UNITED STATES
SECURITIES AND EXCHANGE COMMISSION
Washington, D.C. 20549
FORM N-CSR
CERTIFIED SHAREHOLDER REPORT OF REGISTERED
MANAGEMENT INVESTMENT COMPANIES
| Investment Company Act file number: | 811-02896 | |
| Exact name of registrant as specified in charter: | Dryden High Yield | |
| Fund, Inc. | ||
| Address of principal executive offices: | Gateway Center 3, | |
| 100 Mulberry Street, | ||
| Newark, New Jersey 07102 | ||
| Name and address of agent for service: | Deborah A. Docs | |
| Gateway Center 3, | ||
| 100 Mulberry Street, | ||
| Newark, New Jersey 07102 | ||
| Registrant’s telephone number, including area code: | 800-225-1852 | |
| Date of fiscal year end: | 8/31/2007 | |
| (Registrant changed its fiscal | ||
| year end from December 31) | ||
| Date of reporting period: | 8/31/2007 | |
Item 1 – Reports to Stockholders


| AUGUST 31, 2007 | ANNUAL REPORT |
Dryden High Yield Fund, Inc.
FUND TYPE
Junk bond
OBJECTIVES
Current income, and capital appreciation as a secondary objective
This report is not authorized for distribution to prospective investors unless preceded or accompanied by a current prospectus.
The views expressed in this report and information about the Fund’s portfolio holdings are for the period covered by this report and are subject to change thereafter.
JennisonDryden, Dryden, Prudential Financial and the Rock Prudential logo are registered service marks of The Prudential Insurance Company of America, Newark, NJ, and its affiliates.

October 15, 2007
Dear Shareholder:
On the following pages, you’ll find your annual report for the Dryden High Yield Fund, which includes performance data, an analysis of Fund performance, and a listing of its holdings at period-end. The Fund’s fiscal year has changed from a reporting period that ends December 31 to one that ends August 31. This change should have no impact on the way the Fund is managed. Shareholders will receive future annual and semiannual reports on the new fiscal year-end schedule.
Mutual fund prices and returns will rise or fall over time, and asset managers tend to have periods when they perform better or worse than their long-term average. The best measures of a mutual fund’s quality are its return compared to that of similar investments and the variability of its return over the long term. We recommend that you review your portfolio regularly with your financial adviser.
Sincerely,

Judy A. Rice, President
Dryden High Yield Fund, Inc.
| Dryden High Yield Fund, Inc. | 1 |
Your Fund’s Performance
Fund objectives
The primary investment objective of the Dryden High Yield Fund, Inc. is to maximize current income. As a secondary objective, the Fund seeks capital appreciation, but only when consistent with the Fund’s primary investment objective of current income. There can be no assurance that the Fund will achieve its investment objectives.
Performance data quoted represent past performance. Past performance does not guarantee future results. The investment return and principal value of an investment will fluctuate, so that an investor’s shares, when redeemed, may be worth more or less than their original cost. Current performance may be lower or higher than the past performance data quoted. An investor may obtain performance data as of the most recent month-end by visiting our website at www.jennisondryden.com or by calling (800) 225-1852. Class A and Class L shares have a maximum initial sales charge of 4.50% and 4.25%, respectively. Gross operating expenses: Class A, 0.97%; Class B, 1.42%; Class C, 1.67%; Class L, 1.17%; Class M, 1.67%; Class R, 1.42%; Class X, 1.67%; Class Z, 0.67%. Net operating expenses apply to: Class A, 0.92%; Class B, 1.42%; Class C, 1.42%; Class L, 1.17%; Class M, 1.67%; Class R, 1.17%; Class X, 1.67%; Class Z, 0.67%, after contractual reduction through 4/30/2008.
| Cumulative Total Returns as of 8/31/07 | |||||||||||
| One Year | Five Years | Ten Years | Since Inception1 | ||||||||
Class A | 5.96 | % | 65.49 | % | 55.27 | % | — | ||||
Class B | 5.43 | 61.15 | 47.63 | — | |||||||
Class C | 5.42 | 61.13 | 47.61 | — | |||||||
Class L | N/A | N/A | N/A | –1.93% (3/26/07) | |||||||
Class M | N/A | N/A | N/A | –1.96 (3/26/07) | |||||||
Class R | 5.88 | N/A | N/A | 14.38 (6/6/05) | |||||||
Class X | N/A | N/A | N/A | –1.97 (3/26/07) | |||||||
Class Z | 6.22 | 67.51 | 59.32 | — | |||||||
Lehman Brothers U.S. Corporate High Yield 2% Issuer Capped Index2 | 6.46 | 72.60 | 76.67 | ** | |||||||
Lipper High Current Yield Funds Avg.3 | 5.83 | 63.61 | 54.81 | *** | |||||||
| 2 | Visit our website at www.jennisondryden.com |
| Average Annual Total Returns4 as of 9/30/07 | |||||||||||
| One Year | Five Years | Ten Years | Since Inception1 | ||||||||
Class A | 2.17 | % | 10.45 | % | 4.06 | % | — | ||||
Class B | 1.66 | 10.78 | 4.02 | — | |||||||
Class C | 5.63 | 10.91 | 4.02 | — | |||||||
Class L | N/A | N/A | N/A | N/A | |||||||
Class M | N/A | N/A | N/A | N/A | |||||||
Class R | 7.07 | N/A | | N/A | 7.09% (6/6/05) | ||||||
Class X | N/A | N/A | N/A | N/A | |||||||
Class Z | 7.43 | 11.78 | 4.82 | — | |||||||
Lehman Brothers U.S. Corporate High Yield 2% Issuer Capped Index2 | 7.62 | 12.37 | 5.91 | ** | |||||||
Lipper High Current Yield Funds Avg.3 | 7.02 | 11.10 | 4.31 | *** | |||||||
| Distributions and Yields as of 8/31/07 | ||||||
| Total Distributions Paid for Eight Months | 30-Day SEC Yield | |||||
Class A | $ | 0.28 | 7.43 | % | ||
Class B | $ | 0.26 | 7.29 | |||
Class C | $ | 0.26 | 7.30 | |||
Class L | $ | 0.18 | 7.53 | |||
Class M | $ | 0.17 | 7.02 | |||
Class R | $ | 0.28 | 7.53 | |||
Class X | $ | 0.17 | 7.04 | |||
Class Z | $ | 0.29 | 8.02 | |||
The cumulative total returns do not reflect the deduction of applicable sales charges. If reflected, the applicable sales charges would reduce the cumulative total returns performance quoted. Class A and Class L shares are subject to a maximum front-end sales charge of 4.50% and 4.25%, respectively. Under certain circumstances, Class A shares may be subject to a contingent deferred sales charge (CDSC) of 1%. Class B, Class C, Class L, Class M, and Class X shares are subject to a maximum CDSC of 5%, 1%, 1%, 6%, 6%, respectively. Class R and Class Z shares are not subject to a sales charge.
Source: Prudential Investments LLC and Lipper Inc. Performance figures may reflect fee waivers and/or expense reimbursements. In the absence of such fee waivers and/or expense reimbursements, total returns would be lower.
1Inception date returns are provided for any share class with less than 10 calendar years of returns.
2Lehman Brothers U.S. Corporate High Yield 2% Issuer Capped Index (Lehman High Yield 2% Issuer Capped Index) covers the universe of U.S. dollar-denominated, non-convertible, fixed-rate, non-investment-grade debt. Issuers are capped at 2% of the Index. Index holdings must have at least one year to final maturity, at least $150 million par amount outstanding, and be publicly issued with a rating of Ba1 or lower.
| Dryden High Yield Fund, Inc. | 3 |
Your Fund’s Performance (continued)
3The Lipper High Current Yield Funds Average (Lipper Average) represents returns based on an average return of all funds in the Lipper High Current Yield Funds category for the periods noted. Funds in the Lipper Average aim at high (relative) current yield from fixed income securities, have no quality or maturity restrictions, and tend to invest in lower-grade debt issues.
4The average annual total returns take into account applicable sales charges. Class A, Class B, Class C, Class L, Class M, Class R, and Class X shares are subject to an annual distribution and service (12b-1) fee of up to 0.30%, 0.75%, 1.00%, 0.50%, 1.00%, 0.75%, and 1.00%, respectively. Approximately seven years after purchase, Class B shares will automatically convert to Class A shares on a quarterly basis. Class Z shares are not subject to a 12b-1 fee. Returns in the tables do not reflect the deduction of taxes that a shareholder would pay on Fund distributions or following the redemption of Fund shares.
**Lehman High Yield 2% Issuer Capped Index Closest Month-End to Inception cumulative total returns as of 8/31/07 are –1.88% for Class L, Class M, and Class X; and 15.76% for Class R. Lehman High Yield 2% Issuer Capped Index Closest Month-End to Inception average annual total return as of 9/30/07 is 7.60% for Class R. Class L, Class M, and Class X shares have been in existence for less than one year and have no average annual total return performance information available.
***Lipper High Current Yield Funds Average (Lipper Average) Closest Month-End to Inception cumulative total returns as of 8/31/07 are –1.99% for Class L, Class M, and Class X; and 14.95% for Class R. Lipper High Current Yield Funds Average (Lipper Average) Closest Month-End to Inception average annual total return as of 9/30/07 is 7.16% for Class R. Class L, Class M, and Class X shares have been in existence for less than one year and have no average annual total return performance information available.
Investors cannot invest directly in an index. The returns for the Lehman High Yield 2% Issuer Capped Index and the Lipper Average would be lower if they included the effects of sales charges, operating expenses of a mutual fund, or taxes. Returns for the Lipper Average reflect the deduction of operating expenses, but not sales charges or taxes.
Five Largest Long-Term Issues expressed as a percentage of net assets as of 8/31/07 | |||
Ford Motor Credit Co. LLC, Notes, 7.875%, 6/15/10 | 1.5 | % | |
Realogy Corp., Sr. Sub. Notes, 144A, 12.375%, 4/15/15 | 1.1 | ||
HCA, Inc., Sec’d. Notes, 144A, 9.25%, 11/15/16 | 1.0 | ||
Freescale Semiconductor, Inc., Sr. Notes, PIK, 144A, 9.125%, 12/15/14 | 1.0 | ||
Hertz Corp., Sr. Notes, 8.875%, 1/1/14 | 0.9 |
Issues reflect only long-term investments and are subject to change.
Credit Quality* expressed as a percentage of net assets as of 8/31/07 | |||
High Grade | 3.9 | % | |
Ba | 30.0 | ||
B | 46.3 | ||
Caa or Lower | 14.0 | ||
Not Rated** | 20.3 | ||
Total Investments | 114.5 | ||
Liabilities in excess of other assets | -14.5 | ||
Net Assets | 100.0 | % | |
*Source: Moody’s rating, defaulting to S&P when not rated by Moody’s.
**Approximately 19.4% of Not Rated is reflected in Short Term Money Markets.
Credit Quality is subject to change.
| 4 | Visit our website at www.jennisondryden.com |
Strategy and Performance Overview
How did the Fund perform?
The Dryden High Yield Fund’s Class A shares returned 0.82% for the reporting period from January 1, 2007 through August 31, 2007*, in line with the 0.86% of the Lehman Brothers U.S. Corporate High Yield 2% Issuer Capped Index (the Index) and outperforming the 0.59% of the Lipper High Current Yield Funds Average (Lipper Average).
What were market conditions like during the reporting period?
High yield bonds, commonly called “junk” bonds, got off to a strong start as their prices gained in the first two months of the year. Conservative financial practices of many companies had produced high cash balances and modest amounts of leverage (borrowings) on their balance sheets. Therefore, most firms continued to make timely interest and principal payments on their below-investment-grade debt securities, and the high yield bond default rate declined to a historic low. This and a generally favorable outlook for corporate profits encouraged investment in the high yield market. Credit spreads—the difference between yields on high yield bonds and U.S. Treasury securities—shrank considerably, indicating investors at that time saw little risk in owning bonds rated below investment grade.
A large amount of high yield bonds were issued in conjunction with leveraged buyouts (LBOs) as private equity firms announced a flurry of these deals to take over companies that they believed were undervalued. The target companies issued high yield bonds whose proceeds helped pay for LBOs, but loaded their corporate balance sheets with new debt. Yet investors eagerly snapped up these bonds until June, when market conditions took a turn for the worse.
Two hedge funds that invested in bonds backed by subprime mortgages nearly collapsed in June as delinquencies and foreclosures soared on home loans made to borrowers with poor credit histories. Concern about the subprime mortgage crisis spread to financial markets around the world. A flight to quality ensued in which investors sought the safety of U.S. Treasurys and government bonds of other economically developed nations and avoided riskier assets, including high yield bonds. The Index declined in June and July 2007, reflecting the troubled investment environment.
The Federal Reserve (the Fed) took steps to restore normal conditions to the U.S. financial markets in August. It cut the discount rate it charges banks to borrow money from the Fed’s so-called discount window and lengthened the term of these loans from one day to 30 days. High yield bonds rallied along with the stock market and the Index posted a gain in August, ending a difficult period on a positive note.
* Fund changed its fiscal year-end to August 31. Refer to the Fund’s previous annual report for performance information prior to January 1, 2007.
| Dryden High Yield Fund, Inc. | 5 |
Strategy and Performance Overview (continued)
How was the Fund positioned during the reporting period?
In this challenging environment, we continued to favor shorter-term bonds. The additional yield offered by some longer-term debt securities did not adequately compensate for the greater risk involved in owning them.
From the perspective of sector allocation, we largely pursued a two-pronged strategy, which included an emphasis on bonds of companies in defensive sectors such as healthcare, media/entertainment, gaming, and electric utilities. These businesses tend to do well even when economic growth slows as it did in the United States due largely to the downturn in the housing industry. We balanced this exposure by investing in cyclical sectors such as metals, chemicals, and capital goods to take advantage of the strong global economy where there was solid demand for such products. This two-pronged approach benefited the Fund, particularly its exposure to media/entertainment and metals as both were among the sectors that contributed materially to the Fund’s performance relative to the Index.
Did the Fund invest in high yield sectors that were pressured the most by the subprime mortgage crisis?
While the subprime mortgage meltdown had a negative impact on the entire high yield market as investors grew increasingly risk averse, some sectors, such as building materials and home construction, were particularly hard hit. Back in 2006, we had adopted a cautious approach to investing in bonds of companies in housing-related sectors because rising interest rates had already begun to weaken the industry. Continuing this strategy during the reporting period, we avoided bonds of Beazer Homes USA, Inc., which are included in the Index. Bondholders threatened to declare the homebuilder in default on its debt securities after it delayed filing a quarterly report with the U.S. Securities and Exchange Commission. On the whole, the Fund had a smaller exposure to the building materials and home construction sectors than the Index, which benefited its performance relative to the Index.
What were some of the holdings that aided the Fund’s returns?
We maintained a diversified portfolio of more than 300 holdings that consisted primarily of bonds along with small positions in bank loans and other types of investments in order to spread risk in the Fund. As it turned out, the preferred stock of Ion Media Networks Inc. (formerly Paxson Communications) was the position that contributed the most to the Fund’s returns during the reporting period. The operator of television stations, which was acquired by a hedge fund and NBC Universal, completed a restructuring of its financing mix that gave it greater financial flexibility. We were able to take profits on the Ion Media preferred stock held by the Fund.
| 6 | Visit our website at www.jennisondryden.com |
Another positive for the Fund was its position in bonds of K&F Acquisition, Inc., a company set up to help facilitate Merritt Plc’s purchase of K&F Industries Holdings, a manufacturer of aircraft parts. After the acquisition was completed, K&F Industries offered to buy back its debt securities from bondholders. We participated in this offer and received a price for bonds that was above their previous value.
What were some of the holdings that hurt the Fund’s returns?
Compared to the Index, the Fund had a larger exposure to bonds of Realogy Corp., which detracted the most from its returns during the reporting period. However, we held on to these debt securities because the real estate management and services firm has good liquidity, and we believe the company will gain market share as weaker competitors go out of business.
Bonds of General Motors Acceptance Corp. (GMAC) were another key detractor from the Fund’s returns. Because real estate lending is part of the business mix of this diversified financial services company, the subprime-mortgage crisis had a negative impact on its bonds. Then too, concern that tighter mortgage lending standards could spill over to auto financing also weighed on bonds of GMAC, Ford Motor Co., and its financing subsidiary Ford Motor Credit Co. The Fund had a greater exposure than the Index to bonds of GMAC and Ford Motor Credit.
How would you characterize the market at this point?
It is important to remember that the high yield market is in a mature stage of its credit cycle, where downside risks tend to outweigh the potential for positive developments. Therefore, avoiding bonds of companies headed for trouble is crucial to the Fund’s success. Each member of our team of nine research analysts specializes in specific market sectors and is paired with a portfolio manager. Together they determine which bonds to purchase, sell, hold, or avoid. For example, the decision was made early in the reporting period to avoid bonds of Movie Gallery, Inc., a video store chain whose debt securities were performing well at the time. We did not like the company’s business model, as it had not yet launched its online movie service that would enable it to compete with rival firms. As it turned out, Movie Gallery’s financial standing deteriorated sharply in the spring and summer of 2007 amid declining sales and a heavy debt load. This is one instance where the Fund benefited by avoiding a company’s bonds.
| Dryden High Yield Fund, Inc. | 7 |
Fees and Expenses (Unaudited)
As a shareholder of the Fund, you incur two types of costs: (1) transaction costs, including sales charges (loads) on purchase payments and redemptions, as applicable, and (2) ongoing costs, including management fees, distribution and/or service (12b-1) fees, and other Fund expenses, as applicable. This example is intended to help you understand your ongoing costs (in dollars) of investing in the Fund and to compare these costs with the ongoing costs of investing in other mutual funds.
The example is based on an investment of $1,000 invested on March 1, 2007, at the beginning of the period, and held through the six-month period ended August 31, 2007. The example is for illustrative purposes only; you should consult the Prospectus for information on initial and subsequent minimum investment requirements.
The Fund’s transfer agent may charge additional fees to holders of certain accounts that are not included in the expenses shown in the table on the following page. These fees apply to Individual Retirement Accounts (IRAs) and Section 403(b) accounts. As of the close of the six-month period covered by the table, IRA fees included an annual maintenance fee of $15 per account (subject to a maximum annual maintenance fee of $25 for all accounts held by the same shareholder). Section 403(b) accounts are charged an annual $25 fiduciary maintenance fee. Some of the fees may vary in amount, or may be waived, based on your total account balance or the number of JennisonDryden Funds, including the Fund, that you own. You should consider the additional fees that were charged to your Fund account over the six-month period when you estimate the total ongoing expenses paid over the period and the impact of these fees on your ending account value, as these additional expenses are not reflected in the information provided in the expense table. Additional fees have the effect of reducing investment returns.
Actual Expenses
The first line for each share class in the table on the following page provides information about actual account values and actual expenses. You may use the information on this line, together with the amount you invested, to estimate the expenses that you paid over the period. Simply divide your account value by $1,000 (for example, an $8,600 account value ÷ $1,000 = 8.6), then multiply the result by the number on the first line under the heading “Expenses Paid During the Six-Month Period” to estimate the expenses you paid on your account during this period.
Hypothetical Example for Comparison Purposes
The second line for each share class in the table on the following page provides information about hypothetical account values and hypothetical expenses based on
| 8 | Visit our website at www.jennisondryden.com |
the Fund’s actual expense ratio and an assumed rate of return of 5% per year before expenses, which is not the Fund’s actual return. The hypothetical account values and expenses may not be used to estimate the actual ending account balance or expenses you paid for the period. You may use this information to compare the ongoing costs of investing in the Fund and other funds. To do so, compare this 5% hypothetical example with the 5% hypothetical examples that appear in the shareholder reports of the other funds.
Please note that the expenses shown in the table are meant to highlight your ongoing costs only, and do not reflect any transactional costs such as sales charges (loads). Therefore the second line for each share class in the table is useful in comparing ongoing costs only, and will not help you determine the relative total costs of owning different funds. In addition, if these transactional costs were included, your costs would have been higher.
| Dryden High Yield Fund, Inc. | Beginning Account Value March 1, 2007 | Ending Account Value August 31, 2007 | Annualized Expense Ratio Based on the Six-Month Period | Expenses Paid During the Six-Month Period* | ||||||||||
| Class A | Actual | $ | 1,000.00 | $ | 987.60 | 0.93 | % | $ | 4.66 | |||||
| Hypothetical | $ | 1,000.00 | $ | 1,020.52 | 0.93 | % | $ | 4.74 | ||||||
| Class B | Actual | $ | 1,000.00 | $ | 985.10 | 1.43 | % | $ | 7.16 | |||||
| Hypothetical | $ | 1,000.00 | $ | 1,018.00 | 1.43 | % | $ | 7.27 | ||||||
| Class C | Actual | $ | 1,000.00 | $ | 1,015.00 | 1.43 | % | $ | 7.26 | |||||
| Hypothetical | $ | 1,000.00 | $ | 1,018.00 | 1.43 | % | $ | 7.27 | ||||||
| Class L | Actual** | $ | 1,000.00 | $ | 1,000.00 | 1.18 | % | $ | 3.14 | |||||
| Hypothetical | $ | 1,000.00 | $ | 1,019.26 | 1.18 | % | $ | 6.01 | ||||||
| Class M | Actual** | $ | 1,000.00 | $ | 1,000.00 | 1.68 | % | $ | 4.46 | |||||
| Hypothetical | $ | 1,000.00 | $ | 1,016.74 | 1.68 | % | $ | 8.54 | ||||||
| Class R | Actual | $ | 1,000.00 | $ | 986.70 | 1.18 | % | $ | 5.91 | |||||
| Hypothetical | $ | 1,000.00 | $ | 1,019.26 | 1.18 | % | $ | 6.01 | ||||||
| Class X | Actual** | $ | 1,000.00 | $ | 1,000.00 | 1.68 | % | $ | 4.46 | |||||
| Hypothetical | $ | 1,000.00 | $ | 1,016.74 | 1.68 | % | $ | 8.54 | ||||||
| Class Z | Actual | $ | 1,000.00 | $ | 988.80 | 0.68 | % | $ | 3.41 | |||||
| Hypothetical | $ | 1,000.00 | $ | 1,021.78 | 0.68 | % | $ | 3.47 | ||||||
* Fund expenses (net of fee waivers or subsidies, if any) for each share class are equal to the annualized expense ratio for each share class (provided in the table), multiplied
| Dryden High Yield Fund, Inc. | 9 |
Fees and Expenses (continued)
by the average account value over the period, multiplied by the 184 days in the six-month period ended August 31, 2007, and divided by the 365 days in the Fund’s fiscal year ending December 31, 2007 (to reflect the six-month period) with the exception of the Class L, Class M and Class X “Actual” information which reflects the 97 day period ended August 31, 2007 due to its inception date of March 26, 2007. Expenses presented in the table include the expenses of any underlying portfolios in which the Fund may invest.
** Class L, M and X shares commenced operations on March 26, 2007.
| 10 | Visit our website at www.jennisondryden.com |
Portfolio of Investments
as of August 31, 2007
| Moody’s Rating (Unaudited) | Interest Rate | Maturity Date | Principal Amount (000) | Value (Note 1) | ||||||||
LONG-TERM INVESTMENTS 95.1% | ||||||||||||
ASSET BACKED SECURITIES 1.2% | ||||||||||||
Centurion CDO Vll Ltd. (Cayman Islands), Ser. 2004 -7A, Cl. D1(i)(k) | Ba2 | 12.09% | 1/30/16 | $ |
5,000 | $ | 4,957,150 | |||||
CSAM Funding Corp. 1 (Cayman Islands), Sub. Notes, Cl. D-2, 144A(i)(k) | Ba2 | 11.71(j) | 3/29/16 | 7,000 | 6,650,001 | |||||||
Landmark lV CDO Ltd. (Cayman Islands)(i)(k) | Ba2 | 11.51(j) | 12/15/16 | 3,500 | 3,178,984 | |||||||
Liberty Square Ltd. (Cayman Islands), Ser. 2001-2A, Cl. D, 144A(i)(k) | Caa3 | 11.909(j) | 6/15/13 | 3,320 | 1,560,264 | |||||||
Total asset backed securities | 16,346,399 | |||||||||||
CORPORATE BONDS 93.3% | ||||||||||||
Aerospace/Defense 2.0% | ||||||||||||
Bombardier, Inc. (Canada), Sr. Unsec’d. Notes, 144A(i) | Ba2 | 8.00 | 11/15/14 | 200 | 206,500 | |||||||
DRS Technologies, Inc., | ||||||||||||
Gtd. Notes | B3 | 6.875 | 11/1/13 | 1,000 | 980,000 | |||||||
Gtd. Notes(f) | B3 | 7.625 | 2/1/18 | 5,130 | 5,027,400 | |||||||
Esterline Technologies Corp., | B1 | 7.75 | 6/15/13 | 2,650 | 2,630,125 | |||||||
L-3 Communications Corp., | Ba3 | 6.375 | 10/15/15 | 4,750 | 4,595,625 | |||||||
Sr. Sub. Notes | Ba3 | 7.625 | 6/15/12 | 5,575 | 5,672,563 | |||||||
Sr. Unsec’d. Notes | Ba3 | 6.125 | 1/15/14 | 1,000 | 965,000 | |||||||
Moog, Inc., Sr. Sub. Notes | Ba3 | 6.25 | 1/15/15 | 2,000 | 1,890,000 | |||||||
Sequa Corp., | B2 | 9.00 | 8/1/09 | 1,375 | 1,423,125 | |||||||
Sr. Notes, Ser. B | B2 | 8.875 | 4/1/08 | 3,775 | 3,793,875 | |||||||
TransDigm, Inc., Sr. Sub. Notes | B3 | 7.75 | 7/15/14 | 130 | 130,650 | |||||||
| 27,314,863 | ||||||||||||
Airlines 0.8% | ||||||||||||
American Airlines, Inc., Certs., Ser. 91-A2(k) | B2 | 10.18 | 1/2/13 | 1,994 | 2,033,946 | |||||||
AMR Corp., Notes | CCC+(a) | 10.40 | 3/10/11 | 4,450 | 4,500,063 | |||||||
See Notes to Financial Statements.
| Dryden High Yield Fund, Inc. | 11 |
Portfolio of Investments
as of August 31, 2007 continued
| Moody’s Rating (Unaudited) | Interest Rate | Maturity Date | Principal Amount (000) | Value (Note 1) | ||||||||
Calair Capital LLC, Gtd. Notes | B3 | 8.125% | 4/1/08 | $ | 2,980 | $ | 2,991,175 | |||||
Continental Airlines, Inc., Certs., Ser. 981B | Ba2 | 6.748 | 3/15/17 | 1,306 | 1,263,884 | |||||||
| 10,789,068 | ||||||||||||
Automotive 3.7% | ||||||||||||
ArvinMeritor, Inc., Notes(f) | B1 | 8.75 | 3/1/12 | 300 | 297,000 | |||||||
Cooper-Standard Automotive, Inc., Gtd. Notes(f) | B3 | 7.00 | 12/15/12 | 150 | 136,500 | |||||||
Ford Motor Co., Bank Loan(k) | Ba3 | 8.36 | 12/12/13 | 5,970 | 5,594,075 | |||||||
Ford Motor Co., Notes | Caa1 | 7.45 | 7/16/31 | 325 | 243,750 | |||||||
Ford Motor Credit Co. LLC, | ||||||||||||
Bonds(f) | B1 | 7.375 | 2/1/11 | 820 | 757,314 | |||||||
Notes | B1 | 7.00 | 10/1/13 | 200 | 178,113 | |||||||
Notes | B1 | 7.875 | 6/15/10 | 21,785 | 20,451,585 | |||||||
Sr. Notes | B1 | 7.25 | 10/25/11 | 425 | 387,433 | |||||||
Sr. Notes(f) | B1 | 9.875 | 8/10/11 | 625 | 616,986 | |||||||
General Motors Corp.,(f) | Caa1 | 8.25 | 7/15/23 | 700 | 558,250 | |||||||
Notes | Caa1 | 7.20 | 1/15/11 | 12,640 | 11,186,400 | |||||||
Sr. Notes | Caa1 | 7.125 | 7/15/13 | 950 | 814,625 | |||||||
General Motors Nova Scotia Finance Co. (Canada), Notes(i) | Caa1 | 6.85 | 10/15/08 | 2,165 | 2,110,875 | |||||||
Goodyear Tire & Rubber Co. (The), Sr. Notes | Ba3 | 9.00 | 7/1/15 | 221 | 228,735 | |||||||
Lear Corp., Sr. Notes | B3 | 8.75 | 12/1/16 | 1,800 | 1,665,000 | |||||||
Tenneco, Inc., | B1 | 10.25 | 7/15/13 | 190 | 202,825 | |||||||
Sr. Notes | B3 | 8.625 | 11/15/14 | 100 | 99,000 | |||||||
TRW Automotive, Inc., Sr. Notes, 144A | Ba3 | 7.25 | 3/15/17 | 4,225 | 3,844,750 | |||||||
Visteon Corp., Notes(f) | Caa2 | 7.00 | 3/10/14 | 2,190 | 1,642,500 | |||||||
| 51,015,716 | ||||||||||||
Banking 0.9% | ||||||||||||
Banco BMG SA (Brazil), Notes, 144A(i) | Ba1 | 9.15 | 1/15/16 | 4,750 | 4,898,675 | |||||||
Halyk Savings Bank of Kazahstan (Kazahstan), Notes, 144A(i) | Baa2 | 8.125 | 10/7/09 | 1,620 | 1,644,300 | |||||||
See Notes to Financial Statements.
| 12 | Visit our website at www.jennisondryden.com |
| Moody’s Rating (Unaudited) | Interest Rate | Maturity Date | Principal Amount (000) | Value (Note 1) | ||||||||
HSBK Europe (Netherlands), Gtd. Notes, 144A(f)(i) | Baa2 | 7.25% | 5/3/17 | $ | 4,500 | $ | 4,083,750 | |||||
Kazkommerts Int’l. BV (Netherlands), Gtd. | Baa2 | 7.00 | 11/3/09 | 2,210 | 2,132,650 | |||||||
| 12,759,375 | ||||||||||||
Building Materials & Construction 1.0% | ||||||||||||
Goodman Global Holdings, Inc., Sr. Notes | B1 | 8.36(j) | 6/15/12 | 1,212 | 1,187,760 | |||||||
K Hovnanian Enterprises, Inc., | Ba3 | 10.50 | 10/1/07 | 2,500 | 2,500,000 | |||||||
KB Home, Sr. Sub. Notes | Ba2 | 8.625 | 12/15/08 | 6,075 | 6,059,813 | |||||||
Nortek, Inc., Sr. Sub. Notes | B3 | 8.50 | 9/1/14 | 4,685 | 4,052,525 | |||||||
| 13,800,098 | ||||||||||||
Cable 4.5% | ||||||||||||
CCO Holdings LLC/CCO Holdings Capital Corp., Sr. Notes | Caa1 | 8.75 | 11/15/13 | 800 | 784,000 | |||||||
Charter Communications Holding LLC, | B1 | 7.36 | 4/30/14 | 7,500 | 7,084,155 | |||||||
Gtd. Notes(f) | NR | 10.25 | 10/1/13 | 2,406 | 2,430,060 | |||||||
Gtd. Notes | NR | 11.00 | 10/1/15 | 125 | 121,563 | |||||||
Sr. Notes(f) | Caa3 | 10.00 | 5/15/14 | 983 | 825,720 | |||||||
Sr. Notes | Caa2 | 11.00 | 10/1/15 | 11,717 | 11,482,659 | |||||||
Sr. Notes | Caa3 | 11.125 | 1/15/14 | 4,434 | 3,835,410 | |||||||
Sr. Notes(f) | Caa3 | 11.75 | 5/15/14 | 3,000 | 2,670,000 | |||||||
Sr. Notes(f) | Caa3 | 13.50 | 1/15/14 | 2,000 | 1,890,000 | |||||||
Charter Communications Holdings II, | Caa2 | 10.25 | 9/15/10 | 3,000 | 3,030,000 | |||||||
Sr. Notes, Ser. B | Caa2 | 10.25 | 9/15/10 | 675 | 676,688 | |||||||
Charter Communications Operating LLC, Sr. Notes, 144A(f) | B3 | 8.375 | 4/30/14 | 190 | 188,100 | |||||||
CSC Holdings, Inc., | ||||||||||||
Deb. | B2 | 7.625 | 7/15/18 | 3,110 | 2,853,425 | |||||||
Deb. | B2 | 7.875 | 2/15/18 | 725 | 679,688 | |||||||
Sr. Notes | B2 | 6.75 | 4/15/12 | 425 | 401,625 | |||||||
See Notes to Financial Statements.
| Dryden High Yield Fund, Inc. | 13 |
Portfolio of Investments
as of August 31, 2007 continued
| Moody’s Rating (Unaudited) | Interest Rate | Maturity Date | Principal Amount (000) | Value (Note 1) | ||||||||
Sr. Notes(f) | B2 | 7.875% | 12/15/07 | $ | 4,500 | $ | 4,511,250 | |||||
Sr. Notes, Ser. B | B2 | 7.625 | 4/1/11 | 2,125 | 2,093,125 | |||||||
Sr. Notes, Ser. B(f) | B2 | 8.125 | 7/15/09 | 7,175 | 7,228,812 | |||||||
Mediacom Broadband LLC, Notes | B3 | 8.50 | 10/15/15 | 1,750 | 1,732,500 | |||||||
Mediacom LLC, Sr. Unsec’d. Notes | B3 | 9.50 | 1/15/13 | 800 | 800,000 | |||||||
Telenet Group Holding NV (Belgium), Dis. Notes, 144A (Zero thru 12/15/08)(i) | B3 | 11.50(l) | 6/15/14 | 655 | 622,250 | |||||||
Videotron Ltee (Canada),(i) | ||||||||||||
Gtd. Notes | Ba1 | 6.875 | 1/15/14 | 1,570 | 1,495,425 | |||||||
Sr. Notes | Ba1 | 6.375 | 12/15/15 | 3,525 | 3,216,563 | |||||||
Virgin Media Finance PLC (United Kingdom), Gtd. Notes(i) | B2 | 9.125 | 8/15/16 | 1,125 | 1,137,656 | |||||||
| 61,790,674 | ||||||||||||
Capital Goods 6.8% | ||||||||||||
Actuant Corp., Sr. Notes, 144A(f) | Ba2 | 6.875 | 6/15/17 | 2,975 | 2,863,438 | |||||||
ALH Finance LLC, Sr. Sub. Notes(f) | B3 | 8.50 | 1/15/13 | 2,400 | 2,340,000 | |||||||
Allied Waste North America, Inc., | ||||||||||||
Gtd. Notes, Ser. B | B1 | 7.125 | 5/15/16 | 800 | 796,000 | |||||||
Sr. Notes(f) | B1 | 7.25 | 3/15/15 | 1,705 | 1,705,000 | |||||||
Sr. Notes, Ser. B(f) | B1 | 5.75 | 2/15/11 | 4,320 | 4,201,200 | |||||||
Sr. Notes, Ser. B(f) | B1 | 9.25 | 9/1/12 | 5,127 | 5,357,715 | |||||||
Ashtead Capital, Inc., Notes, 144A | B1 | 9.00 | 8/15/16 | 2,985 | 2,955,150 | |||||||
Ashtead Holdings PLC (United Kingdom), Sec’d. Notes, 144A(i) | B1 | 8.625 | 8/1/15 | 3,225 | 3,160,500 | |||||||
Baldor Electric Co., Gtd. Notes(f) | B3 | 8.625 | 2/15/17 | 2,250 | 2,323,125 | |||||||
Blount, Inc., Sr. Sub. Notes | B2 | 8.875 | 8/1/12 | 7,700 | 7,700,000 | |||||||
Capital Safety Group Ltd.,(k) Bank Loan | B1 | 7.63 | 7/20/15 | 2,728 | 2,721,504 | |||||||
Bank Loan | B1 | 8.13 | 7/20/16 | 7,272 | 7,217,137 | |||||||
See Notes to Financial Statements.
| 14 | Visit our website at www.jennisondryden.com |
| Moody’s Rating (Unaudited) | Interest Rate | Maturity Date | Principal Amount (000) | Value (Note 1) | ||||||||
Chart Industries, Inc., Sr. Sub. Notes | B3 | 9.125% | 10/15/15 | $ | 270 | $ | 276,750 | |||||
Columbus McKinnon Corp., Sr. Sub. Notes | B2 | 8.875 | 11/1/13 | 4,245 | 4,372,350 | |||||||
GrafTech Finance, Inc., Gtd. Notes | B2 | 10.25 | 2/15/12 | 2,000 | 2,090,000 | |||||||
Hertz Corp., Sr. Notes | B1 | 8.875 | 1/1/14 | 11,940 | 12,357,900 | |||||||
Invensys PLC (United Kingdom), Sr. Notes, 144A(i) | B2 | 9.875 | 3/15/11 | 324 | 344,250 | |||||||
Johnson Diversey Holding, Inc., | ||||||||||||
Sr. Disc. Notes | Caa1 | 10.67 | 5/15/13 | 3,745 | 3,763,725 | |||||||
Sr. Sub. Notes, Ser. B | B3 | 9.625 | 5/15/12 | 1,450 | 1,457,250 | |||||||
Mobile Mini, Inc., Sr. Notes, 144A | B1 | 6.875 | 5/1/15 | 1,500 | 1,440,000 | |||||||
Mueller Water Products, Inc., Sr. Sub. Notes, 144A | B3 | 7.375 | 6/1/17 | 2,840 | 2,698,000 | |||||||
RBS Global, Inc. and Rexnord Corp., Gtd. Notes(f) | B3 | 9.50 | 8/1/14 | 7,160 | 7,231,600 | |||||||
Rental Service Corp., Bonds, 144A | Caa1 | 9.50 | 12/1/14 | 3,975 | 3,890,531 | |||||||
Stena AB (Sweden), Sr. Notes(i) | Ba3 | 7.50 | 11/1/13 | 4,900 | 4,851,000 | |||||||
Terex Corp., Gtd. Notes | Ba3 | 7.375 | 1/15/14 | 1,000 | 1,000,000 | |||||||
United Rentals North America, Inc., Sr. Notes | B1 | 6.50 | 2/15/12 | 4,205 | 4,226,025 | |||||||
| 93,340,150 | ||||||||||||
Chemicals 3.7% | ||||||||||||
Equistar Chemicals Funding LP, | ||||||||||||
Gtd. Notes | B1 | 10.125 | 9/1/08 | 4,047 | 4,198,763 | |||||||
Sr. Notes | B1 | 10.625 | 5/1/11 | 1,716 | 1,810,380 | |||||||
Huntsman Co. LLC, Gtd. Notes | Ba1 | 11.625 | 10/15/10 | 3,000 | 3,180,000 | |||||||
Huntsman International LLC, Gtd. Notes | Ba3 | 11.50 | 7/15/12 | 660 | 717,750 | |||||||
Ineos Group Holdings, Inc. (United Kingdom), Notes, 144A(f)(i) | B3 | 8.50 | 2/15/16 | 1,875 | 1,725,000 | |||||||
Koppers, Inc., Gtd. Notes | B2 | 9.875 | 10/15/13 | 5,979 | 6,218,160 | |||||||
Kraton Polymers LLC, Gtd. Notes | B3 | 8.125 | 1/15/14 | 500 | 480,000 | |||||||
Lyondell Chemical Co., | ||||||||||||
Gtd. Notes | B1 | 6.875 | 6/15/17 | 3,000 | 3,247,500 | |||||||
Gtd. Notes | B1 | 8.00 | 9/15/14 | 100 | 108,750 | |||||||
See Notes to Financial Statements.
| Dryden High Yield Fund, Inc. | 15 |
Portfolio of Investments
as of August 31, 2007 continued
| Moody’s Rating (Unaudited) | Interest Rate | Maturity Date | Principal Amount (000) | Value (Note 1) | ||||||||
Gtd. Notes | B1 | 8.25% | 9/15/16 | $ | 3,050 | $ | 3,416,000 | |||||
Gtd. Notes | Ba2 | 10.50 | 6/1/13 | 4,110 | 4,428,525 | |||||||
Momentive Performance Materials, Inc., 144A | ||||||||||||
Sr. Notes | B3 | 9.75 | 12/1/14 | 7,165 | 6,824,662 | |||||||
Sr. Sub. Notes(f) | Caa2 | 11.50 | 12/1/16 | 1,450 | 1,384,750 | |||||||
Mosaic Co., 144A | ||||||||||||
Sr. Notes | B1 | 7.375 | 12/1/14 | 2,155 | 2,192,713 | |||||||
Sr. Notes(f) | B1 | 7.625 | 12/1/16 | 1,850 | 1,896,250 | |||||||
Nalco Co.,(f) | ||||||||||||
Sr. Notes | B1 | 7.75 | 11/15/11 | 6,675 | 6,791,812 | |||||||
Sr. Sub. Notes | B3 | 8.875 | 11/15/13 | 1,745 | 1,784,263 | |||||||
| 50,405,278 | ||||||||||||
Consumer 2.8% | ||||||||||||
Corrections Corp. of America, Gtd. Notes | Ba2 | 6.75 | 1/31/14 | 130 | 127,400 | |||||||
Levi Straus & Co.,(f) | ||||||||||||
Sec’d. Notes | B2 | 8.875 | 4/1/16 | 1,125 | 1,130,625 | |||||||
Sr. Unsub. Notes | B2 | 9.75 | 1/15/15 | 2,230 | 2,308,050 | |||||||
Mac-Gray Corp., Sr. Unsec’d. Notes | B2 | 7.625 | 8/15/15 | 425 | 419,688 | |||||||
Playtex Products, Inc., Gtd. Notes(f) | Caa1 | 9.375 | 6/1/11 | 6,200 | 6,355,000 | |||||||
Quiksilver, Inc., Gtd. Notes | Ba3 | 6.875 | 4/15/15 | 600 | 555,000 | |||||||
Realogy Corp., 144A | ||||||||||||
Sr. Notes(f) | Caa1 | 10.50 | 4/15/14 | 1,750 | 1,474,375 | |||||||
Sr. Notes, PIK(f) | Caa1 | 11.00 | 4/15/14 | 1,800 | 1,458,000 | |||||||
Sr. Sub. Notes | Caa2 | 12.375 | 4/15/15 | 21,025 | 15,479,655 | |||||||
Service Corp. Int’l., | ||||||||||||
Sr. Notes | B1 | 6.75 | 4/1/16 | 5,500 | 5,183,750 | |||||||
Sr. Notes | B1 | 7.00 | 6/15/17 | 2,000 | 1,890,000 | |||||||
Sr. Unsec’d. Notes | B1 | 7.625 | 10/1/18 | 200 | 201,000 | |||||||
Travelport LLC, Gtd. Notes(f) | Caa1 | 11.875 | 9/1/16 | 1,555 | 1,605,538 | |||||||
West Corp., Sr. Sub. Notes(f) | Caa1 | 11.00 | 10/15/16 | 805 | 817,075 | |||||||
| 39,005,156 | ||||||||||||
Electric 8.5% | ||||||||||||
AES Corp., | ||||||||||||
Sec’d. Notes, 144A | Ba3 | 8.75 | 5/15/13 | 4,210 | 4,378,400 | |||||||
Sr. Notes(f) | B1 | 9.375 | 9/15/10 | 6,950 | 7,262,750 | |||||||
Sr. Notes | B1 | 9.50 | 6/1/09 | 6,635 | 6,850,638 | |||||||
See Notes to Financial Statements.
| 16 | Visit our website at www.jennisondryden.com |
| Moody’s Rating (Unaudited) | Interest Rate | Maturity Date | Principal Amount (000) | Value (Note 1) | ||||||||
AES Eastern Energy LP, Certs., Ser. A | Ba1 | 9.00% | 1/2/17 | $ | 5,439 | $ | 5,738,515 | |||||
Aquila, Inc., Sr. Notes | Ba3 | 9.95 | 2/1/11 | 170 | 183,559 | |||||||
CMS Energy Corp., | ||||||||||||
Sr. Notes(f) | Ba1 | 8.50 | 4/15/11 | 4,060 | 4,322,097 | |||||||
Sr. Notes | Ba1 | 9.875 | 10/15/07 | 1,250 | 1,254,295 | |||||||
Dynegy Holdings, Inc., | ||||||||||||
Sr. Notes | B2 | 6.875 | 4/1/11 | 1,050 | 1,008,000 | |||||||
Sr. Notes, 144A | B2 | 7.50 | 6/1/15 | 3,050 | 2,867,000 | |||||||
Sr. Unsec’d. Notes(f) | B2 | 8.375 | 5/1/16 | 4,225 | 4,151,063 | |||||||
Edison Mission Energy, | ||||||||||||
Sr. Notes, 144A(f) | B1 | 7.00 | 5/15/17 | 7,500 | 7,087,500 | |||||||
Sr. Notes, 144A | B1 | 7.625 | 5/15/27 | 1,135 | 1,055,550 | |||||||
Sr. Unsec’d. Notes | B1 | 7.75 | 6/15/16 | 250 | 251,875 | |||||||
Empresa Nacional de Electricidad SA (Chile), Notes(f)(i) | Baa3 | 8.625 | 8/1/15 | 5,650 | 6,563,164 | |||||||
Homer City Funding LLC, | Ba2 | 8.137 | 10/1/19 | 1,750 | 1,863,750 | |||||||
Intergen NV (Netherlands), Sec’d. Notes, 144A(i) | Ba3 | 9.00 | 6/30/17 | 5,225 | 5,303,375 | |||||||
Midwest Generation LLC, Certs., | ||||||||||||
Ser. A | Ba2 | 8.30 | 7/2/09 | 3,339 | 3,396,946 | |||||||
Ser. B | Ba2 | 8.56 | 1/2/16 | 697 | 741,495 | |||||||
Mirant Americas Generations LLC, Sr. Notes | Caa1 | 8.30 | 5/1/11 | 5,200 | 5,135,000 | |||||||
Mirant Corp., Sr. Notes, 144A(e)(k) | NR | 7.40 | 7/15/49 | 2,600 | 130,000 | |||||||
Mirant North America LLC, Series WI | B2 | 7.375 | 12/31/13 | 3,125 | 3,109,375 | |||||||
NSG Holdings LLC, Sec’d. Notes, 144A | Ba2 | 7.75 | 12/15/25 | 150 | 145,688 | |||||||
Nevada Power Co., Gen. & Ref. Mtg. Bkd., Ser. A | Ba1 | 8.25 | 6/1/11 | 2,465 | 2,686,032 | |||||||
NRG Energy, | ||||||||||||
Bank Loan(k) | Ba1 | 7.11 | 2/1/13 | 4,988 | 4,743,745 | |||||||
Bank Loan(k) | Ba1 | 7.11 | 2/1/13 | 2,950 | 1,969,364 | |||||||
Bank Loan(k) | B2 | 7.86 | 6/8/14 | 1,577 | 1,519,682 | |||||||
Gtd. Notes | B1 | 7.25 | 2/1/14 | 300 | 297,000 | |||||||
Gtd. Notes(f) | B1 | 7.375 | 1/15/17 | 3,100 | 3,045,750 | |||||||
Sr. Notes | B1 | 7.375 | 2/1/16 | 8,650 | 8,541,874 | |||||||
See Notes to Financial Statements.
| Dryden High Yield Fund, Inc. | 17 |
Portfolio of Investments
as of August 31, 2007 continued
| Moody’s Rating (Unaudited) | Interest Rate | Maturity Date | Principal Amount (000) | Value (Note 1) | ||||||||
Orion Power Holdings, Inc., | B2 | 12.00% | 5/1/10 | $ | 6,235 | $ | 6,796,150 | |||||
PSEG Energy Holdings LLC, | Ba3 | 8.50 | 6/15/11 | 400 | 419,413 | |||||||
Reliant Energy, Inc., | ||||||||||||
Gtd. Notes | B2 | 6.75 | 12/15/14 | 370 | 366,300 | |||||||
Sr. Notes(f) | B3 | 7.875 | 6/15/17 | 1,600 | 1,564,000 | |||||||
Reliant Energy Mid-Atlantic, Inc., Certs., Ser. C | Ba2 | 9.681 | 7/2/26 | 3,600 | 4,158,000 | |||||||
Roseton/Danskammer., Series A, (Pass-thru Certs.) | Ba3 | 7.27 | 11/8/10 | 200 | 200,000 | |||||||
Sierra Pacific Power Co., | B1 | 8.625 | 3/15/14 | 2,165 | 2,291,074 | |||||||
Sierra Pacific Resources, | B1 | 6.75 | 8/15/17 | 675 | 649,357 | |||||||
Teco Energy, Inc., Sr. Notes | Ba1 | 7.50 | 6/15/10 | 1,000 | 1,034,157 | |||||||
Tenaska Alabama Partners LP, Sec’d. Notes, 144A (cost $152,829; purchased 3/31/06)(b) | Ba2 | 7.00 | 6/30/21 | 151 | 149,518 | |||||||
TXU Corp., | ||||||||||||
Sr. Notes | Ba1 | 5.55 | 11/15/14 | 300 | 246,112 | |||||||
Sr. Notes(f) | Ba1 | 6.50 | 11/15/24 | 1,630 | 1,308,088 | |||||||
Utilicorp Finance Corp. (Canada), Sr. Notes(f)(i) | Ba3 | 7.75 | 6/15/11 | 2,375 | 2,483,986 | |||||||
| 117,269,637 | ||||||||||||
Energy—Integrated 0.1% | ||||||||||||
TNK-BP Finance (Luxembourg), 144A(i) | Baa2 | 7.50 | 7/18/16 | 2,200 | 2,172,500 | |||||||
Energy—Other 4.2% | ||||||||||||
Chesapeake Energy Corp., | ||||||||||||
Gtd. Notes(f) | Ba2 | 7.50 | 6/15/14 | 25 | 25,313 | |||||||
Sr. Notes | Ba2 | 6.375 | 6/15/15 | 4,775 | 4,566,094 | |||||||
Sr. Notes | Ba2 | 6.50 | 8/15/17 | 315 | 300,038 | |||||||
Sr. Notes | Ba2 | 6.875 | 1/15/16 | 2,995 | 2,927,613 | |||||||
Sr. Notes(f) | Ba2 | 7.00 | 8/15/14 | 2,950 | 2,935,250 | |||||||
Compagnie Generale de Geophysique-Veritas (France), Gtd. Notes(f)(i) | Ba3 | 7.50 | 5/15/15 | 645 | 648,225 | |||||||
See Notes to Financial Statements.
| 18 | Visit our website at www.jennisondryden.com |
| Moody’s Rating (Unaudited) | Interest Rate | Maturity Date | Principal Amount (000) | Value (Note 1) | ||||||||
Complete Production Services, Inc., Sr. Notes | B2 | 8.00% | 12/15/16 | $ | 100 | $ | 96,250 | |||||
Dresser-Rand Group, Inc., | ||||||||||||
Gtd. Notes | B1 | 7.375 | 11/1/14 | 200 | 195,000 | |||||||
Forest Oil Corp., | ||||||||||||
Sr. Notes, 144A(f) | B1 | 7.25 | 6/15/19 | 2,550 | 2,454,375 | |||||||
Sr. Notes | B1 | 8.00 | 6/15/08 | 1,260 | 1,272,600 | |||||||
Hanover Equipment Trust, Sec’d. Notes, Ser. B(f) | Ba3 | 8.75 | 9/1/11 | 6,990 | 7,182,224 | |||||||
Newfield Exploration Co., | ||||||||||||
Sr. Sub. Notes(f) | Ba3 | 6.625 | 9/1/14 | 4,760 | 4,575,550 | |||||||
Sr. Sub. Notes | Ba3 | 6.625 | 4/15/16 | 5,100 | 4,870,499 | |||||||
OPTI Canada, Inc. (Canada), Gtd. Notes, 144A(i) | B1 | 8.25 | 12/15/14 | 2,400 | 2,430,000 | |||||||
Parker Drilling Co., Sr. Notes | B2 | 9.625 | 10/1/13 | 3,900 | 4,148,625 | |||||||
Petrohawk Energy Corp., Notes | B3 | 9.125 | 7/15/13 | 4,100 | 4,274,250 | |||||||
Petroplus Finance Ltd. (Bermuda), 144A (i) | ||||||||||||
Gtd. Notes(f) | B1 | 6.75 | 5/1/14 | 2,500 | 2,325,000 | |||||||
Gtd. Notes | B1 | 7.00 | 5/1/17 | 1,450 | 1,334,000 | |||||||
Pioneer Natural Resources Co., | ||||||||||||
Sr. Unsec’d. Notes | Ba1 | 6.65 | 3/15/17 | 5,675 | 5,208,650 | |||||||
Plains Exploration & Production Co., Gtd. Notes | B1 | 7.00 | 3/15/17 | 100 | 91,000 | |||||||
Pogo Producing Co., | ||||||||||||
Sr. Sub. Notes(f) | B1 | 6.875 | 10/1/17 | 1,320 | 1,329,900 | |||||||
Sr. Unsec’d. Notes | B1 | 6.625 | 3/15/15 | 1,205 | 1,214,038 | |||||||
Pride International, Inc., | Ba2 | 7.375 | 7/15/14 | 1,350 | 1,363,500 | |||||||
Tesoro Corp., | ||||||||||||
Sr. Notes | Ba1 | 6.25 | 11/1/12 | 515 | 505,988 | |||||||
Sr. Notes | Ba1 | 6.625 | 11/1/15 | 550 | 542,438 | |||||||
Sr. Notes, 144A | Ba1 | 6.50 | 6/1/17 | 1,900 | 1,847,750 | |||||||
| 58,664,170 | ||||||||||||
Foods 3.0% | ||||||||||||
Ahold Finance USA, Inc.,(f) | ||||||||||||
Gtd. Notes | Baa3 | 6.875 | 5/1/29 | 650 | 682,779 | |||||||
Notes | Baa3 | 8.25 | 7/15/10 | 1,840 | 1,987,345 | |||||||
Albertson’s, Inc., | ||||||||||||
Debs.(f) | B1 | 7.45 | 8/1/29 | 2,850 | 2,706,035 | |||||||
See Notes to Financial Statements.
| Dryden High Yield Fund, Inc. | 19 |
Portfolio of Investments
as of August 31, 2007 continued
| Moody’s Rating (Unaudited) | Interest Rate | Maturity Date | Principal Amount (000) | Value (Note 1) | ||||||||
Debs. | B1 | 8.70% | 5/1/30 | $ | 1,850 | $ | 1,936,545 | |||||
Sr. Notes | B1 | 7.50 | 2/15/11 | 1,725 | 1,798,375 | |||||||
Aramark Corp., Sr. Notes | B3 | 8.50 | 2/1/15 | 8,325 | 8,293,781 | |||||||
Carrols Corp., Gtd. Notes | Caa1 | 9.00 | 1/15/13 | 425 | 399,500 | |||||||
Del Monte Corp., Sr. Sub. Notes | B2 | 8.625 | 12/15/12 | 2,105 | 2,126,050 | |||||||
Delhaize America, Inc., | Baa3 | 9.00 | 4/15/31 | 532 | 622,440 | |||||||
Dole Food, Inc., | ||||||||||||
Gtd. Notes | Caa1 | 7.25 | 6/15/10 | 629 | 581,825 | |||||||
Sr. Notes | Caa1 | 8.625 | 5/1/09 | 1,698 | 1,655,550 | |||||||
Ingles Markets, Inc., Gtd. Notes | B3 | 8.875 | 12/1/11 | 270 | 274,050 | |||||||
National Beef Packing Co., | Caa1 | 10.50 | 8/1/11 | 3,625 | 3,733,750 | |||||||
Pathmark Stores, Inc., | Caa2 | 8.75 | 2/1/12 | 1,910 | 1,890,900 | |||||||
Pilgrim’s Pride Corp., Gtd. Notes | B1 | 9.625 | 9/15/11 | 2,075 | 2,141,566 | |||||||
Smithfield Foods, Inc., | ||||||||||||
Sr. Notes | Ba3 | 7.75 | 5/15/13 | 725 | 728,625 | |||||||
Sr. Notes | Ba3 | 8.00 | 10/15/09 | 405 | 415,125 | |||||||
Stater Brothers Holdings, Inc., | ||||||||||||
Sr. Notes, 144A | B2 | 7.75 | 4/15/15 | 2,800 | 2,716,000 | |||||||
Sr. Notes(f) | B2 | 8.125 | 6/15/12 | 2,745 | 2,738,138 | |||||||
SUPERVALU, Inc., Sr. Notes(f) | B1 | 7.50 | 11/15/14 | 3,675 | 3,711,750 | |||||||
| 41,140,129 | ||||||||||||
Gaming 5.2% | ||||||||||||
Boyd Gaming Corp., | ||||||||||||
Sr. Sub. Notes(f) | Ba3 | 6.75 | 4/15/14 | 1,955 | 1,847,475 | |||||||
Sr. Sub. Notes | Ba3 | 7.125 | 2/1/16 | 200 | 188,000 | |||||||
Caesars Entertainment, Inc., | Ba1 | 8.125 | 5/15/11 | 775 | 767,250 | |||||||
CCM Merger, Inc., | B3 | 8.00 | 8/1/13 | 7,710 | 7,363,049 | |||||||
Choctaw Resort Development Enterprise, Sr. Notes, 144A | Ba2 | 7.25 | 11/15/19 | 242 | 232,925 | |||||||
Chukchansi Economic Development Authority, | B2 | 8.00 | 11/15/13 | 180 | 179,100 | |||||||
Fontainebleau Las Vegas Holdings LLC, Mortgaged Backed, 144A | Caa1 | 10.25 | 6/15/15 | 5,725 | 4,909,188 | |||||||
See Notes to Financial Statements.
| 20 | Visit our website at www.jennisondryden.com |
| Moody’s Rating (Unaudited) | Interest Rate | Maturity Date | Principal Amount (000) | Value (Note 1) | ||||||||
Harrahs Operating Co., Inc., | ||||||||||||
Gtd. Notes | Baa3 | 5.50% | 7/1/10 | $ | 4,175 | $ | 3,924,500 | |||||
Gtd. Notes | Baa3 | 5.625 | 6/1/15 | 5,740 | 4,405,450 | |||||||
Gtd. Notes | Baa3 | 6.50 | 6/1/16 | 775 | 610,313 | |||||||
Herbst Gaming, Inc., Gtd. Notes | B3 | 7.00 | 11/15/14 | 150 | 116,250 | |||||||
Isle of Capri Casinos, Inc., Sr. Sub. Notes | B3 | 37.00 | 3/1/14 | 750 | 650,625 | |||||||
Mandalay Resort Group, | ||||||||||||
Sr. Notes | Ba2 | 9.50 | 8/1/08 | 2,050 | 2,096,125 | |||||||
Sr. Sub. Notes | B1 | 9.375 | 2/15/10 | 450 | 470,250 | |||||||
MGM Mirage, | ||||||||||||
Gtd. Notes(f) | Ba2 | 6.00 | 10/1/09 | 8,840 | 8,762,649 | |||||||
Gtd. Notes | Ba2 | 6.75 | 4/1/13 | 750 | 727,500 | |||||||
Gtd. Notes | Ba2 | 6.875 | 4/1/16 | 4,000 | 3,790,000 | |||||||
Gtd. Notes | Ba2 | 7.50 | 6/1/16 | 5,250 | 5,184,374 | |||||||
Gtd. Notes(f) | B1 | 8.375 | 2/1/11 | 2,500 | 2,556,250 | |||||||
Gtd. Notes | Ba2 | 8.50 | 9/15/10 | 1,000 | 1,037,500 | |||||||
Sr. Notes | Ba2 | 5.875 | 2/27/14 | 1,250 | 1,146,875 | |||||||
Mohegan Tribal Gaming Authority, | ||||||||||||
Sr. Sub. Notes | Ba2 | 8.00 | 4/1/12 | 4,510 | 4,572,013 | |||||||
Sr. Sub. Notes(k) | Ba2 | 8.375 | 7/1/11 | 295 | 299,425 | |||||||
Sr. Unsec’d. Notes(f) | Baa3 | 6.125 | 2/15/13 | 2,500 | 2,378,125 | |||||||
Shingle Springs Tribal Gaming Authority, Sr. Notes, 144A | B3 | 9.375 | 6/15/15 | 2,450 | 2,413,250 | |||||||
Station Casinos, Inc., | ||||||||||||
Sr. Notes(f) | Ba2 | 6.00 | 4/1/12 | 4,395 | 4,076,363 | |||||||
Sr. Notes(f) | Ba2 | 7.75 | 8/15/16 | 1,575 | 1,508,063 | |||||||
Sr. Sub. Notes | Ba3 | 6.50 | 2/1/14 | 955 | 809,363 | |||||||
Sr. Sub. Notes | Ba3 | 6.875 | 3/1/16 | 65 | 54,438 | |||||||
Trump Entertainment Resorts, Inc., Sec’d. Notes(f) | Caa1 | 8.50 | 6/1/15 | 1,535 | 1,251,025 | |||||||
Wimar Opco LLC/Wimar Opco Finance Corp., Sr. Sub. Notes, 144A | Caa1 | 9.625 | 12/15/14 | 4,925 | 3,644,500 | |||||||
| 71,972,213 | ||||||||||||
Healthcare & Pharmaceutical 7.8% | ||||||||||||
Accellent, Inc., Sr. Notes | Caa2 | 10.50 | 12/1/13 | 11,150 | 10,313,749 | |||||||
Alliance Imaging, Inc., | B3 | 7.25 | 12/15/12 | 2,450 | 2,339,750 | |||||||
See Notes to Financial Statements.
| Dryden High Yield Fund, Inc. | 21 |
Portfolio of Investments
as of August 31, 2007 continued
| Moody’s Rating (Unaudited) | Interest Rate | Maturity Date | Principal Amount (000) | Value (Note 1) | ||||||||
Community Health | ||||||||||||
Bank Loan(k) | Ba3 | 7.61% | 6/28/14 | $ | 9,381 | $ | 8,996,913 | |||||
Bank Loan(k) | Ba3 | 7.61 | 6/28/14 | 619 | 593,366 | |||||||
Sr. Notes, 144A(f) | B3 | 8.875 | 7/15/15 | 8,000 | 7,990,000 | |||||||
DaVita, Inc., Gtd. Notes | B2 | 7.25 | 3/15/15 | 822 | 805,560 | |||||||
Elan Finance PLC (Ireland), Sr. Unsec’d. Notes(i) | B3 | 8.875 | 12/1/13 | 3,100 | 3,038,000 | |||||||
Fresenius Med. Care Capital Trust, Gtd. Notes | B1 | 7.875 | 6/15/11 | 410 | 417,175 | |||||||
Hanger Orthopedic Group, Inc. | Caa1 | 10.25 | 6/1/14 | 2,700 | 2,760,750 | |||||||
HCA, Inc., | ||||||||||||
Bank Loan(k) | Ba3 | 8.26 | 11/14/13 | 6,965 | 6,698,916 | |||||||
Notes | Caa1 | 7.50 | 11/15/95 | 1,500 | 1,112,717 | |||||||
Notes | Caa1 | 7.69 | 6/15/25 | 840 | 677,715 | |||||||
Notes, M.T.N. | Caa1 | 8.70 | 2/10/10 | 550 | 550,103 | |||||||
Notes | Caa1 | 8.75 | 9/1/10 | 3,300 | 3,283,500 | |||||||
Notes, M.T.N. | Caa1 | 9.00 | 12/15/14 | 4,000 | 3,787,144 | |||||||
Sec’d. Notes, 144A | B2 | 9.125 | 11/15/14 | 160 | 164,000 | |||||||
Sec’d. Notes, 144A | B2 | 9.25 | 11/15/16 | 13,750 | 14,128,124 | |||||||
Sec’d. Notes, 144A, PIK | B2 | 9.625 | 11/15/16 | 1,350 | 1,395,563 | |||||||
Omega Healthcare Investors, Inc., Gtd. Notes | Ba3 | 7.00 | 4/1/14 | 500 | 490,000 | |||||||
Omnicare, Inc., Sr. Sub. Notes | Ba3 | 6.125 | 6/1/13 | 650 | 593,125 | |||||||
PTS Acquisitions Corp., | ||||||||||||
Bank Loan(k) | Ba3 | 7.61 | 4/5/14 | 7,000 | 6,387,500 | |||||||
Sr. Notes, 144A, PIK(f) | Caa1 | 9.50 | 4/15/15 | 4,225 | 3,823,625 | |||||||
Res-Care, Inc., Sr. Notes(k) | B1 | 7.75 | 10/15/13 | 1,000 | 970,000 | |||||||
Rotech Healthcare, Inc., | Caa3 | 9.50 | 4/1/12 | 300 | 213,000 | |||||||
Select Medical Corp., | B3 | 7.625 | 2/1/15 | 1,605 | 1,392,338 | |||||||
Senior Housing Properties Trust, | ||||||||||||
Sr. Notes | Ba2 | 7.875 | 4/15/15 | 2,000 | 2,040,280 | |||||||
Sr. Notes | Ba2 | 8.625 | 1/15/12 | 4,525 | 4,751,250 | |||||||
Skilled Healthcare Group, Inc., Gtd. Notes | Caa1 | 11.00 | 1/15/14 | 4,431 | 4,707,938 | |||||||
Surgical Care Affiliates, Inc., Sr. Sub. Notes, 144A | Caa1 | 10.00 | 7/15/17 | 2,800 | 2,590,000 | |||||||
Tenet Healthcare Corp., | ||||||||||||
Sr. Notes | Caa1 | 9.875 | 7/1/14 | 250 | 221,250 | |||||||
Sr. Unsec’d. Notes | Caa1 | 7.375 | 2/1/13 | 423 | 351,090 | |||||||
Sr. Unsec’d. Notes | Caa1 | 9.25 | 2/1/15 | 320 | 275,200 | |||||||
See Notes to Financial Statements.
| 22 | Visit our website at www.jennisondryden.com |
| Moody’s Rating (Unaudited) | Interest Rate | Maturity Date | Principal Amount (000) | Value (Note 1) | ||||||||
Ventas Realty LP, | ||||||||||||
Gtd. Notes | Ba2 | 6.75% | 4/1/17 | $ | 450 | $ | 437,625 | |||||
Sr. Notes | Ba2 | 6.50 | 6/1/16 | 150 | 144,375 | |||||||
Sr. Notes | Ba1 | 9.00 | 5/1/12 | 1,880 | 2,016,300 | |||||||
Viant Holdings, Inc., | Caa1 | 10.125 | 7/15/17 | 7,462 | 6,939,660 | |||||||
| 107,397,601 | ||||||||||||
Lodging & Leisure 1.6% | ||||||||||||
Felcor Lodging LP, Gtd. Notes | Ba3 | 8.50 | 6/1/11 | 4,825 | 5,054,188 | |||||||
Gaylord Entertainment Co., | B3 | 8.00 | 11/15/13 | 2,175 | 2,142,375 | |||||||
Hilton Hotel Corp., Sr. Notes(f) | Ba1 | 7.50 | 12/15/17 | 450 | 480,375 | |||||||
Host Marriott LP, | ||||||||||||
Gtd. Notes, Ser. Q | Ba1 | 6.75 | 6/1/16 | 775 | 753,688 | |||||||
Sr. Notes(f) | Ba1 | 7.125 | 11/1/13 | 5,510 | 5,482,450 | |||||||
Sr. Notes, Ser. M | Ba1 | 7.00 | 8/15/12 | 6,250 | 6,046,874 | |||||||
Royal Caribbean Cruises Ltd. (Liberia),(i) | ||||||||||||
Sr. Notes | Ba1 | 6.875 | 12/1/13 | 1,580 | 1,542,055 | |||||||
Sr. Notes | Ba1 | 8.75 | 2/2/11 | 850 | 902,507 | |||||||
| 22,404,512 | ||||||||||||
Media & Entertainment 8.8% | ||||||||||||
AMC Entertainment, Inc., | ||||||||||||
Sr. Notes | B2 | 11.00 | 2/1/16 | 400 | 416,000 | |||||||
Sr. Sub. Notes(f) | B2 | 8.00 | 3/1/14 | 4,075 | 3,769,375 | |||||||
CanWest MediaWorks, Inc. (Canada), Gtd. Notes(i) | B3 | 8.00 | 9/15/12 | 110 | 107,113 | |||||||
Cinemark, Inc., Sr. Notes (Zero thru 3/15/09) | B3 | 9.75(l) | 3/15/14 | 2,400 | 2,220,000 | |||||||
Clear Channel Communications, Inc., | ||||||||||||
Debs. | Baa3 | 6.875 | 6/15/18 | 525 | 433,125 | |||||||
Sr. Notes | Baa3 | 5.50 | 9/15/14 | 1,370 | 1,068,600 | |||||||
Sr. Notes | Baa3 | 5.75 | 1/15/13 | 4,025 | 3,320,625 | |||||||
CMP Susquehanna Corp., | Caa1 | 9.88 | 5/15/14 | 2,100 | 1,942,500 | |||||||
Dex Media East LLC, Gtd. Notes | B1 | 12.125 | 11/15/12 | 10,690 | 11,411,574 | |||||||
Dex Media West LLC, | B1 | 9.875 | 8/15/13 | 7,525 | 7,938,874 | |||||||
See Notes to Financial Statements.
| Dryden High Yield Fund, Inc. | 23 |
Portfolio of Investments
as of August 31, 2007 continued
| Moody’s Rating (Unaudited) | Interest Rate | Maturity Date | Principal Amount (000) | Value (Note 1) | ||||||||
Dex Media, Inc., Notes | B2 | 8.00% | 11/15/13 | $ | 2,645 | $ | 2,625,163 | |||||
DirecTV Holdings LLC, Gtd. Notes, Ser. B | Ba3 | 6.375 | 6/15/15 | 3,059 | 2,860,165 | |||||||
Sr. Notes | Ba3 | 8.375 | 3/15/13 | 500 | 516,250 | |||||||
Echostar DBS Corp., | ||||||||||||
Gtd. Notes(f) | Ba3 | 7.00 | 10/1/13 | 775 | 765,313 | |||||||
Sr. Notes | Ba3 | 6.375 | 10/1/11 | 1,025 | 1,007,063 | |||||||
Sr. Notes | Ba3 | 6.625 | 10/1/14 | 1,600 | 1,548,000 | |||||||
Sr. Notes | Ba3 | 7.125 | 2/1/16 | 8,935 | 8,733,962 | |||||||
Idearc, Inc., Gtd. Notes | B2 | 8.00 | 11/15/16 | 4,385 | 4,330,188 | |||||||
Intelsat Bermuda Ltd. (Bermuda),(i) | ||||||||||||
Sr. Notes | B2 | 8.25 | 1/15/13 | 9,645 | 9,693,224 | |||||||
Sr. Notes | Caa1 | 11.25 | 6/15/16 | 7,975 | 8,343,843 | |||||||
Sr. Unsec’d. Notes | Caa1 | 5.25 | 11/1/08 | 1,500 | 1,458,750 | |||||||
Intelsat Corp., Gtd. Notes | B2 | 9.00 | 6/15/16 | 300 | 306,000 | |||||||
Local TV Finance LLC, | Caa1 | 9.25 | 6/15/15 | 1,000 | 915,000 | |||||||
Medianews Group, Inc., | B2 | 6.375 | 4/1/14 | 3,175 | 2,373,313 | |||||||
Sr. Sub. Notes | B2 | 6.875 | 10/1/13 | 3,825 | 3,040,875 | |||||||
Morris Publishing Group LLC, Sr. Sub. Notes | B1 | 7.00 | 8/1/13 | 1,460 | 1,164,350 | |||||||
Nielsen Finance LLC/Nielsen Finance Co., Gtd. Notes, 144A | Caa1 | 10.00 | 8/1/14 | 2,175 | 2,229,375 | |||||||
Panamsat Corp., Gtd. Notes | B2 | 9.00 | 8/15/14 | 125 | 127,188 | |||||||
Quebecor Media, Inc., (Canada), Sr. Notes(f)(i) | B2 | 7.75 | 3/15/16 | 4,820 | 4,585,025 | |||||||
Quebecor World Capital Corp. (Canada), Sr. Notes, 144A(i) | B3 | 8.75 | 3/15/16 | 2,150 | 1,935,000 | |||||||
Quebecor World, Inc. (Canada), | B3 | 9.75 | 1/15/15 | 445 | 418,300 | |||||||
Radio One, Inc., Gtd. Notes, Ser. B | B1 | 8.875 | 7/1/11 | 2,993 | 2,873,280 | |||||||
Rainbow National Services LLC, | B3 | 10.375 | 9/1/14 | 215 | 234,081 | |||||||
RH Donnelley,(f) | B3 | 6.875 | 1/15/13 | 3,000 | 2,827,500 | |||||||
Sr. Notes | B3 | 8.875 | 1/15/16 | 1,190 | 1,219,750 | |||||||
See Notes to Financial Statements.
| 24 | Visit our website at www.jennisondryden.com |
| Moody’s Rating (Unaudited) | Interest Rate | Maturity Date | Principal Amount (000) | Value (Note 1) | ||||||||
RH Donnelley Finance Corp. I, | B2 | 10.875% | 12/15/12 | $ | 5,675 | $ | 6,015,500 | |||||
Sinclair Broadcast Group, Inc., Gtd. Notes | Ba3 | 8.00 | 3/15/12 | 48 | 48,480 | |||||||
Universal City Development Partners, Unsec’d. Notes | B1 | 11.75 | 4/1/10 | 500 | 526,250 | |||||||
Universal City Florida Holdings Co., Sr. Notes | B3 | 10.106(j) | 5/1/10 | 300 | 303,000 | |||||||
Univision Communications, Inc., | ||||||||||||
Bank Loan(k) | Ba3 | 7.61 | 9/16/14 | 3,758 | 3,470,245 | |||||||
Bank Loan(k) | Ba3 | 7.61 | 9/16/14 | 242 | 223,087 | |||||||
Sr. Notes, 144A, PIK(f) | B3 | 9.75 | 3/15/15 | 6,760 | 6,438,900 | |||||||
Vertis, Inc., Sec’d. Notes | B1 | 9.75 | 4/1/09 | 5,035 | 4,984,650 | |||||||
| 120,768,856 | ||||||||||||
Metals 4.7% | ||||||||||||
AK Steel Corp., Gtd. Notes(f) | B1 | 7.75 | 6/15/12 | 2,135 | 2,124,325 | |||||||
Aleris International, Inc., | ||||||||||||
Bank Loan(k) | B2 | 7.625 | 12/19/13 | 5,000 | 4,637,500 | |||||||
Gtd. Notes, PIK | B3 | 9.00 | 12/15/14 | 900 | 857,250 | |||||||
Gtd. Notes | Caa1 | 10.00 | 12/15/16 | 1,000 | 932,500 | |||||||
Arch Western Finance LLC, | B1 | 6.75 | 7/1/13 | 2,635 | 2,493,369 | |||||||
Century Aluminum Co., | B1 | 7.50 | 8/15/14 | 4,130 | 4,088,700 | |||||||
Chaparral Steel Co., | B1 | 10.00 | 7/15/13 | 3,100 | 3,518,500 | |||||||
CSN Islands VII Corp. (Cayman Islands), Gtd. Notes, 144A(i) | NR | 10.75 | 9/12/08 | 1,990 | 2,079,550 | |||||||
FMG Finance Pty Ltd. (Australia), Sec’d. Notes, 144A (cost $4,598,500; purchased 4/23/07-7/19/07)(b)(i) | Ba3 | 10.625 | 9/1/16 | 3,850 | 4,408,250 | |||||||
Freeport-McMoRan Copper & Gold, Inc., Sr. Unsec’d. Notes | Ba3 | 8.375 | 4/1/17 | 9,150 | 9,744,750 | |||||||
See Notes to Financial Statements.
| Dryden High Yield Fund, Inc. | 25 |
Portfolio of Investments
as of August 31, 2007 continued
| Moody’s Rating (Unaudited) | Interest Rate | Maturity Date | Principal Amount (000) | Value (Note 1) | ||||||||
Gerdau AmeriSteel Corp. (Canada), Sr. Notes(i) | Ba2 | 10.375% | 7/15/11 | $ | 3,500 | $ | 3,683,750 | |||||
Ispat Inland ULC (Canada), Sec’d. Notes(i) | Baa3 | 9.75 | 4/1/14 | 2,580 | 2,817,022 | |||||||
Metals USA, Inc., Sec’d. Notes | B3 | 11.125 | 12/1/15 | 9,400 | 10,010,999 | |||||||
Novelis, Inc. (Canada), Sr. Notes(i) | B3 | 7.25 | 2/15/15 | 4,199 | 4,073,030 | |||||||
Peabody Energy Corp., Gtd. Notes, Ser. B | Ba1 | 6.875 | 3/15/13 | 190 | 189,525 | |||||||
PNA Group, Inc., Sr. Notes, 144A (cost $3,000,000; purchased 8/4/06)(b)(k) | B3 | 10.75 | 9/1/16 | 3,000 | 3,093,750 | |||||||
Ryerson Tull, Inc., Sr. Notes | B3 | 8.25 | 12/15/11 | 1,985 | 1,980,038 | |||||||
Southern Copper Corp., Sr. Notes | Baa2 | 7.50 | 7/27/35 | 3,450 | 3,629,669 | |||||||
| 64,362,477 | ||||||||||||
Non Captive Finance 1.6% | ||||||||||||
General Motors Acceptance Corp., | ||||||||||||
Notes | Ba1 | 6.875 | 9/15/11 | 7,945 | 7,085,828 | |||||||
Notes | Ba1 | 6.875 | 8/28/12 | 9,580 | 8,463,020 | |||||||
GMAC LLC, | ||||||||||||
Notes | Ba1 | 7.00 | 2/1/12 | 650 | 584,148 | |||||||
Unsub. Notes(f) | Ba1 | 6.625 | 5/15/12 | 3,000 | 2,597,787 | |||||||
Residential Capital LLC, Sr. Unsec’d. Notes, M.T.N. | Ba1 | 8.88 | 7/1/14 | 2,425 | 3,544,821 | |||||||
| 22,275,604 | ||||||||||||
Packaging 2.5% | ||||||||||||
Ball Corp., Gtd. Notes | Ba1 | 6.625 | 3/15/18 | 1,950 | 1,867,125 | |||||||
Berry Plastics Hldg. Corp.,(f) | ||||||||||||
Sec’d. Notes | B3 | 8.875 | 9/15/14 | 3,800 | 3,790,500 | |||||||
Sec’d. Notes | B3 | 9.235(j) | 9/15/14 | 1,750 | 1,732,500 | |||||||
Crown Americas LLC, | ||||||||||||
Gtd. Notes | B1 | 7.625 | 11/15/13 | 5,550 | 5,577,750 | |||||||
Gtd. Notes | B1 | 7.75 | 11/15/15 | 600 | 606,000 | |||||||
Exopack Holding, Inc., Gtd. Notes | B3 | 11.25 | 2/1/14 | 2,500 | 2,600,000 | |||||||
Graham Packaging Co., Inc. | ||||||||||||
Sr. Notes | Caa1 | 8.50 | 10/15/12 | 1,070 | 1,043,250 | |||||||
Sr. Sub. Notes(f) | Caa1 | 9.875 | 10/15/14 | 3,805 | 3,728,900 | |||||||
See Notes to Financial Statements.
| 26 | Visit our website at www.jennisondryden.com |
| Moody’s Rating (Unaudited) | Interest Rate | Maturity Date | Principal Amount (000) | Value (Note 1) | ||||||||
Grief Brothers Corp., | Ba2 | 6.75% | 2/1/17 | $ | 2,700 | $ | 2,632,500 | |||||
Owens Brockway Glass Container, Inc., | ||||||||||||
Gtd. Notes | B3 | 6.75 | 12/1/14 | 250 | 241,250 | |||||||
Gtd. Notes | Ba2 | 8.875 | 2/15/09 | 110 | 111,788 | |||||||
Sec’d. Notes | Ba2 | 8.75 | 11/15/12 | 7,430 | 7,727,199 | |||||||
Russell-Stanley Holdings, Inc., Sr. Sub Notes, 144A(e)(k) | NR | Zero | 11/30/08 | 55 | 1 | |||||||
Silgan Holdings, Inc., | B1 | 6.75 | 11/15/13 | 2,717 | 2,649,075 | |||||||
| 34,307,838 | ||||||||||||
Paper 3.1% | ||||||||||||
Abitibi Consolidated, Inc. (Canada),(f)(i) | ||||||||||||
Notes | B3 | 5.25 | 6/20/08 | 2,100 | 2,016,000 | |||||||
Notes | B3 | 8.55 | 8/1/10 | 605 | 541,475 | |||||||
Bowater Finance Corp. (Canada), Gtd. Notes(f)(i) | B3 | 7.95 | 11/15/11 | 1,230 | 1,045,500 | |||||||
Cascades, Inc. (Canada), Sr. Notes(i) | Ba3 | 7.25 | 2/15/13 | 3,205 | 3,060,775 | |||||||
Catalyst Paper Corp. (Canada), Sr. Notes(i) | B2 | 8.625 | 6/15/11 | 6,400 | 5,631,999 | |||||||
Cellu Tissue Holdings, Inc., Sec’d. Notes | B2 | 9.75 | 3/15/10 | 2,625 | 2,506,875 | |||||||
Domtar, Inc. (Canada), | ||||||||||||
Notes | B2 | 5.375 | 12/1/13 | 825 | 713,625 | |||||||
Sr. Notes | B2 | 7.875 | 10/15/11 | 1,465 | 1,450,350 | |||||||
Georgia Pacific Corp., | ||||||||||||
Gtd. Notes, 144A(f) | Ba3 | 7.125 | 1/15/17 | 3,950 | 3,713,000 | |||||||
Sr. Unsec’d. Notes | B2 | 8.00 | 1/15/24 | 310 | 291,400 | |||||||
Notes | B2 | 7.75 | 11/15/29 | 50 | 45,500 | |||||||
Notes | B2 | 8.125 | 5/15/11 | 1,400 | 1,407,000 | |||||||
Glatfelter, Gtd. Notes | Ba1 | 7.125 | 5/1/16 | 270 | 265,950 | |||||||
Graphic Packaging Int’l, Inc., | ||||||||||||
Sr. Notes | B2 | 8.50 | 8/15/11 | 3,010 | 3,040,100 | |||||||
Sr. Sub. Notes(f) | B3 | 9.50 | 8/15/13 | 3,500 | 3,535,000 | |||||||
Millar Western Forest Products Ltd. (Canada), Sr. Notes(i) | B2 | 7.75 | 11/15/13 | 275 | 215,188 | |||||||
NewPage Corp., Gtd. Notes(f) | B2 | 10.00 | 5/1/12 | 1,850 | 1,914,750 | |||||||
See Notes to Financial Statements.
| Dryden High Yield Fund, Inc. | 27 |
Portfolio of Investments
as of August 31, 2007 continued
| Moody’s Rating (Unaudited) | Interest Rate | Maturity Date | Principal Amount (000) | Value (Note 1) | ||||||||
Norampac, Inc. (Canada), Sr. Notes(i) | Ba3 | 6.75% | 6/1/13 | $ | 2,925 | $ | 2,742,188 | |||||
Smurfit Capital Funding PLC (Ireland), Gtd. Notes(i) | Ba2 | 7.50 | 11/20/25 | 100 | 95,500 | |||||||
Smurfit Kappa Funding PLC (Ireland),(i) | ||||||||||||
Sr. Notes(f) | B3 | 8.375 | 7/1/12 | 2,995 | 2,935,100 | |||||||
Sr. Sub. Notes | B2 | 7.75 | 4/1/15 | 100 | 96,500 | |||||||
Smurfit Stone Container Enterprises, Sr. Notes(f) | B3 | 8.00 | 3/15/17 | 2,090 | 1,993,338 | |||||||
Stone Container Finance (Canada), Gtd. Notes(f)(i) | B3 | 7.375 | 7/15/14 | 1,505 | 1,414,700 | |||||||
Verso Paper Hldgs. LLC, | ||||||||||||
Notes | B2 | 9.125 | 8/1/14 | 300 | 300,000 | |||||||
Notes | B2 | 9.106(j) | 8/1/14 | 430 | 427,850 | |||||||
Sr. Sub. Notes | B3 | 11.375 | 8/1/16 | 1,625 | 1,657,500 | |||||||
| 43,057,163 | ||||||||||||
Pipelines & Other 3.1% | ||||||||||||
Amerigas Partners LP/Amerigas Eagle Finance Corp., Sr. Notes | B1 | 7.125 | 5/20/16 | 4,290 | 4,118,400 | |||||||
El Paso Corp., | ||||||||||||
Sr. Unsec’d. Notes | Ba3 | 7.80 | 8/1/31 | 750 | 746,775 | |||||||
Sr. Unsec’d. Notes(f) | Ba3 | 7.875 | 6/15/12 | 750 | 778,830 | |||||||
Sr. Unsec’d. Notes | Ba3 | 8.05 | 10/15/30 | 450 | 455,191 | |||||||
Ferrellgas Partners LP, Sr. Notes | Ba3 | 6.75 | 5/1/14 | 1,500 | 1,425,000 | |||||||
Inergy LP/Inergy Finance Corp., Sr. Notes | B1 | 8.25 | 3/1/16 | 3,750 | 3,796,875 | |||||||
Kinder Morgan Finance Co. ULC (Canada),(i) | ||||||||||||
Gtd. Notes | Ba2 | 5.70 | 1/5/16 | 2,150 | 1,914,033 | |||||||
Gtd. Notes | Ba2 | 6.40 | 1/5/36 | 2,950 | 2,454,984 | |||||||
Pacific Energy Partners LP, Sr. Notes | Baa3 | 7.125 | 6/15/14 | 1,900 | 1,951,055 | |||||||
SemGroup LP, Sr. Notes, 144A (cost $406,065; purchased 4/28/06-10/3/06)(b) | B1 | 8.75 | 11/15/15 | 400 | 385,000 | |||||||
Sonat, Inc., Notes | Ba3 | 7.625 | 7/15/11 | 350 | 358,316 | |||||||
Southern Natural Gas Co., Notes | Baa3 | 8.00 | 3/1/32 | 125 | 139,717 | |||||||
Suburban Propane Partners LP/ Suburban Energy Finance Corp., Sr. Notes | B1 | 6.875 | 12/15/13 | 505 | 482,275 | |||||||
See Notes to Financial Statements.
| 28 | Visit our website at www.jennisondryden.com |
| Moody’s Rating (Unaudited) | Interest Rate | Maturity Date | Principal Amount (000) | Value (Note 1) | ||||||||
Targa Resources, Inc., | B3 | 8.50% | 11/1/13 | $ | 1,400 | $ | 1,344,000 | |||||
Williams Cos., Inc., | ||||||||||||
Notes | Ba2 | 7.125 | 9/1/11 | 10,275 | 10,608,937 | |||||||
Notes | Ba2 | 7.875 | 9/1/21 | 4,865 | 5,217,713 | |||||||
Notes | Ba2 | 8.125 | 3/15/12 | 4,610 | 4,944,225 | |||||||
Notes(f) | Ba2 | 8.75 | 3/15/32 | 650 | 739,375 | |||||||
Sr. Notes | Ba2 | 7.625 | 7/15/19 | 800 | 850,000 | |||||||
Williams Partners LP | Ba3 | 7.25 | 2/1/17 | 225 | 222,750 | |||||||
| 42,933,451 | ||||||||||||
Real Estate Investment Trust | ||||||||||||
Forest City Enterprises, Inc., | Ba3 | 6.50 | 2/1/17 | 150 | 133,500 | |||||||
Retailers 1.8% | ||||||||||||
Asbury Automotive Group, Inc., Sr. Sub. Notes | B3 | 8.00 | 3/15/14 | 1,650 | 1,575,750 | |||||||
Bon-Ton Stores, Inc. (The), Gtd. Notes(f) | B3 | 10.25 | 3/15/14 | 400 | 364,000 | |||||||
Buhrmann US, Inc., (Netherlands), Gtd. Notes | B2 | 7.875 | 3/1/15 | 275 | 253,000 | |||||||
Couche-Tard Finance Corp., Sr. Sub. Notes | Ba2 | 7.50 | 12/15/13 | 1,701 | 1,666,980 | |||||||
GSC Holdings, Gtd. Notes | Ba3 | 8.00 | 10/1/12 | 1,140 | 1,174,200 | |||||||
Michaels Stores, Inc., Sr. Notes, 144A | B2 | 10.00 | 11/1/14 | 3,425 | 3,433,563 | |||||||
Neiman Marcus Group, Inc., | ||||||||||||
Gtd. Notes(f) | B3 | 10.375 | 10/15/15 | 895 | 962,125 | |||||||
Gtd. Notes, PIK | B2 | 9.00 | 10/15/15 | 3,425 | 3,613,375 | |||||||
Pantry, Inc., Sr. Sub. Notes | B3 | 7.75 | 2/15/14 | 2,825 | 2,683,750 | |||||||
Rite Aid Corp., Sec’d. Notes | B3 | 8.125 | 5/1/10 | 5,720 | 5,720,000 | |||||||
Sally Holdings LLC, Sr. Notes, 144A | B2 | 9.25 | 11/15/14 | 200 | 197,000 | |||||||
Stripes Acquisition LLC/Susser Finance Corp., Sr. Notes | B2 | 10.625 | 12/15/13 | 2,849 | 2,977,205 | |||||||
Yankee Acquisition Corp., Sr. Notes | B3 | 8.50 | 2/15/15 | 100 | 94,000 | |||||||
| 24,714,948 | ||||||||||||
See Notes to Financial Statements.
| Dryden High Yield Fund, Inc. | 29 |
Portfolio of Investments
as of August 31, 2007 continued
| Moody’s Rating (Unaudited) | Interest Rate | Maturity Date | Principal Amount (000) | Value (Note 1) | ||||||||
Structured Notes 0.3% | ||||||||||||
CDX North America High Yield, Pass-thru certs, 8T1, 144A(f) | B3 | 7.625% | 6/29/12 | $ | 4,300 | $ | 4,042,000 | |||||
Technology 4.4% | ||||||||||||
Amkor Technology, Inc., Sr. Notes(f) | B1 | 7.125 | 3/15/11 | 1,475 | 1,386,500 | |||||||
Ampex Corp., | NR | 12.00 | 8/15/08 | 152 | 113,795 | |||||||
Avago Technologies Finance Pte (Singapore),(i) | ||||||||||||
Sr. Notes | B2 | 10.125 | 12/1/13 | 4,500 | 4,702,500 | |||||||
Sr. Sub. Notes(f) | Caa1 | 11.875 | 12/1/15 | 1,550 | 1,681,750 | |||||||
Celestica, Inc. (Canada),(i) | ||||||||||||
Sr. Sub. Notes(f) | B3 | 7.625 | 7/1/13 | 200 | 183,000 | |||||||
Sr. Sub. Notes | B3 | 7.875 | 7/1/11 | 150 | 142,500 | |||||||
Communications & Power Industries, Inc., Gtd. Notes | B3 | 8.00 | 2/1/12 | 250 | 251,250 | |||||||
Flextronics Int’l, Ltd. (Singapore),(i) | ||||||||||||
Sr. Sub. Notes | Ba2 | 6.25 | 11/15/14 | 1,500 | 1,380,000 | |||||||
Sr. Sub. Notes | Ba2 | 6.50 | 5/15/13 | 1,370 | 1,304,925 | |||||||
Freescale Semiconductor, Inc., | ||||||||||||
Sr. Notes(f) | B1 | 8.875 | 12/15/14 | 6,895 | 6,360,637 | |||||||
Sr. Notes, PIK | B1 | 9.125 | 12/15/14 | 15,600 | 13,961,999 | |||||||
Sr. Sub. Notes(f) | B2 | 10.125 | 12/15/16 | 810 | 704,700 | |||||||
Iron Mountain, Inc., | B3 | 8.625 | 4/1/13 | 6,075 | 6,074,999 | |||||||
Nortel Networks Corp. (Canada), Notes(i) | B3 | 4.25 | 9/1/08 | 3,070 | 3,031,625 | |||||||
Nortel Networks Ltd. (Canada), 144A,(i) | ||||||||||||
Gtd. Notes | B3 | 10.125 | 7/15/13 | 175 | 178,938 | |||||||
Gtd. Notes | B3 | 10.75 | 7/15/16 | 75 | 77,813 | |||||||
NXP Funding LLC (Netherlands), Sec’d. Notes(i) | Ba3 | 7.875 | 10/15/14 | 1,505 | 1,358,263 | |||||||
Open Solutions, Inc., | Caa1 | 9.75 | 2/1/15 | 2,000 | 1,900,000 | |||||||
Sanmina-SCI Corp., | B2 | 8.125 | 3/1/16 | 325 | 281,125 | |||||||
See Notes to Financial Statements.
| 30 | Visit our website at www.jennisondryden.com |
| Moody’s Rating (Unaudited) | Interest Rate | Maturity Date | Principal Amount (000) | Value (Note 1) | ||||||||
Sensata Technologies, Inc. (Netherlands), Sr. Notes(i) | B3 | 8.00% | 5/1/14 | $ | 4,585 | $ | 4,309,900 | |||||
Serena Software, Inc., Gtd. Notes | Caa1 | 10.375 | 3/15/16 | 5,390 | 5,363,050 | |||||||
Solectron Global Finance Ltd. (Cayman Islands), Gtd. Notes(i) | B3 | 8.00 | 3/15/16 | 100 | 106,250 | |||||||
STATS ChipPAC Ltd. (Singapore), Sr. Notes(i) | Ba1 | 6.75 | 11/15/11 | 1,670 | 1,670,000 | |||||||
Sungard Data Systems, Inc., Gtd. Notes | Caa1 | 9.125 | 8/15/13 | 798 | 823,935 | |||||||
Unisys Corp., Sr. Notes | B2 | 8.00 | 10/15/12 | 1,290 | 1,206,150 | |||||||
Xerox Corp., | ||||||||||||
Sr. Notes | Baa3 | 6.875 | 8/15/11 | 200 | 205,707 | |||||||
Sr. Sub. Notes | Baa3 | 6.40 | 3/15/16 | 1,175 | 1,187,798 | |||||||
Sr. Unsec’d. Notes | Baa3 | 6.75 | 2/1/17 | 250 | 257,282 | |||||||
| 60,206,391 | ||||||||||||
Telecommunications 5.9% | ||||||||||||
Alltel Corp., | ||||||||||||
Sr. Notes | A2 | 7.00 | 7/1/12 | 495 | 453,291 | |||||||
Sr. Notes | A2 | 7.875 | 7/1/32 | 1,650 | 1,353,231 | |||||||
American Cellular Corp., Sr. Notes, Ser. B | B3 | 10.00 | 8/1/11 | 54 | 56,025 | |||||||
Centennial Cellular Corp., Ser. B, Gtd. Notes | B2 | 10.125 | 6/15/13 | 275 | 288,063 | |||||||
Centennial Communications Corp., Sr. Notes(f) | Caa1 | 10.00 | 1/1/13 | 1,410 | 1,473,450 | |||||||
Cincinnati Bell, Inc., | ||||||||||||
Gtd. Notes | Ba3 | 7.25 | 7/15/13 | 1,150 | 1,141,375 | |||||||
Sr. Sub. Notes(f) | B2 | 8.375 | 1/15/14 | 1,380 | 1,366,200 | |||||||
Citizens Communications Co., Notes | Ba2 | 9.25 | 5/15/11 | 2,045 | 2,193,263 | |||||||
Sr. Notes(f) | Ba2 | 6.25 | 1/15/13 | 5,085 | 4,881,600 | |||||||
Sr. Notes | Ba2 | 9.00 | 8/15/31 | 1,035 | 1,016,888 | |||||||
Cricket Communications, Inc., | ||||||||||||
Gtd. Notes, 144A | Caa1 | 9.375 | 11/1/14 | 3,700 | 3,626,000 | |||||||
Sr. Notes | Caa1 | 9.375 | 11/1/14 | 3,150 | 3,087,000 | |||||||
Dobson Cellular Systems, Inc., Sec’d. Notes(f) | Ba2 | 8.375 | 11/1/11 | 1,925 | 2,035,688 | |||||||
Dobson Communications Corp., Sr. Notes | Caa1 | 9.61(j) | 10/15/12 | 945 | 963,900 | |||||||
See Notes to Financial Statements.
| Dryden High Yield Fund, Inc. | 31 |
Portfolio of Investments
as of August 31, 2007 continued
| Moody’s Rating (Unaudited) | Interest Rate | Maturity Date | Principal Amount (000) | Value (Note 1) | ||||||||
Hawaiian Telcom Communication, Inc.,(f) | ||||||||||||
Sr. Notes | Caa1 | 10.86(j)% | 5/1/13 | $ | 1,650 | $ | 1,666,500 | |||||
Sr. Notes | Caa1 | 12.50 | 5/1/15 | 915 | 969,900 | |||||||
Level 3 Financing, Inc., | ||||||||||||
Sr. Notes | B3 | 9.25 | 11/1/14 | 875 | 842,188 | |||||||
Sr. Notes | B3 | 12.25 | 3/15/13 | 10,475 | 11,417,749 | |||||||
Sr. Notes | B3 | 8.75 | 2/15/17 | 3,125 | 2,937,500 | |||||||
Nextel Communications, Inc., Gtd. Notes, Ser. D | Baa3 | 7.375 | 8/1/15 | 425 | 427,835 | |||||||
Nordic Teleco Holding, Inc. (Denmark), Sr. Notes, 144A(i) | B2 | 8.875 | 5/1/16 | 5,220 | 5,402,699 | |||||||
PAETEC Holding Corp., | Caa1 | 9.50 | 7/15/15 | 2,625 | 2,506,875 | |||||||
Qwest Communications Int’l., Inc., Gtd. Notes(f) | Ba3 | 7.50 | 2/15/14 | 6,530 | 6,415,724 | |||||||
Qwest Corp., | ||||||||||||
Debs. | Ba1 | 6.875 | 9/15/33 | 1,025 | 937,875 | |||||||
Debs. | Ba1 | 7.20 | 11/10/26 | 1,000 | 957,500 | |||||||
Sr. Notes | Ba1 | 7.625 | 6/15/15 | 2,380 | 2,451,400 | |||||||
Sr. Unsec’d. Notes | Ba1 | 7.50 | 10/1/14 | 3,550 | 3,638,750 | |||||||
Rogers Wireless Communications, Inc. (Canada),(i) | ||||||||||||
Sr. Sec’d. Notes | Baa3 | 9.625 | 5/1/11 | 5,100 | 5,749,433 | |||||||
Sr. Sub. Notes | Ba1 | 8.00 | 12/15/12 | 225 | 237,182 | |||||||
Rural Cellular Corp., | B3 | 9.875 | 2/1/10 | 200 | 207,000 | |||||||
Time Warner Telecom Holdings, Inc., Gtd. Notes | B3 | 9.25 | 2/15/14 | 2,450 | 2,535,750 | |||||||
Wind Acquisition Finance SA (Luxembourg), Sec’d. Notes, 144A(i) | B2 | 10.75 | 12/1/15 | 1,000 | 1,030,000 | |||||||
Wind Acquisition Holdings (Luxembourg), Bank Loan, PIK(k)(i) | Ba3 | 12.61 | 12/21/11 | 213 | 211,800 | |||||||
Windstream Corp., | ||||||||||||
Gtd. Notes | Ba3 | 8.125 | 8/1/13 | 1,000 | 1,032,500 | |||||||
Sr. Notes | Ba3 | 8.625 | 8/1/16 | 5,135 | 5,366,075 | |||||||
| 80,878,209 | ||||||||||||
See Notes to Financial Statements.
| 32 | Visit our website at www.jennisondryden.com |
| Moody’s Rating (Unaudited) | Interest Rate | Maturity Date | Principal Amount (000) | Value (Note 1) | ||||||||
Tobacco 0.5% | ||||||||||||
Reynolds American, Inc., | ||||||||||||
Bonds(f) | Ba1 | 6.75% | 6/15/17 | $ | 2,200 | $ | 2,232,212 | |||||
Gtd. Notes | Ba1 | 7.30 | 7/15/15 | 2,000 | 2,048,508 | |||||||
Gtd. Notes | Ba1 | 7.625 | 6/1/16 | 2,495 | 2,612,982 | |||||||
Gtd. Notes | Ba1 | 7.75 | 6/1/18 | 100 | 105,247 | |||||||
| 6,998,949 | ||||||||||||
Total corporate bonds | 1,285,920,526 | |||||||||||
SOVEREIGN BOND 0.3% | ||||||||||||
Republic of Argentina, Bonds(i) | NR | 7.00 | 10/3/15 | 5,800 | 4,440,706 | |||||||
| Shares | |||||||||||
COMMON STOCKS 0.3% | |||||||||||
Classic Communications, Inc.(c)(k) | 3,000 | 30 | |||||||||
Embarq Corp. | 2,933 | 183,078 | |||||||||
General Chemical Industrial Products, Inc., Ser. A(c)(k) | 103 | † | |||||||||
General Chemical Industrial Products, Inc.(c)(k) | 179 | 49,907 | |||||||||
Link Energy LLC(c)(k) | 20,000 | 360 | |||||||||
Neenah Enterprises, Inc.(c)(k) | 3,902 | 24,388 | |||||||||
Peachtree Cable Assoc. Ltd.(c)(k) | 31,559 | 316 | |||||||||
Pliant Corp.(c)(k) | 2 | † | |||||||||
Russell Stanley Holdings, Inc.(c)(k) | 6,000 | 6 | |||||||||
Sprint Nextel Corp.(f) | 28,675 | 542,531 | |||||||||
Xerox Corp.(c) | 194,797 | 3,336,872 | |||||||||
Total common stocks | 4,137,488 | ||||||||||
PREFERRED STOCKS(c) | |||||||||||
Building Materials & Construction | |||||||||||
New Millenium Homes LLC, Ser. A(d)(e)(k) | 2,000 | 370,000 | |||||||||
See Notes to Financial Statements.
| Dryden High Yield Fund, Inc. | 33 |
Portfolio of Investments
as of August 31, 2007 continued
| Shares | Value (Note 1) | |||||||||||
Cable | ||||||||||||
Adelphia Recovery Trust(k) | 2,000,000 | $ | 2,000 | |||||||||
Adelphia Communications Corp.(e)(k) | 20,000 | 20 | ||||||||||
PTV, Inc., Ser. A, 10.00%(e) | 9 | 59 | ||||||||||
| 2,079 | ||||||||||||
Media & Entertainment | ||||||||||||
Ziff Davis Holdings, Inc., 10.00% | 2 | 48 | ||||||||||
Total preferred stocks | 372,127 | |||||||||||
| Expiration Date | ||||||||||||
WARRANTS(c) | ||||||||||||
Cable | ||||||||||||
TVN Entertainment (cost $5,615,000; purchased 10/21/04)(b)(k) | 1/1/49 | 46,241 | 26,820 | |||||||||
Capital Goods | ||||||||||||
Pliant Corp., 144A(k) | 6/1/10 | 475 | † | |||||||||
Chemicals | ||||||||||||
General Chemical Industrial Products, Ser. B(k) | 4/30/11 | 77 | † | |||||||||
Sterling Chemical, Inc.(d)(k) | 8/15/08 | 5,450 | 5 | |||||||||
Consumer | ||||||||||||
IHF Holdings, Inc.(k) | 2/31/49 | 4,375 | 44 | |||||||||
Gaming | ||||||||||||
Aladdin Gaming(k) | 3/1/10 | 30,000 | 30 | |||||||||
Media & Entertainment | ||||||||||||
Advanstar Holdings Corp., 144A(k) | 10/15/11 | 225 | 2 | |||||||||
XM Satellite Radio, Inc., 144A(k) | 3/15/10 | 345 | † | |||||||||
Ziff Davis Holdings, Inc. | 8/12/12 | 4,400 | 45 | |||||||||
| 47 | ||||||||||||
See Notes to Financial Statements.
| 34 | Visit our website at www.jennisondryden.com |
| Expiration Date | Shares | Value (Note 1) | ||||||||||
Paper | ||||||||||||
Smurfit Kappa Funding PLC (Ireland), 144A(i)(k) | 4/1/15 | 275 | $ | 3,260 | ||||||||
Technology | ||||||||||||
Viasystems Group, Inc.(k) | 1/10/31 | 166,335 | 18 | |||||||||
Telecommunications | ||||||||||||
Allegiance Telecom, Inc.(k) | 2/3/08 | 14,200 | 14 | |||||||||
GT Group Telecom, Inc. (Canada), 144A(d)(i)(k) | 2/1/10 | 8,610 | 9 | |||||||||
Verado Holdings, Inc.(k) | 4/15/08 | 4,075 | 1,642 | |||||||||
Versatel Telecom Int’l. NV (Netherlands)(i)(k) | 5/15/08 | 10,000 | 10 | |||||||||
| 1,675 | ||||||||||||
Total warrants | 31,899 | |||||||||||
Total long-term investments | 1,311,249,145 | |||||||||||
SHORT-TERM INVESTMENTS 19.4% | ||||||||||||
Affiliated Mutual Funds | ||||||||||||
Dryden Core Investment Fund—Short-Term Core Bond Series(h) | 1,067,546 | 10,440,602 | ||||||||||
Dryden Core Investment Fund—Taxable Money Market Series (includes $223,718,479 of cash collateral received for securities on loan)(g)(h) | 257,013,484 | 257,013,484 | ||||||||||
Total short-term investments | 267,454,086 | |||||||||||
Total Investments(m) 114.5% | 1,578,703,231 | |||||||||||
Liabilities in excess of assets(n) (14.5%) | (200,011,201 | ) | ||||||||||
Net Assets 100.0% | $ | 1,378,692,030 | ||||||||||
See Notes to Financial Statements.
| Dryden High Yield Fund, Inc. | 35 |
Portfolio of Investments
as of August 31, 2007 continued
The following abbreviations are used in portfolio descriptions:
144A—Security was purchased pursuant to, Rule 144A under the Securities Act of 1933 and may not be resold subject to that rule except to qualified institutional buyers. Unless otherwise noted, 144A securities are deemed to be liquid.
LLC—Limited Liability Company.
LP—Limited Partnership.
PIK—Payment-in-kind.
NR—Not Rated by Moody’s or Standard & Poor’s.
M.T.N.—Medium Term Notes
† Less than $0.50.
| (a) | Standard & Poor’s rating. The Fund’s current prospectus contains a description of Moody’s and Standard & Poor’s ratings. |
| (b) | Indicates a restricted security; the aggregate cost of such securities is $13,772,394. The aggregate value of $8,063,338 is approximately 0.6% of net assets. |
| (c) | Non-income producing security. |
| (d) | Consists of more than one class of securities traded together as a unit; generally bonds with attached stock or warrants. |
| (e) | Represents issuer in default on interest payments; non-income producing security. |
| (f) | All or portion of security is on loan. The aggregate market value of such securities is $217,228,757; cash collateral of $223,718,479 (included in liabilities) was received with which the Portfolio purchased highly liquid short-term investments. |
| (g) | Represents security, or portion thereof, purchased with cash collateral received for securities on loan. |
| (h) | Prudential Investments LLC, the manager of the Fund, also serves as manager of the Dryden Core Investment Fund—Short Term Bond Series and the Dryden Core Investment Fund—Taxable Money Market Series. |
| (i) | US$ denominated foreign securities. |
| (j) | Floating rate bond. The coupon is indexed to a floating interest rate. The rate shown is the rate at August 31, 2007. |
| (k) | Indicates a security that has been deemed illiquid. |
| (l) | The rate shown reflects the coupon rate after the step date. |
| (m) | As of August 31, 2007, 17 securities representing $566,219 and 0.04% of the total market value were fair valued in accordance with the policies adopted by the Board of Directors. |
| (n) | Liabilities in excess of other assets include net unrealized appreciation (depreciation) on credit default swaps and foreign currency contracts as follows: |
See Notes to Financial Statements.
| 36 | Visit our website at www.jennisondryden.com |
Credit default swap agreements outstanding at August 31, 2007:
Counterparty (1) | Termination Date | Notional Amount (000) | Fixed Rate | Underlying Bond | Unrealized Appreciation (Depreciation) | ||||||||
Morgan Stanley Capital Services, Inc. | 09/20/2010 | $ | 2,500 | 4.20% | Lear Corp. 8.11% 5/15/09 | $ | 77,789 | ||||||
Merrill Lynch Capital Services, Inc. | 09/20/2009 | 2,000 | 4.65% | General Motors Corp. 7.125% 7/15/19 | (63,329 | ) | |||||||
| $ | 14,460 | ||||||||||||
| (1) | The Fund receives the fixed rate and pays the counterparty par in the event the underlying bond defaults. |
Forward foreign currency exchange contracts outstanding at August 31, 2007:
Foreign Currency Contracts | Contracts to Deliver | Payable at Settlement Date | Value at August 31, 2007 | Unrealized Appreciation (Depreciation) | ||||||
Purchased: | ||||||||||
Pound Sterling expiring 9/25/07 | GBP875,980 | 1,759,047 | 1,765,454 | $ | 6,407 | |||||
Sold: | ||||||||||
Pound Sterling expiring 9/25/07 | GBP3,537,895 | 7,042,382 | 7,130,289 | (87,908 | ) | |||||
| $ | (81,501 | ) | ||||||||
See Notes to Financial Statements.
| Dryden High Yield Fund, Inc. | 37 |
Portfolio of Investments
as of August 31, 2007 continued
The industry classification of long-term portfolio holdings, short-term investments and liabilities in excess of other assets shown as a percentage of net assets as of August 31, 2007 was as follows:
Affiliated Mutual Funds (including 16.3% of collateral received for securities on loan) | 19.4 | % | |
Media & Entertainment | 8.8 | ||
Electric | 8.5 | ||
Healthcare & Pharmaceutical | 7.8 | ||
Capital Goods | 6.8 | ||
Telecommunications | 5.9 | ||
Gaming | 5.2 | ||
Metals | 4.7 | ||
Cable | 4.5 | ||
Technology | 4.4 | ||
Energy—Other | 4.2 | ||
Automotive | 3.7 | ||
Chemicals | 3.7 | ||
Paper | 3.1 | ||
Pipelines & Other | 3.1 | ||
Foods | 3.0 | ||
Consumer | 2.8 | ||
Packaging | 2.5 | ||
Aerospace/Defense | 2.0 | ||
Retailers | 1.8 | ||
Lodging & Leisure | 1.6 | ||
Non Captive Finance | 1.6 | ||
Asset Backed Securities | 1.2 | ||
Building Materials & Construction | 1.0 | ||
Banking | 0.9 | ||
Airlines | 0.8 | ||
Tobacco | 0.5 | ||
Common Stocks | 0.3 | ||
Sovereign Bonds | 0.3 | ||
Structured Notes | 0.3 | ||
Energy—Integrated | 0.1 | ||
| 114.5 | |||
Liabilities in excess of other assets | (14.5 | ) | |
| 100.0 | % | ||
See Notes to Financial Statements.
| 38 | Visit our website at www.jennisondryden.com |
Financial Statements
| AUGUST 31, 2007 | ANNUAL REPORT |
Dryden High Yield Fund, Inc.
Statement of Assets and Liabilities
as of August 31, 2007
Assets | ||||
Investments, at value, including securities on loan of $217,228,757: | ||||
Unaffiliated investments (cost $1,345,102,373) | $ | 1,311,249,145 | ||
Affiliated investments (cost $267,659,991) | 267,454,086 | |||
Foreign currency, at value (cost $5,898) | 5,776 | |||
Cash | 5,554 | |||
Dividends and interest receivable | 29,556,534 | |||
Receivable for investments sold | 3,279,614 | |||
Receivable for Fund shares sold | 239,955 | |||
Prepaid expenses | 28,074 | |||
Unrealized appreciation on swap agreements | 77,789 | |||
Unrealized appreciation on forward foreign currency contracts | 6,407 | |||
Total assets | 1,611,902,934 | |||
Liabilities | ||||
Payable to broker for collateral for securities on loan | 223,718,479 | |||
Income distribution payable | 3,144,120 | |||
Payable for investments purchased | 2,431,021 | |||
Payable for Fund shares reacquired | 2,239,764 | |||
Accrued expenses | 531,758 | |||
Distribution fee payable | 401,698 | |||
Transfer agent fee payable | 300,901 | |||
Management fee payable | 253,487 | |||
Unrealized depreciation on forward foreign currency contracts | 87,908 | |||
Unrealized depreciation on swap agreements | 63,329 | |||
Deferred directors’ fees | 38,439 | |||
Total liabilities | 233,210,904 | |||
Net Assets | $ | 1,378,692,030 | ||
Net assets were comprised of: | ||||
Common stock, at par | $ | 2,469,700 | ||
Paid-in capital in excess of par | 2,567,032,784 | |||
| 2,569,502,484 | ||||
Undistributed net investment income | 486,125 | |||
Accumulated net realized loss on investments and foreign currency transactions | (1,157,170,552 | ) | ||
Net unrealized depreciation on investments and foreign currencies | (34,126,027 | ) | ||
Net assets, August 31, 2007 | $ | 1,378,692,030 | ||
See Notes to Financial Statements.
| 40 | Visit our website at www.jennisondryden.com |
Class A | |||
Net asset value and redemption price per share | |||
($1,099,469,099 ÷ 196,906,487 shares of common stock issued and outstanding) | $ | 5.58 | |
Maximum sales charge (4.50% of offering price) | .26 | ||
Maximum offering price to public | $ | 5.84 | |
Class B | |||
Net asset value, offering price and redemption price per share | |||
($160,264,909 ÷ 28,744,194 shares of common stock issued and outstanding) | $ | 5.58 | |
Class C | |||
Net asset value, offering price and redemption price per share | |||
($56,307,107 ÷ 10,099,145 shares of common stock issued and outstanding) | $ | 5.58 | |
Class L | |||
Net asset value, offering price and redemption price per share | |||
($6,687,769 ÷ 1,197,071 shares of common stock issued and outstanding) | $ | 5.59 | |
Class M | |||
Net asset value, offering price and redemption price per share | |||
($29,221,071 ÷ 5,241,529 shares of common stock issued and outstanding) | $ | 5.57 | |
Class R | |||
Net asset value, offering price and redemption price per share | |||
($851,154 ÷ 152,314 shares of common stock issued and outstanding) | $ | 5.59 | |
Class X | |||
Net asset value, offering price and redemption price per share | |||
($4,526,883 ÷ 812,063 shares of common stock issued and outstanding) | $ | 5.57 | |
Class Z | |||
Net asset value, offering price and redemption price per share | |||
($21,364,038 ÷ 3,817,174 shares of common stock issued and outstanding) | $ | 5.60 | |
See Notes to Financial Statements.
| Dryden High Yield Fund, Inc. | 41 |
Statement of Operations
| Eight Month Period Ended August 31, 2007 | Year Ended December 31, 2006 | |||||||
Net Investment Income | ||||||||
Income | ||||||||
Interest | $ | 76,676,033 | $ | 120,088,969 | ||||
Unaffiliated dividends (net of foreign withholding taxes of $91,284 and $15,694, respectively) | 107,453 | 2,051,986 | ||||||
Affiliated dividend income | 2,364,228 | 1,742,342 | ||||||
Affiliated income from securities loaned, net | 266,185 | 631,312 | ||||||
Total income | 79,413,899 | 124,514,609 | ||||||
Expenses | ||||||||
Management fee | 4,549,672 | 7,088,715 | ||||||
Distribution fee—Class A | 1,947,574 | 3,014,639 | ||||||
Distribution fee—Class B | 893,639 | 1,743,266 | ||||||
Distribution fee—Class C | 292,301 | 419,593 | ||||||
Distribution fee—Class L | 16,643 | — | ||||||
Distribution fee—Class M | 159,344 | — | ||||||
Distribution fee—Class R | 1,336 | 14 | ||||||
Distribution fee—Class X | 23,379 | — | ||||||
Transfer agent’s fee and expenses (including affiliated expense of $880,200 and $1,337,296, respectively) | 1,439,000 | 1,795,000 | ||||||
Reports to shareholders | 240,000 | 80,000 | ||||||
Custodian’s fees and expenses | 134,000 | 135,000 | ||||||
Registration fees | 100,000 | 69,000 | ||||||
Legal fees and expenses | 38,000 | 25,000 | ||||||
Insurance | 27,000 | 49,000 | ||||||
Directors’ fees | 27,000 | 25,000 | ||||||
Audit fee | 26,000 | 23,000 | ||||||
Loan interest expense (Note 2) | — | 15,206 | ||||||
Miscellaneous | 9,794 | 29,254 | ||||||
Total expenses | 9,924,682 | 14,511,687 | ||||||
Less: Expense waiver (Note 2) | (64,702 | ) | — | |||||
Net expenses | 9,859,980 | 14,511,687 | ||||||
Net investment income | 69,553,919 | 110,002,922 | ||||||
Realized And Unrealized Gain (Loss) On Investments, Foreign Currency Transactions And Swaps | ||||||||
Net realized gain (loss) on: | ||||||||
Investment transactions | (1,050,744 | ) | (17,327,430 | ) | ||||
Foreign currency transactions | (26,499 | ) | (10,671 | ) | ||||
Swaps | 100,100 | 130,225 | ||||||
| (977,143 | ) | (17,207,876 | ) | |||||
Net change in unrealized appreciation (depreciation) on: | ||||||||
Investments | (50,976,016 | ) | 54,995,452 | |||||
Foreign currencies | (81,910 | ) | 8,529 | |||||
Swaps | (174,784 | ) | 405,214 | |||||
| (51,232,710 | ) | 55,409,195 | ||||||
Net gain (loss) on investments and foreign currency transactions | (52,209,853 | ) | 38,201,319 | |||||
Net Increase In Net Assets Resulting From Operations | $ | 17,344,066 | $ | 148,204,241 | ||||
See Notes to Financial Statements.
| 42 | Visit our website at www.jennisondryden.com |
Statement of Changes in Net Assets
| Eight Month Period Ended August 31, 2007 | Year Ended December 31, | |||||||||||
| 2006 | 2005 | |||||||||||
Increase (Decrease) In Net Assets | ||||||||||||
Operations | ||||||||||||
Net investment income | $ | 69,553,919 | $ | 110,002,922 | $ | 123,038,359 | ||||||
Net realized (loss) on investments and foreign | (977,143 | ) | (17,207,876 | ) | (11,527,899 | ) | ||||||
Net change in unrealized appreciation (depreciation) of investments and foreign currencies | (51,232,710 | ) | 55,409,195 | (65,106,834 | ) | |||||||
Net increase in net assets resulting from operations | 17,344,066 | 148,204,241 | 46,403,626 | |||||||||
Dividends from net investment income (Note 1) | ||||||||||||
Class A | (57,397,846 | ) | (91,121,822 | ) | (95,762,363 | ) | ||||||
Class B | (8,176,629 | ) | (16,383,182 | ) | (26,303,722 | ) | ||||||
Class C | (2,677,708 | ) | (3,945,884 | ) | (4,909,702 | ) | ||||||
Class L | (237,346 | ) | — | — | ||||||||
Class M | (1,058,763 | ) | — | — | ||||||||
Class R | (19,635 | ) | (214 | ) | (105 | ) | ||||||
Class X | (154,994 | ) | — | — | ||||||||
Class Z | (1,469,110 | ) | (2,079,925 | ) | (2,247,078 | ) | ||||||
| (71,192,031 | ) | (113,531,027 | ) | (129,222,970 | ) | |||||||
Fund share transactions (net of share conversions) (Note 7) |
| |||||||||||
Net proceeds from shares sold | 62,038,200 | 87,023,047 | 179,013,491 | |||||||||
Net asset value of shares issued in connection with merger (Note 7) | 80,086,722 | — | — | |||||||||
Net asset value of shares issued in reinvestment | 39,776,795 | 63,955,471 | 71,944,019 | |||||||||
Cost of shares reacquired | (227,074,856 | ) | (327,430,048 | ) | (479,150,992 | ) | ||||||
Net decrease in net assets from Fund | (45,173,139 | ) | (176,451,530 | ) | (228,193,482 | ) | ||||||
Total decrease | (99,021,104 | ) | (141,778,316 | ) | (311,012,826 | ) | ||||||
Net Assets | ||||||||||||
Beginning of period | 1,477,713,134 | 1,619,491,450 | 1,930,504,276 | |||||||||
End of period (a) | $ | 1,378,692,030 | $ | 1,477,713,134 | $ | 1,619,491,450 | ||||||
(a) Includes undistributed net investment income of: | $ | 486,125 | $ | 420,083 | $ | 112,801 | ||||||
See Notes to Financial Statements.
| Dryden High Yield Fund, Inc. | 43 |
Notes to Financial Statements
Dryden High Yield Fund, Inc. (the “Fund”) is registered under the Investment Company Act of 1940 as a diversified, open-end management investment company. The primary investment objective of the Fund is to maximize current income through investment in a diversified portfolio of high yield fixed-income securities which, in the opinion of the Fund’s investment adviser, do not subject the Fund to unreasonable risks. As a secondary investment objective, the Fund seeks capital appreciation but only when consistent with its primary objective. Lower rated or unrated (i.e., high yield) securities are more likely to react to developments affecting market risk (general market liquidity) and credit risk (an issuer’s inability to meet principal and interest payments on its obligations) than are more highly rated securities, which react primarily to movements in the general level of interest rates. The ability of issuers of debt securities held by the Fund to meet their obligations may be affected by economic developments in a specific industry or region.
The Fund’s fiscal year has changed from an annual reporting period that ends December 31 to one that ends August 31. This change should have no impact on the way the Fund is managed. Shareholders will receive future annual and semiannual reports on the new fiscal year-end schedule.
Note 1. Accounting Policies
The following is a summary of significant accounting policies followed by the Fund in the preparation of its financial statements.
Security Valuation: Securities listed on a securities exchange are valued at the last price on such exchange on the day of valuation or, if there was no sale on such day, at the mean between the last reported bid and asked prices, or at the last bid price on such day in the absence of an asked price. Securities traded via NASDAQ are valued at the official closing price provided by NASDAQ. Securities that are actively traded in the over-the-counter market, including listed securities for which the primary market is believed by Prudential Investments LLC (“PI” or “Manager”) in consultation with the subadvisor, to be over-the-counter, are valued at market value using prices provided by an independent pricing agent or principal market maker. Futures contracts and options thereon traded on a commodities exchange or board of trade are valued at the last sale price at the close of trading on such exchange or board of trade or, if there was no sale on the applicable commodities exchange or board of trade on such day, at the mean between the most recently quoted bid and asked prices on such exchange or board of trade or at the last bid price in the absence of an asked price. Certain fixed income securities for which daily market quotations are not
| 44 | Visit our website at www.jennisondryden.com |
readily available may be valued with reference to fixed income securities whose prices are more readily available, pursuant to guidelines established by the Board of Directors. Prices may be obtained from independent pricing services which use information provided by market makers or estimates of market values obtained from yield data relating to investments or securities with similar characteristics. Securities for which reliable market quotations are not readily available, or whose values have been affected by events occurring after the close of the security’s foreign market and before the Fund’s normal pricing time, are valued at fair value in accordance with the Board of Directors’ approved fair valuation procedures. When determining the fair valuation of securities, some of the factors influencing the valuation include, the nature of any restrictions on disposition of the securities; assessment of the general liquidity of the securities; the issuer’s financial condition and the markets in which it does business; the cost of the investment; the size of the holding and the capitalization of issuer; the prices of any recent transactions or bids/offers for such securities or any comparable securities; any available analyst media or other reports or information deemed reliable by the investment adviser regarding the issuer or the markets or industry in which it operates. Using fair value to price securities may result in a value that is different from the security’s most recent closing price and from the price used by other mutual funds to calculate their net asset values.
Investments in mutual funds are valued at their net asset value as of the close of the New York Stock Exchange on the date of valuation.
Short-term debt securities which mature in 60 days or less are valued at amortized cost, which approximates market value. The amortized cost method involves valuing a security at its cost on the date of purchase and thereafter assuming a constant amortization to maturity of the difference between the principal amount due at maturity and cost. Short-term debt securities which mature in more than 60 days are valued at current market quotations.
Restricted Securities: The Fund may hold up to 15% of its net assets in illiquid securities, including those which are restricted as to disposition under securities law (“restricted securities”). Restricted securities held by the Fund at the end of the fiscal period may include registration rights under which the Fund may demand registration by the issuer, of which the Fund may bear the cost of such registration. Restricted securities are valued pursuant to the valuation procedures noted above.
Swap Agreements: The Fund may enter into interest rate swap agreements, forward swap spread lock agreements, and credit default swap agreements. A swap agreement is an agreement to exchange the return generated by one instrument for the return generated by another instrument. Interest rate swap agreements involve the exchange
| Dryden High Yield Fund, Inc. | 45 |
Notes to Financial Statements
continued
by the Fund with another party of their respective commitments to pay or receive interest. Forward spread lock swap agreements involve commitments to pay or receive a settlement amount calculated as the difference between the swap spread and a fixed spread, multiplied by the notional amount times the duration of the swap.
The swap spread is the difference between the benchmark swap rate (market rate) and the specific Treasury rate. In a credit default swap agreement, one party (the protection buyer) makes a stream of payments to another party (the protection seller) in exchange for the right to receive a specified payment in the event of a default by a third party, typically corporate issues or sovereign issues of an emerging country, on its obligation. The maximum amount of the payment may equal the notional, at par, of the underlying index or security as a result of a default (or “credit event”). In addition to bearing the risk that the credit event will occur, the Fund could be exposed to market risk due to unfavorable changes in interest rates or in the price of the underlying security or index, the possibility that the fund may be unable to close out its position at the same time or at the same price as if it had purchased comparable publicly traded securities, or that the counterparty may default on it’s obligation to perform. The swaps are valued daily at current market value and any unrealized appreciation or depreciation is included in the Statement of Assets and Liabilities. Payments received or paid by the Fund are recorded as realized gains or losses. Risk of loss may exceed amounts recognized on the statements of assets and liabilities. Swap agreements outstanding at period end, if any, are listed on the Schedule of Investments.
Forward currency contracts, written options, short sales, swaps and financial futures contracts involve elements of both market and credit risk in excess of the amounts reflected on the Statement of Assets and Liabilities.
Loan Participations: The Fund may invest in loan participations, another type of restricted security. When the Fund purchases a loan participation, the Fund typically enters into a contractual relationship with the lender or third party selling such participations (“Selling Participant”), but not the borrower. As a result, the Fund assumes the credit risk of the borrower, the selling participant and any other persons interpositioned between the Fund and the borrower (“intermediate participants”). The Fund may not directly benefit from the collateral supporting the senior loan in which it has purchased the loan participation.
| 46 | Visit our website at www.jennisondryden.com |
Foreign Currency Translation: The books and records of the Fund are maintained in U.S. dollars. Foreign currency amounts are translated into U.S. dollars on the following basis:
(i) market value of investment securities, other assets and liabilities at the closing daily rates of exchange;
(ii) purchases and sales of investment securities, income and expenses at the rates of exchange prevailing on the respective dates of such transactions.
The Fund does not isolate that portion of the results of operations arising as a result of changes in the foreign exchange rates from the fluctuations arising from changes in the market prices of long-term securities held at the end of the fiscal period. Similarly, the Fund does not isolate the effect of changes in foreign exchange rates from the fluctuations arising from changes in the market prices of long-term portfolio securities sold during the fiscal period. Accordingly, realized foreign currency gains (losses) are included in the reported net realized gains (losses) on investment transactions.
Net realized gains or losses on foreign currency transactions represent net foreign exchange gains or losses from the holding of foreign currencies, currency gains (losses) realized between the trade and settlement dates on security transactions, and the difference between the amounts of dividends, interest and foreign withholding taxes recorded on the Fund’s books and the U.S. dollar equivalent amounts actually received or paid. Net unrealized currency gains (losses) from valuing foreign currency denominated assets and liabilities (other than investments) at period-ended exchange rates are reflected as a component of net unrealized appreciation (depreciation) on investments and foreign currencies.
Foreign security and currency transactions may involve certain considerations and risks not typically associated with those of domestic origin as a result of, among other factors, the possibility of political and economic instability or the level of governmental supervision and regulation of foreign securities markets.
Forward Currency Contracts: A forward currency contract is a commitment to purchase or sell a foreign currency at a future date at a negotiated forward rate. The Fund enters into forward currency contracts in order to hedge its exposure to changes in foreign currency exchange rates on its foreign portfolio holdings or on specific receivables and payables denominated in a foreign currency. The contracts are valued daily at current forward exchange rates and any unrealized gain or loss is included in net unrealized appreciation (depreciation) on investments and foreign currencies. Gain or loss is realized on the settlement date of the contract equal to the difference between the settlement value of the original and renegotiated forward
| Dryden High Yield Fund, Inc. | 47 |
Notes to Financial Statements
continued
contracts. This gain or loss, if any, is included in net realized gain or loss on foreign currency transactions. Risks may arise upon entering into these contracts from the potential inability of the counterparties to meet the terms of their contracts.
Forward currency contracts involve elements of both market and credit risk in excess of the amounts reported on the Statement of Assets and Liabilities.
Securities Lending: The Fund may lend its portfolio securities to broker-dealers. The loans are secured by collateral at least equal at all times to the market value of the securities loaned. Loans are subject to termination at the option of the borrower or the Fund. Upon termination of the loan, the borrower will return to the lender securities identical to the loaned securities. Should the borrower of the securities fail financially, the Fund has the right to repurchase the securities using the collateral in the open market. The Fund recognizes income, net of any rebate and securities lending agent fees, for lending its securities in the form of fees or interest on the investment of any cash received as collateral. The Fund also continues to receive interest and dividends or amounts equivalent thereto, on the securities loaned and recognizes any unrealized gain or loss in the market price of the securities loaned that may occur during the term of the loan.
Securities Transactions and Net Investment Income: Securities transactions are recorded on the trade date. Realized gains and losses on sales of investments are calculated on the identified cost basis. Dividend income is recorded on the ex-dividend date and interest income, including amortization of premium and accretion of discount on debt securities, as required, is recorded on the accrual basis. Expenses are recorded on the accrual basis which may require the use of certain estimates by management.
Net investment income (loss) (other than distribution fees which are charged directly to the respective class) and unrealized and realized gains and losses are allocated daily to each class of shares based upon the relative proportion of net assets of each class at the beginning of the day.
Taxes: For federal income taxes purposes, it is Fund’s policy to continue to meet the requirements of the Internal Revenue Code applicable to regulated investment companies and to distribute all of its taxable net income and capital gains, if any, to its shareholders. Therefore, no federal income tax provision is required.
| 48 | Visit our website at www.jennisondryden.com |
Dividends and Distributions: The Fund declares daily and pays dividends of net investment income monthly and makes distributions of net realized capital and currency gains, if any, annually. Dividends and distributions to shareholders, which are determined in accordance with federal income tax regulations and which may differ from generally accepted accounting principles, are recorded on the ex-dividend date. Permanent book/tax differences relating to income and gains are reclassified amongst undistributed net investment income, accumulated net realized gain or loss and paid-in capital in excess of par, as appropriate.
Estimates: The preparation of the financial statements requires management to make estimates and assumptions that affect the reported amounts and disclosures in the financial statements. Actual results could differ from those estimates.
Note 2. Agreements
The Fund has a management agreement with PI. Pursuant to this agreement, PI has responsibility for all investment advisory services and supervises the subadvisor’s performance of such services. PI has entered into a subadvisory agreement with Prudential Investment Management, Inc. (“PIM”). The subadvisory agreement provides that PIM will furnish investment advisory services in connection with the management of the Fund. In connection therewith, PIM is obligated to keep certain books and records of the Fund. PI pays for the services of PIM, the cost of compensation of officers of the Fund, occupancy and certain clerical and bookkeeping costs of the Fund. The Fund bears all other costs and expenses.
The management fee paid to PI is accrued daily and payable monthly, at an annual rate of .50 of 1% of the Fund’s average daily net assets up to $250 million, .475 of 1% of the next $500 million, .45 of 1% of the next $750 million, .425 of 1% of the next $500 million, .40 of 1% of the next $500 million, .375 of 1% of the next $500 million and .35 of 1% of the Fund’s average daily net assets in excess of $3 billion. The effective management fee rate was .47 of 1% for the eight month period ended August 31, 2007.
Effective, March 23, 2007, PI has contractually agreed to waive up to .01% of the Fund’s management fee on an annualized basis until March 31, 2008, to the extent the Fund’s net operating expenses, exclusive of taxes, interest, distribution (12b-1) fees and certain extraordinary expenses, exceed .64%.
The Fund has a distribution agreement with Prudential Investment Management Services LLC (“PIMS”), which acts as the distributor of the Class A, Class B, Class C,
| Dryden High Yield Fund, Inc. | 49 |
Notes to Financial Statements
continued
Class L, Class M, Class R, Class X and Class Z shares of the Fund. The Fund compensates PIMS for distributing and servicing the Fund’s Class A, Class B, Class C, Class L, Class M, Class R and Class X shares, pursuant to plans of distribution (the “Class A, B, C, L, M, R and X Plans”), regardless of expenses actually incurred by PIMS. The distribution fees are accrued daily and payable monthly. No distribution or service fees are paid to PIMS as distributor of the Class Z shares of the Fund.
Pursuant to the Class A, B, C, L, M, R and X Plans, the Fund compensates PIMS for distribution related activities at an annual rate of up to .30 of 1%, .75 of 1%, 1%, .50 of 1%, 1%, .75 of 1% and 1% of the average daily net assets of the Class A, B, C, L, M, R and X shares, respectively. For the eight month period ended August 31, 2007, PIMS contractually agreed to limit such fees to .25 of 1%, .75 of 1% and .50 of 1% of the average daily net assets of the Class A, Class C and Class R shares, respectively.
PIMS has advised the Fund that it has received approximately $167,100 in front-end sales charges resulting from sales of Class A shares, during the eight month period ended August 31, 2007. From these fees, PIMS paid such sales charges to affiliated broker-dealers, which in turn paid commissions to salespersons and incurred other distribution costs.
PIMS has advised the Fund that for the eight month period ended August 31, 2007, it received approximately $157,900, $7,600, $79,200 and $6,900 in contingent deferred sales charges imposed upon redemptions by certain Class B, Class C, Class M and Class X shareholders, respectively.
PI, PIMS and PIM are indirect, wholly-owned subsidiaries of Prudential Financial, Inc. (“Prudential”).
The Fund, along with other affiliated registered investment companies (the “Funds”), is a party to a Syndicated Credit Agreement (“SCA”) with two banks. The SCA provides for a commitment of $500 million. Interest on any borrowings under the SCA is incurred at contracted market rates and a commitment fee for the unused amount is accrued daily and paid quarterly. Effective October 27, 2006, the Funds renewed SCA with the banks. The commitment under the renewed SCA continues to be $500 million. The Funds pay a commitment fee of .07 of 1% of the unused portion of the renewed SCA. The expiration date of the renewed SCA will be October 26, 2007. The SCA is in the process of being renewed through October 24, 2008. The
| 50 | Visit our website at www.jennisondryden.com |
purpose of the SCA is to provide an alternative source of temporary funding for capital share redemptions. The Fund did not borrow any amounts pursuant to the SCA during the period ended August 31, 2007.
Note 3. Other Transactions with Affiliates
Prudential Mutual Fund Services LLC (“PMFS”), an affiliate of PI and an indirect, wholly-owned subsidiary of Prudential, serves as the Fund’s transfer agent. Transfer agent’s fees and expenses in the Statement of Operations include certain out-of-pocket expenses paid to non-affiliates, where applicable.
The Fund pays networking fees to affiliated and unaffiliated broker/dealers including fees relating to the services of Wachovia Securities, LLC (“Wachovia”) and First Clearing LLC (“First Clearing”) affiliates of PI. These networking fees are payments made to broker/dealers that clear mutual fund transactions through a national clearing system. For the eight month period ended August 31, 2007 and the year ended December 31, 2006, the Fund incurred approximately $192,500 and $279,200, respectively in total networking fees of which approximately $119,000 and $196,200, respectively was paid to First Clearing. These amounts are included in transfer agent’s fees and expenses in the Statement of Operations.
Prudential Investment Management, Inc., (“PIM”), an indirect, wholly-owned subsidiary of Prudential, is the Fund’s security lending agent. For the eight month period ended August 31, 2007 and the year ended December 31, 2006, PIM has been compensated approximately $118,300 and $270,600, respectively for these services.
The Fund invests in the Taxable Money Market Series and the Dryden Short-Term Core Bond Series, separate portfolios of Dryden Core Investment Fund, pursuant to an exemptive order received from the Securities and Exchange Commission. Taxable Money Market Series and the Dryden Short-Term Core Bond Series are mutual funds registered under the Investment Company Act of 1940, as amended, and managed by PI.
On October 17, 2007, PIM made a payment of $225,538 to the Fund as part of the ultimate realization of a workout related to Price Communications warrants.
Note 4. Portfolio Securities
Purchases and sales of investment securities, other than short-term investments, for the eight month period ended August 31, 2007 aggregated $471,477,756 and $611,246,275, respectively.
| Dryden High Yield Fund, Inc. | 51 |
Notes to Financial Statements
continued
Note 5. Distributions and Tax Information
In order to present undistributed net investment income, accumulated net realized loss on investments and foreign currency transactions and paid-in capital in excess of par on the Statement of Assets and Liabilities that more closely represent their tax character, certain adjustments have been made to undistributed net investment income, accumulated net realized loss on investments and foreign currency transactions and paid-in capital in excess of par.
For the eight-month period ended August 31, 2007, the adjustments were to increase undistributed net investment income by $1,704,154, decrease accumulated net realized loss on investments and foreign currency transactions by $132,821,798 and decrease paid-in capital in excess of par by $134,525,952 primarily due to reclassification of foreign currencies, the difference in the treatment of accreting market discount and premium amortization between financial and tax reporting purposes, paydown gain (losses), swaps, reclassification of disallowed losses from wash sales due to reorganization, write-off of capital loss carryforward due to loss limitations from reorganization, expiration of capital loss carryforward from prior years and other book to tax adjustments. Net investment income, net realized loss on investments and net assets were not affected by this change.
For the eight-month period ended August 31, 2007, the tax character of dividends paid as reflected in the Statement of Changes in Net Assets was $71,192,031 of ordinary income.
For the fiscal years ended December 31, 2006 and 2005, the tax character of dividends paid as reflected in the Statement of Changes in Net Assets were $113,531,027 and $129,222,970 of ordinary income, respectively.
As of August 31, 2007, the components of distributable earnings on a tax basis was $3,627,333 of ordinary income.
The United States federal income tax basis of the Fund’s investments and the net unrealized appreciation as of August 31, 2007 were as follows:
Tax Basis | Appreciation | Depreciation | Net Unrealized | Other Cost Basis Adjustments | Total Net Unrealized Depreciation | |||||
$1,616,670,609 | $23,236,632 | $(61,204,010) | $(37,967,378) | $14,168 | $(37,953,210) |
| 52 | Visit our website at www.jennisondryden.com |
The difference between book basis and tax basis is primarily attributable to the deferred losses on wash sales and the difference in the treatment of accreting market discount and premium amortization. Other cost basis adjustments are attributable to the depreciation on foreign currencies and receivables and payables and appreciation on swaps.
For federal income tax purposes, the Fund had a capital loss carryforward at August 31, 2007 of approximately $1,153,252,000, of which $317,963,000 expires in 2008, $386,822,000 expires in 2009, $392,572,000 expires in 2010, $25,269,000 expires in 2013 and $24,857,000 expires in 2014 and $5,769,000 expires in 2015. Certain portions of the capital loss carryforwards were assumed by the Fund as a result of acquisition. Utilization of these capital loss carryforwards was limited in accordance with income tax regulations. As of August 31, 2007, approximately $20,424,000 of its capital loss carryforwards were written-off as a result of acquisitions. Additionally, approximately $146,145,000 of the Fund’s capital loss carryforward expired at the eight-month period ended August 31, 2007. Accordingly, no capital gains distribution is expected to be paid to shareholders until net gains have been realized in excess of such amounts. It is uncertain whether the Fund will be able to realize the full benefit prior to the expiration dates.
Note 6. Capital
The Fund offers Class A, Class B, Class C, Class L, Class M, Class R, Class X and Class Z shares. Class A and Class L shares are sold with a front-end sales charge of up to 4.50% and 4.25%, respectively. Investors who purchase $1 million or more of Class A or Class L shares and redeem those shares within 12 months of purchase are subject to a contingent deferred sales charge (CDSC) of 1%, but are not subject to an initial sales charge. A special exchange privilege is also available for shareholders who qualified to purchase Class A shares at net asset value. Class B shares are sold with a CDSC which declines from 5% to zero depending on the period of time the shares are held. Class B shares will automatically convert to Class A shares on a quarterly basis approximately seven years after purchase. Class C shares are sold with a CDSC of 1% during the first 12 months. Class M and Class X shares are sold with a CDSC that declines from 6% to zero depending on the period of time the shares are held. Class M shares will automatically convert to Class A shares approximately eight years after purchase. Class X shares will automatically convert to Class A shares approximately 10 years after purchase. Class L, Class M and Class X shares are not offered to new purchasers and are only available through exchange from the same class of shares offered by certain Strategic Partners and JennisonDryden funds. Class R and Class Z shares are not subject to any sales or redemption charges and are available only to a limited group of investors.
The Fund is authorized to issue 3 billion shares of common stock, $.01 par value per share, divided into nine classes, designated Class A, Class B, Class C, Class L, Class M, Class R, Class X and Class Z common stock. Of the authorized shares of
| Dryden High Yield Fund, Inc. | 53 |
Notes to Financial Statements
continued
common stock of the Fund, 500 million shares are designated Class A common stock, 400 million shares are designated Class B common stock, 400 million shares are designated Class C common stock, 400 million shares are designated Class L common stock, 400 million shares are designated Class M common stock, 225 million shares are designated Class R common stock, 225 million shares are designated Class X common stock, 225 million shares are designated Class New X common stock and 225 million shares are designated Class Z common stock.
Transactions in shares of common stock were as follows:
Class A | Shares | Amount | |||||
Eight month period ended August 31, 2007: | |||||||
Shares sold | 6,258,592 | $ | 35,717,651 | ||||
Shares issued in connection with merger | 2,261,473 | 13,229,616 | |||||
Shares issued in reinvestment of dividends | 5,485,954 | 31,752,296 | |||||
Shares reacquired | (27,957,615 | ) | (161,743,635 | ) | |||
Net increase (decrease) in shares outstanding before conversion | (13,951,596 | ) | (81,044,072 | ) | |||
Shares issued upon conversion from Class B, Class M and Class X | 3,651,640 | 21,308,012 | |||||
Net increase (decrease) in shares outstanding | (10,299,956 | ) | $ | (59,736,060 | ) | ||
Year ended December 31, 2006: | |||||||
Shares sold | 9,756,100 | $ | 55,192,932 | ||||
Shares issued in reinvestment of dividends | 9,057,150 | 51,553,831 | |||||
Shares reacquired | (44,055,687 | ) | (250,498,837 | ) | |||
Net increase (decrease) in shares outstanding before conversion | (25,242,437 | ) | (143,752,074 | ) | |||
Shares issued upon conversion from Class B | 11,469,694 | 65,213,888 | |||||
Net increase (decrease) in shares outstanding | (13,772,743 | ) | $ | (78,538,186 | ) | ||
Year ended December 31, 2005: | |||||||
Shares sold | 25,831,549 | $ | 147,620,981 | ||||
Shares issued in reinvestment of dividends | 9,513,870 | 54,534,631 | |||||
Shares reacquired | (60,031,009 | ) | (344,380,128 | ) | |||
Net increase (decrease) in shares outstanding before conversion | (24,685,590 | ) | (142,224,516 | ) | |||
Shares issued upon conversion from Class B | 20,252,757 | 116,489,971 | |||||
Net increase (decrease) in shares outstanding | (4,432,833 | ) | $ | (25,734,545 | ) | ||
| 54 | Visit our website at www.jennisondryden.com |
Class B | Shares | Amount | |||||
Eight month period ended August 31, 2007: | |||||||
Shares sold | 2,064,694 | $ | 11,980,169 | ||||
Shares issued in connection with merger | 314,291 | 1,835,459 | |||||
Shares issued in reinvestment of dividends | 720,891 | 4,168,177 | |||||
Shares reacquired | (4,573,162 | ) | (26,297,635 | ) | |||
Net increase (decrease) in shares outstanding before conversion | (1,473,286 | ) | (8,313,830 | ) | |||
Shares issued upon conversion from Class A | (2,913,385 | ) | (17,027,065 | ) | |||
Net increase (decrease) in shares outstanding | (4,386,671 | ) | $ | (25,340,895 | ) | ||
Year ended December 31, 2006: | |||||||
Shares sold | 2,245,997 | $ | 12,756,096 | ||||
Shares issued in reinvestment of dividends | 1,436,594 | 8,160,974 | |||||
Shares reacquired | (8,800,263 | ) | (49,954,732 | ) | |||
Net increase (decrease) in shares outstanding before conversion | (5,117,672 | ) | (29,037,662 | ) | |||
Shares reacquired upon conversion into Class A | (11,489,904 | ) | (65,213,888 | ) | |||
Net increase (decrease) in shares outstanding | (16,607,576 | ) | $ | (94,251,550 | ) | ||
Year ended December 31, 2005: | |||||||
Shares sold | 2,906,835 | $ | 16,977,800 | ||||
Shares issued in reinvestment of dividends | 2,183,749 | 12,509,546 | |||||
Shares reacquired | (15,788,812 | ) | (90,665,190 | ) | |||
Net increase (decrease) in shares outstanding before conversion | (10,698,228 | ) | (61,177,844 | ) | |||
Shares reacquired upon conversion into Class A | (20,267,875 | ) | (116,489,971 | ) | |||
Net increase (decrease) in shares outstanding | (30,966,103 | ) | $ | (177,667,815 | ) | ||
Class C | |||||||
Eight month period ended August 31, 2007: | |||||||
Shares sold | 1,048,973 | $ | 6,054,417 | ||||
Shares issued in connection with merger | 1,741,136 | 10,185,647 | |||||
Shares issued in reinvestment of dividends | 263,387 | 1,520,904 | |||||
Shares reacquired | (2,288,345 | ) | (13,139,416 | ) | |||
Net increase (decrease) in shares outstanding | 765,151 | $ | 4,621,552 | ||||
Year ended December 31, 2006: | |||||||
Shares sold | 975,882 | $ | 5,559,668 | ||||
Shares issued in reinvestment of dividends | 382,715 | 2,174,798 | |||||
Shares reacquired | (3,007,572 | ) | (17,083,181 | ) | |||
Net increase (decrease) in shares outstanding | (1,648,975 | ) | $ | (9,348,715 | ) | ||
Year ended December 31, 2005: | |||||||
Shares sold | 746,585 | $ | 4,311,636 | ||||
Shares issued in reinvestment of dividends | 474,202 | 2,715,167 | |||||
Shares reacquired | (4,325,568 | ) | (24,820,669 | ) | |||
Net increase (decrease) in shares outstanding | (3,104,781 | ) | $ | (17,793,866 | ) | ||
| Dryden High Yield Fund, Inc. | 55 |
Notes to Financial Statements
continued
Class L | Shares | Amount | |||||
Period ended August 31, 2007:** | |||||||
Shares sold | 46,002 | $ | 265,034 | ||||
Shares issued in connection with mergers | 1,422,148 | 8,333,789 | |||||
Shares issued in reinvestment of dividends | 30,588 | 176,084 | |||||
Shares reacquired | (301,667 | ) | (1,740,675 | ) | |||
Net increase (decrease) in shares outstanding | 1,197,071 | $ | 7,034,232 | ||||
Class M | |||||||
Period ended August 31, 2007:** | |||||||
Shares sold | 260,201 | $ | 1,524,108 | ||||
Shares issued in connection with mergers | 6,982,569 | 40,778,200 | |||||
Shares issued in reinvestment of dividends | 105,848 | 608,688 | |||||
Shares reacquired | (1,385,776 | ) | (7,913,710 | ) | |||
Net increase (decrease) in shares outstanding before conversion | 5,962,842 | 34,997,286 | |||||
Shares reacquired upon conversion into Class A | (721,313 | ) | (4,167,270 | ) | |||
Net increase (decrease) in shares outstanding | 5,241,529 | $ | 30,830,016 | ||||
Class R | |||||||
Eight month period ended August 31, 2007: | |||||||
Shares sold | 158,002 | $ | 919,724 | ||||
Shares issued in reinvestment of dividends | 3,099 | 17,729 | |||||
Shares reacquired | (10,977 | ) | (63,072 | ) | |||
Net increase (decrease) in shares outstanding | 150,124 | $ | 874,381 | ||||
Year ended December 31, 2006: | |||||||
Shares sold | 1,751 | $ | 10,159 | ||||
Shares issued in reinvestment of dividends | 4 | 23 | |||||
Net increase (decrease) in shares outstanding | 1,755 | $ | 10,182 | ||||
Period ended December 31, 2005:* | |||||||
Shares sold | 435 | $ | 2,500 | ||||
Shares issued in reinvestment of dividends | — | — | |||||
Shares reacquired | — | — | |||||
Net increase (decrease) in shares outstanding | 435 | $ | 2,500 | ||||
Class X | |||||||
Period ended August 31, 2007:** | |||||||
Shares sold | 54,609 | $ | 318,373 | ||||
Shares issued in connection with mergers | 980,139 | 5,724,011 | |||||
Shares issued in reinvestment of dividends | 21,642 | 124,318 | |||||
Shares reacquired | (224,864 | ) | (1,293,649 | ) | |||
Net increase (decrease) in shares outstanding before conversion | 831,526 | 4,873,053 | |||||
Shares reacquired upon conversion into Class A | (19,463 | ) | (113,677 | ) | |||
Net increase (decrease) in shares outstanding | 812,063 | $ | 4,759,376 | ||||
| 56 | Visit our website at www.jennisondryden.com |
Class Z | Shares | Amount | |||||
Eight month period ended August 31, 2007: | |||||||
Shares sold | 900,020 | $ | 5,258,724 | ||||
Shares issued in reinvestment of dividends | 242,217 | 1,408,599 | |||||
Shares reacquired | (2,570,553 | ) | (14,883,064 | ) | |||
Net increase (decrease) in shares outstanding | (1,428,316 | ) | $ | (8,215,741 | ) | ||
Year ended December 31, 2006: | |||||||
Shares sold | 2,376,052 | $ | 13,504,192 | ||||
Shares issued in reinvestment of dividends | 361,808 | 2,065,845 | |||||
Shares reacquired | (1,741,855 | ) | (9,893,298 | ) | |||
Net increase (decrease) in shares outstanding | 996,005 | $ | 5,676,739 | ||||
Year ended December 31, 2005: | |||||||
Shares sold | 1,755,003 | $ | 10,100,574 | ||||
Shares issued in reinvestment of dividends | 380,085 | 2,184,675 | |||||
Shares reacquired | (3,362,015 | ) | (19,285,005 | ) | |||
Net increase (decrease) in shares outstanding | (1,226,927 | ) | $ | (6,999,756 | ) | ||
| * | Commenced operations on June 6, 2005. |
| ** | Commenced operations on March 26, 2007. |
Note 7. Reorganization
On March 23, 2007, the Fund acquired all of the net assets of Strategic Partners High Yield Fund (the merged fund) pursuant to a plan of reorganization approved by the Strategic Partners High Yield Fund shareholders on December 21, 2006. The acquisition was accomplished by a tax-free issue of Class A, Class B, Class C, Class L, Class M and Class X shares for the corresponding classes of shares of Strategic Partners High Yield Bond Fund. The following table shows the number of shares of the merged fund and how many shares they became in the Dryden High Yield Fund and total value.
| Strategic Partners High Yield Fund | Dryden High Yield Fund | ||||||||
| Class | Shares | Class | Shares | Value | |||||
| A | 1,792,422 | A | 2,261,473 | $ | 13,229,616 | ||||
| B | 248,503 | B | 314,291 | 1,835,459 | |||||
| C | 1,380,697 | C | 1,741,136 | 10,185,647 | |||||
| L | 1,128,814 | L | 1,422,148 | 8,333,789 | |||||
| M | 5,528,608 | M | 6,982,569 | 40,778,200 | |||||
| X | 775,952 | X | 980,139 | 5,724,011 | |||||
The aggregate net assets and net unrealized appreciation (depreciation) of the Merged fund immediately before the acquisition were:
| Total Net Assets | Net Unrealized Appreciation | |||||
Strategic Partners High Yield Bond Fund | $ | 80,086,722 | $ | 2,728,192 | ||
| Dryden High Yield Fund, Inc. | 57 |
Notes to Financial Statements
continued
The aggregate net assets of Dryden High Yield Fund immediately before the acquisition was $1,458,375,754.
Note 8. New Accounting Pronouncements
On July 13, 2006, the Financial Accounting Standards Board (FASB) released FASB Interpretation No. 48 “Accounting for Uncertainty in Income Taxes” (FIN 48). FIN 48 provides guidance for how uncertain tax positions should be recognized, measured, presented and disclosed in the financial statements. FIN 48 requires the evaluation of tax positions taken or expected to be taken in the course of preparing the Fund’s tax returns to determine whether the tax positions are “more-likely-than-not” of being sustained by the applicable tax authority. Tax Benefits or expenses resulting from tax provisions not deemed to meet the more-likely-than-not threshold would be recorded in the year in which they arise. On December 22, 2006 the Securities and Exchange Commission delayed the effective date until the last net asset value calculation in the first required financial reporting period for its fiscal year beginning after December 15, 2006. The Fund’s financial statements have not been impacted by the adoption of FIN 48. However, the conclusions regarding FIN 48 may be subject to review and adjustment at a later date based on factors including but not limited to, further implementation guidance expected from FASB, and on-going analysis of tax laws, regulations, and interpretations thereof.
On September 20, 2006, the FASB released Statement of Financial Accounting Standards No. 157 “Fair Value Measurements” (FAS 157). FAS 157 establishes an authoritative definition of fair value, sets out a framework for measuring fair value,
and requires additional disclosures about fair-value measurements. The application of FAS 157 is required for fiscal years beginning after November 15, 2007 and interim periods within those fiscal years. At this time, management is evaluating the implications of FAS 157 and its impact, if any, in the financial statements has not yet been determined.
| 58 | Visit our website at www.jennisondryden.com |
Financial Highlights
| AUGUST 31, 2007 | ANNUAL REPORT |
Dryden High Yield Fund, Inc.
Financial Highlights
| Class A | ||||
| Eight Month Period Ended August 31, 2007(e) | ||||
Per Share Operating Performance: | ||||
Net Asset Value, Beginning Of Period | $ | 5.80 | ||
Income (loss) from investment operations: | ||||
Net investment income | .28 | |||
Net realized and unrealized gain (loss) on investment transactions | (.22 | ) | ||
Total from investment operations | .06 | |||
Less Dividends and Distributions: | ||||
Dividends from net investment income | (.28 | ) | ||
Tax return of capital distributions | — | |||
Total dividends and distributions | (.28 | ) | ||
Net asset value, end of period | $ | 5.58 | ||
Total Return(a): | .82 | % | ||
Ratios/Supplemental Data: | ||||
Net assets, end of period (000) | $ | 1,099,469 | ||
Average net assets (000) | $ | 1,170,148 | ||
Ratios to average net assets: | ||||
Expenses, including distribution and service (12b-1) fees(b) | .92 | %(c) | ||
Expenses, excluding distribution and service (12b-1) fees | .67 | %(c) | ||
Net investment income | 7.20 | %(c) | ||
Portfolio turnover rate | 34 | %(d) | ||
| (a) | Total return does not consider the effects of sales loads. Total return is calculated assuming a purchase of a share on the first day and a sale on the last day of each period reported, and includes reinvestment of dividends and distributions. Total investment returns may reflect adjustments to conform to generally accepted accounting principles. Total returns for periods less than one full year are not annualized. |
| (b) | The distributor of the Fund contractually agreed to limit its distribution and service (12b-1) fees to .25 of 1% of the average daily net assets of the Class A shares. |
| (c) | Annualized. |
| (d) | Not annualized. |
| (e) | For period ended August 31, 2007. The Fund changed its fiscal year end from December 31 to August 31. |
See Notes to Financial Statements.
| 60 | Visit our website at www.jennisondryden.com |
| Class A | ||||||||||||||||||
| Year Ended December 31, | ||||||||||||||||||
| 2006 | 2005 | 2004 | 2003 | 2002 | ||||||||||||||
| $ | 5.67 | $ | 5.93 | $ | 5.80 | $ | 4.99 | $ | 5.57 | |||||||||
| .41 | .41 | .41 | .43 | .47 | ||||||||||||||
| .15 | (.24 | ) | .14 | .82 | (.57 | ) | ||||||||||||
| .56 | .17 | .55 | 1.25 | (.10 | ) | |||||||||||||
| (.43 | ) | (.43 | ) | (.42 | ) | (.44 | ) | (.48 | ) | |||||||||
| — | — | — | — | — | ||||||||||||||
| (.43 | ) | (.43 | ) | (.42 | ) | (.44 | ) | (.48 | ) | |||||||||
| $ | 5.80 | $ | 5.67 | $ | 5.93 | $ | 5.80 | $ | 4.99 | |||||||||
| 10.24 | % | 3.07 | % | 9.93 | % | 25.66 | % | (1.56 | )% | |||||||||
| $ | 1,201,400 | $ | 1,251,927 | $ | 1,336,703 | $ | 1,364,999 | $ | 1,160,389 | |||||||||
| $ | 1,205,856 | $ | 1,287,410 | $ | 1,318,334 | $ | 1,268,769 | $ | 1,206,048 | |||||||||
| .86 | % | .90 | % | .89 | % | .90 | % | .90 | % | |||||||||
| .61 | % | .65 | % | .64 | % | .65 | % | .65 | % | |||||||||
| 7.32 | % | 7.09 | % | 7.08 | % | 7.93 | % | 9.13 | % | |||||||||
| 40 | % | 51 | % | 55 | % | 68 | % | 50 | % | |||||||||
See Notes to Financial Statements.
| Dryden High Yield Fund, Inc. | 61 |
Financial Highlights
continued
| Class B | ||||
| Eight Month Period Ended August 31, 2007(c) | ||||
Per Share Operating Performance: | ||||
Net Asset Value, Beginning Of Period | $ | 5.79 | ||
Income (loss) from investment operations: | ||||
Net investment income | .26 | |||
Net realized and unrealized gain (loss) on investment transactions | (.21 | ) | ||
Total from investment operations | .05 | |||
Less Dividends and Distributions: | ||||
Dividends from net investment income | (.26 | ) | ||
Tax return of capital distributions | — | |||
Total dividends and distributions | (.26 | ) | ||
Net asset value, end of period | $ | 5.58 | ||
Total Return(a): | .50 | % | ||
Ratios/Supplemental Data: | ||||
Net assets, end of period (000) | $ | 160,265 | ||
Average net assets (000) | $ | 178,973 | ||
Ratios to average net assets: | ||||
Expenses, including distribution and service (12b-1) fees | 1.42 | %(b) | ||
Expenses, excluding distribution and service (12b-1) fees | .67 | %(b) | ||
Net investment income | 6.69 | %(b) | ||
| (a) | Total return does not consider the effects of sales loads. Total return is calculated assuming a purchase of a share on the first day and a sale on the last day of each period reported, and includes reinvestment of dividends and distributions. Total investment returns may reflect adjustments to conform to generally accepted accounting principles. Total returns for periods less than one full year are not annualized. |
| (b) | Annualized. |
| (c) | For period ended August 31, 2007. The Fund changed its fiscal year end from December 31 to August 31. |
See Notes to Financial Statements.
| 62 | Visit our website at www.jennisondryden.com |
| Class B | ||||||||||||||||||
| Year Ended December 31, | ||||||||||||||||||
| 2006 | 2005 | 2004 | 2003 | 2002 | ||||||||||||||
| $ | 5.66 | $ | 5.92 | $ | 5.79 | $ | 4.98 | $ | 5.56 | |||||||||
| .38 | .38 | .38 | .40 | .44 | ||||||||||||||
| .15 | (.24 | ) | .14 | .82 | (.57 | ) | ||||||||||||
| .53 | .14 | .52 | 1.22 | (.13 | ) | |||||||||||||
| (.40 | ) | (.40 | ) | (.39 | ) | (.41 | ) | (.45 | ) | |||||||||
| — | — | — | — | — | ||||||||||||||
| (.40 | ) | (.40 | ) | (.39 | ) | (.41 | ) | (.45 | ) | |||||||||
| $ | 5.79 | $ | 5.66 | $ | 5.92 | $ | 5.79 | $ | 4.98 | |||||||||
| 9.70 | % | 2.54 | % | 9.39 | % | 25.08 | % | (2.07 | )% | |||||||||
| $ | 191,778 | $ | 281,304 | $ | 477,841 | $ | 618,539 | $ | 610,615 | |||||||||
| $ | 232,435 | $ | 380,450 | $ | 545,044 | $ | 629,849 | $ | 720,123 | |||||||||
| 1.36 | % | 1.40 | % | 1.39 | % | 1.40 | % | 1.40 | % | |||||||||
| .61 | % | .65 | % | .64 | % | .65 | % | .65 | % | |||||||||
| 6.82 | % | 6.57 | % | 6.62 | % | 7.44 | % | 8.60 | % | |||||||||
See Notes to Financial Statements.
| Dryden High Yield Fund, Inc. | 63 |
Financial Highlights
continued
| Class C | ||||
| Eight Month Period Ended August 31, 2007(d) | ||||
Per Share Operating Performance: | ||||
Net Asset Value, Beginning Of Period | $ | 5.79 | ||
Income (loss) from investment operations: | ||||
Net investment income | .26 | |||
Net realized and unrealized gain (loss) on investment transactions | (.21 | ) | ||
Total from investment operations | .05 | |||
Less Dividends and Distributions: | ||||
Dividends from net investment income | (.26 | ) | ||
Tax return of capital distributions | — | |||
Total dividends and distributions | (.26 | ) | ||
Net asset value, end of period | $ | 5.58 | ||
Total Return(a): | .49 | % | ||
Ratios/Supplemental Data: | ||||
Net assets, end of period (000) | $ | 56,307 | ||
Average net assets (000) | $ | 58,540 | ||
Ratios to average net assets: | ||||
Expenses, including distribution and service (12b-1) fees(b) | 1.42 | %(c) | ||
Expenses, excluding distribution and service (12b-1) fees | .67 | %(c) | ||
Net investment income | 6.70 | %(c) | ||
| (a) | Total return does not consider the effects of sales loads. Total return is calculated assuming a purchase of a share on the first day and a sale on the last day of each period reported, and includes reinvestment of dividends and distributions. Total investment returns may reflect adjustments to conform to generally accepted accounting principles. Total returns for periods less than one full year are not annualized. |
| (b) | The distributor of the Fund contractually agreed to limit its distribution and service (12b-1) fees to .75 of 1% of the average daily net assets of the Class C shares. |
| (c) | Annualized. |
| (d) | For the period ended August 31, 2007. The Fund changed its fiscal year end from December 31 to August 31. |
See Notes to Financial Statements.
| 64 | Visit our website at www.jennisondryden.com |
| Class C | ||||||||||||||||||
| Year Ended December 31, | ||||||||||||||||||
| 2006 | 2005 | 2004 | 2003 | 2002 | ||||||||||||||
| $ | 5.66 | $ | 5.92 | $ | 5.79 | $ | 4.98 | $ | 5.56 | |||||||||
| .38 | .38 | .38 | .40 | .44 | ||||||||||||||
| .15 | (.24 | ) | .14 | .82 | (.57 | ) | ||||||||||||
| .53 | .14 | .52 | 1.22 | (.13 | ) | |||||||||||||
| (.40 | ) | (.40 | ) | (.39 | ) | (.41 | ) | (.45 | ) | |||||||||
| — | — | — | — | — | ||||||||||||||
| (.40 | ) | (.40 | ) | (.39 | ) | (.41 | ) | (.45 | ) | |||||||||
| $ | 5.79 | $ | 5.66 | $ | 5.92 | $ | 5.79 | $ | 4.98 | |||||||||
| 9.69 | % | 2.54 | % | 9.39 | % | 25.08 | % | (2.07 | )% | |||||||||
| $ | 54,036 | $ | 62,127 | $ | 83,412 | $ | 97,291 | $ | 72,213 | |||||||||
| $ | 55,946 | $ | 70,914 | $ | 88,295 | $ | 90,157 | $ | 72,506 | |||||||||
| 1.36 | % | 1.40 | % | 1.39 | % | 1.40 | % | 1.40 | % | |||||||||
| .61 | % | .65 | % | .64 | % | .65 | % | .65 | % | |||||||||
| 6.82 | % | 6.57 | % | 6.61 | % | 7.42 | % | 8.65 | % | |||||||||
See Notes to Financial Statements.
| Dryden High Yield Fund, Inc. | 65 |
Financial Highlights
continued
| Class L | ||||
March 26, 2007(a) August 31, 2007(b) | ||||
Per Share Operating Performance: | ||||
Net Asset Value, Beginning Of Period | $ | 5.86 | ||
Income (loss) from investment operations: | ||||
Net investment income | .18 | |||
Net realized and unrealized loss on investment transactions | (.27 | ) | ||
Total from investment operations | (.09 | ) | ||
Less Dividends and Distributions: | ||||
Dividends from net investment income | (.18 | ) | ||
Tax return of capital distributions | — | |||
Total dividends and distributions | (.18 | ) | ||
Net asset value, end of period | $ | 5.59 | ||
Total Return(c): | (1.93 | )% | ||
Ratios/Supplemental Data: | ||||
Net assets, end of period (000) | $ | 6,688 | ||
Average net assets (000) | $ | 7,546 | ||
Ratios to average net assets: | ||||
Expenses, including distribution and service (12b-1) fees | 1.17 | %(d) | ||
Expenses, excluding distribution and service (12b-1) fees | .67 | %(d) | ||
Net investment income | 6.97 | %(d) | ||
| (a) | Inception date of Class L shares. |
| (b) | The Fund changed its fiscal year end from December 31 to August 31. |
| (c) | Total return does not consider the effects of sales loads. Total return is calculated assuming a purchase of a share on the first day and a sale on the last day of each period reported, and includes reinvestment of dividends and distributions. Total investment returns may reflect adjustments to conform to generally accepted accounting principles. Total returns for periods less than one full year are not annualized. |
| (d) | Annualized. |
See Notes to Financial Statements.
| 66 | Visit our website at www.jennisondryden.com |
| Class M | ||||
| March 26, 2007(a) through August 31, 2007(b) | ||||
Per Share Operating Performance: | ||||
Net Asset Value, Beginning Of Period | $ | 5.84 | ||
Income (loss) from investment operations: | ||||
Net investment income | .17 | |||
Net realized and unrealized loss on investment transactions | (.27 | ) | ||
Total from investment operations | (.10 | ) | ||
Less Dividends and Distributions: | ||||
Dividends from net investment income | (.17 | ) | ||
Tax return of capital distributions | — | |||
Total dividends and distributions | (.17 | ) | ||
Net asset value, end of period | $ | 5.57 | ||
Total Return(c): | (1.96 | )% | ||
Ratios/Supplemental Data: | ||||
Net assets, end of period (000) | $ | 29,221 | ||
Average net assets (000) | $ | 36,125 | ||
Ratios to average net assets: | ||||
Expenses, including distribution and service (12b-1) fees | 1.67 | %(d) | ||
Expenses, excluding distribution and service (12b-1) fees | .67 | %(d) | ||
Net investment income | 6.63 | %(d) | ||
| (a) | Inception date of Class M shares. |
| (b) | The Fund changed its fiscal year end from December 31 to August 31. |
| (c) | Total return does not consider the effects of sales loads. Total return is calculated assuming a purchase of a share on the first day and a sale on the last day of each period reported, and includes reinvestment of dividends and distributions. Total investment returns may reflect adjustments to conform to generally accepted accounting principles. Total returns for periods less than one full year are not annualized. |
| (d) | Annualized. |
See Notes to Financial Statements.
| Dryden High Yield Fund, Inc. | 67 |
Financial Highlights
continued
| Class R | ||||
| Eight Month Period Ended August 31, 2007(e) | ||||
Per Share Operating Performance: | ||||
Net Asset Value, Beginning Of Period | $ | 5.81 | ||
Income from investment operations: | ||||
Net investment income | .27 | |||
Net realized and unrealized gain (loss) on investment transactions | (.21 | ) | ||
Total from investment operations | .06 | |||
Less Dividends and Distributions: | ||||
Dividends from net investment income | (.28 | ) | ||
Tax return of capital distributions | — | |||
Total dividends and distributions | (.28 | ) | ||
Net asset value, end of period | $ | 5.59 | ||
Total Return(b): | .56 | % | ||
Ratios/Supplemental Data: | ||||
Net assets, end of period (000) | $ | 851 | ||
Average net assets (000) | $ | 401 | ||
Ratios to average net assets: | ||||
Expenses, including distribution and service (12b-1) fees(c) | 1.17 | %(d) | ||
Expenses, excluding distribution and service (12b-1) fees | .67 | %(d) | ||
Net investment income | 7.19 | %(d) | ||
| (a) | Inception date of Class R shares. |
| (b) | Total return does not consider the effects of sales loads. Total return is calculated assuming a purchase of a share on the first day and a sale on the last day of each period reported, and includes reinvestment of dividends and distributions. Total investment returns may reflect adjustments to conform to generally accepted accounting principles. Total returns for periods less than one full year are not annualized. |
| (c) | During the period, the distributor of the Fund contractually agreed to limit its distribution and service (12b-1) fees to .50 of 1% of the average daily net assets of the Class R shares. |
| (d) | Annualized. |
| (e) | For the period ended August 31, 2007. The Fund changed its fiscal year end from December 31 to August 31. |
See Notes to Financial Statements.
| 68 | Visit our website at www.jennisondryden.com |
| Class R | ||||||
| Year ended December 31, 2006 | June 6, 2005(a) through December 31, 2005 | |||||
| $ | 5.67 | $ | 5.75 | |||
| .42 | .23 | |||||
| .15 | (.06 | ) | ||||
| .57 | .17 | |||||
| (.43 | ) | (.25 | ) | |||
| — | — | |||||
| (.43 | ) | (.25 | ) | |||
| $ | 5.81 | $ | 5.67 | |||
| 10.45 | % | 2.98 | % | |||
| $ | 13 | $ | 2 | |||
| $ | 3 | $ | 2 | |||
| 1.11 | % | 1.15 | %(d) | |||
| .61 | % | .65 | %(d) | |||
| 7.45 | % | 6.75 | %(d) | |||
See Notes to Financial Statements.
| Dryden High Yield Fund, Inc. | 69 |
Financial Highlights
continued
| Class X | ||||
March 26, 2007(a) August 31, 2007(b) | ||||
Per Share Operating Performance: | ||||
Net Asset Value, Beginning Of Period | $ | 5.84 | ||
Income (loss) from investment operations: | ||||
Net investment income | .13 | |||
Net realized and unrealized loss on investment transactions | (.23 | ) | ||
Total from investment operations | (.10 | ) | ||
Less Dividends and Distributions: | ||||
Dividends from net investment income | (.17 | ) | ||
Tax return of capital distributions | — | |||
Total dividends and distributions | (.17 | ) | ||
Net asset value, end of period | $ | 5.57 | ||
Total Return(c): | (1.97 | )% | ||
Ratios/Supplemental Data: | ||||
Net assets, end of period (000) | $ | 4,527 | ||
Average net assets (000) | $ | 5,300 | ||
Ratios to average net assets: | ||||
Expenses, including distribution and service (12b-1) fees | 1.67 | %(d) | ||
Expenses, excluding distribution and service (12b-1) fees | .67 | %(d) | ||
Net investment income | 5.43 | %(d) | ||
| (a) | Inception date of Class X shares. |
| (b) | The Fund changed its fiscal year end from December 31 to August 31. |
| (c) | Total return does not consider the effects of sales loads. Total return is calculated assuming a purchase of a share on the first day and a sale on the last day of each period reported, and includes reinvestment of dividends and distributions. Total investment returns may reflect adjustments to conform to generally accepted accounting principles. Total returns for periods less than one full year are not annualized. |
| (d) | Annualized. |
See Notes to Financial Statements.
| 70 | Visit our website at www.jennisondryden.com |
This Page Intentionally Left Blank
Financial Highlights
continued
| Class Z | ||||
| Eight Month Period Ended August 31, 2007(c) | ||||
Per Share Operating Performance: | ||||
Net Asset Value, Beginning Of Period | $ | 5.81 | ||
Income (loss) from investment operations: | ||||
Net investment income | .29 | |||
Net realized and unrealized gain (loss) on investment transactions | (.21 | ) | ||
Total from investment operations | .08 | |||
Less Dividends and Distributions: | ||||
Dividends from net investment income | (.29 | ) | ||
Tax return of capital distributions | — | |||
Total dividends and distributions | (.29 | ) | ||
Net asset value, end of period | $ | 5.60 | ||
Total Return(a): | .98 | % | ||
Ratios/Supplemental Data: | ||||
Net assets, end of period (000) | $ | 21,364 | ||
Average net assets (000) | $ | 29,101 | ||
Ratios to average net assets: | ||||
Expenses, including distribution and service (12b-1) fees | .67 | %(b) | ||
Expenses, excluding distribution and service (12b-1) fees | .67 | %(b) | ||
Net investment income | 7.41 | %(b) | ||
| (a) | Total return does not consider the effects of sales loads. Total return is calculated assuming a purchase of a share on the first day and a sale on the last day of each period reported, and includes reinvestment of dividends and distributions. Total investment returns may reflect adjustments to conform to generally accepted accounting principles. Total returns for periods less than one full year are not annualized. |
| (b) | Annualized. |
| (c) | For the period ended August 31, 2007. The Fund changed its fiscal year end from December 31 to August 31. |
See Notes to Financial Statements.
| 72 | Visit our website at www.jennisondryden.com |
| Class Z | ||||||||||||||||||
| Year Ended December 31, | ||||||||||||||||||
| 2006 | 2005 | 2004 | 2003 | 2002 | ||||||||||||||
| $ | 5.68 | $ | 5.94 | $ | 5.81 | $ | 5.00 | $ | 5.58 | |||||||||
| .43 | .43 | .42 | .44 | .48 | ||||||||||||||
| .14 | (.24 | ) | .15 | .82 | (.57 | ) | ||||||||||||
| .57 | .19 | .57 | 1.26 | (.09 | ) | |||||||||||||
| (.44 | ) | (.45 | ) | (.44 | ) | (.45 | ) | (.49 | ) | |||||||||
| — | — | — | — | — | ||||||||||||||
| (.44 | ) | (.45 | ) | (.44 | ) | (.45 | ) | (.49 | ) | |||||||||
| $ | 5.81 | $ | 5.68 | $ | 5.94 | $ | 5.81 | $ | 5.00 | |||||||||
| 10.51 | % | 3.32 | % | 10.20 | % | 25.94 | % | (1.30 | )% | |||||||||
| $ | 30,486 | $ | 24,130 | $ | 32,548 | $ | 52,951 | $ | 45,609 | |||||||||
| $ | 26,634 | $ | 29,298 | $ | 32,828 | $ | 56,046 | $ | 43,494 | |||||||||
| .61 | % | .65 | % | .64 | % | .65 | % | .65 | % | |||||||||
| .61 | % | .65 | % | .64 | % | .65 | % | .65 | % | |||||||||
| 7.58 | % | 7.32 | % | 7.32 | % | 8.17 | % | 9.41 | % | |||||||||
See Notes to Financial Statements.
| Dryden High Yield Fund, Inc. | 73 |
Report of Independent Registered Public
Accounting Firm
The Board of Directors and Shareholders of
Dryden High Yield, Inc.:
We have audited the accompanying statement of assets and liabilities of Dryden High Yield, Inc. (hereafter referred to as the “Fund”), including the portfolio of investments, as of August 31, 2007, and the related statement of operations for the period ended August 31, 2007 and the year ended December 31, 2006, the statement of changes in net assets for the period ended August 31, 2007 and each of the years in the two-year period ended December 31, 2006 and the financial highlights for the period ended August 31, 2007 and each of the years in the three-year period ended December 31, 2006. These financial statements and financial highlights are the responsibility of the Fund’s management. Our responsibility is to express an opinion on these financial statements and financial highlights based on our audits. The financial highlights for the years presented prior to the year ended December 31, 2004 were audited by another independent registered public accounting firm, whose report dated February 20, 2004, expressed an unqualified opinion thereon.
We conducted our audits in accordance with the standards of the Public Company Accounting Oversight Board (United States). Those standards require that we plan and perform the audit to obtain reasonable assurance about whether the financial statements and financial highlights are free of material misstatement. An audit includes examining, on a test basis, evidence supporting the amounts and disclosures in the financial statements. Our procedures included confirmation of securities owned as of August 31, 2007, by correspondence with the custodian and brokers or by other appropriate auditing procedures where replies from brokers were not received. An audit also includes assessing the accounting principles used and significant estimates made by management, as well as evaluating the overall financial statement presentation. We believe that our audits provide a reasonable basis for our opinion.
In our opinion, the financial statements and financial highlights referred to above present fairly, in all material respects, the financial position of the Fund as of August 31, 2007, and the results of its operations for the period ended August 31, 2007 and the year ended December 31, 2006, the changes in its net assets for the period ended August 31, 2007 and each of the years in the two-year period ended December 31, 2006 and the financial highlights for the period ended August 31, 2007 and each of the years in the three-year period ended December 31, 2006, in conformity with U.S. generally accepted accounting principles.
New York, New York
October 26, 2007
| 74 | Visit our website at www.jennisondryden.com |
Federal Income Tax Information
(unaudited)
We are required by the Internal Revenue Code to advise you within 60 days of the Fund’s eight-month period end August 31, 2007 as to the federal income tax status of dividends paid by the Fund during such fiscal period. Accordingly, we are advising you that during its fiscal period ended August 31, 2007, the Fund paid dividends for Class A, Class B, Class C, Class L, Class M, Class R, Class X and Class Z shares totaling $.28, $.26, $.26, $.18, $.17, $.28, $.17 and $.29 per share, of ordinary income, which is taxable as such, respectively.
The Fund intends to designate 100% of the ordinary income dividends as interest related dividends under The American Jobs Creation Act of 2004.
In January 2008, you will be advised on IRS Form 1099-DIV or substitute 1099-DIV as to the federal tax status of the distributions received by you in calendar year 2007.
For more detailed information regarding your state and local taxes, you should contact your tax advisor or the state/local taxing authorities.
| Dryden High Yield Fund, Inc. | 75 |
Management of the Fund
(Unaudited)
Information pertaining to the Directors of the Dryden High Yield Fund, Inc. (the “Funds”) is set forth below. Directors who are not deemed to be “interested persons” of the Fund, as defined in the Investment Company Act of 1940 (the 1940 Act), are referred to as “Independent Directors.” Directors who are deemed to be “interested persons” of the Fund are referred to as “Interested Directors.” “Fund Complex”† consists of the Fund and any other investment companies managed by PI.
Independent Directors(2)
Linda W. Bynoe (55), Director since 2005(3) Oversees 60 portfolios in Fund complex
Principal occupations (last 5 years): President and Chief Executive Officer (since March 1995) of Telemat, Ltd. (management consulting); formerly Vice President at Morgan Stanley & Co.
Other Directorships held: Director of Simon Property Group, Inc. (real estate investment trust) (since May 2003); Anixter International (communication products distributor) (since January 2006); Director of Northern Trust Corporation (since April 2006).
David E.A. Carson (73), Director since 2003(3) Oversees 64 portfolios in Fund complex
Principal occupations (last 5 years): Formerly Director (January 2000-May 2000), Chairman (January 1999-December 1999), Chairman and Chief Executive Officer (January 1998-December 1998) and President, Chairman and Chief Executive Officer of People’s Bank (1983-1997).
Robert E. La Blanc (73), Director since 2003(3) Oversees 62 portfolios in Fund complex
Principal occupations (last 5 years): President (since 1981) of Robert E. La Blanc Associates, Inc. (telecommunications).
Other Directorships held:(4) Director of CA, Inc. (since 2002) (software company); FiberNet Telecom Group, Inc. (since 2003) (telecom company).
Douglas H. McCorkindale (68), Director since 2003(3) Oversees 60 portfolios in Fund complex
Principal occupations (last 5 years): Formerly Chairman (February 2001-June 2006), Chief Executive Officer (June 2000-July 2005), President (September 1997-July 2005) and Vice Chairman (March 1984-May 2000) of Gannett Co. Inc. (publishing and media).
Other Directorships held:(4) Director of Continental Airlines, Inc. (since May 1993); Director of Lockheed Martin Corp. (aerospace and defense) (since May 2001).
Richard A. Redeker (64), Director since 1995(3) Oversees 61 portfolios in Fund complex
Principal occupations (last 5 years): Management Consultant; Director (since 2001); Director of Penn Tank Lines, Inc. (since 1999).
Robin B. Smith (67), Director since 2003(3) Oversees 62 portfolios in Fund complex
Principal occupations (last 5 years): Chairman of the Board (since January 2003) of Publishers Clearing House (direct marketing); formerly Chairman and Chief Executive Officer (August 1996-January 2003) of Publishers Clearing House.
Other Directorships held:(4) Formerly Director of BellSouth Corporation (1992-2006).
| 76 | Visit our website at www.jennisondryden.com |
Stephen G. Stoneburn (64), Director since 2003(3) Oversees 62 portfolios in Fund complex
Principal occupations (last 5 years): President and Chief Executive Officer (since June 1996) of Quadrant Media Corp. (publishing company); formerly President (June 1995-June 1996) of Argus Integrated Media, Inc.; Senior Vice President and Managing Director (January 1993-1995) of Cowles Business Media; Senior Vice President of Fairchild Publications, Inc. (1975-1989).
Clay T. Whitehead (68), Director since 2003(3) Oversees 62 portfolios in Fund complex
Principal occupations (last 5 years): President (since 1983) of YCO (new business development firm).
Interested Directors(1)
Judy A. Rice (59), President since 2003 and Director since 2000(3) Oversees 60 portfolios in Fund complex
Principal occupations (last 5 years): President, Chief Executive Officer, Chief Operating Officer and Officer-In-Charge (since February 2003) of Prudential Investments LLC; Vice President (since February 1999) of Prudential Investment Management Services LLC; President, Chief Executive Officer and Officer-In-Charge (since April 2003) of Prudential Mutual Fund Services LLC; formerly Director (May 2003-March 2006) and Executive Vice President (June 2005-March 2006) of AST Investment Services, Inc.; formerly Executive Vice President (September 1999-February 2003) of Prudential Investments LLC; Member of Board of Governors of the Investment Company Institute.
Robert F. Gunia (60), Vice President since 1999 and Director since 1996(3) Oversees 140 portfolios in Fund complex
Principal occupations (last 5 years): Chief Administrative Officer (since September 1999) and Executive Vice President (since December 1996) of Prudential Investments LLC; President (since April 1999) of Prudential Investment Management Services LLC; Executive Vice President (since March 1999) and Treasurer (since May 2000) of Prudential Mutual Fund Services LLC; Chief Administrative Officer, Executive Vice President and Director (since May 2003) of AST Investment Services, Inc.
Other Directorships held:(4) Vice President and Director (since May 1989) and Treasurer (since 1999) of The Asia Pacific Fund, Inc.
Information pertaining to the Officers of the Fund who are not also Directors is set forth below.
Officers(2)
Kathryn L. Quirk (54), Chief Legal Officer since 2005(3)
Principal occupations (last 5 years): Vice President and Corporate Counsel (since September 2004) of Prudential; Executive Vice President, Chief Legal Officer and Secretary (since July 2005) of Prudential Investments LLC and Prudential Mutual Fund Services LLC; formerly Managing Director, General Counsel, Chief Compliance Officer, Chief Risk Officer and Corporate Secretary (1997-2002) of Zurich Scudder Investments, Inc.
Deborah A. Docs (49), Secretary since 1996(3)
Principal occupations (last 5 years): Vice President and Corporate Counsel (since January 2001) of Prudential; Vice President (since December 1996) and Assistant Secretary (since March 1999) of PI; formerly Vice President and Assistant Secretary (May 2003-June 2005) of AST Investment Services, Inc.
| Dryden High Yield Fund, Inc. | 77 |
Jonathan D. Shain (49), Assistant Secretary since 2004(3)
Principal occupations (last 5 years): Vice President and Corporate Counsel (since August 1998) of Prudential; Vice President and Assistant Secretary (since May 2001) of PI; Vice President and Assistant Secretary (since February 2001) of PMFS; formerly Vice President and Assistant Secretary (May 2003-June 2005) of AST Investment Services, Inc.
Claudia DiGiacomo (32), Assistant Secretary since 2005(3)
Principal occupations (last 5 years): Vice President and Corporate Counsel (since January 2005) of Prudential; Vice President and Assistant Secretary of PI (since December 2005); Associate at Sidley Austin Brown & Wood LLP (1999-2004).
Timothy J. Knierim (48), Chief Compliance Officer since 2007(3)
Principal occupations (last 5 years): Chief Compliance Officer of Prudential Investment Management, Inc. (since July 2007); formerly Chief Risk Officer of PIM and PI (2002-2007) and formerly Chief Ethics Officer of PIM and PI (2006-2007).
Valerie M. Simpson (49), Deputy Chief Compliance Officer since 2007(3)
Principal occupations (last 5 years): Vice President and Senior Compliance Officer (since March 2006) of PI; Vice President-Financial Reporting (since March 2006) for Prudential Life and Annuities Finance.
Noreen M. Fierro (43), Anti-Money Laundering Compliance Officer since 2006(3)
Principal occupations (last 5 years): Vice President, Corporate Compliance (since May 2006) of Prudential; formerly Corporate Vice President, Associate General Counsel (April 2002-May 2005) of UBS Financial Services, Inc., in their Money Laundering Prevention Group; Senior Manager (May 2005-May 2006) of Deloitte Financial Advisory Services, LLP, in their Forensic and Dispute Services. Anti-Money Laundering Group.
Grace C. Torres (48), Treasurer and Principal Financial and Accounting Officer since 1995(3)
Principal occupations (last 5 years): Assistant Treasurer (since March 1999) and Senior Vice President (since September 1999) of PI; Assistant Treasurer (since May 2003) and Vice President (since June 2005) of AST Investment Services, Inc.; Senior Vice President and Assistant Treasurer (since May 2003) of Prudential Annuities Advisory Services, Inc.; formerly Senior Vice President (May 2003-June 2005) of AST Investment Services, Inc.
John P. Schwartz (36), Assistant Secretary since 2006(3)
Principal occupations (last 5 years): Vice President and Corporate Counsel (since April 2005) of Prudential; Vice President and Assistant Secretary of PI (since December 2005); Associate at Sidley, Austin Brown & Wood LLP (1997-2005).
Andrew R. French (44), Assistant Secretary since 2006(3)
Principal occupations (last 5 years): Director and Corporate Counsel (since May 2006) of Prudential; Vice President and Assistant Secretary (since January 2007) of PI; Vice President and Assistant Secretary (since January 2007) of PMFS; formerly Senior Legal Analyst of Prudential Mutual Fund Law Department (1997-2006).
M. Sadiq Peshimam (43), Assistant Treasurer since 2006(3)
Principal occupations (last 5 years): Vice President (since 2005) and Director (2000-2005) within Prudential Mutual Fund Administration.
Peter Parrella (49), Assistant Treasurer since 2007(3)
Principal occupations (last 5 years): Vice President (since 2007) and Director (2004-2007) within Prudential Mutual Fund Administration; formerly Tax Manager at SSB Citi Fund Management LLC (1997-2004).
| 78 | Visit our website at www.jennisondryden.com |
† | The Fund Complex consists of all investment companies managed by PI. The Funds for which PI serves as manager include Jennison Dryden Mutual Funds, Strategic Partners Funds, The Prudential Variable Contract Accounts 2, 10, 11. The Target Portfolio Trust, The Prudential Series Fund, The High Yield Income Fund, Inc., The High Yield Plus Fund, Inc., Nicholas-Applegate Fund, Inc., American Skandia Trust, and Prudential’s Gibraltar Fund, Inc. |
(1) | “Interested” Director, as defined in the 1940 Act, by reason of employment with the Manager, a Subadvisor or the Distributor. |
(2) | Unless otherwise noted, the address of the Directors and Officers is c/o: Prudential Investments LLC, Gateway Center Three, 100 Mulberry Street, Newark, NJ 07102. |
(3) | There is no set term of office for Directors and Officers. The Independent Directors have adopted a retirement policy, which calls for the retirement of Directors on December 31 of the year in which they reach the age of 75. The table shows the individual’s length of service as Director and/or Officer. |
(4) | This includes only directorships of companies required to register, or file reports with the SEC under the Securities and Exchange Act of 1934 (that is, “public companies”) or other investment companies registered under the 1940 Act. |
Additional Information about the Trustees is included in the Statement of Additional Information which is available without charge, upon request, by calling (800) 521-7466 or (732) 482-7555 (Calling from outside the U.S.)
| Dryden High Yield Fund, Inc. | 79 |
Growth of a $10,000 Investment
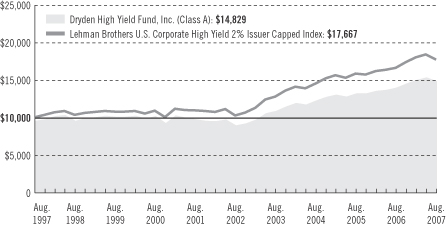
| Average Annual Total Returns (With Sales Charges) as of 8/31/07 | |||||||||||
| One Year | Five Years | Ten Years | Since Inception | ||||||||
Class A | 1.19 | % | 9.59 | % | 4.02 | % | — | ||||
Class B | 0.51 | 9.88 | 3.97 | — | |||||||
Class C | 4.44 | 10.01 | 3.97 | — | |||||||
Class L | N/A | N/A | N/A | N/A (3/26/07) | |||||||
Class M | N/A | N/A | N/A | N/A (3/26/07) | |||||||
Class R | 5.88 | N/A | N/A | 6.19% (6/6/05) | |||||||
Class X | N/A | N/A | N/A | N/A (3/26/07) | |||||||
Class Z | 6.22 | 10.87 | 4.77 | — | |||||||
| Average Annual Total Returns (Without Sales Charges) as of 8/31/07 | |||||||||||
| One Year | Five Years | Ten Years | Since Inception | ||||||||
Class A | 5.96 | % | 10.60 | % | 4.50 | % | — | ||||
Class B | 5.43 | 10.01 | 3.97 | — | |||||||
Class C | 5.42 | 10.01 | 3.97 | — | |||||||
Class L | N/A | N/A | N/A | N/A (3/26/07) | |||||||
Class M | N/A | N/A | N/A | N/A (3/26/07) | |||||||
Class R | 5.88 | N/A | N/A | 6.19% (6/6/05) | |||||||
Class X | N/A | N/A | N/A | N/A (3/26/07) | |||||||
Class Z | 6.22 | 10.87 | 4.77 | — | |||||||
Performance data quoted represent past performance. Past performance does not guarantee future results. The investment return and principal value of an investment will fluctuate, so that an investor’s shares, when redeemed, may be worth more or less than their original cost. Current performance may be lower or higher than the past performance data quoted. An investor may obtain performance data as of the most recent month-end by visiting our website at www.jennisondryden.com or by
| Visit our website at www.jennisondryden.com |
calling (800) 225-1852. Class A and Class L shares have a maximum initial sales charge of 4.50% and 4.25%, respectively. Gross operating expenses: Class A, 0.97%; Class B, 1.42%; Class C, 1.67%; Class L, 1.17%; Class M, 1.67%; Class R, 1.42%; Class X, 1.67%; Class Z, 0.67%. Net operating expenses apply to: Class A, 0.92%; Class B, 1.42%; Class C, 1.42%; Class L, 1.17%; Class M, 1.67%; Class R, 1.17%; Class X, 1.67%; Class Z, 0.67%, after contractual reduction through 4/30/2008.
The returns in the graph and the tables do not reflect the deduction of taxes that a shareholder would pay on Fund distributions or following the redemption of Fund shares.
Source: Prudential Investments LLC and Lipper Inc.
Inception date returns are provided for any share class with less than 10 calendar years of returns.
The graph compares a $10,000 investment in the Dryden High Yield Fund, Inc. (Class A shares) with a similar investment in the Lehman Brothers U.S. Corporate High Yield 2% Issuer Capped Index by portraying the initial account values at the beginning of the 10-year period for Class A shares (August 31, 1997) and the account values at the end of the current fiscal year (August 31, 2007) as measured on a quarterly basis. For purposes of the graph, and unless otherwise indicated, it has been assumed that (a) the maximum applicable front-end sales charge was deducted from the initial $10,000 investment in Class A shares; (b) all recurring fees (including management fees) were deducted; and (c) all dividends and distributions were reinvested. The line graph provides information for Class A shares only. As indicated in the tables provided earlier, performance for Class B, Class C, Class L, Class M, Class R, Class X and Class Z shares will vary due to the differing charges and expenses applicable to each share class (as indicated in the following paragraphs). Without a distribution and service (12b-1) fee waiver of 0.05% for Class A shares through August 31, 2007, the returns shown in the graph and for Class A shares in the tables would have been lower.
The Lehman Brothers U.S. Corporate High Yield 2% Issuer Capped Index is an unmanaged index of fixed-rate, noninvestment-grade debt securities with at least one year remaining to maturity. It gives a broad look at how high yield (junk) bonds have performed. The index total returns include the reinvestment of all dividends, but do not include the effects of sales charges, operating expenses of a mutual fund, or taxes. The returns for the Index would be lower if they included the effects of sales charges, operating expenses, or taxes. The securities that comprise the Index may differ substantially from the securities in the Fund. This is not the only index that may be used to characterize performance of junk bond funds. Other indexes may portray different comparative performance. Investors cannot invest directly in an index.
Class A and Class L shares are subject to a maximum front-end sales charge of 4.50% and 4.25%, respectively, and a 12b-1 fee of up to 0.30% and 0.50%, respectively, annually, and all investors who purchase Class A and Class L shares in an amount of $1 million or more and sell these shares within 12 months of purchase are subject to a contingent deferred sales charge (CDSC) of 1%. Class B shares are subject to a declining CDSC of 5%, 4%, 3%, 2%, 1%, and 1%, respectively, for the first six years after purchase and a 12b-1 fee of 1% annually. Approximately seven years after purchase, Class B shares will automatically convert to Class A shares on a quarterly basis. Class C shares purchased are not subject to a front-end sales charge, but are subject to a CDSC of 1% for shares sold within 12 months from the date of purchase and an annual 12b-1 fee of 1%. Class M shares are subject to a CDSC of 6%, which decreases by 1% annually to 2% in the fifth and sixth years and 1% in the seventh year, a 12b-1 fee of 1% annually. Class M shares automatically convert to Class A shares approximately eight years after purchase. Class X shares are subject to a CDSC of 6%, which decreases by 1% annually to 4% in the third and fourth years, by 1% annually to 2% in the sixth and seventh years, and 1% in the eighth year, a 12b-1 fee of 1% annually. Class X shares automatically convert to Class A shares on a quarterly basis approximately ten years (eight years in the case of shares purchased prior to August 17, 1998) after purchase. Class R and Z shares are not subject to a sales charge. Class Z shares are not subject to a 12b-1 fee. The returns in the graph and tables reflect the share class expense structure in effect at the close of the fiscal period. The returns in the graph and the tables do not reflect the deduction of taxes that a shareholder would pay on Fund distributions or following the redemption of Fund shares.
| Dryden High Yield Fund, Inc. |
| n MAIL | n TELEPHONE | n WEBSITE | ||
Gateway Center Three 100 Mulberry Street Newark, NJ 07102 | (800) 225-1852 | www.jennisondryden.com |
| PROXY VOTING |
| The Board of Directors of the Fund has delegated to the Fund’s investment subadviser the responsibility for voting any proxies and maintaining proxy recordkeeping with respect to the Fund. A description of these proxy voting policies and procedures is available without charge, upon request, by calling (800) 225-1852 or by visiting the Securities and Exchange Commission’s website at www.sec.gov. Information regarding how the Fund voted proxies relating to portfolio securities during the most recent 12-month period ended June 30 is available on the Fund’s website and on the Commission’s website. |
| DIRECTORS |
| Linda W. Bynoe • David E.A. Carson • Robert F. Gunia • Robert E. La Blanc • Douglas H. McCorkindale • Richard A. Redeker • Judy A. Rice • Robin B. Smith • Stephen G. Stoneburn • Clay T. Whitehead |
| OFFICERS |
| Judy A. Rice, President • Robert F. Gunia, Vice President • Grace C. Torres, Treasurer and Principal Financial and Accounting Officer • Kathryn L. Quirk, Chief Legal Officer • Deborah A. Docs, Secretary • Timothy J. Knierim, Chief Compliance Officer • Valerie M. Simpson, Deputy Chief Compliance Officer • Noreen M. Fierro, Anti-Money Laundering Compliance Officer • Jonathan D. Shain, Assistant Secretary • Claudia DiGiacomo, Assistant Secretary • John P. Schwartz, Assistant Secretary • Andrew R. French, Assistant Secretary • M. Sadiq Peshimam, Assistant Treasurer • Peter Parrella, Assistant Treasurer |
| MANAGER | Prudential Investments LLC | Gateway Center Three 100 Mulberry Street Newark, NJ 07102 | ||
| ||||
| INVESTMENT SUBADVISER | Prudential Investment Management, Inc. | Gateway Center Two 100 Mulberry Street | ||
| ||||
| DISTRIBUTOR | Prudential Investment Management Services LLC | Gateway Center Three 100 Mulberry Street Newark, NJ 07102 | ||
| ||||
| CUSTODIAN | The Bank of New York Mellon Corp. | One Wall Street New York, NY 10286 | ||
| ||||
| TRANSFER AGENT | Prudential Mutual Fund Services LLC | P.O. Box 9658 Providence, RI 02940 | ||
| ||||
| INDEPENDENT REGISTERED PUBLIC ACCOUNTING FIRM | KPMG LLP | 345 Park Avenue New York, NY 10154 | ||
| ||||
| FUND COUNSEL | Willkie Farr & Gallagher LLP | 787 Seventh Avenue New York, NY 10019 | ||
| An investor should consider the investment objectives, risks, charges, and expenses of the Fund carefully before investing. The prospectus for the Fund contains this and other information about the Fund. An investor may obtain a prospectus by visiting our website at www.jennisondryden.com or by calling (800) 225-1852. The prospectus should be read carefully before investing. |
| E-DELIVERY |
| To receive your mutual fund documents on-line, go to www.icsdelivery.com/prudential/funds and enroll. Instead of receiving printed documents by mail, you will receive notification via e-mail when new materials are available. You can cancel your enrollment or change your e-mail address at any time by clicking on the change/cancel enrollment option at the icsdelivery website address. |
| SHAREHOLDER COMMUNICATIONS WITH DIRECTORS |
| Shareholders can communicate directly with the Board of Directors by writing to the Chair of the Board, Dryden High Yield Fund, Inc., Prudential Investments, Attn: Board of Directors, 100 Mulberry Street, Gateway Center Three, Newark, NJ 07102. Shareholders can communicate directly with an individual Director by writing to the same address. Communications are not screened before being delivered to the addressee. |
| AVAILABILITY OF PORTFOLIO SCHEDULE |
| The Fund files its complete schedule of portfolio holdings with the Securities and Exchange Commission for the first and third quarters of each fiscal year on Form N-Q. The Fund’s Forms N-Q are available on the Commission’s website at www.sec.gov. The Fund’s Forms N-Q may also be reviewed and copied at the Commission’s Public Reference Room in Washington, D.C. Information on the operation and location of the Public Reference Room may be obtained by calling (800) SEC-0330 (732-0330). The Fund’s schedule of portfolio holdings is also available on the Fund’s website as of the end of each fiscal quarter. |
| The Fund’s Statement of Additional Information contains additional information about the Fund’s Directors and is available without charge, upon request, by calling (800) 225-1852. |
Mutual Funds:
| ARE NOT INSURED BY THE FDIC OR ANY FEDERAL GOVERNMENT AGENCY | MAY LOSE VALUE | ARE NOT A DEPOSIT OF OR GUARANTEED BY ANY BANK OR ANY BANK AFFILIATE |

| Dryden High Yield Fund, Inc. | ||||||||||||||||||||
| Share Class | A | B | C | L | M | R | X | Z | ||||||||||||
NASDAQ | PBHAX | PBHYX | PRHCX | N/A | DHYMX | JDYRX | N/A | PHYZX | ||||||||||||
CUSIP | 262438104 | 262438203 | 262438302 | 262438609 | 262438708 | 262438500 | 262438807 | 262438401 | ||||||||||||
MF110E IFS-A139898 Ed. 10/2007

Item 2 – Code of Ethics – – See Exhibit (a)
As of the end of the period covered by this report, the Registrant has adopted a code of ethics (the “Section 406 Standards for Investment Companies – Ethical Standards for Principal Executive and Financial Officers”) that applies to the Registrant’s Principal Executive Officer and Principal Financial Officer; the Registrant’s Principal Financial Officer also serves as the Principal Accounting Officer.
The Registrant hereby undertakes to provide any person, without charge, upon request, a copy of the code of ethics. To request a copy of the code of ethics, contact the registrant 800-225-1852, and ask for a copy of the Section 406 Standards for Investment Companies - Ethical Standards for Principal Executive and Financial Officers.
Item 3 – Audit Committee Financial Expert –
The Registrant’s Board has determined that Mr. David E. A. Carson, member of the Board’s Audit Committee is an “audit committee financial expert,” and that he is “independent,” for purposes of this Item.
Item 4 – Principal Accountant Fees and Services –
(a) Audit Fees
For the fiscal period January 1, 2007 through August 31, 2007 and fiscal year ended December 31, 2006, KPMG LLP (“KPMG”), the Registrant’s principal accountant, billed the Registrant $26,281 and $22,100, respectively, for professional services rendered for the audit of the Registrant’s annual financial statements or services that are normally provided in connection with statutory and regulatory filings.
(b) Audit-Related Fees
For the fiscal period January 1, 2007 through August 31, 2007, KPMG, the Registrant’s principal accountant, did not bill the Registrant for assurance and related services that are reasonably related to the performance of the audit of the Registrant’s financial statements. For the fiscal year ended December 31, 2006, KPMG, the Registrant’s principal accountant, did not bill the Registrant for assurance and related services that are reasonably related to the performance of the audit of the Registrant’s financial statements.
(c) Tax Fees
None.
(d) All Other Fees
None.
(e) (1) Audit Committee Pre-Approval Policies and Procedures
THE PRUDENTIAL MUTUAL FUNDS
AUDIT COMMITTEE POLICY
on
Pre-Approval of Services Provided by the Independent Accountants
The Audit Committee of each Prudential Mutual Fund is charged with the responsibility to monitor the independence of the Fund’s independent accountants. As part of this responsibility, the Audit Committee must pre-approve any independent accounting firm’s engagement to render audit and/or permissible non-audit services, as required by law. In evaluating a proposed engagement of the independent accountants, the Audit Committee will assess the effect that the engagement might reasonably be expected to have on the accountant’s independence. The Committee’s evaluation will be based on:
| • | a review of the nature of the professional services expected to be provided, |
| • | a review of the safeguards put into place by the accounting firm to safeguard independence, and |
| • | periodic meetings with the accounting firm. |
Policy for Audit and Non-Audit Services Provided to the Funds
On an annual basis, the scope of audits for each Fund, audit fees and expenses, and audit-related and non-audit services (and fees proposed in respect thereof) proposed to be performed by the Fund’s independent accountants will be presented by the Treasurer and the independent accountants to the Audit Committee for review and, as appropriate, approval prior to the initiation of such services. Such presentation shall be accompanied by confirmation by both the Treasurer and the independent accountants that the proposed services will not adversely affect the independence of the independent accountants. Proposed services shall be described in sufficient detail to enable the Audit Committee to assess the appropriateness of such services and fees, and the compatibility of the provision of such services with the auditor’s independence. The Committee shall receive periodic reports on the progress of the audit and other services which are approved by the Committee or by the Committee Chair pursuant to authority delegated in this Policy.
The categories of services enumerated under “Audit Services”, “Audit-related Services”, and “Tax Services” are intended to provide guidance to the Treasurer and the independent accountants as to those categories of services which the Committee believes are generally consistent with the independence of the independent accountants and which the Committee (or the Committee Chair) would expect upon the presentation of specific proposals to pre-approve. The enumerated categories are not intended as an exclusive list of audit, audit-related or tax services, which the Committee (or the Committee Chair) would consider for pre-approval.
Audit Services
The following categories of audit services are considered to be consistent with the role of the Fund’s independent accountants:
| • | Annual Fund financial statement audits |
| • | Seed audits (related to new product filings, as required) |
| • | SEC and regulatory filings and consents |
Audit-related Services
The following categories of audit-related services are considered to be consistent with the role of the Fund’s independent accountants:
| • | Accounting consultations |
| • | Fund merger support services |
| • | Agreed Upon Procedure Reports |
| • | Attestation Reports |
| • | Other Internal Control Reports |
Individual audit-related services that fall within one of these categories and are not presented to the Audit Committee as part of the annual pre-approval process will be subject to pre-approval by the Committee Chair (or any other Committee member on whom this responsibility has been delegated) so long as the estimated fee for those services does not exceed $50,000.
Tax Services
The following categories of tax services are considered to be consistent with the role of the Fund’s independent accountants:
| • | Tax compliance services related to the filing or amendment of the following: |
| • | Federal, state and local income tax compliance; and, |
| • | Sales and use tax compliance |
| • | Timely RIC qualification reviews |
| • | Tax distribution analysis and planning |
| • | Tax authority examination services |
| • | Tax appeals support services |
| • | Accounting methods studies |
| • | Fund merger support services |
| • | Tax consulting services and related projects |
Individual tax services that fall within one of these categories and are not presented to the Audit Committee as part of the annual pre-approval process will be subject to pre-approval by the Committee Chair (or any other Committee member on whom this responsibility has been delegated) so long as the estimated fee for those services does not exceed $50,000.
Other Non-audit Services
Certain non-audit services that the independent accountants are legally permitted to render will be subject to pre-approval by the Committee or by one or more Committee members to whom the Committee has delegated this authority and who will report to the full Committee any pre-approval decisions made pursuant to this Policy. Non-audit services presented for pre-approval pursuant to this paragraph will be accompanied by a confirmation from both the Treasurer and the independent accountants that the proposed services will not adversely affect the independence of the independent accountants.
Proscribed Services
The Fund’s independent accountants will not render services in the following categories of non-audit services:
| • | Bookkeeping or other services related to the accounting records or financial statements of the Fund |
| • | Financial information systems design and implementation |
| • | Appraisal or valuation services, fairness opinions, or contribution-in-kind reports |
| • | Actuarial services |
| • | Internal audit outsourcing services |
| • | Management functions or human resources |
| • | Broker or dealer, investment adviser, or investment banking services |
| • | Legal services and expert services unrelated to the audit |
| • | Any other service that the Public Company Accounting Oversight Board determines, by regulation, is impermissible. |
Pre-approval of Non-Audit Services Provided to Other Entities Within the Prudential Fund Complex
Certain non-audit services provided to Prudential Investments LLC or any of its affiliates that also provide ongoing services to the Prudential Mutual Funds will be subject to pre-approval by the Audit Committee. The only non-audit services provided to these entities that will require pre-approval are those related directly to the operations and financial reporting of the Funds. Individual projects that are not presented to the Audit Committee as part of the annual pre-approval process will be subject to pre-approval by the Committee Chair (or any other Committee member on whom this responsibility has been delegated) so long as the estimated fee for those services does not exceed $50,000. Services presented for pre-approval pursuant to this paragraph will be accompanied by a confirmation from both the Treasurer and the independent accountants that the proposed services will not adversely affect the independence of the independent accountants.
Although the Audit Committee will not pre-approve all services provided to Prudential Investments LLC and its affiliates, the Committee will receive an annual report from the Fund’s independent accounting firm showing the aggregate fees for all services provided to Prudential Investments and its affiliates.
(e) (2) Percentage of services referred to in 4(b)- (4)(d) that were approved by the audit committee –
Not applicable.
(f) Percentage of hours expended attributable to work performed by other than full time employees of principal accountant if greater than 50%.
Not applicable.
(g) Non-Audit Fees
Not applicable to Registrant for the fiscal period January 1, 2007 through August 31, 2007 and fiscal year 2006. The aggregate non-audit fees billed by KPMG for services rendered to the registrant’s investment adviser and any entity controlling, controlled by, or under common control with the investment adviser that provides ongoing services to the registrant for the fiscal period January 1, 2007 through August 31, 2007 and fiscal year 2006 was $44,700 and $317,300, respectively.
(h) Principal Accountant’s Independence
Not applicable as KPMG has not provided non-audit services to the Registrant’s investment adviser and any entity controlling, controlled by, or under common control with the investment adviser that provides ongoing services to the registrant that were not pre-approved pursuant to Rule 2-01(c)(7)(ii) of Regulation S-X.
Item 5 – Audit Committee of Listed Registrants – Not applicable.
Item 6 – Schedule of Investments – The schedule is included as part of the report to shareholders filed under Item 1 of this Form.
Item 7 – Disclosure of Proxy Voting Policies and Procedures for Closed-End Management Investment Companies – Not applicable.
Item 8 – Portfolio Managers of Closed-End Management Investment Companies – Not applicable.
Item 9 – Purchases of Equity Securities by Closed-End Management Investment Company and Affiliated Purchasers – Not applicable.
Item 10 – Submission of Matters to a Vote of Security Holders – Not applicable.
Item 11 – Controls and Procedures
| (a) | It is the conclusion of the Registrant’s principal executive officer and principal financial officer that the effectiveness of the Registrant’s current disclosure controls and procedures (such disclosure controls and procedures having been evaluated within 90 days of the date of this filing) provide reasonable assurance that the information required to be disclosed by the Registrant has been recorded, processed, summarized and reported within the time period specified in the Commission’s rules and forms and that the information required to be disclosed by the Registrant has been accumulated and communicated to the Registrant’s principal executive officer and principal financial officer in order to allow timely decisions regarding required disclosure. |
| (b) | There has been no significant change in the Registrant’s internal control over financial reporting that occurred during the registrant’s most recent fiscal quarter of the period covered by this report that has materially affected, or is likely to materially affect, the Registrant’s internal control over financial reporting. |
Item 12 – Exhibits
(a) (1) Code of Ethics – Attached hereto as Exhibit EX-99.CODE-ETH
| (2) | Certifications pursuant to Section 302 of the Sarbanes-Oxley Act – Attached hereto as Exhibit EX-99.CERT. |
| (3) | Any written solicitation to purchase securities under Rule 23c-1. – Not applicable. |
| (b) | Certifications pursuant to Section 906 of the Sarbanes-Oxley Act – Attached hereto as Exhibit EX-99.906CERT. |
SIGNATURES
Pursuant to the requirements of the Securities Exchange Act of 1934 and the Investment Company Act of 1940, the registrant has duly caused this report to be signed on its behalf by the undersigned, thereunto duly authorized.
(Registrant) Dryden High Yield Fund, Inc.
| By (Signature and Title)* | /s/ Deborah A.Docs | |||
| Deborah A. Docs | ||||
| Secretary |
Date October 24, 2007
Pursuant to the requirements of the Securities Exchange Act of 1934 and the Investment Company Act of 1940, this report has been signed below by the following persons on behalf of the registrant and in the capacities and on the dates indicated.
| By (Signature and Title)* | /s/ Judy A. Rice | |||
| Judy A. Rice | ||||
| President and Principal Executive Officer |
Date October 24, 2007
| By (Signature and Title)* | /s/ Grace C. Torres | |||
| Grace C. Torres | ||||
| Treasurer and Principal Financial Officer |
Date October 24, 2007
| * | Print the name and title of each signing officer under his or her signature. |