UNITED STATES
SECURITIES AND EXCHANGE COMMISSION
Washington, D.C. 20549
FORM N-CSR
CERTIFIED SHAREHOLDER REPORT OF REGISTERED
MANAGEMENT INVESTMENT COMPANIES
Investment Company Act file number: 811-02896
Prudential High Yield Fund, Inc.
Exact name of registrant as specified in charter:
Gateway Center 3,
100 Mulberry Street,
Newark, New Jersey 07102
Address of principal executive offices:
Deborah A. Docs
Gateway Center 3,
100 Mulberry Street,
Newark, New Jersey 07102
Name and address of agent for service:
Registrant’s telephone number, including area code: 800-225-1852
Date of fiscal year end: 8/31/2010
Date of reporting period: 8/31/2010
Item 1 – Reports to Stockholders –

| | |
| ANNUAL REPORT | | AUGUST 31, 2010 |
Prudential High Yield Fund, Inc.
| | | | |
Fund Type High yield bond Objectives Current income, and capital appreciation as a secondary objective | | | | This report is not authorized for distribution to prospective investors unless preceded or accompanied by a current prospectus. The views expressed in this report and information about the Fund’s portfolio holdings are for the period covered by this report and are subject to change thereafter. Prudential Investments, Prudential, the Prudential logo and the Rock symbol are service marks of Prudential Financial, Inc. and its related entities, registered in many jurisdictions worldwide. |
| | |

| | To enroll in e-delivery, go to www.prudentialfunds.com/edelivery |
October 15, 2010
Dear Shareholder:
We hope you find the annual report for the Prudential High Yield Fund, Inc. informative and useful. Because of ongoing market volatility, we understand that this is a difficult time to be an investor. While it is impossible to predict what the future holds, we continue to believe a prudent response to uncertainty is to maintain a diversified portfolio, including stock and bond mutual funds consistent with your tolerance for risk, time horizon, and financial goals.
A diversified asset allocation offers two potential advantages: It limits your exposure to any particular asset class; plus it provides a better opportunity to invest some of your assets in the right place at the right time. Your financial professional can help you create a diversified investment plan that may include mutual funds covering all the basic asset classes and that reflects your personal investor profile and risk tolerance. Keep in mind that diversification and asset allocation strategies do not assure a profit or protect against loss in declining markets.
Prudential Investments® provides a wide range of mutual funds to choose from that can help you make progress toward your financial goals. Our funds offer the experience, resources, and professional discipline of Prudential Financial’s affiliated asset managers. Most of Prudential Investments’ equity funds are advised by Jennison Associates LLC, Quantitative Management Associates LLC (QMA), or Prudential Real Estate Investors. Prudential Investment Management, Inc. (PIM) advises the Prudential Investments fixed income and money market funds through its Prudential Fixed Income unit. Jennison Associates, QMA, and PIM are registered investment advisers and Prudential Financial companies. Prudential Real Estate Investors is a unit of PIM.
Thank you for choosing the Prudential Investments family of mutual funds.
Sincerely,

Judy A. Rice, President
Prudential High Yield Fund, Inc.
| | |
| Prudential High Yield Fund, Inc. | | 1 |
Your Fund’s Performance
Performance data quoted represent past performance. Past performance does not guarantee future results. The investment return and principal value of an investment will fluctuate, so that an investor’s shares, when redeemed, may be worth more or less than their original cost. Current performance may be lower or higher than the past performance data quoted. An investor may obtain performance data as of the most recent month-end by visiting our website at www.prudentialfunds.com or by calling (800) 225-1852. Class A and Class L shares have a maximum initial sales charge of 4.50% and 4.25%, respectively. Gross operating expenses: Class A, 0.95%; Class B, 1.40%; Class C, 1.65%; Class L, 1.15%; Class M, 1.65%; Class R, 1.40%; Class X, 1.65%; Class Z, 0.65%. Net operating expenses: Class A, 0.90%; Class B, 1.40%; Class C, 1.40%; Class L, 1.15%; Class M, 1.65%; Class R, 1.15%; Class X, 1.65%; Class Z, 0.65%, after contractual reduction through 12/31/2010 for Class C and 12/31/2011 for Class R.
| | | | | | | | | | | | | | | | |
| Cumulative Total Returns (Without Sales Charges) as of 8/31/10 | |
| | | One Year | | | Five Years | | | Ten Years | | | Since Inception | |
Class A | | | 19.94 | % | | | 40.44 | % | | | 82.10 | % | | | — | |
Class B | | | 19.39 | | | | 36.99 | | | | 73.39 | | | | — | |
Class C | | | 19.40 | | | | 37.05 | | | | 73.47 | | | | — | |
Class L | | | 19.64 | | | | N/A | | | | N/A | | | | 21.97% (3/26/07) | |
Class M | | | 19.04 | | | | N/A | | | | N/A | | | | 20.28 (3/26/07) | |
Class R | | | 19.66 | | | | 39.04 | | | | N/A | | | | 42.34 (6/6/05) | |
Class X | | | 19.07 | | | | N/A | | | | N/A | | | | 20.09 (3/26/07) | |
Class Z | | | 20.23 | | | | 42.11 | | | | 87.28 | | | | — | |
Barclays Capital U.S. Corporate High Yield 1% Issuer Capped Index | | | 21.22 | | | | 43.13 | | | | 110.07 | | | | — | |
Lipper High Current Yield Funds Avg. | | | 18.99 | | | | 30.29 | | | | 75.50 | | | | — | |
| | | | | | | | | | | | | | | | |
| | |
| 2 | | Visit our website at www.prudentialfunds.com |
| | | | | | | | | | | | | | | | |
| Average Annual Total Returns (With Sales Charges) as of 9/30/10 | |
| | | One Year | | | Five Years | | | Ten Years | | | Since Inception | |
Class A | | | 12.40 | % | | | 6.70 | % | | | 6.13 | % | | | — | |
Class B | | | 12.13 | | | | 7.05 | | | | 6.12 | | | | — | |
Class C | | | 16.38 | | | | 7.21 | | | | 6.13 | | | | — | |
Class L | | | 12.39 | | | | N/A | | | | N/A | | | | 5.36% (3/26/07) | |
Class M | | | 10.81 | | | | N/A | | | | N/A | | | | 5.49 (3/26/07) | |
Class R | | | 17.41 | | | | 7.51 | | | | N/A | | | | 7.40 (6/6/05) | |
Class X | | | 10.82 | | | | N/A | | | | N/A | | | | 5.27 (3/26/07) | |
Class Z | | | 18.26 | | | | 8.04 | | | | 6.95 | | | | — | |
Barclays Capital U.S. Corporate High Yield 1% Issuer Capped Index | | | 17.97 | | | | 8.23 | | | | 8.11 | | | | — | |
Lipper High Current Yield Funds Avg. | | | 16.59 | | | | 6.03 | | | | 6.04 | | | | — | |
| | | | | | | | | | | | | | | | |
Average Annual Total Returns (With Sales Charges) as of 8/31/10 | | | | | |
| | | One Year | | | Five Years | | | Ten Years | | | Since Inception | |
Class A | | | 14.54 | % | | | 6.05 | % | | | 5.69 | % | | | — | |
Class B | | | 14.39 | | | | 6.35 | | | | 5.66 | | | | — | |
Class C | | | 18.40 | | | | 6.51 | | | | 5.66 | | | | — | |
Class L | | | 14.56 | | | | N/A | | | | N/A | | | | 4.62% (3/26/07) | |
Class M | | | 13.04 | | | | N/A | | | | N/A | | | | 4.82 (3/26/07) | |
Class R | | | 19.66 | | | | 6.81 | | | | N/A | | | | 6.97 (6/6/05) | |
Class X | | | 13.07 | | | | N/A | | | | N/A | | | | 4.53 (3/26/07) | |
Class Z | | | 20.23 | | | | 7.28 | | | | 6.48 | | | | — | |
| | | | | | | | | | | | | | | | |
Average Annual Total Returns (Without Sales Charges) as of 8/31/10 | | | | | |
| | | One Year | | | Five Years | | | Ten Years | | | Since Inception | |
Class A | | | 19.94 | % | | | 7.03 | % | | | 6.18 | % | | | — | |
Class B | | | 19.39 | | | | 6.50 | | | | 5.66 | | | | — | |
Class C | | | 19.40 | | | | 6.51 | | | | 5.66 | | | | — | |
Class L | | | 19.64 | | | | N/A | | | | N/A | | | | 5.95% (3/26/07) | |
Class M | | | 19.04 | | | | N/A | | | | N/A | | | | 5.52 (3/26/07) | |
Class R | | | 19.66 | | | | 6.81 | | | | N/A | | | | 6.97 (6/6/05) | |
Class X | | | 19.07 | | | | N/A | | | | N/A | | | | 5.47 (3/26/07) | |
Class Z | | | 20.23 | | | | 7.28 | | | | 6.48 | | | | — | |
| | | | |
| Prudential High Yield Fund, Inc. | | | 3 | |
Your Fund’s Performance (continued)
Growth of a $10,000 Investment
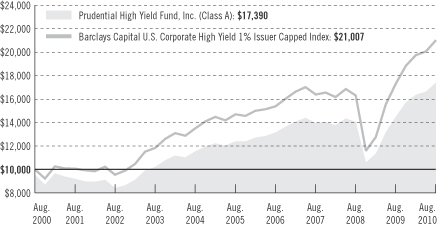
The graph compares a $10,000 investment in the Prudential High Yield Fund, Inc. (Class A shares) with a similar investment in the Barclays Capital U.S. Corporate High Yield 1% Issuer Capped Index by portraying the initial account values at the beginning of the 10-year period for Class A shares (August 31, 2000) and the account values at the end of the current fiscal year (August 31, 2010) as measured on a quarterly basis. For purposes of the graph, and unless otherwise indicated, it has been assumed that (a) the maximum applicable front-end sales charge was deducted from the initial $10,000 investment in Class A shares; (b) all recurring fees (including management fees) were deducted; and (c) all dividends and distributions were reinvested. The line graph provides information for Class A shares only. As indicated in the tables provided earlier, performance for Class B, Class C, Class L, Class M, Class R, Class X and Class Z shares will vary due to the differing charges and expenses applicable to each share class (as indicated in the following paragraphs). Without a distribution and service (12b-1) fee waiver of 0.05% for Class A shares through August 31, 2010, the returns shown in the graph and for Class A shares in the tables would have been lower.
Source: Prudential Investments LLC, and Lipper Inc. Performance figures may reflect fee waivers and/or expense reimbursements. In the absence of such fee waivers and/or expense reimbursements, total returns would be lower.
Inception returns are provided for any share class with less than 10 calendar years of returns.
Class A and Class L shares are subject to a maximum front-end sales charge of 4.50% and 4.25%, respectively, and a 12b-1 fee of up to 0.30% and 0.50%, respectively, annually, and all investors who purchase Class A and Class L shares in an amount of $1 million or more and sell these shares within 12 months of purchase are subject to a contingent deferred sales charge (CDSC) of 1%. Class B shares are subject to a declining CDSC of 5%, 4%, 3%, 2%, 1%, and 1%, respectively, for the first six years after purchase and a 12b-1 fee of 0.75% annually. Approximately seven years after purchase, Class B shares will automatically convert to Class A shares on a quarterly basis. Class C shares purchased are not subject to a front-end sales charge, but are subject to a CDSC of 1% for shares sold within 12 months from the date of purchase and an annual 12b-1 fee of 1%. Class M shares are subject to a CDSC of 6%, which decreases by 1% annually to 2% in the fifth and sixth years and to 1% in the seventh year, and a 12b-1 fee of 1% annually. Class M shares automatically convert to Class A
| | |
| 4 | | Visit our website at www.prudentialfunds.com |
shares approximately eight years after purchase. Class X shares are subject to a CDSC of 6%, which decreases by 1% annually to 4% in the third and fourth years, by 1% annually to 2% in the sixth and seventh years, and to 1% in the eighth year, and a 12b-1 fee of 1% annually. Class X shares automatically convert to Class A shares on a quarterly basis approximately ten years (eight years in the case of shares purchased prior to August 17, 1998) after purchase. Class R and Z shares are not subject to a sales charge. Class R shares are subject to a 12b-1 fee of 0.75% annually. Class Z shares are not subject to a 12b-1 fee. The returns in the graph and tables reflect the share class expense structure in effect at the close of the fiscal period. The returns in the graph and the tables do not reflect the deduction of taxes that a shareholder would pay on Fund distributions or following the redemption of Fund shares.
Benchmark Definitions
Barclays Capital U.S. Corporate High Yield 1% Issuer Capped Index
The Barclays Capital U.S. Corporate High Yield 1% Issuer Capped Index (1% Issuer Capped Index) is an unmanaged index which covers the universe of U.S. dollar denominated, non-convertible, fixed rate, non-investment grade debt. Issuers are capped at 1% of the Index. Index holdings must have at least one year to final maturity, at least $150 million par amount outstanding, and be publicly issued with a rating of Ba1 or lower. Barclays Capital U.S. Corporate High Yield 1% Issuer Capped Index Closest Month-End to Inception cumulative total returns as of 8/31/10 are 26.05% for Class L, Class M, and Class X; and 48.35% for Class R. Barclays Capital U.S. Corporate High Yield 1% Issuer Capped Index Closest Month-End to Inception average annual total returns as of 9/30/10 are 7.70% for Class L, Class M, and Class X; and 8.25% for Class R.
Lipper High Current Yield Funds Average
The Lipper High Current Yield Funds Average (Lipper Average) represents returns based on an average return of all funds in the Lipper High Current Yield Funds category for the periods noted. Funds in the Lipper Average aim at high (relative) current yield from fixed income securities, have no quality or maturity restrictions, and tend to invest in lower-grade debt issues. Lipper Average Closest Month-End to Inception cumulative total returns as of 8/31/10 are 15.07% for Class L, Class M, and Class X; and 35.14% for Class R. Lipper Average Closest Month-End to Inception average annual total returns as of 9/30/10 are 4.74% for Class L, Class M, Class X; and 6.23% for Class R.
Investors cannot invest directly in an index or average. The returns for the Barclays Capital U.S. Corporate High Yield 1% Issuer Capped Index and the Lipper Average would be lower if they included the effects of sales charges, operating expenses of a mutual fund, or taxes. Returns for the Lipper Average reflect the deduction of operating expenses, but not sales charges or taxes.
| | | | |
Five Largest Long-Term Issues expressed as a percentage of net assets as of 8/31/10 | | | | |
Avaya, Inc., Gtd. Notes, 11/1/15 | | | 1.1 | % |
Charter Communications Operating LLC/Charter Communications Operating Capital,
Sec’d. Notes, 144A, 4/30/12 | | | 1.1 | |
NXP BV/NXP Funding LLC (Netherlands), Sec’d. Notes, 144A, 8/1/18 | | | 1.0 | |
Sensata Technologies BV (Netherlands), Gtd. Notes, 5/1/14 | | | 0.9 | |
Royalty Pharma Finance Trust, 5/15/15 | | | 0.9 | |
Issues reflect only long-term investments and are subject to change.
| | | | |
| Prudential High Yield Fund, Inc. | | | 5 | |
Your Fund’s Performance (continued)
| | | | | | |
Distributions and Yields as of 8/31/10 | | | | | | |
| | | Total Distributions
Paid for 12 Months | | 30-Day SEC Yield | |
Class A | | $ | 0.46 | | 7.07 | % |
Class B | | | 0.43 | | 6.90 | |
Class C | | | 0.43 | | 6.90 | |
Class L | | | 0.45 | | 7.14 | |
Class M | | | 0.42 | | 6.64 | |
Class R | | | 0.45 | | 7.15 | |
Class X | | | 0.42 | | 6.65 | |
Class Z | | | 0.47 | | 7.64 | |
| | | |
Credit Quality* expressed as a percentage of net assets as of 8/31/10 | | | |
High Grade | | 3.9 | % |
Ba | | 23.9 | |
B | | 42.8 | |
Caa or Lower | | 23.8 | |
Not Rated** | | 17.1 | |
Total Investments | | 111.5 | |
Liabilities in excess of other assets | | –11.5 | |
Net Assets | | 100.0 | % |
| | | |
*Source: Moody’s rating, defaulting to S&P when not rated by Moody’s.
**Approximately 15.9% of Not Rated is reflected in Short Term Money Markets.
Credit Quality is subject to change.
| | |
| 6 | | Visit our website at www.prudentialfunds.com |
Strategy and Performance Overview
How did the Fund perform?
Prudential High Yield Fund’s Class A shares gained 19.94% for the 12-month reporting period that ended August 31, 2010, trailing the 21.22% gain of the Barclays Capital U.S. Corporate High Yield 1% Issuer Capped Index (the Index). However, the Fund’s Class A shares outperformed the 18.99% gain of the Lipper High Current Yield Funds Average.
How is the Fund managed?
The Fund, which is managed by Prudential Fixed Income, invests primarily in corporate debt securities commonly called “junk” bonds because they are rated below investment grade. Most of the Fund’s holdings are in the Ba and B rating categories, the two highest ratings in the junk bond market according to Moody’s Investors Service.
Research plays a key role in the Fund’s investment process. Senior investment professionals develop a quarterly market outlook that provides an overall view on the economy, interest rates, and risk levels in the major sectors of the bond market. This outlook helps set broad investment strategies for the Fund. Portfolio managers also work closely with a team of 11 credit research analysts when selecting bonds to buy and sell.
What were conditions like in the U.S. high yield corporate bond market?
When the reporting period began on September 1, 2009, the U.S. economy had begun to expand again following its worst downturn since the Great Depression of the 1930s. The world’s largest economy picked up steam in late 2009, helped by a tax cut for first-time homebuyers and other steps taken by the U.S. government. The Federal Reserve (the Fed) also acted aggressively to support the economy and credit markets. For example, it left its target for the overnight bank lending rate near zero throughout the reporting period to help stimulate growth through low borrowing costs.
The combination of rock-bottom interest rates and improving economic conditions helped high yield bond prices rally strongly from September through December 2009. Even as economic growth slowed during the remainder of the reporting period as the effects of the stimulus measures faded in 2010, high yield bond prices gained for most of those months too. This occurred as investors searching for debt securities with attractive yields eagerly purchased a record amount of the below-investment-grade bonds issued by companies taking advantage of the low borrowing costs. The worst month for high yield bonds was May, when a flare-up in a sovereign-debt crisis in Europe and other negative developments heightened risk aversion among investors. This hurt prices of risky assets such as stocks and high yield bonds.
| | | | |
| Prudential High Yield Fund, Inc. | | | 7 | |
Strategy and Performance Overview (continued)
During the reporting period, the easy access to capital enjoyed by corporations helped drive a sharp decline in the high yield bond default rate, which tracks the percentage of companies that did not pay interest and principal for a trailing 12-month period. Credit fundamentals among companies that issue high yield bonds continued to stabilize and earnings increased across a wide range of industries. However, Prudential Fixed Income noted that some companies continue to carry too much debt and credit fundamentals of some firms will remain challenging for a while, particularly if economic growth stalls in the United States.
How did sectors, industries, and rating categories in the high yield market perform?
All sectors and industry groups in the high yield market finished the reporting period in the black, most with double-digit total returns. Some of the largest gains were in more cyclical sectors and industries that tend to be more profitable during a recovery such as financial institutions (banking, brokerage, and insurance), airlines, autos, chemicals, and media (non-cable), all of which outperformed the broader high yield market. By contrast, some of the more defensive industries that tend to be less affected by the economic cycle, including electric utilities, healthcare, supermarkets, and media (cable), posted more modest returns that trailed the broader high yield market.
From the perspective of credit quality, all ratings categories in the high yield market ended the reporting period in positive territory. Based on the Moody’s Investors Service rating methodology, the lowest quality categories (Ca-D and Caa) easily outperformed the better quality categories (Ba and B). This occurred as bargain hunters looking for attractive yields drove up prices of distressed bonds, which are debt securities of firms close to or already in bankruptcy.
How did the leveraged bank loan market in the United States perform?
The market for leveraged bank loans in the United States posted a double-digit increase for the reporting period that underperformed the 21.22% gain of the Index. Leveraged bank loans, which are made to companies that borrowed heavily to finance their operations, are considered a more conservative type of investment than high yield bonds. In most cases, a company in bankruptcy will pay off its leveraged loan before it will pay off its high yield bonds.
Nevertheless, the performance of the leveraged bank loan market also reflected investor preference for higher yielding assets, as lower-rated loans easily outperformed more highly rated loans for the reporting period. Here, too, some of the largest gains for the reporting period were in loans from more cyclical industries such as airlines, autos, media (noncable), chemicals, and building materials, all of which posted double-digit gains. By contrast, loans in some of the more defensive industries such as telecommunications, healthcare, and media (cable) posted single-digit gains.
| | |
| 8 | | Visit our website at www.prudentialfunds.com |
Which strategies and holdings contributed most to the Fund’s performance?
Prudential Fixed Income continued to take a generally cautious approach to investing in the high yield market, emphasizing the importance of credit research in the uncertain economic environment. This approach was also warranted as increased demand for assets with attractive yields has enabled some firms to issue high yield bonds with fewer protections for investors than comparable bonds issued in previous years.
The Fund benefited most from favorable security selection in the technology and consumer cyclical sectors. In the technology sector, it held defaulted bonds of Nortel Networks, a telecommunications equipment maker that is undergoing Chapter 11 bankruptcy in Canada. The company received strong bids for the part of its business it is liquidating, which should help increase the amount holders of its defaulted bonds will receive in the future. The Fund also owned debt securities of Netherlands-based NXP Semiconductors BV that performed well as sales at the chipmaker have improved significantly. NXP also raised about $475 million from an initial public offering in August 2010.
In the consumer cyclical sector, the Fund continued to hold bonds of New Jersey-based real estate brokerage firm Realogy Corp., which made the largest single contribution to the Fund’s return for the reporting period. Prices of the bonds, which were hit particularly hard in 2008 during the credit crisis, continued to rebound as the nation’s housing market stabilized.
The Fund also benefited from its select exposure to collateralized loan obligations (CLOs), which are created from bundles of bank loans. By selling some of their commercial loan portfolio through CLOs, banks are able to lower the amount of capital they are required to hold. As the underlying bank loans recovered in value amid improving economic conditions, the senior portion of CLOs held by the Fund recovered even more.
Which strategies and holdings subtracted most from the Fund’s performance?
Certain aspects of the Fund’s sector allocation strategy hurt its performance versus the Index. Compared to the Index, the Fund had a smaller exposure to the financial institutions sector, the top performing sector for the reporting period. Most of the bonds in the financial institutions sector are “fallen angels,” formerly investment-grade debt securities that entered the high yield arena after being cut to below investment grade by credit rating agencies. Because of its more cautious approach, Prudential Fixed Income tends to limit the Fund’s exposure to these types of bonds.
| | | | |
| Prudential High Yield Fund, Inc. | | | 9 | |
Strategy and Performance Overview (continued)
Meanwhile, the Fund had a larger exposure than the Index to bonds of more defensive industries such as media (cable) and healthcare, which underperformed the broader high yield market for the reporting period as previously discussed. This strategy also hurt the Fund’s performance versus the Index.
| | |
| 10 | | Visit our website at www.prudentialfunds.com |
Fees and Expenses (Unaudited)
As a shareholder of the Fund, you incur two types of costs: (1) transaction costs, including sales charges (loads) on purchase payments and redemptions, as applicable, and (2) ongoing costs, including management fees, distribution and/or service (12b-1) fees, and other Fund expenses, as applicable. This example is intended to help you understand your ongoing costs (in dollars) of investing in the Fund and to compare these costs with the ongoing costs of investing in other mutual funds.
The example is based on an investment of $1,000 invested on March 1, 2010, at the beginning of the period, and held through the six-month period ended August 31, 2010. The example is for illustrative purposes only; you should consult the Prospectus for information on initial and subsequent minimum investment requirements.
The Fund’s transfer agent may charge additional fees to holders of certain accounts that are not included in the expenses shown in the table on the following page. These fees apply to individual retirement accounts (IRAs) and Section 403(b) accounts. As of the close of the six-month period covered by the table, IRA fees included an annual maintenance fee of $15 per account (subject to a maximum annual maintenance fee of $25 for all accounts held by the same shareholder). Section 403(b) accounts are charged an annual $25 fiduciary maintenance fee. Some of the fees may vary in amount, or may be waived, based on your total account balance or the number of Prudential Investments funds, including the Fund, that you own. You should consider the additional fees that were charged to your Fund account over the six-month period when you estimate the total ongoing expenses paid over the period and the impact of these fees on your ending account value, as these additional expenses are not reflected in the information provided in the expense table. Additional fees have the effect of reducing investment returns.
Actual Expenses
The first line for each share class in the table on the following page provides information about actual account values and actual expenses. You may use the information on this line, together with the amount you invested, to estimate the expenses that you paid over the period. Simply divide your account value by $1,000 (for example, an $8,600 account value ÷ $1,000 = 8.6), then multiply the result by the number on the first line under the heading “Expenses Paid During the Six-Month Period” to estimate the expenses you paid on your account during this period.
Hypothetical Example for Comparison Purposes
The second line for each share class in the table on the following page provides information about hypothetical account values and hypothetical expenses based on the Fund’s actual expense ratio and an assumed rate of return of 5% per year before expenses, which is not the Fund’s actual return. The hypothetical account values and expenses may not be used to estimate the actual ending account balance or expenses you paid for the period. You may use this information to compare the ongoing costs
| | |
| Prudential High Yield Fund, Inc. | | 11 |
Fees and Expenses (continued)
of investing in the Fund and other funds. To do so, compare this 5% hypothetical example with the 5% hypothetical examples that appear in the shareholder reports of the other funds.
Please note that the expenses shown in the table are meant to highlight your ongoing costs only and do not reflect any transactional costs such as sales charges (loads). Therefore, the second line for each share class in the table is useful in comparing ongoing costs only and will not help you determine the relative total costs of owning different funds. In addition, if these transactional costs were included, your costs would have been higher.
| | | | | | | | | | | | | | |
Prudential High Yield
Fund, Inc. | | Beginning Account
Value
March 1, 2010 | | Ending Account
Value
August 31, 2010 | | Annualized
Expense Ratio
Based on the
Six-Month Period | | | Expenses Paid
During the
Six-Month Period* |
| | | | | | | | | | | | | | |
| Class A | | Actual | | $ | 1,000.00 | | $ | 1,063.30 | | 0.93 | % | | $ | 4.84 |
| | | Hypothetical | | $ | 1,000.00 | | $ | 1,020.52 | | 0.93 | % | | $ | 4.74 |
| | | | | | | | | | | | | | |
| Class B | | Actual | | $ | 1,000.00 | | $ | 1,058.70 | | 1.43 | % | | $ | 7.42 |
| | | Hypothetical | | $ | 1,000.00 | | $ | 1,018.00 | | 1.43 | % | | $ | 7.27 |
| | | | | | | | | | | | | | |
| Class C | | Actual | | $ | 1,000.00 | | $ | 1,060.80 | | 1.43 | % | | $ | 7.43 |
| | | Hypothetical | | $ | 1,000.00 | | $ | 1,018.00 | | 1.43 | % | | $ | 7.27 |
| | | | | | | | | | | | | | |
| Class L | | Actual | | $ | 1,000.00 | | $ | 1,059.90 | | 1.18 | % | | $ | 6.13 |
| | | Hypothetical | | $ | 1,000.00 | | $ | 1,019.26 | | 1.18 | % | | $ | 6.01 |
| | | | | | | | | | | | | | |
| Class M | | Actual | | $ | 1,000.00 | | $ | 1,059.30 | | 1.68 | % | | $ | 8.72 |
| | | Hypothetical | | $ | 1,000.00 | | $ | 1,016.74 | | 1.68 | % | | $ | 8.54 |
| | | | | | | | | | | | | | |
| Class R | | Actual | | $ | 1,000.00 | | $ | 1,062.00 | | 1.18 | % | | $ | 6.13 |
| | | Hypothetical | | $ | 1,000.00 | | $ | 1,019.26 | | 1.18 | % | | $ | 6.01 |
| | | | | | | | | | | | | | |
| Class X | | Actual | | $ | 1,000.00 | | $ | 1,057.30 | | 1.68 | % | | $ | 8.71 |
| | | Hypothetical | | $ | 1,000.00 | | $ | 1,016.74 | | 1.68 | % | | $ | 8.54 |
| | | | | | | | | | | | | | |
| Class Z | | Actual | | $ | 1,000.00 | | $ | 1,064.70 | | 0.68 | % | | $ | 3.54 |
| | | Hypothetical | | $ | 1,000.00 | | $ | 1,021.78 | | 0.68 | % | | $ | 3.47 |
* Fund expenses (net of fee waivers or subsidies, if any) for each share class are equal to the annualized expense ratio for each share class (provided in the table), multiplied by the average account value over the period, multiplied by the 184 days in the six-month period ended August 31, 2010, and divided by the 365 days in the Fund’s fiscal year ended August 31, 2010 (to reflect the six-month period). Expenses presented in the table include the expenses of any underlying portfolios in which the Fund may invest.
| | |
| 12 | | Visit our website at www.prudentialfunds.com |
Portfolio of Investments
as of August 31, 2010
| | | | | | | | | | | | | | | | |
| | | Moody’s
Ratings*
(Unaudited) | | Interest
Rate | | Maturity
Date | | | Principal
Amount (000) | | | Value (Note 1) | |
| | | | | | | | | | | | | | | | |
LONG-TERM INVESTMENTS 95.6% | | | | | | | | | | | | | | |
| | | | |
ASSET BACKED SECURITIES 1.0% | | | | | | | | | | | | | | |
Baker Street Funding (Cayman Islands), Ser. 2006-1A, Cl. E, 144A(a)(b) | | Ca | | 4.476% | | | 10/15/19 | | | $ | 2,851 | | | $ | 1,254,250 | |
Bridgeport CLO Ltd. (Cayman Islands), Ser. 2007-2A, Cl. D, 144A(a)(b)(c) | | B3 | | 4.789 | | | 06/18/21 | | | | 2,261 | | | | 1,311,381 | |
Centurion CDO VII Ltd. (Cayman Islands), Ser. 2004-7A, Cl. D1(b)(c) | | Caa3 | | 12.090 | | | 01/30/16 | | | | 5,000 | | | | 2,250,000 | |
CSAM Funding Corp. (Cayman Islands), Ser. 2001-1A, Cl. D2, 144A(a)(b)(c) | | Ca | | 6.831 | | | 03/29/16 | | | | 7,000 | | | | 4,060,000 | |
Golden Knight CDO Corp. (Cayman Islands), Ser. 2007-2A, Cl. B, 144A(a)(b) | | Baa2 | | 0.916 | | | 04/15/19 | | | | 3,750 | | | | 2,850,000 | |
Landmark IV CDO Ltd. (Cayman Islands), Ser. 2004-1A, Cl. B2L(a)(b)(c) | | Caa1 | | 6.687 | | | 12/15/16 | | | | 3,259 | | | | 2,020,605 | |
Liberty Square CDO Ltd. (Cayman Islands), Ser. 2001-2A, Cl. D, 144A(a)(b)(c) | | C | | 7.246 | | | 06/15/13 | | | | 3,465 | | | | 381,202 | |
| | | | | | | | | | | | | | | | |
Total asset backed securities | | | | | | | | | | | | | | | 14,127,438 | |
| | | | | | | | | | | | | | | | |
| | | | | |
BANK LOANS(a)(c) 6.6% | | | | | | | | | | | | | | | | |
| | | | | |
Airlines | | | | | | | | | | | | | | | | |
United Airlines, Inc. | | B1 | | 2.313 | | | 02/01/14 | | | | 496 | | | | 448,301 | |
| | | | | |
Automotive 0.5% | | | | | | | | | | | | | | | | |
Ford Motor Co. | | Ba1 | | 3.030 | | | 12/15/13 | | | | 7,210 | | | | 6,935,878 | |
| | | | | |
Cable 1.1% | | | | | | | | | | | | | | | | |
Charter Communications Operating LLC | | Ba2 | | 2.260 | | | 03/06/14 | | | | 802 | | | | 759,047 | |
Charter Communications Operating LLC | | Ba2 | | 3.790 | | | 09/06/16 | | | | 6,511 | | | | 6,227,415 | |
CSC Holdings, Inc. | | Baa3 | | 1.017 | | | 03/31/15 | | | | 2,999 | | | | 2,871,678 | |
Newsday LLC | | Ba3 | | 9.750 | | | 08/01/13 | | | | 6,000 | | | | 6,367,500 | |
| | | | | | | | | | | | | | | | |
| | | | | | | | | | | | | | | 16,225,640 | |
See Notes to Financial Statements.
| | | | |
| Prudential High Yield Fund, Inc. | | | 13 | |
Portfolio of Investments
as of August 31, 2010 continued
| | | | | | | | | | | | | | | | |
| | | Moody’s
Ratings*
(Unaudited) | | Interest
Rate | | Maturity
Date | | | Principal
Amount (000) | | | Value (Note 1) | |
| | | | | | | | | | | | | | | | |
Capital Goods 0.1% | | | | | | | | | | | | | | | | |
Capital Safety Group Ltd. | | B3 | | 2.875% | | | 07/20/15 | | | $ | 176 | | | $ | 151,462 | |
Capital Safety Group Ltd. | | B3 | | 3.010 | | | 07/20/16 | | | | 924 | | | | 794,538 | |
| | | | | | | | | | | | | | | | |
| | | | | | | | | | | | | | | 946,000 | |
| | | | | |
Consumer 0.3% | | | | | | | | | | | | | | | | |
Realogy Corp. | | Caa3 | | 13.500 | | | 10/15/17 | | | | 2,000 | | | | 2,110,000 | |
Realogy Corp. | | Caa3 | | 13.500 | | | 10/15/17 | | | | 2,300 | | | | 2,426,500 | |
| | | | | | | | | | | | | | | | |
| | | | | | | | | | | | | | | 4,536,500 | |
| | | | | |
Electric 1.2% | | | | | | | | | | | | | | | | |
Calpine Corp. | | B1 | | 3.415 | | | 03/29/14 | | | | 1,820 | | | | 1,737,039 | |
Texas Competitive Electric Holdings Co. LLC | | B1 | | 3.795 | | | 10/10/14 | | | | 11,432 | | | | 8,661,548 | |
Texas Competitive Electric Holdings Co. LLC | | B1 | | 3.795 | | | 10/10/14 | | | | 220 | | | | 166,611 | |
Texas Competitive Electric Holdings Co. LLC | | B1 | | 3.795 | | | 10/10/14 | | | | 9,151 | | | | 6,897,544 | |
| | | | | | | | | | | | | | | | |
| | | | | | | | | | | | | | | 17,462,742 | |
| | | | | |
Foods 0.3% | | | | | | | | | | | | | | | | |
OSI Restaurant Partners, Inc. | | B3 | | 0.460 | | | 06/14/13 | | | | 377 | | | | 333,084 | |
OSI Restaurant Partners, Inc. | | B3 | | 2.875 | | | 06/14/14 | | | | 4,159 | | | | 3,675,414 | |
| | | | | | | | | | | | | | | | |
| | | | | | | | | | | | | | | 4,008,498 | |
| | | | | |
Gaming 0.2% | | | | | | | | | | | | | | | | |
Harrahs Operating Co., Inc. | | Caa1 | | 3.498 | | | 01/28/15 | | | | 404 | | | | 346,097 | |
Harrahs Operating Co., Inc. | | Caa1 | | 3.498 | | | 01/28/15 | | | | 1,821 | | | | 1,555,663 | |
Motorcity Casino | | B3 | | 8.500 | | | 07/13/12 | | | | 1,611 | | | | 1,593,919 | |
| | | | | | | | | | | | | | | | |
| | | | | | | | | | | | | | | 3,495,679 | |
| | | | |
Healthcare & Pharmaceutical 0.9% | | | | | | | | | | | | | | |
Royalty Pharma Finance Trust | | Baa3 | | 7.750 | | | 05/15/15 | | | | 13,101 | | | | 12,904,404 | |
| | | | | |
Pipelines & Other 0.2% | | | | | | | | | | | | | | | | |
New Development Holdings LLC | | Ba3 | | 7.000 | | | 07/01/17 | | | | 2,200 | | | | 2,228,679 | |
| | | | | |
Technology 1.7% | | | | | | | | | | | | | | | | |
First Data Corp. | | B1 | | 3.014 | | | 09/24/14 | | | | 2,294 | | | | 1,958,329 | |
First Data Corp. | | B1 | | 3.014 | | | 09/24/14 | | | | 4,274 | | | | 3,644,447 | |
First Data Corp. | | B1 | | 3.014 | | | 09/24/14 | | | | 3,737 | | | | 3,187,345 | |
See Notes to Financial Statements.
| | |
| 14 | | Visit our website at www.prudentialfunds.com |
| | | | | | | | | | | | | | | | |
| | | Moody’s
Ratings*
(Unaudited) | | Interest
Rate | | Maturity
Date | | | Principal
Amount (000) | | | Value (Note 1) | |
| | | | | | | | | | | | | | | | |
Technology (cont’d.) | | | | | | | | | | | | | | | | |
Interactive Data Corp. | | Ba3 | | 6.750% | | | 01/29/17 | | | $ | 6,600 | | | $ | 6,638,498 | |
Spansion LLC | | BB-(d) | | 7.500 | | | 02/09/15 | | | | 2,494 | | | | 2,467,773 | |
Transunion LLC | | Ba3 | | 6.750 | | | 06/15/17 | | | | 5,850 | | | | 5,903,018 | |
| | | | | | | | | | | | | | | | |
| | | | | | | | | | | | | | | 23,799,410 | |
| | | | | |
Telecommunications 0.1% | | | | | | | | | | | | | | | | |
Level 3 Communications, Inc. | | B1 | | 9.080 | | | 03/13/14 | | | | 1,500 | | | | 1,619,062 | |
| | | | | | | | | | | | | | | | |
Total bank loans | | | | | | | | | | | | | | | 94,610,793 | |
| | | | | | | | | | | | | | | | |
| | | | | |
CORPORATE BONDS 87.8% | | | | | | | | | | | | | | | | |
| | | | | |
Aerospace & Defense 1.2% | | | | | | | | | | | | | | | | |
BE Aerospace, Inc., Sr. Unsec’d. Notes | | Ba3 | | 8.500 | | | 07/01/18 | | | | 765 | | | | 818,550 | |
Colt Defense LLC/Colt Finance Corp., Sr. Unsec’d. Notes, 144A
(original cost $3,290,000; purchased 01/13/10-03/23/10)(c)(e) | | B3 | | 8.750 | | | 11/15/17 | | | | 3,250 | | | | 2,315,625 | |
Esterline Technologies Corp.,
Gtd. Notes | | Ba3 | | 6.625 | | | 03/01/17 | | | | 175 | | | | 175,000 | |
Gtd. Notes, 144A | | Ba3 | | 7.000 | | | 08/01/20 | | | | 2,250 | | | | 2,289,375 | |
Hawker Beechcraft Acquisition Co. LLC, Gtd. Notes(f) | | Caa3 | | 8.500 | | | 04/01/15 | | | | 1,650 | | | | 1,266,375 | |
Moog, Inc.,
Sr. Sub. Notes | | Ba3 | | 6.250 | | | 01/15/15 | | | | 2,130 | | | | 2,108,700 | |
Sr. Sub. Notes | | Ba3 | | 7.250 | | | 06/15/18 | | | | 2,850 | | | | 2,878,500 | |
Transdigm, Inc.,
Gtd. Notes | | B3 | | 7.750 | | | 07/15/14 | | | | 5,125 | | | | 5,278,750 | |
Gtd. Notes | | B3 | | 7.750 | | | 07/15/14 | | | | 830 | | | | 854,900 | |
| | | | | | | | | | | | | | | | |
| | | | | | | | | | | | | | | 17,985,775 | |
| | | | | |
Airlines 0.3% | | | | | | | | | | | | | | | | |
AMR Corp., Sr. Unsec’d. Notes, Ser. B, MTN | | CCC+(d) | | 10.400 | | | 03/10/11 | | | | 4,550 | | | | 4,550,000 | |
Continental Airlines, Inc., Pass-thru Certs., Ser. 981B, Cl. B(c) | | Ba2 | | 6.748 | | | 03/15/17 | | | | 489 | | | | 459,415 | |
| | | | | | | | | | | | | | | | |
| | | | | | | | | | | | | | | 5,009,415 | |
See Notes to Financial Statements.
| | | | |
| Prudential High Yield Fund, Inc. | | | 15 | |
Portfolio of Investments
as of August 31, 2010 continued
| | | | | | | | | | | | | | | | |
| | | Moody’s
Ratings*
(Unaudited) | | Interest
Rate | | Maturity
Date | | | Principal
Amount (000) | | | Value (Note 1) | |
| | | | | | | | | | | | | | | | |
Automotive 2.9% | | | | | | | | | | | | | | | | |
American Axle & Manufacturing, Inc., Gtd. Notes(f) | | B3 | | 7.875% | | | 03/01/17 | | | $ | 3,650 | | | $ | 3,376,250 | |
Cooper-Standard Automotive, Inc., Gtd. Notes, 144A | | B2 | | 8.500 | | | 05/01/18 | | | | 775 | | | | 792,438 | |
Ford Motor Co., Sr. Unsec’d. Notes(f) | | B2 | | 7.450 | | | 07/16/31 | | | | 2,250 | | | | 2,193,750 | |
Ford Motor Credit Co. LLC,
Sr. Unsec’d. Notes(f) | | Ba3 | | 7.000 | | | 10/01/13 | | | | 795 | | | | 830,053 | |
Sr. Unsec’d. Notes | | Ba3 | | 7.500 | | | 08/01/12 | | | | 10,000 | | | | 10,497,660 | |
Sr. Unsec’d. Notes | | Ba3 | | 8.000 | | | 12/15/16 | | | | 5,065 | | | | 5,500,261 | |
Lear Corp.,
Gtd. Notes | | B1 | | 7.875 | | | 03/15/18 | | | | 2,500 | | | | 2,587,500 | |
Gtd. Notes(f) | | B1 | | 8.125 | | | 03/15/20 | | | | 3,075 | | | | 3,190,313 | |
Navistar International Corp., Gtd. Notes | | B1 | | 8.250 | | | 11/01/21 | | | | 6,625 | | | | 6,939,687 | |
TRW Automotive, Inc., 144A(f)
Gtd. Notes | | B2 | | 7.000 | | | 03/15/14 | | | | 1,225 | | | | 1,261,750 | |
Gtd. Notes | | B2 | | 7.250 | | | 03/15/17 | | | | 1,750 | | | | 1,789,375 | |
Gtd. Notes | | B2 | | 8.875 | | | 12/01/17 | | | | 2,375 | | | | 2,538,281 | |
| | | | | | | | | | | | | | | | |
| | | | | | | | | | | | | | | 41,497,318 | |
| | | | | |
Banking 1.4% | | | | | | | | | | | | | | | | |
BAC Capital Trust VI, Ltd., Gtd. Notes | | Baa3 | | 5.625 | | | 03/08/35 | | | | 760 | | | | 663,934 | |
BAC Capital Trust XI, Ltd., Gtd. Notes | | Baa3 | | 6.625 | | | 05/23/36 | | | | 485 | | | | 481,502 | |
BAC Capital Trust XIV, Ltd., Gtd. Notes(a) | | Ba3 | | 5.630 | | | 12/31/49 | | | | 465 | | | | 316,200 | |
Bank of America Corp., Jr. Sub. Notes(a) | | Ba3 | | 8.000 | | | 12/29/49 | | | | 7,260 | | | | 7,405,926 | |
HSBK Europe BV (Kazakhstan), Gtd. Notes., 144A(b) | | Ba2 | | 7.250 | | | 05/03/17 | | | | 4,500 | | | | 4,477,500 | |
MBNA Capital A, Ltd., Gtd. Notes, Ser. A | | Baa3 | | 8.278 | | | 12/01/26 | | | | 2,250 | | | | 2,306,250 | |
Wachovia Bank NA, Sub. Notes | | Aa3 | | 6.600 | | | 01/15/38 | | | | 375 | | | | 425,007 | |
Wind Acquisition Holdings Finance SA (Luxembourg), Sr. Sec’d. Notes, PIK, 144A(b)(f) | | B3 | | 12.250 | | | 07/15/17 | | | | 3,964 | | | | 4,103,149 | |
| | | | | | | | | | | | | | | | |
| | | | | | | | | | | | | | | 20,179,468 | |
See Notes to Financial Statements.
| | |
| 16 | | Visit our website at www.prudentialfunds.com |
| | | | | | | | | | | | | | | | |
| | | Moody’s
Ratings*
(Unaudited) | | Interest
Rate | | Maturity
Date | | | Principal
Amount (000) | | | Value (Note 1) | |
| | | | | | | | | | | | | | | | |
Building Materials & Construction 1.4% | | | | | | | | | | | | |
Building Materials Corp. of America, Sr. Sec’d. Notes, 144A
(original cost $2,425,000; purchased 02/02/10)(e) | | Ba2 | | 7.000% | | | 02/15/20 | | | $ | 2,425 | | | $ | 2,412,875 | |
D.R. Horton, Inc.,
Gtd. Notes | | Ba3 | | 6.500 | | | 04/15/16 | | | | 100 | | | | 100,375 | |
Gtd. Notes | | Ba3 | | 9.750 | | | 09/15/10 | | | | 110 | | | | 110,068 | |
Interline Brands, Inc., Gtd. Notes | | B3 | | 8.125 | | | 06/15/14 | | | | 2,900 | | | | 2,950,750 | |
KB Home, Gtd. Notes(f) | | B1 | | 6.375 | | | 08/15/11 | | | | 429 | | | | 434,363 | |
Masco Corp., Sr. Unsec’d. Notes | | Ba2 | | 7.125 | | | 08/15/13 | | | | 2,845 | | | | 3,003,048 | |
Ryland Group, Inc., Gtd. Notes | | Ba3 | | 6.875 | | | 06/15/13 | | | | 3,000 | | | | 3,142,500 | |
Standard Pacific Corp.,
Gtd. Notes | | B3 | | 7.000 | | | 08/15/15 | | | | 500 | | | | 460,000 | |
Gtd. Notes | | B3 | | 10.750 | | | 09/15/16 | | | | 6,225 | | | | 6,551,812 | |
Sec’d. Notes | | B3 | | 8.375 | | | 05/15/18 | | | | 425 | | | | 409,062 | |
| | | | | | | | | | | | | | | | |
| | | | | | | | | | | | | | | 19,574,853 | |
| | | | | |
Cable 5.0% | | | | | | | | | | | | | | | | |
Cablevision Systems Corp.,
Sr. Unsec’d. Notes | | B1 | | 7.750 | | | 04/15/18 | | | | 675 | | | | 710,437 | |
Sr. Unsec’d. Notes, 144A | | B1 | | 8.625 | | | 09/15/17 | | | | 4,725 | | | | 5,150,250 | |
CCH II LLC/CCH II Capital Corp., Gtd. Notes | | B2 | | 13.500 | | | 11/30/16 | | | | 1,438 | | | | 1,703,569 | |
CCO Holdings LLC/CCO Holdings Capital Corp., 144A
Gtd. Notes | | B2 | | 7.875 | | | 04/30/18 | | | | 1,275 | | | | 1,319,625 | |
Gtd. Notes(f) | | B2 | | 8.125 | | | 04/30/20 | | | | 1,125 | | | | 1,184,063 | |
Cequel Communications Holdings I LLC, Sr. Unsec’d. Notes, 144A | | B3 | | 8.625 | | | 11/15/17 | | | | 7,950 | | | | 8,109,000 | |
Charter Communications Operating LLC/Charter Communications Operating Capital, Sec’d. Notes, 144A | | B1 | | 8.000 | | | 04/30/12 | | | | 14,663 | | | | 15,432,808 | |
CSC Holdings LLC, | | | | | | | | | | | | | | | | |
Sr. Unsec’d. Notes | | Ba3 | | 6.750 | | | 04/15/12 | | | | 59 | | | | 61,507 | |
Sr. Unsec’d. Notes(f) | | Ba3 | | 7.625 | | | 07/15/18 | | | | 1,150 | | | | 1,224,750 | |
Sr. Unsec’d. Notes(f) | | Ba3 | | 7.875 | | | 02/15/18 | | | | 161 | | | | 173,075 | |
Sr. Unsec’d. Notes | | Ba3 | | 8.500 | | | 06/15/15 | | | | 1,250 | | | | 1,356,250 | |
Sr. Unsec’d. Notes(f) | | Ba3 | | 8.625 | | | 02/15/19 | | | | 575 | | | | 641,125 | |
Echostar DBS Corp., Gtd. Notes | | Ba3 | | 7.125 | | | 02/01/16 | | | | 1,340 | | | | 1,370,150 | |
See Notes to Financial Statements.
| | | | |
| Prudential High Yield Fund, Inc. | | | 17 | |
Portfolio of Investments
as of August 31, 2010 continued
| | | | | | | | | | | | | | | | |
| | | Moody’s
Ratings*
(Unaudited) | | Interest
Rate | | Maturity
Date | | | Principal
Amount (000) | | | Value (Note 1) | |
| | | | | | | | | | | | | | | | |
Cable (cont’d.) | | | | | | | | | | | | | | | | |
Escrow CB Frontier Vision(c)(g) | | NR | | 0.000% | | | 10/15/10 | | | $ | 575 | | | $ | 6 | |
Mediacom Broadband LLC, Sr. Unsec’d. Notes | | B3 | | 8.500 | | | 10/15/15 | | | | 1,185 | | | | 1,176,113 | |
MediaCom LLC, Unsec’d. Notes(f) | | B3 | | 9.125 | | | 08/15/19 | | | | 1,100 | | | | 1,100,000 | |
Quebecor Media, Inc. (Canada), Sr. Unsec’d. Notes(b) | | B2 | | 7.750 | | | 03/15/16 | | | | 4,065 | | | | 4,146,300 | |
UPC Germany GmbH (Germany), Sr. Sec’d. Notes, 144A(b) | | B1 | | 8.125 | | | 12/01/17 | | | | 1,400 | | | | 1,438,500 | |
UPC Holding BV (Netherlands), Sec’d. Notes, 144A(b) | | B2 | | 9.875 | | | 04/15/18 | | | | 11,950 | | | | 12,442,937 | |
Videotron Ltee (Canada),(b)
Gtd. Notes(f) | | Ba2 | | 6.375 | | | 12/15/15 | | | | 4,325 | | | | 4,325,000 | |
Gtd. Notes | | Ba2 | | 6.875 | | | 01/15/14 | | | | 253 | | | | 254,265 | |
Gtd. Notes | | Ba2 | | 9.125 | | | 04/15/18 | | | | 1,900 | | | | 2,109,000 | |
Virgin Media Finance PLC (United Kingdom),(b)
Gtd. Notes(f) | | Ba3 | | 8.375 | | | 10/15/19 | | | | 1,900 | | | | 2,071,000 | |
Gtd. Notes | | Ba3 | | 9.125 | | | 08/15/16 | | | | 975 | | | | 1,042,031 | |
Gtd. Notes, Ser. 1 | | Ba3 | | 9.500 | | | 08/15/16 | | | | 3,350 | | | | 3,752,000 | |
| | | | | | | | | | | | | | | | |
| | | | | | | | | | | | | | | 72,293,761 | |
| | | | | |
Capital Goods 7.1% | | | | | | | | | | | | | | | | |
Actuant Corp., Gtd. Notes | | Ba2 | | 6.875 | | | 06/15/17 | | | | 3,100 | | | | 3,123,250 | |
ALH Finance LLC, Gtd. Notes(f) | | Caa1 | | 8.500 | | | 01/15/13 | | | | 7,725 | | | | 7,763,625 | |
Amsted Industries, Inc., Sr. Notes, 144A | | B1 | | 8.125 | | | 03/15/18 | | | | 3,250 | | | | 3,351,563 | |
Aquilex Holdings LLC/Aquilex Finance Corp., Gtd. Notes, 144A | | B3 | | 11.125 | | | 12/15/16 | | | | 2,375 | | | | 2,348,281 | |
Ashtead Capital, Inc., Sec’d. Notes, 144A(f) | | B2 | | 9.000 | | | 08/15/16 | | | | 6,260 | | | | 6,346,075 | |
Ashtead Holdings PLC (United Kingdom), Sec’d. Notes, 144A(b)(f) | | B2 | | 8.625 | | | 08/01/15 | | | | 3,675 | | | | 3,684,188 | |
Avis Budget Car Rental LLC, Gtd. Notes(a) | | B3 | | 2.876 | | | 05/15/14 | | | | 310 | | | | 276,675 | |
Blount, Inc., Gtd. Notes | | B2 | | 8.875 | | | 08/01/12 | | | | 4,461 | | | | 4,466,576 | |
Columbus McKinnon Corp., Gtd. Notes | | B1 | | 8.875 | | | 11/01/13 | | | | 5,195 | | | | 5,233,962 | |
Diversey Holdings, Inc., Sr. Unsec’d. Notes | | Caa1 | | 10.500 | | | 05/15/20 | | | | 5,643 | | | | 6,309,526 | |
Diversey, Inc., Gtd. Notes | | B3 | | 8.250 | | | 11/15/19 | | | | 2,875 | | | | 2,975,625 | |
See Notes to Financial Statements.
| | |
| 18 | | Visit our website at www.prudentialfunds.com |
| | | | | | | | | | | | | | | | |
| | | Moody’s
Ratings*
(Unaudited) | | Interest
Rate | | Maturity
Date | | | Principal
Amount (000) | | | Value (Note 1) | |
| | | | | | | | | | | | | | | | |
Capital Goods (cont’d.) | | | | | | | | | | | | | | | | |
Hertz Corp. (The), Gtd. Notes | | B2 | | 8.875% | | | 01/01/14 | | | $ | 8,335 | | | $ | 8,564,212 | |
International Wire Group, Inc., Sr. Sec’d. Notes, 144A (original cost $2,624,507; purchased 04/20/10)(c)(e) | | B3 | | 9.750 | | | 04/15/15 | | | | 2,650 | | | | 2,650,000 | |
Marfrig Overseas Ltd. (Cayman Islands), Gtd. Notes, 144A(b)(f) | | B1 | | 9.500 | | | 05/04/20 | | | | 770 | | | | 789,250 | |
NES Rentals Holdings, Inc., Sr. Sec’d. Notes, 144A (original cost $1,981,660; purchased 04/01/10)(c)(e) | | Caa2 | | 12.250 | | | 04/15/15 | | | | 2,000 | | | | 1,630,000 | |
Overseas Shipholding Group, Inc., Sr. Unsec’d. Notes(f) | | Ba3 | | 8.125 | | | 03/30/18 | | | | 3,850 | | | | 3,936,625 | |
RBS Global, Inc. and Rexnord LLC,
Gtd. Notes | | Caa1 | | 8.500 | | | 05/01/18 | | | | 5,525 | | | | 5,566,438 | |
Gtd. Notes(f) | | Caa2 | | 11.750 | | | 08/01/16 | | | | 815 | | | | 872,050 | |
RSC Equipment Rental, Inc.,
Gtd. Notes(f) | | Caa2 | | 10.250 | | | 11/15/19 | | | | 2,050 | | | | 2,132,000 | |
Sr. Sec’d. Notes, 144A | | B1 | | 10.000 | | | 07/15/17 | | | | 2,425 | | | | 2,643,250 | |
Sr. Unsec’d. Notes(f) | | Caa2 | | 9.500 | | | 12/01/14 | | | | 1,130 | | | | 1,152,600 | |
SPX Corp.,
Gtd. Notes, 144A | | Ba1 | | 6.875 | | | 09/01/17 | | | | 4,975 | | | | 5,124,250 | |
Sr. Unsec’d. Notes | | Ba1 | | 7.500 | | | 01/01/13 | | | | 1,750 | | | | 1,797,250 | |
Sr. Unsec’d. Notes | | Ba1 | | 7.625 | | | 12/15/14 | | | | 6,095 | | | | 6,567,362 | |
Stena AB (Sweden), Sr. Unsec’d. Notes(b) | | Ba2 | | 7.000 | | | 12/01/16 | | | | 229 | | | | 220,126 | |
Terex Corp., Sr. Sub. Notes(f) | | Caa1 | | 8.000 | | | 11/15/17 | | | | 5,480 | | | | 5,233,400 | |
Trimas Corp., Sr. Sec’d. Notes, 144A | | B3 | | 9.750 | | | 12/15/17 | | | | 1,875 | | | | 1,935,938 | |
United Rentals North America, Inc., Gtd. Notes | | B3 | | 10.875 | | | 06/15/16 | | | | 4,750 | | | | 5,272,500 | |
| | | | | | | | | | | | | | | | |
| | | | | | | | | | | | | | | 101,966,597 | |
| | | | | |
Chemicals 2.9% | | | | | | | | | | | | | | | | |
CF Industries, Inc.,
Gtd. Notes | | B1 | | 6.875 | | | 05/01/18 | | | | 1,925 | | | | 2,026,063 | |
Gtd. Notes | | B1 | | 7.125 | | | 05/01/20 | | | | 7,425 | | | | 7,963,313 | |
Invista, Gtd. Notes, 144A (original cost $3,941,503; purchased
07/09/09-06/29/10)(c)(e) | | Ba3 | | 9.250 | | | 05/01/12 | | | | 4,077 | | | | 4,122,866 | |
Koppers, Inc., Gtd. Notes | | B1 | | 7.875 | | | 12/01/19 | | | | 2,800 | | | | 2,866,500 | |
LBI Escrow Corp., Sr. Sec’d. Notes, 144A | | Ba3 | | 8.000 | | | 11/01/17 | | | | 5,475 | | | | 5,878,781 | |
Lyondell Chemical Co., Sr. Sec’d. Notes | | B3 | | 11.000 | | | 05/01/18 | | | | 2,950 | | | | 3,204,437 | |
See Notes to Financial Statements.
| | | | |
| Prudential High Yield Fund, Inc. | | | 19 | |
Portfolio of Investments
as of August 31, 2010 continued
| | | | | | | | | | | | | | | | |
| | | Moody’s
Ratings*
(Unaudited) | | Interest
Rate | | Maturity
Date | | | Principal
Amount (000) | | | Value (Note 1) | |
| | | | | | | | | | | | | | | | |
Chemicals (cont’d.) | | | | | | | | | | | | | | | | |
Momentive Performance Materials, Inc., Gtd. Notes(f) | | Caa2 | | 9.750% | | | 12/01/14 | | | $ | 6,675 | | | $ | 6,516,469 | |
Mosaic Co. (The), Sr. Unsec’d. Notes, 144A | | Baa2 | | 7.375 | | | 12/01/14 | | | | 165 | | | | 172,433 | |
Mosaic Global Holdings, Inc., Sr. Unsec’d. Notes | | Baa2 | | 7.300 | | | 01/15/28 | | | | 100 | | | | 118,306 | |
Nova Chemicals Corp. (Canada), Sr. Unsec’d. Notes(b) | | B1 | | 8.375 | | | 11/01/16 | | | | 5,590 | | | | 5,715,775 | |
Solutia, Inc., Gtd. Notes | | B2 | | 7.875 | | | 03/15/20 | | | | 2,800 | | | | 2,926,000 | |
| | | | | | | | | | | | | | | | |
| | | | | | | | | | | | | | | 41,510,943 | |
| | | | | |
Consumer 1.9% | | | | | | | | | | | | | | | | |
Geo Group, Inc. (The), Gtd. Notes, 144A | | B1 | | 7.750 | | | 10/15/17 | | | | 2,100 | | | | 2,163,000 | |
Mac-Gray Corp., Gtd. Notes | | B3 | | 7.625 | | | 08/15/15 | | | | 3,625 | | | | 3,489,062 | |
Mobile Mini, Inc., Gtd. Notes | | B2 | | 6.875 | | | 05/01/15 | | | | 2,635 | | | | 2,509,838 | |
Phillips-Van Heusen Corp., Sr. Unsec’d. Notes(f) | | B2 | | 7.375 | | | 05/15/20 | | | | 2,075 | | | | 2,137,250 | |
Realogy Corp.,
Gtd. Notes | | Ca | | 10.500 | | | 04/15/14 | | | | 7,565 | | | | 6,165,475 | |
Gtd. Notes, PIK | | Ca | | 11.000 | | | 04/15/14 | | | | 319 | | | | 257,565 | |
Sealy Mattress Co., Sr. Sec’d. Notes, 144A | | Ba3 | | 10.875 | | | 04/15/16 | | | | 2,538 | | | | 2,829,870 | |
Service Corp. International, Sr. Unsec’d. Notes | | B1 | | 7.000 | | | 06/15/17 | | | | 2,225 | | | | 2,302,875 | |
Stewart Enterprises, Inc., Gtd. Notes | | Ba3 | | 6.250 | | | 02/15/13 | | | | 3,280 | | | | 3,280,000 | |
Visant Holding Corp., Sr. Notes | | B3 | | 8.750 | | | 12/01/13 | | | | 1,850 | | | | 1,887,000 | |
| | | | | | | | | | | | | | | | |
| | | | | | | | | | | | | | | 27,021,935 | |
| | | | | |
Electric 4.6% | | | | | | | | | | | | | | | | |
AES Corp. (The),
Sr. Sec’d. Notes, 144A | | Ba3 | | 8.750 | | | 05/15/13 | | | | 326 | | | | 331,297 | |
Sr. Unsec’d. Notes | | B1 | | 7.750 | | | 03/01/14 | | | | 2,000 | | | | 2,092,500 | |
Sr. Unsec’d. Notes | | B1 | | 7.750 | | | 10/15/15 | | | | 2,400 | | | | 2,511,000 | |
Sr. Unsec’d. Notes(f) | | B1 | | 8.000 | | | 06/01/20 | | | | 1,550 | | | | 1,627,500 | |
AES Eastern Energy LP, Pass-thru Certs., Ser. 99-A | | Ba2 | | 9.000 | | | 01/02/17 | | | | 7,087 | | | | 7,264,683 | |
Dynegy Roseton/Danskammer, Pass-thru Certs.,
Ser. A | | B3 | | 7.270 | | | 11/08/10 | | | | 23 | | | | 22,676 | |
Ser. B | | B3 | | 7.670 | | | 11/08/16 | | | | 2,075 | | | | 1,888,250 | |
See Notes to Financial Statements.
| | |
| 20 | | Visit our website at www.prudentialfunds.com |
| | | | | | | | | | | | | | | | |
| | | Moody’s
Ratings*
(Unaudited) | | Interest
Rate | | Maturity
Date | | | Principal
Amount (000) | | | Value (Note 1) | |
| | | | | | | | | | | | | | | | |
Electric (cont’d.) | | | | | | | | | | | | | | | | |
Energy Future Holdings Corp.,
Sr. Sec’d. Notes | | Caa3 | | 9.750% | | | 10/15/19 | | | $ | 3,830 | | | $ | 3,635,612 | |
Sr. Sec’d. Notes, 144A(f) | | Caa3 | | 10.000 | | | 01/15/20 | | | | 2,275 | | | | 2,190,832 | |
Energy Future Intermediate Holding Co. LLC, Sr. Sec’d. Notes(f) | | B+(d) | | 9.750 | | | 10/15/19 | | | | 1,153 | | | | 1,094,481 | |
Ipalco Enterprises, Inc.,
Sr. Sec’d. Notes, 144A | | Ba1 | | 7.250 | | | 04/01/16 | | | | 55 | | | | 57,475 | |
Sr. Sec’d. Notes | | Ba1 | | 8.625 | | | 11/14/11 | | | | 325 | | | | 341,250 | |
Midwest Generation LLC, Pass-thru Certs., Ser. B(f) | | Ba2 | | 8.560 | | | 01/02/16 | | | | 1,225 | | | | 1,194,607 | |
Mirant Americas Generation LLC,
Sr. Unsec’d. Notes | | B3 | | 8.300 | | | 05/01/11 | | | | 550 | | | | 562,375 | |
Sr. Unsec’d. Notes(f) | | B3 | | 8.500 | | | 10/01/21 | | | | 2,200 | | | | 1,985,500 | |
Mirant Corp., 144A(c) | | NR | | 7.400 | | | 07/15/49 | | | | 2,675 | | | | 2,675 | |
Mirant Mid Atlantic LLC, Pass-thru Certs.,
Ser. A | | Ba1 | | 8.625 | | | 06/30/12 | | | | 189 | | | | 193,597 | |
Ser. B | | Ba1 | | 9.125 | | | 06/30/17 | | | | 6,642 | | | | 6,907,544 | |
Mirant North America LLC, Gtd. Notes | | B1 | | 7.375 | | | 12/31/13 | | | | 1,315 | | | | 1,344,588 | |
Nevada Power Co., Genl. Ref. Mtge., Ser. A | | Baa3 | | 8.250 | | | 06/01/11 | | | | 2,465 | | | | 2,594,575 | |
North American Energy Alliance LLC, Sr. Sec’d. Notes, 144A | | | | | | | | | | | | | | | | |
(original cost $3,445,300; purchased 09/22/09)(e) | | Ba3 | | 10.875 | | | 06/01/16 | | | | 3,525 | | | | 3,807,000 | |
NRG Energy, Inc.,
Gtd. Notes | | B1 | | 7.250 | | | 02/01/14 | | | | 5,075 | | | | 5,176,500 | |
Gtd. Notes | | B1 | | 7.375 | | | 02/01/16 | | | | 5,620 | | | | 5,662,150 | |
Gtd. Notes | | B1 | | 7.375 | | | 01/15/17 | | | | 1,230 | | | | 1,239,225 | |
Gtd. Notes, 144A | | B1 | | 8.250 | | | 09/01/20 | | | | 4,850 | | | | 4,880,312 | |
RRI Energy, Inc., Sr. Unsec’d. Notes | | B2 | | 7.875 | | | 06/15/17 | | | | 390 | | | | 359,775 | |
Sierra Pacific Resources, Sr. Unsec’d. Notes | �� | Ba3 | | 6.750 | | | 08/15/17 | | | | 1,364 | | | | 1,407,408 | |
Sithe/Independence Funding Corp., Sr. Sec’d. Notes, Ser. A (original cost $5,080,590; purchased 12/22/08-05/28/10)(c)(e) | | Ba3 | | 9.000 | | | 12/30/13 | | | | 5,305 | | | | 5,466,539 | |
| | | | | | | | | | | | | | | | |
| | | | | | | | | | | | | | | 65,841,926 | |
See Notes to Financial Statements.
| | | | |
| Prudential High Yield Fund, Inc. | | | 21 | |
Portfolio of Investments
as of August 31, 2010 continued
| | | | | | | | | | | | | | | | |
| | | Moody’s
Ratings*
(Unaudited) | | Interest
Rate | | Maturity
Date | | | Principal
Amount (000) | | | Value (Note 1) | |
| | | | | | | | | | | | | | | | |
| | | | | |
Energy - Integrated 0.2% | | | | | | | | | | | | | | | | |
TNK-BP Finance SA (Luxembourg), Gtd. Notes, 144A(b) | | Baa2 | | 7.500% | | | 07/18/16 | | | $ | 2,200 | | | $ | 2,436,500 | |
| | | | | |
Energy - Other 5.8% | | | | | | | | | | | | | | | | |
Cie Generale de Geophysique-Veritas (France),(b)
Gtd. Notes | | Ba3 | | 7.500 | | | 05/15/15 | | | | 2,980 | | | | 2,950,200 | |
Gtd. Notes | | Ba3 | | 7.750 | | | 05/15/17 | | | | 65 | | | | 64,513 | |
Gtd. Notes | | Ba3 | | 9.500 | | | 05/15/16 | | | | 3,535 | | | | 3,729,425 | |
Denbury Resources, Inc.,
Gtd. Notes | | B1 | | 7.500 | | | 12/15/15 | | | | 400 | | | | 412,000 | |
Gtd. Notes | | B1 | | 8.250 | | | 02/15/20 | | | | 483 | | | | 515,603 | |
Gtd. Notes | | B1 | | 9.750 | | | 03/01/16 | | | | 2,875 | | | | 3,169,687 | |
Forest Oil Corp., Gtd. Notes(f) | | B1 | | 7.250 | | | 06/15/19 | | | | 5,650 | | | | 5,657,062 | |
McMoRan Exploration Co., Gtd. Notes | | Caa1 | | 11.875 | | | 11/15/14 | | | | 4,139 | | | | 4,376,992 | |
Newfield Exploration Co.,
Sr. Sub. Notes | | Ba3 | | 6.625 | | | 09/01/14 | | | | 3,158 | | | | 3,229,055 | |
Sr. Sub. Notes | | Ba3 | | 6.625 | | | 04/15/16 | | | | 750 | | | | 776,250 | |
Sr. Sub. Notes | | Ba3 | | 7.125 | | | 05/15/18 | | | | 125 | | | | 130,781 | |
OPTI Canada, Inc. (Canada),(b)
Sr. Sec’d. Notes | | Caa3 | | 7.875 | | | 12/15/14 | | | | 13,775 | | | | 10,606,750 | |
Sr. Sec’d. Notes | | Caa3 | | 8.250 | | | 12/15/14 | | | | 2,825 | | | | 2,203,500 | |
Parker Drilling Co., Gtd. Notes, 144A | | B1 | | 9.125 | | | 04/01/18 | | | | 1,750 | | | | 1,750,000 | |
Petrohawk Energy Corp.,
Gtd. Notes, 144A | | B3 | | 7.250 | | | 08/15/18 | | | | 4,150 | | | | 4,118,875 | |
Gtd. Notes | | B3 | | 7.875 | | | 06/01/15 | | | | 3,420 | | | | 3,548,250 | |
Petroplus Finance Ltd. (Bermuda), 144A(b)
Sec’d. Notes | | B2 | | 7.000 | | | 05/01/17 | | | | 3,300 | | | | 2,805,000 | |
Sr. Sec’d. Notes(f) | | B2 | | 6.750 | | | 05/01/14 | | | | 8,150 | | | | 7,294,250 | |
Pioneer Natural Resources Co.,
Gtd. Notes | | Ba1 | | 5.875 | | | 07/15/16 | | | | 780 | | | | 802,661 | |
Sr. Unsec’d. Notes | | Ba1 | | 6.650 | | | 03/15/17 | | | | 8,415 | | | | 8,785,698 | |
Sr. Unsec’d. Notes | | Ba1 | | 6.875 | | | 05/01/18 | | | | 1,400 | | | | 1,462,940 | |
Sr. Unsec’d. Notes | | Ba1 | | 7.500 | | | 01/15/20 | | | | 4,000 | | | | 4,297,512 | |
Plains Exploration & Production Co.,
Gtd. Notes | | B1 | | 7.625 | | | 06/01/18 | | | | 1,200 | | | | 1,216,500 | |
Gtd. Notes | | B1 | | 7.750 | | | 06/15/15 | | | | 1,635 | | | | 1,659,525 | |
Gtd. Notes(f) | | B1 | | 10.000 | | | 03/01/16 | | | | 1,600 | | | | 1,752,000 | |
See Notes to Financial Statements.
| | |
| 22 | | Visit our website at www.prudentialfunds.com |
| | | | | | | | | | | | | | | | |
| | | Moody’s
Ratings*
(Unaudited) | | Interest
Rate | | Maturity
Date | | | Principal
Amount (000) | | | Value (Note 1) | |
| | | | | | | | | | | | | | | | |
Energy - Other (cont’d.) | | | | | | | | | | | | | | | | |
Range Resources Corp., | | | | | | | | | | | | | | | | |
Gtd. Notes | | Ba3 | | 7.500% | | | 05/15/16 | | | $ | 3,510 | | | $ | 3,650,400 | |
Gtd. Notes | | Ba3 | | 7.500 | | | 10/01/17 | | | | 815 | | | | 851,675 | |
SandRidge Energy, Inc., 144 A
Gtd. Notes(f) | | B3 | | 8.000 | | | 06/01/18 | | | | 1,970 | | | | 1,851,800 | |
Gtd. Notes | | B3 | | 8.750 | | | 01/15/20 | | | | 150 | | | | 142,500 | |
| | | | | | | | | | | | | | | | |
| | | | | | | | | | | | | | | 83,811,404 | |
| | | | | |
Foods 2.0% | | | | | | | | | | | | | | | | |
Aramark Corp., Gtd. Notes | | B3 | | 8.500 | | | 02/01/15 | | | | 3,800 | | | | 3,918,750 | |
Carrols Corp., Gtd. Notes | | B3 | | 9.000 | | | 01/15/13 | | | | 1,055 | | | | 1,060,275 | |
Cott Beverages USA, Inc., Gtd. Notes, 144A | | B3 | | 8.125 | | | 09/01/18 | | | | 1,600 | | | | 1,646,000 | |
Del Monte Corp.,
Gtd. Notes | | Ba3 | | 6.750 | | | 02/15/15 | | | | 1,000 | | | | 1,028,750 | |
Gtd. Notes | | Ba3 | | 7.500 | | | 10/15/19 | | | | 3,425 | | | | 3,630,500 | |
Games Merger Corp., Sr. Notes, 144A | | B3 | | 11.000 | | | 06/01/18 | | | | 1,525 | | | | 1,601,250 | |
Ingles Markets, Inc., Sr. Unsec’d. Notes | | B1 | | 8.875 | | | 05/15/17 | | | | 5,725 | | | | 5,989,781 | |
Michael Foods, Inc., Sr. Notes, 144A(c) | | Caa1 | | 9.750 | | | 07/15/18 | | | | 1,300 | | | | 1,365,000 | |
Smithfield Foods, Inc., Sr. Sec’d. Notes, 144A | | Ba3 | | 10.000 | | | 07/15/14 | | | | 2,205 | | | | 2,461,331 | |
Stater Brothers Holdings, Gtd. Notes | | B2 | | 7.750 | | | 04/15/15 | | | | 550 | | | | 556,875 | |
SUPERVALU, Inc.,
Sr. Unsec’d. Notes | | Ba3 | | 7.500 | | | 05/15/12 | | | | 375 | | | | 387,188 | |
Sr. Unsec’d. Notes(f) | | Ba3 | | 8.000 | | | 05/01/16 | | | | 3,895 | | | | 3,904,738 | |
Tyson Foods, Inc., Gtd. Notes | | Ba3 | | 10.500 | | | 03/01/14 | | | | 1,365 | | | | 1,646,531 | |
| | | | | | | | | | | | | | | | |
| | | | | | | | | | | | | | | 29,196,969 | |
| | | | | |
Gaming 3.7% | | | | | | | | | | | | | | | | |
Buffalo Thunder Development Authority, Sr. Sec’d. Notes, 144A(g) | | NR | | 9.375 | | | 12/15/14 | | | | 615 | | | | 153,750 | |
CCM Merger, Inc., Notes, 144A (original cost $10,775,252; purchased 07/14/05-07/08/10)(e)(f) | | Caa3 | | 8.000 | | | 08/01/13 | | | | 11,885 | | | | 10,815,350 | |
See Notes to Financial Statements.
| | | | |
| Prudential High Yield Fund, Inc. | | | 23 | |
Portfolio of Investments
as of August 31, 2010 continued
| | | | | | | | | | | | | | | | |
| | | Moody’s
Ratings*
(Unaudited) | | Interest
Rate | | Maturity
Date | | | Principal
Amount (000) | | | Value (Note 1) | |
| | | | | | | | | | | | | | | | |
Gaming (cont’d.) | | | | | | | | | | | | | | | | |
Harrah’s Operating Co., Inc.,
Sr. Sec’d. Notes | | CCC(d) | | 10.000% | | | 12/15/18 | | | $ | 2,080 | | | $ | 1,622,400 | |
Sr. Sec’d. Notes(f) | | CCC(d) | | 10.000 | | | 12/15/18 | | | | 1,934 | | | | 1,508,520 | |
Sr. Sec’d. Notes, 144A | | Ca | | 12.750 | | | 04/15/18 | | | | 6,525 | | | | 5,970,375 | |
Marina District Finance Co., Inc., 144A(f)
Sr. Sec’d. Notes | | B2 | | 9.500 | | | 10/15/15 | | | | 2,050 | | | | 2,034,625 | |
Sr. Sec’d. Notes | | B2 | | 9.875 | | | 08/15/18 | | | | 1,500 | | | | 1,496,250 | |
MGM Mirage, Inc.,
Sr. Sec’d. Notes, 144A(f) | | B1 | | 9.000 | | | 03/15/20 | | | | 5,590 | | | | 5,799,625 | |
Sr. Sec’d. Notes | | B1 | | 11.125 | | | 11/15/17 | | | | 2,940 | | | | 3,285,450 | |
Sr. Sec’d. Notes | | B1 | | 13.000 | | | 11/15/13 | | | | 6,155 | | | | 7,109,025 | |
Peninsula Gaming LLC, Gtd. Notes | | B3 | | 10.750 | | | 08/15/17 | | | | 2,210 | | | | 2,320,500 | |
Pinnacle Entertainment, Inc.,
Gtd. Notes | | B1 | | 8.625 | | | 08/01/17 | | | | 1,725 | | | | 1,806,938 | |
Gtd. Notes | | Caa1 | | 8.750 | | | 05/15/20 | | | | 200 | | | | 193,000 | |
Pokagon Gaming Authority, Sr. Notes, 144A (original cost $460,000; purchased 11/13/08)(c)(e) | | B2 | | 10.375 | | | 06/15/14 | | | | 500 | | | | 518,750 | |
Scientific Games International, Inc., Gtd. Notes(f) | | B1 | | 9.250 | | | 06/15/19 | | | | 1,500 | | | | 1,590,000 | |
Station Casinos, Inc.,(g)
Sr. Sub. Notes | | NR | | 6.500 | | | 02/01/14 | | | | 2,930 | | | | 2,930 | |
Sr. Sub. Notes | | NR | | 6.625 | | | 03/15/18 | | | | 1,810 | | | | 4,525 | |
Sr. Sub. Notes | | NR | | 6.875 | | | 03/01/16 | | | | 65 | | | | 8 | |
Sr. Unsec’d. Notes | | NR | | 6.000 | | | 04/01/12 | | | | 134 | | | | 347 | |
Wynn Las Vegas LLC, 144A | | | | | | | | | | | | | | | | |
First Mtge. Bonds | | Ba3 | | 7.750 | | | 08/15/20 | | | | 5,275 | | | | 5,327,750 | |
First Mtge. Bonds | | Ba2 | | 7.875 | | | 11/01/17 | | | | 1,250 | | | | 1,284,375 | |
Yonkers Racing Corp., Sr. Sec’d. Notes, 144A (original cost $1,028,580; purchased 03/30/10)(c)(e) | | B1 | | 11.375 | | | 07/15/16 | | | | 948 | | | | 1,019,100 | |
| | | | | | | | | | | | | | | | |
| | | | | | | | | | | | | | | 53,863,593 | |
| | | | |
Healthcare & Pharmaceutical 10.7% | | | | | | | | | | | | | | |
Accellent, Inc.,
Gtd. Notes | | Caa2 | | 10.500 | | | 12/01/13 | | | | 12,590 | | | | 12,558,525 | |
Sr. Sec’d. Notes | | B1 | | 8.375 | | | 02/01/17 | | | | 1,400 | | | | 1,393,000 | |
See Notes to Financial Statements.
| | |
| 24 | | Visit our website at www.prudentialfunds.com |
| | | | | | | | | | | | | | | | |
| | | Moody’s
Ratings*
(Unaudited) | | Interest
Rate | | Maturity
Date | | | Principal
Amount (000) | | | Value (Note 1) | |
| | | | | | | | | | | | | | | | |
Healthcare & Pharmaceutical (cont’d.) | | | | | | | | | | | | | | |
Alliance Healthcare Services, Inc., Sr. Unsec’d. Notes | | B(d) | | 8.000% | | | 12/01/16 | | | $ | 6,355 | | | $ | 5,886,319 | |
Apria Healthcare Group, Inc., 144A(c)(e)
Sr. Sec’d. Notes (original cost $8,181,911; purchased 05/21/09-07/10/09) | | Ba2 | | 11.250 | | | 11/01/14 | | | | 8,395 | | | | 9,077,094 | |
Sr. Sec’d. Notes (original cost $4,150,261; purchased 08/10/09-08/25/09) | | B1 | | 12.375 | | | 11/01/14 | | | | 4,175 | | | | 4,550,750 | |
Biomet, Inc.,
Gtd. Notes(f) | | B3 | | 10.000 | | | 10/15/17 | | | | 1,900 | | | | 2,061,500 | |
Gtd. Notes, PIK | | B3 | | 10.375 | | | 10/15/17 | | | | 8,275 | | | | 8,999,062 | |
Gtd. Notes(f) | | Caa1 | | 11.625 | | | 10/15/17 | | | | 9,320 | | | | 10,252,000 | |
Capella Healthcare, Inc., Gtd. Notes, 144A (original cost $2,577,114; purchased 06/21/10)(c)(e)(f) | | B3 | | 9.250 | | | 07/01/17 | | | | 2,610 | | | | 2,701,350 | |
Community Health Systems, Inc., Gtd. Notes | | B3 | | 8.875 | | | 07/15/15 | | | | 5,385 | | | | 5,586,937 | |
HCA, Inc.,
Sec’d. Notes | | B2 | | 9.250 | | | 11/15/16 | | | | 2,625 | | | | 2,815,313 | |
Sec’d. Notes, PIK | | B2 | | 9.625 | | | 11/15/16 | | | | 5,367 | | | | 5,762,639 | |
Sr. Unsec’d. Notes | | Caa1 | | 5.750 | | | 03/15/14 | | | | 1,775 | | | | 1,706,219 | |
Sr. Unsec’d. Notes(f) | | Caa1 | | 6.375 | | | 01/15/15 | | | | 5,050 | | | | 4,936,375 | |
Sr. Unsec’d. Notes | | Caa1 | | 7.500 | | | 11/15/95 | | | | 2,850 | | | | 2,169,562 | |
Sr. Unsec’d. Notes, MTN | | Caa1 | | 9.000 | | | 12/15/14 | | | | 4,000 | | | | 4,060,000 | |
Inventiv Health, Inc., Gtd. Notes, 144A | | Caa1 | | 10.000 | | | 08/15/18 | | | | 4,500 | | | | 4,398,750 | |
Mylan, Inc., 144A
Gtd. Notes | | B1 | | 7.625 | | | 07/15/17 | | | | 600 | | | | 619,500 | |
Gtd. Notes | | B1 | | 7.875 | | | 07/15/20 | | | | 4,075 | | | | 4,248,187 | |
Omega Healthcare Investors, Inc.,
Gtd. Notes | | Ba3 | | 7.000 | | | 04/01/14 | | | | 3,925 | | | | 4,003,500 | |
Gtd. Notes | | Ba3 | | 7.000 | | | 01/15/16 | | | | 4,127 | | | | 4,219,858 | |
Radnet Management, Inc., Sr. Unsec’d. Notes, 144A | | Caa1 | | 10.375 | | | 04/01/18 | | | | 7,000 | | | | 6,142,500 | |
Res-Care, Inc., Gtd. Notes | | B1 | | 7.750 | | | 10/15/13 | | | | 9,015 | | | | 9,138,956 | |
Senior Housing Properties Trust,
Sr. Unsec’d. Notes | | Baa3 | | 6.750 | | | 04/15/20 | | | | 300 | | | | 310,125 | |
Sr. Unsec’d. Notes | | Baa3 | | 8.625 | | | 01/15/12 | | | | 10,473 | | | | 10,996,650 | |
Skilled Healthcare Group, Inc., Gtd. Notes(f) | | Caa1 | | 11.000 | | | 01/15/14 | | | | 5,909 | | | | 5,318,100 | |
See Notes to Financial Statements.
| | | | |
| Prudential High Yield Fund, Inc. | | | 25 | |
Portfolio of Investments
as of August 31, 2010 continued
| | | | | | | | | | | | | | | | |
| | | Moody’s
Ratings*
(Unaudited) | | Interest
Rate | | Maturity
Date | | | Principal
Amount (000) | | | Value (Note 1) | |
| | | | | | | | | | | | | | | | |
Healthcare & Pharmaceutical (cont’d.) | | | | | | | | | | | | | | |
Sun Healthcare Group, Inc., Gtd. Notes | | B3 | | 9.125% | | | 04/15/15 | | | $ | 6,350 | | | $ | 6,627,813 | |
Surgical Care Affiliates, Inc., Sr. Sub. Notes, 144A (original cost $4,749,453; purchased 06/21/07-06/24/10)(c)(e) | | Caa1 | | 10.000 | | | 07/15/17 | | | | 5,575 | | | | 5,609,844 | |
Warner Chilcott Co. LLC (Ireland), Gtd. Notes, 144A(b)(f) | | B3 | | 7.750 | | | 09/15/18 | | | | 7,250 | | | | 7,358,750 | |
| | | | | | | | | | | | | | | | |
| | | | | | | | | | | | | | | 153,509,178 | |
| | | | | |
Insurance 0.4% | | | | | | | | | | | | | | | | |
American General Institutional Capital A, Ltd., Gtd. Notes, 144A(f) | | Ba2 | | 7.570 | | | 12/01/45 | | | | 2,825 | | | | 2,542,500 | |
American International Group, Inc., Jr. Sub. Debs.(a) | | Ba2 | | 8.175 | | | 05/15/58 | | | | 550 | | | | 471,625 | |
Sr. Unsec’d. Notes | | A3 | | 5.050 | | | 10/01/15 | | | | 670 | | | | 655,763 | |
Sr. Unsec’d. Notes, MTN | | A3 | | 5.600 | | | 10/18/16 | | | | 2,210 | | | | 2,146,462 | |
| | | | | | | | | | | | | | | | |
| | | | | | | | | | | | | | | 5,816,350 | |
| | | | | |
Lodging & Leisure 1.0% | | | | | | | | | | | | | | | | |
Felcor Lodging LP, Sr. Sec’d. Notes(f) | | B2 | | 10.000 | | | 10/01/14 | | | | 6,575 | | | | 7,018,813 | |
Host Hotels & Resorts LP,
Gtd. Notes(f) | | BB+(d) | | 6.875 | | | 11/01/14 | | | | 740 | | | | 756,650 | |
Gtd. Notes | | Ba1 | | 7.125 | | | 11/01/13 | | | | 1,751 | | | | 1,777,265 | |
Host Marriott LP,
Gtd. Notes, Ser. O | | Ba1 | | 6.375 | | | 03/15/15 | | | | 2,725 | | | | 2,738,625 | |
Royal Caribbean Cruises Ltd. (Liberia), Sr. Unsec’d. Notes(b) | | Ba3 | | 11.875 | | | 07/15/15 | | | | 1,025 | | | | 1,206,937 | |
Starwood Hotels & Resorts Worldwide, Inc., Sr. Unsec’d. Notes(f) | | Ba1 | | 7.875 | | | 10/15/14 | | | | 1,050 | | | | 1,160,250 | |
| | | | | | | | | | | | | | | | |
| | | | | | | | | | | | | | | 14,658,540 | |
| | | | | |
Media & Entertainment 7.7% | | | | | | | | | | | | | | | | |
Allbritton Communications Co., Sr. Unsec’d. Notes | | B2 | | 8.000 | | | 05/15/18 | | | | 2,350 | | | | 2,314,750 | |
AMC Entertainment, Inc.,
Gtd. Notes(f) | | Caa1 | | 8.000 | | | 03/01/14 | | | | 4,415 | | | | 4,370,850 | |
Gtd. Notes | | Caa1 | | 11.000 | | | 02/01/16 | | | | 850 | | | | 898,875 | |
See Notes to Financial Statements.
| | |
| 26 | | Visit our website at www.prudentialfunds.com |
| | | | | | | | | | | | | | | | |
| | | Moody’s
Ratings*
(Unaudited) | | Interest
Rate | | Maturity
Date | | | Principal
Amount (000) | | | Value (Note 1) | |
| | | | | | | | | | | | | | | | |
Media & Entertainment (cont’d.) | | | | | | | | | | | | | | |
Bonten Media Acquisition Co., Gtd. Notes, PIK, 144A | | Caa3 | | 9.000% | | | 06/01/15 | | | $ | 525 | | | $ | 304,407 | |
Cedar Fair LP/Canada’s Wonderland Co./Magnum Management Corp., Gtd. Notes, 144A | | B2 | | 9.125 | | | 08/01/18 | | | | 3,325 | | | | 3,383,187 | |
Clear Channel Communications, Inc.,
Gtd. Notes(f) | | Ca | | 10.750 | | | 08/01/16 | | | | 3,325 | | | | 2,452,188 | |
Sr. Unsec’d. Notes | | Ca | | 4.900 | | | 05/15/15 | | | | 5,000 | | | | 2,687,500 | |
Sr. Unsec’d. Notes | | Ca | | 5.500 | | | 09/15/14 | | | | 2,745 | | | | 1,695,038 | |
Sr. Unsec’d. Notes | | Ca | | 5.500 | | | 12/15/16 | | | | 225 | | | | 111,937 | |
Sr. Unsec’d. Notes(f) | | Ca | | 5.750 | | | 01/15/13 | | | | 2,875 | | | | 2,314,375 | |
Sr. Unsec’d. Notes(f) | | Ca | | 6.875 | | | 06/15/18 | | | | 550 | | | | 269,500 | |
Clear Channel Worldwide Holdings, Inc., Gtd. Notes,
Ser. B | | B2 | | 9.250 | | | 12/15/17 | | | | 2,000 | | | | 2,097,500 | |
CMP Susquehanna Corp., Gtd. Notes | | Caa3 | | 9.875 | | | 05/15/14 | | | | 2,150 | | | | 728,313 | |
CW Media Holdings, Inc. (Canada), Gtd. Notes, PIK, 144A(b) | | B1 | | 13.500 | | | 08/15/15 | | | | 8,024 | | | | 9,097,116 | |
Gray Television, Inc., Sr. Sec’d. Notes(f) | | Caa2 | | 10.500 | | | 06/29/15 | | | | 7,875 | | | | 7,579,687 | |
Inmarsat Finance PLC (United Kingdom), Gtd. Notes, 144A(b) | | Ba2 | | 7.375 | | | 12/01/17 | | | | 775 | | | | 794,375 | |
Intelsat Bermuda Ltd. (Luxembourg), Gtd. Notes(b) | | Caa3 | | 11.250 | | | 02/04/17 | | | | 9,425 | | | | 9,754,875 | |
Intelsat Jackson Holdings SA (Luxembourg), Gtd. Notes, 144A(b)(f) | | B3 | | 8.500 | | | 11/01/19 | | | | 4,050 | | | | 4,282,875 | |
Intelsat Ltd. (Luxembourg), Sr. Unsec’d. Notes(b)(f) | | Caa3 | | 7.625 | | | 04/15/12 | | | | 1,000 | | | | 1,017,500 | |
Intelsat Subsidiary Holding Co. SA (Bermuda), (b)
Gtd. Notes, 144A | | B3 | | 8.875 | | | 01/15/15 | | | | 630 | | | | 647,325 | |
Gtd. Notes | | B3 | | 8.875 | | | 01/15/15 | | | | 1,890 | | | | 1,951,425 | |
Lamar Media Corp., Gtd. Notes | | Ba3 | | 9.750 | | | 04/01/14 | | | | 1,900 | | | | 2,128,000 | |
Lin Television Corp., Gtd. Notes, Ser. B | | B3 | | 6.500 | | | 05/15/13 | | | | 3,000 | | | | 2,932,500 | |
Gtd. Notes(f) | | B3 | | 6.500 | | | 05/15/13 | | | | 1,385 | | | | 1,367,687 | |
See Notes to Financial Statements.
| | | | |
| Prudential High Yield Fund, Inc. | | | 27 | |
Portfolio of Investments
as of August 31, 2010 continued
| | | | | | | | | | | | | | | | |
| | | Moody’s
Ratings*
(Unaudited) | | Interest
Rate | | Maturity
Date | | | Principal
Amount (000) | | | Value (Note 1) | |
| | | | | | | | | | | | | | | | |
Media & Entertainment (cont’d.) | | | | | | | | | | | | | | |
MediaNews Group, Inc., Sr. Sub. Notes | | | | | | | | | | | | | | | | |
(original cost $2,448,196; purchased 04/19/04-05/19/04)(c)(e)(g) | | NR | | 6.875 | | | 10/01/13 | | | $ | 2,450 | | | $ | 245 | |
Morris Publishing Group LLC, Sec’d. Notes | | NR | | 10.000% | | | 09/01/14 | | | | 499 | | | | 475,135 | |
Nielsen Finance LLC, Gtd. Notes | | Caa1 | | 10.000 | | | 08/01/14 | | | | 2,900 | | | | 3,045,000 | |
Rainbow National Services LLC, Gtd. Notes, 144A | | B1 | | 10.375 | | | 09/01/14 | | | | 235 | | | | 243,812 | |
Salem Communications Corp., Sr. Sec’d. Notes | | B2 | | 9.625 | | | 12/15/16 | | | | 2,751 | | | | 2,864,479 | |
Sinclair Broadcast Group, Inc., Gtd. Notes(f) | | B3 | | 8.000 | | | 03/15/12 | | | | 8,300 | | | | 8,300,000 | |
Sinclair Television Group, Inc., Sec’d. Notes, 144A | | B1 | | 9.250 | | | 11/01/17 | | | | 4,125 | | | | 4,248,750 | |
SSI Investments II/SSI Co.-Issuer LLC, Gtd. Notes, 144A | | Caa1 | | 11.125 | | | 06/01/18 | | | | 11,150 | | | | 11,651,750 | |
Sun Media Corp. (Canada), Gtd. Notes(b) | | Ba2 | | 7.625 | | | 02/15/13 | | | | 400 | | | | 400,000 | |
Universal City Development Partners Ltd., 144A(e)
Gtd. Notes | | | | | | | | | | | | | | | | |
(original cost $1,186,500; purchased 10/28/09) | | B3 | | 8.875 | | | 11/15/15 | | | | 1,200 | | | | 1,218,000 | |
Gtd. Notes | | | | | | | | | | | | | | | | |
(original cost $839,766; purchased 10/27/09) | | B3 | | 10.875 | | | 11/15/16 | | | | 850 | | | | 907,375 | |
Univision Communications, Inc., Gtd. Notes, PIK, 144A | | Caa2 | | 9.750 | | | 03/15/15 | | | | 8,337 | | | | 7,503,736 | |
WMG Acquisition Corp., Sr. Sec’d. Notes | | Ba2 | | 9.500 | | | 06/15/16 | | | | 4,625 | | | | 4,833,125 | |
| | | | | | | | | | | | | | | | |
| | | | | | | | | | | | | | | 110,873,192 | |
Metals 1.9% | | | | | | | | | | | | | | | | |
Aleris International, Inc., Gtd. Notes(g) | | NR | | 9.000 | | | 12/15/14 | | | | 1,050 | | | | 2,100 | |
Blaze Recycling & Metals LLC, Sr. Sec’d. Notes, Ser. AI, PIK | | NR | | 13.000 | | | 07/15/12 | | | | 46 | | | | 37,979 | |
FMG Finance Pty Ltd. (Australia), 144A(b)
Sr. Sec’d. Notes | | B2 | | 10.000 | | | 09/01/13 | | | | 1,333 | | | | 1,467,966 | |
Sr. Sec’d. Notes | | B2 | | 10.625 | | | 09/01/16 | | | | 6,010 | | | | 6,964,088 | |
Metals USA, Inc., Sr. Sec’d. Notes(f) | | B3 | | 11.125 | | | 12/01/15 | | | | 9,067 | | | | 9,588,353 | |
See Notes to Financial Statements.
| | |
| 28 | | Visit our website at www.prudentialfunds.com |
| | | | | | | | | | | | | | | | |
| | | Moody’s
Ratings*
(Unaudited) | | Interest
Rate | | Maturity
Date | | | Principal
Amount (000) | | | Value (Note 1) | |
| | | | | | | | | | | | | | | | |
Metals (cont’d.) | | | | | | | | | | | | | | | | |
Novelis, Inc. (Canada), Gtd. Notes(b)(f) | | B1 | | 7.250% | | | 02/15/15 | | | $ | 6,150 | | | $ | 6,165,375 | |
Penn Virginia Resource Partners LP, Gtd. Notes | | B2 | | 8.250 | | | 04/15/18 | | | | 1,750 | | | | 1,767,500 | |
Teck Resources Ltd. (Canada), Sr. Sec’d. Notes(b)(f) | | Baa3 | | 10.750 | | | 05/15/19 | | | | 985 | | | | 1,223,862 | |
| | | | | | | | | | | | | | | | |
| | | | | | | | | | | | | | | 27,217,223 | |
| | | | | |
Non Captive Finance 4.6% | | | | | | | | | | | | | | | | |
Ally Financial, Inc., Gtd. Notes, 144A(f) | | B3 | | 7.500 | | | 09/15/20 | | | | 2,075 | | | | 2,054,250 | |
American General Finance Corp., MTN
Sr. Unsec’d. Notes, Ser. H(f) | | B3 | | 5.375 | | | 10/01/12 | | | | 4,450 | | | | 4,049,500 | |
Sr. Unsec’d. Notes | | B3 | | 6.900 | | | 12/15/17 | | | | 8,250 | | | | 6,393,750 | |
CIT Group, Inc.,
Sr. Sec’d. Notes | | B3 | | 7.000 | | | 05/01/13 | | | | 337 | | | | 333,604 | |
Sr. Sec’d. Notes | | B3 | | 7.000 | | | 05/01/14 | | | | 1,805 | | | | 1,757,446 | |
Sr. Sec’d. Notes | | B3 | | 7.000 | | | 05/01/15 | | | | 505 | | | | 485,261 | |
Sr. Sec’d. Notes | | B3 | | 7.000 | | | 05/01/16 | | | | 8,541 | | | | 8,114,304 | |
Sr. Sec’d. Notes(f) | | B3 | | 7.000 | | | 05/01/17 | | | | 9,963 | | | | 9,368,256 | |
GMAC, Inc.,
Gtd. Notes | | B3 | | 6.625 | | | 05/15/12 | | | | 3,400 | | | | 3,459,500 | |
Gtd. Notes, Ser. 8(f) | | B3 | | 6.750 | | | 12/01/14 | | | | 4,250 | | | | 4,218,125 | |
Gtd. Notes, 144A | | B3 | | 8.000 | | | 03/15/20 | | | | 2,275 | | | | 2,331,875 | |
Gtd. Notes, 144A | | B3 | | 8.300 | | | 02/12/15 | | | | 1,000 | | | | 1,040,000 | |
Notes | | B3 | | 6.875 | | | 08/28/12 | | | | 3,575 | | | | 3,655,437 | |
International Lease Finance Corp.,
Sr. Sec’d. Notes, 144A | | Ba3 | | 6.500 | | | 09/01/14 | | | | 2,825 | | | | 2,895,625 | |
Sr. Sec’d. Notes, 144A | | Ba3 | | 6.750 | | | 09/01/16 | | | | 1,100 | | | | 1,124,750 | |
Sr. Sec’d. Notes, 144A(f) | | Ba3 | | 7.125 | | | 09/01/18 | | | | 1,325 | | | | 1,354,813 | |
Sr. Unsec’d. Notes | | B1 | | 4.750 | | | 01/13/12 | | | | 1,600 | | | | 1,560,000 | |
Sr. Unsec’d. Notes, MTN | | B1 | | 5.750 | | | 06/15/11 | | | | 1,925 | | | | 1,922,594 | |
Sr. Unsec’d. Notes(f) | | B1 | | 6.375 | | | 03/25/13 | | | | 3,000 | | | | 2,898,750 | |
Sr. Unsec’d. Notes, 144A | | B1 | | 8.625 | | | 09/15/15 | | | | 495 | | | | 498,094 | |
Sr. Unsec’d. Notes, 144A | | B1 | | 8.750 | | | 03/15/17 | | | | 3,325 | | | | 3,354,094 | |
SLM Corp., Sr. Unsec’d. Notes, MTN | | Ba1 | | 8.000 | | | 03/25/20 | | | | 3,050 | | | | 2,668,750 | |
| | | | | | | | | | | | | | | | |
| | | | | | | | | | | | | | | 65,538,778 | |
See Notes to Financial Statements.
| | | | |
| Prudential High Yield Fund, Inc. | | | 29 | |
Portfolio of Investments
as of August 31, 2010 continued
| | | | | | | | | | | | | | | | |
| | | Moody’s
Ratings*
(Unaudited) | | Interest
Rate | | Maturity
Date | | | Principal
Amount (000) | | | Value (Note 1) | |
| | | | | | | | | | | | | | | | |
Packaging 2.2% | | | | | | | | | | | | | | | | |
Berry Plastics Corp.,
Sec’d. Notes(a) | | Caa1 | | 4.412% | | | 09/15/14 | | | $ | 1,975 | | | $ | 1,661,469 | |
Sec’d. Notes(f) | | Caa1 | | 8.875 | | | 09/15/14 | | | | 4,600 | | | | 4,381,500 | |
Sr. Sec’d. Notes, 144A | | Caa1 | | 9.500 | | | 05/15/18 | | | | 3,175 | | | | 2,921,000 | |
Exopack Holding Corp., Gtd. Notes | | B3 | | 11.250 | | | 02/01/14 | | | | 5,660 | | | | 5,688,300 | |
Graham Packaging Co. LP, Gtd. Notes, 144A | | Caa1 | | 8.250 | | | 01/01/17 | | | | 2,525 | | | | 2,493,437 | |
Graham Packaging Co., Inc., Gtd. Notes(f) | | Caa1 | | 9.875 | | | 10/15/14 | | | | 2,730 | | | | 2,777,775 | |
Greif, Inc., Sr. Unsec’d. Notes | | Ba2 | | 6.750 | | | 02/01/17 | | | | 3,200 | | | | 3,232,000 | |
Owens-Brockway Glass Container, Inc., Gtd. Notes | | Ba3 | | 6.750 | | | 12/01/14 | | | | 250 | | | | 257,500 | |
Plastipak Holdings, Inc., 144A(c)(e)
Sr. Notes | | | | | | | | | | | | | | | | |
(original cost $1,811,250; purchased 03/31/10-05/21/10)(f) | | B3 | | 8.500 | | | 12/15/15 | | | | 1,800 | | | | 1,818,000 | |
Sr. Notes | | | | | | | | | | | | | | | | |
(original cost $1,544,276; purchased 07/23/09) | | B3 | | 10.625 | | | 08/15/19 | | | | 1,580 | | | | 1,753,800 | |
Reynolds Group Escrow LLC, Sr. Sec’d. Notes, 144A | | B1 | | 7.750 | | | 10/15/16 | | | | 3,550 | | | | 3,576,625 | |
Solo Cup Co., Gtd. Notes(f) | | Caa2 | | 8.500 | | | 02/15/14 | | | | 1,371 | | | | 1,158,495 | |
| | | | | | | | | | | | | | | | |
| | | | | | | | | | | | | | | 31,719,901 | |
| | | | | |
Paper 1.6% | | | | | | | | | | | | | | | | |
Cascades, Inc. (Canada), (b)
Gtd. Notes | | Ba3 | | 7.750 | | | 12/15/17 | | | | 1,725 | | | | 1,776,750 | |
Gtd. Notes | | Ba3 | | 7.875 | | | 01/15/20 | | | | 1,500 | | | | 1,541,250 | |
Cellu Tissue Holdings, Inc., Sr. Sec’d. Notes | | B1 | | 11.500 | | | 06/01/14 | | | | 4,675 | | | | 5,066,531 | |
Domtar Corp.,
Gtd. Notes | | Ba2 | | 7.125 | | | 08/15/15 | | | | 313 | | | | 333,345 | |
Sr. Unsec’d. Notes | | Ba2 | | 10.750 | | | 06/01/17 | | | | 800 | | | | 986,000 | |
Georgia-Pacific LLC, Gtd. Notes, 144A | | | | | | | | | | | | | | | | |
(original cost $4,062,549; purchased 04/20/09)(e) | | Ba2 | | 8.250 | | | 05/01/16 | | | | 4,225 | | | | 4,626,375 | |
Graphic Packaging International, Inc., Gtd. Notes(f) | | B3 | | 9.500 | | | 06/15/17 | | | | 3,420 | | | | 3,642,300 | |
See Notes to Financial Statements.
| | |
| 30 | | Visit our website at www.prudentialfunds.com |
| | | | | | | | | | | | | | | | |
| | | Moody’s
Ratings*
(Unaudited) | | Interest
Rate | | Maturity
Date | | | Principal
Amount (000) | | | Value (Note 1) | |
| | | | | | | | | | | | | | | | |
Paper (cont’d.) | | | | | | | | | | | | | | | | |
NewPage Corp., Sr. Sec’d. Notes(f) | | B2 | | 11.375% | | | 12/31/14 | | | $ | 3,400 | | | $ | 2,762,500 | |
PH Glatfelter, Gtd. Notes, 144A | | Ba2 | | 7.125 | | | 05/01/16 | | | | 1,650 | | | | 1,660,313 | |
Rock-Tenn Co., Gtd. Notes | | Ba2 | | 9.250 | | | 03/15/16 | | | | 500 | | | | 548,750 | |
Smurfit Cap Funding PLC (Ireland), Gtd. Notes(b) | | Ba2 | | 7.500 | | | 11/20/25 | | | | 100 | | | | 91,375 | |
| | | | | | | | | | | | | | | | |
| | | | | | | | | | | | | | | 23,035,489 | |
| | | | | |
Pipelines & Other 1.1% | | | | | | | | | | | | | | | | |
Amerigas Partners LP/Amerigas Eagle Finance Corp., Sr. Unsec’d. Notes | | Ba3 | | 7.125 | | | 05/20/16 | | | | 915 | | | | 939,019 | |
El Paso Energy Corp., Notes, Ser. G, MTN | | Ba3 | | 8.050 | | | 10/15/30 | | | | 110 | | | | 112,360 | |
El Paso Corp.,
Notes, Ser. G, MTN | | Ba3 | | 7.800 | | | 08/01/31 | | | | 750 | | | | 754,933 | |
Sr. Unsec’d. Notes | | Ba3 | | 7.000 | | | 05/15/11 | | | | 330 | | | | 338,974 | |
Ferrellgas Partners LP, Sr. Unsec’d. Notes | | B2 | | 8.625 | | | 06/15/20 | | | | 2,350 | | | | 2,426,375 | |
Markwest Energy Partners LP, Gtd. Notes, Ser. B | | B1 | | 8.750 | | | 04/15/18 | | | | 1,415 | | | | 1,514,050 | |
Sonat, Inc., Sr. Unsec’d. Notes | | Ba3 | | 7.625 | | | 07/15/11 | | | | 350 | | | | 363,313 | |
Southern Natural Gas Co., Sr. Unsec’d. Notes | | Baa3 | | 8.000 | | | 03/01/32 | | | | 29 | | | | 34,627 | |
Targa Resources Partners LP,
Gtd. Notes, 144A(f) | | B1 | | 7.875 | | | 10/15/18 | | | | 3,375 | | | | 3,467,813 | |
Gtd. Notes | | B1 | | 8.250 | | | 07/01/16 | | | | 1,125 | | | | 1,170,000 | |
Gtd. Notes | | B1 | | 11.250 | | | 07/15/17 | | | | 4,175 | | | | 4,801,250 | |
| | | | | | | | | | | | | | | | |
| | | | | | | | | | | | | | | 15,922,714 | |
| | | | | |
Real Estate Investment Trust | | | | | | | | | | | | | | | | |
Forest City Enterprises, Inc., Sr. Unsec’d. Notes | | B3 | | 6.500 | | | 02/01/17 | | | | 150 | | | | 125,812 | |
| | | | | |
Retailers 1.7% | | | | | | | | | | | | | | | | |
Neiman Marcus Group, Inc. (The), Gtd. Notes, PIK(f) | | Caa1 | | 9.000 | | | 10/15/15 | | | | 4,317 | | | | 4,370,735 | |
Pantry, Inc. (The), Gtd. Notes | | Caa1 | | 7.750 | | | 02/15/14 | | | | 2,760 | | | | 2,735,850 | |
QVC, Inc., 144A
Sr. Sec’d. Notes | | Ba2 | | 7.125 | | | 04/15/17 | | | | 2,490 | | | | 2,533,575 | |
Sr. Sec’d. Notes | | Ba2 | | 7.375 | | | 10/15/20 | | | | 2,475 | | | | 2,512,125 | |
See Notes to Financial Statements.
| | | | |
| Prudential High Yield Fund, Inc. | | | 31 | |
Portfolio of Investments
as of August 31, 2010 continued
| | | | | | | | | | | | | | | | |
| | | Moody’s
Ratings*
(Unaudited) | | Interest
Rate | | Maturity
Date | | | Principal
Amount (000) | | | Value (Note 1) | |
| | | | | | | | | | | | | | | | |
Retailers (cont’d.) | | | | | | | | | | | | | | | | |
Rite Aid Corp., (f)
Sr. Sec’d. Notes | | Caa2 | | 7.500% | | | 03/01/17 | | | $ | 2,275 | | | $ | 2,056,031 | |
Sr. Sec’d. Notes | | B3 | | 9.750 | | | 06/12/16 | | | | 850 | | | | 903,125 | |
Susser Holdings LLC, Gtd. Notes, 144A | | B2 | | 8.500 | | | 05/15/16 | | | | 4,850 | | | | 4,971,250 | |
Toys “R” US Property Co. LLC, Sr. Sec’d. Notes, 144A | | Ba1 | | 8.500 | | | 12/01/17 | | | | 4,025 | | | | 4,186,000 | |
| | | | | | | | | | | | | | | | |
| | | | | | | | | | | | | | | 24,268,691 | |
| | | | | |
Technology 11.6% | | | | | | | | | | | | | | | | |
Advanced Micro Devices, Inc.,
Sr. Unsec’d. Notes, 144A | | Ba3 | | 7.750 | | | 08/01/20 | | | | 1,500 | | | | 1,485,000 | |
Sr. Unsec’d. Notes(f) | | Ba3 | | 8.125 | | | 12/15/17 | | | | 5,375 | | | | 5,495,938 | |
Avaya, Inc., Gtd. Notes | | Caa2 | | 9.750 | | | 11/01/15 | | | | 16,600 | | | | 15,728,500 | |
Dupont Fabros Technology LP, Gtd. Notes | | Ba2 | | 8.500 | | | 12/15/17 | | | | 6,075 | | | | 6,424,313 | |
Eastman Kodak Co., Sr. Sec’d. Notes, 144A | | Ba3 | | 9.750 | | | 03/01/18 | | | | 2,575 | | | | 2,465,563 | |
First Data Corp., Gtd. Notes(f) | | Caa1 | | 9.875 | | | 09/24/15 | | | | 7,775 | | | | 5,909,000 | |
Freescale Semiconductor, Inc.,
Gtd. Notes(f) | | Caa2 | | 8.875 | | | 12/15/14 | | | | 2,875 | | | | 2,666,562 | |
Sr. Sec’d. Notes, 144A | | B2 | | 9.250 | | | 04/15/18 | | | | 4,350 | | | | 4,360,875 | |
GXS Worldwide, Inc., Sr. Sec’d. Notes, 144A | | B2 | | 9.750 | | | 06/15/15 | | | | 3,875 | | | | 3,720,000 | |
Interactive Data Corp., Gtd. Notes, 144A | | Caa1 | | 10.250 | | | 08/01/18 | | | | 5,879 | | | | 6,062,719 | |
Iron Mountain, Inc., Gtd. Notes | | B2 | | 7.750 | | | 01/15/15 | | | | 250 | | | | 252,500 | |
Lender Processing Services, Inc., Gtd. Notes | | Ba2 | | 8.125 | | | 07/01/16 | | | | 4,785 | | | | 5,119,950 | |
Nortel Networks Ltd. (Canada), (b)(g)
Gtd. Notes | | NR | | 9.003 | | | 07/15/11 | | | | 3,000 | | | | 2,295,000 | |
Gtd. Notes | | NR | | 10.125 | | | 07/15/13 | | | | 2,600 | | | | 2,028,000 | |
Gtd. Notes(f) | | NR | | 10.750 | | | 07/15/16 | | | | 9,790 | | | | 7,660,675 | |
NXP BV / NXP Funding LLC (Netherlands), (b)
Sr. Sec’d. Notes(a)(f) | | Caa1 | | 3.276 | | | 10/15/13 | | | | 900 | | | | 841,500 | |
Sr. Sec’d. Notes | | Caa1 | | 7.875 | | | 10/15/14 | | | | 2,925 | | | | 2,939,625 | |
Sec’d. Notes, 144A | | Caa1 | | 9.750 | | | 08/01/18 | | | | 13,900 | | | | 14,317,000 | |
See Notes to Financial Statements.
| | |
| 32 | | Visit our website at www.prudentialfunds.com |
| | | | | | | | | | | | | | | | |
| | | Moody’s
Ratings*
(Unaudited) | | Interest
Rate | | Maturity
Date | | | Principal
Amount (000) | | | Value (Note 1) | |
| | | | | | | | | | | | | | | | |
Technology (cont’d.) | | | | | | | | | | | | | | | | |
Seagate HDD Cayman (Cayman Islands), Gtd. Notes, 144A(b) | | Ba1 | | 6.875% | | | 05/01/20 | | | $ | 225 | | | $ | 220,500 | |
Seagate Technology HDD Holdings (Cayman Islands), Gtd. Notes(b) | | Ba1 | | 6.375 | | | 10/01/11 | | | | 3,676 | | | | 3,777,090 | |
Seagate Technology International (Cayman Islands), Sec’d. Notes, 144A(b) | | Baa3 | | 10.000 | | | 05/01/14 | | | | 8,395 | | | | 9,801,162 | |
Sensata Technologies BV (Netherlands), Gtd. Notes(b)(f) | | Caa1 | | 8.000 | | | 05/01/14 | | | | 12,651 | | | | 13,062,157 | |
Serena Software, Inc., Gtd. Notes | | Caa1 | | 10.375 | | | 03/15/16 | | | | 1,965 | | | | 1,950,263 | |
STATS ChipPAC Ltd. (Singapore), Gtd. Notes(b) | | Ba1 | | 6.750 | | | 11/15/11 | | | | 1,321 | | | | 1,344,117 | |
SunGard Data Systems, Inc.,
Gtd. Notes | | Caa1 | | 9.125 | | | 08/15/13 | | | | 1,415 | | | | 1,445,069 | |
Gtd. Notes(f) | | Caa1 | | 10.250 | | | 08/15/15 | | | | 9,690 | | | | 10,174,500 | |
Gtd. Notes | | Caa1 | | 10.625 | | | 05/15/15 | | | | 8,590 | | | | 9,491,950 | |
Trans Union LLC/Transunion Financing Corp., Gtd. Notes, 144A | | B3 | | 11.375 | | | 06/15/18 | | | | 7,375 | | | | 8,020,312 | |
Unisys Corp.,
Sr. Sec’d. Notes, 144A | | Ba1 | | 12.750 | | | 10/15/14 | | | | 2,810 | | | | 3,273,650 | |
Sr. Sec’d. Notes, 144A | | Ba2 | | 14.250 | | | 09/15/15 | | | | 3,000 | | | | 3,510,000 | |
Sr. Unsec’d. Notes | | B2 | | 12.500 | | | 01/15/16 | | | | 4,321 | | | | 4,731,495 | |
Wireco Worldgroup, Inc., Sr. Unsec’d. Notes, 144A(f) | | B3 | | 9.500 | | | 05/15/17 | | | | 5,700 | | | | 5,742,750 | |
| | | | | | | | | | | | | | | | |
| | | | | | | | | | | | | | | 166,317,735 | |
| | | | | |
Telecommunications 2.9% | | | | | | | | | | | | | | | | |
Clearwire Communications LLC, 144A
Sr. Sec’d. Notes | | Caa1 | | 12.000 | | | 12/01/15 | | | | 3,250 | | | | 3,258,125 | |
Sr. Sec’d. Notes | | Caa1 | | 12.000 | | | 12/01/15 | | | | 6,590 | | | | 6,590,000 | |
Frontier Communications Corp.,
Sr. Unsec’d. Notes | | Ba2 | | 8.250 | | | 04/15/17 | | | | 1,550 | | | | 1,639,125 | |
Sr. Unsec’d. Notes | | Ba2 | | 8.500 | | | 04/15/20 | | | | 2,000 | | | | 2,122,500 | |
Sr. Unsec’d. Notes | | Ba2 | | 8.750 | | | 04/15/22 | | | | 3,750 | | | | 3,956,250 | |
Hawaiian Telcom Communications, Inc.,(c)(g)
Gtd. Notes, Ser. B | | NR | | 8.765 | | | 05/01/13 | | | | 1,650 | | | | 28,875 | |
Gtd. Notes, Ser. B | | NR | | 12.500 | | | 05/01/15 | | | | 3,740 | | | | 374 | |
See Notes to Financial Statements.
| | | | |
| Prudential High Yield Fund, Inc. | | | 33 | |
Portfolio of Investments
as of August 31, 2010 continued
| | | | | | | | | | | | | | | | |
| | | Moody’s
Ratings*
(Unaudited) | | Interest
Rate | | Maturity
Date | | | Principal
Amount (000) | | | Value (Note 1) | |
| | | | | | | | | | | | | | | | |
Telecommunications (cont’d.) | | | | | | | | | | | | | | | | |
Nextel Communications, Inc.,
Gtd. Notes, Ser. E | | Ba2 | | 6.875% | | | 10/31/13 | | | $ | 950 | | | $ | 947,625 | |
Gtd. Notes, Ser. D | | Ba2 | | 7.375 | | | 08/01/15 | | | | 425 | | | | 420,750 | |
Qwest Communications International, Inc., Gtd. Notes, 144A | | Ba2 | | 7.125 | | | 04/01/18 | | | | 700 | | | | 728,000 | |
Qwest Corp.,
Sr. Unsec’d. Notes | | Baa3 | | 7.500 | | | 10/01/14 | | | | 760 | | | | 846,450 | |
Sr. Unsec’d. Notes | | Baa3 | | 7.625 | | | 06/15/15 | | | | 1,545 | | | | 1,734,262 | |
Sr. Unsec’d. Notes | | Baa3 | | 8.875 | | | 03/15/12 | | | | 1,000 | | | | 1,100,000 | |
SBA Telecommunications, Inc.,
Gtd. Notes(f) | | Ba3 | | 8.000 | | | 08/15/16 | | | | 1,040 | | | | 1,108,900 | |
Gtd. Notes | | Ba3 | | 8.250 | | | 08/15/19 | | | | 1,040 | | | | 1,128,400 | |
Sprint Capital Corp.,
Gtd. Notes | | Ba3 | | 6.875 | | | 11/15/28 | | | | 1,000 | | | | 835,000 | |
Gtd. Notes | | Ba3 | | 6.900 | | | 05/01/19 | | | | 3,300 | | | | 3,102,000 | |
Gtd. Notes | | Ba3 | | 7.625 | | | 01/30/11 | | | | 375 | | | | 381,562 | |
Gtd. Notes | | Ba3 | | 8.375 | | | 03/15/12 | | | | 1,075 | | | | 1,136,813 | |
Sprint Nextel Corp., Sr. Unsec’d. Notes | | Ba3 | | 6.000 | | | 12/01/16 | | | | 1,915 | | | | 1,788,131 | |
Wind Acquisition Finance SA (Luxembourg), Sec’d. Notes, 144A(b) | | B2 | | 11.750 | | | 07/15/17 | | | | 4,400 | | | | 4,840,000 | |
Windstream Corp.,
Gtd. Notes | | Ba3 | | 7.875 | | | 11/01/17 | | | | 610 | | | | 619,150 | |
Gtd. Notes | | Ba3 | | 8.625 | | | 08/01/16 | | | | 3,045 | | | | 3,143,963 | |
| | | | | | | | | | | | | | | | |
| | | | | | | | | | | | | | | 41,456,255 | |
| | | | | | | | | | | | | | | | |
Total corporate bonds | | | | | | | | | | | | | | | 1,262,650,315 | |
| | | | | | | | | | | | | | | | |
| | | | | |
| | | | | | | | | | Shares | | | | |
| | | | | |
COMMON STOCKS 0.2% | | | | | | | | | | | | | | | | |
Adelphia Recovery Trust, 13.00%(c)(h) | | | | | | | | | | | 2,000,000 | | | | 2,000 | |
CenturyLink, Inc. | | | | | | | | | | | 4,018 | | | | 145,291 | |
DEX One Corp.(h) | | | | | | | | | | | 149,207 | | | | 1,271,243 | |
HF Holdings, Inc.(h) | | | | | | | | | | | 4,375 | | | | 44 | |
Mirant Corp.(h) | | | | | | | | | | | 3,283 | | | | 31,845 | |
Neenah Enterprises, Inc.(h) | | | | | | | | | | | 3,902 | | | | 4 | |
Peachtree Cable Assoc. Ltd.(c)(h) | | | | | | | | | | | 31,559 | | | | 315 | |
See Notes to Financial Statements.
| | |
| 34 | | Visit our website at www.prudentialfunds.com |
| | | | | | | | | | | | | | | | | | | | |
| | | | | | | | | | | | Shares | | | Value (Note 1) | |
Sprint Nextel Corp.(h) | | | | | | | | | | | | | | | 28,675 | | | $ | 116,994 | |
WKI Holding Co., Inc.(c)(h) | | | | | | | | | | | | | | | 6,031 | | | | 163,621 | |
Xerox Corp. | | | | | | | | | | | | | | | 169,797 | | | | 1,433,087 | |
Zemex Minerals Group(c)(h) | | | | | | | | | | | | | | | 171 | | | | 2 | |
| | | | | | | | | | | | | | | | | | | | |
Total common stocks | | | | | | | | | | | | | | | | | | | 3,164,446 | |
| | | | | | | | | | | | | | | | | | | | |
| | | | | |
PREFERRED STOCKS | | | | | | | | | | | | | | | | | | | | |
Building Materials & Construction | | | | | | | | | | | | | | | | | | | | |
New Millenium Homes LLC (original cost $0; purchased 05/27/98)(c)(e)(i) | | | | | | | | | | | | | | | 2,000 | | | | 474,000 | |
| | | | | | | | | | | | | | | | | | | | |
Cable | | | | | | | | | | | | | | | | | | | | |
Escrow Pfd Adelphia(c)(h) | | | | | | | | | | | | | | | 20,000 | | | | 20 | |
PTV, Inc., Ser. A, 10.00%(h) | | | | | | | | | | | | | | | 9 | | | | 1 | |
| | | | | | | | | | | | | | | | | | | | |
| | | | | | | | | | | | | | | | | | | 21 | |
| | | | | | | | | | | | | | | | | | | | |
Total preferred stocks | | | | | | | | | | | | | | | | | | | 474,021 | |
| | | | | | | | | | | | | | | | | | | | |
| | | | | |
| | | | | | | | | Expiration
Date | | | | | | | |
WARRANTS(h) | | | | | | | | | | | | | | | | | | | | |
Chemicals | | | | | | | | | | | | | | | | | | | | |
Hercules, Inc. | | | | | | | | | | | 03/31/29 | | | | 230 | | | | 7,736 | |
| | | | | | | | | | | | | | | | | | | | |
Paper | | | | | | | | | | | | | | | | | | | | |
Smurfit Kappa Group PLC (Ireland), 144A, (b)(c) | | | | | | | | | | | 10/01/13 | | | | 275 | | | | 1,465 | |
| | | | | | | | | | | | | | | | | | | | |
Total warrants | | | | | | | | | | | | | | | | | | | 9,201 | |
| | | | | | | | | | | | | | | | | | | | |
Total long-term investments
(cost $1,345,069,504) | | | | | | | | | | | | | | | | | | | 1,375,036,214 | |
| | | | | | | | | | | | | | | | | | | | |
| | | | | |
SHORT-TERM INVESTMENTS 15.9% | | | | | | | | | | | | | | | | | | | | |
| | | | | |
Affiliated Mutual Funds 15.9% | | | | | | | | | | | | | | | | | | | | |
Prudential Investment Portfolios 2—Prudential Core Short-Term Bond Fund(j) | | | | | | | | | | | | | | | 44,356 | | | | 391,661 | |
Prudential Investment Portfolios 2—Prudential Core Taxable Money Market Fund (cost $228,465,999; includes $195,027,540 of cash collateral received for securities on loan)(j)(k) | | | | | | | | | | | | | | | 228,465,999 | | | | 228,465,999 | |
| | | | | | | | | | | | | | | | | | | | |
See Notes to Financial Statements.
| | | | |
| Prudential High Yield Fund, Inc. | | | 35 | |
Portfolio of Investments
as of August 31, 2010 continued
| | | | |
| | | Value (Note 1) | |
Total short-term investments
(cost $228,898,633) | | $ | 228,857,660 | |
| | | | |
Total Investments (l) 111.5%
(cost $1,573,968,137) | | | 1,603,893,874 | |
Liabilities in excess of other assets(m) (11.5)% | | | (165,108,929 | ) |
| | | | |
Net Assets 100.0% | | $ | 1,438,784,945 | |
| | | | |
| * | The ratings reflected are as of August 31, 2010. Ratings of certain bonds may have changed subsequent to that date. |
The following abbreviations are used in portfolio descriptions:
144A—Security was purchased pursuant to Rule 144A under the Securities Act of 1933 and may not be resold subject to that rule except to qualified institutional buyers. Unless otherwise noted, 144A securities are deemed to be liquid.
LLC—Limited Liability Company
LP—Limited Partnership
MTN—Medium Term Note
NR—Not Rated by Moody’s or Standard & Poor’s
PIK—Payment in Kind
| (a) | Floating rate bond. The coupon is indexed to a floating interest rate. The rate shown is the rate at August 31, 2010 |
| (b) | US$ denominated foreign securities. |
| (c) | Indicates a security that has been deemed illiquid. |
| (d) | Standard & Poor’s Rating |
| (e) | Indicates a restricted security; the aggregate original cost of such securities is $66,603,668. The aggregate value of $67,494,938 is approximately 4.7% of net assets. |
| (f) | All or a portion of security is on loan. The aggregate market value of such securities is $189,494,034; cash collateral of $195,027,540 (included in liabilities) was received with which the Fund purchased highly liquid short-term investments. |
| (g) | Represents issuer in default on interest payments and/or principal repayment; non-income producing security. |
| (h) | Non-income producing security. |
| (i) | Consists of more than one class of securities traded together as a unit; generally bonds with attached stocks or warrants. |
| (j) | Prudential Investments LLC, the manager of the Fund, also serves as manager of the Prudential Investment Portfolios 2—Prudential Taxable Money Market Fund and the Prudential Investment Portfolios 2—Prudential Core Short-Term Bond Fund. |
| (k) | Represents security, or a portion thereof, purchased with cash collateral received for securities on loan. |
| (l) | As of August 31, 2010, 15 securities representing $5,302,475 and 0.4% of the net assets were fair valued in accordance with the policies adopted by the Board of Trustees. |
See Notes to Financial Statements.
| | |
| 36 | | Visit our website at www.prudentialfunds.com |
| (m) | Liabilities in excess of other assets include net unrealized appreciation (depreciation) on credit default swap agreements as follows: |
Credit default swap agreements outstanding at August 31, 2010:
| | | | | | | | | | | | | | | | | | | | | | | | | | |
Counterparty | | Termination
Date | | | Notional
Amount#
(000)(3) | | | Fixed
Rate | | | Reference Entity/
Obligation | | Fair
Value | | | Upfront
Premiums
Paid/
(Received) | | | Unrealized
Appreciation/
(Depreciation) | |
Credit Default Swaps on Corporate Issues—Buy Protection(1): | | | | | | | | | | | | |
Barclays Bank, PLC | | | 06/20/19 | | | $ | 2,500 | | | | 5.000 | % | | Sprint Nextel Corp., 6.000%, 12/1/16 | | $ | (140,868 | ) | | $ | (32,821 | ) | | $ | (108,047 | ) |
Deutsche Bank AG | | | 09/20/13 | | | | 2,845 | | | | 1.000 | | | Masco Corp., 6.125%, 10/3/16 | | | 107,334 | | | | 82,167 | | | | 25,167 | |
Goldman Sachs International | | | 06/20/19 | | | | 2,500 | | | | 5.000 | | | Sprint Nextel Corp., 6.000%, 12/1/16 | | | (140,868 | ) | | | (11,885 | ) | | | (128,983 | ) |
JPMorgan Chase Bank | | | 12/20/13 | | | | 5,000 | | | | 3.350 | | | Seagate Techology HDD Holdings,
6.800%, 10/1/16 | | | (169,613 | ) | | | 1,363 | | | | (170,976 | ) |
JPMorgan Chase Bank | | | 12/20/13 | | | | 5,000 | | | | 6.500 | | | Tenet Healthcare Corp., 7.375%, 2/1/13 | | | (312,201 | ) | | | 2,644 | | | | (314,845 | ) |
| | | | | | | | | | | | | | | | | | | | | | | | | | |
| | | | | | | | | | | | | | | | $ | (656,216 | ) | | $ | 41,468 | | | $ | (697,684 | ) |
| | | | | | | | | | | | | | | | | | | | | | | | | | |
| | | | | | | | | | | | | | | | | | | | | | | | | | | | | | |
Counterparty | | Termination
Date | | | Notional
Amount#
(000)(3) | | | Fixed
Rate | | | Reference
Entity/
Obligation | | Implied
Credit
Spread at
August 31,
2010(4)
(unaudited) | | | Fair
Value | | | Upfront
Premiums
Paid/
(Received) | | | Unrealized
Appreciation/
(Depreciation) | |
Credit Default Swaps on Corporate Issues—Sell Protection(2): | | | | | | | | | | | | | | | | |
Deutsche Bank AG | | | 12/20/14 | | | $ | 6,000 | | | | 5.000 | % | | Ford Motor Co., 6.500%, 8/1/18 | | | 5.960 | % | | $ | (151,119 | ) | | $ | (783,333 | ) | | $ | 632,214 | |
Goldman Sachs International | | | 03/20/16 | | | | 1,850 | | | | 4.100 | | | NRG Energy, Inc.,
7.250%, 2/1/14 | | | 5.632 | % | | | (110,942 | ) | | | — | | | | (110,942 | ) |
| | | | | | | | | | | | | | | | | | | | | | | | | | | | | | |
| | | | | | | | | | | | | | | | | | | | $ | (262,061 | ) | | $ | (783,333 | ) | | $ | 521,272 | |
| | | | | | | | | | | | | | | | | | | | | | | | | | | | | | |
| # | Notional amount is shown in U.S. dollars unless otherwise stated. |
| (1) | If the Fund is a buyer of protection, it pays the fixed rate. When a credit event occurs, as defined under the terms of that particular swap agreement, the Fund will either (i) receive from the seller of protection an amount equal to the notional amount of the swap and make delivery of the referenced obligation or underlying securities comprising the referenced index or (ii) receive a net settlement amount in the form of cash or securities equal to the notional amount of the swap less the recovery value of the referenced obligation or underlying securities comprising the referenced index. |
| (2) | If the Fund is a seller of protection, it receives the fixed rate. When a credit event occurs, as defined under the terms of that particular swap agreement, the Fund will either (i) pay to the buyer of protection an amount equal to |
See Notes to Financial Statements.
| | | | |
| Prudential High Yield Fund, Inc. | | | 37 | |
Portfolio of Investments
as of August 31, 2010 continued
| | the notional amount of the swap and take delivery of the referenced obligation or underlying securities comprising the referenced index or (ii) pay a net settlement amount in the form of cash or securities equal to the notional amount of the swap less the recovery value of the referenced obligation or underlying securities comprising the referenced index. |
| (3) | Notional amount represents the maximum potential amount the Fund could be required to pay as a seller of credit protection or receive as a buyer of credit protection if a credit event occurs as defined under the terms of that particular swap agreement. |
| (4) | Implied credit spreads, represented in absolute terms, utilized in determining the fair value of credit default swap agreements on corporate issues or sovereign issues of an emerging country as of period end serve as an indicator of the current status of the payment/performance risk and represent the likelihood or risk of default for the credit derivative. The implied credit spread of a particular referenced entity reflects the cost of buying/selling protection and may include up-front payments required to be made to enter into the agreement. Wider credit spreads represent a deterioration of the referenced entity’s credit soundness and a greater likelihood or risk of default or other credit event occurring as defined under the terms of the agreement. |
Various inputs are used in determining the value of the Fund’s investments. These inputs are summarized in the three broad levels listed below.
Level 1—quoted prices in active markets for identical securities
Level 2—other significant observable inputs (including quoted prices for similar securities, interest rates, prepayment speeds, credit risk, etc.)
Level 3—significant unobservable inputs (including the Portfolio’s own assumptions in determining the fair value of investments)
The following is a summary of the inputs used as of August 31, 2010 in valuing the Fund’s assets carried at fair value:
| | | | | | | | | | | | |
| | | Level 1 | | | Level 2 | | | Level 3 | |
Investments in Securities | | | | | | | | | | | | |
Asset Backed Securities | | $ | — | | | $ | 9,475,631 | | | $ | 4,651,807 | |
Bank Loans | | | — | | | | 78,834,711 | | | | 15,776,082 | |
Corporate Bonds | | | — | | | | 1,262,647,389 | | | | 2,926 | |
Common Stocks | | | 2,998,460 | | | | — | | | | 165,986 | |
Preferred Stocks | | | 1 | | | | — | | | | 474,020 | |
Warrants | | | 1,465 | | | | — | | | | 7,736 | |
Affiliated Mutual Funds | | | 228,857,660 | | | | — | | | | — | |
Other Financial Instruments* | | | | | | | | | | | | |
Credit Default Swap Agreements | | | — | | | | (176,412 | ) | | | — | |
| | | | | | | | | | | | |
Total | | $ | 231,857,586 | | | $ | 1,350,781,319 | | | $ | 21,078,557 | |
| | | | | | | | | | | | |
See Notes to Financial Statements.
| | |
| 38 | | Visit our website at www.prudentialfunds.com |
The following is a reconciliation of assets in which significant unobservable inputs (Level 3) were used in determining fair value:
| | | | | | | | | | | | | | | | | | | | | | | | |
| | | Asset
Backed
Securities | | | Bank
Loans | | | Corporate
Bonds | | | Common
Stocks | | | Preferred
Stocks | | | Warrants | |
Balance as of 8/31/09 | | $ | 1,179,113 | | | $ | 17,036,662 | | | $ | 41,317 | | | $ | 55,391 | | | $ | 314,020 | | | $ | 7,976 | |
Realized gain (loss) | | | — | | | | 187,407 | | | | — | | | | — | | | | — | | | | (3,521,438 | ) |
Change in unrealized appreciation (depreciation)** | | | 3,490,031 | | | | 461,556 | | | | 13,966 | | | | 109,771 | | | | 160,000 | | | | 3,521,198 | |
Purchases | | | — | | | | 5,389,737 | | | | — | | | | 44 | | | | — | | | | — | |
Sales | | | (174,009 | ) | | | (1,384,788 | ) | | | (54,381 | ) | | | — | | | | — | | | | — | |
Accrued discount/premium | | | 156,672 | | | | 190,508 | | | | 1,779 | | | | — | | | | — | | | | — | |
Transfers into Level 3 | | | — | | | | — | | | | 245 | | | | 780 | | | | — | | | | — | |
Transfers out of Level 3 | | | — | | | | (6,105,000 | ) | | | — | | | | — | | | | — | | | | — | |
| | | | | | | | | | | | | | | | | | | | | | | | |
Balance as of 8/31/2010 | | $ | 4,651,807 | | | $ | 15,776,082 | | | $ | 2,926 | | | $ | 165,986 | | | $ | 474,020 | | | $ | 7,736 | |
| | | | | | | | | | | | | | | | | | | | | | | | |
| * | Other financial instruments are derivative instruments not reflected in the Portfolio of Investments, such as futures, forwards and swap contracts, which are valued at the unrealized appreciation/depreciation on the instrument. |
| ** | Of which, 4,352,781 was included in Net Assets relating to securities held at the reporting period end. |
It is the Fund’s policy to recognize transfers in and transfers out at the fair value as of the beginning of period.
The industry classification of portfolio holdings and liabilities in excess of other assets shown as a percentage of net assets as of August 31, 2010 were as follows:
| | | | |
Affiliated Mutual Funds (including 13.6% of collateral received for securities on loan) | | | 15.9 | % |
Technology | | | 13.3 | |
Healthcare & Pharmaceutical | | | 11.6 | |
Media & Entertainment | | | 7.7 | |
Capital Goods | | | 7.2 | |
Cable | | | 6.1 | |
Electric | | | 5.8 | |
Energy—Other | | | 5.8 | |
Non Captive Finance | | | 4.6 | |
Gaming | | | 3.9 | |
Automotive | | | 3.4 | |
Telecommunications | | | 3.0 | |
Chemicals | | | 2.9 | |
See Notes to Financial Statements.
| | | | |
| Prudential High Yield Fund, Inc. | | | 39 | |
Portfolio of Investments
as of August 31, 2010 continued
| | | |
Foods | | 2.3 | % |
Consumer | | 2.2 | |
Packaging | | 2.2 | |
Metals | | 1.9 | |
Retailers | | 1.7 | |
Paper | | 1.6 | |
Banking | | 1.4 | |
Building Materials & Construction | | 1.4 | |
Pipelines & Other | | 1.3 | |
Aerospace & Defense | | 1.2 | |
Asset Backed Securities | | 1.0 | |
Lodging & Leisure | | 1.0 | |
Insurance | | 0.4 | |
Airlines | | 0.3 | |
Common Stocks | | 0.2 | |
Energy—Integrated | | 0.2 | |
| | | |
| | 111.5 | |
Liabilities in excess of other assets | | (11.5 | ) |
| | | |
Net Assets | | 100.0 | % |
| | | |
The Fund invested in various derivative instruments during the reporting period. The primary types of risk associated with these derivative instruments are commodity risk, credit risk, equity risk, foreign exchange risk and interest rate risk. The effect of such derivative instruments on the Fund’s financial position and financial performance as reflected in the Statement of Assets and Liabilities and Statement of Operations is presented in the summary below.
Fair values of derivative Instruments as of August 31, 2010 as presented in the Statement of Assets and Liabilities:
| | | | | | | | | | |
Derivatives not designated
as hedging instruments,
carried at fair value | | Asset Derivatives | | Liability Derivatives |
| | Balance
Sheet Location | | Fair
Value | | Balance
Sheet Location | | Fair
Value |
| Credit contracts | | Unrealized appreciation on swap agreements | | $ | 657,381 | | Unrealized depreciation on swap agreements | | $ | 833,793 |
| Credit contracts | | Premium paid for swap agreements | | | 86,174 | | Premium received for swap agreements | | | 828,039 |
| Equity contracts | | Unaffiliated Investments | | | 9,201 | | — | | | — |
| | | | | | | | | | |
Total | | | | | 752,756 | | | | $ | 1,661,832 |
| | | | | | | | | | |
See Notes to Financial Statements.
| | |
| 40 | | Visit our website at www.prudentialfunds.com |
The effects of derivative instruments on the Statement of Operations for the year ended August 31, 2010 are as follows:
| | | | | | | | | | | | |
Amount of Realized Gain or (Loss) on Derivatives Recognized in Income | |
Derivatives not designated as hedging
instruments, carried at fair value | | Warrants | | | Swaps | | | Total | |
Credit contracts | | $ | — | | | $ | (2,428,947 | ) | | $ | (2,428,947 | ) |
Equity contracts | | | (3,521,441 | ) | | | — | | | | (3,521,441 | ) |
| | | | | | | | | | | | |
Total | | $ | (3,521,441 | ) | | $ | (2,428,947 | ) | | $ | (5,950,388 | ) |
| | | | | | | | | | | | |
|
Change in Unrealized Appreciation or (Depreciation) on Derivatives Recognized in Income | |
Derivatives not designated as hedging
instruments, carried at fair value | | Warrants | | | Swaps | | | Total | |
Credit contracts | | $ | — | | | $ | 1,097,414 | | | $ | 1,097,414 | |
Equity contracts | | | 3,521,574 | | | | — | | | | 3,521,574 | |
| | | | | | | | | | | | |
Total | | $ | 3,521,574 | | | $ | 1,097,414 | | | $ | 4,618,988 | |
| | | | | | | | | | | | |
For the year ended August 31, 2010, the Portfolio’s average notional amount for credit default swaps as buyer was $26,826,000 and the average notional amount for credit default swaps as writer was $18,028,000.
See Notes to Financial Statements.
| | |
| Prudential High Yield Fund, Inc. | | 41 |
Statement of Assets and Liabilities
as of August 31, 2010
| | | | |
Assets | | | | |
Investments, at value, including securities on loan of $189,494,034: | | | | |
Unaffiliated Investments (cost $1,345,069,504) | | $ | 1,375,036,214 | |
Affiliated Investments (cost $228,898,633) | | | 228,857,660 | |
Cash | | | 1,732,642 | |
Dividends and interest receivable | | | 28,973,465 | |
Receivable for investments sold | | | 22,867,413 | |
Receivable for Fund shares sold | | | 2,300,801 | |
Unrealized appreciation on swap agreements | | | 657,381 | |
Premium paid for swap agreements | | | 86,174 | |
Prepaid expenses | | | 34,517 | |
| | | | |
Total assets | | | 1,660,546,267 | |
| | | | |
| |
Liabilities | | | | |
Payable to broker for collateral for securities on loan (Note 3) | | | 195,027,540 | |
Payable for investments purchased | | | 19,573,518 | |
Income distribution payable | | | 2,844,406 | |
Payable for Fund shares reacquired | | | 1,118,144 | |
Unrealized depreciation on swap agreements | | | 833,793 | |
Premium received for swap agreements | | | 828,039 | |
Management fee payable | | | 575,258 | |
Accrued expenses | | | 394,876 | |
Distribution fee payable | | | 376,713 | |
Affiliated transfer agent fee payable | | | 117,084 | |
Deferred directors’ fees | | | 71,951 | |
| | | | |
Total liabilities | | | 221,761,322 | |
| | | | |
| |
Net Assets | | $ | 1,438,784,945 | |
| | | | |
| | | | | |
Net assets were comprised of: | | | | |
Common stock, at par | | $ | 2,705,532 | |
Paid-in capital in excess of par | | | 1,595,079,560 | |
| | | | |
| | | 1,597,785,092 | |
Undistributed net investment income | | | 2,841,560 | |
Accumulated net realized loss on investments and foreign currency transactions | | | (191,638,705 | ) |
Net unrealized appreciation on investments | | | 29,796,998 | |
| | | | |
Net assets, August 31, 2010 | | $ | 1,438,784,945 | |
| | | | |
See Notes to Financial Statements.
| | |
| 42 | | Visit our website at www.prudentialfunds.com |
| | | |
Class A | | | |
Net asset value and redemption price per share | | | |
($1,093,442,559 ÷ 205,615,875 shares of common stock issued and outstanding) | | $ | 5.32 |
Maximum sales charge (4.50% of offering price) | | | .25 |
| | | |
Maximum offering price to public | | $ | 5.57 |
| | | |
| |
Class B | | | |
Net asset value, offering price and redemption price per share | | | |
($96,408,690 ÷ 18,148,867 shares of common stock issued and outstanding) | | $ | 5.31 |
| | | |
| |
Class C | | | |
Net asset value, offering price and redemption price per share | | | |
($112,211,859 ÷ 21,129,328 shares of common stock issued and outstanding) | | $ | 5.31 |
| | | |
| |
Class L | | | |
Net asset value, offering price and redemption price per share | | | |
($3,868,128 ÷ 726,816 shares of common stock issued and outstanding) | | $ | 5.32 |
| | | |
| |
Class M | | | |
Net asset value, offering price and redemption price per share | | | |
($4,004,015 ÷ 753,091 shares of common stock issued and outstanding) | | $ | 5.32 |
| | | |
| |
Class R | | | |
Net asset value, offering price and redemption price per share | | | |
($10,441,331 ÷ 1,963,903 shares of common stock issued and outstanding) | | $ | 5.32 |
| | | |
| |
Class X | | | |
Net asset value, offering price and redemption price per share | | | |
($966,263 ÷ 181,829 shares of common stock issued and outstanding) | | $ | 5.31 |
| | | |
| |
Class Z | | | |
Net asset value, offering price and redemption price per share | | | |
($117,442,100 ÷ 22,033,465 shares of common stock issued and outstanding) | | $ | 5.33 |
| | | |
See Notes to Financial Statements.
| | |
| Prudential High Yield Fund, Inc. | | 43 |
Statement of Operations
Year Ended August 31, 2010
| | | | |
Net Investment Income | | | | |
Income | | | | |
Interest | | $ | 130,959,219 | |
Affiliated income from securities loaned, net | | | 419,213 | |
Affiliated dividend income | | | 85,214 | |
Unaffiliated dividends | | | 77,779 | |
| | | | |
Total income | | | 131,541,425 | |
| | | | |
| |
Expenses | | | | |
Management fee | | | 6,454,039 | |
Distribution fee—Class A | | | 2,695,074 | |
Distribution fee—Class B | | | 691,297 | |
Distribution fee—Class C | | | 710,522 | |
Distribution fee—Class L | | | 20,303 | |
Distribution fee—Class M | | | 61,899 | |
Distribution fee—Class R | | | 36,301 | |
Distribution fee—Class X | | | 13,595 | |
Transfer agent’s fee and expenses (including affiliated expense of $767,400) (Note 3) | | | 1,728,000 | |
Custodian’s fees and expenses | | | 267,000 | |
Reports to shareholders | | | 230,000 | |
Registration fees | | | 116,000 | |
Directors’ fees | | | 54,000 | |
Legal fees and expenses | | | 53,000 | |
Audit fee | | | 32,000 | |
Insurance | | | 30,000 | |
Loan interest expense (Note 8) | | | 12,744 | |
Miscellaneous | | | 34,806 | |
| | | | |
Total expenses | | | 13,240,580 | |
| | | | |
Net investment income | | | 118,300,845 | |
| | | | |
| |
Realized And Unrealized Gain (Loss) On Investments And Swaps | | | | |
Net realized gain (loss) on: | | | | |
Investment transactions | | | 67,021,983 | |
Swaps | | | (2,428,947 | ) |
| | | | |
| | | 64,593,036 | |
| | | | |
Net change in unrealized appreciation (depreciation) on: | | | | |
Investments | | | 61,271,669 | |
Swaps | | | 1,097,414 | |
| | | | |
| | | 62,369,083 | |
| | | | |
Net gain on investments transactions | | | 126,962,119 | |
| | | | |
Net Increase In Net Assets Resulting From Operations | | $ | 245,262,964 | |
| | | | |
See Notes to Financial Statements.
| | |
| 44 | | Visit our website at www.prudentialfunds.com |
Statement of Changes in Net Assets
| | | | | | | | |
| | | Year Ended August 31, | |
| | | 2010 | | | 2009 | |
Increase (Decrease) In Net Assets | | | | | | | | |
Operations | | | | | | | | |
Net investment income | | $ | 118,300,845 | | | $ | 98,180,768 | |
Net realized gain (loss) on investments and foreign currency transactions | | | 64,593,036 | | | | (140,079,482 | ) |
Net change in unrealized appreciation (depreciation) of investments | | | 62,369,083 | | | | 78,366,689 | |
| | | | | | | | |
Net increase in net assets resulting from operations | | | 245,262,964 | | | | 36,467,975 | |
| | | | | | | | |
| | |
Dividends from net investment income (Note 1) | | | | | | | | |
Class A | | | (94,845,034 | ) | | | (82,156,858 | ) |
Class B | | | (7,655,583 | ) | | | (7,371,534 | ) |
Class C | | | (7,844,430 | ) | | | (4,830,473 | ) |
Class L | | | (347,748 | ) | | | (392,401 | ) |
Class M | | | (502,297 | ) | | | (866,600 | ) |
Class R | | | (615,743 | ) | | | (154,706 | ) |
Class X | | | (110,530 | ) | | | (201,482 | ) |
Class Z | | | (8,554,194 | ) | | | (3,894,502 | ) |
| | | | | | | | |
| | | (120,475,559 | ) | | | (99,868,556 | ) |
| | | | | | | | |
| | |
Fund share transactions (Net of share conversions) (Note 6) | | | | | | | | |
Net proceeds from shares sold | | | 280,352,636 | | | | 243,591,231 | |
Net asset value of shares issued in connection with merger (Note 7) | | | — | | | | 94,748,911 | |
Net asset value of shares issued in reinvestment of dividends | | | 89,944,437 | | | | 61,590,124 | |
Cost of shares reacquired | | | (320,918,536 | ) | | | (235,096,995 | ) |
| | | | | | | | |
Net increase in net assets from Fund share transactions | | | 49,378,537 | | | | 164,833,271 | |
| | | | | | | | |
| | |
Capital Contributions (Note 6) | | | | | | | | |
Proceeds from regulatory settlement | | | 759,492 | | | | — | |
| | | | | | | | |
Total increase | | | 174,925,434 | | | | 101,432,690 | |
| | |
Net Assets | | | | | | | | |
Beginning of year | | | 1,263,859,511 | | | | 1,162,426,821 | |
| | | | | | | | |
End of year(a) | | $ | 1,438,784,945 | | | $ | 1,263,859,511 | |
| | | | | | | | |
(a) Includes undistributed net investment income of: | | | 2,841,560 | | | $ | 320,748 | |
| | | | | | | | |
See Notes to Financial Statements.
| | | | |
| Prudential High Yield Fund, Inc. | | | 45 | |
Notes to Financial Statements
Prudential High Yield Fund, Inc. (the “Fund”) is registered under the Investment Company Act of 1940, as amended, as a diversified, open-end management investment company. The primary investment objective of the Fund is to maximize current income through investment in a diversified portfolio of high yield fixed income securities which, in the opinion of the Fund’s investment adviser, do not subject the Fund to unreasonable risks. As a secondary investment objective, the Fund seeks capital appreciation but only when consistent with its primary objective. Lower rated or unrated (i.e., high yield) securities are more likely to react to developments affecting market risk (general market liquidity) and credit risk (an issuer’s inability to meet principal and interest payments on its obligations) than are more highly rated securities, which react primarily to movements in the general level of interest rates. The ability of issuers of debt securities held by the Fund to meet their obligations may be affected by economic developments in a specific industry or region.
Note 1. Accounting Policies
The following is a summary of significant accounting policies followed by the Fund in the preparation of its financial statements.
Security Valuation: Securities listed on a securities exchange are valued at the last sale price on such exchange on the day of valuation or, if there was no sale on such day, at the mean between the last reported bid and asked prices, or at the last bid price on such day in the absence of an asked price. Securities traded via NASDAQ are valued at the official closing price provided by NASDAQ. Securities that are actively traded in the over-the-counter market, including listed securities for which the primary market is believed by Prudential Investments LLC (“PI” or “Manager”) in consultation with the subadvisor, to be over-the-counter, are valued at market value using prices provided by an independent pricing agent or principal market maker. Futures contracts and options thereon traded on a commodities exchange or board of trade are valued at the last sale price at the close of trading on such exchange or board of trade or, if there was no sale on the applicable commodities exchange or board of trade on such day, at the mean between the most recently quoted bid and asked prices on such exchange or board of trade or at the last bid price in the absence of an asked price. Certain fixed income securities for which daily market quotations are not readily available may be valued with reference to fixed income securities whose prices are more readily available, pursuant to guidelines established by the Board of Directors. Prices may be obtained from independent pricing services which
| | |
| 46 | | Visit our website at www.prudentialfunds.com |
use information provided by market makers or estimates of market values obtained from yield data relating to investments or securities with similar characteristics. Securities for which reliable market quotations are not readily available, or whose values have been affected by events occurring after the close of the security’s foreign market and before the Fund’s normal pricing time, are valued at fair value in accordance with the Board of Directors’ approved fair valuation procedures. When determining the fair valuation of securities, some of the factors influencing the valuation include, the nature of any restrictions on disposition of the securities; assessment of the general liquidity of the securities; the issuer’s financial condition and the markets in which it does business; the cost of the investment; the size of the holding and the capitalization of issuer; the prices of any recent transactions or bids/offers for such securities or any comparable securities; any available analyst media or other reports or information deemed reliable by the investment adviser regarding the issuer or the markets or industry in which it operates. Using fair value to price securities may result in a value that is different from the security’s most recent closing price and from the price used by other mutual funds to calculate their net asset values.
Investments in open end, non-exchange-traded mutual funds are valued at their net asset value as of the close of the New York Stock Exchange on the date of valuation.
Short-term debt securities of sufficient credit quality which mature in 60 days or less are valued at amortized cost, which approximates market value. The amortized cost method involves valuing a security at its cost on the date of purchase and thereafter assuming a constant amortization to maturity of the difference between the principal amount due at maturity and cost. Short-term debt securities which mature in more than 60 days are valued at current market quotations.
Restricted Securities: The Fund may hold up to 15% of its net assets in illiquid securities, including those which are restricted as to disposition under securities law (“restricted securities”). Restricted securities held by the Fund at the end of the fiscal period may include registration rights under which the Fund may demand registration by the issuer, of which the Fund may bear the cost of such registration. Restricted securities are valued pursuant to the valuation procedures noted above.
Swap Agreements: The Fund may enter into credit default, interest rate, total return and other forms of swap agreements. A swap agreement is an agreement to exchange the return generated by one instrument for the return generated by another instrument. In connection with these agreements, securities may be identified as collateral or received as collateral from the counterparty in accordance with the terms of the respective swap agreements to provide or receive assets of value and serve as recourse in the event of default or bankruptcy/insolvency of either party.
| | | | |
| Prudential High Yield Fund, Inc. | | | 47 | |
Notes to Financial Statements
continued
Interest Rate Swaps: Interest rate swaps represent an agreement between counterparties to exchange cash flows based on the difference between two interest rates, applied to a notional principal amount for a specified period. The Fund is subject to interest rate risk exposure in the normal course of pursuing its investment objectives. The Fund may use interest rate swaps to either maintain its ability to generate steady cash flow by receiving a stream of fixed rate payments or to increase exposure to prevailing market rates by receiving floating rate payments using interest rate swap contracts. The Fund’s maximum risk of loss from counterparty credit risk is the discounted net value of the cash flows to be received from the counterparty over the contract’s remaining life. This risk may be mitigated by having a master netting arrangement between the Fund and the counterparty which may permit the Fund to offset amounts payable by the Fund to the same counterparty against amounts to be received; and by the receipt of collateral from the counterparty by the Fund to cover the Fund’s exposure to the counterparty. However, there is no assurance that such mitigating factors are easily enforceable.
Credit Default Swaps: Credit default swaps involve one party (the protection buyer) making a stream of payments to another party (the protection seller) in exchange for the right to receive a specified payment in the event of a default or as a result of a default (“credit event”) for the referenced party, typically corporate issues or sovereign issues of an emerging country, on its obligation; or in the event of a write-down, principal shortfall, interest shortfall or default of all or part of the referenced entities comprising a credit index.
The Fund is subject to credit risk in the normal course of pursuing its investment objectives. The Fund purchased credit default swaps to provide a measure of protection against defaults of the issuers or to take an active long or short position with respect to the likelihood of a particular issuer’s default. The Fund may use credit default swaps on credit indices to hedge a portfolio of credit default swaps or bonds, which is less expensive than it would be to buy many credit default swaps to achieve a similar effect. The Fund sold protection using credit default swaps to take an active short position with respect to the likelihood of a particular issuer’s default. The Fund’s maximum risk of loss from counterparty credit risk for purchased credit default swaps is the notional value of a credit default swap agreement. This risk may be mitigated by having a master netting arrangement between the Fund and the counterparty which may permit the Fund to offset amounts payable by the Fund to the same counterparty against amounts to be received; and by the receipt of collateral from the counterparty by the Fund to cover the Fund’s exposure to the counterparty. However, there is no assurance that such mitigating factors are easily enforceable.
| | |
| 48 | | Visit our website at www.prudentialfunds.com |
As a seller of protection on credit default swap agreements, a Fund will generally receive from the buyer of protection an agreed upon payment throughout the term of the swap provided that there is no credit event. As the seller, a Fund would effectively increase investment risk to its portfolio because, in addition to its total net assets, a Fund may be subject to investment exposure on the notional amount of the swap.
The maximum amount of the payments that a Fund as a seller of protection could be required to pay under a credit default swap agreement would be equal to the notional amount of the underlying security or index contract as a result of a credit event. These potential amounts will be partially offset by any recovery values of the respective referenced obligations, or net amounts received from the settlement of buy protection credit default swap agreements entered into by the Fund for the same referenced entity or index. As a buyer of protection, the Fund generally receives an amount up to the notional value of the swap if a credit event occurs.
Implied credit spreads, represented in absolute terms, utilized in determining the fair value of credit default swap agreements on corporate issues or sovereign issues of an emerging country as of reporting date are disclosed in the footnotes to the Portfolio of Investments and serve as an indicator of the current status of the payment/performance risk and represent the likelihood of risk of default for the credit derivative. The implied credit spread of a particular referenced entity reflects the cost of buying/selling protection and may include upfront payments required to enter into the agreement. For credit default swap agreements on asset-backed securities and credit indices, the quoted market prices and resulting values serve as the indicator of the current status of the payment/performance risk. Wider credits spreads and increasing market value in absolute terms, when compared to the notional amount of the swap, represent a deterioration of the referenced entity’s credit soundness and a greater likelihood of risk of default or other credit event occurring as defined under the terms of the agreement.
In addition to each instrument’s primary underlying risk exposure (e.g., interest rate, credit, equity or foreign exchanged, etc.), swap agreements involve, to varying degrees, elements of credit, market and documentation risk. Such risks involve the possibility that there will be no liquid market for these agreements, that the counterparty to the agreement may default on its obligation to perform or disagree as to the meaning of the contractual terms in the agreement, and that there will be unfavorable changes in net interest rates. In connection with these agreements, securities in the portfolio may be identified as collateral or received as collateral from the counterparty in accordance with the terms of the respective swap agreements to provide or receive assets of value and serve as recourse in the event of default or bankruptcy/insolvency of either party. Such over-the-counter derivative agreements
| | | | |
| Prudential High Yield Fund, Inc. | | | 49 | |
Notes to Financial Statements
continued
include conditions which when materialized, give the counterparty the right to cause an early termination of the transactions under those agreements. Any election by the counterparty for early termination of the contract(s) may impact the amounts reported on financial statements.
As of August 31, 2010, the Fund has not met conditions under such agreements, which give the counterparty the right to call for an early termination.
Forward Currency Contracts: A forward currency contract is a commitment to purchase or sell a foreign currency at a future date at a negotiated forward rate between two parties. The Fund enters into forward currency contracts in order to hedge its exposure to changes in foreign currency exchange rates on its foreign portfolio holdings or specific receivables and payables denominated in a foreign currency. The contracts are valued daily at current exchange rates and any unrealized gain or loss is included in net unrealized appreciation or depreciation on foreign currencies. Gain or loss is realized on the settlement date of the contract equal to the difference between the settlement value of the original and renegotiated forward contracts. This gain or loss, if any, is included in net realized gain (loss) on foreign currency transactions. Forward currency contracts involve risks from currency exchange rate and credit risk in excess of the amounts reflected on the Statement of Assets and Liabilities. Risks may also arise upon entering into these contracts from the potential inability of the counterparties to meet the terms of their contracts. The Fund’s maximum risk of loss from counterparty credit risk is the net value of the cash flows to be received from the counterparty at the end of the contract’s life. This risk may be mitigated by having a master netting arrangement between the Fund and the counterparty which may permit the Fund to offset amounts payable by the Fund to the same counterparty against amounts to be received; and by the receipt of collateral from the counterparty by the Fund to cover the Fund’s exposure to the counterparty. However, there is no assurance that such mitigating factors are easily enforceable.
Warrants and Rights: The Fund may hold warrants and rights acquired either through a direct purchase, including as part of private placement, or pursuant to corporate actions. Warrants and rights entitle the holder to buy a proportionate amount of common stock at a specific price and time through the expiration dates. Such warrants and rights are held as long positions by the Fund until exercised, sold or expired. Warrants and rights are valued at fair value in accordance with the Board approved fair valuation procedures.
| | |
| 50 | | Visit our website at www.prudentialfunds.com |
Loan Participations: The Fund may invest in loan participations, another type of restricted security. When the Fund purchases a loan participation, the Fund typically enters into a contractual relationship with the lender or third party selling such participations (“Selling Participant”), but not the borrower. As a result, the Fund assumes the credit risk of the borrower, the selling participant and any other persons interpositioned between the Fund and the borrower (“intermediate participants”). The Fund may not directly benefit from the collateral supporting the senior loan in which it has purchased the loan participation.
Foreign Currency Translation: The books and records of the Fund are maintained in U.S. dollars. Foreign currency amounts are translated into U.S. dollars on the following basis:
(i) market value of investment securities, other assets and liabilities at the closing daily rates of exchange;
(ii) purchases and sales of investment securities, income and expenses at the rates of exchange prevailing on the respective dates of such transactions.
Although the net assets of the Fund are presented at the foreign exchange rates and market values at the close of the fiscal period, the Fund does not isolate that portion of the results of operations arising as a result of changes in the foreign exchange rates from the fluctuations arising from changes in the market prices of long-term securities held at the end of the fiscal period. Similarly, the Fund does not isolate the effect of changes in foreign exchange rates from the fluctuations arising from changes in the market prices of long-term portfolio securities sold during the fiscal period. Accordingly, realized foreign currency gains (losses) are included in the reported net realized gains (losses) on investment transactions.
Net realized gains or losses on foreign currency transactions represent net foreign exchange gains or losses from the holding of foreign currencies, currency gains (losses) realized between the trade and settlement dates on security transactions, and the difference between the amounts of dividends, interest and foreign withholding taxes recorded on the Fund’s books and the U.S. dollar equivalent amounts actually received or paid. Net unrealized currency gains (losses) from valuing foreign currency denominated assets and liabilities (other than investments) at period-ended exchange rates are reflected as a component of net unrealized appreciation (depreciation) on investments and foreign currencies.
Foreign security and currency transactions may involve certain considerations and risks not typically associated with those of domestic origin as a result of, among other factors, the possibility of political and economic instability or the level of governmental supervision and regulation of foreign securities markets.
| | |
| Prudential High Yield Fund, Inc. | | 51 |
Notes to Financial Statements
continued
Securities Lending: The Fund may lend its portfolio securities to broker-dealers. The loans are secured by collateral at least equal at all times to the market value of the securities loaned. Loans are subject to termination at the option of the borrower or the Fund. Upon termination of the loan, the borrower will return to the Fund securities identical to the loaned securities. Should the borrower of the securities fail financially, the Fund has the right to repurchase the securities using the collateral in the open market. The Fund recognizes income, net of any rebate and securities lending agent fees, for lending its securities in the form of fees or interest on the investment of any cash received as collateral. The Fund also continues to receive interest and dividends or amounts equivalent thereto, on the securities loaned and recognizes any unrealized gain or loss in the market price of the securities loaned that may occur during the term of the loan.
Securities Transactions and Net Investment Income: Securities transactions are recorded on the trade date. Realized gains and losses on sales of investments are calculated on the identified cost basis. Dividend income is recorded on the ex-dividend date. Interest income, including amortization of premium and accretion of discount on debt securities, as required, is recorded on the accrual basis. Expenses are recorded on the accrual basis which may require the use of certain estimates by management. The Fund amortizes premiums and accretes discounts on purchases of debt securities as adjustments to interest income. Net investment income (loss) (other than distribution fees which are charged directly to the respective class) and unrealized and realized gains and losses are allocated daily to each class of shares based upon the relative proportion of net assets of each class at the beginning of the day.
Taxes: For federal income tax purposes, it is the Fund’s policy to continue to meet the requirements of the Internal Revenue Code applicable to regulated investment companies and to distribute all of its taxable net income and capital gains, if any, to its shareholders. Therefore, no federal income tax provision is required.
Dividends and Distributions: The Fund declares daily and pays dividends of net investment income monthly and makes distributions of net realized capital and currency gains, if any, annually. Dividends and distributions to shareholders, which are determined in accordance with federal income tax regulations and which may differ from generally accepted accounting principles, are recorded on the ex-dividend date. Permanent book/tax differences relating to income and gains are reclassified amongst undistributed net investment income, accumulated net realized gain or loss and paid-in capital in excess of par, as appropriate.
| | |
| 52 | | Visit our website at www.prudentialfunds.com |
Estimates: The preparation of the financial statements requires management to make estimates and assumptions that affect the reported amounts and disclosures in the financial statements. Actual results could differ from those estimates.
Note 2. Agreements
The Fund has a management agreement with PI. Pursuant to this agreement, PI has responsibility for all investment advisory services and supervises the subadvisor’s performance of such services. PI has entered into a subadvisory agreement with Prudential Investment Management, Inc. (“PIM”). The subadvisory agreement provides that PIM will furnish investment advisory services in connection with the management of the Fund. In connection therewith, PIM is obligated to keep certain books and records of the Fund. PI pays for the services of PIM, the cost of compensation of officers of the Fund, occupancy and certain clerical and bookkeeping costs of the Fund. The Fund bears all other costs and expenses.
The management fee paid to PI is accrued daily and payable monthly, at an annual rate of .50% of the Fund’s average daily net assets up to $250 million, .475% of the next $500 million, .45% of the next $750 million, .425% of the next $500 million, .40% of the next $500 million, .375% of the next $500 million and .35% of the Fund’s average daily net assets in excess of $3 billion. The effective management fee rate was .47% for the year ended August 31, 2010.
The Fund has a distribution agreement with Prudential Investment Management Services LLC (“PIMS”), which acts as the distributor of the Class A, Class B, Class C, Class L, Class M, Class R, Class X and Class Z shares of the Fund. The Fund compensates PIMS for distributing and servicing the Fund’s Class A, Class B, Class C, Class L, Class M, Class R and Class X shares, pursuant to plans of distribution (the “Class A, B, C, L, M, R and X Plans”), regardless of expenses actually incurred by PIMS. The distribution fees are accrued daily and payable monthly. No distribution or service fees are paid to PIMS as distributor of the Class Z shares of the Fund.
Pursuant to the Class A, B, C, L, M, R and X Plans, the Fund compensates PIMS for distribution related activities at an annual rate of up to .30%, .75%, 1%, ..50%, 1%, .75% and 1% of the average daily net assets of the Class A, B, C, L, M, R and X shares, respectively.
For the year ended August 31, 2010, PIMS contractually agreed to limit such fees to .25%, .75% and .50% of the average daily net assets of the Class A, Class C and Class R shares, respectively.
| | |
| Prudential High Yield Fund, Inc. | | 53 |
Notes to Financial Statements
continued
PIMS has advised the Fund that it has received $703,374 in front-end sales charges resulting from sales of Class A shares, during the year ended August 31, 2010. From these fees, PIMS paid such sales charges to affiliated broker-dealers, which in turn paid commissions to salespersons and incurred other distribution costs.
PIMS has advised the Fund that for the year ended August 31, 2010, it received $9,018, $130,266, $31,260, $4,947 and $408 in contingent deferred sales charges imposed upon redemptions by certain Class A, Class B, Class C, Class M and Class X shareholders, respectively.
PI, PIMS and PIM are indirect, wholly-owned subsidiaries of Prudential Financial, Inc. (“Prudential”).
Note 3. Other Transactions with Affiliates
Prudential Mutual Fund Services LLC (“PMFS”), an affiliate of PI and an indirect, wholly-owned subsidiary of Prudential, serves as the Fund’s transfer agent. Transfer agent’s fees and expenses on the Statement of Operations include certain out-of-pocket expenses paid to non-affiliates, where applicable. The Fund pays networking fees to affiliated and unaffiliated broker/dealers including fees relating to the services of Wells Fargo Advisors, LLC (“Wells Fargo”) and First Clearing LLC (“First Clearing”) affiliates of PI through December 31, 2009. These networking fees are payments made to broker/dealers that clear mutual fund transactions through a national clearing system. For the year ended August 31, 2010, the Fund incurred approximately $537,400 in total networking fees, of which approximately $58,300 and $11,400 was paid to Wells Fargo and First Clearing, respectively. These amounts are included in transfer agent’s fees and expenses in the Statement of Operations.
Prudential Investment Management, Inc., (“PIM”), an indirect, wholly-owned subsidiary of Prudential, is the Fund’s security lending agent. For the year ended August 31, 2010, PIM has been compensated approximately $147,400 for these services.
The Fund invests in the Prudential Core Short-Term Bond Fund, pursuant to an exemptive order received from the Securities and Exchange Commission and in the Prudential Core Taxable Money Market Fund (the “Core Funds”), each a portfolio of the Prudential Investment Portfolios 2 registered under the Investment Company Act of 1940, as amended, and managed by PI. Earnings from the Fund are disclosed on the Statement of Operations as affiliated dividend income.
| | |
| 54 | | Visit our website at www.prudentialfunds.com |
Note 4. Portfolio Securities
Purchases and sales of investment securities, other than short-term investments, for the year ended August 31, 2010 aggregated $1,232,214,728 and $1,207,589,461, respectively.
Note 5. Distributions and Tax Information
Distributions to shareholders, which are determined in accordance with federal income tax regulations and which may differ from generally accepted accounting principles, are recorded on the ex-dividend date. In order to present undistributed net investment income, accumulated net realized loss on investments and foreign currency transactions and paid-in capital in excess of par on the Statement of Assets and Liabilities that more closely represent their tax character, certain adjustments have been made to undistributed net investment income, accumulated net realized loss on investments and foreign currency transactions and paid-in capital in excess of par. For the year ended August 31, 2010, the adjustments were to increase undistributed net investment income by $4,695,526, decrease accumulated net realized loss on investments and foreign currency transactions by $393,118,604 and to decrease paid-in capital in excess of par by $397,814,130 primarily due to reclassification of foreign currencies, the difference in the treatment of accreting market discount and premium amortization between financial and tax reporting purposes, paydown gain (losses), swaps, write off of capital loss carryforward due to expiration and other book to tax differences. Net investment income, net realized gain and net assets were not affected by this change.
For the year ended August 31, 2010 and the year ended August 31, 2009, the tax character of dividends paid as reflected in the Statement of Changes in Net Assets were $120,475,559 and $99,868,556 of ordinary income, respectively.
As of August 31, 2010, the distributable earnings on a tax basis was $7,941,476 of ordinary income.
The United States federal income tax basis of the Fund’s investments and the net unrealized appreciation as of August 31, 2010 were as follows:
| | | | | | | | | | |
Tax Basis | | Appreciation | | Depreciation | | Net
Unrealized
Appreciation | | Other Cost
Basis
Adjustments | | Total Net
Unrealized
Appreciation |
| $1,582,056,486 | | $85,744,221 | | $(63,906,833) | | $21,837,388 | | $(176,412) | | $21,660,976 |
| | | | |
| Prudential High Yield Fund, Inc. | | | 55 | |
Notes to Financial Statements
continued
The difference between book basis and tax basis is primarily attributable to the deferred losses on wash sales, the difference in the treatment of accreting market discount and premium amortization.
For federal income tax purposes, the Fund had a capital loss carryforward as of August 31, 2010 of approximately $185,814,000, of which $25,551,000 expires in 2013, $25,146,000 expires in 2014, $9,303,000 expires in 2015, $11,341,000 expires in 2016, $48,200,000 expires in 2017 and $66,273,000 expires in 2018. Certain portions of the capital loss carryforwards were assumed by the Fund as a result of acquisitions. Utilization of these capital loss carryforwards may be limited in accordance with income tax regulations. As of August 31, 2010, approximately $397,814,000 of its capital loss carryovers were written-off due to expiration. No capital gains distribution is expected to be paid to shareholders until net gains have been realized in excess of such amounts. It is uncertain whether the Fund will be able to realize the full benefit prior to the expiration dates.
Management has analyzed the Fund’s tax positions taken on federal income tax returns for all open tax years and has concluded that as of August 31, 2010, no provision for income tax would be required in the Fund’s financial statements. The Fund’s federal and state income and federal excise tax returns for tax years for which the applicable statutes of limitations have not expired are subject to examination by the Internal Revenue Service and state departments of revenue.
Note 6. Capital
The Fund offers Class A, Class B, Class C, Class L, Class M, Class R, Class X and Class Z shares. Class A and Class L shares are sold with a front-end sales charge of up to 4.50% and 4.25%, respectively. Investors who purchase $1 million or more of Class A or Class L shares and redeem those shares within 12 months of purchase are subject to a contingent deferred sales charge (CDSC) of 1%, but are not subject to an initial sales charge. A special exchange privilege is also available for shareholders who qualified to purchase Class A shares at net asset value. Class B shares are sold with a CDSC which declines from 5% to zero depending on the period of time the shares are held. Class B shares will automatically convert to Class A shares on a quarterly basis approximately seven years after purchase. Class C shares are sold with a CDSC of 1% during the first 12 months. Class M and Class X shares are sold with a CDSC that declines from 6% to zero depending on the period of time the shares are held. Class M
| | |
| 56 | | Visit our website at www.prudentialfunds.com |
shares will automatically convert to Class A shares approximately eight years after purchase. Class X shares will automatically convert to Class A shares approximately 10 years after purchase. Class L, Class M and Class X shares are not offered to new purchasers and are only available through exchange from the same class of shares offered by certain Prudential funds. Class R and Class Z shares are not subject to any sales or redemption charges and are available only to a limited group of investors.
For the year ended August 31, 2010, the Fund received $759,492 related to an affiliate’s settlement of regulatory proceedings involving allegations of improper trading. This amount is presented in the Fund Statement of Changes in Net Assets. The Fund was not involved in the proceedings or the calculation of the payment.
The Fund is authorized to issue 3 billion shares of common stock, $.01 par value per share, divided into nine classes, designated Class A, Class B, Class C, Class L, Class M, Class R, Class X, Class New X and Class Z common stock. Of the authorized shares of common stock of the Fund, 500 million shares are designated Class A common stock, 400 million shares are designated for each of Class B common stock, Class C common stock, Class L common stock, Class M common stock and 225 million shares are designated for each of Class R common stock, Class X common stock, Class New X common stock and Class Z common stock. Transactions in shares of common stock were as follows:
| | | | | | | | |
Class A | | Shares | | | Amount | |
Year ended August 31, 2010: | | | | | | | | |
Shares sold | | | 24,467,434 | | | $ | 127,953,682 | |
Shares issued in reinvestment of dividends | | | 13,303,087 | | | | 69,497,755 | |
Shares reacquired | | | (43,707,622 | ) | | | (228,160,470 | ) |
| | | | | | | | |
Net increase (decrease) in shares outstanding before conversion | | | (5,937,101 | ) | | | (30,709,033 | ) |
Shares issued upon conversion from Class B, Class M and Class X | | | 2,999,137 | | | | 15,388,225 | |
| | | | | | | | |
Net increase (decrease) in shares outstanding | | | (2,937,964 | ) | | $ | (15,320,808 | ) |
| | | | | | | | |
Year ended August 31, 2009: | | | | | | | | |
Shares sold | | | 27,321,353 | | | $ | 116,871,795 | |
Shares issued in connection with the merger | | | 20,823,936 | | | | 94,748,911 | |
Shares issued in reinvestment of dividends | | | 11,606,660 | | | | 49,649,141 | |
Shares reacquired | | | (41,028,571 | ) | | | (177,108,373 | ) |
| | | | | | | | |
Net increase (decrease) in shares outstanding before conversion | | | 18,723,378 | | | | 84,161,474 | |
Shares issued upon conversion from Class B, Class M and Class X | | | 5,822,365 | | | | 25,411,406 | |
| | | | | | | | |
Net increase (decrease) in shares outstanding | | | 24,545,743 | | | $ | 109,572,880 | |
| | | | | | | | |
| | | | |
| Prudential High Yield Fund, Inc. | | | 57 | |
Notes to Financial Statements
continued
| | | | | | | |
Class B | | Shares | | | Amount | |
Year ended August 31, 2010: | | | | | | | |
Shares sold | | 5,910,395 | | | $ | 30,769,404 | |
Shares issued in reinvestment of dividends | | 1,082,663 | | | | 5,648,531 | |
Shares reacquired | | (4,307,006 | ) | | | (22,384,277 | ) |
| | | | | | | |
| | |
Net increase (decrease) in shares outstanding before conversion | | 2,686,052 | | | | 14,033,658 | |
Shares reacquired upon conversion into Class A | | (2,271,193 | ) | | | (11,600,474 | ) |
| | | | | | | |
Net increase (decrease) in shares outstanding | | 414,859 | | | $ | 2,433,184 | |
| | | | | | | |
Year ended August 31, 2009: | | | | | | | |
Shares sold | | 4,452,347 | | | $ | 19,471,215 | |
Shares issued in reinvestment of dividends | | 987,286 | | | | 4,211,358 | |
Shares reacquired | | (3,965,087 | ) | | | (16,981,593 | ) |
| | | | | | | |
Net increase (decrease) in shares outstanding before conversion | | 1,474,546 | | | | 6,700,980 | |
Shares reacquired upon conversion into Class A | | (4,791,122 | ) | | | (21,022,145 | ) |
| | | | | | | |
Net increase (decrease) in shares outstanding | | (3,316,576 | ) | | $ | (14,321,165 | ) |
| | | | | | | |
Class C | | | | | | |
Year ended August 31, 2010: | | | | | | | |
Shares sold | | 8,329,691 | | | $ | 43,486,953 | |
Shares issued in reinvestment of dividends | | 1,197,357 | | | | 6,251,959 | |
Shares reacquired | | (4,367,656 | ) | | | (22,688,976 | ) |
| | | | | | | |
Net increase (decrease) in shares outstanding | | 5,159,392 | | | $ | 27,049,936 | |
| | | | | | | |
Year ended August 31, 2009: | | | | | | | |
Shares sold | | 8,308,346 | | | $ | 36,176,062 | |
Shares issued in reinvestment of dividends | | 723,260 | | | | 3,111,084 | |
Shares reacquired | | (2,641,420 | ) | | | (11,285,037 | ) |
| | | | | | | |
Net increase (decrease) in shares outstanding | | 6,390,186 | | | $ | 28,002,109 | |
| | | | | | | |
Class L | | | | | | |
Year ended August 31, 2010: | | | | | | | |
Shares sold | | 104,691 | | | $ | 548,617 | |
Shares issued in reinvestment of dividends | | 52,677 | | | | 274,950 | |
Shares reacquired | | (286,305 | ) | | | (1,498,731 | ) |
| | | | | | | |
Net increase (decrease) in shares outstanding | | (128,937 | ) | | $ | (675,164 | ) |
| | | | | | | |
Year ended August 31, 2009: | | | | | | | |
Shares sold | | 111,116 | | | $ | 454,324 | |
Shares issued in reinvestment of dividends | | 72,739 | | | | 310,076 | |
Shares reacquired | | (312,614 | ) | | | (1,334,482 | ) |
| | | | | | | |
Net increase (decrease) in shares outstanding | | (128,759 | ) | | $ | (570,082 | ) |
| | | | | | | |
| | |
| 58 | | Visit our website at www.prudentialfunds.com |
| | | | | | | | |
Class M | | Shares | | | Amount | |
Year ended August 31, 2010: | | | | | | | | |
Shares sold | | | 51,131 | | | $ | 264,071 | |
Shares issued in reinvestment of dividends | | | 58,005 | | | | 301,644 | |
Shares reacquired | | | (372,826 | ) | | | (1,940,952 | ) |
| | | | | | | | |
Net increase (decrease) in shares outstanding before conversion | | | (263,690 | ) | | | (1,375,237 | ) |
Shares reacquired upon conversion into Class A | | | (581,013 | ) | | | (3,039,617 | ) |
| | | | | | | | |
Net increase (decrease) in shares outstanding | | | (844,703 | ) | | $ | (4,414,854 | ) |
| | | | | | | | |
Year ended August 31, 2009: | | | | | | | | |
Shares sold | | | 246,755 | | | $ | 1,053,654 | |
Shares issued in reinvestment of dividends | | | 124,863 | | | | 529,184 | |
Shares reacquired | | | (787,061 | ) | | | (3,359,360 | ) |
| | | | | | | | |
Net increase (decrease) in shares outstanding before conversion | | | (415,443 | ) | | | (1,776,522 | ) |
Shares reacquired upon conversion into Class A | | | (844,709 | ) | | | (3,626,735 | ) |
| | | | | | | | |
Net increase (decrease) in shares outstanding | | | (1,260,152 | ) | | $ | (5,403,257 | ) |
| | | | | | | | |
Class R | | | | | | |
Year ended August 31, 2010: | | | | | | | | |
Shares sold | | | 1,739,124 | | | $ | 9,086,006 | |
Shares issued in reinvestment of dividends | | | 115,150 | | | | 603,539 | |
Shares reacquired | | | (654,837 | ) | | | (3,431,136 | ) |
| | | | | | | | |
Net increase (decrease) in shares outstanding | | | 1,199,437 | | | $ | 6,258,409 | |
| | | | | | | | |
Year ended August 31, 2009: | | | | | | | | |
Shares sold | | | 781,107 | | | $ | 3,501,729 | |
Shares issued in reinvestment of dividends | | | 34,255 | | | | 149,205 | |
Shares reacquired | | | (300,451 | ) | | | (1,304,599 | ) |
| | | | | | | | |
Net increase (decrease) in shares outstanding | | | 514,911 | | | $ | 2,346,335 | |
| | | | | | | | |
Class X | | | | | | |
Year ended August 31, 2010: | | | | | | | | |
Shares sold | | | 18,487 | | | $ | 97,527 | |
Shares issued in reinvestment of dividends | | | 19,419 | | | | 100,855 | |
Shares reacquired | | | (101,036 | ) | | | (518,093 | ) |
| | | | | | | | |
Net increase (decrease) in shares outstanding before conversion | | | (63,130 | ) | | | (319,711 | ) |
Shares reacquired upon conversion into Class A | | | (143,565 | ) | | | (748,134 | ) |
| | | | | | | | |
Net increase (decrease) in shares outstanding | | | (206,695 | ) | | $ | (1,067,845 | ) |
| | | | | | | | |
Year ended August 31, 2009: | | | | | | | | |
Shares sold | | | 43,290 | | | $ | 177,761 | |
Shares issued in reinvestment of dividends | | | 43,046 | | | | 182,707 | |
Shares reacquired | | | (189,035 | ) | | | (776,415 | ) |
| | | | | | | | |
Net increase (decrease) in shares outstanding before conversion | | | (102,699 | ) | | | (415,947 | ) |
Shares reacquired upon conversion into Class A | | | (180,368 | ) | | | (762,526 | ) |
| | | | | | | | |
Net increase (decrease) in shares outstanding | | | (283,067 | ) | | $ | (1,178,473 | ) |
| | | | | | | | |
| | | | |
| Prudential High Yield Fund, Inc. | | | 59 | |
Notes to Financial Statements
continued
| | | | | | | |
Class Z | | Shares | | | Amount | |
Year ended August 31, 2010: | | | | | | | |
Shares sold | | 13,005,112 | | | $ | 68,146,376 | |
Shares issued in reinvestment of dividends | | 1,385,980 | | | | 7,265,204 | |
Shares reacquired | | (7,681,172 | ) | | | (40,295,901 | ) |
| | | | | | | |
Net increase (decrease) in shares outstanding | | 6,709,920 | | | $ | 35,115,679 | |
| | | | | | | |
Year ended August 31, 2009: | | | | | | | |
Shares sold | | 15,184,522 | | | $ | 65,884,691 | |
Shares issued in reinvestment of dividends | | 792,035 | | | | 3,447,369 | |
Shares reacquired | | (5,213,068 | ) | | | (22,947,136 | ) |
| | | | | | | |
Net increase (decrease) in shares outstanding | | 10,763,489 | | | $ | 46,384,924 | |
| | | | | | | |
Note 7. Reorganization
On June 19, 2009, the Fund acquired all of the net assets of High Yield Plus Fund and High Yield Income Fund (“the Merged Funds”) pursuant to a plan of reorganization approved by the High Yield Plus Fund and High Yield Income Fund shareholders on May 11, 2009 and May 15, 2009, respectively. The acquisition was accomplished by a tax-free issue of Class A shares for the corresponding classes of shares of High Yield Plus Fund and High Yield Income Fund. The following table shows the number of shares of the merged funds and how many shares they became in the Dryden High Yield Fund and the total value.
| | | | | | | | | |
| High Yield Plus Fund | | Dryden High Yield Fund |
Class | | Shares | | Class | | Shares | | Value |
| A | | 16,088,240 | | A | | 10,329,900 | | $ | 47,001,047 |
| |
| High Yield Income Fund | | Dryden High Yield Fund |
Class | | Shares | | Class | | Shares | | Value |
| A | | 11,605,150 | | A | | 10,494,036 | | $ | 47,747,864 |
The net assets and net unrealized appreciation of the Merged funds immediately before the acquisition were:
| | | | | | | |
| | | Net
Assets | | Net
Unrealized
Depreciation | |
High Yield Plus Fund | | $ | 47,001,047 | | $ | (4,491,965 | ) |
High Yield Income Fund | | | 47,747,864 | | | (5,826,675 | ) |
| | |
| 60 | | Visit our website at www.prudentialfunds.com |
The net assets of Dryden High Yield Fund immediately before the acquisition were $1,076,346,983.
The Fund acquired capital loss carryforward from the reorganization with High Yield Plus Fund and High Yield Income Fund in the amounts of approximately $40,270,000 (of which approximately $26,166,000 was written off due to loss limitation and expiration) and $17,979,000 (of which approximately $11,395,000 was written off due to loss limitation and expiration), respectively (amounts included in Note 5). The future utilization of the acquired capital loss carryforwards may be limited under certain conditions defined in the Internal Revenue Code of 1986, as amended.
Note 8. Borrowings
The Fund, along with other affiliated registered investment companies (the “Funds”), is a party to a Syndicated Credit Agreement (“SCA”) with two banks. The SCA provides for a commitment of $500 million. Interest on any borrowings under the SCA is incurred at contracted market rates and a commitment fee for the unused amount is accrued daily and paid quarterly. The Funds pay a commitment fee of .15% of the unused portion of the renewed SCA. The expiration date of the renewed SCA has been extended from October 20, 2010 through December 24, 2010 under the same terms. The purpose of the SCA is to provide an alternative source of temporary funding for capital share redemptions.
The Fund utilized the line of credit during the year ended August 31, 2010. The average daily balance for the 37 days the Fund had an outstanding balance was $8,951,757 at a weighted average interest rate of 1.389%.
Note 9. New Accounting Pronouncement
In January 2010, the Financial Accounting Standards Board issued Accounting Standards Update (“ASU”) No. 2010-06 “Improving Disclosures about Fair Value Measurements”. ASU 2010-06 will require reporting entities to make new disclosures about amounts and reasons for significant transfers in and out of Level 1 and Level 2 fair value measurements and input and valuation techniques used to measure fair value for both recurring and nonrecurring fair value measurements that fall in either Level 2 or Level 3, and information on purchases, sales, issuances, and settlements in the roll forward of activity in Level 3 fair value measurements. The new and revised disclosures are effective for interim and annual reporting periods beginning after December 15, 2009 except for the disclosures about purchases, sales, issuances, and settlements in the roll forward of activity in Level 3 fair value measurements, which are effective for interim and annual reporting periods beginning after December 15, 2010. At this time, management is evaluating the implications of ASU No. 2010-06 and its impact on the financial statements has not been determined.
| | | | |
| Prudential High Yield Fund, Inc. | | | 61 | |
Financial Highlights
| | | | | | | | | | | | | | | | | | | | | | | | |
| Class A Shares | |
| | | Year Ended August 31, | | | Eight Months
Period Ended August 31, | | | Year Ended
December 31, | |
| | | 2010(h) | | | 2009 | | | 2008 | | | 2007(e) | | | 2006 | | | 2005 | |
| Per Share Operating Performance: | | | | | | | | | | | | | | | | | | | | | | | | |
| Net Asset Value, Beginning Of Period | | | $4.84 | | | | $5.19 | | | | $5.58 | | | | $5.80 | | | | $5.67 | | | | $5.93 | |
| Income (loss) from investment operations: | | | | | | | | | | | | | | | | | | | | | | | | |
| Net investment income | | | .45 | | | | .43 | | | | .43 | | | | .28 | | | | .41 | | | | .41 | |
| Net realized and unrealized gain (loss) on investment transactions | | | .49 | | | | (.34 | ) | | | (.38 | ) | | | (.22 | ) | | | .15 | | | | (.24 | ) |
| Total from investment operations | | | .94 | | | | .09 | | | | .05 | | | | .06 | | | | .56 | | | | .17 | |
| Less Dividends: | | | | | | | | | | | | | | | | | | | | | | | | |
| Dividends from net investment income | | | (.46 | ) | | | (.44 | ) | | | (.44 | ) | | | (.28 | ) | | | (.43 | ) | | | (.43 | ) |
| Capital Contributions | | | - | (g) | | | - | | | | - | | | | - | | | | - | | | | - | |
| Net asset value, end of period | | | $5.32 | | | | $4.84 | | | | $5.19 | | | | $5.58 | | | | $5.80 | | | | $5.67 | |
| Total Return(a): | | | 19.94% | | | | 3.32% | | | | .86% | | | | .82% | | | | 10.24% | | | | 3.07% | |
| |
| Ratios/Supplemental Data: | |
| Net assets, end of period (000) | | | $1,093,443 | | | | $1,009,183 | | | | $955,165 | | | | $1,099,469 | | | | $1,201,400 | | | | $1,251,927 | |
| Average net assets (000) | | | $1,078,033 | | | | $811,838 | | | | $1,024,892 | | | | $1,170,148 | | | | $1,205,856 | | | | $1,287,410 | |
| Ratios to average net assets(f): | | | | | | | | | | | | | | | | | | | | | | | | |
| Expenses, including distribution and service (12b-1) fees(b) | | | .90% | | | | .91% | | | | .88% | | | | .92% | (c) | | | .86% | | | | .90% | |
| Expenses, excluding distribution and service (12b-1) fees | | | .65% | | | | .66% | | | | .63% | | | | .67% | (c) | | | .61% | | | | .65% | |
| Net investment income | | | 8.64% | | | | 9.95% | | | | 7.99% | | | | 7.20% | (c) | | | 7.32% | | | | 7.09% | |
| For Classes A, B, C, L, M, R, X and Z shares: | | | | | | | | | | | | | | | | | | | | | | | | |
| Portfolio turnover rate | | | 91% | | | | 82% | | | | 63% | | | | 34% | (d) | | | 40% | | | | 51.% | |
(a) Total return does not consider the effects of sales loads. Total return is calculated assuming a purchase of a share on the first day and a sale on the last day of each period reported and includes reinvestment of dividends and distributions. Total returns may reflect adjustments to conform to generally accepted accounting principles. Total returns for periods less than one full year are not annualized.
(b) The distributor of the Fund contractually agreed to limit its distribution and service (12b-1) fees to .25% of the average daily net assets of the Class A shares.
(c) Annualized.
(d) Not annualized.
(e) For the period ended August 31, 2007. The Fund changed its fiscal year end from December 31 to August 31.
(f) Does not include expenses of the underlying portfolios in which the Fund invests.
(g) Less than $0.005 per share.
(h) Calculated based on average shares outstanding during the year.
See Notes to Financial Statements.
| | |
| 62 | | Visit our website at www.prudentialfunds.com |
| | | | | | | | | | | | | | | | | | | | | | | | |
| Class B Shares | |
| | | Year Ended August 31, | | | Eight Months Period Ended August 31, | | | Year Ended
December 31, | |
| | | 2010(f) | | | 2009 | | | 2008 | | | 2007(c) | | | 2006 | | | 2005 | |
| Per Share Operating Performance: | | | | | | | | | | | | | | | | | | | | | | | | |
| Net Asset Value, Beginning Of Period | | | $4.83 | | | | $5.19 | | | | $5.58 | | | | $5.79 | | | | $5.66 | | | | $5.92 | |
| Income (loss) from investment operations: | | | | | | | | | | | | | | | | | | | | | | | | |
| Net investment income | | | .42 | | | | .41 | | | | .40 | | | | .26 | | | | .38 | | | | .38 | |
| Net realized and unrealized gain (loss) on investment transactions | | | .49 | | | | (.35 | ) | | | (.38 | ) | | | (.21 | ) | | | .15 | | | | (.24 | ) |
| Total from investment operations | | | .91 | | | | .06 | | | | .02 | | | | .05 | | | | .53 | | | | .14 | |
| Less Dividends: | | | | | | | | | | | | | | | | | | | | | | | | |
| Dividends from net investment income | | | (.43 | ) | | | (.42 | ) | | | (.41 | ) | | | (.26 | ) | | | (.40 | ) | | | (.40 | ) |
| Capital Contributions | | | - | (e) | | | - | | | | - | | | | - | | | | - | | | | - | |
| Net asset value, end of period | | | $5.31 | | | | $4.83 | | | | $5.19 | | | | $5.58 | | | | $5.79 | | | | $5.66 | |
| Total Return(a): | | | 19.39% | | | | 2.59% | | | | .37% | | | | .50% | | | | 9.70% | | | | 2.54% | |
| |
| Ratios/Supplemental Data: | |
| Net assets, end of period (000) | | | $96,409 | | | | $85,727 | | | | $109,152 | | | | $160,265 | | | | $191,778 | | | | $281,304 | |
| Average net assets (000) | | | $92,174 | | | | $76,697 | | | | $132,653 | | | | $178,973 | | | | $232,435 | | | | $380,450 | |
| Ratios to average net assets(d): | | | | | | | | | | | | | | | | | | | | | | | | |
| Expenses, including distribution and service (12b-1) fees | | | 1.40% | | | | 1.41% | | | | 1.38% | | | | 1.42% | (b) | | | 1.36% | | | | 1.40% | |
| Expenses, excluding distribution and service (12b-1) fees | | | .65% | | | | .66% | | | | .63% | | | | .67% | (b) | | | .61% | | | | .65% | |
| Net investment income | | | 8.15% | | | | 9.44% | | | | 7.48% | | | | 6.69% | (b) | | | 6.82% | | | | 6.57% | |
(a) Total return does not consider the effects of sales loads. Total return is calculated assuming a purchase of a share on the first day and a sale on the last day of each period reported and includes reinvestment of dividends and distributions. Total returns may reflect adjustments to conform to generally accepted accounting principles. Total returns for periods less than one full year are not annualized.
(b) Annualized.
(c) For the period ended August 31, 2007. The Fund changed its fiscal year end from December 31 to August 31.
(d) Does not include expenses of the underlying portfolios in which the Fund invests.
(e) Less than $0.005 per share.
(f) Calculated based on average shares outstanding during the year.
See Notes to Financial Statements.
| | | | |
| Prudential High Yield Fund, Inc. | | | 63 | |
Financial Highlights
continued
| | | | | | | | | | | | | | | | | | | | | | | | |
| Class C Shares | |
| | | Year Ended August 31, | | | Eight Months Period Ended August 31, | | | Year Ended
December 31, | |
| | | 2010(g) | | | 2009 | | | 2008 | | | 2007(d) | | | 2006 | | | 2005 | |
| Per Share Operating Performance: | | | | | | | | | | | | | | | | | | | | | | | | |
| Net Asset Value, Beginning Of Period | | | $4.83 | | | | $5.18 | | | | $5.58 | | | | $5.79 | | | | $5.66 | | | | $5.92 | |
| Income (loss) from investment operations: | | | | | | | | | | | | | | | | | | | | | | | | |
| Net investment income | | | .42 | | | | .41 | | | | .40 | | | | .26 | | | | .38 | | | | .38 | |
| Net realized and unrealized gain (loss) on investment transactions | | | .49 | | | | (.34 | ) | | | (.39 | ) | | | (.21 | ) | | | .15 | | | | (.24 | ) |
| Total from investment operations | | | .91 | | | | .07 | | | | .01 | | | | .05 | | | | .53 | | | | .14 | |
| Less Dividends: | | | | | | | | | | | | | | | | | | | | | | | | |
| Dividends from net investment income | | | (.43 | ) | | | (.42 | ) | | | (.41 | ) | | | (.26 | ) | | | (.40 | ) | | | (.40 | ) |
| Capital Contributions | | | - | (f) | | | - | | | | - | | | | - | | | | - | | | | - | |
| Net asset value, end of period | | | $5.31 | | | | $4.83 | | | | $5.18 | | | | $5.58 | | | | $5.79 | | | | $5.66 | |
| Total Return(a): | | | 19.40% | | | | 2.83% | | | | .18% | | | | .49% | | | | 9.69% | | | | 2.54% | |
| |
| Ratios/Supplemental Data: | |
| Net assets, end of period (000) | | | $112,212 | | | | $77,177 | | | | $49,660 | | | | $56,307 | | | | $54,036 | | | | $62,127 | |
| Average net assets (000) | | | $94,741 | | | | $50,393 | | | | $52,804 | | | | $58,540 | | | | $55,946 | | | | $70,914 | |
| Ratios to average net assets(e): | | | | | | | | | | | | | | | | | | | | | | | | |
| Expenses, including distribution and service (12b-1) fees(b) | | | 1.40% | | | | 1.41% | | | | 1.38% | | | | 1.42% | (c) | | | 1.36% | | | | 1.40% | |
| Expenses, excluding distribution and service (12b-1) fees | | | .65% | | | | .66% | | | | .63% | | | | .67% | (c) | | | .61% | | | | .65% | |
| Net investment income | | | 8.12% | | | | 9.42% | | | | 7.49% | | | | 6.70% | (c) | | | 6.82% | | | | 6.57% | |
(a) Total return does not consider the effects of sales loads. Total return is calculated assuming a purchase of a share on the first day and a sale on the last day of each period reported and includes reinvestment of dividends and distributions. Total returns may reflect adjustments to conform to generally accepted accounting principles. Total returns for periods less than one full year are not annualized.
| (b) | The distributor of the Fund contractually agreed to limit its distribution and service (12b-1) fees to .75% of the average daily net assets of the Class C shares. |
| (d) | For the period ended August 31, 2007. The Fund changed its fiscal year end from December 31 to August 31. |
| (e) | Does not include expenses of the underlying portfolios in which the Fund invests. |
| (f) | Less than $0.005 per share. |
(g) Calculated based on average shares outstanding during the year.
See Notes to Financial Statements.
| | |
| 64 | | Visit our website at www.prudentialfunds.com |
| | | | | | | | | | | | | | | | |
| Class L Shares | |
| | | Year Ended August 31, | | | March 26, 2007(a) through August 31, | |
| | | 2010(g) | | | 2009 | | | 2008 | | | 2007(b) | |
| Per Share Operating Performance: | | | | | | | | | | | | | | | | |
| Net Asset Value, Beginning Of Period | | | $4.84 | | | | $5.19 | | | | $5.59 | | | | $5.86 | |
| Income (loss) from investment operations: | | | | | | | | | | | | | | | | |
| Net investment income | | | .44 | | | | .42 | | | | .42 | | | | .18 | |
| Net realized and unrealized gain (loss) on investment transactions | | | .49 | | | | (.34 | ) | | | (.39 | ) | | | (.27 | ) |
| Total from investment operations | | | .93 | | | | .08 | | | | .03 | | | | (.09 | ) |
| Less Dividends: | | | | | | | | | | | | | | | | |
| Dividends from net investment income | | | (.45 | ) | | | (.43 | ) | | | (.43 | ) | | | (.18 | ) |
| Capital Contributions | | | - | (f) | | | - | | | | - | | | | - | |
| Net asset value, end of period | | | $5.32 | | | | $4.84 | | | | $5.19 | | | | $5.59 | |
| Total Return(c): | | | 19.64% | | | | 3.05% | | | | .44% | | | | (1.93 | )% |
| |
| Ratios/Supplemental Data: | |
| Net assets, end of period (000) | | | $3,868 | | | | $4,144 | | | | $5,114 | | | | $6,688 | |
| Average net assets (000) | | | $4,060 | | | | $3,969 | | | | $5,980 | | | | $7,546 | |
| Ratios to average net assets(e): | | | | | | | | | | | | | | | | |
Expenses, including distribution and service (12b-1) fees | | | 1.15% | | | | 1.16% | | | | 1.13% | | | | 1.17% | (d) |
Expenses, excluding distribution and service (12b-1) fees | | | .65% | | | | .66% | | | | .63% | | | | .67% | (d) |
| Net investment income | | | 8.41% | | | | 9.71% | | | | 7.73% | | | | 6.97% | (d) |
| (a) | Inception date of Class L shares. |
(b) The Fund changed its fiscal year end from December 31 to August 31.
(c) Total return does not consider the effects of sales loads. Total return is calculated assuming a purchase of a share on the first day and a sale on the last day of each period reported and includes reinvestment of dividends
and distributions. Total returns may reflect adjustments to conform to generally accepted accounting principles. Total returns for periods less than one full year are not annualized.
(d) Annualized.
(e) Does not include expenses of the underlying portfolios in which the Fund invests.
(f) Less than $0.005 per share.
(g) Calculated based on average shares outstanding during the year.
See Notes to Financial Statements.
| | | | |
| Prudential High Yield Fund, Inc. | | | 65 | |
Financial Highlights
continued
| | | | | | | | | | | | | | | | |
| Class M Shares | |
| | | Year Ended August 31, | | | March 26, 2007(a) through August 31, | |
| | | 2010(g) | | | 2009 | | | 2008 | | | 2007(b) | |
| Per Share Operating Performance: | | | | | | | | | | | | | | | | |
| Net Asset Value, Beginning Of Period | | | $4.84 | | | | $5.19 | | | | $5.57 | | | | $5.84 | |
| Income (loss) from investment operations: | | | | | | | | | | | | | | | | |
| Net investment income | | | .41 | | | | .41 | | | | .39 | | | | .17 | |
| Net realized and unrealized gain (loss) on investment transactions | | | .49 | | | | (.35) | | | | (.37) | | | | (.27) | |
| Total from investment operations | | | .90 | | | | .06 | | | | .02 | | | | (.10) | |
| Less Dividends: | | | | | | | | | | | | | | | | |
| Dividends from net investment income | | | (.42) | | | | (.41) | | | | (.40) | | | | (.17) | |
| Capital Contributions | | | - | (f) | | | - | | | | - | | | | - | |
| Net asset value, end of period | | | $5.32 | | | | $4.84 | | | | $5.19 | | | | $5.57 | |
| Total Return(c): | | | 19.04% | | | | 2.52% | | | | .28% | | | | (1.96)% | |
| |
| Ratios/Supplemental Data: | |
| Net assets, end of period (000) | | | $4,004 | | | | $7,730 | | | | $14,831 | | | | $29,221 | |
| Average net assets (000) | | | $6,190 | | | | $9,244 | | | | $22,037 | | | | $36,125 | |
| Ratios to average net assets(e): | | | | | | | | | | | | | | | | |
Expenses, including distribution and service (12b-1) fees | | | 1.65% | | | | 1.66% | | | | 1.63% | | | | 1.67% | (d) |
Expenses, excluding distribution and service (12b-1) fees | | | .65% | | | | .66% | | | | .63% | | | | .67% | (d) |
| Net investment income | | | 7.96% | | | | 9.20% | | | | 7.21% | | | | 6.63% | (d) |
(a) Inception date of Class M shares.
(b) The Fund changed its fiscal year end from December 31 to August 31.
(c) Total return does not consider the effects of sales loads. Total return is calculated assuming a purchase of a share on the first day and a sale on the last day of each period reported and includes reinvestment of dividends and distributions. Total returns may reflect adjustments to conform to generally accepted accounting principles. Total returns for periods less than one full year are not annualized.
(d) Annualized.
(e) Does not include expenses of the underlying portfolios in which the Fund invests.
(f) Less than $0.005 per share.
(g) Calculated based on average shares outstanding during the year.
See Notes to Financial Statements.
| | |
| 66 | | Visit our website at www.prudentialfunds.com |
| | | | | | | | | | | | | | | | | | | | | | | | |
| Class R Shares | |
| | | Year Ended August 31, | | | Eight Months Period Ended August 31, | | | Year ended December 31, | | | June 6, 2005(a) through December 31, | |
| | | 2010(h) | | | 2009 | | | 2008 | | | 2007(e) | | | 2006 | | | 2005 | |
| Per Share Operating Performance: | | | | | | | | | | | | | | | | | | | | | | | | |
| Net Asset Value, Beginning Of Period | | | $4.84 | | | | $5.19 | | | | $5.59 | | | | $5.81 | | | | $5.67 | | | | $5.75 | |
| Income (loss) from investment operations: | | | | | | | | | | | | | | | | | | | | | | | | |
| Net investment income | | | .44 | | | | .42 | | | | .42 | | | | .27 | | | | .42 | | | | .23 | |
| Net realized and unrealized gain (loss) on investment transactions | | | .49 | | | | (.34 | ) | | | (.39 | ) | | | (.21 | ) | | | .15 | | | | (.06 | ) |
| Total from investment operations | | | .93 | | | | .08 | | | | .03 | | | | .06 | | | | .57 | | | | .17 | |
| Less Dividends: | | | | | | | | | | | | | | | | | | | | | | | | |
| Dividends from net investment income | | | (.45 | ) | | | (.43 | ) | | | (.43 | ) | | | (.28 | ) | | | (.43 | ) | | | (.25 | ) |
| Capital Contributions | | | - | (g) | | | - | | | | - | | | | - | | | | - | | | | - | |
| Net asset value, end of period | | | $5.32 | | | | $4.84 | | | | $5.19 | | | | $5.59 | | | | $5.81 | | | | $5.67 | |
| Total Return(b): | | | 19.66% | | | | 3.07% | | | | .47% | | | | .56% | | | | 10.45% | | | | 2.98% | |
| |
| Ratios/Supplemental Data: | |
| Net assets, end of period (000) | | | $10,441 | | | | $3,698 | | | | $1,295 | | | | $851 | | | | $13 | | | | $2 | |
| Average net assets (000) | | | $7,260 | | | | $1,580 | | | | $1,221 | | | | $401 | | | | $3 | | | | $2 | |
| Ratios to average net assets(f): | | | | | | | | | | | | | | | | | | | | | | | | |
| Expenses, including distribution and service (12b-1) fees(c) | | | 1.15% | | | | 1.16% | | | | 1.13% | | | | 1.17% | (d) | | | 1.11% | | | | 1.15% | (d) |
| Expenses, excluding distribution and service (12b-1) fees | | | .65% | | | | .66% | | | | .63% | | | | .67% | (d) | | | .61% | | | | .65% | (d) |
| Net investment income | | | 8.32% | | | | 9.64% | | | | 7.78% | | | | 7.19% | (d) | | | 7.45% | | | | 6.75% | (d) |
(a) Inception date of Class R shares.
(b) Total return does not consider the effects of sales loads. Total return is calculated assuming a purchase of a share on the first day and a sale on the last day of each period reported and includes reinvestment of dividends
and distributions. Total returns may reflect adjustments to conform to generally accepted accounting principles.
Total returns for periods less than one full year are not annualized.
(c) The distributor of the Fund contractually agreed to limit its distribution and service (12b-1) fees to .50%
of the average daily net assets of the Class R shares.
(d) Annualized.
(e) For the period ended August 31, 2007. The Fund changed its fiscal year end from December 31 to August 31.
(f) Does not include expenses of the underlying portfolios in which the Fund invests.
(g) Less than $0.005 per share.
(h) Calculated based on average shares outstanding during the year.
See Notes to Financial Statements.
| | | | |
| Prudential High Yield Fund, Inc. | | | 67 | |
Financial Highlights
continued
| | | | | | | | | | | | | | | | |
| Class X Shares | |
| | | Year Ended August 31, | | | March 26, 2007(a) through
August 31, | |
| | | 2010(g) | | | 2009 | | | 2008 | | | 2007(b) | |
| Per Share Operating Performance: | | | | | | | | | | | | | | | | |
| Net Asset Value, Beginning Of Period | | | $4.83 | | | | $5.19 | | | | $5.57 | | | | $5.84 | |
| Income (loss) from investment operations: | | | | | | | | | | | | | | | | |
| Net investment income | | | .41 | | | | .38 | | | | .38 | | | | .13 | |
| Net realized and unrealized gain (loss) on investment transactions | | | .49 | | | | (.33) | | | | (.36) | | | | (.23) | |
| Total from investment operations | | | .90 | | | | .05 | | | | .02 | | | | (.10) | |
| Less Dividends: | | | | | | | | | | | | | | | | |
| Dividends from net investment income | | | (.42) | | | | (.41) | | | | (.40) | | | | (.17) | |
| Capital Contributions | | | - | (f) | | | - | | | | - | | | | - | |
| Net asset value, end of period | | | $5.31 | | | | $4.83 | | | | $5.19 | | | | $5.57 | |
| Total Return(c): | | | 19.07% | | | | 2.32% | | | | .30% | | | | (1.97)% | |
| |
| Ratios/Supplemental Data: | |
| Net assets, end of period (000) | | | $966 | | | | $1,878 | | | | $3,482 | | | | $4,527 | |
| Average net assets (000) | | | $1,359 | | | | $2,152 | | | | $4,230 | | | | $5,300 | |
| Ratios to average net assets(e): | | | | | | | | | | | | | | | | |
| Expenses, including distribution and service (12b-1) fees | | | 1.65% | | | | 1.66% | | | | 1.63% | | | | 1.67% | (d) |
| Expenses, excluding distribution and service (12b-1) fees | | | .65% | | | | .66% | | | | .63% | | | | .67% | (d) |
| Net investment income | | | 7.97% | | | | 9.19% | | | | 7.24% | | | | 5.43% | (d) |
(a) Inception date of Class X shares.
(b) The Fund changed its fiscal year end from December 31 to August 31.
(c) Total return does not consider the effects of sales loads. Total return is calculated assuming a purchase of a share on the first day and a sale on the last day of each period reported and includes reinvestment of dividends and distributions. Total returns may reflect adjustments to conform to generally accepted accounting principles. Total returns for periods less than one full year are not annualized.
(d) Annualized.
(e) Does not include expenses of the underlying portfolios in which the Fund invests.
(f) Less than $0.005 per share.
(g) Calculated based on average shares outstanding during the year.
See Notes to Financial Statements.
| | |
| 68 | | Visit our website at www.prudentialfunds.com |
| | | | | | | | | | | | | | | | | | | | | | | | |
| Class Z Shares | |
| | | Year Ended August 31, | | | Eight Months
Period Ended
August 31, | | | Year Ended
December 31, | |
| | | 2010(f) | | | 2009 | | | 2008 | | | 2007(c) | | | 2006 | | | 2005 | |
| Per Share Operating Performance: | | | | | | | | | | | | | | | | | | | | | | | | |
| Net Asset Value, Beginning Of Period | | | $4.85 | | | | $5.20 | | | | $5.60 | | | | $5.81 | | | | $5.68 | | | | $5.94 | |
| Income (loss) from investment operations: | | | | | | | | | | | | | | | | | | | | | |
| Net investment income | | | .46 | | | | .44 | | | | .45 | | | | .29 | | | | .43 | | | | .43 | |
| Net realized and unrealized gain (loss) on investment transactions | | | .49 | | | | (.34 | ) | | | (.39 | ) | | | (.21 | ) | | | .14 | | | | (.24 | ) |
| Total from investment operations | | | .95 | | | | .10 | | | | .06 | | | | .08 | | | | .57 | | | | .19 | |
| Less Dividends: | | | | | | | | | | | | | | | | | | | | | | | | |
| Dividends from net investment income | | | (.47 | ) | | | (.45 | ) | | | (.46 | ) | | | (.29 | ) | | | (.44 | ) | | | (.45 | ) |
| Capital Contributions | | | - | (e) | | | - | | | | - | | | | - | | | | - | | | | - | |
| Net asset value, end of period | | | $5.33 | | | | $4.85 | | | | $5.20 | | | | $5.60 | | | | $5.81 | | | | $5.68 | |
| Total Return(a): | | | 20.23% | | | | 3.68% | | | | .96% | | | | .98% | | | | 10.51% | | | | 3.32% | |
| |
| Ratios/Supplemental Data: | |
| Net assets, end of period (000) | | | $117,442 | | | | $74,321 | | | | $23,728 | | | | $21,364 | | | | $30,486 | | | | $24,130 | |
| Average net assets (000) | | | $94,871 | | | | $37,817 | | | | $22,081 | | | | $29,101 | | | | $26,634 | | | | $29,298 | |
| Ratios to average net assets(d): | | | | | | | | | | | | | | | | | | | | | | | | |
| Expenses, including distribution and service (12b-1) fees | | | .65% | | | | .66% | | | | .63% | | | | .67% | (b) | | | .61% | | | | .65% | |
| Expenses, excluding distribution and service (12b-1) fees | | | .65% | | | | .66% | | | | .63% | | | | .67% | (b) | | | .61% | | | | .65% | |
| Net investment income | | | 8.86% | | | | 10.14% | | | | 8.24% | | | | 7.41% | (b) | | | 7.58% | | | | 7.32% | |
(a) Total return does not consider the effects of sales loads. Total return is calculated assuming a purchase of a share on the first day and a sale on the last day of each period reported and includes reinvestment of dividends and distributions. Total returns may reflect adjustments to conform to generally accepted accounting principles. Total returns for periods less than one full year are not annualized.
(b) Annualized.
(c) For the period ended August 31, 2007. The Fund changed its fiscal year end from December 31 to August 31.
(d) Does not include expenses of the underlying portfolios in which the Fund invests.
(e) Less than $0.005 per share.
(f) Calculated based on average shares outstanding during the year.
See Notes to Financial Statements.
| | | | |
| Prudential High Yield Fund, Inc. | | | 69 | |
Report of Independent Registered Public
Accounting Firm
The Board of Directors and Shareholders
Prudential High Yield Fund, Inc.:
We have audited the accompanying statement of assets and liabilities of the Prudential High Yield Fund, Inc. (formerly Dryden High Yield Fund, Inc.) (hereafter referred to as the “Fund”), including the portfolio of investments, as of August 31, 2010, and the related statement of operations for the year then ended, the statement of changes in net assets for each of the years in the two-year period then ended and the financial highlights for each of the years in the three-year period then ended, the eight-month period ended August 31, 2007 and for each of the years in the two-year period ended December 31, 2006. These financial statements and financial highlights are the responsibility of the Fund’s management. Our responsibility is to express an opinion on these financial statements and financial highlights based on our audit.
We conducted our audits in accordance with the standards of the Public Company Accounting Oversight Board (United States). Those standards require that we plan and perform the audit to obtain reasonable assurance about whether the financial statements and financial highlights are free of material misstatement. An audit includes examining, on a test basis, evidence supporting the amounts and disclosures in the financial statements. Our procedures included confirmation of securities owned as of August 31, 2010, by correspondence with the custodian, transfer agent and brokers or by other appropriate auditing procedures when replies from brokers were not received. An audit also includes assessing the accounting principles used and significant estimates made by management, as well as evaluating the overall financial statement presentation. We believe that our audits provide a reasonable basis for our opinion.
In our opinion, the financial statements and financial highlights referred to above present fairly, in all material respects, the financial position of the Fund as of August 31, 2010, and the results of its operations for the year then ended, the changes in its net assets for each of the years in the two-year period then ended and the financial highlights for each of the years in the three-year period then ended, the eight-month period ended August 31, 2007 and for each of the years in the two-year period ended December 31, 2006, in conformity with U.S. generally accepted accounting principles.

New York, New York
October 21, 2010
| | |
| 70 | | Visit our website at www.prudentialfunds.com |
Federal Income Tax Information
(Unaudited)
We are required by the Internal Revenue Code of 1986, as amended (“the Code”), to advise you within 60 days of the Fund’s year end (August 31, 2010) as to the federal income tax status of dividends paid by the Fund during such fiscal period. We are advising you that during the fiscal year ended August 31, 2010, the Fund paid ordinary income dividends for Class A, Class B, Class C, Class L, Class M, Class R, Class X and Class Z shares of $0.46, $0.43, $0.43, $0.45, $0.42, $0.45, $0.42 and $0.47 per share, respectively.
For the year ended August 31, 2010, the Fund designates the maximum amount allowable but not less than 86.86% as interest related dividends in accordance with Section 871(k)(1) and 881(e)(1) of the Internal Revenue Code.
In January 2011, you will be advised on IRS Form 1099-DIV or substitute 1099-DIV as to the federal tax status of the distributions received by you in calendar year 2010.
| | | | |
| Prudential High Yield Fund, Inc. | | | 71 | |
MANAGEMENT OF THE FUND
(Unaudited)
Information about Fund Directors/Trustees (referred to herein as “Board Members”) and Fund Officers is set forth below. Board Members who are not deemed to be “interested persons,” as defined in the 1940 Act, are referred to as “Independent Board Members.” Board Members who are deemed to be “interested persons” are referred to as “Interested Board Members.” The Board Members are responsible for the overall supervision of the operations of the Fund and perform the various duties imposed on the directors or trustees of investment companies by the 1940 Act.
| | | | |
| Independent Board Members (1) |
Name, Address, Age Position(s) Portfolios Overseen | | Principal Occupation(s) During Past Five Years | | Other Directorships Held |
Kevin J. Bannon (58) Board Member Portfolios Overseen: 55 | | Managing Director (since April 2008) and Chief Investment Officer (since October 2008) of Highmount Capital LLC (registered investment adviser); formerly Executive Vice President and Chief Investment Officer (April 1993-August 2007) of Bank of New York Company; President (May 2003-May 2007) of BNY Hamilton Family of Mutual Funds. | | Director of Urstadt Biddle Properties (since September 2008). |
Linda W. Bynoe (58) Board Member Portfolios Overseen: 55 | | President and Chief Executive Officer (since March 1995) and formerly Chief Operating Officer (December 1989- February 1995) of Telemat Ltd. (management consulting); formerly Vice President (January 1985-June 1989) at Morgan Stanley & Co (broker-dealer). | | Director of Simon Property Group, Inc. (retail real estate) (since May 2003); Anixter International, Inc. (communication products distributor) (since January 2006); Director of Northern Trust Corporation (financial services) (since April 2006); Trustee of Equity Residential (residential real estate) (since December 2009); formerly Director of Dynegy Inc. (power generation) (September 2002-May 2006), CitiStreet Funds, Inc. (mutual funds) (May 1993-February 2005), AM- CH, Inc. (restaurant holding company) (November 2004-February 2005). |
Michael S. Hyland, CFA (64) Board Member Portfolios Overseen: 55 | | Independent Consultant (since February 2005); formerly Senior Managing Director (July 2001-February 2005) of Bear Stearns & Co, Inc.; Global Partner, INVESCO (1999-2001); Managing Director and President of Salomon Brothers Asset Management (1989-1999). | | None. |
Visit our website at www.prudentialfunds.com
| | | | |
Douglas H. McCorkindale (71) Board Member Portfolios Overseen: 55 | | Formerly Chairman (February 2001-June 2006), Chief Executive Officer (June 2000-July 2005), President (September 1997-July 2005) and Vice Chairman (March 1984-May 2000) of Gannett Co. Inc. (publishing and media). | | Director of Continental Airlines, Inc. (since May 1993); Director of Lockheed Martin Corp. (aerospace and defense) (since May 2001). |
Stephen P. Munn (68) Board Member Portfolios Overseen: 55 | | Lead Director (since 2007) and formerly Chairman (1993-2007) of Carlisle Companies Incorporated (manufacturer of industrial products). | | Lead Director (since 2007) of Carlisle Companies Incorporated (manufacturer of industrial products). |
Richard A. Redeker (67) Board Member Portfolios Overseen: 55 | | Retired Mutual Fund Senior Executive (42 years); Management Consultant; Independent Directors Council (organization of 2,800 Independent Mutual Fund Directors)-Executive Committee, Chair of Policy Steering Committee, Governing Council. | | None. |
Robin B. Smith (70) Board Member & Independent Chair Portfolios Overseen: 55 | | Chairman of the Board (since January 2003) of Publishers Clearing House (direct marketing); formerly Chairman and Chief Executive Officer (August 1996-January 2003) of Publishers Clearing House. | | Formerly Director of BellSouth Corporation (telecommunications) (1992-2006). |
Stephen G. Stoneburn (67) Board Member Portfolios Overseen: 55 | | President and Chief Executive Officer (since June 1996) of Quadrant Media Corp. (publishing company); formerly President (June 1995-June 1996) of Argus Integrated Media, Inc.; Senior Vice President and Managing Director (January 1993-1995) of Cowles Business Media; Senior Vice President of Fairchild Publications, Inc (1975-1989). | | None. |
Prudential High Yield Fund, Inc.
| | | | |
| Interested Board Members (1) |
Name, Address, Age Position(s) Portfolios Overseen | | Principal Occupation(s) During Past Five Years | | Other Directorships Held |
Judy A. Rice (62) Board Member & President Portfolios Overseen: 55 | | President, Chief Executive Officer, Chief Operating Officer and Officer-In-Charge (since February 2003) of Prudential Investments LLC; President, Chief Executive Officer and Officer-In-Charge (since April 2003) of Prudential Mutual Fund Services LLC; Executive Vice President (since December 2008) of Prudential Investment Management Services LLC; formerly Vice President (February 1999-April 2006) of Prudential Investment Management Services LLC; formerly President, Chief Executive Officer, Chief Operating Officer and Officer-In-Charge (May 2003-June 2005) and Director (May 2003-March 2006) and Executive Vice President (June 2005- March 2006) of AST Investment Services, Inc.; Member of Board of Governors of the Investment Company Institute. | | None. |
Scott E. Benjamin (37) Board Member & Vice President Portfolios Overseen: 55 | | Executive Vice President (since June 2009) of Prudential Investments LLC and Prudential Investment Management Services LLC; Executive Vice President (since September 2009) of AST Investment Services, Inc.; Senior Vice President of Product Development and Marketing, Prudential Investments (since February 2006); Vice President of Product Development and Product Management, Prudential Investments (2003-2006). | | None. |
| (1) | The year that each individual joined the Fund’s Board is as follows: |
Kevin J. Bannon, 2008; Linda W. Bynoe, 2005; Michael S. Hyland, 2008; Douglas H. McCorkindale, 2003; Stephen P. Munn, 2008; Richard A. Redeker, 1995; Robin B. Smith, 2003; Stephen G. Stoneburn, 2003; Judy A. Rice, Board Member since 2000 and President since 2003; Scott E. Benjamin, Board Member since 2010 and Vice President since 2009.
Visit our website at www.prudentialfunds.com
| | |
| Fund Officers (a)(1) |
Name, Address and Age Position with Fund | | Principal Occupation(s) During Past Five Years |
Kathryn L. Quirk (57) Chief Legal Officer | | Vice President and Corporate Counsel (since September 2004) of Prudential; Executive Vice President, Chief Legal Officer and Secretary (since July 2005) of PI and Prudential Mutual Fund Services LLC; Vice President and Corporate Counsel (since June 2005) and Secretary (since February 2006) of AST Investment Services, Inc.; formerly Senior Vice President and Assistant Secretary (November 2004-August 2005) of PI; formerly Assistant Secretary (June 2005-February 2006) of AST Investment Services, Inc.; formerly Managing Director, General Counsel, Chief Compliance Officer, Chief Risk Officer and Corporate Secretary (1997-2002) of Zurich Scudder Investments, Inc. |
Deborah A. Docs (52) Secretary | | Vice President and Corporate Counsel (since January 2001) of Prudential; Vice President (since December 1996) and Assistant Secretary (since March 1999) of PI; formerly Vice President and Assistant Secretary (May 2003-June 2005) of AST Investment Services, Inc. |
Jonathan D. Shain (52) Assistant Secretary | | Vice President and Corporate Counsel (since August 1998) of Prudential; Vice President and Assistant Secretary (since May 2001) of PI; Vice President and Assistant Secretary (since February 2001) of PMFS; formerly Vice President and Assistant Secretary (May 2003-June 2005) of AST Investment Services, Inc. |
Claudia DiGiacomo (35) Assistant Secretary | | Vice President and Corporate Counsel (since January 2005) of Prudential; Vice President and Assistant Secretary of PI (since December 2005); Associate at Sidley Austin Brown & Wood LLP (1999-2004). |
John P. Schwartz (39) Assistant Secretary | | Vice President and Corporate Counsel (since April 2005) of Prudential; Vice President and Assistant Secretary of PI (since December 2005); Associate at Sidley Austin Brown & Wood LLP (1997-2005). |
Andrew R. French (47) Assistant Secretary | | Vice President and Corporate Counsel (since February 2010) of Prudential; formerly Director and Corporate Counsel (2006-2010) of Prudential; Vice President and Assistant Secretary (since January 2007) of PI; Vice President and Assistant Secretary (since January 2007) of PMFS; formerly Senior Legal Analyst of Prudential Mutual Fund Law Department (1997-2006). |
Timothy J. Knierim (51) Chief Compliance Officer | | Chief Compliance Officer of Prudential Investment Management, Inc. (since July 2007); formerly Chief Risk Officer of PIM and PI (2002-2007) and formerly Chief Ethics Officer of PIM and PI (2006-2007). |
Valerie M. Simpson (52) Deputy Chief Compliance Officer | | Chief Compliance Officer (since April 2007) of PI and AST Investment Services, Inc.; formerly Vice President-Financial Reporting (June 1999-March 2006) for Prudential Life and Annuities Finance. |
Theresa C. Thompson (48) Deputy Chief Compliance Officer | | Vice President, Compliance, PI (since April 2004); and Director, Compliance, PI (2001-2004). |
Prudential High Yield Fund, Inc.
| | |
Noreen M. Fierro (46) Anti-Money Laundering Compliance Officer | | Vice President, Corporate Compliance (since May 2006) of Prudential; formerly Corporate Vice President, Associate General Counsel (April 2002-May 2005) of UBS Financial Services, Inc., in their Money Laundering Prevention Group; Senior Manager (May 2005-May 2006) of Deloitte Financial Advisory Services, LLP, in their Forensic and Dispute Services, Anti-Money Laundering Group. |
Grace C. Torres (51) Treasurer and Principal Financial and Accounting Officer | | Assistant Treasurer (since March 1999) and Senior Vice President (since September 1999) of PI; Assistant Treasurer (since May 2003) and Vice President (since June 2005) of AST Investment Services, Inc.; Senior Vice President and Assistant Treasurer (since May 2003) of Prudential Annuities Advisory Services, Inc.; formerly Senior Vice President (May 2003-June 2005) of AST Investment Services, Inc. |
M. Sadiq Peshimam (46) Assistant Treasurer | | Vice President (since 2005) of Prudential Investments LLC. |
Peter Parrella (52) Assistant Treasurer | | Vice President (since 2007) and Director (2004-2007) within Prudential Mutual Fund Administration; formerly Tax Manager at SSB Citi Fund Management LLC (1997-2004). |
| (a) | Excludes Ms. Rice and Mr. Benjamin, interested Board Members who also serve as President and Vice President, respectively. |
| (1) | The year that each individual became an Officer of the Fund is as follows: |
Kathryn L. Quirk, 2005; Deborah A. Docs, 1996; Jonathan D. Shain, 2004; Claudia DiGiacomo, 2005; John P. Schwartz, 2006; Andrew R. French, 2006; Timothy J. Knierim, 2007; Valerie M. Simpson, 2007; Theresa C. Thompson, 2008; Noreen M. Fierro, 2006; Grace C. Torres, 1995; M. Sadiq Peshimam, 2006; Peter Parrella, 2007.
Explanatory Notes to Tables:
| | • | | Board Members are deemed to be “Interested,” as defined in the 1940 Act, by reason of their affiliation with Prudential Investments LLC and/or an affiliate of Prudential Investments LLC. |
| | • | | Unless otherwise noted, the address of all Board Members and Officers is c/o Prudential Investments LLC, Gateway Center Three, 100 Mulberry Street, Newark, New Jersey 07102-4077. |
| | • | | There is no set term of office for Board Members or Officers. The Board Members have adopted a retirement policy, which calls for the retirement of Board Members on December 31 of the year in which they reach the age of 75. |
| | • | | “Other Directorships Held” includes only directorships of companies required to register or file reports with the Commission under the Securities Exchange Act of 1934, as amended (the “Exchange Act”) (that is, “public companies”) or other investment companies registered under the 1940 Act. |
| | • | | “Portfolios Overseen” includes all investment companies managed by Prudential Investments LLC. The investment companies for which PI serves as manager include the Prudential Investments Mutual Funds, The Prudential Variable Contract Accounts, Target Mutual Funds, The Prudential Series Fund, Prudential’s Gibraltar Fund, Inc. and the Advanced Series Trust. |
Visit our website at www.prudentialfunds.com
Approval of Advisory Agreements
The Fund’s Board of Directors
The Board of Directors (the “Board”) of Prudential High Yield Fund, Inc. (the “Fund”) consists of 10 individuals, eight of whom are not “interested persons” of the Fund, as defined in the Investment Company Act of 1940, as amended (the “1940 Act”) (the “Independent Directors”). The Board is responsible for the oversight of the Fund and its operations, and performs the various duties imposed on the directors of investment companies by the 1940 Act. The Independent Directors have retained independent legal counsel to assist them in connection with their duties. The Chair of the Board is an Independent Director. The Board has established three standing committees: the Audit Committee, the Nominating and Governance Committee, and the Investment Committee. Each committee is chaired by, and composed of, Independent Directors.
Annual Approval of the Fund’s Advisory Agreements
As required under the 1940 Act, the Board determines annually whether to renew the Fund’s management agreement with Prudential Investments LLC (“PI”) and the Fund’s subadvisory agreement with Prudential Investment Management, Inc. (“PIM”). In considering the renewal of the agreements, the Board, including all of the Independent Directors, met on June 21-23, 2010 and approved the renewal of the agreements through July 31, 2011, after concluding that the renewal of the agreements was in the best interests of the Fund and its shareholders.
In advance of the meetings, the Board requested and received materials relating to the agreements, and had the opportunity to ask questions and request further information in connection with its consideration. Among other things, the Board considered comparative fee information from PI and PIM. Also, the Board considered comparisons with other mutual funds in relevant Peer Universes and Peer Groups. The mutual funds included in each Peer Universe or Peer Group were objectively determined by Lipper Inc. (“Lipper”), an independent provider of mutual fund data. The comparisons placed the Fund in various quartiles over the one-, three-, five-, and 10-year periods ending December 31, 2009, with the first quartile being the best 25% of the mutual funds (for performance, the best performing mutual funds and, for expenses, the lowest cost mutual funds).
In approving the agreements, the Board, including the Independent Directors advised by independent legal counsel, considered the factors it deemed relevant, including the nature, quality and extent of services provided by PI and the subadviser, the performance of the Fund, the profitability of PI and its affiliates, expenses and fees, and the potential for economies of scale that may be shared with the Fund and its shareholders as the Fund’s assets grow. In their deliberations, the Directors did not identify any single factor which alone was responsible for the Board’s decision to
| | |
| Prudential High Yield Fund, Inc. | | |
Approval of Advisory Agreements (continued)
approve the agreements with respect to the Fund. In connection with its deliberations, the Board considered information provided by PI throughout the year at regular Board meetings, presentations from portfolio managers and other information, as well as information furnished at or in advance of the meetings on June 21-23, 2010.
The Directors determined that the overall arrangements between the Fund and PI, which serves as the Fund’s investment manager pursuant to a management agreement, and between PI and PIM, which serves as the Fund’s subadviser pursuant to the terms of a subadvisory agreement with PI, are in the interest of the Fund and its shareholders in light of the services performed, fees charged and such other matters as the Directors considered relevant in the exercise of their business judgment.
The material factors and conclusions that formed the basis for the Directors reaching their determinations to approve the continuance of the agreements are separately discussed below.
Nature, Quality, and Extent of Services
The Board received and considered information regarding the nature, quality and extent of services provided to the Fund by PI and PIM. The Board considered the services provided by PI, including but not limited to the oversight of the subadvisers for the Fund, as well as the provision of fund recordkeeping, compliance, and other services to the Fund. With respect to PI’s oversight of the subadviser, the Board noted that PI’s Strategic Investment Research Group (“SIRG”), which is a business unit of PI, is responsible for monitoring and reporting to PI’s senior management on the performance and operations of the subadviser. The Board also considered that PI pays the salaries of all of the officers and non-independent Directors of the Fund. The Board also considered the investment subadvisory services provided by PIM, as well as adherence to the Fund’s investment restrictions and compliance with applicable Fund policies and procedures.
The Board reviewed the qualifications, backgrounds and responsibilities of PI’s senior management responsible for the oversight of the Fund and PIM, and also reviewed the qualifications, backgrounds and responsibilities of PIM’s portfolio managers who are responsible for the day-to-day management of the Fund’s portfolio. The Board was provided with information pertaining to PI’s and PIM’s organizational structure, senior management, investment operations, and other relevant information pertaining to both PI and PIM. The Board also noted that it received favorable compliance reports from the Fund’s Chief Compliance Officer (“CCO”) as to both PI and PIM. The Board noted that PIM is affiliated with PI. The Board considered PI’s evaluation of the subadviser, as well as PI’s recommendation, based on its review of the subadviser, to renew the subadvisory agreement.
| | |
| | Visit our website at www.prudentialfunds.com |
The Board concluded that it was satisfied with the nature, extent and quality of the investment management services provided by PI and the subadvisory services provided to the Fund by PIM, and that there was a reasonable basis on which to conclude that the Fund benefits from the services provided by PI and PIM under the management and subadvisory agreements.
Performance of the Fund
The Board received and considered information about the Fund’s historical performance, noting that the Fund’s gross performance in relation to its Peer Universe (the Lipper High Current Yield Funds Performance Universe) was in the first quartile for the three- and five-year periods, and in the third quartile over the one- and 10-year periods. The Board also noted that the Fund performed competitively against its benchmark index for the five-year period, though it underperformed its benchmark index over the other periods. The Board noted PI’s explanation that the Fund’s underperformance over the one- and three-year periods was primarily the result of an underweight position in lower-quality securities, which experienced a significant recovery during 2009, while the Fund maintained a bias towards higher-quality securities. The Board concluded that it was reasonable for the Fund to renew the agreements.
Fees and Expenses
The Board considered that the Fund’s actual management fee (which reflects any subsidies, expense caps or waivers) and total expenses both ranked in the Expense Group’s first quartile. The Board concluded that the management fees and total expenses were reasonable in light of the services provided.
Costs of Services and Profits Realized by PI
The Board was provided with information on the profitability of PI and its affiliates in serving as the Fund’s investment manager. The Board discussed with PI the methodology utilized in assembling the information regarding profitability and considered its reasonableness. The Board recognized that it is difficult to make comparisons of profitability from fund management contracts because comparative information is not generally publicly available and is affected by numerous factors, including the structure of the particular adviser, the types of funds it manages, its business mix, numerous assumptions regarding allocations and the adviser’s capital structure and cost of capital. The Board did not separately consider the profitability of the subadviser, an affiliate of PI, as its profitability was reflected in the profitability report for PI. Taking these factors into account, the Board concluded that the profitability of PI and its affiliates in relation to the services rendered was not unreasonable.
| | |
| Prudential High Yield Fund, Inc. | | |
Approval of Advisory Agreements (continued)
Economies of Scale
The Board noted that the management fee schedule for the Fund includes breakpoints, which have the effect of decreasing the fee rate as assets increase, and that at its current level of assets the Fund’s effective fee rate reflected some of those rate reductions. The Board received and discussed information concerning whether PI realizes economies of scale as the Fund’s assets grow beyond current levels. The Board took note that the Fund’s fee structure currently results in benefits to Fund shareholders whether or not PI realizes any economies of scale.
Other Benefits to PI and PIM
The Board considered potential ancillary benefits that might be received by PI and PIM and their affiliates as a result of their relationship with the Fund. The Board concluded that potential benefits to be derived by PI included transfer agency fees received by the Fund’s transfer agent (which is affiliated with PI), as well as benefits to the reputation or other intangible benefits resulting from PI’s association with the Fund. The Board concluded that the potential benefits to be derived by PIM included the ability to use soft dollar credits, as well as the potential benefits consistent with those generally resulting from an increase in assets under management, specifically, potential access to additional research resources and benefits to the reputation. The Board concluded that the benefits derived by PI and PIM were consistent with the types of benefits generally derived by investment managers and subadvisers to mutual funds.
After full consideration of these factors, the Board concluded that the approval of the agreements was in the best interest of the Fund and its shareholders.
| | |
| | Visit our website at www.prudentialfunds.com |
| | | | |
| n MAIL | | n TELEPHONE | | n WEBSITE |
Gateway Center Three 100 Mulberry Street Newark, NJ 07102 | | (800) 225-1852
| | www.prudentialfunds.com |
|
| PROXY VOTING |
| The Board of Directors of the Fund has delegated to the Fund’s investment subadviser the responsibility for voting any proxies and maintaining proxy recordkeeping with respect to the Fund. A description of these proxy voting policies and procedures is available without charge, upon request, by calling (800) 225-1852 or by visiting the Securities and Exchange Commission’s website at www.sec.gov. Information regarding how the Fund voted proxies relating to portfolio securities during the most recent 12-month period ended June 30 is available on the Fund’s website and on the Commission’s website. |
|
| DIRECTORS |
| Kevin J. Bannon • Scott E. Benjamin • Linda W. Bynoe • Michael S. Hyland • Douglas H. McCorkindale • Stephen P. Munn • Richard A. Redeker • Judy A. Rice • Robin B. Smith • Stephen G. Stoneburn |
|
| OFFICERS |
| Judy A. Rice, President • Scott E. Benjamin, Vice President • Grace C. Torres, Treasurer and Principal Financial and Accounting Officer • Kathryn L. Quirk, Chief Legal Officer • Deborah A. Docs, Secretary • Timothy J. Knierim, Chief Compliance Officer • Valerie M. Simpson, Deputy Chief Compliance Officer • Theresa C. Thompson, Deputy Chief Compliance Officer • Noreen M. Fierro, Anti-Money Laundering Compliance Officer • Jonathan D. Shain, Assistant Secretary • Claudia DiGiacomo, Assistant Secretary • John P. Schwartz, Assistant Secretary • Andrew R. French, Assistant Secretary • M. Sadiq Peshimam, Assistant Treasurer • Peter Parrella, Assistant Treasurer |
| | | | |
| MANAGER | | Prudential Investments LLC | | Gateway Center Three
100 Mulberry Street Newark, NJ 07102 |
|
| INVESTMENT SUBADVISER | | Prudential Investment
Management, Inc. | | Gateway Center Two
100 Mulberry Street
Newark, NJ 07102 |
|
| DISTRIBUTOR | | Prudential Investment
Management Services LLC | | Gateway Center Three
100 Mulberry Street Newark, NJ 07102 |
|
| CUSTODIAN | | The Bank of New York Mellon | | One Wall Street
New York, NY 10286 |
|
| TRANSFER AGENT | | Prudential Mutual Fund
Services LLC | | PO Box 9658
Providence, RI 02940 |
|
| INDEPENDENT REGISTERED PUBLIC ACCOUNTING FIRM | | KPMG LLP | | 345 Park Avenue
New York, NY 10154 |
|
| FUND COUNSEL | | Willkie Farr & Gallagher LLP | | 787 Seventh Avenue
New York, NY 10019 |
|
| An investor should consider the investment objectives, risks, charges, and expenses of the Fund carefully before investing. The prospectus for the Fund contains this and other information about the Fund. An investor may obtain a prospectus by visiting our website at www.prudentialfunds.com or by calling (800) 225-1852. The prospectus should be read carefully before investing. |
|
| E-DELIVERY |
| To receive your mutual fund documents online, go to www.prudentialfunds.com/edelivery and enroll. Instead of receiving printed documents by mail, you will receive notification via e-mail when new materials are available. You can cancel your enrollment or change your e-mail address at any time by visiting the website address above. |
|
| SHAREHOLDER COMMUNICATIONS WITH DIRECTORS |
| Shareholders can communicate directly with the Board of Directors by writing to the Chair of the Board, Prudential High Yield Fund, Inc., Prudential Investments, Attn: Board of Directors, 100 Mulberry Street, Gateway Center Three, Newark, NJ 07102. Shareholders can communicate directly with an individual Director by writing to the same address. Communications are not screened before being delivered to the addressee. |
|
| AVAILABILITY OF PORTFOLIO SCHEDULE |
| The Fund files its complete schedule of portfolio holdings with the Securities and Exchange Commission for the first and third quarters of each fiscal year on Form N-Q. The Fund’s Forms N-Q are available on the Commission’s website at www.sec.gov. The Fund’s Forms N-Q may also be reviewed and copied at the Commission’s Public Reference Room in Washington, D.C. Information on the operation and location of the Public Reference Room may be obtained by calling (202) 551-8090. The Fund’s schedule of portfolio holdings is also available on the Fund’s website as of the end of each fiscal quarter. |
|
| The Fund’s Statement of Additional Information contains additional information about the Fund’s Directors and is available without charge, upon request, by calling (800) 225-1852. |
Mutual Funds:
| | | | |
| ARE NOT INSURED BY THE FDIC OR ANY FEDERAL GOVERNMENT AGENCY | | MAY LOSE VALUE | | ARE NOT A DEPOSIT OF OR GUARANTEED BY ANY BANK OR ANY BANK AFFILIATE |

| | | | | | | | | | | | | | | | | | | | |
| | | Prudential High Yield Fund, Inc. | | | | | | | | | | | | | | |
| | | Share Class | | A | | B | | C | | L | | M | | R | | X | | Z | | |
| | NASDAQ | | PBHAX | | PBHYX | | PRHCX | | N/A | | DHYMX | | JDYRX | | N/A | | PHYZX | | |
| | CUSIP | | 74440Y108 | | 74440Y207 | | 74440Y306 | | 74440Y405 | | 74440Y504 | | 74440Y603 | | 74440Y702 | | 74440Y801 | | |
| | | | | | | | | | | | | | | | | | | | |
MF110E 0188443-00001-00
Item 2 – Code of Ethics – – See Exhibit (a)
As of the end of the period covered by this report, the registrant has adopted a code of ethics (the “Section 406 Standards for Investment Companies – Ethical Standards for Principal Executive and Financial Officers”) that applies to the registrant’s Principal Executive Officer and Principal Financial Officer; the registrant’s Principal Financial Officer also serves as the Principal Accounting Officer.
The registrant hereby undertakes to provide any person, without charge, upon request, a copy of the code of ethics. To request a copy of the code of ethics, contact the registrant 800-225-1852, and ask for a copy of the Section 406 Standards for Investment Companies - Ethical Standards for Principal Executive and Financial Officers.
Item 3 – Audit Committee Financial Expert –
The registrant’s Board has determined that Mr. Stephen P. Munn, member of the Board’s Audit Committee is an “audit committee financial expert,” and that he is “independent,” for purposes of this Item.
Item 4 – Principal Accountant Fees and Services –
For the fiscal years ended August 31, 2010 and August 31, 2009, KPMG LLP (“KPMG”), the Registrant’s principal accountant, billed the Registrant $32,000 and $27,617 respectively, for professional services rendered for the audit of the Registrant’s annual financial statements or services that are normally provided in connection with statutory and regulatory filings.
Not applicable for the fiscal year ended August 31, 2010. During the fiscal year ended August 31, 2009, KPMG, the Registrant’s principal accountant, billed the Registrant $1,558 for professional services rendered in connection with agreed upon procedures performed related to a custody conversion.
None.
None.
| (e) (1) | Audit Committee Pre-Approval Policies and Procedures |
THE PRUDENTIAL MUTUAL FUNDS
AUDIT COMMITTEE POLICY
on
Pre-Approval of Services Provided by the Independent Accountants
The Audit Committee of each Prudential Mutual Fund is charged with the responsibility to monitor the independence of the Fund’s independent accountants. As part of this responsibility, the Audit Committee must pre-approve any independent accounting firm’s engagement to render audit and/or permissible non-audit services, as required by law. In evaluating a proposed engagement of the independent accountants, the Audit Committee will assess the effect that the engagement might reasonably be expected to have on the accountant’s independence. The Committee’s evaluation will be based on:
| | • | | a review of the nature of the professional services expected to be provided, |
| | • | | a review of the safeguards put into place by the accounting firm to safeguard independence, and |
| | • | | periodic meetings with the accounting firm. |
Policy for Audit and Non-Audit Services Provided to the Funds
On an annual basis, the scope of audits for each Fund, audit fees and expenses, and audit-related and non-audit services (and fees proposed in respect thereof) proposed to be performed by the Fund’s independent accountants will be presented by the Treasurer and the independent accountants to the Audit Committee for review and, as appropriate, approval prior to the initiation of such services. Such presentation shall be accompanied by confirmation by both the Treasurer and the independent accountants that the proposed services will not adversely affect the independence of the independent accountants. Proposed services shall be described in sufficient detail to enable the Audit Committee to assess the appropriateness of such services and fees, and the compatibility of the provision of such services with the auditor’s independence. The Committee shall receive periodic reports on the progress of the audit and other services which are approved by the Committee or by the Committee Chair pursuant to authority delegated in this Policy.
The categories of services enumerated under “Audit Services”, “Audit-related Services”, and “Tax Services” are intended to provide guidance to the Treasurer and the independent accountants as to those categories of services which the Committee believes are generally consistent with the independence of the independent accountants and which the Committee (or the Committee Chair) would expect upon the presentation of specific proposals to pre-approve. The enumerated categories are not intended as an exclusive list of audit, audit-related or tax services, which the Committee (or the Committee Chair) would consider for pre-approval.
Audit Services
The following categories of audit services are considered to be consistent with the role of the Fund’s independent accountants:
| | • | | Annual Fund financial statement audits |
| | • | | Seed audits (related to new product filings, as required) |
| | • | | SEC and regulatory filings and consents |
Audit-related Services
The following categories of audit-related services are considered to be consistent with the role of the Fund’s independent accountants:
| | • | | Accounting consultations |
| | • | | Fund merger support services |
| | • | | Agreed Upon Procedure Reports |
| | • | | Other Internal Control Reports |
Individual audit-related services that fall within one of these categories and are not presented to the Audit Committee as part of the annual pre-approval process will be subject to pre-approval by the Committee Chair (or any other Committee member on whom this responsibility has been delegated) so long as the estimated fee for those services does not exceed $50,000.
Tax Services
The following categories of tax services are considered to be consistent with the role of the Fund’s independent accountants:
| | • | | Tax compliance services related to the filing or amendment of the following: |
| | • | | Federal, state and local income tax compliance; and, |
| | • | | Sales and use tax compliance |
| | • | | Timely RIC qualification reviews |
| | • | | Tax distribution analysis and planning |
| | • | | Tax authority examination services |
| | • | | Tax appeals support services |
| | • | | Accounting methods studies |
| | • | | Fund merger support services |
| | • | | Tax consulting services and related projects |
Individual tax services that fall within one of these categories and are not presented to the Audit Committee as part of the annual pre-approval process will be subject to pre-approval by the Committee Chair (or any other Committee member on whom this responsibility has been delegated) so long as the estimated fee for those services does not exceed $50,000.
Other Non-audit Services
Certain non-audit services that the independent accountants are legally permitted to render will be subject to pre-approval by the Committee or by one or more Committee members to whom the Committee has delegated this authority and who will report to the full Committee any pre-approval decisions made pursuant to this Policy. Non-audit services presented for pre-approval pursuant to this paragraph will be accompanied by a confirmation from both the Treasurer and the independent accountants that the proposed services will not adversely affect the independence of the independent accountants.
Proscribed Services
The Fund’s independent accountants will not render services in the following categories of non-audit services:
| | • | | Bookkeeping or other services related to the accounting records or financial statements of the Fund |
| | • | | Financial information systems design and implementation |
| | • | | Appraisal or valuation services, fairness opinions, or contribution-in-kind reports |
| | • | | Internal audit outsourcing services |
| | • | | Management functions or human resources |
| | • | | Broker or dealer, investment adviser, or investment banking services |
| | • | | Legal services and expert services unrelated to the audit |
| | • | | Any other service that the Public Company Accounting Oversight Board determines, by regulation, is impermissible. |
Pre-approval of Non-Audit Services Provided to Other Entities Within the Prudential Fund Complex
Certain non-audit services provided to Prudential Investments LLC or any of its affiliates that also provide ongoing services to the Prudential Mutual Funds will be subject to pre-approval by the Audit Committee. The only non-audit services provided to these entities that will require pre-approval are those related directly to the operations and financial reporting of the Funds. Individual projects that are not presented to the Audit Committee as part of the annual pre-approval process will be subject to pre-approval by the Committee Chair (or any other Committee member on whom this responsibility has been delegated) so long as the estimated fee for those services does not exceed $50,000. Services presented for pre-approval pursuant to this paragraph will be accompanied by a confirmation from both the Treasurer and the independent accountants that the proposed services will not adversely affect the independence of the independent accountants.
Although the Audit Committee will not pre-approve all services provided to Prudential Investments LLC and its affiliates, the Committee will receive an annual report from the Fund’s independent accounting firm showing the aggregate fees for all services provided to Prudential Investments and its affiliates.
| (e) (2) | Percentage of services referred to in 4(b) – 4(d) that were approved by the audit committee – |
One hundred percent of the services described in Item 4(b) was approved by the audit committee.
| (f) | Percentage of hours expended attributable to work performed by other than full time employees of principal accountant if greater than 50%. |
The percentage of hours expended on the principal accountant’s engagement to audit the registrant’s financial statements for the most recent fiscal year that were attributed to work performed by persons other than the principal accountant’s full-time, permanent employees was 0%.
Not applicable to Registrant for the fiscal years 2010 and 2009. The aggregate non-audit fees billed by KPMG for services rendered to the registrant’s investment adviser and any entity controlling, controlled by, or under common control with the investment adviser that provides ongoing services to the registrant for the fiscal years 2010 and 2009 was $0 and $0, respectively.
| (h) | Principal Accountant’s Independence |
Not applicable as KPMG has not provided non-audit services to the registrant’s investment adviser and any entity controlling, controlled by, or under common control with the investment adviser that provides ongoing services to the registrant that were not pre-approved pursuant to Rule 2-01(c)(7)(ii) of Regulation S-X.
Item 5 – Audit Committee of Listed Registrants – Not applicable.
Item 6 – Schedule of Investments – The schedule is included as part of the report to shareholders filed under Item 1 of this Form.
Item 7 – Disclosure of Proxy Voting Policies and Procedures for Closed-End Management Investment Companies – Not applicable.
Item 8 – Portfolio Managers of Closed-End Management Investment Companies – Not applicable.
Item 9 – Purchases of Equity Securities by Closed-End Management Investment Company and Affiliated Purchasers – Not applicable.
Item 10 – Submission of Matters to a Vote of Security Holders – Not applicable.
Item 11 – Controls and Procedures
| | (a) | It is the conclusion of the registrant’s principal executive officer and principal financial officer that the effectiveness of the registrant’s current disclosure controls and procedures (such disclosure controls and procedures having been evaluated within 90 days of the date of this filing) provide reasonable assurance that the information required to be disclosed by the registrant has been recorded, processed, summarized and reported within the time period specified in the Commission’s rules and forms and that the information required to be disclosed by the registrant has been accumulated and communicated to the registrant’s principal executive officer and principal financial officer in order to allow timely decisions regarding required disclosure. |
| | (b) | There has been no significant change in the registrant’s internal control over financial reporting that occurred during the registrant’s most recent fiscal quarter of the period covered by this report that has materially affected, or is likely to materially affect, the registrant’s internal control over financial reporting. |
Item 12 – Exhibits
| | |
| (a) | | (1) Code of Ethics – Attached hereto as Exhibit EX-99.CODE-ETH |
| |
| | (2) Certifications pursuant to Section 302 of the Sarbanes-Oxley Act – Attached hereto as Exhibit EX-99.CERT. |
| |
| | (3) Any written solicitation to purchase securities under Rule 23c-1. – Not applicable. |
| |
| (b) | | Certifications pursuant to Section 906 of the Sarbanes-Oxley Act – Attached hereto as Exhibit EX-99.906CERT. |
SIGNATURES
Pursuant to the requirements of the Securities Exchange Act of 1934 and the Investment Company Act of 1940, the registrant has duly caused this report to be signed on its behalf by the undersigned, thereunto duly authorized.
| | |
| Registrant: | | Prudential High Yield Fund, Inc. |
| |
| By: | | /S/ DEBORAH A. DOCS |
| | Deborah A. Docs |
| | Secretary |
October 21, 2010
Pursuant to the requirements of the Securities Exchange Act of 1934 and the Investment Company Act of 1940, this report has been signed below by the following persons on behalf of the registrant and in the capacities and on the dates indicated.
| | |
| By: | | /S/ JUDY A. RICE |
| | Judy A. Rice |
| | President and Principal Executive Officer |
October 21, 2010
| | |
| By: | | /S/ GRACE C. TORRES |
| | Grace C. Torres |
| | Treasurer and Principal Financial Officer |
October 21, 2010