UNITED STATES
SECURITIES AND EXCHANGE COMMISSION
Washington, D.C. 20549
FORM N-CSR
CERTIFIED SHAREHOLDER REPORT OF REGISTERED
MANAGEMENT INVESTMENT COMPANIES
| | |
| Investment Company Act file number: | | 811-02896 |
| |
| Exact name of registrant as specified in charter: | | Prudential Investment Portfolios, Inc. 15 |
| |
| Address of principal executive offices: | | 655 Broad Street, 17th Floor |
| | Newark, New Jersey 07102 |
| |
| Name and address of agent for service: | | Deborah A. Docs |
| | 655 Broad Street, 17th Floor |
| | Newark, New Jersey 07102 |
| |
| Registrant’s telephone number, including area code: | | 800-225-1852 |
| |
| Date of fiscal year end: | | 8/31/2015 |
| |
| Date of reporting period: | | 8/31/2015 |
Item 1 – Reports to Stockholders –

PRUDENTIAL INVESTMENTS»MUTUAL FUNDS
PRUDENTIAL HIGH YIELD FUND
ANNUAL REPORT · AUGUST 31, 2015
Objectives
Current income, and capital appreciation as a secondary objective
This report is not authorized for distribution to prospective investors unless preceded or accompanied by a current prospectus.
The views expressed in this report and information about the Fund’s portfolio holdings are for the period covered by this report and are subject to change thereafter.
Mutual funds are distributed by Prudential Investment Management Services LLC (PIMS), a Prudential Financial company and member SIPC. Prudential Fixed Income is a unit of Prudential Investment Management, Inc. (PIM), a registered investment adviser. PIMS and PIM are Prudential Financial companies. ©2015 Prudential Financial, Inc. and its related entities. Prudential Investments LLC, Prudential, the Prudential logo, Bring Your Challenges, and the Rock symbol are service marks of Prudential Financial, Inc. and its related entities, registered in many jurisdictions worldwide.

October 15, 2015
Dear Shareholder:
We hope you find the annual report for the Prudential High Yield Fund informative and useful. The report covers performance for the 12-month period that ended August 31, 2015.
Since market conditions change over time, we believe it is important to maintain a diversified portfolio of funds consistent with your tolerance for risk, time horizon, and financial goals.
Your financial advisor can help you create a diversified investment plan that may include funds covering all the basic asset classes and that reflects your personal investor profile and risk tolerance. Keep in mind, however, that diversification and asset allocation strategies do not assure a profit or protect against loss in declining markets.
Prudential Investments® is dedicated to helping you solve your toughest investment challenges—whether it’s capital growth, reliable income, or protection from market volatility and other risks. We offer the expertise of Prudential Financial’s affiliated asset managers that strive to be leaders in a broad range of funds to help you stay on course to the future you envision. They also manage money for major corporations and pension funds around the world, which means you benefit from the same expertise, innovation, and attention to risk demanded by today’s most sophisticated investors.
Thank you for choosing the Prudential Investments family of funds.
Sincerely,

Stuart S. Parker, President
Prudential High Yield Fund
| | | | |
| Prudential High Yield Fund | | | 1 | |
Your Fund’s Performance (Unaudited)
Performance data quoted represent past performance. Past performance does not guarantee future results. The investment return and principal value of an investment will fluctuate, so that an investor’s shares, when redeemed, may be worth more or less than their original cost. Current performance may be lower or higher than the past performance data quoted. An investor may obtain performance data as of the most recent month-end by visiting our website at www.prudentialfunds.com or by calling (800) 225-1852.
| | | | | | | | | | | | | | | | |
Cumulative Total Returns (Without Sales Charges) as of 8/31/15 | |
| | | One Year | | | Five Years | | | Ten Years | | | Since Inception | |
Class A | | | –1.39 | % | | | 41.20 | % | | | 98.29 | % | | | — | |
Class B | | | –2.06 | | | | 37.80 | | | | 88.77 | | | | — | |
Class C | | | –2.31 | | | | 36.22 | | | | 86.68 | | | | — | |
Class Q | | | –1.20 | | | | N/A | | | | N/A | | | | 29.03% (10/31/11) | |
Class R | | | –1.63 | | | | 39.46 | | | | 93.90 | | | | — | |
Class Z | | | –1.29 | | | | 43.15 | | | | 103.44 | | | | — | |
Barclays US Corporate High Yield
1% Issuer Capped Index | | | –3.06 | | | | 41.90 | | | | 103.11 | | | | — | |
Lipper High Yield
Funds Average | | | –3.38 | | | | 36.24 | | | | 80.98 | | | | — | |
| | | | | | | | | | | | | | | | |
Average Annual Total Returns (With Sales Charges) as of 9/30/15 | |
| | | One Year | | | Five Years | | | Ten Years | | | Since Inception | |
Class A | | | –6.01 | % | | | 5.10 | % | | | 6.39 | % | | | — | |
Class B | | | –6.71 | | | | 5.36 | | | | 6.35 | | | | — | |
Class C | | | –3.25 | | | | 5.27 | | | | 6.23 | | | | — | |
Class Q | | | –1.20 | | | | N/A | | | | N/A | | | | 6.15% (10/31/11) | |
Class R | | | –1.82 | | | | 5.81 | | | | 6.66 | | | | — | |
Class Z | | | –1.30 | | | | 6.32 | | | | 7.17 | | | | — | |
Barclays US Corporate High Yield
1% Issuer Capped Index | | | –3.42 | | | | 6.11 | | | | 7.17 | | | | — | |
Lipper High Yield
Funds Average | | | –3.77 | | | | 5.18 | | | | 5.87 | | | | — | |
| | |
| 2 | | Visit our website at www.prudentialfunds.com |
| | | | | | | | | | | | | | |
Average Annual Total Returns (With Sales Charges) as of 8/31/15 |
| | | One Year | | | Five Years | | | Ten Years | | | Since Inception |
Class A | | | –5.83 | % | | | 6.16 | % | | | 6.59 | % | | — |
Class B | | | –6.69 | | | | 6.47 | | | | 6.56 | | | — |
Class C | | | –3.23 | | | | 6.38 | | | | 6.44 | | | — |
Class Q | | | –1.20 | | | | N/A | | | | N/A | | | 6.87% (10/31/11) |
Class R | | | –1.63 | | | | 6.88 | | | | 6.85 | | | — |
Class Z | | | –1.29 | | | | 7.44 | | | | 7.36 | | | — |
| | | | | | | | | | | | | | |
| Average Annual Total Returns (Without Sales Charges) as of 8/31/15 |
| | | One Year | | | Five Years | | | Ten Years | | | Since Inception |
Class A | | | –1.39 | % | | | 7.14 | % | | | 7.09 | % | | — |
Class B | | | –2.06 | | | | 6.62 | | | | 6.56 | | | — |
Class C | | | –2.31 | | | | 6.38 | | | | 6.44 | | | — |
Class Q | | | –1.20 | | | | N/A | | | | N/A | | | 6.87% (10/31/11) |
Class R | | | –1.63 | | | | 6.88 | | | | 6.85 | | | — |
Class Z | | | –1.29 | | | | 7.44 | | | | 7.36 | | | — |
Growth of a $10,000 Investment
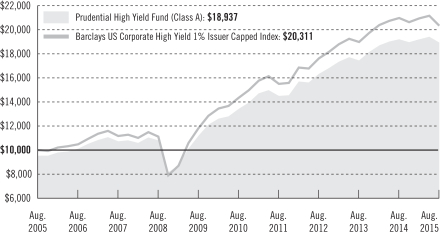
The graph compares a $10,000 investment in the Fund’s Class A shares with a similar investment in the Barclays US Corporate High Yield 1% Issuer Capped Index by portraying the initial account values at the beginning of the 10-year period for Class A shares (August 31, 2005) and the account values at the end of the current fiscal year (August 31, 2015) as measured on a quarterly basis. For purposes of the graph, and unless otherwise indicated, it has been assumed that (a) the maximum applicable front-end sales charge was deducted
| | | | |
| Prudential High Yield Fund | | | 3 | |
Your Fund’s Performance (continued)
from the initial $10,000 investment in Class A shares; (b) all recurring fees (including management fees) were deducted; and (c) all dividends and distributions were reinvested. The line graph provides information for Class A shares only. As indicated in the tables provided earlier, performance for Class B, Class C, Class Q, Class R, and Class Z shares will vary due to the differing charges and expenses applicable to each share class (as indicated in the following paragraphs). Without waiver of fees and/or expense reimbursement, if any, the Fund’s returns would have been lower.
Past performance does not predict future performance. Total returns and the ending account values in the graphs include changes in share price and reinvestment of dividends and capital gains distributions in a hypothetical investment for the periods shown. The Fund’s total returns do not reflect the deduction of income taxes on an individual’s investment. Taxes may reduce your actual investment returns on income or gains paid by the Fund or any gains you may realize if you sell your shares.
Source: Prudential Investments LLC and Lipper Inc.
Inception returns are provided for any share class with less than 10 calendar years of returns.
The returns in the tables do not reflect the deduction of taxes that a shareholder would pay on Fund distributions or following the redemption of Fund shares. The average annual total returns take into account applicable sales charges, which are described for each share class in the table below.
| | | | | | | | | | | | |
| | Class A | | Class B* | | Class C | | Class Q | | Class R | | Class Z |
Maximum initial sales charge | | 4.50% of
the public
offering
price | | None | | None | | None | | None | | None |
Contingent deferred sales charge (CDSC) (as a percentage of the lower of original purchase price or net asset value at redemption) | | 1% on sales
of $1 million
or more
made within
12 months of
purchase | | 5% (Yr. 1)
4% (Yr. 2)
3% (Yr. 3)
2% (Yr. 4)
1% (Yr. 5)
1% (Yr. 6)
0% (Yr. 7) | | 1% on sales
made within
12 months
of purchase | | None | | None | | None |
Annual distribution and service (12b-1) fees (shown as a percentage of average daily net assets) | | .25% | | .75% | | 1% | | None | | .75%
(.50%
currently) | | None |
*Class B shares are closed to all purchase activity and no additional Class B shares may be purchased or acquired except by exchange from Class B shares of another Fund or through dividend or capital gains reinvestment.
| | |
| 4 | | Visit our website at www.prudentialfunds.com |
Benchmark Definitions
Barclays US Corporate High Yield 1% Issuer Capped Index
The Barclays US Corporate High Yield 1% Issuer Capped Index (the Index) is an unmanaged index which covers the universe of US dollar-denominated, non-convertible, fixed rate, non-investment-grade debt. Issuers are capped at 1% of the Index. Index holdings must have at least one year to final maturity, at least $150 million par amount outstanding, and be publicly issued with a rating of Ba1 or lower. The cumulative total return for the Index measured from the month-end closest to the inception date for Class Q shares through 8/31/15 is 27.83%. The average annual total return for the Index measured from the month-end closest to the inception date for Class Q shares through 9/30/15 is 5.79%.
Lipper High Yield Funds Average
The Lipper High Yield Funds Average (Lipper Average) is based on the average return of all funds in the Lipper High Yield Funds category for the periods noted. Funds in the Lipper Average aim at high (relative) current yield from fixed income securities, have no quality or maturity restrictions, and tend to invest in lower-grade debt issues. The cumulative total return for the Lipper Average measured from the month-end closest to the inception date for Class Q shares through 8/31/15 is 24.44%. The average annual total return for the Lipper Average measured from the month-end closest to the inception date for Class Q shares through 9/30/15 is 5.02%.
Investors cannot invest directly in an index or average. The returns for the Index would be lower if they included the effects of sales charges, operating expenses of a mutual fund, or taxes. Returns for the Lipper Average reflect the deduction of operating expenses, but not sales charges or taxes. The Since Inception returns for the Index and the Lipper Average are measured from the closest month-end to the inception date for the indicated share class.
| | | | |
| Prudential High Yield Fund | | | 5 | |
Your Fund’s Performance (continued)
| | | | | | | | | | | | |
Distributions and Yields as of 8/31/15 | | | | | | | | | |
| | | Total Distributions
Paid for 12 Months | | | 30-Day Subsidized SEC Yield* | | | 30-Day Unsubsidized
SEC Yield** | |
Class A | | $ | 0.34 | | | | 6.02 | % | | | 6.02 | % |
Class B | | | 0.31 | | | | 5.80 | | | | 5.80 | |
Class C | | | 0.30 | | | | 5.55 | | | | 5.55 | |
Class Q | | | 0.36 | | | | 6.69 | | | | 6.69 | |
Class R | | | 0.33 | | | | 6.05 | | | | 5.79 | |
Class Z | | | 0.36 | | | | 6.54 | | | | 6.54 | |
*SEC 30-Day Subsidized Yield (%)—A standardized yield calculation created by the Securities and Exchange Commission, it reflects the income earned during a 30-day period, after the deduction of the fund’s net expenses (net of any expense waivers or reimbursements).
**SEC 30-Day Unsubsidized Yield (%)—A standardized yield calculation created by the Securities and Exchange Commission, it reflects the income earned during a 30-day period, after the deduction of the Fund’s gross expenses.
| | | | |
Credit Quality expressed as a percentage of total investments as of 8/31/15 | |
BBB | | | 2.2 | % |
BB | | | 40.7 | |
B | | | 40.7 | |
CCC | | | 13.9 | |
Not Rated | | | 0.0 | |
Cash/Cash Equivalents | | | 2.5 | |
Total Investments | | | 100.0 | % |
Source: Prudential Investment Management, Inc. (PIM)
Credit ratings reflect the highest rating assigned by a nationally recognized statistical rating organization (NRSRO) such as Moody’s Investor Service, Inc. (Moody’s), Standard & Poor’s (S&P), or Fitch, Inc. (Fitch). Credit ratings reflect the common nomenclature used by both S&P and Fitch. Where applicable, ratings are converted to the comparable S&P/Fitch rating tier nomenclature. These rating agencies are independent and are widely used. The Not Rated category consists of securities that have not been rated by a NRSRO. Credit ratings are subject to change.
| | |
| 6 | | Visit our website at www.prudentialfunds.com |
Strategy and Performance Overview
How did the Fund perform?
The Prudential High Yield Fund’s Class A shares returned –1.39% during the 12-month reporting period that ended August 31, 2015. The Fund’s Class A shares outperformed the –3.06% return of the Barclays US Corporate High Yield 1% Issuer Capped Index (the Index) and the –3.38% return of the Lipper High Yield Funds Average.
What were conditions like in the US high yield corporate bond market?
| | • | | High yield corporate bonds struggled throughout the reporting period. The broad high yield corporate bond market (as represented by the Index) faced several hurdles, including continued volatility in oil prices, investor concerns about Federal Reserve (Fed) rate hikes, weakness in the Chinese equity market, fears of a global recession, and uncertainty regarding the Greek debt situation. |
| | • | | With the exception of energy and metals and mining companies, the performance of high yield corporate bonds was driven by the ongoing search for yield, against a backdrop of generally strong fundamentals for high yield issuers and default rates that remained well below historical averages. |
| | • | | Overall, high yield debt securities with healthier fundamentals performed best. Higher-quality bonds rated BB returned 0.2% during the period, outperforming lower-quality bonds rated B and CCC, which declined 3.2% and 10.6%, respectively. |
| | • | | Among the best performers in the Index were certain financials, including banks and Real Estate Investment Trusts (REITs), as well as consumer-oriented sectors, such as airlines, health care and pharmaceutical, and consumer non-cyclical. Commodity-related sectors, such as energy and metals and mining, were by far the worst performers, with energy declining nearly 20%. Aerospace and defense also retreated, declining 5.1% for the period. |
What strategies proved most beneficial to the Fund’s performance?
| | • | | The Fund benefited from strong sector and security selection during the reporting period. |
| | • | | Underweights relative to the Index in the energy and metals and mining sectors, which sold off significantly, were the largest positive contributors to performance. |
| | • | | The Fund’s overweight positions in the technology, gaming, and utilities sectors added to returns. |
| | | | |
| Prudential High Yield Fund | | | 7 | |
Strategy and Performance Overview (continued)
| | • | | Solid security selection in the gaming, retail, restaurants, energy, and utilities sectors enhanced results. |
| | • | | In terms of individual issue selection, the Fund benefited from its underweight in energy names, including oil and natural gas companies Linn Energy, Sandridge Energy, and Chesapeake Energy Corporation. A lack of exposure to Index names in the mining sector, including Alpha Natural Resources and Cliffs Natural Resources, was also positive. |
What strategies detracted most from the Fund’s performance?
| | • | | Relative to the Index, the Fund’s underweight positions in the banking, telecommunications, cable and satellite, media and entertainment, and consumer sectors hurt performance, as these sectors all outperformed the overall high yield market. |
| | • | | The Fund was hampered by security selection within the technology, finance, chemicals, and telecommunications sectors. |
| | • | | In terms of individual issue selection, the largest individual detractors from Fund performance were overweight positions in independent oil and gas exploration company Samson Resources, collection agency Transworld Systems, specialty chemical maker Momentive Specialty Chemicals Holdings, and telecommunications and data networking equipment manufacturer Nortel Network. |
Did the Fund use derivatives and how did they affect performance?
Derivatives were used in the Fund and are instrumental in attaining specific exposures targeted to gain from anticipated market developments. On various occasions throughout the reporting period, the Fund used the Markit CDX HighYield Index to obtain broad market exposure, which added modestly to the Fund’s performance. The Markit CDX HY is based on a basket of 100 equally weighted credit default swaps on high yield issuers. A credit default swap is similar to buying or selling insurance contracts on a corporation’s debt.
| | |
| 8 | | Visit our website at www.prudentialfunds.com |
Fees and Expenses (Unaudited)
As a shareholder of the Fund, you incur two types of costs: (1) transaction costs, including sales charges (loads) on purchase payments and redemptions, as applicable, and (2) ongoing costs, including management fees, distribution and/or service (12b-1) fees, and other Fund expenses, as applicable. This example is intended to help you understand your ongoing costs (in dollars) of investing in the Fund and to compare these costs with the ongoing costs of investing in other mutual funds.
The example is based on an investment of $1,000 invested on March 1, 2015, at the beginning of the period, and held through the six-month period ended August 31, 2015. The example is for illustrative purposes only; you should consult the Prospectus for information on initial and subsequent minimum investment requirements.
Actual Expenses
The first line for each share class in the table on the following page provides information about actual account values and actual expenses. You may use the information on this line, together with the amount you invested, to estimate the expenses that you paid over the period. Simply divide your account value by $1,000 (for example, an $8,600 account value ÷ $1,000 = 8.6), then multiply the result by the number on the first line under the heading “Expenses Paid During the Six-Month Period” to estimate the expenses you paid on your account during this period.
Hypothetical Example for Comparison Purposes
The second line for each share class in the table on the following page provides information about hypothetical account values and hypothetical expenses based on the Fund’s actual expense ratio and an assumed rate of return of 5% per year before expenses, which is not the Fund’s actual return. The hypothetical account values and expenses may not be used to estimate the actual ending account balance or expenses you paid for the period. You may use this information to compare the ongoing costs of investing in the Fund and other funds. To do so, compare this 5% hypothetical example with the 5% hypothetical examples that appear in the shareholder reports of the other funds.
The Fund’s transfer agent may charge additional fees to holders of certain accounts that are not included in the expenses shown in the table on the following page. These fees apply to individual retirement accounts (IRAs) and Section 403(b) accounts. As of the close of the six-month period covered by the table, IRA fees included an annual maintenance fee of $15 per account (subject to a maximum annual maintenance fee of $25 for all accounts held by the same shareholder). Section 403(b) accounts are charged an annual $25 fiduciary maintenance fee. Some of the fees may vary in amount, or may be waived, based on your total account balance or the number of
| | | | |
| Prudential High Yield Fund | | | 9 | |
Fees and Expenses (continued)
Prudential Investments funds, including the Fund, that you own. You should consider the additional fees that were charged to your Fund account over the six-month period when you estimate the total ongoing expenses paid over the period and the impact of these fees on your ending account value, as these additional expenses are not reflected in the information provided in the expense table. Additional fees have the effect of reducing investment returns.
Please note that the expenses shown in the table are meant to highlight your ongoing costs only and do not reflect any transactional costs such as sales charges (loads). Therefore, the second line for each share class in the table is useful in comparing ongoing costs only and will not help you determine the relative total costs of owning different funds. In addition, if these transactional costs were included, your costs would have been higher.
| | | | | | | | | | | | | | | | | | |
Prudential High
Yield Fund | | Beginning Account
Value
March 1, 2015 | | | Ending Account
Value
August 31, 2015 | | | Annualized
Expense Ratio
Based on the
Six-Month Period | | | Expenses Paid
During the
Six-Month Period* | |
| | | | | | | | | | | | | | | | | | |
| Class A | | Actual | | $ | 1,000.00 | | | $ | 987.10 | | | | 0.83 | % | | $ | 4.16 | |
| | | Hypothetical | | $ | 1,000.00 | | | $ | 1,021.02 | | | | 0.83 | % | | $ | 4.23 | |
| | | | | | | | | | | | | | | | | | |
| Class B | | Actual | | $ | 1,000.00 | | | $ | 984.60 | | | | 1.33 | % | | $ | 6.65 | |
| | | Hypothetical | | $ | 1,000.00 | | | $ | 1,018.50 | | | | 1.33 | % | | $ | 6.77 | |
| | | | | | | | | | | | | | | | | | |
| Class C | | Actual | | $ | 1,000.00 | | | $ | 983.30 | | | | 1.58 | % | | $ | 7.90 | |
| | | Hypothetical | | $ | 1,000.00 | | | $ | 1,017.24 | | | | 1.58 | % | | $ | 8.03 | |
| | | | | | | | | | | | | | | | | | |
| Class Q | | Actual | | $ | 1,000.00 | | | $ | 988.90 | | | | 0.46 | % | | $ | 2.31 | |
| | | Hypothetical | | $ | 1,000.00 | | | $ | 1,022.89 | | | | 0.46 | % | | $ | 2.35 | |
| | | | | | | | | | | | | | | | | | |
| Class R | | Actual | | $ | 1,000.00 | | | $ | 985.90 | | | | 1.08 | % | | $ | 5.41 | |
| | | Hypothetical | | $ | 1,000.00 | | | $ | 1,019.76 | | | | 1.08 | % | | $ | 5.50 | |
| | | | | | | | | | | | | | | | | | |
| Class Z | | Actual | | $ | 1,000.00 | | | $ | 988.50 | | | | 0.58 | % | | $ | 2.91 | |
| | | Hypothetical | | $ | 1,000.00 | | | $ | 1,022.28 | | | | 0.58 | % | | $ | 2.96 | |
*Fund expenses (net of fee waivers or subsidies, if any) for each share class are equal to the annualized expense ratio for each share class (provided in the table), multiplied by the average account value over the period, multiplied by the 184 days in the six-month period ended August 31, 2015, and divided by the 365 days in the Fund’s fiscal year ended August 31, 2015 (to reflect the six-month period). Expenses presented in the table include the expenses of any underlying portfolios in which the Fund may invest.
| | |
| 10 | | Visit our website at www.prudentialfunds.com |
The Fund’s annualized expense ratios for the 12-month period ended August 31, 2015, are as follows:
| | | | | | | | |
| Class | | Gross Operating Expenses | | | Net Operating Expenses | |
A | | | 0.85 | % | | | 0.83 | % |
B | | | 1.33 | | | | 1.33 | |
C | | | 1.58 | | | | 1.58 | |
Q | | | 0.46 | | | | 0.46 | |
R | | | 1.33 | | | | 1.08 | |
Z | | | 0.58 | | | | 0.58 | |
Net operating expenses shown above reflect fee waivers and/or expense reimbursements. Additional information on Fund expenses and any fee waivers and/or expense reimbursements can be found in the “Financial Highlights” tables in this report and in the Notes to the Financial Statements in this report.
| | | | |
| Prudential High Yield Fund | | | 11 | |
Portfolio of Investments
as of August 31, 2015
| | | | | | | | | | | | | | |
| Description | | Interest
Rate | | Maturity
Date | | | Principal
Amount (000)# | | | Value (Note 1) | |
LONG-TERM INVESTMENTS 95.4% | |
|
ASSET-BACKED SECURITIES(a) 0.1% | |
|
Collateralized Loan Obligations | |
Baker Street CLO II Ltd. (Cayman Islands), Series 2006-1A, Class E, 144A | | 4.239% | | | 10/15/19 | | | | 2,851 | | | $ | 2,771,388 | |
Bridgeport CLO Ltd., Series 2007-2A, Class D, 144A(b) | | 4.536 | | | 06/18/21 | | | | 2,261 | | | | 2,135,517 | |
| | | | | | | | | | | | | | |
TOTAL ASSET-BACKED SECURITIES
(cost $3,302,637) | | | | | | | | | | | | | 4,906,905 | |
| | | | | | | | | | | | | | |
|
BANK LOANS(a) 1.4% | |
|
Capital Goods 0.1% | |
Neff Rental LLC | | 7.250 | | | 06/09/21 | | | | 4,573 | | | | 4,459,073 | |
|
Chemicals 0.2% | |
Solenis International LP | | 7.750 | | | 07/29/22 | | | | 7,500 | | | | 7,200,000 | |
|
Energy - Other | |
Amern Energy Marcellus LLC | | 8.500 | | | 08/04/21 | | | | 3,825 | | | | 1,013,625 | |
|
Gaming 0.2% | |
CCM Merger, Inc. | | 4.500 | | | 08/06/21 | | | | 3,114 | | | | 3,112,003 | |
Golden Nugget, Inc. | | 5.500 | | | 11/21/19 | | | | 1,448 | | | | 1,450,033 | |
| | | | | | | | | | | | | | |
| | | | | | | | | | | | | 4,562,036 | |
|
Healthcare & Pharmaceutical | |
Radnet Mgmt., Inc. | | 8.000 | | | 03/25/21 | | | | 480 | | | | 472,200 | |
|
Lodging 0.1% | |
Four Seasons Holdings, Inc. | | 6.250 | | | 12/28/20 | | | | 1,750 | | | | 1,750,000 | |
|
Technology 0.8% | |
Evergreen Skills Lux Sarl (Luxembourg) | | 9.250 | | | 04/28/22 | | | | 16,500 | | | | 14,547,506 | |
Kronos, Inc. | | 9.750 | | | 04/30/20 | | | | 11,934 | | | | 12,212,887 | |
| | | | | | | | | | | | | | |
| | | | | | | | | | | | | 26,760,393 | |
| | | | | | | | | | | | | | |
TOTAL BANK LOANS
(cost $50,968,137) | | | | | | | | | | | | | 46,217,327 | |
| | | | | | | | | | | | | | |
See Notes to Financial Statements.
| | | | |
| Prudential High Yield Fund | | | 13 | |
Portfolio of Investments
as of August 31, 2015 continued
| | | | | | | | | | | | | | |
| Description | | Interest
Rate | | Maturity
Date | | | Principal
Amount (000)# | | | Value (Note 1) | |
CORPORATE BONDS 93.7% | |
|
Aerospace & Defense 1.2% | |
Bombardier, Inc. (Canada), | | | | | | | | | | | | | | |
Sr. Unsec’d. Notes, 144A(c) | | 5.750% | | | 03/15/22 | | | | 2,250 | | | $ | 1,676,250 | |
Sr. Unsec’d. Notes, 144A(c) | | 6.000 | | | 10/15/22 | | | | 3,525 | | | | 2,643,750 | |
Sr. Unsec’d. Notes, 144A(c) | | 6.125 | | | 01/15/23 | | | | 2,832 | | | | 2,109,840 | |
Sr. Unsec’d. Notes, 144A(c) | | 7.500 | | | 03/15/25 | | | | 3,275 | | | | 2,480,812 | |
LMI Aerospace, Inc., Sec’d. Notes | | 7.375 | | | 07/15/19 | | | | 3,925 | | | | 3,787,625 | |
Orbital ATK, Inc., Gtd. Notes | | 5.250 | | | 10/01/21 | | | | 3,050 | | | | 3,111,000 | |
Sequa Corp., Gtd. Notes, 144A
(original cost $2,019,250; purchased 12/10/12)(b)(c)(d) | | 7.000 | | | 12/15/17 | | | | 2,050 | | | | 1,066,000 | |
StandardAero Aviation Holdings, Inc., Gtd. Notes, 144A | | 10.000 | | | 07/15/23 | | | | 7,000 | | | | 6,877,500 | |
TransDigm, Inc., | | | | | | | | | | | | | | |
Gtd. Notes(c) | | 6.000 | | | 07/15/22 | | | | 6,325 | | | | 6,231,074 | |
Gtd. Notes | | 6.500 | | | 07/15/24 | | | | 4,830 | | | | 4,721,325 | |
Gtd. Notes(c) | | 7.500 | | | 07/15/21 | | | | 5,200 | | | | 5,538,000 | |
| | | | | | | | | | | | | | |
| | | | | | | | | | | | | 40,243,176 | |
|
Automotive 3.1% | |
American Axle & Manufacturing, Inc., | | | | | | | | | | | | | | |
Gtd. Notes | | 6.250 | | | 03/15/21 | | | | 5,225 | | | | 5,329,500 | |
Gtd. Notes | | 6.625 | | | 10/15/22 | | | | 275 | | | | 280,500 | |
Gtd. Notes | | 7.750 | | | 11/15/19 | | | | 700 | | | | 780,500 | |
American Tire Distributors, Inc.,
Sr. Subordinated, 144A | | 10.250 | | | 03/01/22 | | | | 12,000 | | | | 12,300,000 | |
Dana Holding Corp., | | | | | | | | | | | | | | |
Sr. Unsec’d. Notes | | 5.375 | | | 09/15/21 | | | | 2,550 | | | | 2,556,375 | |
Sr. Unsec’d. Notes | | 6.750 | | | 02/15/21 | | | | 5,785 | | | | 6,016,400 | |
Fiat Chrysler Automobiles NV (United Kingdom), Sr. Unsec’d. Notes | | 5.250 | | | 04/15/23 | | | | 5,875 | | | | 5,808,906 | |
Gates Global LLC/Gates Global Co., Gtd. Notes, 144A (original cost $9,700,000; purchased 06/12/14)(b)(c)(d) | | 6.000 | | | 07/15/22 | | | | 9,700 | | | | 7,906,470 | |
General Motors Co., Sr. Unsec’d. Notes | | 4.875 | | | 10/02/23 | | | | 2,225 | | | | 2,265,751 | |
Jaguar Land Rover Automotive PLC
(United Kingdom), Gtd. Notes, 144A | | 5.625 | | | 02/01/23 | | | | 650 | | | | 649,188 | |
Lear Corp., | | | | | | | | | | | | | | |
Gtd. Notes | | 4.750 | | | 01/15/23 | | | | 775 | | | | 769,188 | |
Gtd. Notes | | 5.250 | | | 01/15/25 | | | | 8,700 | | | | 8,656,500 | |
See Notes to Financial Statements.
| | | | | | | | | | | | | | |
| Description | | Interest
Rate | | Maturity
Date | | | Principal
Amount (000)# | | | Value (Note 1) | |
CORPORATE BONDS (Continued) | |
|
Automotive (cont’d.) | |
Meritor, Inc., | | | | | | | | | | | | | | |
Gtd. Notes(c) | | 6.250% | | | 02/15/24 | | | | 5,575 | | | $ | 5,400,781 | |
Gtd. Notes | | 6.750 | | | 06/15/21 | | | | 8,180 | | | | 8,302,700 | |
Omega US Sub. LLC, Sr. Unsec’d. Notes, 144A(c) | | 8.750 | | | 07/15/23 | | | | 7,425 | | | | 6,793,875 | |
Schaeffler Finance BV (Germany), Sr. Sec’d. Notes, 144A | | 4.750 | | | 05/15/23 | | | | 7,200 | | | | 6,930,000 | |
Schaeffler Holding Finance BV (Germany), Sr. Sec’d. Notes, PIK, 144A(c) | | 6.750 | | | 11/15/22 | | | | 1,800 | | | | 1,921,500 | |
Titan International, Inc., Sr. Sec’d. Notes(c) | | 6.875 | | | 10/01/20 | | | | 4,350 | | | | 3,893,250 | |
ZF North America Capital, Inc. (Germany), | | | | | | | | | | | | | | |
Gtd. Notes, 144A(c) | | 4.500 | | | 04/29/22 | | | | 6,775 | | | | 6,563,281 | |
Gtd. Notes, 144A(c) | | 4.750 | | | 04/29/25 | | | | 8,825 | | | | 8,361,687 | |
| | | | | | | | | | | | | | |
| | | | | | | | | | | | | 101,486,352 | |
| | | | |
Banking 1.9% | | | | | | | | | | | | | | |
Ally Financial, Inc., Sr. Unsec’d. Notes(c) | | 3.750 | | | 11/18/19 | | | | 4,050 | | | | 4,039,875 | |
Bank of America Corp., | | | | | | | | | | | | | | |
Jr. Sub. Notes(c) | | 5.200(a) | | | 12/31/49 | | | | 2,975 | | | | 2,809,144 | |
Jr. Sub. Notes | | 6.100(a) | | | 12/31/49 | | | | 6,875 | | | | 6,711,719 | |
Jr. Sub. Notes | | 6.250(a) | | | 12/31/49 | | | | 2,025 | | | | 2,004,750 | |
Citigroup, Inc., | | | | | | | | | | | | | | |
Jr. Sub. Notes(c) | | 5.800(a) | | | 12/31/49 | | | | 9,440 | | | | 9,354,379 | |
Jr. Sub. Notes | | 5.875(a) | | | 12/31/49 | | | | 4,050 | | | | 4,012,031 | |
Jr. Sub. Notes(c) | | 5.950(a) | | | 12/31/49 | | | | 11,975 | | | | 11,451,094 | |
Goldman Sachs Group, Inc. (The), Jr. Sub. Notes | | 5.375(a) | | | 12/31/49 | | | | 3,875 | | | | 3,795,078 | |
JPMorgan Chase & Co., | | | | | | | | | | | | | | |
Jr. Sub. Notes, Series X | | 6.100(a) | | | 12/31/49 | | | | 797 | | | | 795,749 | |
Jr. Sub. Notes | | 6.125(a) | | | 12/31/49 | | | | 1,530 | | | | 1,530,000 | |
Morgan Stanley, | | | | | | | | | | | | | | |
Jr. Sub. Notes | | 5.450(a) | | | 12/31/49 | | | | 5,025 | | | | 4,987,312 | |
Jr. Sub. Notes(c) | | 5.550(a) | | | 12/31/49 | | | | 6,550 | | | | 6,541,812 | |
Wells Fargo & Co., Jr. Sub. Notes | | 5.900(a) | | | 12/31/49 | | | | 5,025 | | | | 5,043,844 | |
| | | | | | | | | | | | | | |
| | | | | | | | | | | | | 63,076,787 | |
See Notes to Financial Statements.
| | | | |
| Prudential High Yield Fund | | | 15 | |
Portfolio of Investments
as of August 31, 2015 continued
| | | | | | | | | | | | | | |
| Description | | Interest
Rate | | Maturity
Date | | | Principal
Amount (000)# | | | Value (Note 1) | |
CORPORATE BONDS (Continued) | |
| | | | |
Building Materials & Construction 5.0% | | | | | | | | | | | | | | |
Beazer Homes USA, Inc., | | | | | | | | | | | | | | |
Gtd. Notes(c) | | 5.750% | | | 06/15/19 | | | | 7,225 | | | $ | 6,954,062 | |
Gtd. Notes(c) | | 7.250 | | | 02/01/23 | | | | 4,525 | | | | 4,332,688 | |
Gtd. Notes | | 7.500 | | | 09/15/21 | | | | 6,625 | | | | 6,496,607 | |
Gtd. Notes(c) | | 9.125 | | | 05/15/19 | | | | 4,250 | | | | 4,335,000 | |
Brookfield Residential Properties, Inc. (Canada), | | | | | | | | | | | | | | |
Gtd. Notes, 144A | | 6.500 | | | 12/15/20 | | | | 700 | | | | 698,250 | |
Sr. Notes, 144A(c) | | 6.375 | | | 05/15/25 | | | | 4,100 | | | | 3,966,750 | |
Brookfield Residential Properties, Inc./Brookfield Residential US Corp. (Canada), Gtd. Notes, 144A | | 6.125 | | | 07/01/22 | | | | 6,623 | | | | 6,424,310 | |
Builders FirstSource, Inc., Gtd. Notes, 144A(c) | | 10.750 | | | 08/15/23 | | | | 9,150 | | | | 9,287,250 | |
Building Materials Corp. of America, | | | | | | | | | | | | | | |
Sr. Unsec’d. Notes, 144A (original cost $6,245,000; purchased 10/27/14)(b)(d) | | 5.375 | | | 11/15/24 | | | | 6,245 | | | | 6,245,000 | |
Sr. Unsec’d. Notes, 144A (original cost $2,215,000; purchased 04/19/13)(b)(d) | | 6.750 | | | 05/01/21 | | | | 2,000 | | | | 2,092,500 | |
Cemex Finance LLC (Mexico), Sr. Sec’d. Notes, 144A(c) | | 9.375 | | | 10/12/22 | | | | 7,400 | | | | 8,269,500 | |
Cemex SAB de CV (Mexico), Sr. Sec’d. Notes, 144A | | 5.700 | | | 01/11/25 | | | | 1,250 | | | | 1,171,875 | |
D.R. Horton, Inc., | | | | | | | | | | | | | | |
Gtd. Notes | | 4.750 | | | 02/15/23 | | | | 10,300 | | | | 10,351,500 | |
Gtd. Notes | | 6.500 | | | 04/15/16 | | | | 100 | | | | 102,125 | |
HD Supply, Inc., Sr. Sec’d. Notes, 144A(c) | | 5.250 | | | 12/15/21 | | | | 4,825 | | | | 4,957,688 | |
James Hardie International Finance Ltd. (Australia), Gtd. Notes, 144A | | 5.875 | | | 02/15/23 | | | | 4,050 | | | | 4,171,500 | |
KB Home, | | | | | | | | | | | | | | |
Gtd. Notes | | 7.000 | | | 12/15/21 | | | | 2,800 | | | | 2,828,000 | |
Gtd. Notes(c) | | 7.500 | | | 09/15/22 | | | | 5,420 | | | | 5,582,600 | |
Gtd. Notes | | 7.625 | | | 05/15/23 | | | | 4,725 | | | | 4,843,125 | |
Lennar Corp., Gtd. Notes(c) | | 4.750 | | | 05/30/25 | | | | 6,575 | | | | 6,377,750 | |
Meritage Homes Corp., Gtd. Notes | | 6.000 | | | 06/01/25 | | | | 3,575 | | | | 3,604,029 | |
Ryland Group, Inc. (The), Gtd. Notes | | 5.375 | | | 10/01/22 | | | | 3,675 | | | | 3,702,563 | |
Shea Homes LP/Shea Homes Funding Corp., | | | | | | | | | | | | | | |
Sr. Unsec’d. Notes, 144A | | 5.875 | | | 04/01/23 | | | | 2,000 | | | | 2,045,000 | |
Sr. Unsec’d. Notes, 144A | | 6.125 | | | 04/01/25 | | | | 5,750 | | | | 5,879,375 | |
See Notes to Financial Statements.
| | | | | | | | | | | | | | |
| Description | | Interest
Rate | | Maturity
Date | | | Principal
Amount (000)# | | | Value (Note 1) | |
CORPORATE BONDS (Continued) | |
| | | | |
Building Materials & Construction (cont’d.) | | | | | | | | | | | | | | |
Standard Pacific Corp., | | | | | | | | | | | | | | |
Gtd. Notes | | 5.875% | | | 11/15/24 | | | | 1,752 | | | $ | 1,795,800 | |
Gtd. Notes | | 6.250 | | | 12/15/21 | | | | 5,975 | | | | 6,348,437 | |
Gtd. Notes(c) | | 8.375 | | | 01/15/21 | | | | 2,700 | | | | 3,172,500 | |
Gtd. Notes | | 10.750 | | | 09/15/16 | | | | 2,725 | | | | 2,970,250 | |
Summit Materials LLC/Summit Materials Finance Corp., Sr. Unsec’d. Notes, 144A (original cost $6,725,000; purchased 06/23/15)(b)(d) | | 6.125 | | | 07/15/23 | | | | 6,725 | | | | 6,691,375 | |
Taylor Morrison Communities, Inc./Monarch Communities, Inc., | | | | | | | | | | | | | | |
Gtd. Notes, 144A(c) | | 5.625 | | | 03/01/24 | | | | 4,300 | | | | 4,192,500 | |
Gtd. Notes, 144A | | 5.875 | | | 04/15/23 | | | | 8,400 | | | | 8,421,000 | |
Toll Brothers Finance Corp., Gtd. Notes | | 4.000 | | | 12/31/18 | | | | 600 | | | | 612,000 | |
USG Corp., Gtd. Notes, 144A(c) | | 5.500 | | | 03/01/25 | | | | 725 | | | | 721,375 | |
WCI Communities, Inc., Gtd. Notes | | 6.875 | | | 08/15/21 | | | | 9,375 | | | | 9,820,312 | |
William Lyon Homes, Inc., Gtd. Notes | | 7.000 | | | 08/15/22 | | | | 5,775 | | | | 5,962,688 | |
| | | | | | | | | | | | | | |
| | | | | | | | | | | | | 165,427,284 | |
| | | | |
Cable 3.6% | | | | | | | | | | | | | | |
Cablevision Systems Corp., | | | | | | | | | | | | | | |
Sr. Unsec’d. Notes(c) | | 7.750 | | | 04/15/18 | | | | 3,000 | | | | 3,232,200 | |
Sr. Unsec’d. Notes | | 8.625 | | | 09/15/17 | | | | 8,475 | | | | 9,258,937 | |
CCO Holdings LLC/CCO Holdings Capital Corp., | | | | | | | | | | | | | | |
Gtd. Notes(c) | | 5.250 | | | 03/15/21 | | | | 620 | | | | 626,200 | |
Gtd. Notes | | 5.250 | | | 09/30/22 | | | | 500 | | | | 504,000 | |
Gtd. Notes(c) | | 5.750 | | | 09/01/23 | | | | 4,729 | | | | 4,822,634 | |
Gtd. Notes(c) | | 5.750 | | | 01/15/24 | | | | 1,230 | | | | 1,254,600 | |
Gtd. Notes, 144A(c) | | 5.125 | | | 05/01/23 | | | | 2,650 | | | | 2,650,000 | |
Gtd. Notes, 144A | | 5.375 | | | 05/01/25 | | | | 3,150 | | | | 3,059,438 | |
Gtd. Notes, 144A(c) | | 5.875 | | | 05/01/27 | | | | 23,017 | | | | 22,556,660 | |
Cequel Communications Holdings I LLC/Cequel Capital Corp., | | | | | | | | | | | | | | |
Sr. Unsec’d. Notes, 144A(c) | | 5.125 | | | 12/15/21 | | | | 8,960 | | | | 8,209,600 | |
Sr. Unsec’d. Notes, 144A | | 5.125 | | | 12/15/21 | | | | 10,090 | | | | 9,244,962 | |
Sr. Unsec’d. Notes, 144A | | 6.375 | | | 09/15/20 | | | | 5,025 | | | | 4,933,294 | |
See Notes to Financial Statements.
| | | | |
| Prudential High Yield Fund | | | 17 | |
Portfolio of Investments
as of August 31, 2015 continued
| | | | | | | | | | | | | | |
| Description | | Interest
Rate | | Maturity
Date | | | Principal
Amount (000)# | | | Value (Note 1) | |
CORPORATE BONDS (Continued) | |
| | | | |
Cable (cont’d.) | | | | | | | | | | | | | | |
CSC Holdings LLC, | | | | | | | | | | | | | | |
Sr. Unsec’d. Notes | | 6.750% | | | 11/15/21 | | | | 1,600 | | | $ | 1,678,000 | |
Sr. Unsec’d. Notes | | 7.625 | | | 07/15/18 | | | | 875 | | | | 958,125 | |
DISH DBS Corp., | | | | | | | | | | | | | | |
Gtd. Notes(c) | | 5.875 | | | 07/15/22 | | | | 3,075 | | | | 2,907,812 | |
Gtd. Notes | | 5.875 | | | 11/15/24 | | | | 4,025 | | | | 3,667,781 | |
Inmarsat Finance PLC (United Kingdom), Gtd. Notes, 144A | | 4.875 | | | 05/15/22 | | | | 3,700 | | | | 3,596,030 | |
Intelsat Jackson Holdings SA (Luxembourg), | | | | | | | | | | | | | | |
Gtd. Notes(c) | | 5.500 | | | 08/01/23 | | | | 12,750 | | | | 11,220,000 | |
Gtd. Notes(c) | | 7.250 | | | 10/15/20 | | | | 4,600 | | | | 4,421,750 | |
Mediacom Broadband LLC/Mediacom Broadband Corp., Gtd. Notes | | 5.500 | | | 04/15/21 | | | | 3,799 | | | | 3,723,020 | |
Midcontinent Communications & Midcontinent Finance Corp., Gtd. Notes, 144A | | 6.875 | | | 08/15/23 | | | | 2,975 | | | | 2,997,313 | |
Quebecor Media, Inc. (Canada),
Sr. Unsec’d. Notes | | 5.750 | | | 01/15/23 | | | | 10,266 | | | | 10,368,660 | |
Unitymedia KabelBW GmbH (Germany), Gtd. Notes, 144A | | 6.125 | | | 01/15/25 | | | | 2,875 | | | | 2,946,875 | |
| | | | | | | | | | | | | | |
| | | | | | | | | | | | | 118,837,891 | |
| | | | |
Capital Goods 7.5% | | | | | | | | | | | | | | |
ADS Waste Holdings, Inc., Gtd. Notes | | 8.250 | | | 10/01/20 | | | | 5,025 | | | | 5,200,875 | |
AECOM Technology Corp., Gtd. Notes, 144A(c) | | 5.875 | | | 10/15/24 | | | | 10,025 | | | | 10,100,187 | |
Ahern Rentals, Inc., Sec’d. Notes, 144A(c) | | 7.375 | | | 05/15/23 | | | | 5,325 | | | | 4,659,375 | |
Anixter, Inc., Gtd. Notes, 144A | | 5.500 | | | 03/01/23 | | | | 5,800 | | | | 5,800,000 | |
Apex Tool Group LLC, Gtd. Notes, 144A
(original cost $1,880,000; purchased 09/17/14)(b)(c)(d) | | 7.000 | | | 02/01/21 | | | | 2,000 | | | | 1,680,000 | |
Ashtead Capital, Inc. (United Kingdom), Sec’d. Notes, 144A | | 6.500 | | | 07/15/22 | | | | 8,700 | | | | 9,048,000 | |
ATS Automation Tooling Systems, Inc. (Canada), Sr. Unsec’d. Notes, 144A | | 6.500 | | | 06/15/23 | | | | 4,400 | | | | 4,433,000 | |
Belden, Inc., Gtd. Notes, 144A(c) | | 5.500 | | | 09/01/22 | | | | 3,800 | | | | 3,743,000 | |
BlueLine Rental Finance Corp., Sec’d. Notes, 144A (original cost $2,062,875; purchased 01/16/14-02/12/14)(b)(c)(d) | | 7.000 | | | 02/01/19 | | | | 2,025 | | | | 1,913,625 | |
See Notes to Financial Statements.
| | | | | | | | | | | | | | |
| Description | | Interest
Rate | | Maturity
Date | | | Principal
Amount (000)# | | | Value (Note 1) | |
CORPORATE BONDS (Continued) | |
| | | | |
Capital Goods (cont’d.) | | | | | | | | | | | | | | |
Brand Energy & Infrastructure Services, Inc., Gtd. Notes, 144A (original cost $4,650,000; purchased 11/22/13)(b)(d) | | 8.500% | | | 12/01/21 | | | | 4,650 | | | $ | 4,161,750 | |
Case New Holland, Inc., Gtd. Notes | | 7.875 | | | 12/01/17 | | | | 4,335 | | | | 4,698,706 | |
CBRE Services, Inc., Gtd. Notes | | 5.000 | | | 03/15/23 | | | | 7,575 | | | | 7,647,175 | |
Clean Harbors, Inc., | | | | | | | | | | | | | | |
Gtd. Notes | | 5.125 | | | 06/01/21 | | | | 3,200 | | | | 3,231,680 | |
Gtd. Notes | | 5.250 | | | 08/01/20 | | | | 4,900 | | | | 4,998,000 | |
Cleaver-Brooks, Inc., Sr. Sec’d. Notes, 144A (original cost $4,857,500; purchased 04/08/13-12/11/14)(b)(d) | | 8.750 | | | 12/15/19 | | | | 4,500 | | | | 4,325,625 | |
CNH Industrial Capital LLC, Gtd. Notes(c) | | 3.625 | | | 04/15/18 | | | | 3,027 | | | | 3,004,298 | |
Dycom Investments, Inc., Gtd. Notes | | 7.125 | | | 01/15/21 | | | | 5,275 | | | | 5,499,187 | |
EnPro Industries, Inc., Gtd. Notes | | 5.875 | | | 09/15/22 | | | | 4,575 | | | | 4,597,875 | |
General Cable Corp., Gtd. Notes | | 5.750 | | | 10/01/22 | | | | 5,487 | | | | 4,910,865 | |
Greystar Real Estate Partners LLC, Sr. Sec’d. Notes, 144A (original cost $6,000,000; purchased 11/10/14)(b)(d) | | 8.250 | | | 12/01/22 | | | | 6,000 | | | | 6,255,000 | |
Griffon Corp., Gtd. Notes | | 5.250 | | | 03/01/22 | | | | 11,500 | | | | 11,011,250 | |
H&E Equipment Services, Inc., Gtd. Notes(c) | | 7.000 | | | 09/01/22 | | | | 12,255 | | | | 12,193,725 | |
Hill-Rom Holdings, Inc., Sr. Unsec’d. Notes, 144A | | 5.750 | | | 09/01/23 | | | | 2,425 | | | | 2,467,438 | |
International Wire Group Holdings, Inc., Sec’d. Notes, 144A | | 8.500 | | | 10/15/17 | | | | 5,925 | | | | 6,102,750 | |
Jurassic Holdings III, Inc., Sec’d. Notes, 144A (original cost $11,404,406; purchased 01/24/14-05/06/15)(b)(c)(d) | | 6.875 | | | 02/15/21 | | | | 11,760 | | | | 8,261,400 | |
Laureate Education, Inc., Gtd. Notes, 144A(c) | | 10.000 | | | 09/01/19 | | | | 16,645 | | | | 13,960,994 | |
Manitowoc Co., Inc. (The), Gtd. Notes | | 5.875 | | | 10/15/22 | | | | 2,450 | | | | 2,613,202 | |
Modular Space Corp., Sec’d. Notes, 144A (original cost $1,700,000; purchased 02/19/14)(b)(c)(d) | | 10.250 | | | 01/31/19 | | | | 1,700 | | | | 1,241,000 | |
NES Rentals Holdings, Inc., Sec’d. Notes, 144A (original cost $7,483,674; purchased 04/12/13-11/10/14)(b)(d) | | 7.875 | | | 05/01/18 | | | | 7,359 | | | | 7,303,807 | |
Safway Group Holding LLC/Safway Finance Corp., Sec’d. Notes, 144A | | 7.000 | | | 05/15/18 | | | | 2,000 | | | | 2,039,780 | |
See Notes to Financial Statements.
| | | | |
| Prudential High Yield Fund | | | 19 | |
Portfolio of Investments
as of August 31, 2015 continued
| | | | | | | | | | | | | | |
| Description | | Interest
Rate | | Maturity
Date | | | Principal
Amount (000)# | | | Value (Note 1) | |
CORPORATE BONDS (Continued) | |
| | | | |
Capital Goods (cont’d.) | | | | | | | | | | | | | | |
Signode Industrial Group Lux SA/Signode Industrial Group US, Inc., Sr. Unsec’d. Notes, 144A (original cost $12,981,063; purchased 04/07/14-07/11/14)(b)(c)(d) | | 6.375% | | | 05/01/22 | | | | 12,900 | | | $ | 12,448,500 | |
Terex Corp., | | | | | | | | | | | | | | |
Gtd. Notes | | 6.000 | | | 05/15/21 | | | | 6,175 | | | | 6,236,750 | |
Gtd. Notes | | 6.500 | | | 04/01/20 | | | | 4,225 | | | | 4,383,437 | |
Unifrax I LLC/Unifrax Holding Co., Gtd. Notes, 144A (original cost $5,471,120; purchased 10/10/13-02/02/15)(b)(d) | | 7.500 | | | 02/15/19 | | | | 5,404 | | | | 5,390,490 | |
United Rentals North America, Inc., | | | | | | | | | | | | | | |
Gtd. Notes(c) | | 5.500 | | | 07/15/25 | | | | 6,150 | | | | 5,934,750 | |
Gtd. Notes(c) | | 5.750 | | | 11/15/24 | | | | 4,775 | | | | 4,703,375 | |
Gtd. Notes(c) | | 6.125 | | | 06/15/23 | | | | 2,700 | | | | 2,754,000 | |
Gtd. Notes | | 7.375 | | | 05/15/20 | | | | 2,400 | | | | 2,547,000 | |
Gtd. Notes | | 7.625 | | | 04/15/22 | | | | 15,930 | | | | 17,164,575 | |
Gtd. Notes | | 8.250 | | | 02/01/21 | | | | 3,213 | | | | 3,397,748 | |
Vander Intermediate Holding II Corp.,
Sr. Unsec’d. Notes, PIK, 144A | | 9.750 | | | 02/01/19 | | | | 8,100 | | | | 7,067,250 | |
WireCo WorldGroup, Inc., Gtd. Notes(c) | | 9.500 | | | 05/15/17 | | | | 9,675 | | | | 8,223,750 | |
| | | | | | | | | | | | | | |
| | | | | | | | | | | | | 247,355,194 | |
| | | | |
Chemicals 3.9% | | | | | | | | | | | | | | |
A Schulman, Inc., Gtd. Notes, 144A(c) | | 6.875 | | | 06/01/23 | | | | 6,400 | | | | 6,368,000 | |
Axalta Coating Systems U.S. Holdings, Inc./Axalta Coating Systems Dutch Holdings, Inc., Gtd. Notes, 144A | | 7.375 | | | 05/01/21 | | | | 7,600 | | | | 8,131,240 | |
Axiall Corp., Gtd. Notes(c) | | 4.875 | | | 05/15/23 | | | | 2,100 | | | | 2,037,000 | |
Chemours Co./The, | | | | | | | | | | | | | | |
Sr. Unsec’d. Notes, 144A(c) | | 6.625 | | | 05/15/23 | | | | 5,950 | | | | 5,176,500 | |
Sr. Unsec’d. Notes, 144A(c) | | 7.000 | | | 05/15/25 | | | | 5,700 | | | | 4,873,500 | |
Chemtura Corp., Gtd. Notes | | 5.750 | | | 07/15/21 | | | | 16,155 | | | | 16,195,387 | |
Eagle Spinco, Inc., Gtd. Notes(c) | | 4.625 | | | 02/15/21 | | | | 2,675 | | | | 2,608,125 | |
Hexion U.S. Finance Corp., | | | | | | | | | | | | | | |
Sec’d. Notes | | 9.000 | | | 11/15/20 | | | | 21,905 | | | | 15,004,925 | |
Sr. Sec’d. Notes(c) | | 6.625 | | | 04/15/20 | | | | 11,475 | | | | 10,700,438 | |
Sr. Sec’d. Notes(c) | | 8.875 | | | 02/01/18 | | | | 7,750 | | | | 6,742,500 | |
Sr. Sec’d. Notes | | 10.000 | | | 04/15/20 | | | | 4,575 | | | | 4,666,500 | |
See Notes to Financial Statements.
| | | | | | | | | | | | | | |
| Description | | Interest
Rate | | Maturity
Date | | | Principal
Amount (000)# | | | Value (Note 1) | |
CORPORATE BONDS (Continued) | |
| | | | |
Chemicals (cont’d.) | | | | | | | | | | | | | | |
Koppers, Inc., Gtd. Notes | | 7.875% | | | 12/01/19 | | | | 9,259 | | | $ | 9,421,033 | |
Platform Specialty Products Corp., Sr. Unsec’d. Notes, 144A | | 6.500 | | | 02/01/22 | | | | 8,925 | | | | 8,642,345 | |
Rentech Nitrogen Partners LP/Rentech Nitrogen Finance Corp., Sec’d. Notes, 144A | | 6.500 | | | 04/15/21 | | | | 8,350 | | | | 8,446,192 | |
TPC Group, Inc., Sr. Sec’d. Notes, 144A (original cost $15,970,188; purchased 12/11/12-02/20/15)(b)(c)(d) | | 8.750 | | | 12/15/20 | | | | 15,750 | | | | 14,096,250 | |
Tronox Finance LLC, Gtd. Notes(c) | | 6.375 | | | 08/15/20 | | | | 5,587 | | | | 4,581,340 | |
| | | | | | | | | | | | | | |
| | | | | | | | | | | | | 127,691,275 | |
| | | | |
Consumer 2.1% | | | | | | | | | | | | | | |
Carlson Wagonlit BV (Netherlands), Sr. Sec’d. Notes, 144A (original cost $3,100,000; purchased 05/09/12)(b)(d) | | 6.875 | | | 06/15/19 | | | | 3,100 | | | | 3,255,000 | |
Energizer Spinco, Inc., Sr. Unsec’d. Notes, 144A | | 5.500 | | | 06/15/25 | | | | 3,775 | | | | 3,675,906 | |
First Quality Finance Co., Inc., Sr. Unsec’d. Notes, 144A | | 4.625 | | | 05/15/21 | | | | 5,970 | | | | 5,611,800 | |
Hearthside Group Holdings LLC/Hearthside Finance Co., Gtd. Notes, 144A | | 6.500 | | | 05/01/22 | | | | 5,825 | | | | 5,475,500 | |
Interval Acquisition Corp., Gtd. Notes, 144A | | 5.625 | | | 04/15/23 | | | | 4,800 | | | | 4,740,000 | |
Service Corp. International, | | | | | | | | | | | | | | |
Sr. Unsec’d. Notes | | 5.375 | | | 01/15/22 | | | | 975 | | | | 1,022,531 | |
Sr. Unsec’d. Notes | | 5.375 | | | 05/15/24 | | | | 8,775 | | | | 9,126,000 | |
Spectrum Brands Escrow Corp., Gtd. Notes | | 6.375 | | | 11/15/20 | | | | 4,125 | | | | 4,367,344 | |
Spectrum Brands, Inc., Gtd. Notes, 144A(c) | | 5.750 | | | 07/15/25 | | | | 4,800 | | | | 4,944,000 | |
Springs Industries, Inc., Sr. Sec’d. Notes | | 6.250 | | | 06/01/21 | | | | 20,336 | | | | 20,183,480 | |
West Corp., Gtd. Notes, 144A(c) | | 5.375 | | | 07/15/22 | | | | 6,025 | | | | 5,663,500 | |
| | | | | | | | | | | | | | |
| | | | | | | | | | | | | 68,065,061 | |
| | | | |
Electric 6.2% | | | | | | | | | | | | | | |
AES Corp. (The), | | | | | | | | | | | | | | |
Sr. Unsec’d. Notes(c) | | 4.875 | | | 05/15/23 | | | | 2,375 | | | | 2,208,750 | |
Sr. Unsec’d. Notes(c) | | 5.500 | | | 03/15/24 | | | | 2,375 | | | | 2,268,125 | |
Sr. Unsec’d. Notes(c) | | 7.375 | | | 07/01/21 | | | | 12,798 | | | | 13,789,845 | |
Calpine Corp., | | | | | | | | | | | | | | |
Sr. Sec’d. Notes, 144A | | 6.000 | | | 01/15/22 | | | | 1,475 | | | | 1,569,031 | |
Sr. Sec’d. Notes, 144A(c) | | 7.875 | | | 01/15/23 | | | | 6,770 | | | | 7,243,900 | |
See Notes to Financial Statements.
| | | | |
| Prudential High Yield Fund | | | 21 | |
Portfolio of Investments
as of August 31, 2015 continued
| | | | | | | | | | | | | | |
| Description | | Interest
Rate | | Maturity
Date | | | Principal
Amount (000)# | | | Value (Note 1) | |
CORPORATE BONDS (Continued) | |
| | | | |
Electric (cont’d.) | | | | | | | | | | | | | | |
Calpine Corp., (Continued) | | | | | | | | | | | | | | |
Sr. Unsec’d. Notes(c) | | 5.375% | | | 01/15/23 | | | | 11,125 | | | $ | 10,732,287 | |
Sr. Unsec’d. Notes | | 5.500 | | | 02/01/24 | | | | 13,900 | | | | 13,413,500 | |
Sr. Unsec’d. Notes(c) | | 5.750 | | | 01/15/25 | | | | 5,900 | | | | 5,715,625 | |
Covanta Holding Corp., | | | | | | | | | | | | | | |
Sr. Unsec’d. Notes | | 5.875 | | | 03/01/24 | | | | 2,075 | | | | 2,023,125 | |
Sr. Unsec’d. Notes(c) | | 6.375 | | | 10/01/22 | | | | 1,975 | | | | 2,029,313 | |
Sr. Unsec’d. Notes | | 7.250 | | | 12/01/20 | | | | 750 | | | | 782,850 | |
DPL, Inc., | | | | | | | | | | | | | | |
Sr. Unsec’d. Notes | | 6.500 | | | 10/15/16 | | | | 787 | | | | 806,675 | |
Sr. Unsec’d. Notes | | 6.750 | | | 10/01/19 | | | | 4,275 | | | | 4,467,375 | |
Sr. Unsec’d. Notes | | 7.250 | | | 10/15/21 | | | | 16,230 | | | | 16,737,187 | |
Dynegy, Inc., | | | | | | | | | | | | | | |
Gtd. Notes(c) | | 5.875 | | | 06/01/23 | | | | 7,925 | | | | 7,568,375 | |
Gtd. Notes | | 7.375 | | | 11/01/22 | | | | 29,025 | | | | 30,040,875 | |
Gtd. Notes | | 7.625 | | | 11/01/24 | | | | 14,360 | | | | 14,945,888 | |
GenOn Americas Generation LLC, Sr. Unsec’d. Notes | | 8.500 | | | 10/01/21 | | | | 1,000 | | | | 870,000 | |
GenOn Energy, Inc., | | | | | | | | | | | | | | |
Sr. Unsec’d. Notes | | 7.875 | | | 06/15/17 | | | | 1,950 | | | | 1,862,250 | |
Sr. Unsec’d. Notes(c) | | 9.500 | | | 10/15/18 | | | | 3,375 | | | | 3,244,219 | |
Sr. Unsec’d. Notes(c) | | 9.875 | | | 10/15/20 | | | | 13,825 | | | | 13,064,625 | |
InterGen NV (Netherlands), Sr. Sec’d. Notes, 144A (original cost $4,212,047; purchased 06/07/13-04/09/15)(b)(d) | | 7.000 | | | 06/30/23 | | | | 4,300 | | | | 3,751,750 | |
Mirant Corp., Bonds, 144A(b)(e) | | 7.400 | | | 07/15/49 | | | | 2,675 | | | | 2,675 | |
Mirant Mid Atlantic LLC, | | | | | | | | | | | | | | |
Pass-Through Certificates, Series B | | 9.125 | | | 06/30/17 | | | | 1,726 | | | | 1,795,496 | |
Pass-Through Certificates, Series C(c) | | 10.060 | | | 12/30/28 | | | | 706 | | | | 725,347 | |
NRG Energy, Inc., | | | | | | | | | | | | | | |
Gtd. Notes(c) | | 6.250 | | | 07/15/22 | | | | 9,167 | | | | 8,937,825 | |
Gtd. Notes(c) | | 6.250 | | | 05/01/24 | | | | 9,200 | | | | 8,740,000 | |
Gtd. Notes | | 7.625 | | | 01/15/18 | | | | 3,425 | | | | 3,613,375 | |
Gtd. Notes(c) | | 7.875 | | | 05/15/21 | | | | 4,980 | | | | 5,141,850 | |
Gtd. Notes | | 8.250 | | | 09/01/20 | | | | 4,125 | | | | 4,259,063 | |
NRG REMA LLC, | | | | | | | | | | | | | | |
Pass-Through Certificates, Series B(b) | | 9.237 | | | 07/02/17 | | | | 117 | | | | 123,258 | |
Pass-Through Certificates, Series C | | 9.681 | | | 07/02/26 | | | | 7,565 | | | | 7,716,300 | |
See Notes to Financial Statements.
| | | | | | | | | | | | | | |
| Description | | Interest
Rate | | Maturity
Date | | | Principal
Amount (000)# | | | Value (Note 1) | |
CORPORATE BONDS (Continued) | |
| | | | |
Electric (cont’d.) | | | | | | | | | | | | | | |
Red Oak Power LLC, Sr. Sec’d. Notes (original cost $224,500; purchased 05/27/15)(b)(d) | | 9.200% | | | 11/30/29 | | | | 200 | | | $ | 224,000 | |
RJS Power Holdings LLC, Gtd. Notes, 144A | | 4.625(a) | | | 07/15/19 | | | | 5,125 | | | | 4,843,125 | |
| | | | | | | | | | | | | | |
| | | | | | | | | | | | | 205,257,884 | |
| | | | |
Energy - Integrated 0.1% | | | | | | | | | | | | | | |
Pacific Rubiales Energy Corp. (Colombia), Gtd. Notes, 144A | | 5.375 | | | 01/26/19 | | | | 5,000 | | | | 2,700,000 | |
| | | | |
Energy - Other 4.7% | | | | | | | | | | | | | | |
Antero Resources Corp., Gtd. Notes | | 5.125 | | | 12/01/22 | | | | 2,100 | | | | 1,900,941 | |
Bonanza Creek Energy, Inc., | | | | | | | | | | | | | | |
Gtd. Notes | | 5.750 | | | 02/01/23 | | | | 2,625 | | | | 1,785,000 | |
Gtd. Notes(c) | | 6.750 | | | 04/15/21 | | | | 3,775 | | | | 2,793,500 | |
Bristow Group, Inc., Gtd. Notes | | 6.250 | | | 10/15/22 | | | | 3,100 | | | | 2,728,000 | |
California Resources Corp., | | | | | | | | | | | | | | |
Gtd. Notes(c) | | 5.500 | | | 09/15/21 | | | | 3,050 | | | | 2,364,909 | |
Gtd. Notes(c) | | 6.000 | | | 11/15/24 | | | | 18,800 | | | | 13,940,200 | |
CGG SA (France), | | | | | | | | | | | | | | |
Gtd. Notes(c) | | 6.500 | | | 06/01/21 | | | | 2,200 | | | | 1,237,500 | |
Gtd. Notes(c) | | 6.875 | | | 01/15/22 | | | | 1,465 | | | | 842,375 | |
Gtd. Notes | | 7.750 | | | 05/15/17 | | | | 523 | | | | 415,785 | |
Citgo Holding, Inc., Sr. Sec’d. Notes, 144A | | 10.750 | | | 02/15/20 | | | | 9,600 | | | | 9,480,000 | |
Concho Resources, Inc., | | | | | | | | | | | | | | |
Gtd. Notes | | 5.500 | | | 04/01/23 | | | | 1,835 | | | | 1,812,815 | |
Gtd. Notes(c) | | 6.500 | | | 01/15/22 | | | | 500 | | | | 510,105 | |
CSI Compressco LP/Compressco Finance, Inc., Gtd. Notes | | 7.250 | | | 08/15/22 | | | | 5,875 | | | | 4,817,500 | |
Endeavor Energy Resources LP/EER Finance, Inc., | | | | | | | | | | | | | | |
Sr. Unsec’d. Notes, 144A(c) | | 7.000 | | | 08/15/21 | | | | 5,395 | | | | 5,045,458 | |
Sr. Unsec’d. Notes, 144A | | 8.125 | | | 09/15/23 | | | | 2,450 | | | | 2,376,500 | |
EP Energy LLC/EP Energy Finance, Inc., Gtd. Notes(c) | | 9.375 | | | 05/01/20 | | | | 490 | | | | 474,565 | |
Halcon Resources Corp., Sec’d. Notes, 144A(c) | | 8.625 | | | 02/01/20 | | | | 3,950 | | | | 3,466,125 | |
Hilcorp Energy I LP/Hilcorp Finance Co., Sr. Unsec’d. Notes, 144A (original cost $9,450,000; purchased 05/20/15)(b)(d) | | 5.750 | | | 10/01/25 | | | | 9,450 | | | | 8,505,000 | |
See Notes to Financial Statements.
| | | | |
| Prudential High Yield Fund | | | 23 | |
Portfolio of Investments
as of August 31, 2015 continued
| | | | | | | | | | | | | | |
| Description | | Interest
Rate | | Maturity
Date | | | Principal
Amount (000)# | | | Value (Note 1) | |
CORPORATE BONDS (Continued) | |
| | | | |
Energy - Other (cont’d.) | | | | | | | | | | | | | | |
Hornbeck Offshore Services, Inc., Gtd. Notes | | 5.875% | | | 04/01/20 | | | | 3,175 | | | $ | 2,540,000 | |
Jupiter Resources, Inc. (Canada), Sr. Unsec’d. Notes, 144A (original cost $6,083,618; purchased 09/11/14)(b)(c)(d) | | 8.500 | | | 10/01/22 | | | | 6,350 | | | | 3,968,750 | |
MEG Energy Corp. (Canada), Gtd. Notes, 144A | | 6.500 | | | 03/15/21 | | | | 11,150 | | | | 9,315,825 | |
Memorial Resource Development Corp., Gtd. Notes(c) | | 5.875 | | | 07/01/22 | | | | 7,225 | | | | 6,574,750 | |
Newfield Exploration Co., | | | | | | | | | | | | | | |
Sr. Unsec’d. Notes | | 5.375 | | | 01/01/26 | | | | 6,025 | | | | 5,603,250 | |
Sr. Unsec’d. Notes | | 5.750 | | | 01/30/22 | | | | 1,906 | | | | 1,879,793 | |
Parker Drilling Co., Gtd. Notes(c) | | 7.500 | | | 08/01/20 | | | | 2,000 | | | | 1,670,000 | |
PHI, Inc., Gtd. Notes | | 5.250 | | | 03/15/19 | | | | 3,525 | | | | 3,022,687 | |
Pioneer Energy Services Corp., Gtd. Notes | | 6.125 | | | 03/15/22 | | | | 2,375 | | | | 1,353,750 | |
Precision Drilling Corp. (Canada), | | | | | | | | | | | | | | |
Gtd. Notes | | 6.500 | | | 12/15/21 | | | | 1,875 | | | | 1,593,750 | |
Gtd. Notes | | 6.625 | | | 11/15/20 | | | | 2,000 | | | | 1,760,000 | |
QEP Resources, Inc., | | | | | | | | | | | | | | |
Sr. Unsec’d. Notes | | 5.250 | | | 05/01/23 | | | | 2,550 | | | | 2,206,260 | |
Sr. Unsec’d. Notes | | 5.375 | | | 10/01/22 | | | | 2,300 | | | | 1,983,750 | |
Range Resources Corp., Gtd. Notes(c) | | 5.000 | | | 08/15/22 | | | | 2,014 | | | | 1,857,915 | |
Rice Energy, Inc., Gtd. Notes, 144A | | 7.250 | | | 05/01/23 | | | | 5,800 | | | | 5,394,000 | |
SESI LLC, Gtd. Notes(c) | | 6.375 | | | 05/01/19 | | | | 1,148 | | | | 1,142,260 | |
Seventy Seven Energy, Inc., Sr. Unsec’d. Notes(c) | | 6.500 | | | 07/15/22 | | | | 1,800 | | | | 837,000 | |
Triangle USA Petroleum Corp., Sr. Unsec’d. Notes, 144A | | 6.750 | | | 07/15/22 | | | | 5,170 | | | | 3,102,000 | |
Tullow Oil PLC (United Kingdom), Gtd. Notes, 144A | | 6.000 | | | 11/01/20 | | | | 7,150 | | | | 5,291,000 | |
Western Refining Logistics LP/WNRL Finance Corp., Gtd. Notes | | 7.500 | | | 02/15/23 | | | | 6,000 | | | | 6,060,000 | |
Western Refining, Inc., Gtd. Notes | | 6.250 | | | 04/01/21 | | | | 8,380 | | | | 8,296,200 | |
WPX Energy, Inc., | | | | | | | | | | | | | | |
Sr. Unsec’d. Notes(c) | | 6.000 | | | 01/15/22 | | | | 12,933 | | | | 10,928,385 | |
Sr. Unsec’d. Notes(c) | | 8.250 | | | 08/01/23 | | | | 4,925 | | | | 4,740,312 | |
| | | | | | | | | | | | | | |
| | | | | | | | | | | | | 155,617,915 | |
| | | | |
Foods 4.5% | | | | | | | | | | | | | | |
Acosta, Inc., Sr. Unsec’d. Notes, 144A(c) | | 7.750 | | | 10/01/22 | | | | 13,450 | | | | 13,323,839 | |
B&G Foods, Inc., Gtd. Notes | | 4.625 | | | 06/01/21 | | | | 4,200 | | | | 4,089,750 | |
See Notes to Financial Statements.
| | | | | | | | | | | | | | |
| Description | | Interest
Rate | | Maturity
Date | | | Principal
Amount (000)# | | | Value (Note 1) | |
CORPORATE BONDS (Continued) | |
| | | | |
Foods (cont’d.) | | | | | | | | | | | | | | |
Burger King Worldwide Funds (Canada), Sec’d. Notes, 144A(c) | | 6.000% | | | 04/01/22 | | | | 7,125 | | | $ | 7,338,750 | |
CEC Entertainment, Inc., Gtd. Notes(c) | | 8.000 | | | 02/15/22 | | | | 10,350 | | | | 10,350,000 | |
Cott Beverages, Inc. (Canada), Gtd. Notes | | 6.750 | | | 01/01/20 | | | | 5,275 | | | | 5,472,813 | |
Darling Ingredients, Inc., Gtd. Notes(c) | | 5.375 | | | 01/15/22 | | | | 4,950 | | | | 4,888,125 | |
Ingles Markets, Inc., Sr. Unsec’d. Notes | | 5.750 | | | 06/15/23 | | | | 6,050 | | | | 6,186,125 | |
JBS USA LLC/JBS USA Finance, Inc. (Brazil), | | | | | | | | | | | | | | |
Gtd. Notes, 144A (original cost $7,437,875; purchased 09/13/13-10/15/13)(b)(d) | | 7.250 | | | 06/01/21 | | | | 7,450 | | | | 7,775,937 | |
Gtd. Notes, 144A (original cost $3,537,130; purchased 05/20/11-11/16/11)(b)(c)(d) | | 7.250 | | | 06/01/21 | | | | 3,675 | | | | 3,835,781 | |
Sr. Unsec’d. Notes, 144A (original cost $6,615,000; purchased 05/20/15)(b)(d) | | 5.750 | | | 06/15/25 | | | | 6,615 | | | | 6,416,550 | |
Sr. Unsec’d. Notes, 144A (original cost $6,448,688; purchased 06/11/14-07/04/14)(b)(c)(d) | | 5.875 | | | 07/15/24 | | | | 6,450 | | | | 6,425,812 | |
Landry’s, Inc., Gtd. Notes, 144A (original cost $10,932,069; purchased 04/19/12-02/10/15)(b)(d) | | 9.375 | | | 05/01/20 | | | | 10,590 | | | | 11,318,062 | |
Pilgrim’s Pride Corp., Gtd. Notes, 144A(c) | | 5.750 | | | 03/15/25 | | | | 3,300 | | | | 3,374,250 | |
Post Holdings, Inc., | | | | | | | | | | | | | | |
Gtd. Notes(c) | | 7.375 | | | 02/15/22 | | | | 10,900 | | | | 11,172,500 | |
Gtd. Notes, 144A(c) | | 6.000 | | | 12/15/22 | | | | 9,325 | | | | 8,998,625 | |
Gtd. Notes, 144A(c) | | 6.750 | | | 12/01/21 | | | | 3,375 | | | | 3,400,313 | |
Gtd. Notes, 144A(c) | | 8.000 | | | 07/15/25 | | | | 5,575 | | | | 5,756,188 | |
Roundy’s Supermarkets, Inc., Sec’d. Notes, 144A | | 10.250 | | | 12/15/20 | | | | 5,275 | | | | 4,114,500 | |
Smithfield Foods, Inc., | | | | | | | | | | | | | | |
Sr. Unsec’d. Notes | | 6.625 | | | 08/15/22 | | | | 2,600 | | | | 2,765,750 | |
Sr. Unsec’d. Notes, 144A | | 5.875 | | | 08/01/21 | | | | 6,084 | | | | 6,312,150 | |
SUPERVALU, Inc., Sr. Unsec’d. Notes(c) | | 7.750 | | | 11/15/22 | | | | 2,875 | | | | 2,975,625 | |
Tops Holding LLC/Tops Markets II Corp., Sr. Sec’d. Notes, 144A (original cost $6,850,000; purchased 05/29/15)(b)(d) | | 8.000 | | | 06/15/22 | | | | 6,850 | | | | 6,815,750 | |
TreeHouse Foods, Inc., Gtd. Notes(c) | | 4.875 | | | 03/15/22 | | | | 1,000 | | | | 992,500 | |
Wok Acquisition Corp., Gtd. Notes, 144A(c) | | 10.250 | | | 06/30/20 | | | | 2,721 | | | | 2,721,000 | |
| | | | | | | | | | | | | | |
| | | | | | | | | | | | | 146,820,695 | |
See Notes to Financial Statements.
| | | | |
| Prudential High Yield Fund | | | 25 | |
Portfolio of Investments
as of August 31, 2015 continued
| | | | | | | | | | | | | | |
| Description | | Interest
Rate | | Maturity
Date | | | Principal
Amount (000)# | | | Value (Note 1) | |
CORPORATE BONDS (Continued) | |
| | | | |
Gaming 4.9% | | | | | | | | | | | | | | |
Boyd Gaming Corp., | | | | | | | | | | | | | | |
Gtd. Notes(c) | | 6.875% | | | 05/15/23 | | | | 11,529 | | | $ | 11,846,047 | |
Gtd. Notes | | 9.000 | | | 07/01/20 | | | | 7,191 | | | | 7,712,347 | |
CCM Merger, Inc., Gtd. Notes, 144A (original cost $13,837,063; purchased 03/14/12-05/21/14)(b)(c)(d) | | 9.125 | | | 05/01/19 | | | | 13,700 | | | | 14,590,500 | |
Eldorado Resorts, Inc., Sr. Unsec’d. Notes, 144A(c) | | 7.000 | | | 08/01/23 | | | | 10,225 | | | | 10,148,312 | |
GLP Capital LP/GLP Financing II, Inc., | | | | | | | | | | | | | | |
Gtd. Notes(c) | | 4.875 | | | 11/01/20 | | | | 400 | | | | 414,000 | |
Gtd. Notes(c) | | 5.375 | | | 11/01/23 | | | | 5,677 | | | | 5,889,888 | |
Golden Nugget Escrow, Inc., Sr. Unsec’d. Notes, 144A(c) | | 8.500 | | | 12/01/21 | | | | 12,725 | | | | 13,074,937 | |
Isle of Capri Casinos, Inc., | | | | | | | | | | | | | | |
Gtd. Notes(c) | | 5.875 | | | 03/15/21 | | | | 1,717 | | | | 1,768,510 | |
Gtd. Notes(c) | | 8.875 | | | 06/15/20 | | | | 4,675 | | | | 5,013,938 | |
MGM Resorts International, | | | | | | | | | | | | | | |
Gtd. Notes(c) | | 5.250 | | | 03/31/20 | | | | 3,500 | | | | 3,517,500 | |
Gtd. Notes(c) | | 6.625 | | | 12/15/21 | | | | 14,746 | | | | 15,667,625 | |
Gtd. Notes | | 7.625 | | | 01/15/17 | | | | 1,500 | | | | 1,578,750 | |
Gtd. Notes | | 8.625 | | | 02/01/19 | | | | 1,050 | | | | 1,173,060 | |
Penn National Gaming, Inc., Sr. Unsec’d. Notes(c) | | 5.875 | | | 11/01/21 | | | | 13,620 | | | | 13,824,300 | |
Pinnacle Entertainment, Inc., | | | | | | | | | | | | | | |
Gtd. Notes | | 6.375 | | | 08/01/21 | | | | 2,233 | | | | 2,378,145 | |
Gtd. Notes(c) | | 7.750 | | | 04/01/22 | | | | 5,811 | | | | 6,421,155 | |
Scientific Games International, Inc., | | | | | | | | | | | | | | |
Gtd. Notes(c) | | 6.625 | | | 05/15/21 | | | | 27,450 | | | | 20,313,000 | |
Gtd. Notes | | 10.000 | | | 12/01/22 | | | | 2,375 | | | | 2,179,063 | |
Sr. Sec’d. Notes, 144A | | 7.000 | | | 01/01/22 | | | | 3,725 | | | | 3,808,813 | |
Station Casinos LLC, Gtd. Notes | | 7.500 | | | 03/01/21 | | | | 5,465 | | | | 5,781,424 | |
Sugarhouse HSP Gaming Prop Mezz LP/Sugarhouse HSP Gaming Finance Corp., Sr. Sec’d. Notes, 144A (original cost $14,016,313; purchased 05/16/13-05/14/15)(b)(d) | | 6.375 | | | 06/01/21 | | | | 14,200 | | | | 13,490,000 | |
| | | | | | | | | | | | | | |
| | | | | | | | | | | | | 160,591,314 | |
See Notes to Financial Statements.
| | | | | | | | | | | | | | |
| Description | | Interest
Rate | | Maturity
Date | | | Principal
Amount (000)# | | | Value (Note 1) | |
CORPORATE BONDS (Continued) | |
| | | | |
Healthcare & Pharmaceutical 9.2% | | | | | | | | | | | | | | |
Acadia Healthcare Co., Inc., | | | | | | | | | | | | | | |
Gtd. Notes | | 5.625% | | | 02/15/23 | | | | 2,950 | | | $ | 3,007,345 | |
Gtd. Notes | | 6.125 | | | 03/15/21 | | | | 2,870 | | | | 2,963,275 | |
Gtd. Notes | | 12.875 | | | 11/01/18 | | | | 2,003 | | | | 2,153,225 | |
Amsurg Corp., Gtd. Notes | | 5.625 | | | 07/15/22 | | | | 2,200 | | | | 2,245,386 | |
Capsugel SA, Sr. Unsec’d. Notes, PIK, 144A | | 7.000 | | | 05/15/19 | | | | 6,475 | | | | 6,523,562 | |
Centene Corp., Sr. Unsec’d. Notes | | 4.750 | | | 05/15/22 | | | | 6,075 | | | | 6,154,704 | |
CHS/Community Health Systems, Inc., | | | | | | | | | | | | | | |
Gtd. Notes(c) | | 6.875 | | | 02/01/22 | | | | 9,500 | | | | 10,096,695 | |
Gtd. Notes | | 8.000 | | | 11/15/19 | | | | 13,077 | | | | 13,665,465 | |
ConvaTec Finance International SA (Luxembourg), Sr. Unsec’d. Notes, PIK, 144A(c) | | 8.250 | | | 01/15/19 | | | | 3,925 | | | | 3,866,125 | |
ConvaTec Healthcare E SA (Luxembourg), Gtd. Notes, 144A | | 10.500 | | | 12/15/18 | | | | 6,075 | | | | 6,318,000 | |
Davita Healthcare Partners, Inc., Gtd. Notes | | 5.000 | | | 05/01/25 | | | | 5,675 | | | | 5,561,500 | |
Emdeon, Inc., Gtd. Notes | | 11.000 | | | 12/31/19 | | | | 12,170 | | | | 13,067,537 | |
Endo Finance LLC, Gtd. Notes, 144A(c) | | 5.750 | | | 01/15/22 | | | | 2,525 | | | | 2,581,813 | |
Endo Finance LLC/Endo Ltd./Endo Finco, Inc, | | | | | | | | | | | | | | |
Gtd. Notes, 144A(c) | | 6.000 | | | 07/15/23 | | | | 5,700 | | | | 5,928,000 | |
Gtd. Notes, 144A(c) | | 6.000 | | | 02/01/25 | | | | 2,950 | | | | 3,031,125 | |
Grifols Worldwide Operations Ltd. (Spain), Gtd. Notes | | 5.250 | | | 04/01/22 | | | | 4,450 | | | | 4,522,313 | |
HCA Holdings, Inc., Sr. Unsec’d. Notes | | 6.250 | | | 02/15/21 | | | | 1,250 | | | | 1,356,250 | |
HCA, Inc., | | | | | | | | | | | | | | |
Gtd. Notes | | 5.375 | | | 02/01/25 | | | | 34,675 | | | | 35,195,125 | |
Gtd. Notes | | 7.190 | | | 11/15/15 | | | | 3,537 | | | | 3,571,450 | |
Gtd. Notes | | 7.500 | | | 11/15/95 | | | | 2,700 | | | | 2,646,000 | |
Gtd. Notes | | 8.000 | | | 10/01/18 | | | | 3,234 | | | | 3,711,015 | |
Sr. Sec’d. Notes | | 5.000 | | | 03/15/24 | | | | 2,400 | | | | 2,457,000 | |
HealthSouth Corp., | | | | | | | | | | | | | | |
Gtd. Notes | | 5.125 | | | 03/15/23 | | | | 1,525 | | | | 1,509,750 | |
Gtd. Notes | | 7.750 | | | 09/15/22 | | | | 1,153 | | | | 1,200,561 | |
Gtd. Notes, 144A | | 5.750 | | | 11/01/24 | | | | 5,475 | | | | 5,551,103 | |
Horizon Pharma Financing, Inc., Sr. Unsec’d. Notes, 144A | | 6.625 | | | 05/01/23 | | | | 9,075 | | | | 9,369,937 | |
Kindred Healthcare, Inc., | | | | | | | | | | | | | | |
Gtd. Notes | | 6.375 | | | 04/15/22 | | | | 3,550 | | | | 3,638,750 | |
Gtd. Notes, 144A | | 8.000 | | | 01/15/20 | | | | 4,725 | | | | 5,176,828 | |
Gtd. Notes, 144A(c) | | 8.750 | | | 01/15/23 | | | | 2,175 | | | | 2,436,000 | |
See Notes to Financial Statements.
| | | | |
| Prudential High Yield Fund | | | 27 | |
Portfolio of Investments
as of August 31, 2015 continued
| | | | | | | | | | | | | | |
| Description | | Interest
Rate | | Maturity
Date | | | Principal
Amount (000)# | | | Value (Note 1) | |
CORPORATE BONDS (Continued) | |
| | | | |
Healthcare & Pharmaceutical (cont’d.) | | | | | | | | | | | | | | |
LifePoint Hospitals, Inc., Gtd. Notes | | 5.500% | | | 12/01/21 | | | | 4,200 | | | $ | 4,375,875 | |
Mallinckrodt International Finance SA, Gtd. Notes | | 4.750 | | | 04/15/23 | | | | 6,925 | | | | 6,565,766 | |
Mallinckrodt International Finance SA/Mallinckrodt CB LLC, | | | | | | | | | | | | | | |
Gtd. Notes, 144A(c) | | 5.500 | | | 04/15/25 | | | | 1,400 | | | | 1,389,500 | |
Gtd. Notes, 144A | | 5.750 | | | 08/01/22 | | | | 400 | | | | 408,600 | |
MedAssets, Inc., Gtd. Notes | | 8.000 | | | 11/15/18 | | | | 5,850 | | | | 6,011,402 | |
Ortho Clinical Diagnostics, Inc., Sr. Unsec’d. Notes, 144A(c) | | 6.625 | | | 05/15/22 | | | | 23,225 | | | | 20,757,344 | |
Quintiles Transnational Corp., Gtd. Notes, 144A | | 4.875 | | | 05/15/23 | | | | 3,625 | | | | 3,697,500 | |
Select Medical Corp., Gtd. Notes | | 6.375 | | | 06/01/21 | | | | 13,550 | | | | 13,753,250 | |
Sterigenics-Nordion Holdings LLC, Sr. Unsec’d. Notes, 144A (original cost $2,725,000; purchased 05/08/15)(b)(d) | | 6.500 | | | 05/15/23 | | | | 2,725 | | | | 2,779,446 | |
Tenet Healthcare Corp., | | | | | | | | | | | | | | |
Sr. Sec’d. Notes | | 4.375 | | | 10/01/21 | | | | 5,575 | | | | 5,575,000 | |
Sr. Sec’d. Notes | | 4.500 | | | 04/01/21 | | | | 1,000 | | | | 1,005,000 | |
Sr. Sec’d. Notes | | 4.750 | | | 06/01/20 | | | | 3,425 | | | | 3,491,359 | |
Sr. Sec’d. Notes(c) | | 6.000 | | | 10/01/20 | | | | 1,625 | | | | 1,738,750 | |
Sr. Unsec’d. Notes | | 5.000 | | | 03/01/19 | | | | 1,600 | | | | 1,597,184 | |
Sr. Unsec’d. Notes(c) | | 6.750 | | | 02/01/20 | | | | 5,175 | | | | 5,459,625 | |
Sr. Unsec’d. Notes | | 6.750 | | | 06/15/23 | | | | 7,125 | | | | 7,338,750 | |
Sr. Unsec’d. Notes | | 8.125 | | | 04/01/22 | | | | 13,190 | | | | 14,607,925 | |
Valeant Pharmaceuticals International, Inc., | | | | | | | | | | | | | | |
Gtd. Notes, 144A | | 5.500 | | | 03/01/23 | | | | 3,400 | | | | 3,446,750 | |
Gtd. Notes, 144A | | 5.625 | | | 12/01/21 | | | | 1,750 | | | | 1,780,625 | |
Gtd. Notes, 144A(c) | | 5.875 | | | 05/15/23 | | | | 3,750 | | | | 3,825,000 | |
Gtd. Notes, 144A | | 7.500 | | | 07/15/21 | | | | 3,975 | | | | 4,268,156 | |
Sr. Unsec’d. Notes, 144A(c) | | 6.125 | | | 04/15/25 | | | | 19,865 | | | | 20,460,950 | |
| | | | | | | | | | | | | | |
| | | | | | | | | | | | | 303,839,596 | |
| | | | |
Insurance 0.1% | | | | | | | | | | | | | | |
CNO Financial Group, Inc., Sr. Unsec’d. Notes | | 5.250 | | | 05/30/25 | | | | 3,550 | | | | 3,660,938 | |
| | | | |
Lodging 0.7% | | | | | | | | | | | | | | |
Hilton Worldwide Finance LLC/Hilton Worldwide Finance Corp., Gtd. Notes | | 5.625 | | | 10/15/21 | | | | 9,075 | | | | 9,460,688 | |
See Notes to Financial Statements.
| | | | | | | | | | | | | | |
| Description | | Interest
Rate | | Maturity
Date | | | Principal
Amount (000)# | | | Value (Note 1) | |
CORPORATE BONDS (Continued) | |
| | | | |
Lodging (cont’d.) | | | | | | | | | | | | | | |
Royal Caribbean Cruises Ltd., Sr. Unsec’d. Notes | | 7.250% | | | 03/15/18 | | | | 2,300 | | | $ | 2,541,500 | |
Viking Cruises Ltd., | | | | | | | | | | | | | | |
Sr. Unsec’d. Notes, 144A (original cost $3,050,000; purchased 05/05/15)(b)(d) | | 6.250 | | | 05/15/25 | | | | 3,050 | | | | 3,004,250 | |
Sr. Unsec’d. Notes, 144A (original cost $6,734,250; purchased 07/17/14)(b)(d) | | 8.500 | | | 10/15/22 | | | | 6,150 | | | | 6,765,000 | |
| | | | | | | | | | | | | | |
| | | | | | | | | | | | | 21,771,438 | |
| | | | |
Media & Entertainment 3.3% | | | | | | | | | | | | | | |
AMC Entertainment, Inc., Gtd. Notes | | 5.750 | | | 06/15/25 | | | | 9,400 | | | | 9,353,000 | |
AMC Networks, Inc., Gtd. Notes | | 7.750 | | | 07/15/21 | | | | 2,808 | | | | 2,997,540 | |
Belo Corp., Sr. Unsec’d. Notes | | 7.750 | | | 06/01/27 | | | | 2,795 | | | | 3,046,550 | |
Cable One, Inc., Gtd. Notes, 144A | | 5.750 | | | 06/15/22 | | | | 4,075 | | | | 4,115,750 | |
Carmike Cinemas, Inc., Sec’d. Notes, 144A(c) | | 6.000 | | | 06/15/23 | | | | 4,550 | | | | 4,652,375 | |
Cedar Fair LP/Canada’s Wonderland Co./Magnum Management Corp., | | | | | | | | | | | | | | |
Gtd. Notes | | 5.250 | | | 03/15/21 | | | | 2,825 | | | | 2,874,438 | |
Gtd. Notes | | 5.375 | | | 06/01/24 | | | | 2,225 | | | | 2,258,375 | |
Cinemark USA, Inc., | | | | | | | | | | | | | | |
Gtd. Notes | | 4.875 | | | 06/01/23 | | | | 4,989 | | | | 4,864,275 | |
Gtd. Notes(c) | | 5.125 | | | 12/15/22 | | | | 5,775 | | | | 5,775,000 | |
Clear Channel Worldwide Holdings, Inc., | | | | | | | | | | | | | | |
Gtd. Notes | | 6.500 | | | 11/15/22 | | | | 3,069 | | | | 3,101,225 | |
Gtd. Notes | | 6.500 | | | 11/15/22 | | | | 3,074 | | | | 3,175,442 | |
Gtd. Notes(c) | | 7.625 | | | 03/15/20 | | | | 2,275 | | | | 2,331,875 | |
Entercom Radio LLC, Gtd. Notes | | 10.500 | | | 12/01/19 | | | | 3,425 | | | | 3,626,219 | |
Gannett Co., Inc., Gtd. Notes, 144A | | 5.500 | | | 09/15/24 | | | | 2,250 | | | | 2,227,500 | |
Gray Television, Inc., Gtd. Notes(c) | | 7.500 | | | 10/01/20 | | | | 7,300 | | | | 7,548,565 | |
Liberty Interactive LLC, Sr. Unsec’d. Notes | | 8.250 | | | 02/01/30 | | | | 2,000 | | | | 2,030,000 | |
LIN Television Corp., Gtd. Notes | | 6.375 | | | 01/15/21 | | | | 1,900 | | | | 1,923,750 | |
Live Nation Entertainment, Inc., Gtd. Notes, 144A | | 5.375 | | | 06/15/22 | | | | 2,500 | | | | 2,506,250 | |
Mood Media Corp. (Canada), Gtd. Notes, 144A | | 9.250 | | | 10/15/20 | | | | 3,825 | | | | 2,907,000 | |
NAI Entertainment Holdings/NAI Entertainment Holdings Finance, Sr. Sec’d. Notes, 144A (original cost $2,400,000; purchased 07/30/13)(b)(d) | | 5.000 | | | 08/01/18 | | | | 2,400 | | | | 2,448,000 | |
See Notes to Financial Statements.
| | | | |
| Prudential High Yield Fund | | | 29 | |
Portfolio of Investments
as of August 31, 2015 continued
| | | | | | | | | | | | | | |
| Description | | Interest
Rate | | Maturity
Date | | | Principal
Amount (000)# | | | Value (Note 1) | |
CORPORATE BONDS (Continued) | |
| | | | |
Media & Entertainment (cont’d.) | | | | | | | | | | | | | | |
National CineMedia LLC, Sr. Sec’d. Notes | | 6.000% | | | 04/15/22 | | | | 4,075 | | | $ | 4,166,687 | |
Nielsen Finance LLC/Nielsen Finance Co., Gtd. Notes, 144A | | 5.000 | | | 04/15/22 | | | | 2,925 | | | | 2,884,781 | |
Regal Entertainment Group, Sr. Unsec’d. Notes | | 5.750 | | | 02/01/25 | | | | 3,170 | | | | 3,074,900 | |
RR Donnelley & Sons Co., | | | | | | | | | | | | | | |
Sr. Unsec’d. Notes(c) | | 6.000 | | | 04/01/24 | | | | 3,350 | | | | 3,163,238 | |
Sr. Unsec’d. Notes(c) | | 6.500 | | | 11/15/23 | | | | 2,650 | | | | 2,550,625 | |
Sinclair Television Group, Inc., | | | | | | | | | | | | | | |
Gtd. Notes(c) | | 5.375 | | | 04/01/21 | | | | 5,050 | | | | 5,031,062 | |
Gtd. Notes(c) | | 6.125 | | | 10/01/22 | | | | 2,775 | | | | 2,788,875 | |
Gtd. Notes, 144A(c) | | 5.625 | | | 08/01/24 | | | | 2,000 | | | | 1,902,500 | |
Tribune Media Co., Gtd. Notes, 144A(c) | | 5.875 | | | 07/15/22 | | | | 7,375 | | | | 7,430,312 | |
| | | | | | | | | | | | | | |
| | | | | | | | | | | | | 106,756,109 | |
| | | | |
Metals 1.4% | | | | | | | | | | | | | | |
AK Steel Corp., Gtd. Notes(c) | | 7.625 | | | 10/01/21 | | | | 3,800 | | | | 2,384,500 | |
ArcelorMittal (Luxembourg), | | | | | | | | | | | | | | |
Sr. Unsec’d. Notes(c) | | 6.250 | | | 03/01/21 | | | | 6,700 | | | | 6,607,875 | |
Sr. Unsec’d. Notes(c) | | 7.000 | | | 02/25/22 | | | | 3,485 | | | | 3,476,287 | |
AuRico Gold, Inc. (Canada), Sec’d. Notes, 144A | | 7.750 | | | 04/01/20 | | | | 1,400 | | | | 1,260,000 | |
CONSOL Energy, Inc., Gtd. Notes(c) | | 5.875 | | | 04/15/22 | | | | 3,925 | | | | 2,806,375 | |
Eldorado Gold Corp. (Canada), Sr. Unsec’d. Notes, 144A | | 6.125 | | | 12/15/20 | | | | 1,870 | | | | 1,608,200 | |
First Quantum Minerals Ltd. (Canada), | | | | | | | | | | | | | | |
Gtd. Notes, 144A(c) | | 7.000 | | | 02/15/21 | | | | 2,581 | | | | 1,819,605 | |
Gtd. Notes, 144A | | 7.250 | | | 05/15/22 | | | | 650 | | | | 453,375 | |
FMG Resources (August 2006) Pty Ltd. (Australia), Gtd. Notes, 144A(c) | | 8.250 | | | 11/01/19 | | | | 10,825 | | | | 8,335,250 | |
Graftech International Ltd., Gtd. Notes | | 6.375 | | | 11/15/20 | | | | 1,925 | | | | 1,520,750 | |
JMC Steel Group, Inc., Sr. Unsec’d. Notes, 144A(c) | | 8.250 | | | 03/15/18 | | | | 3,864 | | | | 3,062,220 | |
Lundin Mining Corp. (Canada), Sr. Sec’d. Notes, 144A | | 7.500 | | | 11/01/20 | | | | 1,450 | | | | 1,431,875 | |
New Gold, Inc. (Canada), Gtd. Notes, 144A | | 7.000 | | | 04/15/20 | | | | 4,445 | | | | 4,267,200 | |
New Gold, Inc. (Canada), Sr. Unsec’d. Notes, 144A(c) | | 6.250 | | | 11/15/22 | | | | 4,550 | | | | 3,844,750 | |
Peabody Energy Corp., | | | | | | | | | | | | | | |
Gtd. Notes | | 6.250 | | | 11/15/21 | | | | 1,275 | | | | 334,688 | |
Sec’d. Notes, 144A(c) | | 10.000 | | | 03/15/22 | | | | 3,835 | | | | 1,534,000 | |
| | | | | | | | | | | | | | |
| | | | | | | | | | | | | 44,746,950 | |
See Notes to Financial Statements.
| | | | | | | | | | | | | | |
| Description | | Interest
Rate | | Maturity
Date | | | Principal
Amount (000)# | | | Value (Note 1) | |
CORPORATE BONDS (Continued) | |
| | | | |
Non-Captive Finance 3.2% | | | | | | | | | | | | | | |
AerCap Ireland Capital Ltd./AerCap Global Aviation Trust (Netherlands), | | | | | | | | | | | | | | |
Gtd. Notes | | 3.750% | | | 05/15/19 | | | | 1,625 | | | $ | 1,614,844 | |
Gtd. Notes | | 4.250 | | | 07/01/20 | | | | 975 | | | | 982,313 | |
Gtd. Notes | | 4.500 | | | 05/15/21 | | | | 3,882 | | | | 3,945,082 | |
Gtd. Notes(c) | | 4.625 | | | 07/01/22 | | | | 3,035 | | | | 3,057,762 | |
Aston Escrow Corp., Sr. Sec’d. Notes, 144A(b) | | 9.500 | | | 08/15/21 | | | | 15,975 | | | | 8,147,250 | |
CIT Group, Inc., | | | | | | | | | | | | | | |
Sr. Unsec’d. Notes | | 5.000 | | | 05/15/17 | | | | 700 | | | | 720,125 | |
Sr. Unsec’d. Notes(c) | | 5.000 | | | 08/15/22 | | | | 22,550 | | | | 22,916,437 | |
Sr. Unsec’d. Notes | | 5.250 | | | 03/15/18 | | | | 725 | | | | 753,094 | |
Sr. Unsec’d. Notes(c) | | 5.375 | | | 05/15/20 | | | | 1,000 | | | | 1,045,000 | |
Sr. Unsec’d. Notes, 144A | | 5.500 | | | 02/15/19 | | | | 1,725 | | | | 1,813,406 | |
ILFC E-Capital Trust II Ltd., Gtd. Notes, 144A | | 6.250(a) | | | 12/21/65 | | | | 4,275 | | | | 4,034,531 | |
International Lease Finance Corp., | | | | | | | | | | | | | | |
Sr. Sec’d. Notes, 144A | | 7.125 | | | 09/01/18 | | | | 375 | | | | 414,439 | |
Sr. Unsec’d. Notes | | 3.875 | | | 04/15/18 | | | | 4,590 | | | | 4,612,950 | |
Sr. Unsec’d. Notes | | 6.250 | | | 05/15/19 | | | | 1,350 | | | | 1,454,625 | |
Sr. Unsec’d. Notes | | 8.250 | | | 12/15/20 | | | | 1,150 | | | | 1,362,750 | |
Sr. Unsec’d. Notes | | 8.625 | | | 01/15/22 | | | | 1,525 | | | | 1,864,313 | |
Sr. Unsec’d. Notes | | 8.875 | | | 09/01/17 | | | | 3,600 | | | | 3,964,500 | |
KCG Holdings, Inc., Sr. Sec’d. Notes, 144A | | 6.875 | | | 03/15/20 | | | | 5,975 | | | | 5,556,750 | |
Navient Corp., Sr. Unsec’d. Notes | | 5.000 | | | 10/26/20 | | | | 1,500 | | | | 1,335,000 | |
OneMain Financial Holdings, Inc., | | | | | | | | | | | | | | |
Gtd. Notes, 144A | | 6.750 | | | 12/15/19 | | | | 5,825 | | | | 6,087,125 | |
Gtd. Notes, 144A | | 7.250 | | | 12/15/21 | | | | 6,725 | | | | 6,960,375 | |
Patriot Merger Corp., Sr. Unsec’d. Notes, 144A | | 9.000 | | | 07/15/21 | | | | 2,400 | | | | 2,352,000 | |
SLM Corp., Sr. Unsec’d. Notes, MTN | | 8.000 | | | 03/25/20 | | | | 7,300 | | | | 7,391,250 | |
Springleaf Finance Corp., | | | | | | | | | | | | | | |
Gtd. Notes(c) | | 6.000 | | | 06/01/20 | | | | 9,825 | | | | 9,972,375 | |
Gtd. Notes | | 8.250 | | | 10/01/23 | | | | 1,150 | | | | 1,288,000 | |
| | | | | | | | | | | | | | |
| | | | | | | | | | | | | 103,646,296 | |
| | | | |
Packaging 2.6% | | | | | | | | | | | | | | |
AEP Industries, Inc., Sr. Unsec’d. Notes | | 8.250 | | | 04/15/19 | | | | 4,400 | | | | 4,444,000 | |
Ardagh Finance Holdings SA (Luxembourg), Sr. Unsec’d. Notes, PIK, 144A(c) | | 8.625 | | | 06/15/19 | | | | 8,876 | | | | 9,364,494 | |
Ardagh Packaging Finance PLC (Ireland), Gtd. Notes, 144A | | 9.125 | | | 10/15/20 | | | | 1,640 | | | | 1,722,000 | |
See Notes to Financial Statements.
| | | | |
| Prudential High Yield Fund | | | 31 | |
Portfolio of Investments
as of August 31, 2015 continued
| | | | | | | | | | | | | | |
| Description | | Interest
Rate | | Maturity
Date | | | Principal
Amount (000)# | | | Value (Note 1) | |
CORPORATE BONDS (Continued) | |
| | | | |
Packaging (cont’d.) | | | | | | | | | | | | | | |
Ardagh Packaging Finance PLC/Ardagh Holdings USA, Inc. (Ireland), | | | | | | | | | | | | | | |
Gtd. Notes, 144A(c) | | 6.000% | | | 06/30/21 | | | | 1,725 | | | $ | 1,711,717 | |
Gtd. Notes, 144A(c) | | 6.250 | | | 01/31/19 | | | | 2,825 | | | | 2,881,500 | |
Gtd. Notes, 144A(c) | | 6.750 | | | 01/31/21 | | | | 1,485 | | | | 1,514,700 | |
Sr. Unsec’d. Notes, 144A | | 7.000 | | | 11/15/20 | | | | 993 | | | | 1,002,574 | |
Gtd. Notes, 144A | | 9.125 | | | 10/15/20 | | | | 6,075 | | | | 6,351,412 | |
Beverage Packaging Holdings Luxembourg II SA/Beverage Packaging Holdings II Issuer, Inc., Gtd. Notes, 144A | | 6.000 | | | 06/15/17 | | | | 5,310 | | | | 5,283,450 | |
Coveris Holdings SA, Gtd. Notes, 144A | | 7.875 | | | 11/01/19 | | | | 7,375 | | | | 7,153,750 | |
Greif, Inc., Sr. Unsec’d. Notes | | 6.750 | | | 02/01/17 | | | | 3,200 | | | | 3,328,000 | |
Owens-Brockway Glass Container, Inc., | | | | | | | | | | | | | | |
Gtd. Notes, 144A | | 5.875 | | | 08/15/23 | | | | 1,800 | | | | 1,831,500 | |
Gtd. Notes, 144A(c) | | 6.375 | | | 08/15/25 | | | | 1,275 | | | | 1,303,688 | |
PaperWorks Industries, Inc., Sr. Sec’d. Notes, 144A | | 9.500 | | | 08/15/19 | | | | 6,805 | | | | 6,662,095 | |
Plastipak Holdings, Inc., Sr. Unsec’d. Notes, 144A (original cost $8,500,000; purchased 09/25/13-01/22/15)(b)(d) | | 6.500 | | | 10/01/21 | | | | 8,500 | | | | 8,330,000 | |
Reynolds Group Issuer, Inc., | | | | | | | | | | | | | | |
Gtd. Notes | | 9.875 | | | 08/15/19 | | | | 11,285 | | | | 11,863,356 | |
Sr. Sec’d. Notes | | 5.750 | | | 10/15/20 | | | | 520 | | | | 536,250 | |
Sr. Sec’d. Notes | | 6.875 | | | 02/15/21 | | | | 725 | | | | 759,438 | |
Sealed Air Corp., | | | | | | | | | | | | | | |
Gtd. Notes, 144A | | 4.875 | | | 12/01/22 | | | | 3,225 | | | | 3,225,000 | |
Gtd. Notes, 144A | | 5.250 | | | 04/01/23 | | | | 3,575 | | | | 3,655,437 | |
Gtd. Notes, 144A | | 6.500 | | | 12/01/20 | | | | 1,425 | | | | 1,578,188 | |
| | | | | | | | | | | | | | |
| | | | | | | | | | | | | 84,502,549 | |
| | | | |
Paper 0.2% | | | | | | | | | | | | | | |
Smurfit Kappa Acquisitions (Ireland), Sr. Sec’d. Notes, 144A | | 4.875 | | | 09/15/18 | | | | 4,900 | | | | 5,114,375 | |
Tembec Industries, Inc. (Canada), Sr. Sec’d. Notes, 144A(c) | | 9.000 | | | 12/15/19 | | | | 3,975 | | | | 2,544,000 | |
| | | | | | | | | | | | | | |
| | | | | | | | | | | | | 7,658,375 | |
See Notes to Financial Statements.
| | | | | | | | | | | | | | |
| Description | | Interest
Rate | | Maturity
Date | | | Principal
Amount (000)# | | | Value (Note 1) | |
CORPORATE BONDS (Continued) | |
| | | | |
Pipelines & Other 3.2% | | | | | | | | | | | | | | |
AmeriGas Finance LLC, Gtd. Notes | | 7.000% | | | 05/20/22 | | | | 6,175 | | | $ | 6,406,562 | |
AmeriGas Partners LP/AmeriGas Eagle Finance Corp., Sr. Unsec’d. Notes | | 6.500 | | | 05/20/21 | | | | 1,147 | | | | 1,158,470 | |
Crestwood Midstream Partners LP/Crestwood Midstream Finance Corp., | | | | | | | | | | | | | | |
Gtd. Notes | | 6.000 | | | 12/15/20 | | | | 2,750 | | | | 2,598,750 | |
Gtd. Notes, 144A(c) | | 6.250 | | | 04/01/23 | | | | 4,700 | | | | 4,253,500 | |
Energy Transfer Equity LP, Sr. Sec’d. Notes | | 7.500 | | | 10/15/20 | | | | 3,650 | | | | 3,910,136 | |
Ferrellgas LP/Ferrellgas Finance Corp., | | | | | | | | | | | | | | |
Gtd. Notes, 144A | | 6.750 | | | 06/15/23 | | | | 3,075 | | | | 2,952,000 | |
Sr. Unsec’d. Notes | | 6.500 | | | 05/01/21 | | | | 4,275 | | | | 4,104,000 | |
Sr. Unsec’d. Notes | | 6.750 | | | 01/15/22 | | | | 6,064 | | | | 5,851,760 | |
Ferrellgas Partners LP/Ferrellgas Partners Finance Corp., Sr. Unsec’d. Notes | | 8.625 | | | 06/15/20 | | | | 3,430 | | | | 3,464,300 | |
Genesis Energy LP/Genesis Energy Finance Corp., | | | | | | | | | | | | | | |
Gtd. Notes | | 6.000 | | | 05/15/23 | | | | 7,900 | | | | 7,228,500 | |
Gtd. Notes | | 6.750 | | | 08/01/22 | | | | 5,575 | | | | 5,407,750 | |
Global Partners LP/GLP Finance Corp., Gtd. Notes | | 6.250 | | | 07/15/22 | | | | 2,325 | | | | 2,115,750 | |
MarkWest Energy Partners LP/MarkWest Energy Finance Corp., | | | | | | | | | | | | | | |
Gtd. Notes(c) | | 4.875 | | | 12/01/24 | | | | 3,625 | | | | 3,362,188 | |
Gtd. Notes(c) | | 4.875 | | | 06/01/25 | | | | 2,375 | | | | 2,196,875 | |
PBF Logistics LP/PBF Logistics Finance Corp., Gtd. Notes, 144A(c) | | 6.875 | | | 05/15/23 | | | | 2,600 | | | | 2,509,000 | |
Regency Energy Partners LP/Regency Energy Finance Corp., | | | | | | | | | | | | | | |
Gtd. Notes | | 5.500 | | | 04/15/23 | | | | 3,400 | | | | 3,305,242 | |
Gtd. Notes(c) | | 5.750 | | | 09/01/20 | | | | 4,125 | | | | 4,374,563 | |
Rockies Express Pipeline LLC, | | | | | | | | | | | | | | |
Sr. Unsec’d. Notes, 144A (original cost $3,594,625; purchased 02/21/14-02/25/14)(b)(d) | | 5.625 | | | 04/15/20 | | | | 3,725 | | | | 3,594,625 | |
Sr. Unsec’d. Notes, 144A (original cost $5,469,688; purchased 01/10/13-06/13/13)(b)(c)(d) | | 6.000 | | | 01/15/19 | | | | 5,525 | | | | 5,525,000 | |
Rose Rock Midstream LP/Rose Rock Finance Corp., Gtd. Notes, 144A | | 5.625 | | | 11/15/23 | | | | 1,400 | | | | 1,253,000 | |
See Notes to Financial Statements.
| | | | |
| Prudential High Yield Fund | | | 33 | |
Portfolio of Investments
as of August 31, 2015 continued
| | | | | | | | | | | | | | |
| Description | | Interest
Rate | | Maturity
Date | | | Principal
Amount (000)# | | | Value (Note 1) | |
CORPORATE BONDS (Continued) | |
| | | | |
Pipelines & Other (cont’d.) | | | | | | | | | | | | | | |
Suburban Propane Partners LP/Suburban Energy Finance Corp., | | | | | | | | | | | | | | |
Sr. Unsec’d. Notes | | 5.500% | | | 06/01/24 | | | | 5,725 | | | $ | 5,424,437 | |
Sr. Unsec’d. Notes | | 7.375 | | | 08/01/21 | | | | 2,224 | | | | 2,324,080 | |
Sunoco LP/Sunoco Finance Corp., | | | | | | | | | | | | | | |
Gtd. Notes, 144A(c) | | 5.500 | | | 08/01/20 | | | | 4,025 | | | | 4,004,875 | |
Gtd. Notes, 144A | | 6.375 | | | 04/01/23 | | | | 8,925 | | | | 8,969,625 | |
Targa Resources Partners LP, Gtd. Notes | | 6.875 | | | 02/01/21 | | | | 1,293 | | | | 1,293,000 | |
Tesoro Logistics LP/Tesoro Logistics Finance Corp., | | | | | | | | | | | | | | |
Gtd. Notes | | 5.875 | | | 10/01/20 | | | | 2,650 | | | | 2,656,625 | |
Gtd. Notes | | 6.125 | | | 10/15/21 | | | | 3,050 | | | | 3,057,625 | |
Gtd. Notes, 144A(c) | | 6.250 | | | 10/15/22 | | | | 2,475 | | | | 2,475,000 | |
| | | | | | | | | | | | | | |
| | | | | | | | | | | | | 105,777,238 | |
| | | | |
Real Estate Investment Trusts (REITs) 1.5% | | | | | | | | | | | | | | |
CTR Partnership LP/Caretrust Capital Corp., Gtd. Notes | | 5.875 | | | 06/01/21 | | | | 500 | | | | 506,250 | |
CyrusOne LP/CyrusOne Finance Corp., | | | | | | | | | | | | | | |
Gtd. Notes | | 6.375 | | | 11/15/22 | | | | 3,900 | | | | 3,987,750 | |
Gtd. Notes, 144A | | 6.375 | | | 11/15/22 | | | | 2,600 | | | | 2,658,500 | |
DuPont Fabros Technology LP, Gtd. Notes | | 5.875 | | | 09/15/21 | | | | 3,450 | | | | 3,562,125 | |
ESH Hospitality, Inc., Gtd. Notes, 144A(c) | | 5.250 | | | 05/01/25 | | | | 3,475 | | | | 3,370,750 | |
Felcor Lodging LP, | | | | | | | | | | | | | | |
Gtd. Notes, 144A | | 6.000 | | | 06/01/25 | | | | 8,350 | | | | 8,485,687 | |
Sr. Sec’d. Notes(c) | | 5.625 | | | 03/01/23 | | | | 1,530 | | | | 1,575,900 | |
MPT Operating Partnership LP/MPT Finance Corp., Gtd. Notes | | 5.500 | | | 05/01/24 | | | | 3,275 | | | | 3,373,250 | |
RHP Hotel Properties LP/RHP Finance Corp., | | | | | | | | | | | | | | |
Gtd. Notes | | 5.000 | | | 04/15/21 | | | | 3,550 | | | | 3,557,100 | |
Gtd. Notes, 144A | | 5.000 | | | 04/15/23 | | | | 4,107 | | | | 4,065,930 | |
Sabra Health Care LP/Sabra Capital Corp., | | | | | | | | | | | | | | |
Gtd. Notes | | 5.375 | | | 06/01/23 | | | | 4,825 | | | | 4,993,875 | |
Gtd. Notes | | 5.500 | | | 02/01/21 | | | | 1,600 | | | | 1,672,000 | |
Sabre GLBL, Inc., Sr. Sec’d. Notes, 144A | | 5.375 | | | 04/15/23 | | | | 2,675 | | | | 2,621,500 | |
Senior Housing Properties Trust, Sr. Unsec’d. Notes | | 6.750 | | | 12/15/21 | | | | 5,475 | | | | 6,194,344 | |
| | | | | | | | | | | | | | |
| | | | | | | | | | | | | 50,624,961 | |
See Notes to Financial Statements.
| | | | | | | | | | | | | | |
| Description | | Interest
Rate | | Maturity
Date | | | Principal
Amount (000)# | | | Value (Note 1) | |
CORPORATE BONDS (Continued) | |
| | | | |
Retailers 3.3% | | | | | | | | | | | | | | |
Caleres, Inc., Gtd. Notes, 144A | | 6.250% | | | 08/15/23 | | | | 4,175 | | | $ | 4,216,750 | |
Claire’s Stores, Inc., | | | | | | | | | | | | | | |
Sr. Sec’d. Notes, 144A | | 6.125 | | | 03/15/20 | | | | 3,675 | | | | 2,866,500 | |
Sr. Sec’d. Notes, 144A(c) | | 9.000 | | | 03/15/19 | | | | 8,225 | | | | 6,970,688 | |
CST Brands, Inc., Gtd. Notes | | 5.000 | | | 05/01/23 | | | | 2,150 | | | | 2,131,188 | |
Dufry Finance SCA (Switzerland), Gtd. Notes, 144A | | 5.500 | | | 10/15/20 | | | | 10,025 | | | | 10,422,180 | |
Family Tree Escrow LLC, Sr. Sec’d. Notes, 144A(c) | | 5.750 | | | 03/01/23 | | | | 4,150 | | | | 4,347,125 | |
Hot Topic, Inc., | | | | | | | | | | | | | | |
Sr. Sec’d. Notes, 144A (original cost $9,538,835; purchased 06/06/13-12/03/14)(b)(d) | | 9.250 | | | 06/15/21 | | | | 9,350 | | | | 9,443,500 | |
Sr. Unsec’d. Notes, PIK, 144A | | 12.000 | | | 05/15/19 | | | | 1,075 | | | | 1,064,250 | |
L Brands, Inc., Gtd. Notes | | 5.625 | | | 02/15/22 | | | | 5,675 | | | | 6,079,344 | |
Men’s Wearhouse, Inc. (The), Gtd. Notes(c) | | 7.000 | | | 07/01/22 | | | | 2,825 | | | | 2,980,375 | |
Murphy Oil USA, Inc., Gtd. Notes | | 6.000 | | | 08/15/23 | | | | 1,975 | | | | 2,034,250 | |
Neiman Marcus Group Ltd., Inc., Gtd. Notes, 144A(c) | | 8.000 | | | 10/15/21 | | | | 24,728 | | | | 26,088,040 | |
Petsmart, Inc., Sr. Unsec’d. Notes, 144A(c) | | 7.125 | | | 03/15/23 | | | | 11,875 | | | | 12,439,062 | |
PVH Corp., Sr. Unsec’d. Notes(c) | | 4.500 | | | 12/15/22 | | | | 1,600 | | | | 1,596,000 | |
Rite Aid Corp., Gtd. Notes, 144A | | 6.125 | | | 04/01/23 | | | | 14,025 | | | | 14,393,156 | |
| | | | | | | | | | | | | | |
| | | | | | | | | | | | | 107,072,408 | |
| | | | |
Technology 10.1% | | | | | | | | | | | | | | |
Activision Blizzard, Inc., Gtd. Notes, 144A(c) | | 6.125 | | | 09/15/23 | | | | 1,225 | | | | 1,316,875 | |
Alcatel-Lucent USA, Inc. (France), | | | | | | | | | | | | | | |
Gtd. Notes, 144A | | 6.750 | | | 11/15/20 | | | | 1,955 | | | | 2,086,963 | |
Gtd. Notes, 144A | | 8.875 | | | 01/01/20 | | | | 3,000 | | | | 3,256,875 | |
Ancestry.com, Inc., | | | | | | | | | | | | | | |
Gtd. Notes | | 11.000 | | | 12/15/20 | | | | 4,125 | | | | 4,583,906 | |
Sr. Unsec’d. Notes, PIK, 144A | | 9.625 | | | 10/15/18 | | | | 5,420 | | | | 5,474,200 | |
Audatex North America, Inc., | | | | | | | | | | | | | | |
Gtd. Notes, 144A | | 6.000 | | | 06/15/21 | | | | 13,350 | | | | 13,035,741 | |
Gtd. Notes, 144A | | 6.125 | | | 11/01/23 | | | | 800 | | | | 792,912 | |
Avaya, Inc., Sec’d. Notes, 144A | | 10.500 | | | 03/01/21 | | | | 8,690 | | | | 5,757,125 | |
Blue Coat Holdings, Inc., Sr. Unsec’d. Notes, 144A | | 8.375 | | | 06/01/23 | | | | 8,125 | | | | 8,141,250 | |
BMC Software Finance, Inc., Sr. Unsec’d. Notes, 144A(c) | | 8.125 | | | 07/15/21 | | | | 20,000 | | | | 16,350,000 | |
See Notes to Financial Statements.
| | | | |
| Prudential High Yield Fund | | | 35 | |
Portfolio of Investments
as of August 31, 2015 continued
| | | | | | | | | | | | | | |
| Description | | Interest
Rate | | Maturity
Date | | | Principal
Amount (000)# | | | Value (Note 1) | |
CORPORATE BONDS (Continued) | |
| | | | |
Technology (cont’d.) | | | | | | | | | | | | | | |
BMC Software, Inc., Sr. Unsec’d. Notes, PIK, 144A(c) | | 9.000% | | | 10/15/19 | | | | 17,200 | | | $ | 12,728,000 | |
Brightstar Corp., | | | | | | | | | | | | | | |
Gtd. Notes, 144A (original cost $5,379,588; purchased 11/23/10-06/13/12)(b)(d) | | 9.500 | | | 12/01/16 | | | | 5,305 | | | | 5,358,050 | |
Sr. Unsec’d. Notes, 144A (original cost $7,372,509; purchased 07/26/13-08/09/13)(b)(d) | | 7.250 | | | 08/01/18 | | | | 7,450 | | | | 7,841,125 | |
CDW LLC/CDW Finance Corp., Gtd. Notes | | 5.500 | | | 12/01/24 | | | | 11,320 | | | | 11,206,800 | |
Ceridian HCM Holding, Inc., Sr. Unsec’d. Notes, 144A (original cost $1,325,000; purchased 03/21/13)(b)(d) | | 11.000 | | | 03/15/21 | | | | 1,325 | | | | 1,308,438 | |
CommScope Holding Co., Inc., Sr. Unsec’d. Notes, PIK, 144A(c) | | 6.625 | | | 06/01/20 | | | | 21,940 | | | | 22,790,175 | |
CommScope Technologies Finance LLC, Sr. Unsec’d. Notes, 144A | | 6.000 | | | 06/15/25 | | | | 8,550 | | | | 8,314,875 | |
CommScope, Inc., Gtd. Notes, 144A | | 5.500 | | | 06/15/24 | | | | 3,925 | | | | 3,812,156 | |
CoreLogic, Inc., Gtd. Notes | | 7.250 | | | 06/01/21 | | | | 2,500 | | | | 2,618,750 | |
First Data Corp., | | | | | | | | | | | | | | |
Gtd. Notes(c) | | 10.625 | | | 06/15/21 | | | | 8,932 | | | | 9,881,025 | |
Gtd. Notes | | 11.250 | | | 01/15/21 | | | | 6,787 | | | | 7,499,635 | |
Gtd. Notes | | 11.750 | | | 08/15/21 | | | | 29,967 | | | | 33,757,825 | |
Gtd. Notes | | 12.625 | | | 01/15/21 | | | | 20,192 | | | | 23,195,560 | |
Freescale Semiconductor, Inc., Sr. Sec’d. Notes, 144A | | 6.000 | | | 01/15/22 | | | | 4,015 | | | | 4,195,675 | |
Infor Software Parent LLC/Infor Software Parent, Inc., Gtd. Notes, PIK, 144A (original cost $11,378,734; purchased 04/03/14-07/31/15)(b)(c)(d) | | 7.125 | | | 05/01/21 | | | | 11,364 | | | | 10,298,625 | |
Infor US, Inc., Gtd. Notes, 144A (original cost $13,517,750; purchased 03/18/15-08/18/15)(b)(d) | | 6.500 | | | 05/15/22 | | | | 13,500 | | | | 12,656,250 | |
Interactive Data Corp., | | | | | | | | | | | | | | |
Gtd. Notes, 144A(c) | | 5.875 | | | 04/15/19 | | | | 1,250 | | | | 1,264,063 | |
Sr. Unsec’d. Notes, PIK, 144A | | 8.250 | | | 12/15/17 | | | | 6,945 | | | | 6,971,044 | |
Italics Merger Sub., Inc., Sr. Unsec’d. Notes, 144A(c) | | 7.125 | | | 07/15/23 | | | | 9,400 | | | | 9,092,526 | |
See Notes to Financial Statements.
| | | | | | | | | | | | | | |
| Description | | Interest
Rate | | Maturity
Date | | | Principal
Amount (000)# | | | Value (Note 1) | |
CORPORATE BONDS (Continued) | |
| | | | |
Technology (cont’d.) | | | | | | | | | | | | | | |
Micron Technology, Inc., | | | | | | | | | | | | | | |
Sr. Unsec’d. Notes, 144A(c) | | 5.250% | | | 08/01/23 | | | | 11,900 | | | $ | 11,096,750 | |
Sr. Unsec’d. Notes, 144A | | 5.250 | | | 01/15/24 | | | | 2,000 | | | | 1,855,000 | |
Sr. Unsec’d. Notes, 144A(c) | | 5.625 | | | 01/15/26 | | | | 11,975 | | | | 10,867,312 | |
Nuance Communications, Inc., Gtd. Notes, 144A | | 5.375 | | | 08/15/20 | | | | 11,480 | | | | 11,501,582 | |
NXP BV/NXP Funding LLC (Netherlands), | | | | | | | | | | | | | | |
Gtd. Notes, 144A(c) | | 4.625 | | | 06/15/22 | | | | 6,125 | | | | 6,063,750 | |
Gtd. Notes, 144A | | 5.750 | | | 02/15/21 | | | | 3,635 | | | | 3,794,031 | |
Presidio Holdings, Inc., Sr. Unsec’d. Notes, 144A | | 10.250 | | | 02/15/23 | | | | 5,225 | | | | 5,342,563 | |
Sensata Technologies BV (Netherlands), | | | | | | | | | | | | | | |
Gtd. Notes, 144A | | 4.875 | | | 10/15/23 | | | | 6,075 | | | | 5,968,688 | |
Gtd. Notes, 144A | | 5.000 | | | 10/01/25 | | | | 2,000 | | | | 1,940,000 | |
Sophia Holding Finance LP/Sophia Holding Finance, Inc., Gtd. Notes, PIK, 144A | | 9.625 | | | 12/01/18 | | | | 1,100 | | | | 1,118,557 | |
Sophia LP/Sophia Finance, Inc., Gtd. Notes, 144A | | 9.750 | | | 01/15/19 | | | | 11,615 | | | | 12,413,531 | |
Syniverse Holdings, Inc., Gtd. Notes | | 9.125 | | | 01/15/19 | | | | 5,770 | | | | 5,005,475 | |
| | | | | | | | | | | | | | |
| | | | | | | | | | | | | 332,553,683 | |
| | | | |
Telecommunications 4.9% | | | | | | | | | | | | | | |
Altice Finco SA (Luxembourg), Gtd. Notes, 144A | | 7.625 | | | 02/15/25 | | | | 1,025 | | | | 1,004,500 | |
Altice SA (Luxembourg), Gtd. Notes, 144A(c) | | 7.625 | | | 02/15/25 | | | | 6,025 | | | | 5,723,750 | |
Altice US Finance I Corp., Sr. Sec’d. Notes, 144A(c) | | 5.375 | | | 07/15/23 | | | | 9,125 | | | | 9,033,750 | |
Altice US Finance II Corp., Sr. Unsec’d. Notes, 144A(c) | | 7.750 | | | 07/15/25 | | | | 2,900 | | | | 2,827,500 | |
Altice US Finance SA (Luxembourg), Sr. Unsec’d. Notes, 144A | | 7.750 | | | 07/15/25 | | | | 4,075 | | | | 3,901,812 | |
CenturyLink, Inc., | | | | | | | | | | | | | | |
Sr. Unsec’d. Notes(c) | | 5.625 | | | 04/01/20 | | | | 700 | | | | 698,257 | |
Sr. Unsec’d. Notes | | 6.875 | | | 01/15/28 | | | | 4,700 | | | | 4,206,500 | |
Crown Castle International Corp., Sr. Unsec’d. Notes | | 5.250 | | | 01/15/23 | | | | 1,615 | | | | 1,689,694 | |
Digicel Group Ltd. (Jamaica), | | | | | | | | | | | | | | |
Sr. Unsec’d. Notes, 144A | | 7.125 | | | 04/01/22 | | | | 780 | | | | 679,575 | |
Sr. Unsec’d. Notes, 144A | | 8.250 | | | 09/30/20 | | | | 5,600 | | | | 5,180,000 | |
Digicel Ltd. (Jamaica), Gtd. Notes, 144A | | 6.750 | | | 03/01/23 | | | | 8,445 | | | | 7,748,287 | |
Eileme 2 AB (Poland), Sr. Sec’d. Notes, 144A | | 11.625 | | | 01/31/20 | | | | 3,640 | | | | 3,981,250 | |
See Notes to Financial Statements.
| | | | |
| Prudential High Yield Fund | | | 37 | |
Portfolio of Investments
as of August 31, 2015 continued
| | | | | | | | | | | | | | |
| Description | | Interest
Rate | | Maturity
Date | | | Principal
Amount (000)# | | | Value (Note 1) | |
CORPORATE BONDS (Continued) | |
| | | | |
Telecommunications (cont’d.) | | | | | | | | | | | | | | |
Frontier Communications Corp., | | | | | | | | | | | | | | |
Sr. Unsec’d. Notes(c) | | 6.250% | | | 09/15/21 | | | | 1,475 | | | $ | 1,346,528 | |
Sr. Unsec’d. Notes(c) | | 7.125 | | | 01/15/23 | | | | 1,981 | | | | 1,788,843 | |
Sr. Unsec’d. Notes | | 8.500 | | | 04/15/20 | | | | 450 | | | | 462,375 | |
Sr. Unsec’d. Notes | | 8.750 | | | 04/15/22 | | | | 3,750 | | | | 3,693,750 | |
Sprint Capital Corp., | | | | | | | | | | | | | | |
Gtd. Notes | | 6.875 | | | 11/15/28 | | | | 17,010 | | | | 14,628,600 | |
Gtd. Notes | | 6.900 | | | 05/01/19 | | | | 12,060 | | | | 12,225,825 | |
Sprint Communications, Inc., | | | | | | | | | | | | | | |
Gtd. Notes, 144A(c) | | 7.000 | | | 03/01/20 | | | | 1,575 | | | | 1,672,965 | |
Gtd. Notes, 144A | | 9.000 | | | 11/15/18 | | | | 2,265 | | | | 2,522,644 | |
Sr. Unsec’d. Notes | | 7.000 | | | 08/15/20 | | | | 2,325 | | | | 2,295,937 | |
Sprint Corp., | | | | | | | | | | | | | | |
Gtd. Notes(c) | | 7.125 | | | 06/15/24 | | | | 7,990 | | | | 7,388,273 | |
Gtd. Notes | | 7.625 | | | 02/15/25 | | | | 13,418 | | | | 12,520,671 | |
Gtd. Notes | | 7.875 | | | 09/15/23 | | | | 6,000 | | | | 5,767,500 | |
T-Mobile USA, Inc., | | | | | | | | | | | | | | |
Gtd. Notes | | 6.375 | | | 03/01/25 | | | | 7,375 | | | | 7,537,250 | |
Gtd. Notes | | 6.633 | | | 04/28/21 | | | | 5,900 | | | | 6,165,500 | |
Telecom Italia SpA (Italy), Sr. Unsec’d. Notes, 144A | | 5.303 | | | 05/30/24 | | | | 7,400 | | | | 7,455,500 | |
Wind Acquisition Finance SA (Italy), | | | | | | | | | | | | | | |
Sec’d. Notes, 144A | | 7.375 | | | 04/23/21 | | | | 13,800 | | | | 14,110,500 | |
Sr. Sec’d. Notes, 144A(c) | | 6.500 | | | 04/30/20 | | | | 3,300 | | | | 3,473,250 | |
Windstream Holdings, Inc., | | | | | | | | | | | | | | |
Gtd. Notes(c) | | 6.375 | | | 08/01/23 | | | | 6,725 | | | | 4,935,545 | |
Gtd. Notes(c) | | 7.500 | | | 04/01/23 | | | | 3,405 | | | | 2,664,447 | |
Zayo Group LLC/Zayo Capital, Inc., Gtd. Notes, 144A(c) | | 6.375 | | | 05/15/25 | | | | 2,730 | | | | 2,702,700 | |
| | | | | | | | | | | | | | |
| | | | | | | | | | | | | 162,033,478 | |
| | | | |
Textiles, Apparel & Luxury Goods 0.1% | | | | | | | | | | | | | | |
Levi Strauss & Co., Sr. Unsec’d. Notes | | 5.000 | | | 05/01/25 | | | | 3,475 | | | | 3,401,156 | |
| | | | |
Tobacco 0.1% | | | | | | | | | | | | | | |
Vector Group Ltd., Gtd. Notes | | 7.750 | | | 02/15/21 | | | | 4,450 | | | | 4,734,800 | |
See Notes to Financial Statements.
| | | | | | | | | | | | | | |
| Description | | Interest
Rate | | Maturity
Date | | | Principal
Amount (000)# | | | Value (Note 1) | |
CORPORATE BONDS (Continued) | |
| | | | |
Transportation Services 1.1% | | | | | | | | | | | | | | |
Avis Budget Car Rental LLC/Avis Budget Finance, Inc., Gtd. Notes, 144A | | 5.125% | | | 06/01/22 | | | | 6,900 | | | $ | 6,805,125 | |
Hertz Corp. (The), | | | | | | | | | | | | | | |
Gtd. Notes(c) | | 5.875 | | | 10/15/20 | | | | 1,275 | | | | 1,288,209 | |
Gtd. Notes | | 6.750 | | | 04/15/19 | | | | 2,165 | | | | 2,213,713 | |
Navios Maritime Holdings, Inc./Navios Maritime Finance II US, Inc., Sr. Sec’d. Notes, 144A | | 7.375 | | | 01/15/22 | | | | 6,100 | | | | 5,063,000 | |
OPE KAG Finance Sub., Inc., Sr. Unsec’d. Notes, 144A | | 7.875 | | | 07/31/23 | | | | 4,525 | | | | 4,615,500 | |
XPO Logistics, Inc., | | | | | | | | | | | | | | |
Gtd. Notes, 144A(c) | | 6.500 | | | 06/15/22 | | | | 12,550 | | | | 12,361,750 | |
Sr. Unsec’d. Notes, 144A(c) | | 7.875 | | | 09/01/19 | | | | 4,950 | | | | 5,247,000 | |
| | | | | | | | | | | | | | |
| | | | | | | | | | | | | 37,594,297 | |
| | | | | | | | | | | | | | |
TOTAL CORPORATE BONDS
(cost $3,182,186,283) | | | | | | | | | | | | | 3,083,545,100 | |
| | | | | | | | | | | | | | |
| | | | |
| | | | | | | | Shares | | | | |
COMMON STOCKS | | | | | | | | | | | | | | |
Adelphia Recovery Trust*(b) | | | | | | | | | 2,000,000 | | | | 2,000 | |
DEX Media, Inc.*(c) | | | | | | | | | 29,839 | | | | 7,758 | |
Newell Recovery LLC (original cost $23,194; purchased 08/22/12)*(b)(d) | | | | | | | | | 100 | | | | 250 | |
Newell Recycling Southeast LLC (original cost $23,194; purchased 08/22/12)*(b)(d) | | | | | | | | | 100 | | | | 250 | |
WKI Holding Co., Inc.*(b) | | | | | | | | | 6,031 | | | | 318,316 | |
| | | | | | | | | | | | | | |
TOTAL COMMON STOCKS
(cost $19,257,148) | | | | | | | | | | | | | 328,574 | |
| | | | | | | | | | | | | | |
| | | | |
PREFERRED STOCKS 0.2% | | | | | | | | | | | | | | |
| | | | |
Banking 0.2% | | | | | | | | | | | | | | |
Citigroup Capital XIII (Capital security, fixed to floating preferred), 7.875%(a) | | | | | | | | | 153,000 | | | | 3,909,150 | |
Goldman Sachs Group, Inc. (The) (fixed to floating preferred), 6.375%(a) | | | | | | | | | 87,000 | | | | 2,268,090 | |
| | | | | | | | | | | | | | |
| | | | | | | | | | | | | 6,177,240 | |
See Notes to Financial Statements.
| | | | |
| Prudential High Yield Fund | | | 39 | |
Portfolio of Investments
as of August 31, 2015 continued
| | | | | | | | | | | | |
| Description | | | | | | Shares | | | Value (Note 1) | |
| | | | |
Building Materials & Construction | | | | | | | | | | | | |
New Millennium Homes LLC (original cost $0; purchased 05/27/1998)*(b)(d) | | | | | | | 2,000 | | | $ | 102,000 | |
| | | | |
Cable | | | | | | | | | | | | |
Adelphia Communications Corp. (Class A Stock)*(b)(e) | | | | | | | 20,000 | | | | 20 | |
| | | | | | | | | | | | |
TOTAL PREFERRED STOCKS
(cost $6,018,416) | | | | | | | | | | | 6,279,260 | |
| | | | | | | | | | | | |
| | | | |
| | | | | | | Units | | | | |
WARRANTS* | | | | | | | | | | | | |
| | | | |
Chemicals | | | | | | | | | | | | |
Hercules, Inc., expiring 03/31/29 | | | | | | | 230 | | | | 4,803 | |
| | | | |
Media & Entertainment | | | | | | | | | | | | |
MediaNews Group, Inc., expiring 03/19/17(b) | | | | | | | 6,854 | | | | 69 | |
| | | | | | | | | | | | |
TOTAL WARRANTS
(cost $0) | | | | | | | | | | | 4,872 | |
| | | | | | | | | | | | |
TOTAL LONG-TERM INVESTMENTS
(cost $3,261,732,621) | | | | | | | | | | | 3,141,282,038 | |
| | | | | | | | | | | | |
| | | | |
| | | | | | | Shares | | | | |
SHORT-TERM INVESTMENTS 22.2% | | | | | | | | | | | | |
| | | | |
AFFILIATED MUTUAL FUNDS | | | | | | | | | | | | |
Prudential Investment Portfolios 2 - Prudential Core Short-Term Bond Fund (cost $460,433)(f) | | | | | | | 47,388 | | | | 442,129 | |
Prudential Investment Portfolios 2 - Prudential Core Taxable Money Market Fund (cost $729,214,281; includes $633,274,014 of cash collateral for securities on loan)(f)(g) | | | | | | | 729,214,281 | | | | 729,214,281 | |
| | | | | | | | | | | | |
TOTAL SHORT-TERM INVESTMENTS
(cost $729,674,714)(Note 3) | | | | | | | | | | | 729,656,410 | |
| | | | | | | | | | | | |
| | | | |
TOTAL INVESTMENTS 117.6%
(cost $3,991,407,335)(Note 5) | | | | | | | | | | | 3,870,938,448 | |
Liabilities in excess of other assets(h) (17.6)% | | | | | | | | | | | (580,557,927 | ) |
| | | | | | | | | | | | |
NET ASSETS 100.0% | | | | | | | | | | $ | 3,290,380,521 | |
| | | | | | | | | | | | |
See Notes to Financial Statements.
The following abbreviations are used in the portfolio descriptions:
144A—Security was purchased pursuant to Rule 144A under the Securities Act of 1933 and may not be resold subject to that rule except to qualified institutional buyers. Unless otherwise noted, 144A securities are deemed to be liquid.
CDS—Credit Default Swap
CDX—Credit Derivative Index
CLO—Collateralized Loan Obligation
MTN—Medium Term Note
PIK—Payment-in-Kind
| # | Principal amount is shown in U.S. dollars unless otherwise stated. |
| * | Non-income producing security. |
| (a) | Variable rate instrument. The interest rate shown reflects the rate in effect at August 31, 2015. |
| (b) | Indicates a security or securities that has been deemed illiquid (unaudited). |
| (c) | All or a portion of security is on loan. The aggregate market value of such securities, including those sold and pending settlement, is $620,344,234; cash collateral of $633,274,014 (included in liabilities) was received with which the Fund purchased highly liquid short-term investments. In addition, as of August 31, 2015, $870,441 of cash collateral had been segregated to cover the securities lending requirements. Securities on loan are subject to contractual netting arrangements. |
| (d) | Indicates a restricted security; the aggregate original cost of the restricted securities is $275,141,746. The aggregate value, $260,906,493, is approximately 7.9% of net assets. |
| (e) | Represents issuer in default on interest payments. Non-income producing security. |
| (f) | Prudential Investments LLC, the manager of the Fund, also serves as manager of the Prudential Investment Portfolios 2 - Prudential Core Taxable Money Market Fund and the Prudential Investment Portfolios 2 - Prudential Core Short-Term Bond Fund. |
| (g) | Represents security, or a portion thereof, purchased with cash collateral received for securities on loan. |
| (h) | Includes net unrealized appreciation on the following derivative contracts held at reporting period end: |
Credit default swap agreements outstanding at August 31, 2015:
| | | | | | | | | | | | | | | | | | | | | | | | |
Reference Entity/
Obligation | | Termination
Date | | | Fixed
Rate | | | Notional
Amount
(000)#(2) | | | Value at
August 31,
2015(3) | | | Value at
Trade
Date | | | Unrealized
Appreciation | |
Exchange-traded credit default swaps on credit indices—Sell Protection(1): | |
CDX.NA.HY.23 | | | 12/20/19 | | | | 5.000% | | | | 29,100 | | | $ | 1,791,978 | | | $ | 1,469,550 | | | $ | 322,428 | |
| | | | | | | | | | | | | | | | | | | | | | | | |
Cash of $1,500,000 has been segregated with Citigroup Global Markets to cover requirements for open exchange-traded credit default swap agreements at August 31, 2015.
See Notes to Financial Statements.
| | | | |
| Prudential High Yield Fund | | | 41 | |
Portfolio of Investments
as of August 31, 2015 continued
| | | | | | | | | | | | | | | | | | | | | | | | | | | | | | |
Reference Entity/ Obligation | | Termination
Date | | | Fixed
Rate | | | Notional
Amount
(000)#(2) | | | Implied
Credit
Spread at
August 31,
2015(4) | | | Fair
Value | | | Upfront
Premiums
Paid
(Received) | | | Unrealized
Appreciation | | | Counterparty |
Over-the-counter credit default swaps on corporate issues—Sell Protection(1): |
NRG Energy, Inc. | | | 03/20/16 | | | | 4.100% | | | | 1,850 | | | | 0.414 | % | | $ | 53,485 | | | $ | — | | | $ | 53,485 | | | Goldman Sachs & Co. |
| | | | | | | | | | | | | | | | | | | | | | | | | | | | | | |
The Fund entered into credit default swaps (“CDS”) to provide a measure of protection against defaults or to take an active long or short position with respect to the likelihood of a particular issuer’s default or the reference entity’s credit soundness. CDS contracts generally trade based on a spread which represents the cost a protection buyer has to pay the protection seller. The protection buyer is said to be short the credit as the value of the contract rises the more the credit deteriorates. The value of the CDS contract increases for the protection buyer if the spread increases.
| (1) | If the Fund is a seller of protection, it receives the fixed rate. When a credit event occurs, as defined under the terms of that particular swap agreement, the Fund will either (i) pay the buyer of protection an amount equal to the notional amount of the swap less the recovery value of the referenced obligation or underlying securities comprising the referenced obligation or (ii) pay a net settlement amount in the form of cash or securities equal to the notional amount of the swap less the recovery value of the referenced obligation or underlying securities comprising the referenced index. |
| (2) | Notional amount represents the maximum potential amount the Fund could be required to pay as a seller of credit protection or receive as a buyer of credit protection if a credit event occurs as defined under the terms of that particular swap agreement. |
| (3) | The fair value of credit default swap agreements on credit indices serves as an indicator of the current status of the payment/performance risk and represents the likelihood of an expected liability (or profit) for the credit derivative should the notional amount of the swap agreement be closed/sold as of the reporting date. Increasing fair value in absolute terms when compared to the notional amount of the swap, represents a deterioration of the referenced entity’s credit soundness and a greater likelihood of risk of default or other credit event occurring as defined under the terms of the agreement. |
| (4) | Implied credit spreads, represented in absolute terms, utilized in determining the fair value of credit default swap agreements on corporate issues or sovereign issues of an emerging country as of reporting date serve as an indicator of the current status of the payment/performance risk and represent the likelihood of risk of default for the credit derivative. The implied credit spread of a particular referenced entity reflects the cost of buying/selling protection and may include up-front payments required to be made to enter into the agreement. Wider credit spreads represent a deterioration of the referenced entity’s credit soundness and a greater likelihood of risk of default or other credit event occurring as defined under the terms of the agreement. |
See Notes to Financial Statements.
Various inputs are used in determining the value of the Fund’s investments. These inputs are summarized in the three broad levels listed below.
Level 1—quoted prices generally in active markets for identical securities.
Level 2—quoted prices for similar securities, interest rates and yield curves, prepayment speeds, foreign currency exchange rates and other observable inputs.
Level 3—unobservable inputs for securities valued in accordance with Board approved fair valuation procedures.
The following is a summary of the inputs used as of August 31, 2015 in valuing such portfolio securities:
| | | | | | | | | | | | |
| | | Level 1 | | | Level 2 | | | Level 3 | |
Investments in Securities | | | | | | | | | | | | |
Asset-Backed Securities | | | | | | | | | | | | |
Collateralized Loan Obligations | | $ | — | | | $ | 4,906,905 | | | $ | — | |
Bank Loans | | | — | | | | 40,008,254 | | | | 6,209,073 | |
Corporate Bonds | | | — | | | | 3,075,826,125 | | | | 7,718,975 | |
Common Stocks | | | 7,758 | | | | — | | | | 320,816 | |
Preferred Stocks | | | 6,177,240 | | | | — | | | | 102,020 | |
Warrants | | | — | | | | 4,803 | | | | 69 | |
Affiliated Mutual Funds | | | 729,656,410 | | | | — | | | | — | |
Other Financial Instruments* | | | | | | | | | | | | |
Exchange-traded credit default swaps | | | — | | | | 322,428 | | | | — | |
Over-the-counter credit default swaps | | | — | | | | 53,485 | | | | — | |
| | | | | | | | | | | | |
Total | | $ | 735,841,408 | | | $ | 3,121,122,000 | | | $ | 14,350,953 | |
| | | | | | | | | | | | |
| * | Other financial instruments are derivative instruments not reflected in the Portfolio of Investments, such as futures, forwards and exchange-traded swap contracts, which are recorded at the unrealized appreciation/depreciation on the instrument, and over-the-counter swap contracts which are recorded at fair value. |
See Notes to Financial Statements.
| | | | |
| Prudential High Yield Fund | | | 43 | |
Portfolio of Investments
as of August 31, 2015 continued
The industry classification of investments and liabilities in excess of other assets shown as a percentage of net assets as of August 31, 2015 was as follows (Unaudited):
| | | | |
Affiliated Mutual Funds (including 19.3% of collateral for securities on loan) | | | 22.2 | % |
Technology | | | 10.9 | |
Healthcare & Pharmaceutical | | | 9.2 | |
Capital Goods | | | 7.6 | |
Electric | | | 6.2 | |
Gaming | | | 5.1 | |
Building Materials & Construction | | | 5.0 | |
Telecommunications | | | 4.9 | |
Energy - Other | | | 4.7 | |
Foods | | | 4.5 | |
Chemicals | | | 4.1 | |
Cable | | | 3.6 | |
Retailers | | | 3.3 | |
Media & Entertainment | | | 3.3 | |
Pipelines & Other | | | 3.2 | |
Non-Captive Finance | | | 3.2 | |
Automotive | | | 3.1 | |
Packaging | | | 2.6 | % |
Banking | | | 2.1 | |
Consumer | | | 2.1 | |
Real Estate Investment Trusts (REITs) | | | 1.5 | |
Metals | | | 1.4 | |
Aerospace & Defense | | | 1.2 | |
Transportation Services | | | 1.1 | |
Lodging | | | 0.8 | |
Paper | | | 0.2 | |
Collateralized Loan Obligations | | | 0.1 | |
Tobacco | | | 0.1 | |
Insurance | | | 0.1 | |
Textiles, Apparel & Luxury Goods | | | 0.1 | |
Energy - Integrated | | | 0.1 | |
| | | | |
| | | 117.6 | |
Liabilities in excess of other assets | | | (17.6 | ) |
| | | | |
| | | 100.0 | % |
| | | | |
The Fund invested in derivative instruments during the reporting period. The primary types of risk associated with these derivative instruments are equity risk and credit risk. The effect of such derivative instruments on the Fund’s financial position and financial performance as reflected in the Statement of Assets and Liabilities and Statement of Operations is presented in the summary below.
Fair values of derivative instruments as of August 31, 2015 as presented in the Statement of Assets and Liabilities:
| | | | | | | | | | | | |
Derivatives not accounted for
as hedging instruments,
carried at fair value | | Asset Derivatives | | | Liability Derivatives | |
| | Balance Sheet
Location | | Fair
Value | | | Balance Sheet
Location | | Fair
Value | |
| Credit contracts | | Due to/from broker—variation margin—swaps | | $ | 322,428 | * | | — | | $ | — | |
| Credit contracts | | Unrealized appreciation on over-the-counter swap agreements | | | 53,485 | | | — | | | — | |
| Equity contracts | | Unaffiliated investments | | | 4,872 | | | — | | | — | |
| | | | | | | | | | | | |
Total | | | | $ | 380,785 | | | | | $ | — | |
| | | | | | | | | | | | |
| * | Includes cumulative appreciation/depreciation as reported in schedule of exchange-traded swap contracts. Only unsettled variation margin receivable (payable) is reported within the Statement of Assets and Liabilities. |
See Notes to Financial Statements.
The effects of derivative instruments on the Statement of Operations for the year ended August 31, 2015 are as follows:
| | | | | | | | |
Amount of Realized Gain or (Loss) on Derivatives Recognized in Income | |
Derivatives not accounted for as hedging
instruments, carried at fair value | | | | | | Swaps | |
Credit contracts | | | | | | $ | (1,218,173 | ) |
| | | | | | | | |
| | | | | | | | | | | | |
Change in Unrealized Appreciation or (Depreciation) on Derivatives Recognized in Income | |
Derivatives not accounted for as hedging
instruments, carried at fair value | | Warrants(1) | | | Swaps | | | Total | |
Credit contracts | | $ | — | | | $ | (490,255 | ) | | $ | (490,255 | ) |
Equity contracts | | | (60,136 | ) | | | — | | | | (60,136 | ) |
| | | | | | | | | | | | |
Total | | $ | (60,136 | ) | | $ | (490,255 | ) | | $ | (550,391 | ) |
| | | | | | | | | | | | |
| (1) | Included in net change in unrealized appreciation (depreciation) on investments in the Statement of Operations. |
For the year ended August 31, 2015, the Fund’s average notional amount for credit default swaps as seller was $69,784,000.
Offsetting of over-the-counter (OTC) derivative assets and liabilities:
The Fund invested in OTC derivatives during the reporting period that are either offset in accordance with current requirements or are subject to enforceable master netting arrangements or similar agreements that permit offsetting. The information about offsetting and related netting arrangements for OTC derivatives, where the legal right to set-off exists, is presented in the summary below.
| | | | | | | | | | | | | | | | |
Counterparty | | Gross
Amounts of
Recognized
Assets(1) | | | Gross
Amounts
Available
for Offset | | | Collateral
Received(3) | | | Net
Amount | |
Goldman Sachs & Co. | | $ | 53,485 | | | $ | — | | | $ | (150,000 | ) | | $ | — | |
| | | | | | | | | | | | | | | | |
See Notes to Financial Statements.
| | | | |
| Prudential High Yield Fund | | | 45 | |
Portfolio of Investments
as of August 31, 2015 continued
| | | | | | | | | | | | | | | | |
Counterparty | | Gross
Amounts of
Recognized
Liabilities(2) | | | Gross
Amounts
Available
for Offset | | | Collateral
Pledged(3) | | | Net
Amount | |
Goldman Sachs & Co. | | $ | — | | | $ | — | | | $ | — | | | $ | — | |
| (1) | Includes unrealized appreciation on swaps and forwards, premiums paid on swap agreements and market value of purchased options. |
| (2) | Includes unrealized depreciation on swaps and forwards, premiums received on swap agreements and market value of written options. |
| (3) | Amounts shown reflect actual collateral received or pledged by the Fund. Such amounts are applied up to 100% of the Fund’s OTC derivative exposure by counterparty. |
See Notes to Financial Statements.
PRUDENTIAL INVESTMENTS»MUTUAL FUNDS
FINANCIAL STATEMENTS
ANNUAL REPORT · AUGUST 31, 2015
Prudential High Yield Fund
Statement of Assets & Liabilities
as of August 31, 2015
| | | | |
Assets | | | | |
Investments at value, including securities on loan of $620,344,234: | | | | |
Unaffiliated investments (cost $3,261,732,621) | | $ | 3,141,282,038 | |
Affiliated investments (cost $729,674,714) | | | 729,656,410 | |
Cash | | | 472,243 | |
Deposit with broker | | | 1,500,000 | |
Dividends and interest receivable | | | 59,711,062 | |
Receivable for Fund shares sold | | | 8,001,440 | |
Receivable for investments sold | | | 6,787,519 | |
Deposit with affiliated securities lending agent | | | 870,441 | |
Unrealized appreciation on over-the-counter swap agreements | | | 53,485 | |
Prepaid expenses | | | 12,867 | |
| | | | |
Total assets | | | 3,948,347,505 | |
| | | | |
| |
Liabilities | | | | |
Payable to broker for collateral for securities on loan | | | 634,144,455 | |
Payable for Fund shares reacquired | | | 10,853,830 | |
Payable for investments purchased | | | 8,071,409 | |
Dividends payable | | | 2,054,104 | |
Management fee payable | | | 1,195,430 | |
Accrued expenses and other liabilities | | | 763,712 | |
Distribution fee payable | | | 624,128 | |
Affiliated transfer agent fee payable | | | 160,939 | |
Due to broker—variation margin swaps | | | 78,584 | |
Deferred directors’ fees | | | 20,393 | |
| | | | |
Total liabilities | | | 657,966,984 | |
| | | | |
| |
Net Assets | | $ | 3,290,380,521 | |
| | | | |
| | | | | |
Net assets were comprised of: | | | | |
Common stock, at par | | $ | 6,111,001 | |
Paid-in capital in excess of par | | | 3,494,137,991 | |
| | | | |
| | | 3,500,248,992 | |
Undistributed net investment income | | | 7,163,942 | |
Accumulated net realized loss on investment and foreign currency transactions | | | (96,939,878 | ) |
Net unrealized depreciation on investments and foreign currencies | | | (120,092,535 | ) |
| | | | |
Net assets, August 31, 2015 | | $ | 3,290,380,521 | |
| | | | |
See Notes to Financial Statements.
| | | | |
Class A | | | | |
Net asset value and redemption price per share | | | | |
($1,218,179,023 ÷ 226,437,403 shares of common stock issued and outstanding) | | $ | 5.38 | |
Maximum sales charge (4.50% of offering price) | | | 0.25 | |
| | | | |
Maximum offering price to public | | $ | 5.63 | |
| | | | |
| |
Class B | | | | |
Net asset value, offering price and redemption price per share | | | | |
($215,461,964 ÷ 40,096,863 shares of common stock issued and outstanding) | | $ | 5.37 | |
| | | | |
| |
Class C | | | | |
Net asset value, offering price and redemption price per share | | | | |
($236,533,187 ÷ 44,026,781 shares of common stock issued and outstanding) | | $ | 5.37 | |
| | | | |
| |
Class Q | | | | |
Net asset value, offering price and redemption price per share | | | | |
($58,416,341 ÷ 10,847,790 shares of common stock issued and outstanding) | | $ | 5.39 | |
| | | | |
| |
Class R | | | | |
Net asset value, offering price and redemption price per share | | | | |
($51,715,577 ÷ 9,614,993 shares of common stock issued and outstanding) | | $ | 5.38 | |
| | | | |
| |
Class Z | | | | |
Net asset value, offering price and redemption price per share | | | | |
($1,510,074,429 ÷ 280,076,241 shares of common stock issued and outstanding) | | $ | 5.39 | |
| | | | |
See Notes to Financial Statements.
| | | | |
| Prudential High Yield Fund | | | 49 | |
Statement of Operations
Year Ended August 31, 2015
| | | | |
Net Investment Income | | | | |
Income | | | | |
Interest income | | $ | 217,559,845 | |
Affiliated income from securities lending, net | | | 1,473,098 | |
Unaffiliated dividend income | | | 439,876 | |
Affiliated dividend income | | | 168,677 | |
| | | | |
Total income | | | 219,641,496 | |
| | | | |
| |
Expenses | | | | |
Management fee | | | 13,956,485 | |
Distribution fee—Class A | | | 3,562,641 | |
Distribution fee—Class B | | | 1,764,160 | |
Distribution fee—Class C | | | 2,545,175 | |
Distribution fee—Class R | | | 405,649 | |
Transfer agent’s fees and expenses (including affiliated expense of $788,900) | | | 3,815,000 | |
Custodian and accounting fees | | | 396,000 | |
Shareholders’ reports | | | 284,000 | |
Registration fees | | | 248,000 | |
Directors’ fees | | | 75,000 | |
Insurance expenses | | | 41,000 | |
Legal fees and expenses | | | 37,000 | |
Audit fee | | | 34,000 | |
Miscellaneous | | | 27,525 | |
| | | | |
Total expenses | | | 27,191,635 | |
Less: Distribution fee waiver—Class A | | | (336,648 | ) |
Distribution fee waiver—Class R | | | (135,216 | ) |
| | | | |
Net expenses | | | 26,719,771 | |
| | | | |
Net investment income | | | 192,921,725 | |
| | | | |
| |
Realized And Unrealized Gain (Loss) On Investments And Foreign Currency Transactions | | | | |
Net realized loss on: | | | | |
Investment transactions | | | (27,728,363 | ) |
Swap agreement transactions | | | (1,218,173 | ) |
Foreign currency transactions | | | (2,049 | ) |
| | | | |
| | | (28,948,585 | ) |
| | | | |
Net change in unrealized appreciation (depreciation) on: | | | | |
Investments (including affiliated of $(1,410)) | | | (212,032,012 | ) |
Swap agreements | | | (490,255 | ) |
Foreign currencies | | | 526 | |
| | | | |
| | | (212,521,741 | ) |
| | | | |
Net loss on investment and foreign currency transactions | | | (241,470,326 | ) |
| | | | |
Net Decrease In Net Assets Resulting From Operations | | $ | (48,548,601 | ) |
| | | | |
See Notes to Financial Statements.
Statement of Changes in Net Assets
| | | | | | | | |
| | | Year Ended August 31, | |
| | | 2015 | | | 2014 | |
Increase (Decrease) in Net Assets | | | | | | | | |
Operations | | | | | | | | |
Net investment income | | $ | 192,921,725 | | | $ | 183,207,559 | |
Net realized gain (loss) on investment and foreign currency transactions | | | (28,948,585 | ) | | | 59,962,831 | |
Net change in unrealized appreciation (depreciation) on investments and foreign currencies | | | (212,521,741 | ) | | | 57,692,842 | |
| | | | | | | | |
Net increase (decrease) in net assets resulting from operations | | | (48,548,601 | ) | | | 300,863,232 | |
| | | | | | | | |
| | |
Dividends from net investment income (Note 1) | | | | | | | | |
Class A | | | (79,193,882 | ) | | | (83,503,654 | ) |
Class B | | | (13,262,634 | ) | | | (13,538,701 | ) |
Class C | | | (13,715,297 | ) | | | (13,997,820 | ) |
Class Q | | | (2,899,765 | ) | | | (687,488 | ) |
Class R | | | (3,185,804 | ) | | | (3,272,298 | ) |
Class X | | | — | | | | (1,226 | ) |
Class Z | | | (89,227,167 | ) | | | (80,314,668 | ) |
| | | | | | | | |
| | | (201,484,549 | ) | | | (195,315,855 | ) |
| | | | | | | | |
| | |
Fund share transactions (Net of share conversions) (Note 6) | | | | | | | | |
Net proceeds from shares sold | | | 1,080,008,204 | | | | 1,078,720,776 | |
Net asset value of shares issued in reinvestment of dividends and distributions | | | 173,068,158 | | | | 164,498,612 | |
Cost of shares reacquired | | | (998,762,410 | ) | | | (921,234,679 | ) |
| | | | | | | | |
Net increase in net assets from Fund share transactions | | | 254,313,952 | | | | 321,984,709 | |
| | | | | | | | |
Total increase | | | 4,280,802 | | | | 427,532,086 | |
| | |
Net Assets: | | | | | | | | |
Beginning of year | | | 3,286,099,719 | | | | 2,858,567,633 | |
| | | | | | | | |
End of year(a) | | $ | 3,290,380,521 | | | $ | 3,286,099,719 | |
| | | | | | | | |
(a) Includes undistributed net investment income of: | | $ | 7,163,942 | | | $ | 6,016,545 | |
| | | | | | | | |
See Notes to Financial Statements.
| | | | |
| Prudential High Yield Fund | | | 51 | |
Notes to Financial Statements
Prudential Investment Portfolios, Inc. 15 (the “Company”) is registered under the Investment Company Act of 1940, as amended, (“1940 Act”) as a diversified, open-end management investment company. The Company consists of two funds: Prudential High Yield Fund (the “Fund”) and Prudential Short Duration High Yield Income Fund. These financial statements relate to Prudential High Yield Fund. The Fund’s investment objective is to maximize current income. As a secondary investment objective, the Fund seeks capital appreciation but only when consistent with the Fund’s primary objective of current income.
Note 1. Accounting Policies
The Fund follows investment company accounting and reporting guidance of the Financial Accounting Standards Board (“FASB”) Accounting Standard Codification Topic 946 Financial Services-Investment Companies. The following accounting policies conform to U.S. generally accepted accounting principles. The Fund consistently follows such policies in the preparation of its financial statements.
Securities Valuation: The Fund holds securities and other assets that are fair valued at the close of each day the New York Stock Exchange (“NYSE”) is open for trading. Fair value is the price that would be received to sell an asset or paid to transfer a liability in an orderly transaction between market participants on the measurement date. The Board of Directors (the “Board”) has adopted Valuation Procedures for security valuation under which fair valuation responsibilities have been delegated to Prudential Investments LLC (“PI” or “Manager”). Under the current Valuation Procedures, the established Valuation Committee is responsible for supervising the valuation of portfolio securities and other assets. The Valuation Procedures permit the Fund to utilize independent pricing vendor services, quotations from market makers, and alternative valuation methods when market quotations are either not readily available or not deemed representative of fair value. A record of the Valuation Committee’s actions is subject to the Board’s review, approval, and ratification at its next regularly-scheduled quarterly meeting.
Various inputs determine how the Fund’s investments are valued, all of which are categorized according to the three broad levels (Level 1, 2, or 3) detailed in the table following the Portfolio of Investments.
Common and preferred stocks, exchange-traded funds, and derivative instruments such as futures or options that are traded on a national securities exchange are valued at the last sale price as of the close of trading on the applicable exchange where the security principally trades. Securities traded via NASDAQ are valued at the NASDAQ official closing price. To the extent these securities are valued at the last sale price or NASDAQ official closing price, they are classified as Level 1 in the fair value hierarchy.
In the event that no sale or official closing price on valuation date exists, these securities are generally valued at the mean between the last reported bid and ask prices, or at the last bid price in the absence of an ask price. These securities are classified as Level 2 in the fair value hierarchy.
Common and preferred stocks traded on foreign securities exchanges are valued using pricing vendor services that provide model prices derived using adjustment factors based on information such as local closing price, relevant general and sector indices, currency fluctuations, depositary receipts, and futures, as applicable. Securities valued using such model prices are classified as Level 2 in the fair value hierarchy. Such securities are valued using model prices to the extent that the valuation meets the established confidence level for each security. If the confidence level is not met or the vendor does not provide a model price, securities are valued in accordance with exchange-traded common and preferred stocks discussed above.
Participatory Notes (P-notes) are generally valued based upon the value of a related underlying security that trades actively in the market and are classified as Level 2 in the fair value hierarchy.
Investments in open-end, non-exchange-traded mutual funds are valued at their net asset values as of the close of the NYSE on the date of valuation. These securities are classified as Level 1 in the fair value hierarchy since they may be purchased or sold at their net asset values on the date of valuation.
Fixed income securities traded in the over-the-counter (“OTC”) market are generally valued at prices provided by approved independent pricing vendors. The pricing vendors provide these prices after evaluating observable inputs including, but not limited to yield curves, yield spreads, credit ratings, deal terms, tranche level attributes, default rates, cash flows, prepayment speeds, broker/dealer quotations, and reported trades. Securities valued using such vendor prices are classified as Level 2 in the fair value hierarchy.
| | | | |
| Prudential High Yield Fund | | | 53 | |
Notes to Financial Statements
continued
OTC derivative instruments are generally valued using pricing vendor services, which derive the valuation based on inputs such as underlying asset prices, indices, spreads, interest rates, and exchange rates. These instruments are categorized as Level 2 in the fair value hierarchy.
Centrally cleared swaps listed or traded on a multilateral or trade facility platform, such as a registered exchange, are generally valued at the daily settlement price determined by the respective exchange. These securities are classified as Level 2 in the fair value hierarchy, as the daily settlement price is not public.
Securities and other assets that cannot be priced according to the methods described above are valued based on pricing methodologies approved by the Board. In the event that unobservable inputs are used when determining such valuations, the securities will be classified as Level 3 in the fair value hierarchy.
When determining the fair value of securities, some of the factors influencing the valuation include: the nature of any restrictions on disposition of the securities; assessment of the general liquidity of the securities; the issuer’s financial condition and the markets in which it does business; the cost of the investment; the size of the holding and the capitalization of the issuer; the prices of any recent transactions or bids/offers for such securities or any comparable securities; any available analyst media or other reports or information deemed reliable by the investment adviser regarding the issuer or the markets or industry in which it operates. Using fair value to price securities may result in a value that is different from a security’s most recent closing price and from the price used by other mutual funds to calculate their net asset values.
Restricted and Illiquid Securities: Subject to guidelines adopted by the Board, the Fund may invest up to 15% of its net assets in illiquid securities, including those which are restricted as to disposition under securities law (“restricted securities”). Restricted securities are valued pursuant to the valuation procedures noted above. Illiquid securities are those that, because of the absence of a readily available market or due to legal or contractual restrictions on resale, cannot be sold within seven days in the ordinary course of business at approximately the amount at which the Fund has valued the investment. Therefore, the Fund may find it difficult to sell illiquid securities at the time considered most advantageous by its Subadviser and may incur expenses that would not be incurred in the sale of securities that were freely
marketable. Certain securities that would otherwise be considered illiquid because of legal restrictions on resale to the general public may be traded among qualified institutional buyers under Rule 144A of the Securities Act of 1933. These Rule 144A securities, as well as commercial paper that is sold in private placements under Section 4(2) of the Securities Act, may be deemed liquid by the Fund’s Subadviser under the guidelines adopted by the Directors of the Fund. However, the liquidity of the Fund’s investments in Rule 144A securities could be impaired if trading does not develop or declines.
Foreign Currency Translation: The books and records of the Fund are maintained in U.S. dollars. Foreign currency amounts are translated into U.S. dollars on the following basis:
(i) market value of investment securities, other assets and liabilities-at the current rates of exchange.
(ii) purchases and sales of investment securities, income and expenses-at the rates of exchange prevailing on the respective dates of such transactions.
Although the net assets of the Fund are presented at the foreign exchange rates and market values at the close of the period, the Fund does not isolate that portion of the results of operations arising as a result of changes in the foreign exchange rates from the fluctuations arising from changes in the market prices of long-term portfolio securities held at the end of the period. Similarly, the Fund does not isolate the effect of changes in foreign exchange rates from the fluctuations arising from changes in the market prices of long-term portfolio securities sold during the period. Accordingly, these realized foreign currency gains or losses are included in the reported net realized gains or losses on investment transactions.
Net realized gains or losses on foreign currency transactions represent net foreign exchange gains or losses from holdings of foreign currencies, forward currency contracts, disposition of foreign currencies, currency gains or losses realized between the trade and settlement dates on securities transactions, and the difference between the amounts of interest, dividends and foreign withholding taxes recorded on the Fund’s books and the U.S. dollar equivalent amounts actually received or paid. Net unrealized currency gains or losses from valuing foreign currency denominated assets and liabilities (other than investments) at period end exchange rates are reflected as a component of net unrealized appreciation (depreciation) on foreign currencies.
Concentration of Risk: The ability of debt securities issuers (other than those issued or guaranteed by the U.S. Government) held by the Fund to meet its obligations may be affected by the economic or political developments in a specific industry,
| | | | |
| Prudential High Yield Fund | | | 55 | |
Notes to Financial Statements
continued
region or country. Foreign security and currency transactions may involve certain considerations and risks not typically associated with those of U.S. companies as a result of, among other factors, the possibility of political or economic instability or the level of governmental supervision and regulation of foreign securities markets.
Swap Agreements: The Fund may enter into credit default, interest rate, total return and other forms of swap agreements. A swap agreement is an agreement to exchange the return generated by one instrument for the return generated by another instrument. Swap agreements are negotiated in the over-the-counter market and may be executed either directly with the counterparty (“OTC-traded”) or through a central clearing facility, such as a registered commodities exchange (“Exchange-traded”). Swap agreements are valued daily at current market value and any change in value is included in the net unrealized appreciation or depreciation on investments. Exchange-traded swaps pay or receive an amount known as “variation margin”, based on daily changes in the valuation of the swap contract.
Payments received or paid by the Fund are recorded as realized gains or losses upon termination or maturity of the swap. Risk of loss may exceed amounts recognized on the Statement of Assets and Liabilities. Swap agreements outstanding at reporting date, if any, are listed on the Portfolio of Investments.
Credit Default Swaps: Credit default swaps (“CDS”) involve one party (the protection buyer) making a stream of payments to another party (the protection seller) in exchange for the right to receive a specified payment in the event of a default or as a result of a default (collectively a “credit event”) for the referenced entity (typically corporate issues or sovereign issues of an emerging country) on its obligation; or in the event of a write-down, principal shortfall, interest shortfall or default of all or part of the referenced entities comprising a credit index.
The Fund is subject to credit risk in the normal course of pursuing its investment objectives. The Fund entered into credit default swaps to provide a measure of protection against defaults or to take an active long or short position with respect to the likelihood of a particular issuer’s default or the reference entity’s credit soundness. CDS contracts generally trade based on a spread which represents the cost a protection buyer has to pay the protection seller. The protection buyer is said to be short the credit as the value of the contract rises the more the credit deteriorates. The value of the CDS contract increases for the protection buyer if the spread increases.
The Fund’s maximum risk of loss from counterparty credit risk for purchased credit default swaps is the inability of the counterparty to honor the contract up to the notional value due to a credit event.
As a seller of protection on credit default swap agreements, the Fund generally receives an agreed upon payment from the buyer of protection throughout the term of the swap, provided no credit event occurs. As the seller, the Fund effectively increases its investment risk because, in addition to its total net assets, the Fund may be subject to investment exposure on the notional amount of the swap.
The maximum amount of the payment that the Fund, as a seller of protection, could be required to make under a credit default swap agreement would be equal to the notional amount of the underlying security or index contract as a result of a credit event. This potential amount will be partially offset by any recovery values of the respective referenced obligations, or net amounts received from the settlement of buy protection credit default swap agreements which the Fund entered into for the same referenced entity or index. As a buyer of protection, the Fund generally receives an amount up to the notional value of the swap if a credit event occurs.
Implied credit spreads, represented in absolute terms, utilized in determining the market value of credit default swap agreements on corporate or sovereign issues of an emerging country as of period end are disclosed in the footnotes to the Portfolio of Investments, if applicable. These spreads serve as indicators of the current status of the payment/performance risk and represent the likelihood of default risk for the credit derivative. The implied credit spread of a particular referenced entity reflects the cost of buying/selling protection and may include upfront payments required to enter into the agreement. For credit default swap agreements on asset-backed securities and credit indices, the quoted market prices and resulting values serve as indicators of the current status of the payment/performance risk. Wider credit spreads and increased market value in absolute terms, when compared to the notional amount of the swap, represent a deterioration of the referenced entity’s credit soundness and a greater likelihood of risk of default or other credit event occurring as defined under the terms of the agreement.
Master Netting Arrangements: The Fund is subject to various Master Agreements, or netting arrangements, with select counterparties. These are agreements which a subadviser may have negotiated and entered into on behalf of the Fund. A master netting arrangement between the Fund and the counterparty permits the Fund to offset amounts payable by the Fund to the same counterparty against amounts to be received; and by the receipt of collateral from the counterparty by the Fund to cover the Fund’s exposure to the counterparty. However, there is no assurance that such
| | | | |
| Prudential High Yield Fund | | | 57 | |
Notes to Financial Statements
continued
mitigating factors are easily enforceable. The right to set-off exists when all the conditions are met such that each of the parties owes the other determinable amounts, the reporting party has the right to set-off the amount owed with the amount owed by the other party, the reporting party intends to set-off and the right of set-off is enforceable by law. During the reporting period, there were no instances where the right of set-off existed and management has not elected to offset.
The Fund is a party to ISDA (International Swaps and Derivatives Association, Inc.) Master Agreements with certain counterparties that govern over-the-counter derivative and foreign exchange contracts entered into from time to time. The Master Agreements may contain provisions regarding, among other things, the parties’ general obligations, representations, agreements, collateral requirements, events of default and early termination. With respect to certain counterparties, in accordance with the terms of the Master Agreements, collateral posted to the Fund is held in a segregated account by the Fund’s custodian and with respect to those amounts which can be sold or re-pledged, are presented in the Portfolio of Investments. Collateral pledged by the Fund is segregated by the Fund’s custodian and identified in the Portfolio of Investments. Collateral can be in the form of cash or debt securities issued by the U.S. Government or related agencies or other securities as agreed to by the Fund and the applicable counterparty. Collateral requirements are determined based on the Fund’s net position with each counterparty. Termination events applicable to the Fund may occur upon a decline in the Fund’s net assets below a specified threshold over a certain period of time. Termination events applicable to counterparties may occur upon a decline in the counterparty’s long-term and short-term credit ratings below a specified level. In each case, upon occurrence, the other party may elect to terminate early and cause settlement of all derivative and foreign exchange contracts outstanding, including the payment of any losses and costs resulting from such early termination, as reasonably determined by the terminating party. Any decision by one or more of the Fund’s counterparties to elect early termination could impact the Fund’s future derivative activity.
In addition to each instrument’s primary underlying risk exposure (e.g. interest rate, credit, equity or foreign exchange, etc.), swap agreements involve, to varying degrees, elements of credit, market and documentation risk. Such risks involve the possibility that no liquid market for these agreements will exist, the counterparty to the agreement may default on its obligation to perform or disagree on the contractual terms of the agreement, and changes in net interest rates will be unfavorable. In
connection with these agreements, securities in the portfolio may be identified or received as collateral from the counterparty in accordance with the terms of the respective swap agreements to provide or receive assets of value and to serve as recourse in the event of default or bankruptcy/insolvency of either party. Such over-the-counter derivative agreements include conditions which, when materialized, give the counterparty the right to cause an early termination of the transactions under those agreements. Any election by the counterparty for early termination of the contract(s) may impact the amounts reported on financial statements.
As of August 31, 2015, the Fund has not met conditions under such agreements which give the counterparty the right to call for an early termination.
Warrants and Rights: The Fund may hold warrants and rights acquired either through a direct purchase, including as part of private placement, or pursuant to corporate actions. Warrants and rights entitle the holder to buy a proportionate amount of common stock, or such other security that the issuer may specify, at a specific price and time through the expiration dates. Such warrants and rights are held as long positions by the Fund until exercised, sold or expired. Warrants and rights are valued at fair value in accordance with the Board of Directors’ approved fair valuation procedures.
Loan Participations: The Fund may invest in loan participations, another type of restricted security. When the Fund purchases a loan participation, the Fund typically enters into a contractual relationship with the lender or third party selling such participations (“Selling Participant”), but not the borrower. As a result, the Fund assumes the credit risk of the borrower, the Selling Participant and any other persons interpositioned between the Fund and the borrower. The Fund may not directly benefit from the collateral supporting the senior loan in which it has purchased the loan participation.
Payment In Kind Securities: The Fund may invest in open market or receive pursuant to debt restructuring, securities that pay in kind (PIK) the interest due on such debt instruments. The PIK interest, computed at the contractual rate specified, is added to the existing principal balance of the debt when issued bonds have same terms as the bond or recorded as a separate bond when terms are different from the existing debt, and is recorded as interest income. The interest rate on PIK debt is paid out over time.
Securities Lending: The Fund may lend its portfolio securities to banks and broker-dealers. The loans are secured by collateral at least equal to the market value of the securities loaned. Collateral pledged by each borrower is invested in a highly liquid short-term money market fund and is marked to market daily, based on the previous
| | | | |
| Prudential High Yield Fund | | | 59 | |
Notes to Financial Statements
continued
day’s market value, such that the value of the collateral exceeds the value of the loaned securities. Loans are subject to termination at the option of the borrower or the Fund. Upon termination of the loan, the borrower will return to the Fund securities identical to the loaned securities. Should the borrower of the securities fail financially, the Fund has the right to repurchase the securities in the open market using the collateral. The Fund recognizes income, net of any rebate and securities lending agent fees, for lending its securities, and any interest on the investment of cash received as collateral. The Fund also continues to receive interest and dividends or amounts equivalent thereto, on the securities loaned and recognizes any unrealized gain or loss in the market price of the securities loaned that may occur during the term of the loan.
Securities Transactions and Net Investment Income: Securities transactions are recorded on the trade date. Realized gains or losses from investment and currency transactions are calculated on the identified cost basis. Dividend income is recorded on the ex-dividend date. Interest income, including amortization of premium and accretion of discount on debt securities, as required, is recorded on the accrual basis. Expenses are recorded on an accrual basis, which may require the use of certain estimates by management, that may differ from actual.
Net investment income or loss (other than distribution fees, which are charged directly to the respective class and transfer agency fees specific to Class Q shares which are charged to that share class) and unrealized and realized gains or losses are allocated daily to each class of shares based upon the relative proportion of adjusted net assets of each class at the beginning of the day.
Dividends and Distributions: The Fund declares daily and pays dividends of net investment income monthly and makes distributions of net realized capital and currency gains, if any, annually. Dividends and distributions to shareholders, which are determined in accordance with federal income tax regulations and which may differ from generally accepted accounting principles, are recorded on the ex-dividend date. Permanent book/tax differences relating to income and gains are reclassified amongst undistributed net investment income, accumulated net realized gain or loss and paid-in capital in excess of par, as appropriate.
Taxes: It is the Fund’s policy to continue to meet the requirements of the Internal Revenue Code applicable to regulated investment companies and to distribute all of
its taxable net investment income and capital gains, if any, to its shareholders. Therefore, no federal income tax provision is required.
Estimates: The preparation of financial statements requires management to make estimates and assumptions that affect the reported amounts and disclosures in the financial statements. Actual results could differ from those estimates.
Note 2. Agreements
The Fund has a management agreement with PI. Pursuant to this agreement, PI has responsibility for all investment advisory services and supervises the subadvisor’s performance of such services. PI has entered into a subadvisory agreement with Prudential Investment Management, Inc. (“PIM”). The subadvisory agreement provides that PIM will furnish investment advisory services in connection with the management of the Fund. In connection therewith, PIM is obligated to keep certain books and records of the Fund. PI pays for the services of PIM, the cost of compensation of officers of the Fund, occupancy and certain clerical and bookkeeping costs of the Fund. The Fund bears all other costs and expenses.
The management fee paid to PI is accrued daily and payable monthly, at an annual rate of .50% of the Fund’s average daily net assets up to $250 million, .475% of the next $500 million, .45% of the next $750 million, .425% of the next $500 million, .40% of the next $500 million, .375% of the next $500 million and .35% of the Fund’s average daily net assets in excess of $3 billion. The effective management fee rate was .43% for the year ended August 31, 2015.
The Fund has a distribution agreement with Prudential Investment Management Services LLC (“PIMS”), which acts as the distributor of the Class A, Class B, Class C, Class Q, Class R and Class Z shares of the Fund. Formerly through April 11, 2014, the Fund had a distribution agreement with Prudential Annuities Distributors, Inc. (“PAD”), which, together with PIMS, served as co-distributor of Class X shares of the Fund. The Fund compensates PIMS for distributing and servicing the Fund’s Class A, Class B, Class C and Class R shares, pursuant to plans of distribution (the “Distribution Plans”), regardless of expenses actually incurred by PIMS. The distribution fees are accrued daily and payable monthly. No distribution or service fees are paid to PIMS as distributor of the Class Q and Class Z shares of the Fund. Pursuant to the Distribution Plans, the Fund compensates PIMS for distribution related activities at an annual rate of up to .30%, .75%, 1% and .75% of the average daily net assets of the Class A, B, C and R shares, respectively. PIMS contractually agreed to limit such fees to .25% of the average daily net assets of the Class A shares through March 8, 2015. Effective March 9, 2015, the Class A contractual distribution and service (12b-1) fees
| | | | |
| Prudential High Yield Fund | | | 61 | |
Notes to Financial Statements
continued
were reduced from .30% to .25% of the average daily net assets and the .05% contractual 12b-1 fee waiver was terminated. For the year ended August 31, 2015, PIMS contractually agreed to limit such fees to .50% of the average daily net assets of the Class R shares.
As of April 11, 2014, the last conversion of Class X shares to Class A shares was completed. There are no Class X shares outstanding and Class X shares are no longer being offered for sale.
PIMS has advised the Fund that it has received $1,416,658 in front-end sales charges resulting from sales of Class A shares, during the year ended August 31, 2015. From these fees, PIMS paid such sales charges to affiliated broker-dealers, which in turn paid commissions to salespersons and incurred other distribution costs.
PIMS has advised the Fund that for the year ended August 31, 2015, it received $2,187, $342,788 and $25,532 in contingent deferred sales charges imposed upon redemptions by certain Class A, Class B and Class C shareholders, respectively.
PI, PIMS, PIM and PAD are indirect, wholly-owned subsidiaries of Prudential Financial, Inc. (“Prudential”).
Note 3. Other Transactions with Affiliates
Prudential Mutual Fund Services LLC (“PMFS”), an affiliate of PI and an indirect, wholly-owned subsidiary of Prudential, serves as the Fund’s transfer agent. Transfer agent’s fees and expenses on the Statement of Operations include certain out-of-pocket expenses paid to non-affiliates, where applicable.
Prudential Investment Management, Inc., (“PIM”), an indirect, wholly-owned subsidiary of Prudential, is the Fund’s securities lending agent. For the year ended August 31, 2015, PIM has been compensated approximately $440,000 for these services.
The Fund invests in the Prudential Core Short-Term Bond Fund, pursuant to an exemptive order received from the Securities and Exchange Commission and in the Prudential Core Taxable Money Market Fund (the “Core Funds”), each a portfolio of the Prudential Investment Portfolios 2, registered under the 1940 Act and managed by PI. Earnings from the Core Funds are disclosed on the Statement of Operations as affiliated dividend income.
Note 4. Portfolio Securities
Purchases and sales of investment securities, other than short-term investments, for the year ended August 31, 2015, aggregated $1,799,287,414 and $1,502,351,214, respectively.
Note 5. Distributions and Tax Information
Distributions to shareholders, which are determined in accordance with federal income tax regulations and which may differ from generally accepted accounting principles, are recorded on the ex-dividend date. In order to present undistributed net investment income, accumulated net realized loss on investment and foreign currency transactions and paid-in capital in excess of par on the Statement of Assets and Liabilities that more closely represent their tax character, certain adjustments have been made to undistributed net investment income, accumulated net realized loss on investment and foreign currency transactions and paid-in capital in excess of par. For the year ended August 31, 2015, the adjustments were to increase undistributed net investment income by 9,710,221, increase accumulated net realized loss on investment and foreign currency transactions by $9,721,624 and increase paid in capital in excess of par by $11,403 due to differences in the treatment for book and tax purposes of premium amortization, certain transactions involving foreign securities and currencies, paydown gains/losses, swaps, and other book to tax differences. Net investment income, net realized loss on investment and foreign currency transactions and net assets were not affected by this change.
For the years ended August 31, 2015 and August 31, 2014, the tax character of dividends paid by the Fund were $201,484,549 and $195,315,855 of ordinary income, respectively.
As of August 31, 2015, the accumulated undistributed earnings on a tax basis was $9,283,103 of ordinary income. This differs from the amount shown on the Statement of Assets and Liabilities primarily due to cumulative timing differences between financial and tax reporting.
The United States federal income tax basis of the Fund’s investments and the net unrealized depreciation as of August 31, 2015 were as follows:
| | | | | | | | | | |
Tax Basis | | Appreciation | | Depreciation | | Net
Unrealized
Depreciation | | Other Cost
Basis
Adjustments | | Total Net
Unrealized
Depreciation |
| $4,000,114,680 | | $47,511,955 | | $(176,688,187) | | $(129,176,232) | | $360,971 | | $(128,815,261) |
| | | | |
| Prudential High Yield Fund | | | 63 | |
Notes to Financial Statements
continued
The difference between book and tax basis is primarily attributable to deferred losses on wash sales, differences in the treatment of premium amortization for book and tax purposes and trust preferred securities. The other cost basis adjustments are primarily attributable to appreciation (depreciation) of swaps.
Under the Regulated Investment Company Modernization Act of 2010 (the “Act”), the Fund is permitted to carryforward capital losses realized on or after September 1, 2011 (“post-enactment losses”) for an unlimited period. Post-enactment losses are required to be utilized before the utilization of losses incurred prior to the effective date of the Act. As a result of this ordering rule, capital loss carryforwards related to taxable years ending before August 31, 2012 (“pre-enactment losses”) may have an increased likelihood to expire unused. No capital gains distributions are expected to be paid to shareholders until net gains have been realized in excess of such losses. As of August 31, 2015, the pre and post-enactment losses were approximately:
| | | | |
Post-Enactment Losses: | | $ | 4,214,000 | |
| | | | |
Pre-Enactment Losses: | | | | |
Expiring 2018 | | $ | 49,857,000 | |
| | | | |
The Fund elected to treat post-October capital losses of approximately $34,191,000 as having been incurred in the following fiscal year (August 31, 2016).
Management has analyzed the Fund’s tax positions taken on federal income tax returns for all open tax years and has concluded that no provision for income tax is required in the Fund’s financial statements for the current reporting period. The Fund’s federal and state income and federal excise tax returns for tax years for which the applicable statutes of limitations have not expired are subject to examination by the Internal Revenue Service and state departments of revenue.
Note 6. Capital
The Fund offers Class A, Class B, Class C, Class Q, Class R and Class Z shares. Class A shares are sold with a front-end sales charge of up to 4.50%. Investors who purchase $1 million or more of Class A shares and redeem those shares within 12 months of purchase are subject to a contingent deferred sales charge (“CDSC”) of 1%, but are not subject to an initial sales charge. The Class A CDSC is waived for purchases by certain retirement or benefit plans. Class B shares are sold with a CDSC which
declines from 5% to zero depending on the period of time the shares are held. Class B shares will automatically convert to Class A shares on a quarterly basis approximately seven years after purchase. Class B shares are closed to new purchases. Class C shares are sold with a CDSC of 1% during the first 12 months. As of April 11, 2014, the last conversion of Class X shares to Class A shares was completed. There are no Class X shares outstanding and Class X shares are no longer being offered for sale. Class Q, Class R and Class Z shares are not subject to any sales or redemption charges and are available only to a limited group of investors.
Under certain circumstances, an exchange may be made from specified share classes of the Fund to one or more other share classes of the Fund as presented in the table of transactions in shares of common stock.
The Company is authorized to issue 3 billion shares of common stock, $.01 par value per share, divided into 6 classes, designated Class A, Class B, Class C, Class Q, Class R and Class Z common stock. Of the authorized shares of common stock of the Fund, 550 million shares are designated for Class A common stock, 75 million shares are designated for Class B common stock, 125 million shares are designated for Class C common stock, 500 million shares are designated for Class Q common stock, 150 million shares are designated for Class R common stock, and 500 million shares are designated for Class Z common stock.
Transactions in shares of common stock were as follows:
| | | | | | | | |
Class A | | Shares | | | Amount | |
Year ended August 31, 2015: | | | | | | | | |
Shares sold | | | 37,784,860 | | | $ | 210,561,585 | |
Shares issued in reinvestment of dividends and distributions | | | 11,688,852 | | | | 65,047,906 | |
Shares reacquired | | | (53,421,960 | ) | | | (297,129,188 | ) |
| | | | | | | | |
Net increase (decrease) in shares outstanding before conversion | | | (3,948,248 | ) | | | (21,519,697 | ) |
Shares issued upon conversion from other share class(es) | | | 1,587,855 | | | | 8,858,501 | |
Shares reacquired upon conversion into other share class(es) | | | (3,428,484 | ) | | | (19,030,037 | ) |
| | | | | | | | |
Net increase (decrease) in shares outstanding | | | (5,788,877 | ) | | $ | (31,691,233 | ) |
| | | | | | | | |
Year ended August 31, 2014: | | | | | | | | |
Shares sold | | | 31,866,582 | | | $ | 183,587,307 | |
Shares issued in reinvestment of dividends and distributions | | | 11,714,551 | | | | 67,531,261 | |
Shares reacquired | | | (44,046,313 | ) | | | (253,449,540 | ) |
| | | | | | | | |
Net increase (decrease) in shares outstanding before conversion | | | (465,180 | ) | | | (2,330,972 | ) |
Shares issued upon conversion from other share class(es) | | | 1,186,158 | | | | 6,849,047 | |
Shares reacquired upon conversion into other share class(es) | | | (5,471,223 | ) | | | (31,636,684 | ) |
| | | | | | | | |
Net increase (decrease) in shares outstanding | | | (4,750,245 | ) | | $ | (27,118,609 | ) |
| | | | | | | | |
| | | | |
| Prudential High Yield Fund | | | 65 | |
Notes to Financial Statements
continued
| | | | | | | | |
Class B | | Shares | | | Amount | |
Year ended August 31, 2015: | | | | | | | | |
Shares sold | | | 336,735 | | | $ | 1,865,668 | |
Shares issued in reinvestment of dividends and distributions | | | 1,930,960 | | | | 10,734,052 | |
Shares reacquired | | | (5,665,887 | ) | | | (31,465,662 | ) |
| | | | | | | | |
Net increase (decrease) in shares outstanding before conversion | | | (3,398,192 | ) | | | (18,865,942 | ) |
Shares reacquired upon conversion into other share class(es) | | | (1,308,285 | ) | | | (7,296,774 | ) |
| | | | | | | | |
Net increase (decrease) in shares outstanding | | | (4,706,477 | ) | | $ | (26,162,716 | ) |
| | | | | | | | |
Year ended August 31, 2014: | | | | | | | | |
Shares sold | | | 10,579,556 | | | $ | 60,957,516 | |
Shares issued in reinvestment of dividends and distributions | | | 1,866,561 | | | | 10,755,175 | |
Shares reacquired | | | (4,821,903 | ) | | | (27,730,811 | ) |
| | | | | | | | |
Net increase (decrease) in shares outstanding before conversion | | | 7,624,214 | | | | 43,981,880 | |
Shares reacquired upon conversion into other share class(es) | | | (1,010,627 | ) | | | (5,833,252 | ) |
| | | | | | | | |
Net increase (decrease) in shares outstanding | | | 6,613,587 | | | $ | 38,148,628 | |
| | | | | | | | |
Class C | | | | | | |
Year ended August 31, 2015: | | | | | | | | |
Shares sold | | | 7,939,650 | | | $ | 44,407,132 | |
Shares issued in reinvestment of dividends and distributions | | | 2,039,526 | | | | 11,334,398 | |
Shares reacquired | | | (11,934,470 | ) | | | (66,142,653 | ) |
| | | | | | | | |
Net increase (decrease) in shares outstanding before conversion | | | (1,955,294 | ) | | | (10,401,123 | ) |
Shares reacquired upon conversion into other share class(es) | | | (623,055 | ) | | | (3,474,232 | ) |
| | | | | | | | |
Net increase (decrease) in shares outstanding | | | (2,578,349 | ) | | $ | (13,875,355 | ) |
| | | | | | | | |
Year ended August 31, 2014: | | | | | | | | |
Shares sold | | | 11,287,152 | | | $ | 65,018,908 | |
Shares issued in reinvestment of dividends and distributions | | | 1,988,484 | | | | 11,451,688 | |
Shares reacquired | | | (10,487,457 | ) | | | (60,228,260 | ) |
| | | | | | | | |
Net increase (decrease) in shares outstanding before conversion | | | 2,788,179 | | | | 16,242,336 | |
Shares reacquired upon conversion into other share class(es) | | | (508,136 | ) | | | (2,926,501 | ) |
| | | | | | | | |
Net increase (decrease) in shares outstanding | | | 2,280,043 | | | $ | 13,315,835 | |
| | | | | | | | |
| | | | | | | | |
Class Q | | Shares | | | Amount | |
Year ended August 31, 2015: | | | | | | | | |
Shares sold | | | 11,506,894 | | | $ | 64,675,894 | |
Shares issued in reinvestment of dividends and distributions | | | 513,394 | | | | 2,852,645 | |
Shares reacquired | | | (4,330,479 | ) | | | (23,834,537 | ) |
| | | | | | | | |
Net increase (decrease) in shares outstanding before conversion | | | 7,689,809 | | | | 43,694,002 | |
Shares issued upon conversion from other share class(es) | | | 691,850 | | | | 3,881,279 | |
| | | | | | | | |
Net increase (decrease) in shares outstanding | | | 8,381,659 | | | $ | 47,575,281 | |
| | | | | | | | |
Year ended August 31, 2014: | | | | | | | | |
Shares sold | | | 1,499,160 | | | $ | 8,683,554 | |
Shares issued in reinvestment of dividends and distributions | | | 119,133 | | | | 688,446 | |
Shares reacquired | | | (560,310 | ) | | | (3,248,060 | ) |
| | | | | | | | |
Net increase (decrease) in shares outstanding | | | 1,057,983 | | | $ | 6,123,940 | |
| | | | | | | | |
Class R | | | | | | |
Year ended August 31, 2015 | | | | | | | | |
Shares sold | | | 2,376,252 | | | $ | 13,235,546 | |
Shares issued in reinvestment of dividends and distributions | | | 571,724 | | | | 3,181,316 | |
Shares reacquired | | | (3,241,718 | ) | | | (18,023,267 | ) |
| | | | | | | | |
Net increase (decrease) in shares outstanding | | | (293,742 | ) | | $ | (1,606,405 | ) |
| | | | | | | | |
Year ended August 31, 2014: | | | | | | | | |
Shares sold | | | 3,214,716 | | | $ | 18,497,113 | |
Shares issued in reinvestment of dividends and distributions | | | 567,409 | | | | 3,270,947 | |
Shares reacquired | | | (2,930,220 | ) | | | (16,890,913 | ) |
| | | | | | | | |
Net increase (decrease) in shares outstanding | | | 851,905 | | | $ | 4,877,147 | |
| | | | | | | | |
Class X | | | | | | |
Period ended April 11, 2014*: | | | | | | | | |
Shares issued in reinvestment of dividends and distributions | | | 204 | | | $ | 1,162 | |
Shares reacquired | | | (1,343 | ) | | | (7,565 | ) |
| | | | | | | | |
Net increase (decrease) in shares outstanding before conversion | | | (1,139 | ) | | | (6,403 | ) |
Shares reacquired upon conversion into Class A | | | (11,948 | ) | | | (68,325 | ) |
| | | | | | | | |
Net increase (decrease) in shares outstanding | | | (13,087 | ) | | $ | (74,728 | ) |
| | | | | | | | |
| | | | |
| Prudential High Yield Fund | | | 67 | |
Notes to Financial Statements
continued
| | | | | | | | |
Class Z | | Shares | | | Amount | |
Year ended August 31, 2015: | | | | | | | | |
Shares sold | | | 133,643,733 | | | $ | 745,262,379 | |
Shares issued in reinvestment of dividends and distributions | | | 14,344,007 | | | | 79,917,841 | |
Shares reacquired | | | (100,706,938 | ) | | | (562,167,103 | ) |
| | | | | | | | |
Net increase (decrease) in shares outstanding before conversion | | | 47,280,802 | | | | 263,013,117 | |
Shares issued upon conversion from other share class(es) | | | 3,988,510 | | | | 22,189,698 | |
Shares reacquired upon conversion into other share class(es) | | | (913,473 | ) | | | (5,128,435 | ) |
| | | | | | | | |
Net increase (decrease) in shares outstanding | | | 50,355,839 | | | $ | 280,074,380 | |
| | | | | | | | |
Year ended August 31, 2014: | | | | | | | | |
Shares sold | | | 128,576,956 | | | $ | 741,976,378 | |
Shares issued in reinvestment of dividends and distributions | | | 12,240,948 | | | | 70,799,933 | |
Shares reacquired | | | (96,842,573 | ) | | | (559,679,530 | ) |
| | | | | | | | |
Net increase (decrease) in shares outstanding before conversion | | | 43,975,331 | | | | 253,096,781 | |
Shares issued upon conversion from other shares classes | | | 5,957,029 | | | | 34,505,900 | |
Shares reacquired upon conversion into other share class(es) | | | (154,203 | ) | | | (890,185 | ) |
| | | | | | | | |
Net increase (decrease) in shares outstanding | | | 49,778,157 | | | $ | 286,712,496 | |
| | | | | | | | |
| * | As of April 11, 2014, the last conversion of Class X shares to Class A shares was completed. There are no Class X shares outstanding and Class X shares are no longer being offered for sale. |
Note 7. Borrowings
The Fund, along with other affiliated registered investment companies (the “Funds”), is a party to a Syndicated Credit Agreement (“SCA”) with a group of banks. The purpose of the SCA is to provide an alternative source of temporary funding for capital share redemptions. The SCA provides for a commitment of $900 million for the period October 9, 2014 through October 8, 2015. The Funds pay an annualized commitment fee of .075% of the unused portion of the SCA. Prior to October 9, 2014, the Funds had another SCA that provided a commitment of $900 million and the Funds paid an annualized commitment fee of .08% of the unused portion of the SCA. Interest on any borrowings under the SCA is paid at contracted market rates. The commitment fee for the unused amount is accrued daily and paid quarterly.
Subsequent to the fiscal year end, the SCA has been renewed effective October 8, 2015 and will continue to provide a commitment of $900 million through October 6, 2015. Effective October 8, 2015, the Funds pay an annualized commitment fee of .11% of the unused portion of the SCA.
The Fund did not utilize the SCA during the year ended August 31, 2015.
Note 8. New Accounting Pronouncement
In May 2015, the FASB issued Accounting Standards Update (“ASU”) No. 2015-07 regarding “Disclosures for Investments in Certain Entities That Calculate Net Asset Value per Share”. The amendments in this update are effective for the Fund for fiscal years beginning after December 15, 2015, and interim periods within those fiscal years. ASU No. 2015-07 will eliminate the requirement to categorize investments in the fair value hierarchy if their fair value is measured at net asset value (“NAV”) per share (or its equivalent) using the practical expedient in the FASB’s fair value measurement guidance. Management has evaluated the implications of ASU No. 2015-07 and it has been determined that there is no impact on the financial statement disclosures.
| | | | |
| Prudential High Yield Fund | | | 69 | |
Financial Highlights
| | | | | | | | | | | | | | | | | | | | |
| Class A Shares | |
| | | Year Ended August 31, | |
| | | 2015(a) | | | 2014(a) | | | 2013(a) | | | 2012(a) | | | 2011(a) | |
| Per Share Operating Performance: | | | | | | | | | | | | | | | | | |
| Net Asset Value, Beginning of Year | | | $5.80 | | | | $5.60 | | | | $5.59 | | | | $5.34 | | | | $5.32 | |
| Income (loss) from investment operations: | | | | | | | | | | | | | | | | | | | | |
| Net investment income | | | .33 | | | | .33 | | | | .34 | | | | .37 | | | | .40 | |
| Net realized and unrealized gain (loss) on investment transactions | | | (.41 | ) | | | .22 | | | | .04 | | | | .27 | | | | .03 | |
| Total from investment operations | | | (.08 | ) | | | .55 | | | | .38 | | | | .64 | | | | .43 | |
| Less Dividends: | | | | | | | | | | | | | | | | | | | | |
| Dividends from net investment income | | | (.34 | ) | | | (.35 | ) | | | (.37 | ) | | | (.39 | ) | | | (.41 | ) |
| Capital Contributions(e): | | | - | | | | - | | | | - | | | | - | | | | - | (d) |
| Net asset value, end of year | | | $5.38 | | | | $5.80 | | | | $5.60 | | | | $5.59 | | | | $5.34 | |
| Total Return(b): | | | (1.39)% | | | | 10.11% | | | | 6.85% | | | | 12.55% | | | | 8.14% | |
| |
| Ratios/Supplemental Data: | |
| Net assets, end of year (000) | | | $1,218,179 | | | | $1,347,911 | | | | $1,327,678 | | | | $1,339,113 | | | | $1,078,117 | |
| Average net assets (000) | | | $1,290,432 | | | | $1,355,610 | | | | $1,385,567 | | | | $1,187,666 | | | | $1,147,761 | |
| Ratios to average net assets(c): | | | | | | | | | | | | | | | | | | | | |
| Expenses after waivers and/or expense reimbursement(f) | | | .83% | | | | .82% | | | | .83% | | | | .87% | | | | .88% | |
| Expenses before waivers and/or expense reimbursement(f) | | | .85% | | | | .87% | | | | .88% | | | | .92% | | | | .93% | |
| Net investment income | | | 5.88% | | | | 5.78% | | | | 6.04% | | | | 6.75% | | | | 7.20% | |
| Portfolio turnover rate | | | 48% | | | | 51% | | | | 55% | | | | 48% | | | | 87% | |
(a) Calculated based on average shares outstanding during the year.
(b) Total return does not consider the effects of sales loads. Total return is calculated assuming a purchase of a share on the first day and a sale on the last day of each year reported and includes reinvestment of dividends and distributions. Total returns may reflect adjustments to conform to generally accepted accounting principles.
(c) Does not include expenses of the underlying portfolios in which the Fund invests.
(d) Less than $.005 per share.
(e) The Fund received payments related to an unaffiliated-third party’s settlement of regulatory proceedings involving allegations of improper trading in Fund shares during the fiscal year ended August 31, 2011. The Fund was not involved in the proceedings or in the calculation of the amount of settlement.
(f) Effective March 9, 2015, the contractual distribution and service (12b-1) fees were reduced from .30% to .25% of the average daily net assets and the .05% contractual 12b-1 fee waiver was terminated.
See Notes to Financial Statements.
| | | | | | | | | | | | | | | | | | | | |
| Class B Shares | |
| | | Year Ended August 31, | |
| | | 2015(a) | | | 2014(a) | | | 2013(a) | | | 2012(a) | | | 2011(a) | |
| Per Share Operating Performance: | | | | | | | | | | | | | | | | | | | | |
| Net Asset Value, Beginning of Year | | | $5.80 | | | | $5.60 | | | | $5.59 | | | | $5.34 | | | | $5.31 | |
| Income (loss) from investment operations: | | | | | | | | | | | | | | | | | | | | |
| Net investment income | | | .30 | | | | .30 | | | | .32 | | | | .34 | | | | .37 | |
| Net realized and unrealized gain (loss) on investment transactions | | | (.42 | ) | | | .23 | | | | .03 | | | | .28 | | | | .05 | |
| Total from investment operations | | | (.12 | ) | | | .53 | | | | .35 | | | | .62 | | | | .42 | |
| Less Dividends: | | | | | | | | | | | | | | | | | | | | |
| Dividends from net investment income | | | (.31 | ) | | | (.33 | ) | | | (.34 | ) | | | (.37 | ) | | | (.39 | ) |
| Capital Contributions(e): | | | - | | | | - | | | | - | | | | - | | | | - | (d) |
| Net asset value, end of year | | | $5.37 | | | | $5.80 | | | | $5.60 | | | | $5.59 | | | | $5.34 | |
| Total Return(b): | | | (2.06)% | | | | 9.57% | | | | 6.33% | | | | 12.00% | | | | 7.82% | |
| |
| Ratios/Supplemental Data: | | | | | | | | | | | | | | | |
| Net assets, end of year (000) | | | $215,462 | | | | $259,756 | | | | $213,714 | | | | $163,309 | | | | $115,162 | |
| Average net assets (000) | | | $235,221 | | | | $239,412 | | | | $194,916 | | | | $131,650 | | | | $108,578 | |
| Ratios to average net assets(c): | | | | | | | | | | | | | | | | | | | | |
| Expenses after waivers and/or expense reimbursement | | | 1.33% | | | | 1.32% | | | | 1.33% | | | | 1.37% | | | | 1.38% | |
| Expenses before waivers and/or expense reimbursement | | | 1.33% | | | | 1.32% | | | | 1.33% | | | | 1.37% | | | | 1.38% | |
| Net investment income | | | 5.38% | | | | 5.27% | | | | 5.53% | | | | 6.25% | | | | 6.70% | |
| Portfolio turnover rate | | | 48% | | | | 51% | | | | 55% | | | | 48% | | | | 87% | |
(a) Calculated based on average shares outstanding during the year.
(b) Total return does not consider the effects of sales loads. Total return is calculated assuming a purchase of a share on the first day and a sale on the last day of each year reported and includes reinvestment of dividends and distributions. Total returns may reflect adjustments to conform to generally accepted accounting principles.
(c) Does not include expenses of the underlying portfolios in which the Fund invests.
(d) Less than $.005 per share.
(e) The Fund received payments related to an unaffiliated-third party’s settlement of regulatory proceedings involving allegations of improper trading in Fund shares during the fiscal year ended August 31, 2011. The Fund was not involved in the proceedings or in the calculation of the amount of settlement.
See Notes to Financial Statements.
| | | | |
| Prudential High Yield Fund | | | 71 | |
Financial Highlights
continued
| | | | | | | | | | | | | | | | | | | | |
| Class C Shares | |
| | | Year Ended August 31, | |
| | | 2015(a) | | | 2014(a) | | | 2013(a) | | | 2012(a) | | | 2011(a) | |
| Per Share Operating Performance: | | | | | | | | | | | | | | | | | | | | |
| Net Asset Value, Beginning of Year | | | $5.80 | | | | $5.59 | | | | $5.58 | | | | $5.33 | | | | $5.31 | |
| Income (loss) from investment operations: | | | | | | | | | | | | | | | | | | | | |
| Net investment income | | | .29 | | | | .29 | | | | .30 | | | | .32 | | | | .36 | |
| Net realized and unrealized gain (loss) on investment transactions | | | (.42 | ) | | | .23 | | | | .04 | | | | .28 | | | | .04 | |
| Total from investment operations | | | (.13 | ) | | | .52 | | | | .34 | | | | .60 | | | | .40 | |
| Less Dividends: | | | | | | | | | | | | | | | | | | | | |
| Dividends from net investment income | | | (.30 | ) | | | (.31 | ) | | | (.33 | ) | | | (.35 | ) | | | (.38 | ) |
| Capital Contributions(f): | | | - | | | | - | | | | - | | | | - | | | | - | (e) |
| Net asset value, end of year | | | $5.37 | | | | $5.80 | | | | $5.59 | | | | $5.58 | | | | $5.33 | |
| Total Return(b): | | | (2.31)% | | | | 9.49% | | | | 6.07% | | | | 11.74% | | | | 7.45% | |
| |
| Ratios/Supplemental Data: | |
| Net assets, end of year (000) | | | $236,533 | | | | $270,142 | | | | $247,992 | | | | $229,715 | | | | $136,177 | |
| Average net assets (000) | | | $254,515 | | | | $258,825 | | | | $260,306 | | | | $172,185 | | | | $132,854 | |
| Ratios to average net assets(c): | | | | | | | | | | | | | | | | | | | | |
| Expenses after waivers and/or expense reimbursement(d) | | | 1.58% | | | | 1.57% | | | | 1.58% | | | | 1.62% | | | | 1.55% | |
| Expenses before waivers and/or expense reimbursement | | | 1.58% | | | | 1.57% | | | | 1.58% | | | | 1.62% | | | | 1.63% | |
| Net investment income | | | 5.13% | | | | 5.03% | | | | 5.29% | | | | 5.98% | | | | 6.52% | |
| Portfolio turnover rate | | | 48% | | | | 51% | | | | 55% | | | | 48% | | | | 87% | |
(a) Calculated based on average shares outstanding during the year.
(b) Total return does not consider the effects of sales loads. Total return is calculated assuming a purchase of a share on the first day and a sale on the last day of each year reported and includes reinvestment of dividends and distributions. Total returns may reflect adjustments to conform to generally accepted accounting principles.
(c) Does not include expenses of the underlying portfolios in which the Fund invests.
(d) The distributor of the Fund contractually agreed to limit its distribution and service (12b-1) fees to .75% of the average daily net assets of the Class C shares through December 31, 2010.
(e) Less than $.005 per share.
(f) The Fund received payments related to an unaffiliated-third party’s settlement of regulatory proceedings involving allegations of improper trading in Fund shares during the fiscal year ended August 31, 2011. The Fund was not involved in the proceedings or in the calculation of the amount of settlement.
See Notes to Financial Statements.
| | | | | | | | | | | | | | | | | | |
| Class Q Shares | |
| | | Year Ended August 31, | | | | | October 31, 2011(a) through August 31, | |
| | | 2015(b) | | | 2014(b) | | | 2013(b) | | | | 2012(b) | |
| Per Share Operating Performance: | | | | | | | | | | | | | | | | | | |
| Net Asset Value, Beginning of Period | | | $5.81 | | | | $5.61 | | | | $5.61 | | | | | | $5.41 | |
| Income from investment operations: | | | | | | | | | | | | | | | | | | |
| Net investment income | | | .35 | | | | .35 | | | | .37 | | | | | | .35 | |
| Net realized and unrealized gain (loss) on investment transactions | | | (.41 | ) | | | .23 | | | | .02 | | | | | | .19 | |
| Total from investment operations | | | (.06 | ) | | | .58 | | | | .39 | | | | | | .54 | |
| Less Dividends: | | | | | | | | | | | | | | | | | | |
| Dividends from net investment income | | | (.36 | ) | | | (.38 | ) | | | (.39 | ) | | | | | (.34 | ) |
| Net asset value, end of period | | | $5.39 | | | | $5.81 | | | | $5.61 | | | | | | $5.61 | |
| Total Return(c): | | | (1.01)% | | | | 10.50% | | | | 7.04% | | | | | | 10.41% | |
| |
| Ratios/Supplemental Data: | | | | | | | | | | | | | | |
| Net assets, end of period (000) | | | $58,416 | | | | $14,336 | | | | $7,901 | | | | | | $63,914 | |
| Average net assets (000) | | | $44,388 | | | | $10,563 | | | | $52,463 | | | | | | $48,841 | |
| Ratios to average net assets(d): | | | | | | | | | | | | | | | | | | |
| Expenses after waivers and/or expense reimbursement | | | .46% | | | | .46% | | | | .47% | | | | | | .50% | (e) |
| Expenses before waivers and/or expense reimbursement | | | .46% | | | | .46% | | | | .47% | | | | | | .50% | (e) |
| Net investment income | | | 6.27% | | | | 6.12% | | | | 6.40% | | | | | | 6.97% | (e) |
| Portfolio turnover rate | | | 48% | | | | 51% | | | | 55% | | | | | | 48% | (f) |
(a) Commencement of offering.
(b) Calculated based on average shares outstanding during the period.
(c) Total return is calculated assuming a purchase of a share on the first day and a sale on the last day of each period reported and includes reinvestment of dividends and distributions. Total returns may reflect adjustments to conform to generally accepted accounting principles. Total returns for periods less than one full year are not annualized.
(d) Does not include expenses of the underlying portfolios in which the Fund invests.
(e) Annualized.
(f) Not annualized.
See Notes to Financial Statements.
| | | | |
| Prudential High Yield Fund | | | 73 | |
Financial Highlights
continued
| | | | | | | | | | | | | | | | | | | | |
| Class R Shares | | | | | | | | | | | | |
| | | Year Ended August 31, | |
| | | 2015(a) | | | 2014(a) | | | 2013(a) | | | 2012(a) | | | 2011(a) | |
| Per Share Operating Performance: | | | | | | | | | | | | | | | | | | | | |
| Net Asset Value, Beginning Of Year | | | $5.80 | | | | $5.60 | | | | $5.59 | | | | $5.34 | | | | $5.32 | |
| Income (loss) from investment operations: | | | | | | | | | | | | | | | | | | | | |
| Net investment income | | | .31 | | | | .32 | | | | .33 | | | | .35 | | | | .38 | |
| Net realized and unrealized gain (loss) on investment transactions | | | (.40 | ) | | | .22 | | | | .04 | | | | .28 | | | | .04 | |
| Total from investment operations | | | (.09 | ) | | | .54 | | | | .37 | | | | .63 | | | | .42 | |
| Less Dividends: | | | | | | | | | | | | | | | | | | | | |
| Dividends from net investment income | | | (.33 | ) | | | (.34 | ) | | | (.36 | ) | | | (.38 | ) | | | (.40 | ) |
| Capital Contributions(e): | | | - | | | | - | | | | - | | | | - | | | | - | (d) |
| Net asset value, end of year | | | $5.38 | | | | $5.80 | | | | $5.60 | | | | $5.59 | | | | $5.34 | |
| Total Return(b): | | | (1.63)% | | | | 9.84% | | | | 6.59% | | | | 12.26% | | | | 7.88% | |
| |
| Ratios/Supplemental Data: | | | | | | | | | | | | | | | |
| Net assets, end of year (000) | | | $51,716 | | | | $57,502 | | | | $50,732 | | | | $36,886 | | | | $20,630 | |
| Average net assets (000) | | | $54,089 | | | | $55,379 | | | | $47,639 | | | | $27,717 | | | | $16,155 | |
| Ratios to average net assets(c): | | | | | | | | | | | | | | | | | | | | |
| Expenses after waivers and/or expense reimbursement | | | 1.08% | | | | 1.07% | | | | 1.08% | | | | 1.12% | | | | 1.13% | |
| Expenses before waivers and/or expense reimbursement | | | 1.33% | | | | 1.32% | | | | 1.33% | | | | 1.37% | | | | 1.38% | |
| Net investment income | | | 5.63% | | | | 5.53% | | | | 5.78% | | | | 6.47% | | | | 6.93% | |
| Portfolio turnover rate | | | 48% | | | | 51% | | | | 55% | | | | 48% | | | | 87% | |
(a) Calculated based on average shares outstanding during the year.
(b) Total return is calculated assuming a purchase of a share on the first day and a sale on the last day of each year reported and includes reinvestment of dividends and distributions. Total returns may reflect adjustments to conform to generally accepted accounting principles.
(c) Does not include expenses of the underlying portfolios in which the Fund invests.
(d) Less than $.005 per share.
(e) The Fund received payments related to an unaffiliated-third party’s settlement of regulatory proceedings involving allegations of improper trading in Fund shares during the fiscal year ended August 31, 2011. The Fund was not involved in the proceedings or in the calculation of the amount of settlement.
See Notes to Financial Statements.
| | | | | | | | | | | | | | | | | | | | | | | | | | |
| Class X Shares | |
| | | Period
Ended
April 11, | | | | | Year Ended August 31, | |
| | | 2014(a)(h) | | | | | 2013(a) | | | 2012(a) | | | 2011(a) | | | 2010(a) | | | 2009 | |
| Per Share Operating Performance: | | | | | | | | | | | | | | | | | | | | | | | | | | |
| Net Asset Value, Beginning of Period | | | $5.60 | | | | | | $5.59 | | | | $5.34 | | | | $5.31 | | | | $4.83 | | | | $5.19 | |
| Income (loss) from investment operations: | | | | | | | | | | | | | | | | | | | | | | | | | | |
| Net investment income | | | .17 | | | | | | .30 | | | | .33 | | | | .36 | | | | .41 | | | | .38 | |
| Net realized and unrealized gain (loss) on investment transactions | | | .22 | | | | | | .04 | | | | .27 | | | | .04 | | | | .49 | | | | (.33 | ) |
| Total from investment operations | | | .39 | | | | | | .34 | | | | .60 | | | | .40 | | | | .90 | | | | .05 | |
| Less Dividends: | | | | | | | | | | | | | | | | | | | | | | | | | | |
| Dividends from net investment income | | | (.19 | ) | | | | | (.33 | ) | | | (.35 | ) | | | (.37 | ) | | | (.42 | ) | | | (.41 | ) |
| Capital Contributions(e): | | | - | | | | | | - | | | | - | | | | - | (d) | | | - | (d) | | | - | |
| Net asset value, end of period | | | $5.80 | | | | | | $5.60 | | | | $5.59 | | | | $5.34 | | | | $5.31 | | | | $4.83 | |
| Total Return(b): | | | 7.09% | | | | | | 6.06% | | | | 11.69% | | | | 7.54% | | | | 19.07% | | | | 2.32% | |
| |
| Ratios/Supplemental Data: | | | | | | | | | | | | | | | | | | | | |
| Net assets, end of period (000) | | | $2 | | | | | | $73 | | | | $249 | | | | $459 | | | | $966 | | | | $1,878 | |
| Average net assets (000) | | | $36 | | | | | | $167 | | | | $363 | | | | $766 | | | | $1,359 | | | | $2,152 | |
| Ratios to average net assets(c): | | | | | | | | | | | | | | | | | | | | | | | | | | |
| Expenses after waivers and/or expense reimbursement | | | 1.56% | (f) | | | | | 1.58% | | | | 1.62% | | | | 1.63% | | | | 1.65% | | | | 1.66% | |
| Expenses before waivers and/or expense reimbursement | | | 1.56% | (f) | | | | | 1.58% | | | | 1.62% | | | | 1.63% | | | | 1.65% | | | | 1.66% | |
| Net investment income | | | 4.90% | (f) | | | | | 5.30% | | | | 6.06% | | | | 6.48% | | | | 7.97% | | | | 9.19% | |
| Portfolio turnover rate | | | 51% | (g)(i) | | | | | 55% | | | | 48% | | | | 87% | | | | 91% | | | | 82% | |
(a) Calculated based on average shares outstanding during the period.
(b) Total return does not consider the effects of sales loads. Total return is calculated assuming a purchase of a share on the first day and a sale on the last day of each period reported and includes reinvestment of dividends and distributions. Total returns may reflect adjustments to conform to generally accepted accounting principles. Total returns for periods less than one full year are not annualized.
(c) Does not include expenses of the underlying portfolios in which the Fund invests.
(d) Less than $.005 per share.
(e) The Fund received payments related to an unaffiliated-third party’s settlement of regulatory proceedings involving allegations of improper trading in Fund shares during the fiscal years ended August 31, 2011 and 2010. The Fund was not involved in the proceedings or in the calculation of the amount of settlement.
(f) Annualized.
(g) Not annualized.
(h) As of April 11, 2014, the last conversion of Class X shares to Class A shares was completed. There are no Class X shares outstanding and Class X shares are no longer being offered for sale.
(i) Calculated as of August 31, 2014.
See Notes to Financial Statements.
| | | | |
| Prudential High Yield Fund | | | 75 | |
Financial Highlights
continued
| | | | | | | | | | | | | | | | | | | | |
| Class Z Shares | |
| | | Year Ended August 31, | |
| | | 2015(a) | | | 2014(a) | | | 2013(a) | | | 2012(a) | | | 2011(a) | |
| Per Share Operating Performance: | | | | | | | | | | | | | | | | | | | | |
| Net Asset Value, Beginning of Year | | | $5.82 | | | | $5.62 | | | | $5.61 | | | | $5.35 | | | | $5.33 | |
| Income (loss) from investment operations: | | | | | | | | | | | | | | | | | | | | |
| Net investment income | | | .34 | | | | .35 | | | | .36 | | | | .38 | | | | .42 | |
| Net realized and unrealized gain (loss) on investment transactions | | | (.41 | ) | | | .22 | | | | .04 | | | | .29 | | | | .03 | |
| Total from investment operations | | | (.07 | ) | | | .57 | | | | .40 | | | | .67 | | | | .45 | |
| Less Dividends: | | | | | | | | | | | | | | | | | | | | |
| Dividends from net investment income | | | (.36 | ) | | | (.37 | ) | | | (.39 | ) | | | (.41 | ) | | | (.43 | ) |
| Capital Contributions(e): | | | - | | | | - | | | | - | | | | - | | | | - | (d) |
| Net asset value, end of year | | | $5.39 | | | | $5.82 | | | | $5.62 | | | | $5.61 | | | | $5.35 | |
| Total Return(b): | | | (1.29)% | | | | 10.38% | | | | 7.13% | | | | 13.07% | | | | 8.47% | |
| |
| Ratios/Supplemental Data: | |
| Net assets, end of year (000) | | | $1,510,074 | | | | $1,336,453 | | | | $1,010,477 | | | | $725,367 | | | | $334,696 | |
| Average net assets (000) | | | $1,394,662 | | | | $1,254,191 | | | | $911,701 | | | | $479,766 | | | | $304,551 | |
| Ratios to average net assets(c): | | | | | | | | | | | | | | | | | | | | |
| Expenses after waivers and/or expense reimbursement | | | .58% | | | | .57% | | | | .58% | | | | .62% | | | | .63% | |
| Expenses before waivers and/or expense reimbursement | | | .58% | | | | .57% | | | | .58% | | | | .62% | | | | .63% | |
| Net investment income | | | 6.13% | | | | 6.02% | | | | 6.29% | | | | 6.97% | | | | 7.43% | |
| Portfolio turnover rate | | | 48% | | | | 51% | | | | 55% | | | | 48% | | | | 87% | |
(a) Calculated based on average shares outstanding during the year.
(b) Total return is calculated assuming a purchase of a share on the first day and a sale on the last day of each year reported and includes reinvestment of dividends and distributions. Total returns may reflect adjustments to conform to generally accepted accounting principles.
(c) Does not include expenses of the underlying portfolios in which the Fund invests.
(d) Less than $.005 per share.
(e) The Fund received payments related to an unaffiliated-third party’s settlement of regulatory proceedings involving allegations of improper trading in Fund shares during the fiscal year ended August 31, 2011. The Fund was not involved in the proceedings or in the calculation of the amount of settlement.
See Notes to Financial Statements.
Report of Independent Registered Public
Accounting Firm
The Board of Directors and Shareholders
Prudential Investment Portfolios, Inc. 15:
We have audited the accompanying statement of assets and liabilities of the Prudential High Yield Fund, a portfolio of Prudential Investment Portfolios, Inc. 15 (hereafter referred to as the “Fund”), including the portfolio of investments, as of August 31, 2015, and the related statement of operations for the year then ended, the statements of changes in net assets for each of the years in the two-year period then ended, and the financial highlights for each of the years in the five-year period then ended. These financial statements and financial highlights are the responsibility of the Fund’s management. Our responsibility is to express an opinion on these financial statements and financial highlights based on our audits.
We conducted our audits in accordance with the standards of the Public Company Accounting Oversight Board (United States). Those standards require that we plan and perform the audit to obtain reasonable assurance about whether the financial statements and financial highlights are free of material misstatement. An audit includes examining, on a test basis, evidence supporting the amounts and disclosures in the financial statements. Our procedures included confirmation of securities owned as of August 31, 2015, by correspondence with the custodian, transfer agent and brokers or by other appropriate auditing procedures when replies from brokers were not received. An audit also includes assessing the accounting principles used and significant estimates made by management, as well as evaluating the overall financial statement presentation. We believe that our audits provide a reasonable basis for our opinion.
In our opinion, the financial statements and financial highlights referred to above present fairly, in all material respects, the financial position of the Fund as of August 31, 2015, and the results of its operations for the year then ended, the changes in its net assets for each of the years in the two-year period then ended, and the financial highlights for each of the years in the five-year period then ended, in conformity with U.S. generally accepted accounting principles.
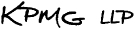
New York, New York
October 30, 2015
| | | | |
| Prudential High Yield Fund | | | 77 | |
Federal Income Tax Information
(Unaudited)
For the year ended August 31, 2015, the Fund reports the maximum amount allowable but not less than 85.01% as interest related dividends in accordance with Section 871(k)(1) and 881(e)(1) of the Internal Revenue Code.
Interest-related dividends do not include any distribution paid by a fund with respect to Fund tax years beginning after August 31, 2015. Consequently, this provision expires with respect to such distributions paid after the Fund’s fiscal year end.
In January 2016, you will be advised on IRS Form 1099-DIV or substitute 1099-DIV, as to the federal tax status of the dividends received by you in calendar year 2015.
INFORMATION ABOUT BOARD MEMBERS AND OFFICERS
(Unaudited)
Information about Board Members and Officers of the Fund is set forth below. Board Members who are not deemed to be “interested persons” of the Fund, as defined in the 1940 Act, are referred to as “Independent Board Members.” Board Members who are deemed to be “interested persons” of the Fund are referred to as “Interested Board Members.” The Board Members are responsible for the overall supervision of the operations of the Fund and perform the various duties imposed on the directors of investment companies by the 1940 Act. The Board in turn elects the Officers, who are responsible for administering the day-to-day operations of the Fund.
| | | | |
| Independent Board Members(1) |
Name, Address, Age Position(s) Portfolios Overseen | | Principal Occupation(s) During Past Five Years | | Other Directorships Held During Past Five Years |
Ellen S. Alberding (57) Board Member Portfolios Overseen: 66 | | President and Board Member, The Joyce Foundation (charitable foundation) (since 2002); Vice Chair, City Colleges of Chicago (community college system) (since 2011); Trustee, Skills for America’s Future (national initiative to connect employers to community colleges) (since 2011); Trustee, National Park Foundation (charitable foundation for national park system) (since 2009); Trustee, Economic Club of Chicago (since 2009). | | None. |
Kevin J. Bannon (63) Board Member Portfolios Overseen: 66 | | Managing Director (April 2008-May 2015) and Chief Investment Officer (October 2008-November 2013) of Highmount Capital LLC (registered investment adviser); formerly Executive Vice President and Chief Investment Officer (April 1993-August 2007) of Bank of New York Company; President (May 2003-May 2007) of BNY Hamilton Family of Mutual Funds. | | Director of Urstadt Biddle Properties (equity real estate investment trust) (since September 2008). |
Linda W. Bynoe (63) Board Member Portfolios Overseen: 66 | | President and Chief Executive Officer (since March 1995) and formerly Chief Operating Officer (December 1989-February 1995) of Telemat Ltd. (management consulting); formerly Vice President (January 1985-June 1989) at Morgan Stanley & Co. (broker-dealer). | | Director of Simon Property Group, Inc. (retail real estate) (May 2003-May 2012); Director of Anixter International, Inc. (communication products distributor) (since January 2006); Director of Northern Trust Corporation (financial services) (since April 2006); Trustee of Equity Residential (residential real estate) (since December 2009). |
Prudential High Yield Fund
| | | | |
| Independent Board Members(1) |
Name, Address, Age Position(s) Portfolios Overseen | | Principal Occupation(s) During Past Five Years | | Other Directorships Held During Past Five Years |
Keith F. Hartstein (59) Board Member Portfolios Overseen: 66 | | Retired; Member (since November 2014) of the Governing Council of the Independent Directors Council (organization of independent mutual fund directors); formerly President and Chief Executive Officer (2005-2012), Senior Vice President (2004-2005), Senior Vice President of Sales and Marketing (1997-2004), and various executive management positions (1990-1997), John Hancock Funds, LLC (asset management); Chairman, Investment Company Institute’s Sales Force Marketing Committee (2003-2008). | | None. |
Michael S. Hyland, CFA (70) Board Member Portfolios Overseen: 66 | | Retired (since February 2005); formerly Senior Managing Director (July 2001-February 2005) of Bear Stearns & Co, Inc.; Global Partner, INVESCO (1999-2001); Managing Director and President of Salomon Brothers Asset Management (1989-1999). | | None. |
Richard A. Redeker (72) Board Member & Independent Chair Portfolios Overseen: 66 | | Retired Mutual Fund Senior Executive (47 years); Management Consultant; Director, Mutual Fund Directors Forum (since 2014); Independent Directors Council (organization of independent mutual fund directors)-Executive Committee, Chair of Policy Steering Committee, Governing Council. | | None. |
Stephen G. Stoneburn (72) Board Member Portfolios Overseen: 66 | | Chairman (since July 2011), President and Chief Executive Officer (since June 1996) of Quadrant Media Corp. (publishing company); formerly President (June 1995-June 1996) of Argus Integrated Media, Inc.; Senior Vice President and Managing Director (January 1993-1995) of Cowles Business Media; Senior Vice President of Fairchild Publications, Inc. (1975-1989). | | None. |
Visit our website at www.prudentialfunds.com
| | | | |
| Interested Board Members(1) |
Name, Address, Age Position(s) Portfolios Overseen | | Principal Occupation(s) During Past Five Years | | Other Directorships Held During Past Five Years |
Stuart S. Parker (53) Board Member & President Portfolios Overseen: 66 | | President of Prudential Investments LLC (since January 2012); Executive Vice President of Prudential Investment Management Services LLC (since December 2012); Executive Vice President of Jennison Associates LLC and Head of Retail Distribution of Prudential Investments LLC (June 2005-December 2011). | | None. |
Scott E. Benjamin (42) Board Member & Vice President Portfolios Overseen: 66 | | Executive Vice President (since June 2009) of Prudential Investments LLC; Executive Vice President (June 2009-June 2012) and Vice President (since June 2012) of Prudential Investment Management Services LLC; Executive Vice President (since September 2009) of AST Investment Services, Inc.; Senior Vice President of Product Development and Marketing, Prudential Investments (since February 2006); Vice President of Product Development and Product Management, Prudential Investments (2003-2006). | | None. |
Grace C. Torres* (56) Board Member Portfolios Overseen: 64 | | Retired; formerly Treasurer and Principal Financial and Accounting Officer of the Prudential Investments Funds, Target Funds, Advanced Series Trust, Prudential Variable Contract Accounts and The Prudential Series Fund (1998-June 2014); Assistant Treasurer (March 1999-June 2014) and Senior Vice President (September 1999-June 2014) of Prudential Investments LLC; Assistant Treasurer (May 2003-June 2014) and Vice President (June 2005-June 2014) of AST Investment Services, Inc.; Senior Vice President and Assistant Treasurer (May 2003-June 2014) of Prudential Annuities Advisory Services, Inc. | | Director (since July 2015) of Sun Bancorp, Inc. N.A. |
| * | Note: Prior to her retirement in 2014, Ms. Torres was employed by Prudential Investments LLC. Due to her prior employment, she is considered to be an “interested person” under the 1940 Act. Ms. Torres is a non-management Interested Board Member. |
| (1) | The year that each individual joined PIP 15’s Board is as follows: |
Ellen S. Alberding, 2013; Kevin J. Bannon, 2008; Linda W. Bynoe, 2005; Keith F. Hartstein, 2013; Michael S. Hyland, 2008; Richard A. Redeker, 1995; Stephen G. Stoneburn, 2003; Grace C. Torres, 2014; Stuart S. Parker, Board Member and President since 2012; Scott E. Benjamin, Board Member since 2010 and Vice President since 2009.
Prudential High Yield Fund
| | | | |
| Fund Officers(a) |
Name, Address and Age Position with Fund | | Principal Occupation(s) During Past Five Years | | Length of Service as Fund Officer |
Raymond A. O’Hara (60) Chief Legal Officer | | Vice President and Corporate Counsel (since July 2010) of Prudential Insurance Company of America (Prudential); Vice President (March 2011-Present) of Pruco Life Insurance Company and Pruco Life Insurance Company of New Jersey; Vice President and Corporate Counsel (March 2011-Present) of Prudential Annuities Life Assurance Corporation; Chief Legal Officer of Prudential Investments LLC (since June 2012); Chief Legal Officer of Prudential Mutual Fund Services LLC (since June 2012) and Corporate Counsel of AST Investment Services, Inc. (since June 2012); formerly Assistant Vice President and Corporate Counsel (September 2008-July 2010) of The Hartford Financial Services Group, Inc.; formerly Associate (September 1980-December 1987) and Partner (January 1988–August 2008) of Blazzard & Hasenauer, P.C. (formerly, Blazzard, Grodd & Hasenauer, P.C.). | | Since 2012 |
Chad A. Earnst (40) Chief Compliance Officer | | Chief Compliance Officer (September 2014-Present) of Prudential Investments LLC; Chief Compliance Officer (September 2014-Present) of the Prudential Investments Funds, Target Funds, Advanced Series Trust, The Prudential Series Fund, Prudential’s Gibraltar Fund, Inc., Prudential Global Short Duration High Yield Income Fund, Inc., Prudential Short Duration High Yield Fund, Inc. and Prudential Jennison MLP Income Fund, Inc.; formerly Assistant Director (March 2010-August 2014) of the Asset Management Unit, Division of Enforcement, US Securities & Exchange Commission; Assistant Regional Director (January 2010-August 2014), Branch Chief (June 2006–December 2009) and Senior Counsel (April 2003-May 2006) of the Miami Regional Office, Division of Enforcement, US Securities & Exchange Commission. | | Since 2014 |
Deborah A. Docs (57) Secretary | | Vice President and Corporate Counsel (since January 2001) of Prudential; Vice President (since December 1996) and Assistant Secretary (since March 1999) of Prudential Investments LLC; formerly Vice President and Assistant Secretary (May 2003-June 2005) of AST Investment Services, Inc. | | Since 2004 |
Jonathan D. Shain (57) Assistant Secretary | | Vice President and Corporate Counsel (since August 1998) of Prudential; Vice President and Assistant Secretary (since May 2001) of Prudential Investments LLC; Vice President and Assistant Secretary (since February 2001) of Prudential Mutual Fund Services LLC; formerly Vice President and Assistant Secretary (May 2003-June 2005) of AST Investment Services, Inc. | | Since 2005 |
Visit our website at www.prudentialfunds.com
| | | | |
| Fund Officers(a) |
Name, Address and Age Position with Fund | | Principal Occupation(s) During Past Five Years | | Length of Service as Fund Officer |
Claudia DiGiacomo (41) Assistant Secretary | | Vice President and Corporate Counsel (since January 2005) of Prudential; Vice President and Assistant Secretary of Prudential Investments LLC (since December 2005); Associate at Sidley Austin Brown & Wood LLP (1999-2004). | | Since 2005 |
Andrew R. French (52) Assistant Secretary | | Vice President and Corporate Counsel (since February 2010) of Prudential; formerly Director and Corporate Counsel (2006-2010) of Prudential; Vice President and Assistant Secretary (since January 2007) of Prudential Investments LLC; Vice President and Assistant Secretary (since January 2007) of Prudential Mutual Fund Services LLC. | | Since 2006 |
Amanda S. Ryan (37) Assistant Secretary | | Director and Corporate Counsel (since March 2012) of Prudential; Director and Assistant Secretary (since June 2012) of Prudential Investments LLC; Associate at Ropes & Gray LLP (2008-2012). | | Since 2012 |
Theresa C. Thompson (53) Deputy Chief Compliance Officer | | Vice President, Compliance, Prudential Investments LLC (since April 2004); and Director, Compliance, Prudential Investments LLC (2001-2004). | | Since 2008 |
Richard W. Kinville (47) Anti-Money Laundering Compliance Officer | | Vice President, Corporate Compliance, Anti-Money Laundering Unit (since January 2005) of Prudential; committee member of the American Council of Life Insurers Anti-Money Laundering and Critical Infrastructure Committee (since January 2007); formerly Investigator and Supervisor in the Special Investigations Unit for the New York Central Mutual Fire Insurance Company (August 1994-January 1999); Investigator in AXA Financial’s Internal Audit Department and Manager in AXA’s Anti-Money Laundering Office (January 1999-January 2005); first chair of the American Council of Life Insurers Anti-Money Laundering and Critical Infrastructure Committee (June 2007-December 2009). | | Since 2011 |
M. Sadiq Peshimam (51) Treasurer and Principal Financial and Accounting Officer | | Vice President (since 2005) of Prudential Investments LLC; formerly Assistant Treasurer of funds in the Prudential Mutual Fund Complex (2006-2014). | | Since 2006 |
Peter Parrella (57) Assistant Treasurer | | Vice President (since 2007) and Director (2004-2007) within Prudential Mutual Fund Administration; formerly Tax Manager at SSB Citi Fund Management LLC (1997-2004). | | Since 2007 |
Lana Lomuti (48) Assistant Treasurer | | Vice President (since 2007) and Director (2005-2007), within Prudential Mutual Fund Administration; formerly Assistant Treasurer (December 2007-February 2014) of The Greater China Fund, Inc. | | Since 2014 |
Linda McMullin (54) Assistant Treasurer | | Vice President (since 2011) and Director (2008-2011) within Prudential Mutual Fund Administration. | | Since 2014 |
Kelly A. Coyne (47) Assistant Treasurer | | Director, Investment Operations of Prudential Mutual Fund Services LLC (since 2010). | | Since 2015 |
Prudential High Yield Fund
| (a) | Excludes Mr. Parker and Mr. Benjamin, interested Board Members who also serve as President and Vice President, respectively. |
Explanatory Notes to Tables:
| • | | Board Members are deemed to be “Interested,” as defined in the 1940 Act, by reason of their affiliation with Prudential Investments LLC and/or an affiliate of Prudential Investments LLC. |
| • | | Unless otherwise noted, the address of all Board Members and Officers is c/o Prudential Investments LLC, 655 Broad Street, Newark, New Jersey 07102-4410. |
| • | | There is no set term of office for Board Members or Officers. The Board Members have adopted a retirement policy, which calls for the retirement of Board Members on December 31 of the year in which they reach the age of 75. |
| • | | “Other Directorships Held” includes only directorships of companies required to register or file reports with the SEC under the 1934 Act (that is, “public companies”) or other investment companies registered under the 1940 Act. |
| • | | “Portfolios Overseen” includes all investment companies managed by Prudential Investments LLC. The investment companies for which Prudential Investments LLC serves as manager include the Prudential Investments Mutual Funds, The Prudential Variable Contract Accounts, Target Mutual Funds, Prudential Short Duration High Yield Fund, Inc., Prudential Global Short Duration High Yield Fund, Inc., The Prudential Series Fund, Prudential’s Gibraltar Fund, Inc. and the Advanced Series Trust. |
Visit our website at www.prudentialfunds.com
Approval of Advisory Agreements
The Fund’s Board of Directors
The Board of Directors (the “Board”) of Prudential High Yield Fund1 (the “Fund”) consists of ten individuals, seven of whom are not “interested persons” of the Fund, as defined in the Investment Company Act of 1940, as amended (the “1940 Act”) (the “Independent Directors”). The Board is responsible for the oversight of the Fund and its operations, and performs the various duties imposed on the directors of investment companies by the 1940 Act. The Independent Directors have retained independent legal counsel to assist them in connection with their duties. The Chair of the Board is an Independent Director. The Board has established three standing committees: the Audit Committee, the Nominating and Governance Committee, and the Investment Committee. Each committee is chaired by, and composed of, Independent Directors.
Annual Approval of the Fund’s Advisory Agreements
As required under the 1940 Act, the Board determines annually whether to renew the Fund’s management agreement with Prudential Investments LLC (“PI”) and the Fund’s subadvisory agreement with Prudential Investment Management, Inc. (“PIM”). In considering the renewal of the agreements, the Board, including all of the Independent Directors, met on June 9-11, 2015 and approved the renewal of the agreements through July 31, 2016, after concluding that the renewal of the agreements was in the best interests of the Fund and its shareholders.
In advance of the meetings, the Board requested and received materials relating to the agreements, and had the opportunity to ask questions and request further information in connection with its consideration. Among other things, the Board considered comparative fee information from PI and PIM. Also, the Board considered comparisons with other mutual funds in relevant Peer Universes and Peer Groups, as is further discussed below.
In approving the agreements, the Board, including the Independent Directors advised by independent legal counsel, considered the factors it deemed relevant, including the nature, quality and extent of services provided by PI and the subadviser, the performance of the Fund, the profitability of PI and its affiliates, expenses and fees, and the potential for economies of scale that may be shared with the Fund and its shareholders as the Fund’s assets grow. In their deliberations, the Directors did not identify any single factor which alone was responsible for the Board’s decision to approve the agreements with respect to the Fund. In connection with its deliberations, the Board considered information provided by PI throughout the year at regular Board
| 1 | Prudential High Yield Fund is a series of Prudential Investment Portfolios, Inc. 15. |
Prudential High Yield Fund
Approval of Advisory Agreements (continued)
meetings, presentations from portfolio managers and other information, as well as information furnished at or in advance of the meetings on June 9-11, 2015.
The Directors determined that the overall arrangements between the Fund and PI, which serves as the Fund’s investment manager pursuant to a management agreement, and between PI and PIM, which serves as the Fund’s subadviser pursuant to the terms of a subadvisory agreement with PI, are in the best interests of the Fund and its shareholders in light of the services performed, fees charged and such other matters as the Directors considered relevant in the exercise of their business judgment.
The material factors and conclusions that formed the basis for the Directors’ reaching their determinations to approve the continuance of the agreements are separately discussed below.
Nature, Quality and Extent of Services
The Board received and considered information regarding the nature, quality and extent of services provided to the Fund by PI and PIM. The Board considered the services provided by PI, including but not limited to the oversight of the subadvisers for the Fund, as well as the provision of fund recordkeeping, compliance, and other services to the Fund. With respect to PI’s oversight of the subadviser, the Board noted that PI’s Strategic Investment Research Group (“SIRG”), which is a business unit of PI, is responsible for monitoring and reporting to PI’s senior management on the performance and operations of the subadviser. The Board also considered that PI pays the salaries of all of the officers and interested Directors of the Fund who are part of Fund management. The Board also considered the investment subadvisory services provided by PIM, as well as adherence to the Fund’s investment restrictions and compliance with applicable Fund policies and procedures.
The Board considered the qualifications, backgrounds and responsibilities of PI’s senior management responsible for the oversight of the Fund and PIM, and also considered the qualifications, backgrounds and responsibilities of PIM’s portfolio managers who are responsible for the day-to-day management of the Fund’s portfolio. The Board was provided with information pertaining to PI’s and PIM’s organizational structure, senior management, investment operations, and other relevant information pertaining to both PI and PIM. The Board also noted that it received favorable compliance reports from the Fund’s Chief Compliance Officer (“CCO”) as to both PI and PIM. The Board noted that PIM is affiliated with PI. The Board considered PI’s evaluation of the subadviser, as well as PI’s recommendation, based on its review of the subadviser, to renew the subadvisory agreement.
Visit our website at www.prudentialfunds.com
The Board concluded that it was satisfied with the nature, extent and quality of the investment management services provided by PI and the subadvisory services provided to the Fund by PIM, and that there was a reasonable basis on which to conclude that the Fund benefits from the services provided by PI and PIM under the management and subadvisory agreements.
Costs of Services and Profits Realized by PI
The Board was provided with information on the profitability of PI and its affiliates in serving as the Fund’s investment manager. The Board discussed with PI the methodology utilized in assembling the information regarding profitability and considered its reasonableness. The Board recognized that it is difficult to make comparisons of profitability from fund management contracts because comparative information is not generally publicly available and is affected by numerous factors, including the structure of the particular adviser, the types of funds it manages, its business mix, numerous assumptions regarding allocations and the adviser’s capital structure and cost of capital. The Board further noted that the subadviser is affiliated with PI and that its profitability is reflected in PI’s profitability report. Taking these factors into account, the Board concluded that the profitability of PI and its affiliates in relation to the services rendered was not unreasonable.
Economies of Scale
PI and the Board previously retained an outside business consulting firm to review management fee breakpoint usage and trends in management fees across the mutual fund industry. The consulting firm presented its analysis and conclusions as to the Funds’ management fee structures to the Board and PI. The Board and PI have discussed these conclusions extensively since that presentation.
The Board received and discussed information concerning economies of scale that PI may realize as the Fund’s assets grow beyond current levels. The Board noted that the management fee schedule for the Fund includes breakpoints, which have the effect of decreasing the fee rate as assets increase, and that at its current level of assets the Fund’s effective fee rate reflected those rate reductions. The Board took note that the Fund’s fee structure currently results in benefits to Fund shareholders whether or not PI realizes any economies of scale. The Board noted that economies of scale can be shared with the Fund in other ways, including low management fees from inception, additional technological and personnel investments to enhance shareholder services, and maintaining existing expense structures in the face of a rising cost environment. The Board also considered PI’s assertion that it continually evaluates the management fee schedule of the Fund and the potential to share economies of scale through breakpoints or fee waivers as asset levels increase.
Prudential High Yield Fund
Approval of Advisory Agreements (continued)
The Board recognized the inherent limitations of any analysis of economies of scale, stemming largely from the Board’s understanding that most of PI’s costs are not specific to individual funds, but rather are incurred across a variety of products and services.
Other Benefits to PI and PIM
The Board considered potential ancillary benefits that might be received by PI and PIM and their affiliates as a result of their relationship with the Fund. The Board concluded that potential benefits to be derived by PI included fees received by affiliates of PI for serving as the Fund’s securities lending agent, transfer agency fees received by the Fund’s transfer agent (which is affiliated with PI), as well as benefits to its reputation or other intangible benefits resulting from PI’s association with the Fund. The Board concluded that the potential benefits to be derived by PIM included the ability to use soft dollar credits, as well as the potential benefits consistent with those generally resulting from an increase in assets under management, specifically, potential access to additional research resources and benefits to its reputation. The Board concluded that the benefits derived by PI and PIM were consistent with the types of benefits generally derived by investment managers and subadvisers to mutual funds.
Performance of the Fund / Fees and Expenses
The Board considered certain additional specific factors and made related conclusions relating to the historical performance of the Fund for the one-, three-, five- and ten-year periods ended December 31, 2014.
The Board also considered the Fund’s actual management fee, as well as the Fund’s net total expense ratio, for the fiscal year ended August 31, 2014. The Board considered the management fee for the Fund as compared to the management fee charged by PI to other funds and the fee charged by other advisers to comparable mutual funds in a Peer Group. The actual management fee represents the fee rate actually paid by Fund shareholders and includes any fee waivers or reimbursements. The net total expense ratio for the Fund represents the actual expense ratio incurred by Fund shareholders.
The mutual funds included in the Peer Universe (the Lipper High Yield Funds Performance Universe) and the Peer Group were objectively determined by Lipper Inc. (“Lipper”), an independent provider of mutual fund data. The comparisons placed the Fund in various quartiles, with the first quartile being the best 25% of the mutual funds (for performance, the best performing mutual funds and, for expenses, the lowest cost mutual funds).
Visit our website at www.prudentialfunds.com
The section below summarizes key factors considered by the Board and the Board’s conclusions regarding the Fund’s performance, fees and overall expenses. The table sets forth gross performance comparisons (which do not reflect the impact on performance of fund expenses, or any subsidies, expense caps or waivers that may be applicable) with the Peer Universe, actual management fees with the Peer Group (which reflect the impact of any subsidies or fee waivers), and net total expenses with the Peer Group, each of which were key factors considered by the Board.
| | | | | | | | |
| Performance | | 1 Year | | 3 Years | | 5 Years | | 10 Years |
| | | 2nd Quartile | | 3rd Quartile | | 2nd Quartile | | 2nd Quartile |
| Actual Management Fees: 1st Quartile |
| Net Total Expenses: 1st Quartile |
| | • | | The Board noted that the Fund outperformed its benchmark index over all periods. |
| | • | | The Board concluded that, in light of the above, it would be in the best interests of the Fund and its shareholders to renew the agreements. |
| | • | | The Board concluded that the management fees (including subadvisory fees) and total expenses were reasonable in light of the services provided. |
* * *
After full consideration of these factors, the Board concluded that approval of the agreements was in the best interests of the Fund and its shareholders.
Prudential High Yield Fund
| | | | |
| n MAIL | | n TELEPHONE | | n WEBSITE |
655 Broad Street Newark, NJ 07102 | | (800) 225-1852 | | www.prudentialfunds.com |
|
| PROXY VOTING |
| The Board of Directors of the Fund has delegated to the Fund’s investment subadviser the responsibility for voting any proxies and maintaining proxy recordkeeping with respect to the Fund. A description of these proxy voting policies and procedures is available without charge, upon request, by calling (800) 225-1852. Information regarding how the Fund voted proxies relating to portfolio securities during the most recent 12-month period ended June 30 is available on the Fund’s website and on the Securities and Exchange Commission’s website. |
|
| DIRECTORS |
Ellen S. Alberding • Kevin J. Bannon • Scott E. Benjamin • Linda W. Bynoe •
Keith F. Hartstein • Michael S. Hyland • Stuart S. Parker • Richard A. Redeker • Stephen G. Stoneburn • Grace C. Torres |
|
| OFFICERS |
| Stuart S. Parker, President • Scott E. Benjamin, Vice President • M. Sadiq Peshimam, Treasurer and Principal Financial and Accounting Officer • Raymond A. O’Hara, Chief Legal Officer • Deborah A. Docs, Secretary • Chad A. Earnst, Chief Compliance Officer • Theresa C. Thompson, Deputy Chief Compliance Officer • Richard W. Kinville, Anti-Money Laundering Compliance Officer • Jonathan D. Shain, Assistant Secretary • Claudia DiGiacomo, Assistant Secretary • Amanda S. Ryan, Assistant Secretary • Andrew R. French, Assistant Secretary • Peter Parrella, Assistant Treasurer • Lana Lomuti, Assistant Treasurer • Linda McMullin, Assistant Treasurer • Kelly A. Coyne, Assistant Treasurer |
| | | | |
| MANAGER | | Prudential Investments LLC | | 655 Broad Street
Newark, NJ 07102 |
|
| INVESTMENT SUBADVISER | | Prudential Investment
Management, Inc. | | 655 Broad Street
Newark, NJ 07102 |
|
| DISTRIBUTOR | | Prudential Investment
Management Services LLC | | 655 Broad Street
Newark, NJ 07102 |
|
| CUSTODIAN | | The Bank of New York Mellon | | One Wall Street
New York, NY 10286 |
|
| TRANSFER AGENT | | Prudential Mutual Fund
Services LLC | | PO Box 9658
Providence, RI 02940 |
|
| INDEPENDENT REGISTERED PUBLIC ACCOUNTING FIRM | | KPMG LLP | | 345 Park Avenue
New York, NY 10154 |
|
| FUND COUNSEL | | Willkie Farr & Gallagher LLP | | 787 Seventh Avenue
New York, NY 10019 |
|
| An investor should consider the investment objectives, risks, charges, and expenses of the Fund carefully before investing. The prospectus and summary prospectus contain this and other information about the Fund. An investor may obtain a prospectus and summary prospectus by visiting our website at www.prudentialfunds.com or by calling (800) 225-1852. The prospectus and summary prospectus should be read carefully before investing. |
|
| E-DELIVERY |
To receive your mutual fund documents online, go to www.prudentialfunds.com/edelivery
and enroll. Instead of receiving printed documents by mail, you will receive notification via email when new materials are available. You can cancel your enrollment or change your email
address at any time by visiting the website address above. |
|
| SHAREHOLDER COMMUNICATIONS WITH DIRECTORS |
| Shareholders can communicate directly with the Board of Directors by writing to the Chair of the Board, Prudential High Yield Fund, Prudential Investments, Attn: Board of Directors, 655 Broad Street, Newark, NJ 07102. Shareholders can communicate directly with an individual Director by writing to the same address. Communications are not screened before being delivered to the addressee. |
|
| AVAILABILITY OF PORTFOLIO SCHEDULE |
| The Fund files its complete schedule of portfolio holdings with the Securities and Exchange Commission for the first and third quarters of each fiscal year on Form N-Q. The Fund’s Forms N-Q are available on the Commission’s website at www.sec.gov. The Fund’s Forms N-Q may also be reviewed and copied at the Commission’s Public Reference Room in Washington, D.C. Information on the operation and location of the Public Reference Room may be obtained by calling 1-800-SEC-0330. The Fund’s schedule of portfolio holdings is also available on the Fund’s website as of the end of each month. |
|
| The Fund’s Statement of Additional Information contains additional information about the Fund’s Directors and is available without charge, upon request, by calling (800) 225-1852. |
Mutual Funds:
| | | | |
| ARE NOT INSURED BY THE FDIC OR ANY FEDERAL GOVERNMENT AGENCY | | MAY LOSE VALUE | | ARE NOT A DEPOSIT OF OR GUARANTEED BY ANY BANK OR ANY BANK AFFILIATE |

PRUDENTIAL HIGH YIELD FUND
| | | | | | | | | | | | |
| SHARE CLASS | | A | | B | | C | | Q | | R | | Z |
| NASDAQ | | PBHAX | | PBHYX | | PRHCX | | PHYQX | | JDYRX | | PHYZX |
| CUSIP | | 74440Y108 | | 74440Y207 | | 74440Y306 | | 74440Y884 | | 74440Y603 | | 74440Y801 |
MF110E 0283765-00001-00

PRUDENTIAL INVESTMENTS»MUTUAL FUNDS
PRUDENTIAL SHORT DURATION HIGH YIELD INCOME FUND
ANNUAL REPORT · AUGUST 31, 2015
Objective
To provide a high level of current income
This report is not authorized for distribution to prospective investors unless preceded or accompanied by a current prospectus.
The views expressed in this report and information about the Fund’s portfolio holdings are for the period covered by this report and are subject to change thereafter.
Mutual funds are distributed by Prudential Investment Management Services LLC (PIMS), a Prudential Financial company and member SIPC. Prudential Fixed Income is a unit of Prudential Investment Management, Inc. (PIM), a registered investment adviser. PIMS and PIM are Prudential Financial companies. ©2015 Prudential Financial, Inc. and its related entities. Prudential Investments LLC, Prudential, the Prudential logo, Bring Your Challenges, and the Rock symbol are service marks of Prudential Financial, Inc. and its related entities, registered in many jurisdictions worldwide.

October 15, 2015
Dear Shareholder:
We hope you find the annual report for the Prudential Short Duration High Yield Income Fund informative and useful. The report covers performance for the 12-month period that ended August 31, 2015.
Since market conditions change over time, we believe it is important to maintain a diversified portfolio of funds consistent with your tolerance for risk, time horizon, and financial goals.
Your financial advisor can help you create a diversified investment plan that may include funds covering all the basic asset classes and that reflects your personal investor profile and risk tolerance. Keep in mind, however, that diversification and asset allocation strategies do not assure a profit or protect against loss in declining markets.
Prudential Investments® is dedicated to helping you solve your toughest investment challenges—whether it’s capital growth, reliable income, or protection from market volatility and other risks. We offer the expertise of Prudential Financial’s affiliated asset managers that strive to be leaders in a broad range of funds to help you stay on course to the future you envision. They also manage money for major corporations and pension funds around the world, which means you benefit from the same expertise, innovation, and attention to risk demanded by today’s most sophisticated investors.
Thank you for choosing the Prudential Investments family of funds.
Sincerely,

Stuart S. Parker, President
Prudential Short Duration High Yield Income Fund
| | | | |
| Prudential Short Duration High Yield Income Fund | | | 1 | |
Your Fund’s Performance (Unaudited)
Performance data quoted represent past performance. Past performance does not guarantee future results. The investment return and principal value of an investment will fluctuate, so that an investor’s shares, when redeemed, may be worth more or less than their original cost. Current performance may be lower or higher than the past performance data quoted. An investor may obtain performance data as of the most recent month-end by visiting our website at www.prudentialfunds.com or by calling (800) 225-1852.
| | | | | | | | |
Cumulative Total Returns (Without Sales Charges) as of 8/31/15 | |
| | | One Year | | | Since Inception | |
Class A | | | 0.72 | % | | | 8.98% (10/26/12) | |
Class C | | | –0.13 | | | | 6.55 (10/26/12) | |
Class Q | | | N/A | | | | 1.54 (10/27/14) | |
Class Z | | | 0.98 | | | | 9.79 (10/26/12) | |
Barclays US High Yield Ba/B Rated 1–5 Yr
1% Capped Index | | | –1.37 | | | | — | |
Lipper High Yield Funds Average | | | –3.38 | | | | — | |
| | | | | | | | |
Average Annual Total Returns (With Sales Charges) as of 9/30/15 | |
| | | One Year | | | Since Inception | |
Class A | | | –2.20 | % | | | 1.51% (10/26/12) | |
Class C | | | –0.72 | | | | 1.85 (10/26/12) | |
Class Q | | | N/A | | | | N/A (10/27/14) | |
Class Z | | | 1.35 | | | | 2.92 (10/26/12) | |
Barclays US High Yield Ba/B Rated 1–5 Yr
1% Capped Index | | | –2.11 | | | | — | |
Lipper High Yield Funds Average | | | –3.77 | | | | — | |
| | | | | | | | |
Average Annual Total Returns (With Sales Charges) as of 8/31/15 | |
| | | One Year | | | Since Inception | |
Class A | | | –2.55 | % | | | 1.88% (10/26/12) | |
Class C | | | –1.07 | | | | 2.25 (10/26/12) | |
Class Q | | | N/A | | | | N/A (10/27/14) | |
Class Z | | | 0.98 | | | | 3.33 (10/26/12) | |
| | | | | | | | |
Average Annual Total Returns (Without Sales Charges) as of 8/31/15 | |
| | | One Year | | | Since Inception | |
Class A | | | 0.72 | % | | | 3.07% (10/26/12) | |
Class C | | | –0.13 | | | | 2.25 (10/26/12) | |
Class Q | | | N/A | | | | N/A (10/27/14) | |
Class Z | | | 0.98 | | | | 3.33 (10/26/12) | |
| | |
| 2 | | Visit our website at www.prudentialfunds.com |
Growth of a $10,000 Investment
The graph compares a $10,000 investment in the Fund’s Class A shares with a similar investment in the Barclays US High Yield Ba/B Rated 1-5 Year 1% Capped Index by portraying the initial account values at the beginning of the period for Class A shares (October 26, 2012) and the account values at the end of the current fiscal year (August 31, 2015) as measured on a quarterly basis. For purposes of the graph, and unless otherwise indicated, it has been assumed that (a) the maximum applicable front-end sales charge was deducted from the initial $10,000 investment in Class A shares; (b) all recurring fees (including management fees) were deducted; and (c) all dividends and distributions were reinvested. The line graph provides information for Class A shares only. As indicated in the tables provided earlier, performance for Class C, Class Q, and Class Z shares will vary due to the differing charges and expenses applicable to each share class (as indicated in the following paragraphs). Without waiver of fees and/or expense reimbursement, if any, the Fund’s returns would have been lower.
Past performance does not predict future performance. Total returns and the ending account values in the graphs include changes in share price and reinvestment of dividends and capital gains distributions in a hypothetical investment for the periods shown. The Fund’s total returns do not reflect the deduction of income taxes on an individual’s investment. Taxes may reduce your actual investment returns on income or gains paid by the Fund or any gains you may realize if you sell your shares.
Source: Prudential Investments LLC and Lipper Inc.
Inception returns are provided for any share class with less than 10 calendar years of returns.
| | | | |
| Prudential Short Duration High Yield Income Fund | | | 3 | |
Your Fund’s Performance (continued)
The returns in the tables do not reflect the deduction of taxes that a shareholder would pay on Fund distributions or following the redemption of Fund shares. The average annual total returns take into account applicable sales charges which are described for each share class in the table below.
| | | | | | | | |
| | Class A | | Class C | | Class Q | | Class Z |
Maximum initial sales charge | | 3.25% of the
public offering
price | | None | | None | | None |
Contingent deferred sales charge (CDSC) (as a percentage of the lower of original purchase price or net asset value at redemption) | | 1% on sales
of $1 million
or more
made within
12 months
of purchase | | 1% on sales
made within
12 months
of purchase | | None | | None |
Annual distribution and service (12b-1) fees (shown as a percentage of average daily net assets) | | .25% | | 1% | | None | | None |
Benchmark Definitions
Barclays US High Yield Ba/B Rated 1–5 Year 1% Capped Index
The Barclays US High Yield Ba/B Rated 1–5 Year 1% Capped Index (Capped Index) represents the performance of US short duration, higher-rated high yield bonds. The cumulative total returns for the Capped Index measured from the month-end closest to the inception date for Class A, C, and Z shares through 8/31/15 are 11.20% and –1.09% for Class Q shares. The average annual total return for the Capped Index measured from the month-end closest to the inception date for Class A, C, and Z shares through 9/30/15 is 3.05%. Class Q shares have been in existence for less than one year and have no average annual total return performance available.
Lipper High Yield Funds Average
The Lipper High Yield Funds Average (Lipper Average) is based on the average return of all funds in the Lipper High Yield Funds category for the periods noted. Funds in the Lipper Average aim at high (relative) current yield from fixed income securities, have no quality or maturity restrictions, and tend to invest in lower-grade debt issues. The cumulative total returns for the Lipper Average measured from the month-end closest to the inception date for Class A, C, and Z shares through 8/31/15 are 10.61% and –2.15% for Class Q shares. The average annual total return for the Lipper Average measured from the month-end closest to the inception date for Class A, C, and Z shares through 9/30/15 is 2.60%. Class Q shares have been in existence for less than one year and have no average annual total return performance available.
Investors cannot invest directly in an index or average. The returns for the Index would be lower if they included the effects of sales charges, operating expenses of a mutual fund, or taxes. Returns for the Lipper Average reflect the deduction of operating expenses, but not sales charges or taxes. The Since Inception returns for the Index and the Lipper Average are measured from the closest month-end to the inception date for the indicated share class.
| | |
| 4 | | Visit our website at www.prudentialfunds.com |
| | | | | | | | | | | | |
Distributions and Yields as of 8/31/15 | | | | | |
| | | Total Distributions
Paid for 12 Months | | | 30-Day Subsidized
SEC Yield* | | | 30-Day Unsubsidized
SEC Yield** | |
Class A | | $ | 0.59 | | | | 4.53 | % | | | 4.53 | % |
Class C | | | 0.52 | | | | 3.93 | | | | 3.93 | |
Class Q | | | 0.52 | | | | 5.00 | | | | 5.00 | |
Class Z | | | 0.61 | | | | 4.94 | | | | 4.94 | |
*SEC 30-Day Subsidized Yield (%)—A standardized yield calculation created by the Securities and Exchange Commission, it reflects the income earned during a 30-day period, after the deduction of the fund’s net expenses (net of any expense waivers or reimbursements).
**SEC 30-Day Unsubsidized Yield (%)—A standardized yield calculation created by the Securities and Exchange Commission, it reflects the income earned during a 30-day period, after the deduction of the Fund’s gross expenses.
| | | | |
Credit Quality expressed as a percentage of total investments as of 8/31/15 | |
BBB | | | 2.4 | % |
BB | | | 49.3 | |
B | | | 41.0 | |
CCC | | | 7.2 | |
Not Rated | | | 0.3 | |
Cash/Cash Equivalents | | | –0.2 | |
Total Investments | | | 100.0 | % |
Source: Prudential Investment Management, Inc. (PIM)
Credit ratings reflect the highest rating assigned by a nationally recognized statistical rating organization (NRSRO) such as Moody’s Investor Service, Inc. (Moody’s), Standard & Poor’s (S&P), or Fitch, Inc. (Fitch). Credit ratings reflect the common nomenclature used by both S&P and Fitch. Where applicable, ratings are converted to the comparable S&P/Fitch rating tier nomenclature. These rating agencies are independent and are widely used. The Not Rated category consists of securities that have not been rated by a NRSRO. Credit ratings are subject to change.
| | | | |
| Prudential Short Duration High Yield Income Fund | | | 5 | |
Strategy and Performance Overview
How did the Fund perform?
The Prudential Short Duration High Yield Income Fund’s Class A shares returned 0.72% for the 12-month reporting period ended August 31, 2015, outperforming the –1.37% return of the Barclays US High Yield Ba/B Rated 1–5 Year 1% Capped Index (the Index) and the –3.38% return of the Lipper High Yield Funds Average.
What were conditions like in the US high yield corporate bond market?
| | • | | High yield corporate bonds struggled throughout the reporting period. The broad high yield corporate bond market (as represented by the Index) faced several hurdles, including continued volatility in oil prices, investor concerns about Federal Reserve (Fed) rate hikes, weakness in the Chinese equity market, fears of a global recession, and uncertainty regarding the Greek debt situation. |
| | • | | Throughout the volatile period, the high quality short duration high yield segment of the market outperformed the broader market by approximately 1.7%. |
| | • | | With the exception of energy and metals and mining companies, the performance of high yield corporate bonds was driven by the ongoing search for yield, against a backdrop of generally strong fundamentals for high yield issuers and default rates that remained well below historical averages. |
| | • | | Overall, high yield debt securities with healthier fundamentals performed best. Higher-quality bonds rated BB returned 0.2% during the period, outperforming lower-quality bonds rated B and CCC, which declined 3.2% and 10.6% respectively. |
| | • | | Among the best performers in the Index were certain financials, including banks and Real Estate Investment Trusts (REITs), as well as consumer-oriented sectors, such as airlines, health care and pharmaceutical, and consumer non-cyclical. Commodity-related sectors, such as energy and metals and mining, were by far the worst performers, with energy declining nearly 20%. Aerospace and defense also retreated, declining 5.1% for the period. |
What strategies proved most beneficial to the Fund’s performance?
| | • | | The Fund benefited from strong sector and security selection during the reporting period. |
| | • | | An underweight relative to the Index in the energy sector, which struggled during the period, was the largest positive contributor to performance. |
| | • | | The Fund’s overweight positions in the technology, gaming, and health care sectors added to returns. |
| | • | | Solid security selection in the metals, paper and packaging, technology, industrial, and transportation and environmental services sectors contributed positively. |
| | |
| 6 | | Visit our website at www.prudentialfunds.com |
| | • | | In terms of individual issue selection, the Fund benefited from its underweights in energy names, including Linn Energy, Energy XXI, and Sandridge Energy. Its underweight positions in paper manufacturer Verso Paper Management and Spain-based environmental services holding company Abengoa SA also added to results. |
What strategies detracted most from the Fund’s performance?
| | • | | Relative to the Index, security selection in the retail, restaurants, energy, and consumer and capital goods sectors hindered the Fund’s performance. |
| | • | | An underweight in the banking sector, as well as positioning in the finance and paper & packaging sectors, detracted from Fund returns. |
| | • | | In terms of individual issue selection, the Fund was hurt by overweight positions in Afren, an oil and gas exploration company; Intercontinental Exchange, which operates exchanges and clearing houses for the financial and commodity markets; Phones 4U, a UK mobile phone provider; and NCSG Crane & Heavy Haul Corporation, which provides mobile crane rental and heavy haul services. All four securities underperformed during the period. |
Did the Fund use derivatives and how did they affect performance?
The Fund used derivatives, specifically currency forwards, to hedge the currency risk from owning non-dollar-denominated bonds. The derivatives help immunize any impact from fluctuating currency rates, which were volatile over the one-year period.
| | | | |
| Prudential Short Duration High Yield Income Fund | | | 7 | |
Fees and Expenses (Unaudited)
As a shareholder of the Fund, you incur two types of costs: (1) transaction costs, including sales charges (loads) on purchase payments and redemptions, as applicable, and (2) ongoing costs, including management fees, distribution and/or service (12b-1) fees, and other Fund expenses, as applicable. This example is intended to help you understand your ongoing costs (in dollars) of investing in the Fund and to compare these costs with the ongoing costs of investing in other mutual funds.
The example is based on an investment of $1,000 invested on March 1, 2015, at the beginning of the period, and held through the six-month period ended August 31, 2015. The example is for illustrative purposes only; you should consult the Prospectus for information on initial and subsequent minimum investment requirements.
Actual Expenses
The first line for each share class in the table on the following page provides information about actual account values and actual expenses. You may use the information on this line, together with the amount you invested, to estimate the expenses that you paid over the period. Simply divide your account value by $1,000 (for example, an $8,600 account value ÷ $1,000 = 8.6), then multiply the result by the number on the first line under the heading “Expenses Paid During the Six-Month Period” to estimate the expenses you paid on your account during this period.
Hypothetical Example for Comparison Purposes
The second line for each share class in the table on the following page provides information about hypothetical account values and hypothetical expenses based on the Fund’s actual expense ratio and an assumed rate of return of 5% per year before expenses, which is not the Fund’s actual return. The hypothetical account values and expenses may not be used to estimate the actual ending account balance or expenses you paid for the period. You may use this information to compare the ongoing costs of investing in the Fund and other funds. To do so, compare this 5% hypothetical example with the 5% hypothetical examples that appear in the shareholder reports of the other funds.
The Fund’s transfer agent may charge additional fees to holders of certain accounts that are not included in the expenses shown in the table on the following page. These fees apply to individual retirement accounts (IRAs) and Section 403(b) accounts. As of the close of the six-month period covered by the table, IRA fees included an annual maintenance fee of $15 per account (subject to a maximum annual maintenance fee of $25 for all accounts held by the same shareholder). Section 403(b) accounts are charged an annual $25 fiduciary maintenance fee. Some of the fees may vary in amount, or may be waived, based on your total account balance or the number of
| | |
| 8 | | Visit our website at www.prudentialfunds.com |
Prudential Investments funds, including the Fund, that you own. You should consider the additional fees that were charged to your Fund account over the six-month period when you estimate the total ongoing expenses paid over the period and the impact of these fees on your ending account value, as these additional expenses are not reflected in the information provided in the expense table. Additional fees have the effect of reducing investment returns.
Please note that the expenses shown in the table are meant to highlight your ongoing costs only and do not reflect any transactional costs such as sales charges (loads). Therefore, the second line for each share class in the table is useful in comparing ongoing costs only and will not help you determine the relative total costs of owning different funds. In addition, if these transactional costs were included, your costs would have been higher.
| | | | | | | | | | | | | | | | | | |
Prudential
Short Duration High
Yield Income Fund | | Beginning Account
Value
March 1, 2015 | | | Ending Account
Value
August 31, 2015 | | | Annualized
Expense Ratio
Based on the
Six-Month Period | | | Expenses Paid
During the
Six-Month Period* | |
| | | | | | | | | | | | | | | | | | |
| Class A | | Actual | | $ | 1,000.00 | | | $ | 1,003.10 | | | | 1.11 | % | | $ | 5.60 | |
| | | Hypothetical | | $ | 1,000.00 | | | $ | 1,019.61 | | | | 1.11 | % | | $ | 5.65 | |
| | | | | | | | | | | | | | | | | | |
| Class C | | Actual | | $ | 1,000.00 | | | $ | 998.30 | | | | 1.86 | % | | $ | 9.37 | |
| | | Hypothetical | | $ | 1,000.00 | | | $ | 1,015.83 | | | | 1.86 | % | | $ | 9.45 | |
| | | | | | | | | | | | | | | | | | |
| Class Q | | Actual | | $ | 1,000.00 | | | $ | 1,004.90 | | | | 0.77 | % | | $ | 3.89 | |
| | | Hypothetical | | $ | 1,000.00 | | | $ | 1,021.32 | | | | 0.77 | % | | $ | 3.92 | |
| | | | | | | | | | | | | | | | | | |
| Class Z | | Actual | | $ | 1,000.00 | | | $ | 1,004.40 | | | | 0.86 | % | | $ | 4.34 | |
| | | Hypothetical | | $ | 1,000.00 | | | $ | 1,020.87 | | | | 0.86 | % | | $ | 4.38 | |
*Fund expenses (net of fee waivers or subsidies, if any) for each share class are equal to the annualized expense ratio for each share class (provided in the table), multiplied by the average account value over the period, multiplied by the 184 days in the six-month period ended August 31, 2015, and divided by 365 days in the Fund’s fiscal year ended August 31, 2015 (to reflect the six-month period). Expenses presented in the table include the expenses of any underlying portfolios in which the Fund may invest.
| | | | |
| Prudential Short Duration High Yield Income Fund | | | 9 | |
Fees and Expenses (continued)
The Fund’s annualized expense ratios for the 12-month period ended August 31, 2015, are as follows:
| | | | | | | | |
| Class | | Gross Operating Expenses | | | Net Operating Expenses | |
A | | | 1.14 | % | | | 1.11 | % |
C | | | 1.86 | | | | 1.86 | |
Q | | | 0.77 | | | | 0.77 | |
Z | | | 0.86 | | | | 0.86 | |
Net operating expenses shown above reflect fee waivers and/or expense reimbursements. Additional information on Fund expenses and any fee waivers and/or expense reimbursements can be found in the “Financial Highlights” tables in this report and in the Notes to the Financial Statements in this report.
| | |
| 10 | | Visit our website at www.prudentialfunds.com |
Portfolio of Investments
as of August 31, 2015
| | | | | | | | | | | | | | |
| Description | | Interest
Rate | | Maturity
Date | | | Principal
Amount (000)# | | | Value (Note 1) | |
LONG-TERM INVESTMENTS 98.3% | |
|
BANK LOANS(a) 2.4% | |
|
Building Materials & Construction 0.3% | |
Materis CHRYSO SA (France) | | 4.750% | | | 08/13/21 | | | EUR | 3,000 | �� | | $ | 3,343,713 | |
|
Chemicals 0.2% | |
Axalta Coating Systems US Holdings | | 3.750 | | | 02/01/20 | | | | 2,359 | | | | 2,350,641 | |
|
Foods 0.5% | |
Agrokor DD Spv2 (Croatia), PIK | | 9.500 | | | 06/04/18 | | | EUR | 4,000 | | | | 4,488,582 | |
Jacobs Douwe Egberts (Netherlands) | | 4.250 | | | 07/02/22 | | | EUR | 1,900 | | | | 2,132,966 | |
| | | | | | | | | | | | | | |
| | | | | | | | | | | | | 6,621,548 | |
|
Metals 0.5% | |
FMG Resources (August 2006) Pty. Ltd. (Australia) | | 3.750 | | | 06/30/19 | | | | 2,976 | | | | 2,399,377 | |
Murray Energy Corp. | | 7.500 | | | 04/16/20 | | | | 6,000 | | | | 4,489,998 | |
| | | | | | | | | | | | | | |
| | | | | | | | | | | | | 6,889,375 | |
|
Technology 0.6% | |
BMC Software Finance, Inc. | | 5.000 | | | 09/10/20 | | | | 4,987 | | | | 4,570,476 | |
Kronos, Inc. | | 9.750 | | | 04/30/20 | | | | 3,541 | | | | 3,623,151 | |
| | | | | | | | | | | | | | |
| | | | | | | | | | | | | 8,193,627 | |
|
Telecommunications 0.3% | |
Communications Sales & Leasing, Inc. | | 5.000 | | | 10/24/22 | | | | 4,650 | | | | 4,456,249 | |
| | | | | | | | | | | | | | |
TOTAL BANK LOANS
(cost $35,918,728) | | | | 31,855,153 | |
| | | | | | | | | | | | | | |
| | |
CORPORATE BONDS 95.7% | | | | | | | | | |
|
Aerospace & Defense 0.7% | |
Bombardier, Inc. (Canada),
Sr. Unsec’d. Notes, 144A(b) | | 4.750 | | | 04/15/19 | | | | 6,650 | | | | 5,386,500 | |
Sr. Unsec’d. Notes, 144A(b) | | 7.500 | | | 03/15/18 | | | | 4,025 | | | | 3,763,375 | |
| | | | | | | | | | | | | | |
| | | | | | | | | | | | | 9,149,875 | |
|
Airlines 1.5% | |
Continental Airlines Pass-Through Trust, Pass-Through Certificates, Series 2012-3, Class C(b) | | 6.125 | | | 04/29/18 | | | | 18,725 | | | | 19,427,188 | |
See Notes to Financial Statements.
| | | | |
| Prudential Short Duration High Yield Income Fund | | | 11 | |
Portfolio of Investments
as of August 31, 2015 continued
| | | | | | | | | | | | | | |
| Description | | Interest
Rate | | Maturity
Date | | | Principal
Amount (000)# | | | Value (Note 1) | |
CORPORATE BONDS (Continued) | |
|
Automotive 1.9% | |
American Axle & Manufacturing, Inc.,
Gtd. Notes(b) | | 5.125 % | | | 02/15/19 | | | | 3,500 | | | $ | 3,543,750 | |
Gtd. Notes | | 7.750 | | | 11/15/19 | | | | 3,500 | | | | 3,902,500 | |
Fiat Chrysler Automobiles NV (United Kingdom), Sr. Unsec’d. Notes(b) | | 4.500 | | | 04/15/20 | | | | 1,925 | | | | 1,925,962 | |
Jaguar Land Rover Automotive PLC (United Kingdom), Gtd. Notes, 144A | | 4.250 | | | 11/15/19 | | | | 2,125 | | | | 2,114,375 | |
Schaeffler Holding Finance BV (Germany),
Sr. Sec’d. Notes, PIK, 144A(b) | | 6.250 | | | 11/15/19 | | | | 2,350 | | | | 2,473,375 | |
Sr. Sec’d. Notes, PIK, 144A | | 6.875 | | | 08/15/18 | | | | 6,425 | | | | 6,630,600 | |
ZF North America Capital, Inc. (Germany), Gtd. Notes, 144A | | 4.000 | | | 04/29/20 | | | | 4,000 | | | | 3,999,400 | |
| | | | | | | | | | | | | | |
| | | | | | | | | | | | | 24,589,962 | |
|
Building Materials & Construction 8.5% | |
Beazer Homes USA, Inc.,
Gtd. Notes(b) | | 5.750 | | | 06/15/19 | | | | 5,925 | | | | 5,702,813 | |
Sr. Sec’d. Notes | | 6.625 | | | 04/15/18 | | | | 13,896 | | | | 14,312,880 | |
Brookfield Residential Properties, Inc. (Canada), Gtd. Notes, 144A | | 6.500 | | | 12/15/20 | | | | 5,675 | | | | 5,660,813 | |
Building Materials Corp. of America, Sr. Unsec’d. Notes, 144A (original cost $8,071,819; purchased 04/24/14 - 05/29/15)(c)(d) | | 6.750 | | | 05/01/21 | | | | 7,510 | | | | 7,857,337 | |
Cemex Espana SA Luxembourg (Mexico), Sr. Sec’d. Notes, 144A | | 9.875 | | | 04/30/19 | | | | 4,000 | | | | 4,354,000 | |
Cemex SAB de CV (Mexico), Sr. Sec’d. Notes, 144A | | 9.500 | | | 06/15/18 | | | | 2,500 | | | | 2,731,250 | |
D.R. Horton, Inc.,
Gtd. Notes(b) | | 3.625 | | | 02/15/18 | | | | 2,018 | | | | 2,048,270 | |
Gtd. Notes | | 6.500 | | | 04/15/16 | | | | 100 | | | | 102,125 | |
HD Supply, Inc., Gtd. Notes | | 11.500 | | | 07/15/20 | | | | 3,500 | | | | 4,007,500 | |
KB Home, Gtd. Notes | | 4.750 | | | 05/15/19 | | | | 7,729 | | | | 7,593,742 | |
Lennar Corp.,
Gtd. Notes | | 6.950 | | | 06/01/18 | | | | 125 | | | | 135,625 | |
Gtd. Notes | | 4.500 | | | 06/15/19 | | | | 4,200 | | | | 4,292,400 | |
Gtd. Notes | | 4.500 | | | 11/15/19 | | | | 8,125 | | | | 8,324,062 | |
Standard Pacific Corp., Gtd. Notes | | 8.375 | | | 05/15/18 | | | | 15,066 | | | | 17,024,580 | |
Toll Brothers Finance Corp., Gtd. Notes | | 4.000 | | | 12/31/18 | | | | 500 | | | | 510,000 | |
See Notes to Financial Statements.
| | | | | | | | | | | | | | |
| Description | | Interest
Rate | | Maturity
Date | | | Principal
Amount (000)# | | | Value (Note 1) | |
CORPORATE BONDS (Continued) | |
|
Building Materials & Construction (cont’d.) | |
U.S. Concrete, Inc., Sr. Sec’d. Notes | | 8.500 % | | | 12/01/18 | | | | 14,575 | | | $ | 15,230,875 | |
USG Corp.,
Sr. Unsec’d. Notes(b) | | 6.300 | | | 11/15/16 | | | | 3,725 | | | | 3,837,868 | |
Sr. Unsec’d. Notes | | 9.750 | | | 01/15/18 | | | | 7,000 | | | | 7,875,000 | |
William Lyon Homes, Inc., Gtd. Notes | | 8.500 | | | 11/15/20 | | | | 1,600 | | | | 1,728,000 | |
| | | | | | | | | | | | | | |
| | | | | | | | | | | | | 113,329,140 | |
|
Cable & Satellite 8.6% | |
Cablevision Systems Corp.,
Sr. Unsec’d. Notes(b) | | 7.750 | | | 04/15/18 | | | | 5,500 | | | | 5,925,700 | |
Sr. Unsec’d. Notes(b) | | 8.625 | | | 09/15/17 | | | | 9,440 | | | | 10,313,200 | |
CCO Holdings LLC/CCO Holdings Capital Corp.,
Gtd. Notes(b) | | 6.500 | | | 04/30/21 | | | | 20,245 | | | | 21,160,074 | |
Gtd. Notes | | 7.000 | | | 01/15/19 | | | | 2,140 | | | | 2,209,550 | |
Gtd. Notes | | 7.375 | | | 06/01/20 | | | | 2,000 | | | | 2,085,000 | |
Cequel Communications Holdings I LLC/Cequel Capital Corp., Sr. Unsec’d. Notes, 144A | | 6.375 | | | 09/15/20 | | | | 4,687 | | | | 4,601,462 | |
CSC Holdings LLC,
Sr. Unsec’d. Notes(b) | | 7.625 | | | 07/15/18 | | | | 4,218 | | | | 4,618,710 | |
Sr. Unsec’d. Notes | | 7.875 | | | 02/15/18 | | | | 4,250 | | | | 4,643,125 | |
Sr. Unsec’d. Notes | | 8.625 | | | 02/15/19 | | | | 250 | | | | 281,250 | |
DISH DBS Corp.,
Gtd. Notes(b) | | 4.250 | | | 04/01/18 | | | | 5,195 | | | | 5,179,363 | |
Gtd. Notes(b) | | 4.625 | | | 07/15/17 | | | | 3,000 | | | | 3,063,750 | |
Gtd. Notes | | 7.875 | | | 09/01/19 | | | | 5,509 | | | | 5,971,205 | |
Harron Communications LP/Harron Finance Corp., Sr. Unsec’d. Notes, 144A (original cost $12,018,750; purchased 04/14/15 - 06/24/15)(c)(d) | | 9.125 | | | 04/01/20 | | | | 11,000 | | | | 11,825,000 | |
Intelsat Jackson Holdings SA (Luxembourg),
Gtd. Notes(b) | | 7.250 | | | 04/01/19 | | | | 11,592 | | | | 11,331,180 | |
Gtd. Notes | | 7.250 | | | 10/15/20 | | | | 2,815 | | | | 2,705,919 | |
Numericabie-SFR SAS (France), Sr. Sec’d. Notes, 144A(b) | | 4.875 | | | 05/15/19 | | | | 4,675 | | | | 4,704,219 | |
Telesat Canada/Telesat LLC (Canada), Gtd. Notes, 144A | | 6.000 | | | 05/15/17 | | | | 6,850 | | | | 6,935,625 | |
UPCB Finance V Ltd. (Netherlands),
Sr. Sec’d. Notes, 144A | | 7.250 | | | 11/15/21 | | | | 5,661 | | | | 6,078,499 | |
| | | | | | | | | | | | | | |
| | | | | | | | | | | | | 113,632,831 | |
See Notes to Financial Statements.
| | | | |
| Prudential Short Duration High Yield Income Fund | | | 13 | |
Portfolio of Investments
as of August 31, 2015 continued
| | | | | | | | | | | | | | |
| Description | | Interest
Rate | | Maturity
Date | | | Principal
Amount (000)# | | | Value (Note 1) | |
CORPORATE BONDS (Continued) | |
|
Capital Goods 5.5% | |
Anixter, Inc., Gtd. Notes | | 5.625 % | | | 05/01/19 | | | | 6,776 | | | $ | 7,097,860 | |
BiueLine Rental Finance Corp., Sec’d. Notes, 144A
(original cost $1,136,375; purchased 01/16/14 -
02/11/14)(b)(c)(d) | | 7.000 | | | 02/01/19 | | | | 1,125 | | | | 1,063,125 | |
Case New Holland Industrial, Inc. (United Kingdom), Gtd. Notes(b) | | 7.875 | | | 12/01/17 | | | | 2,570 | | | | 2,785,623 | |
Cleaver-Brooks, Inc., Sr. Sec’d. Notes, 144A (original cost $2,725,000; purchased 03/21/14)(c)(d) | | 8.750 | | | 12/15/19 | | | | 2,500 | | | | 2,403,125 | |
CNH Industrial Capital LLC,
Gtd. Notes, 144A | | 3.875 | | | 07/16/18 | | | | 2,825 | | | | 2,814,406 | |
Gtd. Notes | | 3.625 | | | 04/15/18 | | | | 375 | | | | 372,188 | |
Gtd. Notes | | 3.875 | | | 11/01/15 | | | | 250 | | | | 250,000 | |
Dycom Investments, Inc., Gtd. Notes | | 7.125 | | | 01/15/21 | | | | 2,000 | | | | 2,085,000 | |
Hertz Corp. (The), Gtd. Notes | | 7.500 | | | 10/15/18 | | | | 5,716 | | | | 5,837,465 | |
International Wire Group Holdings, Inc., Sec’d. Notes, 144A | | 8.500 | | | 10/15/17 | | | | 3,150 | | | | 3,244,500 | |
Laureate Education, Inc., Gtd. Notes, 144A(b) | | 10.000 | | | 09/01/19 | | | | 6,700 | | | | 5,619,625 | |
Michael Baker International LLC/CDL Acquisition Co., Inc., Sr. Sec’d. Notes, 144A | | 8.250 | | | 10/15/18 | | | | 7,910 | | | | 7,712,250 | |
NCSG Crane & Heavy Haul Services, Inc. (Canada), Sec’d. Notes, 144A | | 9.500 | | | 08/15/19 | | | | 3,525 | | | | 1,921,125 | |
Safway Group Holding LLC/Satway Finance Corp., Sec’d. Notes, 144A(b) | | 7.000 | | | 05/15/18 | | | | 9,272 | | | | 9,456,420 | |
SPX Corp., Gtd. Notes(b) | | 6.875 | | | 09/01/17 | | | | 6,781 | | | | 7,221,765 | |
Terex Corp., Gtd. Notes(b) | | 6.500 | | | 04/01/20 | | | | 2,900 | | | | 3,008,750 | |
Unifrax 1 LLC/Unifrax Holding Co., Gtd. Notes, 144A
(original cost $6,917,735; purchased 01/31/13 - 06/30/14)(c)(d) | | 7.500 | | | 02/15/19 | | | | 6,583 | | | | 6,566,542 | |
United Rentals North America, Inc., Gtd. Notes | | 8.250 | | | 02/01/21 | | | | 2,364 | | | | 2,499,930 | |
WireCo WorldGroup, Inc., Gtd. Notes(b) | | 9.500 | | | 05/15/17 | | | | 1,650 | | | | 1,402,500 | |
| | | | | | | | | | | | | | |
| | | | | | | | | | | | | 73,362,199 | |
| | | | |
Capital Markets 0.1% | | | | | | | | | | | | | | |
KCG Holdings, Inc., Sr. Sec’d. Notes, 144A | | 6.875 | | | 03/15/20 | | | | 1,750 | | | | 1,627,500 | |
See Notes to Financial Statements.
| | | | | | | | | | | | | | |
| Description | | Interest
Rate | | Maturity
Date | | | Principal
Amount (000)# | | | Value (Note 1) | |
CORPORATE BONDS (Continued) | |
| | | | |
Chemicals 3.9% | | | | | | | | | | | | | | |
Axalta Coating Systems U.S. Holdings, Inc./Axalta Coating Systems Dutch Holding B BV, Gtd. Notes, 144A(b) | | 7.375 % | | | 05/01/21 | | | | 25,130 | | | $ | 26,886,587 | |
Chemtura Corp., Gtd. Notes | | 5.750 | | | 07/15/21 | | | | 1,280 | | | | 1,283,200 | |
Hexion, Inc., Sr. Sec’d. Notes(b) | | 8.875 | | | 02/01/18 | | | | 4,600 | | | | 4,002,000 | |
Koppers, Inc., Gtd. Notes | | 7.875 | | | 12/01/19 | | | | 17,627 | | | | 17,935,472 | |
PolyOne Corp., Sr. Unsec’d. Notes | | 7.375 | | | 09/15/20 | | | | 1,200 | | | | 1,246,800 | |
| | | | | | | | | | | | | | |
| | | | | | | | | | | | | 51,354,059 | |
| | | | |
Consumer 1 3% | | | | | | | | | | | | | | |
Scotts Miracle-Gro Co. (The), Gtd. Notes | | 6.625 | | | 12/15/20 | | | | 6,374 | | | | 6,628,960 | |
Service Corp. International, Sr. Unsec’d. Notes | | 7.625 | | | 10/01/18 | | | | 9,730 | | | | 10,897,600 | |
| | | | | | | | | | | | | | |
| | | | | | | | | | | | | 17,526,560 | |
| | | | |
Electric 3.2% | | | | | | | | | | | | | | |
AES Corp.,
Sr. Unsec’d. Notes | | 3.324(a) | | | 06/01/19 | | | | 1,725 | | | | 1,707,750 | |
Sr. Unsec’d. Notes(b) | | 7.375 | | | 07/01/21 | | | | 2,772 | | | | 2,986,830 | |
Sr. Unsec’d. Notes(b) | | 8.000 | | | 06/01/20 | | | | 182 | | | | 210,328 | |
DPL, Inc.,
Sr. Unsec’d. Notes | | 6.500 | | | 10/15/16 | | | | 901 | | | | 923,525 | |
Sr. Unsec’d. Notes | | 7.250 | | | 10/15/21 | | | | 3,400 | | | | 3,506,250 | |
Dynegy, Inc., Gtd. Notes | | 6.750 | | | 11/01/19 | | | | 9,575 | | | | 9,928,078 | |
GenOn Energy, Inc., Sr. Unsec’d. Notes(b) | | 9.500 | | | 10/15/18 | | | | 2,525 | | | | 2,427,156 | |
Mirant Mid-Atlantic Trust, Pass-Through Certificates, Series B | | 9.125 | | | 06/30/17 | | | | 583 | | | | 605,931 | |
NRG Energy, Inc.,
Gtd. Notes(b) | | 7.625 | | | 01/15/18 | | | | 12,500 | | | | 13,187,500 | |
Gtd. Notes(b) | | 7.875 | | | 05/15/21 | | | | 2,000 | | | | 2,065,000 | |
Gtd. Notes | | 8.250 | | | 09/01/20 | | | | 4,375 | | | | 4,517,188 | |
NRG REMA LLC, Pass-Through Certificates, Series B(c) | | 9.237 | | | 07/02/17 | | | | 251 | | | | 265,444 | |
| | | | | | | | | | | | | | |
| | | | | | | | | | | | | 42,330,980 | |
|
Energy—Integrated | |
Pacific Rubiales Energy Corp. (Colombia), Gtd. Notes, 144A | | 7.250 | | | 12/12/21 | | | | 200 | | | | 108,000 | |
See Notes to Financial Statements.
| | | | |
| Prudential Short Duration High Yield Income Fund | | | 15 | |
Portfolio of Investments
as of August 31, 2015 continued
| | | | | | | | | | | | | | |
| Description | | Interest
Rate | | Maturity
Date | | | Principal
Amount (000)# | | | Value (Note 1) | |
CORPORATE BONDS (Continued) | |
|
Energy—Other 0.9% | |
CGG SA (France), Gtd. Notes | | 7.750 % | | | 05/15/17 | | | | 288 | | | $ | 228,960 | |
EP Energy LLC/Everest Acquisition Finance, Inc., Gtd. Notes(b) | | 9.375 | | | 05/01/20 | | | | 225 | | | | 217,913 | |
PHI, Inc., Gtd. Notes | | 5.250 | | | 03/15/19 | | | | 1,650 | | | | 1,414,875 | |
SESI LLC, Gtd. Notes(b) | | 6.375 | | | 05/01/19 | | | | 2,925 | | | | 2,910,375 | |
Whiting Canadian Holding Com., ULC, Gtd. Notes | | 8.125 | | | 12/01/19 | | | | 5,000 | | | | 4,800,000 | |
WPX Energy, Inc., Sr. Unsec’d. Notes | | 7.500 | | | 08/01/20 | | | | 2,850 | | | | 2,737,083 | |
| | | | | | | | | | | | | | |
| | | | | | | | | | | | | 12,309,206 | |
|
Food & Beverage 4.6% | |
Aramark Services, Inc., Gtd. Notes | | 5.750 | | | 03/15/20 | | | | 1,005 | | | | 1,042,059 | |
Bertin SA/Bertin Finance Ltd. (Brazil), Gtd. Notes, 144A | | 10.250 | | | 10/05/16 | | | | 2,900 | | | | 3,060,950 | |
Cott Beverages, Inc. (Canada), Gtd. Notes | | 6.750 | | | 01/01/20 | | | | 7,125 | | | | 7,392,188 | |
Diamond Foods, Inc., Gtd. Notes, 144A(b) | | 7.000 | | | 03/15/19 | | | | 9,800 | | | | 10,094,000 | |
Iceland Bondco PLC (United Kingdom), Sr. Sec’d. Notes, 144A | | 4.834(a) | | | 07/15/20 | | | GBP | 2,254 | | | | 2,836,177 | |
JBS SA (Brazil Sr Unsec’d Notes RegS | | 10.500 | | | 08/04/16 | | | | 1,500 | | | | 1,593,750 | |
JBS USA LLC/JBS USA Finance, Inc. (Brazil), Gtd. Notes, 144A
(original cost $4,865,625; purchased 06/17/14)(b)(c)(d) | | 7.250 | | | 06/01/21 | | | | 4,500 | | | | 4,696,875 | |
Landry’s, Inc., Gtd. Notes, 144A
(original cost $18,625,707; purchased 05/27/14 -
07/22/15)(c)(d) | | 9.375 | | | 05/01/20 | | | | 17,255 | | | | 18,441,281 | |
Shearer’s Foods LLC/Chip Finance Corp., Sr. Sec’d. Notes 144A | | 9.000 | | | 11/01/19 | | | | 5,230 | | | | 5,569,950 | |
Smithfield Foods, Inc.,
Sr. Unsec’d. Notes | | 7.750 | | | 07/01/17 | | | | 2,825 | | | | 3,065,125 | |
Sr. Unsec’d. Notes, 144A | | 5.250 | | | 08/01/18 | | | | 3,425 | | | | 3,484,938 | |
| | | | | | | | | | | | | | |
| | | | | | | | | | | | | 61,277,293 | |
|
Gaming 7.4% | |
Boyd Gaming Corp., Gtd. Notes | | 9.000 | | | 07/01/20 | | | | 1,300 | | | | 1,394,250 | |
CCM Merger, Inc., Gtd. Notes, 144A (original cost $6,468,325; purchased 09/04/13 - 08/17/15)(c)(d) | | 9.125 | | | 05/01/19 | | | | 6,135 | | | | 6,533,775 | |
GLP Capital LP/GLP Financing II, Inc., Gtd, Notes(b) | | 4.375 | | | 11/01/18 | | | | 6,425 | | | | 6,617,750 | |
See Notes to Financial Statements.
| | | | | | | | | | | | | | |
| Description | | Interest
Rate | | Maturity
Date | | | Principal
Amount (000)# | | | Value (Note 1) | |
CORPORATE BONDS (Continued) | |
|
Gaming (cont’d.) | |
Golden Nugget Escrow, Inc., Sr. Unsec’d. Notes, 144A(b) | | 8.500 % | | | 12/01/21 | | | | 2,235 | | | $ | 2,296,463 | |
Isle of Capri Casinos, Inc., Gtd. Notes(b) | | 8.875 | | | 06/15/20 | | | | 8,417 | | | | 9,027,232 | |
MGM Resorts International,
Gtd. Notes | | 7.625 | | | 01/15/17 | | | | 11,070 | | | | 11,651,175 | |
Gtd. Notes | | 8.625 | | | 02/01/19 | | | | 10,981 | | | | 12,267,973 | |
Gtd Notss(b) | | 10.000 | | | 11/01/16 | | | | 8,080 | | | | 8,706,200 | |
NCL Corp. Ltd., Sr. Unsec’d. Notes, 144A(b) | | 5.250 | | | 11/15/19 | | | | 2,800 | | | | 2,897,132 | |
Peninsula Gaming LLC/Peninsula Gaming Corp., Gtd. Notes, 144A(b) | | 8.375 | | | 02/15/18 | | | | 13,021 | | | | 13,541,840 | |
Penn National Gaming, Inc., Sr. Unsec’d. Notes(b) | | 5.875 | | | 11/01/21 | | | | 900 | | | | 913,500 | |
Pinnacle Entertainment Inc.,
Gtd. Notes | | 7.500 | | | 04/15/21 | | | | 5,400 | | | | 5,710,500 | |
Gtd. Notes(b) | | 8.750 | | | 05/15/20 | | | | 5,966 | | | | 6,249,385 | |
Scientific Games Corp., Gtd. Notes(b) | | 8.125 | | | 09/15/18 | | | | 3,985 | | | | 3,706,050 | |
Station Casinos LLC, Gtd. Notes | | 7.500 | | | 03/01/21 | | | | 6,150 | | | | 6,506,085 | |
| | | | | | | | | | | | | | |
| | | | | | | | | | | | | 98,019,310 | |
|
Healthcare & Pharmaceutical 11.9% | |
Capella Healthcare, Inc., Gtd. Notes | | 9.250 | | | 07/01/17 | | | | 3,875 | | | | 3,981,563 | |
Capsugel SA, Sr. Unsec’d. Notes, PIK, 144A | | 7.000 | | | 05/15/19 | | | | 6,525 | | | | 6,573,937 | |
CHS/Community Health Systems, Inc., Gtd. Notes | | 8.000 | | | 11/15/19 | | | | 18,652 | | | | 19,491,340 | |
ConvaTec Healthcare E SA (Luxembourg), Gtd. Notes, 144A | | 10.500 | | | 12/15/18 | | | | 10,784 | | | | 11,215,360 | |
Elli Finance UK PLC (United Kingdom), Sr. Sec’d. Notes, RegS(b) | | 8.750 | | | 06/15/19 | | | GBP | 1,950 | | | | 2,808,242 | |
Emdeon, Inc., Gtd. Notes | | 11.000 | | | 12/31/19 | | | | 17,000 | | | | 18,253,750 | |
Endo Finance LLC/Endo Finco, Inc., Gtd. Notes, 144A(b) | | 7.250 | | | 12/15/20 | | | | 4,025 | | | | 4,196,063 | |
HCA, Inc.,
Gtd. Notes | | 6.500 | | | 02/15/16 | | | | 250 | | | | 254,375 | |
Gtd. Notes(b) | | 8.000 | | | 10/01/18 | | | | 9,358 | | | | 10,738,305 | |
Sr. Sec’d. Notes(b) | | 4.250 | | | 10/15/19 | | | | 4,600 | | | | 4,692,000 | |
IDH Finance PLC (United Kingdom),
Sr. Sec’d. Notes, 144A | | 5.586(a) | | | 12/01/18 | | | GBP | 2,000 | | | | 3,045,973 | |
Sr. Sec’d. Notes, MTN, 144A | | 6.000 | | | 12/01/18 | | | GBP | 1,000 | | | | 1,549,196 | |
Kindred Healthcare, Inc., Gtd. Notes, 144A(b) | | 8.000 | | | 01/15/20 | | | | 2,900 | | | | 3,177,313 | |
Mallinckrodt International Finance SA/ Mallinckrodt CB LLC, Gtd. Notes, 144A | | 4.875 | | | 04/15/20 | | | | 5,375 | | | | 5,428,750 | |
See Notes to Financial Statements.
| | | | |
| Prudential Short Duration High Yield Income Fund | | | 17 | |
Portfolio of Investments
as of August 31, 2015 continued
| | | | | | | | | | | | | | |
| Description | | Interest
Rate | | Maturity
Date | | | Principal
Amount (000)# | | | Value (Note 1) | |
CORPORATE BONDS (Continued) | |
|
Healthcare & Pharmaceutical (cont’d.) | |
MedAssets, Inc., Gtd. Notes | | 8.000 % | | | 11/15/18 | | | | 14,549 | | | $ | 14,950,407 | |
Priory Group No. 3 PLC (United Kingdom), Sr. Sec’d. Notes, RegS | | 7.000 | | | 02/15/18 | | | GBP | 184 | | | | 290,280 | |
Tenet Healthcare Corp.,
Sr. Sec’d. Notes | | 6.250 | | | 11/01/18 | | | | 13,200 | | | | 14,305,500 | |
Sr. Unsec’d. Notes | | 5.000 | | | 03/01/19 | | | | 4,000 | | | | 3,992,960 | |
Sr. Unsec’d. Notes | | 8.000 | | | 08/01/20 | | | | 1,000 | | | | 1,043,750 | |
Valeant Pharmaceuticals International, Inc.,
Gtd. Notes, 14A | | 5.375 | | | 03/15/20 | | | | 10,275 | | | | 10,454,812 | |
Gtd. Notes, 144A | | 6.375 | | | 10/15/20 | | | | 5,000 | | | | 5,212,500 | |
Gtd. Notes, 144A(b) | | 6.750 | | | 08/15/18 | | | | 4,900 | | | | 5,126,625 | |
Gtd. Notes, 144A | | 7.500 | | | 07/15/21 | | | | 6,150 | | | | 6,603,562 | |
| | | | | | | | | | | | | | |
| | | | | | | | | | | | | 157,386,563 | |
| | | | |
Hotels, Restaurants & Leisure 0.9% | | | | | | | | | | | | | | |
Cedar Fair LP/Canada’s Wonderland Co./Magnum Management Corp., Gtd. Notes | | 5.250 | | | 03/15/21 | | | | 10,040 | | | | 10,215,700 | |
Royal Caribbean Cruises Ltd., Sr. Unsec’d. Notes | | 7.250 | | | 03/15/18 | | | | 2,000 | | | | 2,210,000 | |
| | | | | | | | | | | | | | |
| | | | | | | | | | | | | 12,425,700 | |
| | | | |
Media & Entertainment 3.4% | | | | | | | | | | | | | | |
AMC Networks, Inc., Gtd. Notes | | 7.750 | | | 07/15/21 | | | | 13,973 | | | | 14,916,177 | |
Carlson Travel Holdings, Inc., Sr. Unsec’d. Notes, PIK, 144A
(original cost $4,679,875; purchased 06/26/14 -
08/04/14)(c)(d) | | 7.500 | | | 08/15/19 | | | | 4,650 | | | | 4,708,125 | |
Cinemark USA, Inc., Gtd. Notes | | 7.375 | | | 06/15/21 | | | | 3,100 | | | | 3,278,250 | |
Clear Channel Worldwide Holdings, Inc., Gtd. Notes,
Series A(b) | | 7.625 | | | 03/15/20 | | | | 525 | | | | 538,125 | |
Entercom Radio LLC, Gtd. Notes | | 10.500 | | | 12/01/19 | | | | 6,882 | | | | 7,286,317 | |
NAI Entertainment Holdings/NAI Entertainment Holdings Finance Corp., Sr. Sec’d. Notes, 144A (original cost $8,784,018; purchased 07/30/13 - 08/04/15)(c)(d) | | 5.000 | | | 08/01/18 | | | | 8,567 | | | | 8,738,340 | |
National CineMedia LLC,
Sr. Sec’d. Notes | | 6.000 | | | 04/15/22 | | | | 1,275 | | | | 1,303,688 | |
Sr. Unsec’d. Notes | | 7.875 | | | 07/15/21 | | | | 4,750 | | | | 4,951,875 | |
| | | | | | | | | | | | | | |
| | | | | | | | | | | | | 45,720,897 | |
See Notes to Financial Statements.
| | | | | | | | | | | | | | |
| Description | | Interest
Rate | | Maturity
Date | | | Principal
Amount (000)# | | | Value (Note 1) | |
CORPORATE BONDS (Continued) | |
| | | | |
Metals 4.1% | | | | | | | | | | | | | | |
AK Steel Corp., Sr. Sec’d. Notes(b) | | 8.750 % | | | 12/01/18 | | | | 10,775 | | | $ | 10,775,000 | |
Alcoa Inc., Sr. Unsec’d. Notes | | 6.750 | | | 07/15/18 | | | | 4,000 | | | | 4,330,000 | |
ArcelorMittal (Luxembourg),
Sr. Unsec’d. Notes(b) | | 5.125 | | | 06/01/20 | | | | 650 | | | | 641,875 | |
Sr. Unsec’d. Notes(b) | | 5.250 | | | 02/25/17 | | | | 422 | | | | 429,385 | |
Sr, Unsec’d. Notes | | 6.125 | | | 06/01/18 | | | | 5,307 | | | | 5,519,280 | |
Sr. Unsec’d. Notes(b) | | 10.600 | | | 06/01/19 | | | | 4,500 | | | | 5,242,500 | |
AuRico Gold, Inc. (Canada), Sec’d. Notes, 144A | | 7.750 | | | 04/01/20 | | | | 500 | | | | 450,000 | |
FMG Resources (August 2006) Pty Ltd. (Australia), Gtd. Notes, 144A(b) | | 8.250 | | | 11/01/19 | | | | 3,200 | | | | 2,464,000 | |
JMC Steel Group, Inc., Sr. Unsec’d. Notes, 144A(b) | | 8.250 | | | 03/15/18 | | | | 1,994 | | | | 1,580,245 | |
Lundin Mining Corp. (Canada), Sr. Sec’d. Notes, 144A | | 7.500 | | | 11/01/20 | | | | 10,900 | | | | 10,763,750 | |
New Gold, Inc. (Canada), Gtd. Notes, 144A | | 7.000 | | | 04/15/20 | | | | 1,650 | | | | 1,584,000 | |
Peabody Energy Corp., Gtd. Notes(b) | | 6.000 | | | 11/15/18 | | | | 5,400 | | | | 1,795,500 | |
Steel Dynamics, Inc., Gtd. Notes(b) | | 6.125 | | | 08/15/19 | | | | 6,460 | | | | 6,694,175 | |
United States Steel Corp., Sr. Unsec’d. Notes(b) | | 7.000 | | | 02/01/18 | | | | 1,926 | | | | 1,935,630 | |
| | | | | | | | | | | | | | |
| | | | | | | | | | | | | 54,205,340 | |
| | | | |
Non-Captive Finance 1.1% | | | | | | | | | | | | | | |
AerCap Ireland Capital Ltd./AerCap Global Aviation Trust (Netherlands), Gtd. Notes(b) | | 4.250 | | | 07/01/20 | | | | 2,850 | | | | 2,871,375 | |
CIT Group, Inc., Sr. Unsec’d, Notes(b) | | 5.250 | | | 03/15/18 | | | | 250 | | | | 259,688 | |
International Lease Finance Corp.,
Sr. Unsec’d, Notes(b) | | 5.875 | | | 04/01/19 | | | | 1,000 | | | | 1,063,750 | |
Sr. Unsec’d. Notes | | 8.875 | | | 09/01/17 | | | | 1,600 | | | | 1,762,000 | |
Navient Corp.,
Sr. Unsec’d. Notes, MTN | | 8.000 | | | 03/25/20 | | | | 150 | | | | 151,875 | |
Sr, Unsec’d. Notes, MTN | | 8.450 | | | 06/15/18 | | | | 3,150 | | | | 3,339,000 | |
OneMain Financial Holdings, Inc., Gtd. Notes, 144A | | 6.750 | | | 12/15/19 | | | | 5,075 | | | | 5,303,375 | |
| | | | | | | | | | | | | | |
| | | | | | | | | | | | | 14,751,063 | |
| | | | |
Packaging 3.6% | | | | | | | | | | | | | | |
AEP Industries, Inc., Sr. Unsec’d. Notes | | 8.250 | | | 04/15/19 | | | | 11,020 | | | | 11,130,200 | |
Ardagh Packaging Finance PLC (Ireland), Gtd. Notes, 144A(b) | | 9.125 | | | 10/15/20 | | | | 1,000 | | | | 1,050,000 | |
See Notes to Financial Statements.
| | | | |
| Prudential Short Duration High Yield Income Fund | | | 19 | |
Portfolio of Investments
as of August 31, 2015 continued
| | | | | | | | | | | | | | |
| Description | | Interest
Rate | | Maturity
Date | | | Principal
Amount (000)# | | | Value (Note 1) | |
CORPORATE BONDS (Continued) | |
| | | | |
Packaging (cont’d.) | | | | | | | | | | | | | | |
Ardagh Packaging Finance PLC/Ardagh Holdings USA, Inc. (Ireland),
Gtd, Notes, 144A | | 6.250 % | | | 01/31/19 | | | | 400 | | | $ | 408,000 | |
Gtd. Notes, 144A | | 6.750 | | | 01/31/21 | | | | 3,700 | | | | 3,774,000 | |
Beverage Packaging Holdings Luxembourg II SA/Beverage Packaging Holdings II Is (New Zealand), Gtd. Notes, 144A | | 6.000 | | | 06/15/17 | | | | 1,625 | | | | 1,616,875 | |
Greif, Inc.,
Sr. Unsec’d. Notes | | 6.750 | | | 02/01/17 | | | | 4,262 | | | | 4,432,480 | |
Sr. Unsec’d. Notes(b) | | 7.750 | | | 08/01/19 | | | | 9,210 | | | | 10,142,512 | |
Owens-Illinois, Inc., Gtd. Notes | | 7.800 | | | 05/15/18 | | | | 4,829 | | | | 5,336,045 | |
Paperworks Industries, Inc., Sr. Sec’d. Notes, 144A | | 9.500 | | | 08/15/19 | | | | 6,375 | | | | 6,241,125 | |
Reynolds Group Issuer, Inc./Reynolds Group Issuer LLC (New Zealand), Gtd. Notes(b) | | 9.875 | | | 08/15/19 | | | | 1,350 | | | | 1,419,188 | |
Sealed Air Corp., Gtd. Notes, 144A(b) | | 6.500 | | | 12/01/20 | | | | 2,365 | | | | 2,619,237 | |
| | | | | | | | | | | | | | |
| | | | | | | | | | | | | 48,169,662 | |
| | | | |
Paper 0.5% | | | | | | | | | | | | | | |
Smurfit Kappa Acquisitions (Ireland), Sr. Sec’d. Notes, 144A | | 4.875 | | | 09/15/18 | | | | 4,150 | | | | 4,331,563 | |
Tembec Industries, Inc. (Canada), Sr. Sec’d. Notes, 144A(b) | | 9.000 | | | 12/15/19 | | | | 3,275 | | | | 2,096,000 | |
| | | | | | | | | | | | | | |
| | | | | | | | | | | | | 6,427,563 | |
| | | | |
Pipelines & Other 0.7% | | | | | | | | | | | | | | |
AmeriGas Finance LLC/AmeriGas Finance Corp., Gtd. Notes | | 6.750 | | | 05/20/20 | | | | 1,000 | | | | 1,032,500 | |
AmeriGas Partners LP/AmeriGas Eagle Finance Corp., Sr. Unsec’d. Notes | | 6.500 | | | 05/20/21 | | | | 1,425 | | | | 1,439,250 | |
Ferrellgas Partners LP/Ferrellgas Partners Finance Corp., Sr. Unsec’d. Notes | | 8.625 | | | 06/15/20 | | | | 1,525 | | | | 1,540,250 | |
Rockies Express Pipeline LLC, Sr. Unsec’d. Notes, 144A (original cost $3,247,125; purchased 01/10/13 -
05/26/15)(b)(c)(d) | | 6.000 | | | 01/15/19 | | | | 3,100 | | | | 3,100,000 | |
See Notes to Financial Statements.
| | | | | | | | | | | | | | |
| Description | | Interest
Rate | | Maturity
Date | | | Principal
Amount (000)# | | | Value (Note 1) | |
CORPORATE BONDS (Continued) | |
| | | | |
Pipelines & Other (cont’d.) | | | | | | | | | | | | | | |
Sunoco LP/Sunoco Finance Corp., Gtd. Notes, 144A(b) | | 5.500 % | | | 08/01/20 | | | | 1,600 | | | $ | 1,592,000 | |
| | | | | | | | | | | | | | |
| | | | | | | | | | | | | 8,704,000 | |
| | | | |
Real Estate Investment Trusts 0.4% | | | | | | | | | | | | | | |
CTR Partnership LP/CareTrust Capita! Corp., Gtd. Notes | | 5.875 | | | 06/01/21 | | | | 3,125 | | | | 3,164,062 | |
MPT Operating Partnership LP/MPT Finance Corp., Gtd. Notes | | 6.375 | | | 02/15/22 | | | | 2,650 | | | | 2,792,438 | |
| | | | | | | | | | | | | | |
| | | | | | | | | | | | | 5,956,500 | |
| | | | |
Retailers 1.7% | | | | | | | | | | | | | | |
Claire’s Stores, Inc., Sr. Sec’d. Notes, 144A(b) | | 9.000 | | | 03/15/19 | | | | 8,630 | | | | 7,313,925 | |
Dollar Tree, inc., Gtd. Notes, 144A(b) | | 5.250 | | | 03/01/20 | | | | 1,175 | | | | 1,230,813 | |
Hot Topic, Inc., Sr. Sec’d. Notes, 144A (original cost $1,915,813; purchased 12/10/13 - 01/03/14)(c)(d) | | 9.250 | | | 06/15/21 | | | | 1,825 | | | | 1,843,250 | |
L Brands, Inc., Gtd. Notes | | 8.500 | | | 06/15/19 | | | | 2,195 | | | | 2,584,612 | |
THOM Europe SAS (France), Sr. Sec’d. Notes, 144A | | 7.375 | | | 07/15/19 | | | EUR | 6,000 | | | | 7,052,685 | |
Toys “R” Us Property Co. II LLC, Sr. Sec’d. Notes | | 8.500 | | | 12/01/17 | | | | 2,000 | | | | 1,940,000 | |
| | | | | | | | | | | | | | |
| | | | | | | | | | | | | 21,965,285 | |
| | | | |
Technology 12.4% | | | | | | | | | | | | | | |
Alcatel-Lucent USA, Inc. (France),
Gtd. Notes, 144A(b) | | 4.625 | | | 07/01/17 | | | | 9,800 | | | | 10,069,500 | |
Gtd. Notes, 144A | | 6.750 | | | 11/15/20 | | | | 3,650 | | | | 3,896,375 | |
Gtd. Notes, 144A(b) | | 8.875 | | | 01/01/20 | | | | 11,440 | | | | 12,419,550 | |
Ancestry.com, Inc., Gtd. Notes | | 11.000 | | | 12/15/20 | | | | 2,700 | | | | 3,000,375 | |
Audatex North America, Inc., Gtd. Notes, 144A(b) | | 6.000 | | | 06/15/21 | | | | 10,615 | | | | 10,365,123 | |
Brightstar Corp., | | | | | | | | | | | | | | |
Gtd. Notes, 144A
(original cost $7,537,919; purchased 11/08/12 -
04/10/15)(c)(d) | | 9.500 | | | 12/01/16 | | | | 7,105 | | | | 7,176,050 | |
Sr. Unsec’d. Notes, 144A
(original cost $6,013,728; purchased 07/26/13 -
12/18/13)(c)(d) | | 7.250 | | | 08/01/18 | | | | 5,625 | | | | 5,920,312 | |
CommScope Holding Co., Inc., Sr. Unsec’d. Notes, PIK,
144A(b) | | 6.625 | | | 06/01/20 | | | | 9,540 | | | | 9,909,675 | |
See Notes to Financial Statements.
| | | | |
| Prudential Short Duration High Yield Income Fund | | | 21 | |
Portfolio of Investments
as of August 31, 2015 continued
| | | | | | | | | | | | | | |
| Description | | Interest
Rate | | Maturity
Date | | | Principal
Amount (000)# | | | Value (Note 1) | |
CORPORATE BONDS (Continued) | |
| | | | |
Technology (cont’d.) | | | | | | | | | | | | | | |
CommScope, Inc., Sr. Sec’d. Notes, 144A(b) | | 4.375 % | | | 06/15/20 | | | | 7,455 | | | $ | 7,520,231 | |
CoreLogic, Inc., Gtd. Notes | | 7.250 | | | 06/01/21 | | | | 5,941 | | | | 6,223,197 | |
First Data Corp., Gtd. Notes | | 12.625 | | | 01/15/21 | | | | 26,240 | | | | 30,143,200 | |
Freescale Semiconductor, Inc.,
Sr. Sec’d. Notes, 144A | | 5.000 | | | 05/15/21 | | | | 3,447 | | | | 3,472,853 | |
Sr. Sec’d. Notes, 144A | | 6.000 | | | 01/15/22 | | | | 15,110 | | | | 15,789,950 | |
Igloo Holdings Corp., Sr. Unsec’d. Notes, PIK, 144A | | 8.250 | | | 12/15/17 | | | | 2,400 | | | | 2,409,000 | |
Infor US, Inc., Sr. Sec’d. Notes, 144A
(original cost $717,750; purchased 08/11/15)(c)(d) | | 5.750 | | | 08/15/20 | | | | 725 | | | | 726,813 | |
Interactive Data Corp., Gtd. Notes, 144A(b) | | 5.875 | | | 04/15/19 | | | | 11,170 | | | | 11,295,662 | |
Jabil Circuit, inc.,
Sr. Unsec’d. Notes | | 7.750 | | | 07/15/16 | | | | 150 | | | | 156,000 | |
Sr. Unsec’d. Notes | | 8.250 | | | 03/15/18 | | | | 2,300 | | | | 2,584,970 | |
NXP BV/NXP Funding LLC (Netherlands), Gtd. Notes,
144A(b) | | 4.125 | | | 06/15/20 | | | | 1,310 | | | | 1,311,638 | |
Sophia LP/Sophia Finance, Inc., Gtd. Notes, 144A(b) | | 9.750 | | | 01/15/19 | | | | 9,905 | | | | 10,585,969 | |
SunGard Data Systems, Inc.,
Gtd. Notes | | 6.625 | | | 11/01/19 | | | | 4,013 | | | | 4,163,488 | |
Gtd. Notes | | 7.625 | | | 11/15/20 | | | | 5,413 | | | | 5,670,117 | |
| | | | | | | | | | | | | | |
| | | | | | | | | | | | | 164,810,048 | |
| | | | |
Telecommunications 6.3% | | | | | | | | | | | | | | |
CenturyLink, Inc.,
Sr. Unsec’d. Notes, Series R(b) | | 5.150 | | | 06/15/17 | | | | 849 | | | | 870,225 | |
Sr. Unsec’d. Notes, Series N(b) | | 6.000 | | | 04/01/17 | | | | 850 | | | | 886,125 | |
Sr. Unsec’d. Notes, Series Q | | 6.150 | | | 09/15/19 | | | | 738 | | | | 773,055 | |
Clearwire Communications LLC/Clearwire Finance, Inc., Sr. Sec’d. Notes, 144A | | 14.750 | | | 12/01/16 | | | | 2,000 | | | | 2,280,000 | |
Eileme 2 AB (Poland),
Sr. Sec’d. Notes, RegS | | 11.750 | | | 01/31/20 | | | EUR | 300 | | | | 367,783 | |
Sr. Sec’d. Notes, 144A | | 11.625 | | | 01/31/20 | | | | 6,750 | | | | 7,382,812 | |
Frontier Communications Corp., Sr. Unsec’d. Notes | | 8.125 | | | 10/01/18 | | | | 1,150 | | | | 1,242,000 | |
See Notes to Financial Statements.
| | | | | | | | | | | | | | |
| Description | | Interest
Rate | | Maturity
Date | | | Principal
Amount (000)# | | | Value (Note 1) | |
CORPORATE BONDS (Continued) | |
| | | | |
Telecommunications (cont’d.) | | | | | | | | | | | | | | |
Level 3 Financing, Inc.,
Gtd. Notes | | 3.914 % (a) | | | 01/15/18 | | | | 1,585 | | | $ | 1,596,888 | |
Gtd. Notes(b) | | 7.000 | | | 06/01/20 | | | | 10,054 | | | | 10,581,835 | |
Gtd. Notes | | 8.625 | | | 07/15/20 | | | | 9,687 | | | | 10,263,376 | |
Sprint Capital Corp., Gtd. Notes(b) | | 6.900 | | | 05/01/19 | | | | 550 | | | | 557,563 | |
Sprint Communications, Inc.,
Gtd. Notes, 144A | | 9.000 | | | 11/15/18 | | | | 9,715 | | | | 10,820,081 | |
Sr. Unsec’d. Notes | | 6.000 | | | 12/01/16 | | | | 1,427 | | | | 1,459,108 | |
Sr. Unsec’d. Notes(b) | | 8.375 | | | 08/15/17 | | | | 12,517 | | | | 13,236,727 | |
Sr. Unsec’d. Notes(b) | | 9.125 | | | 03/01/17 | | | | 400 | | | | 426,000 | |
T-Mobile USA, Inc., | | | | | | | | | | | | | | |
Gtd. Notes(b) | | 6.542 | | | 04/28/20 | | | | 2,475 | | | | 2,580,188 | |
Gtd. Notes(b) | | 6.625 | | | 11/15/20 | | | | 1,000 | | | | 1,035,000 | |
TBG Global Pte Ltd. (Indonesia), Gtd. Notes, RegS | | 4.625 | | | 04/03/18 | | | | 400 | | | | 394,000 | |
Telecom Italia Capital SA (Italy), Gtd. Notes | | 6.999 | | | 06/04/18 | | | | 3,470 | | | | 3,790,975 | |
Vimpel Communications Via VIP Finance Ireland Ltd. OJSC (Russia), Sr. Unsec’d. Notes, 144A | | 9.125 | | | 04/30/18 | | | | 1,000 | | | | 1,060,952 | |
Wind Acquisition Finance SA (Italy), Sr. Sec’d. Notes, 144A | | 3.981(a) | | | 07/15/20 | | | EUR | 2,000 | | | | 2,241,598 | |
Windstream Services LLC, | | | | | | | | | | | | | | |
Gtd. Notes(b) | | 7.750 | | | 10/15/20 | | | | 3,000 | | | | 2,670,000 | |
Gtd. Notes(b) | | 7.875 | | | 11/01/17 | | | | 5,422 | | | | 5,665,990 | |
Zayo Group LLC/Zayo Capita), Inc., Gtd. Notes | | 10.125 | | | 07/01/20 | | | | 846 | | | | 930,600 | |
| | | | | | | | | | | | | | |
| | | | | | | | | | | | | 83,112,881 | |
| | | | |
Transportation 0.6% | | | | | | | | | | | | | | |
XPO Logistics, Inc., Sr. Unsec’d. Notes, 144A(b) | | 7.875 | | | 09/01/19 | | | | 7,075 | | | | 7,499,500 | |
| | | | | | | | | | | | | | |
TOTAL CORPORATE BONDS
(cost $1,304,254,437) | | | | | | | | | | | | | 1,269,179,105 | |
| | | | | | | | | | | | | | |
| | | | |
FOREIGN AGENCIES 0.2% | | | | | | | | | | | | | | |
Petrobras Global Finance BV (Brazil), | | | | | | | | | | | | | | |
Gtd. Notes | | 2.000 | | | 05/20/16 | | | | 1,650 | | | | 1,623,649 | |
Gtd. Notes | | 3.875 | | | 01/27/16 | | | | 1,153 | | | | 1,152,389 | |
| | | | | | | | | | | | | | |
TOTAL FOREIGN AGENCIES
(cost $2,746,521) | | | | | | | | | | | | | 2,776,038 | |
| | | | | | | | | | | | | | |
TOTAL LONG-TERM INVESTMENTS
(cost $1,342,919,686) | | | | | | | | | | | | | 1,303,810,296 | |
| | | | | | | | | | | | | | |
See Notes to Financial Statements.
| | | | |
| Prudential Short Duration High Yield Income Fund | | | 23 | |
Portfolio of Investments
as of August 31, 2015 continued
| | | | | | | | | | | | |
| Description | | | | | | Shares | | | Value (Note 1) | |
SHORT-TERM INVESTMENT 15.2% | |
| | |
AFFILIATED MONEY MARKET MUTUAL FUND | | | | | | | | |
Prudential Investment Portfolios 2 - Prudential Core Taxable Money Market Fund
(cost $201,700,628; includes $199,908,146 of cash collateral for securities on loan) (Note 3)(e)(f) | | | 201,700,628 | | | $ | 201,700,628 | |
| | | | | | | | | | | | |
| | |
TOTAL INVESTMENTS 113.5%
(cost $1,544,620,314) (Note 5) | | | | | | | 1,505,510,924 | |
Liabilities in excess of other assets(g) (13.5)% | | | | | | | (178,987,081 | ) |
| | | | | | | | | | | | |
NET ASSETS 100.0% | | | | | | $ | 1,326,523,843 | |
| | | | | | | | | | | | |
The following abbreviations are used in the portfolio descriptions:
144A—Security was purchased pursuant to Rule 144A under the Securities Act of 1933 and may not be resold subject to that rule except to qualified institutional buyers. Unless otherwise noted, 144A securities are deemed to be liquid.
RegS—Regulation S. Security was purchased pursuant to Regulation S and may not be offered, sold or delivered within the United States or to, or for the account or benefit of, U.S. persons, except pursuant to an exemption from, or in a transaction not subject to, the registration requirements of the Securities Act of 1933.
MTN—Medium Term Note
PIK—Payment-in-Kind
EUR—Euro
GBP—British Pound
| # | Principal amount shown in U.S. dollars unless otherwise stated. |
| (a) | Variable rate instrument. The interest rate shown reflects the rate in effect at August 31, 2015. |
| (b) | All or a portion of security is on loan. The aggregate market value of such securities, including those sold and pending settlement, is $197,777,807; cash collateral of $199,908,146 (included in liabilities) was received with which the Fund purchased highly liquid short-term investments. In addition, as of August 31, 2015, $2,169,771 of cash collateral had been segregated to cover the securities lending requirements. Securities on loan are subject to contractual netting arrangements. |
| (c) | Indicates a security or securities that have been deemed illiquid (unaudited). |
| (d) | Indicates a restricted security; the aggregate original cost of the restricted securities is $93,725,564. The aggregate value of $91,599,950, is approximately 6.9% of net assets. |
| (e) | Prudential Investments LLC, the manager of the Fund, also serves as manager of the Prudential Investment Portfolios 2 - Prudential Core Taxable Money Market Fund. |
| (f) | Represents security, or a portion thereof, purchased with cash collateral received for securities on loan. |
| (g) | Includes net unrealized appreciation (depreciation) on the following derivative contracts held at reporting period end: |
See Notes to Financial Statements.
Forward foreign currency exchange contracts outstanding at August 31, 2015:
| | | | | | | | | | | | | | | | | | |
Purchase Contracts | | Counterparty | | Notional
Amount
(000) | | | Value at
Settlement
Date | | | Current
Value | | | Unrealized
Appreciation
(Depreciation) | |
British Pound, | | | | | | | | | | | | | | | | | | |
Expiring 09/02/15 | | JPMorgan Chase | | GBP | 417 | | | $ | 649,585 | | | $ | 639,332 | | | $ | (10,253 | ) |
Expiring 09/02/15 | | JPMorgan Chase | | GBP | 767 | | | | 1,203,690 | | | | 1,176,752 | | | | (26,938 | ) |
Expiring 09/02/15 | | Goldman Sachs & Co. | | GBP | 6,473 | | | | 10,054,941 | | | | 9,933,534 | | | | (121,407 | ) |
Euro, | | | | | | | | | | | | | | | | | | |
Expiring 09/02/15 | | UBS AG | | EUR | 1,485 | | | | 1,637,533 | | | | 1,666,060 | | | | 28,527 | |
Expiring 09/02/15 | | Goldman Sachs & Co. | | EUR | 17,182 | | | | 19,595,155 | | | | 19,280,649 | | | | (314,506 | ) |
| | | | | | | | | | | | | | | | | | |
| | | | | | | | $ | 33,140,904 | | | $ | 32,696,327 | | | $ | (444,577 | ) |
| | | | | | | | | | | | | | | | | | |
| | | | | | | | | | | | | | | | | | |
Sale Contracts | | Counterparty | | Notional
Amount
(000) | | | Value at
Settlement
Date | | | Current
Value | | | Unrealized
Appreciation
(Depreciation) | |
British Pound, | | | | | | | | | | | | | | | | | | |
Expiring 09/02/15 | | Goldman Sachs & Co. | | GBP | 7,657 | | | $ | 11,925,993 | | | $ | 11,749,618 | | | $ | 176,375 | |
Expiring 10/02/15 | | Goldman Sachs & Co. | | GBP | 6,473 | | | | 10,053,226 | | | | 9,931,898 | | | | 121,328 | |
Euro, | | | | | | | | | | | | | | | | | | |
Expiring 09/02/15 | | Goldman Sachs & Co. | | EUR | 18,667 | | | | 20,612,192 | | | | 20,946,709 | | | | (334,517 | ) |
Expiring 10/02/15 | | Goldman Sachs & Co. | | EUR | 17,182 | | | | 19,604,262 | | | | 19,289,741 | | | | 314,521 | |
| | | | | | | | | | | | | | | | | | |
| | | | | | | | $ | 62,195,673 | | | $ | 61,917,966 | | | $ | 277,707 | |
| | | | | | | | | | | | | | | | | | |
| | | | | | | | | | | | | | | | $ | (166,870 | ) |
| | | | | | | | | | | | | | | | | | |
Various inputs are used in determining the value of the Fund’s investments. These inputs are summarized in the three broad levels listed below.
Level 1—quoted prices generally in active markets for identical securities.
Level 2—quoted prices for similar securities, interest rates and yield curves, prepayment speeds, foreign currency exchange rates and other observable inputs.
Level 3—unobservable inputs for securities valued in accordance with Board approved fair valuation procedures.
See Notes to Financial Statements.
| | | | |
| Prudential Short Duration High Yield Income Fund | | | 25 | |
Portfolio of Investments
as of August 31, 2015 continued
The following is a summary of the inputs used as of August 31, 2015 in valuing such portfolio securities:
| | | | | | | | | | | | |
| | | Level 1 | | | Level 2 | | | Level 3 | |
Investments in Securities | | | | | | | | | | | | |
Bank Loans | | $ | — | | | $ | 31,855,153 | | | $ | — | |
Corporate Bonds | | | — | | | | 1,269,179,105 | | | | — | |
Foreign Agencies | | | — | | | | 2,776,038 | | | | — | |
Affiliated Money Market Mutual Fund | | | 201,700,628 | | | | — | | | | — | |
Other Financial Instruments* | | | | | | | | | | | | |
Forward Foreign Currency Exchange Contracts | | | — | | | | (166,870 | ) | | | — | |
| | | | | | | | | | | | |
Total | | $ | 201,700,628 | | | $ | 1,303,643,426 | | | $ | — | |
| | | | | | | | | | | | |
| * | Other financial instruments are derivative instruments not reflected in the Portfolio of Investments, such as futures, forwards and exchange-traded swap contracts, which are recorded at the unrealized appreciation/depreciation on the instrument, and over-the-counter swap contracts which are recorded at fair value. |
The industry classification of investments and liabilities in excess of other assets shown as a percentage of net assets as of August 31, 2015 were as follows (Unaudited):
| | | | |
Affiliated Money Market Mutual Fund (including 15.1% of collateral for securities on loan) | | | 15.2 | % |
Technology | | | 13.0 | |
Healthcare & Pharmaceutical | | | 11.9 | |
Building Materials & Construction | | | 8.8 | |
Cable & Satellite | | | 8.6 | |
Gaming | | | 7.4 | |
Telecommunications | | | 6.6 | |
Capital Goods | | | 5.5 | |
Food & Beverage | | | 4.6 | |
Metals | | | 4.6 | |
Chemicals | | | 4.1 | |
Packaging | | | 3.6 | |
Media & Entertainment | | | 3.4 | |
Electric | | | 3.2 | |
Automotive | | | 1.9 | |
Retailers | | | 1.7 | |
Airlines | | | 1.5 | % |
Consumer | | | 1.3 | |
Non-Captive Finance | | | 1.1 | |
Hotels, Restaurants & Leisure | | | 0.9 | |
Energy—Other | | | 0.9 | |
Aerospace & Defense | | | 0.7 | |
Pipelines & Other | | | 0.7 | |
Transportation | | | 0.6 | |
Foods | | | 0.5 | |
Paper | | | 0.5 | |
Real Estate Investment Trusts | | | 0.4 | |
Foreign Agencies | | | 0.2 | |
Capital Markets | | | 0.1 | |
| | | | |
| | | 113.5 | |
Liabilities in excess of other assets | | | (13.5 | ) |
| | | | |
| | | 100.0 | % |
| | | | |
The Fund invested in derivative instruments during the reporting period. The primary types of risk associated with these derivative instruments is foreign exchange risk.
See Notes to Financial Statements.
The effect of such derivative instruments on the Fund’s financial position and financial performance as reflected in the Statement of Assets and Liabilities and Statement of Operations is presented in the summary below.
Fair values of derivative instruments as of August 31, 2015 as presented in the Statement of Assets and Liabilities:
| | | | | | | | | | | | |
Derivatives not accounted
for as hedging instruments,
carried at fair value | | Asset Derivatives | | | Liability Derivatives | |
| | Balance
Sheet Location | | Fair
Value | | | Balance
Sheet Location | | Fair
Value | |
| Foreign exchange contracts | | Unrealized appreciation on forward foreign currency exchange contracts | | $ | 640,751 | | | Unrealized depreciation on forward foreign currency exchange contracts | | $ | 807,621 | |
| | | | | | | | | | | | |
The effects of derivative instruments on the Statement of Operations for the year ended August 31, 2015 are as follows:
| | | | | | | | |
Amount of Realized Gain or (Loss) on Derivatives Recognized in Income | |
Derivatives not accounted for as hedging
instruments, carried at fair value | | Forward Currency
Contracts* | | | Total | |
Foreign exchange contracts | | $ | 7,146,707 | | | $ | 7,146,707 | |
| | | | | | | | |
| * | Included in net realized gain (loss) on foreign currency transactions in the Statement of Operations. |
| | | | | | | | |
Change in Unrealized Appreciation or (Depreciation) on Derivatives Recognized in Income | |
Derivatives not accounted for as hedging
instruments, carried at fair value | | Forward Currency
Contracts* | | | Total | |
Foreign exchange contracts | | $ | (420,149 | ) | | $ | (420,149 | ) |
| | | | | | | | |
| * | Included in net change in unrealized appreciation (depreciation) on foreign currencies in the Statement of Operations. |
For the year ended August 31, 2015, the Fund’s average value at settlement date for forward foreign currency exchange contracts purchased was $33,970,304 and the average value at settlement date for forward currency contracts sold was $74,527,768.
See Notes to Financial Statements.
| | | | |
| Prudential Short Duration High Yield Income Fund | | | 27 | |
Portfolio of Investments
as of August 31, 2015 continued
Offsetting of over-the-counter (OTC) derivative assets and liabilities:
The Portfolio invested in OTC derivatives during the reporting period that are either offset in accordance with current requirements or are subject to enforceable master netting arrangements or similar agreements that permit offsetting. The information about offsetting and related netting arrangements for OTC derivatives, where the legal right to set-off exists, is presented in the summary below.
| | | | | | | | | | | | | | | | |
Counterparty | | Gross
Amounts of
Recognized
Assets(1) | | | Gross
Amounts
Available
for Offset | | | Collateral
Received(3) | | | Net
Amount | |
Goldman Sachs & Co. | | $ | 612,224 | | | $ | (612,224 | ) | | $ | — | | | $ | — | |
JPMorgan Chase | | | — | | | | — | | | | — | | | | — | |
UBS AG | | | 28,527 | | | | — | | | | — | | | | 28,527 | |
| | | | | | | | | | | | | | | | |
| | $ | 640,751 | | | | | | | | | | | | | |
| | | | | | | | | | | | | | | | |
| | | | |
Counterparty | | Gross
Amounts of
Recognized
Liabilities(2) | | | Gross
Amounts
Available
for Offset | | | Collateral
Pledged(3) | | | Net
Amount | |
Goldman Sachs & Co. | | $ | (770,430 | ) | | $ | 612,224 | | | $ | 500,000 | | | $ | — | |
JPMorgan Chase | | | (37,191 | ) | | | — | | | | — | | | | (37,191 | ) |
UBS AG | | | — | | | | — | | | | — | | | | — | |
| | | | | | | | | | | | | | | | |
| | $ | (807,621 | ) | | | | | | | | | | | | |
| | | | | | | | | | | | | | | | |
| (1) | Includes unrealized appreciation on swaps and forwards, premiums paid on swap agreements and market value of purchased options. |
| (2) | Includes unrealized depreciation on swaps and forwards, premiums received on swap agreements and market value of written options. |
| (3) | Amounts shown reflect actual collateral received or pledged by the Portfolio. Such amounts are applied up to 100% of the Portfolio’s OTC derivative exposure by counterparty. |
See Notes to Financial Statements.
PRUDENTIAL INVESTMENTS»MUTUAL FUNDS
FINANCIAL STATEMENTS
ANNUAL REPORT · AUGUST 31, 2015
Prudential Short Duration High Yield Income Fund
Statement of Assets & Liabilities
as of August 31, 2015
| | | | |
Assets | | | | |
Investments at value, including securities on loan of $197,777,807: | | | | |
Unaffiliated investments (cost $1,342,919,686) | | $ | 1,303,810,296 | |
Affiliated investments (cost $201,700,628) | | | 201,700,628 | |
Dividends and interest receivable | | | 24,059,882 | |
Receivable for Fund shares sold | | | 4,351,022 | |
Deposit with affiliated securities lending agent | | | 2,169,771 | |
Receivable for investments sold | | | 2,053,292 | |
Unrealized appreciation on forward foreign currency exchange contracts | | | 640,751 | |
Deposit with counterparty | | | 500,000 | |
| | | | |
Total assets | | | 1,539,285,642 | |
| | | | |
| |
Liabilities | | | | |
Payable to broker for collateral for securities on loan | | | 202,077,917 | |
Payable for Fund shares reacquired | | | 5,147,351 | |
Payable to custodian | | | 2,053,315 | |
Dividends payable | | | 1,148,364 | |
Unrealized depreciation on forward foreign currency exchange contracts | | | 807,621 | |
Management fee payable | | | 799,168 | |
Accrued expenses | | | 384,364 | |
Distribution fee payable | | | 324,404 | |
Affiliated transfer agent fee payable | | | 18,447 | |
Loan interest payable | | | 848 | |
| | | | |
Total liabilities | | | 212,761,799 | |
| | | | |
| |
Net Assets | | $ | 1,326,523,843 | |
| | | | |
| | | | | |
Net assets were comprised of: | | | | |
Common stock, at par | | $ | 1,439,777 | |
Paid-in capital in excess of par | | | 1,427,186,540 | |
| | | | |
| | | 1,428,626,317 | |
Undistributed net investment income | | | 3,402,928 | |
Accumulated net realized loss on investment and foreign currency transactions | | | (66,229,379 | ) |
Net unrealized depreciation on investments and foreign currencies | | | (39,276,023 | ) |
| | | | |
Net assets, August 31, 2015 | | $ | 1,326,523,843 | |
| | | | |
See Notes to Financial Statements.
| | | | |
Class A | | | | |
Net asset value and redemption price per share ($366,344,613 ÷ 39,764,259 shares of common stock issued and outstanding) | | $ | 9.21 | |
Maximum sales charge (3.25% of offering price) | | | 0.31 | |
| | | | |
Maximum offering price to public | | $ | 9.52 | |
| | | | |
| |
Class C | | | | |
Net asset value, offering price and redemption price per share
($286,998,519 ÷ 31,157,828 shares of common stock issued and outstanding) | | $ | 9.21 | |
| | | | |
| |
Class Q | | | | |
Net asset value, offering price and redemption price per share
($16,690,098 ÷ 1,810,934 shares of common stock issued and outstanding) | | $ | 9.22 | |
| | | | |
| |
Class Z | | | | |
Net asset value, offering price and redemption price per share
($656,490,613 ÷ 71,244,684 shares of common stock issued and outstanding) | | $ | 9.21 | |
| | | | |
See Notes to Financial Statements.
| | | | |
| Prudential Short Duration High Yield Income Fund | | | 31 | |
Statement of Operations
Year Ended August 31, 2015
| | | | |
Net Investment Income | | | | |
Income | | | | |
Interest income | | $ | 79,166,929 | |
Affiliated income from securities lending, net | | | 276,496 | |
Affiliated dividend income | | | 25,103 | |
| | | | |
Total income | | | 79,468,528 | |
| | | | |
| |
Expenses | | | | |
Management fee | | | 9,580,057 | |
Distribution fee—Class A | | | 1,053,652 | |
Distribution fee—Class C | | | 2,985,533 | |
Transfer agent’s fees and expenses (including affiliated expense of $98,100) | | | 1,283,000 | |
Registration fees | | | 296,000 | |
Custodian and accounting fees | | | 179,000 | |
Shareholders’ reports | | | 156,000 | |
Legal fees and expenses | | | 43,000 | |
Directors’ fees | | | 39,000 | |
Commitment fee on syndicated credit agreement | | | 36,000 | |
Audit fee | | | 34,000 | |
Loan interest expense | | | 25,172 | |
Insurance expenses | | | 18,000 | |
Miscellaneous | | | 19,934 | |
| | | | |
Total expenses | | | 15,748,348 | |
Less: Distribution fee waiver—CIass A | | | (100,222 | ) |
| | | | |
Net expenses | | | 15,648,126 | |
| | | | |
Net investment income | | | 63,820,402 | |
| | | | |
| |
Realized And Unrealized Gain (Loss) On Investments And Foreign Currency Transactions | | | | |
Net realized gain (loss) on: | | | | |
Investment transactions | | | (31,856,534 | ) |
Foreign currency transactions | | | 6,982,597 | |
| | | | |
| | | (24,873,937 | ) |
| | | | |
Net change in unrealized appreciation (depreciation) on: | | | | |
Investments | | | (30,680,236 | ) |
Foreign currencies | | | (753,994 | ) |
| | | | |
| | | (31,434,230 | ) |
| | | | |
Net loss on investment and foreign currency transactions | | | (56,308,167 | ) |
| | | | |
Net Increase In Net Assets Resulting From Operations | | $ | 7,512,235 | |
| | | | |
See Notes to Financial Statements.
Statement of Changes in Net Assets
| | | | | | | | |
| | | Year Ended August 31, | |
| | | 2015 | | | 2014 | |
Increase (Decrease) in Net Assets | | | | | | | | |
Operations | | | | | | | | |
Net investment income | | $ | 63,820,402 | | | $ | 48,729,239 | |
Net realized gain (loss) on investment and foreign currency transactions | | | (24,873,937 | ) | | | 17,825 | |
Net change in unrealized appreciation (depreciation) on investments and foreign currencies | | | (31,434,230 | ) | | | (4,145,701 | ) |
| | | | | | | | |
Net increase in net assets resulting from operations | | | 7,512,235 | | | | 44,601,363 | |
| | | | | | | | |
| | |
Dividends from net investment income (Note 1) | | | | | | | | |
Class A | | | (23,809,565 | ) | | | (21,391,956 | ) |
Class C | | | (16,414,851 | ) | | | (10,216,790 | ) |
Class Q | | | (849,991 | ) | | | — | |
Class Z | | | (43,993,700 | ) | | | (31,950,635 | ) |
| | | | | | | | |
| | | (85,068,107 | ) | | | (63,559,381 | ) |
| | | | | | | | |
| | |
Fund share transactions (Net of share conversions) (Note 6) | | | | | | | | |
Net proceeds from shares sold | | | 707,876,725 | | | | 1,447,219,625 | |
Net asset value of shares issued in reinvestment of dividends and distributions | | | 68,803,234 | | | | 50,216,652 | |
Cost of shares reacquired | | | (884,014,895 | ) | | | (397,795,277 | ) |
| | | | | | | | |
Net increase (decrease) in net assets from Fund share transactions | | | (107,334,936 | ) | | | 1,099,641,000 | |
| | | | | | | | |
Total increase (decrease) | | | (184,890,808 | ) | | | 1,080,682,982 | |
| | |
Net Assets: | | | | | | | | |
Beginning of year | | | 1,511,414,651 | | | | 430,731,669 | |
| | | | | | | | |
End of year(a) | | $ | 1,326,523,843 | | | $ | 1,511,414,651 | |
| | | | | | | | |
(a) Includes undistributed net investment income of: | | $ | 3,402,928 | | | $ | 614,159 | |
| | | | | | | | |
See Notes to Financial Statements.
| | | | |
| Prudential Short Duration High Yield Income Fund | | | 33 | |
Notes to Financial Statements
Prudential Investment Portfolios, Inc. 15 (the “Company”) is registered under the Investment Company Act of 1940, as amended, (the “1940 Act”) as a diversified, open-end management investment company. The Company consists of two funds: Prudential High Yield Fund and Prudential Short Duration High Yield Income Fund (the “Fund”). These financial statements relate to Prudential Short Duration High Yield Income Fund. The Fund’s investment objective is to provide a high level of current income.
Note 1. Accounting Policies
The Fund follows investment company accounting and reporting guidance of the Financial Accounting Standards Board (“FASB”) Accounting Standard Codification Topic 946 Financial Services-lnvestment Companies. The following accounting policies conform to U.S. generally accepted accounting principles. The Fund consistently follows such policies in the preparation of its financial statements.
Securities Valuation: The Fund holds securities and other assets that are fair valued at the close of each day the New York Stock Exchange (“NYSE”) is open for trading. Fair value is the price that would be received to sell an asset or paid to transfer a liability in an orderly transaction between market participants on the measurement date. The Board of Directors (the “Board”) has adopted Valuation Procedures for security valuation under which fair valuation responsibilities have been delegated to Prudential Investments LLC (“PI” or “Manager). Under the current Valuation Procedures, the established Valuation Committee is responsible for supervising the valuation of portfolio securities and other assets. The Valuation Procedures permit the Fund to utilize independent pricing vendor services, quotations from market makers, and alternative valuation methods when market quotations are either not readily available or not deemed representative of fair value. A record of the Valuation Committee’s actions is subject to the Board’s review, approval, and ratification at its next regularly-scheduled quarterly meeting.
Various inputs determine how the Fund’s investments are valued, all of which are categorized according to the three broad levels (Level 1, 2, or 3) detailed in the table following the Portfolio of Investments.
Common and preferred stocks, exchange-traded funds, and derivative instruments such as futures or options that are traded on a national securities exchange are valued at the last sale price as of the close of trading on the applicable exchange where the security
principally trades. Securities traded via NASDAQ are valued at the NASDAQ official closing price. To the extent these securities are valued at the last sale price or NASDAQ official closing price, they are classified as Level 1 in the fair value hierarchy.
In the event that no sale or official closing price on valuation date exists, these securities are generally valued at the mean between the last reported bid and ask prices, or at the last bid price in the absence of an ask price. These securities are classified as Level 2 in the fair value hierarchy.
Common and preferred stocks traded on foreign securities exchanges are valued using pricing vendor services that provide model prices derived using adjustment factors based on information such as local closing price, relevant general and sector indices, currency fluctuations, depositary receipts, and futures, as applicable. Securities valued using such model prices are classified as Level 2 in the fair value hierarchy. Such securities are valued using model prices to the extent that the valuation meets the established confidence level for each security. If the confidence level is not met or the vendor does not provide a model price, securities are valued in accordance with exchange-traded common and preferred stocks discussed above.
Participatory Notes (P-notes) are generally valued based upon the value of a related underlying security that trades actively in the market and are classified as Level 2 in the fair value hierarchy.
Investments in open-end, non-exchange-traded mutual funds are valued at their net asset values as of the close of the NYSE on the date of valuation. These securities are classified as Level 1 in the fair value hierarchy since they may be purchased or sold at their net asset values on the date of valuation.
Fixed income securities traded in the over-the-counter market are generally valued at prices provided by approved independent pricing vendors. The pricing vendors provide these prices after evaluating observable inputs including, but not limited to yield curves, yield spreads, credit ratings, deal terms, tranche level attributes, default rates, cash flows, prepayment speeds, broker/dealer quotations, and reported trades. Securities valued using such vendor prices are classified as Level 2 in the fair value hierarchy.
Over-the-counter derivative instruments are generally valued using pricing vendor services, which derive the valuation based on inputs such as underlying asset prices, indices, spreads, interest rates, and exchange rates. These instruments are categorized as Level 2 in the fair value hierarchy.
| | | | |
| Prudential Short Duration High Yield Income Fund | | | 35 | |
Notes to Financial Statements
continued
Centrally cleared swaps listed or traded on a multilateral or trade facility platform, such as a registered exchange, are generally valued at the daily settlement price determined by the respective exchange. These securities are classified as Level 2 in the fair value hierarchy, as the daily settlement price is not public.
Securities and other assets that cannot be priced according to the methods described above are valued based on pricing methodologies approved by the Board. In the event that unobservable inputs are used when determining such valuations, the securities will be classified as Level 3 in the fair value hierarchy.
When determining the fair value of securities, some of the factors influencing the valuation include: the nature of any restrictions on disposition of the securities; assessment of the general liquidity of the securities; the issuer’s financial condition and the markets in which it does business; the cost of the investment; the size of the holding and the capitalization of the issuer; the prices of any recent transactions or bids/offers for such securities or any comparable securities; any available analyst media or other reports or information deemed reliable by the investment adviser regarding the issuer or the markets or industry in which it operates. Using fair value to price securities may result in a value that is different from a security’s most recent closing price and from the price used by other mutual funds to calculate their net asset values.
Restricted and Illiquid Securities: Subject to the guidelines adopted by the Board, the Fund may invest up to 15% of its net assets in illiquid securities, including those which are restricted as to disposition under securities law (“restricted securities”). Restricted securities are valued pursuant to the valuation procedures noted above. Illiquid securities are those that, because of the absence of a readily available market or due to legal or contractual restrictions on resale, cannot be sold within seven days in the ordinary course of business at approximately the amount at which the Fund has valued the investment. Therefore, the Fund may find it difficult to sell illiquid securities at the time considered most advantageous by its Subadviser and may incur expenses that would not be incurred in the sale of securities that were freely marketable. Certain securities that would otherwise be considered illiquid because of legal restrictions on resale to the general public may be traded among qualified institutional buyers under Rule 144A of the Securities Act of 1933. These Rule 144A securities, as well as commercial paper that is sold in private placements under Section 4(2) of the Securities Act, may be deemed liquid by the Fund’s Subadviser
under the guidelines adopted by the Directors of the Fund. However, the liquidity of the Fund’s investments in Rule 144A securities could be impaired if trading does not develop or declines.
Foreign Currency Translation: The books and records of the Fund are maintained in U.S. dollars. Foreign currency amounts are translated into U.S. dollars on the following basis:
(i) market value of investment securities, other assets and liabilities—at the current rates of exchange.
(ii) purchases and sales of investment securities, income and expenses—at the rates of exchange prevailing on the respective dates of such transactions.
Although the net assets of the Fund are presented at the foreign exchange rates and market values at the close of the period, the Fund does not isolate that portion of the results of operations arising as a result of changes in the foreign exchange rates from the fluctuations arising from changes in the market prices of securities held at the end of the period. Similarly, the Fund does not isolate the effect of changes in foreign exchange rates from the fluctuations arising from changes in the market prices of securities sold during the period. Accordingly, realized foreign currency gains or losses are included in the reported net realized gains or losses on investment transactions.
Net realized gains or losses on foreign currency transactions represent net foreign exchange gains or losses from holdings of foreign currencies, forward currency contracts, disposition of foreign currencies, currency gains or losses realized between the trade and settlement dates on securities transactions, and the difference between the amounts of interest, dividends and foreign withholding taxes recorded on the Fund’s books and the U.S. dollar equivalent amounts actually received or paid. Net unrealized currency gains or losses from valuing foreign currency denominated assets and liabilities (other than investments) at period end exchange rates are reflected as a component of net unrealized appreciation (depreciation) on foreign currencies.
Cross Currency Exchange Contracts: A cross currency contract is a forward contract where a specified amount of one foreign currency will be exchanged for a specified amount of another foreign currency.
Concentration of Risk: The ability of debt securities issuers (other than those issued or guaranteed by the U.S. Government) held by the Fund to meet its obligations may be affected by the economic or political developments in a specific industry, region or country. Foreign security and currency transactions may involve certain considerations and risks not typically associated with those of U.S. companies as a result of, among
| | | | |
| Prudential Short Duration High Yield Income Fund | | | 37 | |
Notes to Financial Statements
continued
other factors, the possibility of political or economic instability or the level of governmental supervision and regulation of foreign securities markets.
Forward Currency Contracts: A forward currency contract is a commitment to purchase or sell a foreign currency at a future date at a negotiated forward rate between two parties. The Fund enters into forward currency contracts in order to hedge its exposure to changes in foreign currency exchange rates on its foreign portfolio holdings or specific receivables and payables denominated in a foreign currency. The contracts are valued daily at current exchange rates and any unrealized gain or loss is included in net unrealized appreciation or depreciation on foreign currencies. Gain or loss is realized on the settlement date of the contract equal to the difference between the settlement value of the original and negotiated forward contracts. This gain or loss, if any, is included in net realized gain (loss) on foreign currency transactions. Risks may arise upon entering into these contracts from the potential inability of the counterparties to meet the terms of their contracts. Forward currency contracts involve risks from currency exchange rate and credit risk in excess of the amounts reflected on the Statement of Assets and Liabilities. The Fund’s maximum risk of loss from counterparty credit risk is the net value of the cash flows to be received from the counterparty at the end of the contract’s life.
Swap Agreements: The Fund entered into credit default, interest rate, total return and other forms of swap agreements. A swap agreement is an agreement to exchange the return generated by one instrument for the return generated by another instrument. Swap agreements are negotiated in the over-the-counter market and may be executed either directly with counterparty (“OTC-Traded”) or through a central clearing facility, such as a registered commodities exchange (“Exchange-Traded”). Swap agreements are valued daily at current market value and any change in value is included in the net unrealized appreciation or depreciation on investments. Exchange-traded swaps pay or receive an amount, known as “variation margin”, based on daily changes in the valuation of a swap contract. Payments received or paid by the Fund are recorded as realized gains or losses upon termination or maturity of the swap. Risk of loss may exceed amounts recognized on the statements of assets and liabilities. Swap agreements outstanding at period end, if any, are listed on the Portfolio of Investments.
Credit Default Swaps: Credit default swaps (“CDS’’) involve one party (the protection buyer) making a stream of payments to another party (the protection seller) in exchange for the right to receive a specified payment in the event of a default or as a
result of a default (collectively a “credit event”) for the referenced entity (typically corporate issues or sovereign issues of an emerging country) on its obligation; or in the event of a write-down, principal shortfall, interest shortfall or default of all or part of the referenced entities comprising a credit index.
The Fund is subject to credit risk in the normal course of pursuing its investment objectives. The Fund entered into credit default swaps to provide a measure of protection against defaults or to take an active long or short position with respect to the likelihood of a particular issuer’s default or the reference entity’s credit soundness. CDS contracts generally trade based on a spread which represents the cost a protection buyer has to pay the protection seller. The protection buyer is said to be short the credit as the value of the contract rises the more the credit deteriorates. The value of the CDS contract increases for the protection buyer if the spread increases. The Fund’s maximum risk of loss from counterparty credit risk for purchased credit default swaps is the inability of the counterparty to honor the contract up to the notional value due to a credit event.
As a seller of protection on credit default swap agreements, the Fund generally receives an agreed upon payment from the buyer of protection throughout the term of the swap, provided no credit event occurs. As the seller, the Fund effectively increases its investment risk because, in addition to its total net assets, the Fund may be subject to investment exposure on the notional amount of the swap.
The maximum amount of the payment that the Fund, as a seller of protection, could be required to make under a credit default swap agreement would be equal to the notional amount of the underlying security or index contract as a result of a credit event. This potential amount will be partially offset by any recovery values of the respective referenced obligations, or net amounts received from the settlement of buy protection credit default swap agreements which the Fund entered for the same referenced entity or index. As a buyer of protection, the Fund generally receives an amount up to the notional value of the swap if a credit event occurs.
Implied credit spreads, represented in absolute terms, utilized in determining the market value of credit default swap agreements on corporate issues or sovereign issues of an emerging country as of period end are disclosed in the footnotes to the Portfolio of Investments, if applicable. These spreads serve as an indicator of the current status of the payment/performance risk and represent the likelihood of default risk for the credit derivative. The implied credit spread of a particular referenced entity reflects the cost of buying/selling protection and may include upfront payments required to enter into the agreement. For credit default swap agreements on asset-backed securities and credit indices, the quoted market prices and resulting values
| | | | |
| Prudential Short Duration High Yield Income Fund | | | 39 | |
Notes to Financial Statements
continued
serve as indicators of the current status of the payment/performance risk. Wider credit spreads and increasing market value in absolute terms, when compared to the notional amount of the swap, represent a deterioration of the referenced entity’s credit soundness and a greater likelihood of risk of default or other credit event occurring as defined under the terms of the agreement.
Master Netting Arrangements: The Fund is subject to various Master Agreements, or netting arrangements, with select counterparties. These are agreements which a sub-adviser may have negotiated and entered into on behalf of the Portfolio. A master netting arrangement between the Fund and the counterparty permits the Fund to offset amounts payable by the Fund to the same counterparty against amounts to be received; and by the receipt of collateral from the counterparty by the Fund to cover the Fund’s exposure to the counterparty. However, there is no assurance that such mitigating factors are easily enforceable. The right to set-off exists when all the conditions are met such that each of the parties owes the other a determinable amount, the reporting party has the right to set-off the amount owed with the amount owed by the other party, the reporting party intends to set-off, and the right of set-off is enforceable by law. During the reporting period, there were no instances where the right to set-off existed and management has not elected to offset.
The Fund is a party to ISDA (International Swaps and Derivatives Association, Inc.) Master Agreements with certain counterparties that govern over-the-counter derivative and foreign exchange contracts entered into from time to time. The Master Agreements may contain provisions regarding, among other things, the parties’ general obligations, representations, agreements, collateral requirements, events of default and early termination. With respect to certain counterparties, in accordance with the terms of the Master Agreements, collateral posted to the Fund is held in a segregated account by the Fund’s custodian and with respect to those amounts which can be sold or re-pledged, are presented in the Portfolio of Investments. Collateral pledged by the Fund is segregated by the Fund’s custodian and identified in the Portfolio of Investments. Collateral can be in the form of cash or debt securities issued by the U.S. Government or related agencies or other securities as agreed to by the Fund and the applicable counterparty. Collateral requirements are determined based on the Fund’s net position with each counterparty. Termination events applicable to the Fund may occur upon a decline in the Fund’s net assets below a specified threshold over a certain period of time. Termination events applicable to counterparties may occur upon a decline in the counterparty’s long-term and short-term credit ratings below a specified level. In each
case, upon occurrence, the other party may elect to terminate early and cause settlement of all derivative and foreign exchange contracts outstanding, including the payment of any losses and costs resulting from such early termination, as reasonably determined by the terminating party. Any decision by one or more of the Fund’s counterparties to elect early termination could impact the Fund’s future derivative activity.
In addition to each instrument’s primary underlying risk exposure (e.g. interest rate, credit, equity or foreign exchanged, etc.), swap agreements involve, to varying degrees, elements of credit, market and documentation risk. Such risks involve the possibility that no liquid market for these agreements will exist, the counterparty to the agreement may default on its obligation to perform or disagree on the contractual terms of the agreement, and changes in net interest rates will be unfavorable. In connection with these agreements, securities in the portfolio may be identified or received as collateral from the counterparty in accordance with the terms of the respective swap agreements to provide or receive assets of value and to serve as recourse in the event of default or bankruptcy/insolvency of either party. Such over-the-counter derivative agreements include conditions which, when materialized, give the counterparty the right to cause an early termination of the transactions under those agreements. Any election by the counterparty for early termination of the contract(s) may impact the amounts reported on financial statements.
As of August 31, 2015, the Fund has not met conditions under such agreements, which give the counterparty the right to call for an early termination.
Forward currency contracts, written options, short sales, swaps and financial futures contracts involve elements of both market and credit risk in excess of the amounts reflected on the Statement of Assets and Liabilities. Such risks may be mitigated by engaging in master netting arrangements.
Payment in Kind Securities: Certain fixed income Portfolios may invest in open market or receive pursuant to debt restructuring, securities that pay in kind (PIK) the interest due on such debt instruments. The PIK interest, computed at the contractual rate specified, is added to the existing principal balance of the debt when issued bonds have same terms as the bond or recorded as a separate bond when terms are different from the existing debt, and is recorded as interest income. The interest rate on PIK debt is paid out over time.
Securities Lending: The Fund may lend its portfolio securities to banks and broker-dealers. The loans are secured by collateral at least equal to the market value of the securities loaned. Collateral pledged by each borrower is invested in a highly liquid short-term money market fund and is marked to market daily, based on the day’s
| | | | |
| Prudential Short Duration High Yield Income Fund | | | 41 | |
Notes to Financial Statements
continued
market value, such that the value of the collateral exceeds the value of the loaned securities. Loans are subject to termination at the option of the borrower or the Fund. Upon termination of the loan, the borrower will return to the Fund securities identical to the loaned securities. Should the borrower of the securities fail financially, the Fund has the right to repurchase the securities using the collateral in the open market. The Fund recognizes income, net of any rebate and securities lending agent fees, for lending its securities, and any interest on the investment of cash received as collateral. The Fund also continues to receive interest and dividends or amounts equivalent thereto, on the securities loaned and recognizes any unrealized gain or loss in the market price of the securities loaned that may occur during the term of the loan.
Loan Participations: The Fund may invest in loan participations, another type of restricted security. When the Fund purchases a loan participation, the Fund typically enters into a contractual relationship with the lender or third party selling such participations (“Selling Participant”), but not the borrower. As a result, the Fund assumes the credit risk of the borrower, the Selling Participant and any other persons interpositioned between the Fund and the borrower. The Fund may not directly benefit from the collateral supporting the senior loan in which it has purchased the loan participation.
Securities Transactions and Net Investment Income: Securities transactions are recorded on the trade date. Realized gains or losses from investment and currency transactions are calculated on the identified cost basis. Dividend income is recorded on the ex-dividend date. Interest income, including amortization of premium and accretion of discount on debt securities, as required, is recorded on the accrual basis. Expenses are recorded on the accrual basis, which may require the use of certain estimates by management that may differ from actual.
Net investment income or loss (other than distribution fees, which are charged directly to the respective class and transfer agency fees specific to Class Q shares which are charged to that share class) and unrealized and realized gains or losses are allocated daily to each class of shares based upon the relative proportion of adjusted net assets of each class at the beginning of the day.
Dividends and Distributions: The Fund declares daily and pays dividends of net investment income monthly and makes distributions of net realized capital and currency gains, if any, annually. Dividends and distributions to shareholders, which
are determined in accordance with federal income tax regulations and which may differ from generally accepted accounting principles, are recorded on the ex-dividend date. Permanent book/tax differences relating to income and gains are reclassified amongst undistributed net investment income, accumulated net realized gain or loss and paid-in capital in excess of par, as appropriate.
Taxes: For federal income tax purposes, it is the Fund’s policy to continue to meet the requirements of the Internal Revenue Code applicable to regulated investment companies and to distribute all of its taxable net income and capital gains, if any, to its shareholders. Therefore, no federal income tax provision is required.
Estimates: The preparation of the financial statements requires management to make estimates and assumptions that affect the reported amounts and disclosures in the financial statements. Actual results could differ from those estimates.
Note 2. Agreements
The Fund has a management agreement with PI. Pursuant to this agreement, PI has responsibility for all investment advisory services and supervises the subadvisor’s performance of such services. PI has entered into a subadvisory agreement with Prudential Investment Management, Inc. (“PIM”). The subadvisory agreement provides that PIM will furnish investment advisory services in connection with the management of the Fund. In connection therewith, PIM is obligated to keep certain books and records of the Fund. PI pays for the services of PIM, the cost of compensation of officers of the Fund, occupancy and certain clerical and bookkeeping costs of the Fund. The Fund bears all other costs and expenses.
The management fee paid to PI is accrued daily and payable monthly at an annual rate of .70% of the Fund’s average daily net assets up to $2 billion and .675% of the average daily net assets in excess of $2 billion. Prior to July 1, 2014, the management fee paid to PI was accrued daily and payable monthly at an annual rate of .70% of the Fund’s average daily net assets.
PI contractually agreed through December 31, 2014 to limit net annual Fund operating expenses (excluding distribution and service (12b-1) fees, extraordinary and certain other expenses, including taxes, interest and brokerage commissions) of each class of shares to .90% of the Fund’s average daily net assets. Effective January 1, 2015, this contractual expense limit was terminated.
The Fund has a distribution agreement with Prudential Investment Management Services LLC (“PIMS”), which acts as the distributor of the Class A, Class C, Class Q
| | | | |
| Prudential Short Duration High Yield Income Fund | | | 43 | |
Notes to Financial Statements
continued
and Class Z shares of the Fund. The Fund compensates PIMS for distributing and servicing the Fund’s Class A and Class C shares, pursuant to plans of distribution (the “Distribution Plans”), regardless of expenses actually incurred by PIMS. The distribution fees are accrued daily and payable monthly. No distribution or service fees are paid to PIMS as distributor of the Class Q and Class Z shares of the Fund.
Pursuant to the Distribution Plans, the Fund compensates PIMS for distribution related activities at an annual rate of up to .30% and 1% of the average daily net assets of the Class A and C shares, respectively. PIMS contractually agreed to limit such fees to .25% of the average daily net assets of the Class A shares through March 8, 2015. Effective March 9, 2015, the Class A contractual distribution and service (12b-1) fees were reduced from .30% to .25% of the average daily net assets and the .05% contractual 12b-1 fee waiver was terminated.
PIMS has advised the Fund that it has received $725,257 in front-end sales charges resulting from sales of Class A shares, during the year ended August 31, 2015. From these fees, PIMS paid such sales charges to affiliated broker-dealers, which in turn paid commissions to salespersons and incurred other distribution costs.
PIMS has advised the Fund that for the year ended August 31, 2015, it received $16,715 and $89,530 in contingent deferred sales charges imposed upon redemptions by certain Class A and Class C shareholders, respectively.
PI, PIMS and PIM are indirect, wholly-owned subsidiaries of Prudential Financial, Inc. (“Prudential”).
Note 3. Other Transactions with Affiliates
Prudential Mutual Fund Services LLC (“PMFS”), an affiliate of PI and an indirect, wholly-owned subsidiary of Prudential, serves as the Fund’s transfer agent. Transfer agent’s fees and expenses on the Statement of Operations include certain out-of-pocket expenses paid to non-affiliates, where applicable.
Prudential Investment Management, Inc. (“PIM”), an indirect, wholly-owned subsidiary of Prudential, is the Fund’s securities lending agent. Earnings from securities lending are disclosed on the Statement of Operations as “Affiliated income from securities lending, net”. For the year ended August 31, 2015, PIM was compensated $83,485 for these services.
The Fund invests in the Prudential Core Taxable Money Market Fund (the “Core Funds”), a portfolio of the Prudential Investment Portfolios 2, registered under the 1940 Act and managed by PI. Earnings from the Core Fund is disclosed on the Statement of Operations as “Affiliated dividend income”.
Note 4. Portfolio Securities
Purchases and sales of investment securities, other than short-term investments, for the year ended August 31, 2015, aggregated $756,185,389 and $849,034,796, respectively.
Note 5. Distributions and Tax Information
Distributions to shareholders, which are determined in accordance with federal income tax regulations and which may differ from generally accepted accounting principles, are recorded on the ex-dividend date. In order to present undistributed net investment income, accumulated net realized loss on investment and foreign currency transactions and paid-in capital in excess of par on the Statement of Assets and Liabilities that more closely represent their tax character, certain adjustments have been made to undistributed net investment income and accumulated net realized loss on investment and foreign currency transactions. For the year ended August 31, 2015, the adjustments were to increase undistributed net investment income and increase accumulated net realized loss on investment and foreign currency transactions by $24,036,474 due to differences in the treatment for book and tax purposes of premium amortization, certain transactions involving foreign securities and currencies and paydown gains/losses. Net investment income, net realized gain (loss) on investment and foreign currency transactions and net assets were not affected by this change.
For the years ended August 31, 2015 and August 31, 2014, the tax character of dividends paid by the Fund were $85,068,107 and $63,559,381 of ordinary income, respectively.
As of August 31, 2015, the accumulated undistributed earnings on a tax basis was $4,388,262 of ordinary income. This differs from the amount shown on the Statement of Assets and Liabilities primarily due to cumulative timing differences between financial and tax reporting.
| | | | |
| Prudential Short Duration High Yield Income Fund | | | 45 | |
Notes to Financial Statements
continued
The United States federal income tax basis of the Fund’s investments and the net unrealized depreciation as of August 31, 2015 were as follows:
| | | | | | | | | | |
Tax Basis | | Appreciation | | Depreciation | | Net Unrealized Depreciation | | Other Cost
Basis
Adjustments | | Total Net
Unrealized
Depreciation |
| $1,565,643,254 | | $3,430,098 | | $(63,562,428) | | $(60,132,330) | | $237 | | $(60,132,093) |
The difference between book and tax basis is primarily attributable to deferred losses on wash sales and differences in the treatment of premium amortization for book and tax purposes. The other cost basis adjustments are primarily attributable to appreciation (depreciation) of foreign currencies and mark-to-market of receivables and payables.
For federal income tax purposes, the Fund had a capital loss carryforward as of August 31, 2015 of approximately $9,527,000 which can be carried forward for an unlimited period. No capital gains distributions are expected to be paid to shareholders until net gains have been realized in excess of such losses.
The Fund elected to treat post-October capital losses of approximately $35,679,000 as having been incurred in the following fiscal year (August 31, 2016).
Management has analyzed the Fund’s tax positions taken on federal, state and local income tax returns for all open tax years and has concluded that no provision for income tax is required in the Fund’s financial statements for the current reporting period. The Fund’s federal, state and local income and federal excise tax returns for tax years for which the applicable statutes of limitations have not expired are subject to examination by the Internal Revenue Service and state departments of revenue.
Note 6. Capital
The Fund offers Class A, Class C, Class Q and Class Z shares. Class A shares are sold with a front-end sales charge of up to 3.25%. Investors who purchase $1 million or more of Class A shares and redeem those shares within 12 months of purchase are subject to a contingent deferred sales charge (“CDSC”) of 1%, but are not subject to an initial sales charge. The Class A CDSC is waived for purchases by certain retirement or benefit plans. Class C shares sold within 12 months of purchase are subject to a CDSC of 1%. A special exchange privilege is also available for
shareholders who qualified to purchase Class A shares at net asset value. Class Q and Class Z shares are not subject to any sales or redemption charges and are available only to a limited group of investors.
Under certain circumstances, an exchange may be made from specified share classes of the Fund to one or more other share classes of the Fund as presented in the table of transactions in shares of beneficial interest.
The Fund is authorized to issue 1.1 billion shares of common stock, $.01 par value per share, divided into four classes, designated Class A, Class C, Class Q and Class Z common stock. Of the authorized shares of common stock of the Fund, 225 million shares are designated for Class A common stock, 175 million shares are designated for Class C common stock, 250 million shares are designated for Class Q common stock and 450 million shares are designated for Class Z common stock.
At August 31, 2015, Prudential Financial, Inc. through its affiliates owned 1,102 Class Q shares of the Fund.
Transactions in shares of common stock were as follows:
| | | | | | | | |
Class A | | Shares | | | Amount | |
Year ended August 31, 2015: | | | | | | | | |
Shares sold | | | 18,993,279 | | | $ | 179,576,725 | |
Shares issued in reinvestment of dividends and distributions | | | 1,980,302 | | | | 18,676,378 | |
Shares reacquired | | | (22,297,696 | ) | | | (210,456,748 | ) |
| | | | | | | | |
Net increase (decrease) in shares outstanding before conversion | | | (1,324,115 | ) | | | (12,203,645 | ) |
Shares issued upon conversion from other share class(es) | | | 368,039 | | | | 3,479,142 | |
Shares reacquired upon conversion into other share class(es) | | | (1,840,221 | ) | | | (17,585,823 | ) |
| | | | | | | | |
Net increase (decrease) in shares outstanding | | | (2,796,297 | ) | | $ | (26,310,326 | ) |
| | | | | | | | |
Year ended August 31, 2014: | | | | | | | | |
Shares sold | | | 44,909,690 | | | $ | 442,805,761 | |
Shares issued in reinvestment of dividends and distributions | | | 1,716,198 | | | | 16,873,406 | |
Shares reacquired | | | (12,187,878 | ) | | | (119,858,992 | ) |
| | | | | | | | |
Net increase (decrease) in shares outstanding before conversion | | | 34,438,010 | | | | 339,820,175 | |
Shares issued upon conversion from other share class(es) | | | 137,202 | | | | 1,349,818 | |
Shares reacquired upon conversion into other share class(es) | | | (9,747,349 | ) | | | (95,374,816 | ) |
| | | | | | | | |
Net increase (decrease) in shares outstanding | | | 24,827,863 | | | $ | 245,795,177 | |
| | | | | | | | |
| | | | |
| Prudential Short Duration High Yield Income Fund | | | 47 | |
Notes to Financial Statements
continued
| | | | | | | | |
Class C | | Shares | | | Amount | |
Year ended August 31, 2015: | | | | | | | | |
Shares sold | | | 10,141,711 | | | $ | 95,921,687 | |
Shares issued in reinvestment of dividends and distributions | | | 1,381,553 | | | | 13,025,422 | |
Shares reacquired | | | (11,351,594 | ) | | | (107,095,423 | ) |
| | | | | | | | |
Net increase (decrease) in shares outstanding before conversion | | | 171,670 | | | | 1,851,686 | |
Shares reacquired upon conversion into other share class(es) | | | (365,355 | ) | | | (3,449,149 | ) |
| | | | | | | | |
Net increase (decrease) in shares outstanding | | | (193,685 | ) | | $ | (1,597,463 | ) |
| | | | | | | | |
Year ended August 31, 2014: | | | | | | | | |
Shares sold | | | 26,159,905 | | | $ | 257,703,956 | |
Shares issued in reinvestment of dividends and distributions | | | 804,337 | | | | 7,901,528 | |
Shares reacquired | | | (3,265,955 | ) | | | (32,083,918 | ) |
| | | | | | | | |
Net increase (decrease) in shares outstanding before conversion | | | 23,698,287 | | | | 233,521,566 | |
Shares reacquired upon conversion into other share class(es) | | | (63,069 | ) | | | (620,550 | ) |
| | | | | | | | |
Net increase (decrease) in shares outstanding | | | 23,635,218 | | | $ | 232,901,016 | |
| | | | | | | | |
Class Q | | | | | | |
Period* ended August 31, 2015: | | | | | | | | |
Shares sold | | | 2,380,380 | | | $ | 22,434,988 | |
Shares issued in reinvestment of dividends and distributions | | | 93,124 | | | | 875,633 | |
Shares reacquired | | | (1,248,412 | ) | | | (11,714,200 | ) |
| | | | | | | | |
Net increase (decrease) in shares outstanding before conversion | | | 1,225,092 | | | | 11,596,421 | |
Shares issued upon conversion from other share class(es) | | | 585,842 | | | | 5,618,230 | |
| | | | | | | | |
Net increase (decrease) in shares outstanding | | | 1,810,934 | | | $ | 17,214,651 | |
| | | | | | | | |
Class Z | | | | | | |
Year ended August 31, 2015: | | | | | | | | |
Shares sold | | | 43,434,849 | | | $ | 409,943,325 | |
Shares issued in reinvestment of dividends and distributions | | | 3,840,463 | | | | 36,225,801 | |
Shares reacquired | | | (58,749,440 | ) | | | (554,748,524 | ) |
| | | | | | | | |
Net increase (decrease) in shares outstanding before conversion | | | (11,474,128 | ) | | | (108,579,398 | ) |
Shares issued upon conversion from other share class(es) | | | 2,187,341 | | | | 20,870,393 | |
Shares reacquired upon conversion into other share class(es) | | | (933,495 | ) | | | (8,932,793 | ) |
| | | | | | | | |
Net increase (decrease) in shares outstanding | | | (10,220,282 | ) | | $ | (96,641,798 | ) |
| | | | | | | | |
Year ended August 31, 2014: | | | | | | | | |
Shares sold | | | 75,768,728 | | | $ | 746,709,908 | |
Shares issued in reinvestment of dividends and distributions | | | 2,589,965 | | | | 25,441,718 | |
Shares reacquired | | | (25,106,458 | ) | | | (245,852,367 | ) |
| | | | | | | | |
Net increase (decrease) in shares outstanding before conversion | | | 53,252,235 | | | | 526,299,259 | |
Shares issued upon conversion from other share class(es) | | | 9,798,372 | | | | 95,899,088 | |
Shares reacquired upon conversion into other share class(es) | | | (127,292 | ) | | | (1,253,540 | ) |
| | | | | | | | |
Net increase (decrease) in shares outstanding | | | 62,923,315 | | | $ | 620,944,807 | |
| | | | | | | | |
| * | Commenced operations October 27, 2014. |
Note 7. Borrowings
The Fund, along with other affiliated registered investment companies (the “Funds”), is a party to a Syndicated Credit Agreement (“SCA”) with a group of banks. The purpose of the SCA is to provide an alternative source of temporary funding for capital share redemptions. The SCA provides for a commitment of $900 million for the period October 9, 2014 through October 8, 2015. The Funds pay an annualized commitment fee of .075% on the unused portion of the SCA. Interest on any borrowings under the SCA is paid at contracted market rates. Prior to October 9, 2014 the Funds had another SCA that provided a commitment of $900 million and the Funds paid an annualized commitment fee of .08% of the unused portion of the SCA. The commitment fee for the unused amount is accrued daily and paid quarterly.
Subsequent to the fiscal year end, the SCA has been renewed effective October 8, 2015, and will continue to provide a commitment of $900 million through October 6, 2016. Effective October 8, 2015, the Funds pay an annualized commitment fee of .11% of the unused portion of the SCA.
The Fund utilized the SCA during the year ended August 31, 2015. The Fund had an average outstanding balance of $10,162,794 for 63 days at an average interest rate of 1.42%. The maximum amount of loan outstanding during the period was $27,242,000. At August 31, 2015, the Fund did not have an outstanding loan amount.
Note 8. New Accounting Pronouncement
In May 2015, the FASB issued Accounting Standards Update (“ASU”) No. 2015-07 regarding “Disclosures for Investments in Certain Entities That Calculate Net Asset Value per Share”. The amendments in this update are effective for the Fund for fiscal years beginning after December 15, 2015, and interim periods within those fiscal years. ASU No. 2015-07 will eliminate the requirement to categorize investments in the fair value hierarchy if their fair value is measured at net asset value (“NAV”) per share (or its equivalent) using the practical expedient in the FASB’s fair value measurement guidance. Management has evaluated the implications of ASU No. 2015-07 and it has been determined that there is no impact on the financial statement disclosures.
| | | | |
| Prudential Short Duration High Yield Income Fund | | | 49 | |
Financial Highlights
| | | | | | | | | | | | | | | | |
| Class A Shares | | | |
| | | Year Ended
August 31,
2015 | | | | | Year Ended
August 31,
2014(b) | | | | | October 26,
2012(a)(b)
through
August 31,
2013 | |
| Per Share Operating Performance: | | | | | | | | | | | | | | | | |
| Net Asset Value, Beginning Of Period | | | $9.73 | | | | | | $9.79 | | | | | | $10.00 | |
| Income from investment operations: | | | | | | | | | | | | | | | | |
| Net investment income | | | .44 | | | | | | .45 | | | | | | .34 | |
| Net realized and unrealized gain (loss) on investment and foreign currency transactions | | | (.37 | ) | | | | | .09 | | | | | | (.09 | ) |
| Total from investment operations | | | .07 | | | | | | .54 | | | | | | .25 | |
| Less Dividends: | | | | | | | | | | | | | | | | |
| Dividends from net investment income | | | (.59 | ) | | | | | (.60 | ) | | | | | (.46 | ) |
| Net asset value, end of period | | | $9.21 | | | | | | $9.73 | | | | | | $9.79 | |
| Total Return(c): | | | .72% | | | | | | 5.55% | | | | | | 2.50% | |
| | | | | | | |
| Ratios/Supplemental Data: | | | | | | |
| Net assets, end of period (000) | | | $366,345 | | | | | | $413,957 | | | | | | $173,606 | |
| Average net assets (000) | | | $381,350 | | | | | | $354,627 | | | | | | $55,859 | |
| Ratios to average net assets(d): | | | | | | | | | | | | | | | | |
| Expenses after waivers and/or expense reimbursement(e) | | | 1.11% | | | | | | 1.09% | | | | | | 1.15% | (f) |
| Expenses before waivers and/or expense reimbursement(e) | | | 1.14% | | | | | | 1.14% | | | | | | 1.25% | (f) |
| Net investment income | | | 4.70% | | | | | | 4.63% | | | | | | 4.16% | (f) |
| Portfolio turnover rate | | | 56% | | | | | | 60% | | | | | | 30% | (g) |
(a) Commencement of operations.
(b) Calculated based on average shares outstanding during the period.
(c) Total return does not consider the effects of sales loads. Total return is calculated assuming a purchase of a share on the first day and a sale on the last day of each period reported and includes reinvestment of dividends and distributions. Total returns may reflect adjustments to conform to generally accepted accounting principles. Total returns for periods less than one full year are not annualized.
(d) Does not include expenses of the underlying portfolio in which the Fund invests.
(e) Effective March 9, 2015, the contractual distribution and service (12b-1) fees were reduced from .30% to .25% of the average daily net assets and the .05% contractual 12b-1 fee waiver was terminated.
(f) Annualized.
(g) Not annualized.
See Notes to Financial Statements.
| | | | | | | | | | | | | | | | |
| Class C Shares | | | |
| | | Year Ended
August 31,
2015 | | | | | Year Ended
August 31,
2014(b) | | | | | October 26,
2012(a)(b)
through
August 31,
2013 | |
| Per Share Operating Performance: | | | | | | | | | | | | | | | | |
| Net Asset Value, Beginning Of Period | | | $9.73 | | | | | | $9.79 | | | | | | $10.00 | |
| Income from investment operations: | | | | | | | | | | | | | | | | |
| Net investment income | | | .37 | | | | | | .38 | | | | | | .28 | |
| Net realized and unrealized gain (loss) on investment and foreign currency transactions | | | (.37 | ) | | | | | .08 | | | | | | (.10 | ) |
| Total from investment operations | | | - | | | | | | .46 | | | | | | .18 | |
| Less Dividends: | | | | | | | | | | | | | | | | |
| Dividends from net investment income | | | (.52 | ) | | | | | (.52 | ) | | | | | (.39 | ) |
| Net asset value, end of period | | | $9.21 | | | | | | $9.73 | | | | | | $9.79 | |
| Total Return(c): | | | (.02)% | | | | | | 4.77% | | | | | | 1.83% | |
| | | | |
| Ratios/Supplemental Data: | | | |
| Net assets, end of period (000) | | | $286,999 | | | | | | $304,897 | | | | | | $75,539 | |
| Average net assets (000) | | | $298,555 | | | | | | $194,085 | | | | | | $25,240 | |
| Ratios to average net assets(d): | | | | | | | | | | | | | | | | |
| Expenses after waivers and/or expense reimbursement | | | 1.86% | | | | | | 1.83% | | | | | | 1.90% | (e) |
| Expenses before waivers and/or expense reimbursement | | | 1.86% | | | | | | 1.83% | | | | | | 1.95% | (e) |
| Net investment income | | | 3.95% | | | | | | 3.86% | | | | | | 3.38% | (e) |
| Portfolio turnover rate | | | 56% | | | | | | 60% | | | | | | 30% | (f) |
(a) Commencement of operations.
(b) Calculated based on average shares outstanding during the period.
(c) Total return does not consider the effects of sales loads. Total return is calculated assuming a purchase of a share on the first day and a sale on the last day of each period reported and includes reinvestment of dividends and distributions. Total returns may reflect adjustments to conform to generally accepted accounting principles. Total returns for periods less than one full year are not annualized.
(d) Does not include expenses of the underlying portfolio in which the Fund invests.
(e) Annualized.
(f) Not annualized.
See Notes to Financial Statements.
| | | | |
| Prudential Short Duration High Yield Income Fund | | | 51 | |
Financial Highlights
continued
| | | | |
| Class Q Shares | |
| | | October 27,
2014(a)
through
August 31,
2015 | |
| Per Share Operating Performance: | | | | |
| Net Asset Value, Beginning Of Period | | | $9.59 | |
| Income from investment operations: | | | | |
| Net investment income | | | .39 | |
| Net realized and unrealized gain (loss) on investment and foreign currency transactions | | | (.24 | ) |
| Total from investment operations | | | .15 | |
| Less Dividends: | | | | |
| Dividends from net investment income | | | (.52 | ) |
| Net asset value, end of period | | | $9.22 | |
| Total Return(b): | | | 1.65% | |
| |
| Ratios/Supplemental Data: | |
| Net assets, end of period (000) | | | $16,690 | |
| Average net assets (000) | | | $15,387 | |
| Ratios to average net assets(c): | | | | |
| Expenses after waivers and/or expense reimbursement | | | .77% | (d) |
| Expenses before waivers and/or expense reimbursement | | | .77% | (d) |
| Net investment income | | | 4.77% | (d) |
| Portfolio turnover rate | | | 56% | (e) |
(a) Commencement of operations.
(b) Total return does not consider the effects of sales loads. Total return is calculated assuming a purchase of a share on the first day and a sale on the last day of each period reported and includes reinvestment of dividends and distributions. Total returns may reflect adjustments to conform to generally accepted accounting principles. Total returns for periods less than one full year are not annualized.
(c) Does not include expenses of the underlying portfolio in which the Fund invests.
(d) Annualized.
(e) Not annualized.
See Notes to Financial Statements.
| | | | | | | | | | | | | | | | |
| Class Z Shares | | | |
| | | Year Ended
August 31,
2015 | | | | | Year Ended
August 31,
2014(b) | | | | | October 26,
2012(a)(b)
through
August 31,
2013 | |
| Per Share Operating Performance: | | | | | | | | | | | | | | | | |
| Net Asset Value, Beginning Of Period | | | $9.73 | | | | | | $9.79 | | | | | | $10.00 | |
| Income from investment operations: | | | | | | | | | | | | | | | | |
| Net investment income | | | .47 | | | | | | .48 | | | | | | .36 | |
| Net realized and unrealized gain (loss) on investment and foreign currency transactions | | | (.38 | ) | | | | | .08 | | | | | | (.09 | ) |
| Total from investment operations | | | .09 | | | | | | .56 | | | | | | .27 | |
| Less Dividends: | | | | | | | | | | | | | | | | |
| Dividends from net investment income | | | (.61 | ) | | | | | (.62 | ) | | | | | (.48 | ) |
| Net asset value, end of period | | | $9.21 | | | | | | $9.73 | | | | | | $9.79 | |
| Total Return(c): | | | .98% | | | | | | 5.82% | | | | | | 2.74% | |
| | | | |
| Ratios/Supplemental Data: | | | |
| Net assets, end of period (000) | | | $656,491 | | | | | | $792,560 | | | | | | $181,587 | |
| Average net assets (000) | | | $675,793 | | | | | | $507,805 | | | | | | $69,695 | |
| Ratios to average net assets(d): | | | | | | | | | | | | | | | | |
| Expenses after waivers and/or expense reimbursement | | | .86% | | | | | | .84% | | | | | | .90% | (e) |
| Expenses before waivers and/or expense reimbursement | | | .86% | | | | | | .84% | | | | | | 1.04% | (e) |
| Net investment income | | | 4.96% | | | | | | 4.89% | | | | | | 4.29% | (e) |
| Portfolio turnover rate | | | 56% | | | | | | 60% | | | | | | 30% | (f) |
(a) Commencement of operations.
(b) Calculated based on average shares outstanding during the period.
(c) Total return is calculated assuming a purchase of a share on the first day and a sale on the last day of each period reported and includes reinvestment of dividends and distributions. Total returns may reflect adjustments to conform to generally accepted accounting principles. Total returns for periods less than one full year are not annualized.
(d) Does not include expenses of the underlying portfolio in which the Fund invests.
(e) Annualized.
(f) Not annualized.
See Notes to Financial Statements.
| | | | |
| Prudential Short Duration High Yield Income Fund | | | 53 | |
Report of Independent Registered Public
Accounting Firm
The Board of Directors and Shareholders
Prudential Investment Portfolios 15, Inc.:
We have audited the accompanying statement of assets and liabilities of the Prudential Short Duration High Yield Income Fund, a portfolio of Prudential Investment Portfolios, Inc. 15 (hereafter referred to as the “Fund”), including the portfolio of investments, as of August 31, 2015, and the related statement of operations for the year then ended, the statements of changes in net assets for each of the years in the two-year period then ended, and the financial highlights for each of the years in the five year period then ended. These financial statements and financial highlights are the responsibility of the Fund’s management. Our responsibility is to express an opinion on these financial statements and financial highlights based on our audits.
We conducted our audits in accordance with the standards of the Public Company Accounting Oversight Board (United States). Those standards require that we plan and perform the audit to obtain reasonable assurance about whether the financial statements and financial highlights are free of material misstatement. An audit includes examining, on a test basis, evidence supporting the amounts and disclosures in the financial statements. Our procedures included confirmation of securities owned as of August 31, 2015, by correspondence with the custodian, transfer agent and brokers or by other appropriate auditing procedures when replies from brokers were not received. An audit also includes assessing the accounting principles used and significant estimates made by management, as well as evaluating the overall financial statement presentation. We believe that our audits provide a reasonable basis for our opinion.
In our opinion, the financial statements and financial highlights referred to above present fairly, in all material respects, the financial position of the Fund as of August 31, 2015, and the results of its operations for the year then ended, the changes in its net assets for each of the years in the two-year period then ended, and the financial highlights for each of the years in the five-year period then ended, in conformity with U.S. generally accepted accounting principles.

New York, New York
October 30, 2015
Tax Information
(Unaudited)
For the year ended August 31, 2015, the Fund reports the maximum amount allowable but not less than 78.92% as interest related dividends in accordance with Section 871(k)(1) and 881(e)(1) of the Internal Revenue Code.
Interest-related dividends do not include any distributions paid by a fund with respect to Fund tax years beginning after August 31, 2015. Consequently, this provision expires with respect to such distributions paid after the Fund’s fiscal year end.
In January 2016, you will be advised on IRS Form 1099-DIV or substitute 1099-DIV, as to the federal tax status of dividends received by you in calendar year 2015.
| | | | |
| Prudential Short Duration High Yield Income Fund | | | 55 | |
INFORMATION ABOUT BOARD MEMBERS AND OFFICERS
(Unaudited)
Information about Board Members and Officers of the Fund is set forth below. Board Members who are not deemed to be “interested persons” of the Fund, as defined in the 1940 Act, are referred to as “Independent Board Members.” Board Members who are deemed to be “interested persons” of the Fund are referred to as “Interested Board Members.” The Board Members are responsible for the overall supervision of the operations of the Fund and perform the various duties imposed on the directors of investment companies by the 1940 Act. The Board in turn elects the Officers, who are responsible for administering the day-to-day operations of the Fund.
| | | | |
| Independent Board Members(1) |
Name, Address, Age Position(s) Portfolios Overseen | | Principal Occupation(s) During Past Five Years | | Other Directorships Held During Past Five Years |
Ellen S. Alberding (57) Board Member Portfolios Overseen: 66 | | President and Board Member, The Joyce Foundation (charitable foundation) (since 2002); Vice Chair, City Colleges of Chicago (community college system) (since 2011); Trustee, Skills for America’s Future (national initiative to connect employers to community colleges) (since 2011); Trustee, National Park Foundation (charitable foundation for national park system) (since 2009); Trustee, Economic Club of Chicago (since 2009). | | None. |
Kevin J. Bannon (63) Board Member Portfolios Overseen: 66 | | Managing Director (April 2008-May 2015) and Chief Investment Officer (October 2008-November 2013) of Highmount Capital LLC (registered investment adviser); formerly Executive Vice President and Chief Investment Officer (April 1993-August 2007) of Bank of New York Company; President (May 2003-May 2007) of BNY Hamilton Family of Mutual Funds. | | Director of Urstadt Biddle Properties (equity real estate investment trust) (since September 2008). |
Linda W. Bynoe (63) Board Member Portfolios Overseen: 66 | | President and Chief Executive Officer (since March 1995) and formerly Chief Operating Officer (December 1989-February 1995) of Telemat Ltd. (management consulting); formerly Vice President (January 1985-June 1989) at Morgan Stanley & Co. (broker-dealer). | | Director of Simon Property Group, Inc. (retail real estate) (May 2003-May 2012); Director of Anixter International, Inc. (communication products distributor) (since January 2006); Director of Northern Trust Corporation (financial services) (since April 2006); Trustee of Equity Residential (residential real estate) (since December 2009). |
Prudential Short Duration High Yield Income Fund
| | | | |
| Independent Board Members(1) |
Name, Address, Age Position(s) Portfolios Overseen | | Principal Occupation(s) During Past Five Years | | Other Directorships Held During Past Five Years |
Keith F. Hartstein (59) Board Member Portfolios Overseen: 66 | | Retired; Member (since November 2014) of the Governing Council of the Independent Directors Council (organization of independent mutual fund directors); formerly President and Chief Executive Officer (2005-2012), Senior Vice President (2004-2005), Senior Vice President of Sales and Marketing (1997-2004), and various executive management positions (1990-1997), John Hancock Funds, LLC (asset management); Chairman, Investment Company Institute’s Sales Force Marketing Committee (2003-2008). | | None. |
Michael S. Hyland, CFA (70) Board Member Portfolios Overseen: 66 | | Retired (since February 2005); formerly Senior Managing Director (July 2001-February 2005) of Bear Stearns & Co, Inc.; Global Partner, INVESCO (1999-2001); Managing Director and President of Salomon Brothers Asset Management (1989-1999). | | None. |
Richard A. Redeker (72) Board Member & Independent Chair Portfolios Overseen: 66 | | Retired Mutual Fund Senior Executive (47 years); Management Consultant; Director, Mutual Fund Directors Forum (since 2014); Independent Directors Council (organization of independent mutual fund directors)-Executive Committee, Chair of Policy Steering Committee, Governing Council. | | None. |
Stephen G. Stoneburn (72) Board Member Portfolios Overseen: 66 | | Chairman (since July 2011), President and Chief Executive Officer (since June 1996) of Quadrant Media Corp. (publishing company); formerly President (June 1995-June 1996) of Argus Integrated Media, Inc.; Senior Vice President and Managing Director (January 1993-1995) of Cowles Business Media; Senior Vice President of Fairchild Publications, Inc. (1975-1989). | | None. |
Visit our website at www.prudentialfunds.com
| | | | |
| Interested Board Members(1) |
Name, Address, Age Position(s) Portfolios Overseen | | Principal Occupation(s) During Past Five Years | | Other Directorships Held During Past Five Years |
Stuart S. Parker (53) Board Member & President Portfolios Overseen: 66 | | President of Prudential Investments LLC (since January 2012); Executive Vice President of Prudential Investment Management Services LLC (since December 2012); Executive Vice President of Jennison Associates LLC and Head of Retail Distribution of Prudential Investments LLC (June 2005-December 2011). | | None. |
Scott E. Benjamin (42) Board Member & Vice President Portfolios Overseen: 66 | | Executive Vice President (since June 2009) of Prudential Investments LLC; Executive Vice President (June 2009-June 2012) and Vice President (since June 2012) of Prudential Investment Management Services LLC; Executive Vice President (since September 2009) of AST Investment Services, Inc.; Senior Vice President of Product Development and Marketing, Prudential Investments (since February 2006); Vice President of Product Development and Product Management, Prudential Investments (2003-2006). | | None. |
Grace C. Torres* (56) Board Member Portfolios Overseen: 64 | | Retired; formerly Treasurer and Principal Financial and Accounting Officer of the Prudential Investments Funds, Target Funds, Advanced Series Trust, Prudential Variable Contract Accounts and The Prudential Series Fund (1998-June 2014); Assistant Treasurer (March 1999-June 2014) and Senior Vice President (September 1999-June 2014) of Prudential Investments LLC; Assistant Treasurer (May 2003-June 2014) and Vice President (June 2005-June 2014) of AST Investment Services, Inc.; Senior Vice President and Assistant Treasurer (May 2003-June 2014) of Prudential Annuities Advisory Services, Inc. | | Director (since July 2015) of Sun Bancorp, Inc. N.A. |
| * | Note: Prior to her retirement in 2014, Ms. Torres was employed by Prudential Investments LLC. Due to her prior employment, she is considered to be an “interested person” under the 1940 Act. Ms. Torres is a non-management Interested Board Member. |
| (1) | The year that each individual joined PIP 15’s Board is as follows: |
Ellen S. Alberding, 2013; Kevin J. Bannon, 2008; Linda W. Bynoe, 2005; Keith F. Hartstein, 2013; Michael S. Hyland, 2008; Richard A. Redeker, 1995; Stephen G. Stoneburn, 2003; Grace C. Torres, 2014; Stuart S. Parker, Board Member and President since 2012; Scott E. Benjamin, Board Member since 2010 and Vice President since 2009.
Prudential Short Duration High Yield Income Fund
| | | | |
| Fund Officers(a) |
Name, Address and Age Position with Fund | | Principal Occupation(s) During Past Five Years | | Length of Service as Fund Officer |
Raymond A. O’Hara (60) Chief Legal Officer | | Vice President and Corporate Counsel (since July 2010) of Prudential Insurance Company of America (Prudential); Vice President (March 2011-Present) of Pruco Life Insurance Company and Pruco Life Insurance Company of New Jersey; Vice President and Corporate Counsel (March 2011-Present) of Prudential Annuities Life Assurance Corporation; Chief Legal Officer of Prudential Investments LLC (since June 2012); Chief Legal Officer of Prudential Mutual Fund Services LLC (since June 2012) and Corporate Counsel of AST Investment Services, Inc. (since June 2012); formerly Assistant Vice President and Corporate Counsel (September 2008-July 2010) of The Hartford Financial Services Group, Inc.; formerly Associate (September 1980-December 1987) and Partner (January 1988–August 2008) of Blazzard & Hasenauer, P.C. (formerly, Blazzard, Grodd & Hasenauer, P.C.). | | Since 2012 |
Chad A. Earnst (40) Chief Compliance Officer | | Chief Compliance Officer (September 2014-Present) of Prudential Investments LLC; Chief Compliance Officer (September 2014-Present) of the Prudential Investments Funds, Target Funds, Advanced Series Trust, The Prudential Series Fund, Prudential’s Gibraltar Fund, Inc., Prudential Global Short Duration High Yield Income Fund, Inc., Prudential Short Duration High Yield Fund, Inc. and Prudential Jennison MLP Income Fund, Inc.; formerly Assistant Director (March 2010-August 2014) of the Asset Management Unit, Division of Enforcement, US Securities & Exchange Commission; Assistant Regional Director (January 2010-August 2014), Branch Chief (June 2006–December 2009) and Senior Counsel (April 2003-May 2006) of the Miami Regional Office, Division of Enforcement, US Securities & Exchange Commission. | | Since 2014 |
Deborah A. Docs (57) Secretary | | Vice President and Corporate Counsel (since January 2001) of Prudential; Vice President (since December 1996) and Assistant Secretary (since March 1999) of Prudential Investments LLC; formerly Vice President and Assistant Secretary (May 2003-June 2005) of AST Investment Services, Inc. | | Since 2004 |
Jonathan D. Shain (57) Assistant Secretary | | Vice President and Corporate Counsel (since August 1998) of Prudential; Vice President and Assistant Secretary (since May 2001) of Prudential Investments LLC; Vice President and Assistant Secretary (since February 2001) of Prudential Mutual Fund Services LLC; formerly Vice President and Assistant Secretary (May 2003-June 2005) of AST Investment Services, Inc. | | Since 2005 |
Visit our website at www.prudentialfunds.com
| | | | |
| Fund Officers(a) |
Name, Address and Age Position with Fund | | Principal Occupation(s) During Past Five Years | | Length of Service as Fund Officer |
Claudia DiGiacomo (41) Assistant Secretary | | Vice President and Corporate Counsel (since January 2005) of Prudential; Vice President and Assistant Secretary of Prudential Investments LLC (since December 2005); Associate at Sidley Austin Brown & Wood LLP (1999-2004). | | Since 2005 |
Andrew R. French (52) Assistant Secretary | | Vice President and Corporate Counsel (since February 2010) of Prudential; formerly Director and Corporate Counsel (2006-2010) of Prudential; Vice President and Assistant Secretary (since January 2007) of Prudential Investments LLC; Vice President and Assistant Secretary (since January 2007) of Prudential Mutual Fund Services LLC. | | Since 2006 |
Amanda S. Ryan (37) Assistant Secretary | | Director and Corporate Counsel (since March 2012) of Prudential; Director and Assistant Secretary (since June 2012) of Prudential Investments LLC; Associate at Ropes & Gray LLP (2008-2012). | | Since 2012 |
Theresa C. Thompson (53) Deputy Chief Compliance Officer | | Vice President, Compliance, Prudential Investments LLC (since April 2004); and Director, Compliance, Prudential Investments LLC (2001-2004). | | Since 2008 |
Richard W. Kinville (47) Anti-Money Laundering Compliance Officer | | Vice President, Corporate Compliance, Anti-Money Laundering Unit (since January 2005) of Prudential; committee member of the American Council of Life Insurers Anti-Money Laundering and Critical Infrastructure Committee (since January 2007); formerly Investigator and Supervisor in the Special Investigations Unit for the New York Central Mutual Fire Insurance Company (August 1994-January 1999); Investigator in AXA Financial’s Internal Audit Department and Manager in AXA’s Anti-Money Laundering Office (January 1999-January 2005); first chair of the American Council of Life Insurers Anti-Money Laundering and Critical Infrastructure Committee (June 2007-December 2009). | | Since 2011 |
M. Sadiq Peshimam (51) Treasurer and Principal Financial and Accounting Officer | | Vice President (since 2005) of Prudential Investments LLC; formerly Assistant Treasurer of funds in the Prudential Mutual Fund Complex (2006-2014). | | Since 2006 |
Peter Parrella (57) Assistant Treasurer | | Vice President (since 2007) and Director (2004-2007) within Prudential Mutual Fund Administration; formerly Tax Manager at SSB Citi Fund Management LLC (1997-2004). | | Since 2007 |
Lana Lomuti (48) Assistant Treasurer | | Vice President (since 2007) and Director (2005-2007), within Prudential Mutual Fund Administration; formerly Assistant Treasurer (December 2007-February 2014) of The Greater China Fund, Inc. | | Since 2014 |
| Linda McMullin (54) Assistant Treasurer | | Vice President (since 2011) and Director (2008-2011) within Prudential Mutual Fund Administration. | | Since 2014 |
Kelly A. Coyne (47) Assistant Treasurer | | Director, Investment Operations of Prudential Mutual Fund Services LLC (since 2010). | | Since 2015 |
Prudential Short Duration High Yield Income Fund
| (a) | Excludes Mr. Parker and Mr. Benjamin, interested Board Members who also serve as President and Vice President, respectively. |
Explanatory Notes to Tables:
| • | | Board Members are deemed to be “Interested,” as defined in the 1940 Act, by reason of their affiliation with Prudential Investments LLC and/or an affiliate of Prudential Investments LLC. |
| • | | Unless otherwise noted, the address of all Board Members and Officers is c/o Prudential Investments LLC, 655 Broad Street, Newark, New Jersey 07102-4410. |
| • | | There is no set term of office for Board Members or Officers. The Board Members have adopted a retirement policy, which calls for the retirement of Board Members on December 31 of the year in which they reach the age of 75. |
| • | | “Other Directorships Held” includes only directorships of companies required to register or file reports with the SEC under the 1934 Act (that is, “public companies”) or other investment companies registered under the 1940 Act. |
| • | | “Portfolios Overseen” includes all investment companies managed by Prudential Investments LLC. The investment companies for which Prudential Investments LLC serves as manager include the Prudential Investments Mutual Funds, The Prudential Variable Contract Accounts, Target Mutual Funds, Prudential Short Duration High Yield Fund, Inc., Prudential Global Short Duration High Yield Fund, Inc., The Prudential Series Fund, Prudential’s Gibraltar Fund, Inc. and the Advanced Series Trust. |
Visit our website at www.prudentialfunds.com
Approval of Management and
Subadvisory Agreements
The Fund’s Board of Directors
The Board of Directors (the “Board”) of Prudential Short Duration High Yield Income Fund1 (the “Fund”) consists of ten individuals, seven of whom are not “interested persons” of the Fund, as defined in the Investment Company Act of 1940, as amended (the “1940 Act”) (the “Independent Directors”). The Board is responsible for the oversight of the Fund and its operations, and performs the various duties imposed on the directors of investment companies by the 1940 Act. The Independent Directors have retained independent legal counsel to assist them in connection with their duties. The Chair of the Board is an Independent Director. The Board has established three standing committees: the Audit Committee, the Nominating and Governance Committee, and the Investment Committee. Each committee is chaired by, and composed of, Independent Directors.
Annual Approval of the Fund’s Advisory Agreements
As required under the 1940 Act, the Board determines annually whether to renew the Fund’s management agreement with Prudential Investments LLC (“PI”) and the Fund’s subadvisory agreement with Prudential Investment Management, Inc. (“PIM”). In considering the renewal of the agreements, the Board, including all of the Independent Directors, met on June 9-11, 2015 and approved the renewal of the agreements through July 31, 2016, after concluding that the renewal of the agreements was in the best interests of the Fund and its shareholders.
In advance of the meetings, the Board requested and received materials relating to the agreements, and had the opportunity to ask questions and request further information in connection with its consideration. Among other things, the Board considered comparative fee information from PI and PIM. Also, the Board considered comparisons with other mutual funds in relevant Peer Universes and Peer Groups, as is further discussed below.
In approving the agreements, the Board, including the Independent Directors advised by independent legal counsel, considered the factors it deemed relevant, including the nature, quality and extent of services provided by PI and the subadviser, the performance of the Fund, the profitability of PI and its affiliates, expenses and fees, and the potential for economies of scale that may be shared with the Fund and its shareholders as the Fund’s assets grow. In their deliberations, the Directors did not identify any single factor which alone was responsible for the Board’s decision to approve the agreements with respect to the Fund. In connection with its deliberations, the Board considered information provided by PI throughout the year at regular Board
| 1 | Prudential Short Duration High Yield Income Fund is a series of Prudential Investment Portfolios, Inc. 15. |
Prudential Short Duration High Yield Income Fund
Approval of Management and
Subadvisory Agreements (continued)
meetings, presentations from portfolio managers and other information, as well as information furnished at or in advance of the meetings on June 9-11, 2015.
The Directors determined that the overall arrangements between the Fund and PI, which serves as the Fund’s investment manager pursuant to a management agreement, and between PI and PIM, which serves as the Fund’s subadviser pursuant to the terms of a subadvisory agreement with PI, are in the best interests of the Fund and its shareholders in light of the services performed, fees charged and such other matters as the Directors considered relevant in the exercise of their business judgment.
The material factors and conclusions that formed the basis for the Directors’ reaching their determinations to approve the continuance of the agreements are separately discussed below.
Nature, Quality and Extent of Services
The Board received and considered information regarding the nature, quality and extent of services provided to the Fund by PI and PIM. The Board considered the services provided by PI, including but not limited to the oversight of the subadviser for the Fund, as well as the provision of fund recordkeeping, compliance, and other services to the Fund. With respect to PI’s oversight of the subadviser, the Board noted that PI’s Strategic Investment Research Group (“SIRG”), which is a business unit of PI, is responsible for monitoring and reporting to PI’s senior management on the performance and operations of the subadviser. The Board also considered that PI pays the salaries of all of the officers and interested Directors of the Fund who are part of Fund management. The Board also considered the investment subadvisory services provided by PIM, as well as adherence to the Fund’s investment restrictions and compliance with applicable Fund policies and procedures.
The Board considered the qualifications, backgrounds and responsibilities of PI’s senior management responsible for the oversight of the Fund and PIM, and also considered the qualifications, backgrounds and responsibilities of PIM’s portfolio managers who are responsible for the day-to-day management of the Fund’s portfolio. The Board was provided with information pertaining to PI’s and PIM’s organizational structure, senior management, investment operations, and other relevant information pertaining to both PI and PIM. The Board also noted that it received favorable compliance reports from the Fund’s Chief Compliance Officer (“CCO”) as to both PI and PIM. The Board noted that PIM is affiliated with PI. The Board considered PI’s evaluation of the subadviser, as well as PI’s recommendation, based on its review of the subadviser, to renew the subadvisory agreement.
Visit our website at www.prudentialfunds.com
The Board concluded that it was satisfied with the nature, extent and quality of the investment management services provided by PI and the subadvisory services provided to the Fund by PIM, and that there was a reasonable basis on which to conclude that the Fund benefits from the services provided by PI and PIM under the management and subadvisory agreements.
Costs of Services and Profits Realized by PI
The Board was provided with information on the profitability of PI and its affiliates in serving as the Fund’s investment manager. The Board discussed with PI the methodology utilized in assembling the information regarding profitability and considered its reasonableness. The Board recognized that it is difficult to make comparisons of profitability from fund management contracts because comparative information is not generally publicly available and is affected by numerous factors, including the structure of the particular adviser, the types of funds it manages, its business mix, numerous assumptions regarding allocations and the adviser’s capital structure and cost of capital. The Board further noted that the subadviser is affiliated with PI and that its profitability is reflected in PI’s profitability report. Taking these factors into account, the Board concluded that the profitability of PI and its affiliates in relation to the services rendered was not unreasonable.
Economies of Scale
PI and the Board previously retained an outside business consulting firm to review management fee breakpoint usage and trends in management fees across the mutual fund industry. The consulting firm presented its analysis and conclusions as to the Funds’ management fee structures to the Board and PI. The Board and PI have discussed these conclusions extensively since that presentation.
The Board received and discussed information concerning economies of scale that PI may realize as the Fund’s assets grow beyond current levels. The Board noted that the management fee schedule for the Fund includes breakpoints, which have the effect of decreasing the fee rate as assets increase, but that at its current level of assets the Fund does not realize the effect of those rate reductions. The Board took note that the Fund’s fee structure currently results in benefits to Fund shareholders whether or not PI realizes any economies of scale. The Board noted that economies of scale can be shared with the Fund in other ways, including low management fees from inception, additional technological and personnel investments to enhance shareholder services, and maintaining existing expense structures in the face of a rising cost environment. The Board also considered PI’s assertion that it continually evaluates the management fee schedule of the Fund and the potential to share economies of scale through breakpoints or fee waivers as asset levels increase.
Prudential Short Duration High Yield Income Fund
Approval of Management and
Subadvisory Agreements (continued)
The Board recognized the inherent limitations of any analysis of economies of scale, stemming largely from the Board’s understanding that most of PI’s costs are not specific to individual funds, but rather are incurred across a variety of products and services.
Other Benefits to PI and PIM
The Board considered potential ancillary benefits that might be received by PI and PIM and their affiliates as a result of their relationship with the Fund. The Board concluded that potential benefits to be derived by PI included fees received by affiliates of PI for serving as the Fund’s securities lending agent, transfer agency fees received by the Fund’s transfer agent (which is affiliated with PI), as well as benefits to its reputation or other intangible benefits resulting from PI’s association with the Fund. The Board concluded that the potential benefits to be derived by PIM included the ability to use soft dollar credits, as well as the potential benefits consistent with those generally resulting from an increase in assets under management, specifically, potential access to additional research resources and benefits to its reputation. The Board concluded that the benefits derived by PI and PIM were consistent with the types of benefits generally derived by investment managers and subadvisers to mutual funds.
Performance of the Fund / Fees and Expenses
The Board considered certain additional specific factors and made related conclusions relating to the historical performance of the Fund for the one-year period ended December 31, 2014. The Board considered that the Fund commenced operations on October 26, 2012 and that longer-term performance was not yet available.
The Board also considered the Fund’s actual management fee, as well as the Fund’s net total expense ratio, for the fiscal year ended August 31, 2014. The Board considered the management fee for the Fund as compared to the management fee charged by PI to other funds and the fee charged by other advisers to comparable mutual funds in a Peer Group. The actual management fee represents the fee rate actually paid by Fund shareholders and includes any fee waivers or reimbursements. The net total expense ratio for the Fund represents the actual expense ratio incurred by Fund shareholders.
The mutual funds included in the Peer Universe (the Lipper High Yield Funds Performance Universe) and the Peer Group were objectively determined by Lipper Inc. (“Lipper”), an independent provider of mutual fund data. The comparisons placed the Fund in various quartiles, with the first quartile being the best 25% of the mutual funds (for performance, the best performing mutual funds and, for expenses, the lowest cost mutual funds).
Visit our website at www.prudentialfunds.com
The section below summarizes key factors considered by the Board and the Board’s conclusions regarding the Fund’s performance, fees and overall expenses. The table sets forth gross performance comparisons (which do not reflect the impact on performance of fund expenses, or any subsidies, expense caps or waivers that may be applicable) with the Peer Universe, actual management fees with the Peer Group (which reflect the impact of any subsidies or fee waivers), and net total expenses with the Peer Group, each of which were key factors considered by the Board.
| | | | | | | | |
| Performance | | 1 Year | | 3 Years | | 5 Years | | 10 Years |
| | | 3rd Quartile | | N/A | | N/A | | N/A |
| Actual Management Fees: 3rd Quartile |
| Net Total Expenses: 4th Quartile |
| | • | | The Board noted that Fund outperformed its benchmark index for the one-year period. |
| | • | | The Board considered PI’s explanation that the Fund’s underperformance in the Peer Universe relative to the other funds in the Peer Universe was primarily the result of the Fund’s focus on shorter duration bonds versus peer funds. |
| | • | | The Board noted that the Fund does not yet have a three-year performance record and that, therefore, the subadviser should have more time to develop that record. |
| | • | | The Board noted information provided by PI which indicated that the Fund’s net total expense ratio was only 11 basis points higher than the median of all funds included in the Peer Group. |
| | • | | The Board concluded that, in light of the above, it would be in the best interests of the Fund and its shareholders to renew the agreements to allow the subadviser to continue to develop a performance record. |
| | • | | The Board concluded that the management fees (including subadvisory fees) and total expenses were reasonable in light of the services provided. |
* * *
After full consideration of these factors, the Board concluded that approval of the agreements was in the best interests of the Fund and its shareholders.
Prudential Short Duration High Yield Income Fund
Approval of New Sub-Subadvisory Agreement
As required by the 1940 Act, at an in-person meeting of the Board of Trustees (the Board) held on March 3-5, 2015, the Board, including a majority of the Independent Trustees, considered and approved a proposed sub-subadvisory agreement (the “Sub-Subadvisory Agreement”) between PIM and Pramerica Investment Management Limited (PIML or the Sub-Subadviser), under which PIM may delegate subadvisory authority to PIML such that PIML may execute trades directly on behalf of the Fund. The Board noted that counsel to the Fund had issued an opinion that the delegation of subadvisory services by PIM to PIML with respect to the Fund would not constitute an assignment of the current subadvisory agreement between PI and PIM with respect to the Fund or a material amendment of the agreement, so that PIM and PIML could enter into the Sub-Subadvisory Agreement with respect to the Fund with Board approval but without shareholder approval being required under the 1940 Act.
In approving the Sub-Subadvisory Agreement, the Board, including the Independent Trustees advised by independent legal counsel, considered the factors it deemed relevant, including the nature, quality and extent of services to be provided to the Funds by the Sub-Subadviser; any relevant comparable performance information; the fees, if any, proposed to be paid by PIM to the Sub-Subadviser under the Sub-Subadvisory Agreement and the potential for economies of scale that may be shared with the Fund and its shareholders. In connection with its deliberations, the Board considered information provided by PI, the Subadviser and the Sub-Subadviser at or in advance of the meetings on March 3-5, 2015. In their deliberations, the Trustees did not identify any single factor which alone was responsible for the Board’s decision to approve the Sub-Subadvisory Agreement with respect to the Fund.
The Trustees determined that the overall arrangements between PI, the Subadviser and the Sub-Subadviser, which will serve as a sub-subadviser to the Fund pursuant to the terms of the Sub-Subadvisory Agreement, are in the best interests of the Fund and its shareholders in light of the services to be performed, the fees to be charged, if any, under the Sub-Subadvisory Agreement and such other matters as the Trustees considered relevant in the exercise of their business judgment.
The material factors and conclusions that formed the basis for the Trustees’ reaching their determinations to approve the Sub-Subadvisory Agreement with respect to the Fund are separately discussed below.
Nature, quality and extent of services
The Board noted that it had received and considered information regarding the nature and extent of services currently provided to the Fund by PIM under the current subadvisory agreement at the meetings on June 9-11, 2014. The Board also noted that
Visit our website at www.prudentialfunds.com
PIM proposed to formally delegate trading and limited management authority for the Fund to PIML so that PIML will be authorized to act on behalf of the Fund and conduct real-time trading in either the United States or the United Kingdom, where PIML is organized. The Board noted PI’s statement that the existing arrangements, which require all trades on behalf of the Fund to be routed through PIM personnel in the U.S., create delays that potentially disadvantage the Fund and its shareholders.
With respect to the quality of services, the Board considered, among other things, the background and experience of the PIML management team and compliance personnel. The Board met with representatives from PIM and PIML and reviewed the qualifications, backgrounds and responsibilities of the personnel who would be authorized to act on behalf of the Funds. The Board was also provided with information pertaining to the organizational structure, senior management, investment operations, and other relevant information pertaining to PIML. The Board noted that it received a favorable compliance report from the Fund’s Chief Compliance Officer (CCO) as to PIML.
The Board concluded that it was satisfied with the nature, extent and quality of the investment sub-subadvisory services anticipated to be provided to the Fund by PIML and that there was a reasonable basis on which to conclude that the Fund would benefit from the additional subadvisory services to be provided by PIML under the new Sub-Subadvisory Agreement. The Board noted PI’s statement that no member of the PIML portfolio management team would serve as a portfolio manager of the Fund.
Performance of the Fund
The Board noted that performance of other accounts managed by PIML was not a relevant factor for its consideration since PIML would not be responsible for managing Fund assets under the Sub-Subadvisory Agreement. The Board noted PI’s statements that PIML’s role would be limited to trading on behalf of the Fund and that PIM portfolio managers will oversee all transactions executed by PIML.
Investment Subadvisory Fee Rates
The Board noted that under the Sub-Subadvisory Agreement PIML will be paid a subadvisory fee, if any, by PIM, not the Fund or PI. The Board noted PI’s statement that the fees and expenses of the Fund and the fees paid by PI to PIM will not increase as a result of the Sub-Subadvisory Agreement.
Prudential Short Duration High Yield Income Fund
Approval of New Sub-Subadvisory Agreement
(continued)
Subadviser’s Profitability
The Board noted that any fee to be paid to PIML for sub-subadvisory services would be paid by PIM, not PI or the Fund. The Board further noted that PIML is affiliated with PIM and PI and, as a result, the Board will not separately consider PIML’s profitability since PIML’s profitability will be reflected in PI’s profitability report.
Economies of Scale
The Board noted that any fee to be paid to PIML for sub-subadvisory services would be paid by PIM, not PI or or the Fund. The Board noted that it would review economies of scale in connection with future annual reviews of advisory agreements.
Other Benefits to the Sub-Subadviser or its Affiliates from Serving as Sub-Subadviser
The Board considered potential “fall-out” or ancillary benefits that might be received by PIML and its affiliates as a result of their relationships with the Fund. The Board concluded that any potential benefits to be derived by PIML, which included potential access to additional research resources and benefits to its reputation, were consistent with the types of benefits generally derived by subadvisers to mutual funds.
* * *
After full consideration of these factors, the Board concluded that the approval of the Sub-Subadvisory Agreement was in the best interests of the Fund and its shareholders.
Visit our website at www.prudentialfunds.com
| | | | |
| n MAIL | | n TELEPHONE | | n WEBSITE |
655 Broad Street Newark, NJ 07102 | | (800) 225-1852 | | www.prudentialfunds.com |
|
| PROXY VOTING |
| The Board of Directors of the Fund has delegated to the Fund’s investment subadviser the responsibility for voting any proxies and maintaining proxy recordkeeping with respect to the Fund. A description of these proxy voting policies and procedures is available without charge, upon request, by calling (800) 225-1852. Information regarding how the Fund voted proxies relating to portfolio securities during the most recent 12-month period ended June 30 is available on the Fund’s website and on the Securities and Exchange Commission’s website. |
|
| DIRECTORS |
| Ellen S. Alberding • Kevin J. Bannon • Scott E. Benjamin • Linda W. Bynoe • Keith F. Hartstein • Michael S. Hyland • Stuart S. Parker • Richard A. Redeker • Stephen G. Stoneburn • Grace C. Torres |
|
| OFFICERS |
| Stuart S. Parker, President • Scott E. Benjamin, Vice President • M. Sadiq Peshimam, Treasurer and Principal Financial and Accounting Officer • Raymond A. O’Hara, Chief Legal Officer • Deborah A. Docs, Secretary • Chad A. Earnst, Chief Compliance Officer • Theresa C. Thompson, Deputy Chief Compliance Officer • Richard W. Kinville, Anti-Money Laundering Compliance Officer • Jonathan D. Shain, Assistant Secretary • Claudia DiGiacomo, Assistant Secretary • Amanda S. Ryan, Assistant Secretary • Andrew R. French, Assistant Secretary • Peter Parrella, Assistant Treasurer • Lana Lomuti, Assistant Treasurer • Linda McMullin, Assistant Treasurer • Kelly A. Coyne, Assistant Treasurer |
| | | | |
| MANAGER | | Prudential Investments LLC | | 655 Broad Street
Newark, NJ 07102 |
|
| INVESTMENT SUBADVISER | | Prudential Investment
Management, Inc. | | 655 Broad Street
Newark, NJ 07102 |
|
| DISTRIBUTOR | | Prudential Investment
Management Services LLC | | 655 Broad Street
Newark, NJ 07102 |
|
| CUSTODIAN | | The Bank of New York Mellon | | One Wall Street
New York, NY 10286 |
|
| TRANSFER AGENT | | Prudential Mutual Fund
Services LLC | | PO Box 9658
Providence, RI 02940 |
|
INDEPENDENT REGISTERED
PUBLIC ACCOUNTING FIRM | | KPMG LLP | | 345 Park Avenue
New York, NY 10154 |
|
| FUND COUNSEL | | Willkie Farr & Gallagher LLP | | 787 Seventh Avenue
New York, NY 10019 |
|
| An investor should consider the investment objectives, risks, charges, and expenses of the Fund carefully before investing. The prospectus and summary prospectus contain this and other information about the Fund. An investor may obtain a prospectus and summary prospectus by visiting our website at www.prudentialfunds.com or by calling (800) 225-1852. The prospectus and summary prospectus should be read carefully before investing. |
|
| E-DELIVERY |
| To receive your mutual fund documents online, go to www.prudentialfunds.com/edelivery and enroll. Instead of receiving printed documents by mail, you will receive notification via email when new materials are available. You can cancel your enrollment or change your email address at any time by visiting the website address above. |
|
| SHAREHOLDER COMMUNICATIONS WITH DIRECTORS |
| Shareholders can communicate directly with the Board of Directors by writing to the Chair of the Board, Prudential Short Duration High Yield Income Fund, Prudential Investments, Attn: Board of Directors, 655 Broad Street, Newark, NJ 07102. Shareholders can communicate directly with an individual Director by writing to the same address. Communications are not screened before being delivered to the addressee. |
|
| AVAILABILITY OF PORTFOLIO SCHEDULE |
| The Fund files its complete schedule of portfolio holdings with the Securities and Exchange Commission for the first and third quarters of each fiscal year on Form N-Q. The Fund’s Forms N-Q are available on the Commission’s website at www.sec.gov. The Fund’s Forms N-Q may also be reviewed and copied at the Commission’s Public Reference Room in Washington, D.C. Information on the operation and location of the Public Reference Room may be obtained by calling 1-800-SEC-0330. The Fund’s schedule of portfolio holdings is also available on the Fund’s website as of the end of each month. |
|
| The Fund’s Statement of Additional Information contains additional information about the Fund’s Directors and is available without charge, upon request, by calling (800) 225-1852. |
Mutual Funds:
| | | | |
| ARE NOT INSURED BY THE FDIC OR ANY FEDERAL GOVERNMENT AGENCY | | MAY LOSE VALUE | | ARE NOT A DEPOSIT OF OR GUARANTEED BY ANY BANK OR ANY BANK AFFILIATE |

PRUDENTIAL SHORT DURATION HIGH YIELD INCOME FUND
| | | | | | | | |
| SHARE CLASS | | A | | C | | Q | | Z |
| NASDAQ | | HYSAX | | HYSCX | | HYSQX | | HYSZX |
| CUSIP | | 74442J109 | | 74442J208 | | 74442J406 | | 74442J307 |
MF216E 0283770-00001-00
Item 2 – Code of Ethics — See Exhibit (a)
As of the end of the period covered by this report, the registrant has adopted a code of ethics (the “Section 406 Standards for Investment Companies – Ethical Standards for Principal Executive and Financial Officers”) that applies to the registrant’s Principal Executive Officer and Principal Financial Officer; the registrant’s Principal Financial Officer also serves as the Principal Accounting Officer.
The registrant hereby undertakes to provide any person, without charge, upon request, a copy of the code of ethics. To request a copy of the code of ethics, contact the registrant 800-225-1852, and ask for a copy of the Section 406 Standards for Investment Companies - Ethical Standards for Principal Executive and Financial Officers.
Item 3 – Audit Committee Financial Expert –
The registrant’s Board has determined that Mr. Kevin J. Bannon, member of the Board’s Audit Committee is an “audit committee financial expert,” and that he is “independent,” for purposes of this Item.
Item 4 – Principal Accountant Fees and Services –
(a) Audit Fees
For the fiscal years ended August 31, 2015 and August 31, 2014, KPMG LLP (“KPMG”), the Registrant’s principal accountant, billed the Registrant $67,600 and $67,600, respectively, for professional services rendered for the audit of the Registrant’s annual financial statements or services that are normally provided in connection with statutory and regulatory filings.
(b) Audit-Related Fees
For the fiscal years ended August 31, 2015 and August 31, 2014: none.
(c) Tax Fees
For the fiscal years ended August 31, 2015 and August 31, 2014: none.
(d) All Other Fees
For the fiscal years ended August 31, 2015 and August 31, 2014: none.
(e) (1) Audit Committee Pre-Approval Policies and Procedures
THE PRUDENTIAL MUTUAL FUNDS
AUDIT COMMITTEE POLICY
on
Pre-Approval of Services Provided by the Independent Accountants
The Audit Committee of each Prudential Mutual Fund is charged with the responsibility to monitor the independence of the Fund’s independent accountants. As part of this responsibility, the Audit Committee must pre-approve any independent accounting firm’s engagement to render audit and/or permissible non-audit services, as required by law. In evaluating a proposed engagement of the independent accountants, the Audit Committee will assess the effect that the engagement might reasonably be expected to have on the accountant’s independence. The Committee’s evaluation will be based on:
| | • | | a review of the nature of the professional services expected to be provided, |
| | • | | a review of the safeguards put into place by the accounting firm to safeguard independence, and |
| | • | | periodic meetings with the accounting firm. |
Policy for Audit and Non-Audit Services Provided to the Funds
On an annual basis, the scope of audits for each Fund, audit fees and expenses, and audit-related and non-audit services (and fees proposed in respect thereof) proposed to be performed by the Fund’s independent accountants will be presented by the Treasurer and the independent accountants to the Audit Committee for review and, as appropriate, approval prior to the initiation of such services. Such presentation shall be accompanied by confirmation by both the Treasurer and the independent accountants that the proposed services will not adversely affect the independence of the independent accountants. Proposed services shall be described in sufficient detail to enable the Audit Committee to assess the appropriateness of such services and fees, and the compatibility of the provision of such services with the auditor’s independence. The Committee shall receive periodic reports on the progress of the audit and other services which are approved by the Committee or by the Committee Chair pursuant to authority delegated in this Policy.
The categories of services enumerated under “Audit Services”, “Audit-related Services”, and “Tax Services” are intended to provide guidance to the Treasurer and the independent accountants as to those categories of services which the Committee believes are generally consistent with the independence of the independent accountants and which the Committee (or the Committee Chair) would expect upon the presentation of specific proposals to pre-approve. The enumerated categories are not intended as an exclusive list of audit, audit-related or tax services, which the Committee (or the Committee Chair) would consider for pre-approval.
Audit Services
The following categories of audit services are considered to be consistent with the role of the Fund’s independent accountants:
| | • | | Annual Fund financial statement audits |
| | • | | Seed audits (related to new product filings, as required) |
| | • | | SEC and regulatory filings and consents |
Audit-related Services
The following categories of audit-related services are considered to be consistent with the role of the Fund’s independent accountants:
| | • | | Accounting consultations |
| | • | | Fund merger support services |
| | • | | Agreed Upon Procedure Reports |
| | • | | Other Internal Control Reports |
Individual audit-related services that fall within one of these categories and are not presented to the Audit Committee as part of the annual pre-approval process will be subject to pre-approval by the Committee Chair (or any other Committee member on whom this responsibility has been delegated) so long as the estimated fee for those services does not exceed $30,000.
Tax Services
The following categories of tax services are considered to be consistent with the role of the Fund’s independent accountants:
| | • | | Tax compliance services related to the filing or amendment of the following: |
| | • | | Federal, state and local income tax compliance; and, |
| | • | | Sales and use tax compliance |
| | • | | Timely RIC qualification reviews |
| | • | | Tax distribution analysis and planning |
| | • | | Tax authority examination services |
| | • | | Tax appeals support services |
| | • | | Accounting methods studies |
| | • | | Fund merger support services |
| | • | | Tax consulting services and related projects |
Individual tax services that fall within one of these categories and are not presented to the Audit Committee as part of the annual pre-approval process will be subject to pre-approval by the Committee Chair (or any other Committee member on whom this responsibility has been delegated) so long as the estimated fee for those services does not exceed $30,000.
Other Non-audit Services
Certain non-audit services that the independent accountants are legally permitted to render will be subject to pre-approval by the Committee or by one or more Committee members to whom the Committee has delegated this authority and who will report to the full Committee any pre-approval decisions made pursuant to this Policy. Non-audit services presented for pre-approval pursuant to this paragraph will be accompanied by a confirmation from both the Treasurer and the independent accountants that the proposed services will not adversely affect the independence of the independent accountants.
Proscribed Services
The Fund’s independent accountants will not render services in the following categories of non-audit services:
| | • | | Bookkeeping or other services related to the accounting records or financial statements of the Fund |
| | • | | Financial information systems design and implementation |
| | • | | Appraisal or valuation services, fairness opinions, or contribution-in-kind reports |
| | • | | Internal audit outsourcing services |
| | • | | Management functions or human resources |
| | • | | Broker or dealer, investment adviser, or investment banking services |
| | • | | Legal services and expert services unrelated to the audit |
| | • | | Any other service that the Public Company Accounting Oversight Board determines, by regulation, is impermissible. |
Pre-approval of Non-Audit Services Provided to Other Entities Within the Prudential Fund Complex
Certain non-audit services provided to Prudential Investments LLC or any of its affiliates that also provide ongoing services to the Prudential Mutual Funds will be subject to pre-approval by the Audit Committee. The only non-audit services provided to these entities that will require pre-approval are those related directly to the operations and financial reporting of the Funds. Individual projects that are not presented to the Audit Committee as part of the annual pre-approval process will be subject to pre-approval by the Committee Chair (or any other Committee member on whom this responsibility has been delegated) so long as the estimated fee for those services does not exceed $30,000. Services presented for pre-approval pursuant to this paragraph will be accompanied by a confirmation from both the Treasurer and the independent accountants that the proposed services will not adversely affect the independence of the independent accountants.
Although the Audit Committee will not pre-approve all services provided to Prudential Investments LLC and its affiliates, the Committee will receive an annual report from the Fund’s independent accounting firm showing the aggregate fees for all services provided to Prudential Investments and its affiliates.
(e) (2) Percentage of services referred to in 4(b) – 4(d) that were approved by the audit committee –
For the fiscal years ended August 31, 2015 and August 31, 2014: none.
(f) Percentage of hours expended attributable to work performed by other than full time employees of principal accountant if greater than 50%.
The percentage of hours expended on the principal accountant’s engagement to audit the registrant’s financial statements for the most recent fiscal year that were attributed to work performed by persons other than the principal accountant’s full-time, permanent employees was 0%.
(g) Non-Audit Fees
The aggregate non-audit fees billed by KPMG for services rendered to the registrant’s investment adviser and any entity controlling, controlled by, or under common control with the investment adviser that provides ongoing services to the registrant for the fiscal years ended August 31, 2015 and August 31, 2014 was $0 and $0, respectively.
(h) Principal Accountant’s Independence
Not applicable as KPMG has not provided non-audit services to the registrant’s investment adviser and any entity controlling, controlled by, or under common control with the investment adviser that provides ongoing services to the registrant that were not pre-approved pursuant to Rule 2-01(c)(7)(ii) of Regulation S-X.
| | |
| Item 5 – | | Audit Committee of Listed Registrants – Not applicable. |
| |
| Item 6 – | | Schedule of Investments – The schedule is included as part of the report to shareholders filed under Item 1 of this Form. |
| |
| Item 7 – | | Disclosure of Proxy Voting Policies and Procedures for Closed-End Management Investment Companies – Not applicable. |
| |
| Item 8 – | | Portfolio Managers of Closed-End Management Investment Companies – Not applicable. |
| |
| Item 9 – | | Purchases of Equity Securities by Closed-End Management Investment Company and Affiliated Purchasers – Not applicable. |
| |
| Item 10 – | | Submission of Matters to a Vote of Security Holders – Not applicable. |
| |
| Item 11 – | | Controls and Procedures |
| | (a) | It is the conclusion of the registrant’s principal executive officer and principal financial officer that the effectiveness of the registrant’s current disclosure controls and procedures (such disclosure controls and procedures having been evaluated within 90 days of the date of this filing) provide reasonable assurance that the information required to be disclosed by the registrant has been recorded, processed, summarized and reported within the time period specified in the Commission’s rules and forms and that the information required to be disclosed by the registrant has been accumulated and communicated to the registrant’s principal executive officer and principal financial officer in order to allow timely decisions regarding required disclosure. |
| | (b) | There has been no significant change in the registrant’s internal control over financial reporting that occurred during the registrant’s most recent fiscal quarter of the period covered by this report that has materially affected, or is likely to materially affect, the registrant’s internal control over financial reporting. |
Item 12 – Exhibits
| | (a) | (1) Code of Ethics – Attached hereto as Exhibit EX-99.CODE-ETH |
| | (2) | Certifications pursuant to Section 302 of the Sarbanes-Oxley Act – Attached hereto as Exhibit EX-99.CERT. |
| | (3) | Any written solicitation to purchase securities under Rule 23c-1. – Not applicable. |
| | (b) | Certifications pursuant to Section 906 of the Sarbanes-Oxley Act – Attached hereto as Exhibit EX-99.906CERT. |
SIGNATURES
Pursuant to the requirements of the Securities Exchange Act of 1934 and the Investment Company Act of 1940, the registrant has duly caused this report to be signed on its behalf by the undersigned, thereunto duly authorized.
| | | | |
| Registrant: | | Prudential Investment Portfolios, Inc. 15 | | |
| | |
| By: | | /s/ Deborah A. Docs | | |
| | Deborah A. Docs | | |
| | Secretary | | |
| | |
| Date: | | October 30, 2015 | | |
|
| Pursuant to the requirements of the Securities Exchange Act of 1934 and the Investment Company Act of 1940, this report has been signed below by the following persons on behalf of the registrant and in the capacities and on the dates indicated. |
| | |
| By: | | /s/ Stuart S. Parker | | |
| | Stuart S. Parker | | |
| | President and Principal Executive Officer | | |
| | |
| Date: | | October 30, 2015 | | |
| | |
| By: | | /s/ M. Sadiq Peshimam | | |
| | M. Sadiq Peshimam | | |
| | Treasurer and Principal Financial and Accounting Officer | | |
| | |
| Date: | | October 30, 2015 | | |