UNITED STATES SECURITIES AND EXCHANGE COMMISSION
Washington, D.C. 20549
FORM N-CSR
CERTIFIED SHAREHOLDER REPORT OF REGISTERED MANAGEMENT INVESTMENT
COMPANIES
| Investment Company Act file number: 811-02071 |
Exact name of registrant as specified in charter:
Delaware Group® Income Funds
Address of principal executive offices:
2005 Market Street
Philadelphia, PA 19103
Name and address of agent for service:
David F. Connor, Esq.
2005 Market Street
Philadelphia, PA 19103
Registrant’s telephone number, including area code: (800) 523-1918
| Date of fiscal year end: July 31 |
| |
| Date of reporting period: July 31, 2010 |
Item 1. Reports to Stockholders

Annual report Delaware Core Bond Fund July 31, 2010 Fixed income mutual fund |
This annual report is for the information of Delaware Core Bond Fund shareholders, but it may be used with prospective investors when preceded or accompanied by a current prospectus for Delaware Core Bond Fund. The figures in the annual report for Delaware Core Bond Fund represent past results, which are not a guarantee of future results. The return and principal value of an investment in the Fund will fluctuate so that shares, when redeemed, may be worth more or less than their original cost. Current performance may be higher or lower than the performance data quoted.
You should consider the investment objectives, risks, charges, and expenses of the Fund carefully before investing. The Delaware Core Bond Fund prospectus contains this and other important information about the Fund. Prospectuses for all open-end funds in the Delaware Investments® Family of Funds are available from your financial advisor, online at www.delawareinvestments.com, or by phone at 800 523-1918. Please read the prospectus carefully before you invest or send money.
|
You can obtain shareholder reports and prospectuses online instead of in the mail.
Visit www.delawareinvestments.com/edelivery. |
Experience Delaware Investments
Delaware Investments is committed to the pursuit of consistently superior asset management and unparalleled client service. We believe in our investment processes, which seek to deliver consistent results, and in convenient services that help add value for our clients.
If you are interested in learning more about creating an investment plan, contact your financial advisor.
You can learn more about Delaware Investments or obtain a prospectus for Delaware Core Bond Fund at www.delawareinvestments.com.
Manage your investments online
- 24-hour access to your account information
- Obtain share prices
- Check your account balance and recent transactions
- Request statements or literature
- Make purchases and redemptions
Delaware Management Holdings, Inc., and its subsidiaries (collectively known by the marketing name of Delaware Investments) are wholly owned subsidiaries of Macquarie Group Limited, a global provider of banking, financial, advisory, investment and funds management services.
Investments in Delaware Core Bond Fund are not and will not be deposits with or liabilities of Macquarie Bank Limited ABN 46 008 583 542 and its holding companies, including their subsidiaries or related companies (Macquarie Group), and are subject to investment risk, including possible delays in repayment and loss of income and capital invested. No Macquarie Group company guarantees or will guarantee the performance of the Fund, the repayment of capital from the Fund, or any particular rate of return.
| Table of contents | |
| Portfolio management review | 1 |
| Performance summary | 4 |
| Disclosure of Fund expenses | 8 |
| Security type | 10 |
| Statement of net assets | 11 |
| Statements of operations | 26 |
| Statements of changes in net assets | 28 |
| Financial highlights | 30 |
| Notes to financial statements | 38 |
| Report of independent registered | |
| public accounting firm | 49 |
| Other Fund information | 50 |
| Board of trustees/directors and | |
| officers addendum | 52 |
| About the organization | 62 |
Unless otherwise noted, views expressed herein are current as of July 31, 2010, and are subject to change. Funds are not FDIC insured and are not guaranteed. It is possible to lose the principal amount invested.
Mutual fund advisory services provided by Delaware Management Company, a series of Delaware Management Business Trust, which is a registered investment advisor. Delaware Investments, a member of Macquarie Group, refers to Delaware Management Holdings, Inc. and its subsidiaries, including the Fund’s distributor, Delaware Distributors, L.P. Macquarie Group refers to Macquarie Group Limited and its subsidiaries and affiliates worldwide.
© 2010 Delaware Management Holdings, Inc.
All third-party trademarks cited are the property of their respective owners.
| Portfolio management review | |
| Delaware Core Bond Fund | Aug. 10, 2010 |
| | | 1-year return | | 9-month return |
| Delaware Core Bond Fund (Class A shares) | | +9.99% | | +5.89% |
| Barclays Capital U.S. Aggregate Index (Benchmark) | | +8.91% | | +6.15% |
Past performance does not guarantee future results.
For complete, annualized performance for Delaware Core Bond Fund, please see the table on page 4.
The performance of Class A shares excludes the applicable sales charge and reflects the reinvestment of all distributions. Index performance returns do not reflect any management fees, transaction costs, or expenses. Indices are unmanaged and one cannot invest directly in an index.
Delaware Core Bond Fund is the successor to The Intermediate Fixed Income Portfolio of the Delaware Pooled® Trust pursuant to a reorganization. Prior to the reorganization, the Fund had no investment operations. Accordingly, the performance information shown for Class A shares of the Fund includes historical information for The Intermediate Fixed Income Portfolio.
Fund performance
Delaware Core Bond Fund Class A shares returned +9.99% at net asset value and +5.09% at maximum offer price (both returns include distributions reinvested) for one year ended July 31, 2010. In the nine months since our last report to shareholders, the Fund’s Class A shares returned +5.89% at net asset value and +1.11% at maximum offer price (both returns include distributions reinvested). For the same periods, the Fund’s benchmark, the Barclays Capital U.S. Aggregate Index, advanced +8.91% and +6.15%, respectively. For complete annualized performance for Delaware Core Bond Fund, please see the table on page 4.
| It is important to note that, as economic conditions turned more volatile, we attempted to upgrade the quality of the Fund’s holdings within both the investment grade and high yield sectors. This decision proved generally beneficial, though our allocation to the high yield sector lost some of the gains it had generated earlier in the period. |
1
Portfolio management review
Delaware Core Bond Fund
A strong beginning, a shakier end
During the reporting period, the fixed income markets continued to normalize and corporations were generally able to refinance debt. Bond default rates dropped as a result, particularly in the high-yield sector, declining to between 5 and 6 percent from highs near 13 percent. They are expected to hover near 3 percent in 2011. (Source: Moody’s.)
Beginning in April 2010, investors seemed to turn their attention to what many economists believed were structural debt problems within certain euro zone governments — problems that could potentially create a drag on a nascent economic recovery across the developed world. The European Union, in conjunction with the International Monetary Fund, eventually backed a massive rescue fund for euro zone members, but not before investor sentiment turned sour. Greece bore the brunt of investor concern, as investors demanded upward of 1000 basis points (or 10 percentage points) of protection against default in the credit derivative swap market. Investors also demanded risk premiums from Portuguese, Italian, Irish, and Spanish government bonds.
More broadly, however, the debt concerns in Europe resulted in a global flight to quality that generated intense demand for Treasury securities. Though we began the fiscal period with the belief that rising Treasury rates could become a potential cause for concern, yields on 10-year Treasury securities declined significantly after peaking in April 2010. In turn, yields on non-Treasury spread product rose as investors navigated increasingly fragile economic conditions. (It’s important to remember that bond yields move in the opposite direction of prices.)
Within the Fund
Broadly speaking, we began the period attempting to participate in the rally that carried over from the end of the previous fiscal period. During this time, our allocations to cyclical sectors within the investment grade and high yield corporate bond sectors contributed significantly to the Fund’s return.
The Fund generally made gains relative to the benchmark index across nearly all investment-grade industries during the period. Our emphasis on BBB- and A-rated issues and in financials particularly added to the Fund’s performance over the fiscal year. Among the Fund’s high yield allocation, we generally attempted to take advantage of the potential for “snap-back” rallies in sectors that we believed had sustained the most damage during the preceding fiscal year. Specifically, we took large overweight positions in CCC- and B-rated bonds within economically sensitive cyclical sectors such as basic materials. Meanwhile, we underweighted higher-rated BB securities and bonds from defensive industries such as energy, healthcare, and utilities. Those credit and sector allocation decisions also contributed to the Fund’s relative performance.
It is important to note that, as economic conditions turned more volatile, we attempted to upgrade the quality of the Fund’s holdings within both the investment grade and high yield sectors. This decision proved generally beneficial, though our allocation to the high yield sector lost some of the gains it had generated earlier in the period.
2
In contrast, the Fund’s underweight position in Treasury securities ultimately detracted from performance versus the benchmark index. While the underweight helped at first, Treasurys advanced later in the period on the back of strong demand as noted above.
Other detractors from the Fund’s relative performance came from overweights in asset-backed securities and commercial mortgage-backed securities (particularly during the latter parts of the period). This happened despite the Fund’s bias toward higher-quality commercial mortgage-backed securities.
Although the global economic outlook is uncertain, we believe that our in-depth, fundamentals-based debt selection process has uncovered many positive stories, and should allow us to successfully steer the Fund through events that we believe could continue to test global economies and financial markets in the coming quarters.
3
| Performance summary | |
| Delaware Core Bond Fund | July 31, 2010 |
The performance data quoted represent past performance; past performance does not guarantee future results. Investment return and principal value will fluctuate so your shares, when redeemed, may be worth more or less than their original cost. Please obtain the performance data current for the most recent month end by calling 800 523-1918 or visiting our Web site at www.delawareinvestments.com/performance. Current performance may be lower or higher than the performance data quoted.
You should consider the investment objectives, risks, charges, and expenses of the investment company carefully before investing. The Delaware Core Bond Fund prospectus contains this and other important information about the investment company. Please request a prospectus through your financial advisor or by calling 800 523-1918 or visiting our Web site at www.delawareinvestments.com. Read the prospectus carefully before you invest or send money.
| Fund performance | | Average annual total returns through July 31, 2010 |
| | | 1 year | | 5 years | | 10 years | | Lifetime |
| Class A (Est. March 12, 1996) | | | | | | | | | | |
| Excluding sales charge | | +9.99 | % | | +6.02 | % | | +6.25 | % | | n/a | |
| Including sales charge | | +5.09 | % | | +5.04 | % | | +5.75 | % | | n/a | |
| Class C (Est. Sept. 30, 2009) | | | | | | | | | | |
| Excluding sales charge | | n/a | | | n/a | | | n/a | | | +6.48 | % |
| Including sales charge | | n/a | | | n/a | | | n/a | | | +5.48 | % |
| Class R (Est. Sept. 30, 2009) | | | | | | | | | | |
| Excluding sales charge | | n/a | | | n/a | | | n/a | | | +7.31 | % |
| Including sales charge | | n/a | | | n/a | | | n/a | | | +7.31 | % |
| Institutional Class (Est. Sept. 30, 2009) | | | | | | | | | | |
| Excluding sales charge | | n/a | | | n/a | | | n/a | | | +7.88 | % |
| Including sales charge | | n/a | | | n/a | | | n/a | | | +7.88 | % |
Delaware Core Bond Fund is the successor to The Intermediate Fixed Income Portfolio of the Delaware Pooled® Trust pursuant to the reorganization (Reorganization) of The Intermediate Fixed Income Portfolio into the Fund. Prior to the Reorganization, the Fund had no investment operations. Accordingly, for periods before Sept. 30, 2009, the performance information shown above that includes data from that period and on pages 6 and 7 is historical information for The Intermediate Fixed Income Portfolio. The Intermediate Fixed Income Portfolio had the same investment objective and a similar investment strategy as the Fund, and was managed by the same portfolio managers. Because the Fund’s fees and ex penses are higher than those of The Intermediate Fixed Income Portfolio, the Fund’s performance would have been lower than that shown for relevant periods in this report.
Returns reflect the reinvestment of all distributions and any applicable sales charges as noted in the following paragraphs.
Performance for C shares, excluding sales charges, assumes either that contingent deferred sales charges did not apply or that the investment was not redeemed.
4
Expense limitations were in effect for certain classes during the periods shown in the “Fund performance” chart and in the “Performance of a $10,000 investment” chart. The current expenses for each class are listed on the “Fund expense ratios” chart. (Note that all charts and graphs referred to in the “Performance summary” section of this report are found on pages 4 through 7.) Performance would have been lower had the expense limitations not been in effect.
The Fund offers Class A, C, R, and Institutional Class shares.
Class A shares are sold with a maximum front-end sales charge of up to 4.50%, and have an annual distribution and service fee of up to 0.30% of average daily net assets. This fee has been contractually limited to 0.25% of average daily net assets from Aug. 26, 2009, through Nov. 30, 2010.
Class C shares are sold with a contingent deferred sales charge of 1.00% if redeemed during the first 12 months. They are also subject to an annual distribution and service fee of up to 1.00% of average daily net assets.
Class R shares are available only for certain retirement plan products. They are sold without a sales charge and have an annual distribution and service fee of up to 0.60% of average daily net assets, which has been limited contractually to 0.50% from Aug. 26, 2009, through Nov. 30, 2010.
Institutional Class shares are available without sales or asset-based distribution charges only to certain eligible institutional accounts.
The “Fund performance” table and the “Performance of a $10,000 investment” graph do not reflect the deduction of taxes the shareholder would pay on Fund distributions or redemptions of Fund shares.
Fixed income securities and bond funds can lose value, and investors can lose principal, as interest rates rise. They also may be affected by economic conditions that hinder an issuer’s ability to make interest and principal payments on its debt.
The Fund may also be subject to prepayment risk, the risk that the principal of a fixed income security that is held by the Fund may be prepaid prior to maturity, potentially forcing the Fund to reinvest that money at a lower interest rate.
If and when we invest in forward foreign currency contracts or use other investments to hedge against currency risks, the Fund will be subject to special risks, including counterparty risk.
The Fund may invest in derivatives, which may involve additional expenses and are subject to risk, including the risk that an underlying security or securities index moves in the opposite direction from what the portfolio manager anticipated. A derivative transaction depends upon the counterparties’ ability to fulfill their contractual obligations.
International investments entail risks not ordinarily associated with U.S. investments including fluctuation in currency values, differences in accounting principles, or economic or political instability in other nations.
The Fund may experience portfolio turnover in excess of 100%, which could result in higher transaction costs and tax liability.
5
Performance summary
Delaware Core Bond Fund
The Fund’s expense ratios, as described in the most recent prospectus, are disclosed in the following “Fund expense ratios” chart. Delaware Investments has agreed to reimburse certain expenses and/or waive certain fees from Aug. 26, 2009, through Nov. 30, 2010. Please see the most recent prospectus and any applicable supplement(s) for additional information on these fee waivers and/or reimbursements.
| Fund expense ratios | | Class A | �� | Class C | | Class R | | Institutional Class |
| Total annual operating expenses | | 2.52% | | 3.22% | | 2.82% | | 2.22% |
| (without fee waivers) | | | | | | | | |
| Net expenses | | 0.90% | | 1.65% | | 1.15% | | 0.65% |
| (including fee waivers, if any) | | | | | | | | |
| Type of waiver | | Contractual | | Contractual | | Contractual | | Contractual |
6
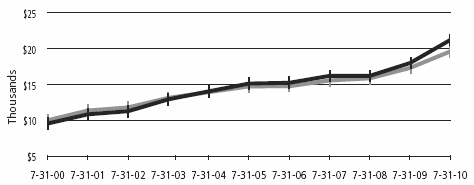
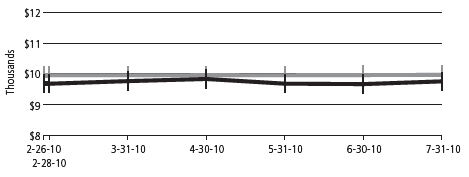
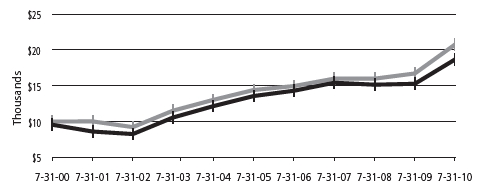
Performance of a $10,000 investment
Average annual total returns from July 31, 2000, through July 31, 2010
| For period beginning July 31, 2000, through July 31, 2010 | Starting value | Ending value |
| Barclays Capital U.S. Aggregate Index | $10,000 | $18,742 |
| Delaware Core Bond Fund — Class A Shares | $9,550 | $17,493 |
The chart assumes $10,000 invested in the Fund on July 31, 2000, and includes the effect of a 4.50% front-end sales charge and the reinvestment of all distributions. Please note additional details on these fees in the “Performance summary” section of this report, which includes pages 4 through 7.
The chart also assumes $10,000 invested in the Barclays Capital U.S. Aggregate Index as of July 31, 2000.
The Barclays Capital U.S. Aggregate Index is a broad composite of more than 8,000 securities that tracks the investment grade domestic bond market.
Index performance returns do not reflect any management fees, transaction costs or expenses. Indices are unmanaged and one cannot invest directly in an index. Past performance is not a guarantee of future results.
Performance of other Fund classes will vary due to different charges and expenses.
The “Fund performance” chart and the “Performance of a $10,000 investment” graph do not reflect the deduction of taxes shareholders would pay on Fund distributions or redemptions of Fund shares.
| | | Nasdaq symbols | | CUSIPs | |
| Class A | | | DPFIX | | | 245908710 | |
| Class C | | | DCBCX | | | 245908694 | |
| Class R | | | DEBRX | | | 245908686 | |
| Institutional Class | | | DCBIX | | | 245908678 | |
7
Disclosure of Fund expenses
For the six-month period February 1, 2010 to July 31, 2010
As a shareholder of the Fund, you incur two types of costs: (1) transaction costs, including sales charges (loads) on purchase payments, reinvested dividends, or other distributions; redemption fees; and exchange fees; and (2) ongoing costs, including management fees; distribution and/or service (12b-1) fees; and other Fund expenses. This example is intended to help you understand your ongoing costs (in dollars) of investing in the Fund and to compare these costs with the ongoing costs of investing in other mutual funds.
The example is based on an investment of $1,000 invested at the beginning of the period and held for the entire six-month period from February 1, 2010 to July 31, 2010.
Actual expenses
The first section of the table shown, “Actual Fund return,” provides information about actual account values and actual expenses. You may use the information in this section of the table, together with the amount you invested, to estimate the expenses that you paid over the period. Simply divide your account value by $1,000 (for example, an $8,600 account value divided by $1,000 = 8.6), then multiply the result by the number in the first section under the heading entitled “Expenses Paid During Period” to estimate the expenses you paid on your account during this period.
Hypothetical example for comparison purposes
The second section of the table shown, “Hypothetical 5% return,” provides information about hypothetical account values and hypothetical expenses based on the Fund’s actual expense ratio and an assumed rate of return of 5% per year before expenses, which is not the Fund’s actual return. The hypothetical account values and expenses may not be used to estimate the actual ending account balance or expenses you paid for the period. You may use this information to compare the ongoing costs of investing in the Fund and other funds. To do so, compare this 5% hypothetical example with the 5% hypothetical examples that appear in the shareholder reports of the other funds.
Please note that the expenses shown in the table are meant to highlight your ongoing costs only and do not reflect any transactional costs, such as sales charges (loads), redemption fees, or exchange fees. Therefore, the second section of the table is useful in comparing ongoing costs only, and will not help you determine the relative total costs of owning different funds. In addition, if these transactional costs were included, your costs would have been higher. The Fund’s expenses shown in the table reflect fee waivers in effect. The expenses shown in the table assume reinvestment of all dividends and distributions.
8
Delaware Core Bond Fund
Expense analysis of an investment of $1,000
| | | Beginning | | Ending | | | | Expenses |
| | | Account Value | | Account Value | | Annualized | | Paid During Period |
| | | 2/1/10 | | 7/31/10 | | Expense Ratio | | 2/1/10 to 7/31/2010* |
| Actual Fund return | | | | | | | | | | | | | | |
| Class A | | | $1,000.00 | | | | $1,039.50 | | | 0.90% | | | $4.55 | |
| Class C | | | 1,000.00 | | | | 1,036.60 | | | 1.65% | | | 8.33 | |
| Class R | | | 1,000.00 | | | | 1,038.80 | | | 1.15% | | | 5.81 | |
| Institutional Class | | | 1,000.00 | | | | 1,041.60 | | | 0.65% | | | 3.29 | |
| Hypothetical 5% return (5% return before expenses) | | | | | | | |
| Class A | | | $1,000.00 | | | | $1,020.33 | | | 0.90% | | | $4.51 | |
| Class C | | | 1,000.00 | | | | 1,016.61 | | | 1.65% | | | 8.25 | |
| Class R | | | 1,000.00 | | | | 1,019.09 | | | 1.15% | | | 5.76 | |
| Institutional Class | | | 1,000.00 | | | | 1,021.57 | | | 0.65% | | | 3.26 | |
*“Expenses Paid During Period” are equal to the Fund’s annualized expense ratio, multiplied by the average account value over the period, multiplied by 181/365 (to reflect the one-half year period).
9
| Security type | |
| Delaware Core Bond Fund | As of July 31, 2010 |
Sector designations may be different than the sector designations presented in other Fund materials. The sector designations may represent the investment manager’s internal sector classifications, which may result in the sector designations for one fund being different than another fund’s sector designations.
| Security type | Percentage of net assets |
| Agency Asset-Backed Securities | 0.13% | |
| Agency Collateralized Mortgage Obligations | 1.24% | |
| Agency Mortgage-Backed Securities | 31.31% | |
| Commercial Mortgage-Backed Securities | 7.55% | |
| Corporate Bonds | 30.75% | |
| Banking | 6.67% | |
| Basic Industry | 1.69% | |
| Brokerage | 0.77% | |
| Capital Goods | 0.70% | |
| Communications | 4.20% | |
| Consumer Cyclical | 0.99% | |
| Consumer Non-Cyclical | 4.23% | |
| Electric | 3.18% | |
| Energy | 3.20% | |
| Financials | 1.08% | |
| Insurance | 1.37% | |
| Natural Gas | 1.95% | |
| Real Estate | 0.39% | |
| Technology | 0.22% | |
| Transportation | 0.11% | |
| Non-Agency Asset-Backed Securities | 8.45% | |
| Non-Agency Collateralized Mortgage Obligation | 0.42% | |
| Regional Authorities | 2.87% | |
| Sovereign Agencies | 4.16% | |
| Supranational Banks | 2.50% | |
| U.S. Treasury Obligations | 10.81% | |
| Preferred Stock | 0.18% | |
| Discount Note | 27.69% | |
| Total Value of Securities | 128.06% | |
| Liabilities Net of Receivables and Other Assets | (28.06% | ) |
| Total Net Assets | 100.00% | |
10
| Statement of net assets |
| Delaware Core Bond Fund | | | July 31, 2010 |
| | | Principal amount (U.S. $) | | Value (U.S. $) |
| Agency Asset-Backed Securities – 0.13% | | | | | |
| | Fannie Mae Grantor Trust | | | | | |
| | Series 2003-T4 2A5 5.407% 9/26/33 | $ | 11,004 | | $ | 10,300 |
| | Fannie Mae Whole Loan | | | | | |
| | Series 2001-W2 AS5 6.473% 10/25/31 | | 12,856 | | | 13,217 |
| | •Series 2002-W11 AV1 0.669% 11/25/32 | | 2,033 | | | 1,814 |
| Total Agency Asset-Backed Securities | | | | | |
| | (cost $25,771) | | | | | 25,331 |
| | |
| Agency Collateralized Mortgage Obligations – 1.24% | | | | | |
| | Fannie Mae REMIC | | | | | |
| | Series 2004-49 EB 5.00% 7/25/24 | | 65,000 | | | 71,378 |
| | Fannie Mae Whole Loan | | | | | |
| | Series 2003-W15 2A7 5.55% 8/25/43 | | 26,217 | | | 28,577 |
| | Freddie Mac REMIC | | | | | |
| | Series 2326 ZQ 6.50% 6/15/31 | | 51,066 | | | 56,986 |
| | Series 3027 DE 5.00% 9/15/25 | | 60,000 | | | 65,703 |
| • | Vendee Mortgage Trust | | | | | |
| | Series 2000-1 1A 6.817% 1/15/30 | | 23,732 | | | 26,209 |
| Total Agency Collateralized Mortgage Obligations | | | | | |
| | (cost $235,599) | | | | | 248,853 |
| | |
| Agency Mortgage-Backed Securities – 31.31% | | | | | |
| | Fannie Mae 8.50% 9/20/10 | | 51 | | | 52 |
| • | Fannie Mae ARM | | | | | |
| | 2.801% 8/1/34 | | 27,490 | | | 28,761 |
| | 2.846% 12/1/33 | | 19,880 | | | 20,707 |
| | Fannie Mae FHAVA 11.00% 12/1/15 | | 4 | | | 4 |
| | Fannie Mae Relocation 30 yr 5.00% 1/1/34 | | 3,174 | | | 3,359 |
| | Fannie Mae S.F. 15 yr 8.00% 10/1/14 | | 274 | | | 288 |
| | Fannie Mae S.F. 15 yr TBA | | | | | |
| | 4.00% 8/1/25 | | 905,000 | | | 946,432 |
| | 4.50% 8/1/25 | | 1,010,000 | | | 1,070,127 |
| | 5.00% 8/1/25 | | 905,000 | | | 966,654 |
| | 5.50% 8/25/25 | | 590,000 | | | 637,938 |
| | Fannie Mae S.F. 20 yr 5.50% 8/1/28 | | 88,596 | | | 95,688 |
11
Statement of net assets
Delaware Core Bond Fund
| | | Principal amount (U.S. $) | | Value (U.S. $) |
| Agency Mortgage-Backed Securities (continued) | | | | | |
| | Fannie Mae S.F. 30 yr | | | | | |
| | 5.00% 12/1/37 | $ | 7,225 | | $ | 7,708 |
| | 5.00% 1/1/38 | | 12,944 | | | 13,810 |
| | 5.00% 2/1/38 | | 6,139 | | | 6,550 |
| | 7.50% 12/1/32 | | 5,324 | | | 6,094 |
| | 9.50% 4/1/18 | | 967 | | | 1,115 |
| | Fannie Mae S.F. 30 yr TBA | | | | | |
| | 4.50% 9/1/40 | | 170,000 | | | 177,119 |
| | 5.00% 9/1/40 | | 550,000 | | | 584,203 |
| • | Freddie Mac ARM | | | | | |
| | 2.672% 4/1/33 | | 6,246 | | | 6,501 |
| | 3.417% 4/1/34 | | 4,692 | | | 4,881 |
| | 5.059% 8/1/38 | | 269,119 | | | 285,915 |
| | 5.672% 7/1/36 | | 11,174 | | | 11,757 |
| | Freddie Mac Relocation 15 yr 3.50% 10/1/18 | | 3,467 | | | 3,416 |
| | Freddie Mac S.F. 15 yr 5.00% 4/1/20 | | 17,063 | | | 18,366 |
| | Freddie Mac S.F. 15 yr TBA | | | | | |
| | 5.00% 8/1/25 | | 180,000 | | | 192,291 |
| | 5.50% 8/1/25 | | 180,000 | | | 194,288 |
| | Freddie Mac S.F. 30 yr TBA | | | | | |
| | 6.00% 8/1/40 | | 840,000 | | | 912,319 |
| | 6.50% 8/1/40 | | 75,000 | | | 82,195 |
| | GNMA I S.F. 15 yr 7.50% 4/15/13 | | 494 | | | 489 |
| | GNMA I S.F. 30 yr 7.50% 2/15/32 | | 2,979 | | | 3,440 |
| Total Agency Mortgage-Backed Securities | | | | | |
| | (cost $6,250,436) | | | | | 6,282,467 |
| | |
| Commercial Mortgage-Backed Securities – 7.55% | | | | | |
| | Bank of America Commercial Mortgage Securities | | | | | |
| | Series 2004-2 A3 4.05% 11/10/38 | | 91,028 | | | 92,273 |
| | Series 2005-1 A3 4.877% 11/10/42 | | 28,811 | | | 29,050 |
| | Bear Stearns Commercial Mortgage Securities | | | | | |
| | •Series 2005-PW10 A4 5.405% 12/11/40 | | 225,000 | | | 243,284 |
| | •Series 2005-T20 A4A 5.149% 10/12/42 | | 25,000 | | | 27,180 |
| | Series 2006-PW14 A4 5.201% 12/11/38 | | 50,000 | | | 52,666 |
| | Series 2007-PW15 A4 5.331% 2/11/44 | | 25,000 | | | 25,170 |
12
| | | Principal amount (U.S. $) | | Value (U.S. $) |
| Commercial Mortgage-Backed Securities (continued) | | | | | |
| u• | Commercial Mortgage Pass Through Certificates | | | | | |
| | Series 2005-C6 A5A 5.116% 6/10/44 | $ | 120,000 | | $ | 129,072 |
| #• | Credit Suisse First Boston Mortgage Securities | | | | | |
| | Series 2001-SPGA A2 144A 6.515% 8/13/18 | | 65,000 | | | 67,620 |
| • | Credit Suisse Mortgage Capital Certificates | | | | | |
| | Series 2006-C1 AAB 5.549% 2/15/39 | | 20,000 | | | 21,190 |
| • | General Electric Capital Commercial Mortgage | | | | | |
| | Series 2005-C4 A2 5.305% 11/10/45 | | 23,490 | | | 23,639 |
| | Goldman Sachs Mortgage Securities II | | | | | |
| | •Series 2004-GG2 A6 5.396% 8/10/38 | | 20,000 | | | 21,380 |
| | Series 2005-GG4 A4 4.761% 7/10/39 | | 35,000 | | | 36,078 |
| | Series 2005-GG4 A4A 4.751% 7/10/39 | | 115,000 | | | 121,700 |
| | •Series 2006-GG6 A4 5.553% 4/10/38 | | 120,000 | | | 127,217 |
| • | JPMorgan Chase Commercial Mortgage Securities | | | | | |
| | Series 2005-LDP5 A4 5.195% 12/15/44 | | 15,000 | | | 16,282 |
| | Lehman Brothers-UBS Commercial Mortgage Trust | | | | | |
| | Series 2004-C1 A4 4.568% 1/15/31 | | 100,000 | | | 104,245 |
| | Morgan Stanley Capital I | | | | | |
| | Series 2005-HQ6 A4A 4.989% 8/13/42 | | 160,000 | | | 171,536 |
| | •Series 2007-T27 A4 5.649% 6/11/42 | | 190,000 | | | 204,464 |
| Total Commercial Mortgage-Backed Securities | | | | | |
| | (cost $1,409,964) | | | | | 1,514,046 |
| | |
| Corporate Bonds – 30.75% | | | | | |
| Banking – 6.67% | | | | | |
| | BB&T | | | | | |
| | 5.20% 12/23/15 | | 30,000 | | | 32,482 |
| | 5.25% 11/1/19 | | 91,000 | | | 94,741 |
| | JPMorgan Chase 4.40% 7/22/20 | | 135,000 | | | 135,596 |
| | JPMorgan Chase Capital XXV 6.80% 10/1/37 | | 70,000 | | | 71,463 |
| | KFW 4.00% 1/27/20 | | 55,000 | | | 57,965 |
| # | NIBC Bank 144A 2.80% 12/2/14 | | 100,000 | | | 102,150 |
| | Oesterreichische Kontrollbank | | | | | |
| | 1.75% 3/11/13 | | 50,000 | | | 50,754 |
| | 4.875% 2/16/16 | | 95,000 | | | 106,424 |
13
Statement of net assets
Delaware Core Bond Fund
| | | Principal amount (U.S. $) | | Value (U.S. $) |
| Corporate Bonds (continued) | | | | | |
| Banking (continued) | | | | | |
| | PNC Funding | | | | | |
| | 5.125% 2/8/20 | $ | 160,000 | | $ | 169,826 |
| | 5.25% 11/15/15 | | 15,000 | | | 16,240 |
| | Rentenbank | | | | | |
| | 3.125% 7/15/15 | | 50,000 | | | 52,439 |
| | 3.25% 3/15/13 | | 55,000 | | | 57,965 |
| | 4.125% 7/15/13 | | 25,000 | | | 27,013 |
| | US Bancorp 3.15% 3/4/15 | | 55,000 | | | 56,816 |
| • | USB Capital IX 6.189% 4/15/49 | | 70,000 | | | 54,558 |
| | Wachovia | | | | | |
| | 5.25% 8/1/14 | | 195,000 | | | 208,912 |
| | 5.625% 10/15/16 | | 40,000 | | | 43,925 |
| | | | | | | 1,339,269 |
| Basic Industry – 1.69% | | | | | |
| | Alcoa 6.15% 8/15/20 | | 25,000 | | | 25,382 |
| | ArcelorMittal 9.85% 6/1/19 | | 25,000 | | | 32,352 |
| | Cytec Industries 8.95% 7/1/17 | | 35,000 | | | 43,080 |
| | Dow Chemical 8.55% 5/15/19 | | 40,000 | | | 50,036 |
| | International Paper 9.375% 5/15/19 | | 50,000 | | | 65,116 |
| | Reliance Steel & Aluminum 6.85% 11/15/36 | | 10,000 | | | 9,605 |
| | Teck Resources | | | | | |
| | 9.75% 5/15/14 | | 70,000 | | | 85,160 |
| | 10.25% 5/15/16 | | 10,000 | | | 12,114 |
| | Vale Overseas 6.875% 11/10/39 | | 15,000 | | | 16,611 |
| | | | | | | 339,456 |
| Brokerage – 0.77% | | | | | |
| | Goldman Sachs Group | | | | | |
| | 3.70% 8/1/15 | | 30,000 | | | 30,248 |
| | 5.375% 3/15/20 | | 45,000 | | | 46,407 |
| | Jefferies Group | | | | | |
| | 5.875% 6/8/14 | | 10,000 | | | 10,707 |
| | 6.45% 6/8/27 | | 15,000 | | | 14,239 |
14
| | | Principal amount (U.S. $) | | Value (U.S. $) |
| Corporate Bonds (continued) | | | | | |
| Brokerage (continued) | | | | | |
| | Lazard Group | | | | | |
| | 6.85% 6/15/17 | $ | 45,000 | | $ | 46,644 |
| | 7.125% 5/15/15 | | 5,000 | | | 5,345 |
| | | | | | | 153,590 |
| Capital Goods – 0.70% | | | | | |
| | Allied Waste North America | | | | | |
| | 6.875% 6/1/17 | | 10,000 | | | 11,053 |
| | 7.125% 5/15/16 | | 20,000 | | | 21,626 |
| | L-3 Communications 4.75% 7/15/20 | | 65,000 | | | 66,541 |
| | Thermo Fisher Scientific 3.20% 5/1/15 | | 40,000 | | | 42,027 |
| | | | | | | 141,247 |
| Communications – 4.20% | | | | | |
| | American Tower 7.00% 10/15/17 | | 45,000 | | | 51,694 |
| | AT&T 6.50% 9/1/37 | | 50,000 | | | 57,135 |
| | Cisco Systems 4.45% 1/15/20 | | 75,000 | | | 80,470 |
| | Comcast 5.90% 3/15/16 | | 55,000 | | | 63,176 |
| # | COX Communications 144A 6.45% 12/1/36 | | 5,000 | | | 5,518 |
| | DIRECTV Holdings/Financing 7.625% 5/15/16 | | 145,000 | | | 161,140 |
| # | NBC Universal 144A 5.15% 4/30/20 | | 40,000 | | | 42,598 |
| | Qwest 8.375% 5/1/16 | | 65,000 | | | 74,263 |
| | Telecom Italia Capital | | | | | |
| | 5.25% 10/1/15 | | 80,000 | | | 84,340 |
| | 6.175% 6/18/14 | | 90,000 | | | 97,888 |
| | Time Warner Cable | | | | | |
| | 8.25% 2/14/14 | | 5,000 | | | 5,966 |
| | 8.25% 4/1/19 | | 40,000 | | | 50,320 |
| | Verizon Communications | | | | | |
| | 6.40% 2/15/38 | | 10,000 | | | 11,359 |
| | 7.35% 4/1/39 | | 10,000 | | | 12,666 |
| # | Vivendi 144A | | | | | |
| | 5.75% 4/4/13 | | 30,000 | | | 32,338 |
| | 6.625% 4/4/18 | | 10,000 | | | 11,273 |
| | | | | | | 842,144 |
15
Statement of net assets
Delaware Core Bond Fund
| | | Principal amount (U.S. $) | | Value (U.S. $) |
| Corporate Bonds (continued) | | | | | |
| Consumer Cyclical – 0.99% | | | | | |
| #u | CVS Pass Through Trust 144A 8.353% 7/10/31 | $ | 113,077 | | $ | 136,823 |
| | International Game Technology 5.50% 6/15/20 | | 20,000 | | | 20,872 |
| | Wal-Mart Stores 3.625% 7/8/20 | | 40,000 | | | 40,279 |
| | | | | | | 197,974 |
| Consumer Non-Cyclical – 4.23% | | | | | |
| | Abbott Laboratories 4.125% 5/27/20 | | 65,000 | | | 68,985 |
| | Amgen 4.50% 3/15/20 | | 10,000 | | | 10,823 |
| # | Anheuser-Busch InBev Worldwide 144A | | | | | |
| | 5.00% 4/15/20 | | 70,000 | | | 75,314 |
| | Baxter International 4.50% 8/15/19 | | 50,000 | | | 54,104 |
| # | Brambles USA 144A | | | | | |
| | 3.95% 4/1/15 | | 20,000 | | | 20,491 |
| | 5.35% 4/1/20 | | 20,000 | | | 20,864 |
| | Covidien International Finance 4.20% 6/15/20 | | 45,000 | | | 46,836 |
| | General Mills 5.65% 2/15/19 | | 15,000 | | | 17,200 |
| # | Genzyme 144A | | | | | |
| | 3.625% 6/15/15 | | 15,000 | | | 15,786 |
| | 5.00% 6/15/20 | | 35,000 | | | 38,021 |
| | Hospira 6.40% 5/15/15 | | 30,000 | | | 34,330 |
| | Kraft Foods 5.375% 2/10/20 | | 40,000 | | | 43,836 |
| | Life Technologies | | | | | |
| | 4.40% 3/1/15 | | 5,000 | | | 5,248 |
| | 6.00% 3/1/20 | | 65,000 | | | 71,795 |
| | Medco Health Solutions 7.125% 3/15/18 | | 120,000 | | | 143,746 |
| | Pfizer 6.20% 3/15/19 | | 30,000 | | | 36,263 |
| # | Roche Holdings 144A 6.00% 3/1/19 | | 60,000 | | | 70,905 |
| | St. Jude Medical 4.875% 7/15/19 | | 10,000 | | | 11,044 |
| | Yale University 2.90% 10/15/14 | | 20,000 | | | 21,074 |
| | Zimmer Holdings 4.625% 11/30/19 | | 40,000 | | | 42,294 |
| | | | | | | 848,959 |
| Electric – 3.18% | | | | | |
| # | American Transmission Systems 144A 5.25% 1/15/22 | | 75,000 | | | 79,080 |
| | Commonwealth Edison | | | | | |
| | 4.00% 8/1/20 | | 55,000 | | | 56,358 |
| | 5.80% 3/15/18 | | 5,000 | | | 5,758 |
16
| | | Principal amount (U.S. $) | | Value (U.S. $) |
| Corporate Bonds (continued) | | | | | |
| Electric (continued) | | | | | |
| | Duke Energy Carolinas 4.30% 6/15/20 | $ | 45,000 | | $ | 48,244 |
| | Illinois Power 9.75% 11/15/18 | | 45,000 | | | 59,227 |
| | Indiana Michigan Power 7.00% 3/15/19 | | 45,000 | | | 53,910 |
| | Jersey Central Power & Light 5.625% 5/1/16 | | 20,000 | | | 21,896 |
| | PacifiCorp 5.50% 1/15/19 | | 235,000 | | | 271,303 |
| | Pennsylvania Electric 5.20% 4/1/20 | | 20,000 | | | 21,115 |
| | Public Service Oklahoma 5.15% 12/1/19 | | 20,000 | | | 21,481 |
| | | | | | | 638,372 |
| Energy – 3.20% | | | | | |
| | EOG Resources 2.95% 6/1/15 | | 25,000 | | | 25,828 |
| | Nexen 7.50% 7/30/39 | | 45,000 | | | 56,032 |
| | Noble Energy 8.25% 3/1/19 | | 55,000 | | | 68,713 |
| | Noble Holding International | | | | | |
| | 4.90% 8/1/20 | | 30,000 | | | 31,420 |
| | 6.20% 8/1/40 | | 15,000 | | | 16,204 |
| | Petrobras International Finance 5.75% 1/20/20 | | 55,000 | | | 58,750 |
| | Pride International 8.50% 6/15/19 | | 15,000 | | | 16,838 |
| # | Ras Laffan Liquefied Natural Gas III 144A | | | | | |
| | 5.832% 9/30/16 | | 90,000 | | | 98,526 |
| # | SEMCO Energy 144A 5.15% 4/21/20 | | 60,000 | | | 64,099 |
| | Total Capital 4.45% 6/24/20 | | 55,000 | | | 58,379 |
| | Transocean 6.80% 3/15/38 | | 15,000 | | | 13,538 |
| | Weatherford International 9.625% 3/1/19 | | 55,000 | | | 69,756 |
| # | Woodside Finance 144A | | | | | |
| | 4.50% 11/10/14 | | 50,000 | | | 52,121 |
| | 8.125% 3/1/14 | | 10,000 | | | 11,570 |
| | | | | | | 641,774 |
| Financials – 1.08% | | | | | |
| | Capital One Capital V 10.25% 8/15/39 | | 30,000 | | | 32,663 |
| | City National Capital Trust I 9.625% 2/1/40 | | 50,000 | | | 53,099 |
| # | Erac USA Finance 144A 5.25% 10/1/20 | | 20,000 | | | 20,539 |
| | General Electric Capital 6.00% 8/7/19 | | 100,000 | | | 110,884 |
| | | | | | | 217,185 |
17
Statement of net assets
Delaware Core Bond Fund
| | | Principal amount (U.S. $) | | Value (U.S. $) |
| Corporate Bonds (continued) | | | | | |
| Insurance – 1.37% | | | | | |
| | MetLife 6.817% 8/15/18 | $ | 185,000 | | $ | 212,599 |
| | Prudential Financial 3.875% 1/14/15 | | 60,000 | | | 61,834 |
| | | | | | | 274,433 |
| Natural Gas – 1.95% | | | | | |
| • | Enbridge Energy Partners 8.05% 10/1/37 | | 30,000 | | | 29,593 |
| | Energy Transfer Partners 9.70% 3/15/19 | | 35,000 | | | 44,116 |
| | Enterprise Products Operating | | | | | |
| | 7.50% 2/1/11 | | 15,000 | | | 15,416 |
| | 9.75% 1/31/14 | | 60,000 | | | 73,424 |
| | Kinder Morgan Energy Partners | | | | | |
| | 6.55% 9/15/40 | | 10,000 | | | 11,054 |
| | 9.00% 2/1/19 | | 45,000 | | | 58,476 |
| # | Midcontinent Express Pipeline 144A | | | | | |
| | 5.45% 9/15/14 | | 10,000 | | | 10,574 |
| | 6.70% 9/15/19 | | 45,000 | | | 47,881 |
| | Plains All American Pipeline/Finance 8.75% 5/1/19 | | 40,000 | | | 49,916 |
| • | TransCanada PipeLines 6.35% 5/15/67 | | 55,000 | | | 50,117 |
| | | | | | | 390,567 |
| Real Estate – 0.39% | | | | | |
| | Developers Diversified Realty 7.50% 4/1/17 | | 10,000 | | | 9,914 |
| # | Digital Realty Trust 144A 5.875% 2/1/20 | | 5,000 | | | 5,131 |
| | ProLogis | | | | | |
| | 6.25% 3/15/17 | | 5,000 | | | 4,846 |
| | 7.375% 10/30/19 | | 45,000 | | | 44,249 |
| | Regency Centers 5.875% 6/15/17 | | 14,000 | | | 14,910 |
| | | | | | | 79,050 |
| Technology – 0.22% | | | | | |
| | National Semiconductor | | | | | |
| | 3.95% 4/15/15 | | 15,000 | | | 15,463 |
| | 6.60% 6/15/17 | | 25,000 | | | 28,247 |
| | | | | | | 43,710 |
18
| | | | Principal amount (U.S. $) | | Value (U.S. $) |
| Corporate Bonds (continued) | | | | | | |
| Transportation – 0.11% | | | | | | |
| | Burlington Northern Santa Fe 4.70% 10/1/19 | | $ | 20,000 | | $ | 21,404 |
| | | | | | | | 21,404 |
| Total Corporate Bonds (cost $5,932,795) | | | | | | 6,169,134 |
| | | | | | | | |
| Non-Agency Asset-Backed Securities – 8.45% | | | | | | |
| #• | AH Mortgage Advance Trust Series 2009-ADV3 A1 | | | | | | |
| | 144A 2.297% 10/6/21 | | | 110,000 | | | 109,923 |
| | Ally Auto Receivables Trust Series 2010-2 A3 | | | | | | |
| | 1.38% 7/15/14 | | | 15,000 | | | 15,114 |
| • | American Express Issuance Trust Series 2005-2 A | | | | | | |
| | 0.411% 8/15/13 | | | 100,000 | | | 99,601 |
| | #Bank of America Auto Trust Series 2009-3A A4 | | | | | | |
| | 144A 2.67% 12/15/16 | | | 100,000 | | | 103,527 |
| • | Bank of America Credit Card Trust | | | | | | |
| | Series 2007-A6 A6 0.401% 9/15/16 | | | 75,000 | | | 74,105 |
| | Series 2008-A5 A5 1.541% 12/16/13 | | | 100,000 | | | 100,917 |
| • | Capital One Multi-Asset Execution Trust | | | | | | |
| | Series 2007-A4 A4 0.371% 3/16/15 | | | 100,000 | | | 99,382 |
| • | Chase Issuance Trust Series 2009-A2 A2 | | | | | | |
| | 1.891% 4/15/14 | | | 200,000 | | | 204,348 |
| • | Citibank Credit Card Issuance Trust | | | | | | |
| | Series 2004-C1 C1 0.991% 7/15/13 | | | 20,000 | | | 19,800 |
| | Series 2008-A6 A6 1.538% 5/22/17 | | | 115,000 | | | 118,850 |
| | Series 2009-A1 A1 2.091% 3/17/14 | | | 100,000 | | | 102,467 |
| | Series 2009-A2 A2 1.891% 5/15/14 | | | 100,000 | | | 102,345 |
| | CNH Equipment Trust | | | | | | |
| | •Series 2007-A A4 0.381% 9/17/12 | | | 3,697 | | | 3,694 |
| | Series 2008-A A3 4.12% 5/15/12 | | | 891 | | | 895 |
| | Series 2008-A A4A 4.93% 8/15/14 | | | 10,000 | | | 10,356 |
| | Series 2008-B A3A 4.78% 7/16/12 | | | 2,931 | | | 2,962 |
| | Series 2009-C A3 1.85% 12/16/13 | | | 5,000 | | | 5,065 |
| | Series 2009-C A4 3.00% 8/17/15 | | | 110,000 | | | 114,938 |
| | Series 2010-A A4 2.49% 1/15/16 | | | 50,000 | | | 51,517 |
| | Discover Card Master Trust Series 2008-A4 A4 | | | | | | |
| | 5.65% 12/15/15 | | | 100,000 | | | 112,110 |
19
Statement of net assets
Delaware Core Bond Fund
| | | | Principal amount (U.S. $) | | Value (U.S. $) |
| Non-Agency Asset-Backed Securities (continued) | | | | | | |
| | Harley Davidson Motorcycle Trust 2008-1 A4 | | | | | | |
| | 4.90% 12/15/13 | | $ | 100,000 | | $ | 104,921 |
| | John Deere Owner Trust Series 2010-A A4 | | | | | | |
| | 2.13% 10/17/16 | | | 35,000 | | | 35,839 |
| • | Merrill Auto Trust Securitization Series 2007-1 A4 | | | | | | |
| | 0.401% 12/15/13 | | | 3,931 | | | 3,914 |
| | Mid-State Trust Series 11 A1 4.864% 7/15/38 | | | 26,818 | | | 25,986 |
| #• | Nissan Master Owner Trust Receivables | | | | | | |
| | Series 2010-AA A 144A 1.491% 1/15/15 | | | 50,000 | | | 50,132 |
| • | World Omni Auto Receivables Trust | | | | | | |
| | Series 2007-B A3B 0.731% 1/17/12 | | | 3,412 | | | 3,412 |
| | World Omni Automobile Lease Securitization Trust | | | | | | |
| | Series 2009-A A3 1.65% 2/15/13 | | | 20,000 | | | 20,183 |
| Total Non-Agency Asset-Backed Securities | | | | | | |
| | (cost $1,681,930) | | | | | | 1,696,303 |
| | | | | | | |
| Non-Agency Collateralized Mortgage Obligation – 0.42% | | | | | | |
| | Deutsche Alternative Securities Loan Trust | | | | | | |
| | Series 2003-4XS A6A 4.82% 10/25/33 | | | 89,738 | | | 84,049 |
| Total Non-Agency Collateralized Mortgage Obligation | | | | | | |
| | (cost $87,705) | | | | | | 84,049 |
| | | | | | | |
| Regional Authorities – 2.87%Δ | | | | | | |
| Canada – 2.87% | | | | | | |
| | Province of British Columbia Canada 2.85% 6/15/15 | | | 65,000 | | | 68,375 |
| | Province of Manitoba Canada 2.625% 7/15/15 | | | 25,000 | | | 26,018 |
| | Province of Nova Scotia Canada 2.375% 7/21/15 | | | 40,000 | | | 40,550 |
| | Province of Ontario Canada | | | | | | |
| | 4.10% 6/16/14 | | | 145,000 | | | 158,366 |
| | 4.40% 4/14/20 | | | 100,000 | | | 108,264 |
| | Province of Quebec Canada | | | | | | |
| | 4.875% 5/5/14 | | | 60,000 | | | 66,480 |
| | 5.00% 3/1/16 | | | 95,000 | | | 107,699 |
| Total Regional Authorities (cost $553,451) | | | | | | 575,752 |
20
| | | | Principal amount (U.S. $) | | Value (U.S. $) |
| Sovereign Agencies – 4.16%Δ | | | | | | |
| Canada – 0.76% | | | | | | |
| | Export Development Canada | | | | | | |
| | 2.25% 5/28/15 | | $ | 40,000 | | $ | 41,084 |
| | 3.125% 4/24/14 | | | 105,000 | | | 111,900 |
| | | | | | | | 152,984 |
| Norway – 2.35% | | | | | | |
| | Eksportfinans | | | | | | |
| | 1.875% 4/2/13 | | | 105,000 | | | 106,850 |
| | 3.00% 11/17/14 | | | 150,000 | | | 156,885 |
| | 5.50% 5/25/16 | | | 90,000 | | | 103,292 |
| | #Kommunalbanken 144A 2.75% 5/5/15 | | | 100,000 | | | 103,144 |
| | | | | | | | 470,171 |
| Sweden – 1.05% | | | | | | |
| | Swedish Export Credit 3.25% 9/16/14 | | | 200,000 | | | 210,640 |
| | | | | | | | 210,640 |
| Total Sovereign Agencies (cost $808,119) | | | | | | 833,795 |
| | | | | | | |
| Supranational Banks – 2.50% | | | | | | |
| | African Development Bank 3.00% 5/27/14 | | | 50,000 | | | 52,960 |
| | Asian Development Bank | | | | | | |
| | 1.625% 7/15/13 | | | 105,000 | | | 106,901 |
| | 2.75% 5/21/14 | | | 65,000 | | | 68,233 |
| | Inter-American Development Bank | | | | | | |
| | 1.625% 7/15/13 | | | 70,000 | | | 71,054 |
| | 2.25% 7/15/15 | | | 40,000 | | | 40,931 |
| | 3.50% 7/8/13 | | | 25,000 | | | 26,674 |
| | International Bank for Reconstruction & | | | | | | |
| | Development 2.375% 5/26/15 | | | 70,000 | | | 72,412 |
| | International Finance 3.00% 4/22/14 | | | 35,000 | | | 37,350 |
| | Nordic Investment Bank 2.50% 7/15/15 | | | 25,000 | | | 25,738 |
| Total Supranational Banks (cost $488,896) | | | | | | 502,253 |
21
Statement of net assets
Delaware Core Bond Fund
| | | | Principal amount (U.S. $) | | Value (U.S. $) | |
| U.S. Treasury Obligations – 10.81% | | | | | | | |
| | U.S. Treasury Bond 4.625% 2/15/40 | | $ | 1,035,000 | | $ | 1,151,114 | |
| | U.S. Treasury Notes | | | | | | | |
| | 1.875% 6/30/15 | | | 25,000 | | | 25,373 | |
| | 3.50% 5/15/20 | | | 945,000 | | | 992,550 | |
| Total U.S. Treasury Obligations (cost $2,129,885) | | | | | | 2,169,037 | |
| | | | | | | | |
| | | | Number of shares | | | | |
| Preferred Stock – 0.18% | | | | | | | |
| • | PNC Financial Services Group 8.25% | | | 35,000 | | | 36,653 | |
| Total Preferred Stock (cost $30,388) | | | | | | 36,653 | |
| | | | | | | | |
| | | | Principal amount (U.S. $) | | | | |
| ≠Discount Note – 27.69% | | | | | | | |
| | Federal Home Loan Bank 0.06% 8/2/10 | | $ | 5,556,029 | | | 5,556,020 | |
| Total Discount Note (cost $5,556,020) | | | | | | 5,556,020 | |
| | | | | | | | |
| Total Value of Securities – 128.06% | | | | | | | |
| | (cost $25,190,959) | | | | | | 25,693,693 | |
| Liabilities Net of Receivables and | | | | | | | |
| | Other Assets – (28.06%)z | | | | | | (5,629,259 | ) |
| Net Assets Applicable to 1,855,532 | | | | | | | |
| | Shares Outstanding – 100.00% | | | | | $ | 20,064,434 | |
| | | | | | | | | |
| Net Asset Value – Delaware Core Bond Fund Class A | | | | | | | |
| | ($4,022,287 / 374,288 Shares) | | | | | | $10.75 | |
| Net Asset Value – Delaware Core Bond Fund Class C | | | | | | | |
| | ($145,317 / 13,472 Shares) | | | | | | $10.79 | |
| Net Asset Value – Delaware Core Bond Fund Class R | | | | | | | |
| | ($2,168 / 200.20 Shares) | | | | | | $10.83 | |
| Net Asset Value – Delaware Core Bond Fund Institutional Class | | | | |
| | ($15,894,662 / 1,467,572 Shares) | | | | | | $10.83 | |
22
| | | | | |
| Components of Net Assets at July 31, 2010: | | | | |
| Shares of beneficial interest (unlimited authorization – no par) | | $ | 19,708,291 | |
| Undistributed net investment income | | | 3,325 | |
| Accumulated net realized loss on investments | | | (149,916 | ) |
| Net unrealized appreciation of investments | | | 502,734 | |
| Total net assets | | $ | 20,064,434 | |
| • | Variable rate security. The rate shown is the rate as of July 31, 2010. Interest rates reset periodically. |
| w | Pass Through Agreement. Security represents the contractual right to receive a proportionate amount of underlying payments due to the counterparty pursuant to various agreements related to the rescheduling of obligations and the exchange of certain notes. |
| # | Security exempt from registration under Rule 144A of the Securities Act of 1933, as amended. At July 31, 2010, the aggregate amount of Rule 144A securities was $1,395,948, which represented 6.96% of the Fund’s net assets. See Note 9 in “Notes to financial statements.” |
| ≠ | The rate shown is the effective yield at the time of purchase. |
| Δ | Securities have been classified by country of origin. |
| z | Of this amount, $6,591,299 represents payable for securities purchased as of July 31, 2010. |
Summary of abbreviations:
ARM — Adjustable Rate Mortgage
FHAVA — Federal Housing Administration & Veterans Administration
GNMA — Government National Mortgage Association
REMIC — Real Estate Mortgage Investment Conduit
S.F. — Single Family
TBA — To be announced
yr — Year
23
Statement of net assets
Delaware Core Bond Fund
| | | | |
| Net Asset Value and Offering Price Per Share – | | | |
| Delaware Core Bond Fund | | | |
| Net asset value Class A (A) | | $ | 10.75 |
| Sales charge (4.50% of offering price) (B) | | | 0.51 |
| Offering Price | | $ | 11.26 |
| (A) | Net asset value per share, as illustrated, is the amount which would be paid upon redemption or repurchase of shares. |
| (B) | See the current prospectus for purchases of $100,000 or more. |
See accompanying Notes, which are an integral part of the financial statements
24
Statements of operations
Delaware Core Bond Fund
| | | 11/1/09 | | Year |
| | | to | | Ended |
| | | 7/31/10* | | 10/31/09 |
| Investment Income: | | | | | | |
| Interest | | $ | 334,867 | | | $ | 343,268 | |
| Dividends | | | 3,300 | | | | 5,930 | |
| Securities lending income | | | — | | | | 1,792 | |
| | | | 338,167 | | | | 350,990 | |
| Expenses: | | | | | | | | |
| Registration fees | | | 60,701 | | | | 20,798 | |
| Management fees | | | 57,567 | | | | 28,311 | |
| Legal fees | | | 30,429 | | | | 3,382 | |
| Reports and statements to shareholders | | | 20,927 | | | | 4,763 | |
| Audit and tax | | | 16,815 | | | | 13,316 | |
| Dividend disbursing and transfer agent fees and expenses | | | 15,062 | | | | 3,968 | |
| Distribution expense – Class A | | | 11,024 | | | | 1,656 | |
| Distribution expense – Class C | | | 313 | | | | 2 | |
| Distribution expense – Class R | | | 8 | | | | 1 | |
| Pricing fees | | | 9,754 | | | | 10,594 | |
| Dues and services | | | 6,122 | | | | 37 | |
| Accounting and administration expenses | | | 4,574 | | | | 2,776 | |
| Custodian fees | | | 2,023 | | | | 1,898 | |
| Trustees’ fees | | | 560 | | | | 479 | |
| Consulting fees | | | 195 | | | | 110 | |
| Insurance fees | | | 168 | | | | 192 | |
| Trustees’ expenses | | | 40 | | | | 37 | |
| | | | 236,282 | | | | 92,320 | |
| Less fees waived | | | (150,310 | ) | | | (59,577 | ) |
| Less waived distribution expenses – Class A | | | (1,837 | ) | | | (276 | ) |
| Less waived distribution expenses – Class R | | | (1 | ) | | | — | |
| Less expense paid indirectly | | | (2 | ) | | | — | |
| Total operating expenses | | | 84,132 | | | | 32,467 | |
| Net Investment Income | | | 254,035 | | | | 318,523 | |
26
| Net Realized and Unrealized Gain (Loss) on Investments: | | | | | | | |
| Net realized gain (loss) on: | | | | | | | |
| Investments | | $ | 300,943 | | $ | 279,025 | |
| Futures contracts | | | — | | | 1,285 | |
| Written options | | | — | | | (64,814 | ) |
| Swap contracts | | | — | | | (5,145 | ) |
| Net realized gain | | | 300,943 | | | 210,351 | |
| Net change in unrealized appreciation/depreciation of investments | | | 396,380 | | | 641,103 | |
| Net Realized and Unrealized Gain on Investments | | | 697,323 | | | 851,454 | |
| | | | | | | | |
| Net Increase in Net Assets Resulting from Operations | | $ | 951,358 | | $ | 1,169,977 | |
*During the period ended July 31, 2010 the Fund changed its fiscal year end from October to July.
See accompanying Notes, which are an integral part of the financial statements
27
Statements of changes in net assets
Delaware Core Bond Fund
| | | 11/1/09 | | Year | | Year |
| | | to | | Ended | | Ended |
| | | 7/31/10* | | 10/31/09 | | 10/31/08 |
| Increase (Decrease) in Net Assets | | | | | | | | | | | | |
| from Operations: | | | | | | | | | | | | |
| Net investment income | | $ | 254,035 | | | $ | 318,523 | | | $ | 364,424 | |
| Net realized gain on investments | | | 300,943 | | | | 210,351 | | | | 157,470 | |
| Net change in unrealized appreciation/ | | | | | | | | | | | | |
| depreciation of investments | | | 396,380 | | | | 641,103 | | | | (539,825 | ) |
| Net increase (decrease) in net assets resulting | | | | | | | | | | | | |
| from operations | | | 951,358 | | | | 1,169,977 | | | | (17,931 | ) |
| | | | | | | | | | | | | |
| Dividends and Distributions to | | | | | | | | | | | | |
| Shareholders from: | | | | | | | | | | | | |
| Net investment income: | | | | | | | | | | | | |
| Class A | | | (104,466 | ) | | | (337,265 | ) | | | (393,379 | ) |
| Class C | | | (507 | ) | | | (6 | ) | | | — | |
| Class R | | | (24 | ) | | | (6 | ) | | | — | |
| Institutional Class | | | (198,771 | ) | | | (7 | ) | | | — | |
| | | | (303,768 | ) | | | (337,284 | ) | | | (393,379 | ) |
| | | | | | | | | | | | | |
| Capital Share Transactions: | | | | | | | | | | | | |
| Proceeds from shares sold: | | | | | | | | | | | | |
| Class A | | | 415,835 | | | | 153,596 | | | | 144,850 | |
| Class C | | | 140,412 | | | | 2,022 | | | | — | |
| Class R | | | — | | | | 2,022 | | | | — | |
| Institutional Class | | | 16,968,441 | | | | 2,022 | | | | — | |
| | | | | | | | | | | | | |
| Net asset value of shares issued upon | | | | | | | | | | | | |
| reinvestment of dividends and distributions: | | | | | | | | | | | | |
| Class A | | | 104,466 | | | | 300,080 | | | | 347,507 | |
| Class C | | | 483 | | | | 4 | | | | — | |
| Class R | | | 24 | | | | 5 | | | | — | |
| Institutional Class | | | 190,236 | | | | 6 | | | | — | |
| | | | 17,819,897 | | | | 459,757 | | | | 492,357 | |
28
| | | 11/1/09 | | Year | | Year |
| | | to | | Ended | | Ended |
| | | 7/31/10* | | 10/31/09 | | 10/31/08 |
| Capital Share Transactions (continued): | | | | | | | | | | | | |
| Cost of shares repurchased: | | | | | | | | | | | | |
| Class A | | $ | (3,001,525 | ) | | $ | (1,697,319 | ) | | $ | (7,114,923 | ) |
| Institutional Class | | | (1,754,001 | ) | | | — | | | | — | |
| | | | (4,755,526 | ) | | | (1,697,319 | ) | | | (7,114,923 | ) |
| Increase (decrease) in net assets derived from | | | | | | | | | | | | |
| capital share transactions | | | 13,064,371 | | | | (1,237,562 | ) | | | (6,622,566 | ) |
| Net Increase (Decrease) in Net Assets | | | 13,711,961 | | | | (404,869 | ) | | | (7,033,876 | ) |
| | | | | | | | | | | | | |
| Net Assets: | | | | | | | | | | | | |
| Beginning of period | | | 6,352,473 | | | | 6,757,342 | | | | 13,791,218 | |
| End of period (including undistributed net | | | | | | | | | | | | |
| investment income of $3,325, $9,166 and | | | | | | | | | | | | |
| $8,315, respectively) | | $ | 20,064,434 | | | $ | 6,352,473 | | | $ | 6,757,342 | |
*During the period ended July 31, 2010 the Fund changed its fiscal year end from October to July.
See accompanying Notes, which are an integral part of the financial statements
29
Financial highlights
Delaware Core Bond Fund Class A
Selected data for each share of the Fund outstanding throughout each period were as follows:
| Net asset value, beginning of period |
| |
| Income (loss) from investment operations: |
| Net investment income3 |
| Net realized and unrealized gain (loss) on investments |
| Total from investment operations |
| |
| Less dividends and distributions from: |
| Net investment income |
| Total dividends and distributions |
| |
| Net asset value, end of period |
| |
| Total return4 |
| |
| Ratios and supplemental data: |
| Net assets, end of period (000 omitted) |
| Ratio of expenses to average net assets |
| Ratio of expenses to average net assets |
| prior to fees waived and expense paid indirectly |
| Ratio of net investment income to average net assets |
| Ratio of net investment income to average net assets |
| prior to fees waived and expense paid indirectly |
| Portfolio turnover |
1 During the period ended July 31, 2010, the Fund changed its fiscal year end from October to July. Ratios have been annualized and portfolio turnover and total return have not been annualized. |
2 Effective September 30, 2009, the Fund received all of the assets and liabilities of the Delaware Pooled® Trust – The Intermediate Fixed Income Portfolio (the Portfolio). The Class A shares financial highlights for the periods prior to September 30, 2009 reflect the performance of the Institutional Class shares of the Portfolio. Fees paid by Portfolio were less than Class A share fees, and performance would have been lower if Class A fees were paid. See Note 2 in “Notes to financial statements.” |
See accompanying Notes, which are an integral part of the financial statements
30
| | 11/1/09 | | | | | | | | | | | | | | | | |
| | to | | Year Ended | |
| | 7/31/101 | | 10/31/092 | | 10/31/082 | | 10/31/072 | | 10/31/062 | | 10/31/052 | |
| | $10.370 | | | $9.200 | | | $9.880 | | | $9.940 | | | $9.960 | | | $10.310 | | |
| | | | |
| | | | |
| | 0.159 | | | 0.445 | | | 0.460 | | | 0.457 | | | 0.427 | | | 0.382 | | |
| | 0.434 | | | 1.195 | | | (0.643 | ) | | (0.014 | ) | | 0.025 | | | (0.283 | ) | |
| | 0.593 | | | 1.640 | | | (0.183 | ) | | 0.443 | | | 0.452 | | | 0.099 | | |
| | | | |
| | | | |
| | (0.213 | ) | | (0.470 | ) | | (0.497 | ) | | (0.503 | ) | | (0.472 | ) | | (0.449 | ) | |
| | (0.213 | ) | | (0.470 | ) | | (0.497 | ) | | (0.503 | ) | | (0.472 | ) | | (0.449 | ) | |
| | | | |
| | $10.750 | | | $10.370 | | | $ 9.200 | | | $ 9.880 | | | $ 9.940 | | | $ 9.960 | | |
| | | | |
| | 5.89% | | | 18.29% | | | (2.07% | ) | | 4.68% | | | 4.68% | | | 0.97% | | |
| | | | |
| | | | |
| | $4,022 | | | $6,346 | | | $6,757 | | | $13,791 | | | $28,795 | | | $15,786 | | |
| | 0.90% | | | 0.70% | | | 0.39% | | | 0.39% | | | 0.43%5 | | | 0.44% | | |
| | | | |
| | 2.25% | | | 1.60% | | | 1.12% | | | 0.66% | | | 0.67% | | | 0.68% | | |
| | 2.04% | | | 4.35% | | | 4.66% | | | 4.61% | | | 4.38% | | | 3.76% | | |
| | | | |
| | 0.69% | | | 3.45% | | | 3.93% | | | 4.33% | | | 4.14% | | | 3.52% | | |
| | 528% | | | 346% | | | 391% | | | 251% | | | 342% | | | 212% | | |
3 The average shares outstanding method has been applied for per share information. |
4 Total investment return is based on the change in net asset value of a share during the period and assumes reinvestment of dividends and distributions at net asset value and does not reflect the impact of a sales charge. Total investment return during some of the periods shown reflects waivers by the manager and/or distributor. Performance would have been lower had the waivers not been in effect. |
5 Ratio for the year ended October 31, 2006, including fees paid indirectly in accordance with Securities and Exchange Commission rules, was 0.44%. |
31
Financial highlights
Delaware Core Bond Fund Class C
Selected data for each share of the Fund outstanding throughout each period were as follows:
| Net asset value, beginning of period |
| |
| Income from investment operations: |
| Net investment income3 |
| Net realized and unrealized gain on investments |
| Total from investment operations |
| |
| Less dividends and distributions from: |
| Net investment income |
| Total dividends and distributions |
| |
| Net asset value, end of period |
| |
| Total return4 |
| |
| Ratios and supplemental data: |
| Net assets, end of period (000 omitted) |
| Ratio of expenses to average net assets |
| Ratio of expenses to average net assets |
| prior to fees waived |
| Ratio of net investment income to average net assets |
| Ratio of net investment loss to average net assets |
| prior to fees waived |
| Portfolio turnover |
1 During the period ended July 31, 2010, the Fund changed its fiscal year end from October to July. Ratios have been annualized and portfolio turnover and total return have not been annualized. |
2 Date of commencement of operations; ratios have been annualized and total return has not been annualized. |
3 The average shares outstanding method has been applied for per share information. |
See accompanying Notes, which are an integral part of the financial statements
32
| | 11/1/09 | | | 9/30/092 | | |
| | to | | | to | | |
| | 7/31/101 | | | 10/31/09 | | |
| | $10.370 | | | $10.310 | | |
| | | | |
| | | | |
| | 0.103 | | | 0.030 | | |
| | 0.469 | | | 0.059 | | |
| | 0.572 | | | 0.089 | | |
| | | | |
| | | | |
| | (0.152 | ) | | (0.029 | ) | |
| | (0.152 | ) | | (0.029 | ) | |
| | | | |
| | $10.790 | | | $10.370 | | |
| | | | |
| | 5.67% | | | 0.86% | | |
| | | | |
| | | | |
| | $145 | | | $2 | | |
| | 1.65% | | | 1.65% | | |
| | | | |
| | 2.95% | | | 5.32% | | |
| | 1.29% | | | 3.33% | | |
| | | | |
| | (0.01% | ) | | (0.34% | ) | |
| | 528% | | | 346% | 5 | |
4 Total investment return is based on the change in net asset value of a share during the period and assumes reinvestment of dividends and distributions at net asset value and does not reflect the impact of a sales charge. Total investment return during all of the periods shown reflects a waiver by the manager. Performance would have been lower had the waiver not been in effect. |
5 Portfolio turnover reflects the portfolio turnover rate that the Fund experienced from 11/1/08 through 10/31/09. |
33
Financial highlights
Delaware Core Bond Fund Class R
Selected data for each share of the Fund outstanding throughout each period were as follows:
| Net asset value, beginning of period |
| |
| Income from investment operations: |
| Net investment income3 |
| Net realized and unrealized gain on investments |
| Total from investment operations |
| |
| Less dividends and distributions from: |
| Net investment income |
| Total dividends and distributions |
| |
| Net asset value, end of period |
| |
| Total return4 |
| |
| Ratios and supplemental data: |
| Net assets, end of period (000 omitted) |
| Ratio of expenses to average net assets |
| Ratio of expenses to average net assets |
| prior to fees waived |
| Ratio of net investment income to average net assets |
| Ratio of net investment income to average net assets |
| prior to fees waived |
| Portfolio turnover |
1 During the period ended July 31, 2010, the Fund changed its fiscal year end from October to July. Ratios have been annualized and portfolio turnover and total return have not been annualized. |
2 Date of commencement of operations; ratios have been annualized and total return has not been annualized. |
3 The average shares outstanding method has been applied for per share information. |
See accompanying Notes, which are an integral part of the financial statements
34
| | 11/1/09 | | | 9/30/092 | | |
| | to | | | to | | |
| | 7/31/101 | | | 10/31/09 | | |
| | $10.370 | | | $10.310 | | |
| | | | |
| | | | |
| | 0.141 | | | 0.035 | | |
| | 0.510 | | | 0.059 | | |
| | 0.651 | | | 0.094 | | |
| | | | |
| | | | |
| | (0.191 | ) | | (0.034 | ) | |
| | (0.191 | ) | | (0.034 | ) | |
| | | | |
| | $10.830 | | | $10.370 | | |
| | | | |
| | 6.44% | | | 0.90% | | |
| | | | |
| | | | |
| | $2 | | | $2 | | |
| | 1.15% | | | 1.15% | | |
| | | | |
| | 2.55% | | | 4.92% | | |
| | 1.79% | | | 3.83% | | |
| | | | |
| | 0.39% | | | 0.06% | | |
| | 528% | | | 346% | 5 | |
4 Total investment return is based on the change in net asset value of a share during the period and assumes reinvestment of dividends and distributions at net asset value. Total investment return during all of the periods shown reflects waivers by the manager and distributor. Performance would have been lower had the waivers not been in effect. |
5 Portfolio turnover reflects the portfolio turnover rate that the Fund experienced from 11/1/08 through 10/31/09. |
35
Financial highlights
Delaware Core Bond Fund Institutional Class
Selected data for each share of the Fund outstanding throughout each period were as follows:
| Net asset value, beginning of period |
| |
| Income from investment operations: |
| Net investment income3 |
| Net realized and unrealized gain on investments |
| Total from investment operations |
| |
| Less dividends and distributions from: |
| Net investment income |
| Total dividends and distributions |
| |
| Net asset value, end of period |
| |
| Total return4 |
| |
| Ratios and supplemental data: |
| Net assets, end of period (000 omitted) |
| Ratio of expenses to average net assets |
| Ratio of expenses to average net assets |
| prior to fees waived |
| Ratio of net investment income to average net assets |
| Ratio of net investment income to average net assets |
| prior to fees waived |
| Portfolio turnover |
1 During the period ended July 31, 2010, the Fund changed its fiscal year end from October to July. Ratios have been annualized and portfolio turnover and total return have not been annualized. |
2 Date of commencement of operations; ratios have been annualized and total return has not been annualized. |
3 The average shares outstanding method has been applied for per share information. |
See accompanying Notes, which are an integral part of the financial statements
36
| | 11/1/09 | | | 9/30/092 | | |
| | to | | | to | | |
| | 7/31/101 | | | 10/31/09 | | |
| | $10.370 | | | $10.310 | | |
| | | | |
| | | | |
| | 0.181 | | | 0.039 | | |
| | 0.512 | | | 0.060 | | |
| | 0.693 | | | 0.099 | | |
| | | | |
| | | | |
| | (0.233 | ) | | (0.039 | ) | |
| | (0.233 | ) | | (0.039 | ) | |
| | | | |
| | $10.830 | | | $10.370 | | |
| | | | |
| | 6.76% | | | 0.96% | | |
| | | | |
| | | | |
| | $15,895 | | | $2 | | |
| | 0.65% | | | 0.65% | | |
| | | | |
| | 1.95% | | | 4.32% | | |
| | 2.29% | | | 4.33% | | |
| | | | |
| | 0.99% | | | 0.66% | | |
| | 528% | | | 346% | 5 | |
4 Total investment return is based on the change in net asset value of a share during the period and assumes reinvestment of dividends and distributions at net asset value. Total investment return during all of the periods shown reflects a waiver by the manager. Performance would have been lower had the waiver not been in effect. |
5 Portfolio turnover reflects the portfolio turnover rate that the Fund experienced from 11/1/08 through 10/31/09. |
37
| Notes to financial statements | |
| Delaware Core Bond Fund | July 31, 2010 |
Delaware Group® Income Funds (Trust) is organized as a Delaware statutory trust and offers five Series: Delaware Core Bond Fund, Delaware Corporate Bond Fund, Delaware Extended Duration Bond Fund, Delaware Diversified Floating Rate Fund and Delaware High-Yield Opportunities Fund. These financial statements and the related notes pertain to Delaware Core Bond Fund (Fund). The Trust is an open-end investment company. The Fund is considered diversified under the Investment Company Act of 1940, as amended, and offers Class A, Class C, Class R and Institutional Class shares. Class A shares are sold with a maximum front-end sales charge of up to 4.50%. Class A share purchases of $1,000,000 or more will incur a contingent deferred sales charge (CDSC) of 1% if redeemed during the first year and 0.50% during the second year, provided that Delaware Distributors, L.P. (DDLP) paid a fin ancial advisor a commission on the purchase of those shares. Class C shares are sold with a CDSC of 1%, if redeemed during the first twelve months. Class R and Institutional Class shares are not subject to a sales charge and are offered for sale exclusively to certain eligible investors.
The investment objective of the Fund is to seek maximum long term total return, consistent with reasonable risk.
In May 2009, the Fund’s Board of Trustees (Board) approved changing the Fund’s fiscal year-end from October 31 to July 31, effective July 31, 2010.
1. Significant Accounting Policies
The following accounting policies are in accordance with U.S. generally accepted accounting principles (U.S. GAAP) and are consistently followed by the Fund.
Security Valuation — Equity securities, except those traded on the Nasdaq Stock Market, Inc. (Nasdaq), are valued at the last quoted sales price as of the time of the regular close of the New York Stock Exchange (NYSE) on the valuation date. Securities traded on the Nasdaq are valued in accordance with the Nasdaq Official Closing Price, which may not be the last sales price. If on a particular day an equity security does not trade, then the mean between the bid and ask prices will be used. Securities listed on a foreign exchange are valued at the last quoted sales price on the valuation date. Short-term debt securities are valued at market value. U.S. government and agency securities are valued at the mean between the bid and ask prices. Other debt securities, credit default swap (CDS) contracts and interest rate swap co ntracts are valued by an independent pricing service or broker. To the extent current market prices are not available, the pricing service may take into account developments related to the specific security, as well as transactions in comparable securities. Financial futures contracts and options on futures contracts are valued at the daily quoted settlement prices. Generally, other securities and assets for which market quotations are not readily available are valued at fair value as determined in good faith under the direction of the Fund’s Board. In determining whether market quotations are readily available or fair valuation will be used, various factors will be taken into consideration, such as market closures or suspension of trading in a security. The Fund may use fair value pricing more frequently for securities traded primarily in non-U.S. markets because, among other things, most foreign markets close well before the Fund values its securities at 4:00 p.m. Eastern time. The earlier close of t hese foreign markets gives rise to the possibility that significant events, including broad market moves, government actions or pronouncements, aftermarket trading, or news events may have occurred in the interim. To account for this, the Fund may frequently value foreign securities using fair value prices based on third-party vendor modeling tools (international fair value pricing).
38
Federal Income Taxes — No provision for federal income taxes has been made as the Fund intends to continue to qualify for federal income tax purposes as a regulated investment company under Subchapter M of the Internal Revenue Code of 1986, as amended, and make the requisite distributions to shareholders. The Fund evaluates tax positions taken or expected to be taken in the course of preparing the Fund’s tax returns to determine whether the tax positions are “more likely-than-not” of being sustained by the applicable tax authority. Tax positions not deemed to meet the more-likely-than-not threshold are recorded as a tax benefit or expense in the current year. Management has analyzed the Fund’s tax positions taken on federal income tax returns for all open tax years (October 31, 2007 – July 3 1, 2010), and has concluded that no provision for federal income tax is required in the Fund’s financial statements. During the period ended July 31, 2010, the Fund changed its fiscal year end from October to July.
Class Accounting — Investment income and common expenses are allocated to the various classes of the Fund on the basis of “settled shares” of each class in relation to the net assets of the Fund. Realized and unrealized gain (loss) on investments are allocated to the various classes of the Fund on the basis of daily net assets of each class. Distribution expenses relating to a specific class are charged directly to that class.
Repurchase Agreements — The Fund may invest in a pooled cash account along with other members of the Delaware Investments® Family of Funds pursuant to an exemptive order issued by the Securities and Exchange Commission. The aggregate daily balance of the pooled cash account is invested in repurchase agreements secured by obligations of the U.S. government. The respective collateral is held by the Fund’s custodian bank until the maturity of the respective repurchase agreements. Each repurchase agreement is at least 102% collateralized. However, in the event of default or bankruptcy by the counterparty to the agreement, realization of the collateral may be subject to legal proceedings. At July 31, 2010, the Fund held no investments in repurchase agree ments.
To Be Announced Trades — The Fund may contract to purchase securities for a fixed price at a transaction date beyond the customary settlement period (i.e., “when issued,” “delayed delivery,” “forward commitment,” or “TBA transactions”) consistent with the Fund’s ability to manage its investment portfolio and meet redemption requests. These transactions involve a commitment by the Fund to purchase securities for a predetermined price or yield with payment and delivery taking place more than three days in the future, or after a period longer than the customary settlement period for that type of security. No interest will be earned by the Fund on such purchases until the securities are delivered; however the market value may change prior to delivery.
Use of Estimates — The preparation of financial statements in conformity with U.S. GAAP requires management to make estimates and assumptions that affect the reported amounts of assets and liabilities and disclosure of contingent assets and liabilities at the date of the financial statements and the reported amounts of revenues and expenses during the reporting period. Actual results could differ from those estimates and such differences could be material.
39
Notes to financial statements
Delaware Core Bond Fund
1. Significant Accounting Policies (continued)
Other — Expenses directly attributable to the Fund are charged directly to the Fund. Other expenses common to various funds within the Delaware Investments Family of Funds are generally allocated amongst such funds on the basis of average net assets. Management fees and some other expenses are paid monthly. Security transactions are recorded on the date the securities are purchased or sold (trade date) for financial reporting purposes. Costs used in calculating realized gains and losses on the sale of investment securities are those of the specific securities sold. Dividend income is recorded on the ex-dividend date and interest income is recorded on the accrual basis. Discounts and premiums on non-convertible bonds are amortized to interest income over the lives of the respective securities. Realized gains (losses) on paydowns of mortgage- and asset- backed securities are classified as interest income. The Fund declares dividends daily from net investment income and pays such dividends monthly and declares and pays distributions from net realized gain on investments, if any, annually. Such dividends and distributions, if any, are recorded on ex-dividend date.
The Fund may receive earnings credits from its custodian when positive cash balances are maintained, which are used to offset custody fees. There were no earnings credits for the period November 1, 2009 to July 31, 2010 and year ended October 31, 2009.
The Fund may receive earnings credits from its transfer agent when positive cash balances are maintained, which may be used to offset transfer agent fees. There were no earnings credits for the period November 1, 2009 to July 31, 2010 and year ended October 31, 2009.
2. Investment Management, Administration Agreements and Other Transactions with Affiliates
In accordance with the terms of its investment management agreement, the Fund pays Delaware Management Company (DMC), a series of Delaware Management Business Trust and the investment manager, an annual fee which is calculated daily at the rate of 0.50% on the first $500 million of average daily net assets of the Fund, 0.475% on the next $500 million, 0.45% on the next $1.5 billion, and 0.425% on average daily net assets in excess of $2.5 billion.
DMC has contractually agreed to waive that portion, if any, of its management fee and reimburse the Fund to the extent necessary to ensure the annual operating expenses, (excluding any 12b-1 plan expenses, taxes, interest, inverse floater program expenses, brokerage fees, certain insurance costs, and nonroutine expenses or costs including, but not limited to, those relating to reorganizations, litigation, conducting shareholder meetings, and liquidations (collectively, nonroutine expenses)), do not exceed 0.65% of average daily net assets of the Fund through November 30, 2010. For purposes of this waiver and reimbursement, nonroutine expenses may also include such additional costs and expenses, as may be agreed upon from time to time by the Fund’s Board and DMC. This expense waiver and reimbursement applies only to expenses paid directly by the Fund.
Delaware Service Company, Inc. (DSC), an affiliate of DMC, provides fund accounting and financial administration oversight services to the Fund. For these services, the Fund pays DSC fees based on the aggregate daily net assets of the Delaware Investments® Family of Funds at the
40
following annual rate: 0.0050% of the first $30 billion; 0.0045% of the next $10 billion; 0.0040% of the next $10 billion; and 0.0025% of aggregate average daily net assets in excess of $50 billion. The fees payable to DSC under the service agreement described above are allocated among all Funds in the Delaware Investments Family of Funds on a relative net asset value basis. For the period ended July 31, 2010 and year ended October 31, 2009, the Fund was charged $ 576 and $347, respectively, for these services.
DSC also provides dividend disbursing and transfer agency services. The Fund pays DSC a monthly fee based on the number of shareholder accounts for dividend disbursing and transfer agent services.
Pursuant to a distribution agreement and distribution plan, the Fund pays DDLP, the distributor and an affiliate of DMC, an annual distribution and service fee not to exceed 0.30% of the average daily net assets of the Class A shares, 1.00% of the average daily net assets of the Class C shares and 0.60% of the average daily net assets of the Class R shares. Institutional Class shares pay no distribution and service expenses. DDLP has contracted to waive distribution and service fees of Class A and Class R shares from exceeding 0.25% and 0.50%, respectively, of average daily net assets through November 30, 2010.
The Fund had receivables due from or liabilities payable to affiliates for the period ended July 31, 2010 and year ended October 31, 2009 as follows:
| | | 11/1/09 | | Year |
| | | to | | Ended |
| | | 7/31/10 | | 10/31/09 |
| Receivable from DMC under expense limitation agreement | | $ | 13,430 | | | $ | 15,425 | |
| Dividend disbursing, transfer agent and fund, accounting | | | | | | | | |
| oversight fees and other expenses payable to DSC | | | (163 | ) | | | (706 | ) |
| Distribution fees payable to DDLP | | | (924 | ) | | | — | |
| Other expenses payable to DMC and affiliates* | | | (2,161 | ) | | | (2,143 | ) |
| * | DMC, as part of its administrative services, pays operating expenses on behalf of the Fund and is reimbursed on a periodic basis. Such expenses include items such as printing of shareholder reports, fees for audit, legal and tax services, registration fees and trustees’ fees. |
As provided in the investment management agreement, the Fund bears the cost of certain legal and tax services, including internal legal and tax services provided to the Fund by DMC and/or its affiliates’ employees. For the period ended July 31, 2010 and year ended October 31, 2009, the Fund was charged $ 593 and $601, respectively, for internal legal and tax services provided by DMC and/ or its affiliates’ employees.
For the period ended July 31, 2010 and year ended October 31, 2009, DDLP earned $488 and $0, respectively, for commissions on sales of the Fund’s Class A shares.
Trustees’ fees include expenses accrued by the Fund for each Trustee’s retainer and meeting fees. Certain officers of DMC, DSC, and DDLP are officers and/or Trustees of the Trust. These officers and Trustees are paid no compensation by the Fund.
41
Notes to financial statements
Delaware Core Bond Fund
3. Investments
For the period ended July 31, 2010, the Fund made purchases of $52,298,211 and sales of $41,594,851 of investment securities other than U.S. government securities and short-term investments. For the period ended July 31, 2010, the Fund made purchases of $35,927,865 and sales of $33,367,644 of long-term U.S. government securities.
At July 31, 2010, the cost of investments for federal income tax purposes was $25,222,202. At July 31, 2010, net unrealized appreciation was $471,491, of which $490,530 related to unrealized appreciation of investments and $19,039 related to unrealized depreciation of investments.
U.S. GAAP defines fair value as the price that the Fund would receive to sell an asset or pay to transfer a liability in an orderly transaction between market participants at the measurement date under current market conditions. A three level hierarchy for fair value measurements has been established based upon the transparency of inputs to the valuation of an asset or liability. Inputs may be observable or unobservable and refer broadly to the assumptions that market participants would use in pricing the asset or liability. Observable inputs reflect the assumptions market participants would use in pricing the asset or liability based on market data obtained from sources independent of the reporting entity. Unobservable inputs reflect the reporting entity’s own assumptions about the assumptions that market participants would use in pricing the asset or liability developed based on the best information available under the circumstance s. The Fund’s investment in its entirety is assigned a level based upon the observability of the inputs which are significant to the overall valuation. The three level hierarchy of inputs is summarized below.
| Level 1 – | inputs are quoted prices in active markets for identical investments |
| | |
| Level 2 – | other observable inputs (including, but not limited to: quoted prices for similar assets or liabilities in markets that are active, quoted prices for identical or similar assets or liabilities in markets that are not active, inputs other than quoted prices that are observable for the assets or liabilities (such as interest rates, yield curves, volatilities, prepayment speeds, loss severities, credit risks and default rates) or other market-corroborated inputs) Level 3 – inputs are significant unobservable inputs (including the Fund’s own assumptions used to determine the fair value of investments) |
| | |
| Level 3 – | inputs are significant unobservable inputs (including the Fund’s own assumptions used to determine the fair value of investments) |
The following table summarizes the valuation of the Fund’s investments by fair value hierarchy levels as of July 31, 2010:
| | | Level 1 | | Level 2 | | Level 3 | | Total |
| Agency, Asset-Backed and | | | | | | | | | | | | |
| Mortgage-Backed Securities | | $ | — | | $ | 9,851,049 | | $ | — | | $ | 9,851,049 |
| Corporate Debt | | | — | | | 6,169,134 | | | — | | | 6,169,134 |
| Foreign Debt | | | — | | | 1,870,869 | | | 40,931 | | | 1,911,800 |
| U.S. Treasury Obligations | | | — | | | 2,169,037 | | | — | | | 2,169,037 |
| Short-Term | | | — | | | 5,556,020 | | | — | | | 5,556,020 |
| Other | | | — | | | 36,653 | | | — | | | 36,653 |
| Total | | $ | — | | $ | 25,652,762 | | $ | 40,931 | | $ | 25,693,693 |
42
The following is a reconciliation of investments in which significant unobservable inputs (Level 3) were used in determining fair value:
| | | Agency, Asset- | | | | | | | |
| | | Backed and | | | | | | | |
| | | Mortgage- | | | | | | | |
| | | Backed | | Foreign | | | | |
| | | Securities | | Debt | | Total |
| Balance as of 10/31/09 | | $ | 37,000 | | | $ | — | | $ | 37,000 | |
| Purchases | | | — | | | | 39,770 | | | 39,770 | |
| Sales | | | (35,000 | ) | | | — | | | (35,000 | ) |
| Transfers out of Level 3 | | | (10,000 | ) | | | — | | | (10,000 | ) |
| Net realized loss | | | (68,514 | ) | | | — | | | (68,514 | ) |
| Net change in unrealized appreciation/depreciation | | | 76,514 | | | | 1,161 | | | 77,675 | |
| Balance as of 7/31/10 | | $ | — | | | $ | 40,931 | | $ | 40,931 | |
| |
| Net change in unrealized appreciation/depreciation | | | | | | | | | | | |
| from investments still held as of 7/31/10 | | $ | — | | | $ | 1,161 | | $ | 1,161 | |
In January 2010, the Financial Accounting Standards Board issued an Accounting Standards Update, Improving Disclosures about Fair Value Measurements, which introduced new disclosure requirements and clarified certain existing disclosure requirements around fair value measurements currently presented above. The new disclosures and clarifications of existing disclosures are generally effective for the Fund’s fiscal year ending July 31, 2011 and interim periods therein. Management has evaluated the impact of this update on its current disclosures and determined that there were no transfers of securities between Level 1 investments and Level 2 investments that had a material impact to the Fund. During the period ended July 31, 2010, the Fund made transfers out of Level 3 investments into Level 2 investments in the amount of $10,000 for the Fund. This was due to the Fund’s pricing vendor being able to supply a matrix price for an in vestment that had been utilizing a broker quoted price.
4. Dividend and Distribution Information
Income and long-term capital gain distributions are determined in accordance with federal income tax regulations, which may differ from U.S. GAAP. Additionally, distributions from net short-term gains on sales of investment securities are treated as ordinary income for federal income tax purposes. The tax character of dividends and distributions paid during the period ended July 31, 2010 and year ended October 31, 2009 was as follows:
| | | 11/1/09 to | | Year Ended |
| | | 7/31/10 | | 10/31/09 |
| Ordinary income | | $ | 303,768 | | $ | 337,284 |
43
Notes to financial statements
Delaware Core Bond Fund
5. Components of Net Assets on a Tax Basis
As of July 31, 2010, the components of net asset on a tax basis were as follows:
| Shares of beneficial interest | | $ | 19,708,291 | |
| Undistributed ordinary income | | | 15,487 | |
| Distributions payable | | | (12,162 | ) |
| Capital loss carryforwards | | | (108,492 | ) |
| Other temporary differences | | | (10,181 | ) |
| Unrealized appreciation of investments | | | 471,491 | |
| Net assets | | $ | 20,064,434 | |
The differences between book basis and tax basis components of net assets are primarily attributable to tax deferral of losses on wash sales, straddles, tax treatment of distribution payable and tax treatment of market discount and premium on debt instruments.
For financial reporting purposes, capital accounts are adjusted to reflect the tax character of permanent book/tax differences. Reclassifications are primarily due to tax treatment of market discount and premium on certain debt instruments and paydowns of asset- and mortgage-backed securities. Results of operations and net assets were not affected by these reclassifications. For the period ended July 31, 2010, the Fund recorded the following reclassifications:
| Undistributed net investment income | | $ | 43,892 | |
| Accumulated net realized loss | | | (43,892 | ) |
For federal income tax purposes, capital loss carryforwards may be carried forward and applied against future capital gains. $284,592 was utilized in 2010. Capital loss carryforwards remaining at July 31, 2010 will expire as follows: $108,492 expires in 2015.
44
6. Capital Shares
Transactions in capital shares were as follows:
| | | 11/1/09 | | | | | | |
| | | to | | Year Ended | | Year Ended |
| | | 7/31/10 | | 10/31/09 | | 10/31/08 |
| Shares sold: | | | | | | | | | |
| Class A | | 39,518 | | | 16,224 | | | 14,472 | |
| Class C | | 13,230 | | | 196 | | | — | |
| Class R | | — | | | 196 | | | — | |
| Institutional Class | | 1,613,491 | | | 196 | | | — | |
| |
| Shares issued upon reinvestment of dividends and distributions: | | | | | | | | | |
| Class A | | 10,133 | | | 30,960 | | | 35,282 | |
| Class C | | 46 | | | — | | | — | |
| Class R | | 3 | | | 1 | | | — | |
| Institutional Class | | 17,915 | | | 1 | | | — | |
| | | 1,694,336 | | | 47,774 | | | 49,754 | |
| |
| Shares repurchased: | | | | | | | | | |
| Class A | | (287,460 | ) | | (169,379 | ) | | (710,797 | ) |
| Institutional Class | | (164,031 | ) | | — | | | — | |
| | | (451,491 | ) | | (169,379 | ) | | (710,797 | ) |
| Net increase (decrease) | | 1,242,845 | | | (121,605 | ) | | (661,043 | ) |
7. Line of Credit
The Fund, along with certain other funds in the Delaware Investments® Family of Funds (Participants), participates in a $35,000,000 revolving line of credit with The Bank of New York Mellon (BNY Mellon) to be used for temporary or emergency purposes as an additional source of liquidity to fund redemptions of investor shares. Under the agreement, Participants are charged an annual commitment fee, which is allocated across the Participants on the basis of each Participant’s allocation of the entire facility. The Participants may borrow up to a maximum of one third of their net assets under the agreement. The agreement expires on November 16, 2010. The Fund had no amounts outstanding as of July 31, 2010, or at any time during the period then ended.
8. Securities Lending
The Fund, along with other funds in the Delaware Investments Family of Funds, may lend its securities pursuant to a security lending agreement (Lending Agreement) with BNY Mellon. With respect to each loan, if on any business day the aggregate market value of securities collateral plus cash collateral held is less than the aggregate market value of the securities which are the subject of such loan, the borrower will be notified to provide additional collateral by the end of the following business day which, together with the collateral already held, will be not less than the
45
Notes to financial statements
Delaware Core Bond Fund
8. Securities Lending (continued)
applicable collateral requirements for such security loan. If the aggregate market value of securities collateral and cash collateral held with respect to a security loan exceeds the applicable collateral requirement, upon the request of the borrower BNY Mellon must return enough collateral to the borrower by the end of the following business day to reduce the value of the remaining collateral to the applicable collateral requirement for such security loan. As a result of the foregoing, the value of the collateral held with respect to a loaned security may be temporarily more or less than the value of the security on loan.
Cash collateral received is generally invested in the BNY Mellon Securities Lending Overnight Fund (Collective Trust) established by BNY Mellon for the purpose of investment on behalf of clients participating in its securities lending programs. The Collective Trust may invest in U.S. government securities and high quality corporate debt, asset-backed and other money market securities and in repurchase agreements collateralized by such securities, provided that the Collective Trust will only hold such assets with a maturity of one business day or less. The Collective Trust seeks to maintain a net asset value per unit of $1.00, but there can be no assurance that it will always be able to do so. The Fund may incur investment losses as a result of investing securities lending collateral in the Collective Trust. This could occur if an investment in the Collective Trust defaulted or if it were necessary to liquidate assets in the Collective Trus t to meet returns on outstanding security loans at a time when the Collective Trust’s net asset value per unit was less than $1.00. Under those circumstances, the Fund may not receive an amount from the Collective Trust that is equal in amount to the collateral the Fund would be required to return to the borrower of the securities and the Fund would be required to make up for this shortfall. The Fund can also accept U.S. government securities and letters of credit (non-cash collateral) in connection with securities loans. In the event of default or bankruptcy by the lending agent, realization and/or retention of the collateral may be subject to legal proceedings. In the event the borrower fails to return loaned securities and the collateral received is insufficient to cover the value of the loaned securities and provided such collateral shortfall is not the result of investment losses, the lending agent has agreed to pay the amount of the shortfall to the Fund, or at the discretion of the lending agent , replace the loaned securities. The Fund continues to record dividends or interest, as applicable, on the securities loaned and is subject to change in value of the securities loaned that may occur during the term of the loan. The Fund has the right under the Lending Agreement to recover the securities from the borrower on demand. With respect to security loans collateralized by non-cash collateral, the Fund receives loan premiums paid by the borrower. With respect to security loans collateralized by cash collateral, the earnings from the collateral investments are shared among the Fund, the security lending agent and the borrower. The Fund records security lending income net of allocations to the security lending agent and the borrower. The Fund had no securities out on loan as of July 31, 2010.
46
9. Credit and Market Risk
The Fund invests in fixed income securities whose value is derived from an underlying pool of mortgages or consumer loans. The value of these securities is sensitive to changes in economic conditions, including delinquencies and/or defaults, and may be adversely affected by shifts in the market’s perception of the issuers and changes in interest rates. Investors receive principal and interest payments as the underlying mortgages and consumer loans are paid back. Some of these securities are collateralized mortgage obligations (CMOs). CMOs are debt securities issued by U.S. government agencies or by financial institutions and other mortgage lenders, which are collateralized by a pool of mortgages held under an indenture. Prepayment of mortgages may shorten the stated maturity of the obligations and can result in a loss of premium, if any has been paid. Certain of these securities may be stripped (securities which provide only the prin cipal or interest feature of the underlying security). The yield to maturity on an interest-only CMO is extremely sensitive not only to changes in prevailing interest rates, but also to the rate of principal payments (including prepayments) on the related underlying mortgage assets. A rapid rate of principal payments may have a material adverse affect on the Fund’s yield to maturity. If the underlying mortgage assets experience greater than anticipated prepayments of principal, the Fund may fail to fully recoup its initial investment in these securities even if the securities are rated in the highest rating categories.
The Fund may invest up to 15% of its net assets in illiquid securities, which may include securities with contractual restrictions on resale, securities exempt from registration under Rule 144A of the Securities Act of 1933, as amended, and other securities which may not be readily marketable. The relative illiquidity of these securities may impair the Fund from disposing of them in a timely manner and at a fair price when it is necessary or desirable to do so. While maintaining oversight, the Fund’s Board has delegated to DMC the day-to-day functions of determining whether individual securities are liquid for purposes of the Fund’s limitation on investments in illiquid assets. Securities eligible for resale pursuant to Rule 144A, which are determined to be liquid, are not subject to the Fund’s 15% limit on investments in illiquid securities. As of July 31, 2010, no securities have been determined to be illiquid under the Fund’s Liquidity Procedures. Rule 144A securities have been identified on the statement of net assets.
10. Contractual Obligations
The Fund enters into contracts in the normal course of business that contain a variety of indemnifications. The Fund’s maximum exposure under these arrangements is unknown. However, the Fund has not had prior claims or losses pursuant to these contracts. Management has reviewed the Fund’s existing contracts and expects the risk of loss to be remote.
47
Notes to financial statements
Delaware Core Bond Fund
11. Subsequent Events
Management has determined no material events or transactions occurred subsequent to July 31, 2010 that would require recognition or disclosure in the Fund’s financial statements.
12. Tax Information (Unaudited)
The information set forth below is for the Fund’s fiscal year as required by federal income tax laws. Shareholders, however, must report distributions on a calendar year basis for income tax purposes, which may include distributions for portions of two fiscal years of a fund. Accordingly, the information needed by shareholders for income tax purposes will be sent to them in January of each year. Please consult your tax advisor for proper treatment of this information.
For the period ended July 31, 2010, the Fund designates distributions paid during the year as follows:
| (A) Ordinary Income Distribution* (Tax Basis) | 100% |
| (B) Qualifying Dividends1 | 1% |
(A) is based on a percentage of the Fund’s total distributions.
(B) is based on a percentage of the Fund’s ordinary income distributions.
1 Qualifying dividends represent dividends which qualify for the corporate dividends received deduction.
*For the period ended July 31, 2010, certain dividends paid by the Fund may be subject to a maximum tax rate of 15%, as provided for by the Jobs and Growth Tax Relief Reconciliation Act of 2003. The Fund intends to designate up to a maximum amount of $3,300 to be taxed at maximum rate of 15%. Complete information will be computed and reported in conjunction with your 2010 Form 1099-DIV.
48
Report of independent
registered public accounting firm
To the Board of Trustees of Delaware Group® Income Funds and the
Shareholders of Delaware Core Bond Fund:
In our opinion, the accompanying statement of net assets and the related statements of operations and of changes in net assets and the financial highlights present fairly, in all material respects, the financial position of Delaware Core Bond Fund (one of the series constituting Delaware Group Income Funds, hereafter referred to as the “Fund”) at July 31, 2010, and the results of its operations, the changes in its net assets and the financial highlights for the period then ended, in conformity with accounting principles generally accepted in the United States of America. These financial statements and financial highlights (hereafter referred to as “financial statements”) are the responsibility of the Fund’s management; our responsibility is to express an opinion on these financial statements based on our audit. We conducted our audit of these financial statements in accordance with the standards of the Public Company Accounting Oversight Board (United States). Those standards require that we plan and perform the audit to obtain reasonable assurance about whether the financial statements are free of material misstatement. An audit includes examining, on a test basis, evidence supporting the amounts and disclosures in the financial statements, assessing the accounting principles used and significant estimates made by management, and evaluating the overall financial statement presentation. We believe that our audit, which included confirmation of securities at July 31, 2010 by correspondence with the custodian, provides a reasonable basis for our opinion. The statement of operations for the year ended October 31, 2009, the statement of changes in net assets for each of the two years in the period ended October 31, 2009 and the financial highlights for each of the five years in the period ended October 31, 2009 were audited by other independent accountants whose report dated December 22, 2009 expressed an unqualified opinion on those statements.
PricewaterhouseCoopers LLP
Philadelphia, Pennsylvania
September 22, 2010
49
Other Fund information
(Unaudited)
Delaware Core Bond Fund
Proxy Results (Unaudited)
At Joint Special Meetings of Shareholders of Delaware Group® Income Funds (the “Trust”), on behalf of Delaware Core Bond Fund (the “Fund”), the sole shareholder of the Fund voted to elect a Board of Trustees for the Trust at a meeting held on November 12, 2009 and reconvened to March 16, 2010. The sole shareholder of the Fund approved a new investment advisory agreement between the Trust, on behalf of the Fund, and Delaware Management Company by Consent of Sole Shareholder on September 29, 2009. The following people were elected to serve as Independent Trustees: Thomas L. Bennett, John A. Fry, Anthony D. Knerr, Lucinda S. Landreth, Ann R. Leven, Thomas F. Madison, Janet L. Yeomans, and J. Richard Zecher. In addition, Patrick P. Coyne was elected to serve as an Interested Trustee.
The following proposals were submitted for a vote of the shareholders:
1. To elect a Board of Trustees for the Trust.
| | | | | % of | | % of | | | | % of | | % of |
| | | | | Outstanding | | Shares | | | | Outstanding | | Shares |
| | | Shares Voted For | | Shares | | Voted | | Shares Withheld | | Shares | | Voted |
| Thomas L. Bennett | | 177,463,481.025 | | 64.960 | | 96.382 | | 6,662,426.895 | | 2.439 | | 3.618 |
| Patrick P. Coyne | | 177,537,391.529 | | 64.987 | | 96.422 | | 6,588,516.391 | | 2.412 | | 3.578 |
| John A. Fry | | 177,569,351.590 | | 64.999 | | 96.439 | | 6,556,556.330 | | 2.400 | | 3.561 |
| Anthony D. Knerr | | 177,501,127.825 | | 64.974 | | 96.402 | | 6,624,780.095 | | 2.425 | | 3.598 |
| Lucinda S. Landreth | | 177,497,831.093 | | 64.973 | | 96.400 | | 6,628,076.827 | | 2.426 | | 3.600 |
| Ann R. Leven | | 177,337,196.822 | | 64.914 | | 96.313 | | 6,788,711.098 | | 2.485 | | 3.687 |
| Thomas F. Madison | | 177,494,821.896 | | 64.972 | | 96.399 | | 6,631,086.024 | | 2.427 | | 3.601 |
| Janet L. Yeomans | | 177,526,408.755 | | 64.983 | | 96.416 | | 6,599,499.165 | | 2.416 | | 3.584 |
| J. Richard Zecher | | 177,459,458.860 | | 64.959 | | 96.379 | | 6,666,449.060 | | 2.440 | | 3.621 |
50
Change in Independent Registered Public Accounting Firm
Due to independence matters under the Securities and Exchange Commission’s auditor independence rules relating to the January 4, 2010 acquisition of Delaware Investments (including DMC, DDLP and DSC) by Macquarie Group, Ernst & Young LLP (E&Y) has resigned as the independent registered public accounting firm for Delaware Group® Income Funds (the Trust) effective May 20, 2010. At a meeting held on May 20, 2010, the Board of Trustees of the Trust, upon recommendation of the Audit Committee, selected PricewaterhouseCoopers LLP (PwC) to serve as the independent registered public accounting firm for the Trust for the fiscal year ending July 31, 2010. During the fiscal years ended October 31, 2009 and 2008, E&Y’s audit reports on the financ ial statements of the Fund did not contain any adverse opinion or disclaimer of opinion, nor were they qualified or modified as to uncertainty, audit scope, or accounting principles. In addition, there were no disagreements between the Trust and E&Y on accounting principles, financial statements disclosures or audit scope, which, if not resolved to the satisfaction of E&Y, would have caused them to make reference to the disagreement in their reports. Neither the Trust nor anyone on its behalf has consulted with PwC at any time prior to their selection with respect to the application of accounting principles to a specified transaction, either completed or proposed or the type of audit opinion that might be rendered on the Fund’s financial statements.
51
Board of trustees/directors and officers addendum
Delaware Investments® Family of Funds
A mutual fund is governed by a Board of Trustees/Directors (“Trustees”), which has oversight responsibility for the management of a fund’s business affairs. Trustees establish procedures and oversee and review the performance of the investment manager, the distributor, and others who perform services for the fund. The independent fund trustees, in particular, are advocates
| Name, Address, | | Position(s) | | Length of |
| and Birth Date | | Held with Fund(s) | | Time Served |
| Interested Trustees | | | | |
| | | | | |
| Patrick P. Coyne1 | | Chairman, President, | | Chairman and Trustee |
| 2005 Market Street | | Chief Executive Officer, | | since August 16, 2006 |
| Philadelphia, PA 19103 | | and Trustee | | |
| April 1963 | | | | President and |
| | | | | Chief Executive Officer |
| | | | | since August 1, 2006 |
| | | | | |
| | | | | |
| | | | | |
| | | | | |
| | | | | |
| | | | | |
| | | | | |
| | | | | |
| | | | | |
| | | | | |
| | | | | |
| | | | | |
| | | | | |
| | | | | |
| | | | | |
| | | | | |
| | | | | |
| | | | | |
1 Patrick P. Coyne is considered to be an “Interested Trustee” because he is an executive officer of the Fund’s(s’) investment advisor.
52
for shareholder interests. Each trustee has served in that capacity since he or she was elected to or appointed to the Board of Trustees, and will continue to serve until his or her retirement or the election of a new trustee in his or her place. The following is a list of the Trustees and Officers with certain background and related information.
| | | Number of Portfolios in | | |
| Principal Occupation(s) | | Fund Complex Overseen | | Other Directorships |
| During Past 5 Years | | by Trustee or Officer | | Held by Trustee or Officer |
| |
| |
| Patrick P. Coyne has served in | | 81 | | Director |
| various executive capacities | | | | Kaydon Corp. |
| at different times at | | | | |
| Delaware Investments.2 | | | | Board of Governors Member |
| | | | | Investment Company |
| | | | | Institute (ICI) |
| | | | | |
| | | | | Finance Committee Member |
| | | | | St. John Vianney Roman |
| | | | | Catholic Church |
| |
| | | | | Board of Trustees |
| | | | | Agnes Irwin School |
| |
| | | | | Member of Investment |
| | | | | Committee |
| | | | | Cradle of Liberty Council, |
| | | | | BSA |
| | | | | (2007 – 2010) |
| | | | | |
| |
| | | | | |
| | | | | |
| |
2 Delaware Investments is the marketing name for Delaware Management Holdings, Inc. and its subsidiaries, including the Fund’s(s’) investment advisor, principal underwriter, and its transfer agent.
53
Board of trustees/directors and officers addendum
Delaware Investments® Family of Funds
| Name, Address, | | Position(s) | | Length of |
| and Birth Date | | Held with Fund(s) | | Time Served |
| Independent Trustees | | | | |
| |
| Thomas L. Bennett | | Trustee | | Since March 2005 |
| 2005 Market Street | | | | |
| Philadelphia, PA 19103 | | | | |
| October 1947 | | | | |
| |
| |
| |
| |
| |
| |
| |
| |
| |
| |
| John A. Fry | | Trustee | | Since January 2001 |
| 2005 Market Street | | | | |
| Philadelphia, PA 19103 | | | | |
| May 1960 | | | | |
| |
| |
| |
| |
| |
| |
| |
| |
| Anthony D. Knerr | | Trustee | | Since April 1990 |
| 2005 Market Street | | | | |
| Philadelphia, PA 19103 | | | | |
| December 1938 | | | | |
| |
| |
| Lucinda S. Landreth | | Trustee | | Since March 2005 |
| 2005 Market Street | | | | |
| Philadelphia, PA 19103 | | | | |
| June 1947 | | | | |
| |
54
| | | Number of Portfolios in | | |
| Principal Occupation(s) | | Fund Complex Overseen | | Other Directorships |
| During Past 5 Years | | by Trustee or Officer | | Held by Trustee or Officer |
| | | | | |
| |
| Private Investor | | 81 | | Director |
| (March 2004–Present) | | | | Bryn Mawr Bank Corp. (BMTC) |
| | | | | |
| Investment Manager | | | | Chairman of Investment |
| Morgan Stanley & Co. | | | | Committee |
| (January 1984–March 2004) | | | | Pennsylvania Academy of |
| | | | | Fine Arts |
| | | | | |
| | | | | Investment Committee and |
| | | | | Governance Committee |
| | | | | Member |
| | | | | Pennsylvania Horticultural |
| | | | | Society |
| |
| President | | 81 | | Director |
| Drexel University | | | | Community Health Systems |
| (August 2010–Present) | | | | |
| | | | | Director — Ecore |
| President | | | | International |
| Franklin & Marshall College | | | | (2009-2010) |
| (July 2002–July 2010) | | | | |
| | | | | Director — Allied |
| Executive Vice President | | | | Barton Securities Holdings |
| University of Pennsylvania | | | | (2005 to 2008) |
| (April 1995–June 2002) | | | | |
| |
| Founder and | | 81 | | None |
| Managing Director | | | | |
| Anthony Knerr & Associates | | | | |
| (Strategic Consulting) | | | | |
| (1990–Present) | | | | |
| |
| Chief Investment Officer | | 81 | | None |
| Assurant, Inc. (Insurance) | | | | |
| (2002–2004) | | | | |
| | | | | |
| |
55
Board of trustees/directors and officers addendum
Delaware Investments® Family of Funds
| Name, Address, | | Position(s) | | Length of |
| and Birth Date | | Held with Fund(s) | | Time Served |
| Independent Trustees (continued) | | | | |
| |
| Ann R. Leven | | Trustee | | Since October 1989 |
| 2005 Market Street | | | | |
| Philadelphia, PA 19103 | | | | |
| November 1940 | | | | |
| |
| |
| |
| |
| |
| |
| Thomas F. Madison | | Trustee | | Since May 19973 |
| 2005 Market Street | | | | |
| Philadelphia, PA 19103 | | | | |
| February 1936 | | | | |
| |
| |
| |
| |
| |
| |
| |
| |
| | | | | |
| | | | | |
| | | | | |
| | | | | |
| |
| |
| |
| | | | | |
| | | | | |
| | | | | |
| | | | | |
| | | | | |
| | | | | |
| | | | | |
| | | | | |
| |
3 In 1997, several funds managed by Voyageur Fund Managers, Inc. (the “Voyageur Funds”) were incorporated into the Delaware Investments Family of Funds. Mr. Madison served as a director of the Voyageur Funds from 1993 until 1997.
56
| | | Number of Portfolios in | | |
| Principal Occupation(s) | | Fund Complex Overseen | | Other Directorships |
| During Past 5 Years | | by Trustee or Officer | | Held by Trustee or Officer |
| | | | | |
| |
| Consultant | | 81 | | Director and Audit |
| ARL Associates | | | | Committee Chair – |
| (Financial Planning) | | | | Systemax Inc. |
| (1983–Present) | | | | (2001 – 2009) |
| | | | | |
| | | | | Director and Audit |
| | | | | Committee Chairperson – |
| | | | | Andy Warhol Foundation |
| | | | | (1999 – 2007) |
| |
| President and | | 81 | | Director and Chair of |
| Chief Executive Officer | | | | Compensation Committee, |
| MLM Partners, Inc. | | | | Governance Committee |
| (Small Business Investing | | | | Member |
| and Consulting) | | | | CenterPoint Energy |
| (January 1993–Present) | | | | |
| | | | | Lead Director and Chair of |
| | | | | Audit and Governance |
| | | | | Committees, Member of |
| | | | | Compensation Committee |
| | | | | Digital River, Inc. |
| | | | | |
| | | | | Director and Chair of |
| | | | | Governance Committee, |
| | | | | Audit Committee |
| | | | | Member |
| | | | | Rimage Corporation |
| | | | | |
| | | | | Director and Chair of |
| | | | | Compensation Committee |
| | | | | Spanlink Communications |
| | | | | |
| | | | | Lead Director and Member of |
| | | | | Compensation and |
| | | | | Governance Committees |
| | | | | Valmont Industries, Inc. |
| | | | | (1987 – 2010) |
| |
57
Board of trustees/directors and officers addendum
Delaware Investments® Family of Funds
| Name, Address, | | Position(s) | | Length of |
| and Birth Date | | Held with Fund(s) | | Time Served |
| Independent Trustees (continued) | | | | |
| |
| Thomas F. Madison | | | | |
| 2005 Market Street | | | | |
| Philadelphia, PA 19103 | | | | |
| February 1936 | | | | |
| |
| Janet L. Yeomans | | Trustee | | Since April 1999 |
| 2005 Market Street | | | | |
| Philadelphia, PA 19103 | | | | |
| July 1948 | | | | |
| |
| |
| |
| |
| J. Richard Zecher | | Trustee | | Since March 2005 |
| 2005 Market Street | | | | |
| Philadelphia, PA 19103 | | | | |
| July 1940 | | | | |
| |
| |
| | | | | |
| | | | | |
| | | | | |
| | | | | |
| | | | | |
| | | | | |
| | | | | |
| | | | | |
| | | | | |
| | | | | |
| | | | | |
| | | | | |
| | | | | |
| | | | | |
| |
58
| | | Number of Portfolios in | | |
| Principal Occupation(s) | | Fund Complex Overseen | | Other Directorships |
| During Past 5 Years | | by Trustee or Officer | | Held by Trustee or Officer |
| | | | | |
| |
| | | | | Director |
| | | | | Banner Health |
| | | | | (1996 to 2007) |
| | | | | |
| |
| Vice President and Treasurer | | 81 | | Director |
| (January 2006–Present) | | | | Okabena Company |
| Vice President — Mergers & Acquisitions | | | | |
| (January 2003–January 2006), and | | | | |
| Vice President | | | | |
| (July 1995–January 2003) | | | | |
| 3M Corporation | | | | |
| |
| Founder | | 81 | | Director and Audit |
| Investor Analytics | | | | Committee Member |
| (Risk Management) | | | | Investor Analytics |
| (May 1999–Present) | | | | |
| | | | | |
| Founder | | | | Director |
| Sutton Asset Management | | | | Oxigene, Inc. |
| (Hedge Fund) | | | | (2003 to 2008) |
| (September 1996–Present) | | | | |
| | | | | |
| | | | | |
| | | | | |
| | | | | |
| | | | | |
| | | | | |
| | | | | |
| | | | | |
| | | | | |
| | | | | |
| | | | | |
| |
59
Board of trustees/directors and officers addendum
Delaware Investments® Family of Funds
| Name, Address, | | Position(s) | | Length of |
| and Birth Date | | Held with Fund(s) | | Time Served |
| Officers | | | | |
| | | | | |
| David F. Connor | | Vice President, | | Vice President since |
| 2005 Market Street | | Deputy General | | September 2000 |
| Philadelphia, PA 19103 | | Counsel, and Secretary | | and Secretary since |
| December 1963 | | | | October 2005 |
| |
| |
| Daniel V. Geatens | | Vice President | | Treasurer |
| 2005 Market Street | | and Treasurer | | since October 25, 2007 |
| Philadelphia, PA 19103 | | | | |
| October 1972 | | | | |
| |
| David P. O’Connor | | Senior Vice President, | | Senior Vice President, |
| 2005 Market Street | | General Counsel, | | General Counsel, and |
| Philadelphia, PA 19103 | | and Chief Legal Officer | | Chief Legal Officer |
| February 1966 | | | | since October 2005 |
| |
| Richard Salus | | Senior Vice President | | Chief Financial Officer |
| 2005 Market Street | | and Chief Financial Officer | | since November 2006 |
| Philadelphia, PA 19103 | | | | |
| October 1963 | | | | |
| |
The Statement of Additional Information for the Fund(s) includes additional information about the Trustees and Officers and is available, without charge, upon request by calling 800 523-1918.
60
| | | Number of Portfolios in | | |
| Principal Occupation(s) | | Fund Complex Overseen | | Other Directorships |
| During Past 5 Years | | by Trustee or Officer | | Held by Trustee or Officer |
| |
| |
| David F. Connor has served as | | 81 | | None4 |
| Vice President and Deputy | | | | |
| General Counsel of | | | | |
| Delaware Investments | | | | |
| since 2000. | | | | |
| |
| Daniel V. Geatens has served | | 81 | | None4 |
| in various capacities at | | | | |
| different times at | | | | |
| Delaware Investments. | | | | |
| |
| David P. O’Connor has served in | | 81 | | None4 |
| various executive and legal | | | | |
| capacities at different times | | | | |
| at Delaware Investments. | | | | |
| |
| Richard Salus has served in | | 81 | | None4 |
| various executive capacities | | | | |
| at different times at | | | | |
| Delaware Investments. | | | | |
| |
4 David F. Connor, Daniel V. Geatens, David P. O’Connor, and Richard Salus serve in similar capacities for the six portfolios of the Optimum Fund Trust, which have the same investment advisor, principal underwriter, and transfer agent as the registrant.
61
About the organization
| Board of trustees | | | |
| | | | |
Patrick P. Coyne
Chairman, President, and
Chief Executive Officer
Delaware Investments®
Family of Funds
Philadelphia, PA Thomas L. Bennett
Private Investor
Rosemont, PA John A. Fry
President
Drexel University
Philadelphia, PA | Anthony D. Knerr
Founder and Managing
Director
Anthony Knerr &
Associates
New York, NY Lucinda S. Landreth
Former Chief Investment
Officer
Assurant, Inc.
Philadelphia, PA | Ann R. Leven
Consultant
ARL Associates
New York, NY Thomas F. Madison
President and
Chief Executive Officer
MLM Partners, Inc.
Minneapolis, MN | Janet L. Yeomans
Vice President and
Treasurer
3M Corporation
St. Paul, MN J. Richard Zecher
Founder
Investor Analytics
Scottsdale, AZ |
| | | | |
| Affiliated officers | | | |
| | | | |
David F. Connor
Vice President, Deputy
General Counsel, and
Secretary
Delaware Investments
Family of Funds
Philadelphia, PA | Daniel V. Geatens
Vice President and
Treasurer
Delaware Investments
Family of Funds
Philadelphia, PA | David P. O’Connor
Senior Vice President,
General Counsel,
and Chief Legal Officer
Delaware Investments
Family of Funds
Philadelphia, PA | Richard Salus
Senior Vice President and
Chief Financial Officer
Delaware Investments
Family of Funds
Philadelphia, PA |
This annual report is for the information of Delaware Core Bond Fund shareholders, but it may be used with prospective investors when preceded or accompanied by a current prospectus for Delaware Core Bond Fund and the Delaware Investments Fund fact sheet for the most recently completed calendar quarter. These documents are available at www.delawareinvestments.com. The prospectus sets forth details about charges, expenses, investment objectives, and operating policies of the investment company. You should read the prospectus carefully before you invest. The figures in this report represent past results that are not a guarantee of future results. The return and principal value of an investment in the investment company will fluctuate so that shares, when redeemed, may be worth more or less than their original cost. |
Delaware Investments is the marketing name of Delaware Management Holdings, Inc. and its subsidiaries. The Fund files its complete schedule of portfolio holdings with the Securities and Exchange Commission (SEC) for the first and third quarters of each fiscal year on Form N-Q. The Fund’s Forms N-Q, as well as a description of the policies and procedures that the Fund uses to determine how to vote proxies (if any) relating to portfolio securities are available without charge (i) upon request, by calling 800 523-1918; and (ii) on the SEC’s Web site at www.sec.gov. In addition, a description of the policies and procedures that the Fund uses to determine how to vote proxies (if any) relating to portfolio securities and the Fund’s Schedule of Investments are available without charge on the Fund’s Web site at www.delawareinvestments.com. The Fund’s Forms N-Q may be reviewed and copied at the SEC’s Public Reference Room in Washington, D.C.; information on the o peration of the Public Reference Room may be obtained by calling 800 SEC-0330. Information (if any) regarding how the Fund voted proxies relating to portfolio securities during the most recently disclosed 12-month period ended June 30 is available without charge (i) through the Fund’s Web site at www.delawareinvestments.com; and (ii) on the SEC’s Web site at www.sec.gov. |
Annual report Delaware Corporate Bond Fund
Delaware Extended Duration Bond Fund July 31, 2010 Fixed income mutual funds |
This annual report is for the information of Delaware Corporate Bond Fund and Delaware Extended Duration Bond Fund shareholders, but it may be used with prospective investors when preceded or accompanied by a current prospectus for Delaware Corporate Bond Fund and Delaware Extended Duration Bond Fund. The figures in the annual report for Delaware Corporate Bond Fund and Delaware Extended Duration Bond Fund represent past results, which are not a guarantee of future results. The return and principal value of an investment in the Funds will fluctuate so that shares, when redeemed, may be worth more or less than their original cost. Current performance may be higher or lower than the performance data quoted.
You should consider the investment objectives, risks, charges, and expenses of the Funds carefully before investing. The Delaware Corporate Bond Fund and Delaware Extended Duration Bond Fund prospectus contains this and other important information about the Funds. Prospectuses for all open-end funds in the Delaware Investments® Family of Funds are available from your financial advisor, online at www.delawareinvestments.com, or by phone at 800 523-1918. Please read the prospectus carefully before you invest or send money.
|
You can obtain shareholder reports and prospectuses online instead of in the mail.
Visit www.delawareinvestments.com/edelivery. |
Experience Delaware Investments
Delaware Investments is committed to the pursuit of consistently superior asset management and unparalleled client service. We believe in our investment processes, which seek to deliver consistent results, and in convenient services that help add value for our clients.
If you are interested in learning more about creating an investment plan, contact your financial advisor.
You can learn more about Delaware Investments or obtain a prospectus for Delaware Corporate Bond Fund and Delaware Extended Duration Bond Fund at www.delawareinvestments.com.
| Manage your investments online |
- 24-hour access to your account information
- Obtain share prices
- Check your account balance and recent transactions
- Request statements or literature
- Make purchases and redemptions
|
Delaware Management Holdings, Inc., and its subsidiaries (collectively known by the marketing name of Delaware Investments) are wholly owned subsidiaries of Macquarie Group Limited, a global provider of banking, financial, advisory, investment and funds management services.
Investments in Delaware Corporate Bond Fund and Delaware Extended Duration Bond Fund are not and will not be deposits with or liabilities of Macquarie Bank Limited ABN 46 008 583 542 and its holding companies, including their subsidiaries or related companies (Macquarie Group), and are subject to investment risk, including possible delays in repayment and loss of income and capital invested. No Macquarie Group company guarantees or will guarantee the performance of the Funds, the repayment of capital from the Funds, or any particular rate of return.
| Table of contents | |
| Portfolio management review | 1 |
| Performance summaries | 4 |
| Disclosure of Fund expenses | 12 |
| Security types | 14 |
| Statements of net assets | 16 |
| Statements of operations | 48 |
| Statements of changes in net assets | 50 |
| Financial highlights | 54 |
| Notes to financial statements | 74 |
| Report of independent registered | |
| public accounting firm | 97 |
| Other Fund information | 98 |
| Board of trustees/directors and | |
| officers addendum | 102 |
| About the organization | 112 |
Unless otherwise noted, views expressed herein are current as of July 31, 2010, and are subject to change.
Funds are not FDIC insured and are not guaranteed. It is possible to lose the principal amount invested.
Mutual fund advisory services provided by Delaware Management Company, a series of Delaware Management Business Trust, which is a registered investment advisor. Delaware Investments, a member of Macquarie Group, refers to Delaware Management Holdings, Inc. and its subsidiaries, including the Funds’ distributor, Delaware Distributors, L.P. Macquarie Group refers to Macquarie Group Limited and its subsidiaries and affiliates worldwide.
© 2010 Delaware Management Holdings, Inc.
All third-party trademarks cited are the property of their respective owners.
| Portfolio management review | | |
| Delaware Corporate Bond Fund and Delaware Extended Duration Bond Fund | | Aug. 10, 2010 |
| Performance preview (for the period ended July 31, 2010) | | | | |
| Delaware Corporate Bond Fund (Class A shares) | | 1-year return | | +17.91% |
| Barclays Capital U.S. Corporate Investment Grade Index (benchmark) | | 1-year return | | +13.30% |
Past performance does not guarantee future results.
For complete, annualized performance for Delaware Corporate Bond Fund, please see the table on page 4. The performance of Class A shares excludes the applicable sales charge and reflects the reinvestment of all distributions. Index performance returns do not reflect any management fees, transaction costs, or expenses. Indices are unmanaged and one cannot invest directly in an index. |
| Delaware Extended Duration Bond Fund (Class A shares) | | 1-year return | | +22.00% |
| Barclays Capital Long U.S. Corporate Index (benchmark) | | 1-year return | | +15.73% |
Past performance does not guarantee future results.
For complete, annualized performance for Delaware Extended Duration Bond Fund, please see the table on page 8. The performance of Class A shares excludes the applicable sales charge and reflects the reinvestment of all distributions. Index performance returns do not reflect any management fees, transaction costs, or expenses. Indices are unmanaged and one cannot invest directly in an index. |
The fiscal year ended July 31, 2010 began with substantial improvements in liquidity, stability, and investor risk appetite, particularly compared with the chaos and turmoil that marked the Funds’ previous fiscal year. Many investors took advantage of positive news during the period, though they were also quick to step back on any indications of significant global economic problems.
Fund performance
Delaware Corporate Bond Fund Class A shares returned +17.91% at net asset value and +12.55% at maximum offer price (both returns include distributions reinvested) for the fiscal year ended July 31, 2010. For the same period, the Fund’s benchmark, the Barclays Capital U.S. Corporate Investment Grade Index, advanced +13.30%. For complete annualized performance for Delaware Corporate Bond Fund, please see the table on page 4.
Delaware Extended Duration Bond Fund Class A shares returned +22.00% at net asset value and +16.58% at maximum offer price (both returns include distributions reinvested)
Corporate bonds benefited from strong demand throughout much of the fiscal period, as rates in the short-term and Treasury markets remained near historic lows. The sector also rallied as investors seemed to grow increasingly confident that the financial sector was indeed healthy once again. Conditions were generally constructive from the beginning of the period through the first three months of 2010.
1
Portfolio management review
Delaware Corporate Bond Fund and Delaware Extended Duration Bond Fund
for the fiscal year ended July 31, 2010. For the same period, the Fund’s benchmark, the Barclays Capital Long U.S. Corporate Index, returned +15.73%. For complete annualized performance for Delaware Extended Duration Bond Fund, please see the table on page 8.
A rally, a step back, then another rally
Following the unsteady conditions of the previous fiscal period, capital markets largely reopened, allowing companies to refinance maturing debt and removing the specter of possible large default rates that lingered during the credit crisis. Default rates subsequently dropped, particularly among high yield corporate bonds, declining to between 5% and 6% from highs near 13% in 2009. They are expected to hover near 3% in 2011 (default rate data: Moody’s).
The banking sector began rebounding from its prior losses, with U.S. banks largely emerging from the government-led “stress tests” and capital evaluations. Many banks also introduced clear recapitalization plans, which typically included increasing common equity and shrinking inflated leverage levels.
Corporate bonds benefited from strong demand throughout much of the fiscal period, as rates in the short-term and Treasury markets remained near historic lows. The sector also rallied as investors seemed to grow increasingly confident that the financial sector was indeed healthy once again. Conditions were generally constructive from the beginning of the period through the first three months of 2010.
Beginning in April 2010, however, investors seemed to turn their attention to what many economists believed were structural debt problems within certain euro zone governments — problems that could potentially create a drag on a nascent economic recovery across the developed world. The European Union, in
We expect credit markets to generally be range-bound until there’s more clarity about the direction of the global economy, and especially the United States, China, and the euro zone. Are we moving constructively ahead or toward a double-dip recession? It may be some time before the answer is obvious. In the meantime, we remain confident that our bottom-up, research-driven investing style should continue providing investors a risk-adjusted means of participating in the fixed income markets.
2
conjunction with the International Monetary Fund, eventually backed a massive rescue fund for euro zone members, but not before investor sentiment turned sour. Greece bore the brunt of investor concern, as investors demanded upward of 1,000 basis points (or 10 percentage points) of protection against default in the credit derivative swap market. Investors also demanded premiums for Portuguese, Italian, Irish, and Spanish government default risk.
The corporate bond market
The corporate bond market as a whole generally benefited from a slowly recovering economy and an appetite for risk in the capital markets. Relative calm distinguished this fiscal year from the turbulence of the Funds’ prior fiscal year. As noted above, high yield bond default rates shrank, largely in response to fresh refinance opportunities in revitalized capital markets.
We also began seeing improved corporate earnings. Many companies managed to generate positive cash flows and improve productivity by reducing costs (unfortunately at the expense of laying off workers), and capital expenditures, maintaining a trend that we’ve seen throughout much of the economic crisis. As companies repaired their balance sheets, they enjoyed lower leverage and strong cash balances. Disappointingly, however, even a brief inventory rebuilding phase did not lead them to create jobs or offer optimistic forecasts.
High yield allocation aids the Funds’ performance
The Funds allocated between 15% and 18% of their investments to high-yield debt in the form of bonds, loans, emerging market, and convertible holdings during the Funds’ fiscal year. This allocation did relatively well during the fiscal year, contributing to both Fund's outperforming their benchmark indices during the fiscal periods.
We believe that larger, better-capitalized firms typically stand out among the survivors of economic downturns, as they feed on weaker companies and capitalize on their access to capital and scale. That generally proved true this year in the communications sector, where the Funds benefited from positive performance among wireless and cable companies, as well as in consumer cyclical companies that pared back expenses and refinanced debt.
Both Funds also benefited from exposure to master limited partnership entities in the energy sector. Though these investments were at the low end of the investment grade ratings scale, given their higher leverage REIT-like balance sheets, the structural importance and performance of their infrastructure assets served them well.
The Funds largely avoided bonds issued by reinsurance companies, on the belief that these issues generally paid too little for the risk involved. However, these bonds performed relatively well, and our underweight detracted from the Funds’ performance versus their benchmark indices. Our underweight in such low-beta sectors as pharmaceuticals, healthcare, and food and beverages also pushed the Funds’ performance lower versus their benchmarks.
The road ahead
We expect credit markets to generally be range-bound until there’s more clarity about the direction of the global economy, and especially the U.S., China, and the euro zone. Are we moving constructively ahead or toward a double-dip recession? It may be some time before the answer is obvious. In the meantime, we remain confident that our bottom-up, research-driven investing style should continue providing investors a risk-adjusted means of participating in the fixed income markets.
3
| Performance summaries | |
| Delaware Corporate Bond Fund | July 31, 2010 |
The performance data quoted represent past performance; past performance does not guarantee future results. Investment return and principal value will fluctuate so your shares, when redeemed, may be worth more or less than their original cost. Please obtain the performance data current for the most recent month end by calling 800 523-1918 or visiting our Web site at www.delawareinvestments.com/performance. Current performance may be lower or higher than the performance data quoted.
You should consider the investment objectives, risks, charges, and expenses of the investment company carefully before investing. The Delaware Corporate Bond Fund prospectus contains this and other important information about the investment company. Please request a prospectus through your financial advisor or by calling 800 523-1918 or visiting our Web site at www.delawareinvestments.com. Read the prospectus carefully before you invest or send money.
| Fund performance | | Average annual total returns through July 31, 2010 |
| | | 1 year | | 5 years | | 10 years | | Lifetime |
| Class A (Est. Sept. 15, 1998) | | | | | | |
| Excluding sales charge | | +17.91% | | +7.00% | | +8.33% | | n/a |
| Including sales charge | | +12.55% | | +6.03% | | +7.83% | | n/a |
| Class B (Est. Sept. 15, 1998) | | | | | | |
| Excluding sales charge | | +17.04% | | +6.25% | | +7.68% | | n/a |
| Including sales charge | | +13.04% | | +6.01% | | +7.68% | | n/a |
| Class C (Est. Sept. 15, 1998) | | | | | | |
| Excluding sales charge | | +17.01% | | +6.24% | | +7.55% | | n/a |
| Including sales charge | | +16.01% | | +6.24% | | +7.55% | | n/a |
| Class R (Est. June 2, 2003) | | | | | | |
| Excluding sales charge | | +17.60% | | +6.77% | | n/a | | +6.23% |
| Including sales charge | | +17.60% | | +6.77% | | n/a | | +6.23% |
| Institutional Class (Est. Sept. 15, 1998) | | | | | | |
| Excluding sales charge | | +18.40% | | +7.34% | | +8.63% | | n/a |
| Including sales charge | | +18.40% | | +7.34% | | +8.63% | | n/a |
Returns reflect the reinvestment of all distributions and any applicable sales charges as noted in the following paragraphs.
Performance for Class B and C shares, excluding sales charges, assumes either that contingent deferred sales charges did not apply or that the investment was not redeemed.
Expense limitations were in effect for certain classes during the periods shown in the “Fund performance” chart and in the “Performance of a $10,000 investment” chart. The current expenses for each class are listed on the “Fund expense ratios” chart. (Note that all charts and graphs referred to in the “Performance summary” section of this report are found on pages 4 through 7.) Performance would have been lower had the expense limitations not been in effect.
4
The Fund offers Class A, B, C, R, and Institutional Class shares.
Class A shares are sold with a maximum front-end sales charge of up to 4.50%, and have an annual distribution and service fee of up to 0.30% of average daily net assets. This fee has been contractually limited to 0.25% of average daily net assets from Dec. 1, 2009, through Nov. 30, 2010.
Class B shares may only be purchased through dividend reinvestment and certain permitted exchanges as described in the prospectus. Please see the prospectus for additional information on Class B purchase and sales charges. Class B shares have a contingent deferred sales charge that declines from 4.00% to zero depending on the period of time the shares are held.
Class B shares will automatically convert to Class A shares on a quarterly basis approximately eight years after purchase. They are also subject to an annual distribution and service fee of up to 1.00% of average daily net assets.
Ten-year performance figures for Class B shares reflect conversion to Class A shares after approximately eight years.
Class C shares are sold with a contingent deferred sales charge of 1.00% if redeemed during the first 12 months. They are also subject to an annual distribution and service fee of up to 1.00% of average daily net assets.
Class R shares are available only for certain retirement plan products. They are sold without a sales charge and have an annual distribution and service fee of up to 0.60% of average daily net assets, which has been limited contractually to 0.50% from Dec. 1, 2009, through Nov. 30, 2010.
Institutional Class shares are available without sales or asset-based distribution charges only to certain eligible institutional accounts.
The “Fund performance” table and the “Performance of a $10,000 investment” graph do not reflect the deduction of taxes the shareholder would pay on Fund distributions or redemptions of Fund shares.
Fixed income securities and bond funds can lose value, and investors can lose principal, as interest rates rise. They also may be affected by economic conditions that hinder an issuer’s ability to make interest and principal payments on its debt.
The Fund may also be subject to prepayment risk, the risk that the principal of a fixed income security that is held by the Fund may be prepaid prior to maturity, potentially forcing the Fund to reinvest that money at a lower interest rate.
High yielding, noninvestment grade bonds (junk bonds) involve higher risk than investment grade bonds.
The Fund may invest in derivatives, which may involve additional expenses and are subject to risk, including the risk that an underlying security or securities index moves in the opposite direction from what the portfolio manager anticipated. A derivative transaction depends upon the counterparties’ ability to fulfill their contractual obligations.
International investments entail risks not ordinarily associated with U.S. investments including fluctuation in currency values, differences in accounting principles, or economic or political instability in other nations. Investing in emerging markets can be riskier than investing in established foreign markets due to increased volatility and lower trading volume.
The Fund may experience portfolio turnover in excess of 100%, which could result in higher transaction costs and tax liability.
5
Performance summaries
Delaware Corporate Bond Fund
The Fund’s expense ratios, as described in the most recent prospectus, are disclosed in the following “Fund expense ratios” chart. Delaware Investments has agreed to (1) voluntarily waive all or a portion of its investment advisory fees and/or reimburse certain expenses (excluding certain expenses) to prevent total annual fund operating expenses from exceeding 0.70% of the Fund’s average daily net assets from Dec. 1, 2009, until the voluntary cap is discontinued; and (2) contractually limit the Class A and R shares distribution and service fees from Dec. 1, 2009, through Nov. 30, 2010, to 0.25% and 0.50%. Please see the most recent prospectus and any applicable supplement(s) for additional information on these fee waivers and/or reimbursements.
| Fund expense ratios | Class A | | Class B | | Class C | | Class R | | Institutional Class |
| Total annual operating expenses | 1.11% | | 1.81% | | 1.81% | | 1.41% | | 0.81% |
| (without fee waivers) | | | | | | | | | |
| Net expenses | 1.06% | | 1.81% | | 1.81% | | 1.31% | | 0.81% |
| (including fee waivers, if any) | | | | | | | | | |
| Type of waiver | Contractual | | Voluntary | | Voluntary | | Contractual | | Voluntary |
| | and voluntary | | | | | | and voluntary | | |
6
Performance of a $10,000 investment
Average annual total returns from July 31, 2000, through July 31, 2010
| For period beginning July 31, 2000, through July 31, 2010 | Starting value | Ending value |
| | Delaware Corporate Bond Fund — Class A Shares | $9,550 | $21,231 |
| | Barclays Capital U.S. Corporate
Investment Grade Index | $10,000 | $19,627 |
The chart assumes $10,000 invested in the Fund on July 31, 2000, and includes the effect of a 4.50% front-end sales charge and the reinvestment of all distributions. Please note additional details on these fees in the “Performance summary” section of this report, which includes pages 4 through 7.
The chart also assumes $10,000 invested in the Barclays Capital U.S. Corporate Investment Grade Index as of July 31, 2000.
The Barclays Capital U.S. Corporate Investment Grade Index is composed of U.S. dollar–denominated, investment grade, SEC-registered corporate bonds issued by industrial, utility, and financial companies. All bonds in the index have at least one year to maturity.
Index performance returns do not reflect any management fees, transaction costs or expenses. Indices are unmanaged and one cannot invest directly in an index. Past performance is not a guarantee of future results.
Performance of other Fund classes will vary due to different charges and expenses.
The “Fund performance” chart and the “Performance of a $10,000 investment” graph do not reflect the deduction of taxes shareholders would pay on Fund distributions or redemptions of Fund shares.
| | | Nasdaq symbols | | CUSIPs | |
| Class A | | | DGCAX | | | 245908785 | |
| Class B | | | DGCBX | | | 245908777 | |
| Class C | | | DGCCX | | | 245908769 | |
| Class R | | | DGCRX | | | 245908744 | |
| Institutional Class | | | DGCIX | | | 245908751 | |
7
| Performance summaries | |
| Delaware Extended Duration Bond Fund | July 31, 2010 |
The performance data quoted represent past performance; past performance does not guarantee future results. Investment return and principal value will fluctuate so your shares, when redeemed, may be worth more or less than their original cost. Please obtain the performance data current for the most recent month end by calling 800 523-1918 or visiting our Web site at www.delawareinvestments.com/performance. Current performance may be lower or higher than the performance data quoted.
You should consider the investment objectives, risks, charges, and expenses of the investment company carefully before investing. The Delaware Extended Duration Bond Fund prospectus contains this and other important information about the investment company. Please request a prospectus through your financial advisor or by calling 800 523-1918 or visiting our Web site at www.delawareinvestments.com. Read the prospectus carefully before you invest or send money.
| Fund performance | | Average annual total returns through July 31, 2010 |
| | | 1 year | | 5 years | | 10 years | | Lifetime |
| Class A (Est. Sept. 15, 1998) | | | | | | |
| Excluding sales charge | | +22.00% | | +8.00% | | +9.99% | | n/a |
| Including sales charge | | +16.58% | | +7.01% | | +9.48% | | n/a |
| Class B (Est. Sept. 15, 1998) | | | | | | |
| Excluding sales charge | | +21.13% | | +7.21% | | +9.31% | | n/a |
| Including sales charge | | +17.13% | | +6.98% | | +9.31% | | n/a |
| Class C (Est. Sept. 15, 1998) | | | | | | |
| Excluding sales charge | | +20.91% | | +7.20% | | +9.15% | | n/a |
| Including sales charge | | +19.91% | | +7.20% | | +9.15% | | n/a |
| Class R (Est. Oct. 1, 2005) | | | | | | |
| Excluding sales charge | | +21.48% | | n/a | | n/a | | +8.12% |
| Including sales charge | | +21.48% | | n/a | | n/a | | +8.12% |
| Institutional Class (Est. Sept. 15, 1998) | | | | | | |
| Excluding sales charge | | +22.33% | | +8.28% | | +10.26% | | n/a |
| Including sales charge | | +22.33% | | +8.28% | | +10.26% | | n/a |
Returns reflect the reinvestment of all distributions and any applicable sales charges as noted in the following paragraphs.
Performance for Class B and C shares, excluding sales charges, assumes either that contingent deferred sales charges did not apply or that the investment was not redeemed.
Expense limitations were in effect for certain classes during the periods shown in the “Fund performance” chart and in the “Performance of a $10,000 investment” chart. The current expenses for each class are listed on the “Fund expense ratios” chart. (Note that all charts and graphs referred to in the “Performance summary” section of this report are found on pages 8 through 11.) Performance would have been lower had the expense limitations not been in effect.
8
The Fund offers Class A, B, C, R, and Institutional Class shares.
Class A shares are sold with a maximum front-end sales charge of up to 4.50%, and have an annual distribution and service fee of up to 0.30% of average daily net assets. This fee has been contractually limited to 0.25% of average daily net assets from Dec. 1, 2009 through Nov. 30, 2010.
Class B shares may only be purchased through dividend reinvestment and certain permitted exchanges as described in the prospectus. Please see the prospectus for additional information on Class B purchase and sales charges. Class B shares have a contingent deferred sales charge that declines from 4.00% to zero depending on the period of time the shares are held.
Class B shares will automatically convert to Class A shares on a quarterly basis approximately eight years after purchase. They are also subject to an annual distribution and service fee of up to 1.00% of average daily net assets.
Ten-year performance figures for Class B shares reflect conversion to Class A shares after approximately eight years.
Class C shares are sold with a contingent deferred sales charge of 1.00% if redeemed during the first 12 months. They are also subject to an annual distribution and service fee of up to 1.00% of average daily net assets.
Class R shares are available only for certain retirement plan products. They are sold without a sales charge and have an annual distribution and service fee of up to 0.60% of average daily net assets, which has been limited contractually to 0.50% from Dec. 1, 2009, through Nov. 30, 2010.
Institutional Class shares are available without sales or asset-based distribution charges only to certain eligible institutional accounts.
The “Fund performance” table and the “Performance of a $10,000 investment” graph do not reflect the deduction of taxes the shareholder would pay on Fund distributions or redemptions of Fund shares.
Instances of high double-digit returns are unusual, cannot be sustained, and were primarily achieved during favorable market conditions.
Fixed income securities and bond funds can lose value, and investors can lose principal, as interest rates rise. They also may be affected by economic conditions that hinder an issuer’s ability to make interest and principal payments on its debt.
The Fund may also be subject to prepayment risk, the risk that the principal of a fixed income security that is held by the Fund may be prepaid prior to maturity, potentially forcing the Fund to reinvest that money at a lower interest rate.
High yielding, noninvestment grade bonds (junk bonds) involve higher risk than investment grade bonds.
The Fund may invest in derivatives, which may involve additional expenses and are subject to risk, including the risk that an underlying security or securities index moves in the opposite direction from what the portfolio manager anticipated. A derivative transaction depends upon the counterparties’ ability to fulfill their contractual obligations.
International investments entail risks not ordinarily associated with U.S. investments including fluctuation in currency values, differences in accounting principles, or economic or political instability in other nations. Investing in emerging markets can be riskier than investing in established foreign markets due to increased volatility and lower trading volume.
The Fund may experience portfolio turnover in excess of 100%, which could result in higher transaction costs and tax liability.
9
Performance summaries
Delaware Extended Duration Bond Fund
The Fund’s expense ratios, as described in the most recent prospectus, are disclosed in the following “Fund expense ratios” chart. Delaware Investments has agreed to (1) voluntarily waive all or a portion of its investment advisory fees and/or reimburse certain expenses (excluding certain expenses) to prevent total annual fund operating expenses from exceeding 0.70% of the Fund’s average daily net assets from Dec. 1, 2009, until the voluntary cap is discontinued; and (2) contractually limit the Class A and R shares distribution and service fees from Dec. 1, 2009, through Nov. 30, 2010, to 0.25% and 0.50%. Please see the most recent prospectus and any applicable supplement(s) for additional information on these fee waivers and/or reimbursements.
| Fund expense ratios | Class A | | Class B | | Class C | | Class R | | Institutional Class |
| Total annual operating expenses | 1.29 | % | | 1.99 | % | | 1.99 | % | | 1.59 | % | | 0.99 | % |
| (without fee waivers) | | | | | | | | | | | | | | |
| Net expenses | 1.24 | % | | 1.99 | % | | 1.99 | % | | 1.49 | % | | 0.99 | % |
| (including fee waivers, if any) | | | | | | | | | | | | | | |
| Type of waiver | Contractual | | Voluntary | | Voluntary | | Contractual | | Voluntary |
| | and voluntary | | | | | | | and voluntary | | |
10
Performance of a $10,000 investment
Average annual total returns from July 31, 2000, through July 31, 2010
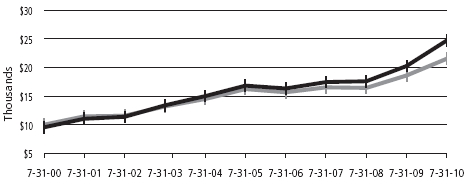
| For period beginning July 31, 2000, through July 31, 2010 | Starting value | Ending value |
| | Delaware Extended Duration Bond Fund —
Class A Shares | $9,550 | $24,709 |
| | Barclays Capital Long U.S. Corporate Index | $10,000 | $21,522 |
The chart assumes $10,000 invested in the Fund on July 31, 2000, and includes the effect of a 4.50% front-end sales charge and the reinvestment of all distributions. Please note additional details on these fees in the “Performance summary” section of this report, which includes pages 8 through 11.
The chart also assumes $10,000 invested in the Barclays Capital Long U.S. Corporate Index as of July 31, 2000.
The Barclays Capital Long U.S. Corporate Index is composed of U.S. dollar–denominated, investment grade, SEC-registered corporate bonds issued by industrial, utility, and financial companies. All bonds in the index have at least 10 years to maturity.
Index performance returns do not reflect any management fees, transaction costs or expenses. Indices are unmanaged and one cannot invest directly in an index. Past performance is not a guarantee of future results.
Performance of other Fund classes will vary due to different charges and expenses.
The “Fund performance” chart and the “Performance of a $10,000 investment” graph do not reflect the deduction of taxes shareholders would pay on Fund distributions or redemptions of Fund shares.
| | | Nasdaq symbols | | CUSIPs | |
| Class A | | DEEAX | | 245908835 | |
| Class B | | DEEBX | | 245908827 | |
| Class C | | DEECX | | 245908819 | |
| Class R | | DEERX | | 245908728 | |
| Institutional Class | | DEEIX | | 245908793 | |
11
Disclosure of Fund expenses
For the six-month period February 1, 2010 to July 31, 2010
As a shareholder of a Fund, you incur two types of costs: (1) transaction costs, including sales charges (loads) on purchase payments, reinvested dividends, or other distributions; redemption fees; and exchange fees; and (2) ongoing costs, including management fees; distribution and/or service (12b-1) fees; and other Fund expenses. These following examples are intended to help you understand your ongoing costs (in dollars) of investing in a Fund and to compare these costs with the ongoing costs of investing in other mutual funds.
The examples are based on an investment of $1,000 invested at the beginning of the period and held for the entire six-month period from February 1, 2010 to July 31, 2010.
Actual expenses
The first section of the tables shown, “Actual Fund return,” provides information about actual account values and actual expenses. You may use the information in this section of the table, together with the amount you invested, to estimate the expenses that you paid over the period. Simply divide your account value by $1,000 (for example, an $8,600 account value divided by $1,000 = 8.6), then multiply the result by the number in the first section under the heading entitled “Expenses Paid During Period” to estimate the expenses you paid on your account during this period.
Hypothetical example for comparison purposes
The second section of the tables shown, “Hypothetical 5% return,” provides information about hypothetical account values and hypothetical expenses based on the Funds’ actual expense ratios and an assumed rate of return of 5% per year before expenses, which is not the Funds’ actual return. The hypothetical account values and expenses may not be used to estimate the actual ending account balance or expenses you paid for the period. You may use this information to compare the ongoing costs of investing in the Fund and other funds. To do so, compare this 5% hypothetical example with the 5% hypothetical examples that appear in the shareholder reports of the other funds.
Please note that the expenses shown in the tables are meant to highlight your ongoing costs only and do not reflect any transactional costs, such as sales charges (loads), redemption fees, or exchange fees. Therefore, the second section of each table is useful in comparing ongoing costs only, and will not help you determine the relative total costs of owning different funds. In addition, if these transactional costs were included, your costs would have been higher. The Funds’ expenses shown in the tables reflect fee waivers in effect. The expenses shown in each table assume reinvestment of all dividends and distributions.
12
Delaware Corporate Bond Fund
Expense analysis of an investment of $1,000
| | | Beginning | | Ending | | | | | Expenses |
| | | Account Value | | Account Value | | Annualized | | Paid During Period |
| | | 2/1/10 | | 7/31/10 | | Expense Ratio | | 2/1/10 to 7/31/10* |
| Actual Fund return | | | | | | | | | | | | |
| Class A | | $ | 1,000.00 | | | $ | 1,061.60 | | | 0.95 | % | | $ | 4.86 | |
| Class B | | | 1,000.00 | | | | 1,057.70 | | | 1.70 | % | | | 8.67 | |
| Class C | | | 1,000.00 | | | | 1,059.40 | | | 1.70 | % | | | 8.68 | |
| Class R | | | 1,000.00 | | | | 1,060.20 | | | 1.20 | % | | | 6.13 | |
| Institutional Class | | | 1,000.00 | | | | 1,064.60 | | | 0.70 | % | | | 3.58 | |
| Hypothetical 5% return (5% return before expenses) | | | | | | | | | | | |
| Class A | | $ | 1,000.00 | | | $ | 1,020.08 | | | 0.95 | % | | $ | 4.76 | |
| Class B | | | 1,000.00 | | | | 1,016.36 | | | 1.70 | % | | | 8.50 | |
| Class C | | | 1,000.00 | | | | 1,016.36 | | | 1.70 | % | | | 8.50 | |
| Class R | | | 1,000.00 | | | | 1,018.84 | | | 1.20 | % | | | 6.01 | |
| Institutional Class | | | 1,000.00 | | | | 1,021.32 | | | 0.70 | % | | | 3.51 | |
| | |
Delaware Extended Duration Bond Fund
Expense analysis of an investment of $1,000 |
| | | | | | | | | |
| | | Beginning | | Ending | | | | | Expenses |
| | | Account Value | | Account Value | | Annualized | | Paid During Period |
| | | 2/1/10 | | 7/31/10 | | Expense Ratio | | 2/1/10 to 7/31/10* |
| Actual Fund return | | | | | | | | | | | | |
| Class A | | $ | 1,000.00 | | | $ | 1,095.50 | | | 0.95 | % | | $ | 4.94 | |
| Class B | | | 1,000.00 | | | | 1,091.60 | | | 1.70 | % | | | 8.82 | |
| Class C | | | 1,000.00 | | | | 1,089.80 | | | 1.70 | % | | | 8.81 | |
| Class R | | | 1,000.00 | | | | 1,092.30 | | | 1.20 | % | | | 6.23 | |
| Institutional Class | | | 1,000.00 | | | | 1,096.90 | | | 0.70 | % | | | 3.64 | |
| Hypothetical 5% return (5% return before expenses) | | | | | | | | | | | |
| Class A | | $ | 1,000.00 | | | $ | 1,020.08 | | | 0.95 | % | | $ | 4.76 | |
| Class B | | | 1,000.00 | | | | 1,016.36 | | | 1.70 | % | | | 8.50 | |
| Class C | | | 1,000.00 | | | | 1,016.36 | | | 1.70 | % | | | 8.50 | |
| Class R | | | 1,000.00 | | | | 1,018.84 | | | 1.20 | % | | | 6.01 | |
| Institutional Class | | | 1,000.00 | | | | 1,021.32 | | | 0.70 | % | | | 3.51 | |
*“Expenses Paid During Period” are equal to the Funds’ annualized expense ratios, multiplied by the average account value over the period, multiplied by 181/365 (to reflect the one-half year period).
13
| Security types | |
| Delaware Corporate Bond Fund | As of July 31, 2010 |
Sector designations may be different than the sector designations presented in other Fund materials. The sector designations may represent the investment manager’s internal sector classifications, which may result in the sector designations for one fund being different than another fund’s sector designations.
| Security types | Percentage of net assets |
| Commercial Mortgage-Backed Securities | 0.64 | % |
| Convertible Bonds | 2.00 | % |
| Corporate Bonds | 89.06 | % |
| Banking | 10.99 | % |
| Basic Industry | 8.10 | % |
| Brokerage | 3.54 | % |
| Capital Goods | 4.04 | % |
| Communications | 16.50 | % |
| Consumer Cyclical | 3.86 | % |
| Consumer Non-Cyclical | 8.34 | % |
| Electric | 8.00 | % |
| Energy | 9.90 | % |
| Finance Companies | 4.33 | % |
| Insurance | 2.07 | % |
| Natural Gas | 5.83 | % |
| Real Estate | 1.87 | % |
| Technology | 0.97 | % |
| Transportation | 0.72 | % |
| Municipal Bond | 0.50 | % |
| Non-Agency Asset Backed Securities | 0.83 | % |
| Non-Agency Collateralized Mortgage Obligations | 0.03 | % |
| Regional Authority | 0.15 | % |
| Senior Secured Loans | 1.93 | % |
| Sovereign Agency | 0.27 | % |
| Sovereign Debt | 0.80 | % |
| Supranational Banks | 0.49 | % |
| U.S. Treasury Obligations | 1.94 | % |
| Common Stock | 0.00 | % |
| Preferred Stock | 0.35 | % |
| Discount Note | 0.68 | % |
| Securities Lending Collateral | 1.26 | % |
| Total Value of Securities | 100.93 | % |
| Obligation to Return Securities Lending Collateral | (1.28 | %) |
| Receivables and Other Assets Net of Liabilities | 0.35 | % |
| Total Net Assets | 100.00 | % |
14
| Security types | |
| Delaware Extended Duration Bond Fund | As of July 31, 2010 |
Sector designations may be different than the sector designations presented in other Fund materials. The sector designations may represent the investment manager’s internal sector classifications, which may result in the sector designations for one fund being different than another fund’s sector designations.
| Security types | Percentage of net assets |
| Commercial Mortgage-Backed Securities | 0.69 | % |
| Convertible Bonds | 1.85 | % |
| Corporate Bonds | 83.43 | % |
| Banking | 8.63 | % |
| Basic Industry | 5.64 | % |
| Brokerage | 3.82 | % |
| Capital Goods | 3.12 | % |
| Communications | 15.78 | % |
| Consumer Cyclical | 4.56 | % |
| Consumer Non-Cyclical | 7.87 | % |
| Electric | 8.57 | % |
| Energy | 7.49 | % |
| Finance Companies | 4.39 | % |
| Insurance | 1.97 | % |
| Natural Gas | 8.08 | % |
| Real Estate | 0.99 | % |
| Technology | 1.04 | % |
| Transportation | 1.48 | % |
| Municipal Bonds | 4.34 | % |
| Non-Agency Asset-Backed Securities | 1.07 | % |
| Regional Authority | 0.16 | % |
| Senior Secured Loans | 1.84 | % |
| Sovereign Debt | 0.83 | % |
| Supranational Banks | 0.52 | % |
| U.S. Treasury Obligation | 0.67 | % |
| Preferred Stock | 0.46 | % |
| Discount Note | 2.15 | % |
| Securities Lending Collateral | 1.34 | % |
| Total Value of Securities | 99.35 | % |
| Obligation to Return Securities Lending Collateral | (1.37 | %) |
| Receivables and Other Assets Net of Liabilities | 2.02 | % |
| Total Net Assets | 100.00 | % |
15
| Statements of net assets | |
| Delaware Corporate Bond Fund | July 31, 2010 |
| | | Principal amount° | | Value (U.S. $) |
| Commercial Mortgage-Backed Securities – 0.64% | | | | | | | |
| # | American Tower Trust Series 2007-1A AFX | | | | | | | |
| | 144A 5.42% 4/15/37 | USD | | 1,349,000 | | | $ | 1,474,240 |
| • | Bank of America Commercial Mortgage | | | | | | | |
| | Series 2004-3 A5 5.413% 6/10/39 | | | 1,340,000 | | | | 1,438,430 |
| •# | Credit Suisse First Boston Mortgage Securities | | | | | | | |
| | Series 2001-SPGA A2 144A 6.515% 8/13/18 | | | 2,154,000 | | | | 2,240,818 |
| # | Merrill Lynch Mortgage Investors | | | | | | | |
| | Series 1998-C3 G 144A 6.00% 12/15/30 | | | 1,200,000 | | | | 634,952 |
| # | Merrill Lynch Mortgage Trust Series 2002-MW1 J | | | | | | | |
| | 144A 5.695% 7/12/34 | | | 295,000 | | | | 140,653 |
| •# | Morgan Stanley Capital I Series 1999-FNV1 G | | | | | | | |
| | 144A 6.12% 3/15/31 | | | 46,686 | | | | 48,042 |
| Total Commercial Mortgage-Backed Securities | | | | | | | |
| | (cost $6,193,747) | | | | | | | 5,977,135 |
| |
| Convertible Bonds – 2.00% | | | | | | | |
| | Amgen 0.375% exercise price $79.48, | | | | | | | |
| | expiration date 2/1/13 | | | 1,102,000 | | | | 1,110,265 |
| | ArvinMeritor 4.00% exercise price $26.73, | | | | | | | |
| | expiration date 2/15/27 | | | 805,000 | | | | 723,494 |
| # | Gaylord Entertainment 144A 3.75% exercise | | | | | | | |
| | price $27.25, expiration date 10/1/14 | | | 840,000 | | | | 1,048,950 |
| | Health Care REIT 3.00% exercise price | | | | | | | |
| | $51.27, expiration date 12/1/29 | | | 2,255,000 | | | | 2,339,562 |
| Φ | Hologic 2.00% exercise price $38.59, | | | | | | | |
| | expiration date 12/15/37 | | | 805,000 | | | | 713,431 |
| * | Leap Wireless International 4.50% exercise | | | | | | | |
| | price $93.21, expiration date 7/15/14 | | | 1,050,000 | | | | 910,875 |
| | LifePoint Hospitals | | | | | | | |
| | 3.25% exercise price $61.22, | | | | | | | |
| | expiration date 8/15/25 | | | 1,035,000 | | | | 991,013 |
| | 3.50% exercise price $51.79, | | | | | | | |
| | expiration date 5/15/14 | | | 1,205,000 | | | | 1,144,750 |
| | Linear Technology 3.00% exercise | | | | | | | |
| | price $45.36, expiration date 5/1/27 | | | 2,085,000 | | | | 2,121,487 |
| | Live Nation Entertainment 2.875% exercise | | | | | | | |
| | price $27.14, expiration date 7/14/27 | | | 942,000 | | | | 794,813 |
16
| | | Principal amount° | | Value (U.S. $) |
| Convertible Bonds (continued) | | | | | | | |
| | Medtronic 1.625% exercise price $54.79, | | | | | | | |
| | expiration date 4/15/13 | USD | | 1,511,000 | | | $ | 1,527,999 |
| # | SVB Financial Group 144A 3.875% exercise | | | | | | | |
| | price $53.04, expiration date 4/15/11 | | | 1,320,000 | | | | 1,364,550 |
| | Transocean | | | | | | | |
| | *1.50% exercise price $168.61, | | | | | | | |
| | expiration date 12/15/37 | | | 1,665,000 | | | | 1,540,125 |
| | 1.50% exercise price $168.61, | | | | | | | |
| | expiration date 12/15/37 | | | 2,570,000 | | | | 2,245,538 |
| Total Convertible Bonds (cost $18,064,962) | | | | | | | 18,576,852 |
| |
| Corporate Bonds – 89.06% | | | | | | | |
| Banking – 10.99% | | | | | | | |
| | AgriBank FCB 9.125% 7/15/19 | | | 3,017,000 | | | | 3,608,558 |
| | Bank of America 5.625% 7/1/20 | | | 5,475,000 | | | | 5,659,935 |
| | BB&T 5.25% 11/1/19 | | | 1,086,000 | | | | 1,130,647 |
| • | BB&T Capital Trust IV 6.82% 6/12/57 | | | 6,400,000 | | | | 6,200,000 |
| @# | CoBank ACB 144A 7.875% 4/16/18 | | | 2,060,000 | | | | 2,347,131 |
| | Export-Import Bank of Korea | | | | | | | |
| | 5.875% 1/14/15 | | | 885,000 | | | | 982,450 |
| | #144A 5.25% 2/10/14 | | | 2,340,000 | | | | 2,522,010 |
| •# | HBOS Capital Funding 144A 6.071% 6/29/49 | | | 980,000 | | | | 764,400 |
| | JPMorgan Chase | | | | | | | |
| | 4.40% 7/22/20 | | | 4,050,000 | | | | 4,067,873 |
| | •5.10% 6/21/12 | AUD | | 1,800,000 | | | | 1,601,881 |
| | 5.875% 6/13/16 | USD | | 3,660,000 | | | | 4,075,809 |
| | 6.00% 10/1/17 | | | 2,770,000 | | | | 3,117,821 |
| | JPMorgan Chase Capital XXV 6.80% 10/1/37 | | | 4,823,000 | | | | 4,923,825 |
| | KeyBank 6.95% 2/1/28 | | | 4,700,000 | | | | 4,785,799 |
| | KFW 10.00% 5/15/12 | BRL | | 2,390,000 | | | | 1,379,617 |
| | Korea Development Bank | | | | | | | |
| | 4.375% 8/10/15 | USD | | 2,105,000 | | | | 2,211,608 |
| | 8.00% 1/23/14 | | | 4,315,000 | | | | 5,051,575 |
| • | National City Bank 0.908% 6/7/17 | | | 2,030,000 | | | | 1,821,957 |
| | PNC Bank 6.875% 4/1/18 | | | 5,051,000 | | | | 5,773,152 |
| | PNC Funding | | | | | | | |
| | 5.125% 2/8/20 | | | 2,275,000 | | | | 2,414,717 |
| | 5.25% 11/15/15 | | | 115,000 | | | | 124,508 |
| | 5.625% 2/1/17 | | | 25,000 | | | | 26,911 |
17
Statements of net assets
Delaware Corporate Bond Fund
| | | Principal amount° | | Value (U.S. $) |
| Corporate Bonds (continued) | | | | | | | |
| Banking (continued) | | | | | | | |
| •# | Rabobank Nederland 144A 11.00% 12/29/49 | USD | | 7,420,000 | | | $ | 9,397,629 |
| | Silicon Valley Bank | | | | | | | |
| | 5.70% 6/1/12 | | | 2,320,000 | | | | 2,419,400 |
| | 6.05% 6/1/17 | | | 1,870,000 | | | | 1,912,215 |
| • | USB Capital IX 6.189% 10/29/49 | | | 4,867,000 | | | | 3,793,340 |
| | Wachovia 5.625% 10/15/16 | | | 7,875,000 | | | | 8,647,828 |
| • | Wells Fargo Capital XIII 7.70% 12/29/49 | | | 7,306,000 | | | | 7,525,180 |
| | Zions Bancorporation | | | | | | | |
| | 5.50% 11/16/15 | | | 1,933,000 | | | | 1,743,831 |
| | 7.75% 9/23/14 | | | 1,940,000 | | | | 2,014,519 |
| | | | | | | | | 102,046,126 |
| Basic Industry – 8.10% | | | | | | | |
| | Alcoa 6.15% 8/15/20 | | | 2,800,000 | | | | 2,842,809 |
| | ArcelorMittal 9.85% 6/1/19 | | | 4,340,000 | | | | 5,616,351 |
| | CF Industries 7.125% 5/1/20 | | | 875,000 | | | | 936,250 |
| | Cytec Industries 8.95% 7/1/17 | | | 7,150,000 | | | | 8,800,692 |
| | Dow Chemical 8.55% 5/15/19 | | | 8,010,000 | | | | 10,019,685 |
| | Freeport McMoRan Copper & Gold | | | | | | | |
| | 8.25% 4/1/15 | | | 306,000 | | | | 332,332 |
| | 8.375% 4/1/17 | | | 3,135,000 | | | | 3,507,893 |
| # | Georgia-Pacific 144A 8.25% 5/1/16 | | | 450,000 | | | | 490,500 |
| *# | Gerdau Holdings 144A 7.00% 1/20/20 | | | 446,000 | | | | 477,220 |
| | Hexion Finance Escrow 8.875% 2/1/18 | | | 1,685,000 | | | | 1,632,344 |
| | International Paper 9.375% 5/15/19 | | | 11,510,000 | | | | 14,989,680 |
| | Lubrizol 6.50% 10/1/34 | | | 4,006,000 | | | | 4,027,460 |
| | NewPage 11.375% 12/31/14 | | | 825,000 | | | | 768,281 |
| | Reliance Steel & Aluminum 6.85% 11/15/36 | | | 3,697,000 | | | | 3,551,042 |
| | Steel Dynamics 7.75% 4/15/16 | | | 832,000 | | | | 869,440 |
| | Teck Resources | | | | | | | |
| | 9.75% 5/15/14 | | | 8,560,000 | | | | 10,413,848 |
| | 10.25% 5/15/16 | | | 1,779,000 | | | | 2,155,015 |
| | 10.75% 5/15/19 | | | 958,000 | | | | 1,198,152 |
| | Vale Overseas 6.875% 11/10/39 | | | 2,390,000 | | | | 2,646,674 |
| | | | | | | | | 75,275,668 |
| Brokerage – 3.54% | | | | | | | |
| • | Bear Stearns 5.267% 12/7/12 | AUD | | 710,000 | | | | 630,212 |
| | E Trade PIK Financial 12.50% 11/30/17 | USD | | 2,040,000 | | | | 2,305,200 |
18
| | | Principal amount° | | Value (U.S. $) |
| Corporate Bonds (continued) | | | | | | | |
| Brokerage (continued) | | | | | | | |
| | Goldman Sachs Group | | | | | | | |
| | 3.70% 8/1/15 | USD | | 2,085,000 | | | $ | 2,102,243 |
| | 5.375% 3/15/20 | | | 6,057,000 | | | | 6,246,348 |
| | Jefferies Group | | | | | | | |
| | 6.25% 1/15/36 | | | 2,620,000 | | | | 2,327,152 |
| | 6.45% 6/8/27 | | | 6,627,000 | | | | 6,290,859 |
| | Lazard Group | | | | | | | |
| | 6.85% 6/15/17 | | | 7,744,000 | | | | 8,026,826 |
| | 7.125% 5/15/15 | | | 751,000 | | | | 802,810 |
| | Morgan Stanley 5.50% 7/24/20 | | | 2,735,000 | | | | 2,757,178 |
| | Nuveen Investments 10.50% 11/15/15 | | | 1,375,000 | | | | 1,357,813 |
| | | | | | | | | 32,846,641 |
| Capital Goods – 4.04% | | | | | | | |
| | Allied Waste North America | | | | | | | |
| | 6.875% 6/1/17 | | | 8,090,000 | | | | 8,941,617 |
| | 7.125% 5/15/16 | | | 6,399,000 | | | | 6,919,135 |
| # | BAE Systems Holdings 144A 5.20% 8/15/15 | | | 10,000 | | | | 10,830 |
| | Ball | | | | | | | |
| | 7.125% 9/1/16 | | | 532,000 | | | | 574,560 |
| | 7.375% 9/1/19 | | | 798,000 | | | | 865,830 |
| | Clean Harbors 7.625% 8/15/16 | | | 1,490,000 | | | | 1,545,875 |
| * | Graham Packaging 9.875% 10/15/14 | | | 2,246,000 | | | | 2,341,455 |
| | Graphic Packaging International 9.50% 8/15/13 | | | 463,000 | | | | 473,418 |
| | L-3 Communications 4.75% 7/15/20 | | | 4,700,000 | | | | 4,811,465 |
| # | Meccanica Holdings USA 144A 6.25% 7/15/19 | | | 5,610,000 | | | | 5,931,588 |
| | Ply Gem Industries 11.75% 6/15/13 | | | 1,100,000 | | | | 1,174,250 |
| | Thermo Fisher Scientific 4.70% 5/1/20 | | | 2,900,000 | | | | 3,189,551 |
| # | USG 144A 9.75% 8/1/14 | | | 285,000 | | | | 299,250 |
| # | Votorantim Overseas Trading Operations | | | | | | | |
| | 144A 6.625% 9/25/19 | | | 474,000 | | | | 487,628 |
| | | | | | | | | 37,566,452 |
| Communications – 16.50% | | | | | | | |
| | American Tower 7.00% 10/15/17 | | | 6,555,000 | | | | 7,530,056 |
| | AT&T 6.50% 9/1/37 | | | 4,925,000 | | | | 5,627,798 |
| # | Cablevision Systems 144A 8.625% 9/15/17 | | | 600,000 | | | | 647,250 |
| # | Charter Communications Operating Capital | | | | | | | |
| | 144A 10.875% 9/15/14 | | | 1,349,000 | | | | 1,517,625 |
19
Statements of net assets
Delaware Corporate Bond Fund
| | | Principal amount° | | Value (U.S. $) |
| Corporate Bonds (continued) | | | | | | | |
| Communications (continued) | | | | | | | |
| | Comcast 5.90% 3/15/16 | USD | | 11,305,000 | | | $ | 12,985,589 |
| # | Cox Communications 144A | | | | | | | |
| | 6.25% 6/1/18 | | | 1,675,000 | | | | 1,914,530 |
| | 6.95% 6/1/38 | | | 1,045,000 | | | | 1,220,367 |
| * | Cricket Communications 9.375% 11/1/14 | | | 869,000 | | | | 902,674 |
| | Crown Castle International 9.00% 1/15/15 | | | 719,000 | | | | 790,900 |
| # | Crown Castle Towers 144A 4.883% 8/15/20 | | | 4,610,000 | | | | 4,650,338 |
| | CSC Holdings | | | | | | | |
| | 8.50% 4/15/14 | | | 612,000 | | | | 664,020 |
| | 8.50% 6/15/15 | | | 460,000 | | | | 497,375 |
| *# | Digicel Group 144A 10.50% 4/15/18 | | | 775,000 | | | | 833,125 |
| | DIRECTV Holdings 7.625% 5/15/16 | | | 18,400,000 | | | | 20,448,103 |
| | DISH DBS 7.875% 9/1/19 | | | 1,740,000 | | | | 1,857,450 |
| # | GXS Worldwide 144A 9.75% 6/15/15 | | | 1,700,000 | | | | 1,640,500 |
| | Intelsat Bermuda 11.25% 2/4/17 | | | 2,100,000 | | | | 2,236,500 |
| | Intelsat Jackson Holdings 11.25% 6/15/16 | | | 513,000 | | | | 556,605 |
| # | Myriad International Holding 144A | | | | | | | |
| | 6.375% 7/28/17 | | | 610,000 | | | | 629,825 |
| # | NBC Universal 144A | | | | | | | |
| | *3.65% 4/30/15 | | | 350,000 | | | | 365,560 |
| | 5.15% 4/30/20 | | | 14,280,000 | | | | 15,207,314 |
| | Nielsen Finance 11.50% 5/1/16 | | | 750,000 | | | | 845,625 |
| | PAETEC Holding 8.875% 6/30/17 | | | 746,000 | | | | 774,908 |
| | Qwest 8.375% 5/1/16 | | | 7,442,000 | | | | 8,502,485 |
| # | Qwest Communications International 144A | | | | | | | |
| | 7.125% 4/1/18 | | | 2,000,000 | | | | 2,080,000 |
| | Rogers Communications 6.75% 3/15/15 | | | 3,635,000 | | | | 4,289,893 |
| | Shaw Communications 6.75% 11/9/39 | CAD | | 1,254,000 | | | | 1,256,147 |
| * | Sprint Capital 6.875% 11/15/28 | USD | | 1,050,000 | | | | 918,750 |
| | Telecom Italia Capital | | | | | | | |
| | 5.25% 10/1/15 | | | 11,314,000 | | | | 11,927,840 |
| | 6.175% 6/18/14 | | | 1,545,000 | | | | 1,680,416 |
| | Telefonica Emisiones | | | | | | | |
| | 3.729% 4/27/15 | | | 2,715,000 | | | | 2,786,858 |
| | 5.134% 4/27/20 | | | 4,550,000 | | | | 4,788,902 |
| | Telesat Canada 11.00% 11/1/15 | | | 665,000 | | | | 764,750 |
| | Time Warner Cable 8.25% 4/1/19 | | | 7,946,000 | | | | 9,996,115 |
| * | Verizon Communications 7.35% 4/1/39 | | | 1,420,000 | | | | 1,798,558 |
20
| | | Principal amount° | | Value (U.S. $) |
| Corporate Bonds (continued) | | | | | | | |
| Communications (continued) | | | | | | | |
| | Videotron | | | | | | | |
| | 6.875% 1/15/14 | USD | | 1,201,000 | | | $ | 1,228,023 |
| | #144A 7.125% 1/15/20 | CAD | | 1,173,000 | | | | 1,163,928 |
| # | Vivendi 144A | | | | | | | |
| | 5.75% 4/4/13 | USD | | 4,095,000 | | | | 4,414,103 |
| | 6.625% 4/4/18 | | | 5,847,000 | | | | 6,591,341 |
| # | Wind Acquisition Finance 144A | | | | | | | |
| | 11.75% 7/15/17 | | | 2,340,000 | | | | 2,497,950 |
| # | XM Satellite Radio 144A 13.00% 8/1/13 | | | 1,935,000 | | | | 2,201,063 |
| | | | | | | | | 153,231,159 |
| Consumer Cyclical – 3.86% | | | | | | | |
| | Brinker International 5.75% 6/1/14 | | | 3,000,000 | | | | 3,180,906 |
| | Burlington Coat Factory Investment Holdings | | | | | | | |
| | 14.50% 10/15/14 | | | 1,150,000 | | | | 1,242,000 |
| * | Burlington Coat Factory Warehouse | | | | | | | |
| | 11.125% 4/15/14 | | | 2,005,000 | | | | 2,110,263 |
| w# | CVS Pass Through Trust 144A 8.353% 7/10/31 | | | 4,762,988 | | | | 5,763,191 |
| * | Ford Motor 7.45% 7/16/31 | | | 2,300,000 | | | | 2,242,500 |
| | Ford Motor Credit | | | | | | | |
| | *7.50% 8/1/12 | | | 500,000 | | | | 523,057 |
| | 9.875% 8/10/11 | | | 1,349,000 | | | | 1,423,450 |
| | Goodyear Tire & Rubber 10.50% 5/15/16 | | | 27,000 | | | | 30,375 |
| *# | Harrah’s Operating 144A 10.00% 12/15/18 | | | 1,335,000 | | | | 1,129,744 |
| | International Game Technology 5.50% 6/15/20 | | | 3,180,000 | | | | 3,318,718 |
| # | Invista 144A 9.25% 5/1/12 | | | 217,000 | | | | 219,984 |
| | Macy’s Retail Holdings 8.375% 7/15/15 | | | 1,799,000 | | | | 2,021,626 |
| | MGM MIRAGE | | | | | | | |
| | 10.375% 5/15/14 | | | 216,000 | | | | 239,760 |
| | 11.125% 11/15/17 | | | 279,000 | | | | 318,060 |
| | *13.00% 11/15/13 | | | 435,000 | | | | 508,950 |
| | Norcraft Holdings 9.75% 9/1/12 | | | 1,400,000 | | | | 1,317,750 |
| * | OSI Restaurant Partners 10.00% 6/15/15 | | | 1,850,000 | | | | 1,808,375 |
| * | Quiksilver 6.875% 4/15/15 | | | 2,000,000 | | | | 1,890,000 |
| | Ryland Group 8.40% 5/15/17 | | | 378,000 | | | | 406,350 |
| | Sally Holdings 10.50% 11/15/16 | | | 621,000 | | | | 679,995 |
| | Wyndham Worldwide 7.375% 3/1/20 | | | 5,175,000 | | | | 5,461,555 |
| | | | | | | | | 35,836,609 |
21
Statements of net assets
Delaware Corporate Bond Fund
| | | Principal amount° | | Value (U.S. $) |
| Corporate Bonds (continued) | | | | | | | |
| Consumer Non-Cyclical – 8.34% | | | | | | | |
| * | Abbott Laboratories 4.125% 5/27/20 | USD | | 6,000,000 | | | $ | 6,367,890 |
| # | Anheuser-Busch InBev Worldwide 144A | | | | | | | |
| | 5.00% 4/15/20 | | | 6,810,000 | | | | 7,326,872 |
| # | Brambles USA 144A | | | | | | | |
| | 3.95% 4/1/15 | | | 1,625,000 | | | | 1,664,908 |
| | 5.35% 4/1/20 | | | 3,875,000 | | | | 4,042,489 |
| | CareFusion | | | | | | | |
| | 5.125% 8/1/14 | | | 50,000 | | | | 54,431 |
| | 6.375% 8/1/19 | | | 7,180,000 | | | | 8,307,424 |
| | Community Health Systems 8.875% 7/15/15 | | | 1,115,000 | | | | 1,170,750 |
| | Covidien International Finance 4.20% 6/15/20 | | | 4,735,000 | | | | 4,928,197 |
| # | Genzyme 144A | | | | | | | |
| | 3.625% 6/15/15 | | | 1,000,000 | | | | 1,052,374 |
| | 5.00% 6/15/20 | | | 3,505,000 | | | | 3,807,573 |
| | HCA | | | | | | | |
| | 9.25% 11/15/16 | | | 1,343,000 | | | | 1,453,798 |
| | PIK 9.625% 11/15/16 | | | 340,000 | | | | 368,050 |
| | Hospira 6.40% 5/15/15 | | | 5,550,000 | | | | 6,351,009 |
| # | inVentiv Health 144A 10.00% 8/15/18 | | | 2,400,000 | | | | 2,442,000 |
| | Kraft Foods 5.375% 2/10/20 | | | 2,135,000 | | | | 2,339,766 |
| | Life Technologies | | | | | | | |
| | 4.40% 3/1/15 | | | 2,990,000 | | | | 3,138,250 |
| | 6.00% 3/1/20 | | | 6,807,000 | | | | 7,518,604 |
| | Medco Health Solutions 7.125% 3/15/18 | | | 4,860,000 | | | | 5,821,687 |
| # | Mylan 144A 7.625% 7/15/17 | | | 3,895,000 | | | | 4,157,913 |
| *# | RSC Equipment Rental 144A 10.25% 11/15/19 | | | 2,060,000 | | | | 2,116,650 |
| * | Select Medical 7.625% 2/1/15 | | | 850,000 | | | | 818,125 |
| | Supervalu 7.50% 11/15/14 | | | 1,380,000 | | | | 1,400,700 |
| • | US Oncology Holdings PIK 6.643% 3/15/12 | | | 825,000 | | | | 785,813 |
| | | | | | | | | 77,435,273 |
| Electric – 8.00% | | | | | | | |
| # | American Transmission Systems 144A | | | | | | | |
| | 5.25% 1/15/22 | | | 4,835,000 | | | | 5,098,034 |
| # | Centrais Eletricas Brasileiras 144A | | | | | | | |
| | 6.875% 7/30/19 | | | 8,515,000 | | | | 9,707,099 |
| | CMS Energy | | | | | | | |
| | 6.55% 7/17/17 | | | 2,050,000 | | | | 2,134,444 |
| | 8.75% 6/15/19 | | | 2,680,000 | | | | 3,073,721 |
22
| | | Principal amount° | | Value (U.S. $) |
| Corporate Bonds (continued) | | | | | | | |
| Electric (continued) | | | | | | | |
| | Commonwealth Edison | | | | | | | |
| | 4.00% 8/1/20 | USD | | 5,630,000 | | | $ | 5,769,050 |
| | 5.80% 3/15/18 | | | 945,000 | | | | 1,088,315 |
| | Duke Energy Carolinas 4.30% 6/15/20 | | | 8,700,000 | | | | 9,327,079 |
| | Duke Energy Indiana 3.75% 7/15/20 | | | 1,815,000 | | | | 1,849,445 |
| | Illinois Power 9.75% 11/15/18 | | | 7,156,000 | | | | 9,418,434 |
| | Indiana Michigan Power 7.00% 3/15/19 | | | 2,300,000 | | | | 2,755,423 |
| | Jersey Central Power & Light 5.625% 5/1/16 | | | 1,500,000 | | | | 1,642,194 |
| * | NRG Energy 7.375% 1/15/17 | | | 880,000 | | | | 893,200 |
| * | Pennsylvania Electric 5.20% 4/1/20 | | | 6,681,000 | | | | 7,053,312 |
| @# | Power Receivables Finance 144A | | | | | | | |
| | 6.29% 1/1/12 | | | 56,542 | | | | 56,580 |
| | Public Service Oklahoma | | | | | | | |
| | 5.15% 12/1/19 | | | 5,865,000 | | | | 6,299,333 |
| • | Puget Sound Energy 6.974% 6/1/67 | | | 850,000 | | | | 794,257 |
| • | Wisconsin Energy 6.25% 5/15/67 | | | 7,934,000 | | | | 7,328,945 |
| | | | | | | | | 74,288,865 |
| Energy – 9.90% | | | | | | | |
| * | Anadarko Petroleum 5.95% 9/15/16 | | | 2,400,000 | | | | 2,318,225 |
| | Chesapeake Energy | | | | | | | |
| | 7.25% 12/15/18 | | | 1,439,000 | | | | 1,528,938 |
| | 9.50% 2/15/15 | | | 580,000 | | | | 653,950 |
| *# | Hercules Offshore 144A 10.50% 10/15/17 | | | 825,000 | | | | 742,500 |
| | Mariner Energy 8.00% 5/15/17 | | | 4,000,000 | | | | 4,420,000 |
| # | New World Resources 144A 7.875% 5/1/18 | EUR | | 331,000 | | | | 446,457 |
| | Nexen 7.50% 7/30/39 | USD | | 6,355,000 | | | | 7,913,017 |
| | Noble Energy 8.25% 3/1/19 | | | 10,216,000 | | | | 12,763,124 |
| # | Noble Group 144A 6.625% 8/5/20 | | | 871,000 | | | | 868,422 |
| | Noble Holding International | | | | | | | |
| | *4.90% 8/1/20 | | | 4,455,000 | | | | 4,665,815 |
| | 6.20% 8/1/40 | | | 2,640,000 | | | | 2,851,865 |
| | Petrobras International Finance 5.75% 1/20/20 | | | 7,520,000 | | | | 8,032,661 |
| | Petrohawk Energy 10.50% 8/1/14 | | | 773,000 | | | | 865,760 |
| | Pride International 8.50% 6/15/19 | | | 10,720,000 | | | | 12,033,200 |
| # | SEMCO Energy 144A 5.15% 4/21/20 | | | 2,085,000 | | | | 2,227,456 |
| | Total Capital 4.45% 6/24/20 | | | 10,640,000 | | | | 11,293,679 |
| * | Weatherford International 9.625% 3/1/19 | | | 8,845,000 | | | | 11,218,264 |
23
Statements of net assets
Delaware Corporate Bond Fund
| | | Principal amount° | | Value (U.S. $) |
| Corporate Bonds (continued) | | | | | | | |
| Energy (continued) | | | | | | | |
| # | Woodside Finance 144A | | | | | | | |
| | 4.50% 11/10/14 | USD | | 5,400,000 | | | $ | 5,629,019 |
| | 8.125% 3/1/14 | | | 1,315,000 | | | | 1,521,392 |
| | | | | | | | | 91,993,744 |
| Finance Companies – 4.33% | | | | | | | |
| | Capital One Capital V 10.25% 8/15/39 | | | 375,000 | | | | 408,281 |
| # | CDP Financial 144A | | | | | | | |
| | 4.40% 11/25/19 | | | 3,510,000 | | | | 3,664,686 |
| | 5.60% 11/25/39 | | | 3,670,000 | | | | 3,993,375 |
| | City National Capital Trust I 9.625% 2/1/40 | | | 4,250,000 | | | | 4,513,445 |
| * | FTI Consulting 7.75% 10/1/16 | | | 328,000 | | | | 341,530 |
| | General Electric Capital 6.00% 8/7/19 | | | 15,184,000 | | | | 16,836,717 |
| •# | ILFC E-Capital Trust II 144A 6.25% 12/21/65 | | | 3,065,000 | | | | 2,099,525 |
| # | International Lease Finance 144A | | | | | | | |
| | 8.75% 3/15/17 | | | 8,220,000 | | | | 8,404,950 |
| | | | | | | | | 40,262,509 |
| Insurance – 2.07% | | | | | | | |
| • | Chubb 6.375% 3/29/67 | | | 4,396,000 | | | | 4,330,060 |
| • | Genworth Financial 6.15% 11/15/66 | | | 3,025,000 | | | | 2,208,250 |
| •# | Liberty Mutual 144A 7.00% 3/15/37 | | | 2,775,000 | | | | 2,308,994 |
| | MetLife 6.40% 12/15/36 | | | 180,000 | | | | 167,850 |
| •# | MetLife Capital Trust X 144A 9.25% 4/8/38 | | | 5,980,000 | | | | 6,787,301 |
| | Prudential Financial 3.875% 1/14/15 | | | 3,320,000 | | | | 3,421,472 |
| #‡w•@= | Twin Reefs Pass Through Trust 144A | | | | | | | |
| | 0.00% 12/31/49 | | | 3,100,000 | | | | 0 |
| | | | | | | | | 19,223,927 |
| Natural Gas – 5.83% | | | | | | | |
| • | Enbridge Energy Partners 8.05% 10/1/37 | | | 4,450,000 | | | | 4,389,591 |
| | Energy Transfer Partners 9.70% 3/15/19 | | | 7,291,000 | | | | 9,189,926 |
| | Enterprise Products Operating | | | | | | | |
| | 5.20% 9/1/20 | | | 475,000 | | | | 509,859 |
| | •7.034% 1/15/68 | | | 6,000,000 | | | | 5,738,112 |
| | 9.75% 1/31/14 | | | 4,464,000 | | | | 5,462,762 |
| | Kinder Morgan Energy Partners | | | | | | | |
| | 6.55% 9/15/40 | | | 1,325,000 | | | | 1,464,687 |
| | 9.00% 2/1/19 | | | 3,905,000 | | | | 5,074,380 |
24
| | | Principal amount° | | Value (U.S. $) |
| Corporate Bonds (continued) | | | | | | | |
| Natural Gas (continued) | | | | | | | |
| # | Midcontinent Express Pipeline 144A | | | | | | | |
| | 5.45% 9/15/14 | USD | | 2,565,000 | | | $ | 2,712,154 |
| | *6.70% 9/15/19 | | | 3,000,000 | | | | 3,192,081 |
| | Plains All American Pipeline 8.75% 5/1/19 | | | 6,345,000 | | | | 7,917,964 |
| # | Rockies Express Pipeline 144A | | | | | | | |
| | 5.625% 4/15/20 | | | 1,565,000 | | | | 1,523,781 |
| | •TransCanada Pipelines 6.35% 5/15/67 | | | 7,652,000 | | | | 6,972,609 |
| | | | | | | | | 54,147,906 |
| Real Estate – 1.87% | | | | | | | |
| | Developers Diversified Realty | | | | | | | |
| | 7.50% 4/1/17 | | | 2,500,000 | | | | 2,478,468 |
| | 9.625% 3/15/16 | | | 1,415,000 | | | | 1,551,570 |
| # | Digital Realty Trust 144A 5.875% 2/1/20 | | | 1,680,000 | | | | 1,724,006 |
| | ProLogis | | | | | | | |
| | 6.25% 3/15/17 | | | 2,015,000 | | | | 1,952,888 |
| | 7.375% 10/30/19 | | | 5,070,000 | | | | 4,985,320 |
| | Regency Centers 5.875% 6/15/17 | | | 2,325,000 | | | | 2,476,204 |
| •# | USB Realty 144A 6.091% 12/29/49 | | | 3,100,000 | | | | 2,193,250 |
| | | | | | | | | 17,361,706 |
| Technology – 0.97% | | | | | | | |
| | National Semiconductor | | | | | | | |
| | *3.95% 4/15/15 | | | 2,065,000 | | | | 2,128,773 |
| | 6.60% 6/15/17 | | | 3,840,000 | | | | 4,338,709 |
| # | Oracle 144A 3.875% 7/15/20 | | | 2,500,000 | | | | 2,562,295 |
| | | | | | | | | 9,029,777 |
| Transportation – 0.72% | | | | | | | |
| | Burlington Northern Santa Fe 4.70% 10/1/19 | | | 4,500,000 | | | | 4,815,967 |
| # | ERAC USA Finance 144A 5.25% 10/1/20 | | | 1,785,000 | | | | 1,833,115 |
| | | | | | | | | 6,649,082 |
| Total Corporate Bonds (cost $782,018,803) | | | | | | | 827,195,444 |
| |
| Municipal Bond – 0.50% | | | | | | | |
| | Metropolitan Transportation Authority, New | | | | | | | |
| | York Dedicated Tax Fund Build America | | | | | | | |
| | Bonds (Metropolitan Transit Authority) | | | | | | | |
| | 6.687% 11/15/40 | | | 4,500,000 | | | | 4,663,890 |
| Total Municipal Bond (cost $4,500,000) | | | | | | | 4,663,890 |
25
Statements of net assets
Delaware Corporate Bond Fund
| | | Principal amount° | | Value (U.S. $) |
| Non-Agency Asset-Backed Securities – 0.83% | | | | | | | |
| | Capital One Multi-Asset Execution Trust | | | | | | | |
| | Series 2007-A7 A7 5.75% 7/15/20 | USD | | 1,147,000 | | | $ | 1,337,236 |
| | Citibank Credit Card Issuance Trust | | | | | | | |
| | Series 2007-A3 A3 6.15% 6/15/39 | | | 2,837,000 | | | | 3,540,364 |
| | Discover Card Master Trust Series 2007-A1 | | | | | | | |
| | A1 5.65% 3/16/20 | | | 1,960,000 | | | | 2,283,399 |
| # | Dunkin Securitization Series 2006-1 | | | | | | | |
| | A2 144A 5.779% 6/20/31 | | | 425,000 | | | | 415,160 |
| | Mid-State Trust Series 11 A1 4.864% 7/15/38 | | | 153,596 | | | | 148,830 |
| | | | | | | | |
| Total Non-Agency Asset-Backed Securities | | | | | | | |
| | (cost $6,515,640) | | | | | | | 7,724,989 |
| | |
| Non-Agency Collateralized Mortgage Obligations – 0.03% | | | | |
| •@ | First Horizon Alternative Mortgage Securities | | | | | | | |
| | Series 2006-FA2 B1 5.879% 5/25/36 | | | 470,411 | | | | 2,837 |
| •# | MASTR Specialized Loan Trust Series 2005-2 | | | | | | | |
| | A2 144A 5.006% 7/25/35 | | | 298,870 | | | | 286,894 |
| | | | | | | | |
| Total Non-Agency Collateralized Mortgage | | | | | | | |
| | Obligations (cost $756,106) | | | | | | | 289,731 |
| | |
| Regional Authority – 0.15%Δ | | | | | | | |
| Canada – 0.15% | | | | | | | |
| | Province of Quebec 4.50% 12/1/19 | CAD | | 1,395,000 | | | | 1,421,734 |
| Total Regional Authority (cost $1,357,222) | | | | | | | 1,421,734 |
| | |
| «Senior Secured Loans – 1.93% | | | | | | | |
| | Affinion Group Tranche B 5.00% 10/7/16 | USD | | 1,345,875 | | | | 1,300,169 |
| | Alliance HealthCare Services 5.50% 6/1/16 | | | 1,194,000 | | | | 1,180,568 |
| | Cengage Learning Acquisitions 7.50% 7/7/14 | | | 1,313,300 | | | | 1,322,335 |
| | Chester Downs & Marina 12.375% 12/31/16 | | | 943,750 | | | | 952,008 |
| | Delta Air Lines 8.75% 9/16/13 | | | 2,047,037 | | | | 2,077,742 |
| | Energy Future Holdings Tranche B2 | | | | | | | |
| | 3.729% 10/10/14 | | | 1,466,948 | | | | 1,148,312 |
| | Fidelity National Information Services | | | | | | | |
| | 5.25% 7/18/16 | | | 1,840,000 | | | | 1,855,805 |
| | Ford Motor Tranche B 3.258% 12/15/13 | | | 1,531,114 | | | | 1,493,663 |
| | Graham Packaging Tranche C 6.75% 4/5/14 | | | 777,817 | | | | 788,030 |
| | JohnsonDiversey Tranche B 5.50% 11/24/15 | | | 1,243,750 | | | | 1,248,936 |
26
| | | Principal amount° | | Value (U.S. $) |
| «Senior Secured Loans (continued) | | | | | | | |
| | Nuveen Investments 2nd Lien 12.50% 7/9/15 | USD | | 735,000 | | | $ | 814,013 |
| | Phillips-Van Heusen Tranche B 4.75% 3/15/16 | | | 809,094 | | | | 816,449 |
| | Reynolds & Reynolds 5.25% 4/3/17 | | | 810,302 | | | | 806,632 |
| | Smurfit-Stone Container Enterprises | | | | | | | |
| | 6.75% 1/2/16 | | | 1,240,000 | | | | 1,251,520 |
| | Univision Communications Tranche B | | | | | | | |
| | 2.533% 9/29/14 | | | 953,944 | | | | 836,494 |
| Total Senior Secured Loans (cost $17,463,465) | | | | | | | 17,892,676 |
| | |
| Sovereign Agency – 0.27%Δ | | | | | | | |
| Republic of Korea – 0.27% | | | | | | | |
| # | Korea Expressway 144A 4.50% 3/23/15 | | | 2,360,000 | | | | 2,464,520 |
| Total Sovereign Agency (cost $2,354,577) | | | | | | | 2,464,520 |
| | |
| Sovereign Debt – 0.80%Δ | | | | | | | |
| Chile – 0.11% | | | | | | | |
| | Chile Government International Bond | | | | | | | |
| | 5.50% 8/5/20 | CLP | | 544,000,000 | | | | 1,053,560 |
| | | | | | | | | 1,053,560 |
| Indonesia – 0.69% | | | | | | | |
| | Indonesia Treasury Bonds | | | | | | | |
| | 9.50% 7/15/23 | IDR | | 2,860,000,000 | | | | 346,799 |
| | 10.75% 5/15/16 | IDR | | 16,033,000,000 | | | | 2,062,972 |
| | 11.00% 11/15/20 | IDR | | 29,154,000,000 | | | | 3,964,494 |
| | | | | | | | | 6,374,265 |
| Total Sovereign Debt (cost $6,583,322) | | | | | | | 7,427,825 |
| | |
| Supranational Banks – 0.49% | | | | | | | |
| | International Bank for Reconstruction & | | | | | | | |
| | Development 5.75% 10/21/19 | AUD | | 2,473,000 | | | | 2,246,289 |
| | International Finance 5.75% 3/16/15 | AUD | | 2,473,000 | | | | 2,275,726 |
| Total Supranational Banks (cost $4,426,730) | | | | | | | 4,522,015 |
| | |
| U.S. Treasury Obligations – 1.94% | | | | | | | |
| | U.S. Treasury Bond 4.625% 2/15/40 | USD | | 4,580,000 | | | | 5,093,821 |
| ¥ | U.S. Treasury Note 3.50% 5/15/20 | | | 12,345,000 | | | | 12,966,163 |
| Total U.S. Treasury Obligations (cost $17,736,437) | | | | | | | 18,059,984 |
27
Statements of net assets
Delaware Corporate Bond Fund
| | | Number of shares | | Value (U.S. $) |
| Common Stock – 0.00% | | | | | | | |
| | Masco | | | 251 | | $ | 2,580 | |
| † | UAL | | | 40 | | | 950 | |
| Total Common Stock (cost $1,783) | | | | | | 3,530 | |
| | |
| •Preferred Stock – 0.35% | | | | | | | |
| | PNC Financial Services Group 8.25% | | | 3,112,000 | | | 3,258,936 | |
| Total Preferred Stock (cost $3,066,625) | | | | | | 3,258,936 | |
| | | | | | | |
| | | Principal amount° | | | | |
| ≠Discount Note – 0.68% | | | | | | | |
| | Federal Home Loan Bank 0.06% 8/2/10 | USD | | 6,281,033 | | | 6,281,022 | |
| Total Discount Note (cost $6,281,022) | | | | | | 6,281,022 | |
| | |
| Total Value of Securities Before Securities | | | | | | | |
| | Lending Collateral – 99.67% (cost $877,320,441) | | | | | | 925,760,283 | |
| | | | | | | |
| | | Number of shares | | | | |
| Securities Lending Collateral** – 1.26% | | | | | | | |
| | Investment Companies | | | | | | | |
| | BNY Mellon Securities Lending Overnight Fund | | | 11,372,838 | | | 11,372,838 | |
| | BNY Mellon SL DBT II Liquidating Fund | | | 299,146 | | | 293,642 | |
| | †@Mellon GSL Reinvestment Trust II | | | 242,932 | | | 10,325 | |
| Total Securities Lending Collateral | | | | | | | |
| | (cost $11,914,916) | | | | | | 11,676,805 | |
| | |
| Total Value of Securities – 100.93% | | | | | | | |
| | (cost $889,235,357) | | | | | | 937,437,088 | © |
| Obligation to Return Securities | | | | | | | |
| | Lending Collateral** – (1.28%) | | | | | | (11,914,916 | ) |
| Receivables and Other Assets | | | | | | | |
| | Net of Liabilities – 0.35% | | | | | | 3,293,802 | |
| Net Assets Applicable to 152,629,280 | | | | | | | |
| | Shares Outstanding – 100.00% | | | | | $ | 928,815,974 | |
28
| | | | |
| Net Asset Value – Delaware Corporate Bond Fund | | | |
| | Class A ($409,670,607 / 67,327,486 Shares) | | | $6.08 | |
| Net Asset Value – Delaware Corporate Bond Fund | | | |
| | Class B ($9,806,926 / 1,612,043 Shares) | | | $6.08 | |
| Net Asset Value – Delaware Corporate Bond Fund | | | |
| | Class C ($141,328,584 / 23,221,428 Shares) | | | $6.09 | |
| Net Asset Value – Delaware Corporate Bond Fund | | | |
| | Class R ($10,209,248 / 1,676,484 Shares) | | | $6.09 | |
| Net Asset Value – Delaware Corporate Bond Fund | | | |
| | Institutional Class ($357,800,609 / 58,791,839 Shares) | | | $6.09 | |
| | |
| Components of Net Assets at July 31, 2010: | | | |
| Shares of beneficial interest (unlimited authorization – no par) | $ | 859,453,406 | |
| Distributions in excess of net investment income | | (163,236 | ) |
| Accumulated net realized gain on investments | | 20,451,406 | |
| Net unrealized appreciation of investments and foreign currencies | | 49,074,398 | |
| Total net assets | $ | 928,815,974 | |
°Principal amount is stated in the currency in which each security is denominated.
AUD — Australian Dollar
BRL — Brazilian Real
CAD — Canadian Dollar
CLP — Chilean Peso
EUR — European Monetary Unit
IDR — Indonesia Rupiah
MXN — Mexican Peso
MYR — Malaysian Ringgit
NOK — Norwegian Kroner
NZD — New Zealand Dollar
USD — United States Dollar
| # | Security exempt from registration under Rule 144A of the Securities Act of 1933, as amended. At July 31, 2010, the aggregate amount of Rule 144A securities was $183,441,954, which represented 19.75% of the Fund’s net assets. See Note 10 in ”Notes to financial statements.” |
| • | Variable rate security. The rate shown is the rate as of July 31, 2010. Interest rates reset periodically. |
| Φ | Step coupon bond. Coupon increases or decreases periodically based on a predetermined schedule. Stated rate in effect at July 31, 2010. |
29
Statements of net assets
Delaware Corporate Bond Fund
| | |
| * | Fully or partially on loan. |
| @ | Illiquid security. At July 31, 2010, the aggregate amount of illiquid securities was $2,416,873, which represented 0.26% of the Fund’s net assets. See Note 10 in “Notes to financial statements.” |
| w | Pass Through Agreement. Security represents the contractual right to receive a proportionate amount of underlying payments due to the counterparty pursuant to various agreements related to the rescheduling of obligations and the exchange of certain notes. |
| ‡ | Non income producing security. Security is currently in default. |
| = | Security is being fair valued in accordance with the Fund’s fair valuation policy. At July 31, 2010, the aggregate amount of fair valued securities was $0, which represented 0.00% of the Fund’s net assets. See Note 1 in ”Notes to financial statements.” |
| Δ | Securities have been classified by country of origin. |
| « | Senior Secured Loans generally pay interest at rates which are periodically redetermined by reference to a base lending rate plus a premium. These base lending rates are generally: (i) the prime rate offered by one or more United States banks, (ii) the lending rate offered by one or more European banks such as the London Inter-Bank Offered Rate (LIBOR), and (iii) the certificate of deposit rate. Senior Secured Loans may be subject to restrictions on resale. Stated rate in effect at July 31, 2010. |
| ¥ | Fully or partially pledged as collateral for futures contracts. |
| † | Non income producing security. |
| ≠ | The rate shown is the effective yield at the time of purchase. |
| ** | See Note 9 in “Notes to financial statements” |
| © | Includes $11,540,153 of securities loaned. |
Summary of abbreviations:
BCLY — Barclays
BOA — Bank of America Securities
CDS — Credit Default Swap
CMB — Chase Manhattan Bank
GSC — Goldman Sachs
HKSB — Hong Kong Shanghai Bank
MASTR — Mortgage Asset Securitization Transactions, Inc.
MSC — Morgan Stanley & Company
PIK — Pay-in-kind
REIT — Real Estate Investment Trust
yr — Year
30
| | | |
| Net Asset Value and Offering Price Per Share – | | |
| | Delaware Corporate Bond Fund | | |
| Net asset value Class A (A) | $ | 6.08 |
| Sales charge (4.50% of offering price) (B) | | 0.29 |
| Offering price | $ | 6.37 |
| (A) | �� | Net asset value per share, as illustrated, is the amount which would be paid upon redemption or repurchase of shares. |
| (B) | | See the current prospectus for purchases of $100,000 or more. |
1The following foreign currency exchange contracts, futures contracts and swap contracts were outstanding at July 31, 2010:
Foreign Currency Exchange Contracts
| | | | | | | | | | | | | | | Unrealized |
| | | Contracts to | | | | | | | | | Appreciation |
| Counterparty | | Receive (Deliver) | | In Exchange For | | Settlement Date | | (Depreciation) |
| HKSB | | AUD | | 1,331,430 | | | USD | | (1,197,182 | ) | | 9/15/10 | | | $ | 304 | |
| MSC | | AUD | | 6,371 | | | USD | | (5,711 | ) | | 9/15/10 | | | | 18 | |
| BCLY | | BRL | | 1,060,000 | | | USD | | (593,572 | ) | | 9/15/10 | | | | 2,831 | |
| CMB | | BRL | | 1,508,597 | | | USD | | (845,863 | ) | | 9/15/10 | | | | 2,940 | |
| GSC | | CAD | | 3,808,575 | | | USD | | (3,681,419 | ) | | 9/15/10 | | | | 21,209 | |
| HKSB | | EUR | | (6,605,931 | ) | | USD | | 8,593,325 | | | 9/15/10 | | | | (15,074 | ) |
| MSC | | EUR | | 5,328,966 | | | USD | | (6,916,519 | ) | | 9/15/10 | | | | 27,828 | |
| BOA | | MXN | | 20,019 | | | USD | | (1,572 | ) | | 8/2/10 | | | | 9 | |
| MSC | | MXN | | 5,861,136 | | | USD | | (460,000 | ) | | 9/15/10 | | | | 738 | |
| MSC | | MYR | | 11,409 | | | USD | | (3,576 | ) | | 9/15/10 | | | | (4 | ) |
| BOA | | NOK | | (12,088,142) | | | USD | | 1,960,133 | | | 9/15/10 | | | | (24,492 | ) |
| HKSB | | NOK | | 19,662,240 | | | USD | | (3,184,736 | ) | | 9/15/10 | | | | 43,401 | |
| GSC | | NOK | | 3,822,099 | | | USD | | (618,182 | ) | | 9/15/10 | | | | 9,329 | |
| CMB | | NZD | | 3,778,143 | | | USD | | (2,729,708 | ) | | 9/15/10 | | | | 1,648 | |
| | | | | | | | | | | | | | | | $ | 70,685 | |
Futures Contracts
| | | | | | | | | | | | | Unrealized |
| | | Notional Cost | | | | | | | | Appreciation |
| Contracts to Buy (Sell) | | (Proceeds) | | Notional Value | | Expiration Date | | (Depreciation) |
| (605) U.S. Treasury 10 yr Notes | | $ | (73,099,609 | ) | | $ | (74,906,563 | ) | | 9/30/10 | | | $ | (1,806,954 | ) |
| 680 U.S. Treasury Long Bond | | | 84,311,227 | | | | 87,528,750 | | | 9/21/10 | | | | 3,217,523 | |
| | | $ | 11,211,618 | | | | | | | | | | $ | 1,410,569 | |
31
Statements of net assets
Delaware Corporate Bond Fund
| |
| Swap Contracts |
| CDS Contracts |
| | | | | | Annual | | | | Unrealized |
| Swap Counterparty & | | | | | Protection | | Termination | | Appreciation |
| Referenced Obligation | | | Notional Value | | Payments | | Date | | (Depreciation) |
| Protection Purchased: | | | | | | | | | | | |
| Barclays | | | | | | | | | | | |
| ITRAXX Europe Subordinate | | | | | | | | | | | |
| Financials 13.1 5 yr CDS | | $ | 18,560,000 | | 1.00% | | 6/20/15 | | $ | (401,777 | ) |
| Kingdom of Spain 5 yr CDS | | | 1,720,000 | | 1.00% | | 3/20/15 | | | 29,424 | |
| Goldman Sachs | | | | | | | | | | | |
| Sunoco 5 yr CDS | | | 1,580,000 | | 1.00% | | 3/20/15 | | | (4,092 | ) |
| JPMorgan Securities | | | | | | | | | | | |
| Donnelley (R.R.) & Sons 5 yr CDS | | | 2,800,000 | | 5.00% | | 6/20/14 | | | (395,691 | ) |
| Penney (J.C.) 5 yr CDS | | | 2,710,000 | | 1.00% | | 3/20/15 | | | 55,731 | |
| Portuguese Republic | | | | | | | | | | | |
| 5 yr CDS | | | 1,206,000 | | 1.00% | | 3/20/15 | | | 49,801 | |
| 5 yr CDS | | | 2,042,000 | | 1.00% | | 6/20/15 | | | 30,420 | |
| Sunoco 5 yr CDS | | | 570,000 | | 1.00% | | 3/20/15 | | | 15,797 | |
| | | $ | 31,188,000 | | | | | | $ | (620,387 | ) |
| Credit Protection Sold / Moody’s Rating | | | | | | | | | | | |
| Citigroup Global Markets | | | | | | | | | | | |
| MetLife 5 yr CDS / A | | $ | 2,335,000 | | 5.00% | | 9/20/14 | | $ | 42,507 | |
| JPMorgan Securities | | | | | | | | | | | |
| MetLife 5 yr CDS / A | | | 2,645,000 | | 1.00% | | 12/20/14 | | | (35,971 | ) |
| Valero Energy 5 yr CDS / Baa | | | 570,000 | | 1.00% | | 3/20/15 | | | (997 | ) |
| Morgan Stanley | | | | | | | | | | | |
| Valero Energy 5 yr CDS / Baa | | | 1,580,000 | | 1.00% | | 3/20/15 | | | 30,994 | |
| | | $ | 7,130,000 | | | | | | $ | 36,533 | |
| Total | | | | | | | | | $ | (583,854 | ) |
The use of foreign currency exchange contracts, futures contracts and swap contracts involves elements of market risk and risks in excess of the amounts recognized in the financial statements. The notional values presented above represent the Fund’s total exposure in such contracts, whereas only the net unrealized appreciation (depreciation) is reflected in the Fund’s net assets.
1See Note 8 in ”Notes to financial statements.”
See accompanying Notes, which are an integral part of the financial statements.
32
| Delaware Extended Duration Bond Fund | July 31, 2010 |
| | | Principal amount° | | Value (U.S. $) |
| Commercial Mortgage-Backed Securities – 0.69% | | | | | | | |
| # | American Tower Trust | | | | | | | |
| | Series 2007-1A AFX 144A 5.42% 4/15/37 | USD | | 715,000 | | | $ | 781,379 |
| • | Bank of America Commercial Mortgage | | | | | | | |
| | Series 2004-3 A5 5.413% 6/10/39 | | | 665,000 | | | | 713,848 |
| •# | Credit Suisse First Boston Mortgage Securities | | | | | | | |
| | Series 2001-SPGA A2 144A 6.515% 8/13/18 | | | 610,000 | | | | 634,586 |
| # | Merrill Lynch Mortgage Investors | | | | | | | |
| | Series 1998-C3 G 144A 6.00% 12/15/30 | | | 500,000 | | | | 264,564 |
| | Merrill Lynch Mortgage Trust | | | | | | | |
| | #Series 2002-MW1 J 144A 5.695% 7/12/34 | | | 110,000 | | | | 52,447 |
| | Series 2005-CIP1 A2 4.96% 7/12/38 | | | 38,166 | | | | 39,050 |
| •# | Morgan Stanley Capital I | | | | | | | |
| | Series 1999-FNV1 G 144A 6.12% 3/15/31 | | | 15,731 | | | | 16,188 |
| Total Commercial Mortgage-Backed Securities | | | | | | | |
| | (cost $2,526,704) | | | | | | | 2,502,062 |
| | | | | | | | | |
| Convertible Bonds – 1.85% | | | | | | | |
| | Amgen 0.375% exercise price $79.48, | | | | | | | |
| | expiration date 2/1/13 | | | 445,000 | | | | 448,338 |
| | ArvinMeritor 4.00% exercise price $26.73, | | | | | | | |
| | expiration date 2/15/27 | | | 310,000 | | | | 278,613 |
| # | Gaylord Entertainment 144A 3.75% exercise price | | | | | | | |
| | $27.25, expiration date 10/1/14 | | | 320,000 | | | | 399,600 |
| | Health Care REIT 3.00% exercise price $51.27, | | | | | | | |
| | expiration date 12/1/29 | | | 885,000 | | | | 918,187 |
| Φ | Hologic 2.00% exercise price $38.59, | | | | | | | |
| | expiration date 12/15/37 | | | 305,000 | | | | 270,306 |
| * | Leap Wireless International 4.50% exercise price | | | | | | | |
| | $93.21, expiration date 7/15/14 | | | 395,000 | | | | 342,663 |
| | Lifepoint Hospitals | | | | | | | |
| | 3.25% exercise price $61.22, | | | | | | | |
| | expiration date 8/15/25 | | | 410,000 | | | | 392,575 |
| | 3.50% exercise price $51.79, | | | | | | | |
| | expiration date 5/15/14 | | | 480,000 | | | | 456,000 |
| | Linear Technology 3.00% exercise price $45.36, | | | | | | | |
| | expiration date 5/1/27 | | | 825,000 | | | | 839,437 |
| | Live Nation Entertainment 2.875% exercise price | | | | | | | |
| | $27.14, expiration date 7/14/27 | | | 362,000 | | | | 305,438 |
33
Statements of net assets
Delaware Extended Duration Bond Fund
| | | Principal amount° | | Value (U.S. $) |
| Convertible Bonds (continued) | | | | | | |
| | Medtronic 1.625% exercise price $54.79, | | | | | | | |
| | expiration date 4/15/13 | USD | | 610,000 | | | $ | 616,863 |
| # | SVB Financial Group 144A 3.875% exercise price | | | | | | | |
| | $53.04, expiration date 4/15/11 | | | 505,000 | | | | 522,044 |
| * | Transocean 1.50% exercise price $168.61, | | | | | | | |
| | expiration date 12/15/37 | | | 1,040,000 | | | | 961,999 |
| Total Convertible Bonds (cost $6,452,621) | | | | | | | 6,752,063 |
| | | | | | | | |
| Corporate Bonds – 83.43% | | | | | | | |
| Banking – 8.63% | | | | | | | |
| | AgriBank FCB 9.125% 7/15/19 | | | 1,210,000 | | | | 1,447,251 |
| | Bank of America 5.625% 7/1/20 | | | 2,110,000 | | | | 2,181,272 |
| | BB&T Capital Trust II 6.75% 6/7/36 | | | 2,403,000 | | | | 2,445,192 |
| • | BB&T Capital Trust IV 6.82% 6/12/57 | | | 630,000 | | | | 610,313 |
| @# | CoBank ACB 144A 7.875% 4/16/18 | | | 935,000 | | | | 1,065,324 |
| •# | HBOS Capital Funding 144A 6.071% 6/29/49 | | | 365,000 | | | | 284,700 |
| | JPMorgan Chase 6.00% 10/1/17 | | | 345,000 | | | | 388,321 |
| | JPMorgan Chase Capital XXV 6.80% 10/1/37 | | | 4,395,000 | | | | 4,486,876 |
| | KeyBank 6.95% 2/1/28 | | | 1,685,000 | | | | 1,715,760 |
| | KFW 10.00% 5/15/12 | BRL | | 840,000 | | | | 484,886 |
| •# | PNC Preferred Funding Trust I 144A | | | | | | | |
| | 6.113% 3/29/49 | USD | | 3,900,000 | | | | 2,816,662 |
| •# | Rabobank Nederland 144A 11.00% 12/29/49 | | | 2,370,000 | | | | 3,001,669 |
| | Silicon Valley Bank 6.05% 6/1/17 | | | 805,000 | | | | 823,173 |
| • | USB Capital IX 6.189% 10/29/49 | | | 2,925,000 | | | | 2,279,745 |
| | Wachovia 5.50% 8/1/35 | | | 2,910,000 | | | | 2,775,218 |
| • | Wells Fargo Capital XIII 7.70% 12/29/49 | | | 3,150,000 | | | | 3,244,499 |
| * | Zions Bancorporation | | | | | | | |
| | 5.50% 11/16/15 | | | 790,000 | | | | 712,688 |
| | 7.75% 9/23/14 | | | 750,000 | | | | 778,809 |
| | | | | | | | | 31,542,358 |
| Basic Industry – 5.64% | | | | | | | |
| | CF Industries 7.125% 5/1/20 | | | 350,000 | | | | 374,500 |
| | Dow Chemical | | | | | | | |
| | 8.55% 5/15/19 | | | 625,000 | | | | 781,811 |
| | *9.40% 5/15/39 | | | 2,150,000 | | | | 3,028,198 |
| | Freeport McMoRan Copper & Gold | | | | | | | |
| | 8.25% 4/1/15 | | | 130,000 | | | | 141,187 |
| | 8.375% 4/1/17 | | | 1,070,000 | | | | 1,197,271 |
34
| | | Principal amount° | | Value (U.S. $) |
| Corporate Bonds (continued) | | | | | | | |
| Basic Industry (continued) | | | | | | | |
| # | Georgia-Pacific 144A 8.25% 5/1/16 | USD | | 185,000 | | | $ | 201,650 |
| *# | Gerdau Holdings 144A 7.00% 1/20/20 | | | 146,000 | | | | 156,220 |
| | Hexion Finance Escrow 8.875% 2/1/18 | | | 615,000 | | | | 595,781 |
| * | International Paper 9.375% 5/15/19 | | | 3,290,000 | | | | 4,284,626 |
| | Lubrizol 6.50% 10/1/34 | | | 970,000 | | | | 975,196 |
| | NewPage 11.375% 12/31/14 | | | 325,000 | | | | 302,656 |
| | Reliance Steel & Aluminum 6.85% 11/15/36 | | | 2,107,000 | | | | 2,023,816 |
| | Southern Copper 6.75% 4/16/40 | | | 3,625,000 | | | | 3,826,329 |
| | Steel Dynamics 7.75% 4/15/16 | | | 420,000 | | | | 438,900 |
| | Teck Resources | | | | | | | |
| | 10.25% 5/15/16 | | | 40,000 | | | | 48,455 |
| | 10.75% 5/15/19 | | | 400,000 | | | | 500,272 |
| | Vale Overseas 6.875% 11/10/39 | | | 1,570,000 | | | | 1,738,610 |
| | | | | | | | | 20,615,478 |
| Brokerage – 3.82% | | | | | | | |
| • | Bear Stearns 5.267% 12/7/12 | AUD | | 1,410,000 | | | | 1,251,548 |
| | E Trade Financial PIK 12.50% 11/30/17 | USD | | 765,000 | | | | 864,450 |
| | Goldman Sachs Group 5.375% 3/15/20 | | | 3,529,000 | | | | 3,639,321 |
| | Jefferies Group | | | | | | | |
| | 6.25% 1/15/36 | | | 515,000 | | | | 457,436 |
| | 6.45% 6/8/27 | | | 2,640,000 | | | | 2,506,091 |
| | Lazard Group 6.85% 6/15/17 | | | 3,271,000 | | | | 3,390,463 |
| | Morgan Stanley 5.50% 7/24/20 | | | 1,055,000 | | | | 1,063,555 |
| | Nuveen Investments 10.50% 11/15/15 | | | 810,000 | | | | 799,875 |
| | | | | | | | | 13,972,739 |
| Capital Goods – 3.12% | | | | | | | |
| | Allied Waste North America | | | | | | | |
| | 6.875% 6/1/17 | | | 1,050,000 | | | | 1,160,531 |
| | 7.125% 5/15/16 | | | 2,390,000 | | | | 2,584,268 |
| | Ball | | | | | | | |
| | 7.125% 9/1/16 | | | 188,000 | | | | 203,040 |
| | 7.375% 9/1/19 | | | 282,000 | | | | 305,970 |
| | Clean Harbors 7.625% 8/15/16 | | | 520,000 | | | | 539,500 |
| * | Graham Packaging 9.875% 10/15/14 | | | 465,000 | | | | 484,763 |
| * | Graphic Packaging International 9.50% 8/15/13 | | | 197,000 | | | | 201,433 |
| # | Meccanica Holdings USA 144A 6.25% 7/15/19 | | | 2,140,000 | | | | 2,262,673 |
| | Ply Gem Industries 11.75% 6/15/13 | | | 350,000 | | | | 373,625 |
| # | USG 144A 9.75% 8/1/14 | | | 100,000 | | | | 105,000 |
35
Statements of net assets
Delaware Extended Duration Bond Fund
| | | Principal amount° | | Value (U.S. $) |
| Corporate Bonds (continued) | | | | | | | |
| Capital Goods (continued) | | | | | | | |
| # | Votorantim Overseas Trading Operations 144A | | | | | | | |
| | 6.625% 9/25/19 | USD | | 169,000 | | | $ | 173,859 |
| | Waste Management | | | | | | | |
| | *6.125% 11/30/39 | | | 615,000 | | | | 660,715 |
| | 7.75% 5/15/32 | | | 900,000 | | | | 1,127,740 |
| | WMX Technologies 7.10% 8/1/26 | | | 1,025,000 | | | | 1,197,718 |
| | | | | | | | | 11,380,835 |
| Communications – 15.78% | | | | | | | |
| | American Tower | | | | | | | |
| | 7.00% 10/15/17 | | | 300,000 | | | | 344,625 |
| | 7.25% 5/15/19 | | | 2,000,000 | | | | 2,345,000 |
| | AT&T 6.50% 9/1/37 | | | 4,890,000 | | | | 5,587,802 |
| # | Cablevision Systems 144A 8.625% 9/15/17 | | | 250,000 | | | | 269,688 |
| # | CC Holdings GS V 144A 7.75% 5/1/17 | | | 235,000 | | | | 257,913 |
| # | Charter Communications Operating Capital | | | | | | | |
| | 144A 10.875% 9/15/14 | | | 675,000 | | | | 759,375 |
| * | Comcast 6.95% 8/15/37 | | | 4,157,000 | | | | 4,906,423 |
| # | Cox Communications 144A | | | | | | | |
| | 6.45% 12/1/36 | | | 2,000,000 | | | | 2,207,396 |
| | 6.95% 6/1/38 | | | 1,775,000 | | | | 2,072,872 |
| * | Cricket Communications 9.375% 11/1/14 | | | 355,000 | | | | 368,756 |
| | Crown Castle International 9.00% 1/15/15 | | | 660,000 | | | | 726,000 |
| | CSC Holdings 8.50% 4/15/14 | | | 329,000 | | | | 356,965 |
| | Deutsche Telekom International Finance | | | | | | | |
| | 8.75% 6/15/30 | | | 1,335,000 | | | | 1,805,080 |
| *# | Digicel Group 144A 10.50% 4/15/18 | | | 300,000 | | | | 322,500 |
| | DIRECTV Holdings | | | | | | | |
| | *6.35% 3/15/40 | | | 1,135,000 | | | | 1,232,613 |
| | 7.625% 5/15/16 | | | 4,550,000 | | | | 5,056,460 |
| | DISH DBS 7.875% 9/1/19 | | | 635,000 | | | | 677,863 |
| | Intelsat Bermuda 11.25% 2/4/17 | | | 740,000 | | | | 788,100 |
| | Intelsat Jackson Holdings 11.25% 6/15/16 | | | 195,000 | | | | 211,575 |
| # | Myriad International Holding 144A | | | | | | | |
| | 6.375% 7/28/17 | | | 200,000 | | | | 206,500 |
| # | NBC Universal 144A 6.40% 4/30/40 | | | 3,875,000 | | | | 4,275,877 |
| | Nielsen Finance 11.50% 5/1/16 | | | 275,000 | | | | 310,063 |
| | Qwest 8.375% 5/1/16 | | | 230,000 | | | | 262,775 |
36
| | | Principal amount° | | Value (U.S. $) |
| Corporate Bonds (continued) | | | | | | | |
| Communications (continued) | | | | | | | |
| # | Qwest Communications International 144A | | | | | | | |
| | 7.125% 4/1/18 | USD | | 700,000 | | | $ | 728,000 |
| | Shaw Communications 6.75% 11/9/39 | CAD | | 383,000 | | | | 383,656 |
| * | Sprint Capital 6.875% 11/15/28 | USD | | 400,000 | | | | 350,000 |
| | Telecom Italia Capital 7.721% 6/4/38 | | | 4,290,000 | | | | 4,796,386 |
| | Telefonica Emisiones 5.134% 4/27/20 | | | 2,830,000 | | | | 2,978,592 |
| | Telesat Canada 11.00% 11/1/15 | | | 230,000 | | | | 264,500 |
| | Time Warner Cable | | | | | | | |
| | *6.75% 6/15/39 | | | 1,585,000 | | | | 1,811,259 |
| | 8.25% 4/1/19 | | | 1,645,000 | | | | 2,069,420 |
| | Verizon Communications | | | | | | | |
| | 6.40% 2/15/38 | | | 2,880,000 | | | | 3,271,300 |
| | 7.35% 4/1/39 | | | 550,000 | | | | 696,625 |
| # | Videotron 144A 7.125% 1/15/20 | CAD | | 418,000 | | | | 414,767 |
| # | Vivendi 144A 6.625% 4/4/18 | USD | | 2,470,000 | | | | 2,784,438 |
| # | Wind Acquisition Finance 144A 11.75% 7/15/17 | | | 860,000 | | | | 918,050 |
| # | XM Satellite Radio 144A 13.00% 8/1/13 | | | 720,000 | | | | 819,000 |
| | | | | | | | | 57,638,214 |
| Consumer Cyclical – 4.56% | | | | | | | |
| | Burlington Coat Factory Investment Holdings | | | | | | | |
| | 14.50% 10/15/14 | | | 400,000 | | | | 432,000 |
| | CVS Caremark 6.125% 9/15/39 | | | 2,000,000 | | | | 2,142,272 |
| w# | CVS Pass Through Trust 144A 8.353% 7/10/31 | | | 2,163,207 | | | | 2,617,470 |
| * | Ford Motor 7.45% 7/16/31 | | | 825,000 | | | | 804,375 |
| | Ford Motor Credit 9.875% 8/10/11 | | | 650,000 | | | | 685,873 |
| * | Goodyear Tire & Rubber 10.50% 5/15/16 | | | 10,000 | | | | 11,250 |
| | Harrah’s Operating | | | | | | | |
| | 11.25% 6/1/17 | | | 335,000 | | | | 363,475 |
| | *#144A 10.00% 12/15/18 | | | 475,000 | | | | 401,969 |
| # | Invista 144A 9.25% 5/1/12 | | | 97,000 | | | | 98,334 |
| * | Macy’s Retail Holdings 8.375% 7/15/15 | | | 150,000 | | | | 168,563 |
| | MGM MIRAGE | | | | | | | |
| | 10.375% 5/15/14 | | | 90,000 | | | | 99,900 |
| | 11.125% 11/15/17 | | | 110,000 | | | | 125,400 |
| | *13.00% 11/15/13 | | | 175,000 | | | | 204,750 |
| | Norcraft Holdings 9.75% 9/1/12 | | | 525,000 | | | | 494,156 |
| * | OSI Restaurant Partners 10.00% 6/15/15 | | | 675,000 | | | | 659,813 |
| | Quiksilver 6.875% 4/15/15 | | | 700,000 | | | | 661,500 |
37
Statements of net assets
Delaware Extended Duration Bond Fund
| | | Principal amount° | | Value (U.S. $) |
| Corporate Bonds (continued) | | | | | | | |
| Consumer Cyclical (continued) | | | | | | | |
| | Ryland Group 8.40% 5/15/17 | USD | | 475,000 | | | $ | 510,625 |
| | Sally Holdings 10.50% 11/15/16 | | | 260,000 | | | | 284,700 |
| | Wal-Mart Stores 4.875% 7/8/40 | | | 3,900,000 | | | | 3,869,494 |
| | Wyndham Worldwide 7.375% 3/1/20 | | | 1,930,000 | | | | 2,036,870 |
| | | | | | | | | 16,672,789 |
| Consumer Non-Cyclical – 7.87% | | | | | | | |
| | Abbott Laboratories 5.30% 5/27/40 | | | 5,850,000 | | | | 6,257,469 |
| | Alere 9.00% 5/15/16 | | | 250,000 | | | | 255,000 |
| | Amgen | | | | | | | |
| | 5.75% 3/15/40 | | | 65,000 | | | | 72,868 |
| | 6.40% 2/1/39 | | | 3,250,000 | | | | 3,906,187 |
| *# | Anheuser-Busch InBev Worldwide 144A | | | | | | | |
| | 5.00% 4/15/20 | | | 2,100,000 | | | | 2,259,388 |
| # | Brambles USA 144A 5.35% 4/1/20 | | | 2,155,000 | | | | 2,248,146 |
| | Community Health Systems 8.875% 7/15/15 | | | 495,000 | | | | 519,750 |
| # | Genzyme 144A 5.00% 6/15/20 | | | 1,330,000 | | | | 1,444,814 |
| | HCA | | | | | | | |
| | 9.25% 11/15/16 | | | 530,000 | | | | 573,725 |
| | PIK 9.625% 11/15/16 | | | 125,000 | | | | 135,313 |
| # | inVentiv Health 144A 10.00% 8/15/18 | | | 940,000 | | | | 956,450 |
| | Kraft Foods 6.50% 2/9/40 | | | 3,510,000 | | | | 4,056,460 |
| | Life Technologies 6.00% 3/1/20 | | | 3,365,000 | | | | 3,716,777 |
| # | Mylan 144A 7.625% 7/15/17 | | | 1,480,000 | | | | 1,579,900 |
| | Supervalu 7.50% 11/15/14 | | | 460,000 | | | | 466,900 |
| • | US Oncology Holdings PIK 6.643% 3/15/12 | | | 309,000 | | | | 294,323 |
| | | | | | | | | 28,743,470 |
| Electric – 8.57% | | | | | | | |
| | AES 8.00% 6/1/20 | | | 325,000 | | | | 345,719 |
| # | American Transmission Systems 144A | | | | | | | |
| | 5.25% 1/15/22 | | | 3,640,000 | | | | 3,838,023 |
| # | Centrais Eletricas Brasileiras 144A | | | | | | | |
| | 6.875% 7/30/19 | | | 2,850,000 | | | | 3,249,000 |
| | CMS Energy 8.75% 6/15/19 | | | 1,035,000 | | | | 1,187,053 |
| | Duke Energy Carolinas 6.05% 4/15/38 | | | 1,480,000 | | | | 1,725,852 |
| | Energy Future Holdings 10.875% 11/1/17 | | | 175,000 | | | | 123,375 |
| | Florida Power | | | | | | | |
| | 6.35% 9/15/37 | | | 1,500,000 | | | | 1,798,239 |
| | *6.40% 6/15/38 | | | 1,350,000 | | | | 1,636,619 |
38
| | | Principal amount° | | Value (U.S. $) |
| Corporate Bonds (continued) | | | | | | | |
| Electric (continued) | | | | | | | |
| | Florida Power & Light 5.69% 3/1/40 | USD | | 2,200,000 | | | $ | 2,469,115 |
| | Illinois Power 9.75% 11/15/18 | | | 3,680,000 | | | | 4,843,464 |
| * | NRG Energy 7.375% 1/15/17 | | | 180,000 | | | | 182,700 |
| | Pacific Gas & Electric 5.40% 1/15/40 | | | 2,500,000 | | | | 2,640,438 |
| • | Puget Sound Energy 6.974% 6/1/67 | | | 300,000 | | | | 280,326 |
| * | Southwestern Electric Power 6.20% 3/15/40 | | | 4,550,000 | | | | 4,771,185 |
| • | Wisconsin Energy 6.25% 5/15/67 | | | 2,405,000 | | | | 2,221,592 |
| | | | | | | | | 31,312,700 |
| Energy – 7.49% | | | | | | | |
| | Anadarko Finance 7.50% 5/1/31 | | | 910,000 | | | | 889,754 |
| | Chesapeake Energy 7.25% 12/15/18 | | | 610,000 | | | | 648,125 |
| *# | Hercules Offshore 144A 10.50% 10/15/17 | | | 315,000 | | | | 283,500 |
| | Mariner Energy 8.00% 5/15/17 | | | 1,525,000 | | | | 1,685,125 |
| # | New World Resources 144A 7.875% 5/1/18 | EUR | | 132,000 | | | | 178,043 |
| | Nexen 7.50% 7/30/39 | USD | | 2,965,000 | | | | 3,691,911 |
| | Noble Energy 8.25% 3/1/19 | | | 1,675,000 | | | | 2,092,623 |
| # | Noble Group 144A 6.625% 8/5/20 | | | 286,000 | | | | 285,153 |
| | Noble Holding International 6.20% 8/1/40 | | | 3,665,000 | | | | 3,959,123 |
| * | Petrobras International Finance 6.875% 1/20/40 | | | 1,550,000 | | | | 1,692,279 |
| | Petrohawk Energy 10.50% 8/1/14 | | | 370,000 | | | | 414,400 |
| * | Pride International 8.50% 6/15/19 | | | 2,395,000 | | | | 2,688,388 |
| | Suncor Energy 6.85% 6/1/39 | | | 2,500,000 | | | | 2,996,495 |
| | Total Capital 4.45% 6/24/20 | | | 575,000 | | | | 610,326 |
| | Transocean 6.80% 3/15/38 | | | 880,000 | | | | 794,238 |
| | Weatherford International | | | | | | | |
| | 7.00% 3/15/38 | | | 995,000 | | | | 1,044,513 |
| | 9.625% 3/1/19 | | | 2,690,000 | | | | 3,411,773 |
| | | | | | | | | 27,365,769 |
| Finance Companies – 4.39% | | | | | | | |
| | Capital One Capital V 10.25% 8/15/39 | | | 2,430,000 | | | | 2,645,663 |
| # | CDP Financial 144A 5.60% 11/25/39 | | | 2,525,000 | | | | 2,747,484 |
| | City National Capital Trust I 9.625% 2/1/40 | | | 1,650,000 | | | | 1,752,279 |
| * | FTI Consulting 7.75% 10/1/16 | | | 375,000 | | | | 390,469 |
| | General Electric Capital 5.875% 1/14/38 | | | 5,845,000 | | | | 5,868,584 |
| •# | ILFC E-Capital Trust II 144A 6.25% 12/21/65 | | | 1,250,000 | | | | 856,250 |
| *# | International Lease Finance 144A 8.75% 3/15/17 | | | 1,725,000 | | | | 1,763,813 |
| | | | | | | | | 16,024,542 |
39
Statements of net assets
Delaware Extended Duration Bond Fund
| | | Principal amount° | | Value (U.S. $) |
| Corporate Bonds (continued) | | | | | | | |
| Insurance – 1.97% | | | | | | | |
| • | Chubb 6.375% 3/29/67 | USD | | 1,540,000 | | | $ | 1,516,900 |
| • | Genworth Financial 6.15% 11/15/66 | | | 1,200,000 | | | | 876,000 |
| •# | Liberty Mutual 144A 7.00% 3/15/37 | | | 1,050,000 | | | | 873,674 |
| •# | MetLife Capital Trust X 144A 9.25% 4/8/38 | | | 2,845,000 | | | | 3,229,075 |
| | Transatlantic Holdings 8.00% 11/30/39 | | | 704,000 | | | | 693,183 |
| | | | | | | | | 7,188,832 |
| Natural Gas – 8.08% | | | | | | | |
| @ | Boston Gas 6.95% 12/1/23 | | | 200,000 | | | | 229,476 |
| •* | Enbridge Energy Partners 8.05% 10/1/37 | | | 1,875,000 | | | | 1,849,547 |
| | Energy Transfer Partners 9.70% 3/15/19 | | | 2,225,000 | | | | 2,804,497 |
| | Enterprise Products Operating | | | | | | | |
| | *6.125% 10/15/39 | | | 710,000 | | | | 748,945 |
| | •7.034% 1/15/68 | | | 2,310,000 | | | | 2,209,173 |
| | Inergy Finance 8.75% 3/1/15 | | | 170,000 | | | | 181,475 |
| | Kinder Morgan Energy Partners 7.30% 8/15/33 | | | 4,320,000 | | | | 5,073,261 |
| # | Midcontinent Express Pipeline 144A | | | | | | | |
| | 6.70% 9/15/19 | | | 2,265,000 | | | | 2,410,021 |
| | Plains All American Pipeline 6.65% 1/15/37 | | | 4,915,000 | | | | 5,230,499 |
| # | Rockies Express Pipeline 144A 5.625% 4/15/20 | | | 595,000 | | | | 579,329 |
| | Sempra Energy 6.00% 10/15/39 | | | 1,470,000 | | | | 1,609,766 |
| | TransCanada Pipelines | | | | | | | |
| | 6.10% 6/1/40 | | | 2,000,000 | | | | 2,221,490 |
| | •6.35% 5/15/67 | | | 2,940,000 | | | | 2,678,969 |
| | Williams Partners 6.30% 4/15/40 | | | 1,565,000 | | | | 1,679,239 |
| | | | | | | | | 29,505,687 |
| Real Estate – 0.99% | | | | | | | |
| | ProLogis 7.375% 10/30/19 | | | 1,455,000 | | | | 1,430,698 |
| | Regency Centers 5.875% 6/15/17 | | | 1,140,000 | | | | 1,214,139 |
| •# | USB Realty 144A 6.091% 12/29/49 | | | 1,400,000 | | | | 990,500 |
| | | | | | | | | 3,635,337 |
| Technology – 1.04% | | | | | | | |
| # | Oracle 144A 5.375% 7/15/40 | | | 3,710,000 | | | | 3,788,036 |
| | | | | | | | | 3,788,036 |
| Transportation – 1.48% | | | | | | | |
| | Burlington Northern Santa Fe 5.75% 5/1/40 | | | 4,410,000 | | | | 4,715,503 |
| # | ERAC USA Finance 144A 5.25% 10/1/20 | | | 680,000 | | | | 698,329 |
| | | | | | | | | 5,413,832 |
| Total Corporate Bonds (cost $281,988,881) | | | | | | | 304,800,618 |
40
| | | Principal amount° | | Value (U.S. $) |
| Municipal Bonds – 4.34% | | | | | | | |
| | Chicago, Illinois O’Hare International Airport Build | | | | | | | |
| | America Bonds Series B 6.395% 1/1/40 | USD | | 3,800,000 | | | $ | 4,005,998 |
| | Long Island, New York Power Authority | | | | | | | |
| | 5.85% 5/1/41 | | | 3,600,000 | | | | 3,628,404 |
| | Metropolitan Transportation Authority, New York | | | | | | | |
| | Dedicated Tax Fund Build America Bonds | | | | | | | |
| | (Metropolitan Transit Authority) | | | | | | | |
| | 6.687% 11/15/40 | | | 3,000,000 | | | | 3,109,260 |
| | Series A-2 6.089% 11/15/40 | | | 3,205,000 | | | | 3,387,845 |
| | Oregon State Department of Transportation | | | | | | | |
| | Highway User Tax Revenue Build America | | | | | | | |
| | Bonds (Taxable Subordinate Lien Direct | | | | | | | |
| | Payment) Series A 5.834% 11/15/34 | | | 1,605,000 | | | | 1,730,142 |
| Total Municipal Bonds (cost $15,234,530) | | | | | | | 15,861,649 |
| | | | | | | | |
| Non-Agency Asset-Backed Securities – 1.07% | | | | | | | |
| | Capital One Multi-Asset Execution Trust | | | | | | | |
| | Series 2007-A7 A7 5.75% 7/15/20 | | | 550,000 | | | | 641,221 |
| | Citibank Credit Card Issuance Trust | | | | | | | |
| | Series 2007-A3 A3 6.15% 6/15/39 | | | 1,505,000 | | | | 1,878,126 |
| | CNH Equipment Trust | | | | | | | |
| | Series 2008-A A3 4.12% 5/15/12 | | | 35,639 | | | | 35,812 |
| | Discover Card Master Trust | | | | | | | |
| | Series 2007-A1 A1 5.65% 3/16/20 | | | 960,000 | | | | 1,118,400 |
| # | Dunkin Securitization | | | | | | | |
| | Series 2006-1 A2 144A 5.779% 6/20/31 | | | 190,000 | | | | 185,601 |
| | Mid-State Trust Series 11 A1 4.864% 7/15/38 | | | 46,323 | | | | 44,885 |
| Total Non-Agency Asset-Backed Securities | | | | | | | |
| | (cost $3,283,105) | | | | | | | 3,904,045 |
| | | | | | | | |
| Regional Authority – 0.16%Δ | | | | | | | |
| Canada – 0.16% | | | | | | | |
| | Province of Quebec 4.50% 12/1/19 | CAD | | 570,000 | | | | 580,924 |
| Total Regional Authority (cost $554,564) | | | | | | | 580,924 |
| | | | | | | | |
| «Senior Secured Loans – 1.84% | | | | | | | |
| | Affinion Group Tranche B 5.00% 10/7/16 | USD | | 518,350 | | | | 500,747 |
| | Alliance HealthCare Services 5.50% 6/1/16 | | | 388,050 | | | | 383,684 |
41
Statements of net assets
Delaware Extended Duration Bond Fund
| | | Principal amount° | | Value (U.S. $) |
| «Senior Secured Loans (continued) | | | | | | | |
| | Cengage Learning Acquisitions 7.50% 7/7/14 | USD | | 517,588 | | | $ | 521,149 |
| | Chester Downs & Marina 12.375% 12/31/16 | | | 369,166 | | | | 372,396 |
| | Delta Air Lines 8.75% 9/16/13 | | | 685,571 | | | | 695,855 |
| | Energy Future Holdings Tranche B2 | | | | | | | |
| | 3.729% 10/10/14 | | | 611,116 | | | | 478,375 |
| | Fidelity National Information Services | | | | | | | |
| | 5.25% 7/18/16 | | | 685,000 | | | | 690,884 |
| | Ford Motor Tranche B 3.258% 12/15/13 | | | 507,431 | | | | 495,019 |
| | Graham Packaging Tranche C 6.75% 4/5/14 | | | 308,267 | | | | 312,315 |
| | JohnsonDiversey Tranche B 5.50% 11/24/15 | | | 537,300 | | | | 539,541 |
| | Nuveen Investments 2nd Lien 12.50% 7/9/15 | | | 295,000 | | | | 326,713 |
| | Phillips-Van Heusen Tranche B 4.75% 3/15/16 | | | 312,282 | | | | 315,121 |
| | Reynolds & Reynolds 5.25% 4/3/17 | | | 319,354 | | | | 317,908 |
| | Smurfit-Stone Container Enterprises 6.75% 1/2/16 | | | 460,000 | | | | 464,273 |
| | Univision Communications Tranche B | | | | | | | |
| | 2.533% 9/29/14 | | | 357,729 | | | | 313,685 |
| Total Senior Secured Loans (cost $6,577,862) | | | | | | | 6,727,665 |
| | | | | | | | |
| Sovereign Debt – 0.83%Δ | | | | | | | |
| Chile – 0.11% | | | | | | | |
| | Chile Government International Bond | | | | | | | |
| | 5.50% 8/5/20 | CLP | | 215,000,000 | | | | 416,388 |
| | | | | | | | | 416,388 |
| Indonesia – 0.72% | | | | | | | |
| | Indonesia Treasury Bonds | | | | | | | |
| | 9.50% 7/15/23 | IDR | | 1,150,000,000 | | | | 139,447 |
| | 10.75% 5/15/16 | IDR | | 5,909,000,000 | | | | 760,313 |
| | 11.00% 11/15/20 | IDR | | 12,641,000,000 | | | | 1,718,982 |
| | | | | | | | | 2,618,742 |
| Total Sovereign Debt (cost $2,703,299) | | | | | | | 3,035,130 |
| | | | | | | | |
| Supranational Banks – 0.52% | | | | | | | |
| | International Bank for Reconstruction & | | | | | | | |
| | Development 5.75% 10/21/19 | AUD | | 1,041,000 | | | | 945,567 |
| | International Finance 5.75% 3/16/15 | AUD | | 1,041,000 | | | | 957,958 |
| Total Supranational Banks (cost $1,863,415) | | | | | | | 1,903,525 |
42
| | | Principal amount° | | Value (U.S. $) | |
| U.S. Treasury Obligation – 0.67% | | | | | | | | |
| ¥^ | U.S. Treasury Strip Principal 4.675% 2/15/40 | USD | | 8,505,000 | | | $ | 2,436,164 | |
| Total U.S. Treasury Obligation (cost $2,176,483) | | | | | | | 2,436,164 | |
| | | | | | | |
| | | Number of shares | | | | |
| Preferred Stock – 0.46% | | | | | | | | |
| • | PNC Financial Services Group 8.25% | | | 1,615,000 | | | | 1,691,254 | |
| Total Preferred Stock (cost $1,588,134) | | | | | | | 1,691,254 | |
| | | | | | | |
| | | Principal amount° | | | | |
| ≠Discount Note – 2.15% | | | | | | | | |
| | Federal Home Loan Bank 0.06% 8/2/10 | USD | | 7,842,041 | | | | 7,842,028 | |
| Total Discount Note (cost $7,842,028) | | | | | | | 7,842,028 | |
| | | | | | | | | |
| Total Value of Securities Before Securities | | | | | | | | |
| | Lending Collateral – 98.01% (cost $332,791,626) | | | | | | | 358,037,127 | |
| | | | | | | |
| | | Number of shares | | | | |
| Securities Lending Collateral** – 1.34% | | | | | | | | |
| | Investment Companies | | | | | | | | |
| | BNY Mellon Securities Lending Overnight Fund | | | 4,727,669 | | | | 4,727,669 | |
| | BNY Mellon SL DBT II Liquidating Fund | | | 171,990 | | | | 168,825 | |
| | @†Mellon GSL Reinvestment Trust II | | | 101,515 | | | | 4,314 | |
| Total Securities Lending Collateral (cost $5,001,174) | | | | | | | 4,900,808 | |
| | | | | | | | | |
| Total Value of Securities – 99.35% | | | | | | | | |
| | (cost $337,792,800) | | | | | | | 362,937,935 | © |
| Obligation to Return Securities | | | | | | | | |
| | Lending Collateral** – (1.37%) | | | | | | | (5,001,174 | ) |
| Receivables and Other Assets | | | | | | | | |
| | Net of Liabilities – 2.02% | | | | | | | 7,395,400 | |
| Net Assets Applicable to 56,772,984 | | | | | | | | |
| | Shares Outstanding – 100.00% | | | | | | $ | 365,332,161 | |
43
Statements of net assets
Delaware Extended Duration Bond Fund
| |
| Net Asset Value – Delaware Extended Duration Bond Fund | | |
| Class A ($275,311,839 / 42,775,502 Shares) | | | $6.44 |
| Net Asset Value – Delaware Extended Duration Bond Fund | | |
| Class B ($3,464,371 / 539,149 Shares) | | | $6.43 |
| Net Asset Value – Delaware Extended Duration Bond Fund | | |
| Class C ($23,114,715 / 3,592,558 Shares) | | | $6.43 |
| Net Asset Value – Delaware Extended Duration Bond Fund | | |
| Class R ($14,131,132 / 2,193,174 Shares) | | | $6.44 |
| Net Asset Value – Delaware Extended Duration Bond Fund | | |
| Institutional Class ($49,310,104 / 7,672,601 Shares) | | | $6.43 |
| | | |
| Components of Net Assets at July 31, 2010: | | |
| Shares of beneficial interest (unlimited authorization – no par) | $ | 331,270,369 |
| Undistributed net investment income | | 1,078,126 |
| Accumulated net realized gain on investments | | 5,949,019 |
| Net unrealized appreciation of investments and foreign currencies | | 27,034,647 |
| Total net assets | $ | 365,332,161 |
°Principal amount is stated in the currency in which each security is denominated.
AUD — Australian Dollar
BRL — Brazilian Real
CAD — Canadian Dollar
CLP — Chilean Peso
EUR — European Monetary Unit
IDR — Indonesia Rupiah
MYR — Malaysian Ringgit
NOK — Norwegian Kroner
NZD — New Zealand Dollar
USD — United States Dollar
44
| | |
| # | Security exempt from registration under Rule 144A of the Securities Act of 1933, as amended. At July 31, 2010, the aggregate amount of Rule 144A securities was $66,337,243, which represented 18.16% of the Fund’s net assets. See Note 10 in “Notes to financial statements.” |
| • | Variable rate security. The rate shown is the rate as of July 31, 2010. Interest rates reset periodically. |
| Φ | Step coupon bond. Coupon increases or decreases periodically based on a predetermined schedule. Stated rate is in effect at July 31, 2010. |
| * | Fully or partially on loan. |
| @ | Illiquid security. At July 31, 2010, the aggregate amount of illiquid securities was $1,299,114, which represented 0.36% of the Fund’s net assets. See Note 10 in “Notes to financial statements.” |
| w | Pass Through Agreement. Security represents the contractual right to receive a proportionate amount of underlying payments due to the counterparty pursuant to various agreements related to the rescheduling of obligations and the exchange of certain notes. |
| Δ | Securities have been classified by country of origin |
| « | Senior Secured Loans generally pay interest at rates which are periodically redetermined by reference to a base lending rate plus a premium. These base lending rates are generally: (i) the prime rate offered by one or more United States banks, (ii) the lending rate offered by one or more European banks such as the London Inter-Bank Offered Rate (LIBOR), and (iii) the certificate of deposit rate. Senior Secured Loans may be subject to restrictions on resale. Stated rate in effect at July 31, 2010. |
| ≠ | The rate shown is the effective yield at the time of purchase. |
| ^ | Zero coupon security. The rate shown is the yield at the time of purchase. |
| † | Non income producing security. |
| ¥ | Fully or partially pledged as collateral futures contracts. |
| ** | See Note 9 in “Notes to financial statements.” |
| © | Includes $4,857,782 of securities loaned. |
Summary of abbreviations:
BCLY — Barclays
BOA — Bank of America Securities
CDS — Credit Default Swap
CMB — Chase Manhattan Bank
GSC — Goldman Sachs
HKSB — Hong Kong Shanghai Bank
MSC — Morgan Stanley & Company
PIK — Pay-in-kind
REIT — Real Estate Investment Trust
yr — Year
45
Statements of net assets
Delaware Extended Duration Bond Fund
| |
| Net Asset Value and Offering Price Per Share – | | | |
| Delaware Extended Duration Bond Fund | | | |
| Net asset value Class A (A) | | $ | 6.44 |
| Sales charge (4.50% of offering price) (B) | | | 0.30 |
| Offering price | | $ | 6.74 |
| (A) | | Net asset value per share, as illustrated, is the amount which would be paid upon redemption or repurchase of shares. |
| (B) | | See the current prospectus for purchases of $100,000 or more. |
1The following foreign currency exchange contracts, futures contracts and swap contracts were outstanding at July 31, 2010:
Foreign Currency Exchange Contracts
| | | | | | | | | | | | | | | Unrealized |
| | | | | | | | | | | | | | | Appreciation |
| Counterparty | | Contracts to Receive (Deliver) | | In Exchange For | | Settlement Date | | (Depreciation) |
| HKSB | | | AUD | | 522,505 | | | USD | (469,821 | ) | | 9/15/10 | | | $ | 119 | |
| MSC | | | AUD | | 2,444 | | | USD | (2,191 | ) | | 9/15/10 | | | | 7 | |
| BCLY | | | BRL | | 450,000 | | | USD | (241,988 | ) | | 9/15/10 | | | | 1,202 | |
| CMB | | | BRL | | 733,642 | | | USD | (411,350 | ) | | 9/15/10 | | | | 1,430 | |
| GSC | | | CAD | | 1,469,563 | | | USD | (1,420,499 | ) | | 9/15/10 | | | | 8,184 | |
| HKSB | | | EUR | | (2,740,964 | ) | | USD | 3,565,583 | | | 9/15/10 | | | | (6,255 | ) |
| MSC | | | EUR | | 2,244,262 | | | USD | (2,912,850 | ) | | 9/15/10 | | | | 11,719 | |
| MSC | | | MYR | | 71,521 | | | USD | (22,420 | ) | | 9/15/10 | | | | (24 | ) |
| BOA | | | NOK | | (3,945,570 | ) | | USD | 639,788 | | | 9/15/10 | | | | (7,994 | ) |
| HKSB | | | NOK | | 6,856,687 | | | USD | (1,110,593 | ) | | 9/15/10 | | | | 15,135 | |
| GSC | | | NOK | | 1,419,090 | | | USD | (229,522 | ) | | 9/15/10 | | | | 3,464 | |
| CMB | | | NZD | | 1,487,182 | | | USD | (1,074,534 | ) | | 9/15/10 | | | | 602 | |
| | | | | | | | | | | | | | | | $ | 27,589 | |
Futures Contracts
| | | | | | | | | | | | | Unrealized |
| | | Notional Cost | | | | | | | | Appreciation |
| Contracts to Buy (Sell) | | (Proceeds) | | Notional Value | | Expiration Date | | (Depreciation) |
| (211) U.S. Treasury 10 yr Note | | $ | (25,494,244 | ) | | $ | (26,124,438 | ) | | 9/30/10 | | $ | (630,194 | ) |
| 393 U.S. Treasury Long Bond | | | 48,726,930 | | | | 50,586,469 | | | 9/21/10 | | | 1,859,539 | |
| 307 U.S. Treasury Ultra Term Bond | | | 40,632,798 | | | | 41,521,750 | | | 9/21/10 | | | 888,952 | |
| | | $ | 63,865,484 | | | | | | | | | $ | 2,118,297 | |
46
| |
| Swap Contracts |
| CDS Contracts |
| | | | | | Annual | | | | Unrealized |
| Swap Counterparty & | | | | | Protection | | Termination | | Appreciation |
| Referenced Obligation | | Notional Value | | Payments | | Date | | (Depreciation) |
| Protection Purchased: | | | | | | | | | | | |
| Barclays | | | | | | | | | | | |
| ITRAXX Europe Subordinate | | | | | | | | | | | |
| Financials 13.1 5 yr CDS | | $ | 7,090,000 | | 1.00% | | 6/20/15 | | $ | (152,683 | ) |
| Kingdom of Spain 5 yr CDS | | | 670,000 | | 1.00% | | 3/20/15 | | | 11,462 | |
| Goldman | | | | | | | | | | | |
| Sunoco 5 yr CDS | | | 520,000 | | 1.00% | | 3/20/15 | | | (1,347 | ) |
| JPMorgan Securities | | | | | | | | | | | |
| Donnelley (R.R.) & Sons 5 yr CDS | | | 1,285,000 | | 5.00% | | 6/20/14 | | | (181,594 | ) |
| Penney (J.C.) 5 yr CDS | | | 880,000 | | 1.00% | | 3/20/15 | | | 18,094 | |
| Portuguese Republic | | | | | | | | | | | |
| 5 yr CDS | | | 474,000 | | 1.00% | | 3/20/15 | | | 19,574 | |
| 5 yr CDS | | | 756,000 | | 1.00% | | 6/20/15 | | | 12,666 | |
| Sunoco 5 yr CDS | | | 185,000 | | 1.00% | | 3/20/15 | | | 5,127 | |
| Viacom 5 yr CDS | | | 1,250,000 | | 1.00% | | 9/20/15 | | | (6,458 | ) |
| | | $ | 13,110,000 | | | | | | $ | (275,159 | ) |
| Credit Protection Sold / Moody’s Rating | | | | | | | | | | | |
| Citigroup Global Markets | | | | | | | | | | | |
| MetLife 5 yr CDS / A | | $ | 825,000 | | 5.00% | | 9/20/14 | | $ | 15,019 | |
| JPMorgan Securities | | | | | | | | | | | |
| MetLife 5 yr CDS / A | | | 235,000 | | 1.00% | | 12/20/14 | | | (3,196 | ) |
| Valero Energy 5 yr CDS / Baa | | | 185,000 | | 1.00% | | 3/20/15 | | | (324 | ) |
| Comcast 5 yr CDS / Baa | | | 1,250,000 | | 1.00% | | 9/20/15 | | | 9,978 | |
| Morgan Stanley | | | | | | | | | | | |
| Valero Energy 5 yr CDS / Baa | | | 520,000 | | 1.00% | | 3/20/15 | | | 10,201 | |
| | | $ | 3,015,000 | | | | | | $ | 31,678 | |
| Total | | | | | | | | | $ | (243,481 | ) |
The use of foreign currency exchange contracts, futures contracts, and swap contracts involves elements of market risk and risks in excess of the amounts recognized in the financial statements. The notional values presented above represent the Fund’s total exposure in such contracts, whereas only the net unrealized appreciation (depreciation) is reflected in the Fund’s net assets.
1See Note 8 in “Notes to financial statements.”
See accompanying Notes, which are an integral part of the financial statements.
47
| Statements of operations | |
| | Year Ended July 31, 2010 |
| | | Delaware | | Delaware |
| | | Corporate | | Extended |
| | | Bond | | Duration Bond |
| | | Fund | | Fund |
| Investment Income: | | | | | | | | |
| Interest | | $ | 50,332,985 | | | $ | 19,700,060 | |
| Dividends | | | 280,534 | | | | 133,238 | |
| Securities lending income | | | 61,979 | | | | 19,848 | |
| Foreign tax withheld | | | (24,974 | ) | | | (12,835 | ) |
| | | | 50,650,524 | | | | 19,840,311 | |
| Expenses: | | | | | | | | |
| Management fees | | | 3,977,258 | | | | 1,625,747 | |
| Distribution expense – Class A | | | 1,536,875 | | | | 697,113 | |
| Distribution expense – Class B | | | 109,587 | | | | 37,022 | |
| Distribution expense – Class C | | | 1,374,159 | | | | 206,480 | |
| Distribution expense – Class R | | | 65,471 | | | | 36,479 | |
| Dividend disbursing and transfer agent fees and expenses | | | 1,593,670 | | | | 602,118 | |
| Accounting and administration expenses | | | 322,969 | | | | 117,690 | |
| Reports and statements to shareholders | | | 148,341 | | | | 52,771 | |
| Registration fees | | | 132,294 | | | | 76,915 | |
| Legal fees | | | 91,821 | | | | 32,875 | |
| Audit and tax | | | 54,734 | | | | 27,728 | |
| Trustees’ fees | | | 46,885 | | | | 16,904 | |
| Custodian fees | | | 36,475 | | | | 13,680 | |
| Insurance fees | | | 24,520 | | | | 8,847 | |
| Dues and services | | | 22,721 | | | | 13,035 | |
| Pricing fees | | | 18,573 | | | | 16,445 | |
| Consulting fees | | | 11,618 | | | | 4,348 | |
| Trustees’ expenses | | | 3,244 | | | | 1,176 | |
| | | | 9,571,215 | | | | 3,587,373 | |
| Less fees waived | | | (927,863 | ) | | | (583,953 | ) |
| Less waived distribution expenses – Class A | | | (254,918 | ) | | | (115,946 | ) |
| Less waived distribution expenses – Class R | | | (10,912 | ) | | | (6,080 | ) |
| Less expense paid indirectly | | | (798 | ) | | | (505 | ) |
| Total operating expenses | | | 8,376,724 | | | | 2,880,889 | |
| Net Investment Income | | | 42,273,800 | | | | 16,959,422 | |
48
| | | Delaware | | Delaware |
| | | Corporate | | Extended |
| | | Bond | | Duration Bond |
| | | Fund | | Fund |
| Net Realized and Unrealized Gain (Loss) on | | | | | | | | |
| Investments and Foreign Currencies: | | | | | | | | |
| Net realized gain (loss) on: | | | | | | | | |
| Investments | | $ | 61,067,216 | | | $ | 20,729,256 | |
| Foreign currencies | | | 557,483 | | | | 216,798 | |
| Futures contracts | | | 1,849,024 | | | | 7,313,387 | |
| Swap contracts | | | (92,489 | ) | | | (26,826 | ) |
| Net realized gain | | | 63,381,234 | | | | 28,232,615 | |
| Net change in unrealized appreciation/depreciation | | | | | | | | |
| of investments and foreign currencies | | | 24,337,227 | | | | 12,929,876 | |
| Net Realized and Unrealized Gain on | | | | | | | | |
| Investments and Foreign Currencies | | | 87,718,461 | | | | 41,162,491 | |
| | | | | | | | | |
| Net Increase in Net Assets Resulting | | | | | | | | |
| from Operations | | $ | 129,992,261 | | | $ | 58,121,913 | |
See accompanying Notes, which are an integral part of the financial statements.
49
Statements of changes in net assets
Delaware Corporate Bond Fund
| | | Year Ended |
| | | 7/31/10 | | 7/31/09 |
| Increase (Decrease) in Net Assets from Operations: | | | | | | | | |
| Net investment income | | $ | 42,273,800 | | | $ | 34,436,470 | |
| Net realized gain (loss) on investments | | | | | | | | |
| and foreign currencies | | | 63,381,234 | | | | (15,995,766 | ) |
| Net change in unrealized appreciation/depreciation | | | | | | | | |
| of investments and foreign currencies | | | 24,337,227 | | | | 50,764,760 | |
| Net increase in net assets resulting from operations | | | 129,992,261 | | | | 69,205,464 | |
| | | | | | | | | |
| Dividends and Distributions to Shareholders from: | | | | | | | | |
| Net investment income: | | | | | | | | |
| Class A | | | (29,498,681 | ) | | | (17,630,473 | ) |
| Class B | | | (550,082 | ) | | | (669,607 | ) |
| Class C | | | (6,879,814 | ) | | | (4,142,648 | ) |
| Class R | | | (602,275 | ) | | | (589,808 | ) |
| Institutional Class | | | (8,273,848 | ) | | | (10,872,016 | ) |
| | | | (45,804,700 | ) | | | (33,904,552 | ) |
| | | | | | | | | |
| Capital Share Transactions: | | | | | | | | |
| Proceeds from shares sold: | | | | | | | | |
| Class A | | | 351,999,821 | | | | 289,855,627 | |
| Class B | | | 286,236 | | | | 410,530 | |
| Class C | | | 47,478,675 | | | | 68,765,093 | |
| Class R | | | 5,484,669 | | | | 5,041,020 | |
| Institutional Class | | | 346,602,990 | | | | 56,389,720 | |
| | | | | | | | | |
| Net asset value of shares issued upon reinvestment | | | | | | | | |
| of dividends and distributions: | | | | | | | | |
| Class A | | | 15,482,178 | | | | 12,817,706 | |
| Class B | | | 325,321 | | | | 400,067 | |
| Class C | | | 2,664,010 | | | | 3,009,722 | |
| Class R | | | 381,206 | | | | 580,575 | |
| Institutional Class | | | 1,611,278 | | | | 2,751,488 | |
| | | | 772,316,384 | | | | 440,021,548 | |
50
| | | Year Ended |
| | | 7/31/10 | | 7/31/09 |
| Capital Share Transactions (continued): | | | | | | | | |
| Cost of shares repurchased: | | | | | | | | |
| Class A | | $ | (473,604,171 | ) | | $ | (138,950,540 | ) |
| Class B | | | (3,955,525 | ) | | | (4,594,860 | ) |
| Class C | | | (45,346,480 | ) | | | (21,190,502 | ) |
| Class R | | | (8,066,461 | ) | | | (6,875,785 | ) |
| Institutional Class | | | (51,910,392 | ) | | | (212,080,924 | ) |
| | | | (582,883,029 | ) | | | (383,692,611 | ) |
| Increase (decrease) in net assets derived | | | | | | | | |
| from capital share transactions | | | 189,433,355 | | | | 56,328,937 | |
| Net Increase in Net Assets | | | 273,620,916 | | | | 91,629,849 | |
| | | | | | | | | |
| Net Assets: | | | | | | | | |
| Beginning of year | | | 655,195,058 | | | | 563,565,209 | |
| End of year | | $ | 928,815,974 | | | $ | 655,195,058 | |
| | | | | | | | | |
| Distributions in excess of net investment income | | $ | (163,236 | ) | | $ | (482,217 | ) |
See accompanying Notes, which are an integral part of the financial statements.
51
Statements of changes in net assets
Delaware Extended Duration Bond Fund
| | | Year Ended |
| | | 7/31/10 | | 7/31/09 |
| Increase (Decrease) in Net Assets from Operations: | | | | | �� | | | |
| Net investment income | | $ | 16,959,422 | | | $ | 14,523,299 | |
| Net realized gain (loss) on investments | | | | | | | | |
| and foreign currencies | | | 28,232,615 | | | | (6,685,843 | ) |
| Net change in unrealized appreciation/depreciation | | | | | | | | |
| of investments and foreign currencies | | | 12,929,876 | | | | 23,785,423 | |
| Net increase in net assets resulting from operations | | | 58,121,913 | | | | 31,622,879 | |
| | | | | | | | | |
| Dividends and Distributions to Shareholders from: | | | | | | | | |
| Net investment income: | | | | | | | | |
| Class A | | | (13,787,748 | ) | | | (10,826,524 | ) |
| Class B | | | (193,311 | ) | | | (241,956 | ) |
| Class C | | | (1,074,872 | ) | | | (1,006,934 | ) |
| Class R | | | (340,033 | ) | | | (26,836 | ) |
| Institutional Class | | | (2,034,209 | ) | | | (2,188,704 | ) |
| | | | (17,430,173 | ) | | | (14,290,954 | ) |
| | | | | | | | | |
| Capital Share Transactions: | | | | | | | | |
| Proceeds from shares sold: | | | | | | | | |
| Class A | | | 138,349,253 | | | | 75,992,783 | |
| Class B | | | 62,238 | | | | 67,858 | |
| Class C | | | 8,692,273 | | | | 5,066,090 | |
| Class R | | | 14,196,170 | | | | 338,174 | |
| Institutional Class | | | 28,357,875 | | | | 18,626,692 | |
| | | | | | | | | |
| Net asset value of shares issued upon reinvestment | | | | | | | | |
| of dividends and distributions: | | | | | | | | |
| Class A | | | 11,967,772 | | | | 9,259,070 | |
| Class B | | | 117,338 | | | | 161,170 | |
| Class C | | | 554,975 | | | | 681,672 | |
| Class R | | | 323,298 | | | | 26,168 | |
| Institutional Class | | | 1,509,711 | | | | 901,074 | |
| | | | 204,130,903 | | | | 111,120,751 | |
52
| | | Year Ended |
| | | 7/31/10 | | 7/31/09 |
| Capital Share Transactions (continued): | | | | | | | | |
| Cost of shares repurchased: | | | | | | | | |
| Class A | | $ | (91,290,016 | ) | | $ | (77,581,305 | ) |
| Class B | | | (1,230,405 | ) | | | (1,142,233 | ) |
| Class C | | | (8,143,235 | ) | | | (5,866,638 | ) |
| Class R | | | (1,833,248 | ) | | | (144,414 | ) |
| Institutional Class | | | (11,531,587 | ) | | | (32,116,715 | ) |
| | | | (114,028,491 | ) | | | (116,851,305 | ) |
| Increase (decrease) in net assets derived | | | | | | | | |
| from capital share transactions | | | 90,102,412 | | | | (5,730,554 | ) |
| Net Increase in Net Assets | | | 130,794,152 | | | | 11,601,371 | |
| | | | | | | | | |
| Net Assets: | | | | | | | | |
| Beginning of year | | | 234,538,009 | | | | 222,936,638 | |
| End of year | | $ | 365,332,161 | | | $ | 234,538,009 | |
| | | | | | | | | |
| Undistributed net investment income | | $ | 1,078,126 | | | $ | 913,555 | |
See accompanying Notes, which are an integral part of the financial statements.
53
Financial highlights
Delaware Corporate Bond Fund Class A
Selected data for each share of the Fund outstanding throughout each period were as follows:
| |
| Net asset value, beginning of period |
| |
| Income (loss) from investment operations: |
| Net investment income1 |
| Net realized and unrealized gain (loss) on investments and foreign currencies |
| Total from investment operations |
| |
| Less dividends and distributions from: |
| Net investment income |
| Net realized gain on investments |
| Total dividends and distributions |
| |
| Net asset value, end of period |
| |
| Total return2 |
| |
| Ratios and supplemental data: |
| Net assets, end of period (000 omitted) |
| Ratio of expenses to average net assets |
| Ratio of expenses to average net assets |
| prior to fees waived and expense paid indirectly |
| Ratio of net investment income to average net assets |
| Ratio of net investment income to average net assets |
| prior to fees waived and expense paid indirectly |
| Portfolio turnover |
1 The average shares outstanding method has been applied for per share information. |
2 Total investment return is based on the change in net asset value of a share during the period and assumes reinvestment of dividends and distributions at net asset value and does not reflect the impact of a sales charge. Total investment return during all of the periods shown reflects waivers by the manager and/or distributor. Performance would have been lower had the waivers not been in effect. |
See accompanying Notes, which are an integral part of the financial statements.
54
| | Year Ended |
| | | 7/31/10 | | | 7/31/09 | | | 7/31/08 | | | 7/31/07 | | | 7/31/06 | | |
| | | $5.460 | | | $5.240 | | | $5.520 | | | $5.490 | | | $5.780 | | |
| | | |
| | | |
| | | 0.309 | | | 0.314 | | | 0.279 | | | 0.301 | | | 0.276 | | |
| | | 0.647 | | | 0.216 | | | (0.272 | ) | | 0.046 | | | (0.239 | ) | |
| | | 0.956 | | | 0.530 | | | 0.007 | | | 0.347 | | | 0.037 | | |
| | | |
| | | |
| | | (0.336 | ) | | (0.310 | ) | | (0.287 | ) | | (0.317 | ) | | (0.306 | ) | |
| | | — | | | — | | | — | | | — | | | (0.021 | ) | |
| | | (0.336 | ) | | (0.310 | ) | | (0.287 | ) | | (0.317 | ) | | (0.327 | ) | |
| | | |
| | | $6.080 | | | $5.460 | | | $5.240 | | | $5.520 | | | $5.490 | | |
| | | |
| | | 17.91% | | | 11.04% | | | 0.04% | | | 6.35% | | | 0.70% | | |
| | | |
| | | |
| | | $409,671 | | | $459,892 | | | $268,659 | | | $304,255 | | | $256,776 | | |
| | | 0.94% | | | 0.90% | | | 0.90% | | | 0.82% | | | 0.81% | | |
| | | |
| | | 1.10% | | | 1.11% | | | 1.08% | | | 1.06% | | | 1.05% | | |
| | | 5.31% | | | 6.45% | | | 5.10% | | | 5.35% | | | 4.95% | | |
| | | |
| | | 5.15% | | | 6.24% | | | 4.92% | | | 5.11% | | | 4.71% | | |
| | | 219% | | | 271% | | | 355% | | | 244% | | | 173% | | |
55
Financial highlights
Delaware Corporate Bond Fund Class B
Selected data for each share of the Fund outstanding throughout each period were as follows:
| |
| Net asset value, beginning of period |
| |
| Income (loss) from investment operations: |
| Net investment income1 |
| Net realized and unrealized gain (loss) on investments and foreign currencies |
| Total from investment operations |
| |
| Less dividends and distributions from: |
| Net investment income |
| Net realized gain on investments |
| Total dividends and distributions |
| |
| Net asset value, end of period |
| |
| Total return2 |
| |
| Ratios and supplemental data: |
| Net assets, end of period (000 omitted) |
| Ratio of expenses to average net assets |
| Ratio of expenses to average net assets |
| prior to fees waived and expense paid indirectly |
| Ratio of net investment income to average net assets |
| Ratio of net investment income to average net assets |
| prior to fees waived and expense paid indirectly |
| Portfolio turnover |
1 The average shares outstanding method has been applied for per share information. |
2 Total investment return is based on the change in net asset value of a share during the period and assumes reinvestment of dividends and distributions at net asset value and does not reflect the impact of a sales charge. Total investment return during all of the periods shown reflects a waiver by the manager. Performance would have been lower had the waiver not been in effect. |
See accompanying Notes, which are an integral part of the financial statements.
56
| | Year Ended |
| | | 7/31/10 | | | 7/31/09 | | | 7/31/08 | | | 7/31/07 | | | 7/31/06 | | |
| | | $5.460 | | | $5.230 | | | $5.520 | | | $5.480 | | | $5.770 | | |
| | | |
| | | |
| | | 0.265 | | | 0.278 | | | 0.238 | | | 0.259 | | | 0.234 | | |
| | | 0.647 | | | 0.225 | | | (0.283 | ) | | 0.055 | | | (0.239 | ) | |
| | | 0.912 | | | 0.503 | | | (0.045 | ) | | 0.314 | | | (0.005 | ) | |
| | | |
| | | |
| | | (0.292 | ) | | (0.273 | ) | | (0.245 | ) | | (0.274 | ) | | (0.264 | ) | |
| | | — | | | — | | | — | | | — | | | (0.021 | ) | |
| | | (0.292 | ) | | (0.273 | ) | | (0.245 | ) | | (0.274 | ) | | (0.285 | ) | |
| | | |
| | | $6.080 | | | $5.460 | | | $5.230 | | | $5.520 | | | $5.480 | | |
| | | |
| | | 17.04% | | | 10.43% | | | (0.90% | ) | | 5.56% | | | 0.13% | | |
| | | |
| | | |
| | | $9,807 | | | $11,938 | | | $15,525 | | | $22,694 | | | $23,792 | | |
| | | 1.69% | | | 1.65% | | | 1.65% | | | 1.57% | | | 1.56% | | |
| | | |
| | | 1.80% | | | 1.81% | | | 1.78% | | | 1.76% | | | 1.75% | | |
| | | 4.56% | | | 5.70% | | | 4.35% | | | 4.60% | | | 4.20% | | |
| | | |
| | | 4.45% | | | 5.54% | | | 4.22% | | | 4.41% | | | 4.01% | | |
| | | 219% | | | 271% | | | 355% | | | 244% | | | 173% | | |
57
Financial highlights
Delaware Corporate Bond Fund Class C
Selected data for each share of the Fund outstanding throughout each period were as follows:
| |
| Net asset value, beginning of period |
| |
| Income (loss) from investment operations: |
| Net investment income1 |
| Net realized and unrealized gain (loss) on investments and foreign currencies |
| Total from investment operations |
| |
| Less dividends and distributions from: |
| Net investment income |
| Net realized gain on investments |
| Total dividends and distributions |
| |
| Net asset value, end of period |
| |
| Total return2 |
| |
| Ratios and supplemental data: |
| Net assets, end of period (000 omitted) |
| Ratio of expenses to average net assets |
| Ratio of expenses to average net assets |
| prior to fees waived and expense paid indirectly |
| Ratio of net investment income to average net assets |
| Ratio of net investment income to average net assets |
| prior to fees waived and expense paid indirectly |
| Portfolio turnover |
1 The average shares outstanding method has been applied for per share information. |
2 Total investment return is based on the change in net asset value of a share during the period and assumes reinvestment of dividends and distributions at net asset value and does not reflect the impact of a sales charge. Total investment return during all of the periods shown reflects a waiver by the manager. Performance would have been lower had the waiver not been in effect. |
See accompanying Notes, which are an integral part of the financial statements.
58
| | Year Ended |
| | | 7/31/10 | | | 7/31/09 | | | 7/31/08 | | | 7/31/07 | | | 7/31/06 | | |
| | | $5.470 | | | $5.240 | | | $5.520 | | | $5.490 | | | $5.780 | | |
| | | |
| | | |
| | | 0.266 | | | 0.278 | | | 0.238 | | | 0.259 | | | 0.234 | | |
| | | 0.646 | | | 0.225 | | | (0.273 | ) | | 0.045 | | | (0.239 | ) | |
| | | 0.912 | | | 0.503 | | | (0.035 | ) | | 0.304 | | | (0.005 | ) | |
| | | |
| | | |
| | | (0.292 | ) | | (0.273 | ) | | (0.245 | ) | | (0.274 | ) | | (0.264 | ) | |
| | | — | | | — | | | — | | | — | | | (0.021 | ) | |
| | | (0.292 | ) | | (0.273 | ) | | (0.245 | ) | | (0.274 | ) | | (0.285 | ) | |
| | | |
| | | $6.090 | | | $5.470 | | | $5.240 | | | $5.520 | | | $5.490 | | |
| | | |
| | | 17.01% | | | 10.41% | | | (0.71% | ) | | 5.55% | | | (0.05% | ) | |
| | | |
| | | |
| | | $141,328 | | | $121,901 | | | $62,211 | | | $67,693 | | | $48,425 | | |
| | | 1.69% | | | 1.65% | | | 1.65% | | | 1.57% | | | 1.56% | | |
| | | |
| | | 1.80% | | | 1.81% | | | 1.78% | | | 1.76% | | | 1.75% | | |
| | | 4.56% | | | 5.70% | | | 4.35% | | | 4.60% | | | 4.20% | | |
| | | |
| | | 4.45% | | | 5.54% | | | 4.22% | | | 4.41% | | | 4.01% | | |
| | | 219% | | | 271% | | | 355% | | | 244% | | | 173% | | |
59
Financial highlights
Delaware Corporate Bond Fund Class R
Selected data for each share of the Fund outstanding throughout each period were as follows:
| |
| Net asset value, beginning of period |
| |
| Income (loss) from investment operations: |
| Net investment income1 |
| Net realized and unrealized gain (loss) on investments and foreign currencies |
| Total from investment operations |
| |
| Less dividends and distributions from: |
| Net investment income |
| Net realized gain on investments |
| Total dividends and distributions |
| |
| Net asset value, end of period |
| |
| Total return2 |
| |
| Ratios and supplemental data: |
| Net assets, end of period (000 omitted) |
| Ratio of expenses to average net assets |
| Ratio of expenses to average net assets |
| prior to fees waived and expense paid indirectly |
| Ratio of net investment income to average net assets |
| Ratio of net investment income to average net assets |
| prior to fees waived and expense paid indirectly |
| Portfolio turnover |
1 The average shares outstanding method has been applied for per share information. |
2 Total investment return is based on the change in net asset value of a share during the period and assumes reinvestment of dividends and distributions at net asset value. Total investment return during all of the periods shown reflects waivers by the manager and/or distributor. Performance would have been lower had the waivers not been in effect. |
See accompanying Notes, which are an integral part of the financial statements.
60
| | Year Ended |
| | | 7/31/10 | | | 7/31/09 | | | 7/31/08 | | | 7/31/07 | | | 7/31/06 | | |
| | | $5.470 | | | $5.240 | | | $5.520 | | | $5.490 | | | $5.780 | | |
| | | |
| | | |
| | | 0.295 | | | 0.302 | | | 0.265 | | | 0.287 | | | 0.262 | | |
| | | 0.646 | | | 0.226 | | | (0.272 | ) | | 0.045 | | | (0.239 | ) | |
| | | 0.941 | | | 0.528 | | | (0.007 | ) | | 0.332 | | | 0.023 | | |
| | | |
| | | |
| | | (0.321 | ) | | (0.298 | ) | | (0.273 | ) | | (0.302 | ) | | (0.292 | ) | |
| | | — | | | — | | | — | | | — | | | (0.021 | ) | |
| | | (0.321 | ) | | (0.298 | ) | | (0.273 | ) | | (0.302 | ) | | (0.313 | ) | |
| | | |
| | | $6.090 | | | $5.470 | | | $5.240 | | | $5.520 | | | $5.490 | | |
| | | |
| | | 17.60% | | | 10.97% | | | (0.21% | ) | | 6.07% | | | 0.45% | | |
| | | |
| | | |
| | | $10,209 | | | $11,229 | | | $11,973 | | | $15,802 | | | $6,048 | | |
| | | 1.19% | | | 1.15% | | | 1.15% | | | 1.07% | | | 1.06% | | |
| | | |
| | | 1.40% | | | 1.41% | | | 1.38% | | | 1.36% | | | 1.35% | | |
| | | 5.06% | | | 6.20% | | | 4.85% | | | 5.10% | | | 4.70% | | |
| | | |
| | | 4.85% | | | 5.94% | | | 4.62% | | | 4.81% | | | 4.41% | | |
| | | 219% | | | 271% | | | 355% | | | 244% | | | 173% | | |
61
Financial highlights
Delaware Corporate Bond Fund Institutional Class
Selected data for each share of the Fund outstanding throughout each period were as follows:
| |
| Net asset value, beginning of period |
| |
| Income (loss) from investment operations: |
| Net investment income1 |
| Net realized and unrealized gain (loss) on investments and foreign currencies |
| Total from investment operations |
| |
| Less dividends and distributions from: |
| Net investment income |
| Net realized gain on investments |
| Total dividends and distributions |
| |
| Net asset value, end of period |
| |
| Total return2 |
| |
| Ratios and supplemental data: |
| Net assets, end of period (000 omitted) |
| Ratio of expenses to average net assets |
| Ratio of expenses to average net assets |
| prior to fees waived and expense paid indirectly |
| Ratio of net investment income to average net assets |
| Ratio of net investment income to average net assets |
| prior to fees waived and expense paid indirectly |
| Portfolio turnover |
1 The average shares outstanding method has been applied for per share information. |
2 Total investment return is based on the change in net asset value of a share during the period and assumes reinvestment of dividends and distributions at net asset value. Total investment return during all of the periods shown reflects a waiver by the manager. Performance would have been lower had the waiver not been in effect. |
See accompanying Notes, which are an integral part of the financial statements.
62
| | Year Ended |
| | | 7/31/10 | | | 7/31/09 | | | 7/31/08 | | | 7/31/07 | | | 7/31/06 | | |
| | | $5.470 | | | $5.240 | | | $5.520 | | | $5.480 | | | $5.770 | | |
| | | |
| | | |
| | | 0.329 | | | 0.327 | | | 0.293 | | | 0.315 | | | 0.289 | | |
| | | 0.641 | | | 0.225 | | | (0.273 | ) | | 0.056 | | | (0.238 | ) | |
| | | 0.970 | | | 0.552 | | | 0.020 | | | 0.371 | | | 0.051 | | |
| | | |
| | | |
| | | (0.350 | ) | | (0.322 | ) | | (0.300 | ) | | (0.331 | ) | | (0.320 | ) | |
| | | — | | | — | | | — | | | — | | | (0.021 | ) | |
| | | (0.350 | ) | | (0.322 | ) | | (0.300 | ) | | (0.331 | ) | | (0.341 | ) | |
| | | |
| | | $6.090 | | | $5.470 | | | $5.240 | | | $5.520 | | | $5.480 | | |
| | | |
| | | 18.40% | | | 11.53% | | | 0.10% | | | 6.81% | | | 0.95% | | |
| | | |
| | | |
| | | $357,801 | | | $50,235 | | | $205,197 | | | $180,631 | | | $234,281 | | |
| | | 0.69% | | | 0.65% | | | 0.65% | | | 0.57% | | | 0.56% | | |
| | | |
| | | 0.80% | | | 0.81% | | | 0.78% | | | 0.76% | | | 0.75% | | |
| | | 5.56% | | | 6.70% | | | 5.35% | | | 5.60% | | | 5.20% | | |
| | | |
| | | 5.45% | | | 6.54% | | | 5.22% | | | 5.41% | | | 5.01% | | |
| | | 219% | | | 271% | | | 355% | | | 244% | | | 173% | | |
63
Financial highlights
Delaware Extended Duration Bond Fund Class A
Selected data for each share of the Fund outstanding throughout each period were as follows:
| |
| Net asset value, beginning of period |
| |
| Income (loss) from investment operations: |
| Net investment income1 |
| Net realized and unrealized gain (loss) on investments and foreign currencies |
| Total from investment operations |
| |
| Less dividends and distributions from: |
| Net investment income |
| Net realized gain on investments |
| Total dividends and distributions |
| |
| Net asset value, end of period |
| |
| Total return2 |
| |
| Ratios and supplemental data: |
| Net assets, end of period (000 omitted) |
| Ratio of expenses to average net assets |
| Ratio of expenses to average net assets |
| prior to fees waived and expense paid indirectly |
| Ratio of net investment income to average net assets |
| Ratio of net investment income to average net assets |
| prior to fees waived and expense paid indirectly |
| Portfolio turnover |
1 The average shares outstanding method has been applied for per share information. |
2 Total investment return is based on the change in net asset value of a share during the period and assumes reinvestment of dividends and distributions at net asset value and does not reflect the impact of a sales charge. Total investment return during all of the periods shown reflects waivers by the manager and/or distributor. Performance would have been lower had the waivers not been in effect. |
See accompanying Notes, which are an integral part of the financial statements.
64
| | Year Ended |
| | | 7/31/10 | | | 7/31/09 | | | 7/31/08 | | | 7/31/07 | | | 7/31/06 | | |
| | | $5.600 | | | $5.210 | | | $5.460 | | | $5.410 | | | $5.940 | | |
| | | |
| | | |
| | | 0.348 | | | 0.344 | | | 0.296 | | | 0.306 | | | 0.299 | | |
| | | 0.850 | | | 0.385 | | | (0.245 | ) | | 0.065 | | | (0.468 | ) | |
| | | 1.198 | | | 0.729 | | | 0.051 | | | 0.371 | | | (0.169 | ) | |
| | | |
| | | |
| | | (0.358 | ) | | (0.339 | ) | | (0.301 | ) | | (0.321 | ) | | (0.309 | ) | |
| | | — | | | — | | | — | | | — | | | (0.052 | ) | |
| | | (0.358 | ) | | (0.339 | ) | | (0.301 | ) | | (0.321 | ) | | (0.361 | ) | |
| | | |
| | | $6.440 | | | $5.600 | | | $5.210 | | | $5.460 | | | $5.410 | | |
| | | |
| | | 22.00% | | | 15.17% | | | 0.83% | | | 6.82% | | | (2.89% | ) | |
| | | |
| | | |
| | | $275,312 | | | $184,538 | | | $163,372 | | | $180,853 | | | $92,132 | | |
| | | 0.94% | | | 0.90% | | | 0.90% | | | 0.88% | | | 0.80% | | |
| | | |
| | | 1.18% | | | 1.29% | | | 1.23% | | | 1.20% | | | 1.22% | | |
| | | 5.77% | | | 7.03% | | | 5.42% | | | 5.44% | | | 5.35% | | |
| | | |
| | | 5.53% | | | 6.64% | | | 5.09% | | | 5.12% | | | 4.93% | | |
| | | 149% | | | 234% | | | 443% | | | 276% | | | 184% | | |
65
Financial highlights
Delaware Extended Duration Bond Fund Class B
Selected data for each share of the Fund outstanding throughout each period were as follows:
| |
| Net asset value, beginning of period |
| |
| Income (loss) from investment operations: |
| Net investment income1 |
| Net realized and unrealized gain (loss) on investments and foreign currencies |
| Total from investment operations |
| |
| Less dividends and distributions from: |
| Net investment income |
| Net realized gain on investments |
| Total dividends and distributions |
| |
| Net asset value, end of period |
| |
| Total return2 |
| |
| Ratios and supplemental data: |
| Net assets, end of period (000 omitted) |
| Ratio of expenses to average net assets |
| Ratio of expenses to average net assets |
| prior to fees waived and expense paid indirectly |
| Ratio of net investment income to average net assets |
| Ratio of net investment income to average net assets |
| prior to fees waived and expense paid indirectly |
| Portfolio turnover |
1 The average shares outstanding method has been applied for per share information. |
2 Total investment return is based on the change in net asset value of a share during the period and assumes reinvestment of dividends and distributions at net asset value and does not reflect the impact of a sales charge. Total investment return during all of the periods shown reflects a waiver by the manager. Performance would have been lower had the waiver not been in effect. |
See accompanying Notes, which are an integral part of the financial statements.
66
| | Year Ended |
| | | 7/31/10 | | | 7/31/09 | | | 7/31/08 | | | 7/31/07 | | | 7/31/06 | | |
| | | $5.590 | | | $5.200 | | | $5.450 | | | $5.410 | | | $5.930 | | |
| | | |
| | | |
| | | 0.301 | | | 0.307 | | | 0.254 | | | 0.264 | | | 0.257 | | |
| | | 0.852 | | | 0.384 | | | (0.244 | ) | | 0.054 | | | (0.458 | ) | |
| | | 1.153 | | | 0.691 | | | 0.010 | | | 0.318 | | | (0.201 | ) | |
| | | |
| | | |
| | | (0.313 | ) | | (0.301 | ) | | (0.260 | ) | | (0.278 | ) | | (0.267 | ) | |
| | | — | | | — | | | — | | | — | | | (0.052 | ) | |
| | | (0.313 | ) | | (0.301 | ) | | (0.260 | ) | | (0.278 | ) | | (0.319 | ) | |
| | | |
| | | $6.430 | | | $5.590 | | | $5.200 | | | $5.450 | | | $5.410 | | |
| | | |
| | | 21.13% | | | 14.33% | | | 0.08% | | | 5.84% | | | (3.45% | ) | |
| | | |
| | | |
| | | $3,464 | | | $3,992 | | | $4,718 | | | $5,959 | | | $6,371 | | |
| | | 1.69% | | | 1.65% | | | 1.65% | | | 1.63% | | | 1.55% | | |
| | | |
| | | 1.88% | | | 1.99% | | | 1.93% | | | 1.90% | | | 1.92% | | |
| | | 5.02% | | | 6.28% | | | 4.67% | | | 4.69% | | | 4.60% | | |
| | | |
| | | 4.83% | | | 5.94% | | | 4.39% | | | 4.42% | | | 4.23% | | |
| | | 149% | | | 234% | | | 443% | | | 276% | | | 184% | | |
67
Financial highlights
Delaware Extended Duration Bond Fund Class C
Selected data for each share of the Fund outstanding throughout each period were as follows:
| |
| Net asset value, beginning of period |
| |
| Income (loss) from investment operations: |
| Net investment income1 |
| Net realized and unrealized gain (loss) on investments and foreign currencies |
| Total from investment operations |
| |
| Less dividends and distributions from: |
| Net investment income |
| Net realized gain on investments |
| Total dividends and distributions |
| |
| Net asset value, end of period |
| |
| Total return2 |
| |
| Ratios and supplemental data: |
| Net assets, end of period (000 omitted) |
| Ratio of expenses to average net assets |
| Ratio of expenses to average net assets |
| prior to fees waived and expense paid indirectly |
| Ratio of net investment income to average net assets |
| Ratio of net investment income to average net assets |
| prior to fees waived and expense paid indirectly |
| Portfolio turnover |
1 The average shares outstanding method has been applied for per share information. |
2 Total investment return is based on the change in net asset value of a share during the period and assumes reinvestment of dividends and distributions at net asset value and does not reflect the impact of a sales charge. Total investment return during all of the periods shown reflects a waiver by the manager. Performance would have been lower had the waiver not been in effect. |
See accompanying Notes, which are an integral part of the financial statements.
68
| | Year Ended |
| | | 7/31/10 | | | 7/31/09 | | | 7/31/08 | | | 7/31/07 | | | 7/31/06 | | |
| | | $5.600 | | | $5.210 | | | $5.460 | | | $5.410 | | | $5.930 | | |
| | | |
| | | |
| | | 0.302 | | | 0.307 | | | 0.254 | | | 0.264 | | | 0.257 | | |
| | | 0.841 | | | 0.385 | | | (0.244 | ) | | 0.064 | | | (0.458 | ) | |
| | | 1.143 | | | 0.692 | | | 0.010 | | | 0.328 | | | (0.201 | ) | |
| | | |
| | | |
| | | (0.313 | ) | | (0.302 | ) | | (0.260 | ) | | (0.278 | ) | | (0.267 | ) | |
| | | — | | | — | | | — | | | — | | | (0.052 | ) | |
| | | (0.313 | ) | | (0.302 | ) | | (0.260 | ) | | (0.278 | ) | | (0.319 | ) | |
| | | |
| | | $6.430 | | | $5.600 | | | $5.210 | | | $5.460 | | | $5.410 | | |
| | | |
| | | 20.91% | | | 14.32% | | | 0.08% | | | 6.03% | | | (3.45% | ) | |
| | | |
| | | |
| | | $23,115 | | | $19,120 | | | $17,976 | | | $20,156 | | | $11,021 | | |
| | | 1.69% | | | 1.65% | | | 1.65% | | | 1.63% | | | 1.55% | | |
| | | |
| | | 1.88% | | | 1.99% | | | 1.93% | | | 1.90% | | | 1.92% | | |
| | | 5.02% | | | 6.28% | | | 4.67% | | | 4.69% | | | 4.60% | | |
| | | |
| | | 4.83% | | | 5.94% | | | 4.39% | | | 4.42% | | | 4.23% | | |
| | | 149% | | | 234% | | | 443% | | | 276% | | | 184% | | |
69
Financial highlights
Delaware Extended Duration Bond Fund Class R
Selected data for each share of the Fund outstanding throughout each period were as follows:
| |
| Net asset value, beginning of period |
| |
| Income (loss) from investment operations: |
| Net investment income2 |
| Net realized and unrealized gain (loss) on investments and foreign currencies |
| Total from investment operations |
| |
| Less dividends and distributions from: |
| Net investment income |
| Net realized gain on investments |
| Total dividends and distributions |
| |
| Net asset value, end of period |
| |
| Total return3 |
| |
| Ratios and supplemental data: |
| Net assets, end of period (000 omitted) |
| Ratio of expenses to average net assets |
| Ratio of expenses to average net assets |
| prior to fees waived and expense paid indirectly |
| Ratio of net investment income to average net assets |
| Ratio of net investment income to average net assets |
| prior to fees waived and expense paid indirectly |
| Portfolio turnover |
1 Date of commencement of operations; ratios have been annualized and total return has not been annualized. |
2 The average shares outstanding method has been applied for per share information. |
See accompanying Notes, which are an integral part of the financial statements.
70
| | Year Ended | | 10/1/051
to | | |
| | | 7/31/10 | | | 7/31/09 | | | 7/31/08 | | | 7/31/07 | | | 7/31/06 | | |
| | | $5.600 | | | $5.210 | | | $5.460 | | | $5.410 | | | $5.820 | | |
| | | |
| | | |
| | | 0.339 | | | 0.332 | | | 0.282 | | | 0.293 | | | 0.236 | | |
| | | 0.845 | | | 0.385 | | | (0.245 | ) | | 0.064 | | | (0.391 | ) | |
| | | 1.184 | | | 0.717 | | | 0.037 | | | 0.357 | | | (0.155 | ) | |
| | | |
| | | |
| | | (0.344 | ) | | (0.327 | ) | | (0.287 | ) | | (0.307 | ) | | (0.203 | ) | |
| | | — | | | — | | | — | | | — | | | (0.052 | ) | |
| | | (0.344 | ) | | (0.327 | ) | | (0.287 | ) | | (0.307 | ) | | (0.255 | ) | |
| | | |
| | | $6.440 | | | $5.600 | | | $5.210 | | | $5.460 | | | $5.410 | | |
| | | |
| | | 21.48% | | | 15.08% | | | 0.39% | | | 6.75% | | | (2.67% | ) | |
| | | |
| | | |
| | | $14,131 | | | $665 | | | $377 | | | $250 | | | $23 | | |
| | | 1.19% | | | 1.15% | | | 1.15% | | | 1.13% | | | 1.05% | | |
| | | |
| | | 1.48% | | | 1.59% | | | 1.53% | | | 1.50% | | | 1.52% | | |
| | | 5.52% | | | 6.78% | | | 5.17% | | | 5.19% | | | 5.12% | | |
| | | |
| | | 5.23% | | | 6.34% | | | 4.79% | | | 4.82% | | | 4.65% | | |
| | | 149% | | | 234% | | | 443% | | | 276% | | | 184% | 4 | |
3 Total investment return is based on the change in net asset value of a share during the period and assumes reinvestment of dividends and distributions at net asset value. Total investment return during all of the periods shown reflects waivers by the manager and/or distributor. Performance would have been lower had the waivers not been in effect. |
4 Portfolio turnover is representative of the Fund for the entire year. |
71
Financial highlights
Delaware Extended Duration Bond Fund Institutional Class
Selected data for each share of the Fund outstanding throughout each period were as follows:
| |
| Net asset value, beginning of period |
| |
| Income (loss) from investment operations: |
| Net investment income1 |
| Net realized and unrealized gain (loss) on investments and foreign currencies |
| Total from investment operations |
| |
| Less dividends and distributions from: |
| Net investment income |
| Net realized gain on investments |
| Total dividends and distributions |
| |
| Net asset value, end of period |
| |
| Total return2 |
| |
| Ratios and supplemental data: |
| Net assets, end of period (000 omitted) |
| Ratio of expenses to average net assets |
| Ratio of expenses to average net assets |
| prior to fees waived and expense paid indirectly |
| Ratio of net investment income to average net assets |
| Ratio of net investment income to average net assets |
| prior to fees waived and expense paid indirectly |
| Portfolio turnover |
1 The average shares outstanding method has been applied for per share information. |
2 Total investment return during all periods shown is based on the change in net asset value of a share during the period and assumes reinvestment of dividends and distributions at net asset value. Total investment return during all of the periods shown reflects a waiver by the manager. Performance would have been lower had the waiver not been in effect. |
See accompanying Notes, which are an integral part of the financial statements.
72
| | Year Ended |
| | | 7/31/10 | | | 7/31/09 | | | 7/31/08 | | | 7/31/07 | | | 7/31/06 | | |
| | | $5.590 | | | $5.200 | | | $5.450 | | | $5.410 | | | $5.930 | | |
| | | |
| | | |
| | | 0.364 | | | 0.356 | | | 0.309 | | | 0.320 | | | 0.313 | | |
| | | 0.849 | | | 0.385 | | | (0.244 | ) | | 0.055 | | | (0.458 | ) | |
| | | 1.213 | | | 0.741 | | | 0.065 | | | 0.375 | | | (0.145 | ) | |
| | | |
| | | |
| | | (0.373 | ) | | (0.351 | ) | | (0.315 | ) | | (0.335 | ) | | (0.323 | ) | |
| | | — | | | — | | | — | | | — | | | (0.052 | ) | |
| | | (0.373 | ) | | (0.351 | ) | | (0.315 | ) | | (0.335 | ) | | (0.375 | ) | |
| | | |
| | | $6.430 | | | $5.590 | | | $5.200 | | | $5.450 | | | $5.410 | | |
| | | |
| | | 22.33% | | | 15.48% | | | 1.09% | | | 6.90% | | | (2.48% | ) | |
| | | |
| | | |
| | | $49,310 | | | $26,223 | | | $36,494 | | | $65,537 | | | $69,357 | | |
| | | 0.69% | | | 0.65% | | | 0.65% | | | 0.63% | | | 0.55% | | |
| | | |
| | | 0.88% | | | 0.99% | | | 0.93% | | | 0.90% | | | 0.92% | | |
| | | 6.02% | | | 7.28% | | | 5.67% | | | 5.69% | | | 5.60% | | |
| | | |
| | | 5.83% | | | 6.94% | | | 5.39% | | | 5.42% | | | 5.23% | | |
| | | 149% | | | 234% | | | 443% | | | 276% | | | 184% | | |
73
| Notes to financial statements | |
| Delaware Corporate Bond Fund and Delaware Extended Duration Bond Fund | July 31, 2010 |
Delaware Group® Income Funds (Trust) is organized as a Delaware statutory trust and offers five series: Delaware Corporate Bond Fund, Delaware Extended Duration Bond Fund, Delaware Core Bond Fund, Delaware High-Yield Opportunities Fund and Delaware Diversified Floating Rate Fund. These financial statements and the related notes pertain to Delaware Corporate Bond Fund and Delaware Extended Duration Bond Fund (each referred to as a Fund or collectively as the Funds). The Trust is an open-end investment company. The Funds are considered diversified under the Investment Company Act of 1940, as amended, and offer Class A, Class B, Class C, Class R and Institutional Class shares. Class A shares are sold with a front-end sales charge of up to 4.50%. Class A share purchases of $1,000,000 or more will incur a contingent deferred sales charge (CDSC) of 1% if redeemed during the first year and 0.50% during the second year, provided that Delaware Distributors, L.P. (DDLP) paid a financial advisor a commission on the purchase of those shares. Class B shares may only be purchased through dividend reinvestment and certain permitted exchanges. Prior to June 1, 2007, Class B shares were sold with a CDSC that declined from 4% to zero depending upon the period of time the shares were held. Class B shares will automatically convert to Class A shares on a quarterly basis approximately eight years after purchase. Class C shares are sold with a CDSC of 1%, if redeemed during the first twelve months. Class R and Institutional Class shares are not subject to a sales charge and are offered for sale exclusively to certain eligible investors.
The investment objective of the Funds is to seek to provide investors with total return.
1. Significant Accounting Policies
The following accounting policies are in accordance with U.S. generally accepted accounting principles (U.S. GAAP) and are consistently followed by the Funds.
Security Valuation — Equity securities, except those traded on the Nasdaq Stock Market, Inc. (Nasdaq), are valued at the last quoted sales price as of the time of the regular close of the New York Stock Exchange (NYSE) on the valuation date. Securities traded on the Nasdaq are valued in accordance with the Nasdaq Official Closing Price, which may not be the last sales price. If on a particular day an equity security does not trade, then the mean between the bid and ask prices will be used. Securities listed on a foreign exchange are valued at the last quoted sales price on the valuation date. Short-term debt securities are valued at market value. U.S. government and agency securities are valued at the mean between the bid and ask prices. Other debt securities, credit default swap (CDS) contracts and interest rate swap co ntracts are valued by an independent pricing service or broker. To the extent current market prices are not available, the pricing service may take into account developments related to the specific security, as well as transactions in comparable securities. Investment companies are valued at net asset value per share. Foreign currency exchange contracts are valued at the mean between the bid and ask prices. Interpolated values are derived when the settlement date of the contract is an interim date for which quotations are not available. Futures contracts and options on futures contracts are valued at the daily quoted settlement prices. Generally, other securities and assets for which market quotations are not readily available are valued at fair value as determined in good faith under the direction of
74
each Fund’s Board of Trustees (Board). In determining whether market quotations are readily available or fair valuation will be used, various factors will be taken into consideration, such as market closures or suspension of trading in a security. The Funds may use fair value pricing more frequently for securities traded primarily in non-U.S. markets because, among other things, most foreign markets close well before each Fund values its securities at 4:00 p.m. Eastern time. The earlier close of these foreign markets gives rise to the possibility that significant events, including broad market moves, government actions or pronouncements, aftermarket trading, or news events may have occurred in the interim. To account for this, the Funds may frequently value foreign securities using fair value prices based on third-party vendor modeling tools (international fair value pricing).
Federal Income Taxes — No provision for federal income taxes has been made as the Funds intend to continue to qualify for federal income tax purposes as a regulated investment company under Subchapter M of the Internal Revenue Code of 1986, as amended, and make the requisite distributions to shareholders. The Funds evaluate tax positions taken or expected to be taken in the course of preparing the Funds’ tax returns to determine whether the tax positions are “more-likely-than-not” of being sustained by the applicable tax authority. Tax positions not deemed to meet the more-likely-than-not threshold are recorded as a tax benefit or expense in the current year. Management has analyzed each Fund’s tax positions taken on federal income tax returns for all open tax years (July 31, 2007 – July 31, 2010), and has concluded that no provision for federal income tax is required in the Funds’ financial statements.
Class Accounting — Investment income and common expenses are allocated to the various classes of the Funds on the basis of “settled shares” of each class in relation to the net assets of the Funds. Realized and unrealized gains (loss) on investments are allocated to the various classes of the Funds on the basis of daily net assets of each class. Distribution expenses relating to a specific class are charged directly to that class.
Repurchase Agreements — The Funds may invest in a pooled cash account along with other members of the Delaware Investments® Family of Funds pursuant to an exemptive order issued by the Securities and Exchange Commission. The aggregate daily balance of the pooled cash account is invested in repurchase agreements secured by obligations of the U.S. government. The respective collateral is held by each Fund’s custodian bank until the maturity of the respective repurchase agreements. Each repurchase agreement is at least 102% collateralized. However, in the event of default or bankruptcy by the counterparty to the agreement, realization o f the collateral may be subject to legal proceedings. At July 31, 2010, the Funds held no investments in repurchase agreements.
To Be Announced Trades — The Funds may contract to purchase securities for a fixed price at a transaction date beyond the customary settlement period (i.e., “when issued,” “delayed delivery,” “forward commitment,” or “TBA transactions”) consistent with the Funds’ ability to manage their investment portfolio and meet redemption requests. These transactions involve a commitment by the Funds to purchase securities for a predetermined price or yield with payment
75
Notes to financial statements
Delaware Corporate Bond Fund and Delaware Extended Duration Bond Fund
1. Significant Accounting Policies (continued)
and delivery taking place more than three days in the future, or after a period longer than the customary settlement period for that type of security. No interest will be earned by the Funds on such purchases until the securities are delivered; however the market value may change prior to delivery.
Foreign Currency Transactions — Transactions denominated in foreign currencies are recorded at the prevailing exchange rates on the valuation date in accordance with the Funds’ prospectus. The value of all assets and liabilities denominated in foreign currencies is translated into U.S. dollars at the exchange rate of such currencies against the U.S. dollar daily. Transaction gains or losses resulting from changes in exchange rates during the reporting period or upon settlement of the foreign currency transaction are reported in operations for the current period. The Funds isolate that portion of realized gains and losses on investments in debt securities which is due to changes in foreign exchange rates from that which are due to changes in market prices of debt securities. The Funds report certain foreign currency related transactions as components of realized gains (losses) for financial reporting purposes, whereas such components are treated as ordinary income (loss) for federal income tax purposes.
Use of Estimates — The preparation of financial statements in conformity with U.S. GAAP requires management to make estimates and assumptions that affect the reported amounts of assets and liabilities and disclosure of contingent assets and liabilities at the date of the financial statements and the reported amounts of revenues and expenses during the reporting period. Actual results could differ from those estimates and such differences could be material.
Other — Expenses directly attributable to a Fund are charged directly to that Fund. Other expenses common to various funds within the Delaware Investments® Family of Funds are generally allocated amongst such funds on the basis of average net assets. Management fees and some other expenses are paid monthly. Security transactions are recorded on the date the securities are purchased or sold (trade date) for financial reporting purposes. Costs used in calculating realized gains and losses on the sale of investment securities are those of the specific securities sold. Dividend income is recorded on the ex-dividend date and interest income is recorded on the accrual basis. Discounts and premiums on non-convertible bonds are amortized to interest income over the lives of the respective securities. Realized gains (losses) on paydowns of mortgage- and asset-backed securities are classified as interest income. Withholding taxes on foreign interest have been recorded in accordance with each Fund’s understanding of the applicable country’s tax rules and rates. Each Fund declares dividends daily from net investment income and pays such dividends monthly and declares and pays distributions from net realized gain on investments, if any, twice per year. Such dividends and distributions, if any, are recorded on the ex-dividend date.
The Funds may receive earnings credits from their custodian when positive cash balances are maintained, which are used to offset custody fees. There were no earnings credits for the year ended July 31, 2010.
76
The Funds may receive earnings credits from their transfer agent when positive cash balances are maintained, which may be used to offset transfer agent fees. For the year ended July 31, 2010, the Funds earned the following amounts under this agreement:
| | | Delaware | | Delaware |
| | | Corporate | | Extended Duration |
| | | Bond Fund | | Bond Fund |
| | | $798 | | $505 |
2. Investment Management, Administration Agreements and Other Transactions with Affiliates
In accordance with the terms of its respective investment management agreement, each Fund pays Delaware Management Company (DMC), a series of Delaware Management Business Trust and the investment manager, an annual fee which is calculated based on each Fund’s average daily net assets as follows:
| | | Delaware | | Delaware |
| | | Corporate | | Extended Duration |
| | | Bond Fund | | Bond Fund |
| On the first $500 million | | 0.500% | | 0.550% |
| On the next $500 million | | 0.475% | | 0.500% |
| On the next $1.5 billion | | 0.450% | | 0.450% |
| In excess of $2.5 billion | | 0.425% | | 0.425% |
Effective December 1, 2009, DMC has voluntarily agreed to waive that portion, if any, of its management fee and reimburse the Funds to the extent necessary to ensure that total annual operating expenses, (excluding any 12b-1 plan expenses, taxes, interest, inverse floater program expenses, short sale and dividend interest expenses, brokerage fees, certain insurance costs, and nonroutine expenses or costs, including, but not limited to those relating to reorganizations, litigation, conducting shareholder meetings, and liquidations) do not exceed 0.70% of each Fund’s average daily net assets until such time as the voluntary waiver is discontinued. These expense waivers and reimbursements apply only to expenses paid directly by each Fund, and may be discontinued at any time because they are voluntary. Prior to December 1, 2009, DMC had contractually agreed to waive that portion, if any, of its management fee and reimburse the Funds to t he extent necessary to ensure that total annual operating expenses did not exceed 0.65% of average daily net assets of each Fund.
Delaware Service Company, Inc. (DSC), an affiliate of DMC, provides fund accounting and financial administration oversight services to the Funds. For these services, the Funds pay DSC fees based on the aggregate daily net assets of the Delaware Investments® Family of Funds at the following annual rate: 0.0050% of the first $30 billion; 0.0045% of the next $10 billion; 0.0040% of the next $10 billion; and 0.0025% of aggregate average daily net assets in excess of $50 billion. The fees payable to DSC under the service agreement described above are allocated among all Funds in the Delaware Investments Family of Funds on a relative net asset value basis. For the year ended July 31, 2010, the Funds were charged for these services as follows:
77
Notes to financial statements
Delaware Corporate Bond Fund and Delaware Extended Duration Bond Fund
2. Investment Management, Administration Agreements and Other Transactions with Affiliates (continued)
| | Delaware | | Delaware |
| | Corporate | | Extended Duration |
| | Bond Fund | | Bond Fund |
| | $40,550 | | $14,780 |
DSC also provides dividend disbursing and transfer agency services. Each Fund pays DSC a monthly fee based on the number of shareholder accounts for dividend disbursing and transfer agent services.
Pursuant to a distribution agreement and distribution plan, each Fund pays DDLP, the distributor and an affiliate of DMC, an annual distribution and service fee not to exceed 0.30% of the average daily net assets of the Class A shares, 1.00% of the average daily net assets of the Class B and C shares and 0.60% of the average daily net assets of Class R shares. Institutional Class shares pay no distribution and service expenses. DDLP has contracted to limit the Class A and Class R shares’ 12b-1 fee for each Fund through November 30, 2010 to no more than 0.25% and 0.50% of average daily net assets, respectively.
At July 31, 2010, each Fund had liabilities payable to affiliates as follows:
| | | Delaware | | Delaware |
| | | Corporate | | Extended Duration |
| | | Bond Fund | | Bond Fund |
| Investment management fee payable to DMC | | | $270,317 | | | | $79,861 | |
| Dividend disbursing, transfer agent and fund accounting | | | | | | | | |
| oversight fees and other expenses payable to DSC | | | 69,706 | | | | 21,297 | |
| Distribution fee payable to DDLP | | | 215,086 | | | | 82,975 | |
| Other expenses payable to DMC and affiliates* | | | 20,811 | | | | 10,530 | |
*DMC, as part of its administrative services, pays operating expenses on behalf of each Fund and is reimbursed on a periodic basis. Such expenses include items such as printing of shareholder reports, fees for audit, legal and tax services, registration fees and trustees’ fees.
As provided in the investment management agreement, each Fund bears the cost of certain legal and tax services, including internal legal and tax services provided to the Funds by DMC and/or its affiliates’ employees. For the year ended July 31, 2010, the Funds were charged for internal legal and tax services provided by DMC and/or its affiliates’ employees as follows:
| | Delaware | | Delaware |
| | Corporate | | Extended Duration |
| | Bond Fund | | Bond Fund |
| | $37,108 | | $13,750 |
78
For the year ended July 31, 2010, DDLP earned commissions on sales of Class A shares for each Fund as follows:
| | Delaware | | Delaware |
| | Corporate | | Extended Duration |
| | Bond Fund | | Bond Fund |
| | $106,971 | | $27,198 |
For the year ended July 31, 2010, DDLP received gross CDSC commissions on redemptions of each Fund’s Class A, Class B, and Class C shares, respectively, and these commissions were entirely used to offset up-front commissions previously paid by DDLP to broker/dealers on sales of those shares. The amounts received were as follows:
| | Delaware | | Delaware |
| | Corporate | | Extended Duration |
| | Bond Fund | | Bond Fund |
| Class A | $ | — | | | $ | — | |
| Class B | | 14,179 | | | | 3,415 | |
| Class C | | 22,155 | | | | 6,160 | |
Trustees’ fees include expenses accrued by the Funds for each Trustee’s retainer and meeting fees. Certain officers of DMC, DSC and DDLP are officers and/or Trustees of the Trust. These officers and Trustees are paid no compensation by the Funds.
3. Investments
For the year ended July 31, 2010, the Funds made purchases and sales of investments securities other than short-term investments as follows:
| | | Delaware | | Delaware |
| | | Corporate | | Extended Duration |
| | | Bond Fund | | Bond Fund |
| Purchases other than U.S. government securities | | $1,626,696,784 | | $434,532,197 |
| Purchases of U.S. government securities | | 311,578,904 | | 85,968,410 |
| Sales other than U.S. government securities | | 1,441,614,472 | | 345,294,778 |
| Sales of U.S. government securities | | 301,923,671 | | 85,420,026 |
79
Notes to financial statements
Delaware Corporate Bond Fund and Delaware Extended Duration Bond Fund
3. Investments (continued)
At July 31, 2010, the cost of investments and unrealized appreciation (depreciation) for federal income tax purposes for each Fund were as follows:
| | | Delaware | | Delaware |
| | | Corporate | | Extended Duration |
| | | Bond Fund | | Bond Fund |
| Cost of investments | | $ | 891,302,488 | | | $ | 338,117,481 | |
| Aggregate unrealized appreciation | | $ | 53,121,129 | | | $ | 26,560,584 | |
| Aggregate unrealized depreciation | | | (6,986,529 | ) | | | (1,740,130 | ) |
| Net unrealized appreciation | | $ | 46,134,600 | | | $ | 24,820,454 | |
U.S. GAAP defines fair value as the price that the Funds would receive to sell an asset or pay to transfer a liability in an orderly transaction between market participants at the measurement date under current market conditions. A three level hierarchy for fair value measurements has been established based upon the transparency of inputs to the valuation of an asset or liability. Inputs may be observable or unobservable and refer broadly to the assumptions that market participants would use in pricing the asset or liability. Observable inputs reflect the assumptions market participants would use in pricing the asset or liability based on market data obtained from sources independent of the reporting entity. Unobservable inputs reflect the reporting entity’s own assumptions about the assumptions that market participants would use in pricing the asset or liability developed based on the best information available under the circumstanc es. Each Fund investment in its entirety is assigned a level based upon the observability of the inputs which are significant to the overall valuation. The three level hierarchy of inputs is summarized below.
| Level 1 | – | inputs are quoted prices in active markets for identical investments |
| | | |
| Level 2 | – | other observable inputs (including, but not limited to: quoted prices for similar assets or liabilities in markets that are active, quoted prices for identical or similar assets or liabilities in markets that are not active, inputs other than quoted prices that are observable for the assets or liabilities (such as interest rates, yield curves, volatilities, prepayment speeds, loss severities, credit risks and default rates) or other market-corroborated inputs) |
| | | |
| Level 3 | – | inputs are significant unobservable inputs (including the Funds’ own assumptions used to determine the fair value of investments.) |
80
The following table summarizes the valuation of the Funds’ investments by fair value hierarchy levels as of July 31, 2010:
| | | Delaware Corporate Bond Fund |
| | | Level 1 | | Level 2 | | Level 3 | | Total |
| Agency, Asset-Backed & | | | | | | | | | | | | | | |
| Mortgage-Backed Securities | | $ | — | | $ | 13,991,855 | | | $ | — | | $ | 13,991,855 | |
| Common Stock | | | 3,530 | | | — | | | | — | | | 3,530 | |
| Corporate Debt | | | — | | | 862,501,044 | | | | 1,163,928 | | | 863,664,972 | |
| Foreign Debt | | | — | | | 15,836,094 | | | | — | | | 15,836,094 | |
| Municipal Bonds | | | — | | | 4,663,890 | | | | — | | | 4,663,890 | |
| U.S. Treasury Obligations | | | — | | | 18,059,984 | | | | — | | | 18,059,984 | |
| Short-Term | | | — | | | 6,281,022 | | | | — | | | 6,281,022 | |
| Securities Lending Collateral | | | — | | | 11,666,480 | | | | 10,325 | | | 11,676,805 | |
| Preferred Stock | | | — | | | 3,258,936 | | | | — | | | 3,258,936 | |
| Total | | $ | 3,530 | | $ | 936,259,305 | | | $ | 1,174,253 | | $ | 937,437,088 | |
| | | | | | | | | | | | | | | |
| Foreign Currency | | | | | | | | | | | | | | |
| Exchange Contracts | | $ | — | | $ | 70,685 | | | $ | — | | $ | 70,685 | |
| Futures Contracts | | $ | 1,410,569 | | $ | — | | | $ | — | | $ | 1,410,569 | |
| Swap Contracts | | $ | — | | $ | (583,854 | ) | | $ | — | | $ | (583,854 | ) |
| | | |
| | | Delaware Extended Duration Bond Fund |
| | | Level 1 | | Level 2 | | Level 3 | | Total |
| Agency, Asset-Backed & | | | | | | | | | | | | | | |
| Mortgage-Backed Securities | | $ | — | | $ | 6,406,107 | | | $ | — | | $ | 6,406,107 | |
| Corporate Debt | | | — | | | 317,865,579 | | | | 414,767 | | | 318,280,346 | |
| Foreign Debt | | | — | | | 5,519,579 | | | | — | | | 5,519,579 | |
| Municipal Bonds | | | — | | | 15,861,649 | | | | — | | | 15,861,649 | |
| U.S. Treasury Obligations | | | — | | | 2,436,164 | | | | — | | | 2,436,164 | |
| Short-Term | | | — | | | 7,842,028 | | | | — | | | 7,842,028 | |
| Securities Lending Collateral | | | — | | | 4,896,494 | | | | 4,314 | | | 4,900,808 | |
| Preferred Stock | | | — | | | 1,691,254 | | | | — | | | 1,691,254 | |
| Total | | $ | — | | $ | 362,518,854 | | | $ | 419,081 | | $ | 362,937,935 | |
| | | | | | | | | | | | | | | |
| Foreign Currency | | | | | | | | | | | | | | |
| Exchange Contracts | | $ | — | | $ | 27,589 | | | $ | — | | $ | 27,589 | |
| Futures Contracts | | $ | 2,118,297 | | $ | — | | | $ | — | | $ | 2,118,297 | |
| Swap Contracts | | $ | — | | $ | (243,481 | ) | | $ | — | | $ | (243,481 | ) |
81
Notes to financial statements
Delaware Corporate Bond Fund and Delaware Extended Duration Bond Fund
3. Investments (continued)
The following is a reconciliation of investments in which significant unobservable inputs (Level 3) were used in determining fair value:
| | | Delaware Corporate Bond Fund |
| | | Agency, Asset- | | | | | | | | | | | | | | | |
| | | Backed and | | | | | | | | | | | | | | | |
| | | Mortgage- | | | | | | | | | | Securities | | | | |
| | | Backed | | Corporate | | Foreign | | Lending | | | | |
| | | Securities | | Debt | | Debt | | Collateral | | Total Fund |
| Balance as of 7/31/09 | | $ | 384,247 | | | $ | 1,449,007 | | | $ | 1,328,013 | | | $ | 24 | | $ | 3,161,291 | |
| Purchases | | | — | | | | 1,131,910 | | | | — | | | | — | | | 1,131,910 | |
| Sales | | | (199,760 | ) | | | (1,856,204 | ) | | | (1,394,351 | ) | | | — | | | (3,450,315 | ) |
| Net realized gain (loss) | | | (19,320 | ) | | | (1,581,850 | ) | | | 62,555 | | | | — | | | (1,538,615 | ) |
| Transfers out of Level 3 | | | (342,930 | ) | | | — | | | | — | | | | — | | | (342,930 | ) |
| Net change in unrealized | | | | | | | | | | | | | | | | | | | |
| appreciation/ | | | | | | | | | | | | | | | | | | | |
| depreciation | | | 177,763 | | | | 2,021,065 | | | | 3,783 | | | | 10,301 | | | 2,212,912 | |
| Balance as of 7/31/10 | | $ | — | | | $ | 1,163,928 | | | $ | — | | | $ | 10,325 | | $ | 1,174,253 | |
| | | | | | | | | | | | | | | | | | | | |
| Net change in unrealized | | | | | | | | | | | | | | | | | | | |
| appreciation/depreciation | | | | | | | | | | | | | | | | | | | |
| from investments still held | | | | | | | | | | | | | | | | | | | |
| as of 7/31/10 | | $ | — | | | $ | 32,018 | | | $ | — | | | $ | 10,301 | | $ | 42,319 | |
| | | | | | | | | | | | | | | | | | | | |
| | | Delaware Extended Duration Bond Fund |
| | | Agency, Asset- | | | | | | | | | | | | | | | |
| | | Backed and | | | | | | | | | | | | | | | |
| | | Mortgage- | | | | | | | | | | Securities | | | | |
| | | Backed | | Corporate | | Foreign | | Lending | | | | |
| | | Securities | | Debt | | Debt | | Collateral | | Total Fund |
| Balance as of 7/31/09 | | $ | 79,206 | | | $ | 641,159 | | | $ | 610,496 | | | $ | 10 | | $ | 1,330,871 | |
| Purchases | | | — | | | | 403,357 | | | | — | | | | — | | | 403,357 | |
| Sales | | | (114,834 | ) | | | (843,605 | ) | | | (639,813 | ) | | | — | | | (1,598,252 | ) |
| Net realized gain (loss) | | | (5,506 | ) | | | (833,911 | ) | | | 27,289 | | | | — | | | (812,128 | ) |
| Net change in unrealized | | | | | | | | | | | | | | | | | | | |
| appreciation/ | | | | | | | | | | | | | | | | | | | |
| depreciation | | | 41,134 | | | | 1,047,767 | | | | 2,028 | | | | 4,304 | | | 1,095,233 | |
| Balance as of 7/31/10 | | $ | — | | | $ | 414,767 | | | $ | — | | | $ | 4,314 | | $ | 419,081 | |
| | | | | | | | | | | | | | | | | | | | |
| Net change in unrealized | | | | | | | | | | | | | | | | | | | |
| appreciation/depreciation | | | | | | | | | | | | | | | | | | | |
| from investments still held | | | | | | | | | | | | | | | | | | | |
| as of 7/31/10 | | $ | — | | | $ | 11,410 | | | $ | — | | | $ | 4,304 | | $ | 15,714 | |
82
In January 2010, the Financial Accounting Standards Board issued an Accounting Standards Update, Improving Disclosures about Fair Value Measurements, which introduced new disclosure requirements and clarified certain existing disclosure requirements around fair value measurements currently presented above. The new disclosures and clarifications of existing disclosures are generally effective for the Funds’ fiscal year ending July 31, 2010 and interim periods therein. During the fiscal year ended July 31, 2010, the Funds made transfers out of Level 1 investments into Level 2 investments in the amounts of $11,372,838 and $4,727,669 for Delaware Corporate Bond Fund and Delaware Extended Duration Bond Fund, respectively, based on management’s decision to classify the BNY Mellon Securities Lending Overnight Fund as Level 2 investments. Management has classified the BNY Mellon Securities Lending Overnight Fund as Level 2 investments because the price is not quoted in an active market or listed on a public exchange. The BNY Mellon Securities Lending Overnight Fund is priced daily for investors in the Funds. Utilizing international fair value pricing could cause transfers from Level 1 investments to Level 2 investments in the hierarchy. During the period ended July 31, 2010, transfers out of Level 3 investments into Level 2 investments were made in the amount of $342,930 for the Delaware Corporate Bond Fund. This was due to the Fund’s pricing vendor being able to supply a matrix price for an investment that had been utilizing a broker quoted price.
4. Dividend and Distribution Information
Income and long-term capital gain distributions are determined in accordance with federal income tax regulations, which may differ from U.S. GAAP. Additionally, distributions from net gains on foreign currency transactions and net short-term gains on sales of investment securities are treated as ordinary income for federal income tax purposes. The tax character of dividends and distributions paid during the years ended July 31, 2010 and 2009 was as follows:
| | | Delaware | | Delaware |
| | | Corporate | | Extended Duration |
| | | Bond Fund | | Bond Fund |
| | | Year Ended | | Year Ended |
| | | 7/31/10 | | 7/31/09 | | 7/31/10 | | 7/31/09 |
| Ordinary income | | $ | 45,804,700 | | $ | 33,904,552 | | $ | 17,430,173 | | $ | 14,290,954 |
83
Notes to financial statements
Delaware Corporate Bond Fund and Delaware Extended Duration Bond Fund
5. Components of Net Assets on a Tax Basis
As of July 31, 2010, the components of net assets on a tax basis were as follows:
| | | Delaware | | Delaware |
| | | Corporate | | Extended Duration |
| | | Bond Fund | | Bond Fund |
| Shares of beneficial interest | | $ | 859,453,406 | | | $ | 331,270,369 | |
| Undistributed ordinary income | | | 24,842,597 | | | | 4,173,189 | |
| Distributions payable | | | (1,182,160 | ) | | | (459,615 | ) |
| Undistributed long term capital gains | | | — | | | | 5,848,703 | |
| Other temporary differences | | | (442,913 | ) | | | (323,774 | ) |
| Unrealized appreciation of investments | | | | | | | | |
| and foreign currencies | | | 46,145,044 | | | | 24,823,289 | |
| Net assets | | $ | 928,815,974 | | | $ | 365,332,161 | |
The differences between book basis and tax basis components of net assets are primarily attributable to tax deferral of losses on wash sales, tax treatment of distribution payables, mark-to-market of futures contracts, mark-to-market of foreign currency contracts, tax deferral of losses on straddles, tax treatment of CDS contracts, and tax treatment of market discount and premium on debt instruments.
For financial reporting purposes, capital accounts are adjusted to reflect the tax character of permanent book/tax differences. Reclassifications are primarily due to tax treatment of gain (loss) on foreign currency transactions, market discount and premium on certain debt instruments, paydowns of mortgage- and asset-backed securities and tax treatment of CDS contracts. Results of operations and net assets were not affected by these reclassifications. For the year ended July 31, 2010, the Funds recorded the following reclassifications:
| | | Delaware | | Delaware |
| | | Corporate | | Extended Duration |
| | | Bond Fund | | Bond Fund |
| Undistributed net investment income | | $ | 3,849,881 | | | $ | 635,322 | |
| Accumulated net realized gain | | | (3,849,881 | ) | | | (635,322 | ) |
For federal income tax purposes, capital loss carryforwards may be carried forward and applied against future capital gains. In 2010, the Funds utilized capital loss carryforwards as follows:
| | Delaware | | Delaware |
| | Corporate | | Extended Duration |
| | Bond Fund | | Bond Fund |
| | $25,732,798 | | $16,724,025 |
84
6. Capital Shares
Transactions in capital shares were as follows:
| | | Delaware | | Delaware |
| | | Corporate | | Extended Duration |
| | | Bond Fund | | Bond Fund |
| | | Year Ended | | Year Ended |
| | | 7/31/10 | | 7/31/09 | | 7/31/10 | | 7/31/09 |
| Shares sold: | | | | | | | | | | | | |
| Class A | | 60,801,418 | | | 58,874,837 | | | 22,984,097 | | | 15,603,755 | |
| Class B | | 49,767 | | | 85,713 | | | 10,437 | | | 13,812 | |
| Class C | | 8,191,772 | | | 14,181,834 | | | 1,432,071 | | | 1,026,837 | |
| Class R | | 941,376 | | | 1,039,675 | | | 2,319,099 | | | 70,073 | |
| Institutional Class | | 58,201,643 | | | 11,688,791 | | | 4,659,277 | | | 3,868,160 | |
| | | | | | | | | | | | | |
| Shares issued upon reinvestment of dividends and distributions: | | | | | | | |
| Class A | | 2,649,551 | | | 2,624,580 | | | 1,978,252 | | | 1,894,153 | |
| Class B | | 55,807 | | | 82,466 | | | 19,523 | | | 33,107 | |
| Class C | | 455,847 | | | 616,027 | | | 91,993 | | | 139,733 | |
| Class R | | 65,325 | | | 119,317 | | | 52,485 | | | 5,315 | |
| Institutional Class | | 276,079 | | | 569,296 | | | 249,693 | | | 183,027 | |
| | | 131,688,585 | | | 89,882,536 | | | 33,796,927 | | | 22,837,972 | |
| | | | | | | | | | | | | |
| Shares repurchased: | | | | | | | | | | | | |
| Class A | | (80,288,313 | ) | | (28,618,933 | ) | | (15,151,966 | ) | | (15,890,698 | ) |
| Class B | | (679,104 | ) | | (948,343 | ) | | (205,164 | ) | | (239,689 | ) |
| Class C | | (7,730,878 | ) | | (4,364,844 | ) | | (1,347,983 | ) | | (1,201,459 | ) |
| Class R | | (1,383,742 | ) | | (1,389,824 | ) | | (297,005 | ) | | (29,128 | ) |
| Institutional Class | | (8,878,024 | ) | | (42,255,671 | ) | | (1,927,229 | ) | | (6,375,142 | ) |
| | | (98,960,061 | ) | | (77,577,615 | ) | | (18,929,347 | ) | | (23,736,116 | ) |
| Net increase (decrease) | | 32,728,524 | | | 12,304,921 | | | 14,867,580 | | | (898,144 | ) |
For the years ended July 31, 2010 and 2009, Class B shares were converted to Class A shares as follows:
| | | Year Ended | | Year Ended |
| | | | | 7/31/10 | | | | | | | 7/31/09 | | | |
| | | Class B | | Class A | | | | | Class B | | Class A | | | |
| | | Shares | | Shares | | Value | | Shares | | Shares | | Value |
| Delaware Corporate Bond | | 139,620 | | 139,406 | | $ | 812,537 | | 121,615 | | 121,514 | | $ | 593,982 |
| Delaware Extended Duration | | 47,473 | | 47,393 | | | 284,985 | | 32,497 | | 32,440 | | | 163,050 |
The respective amounts are included in Class B redemptions and Class A subscriptions in the table above and the statements of changes in net assets.
85
Notes to financial statements
Delaware Corporate Bond Fund and Delaware Extended Duration Bond Fund
7. Line of Credit
The Funds, along with certain other funds in the Delaware Investments® Family of Funds (Participants), participate in a $35,000,000 revolving line of credit with The Bank of New York Mellon (BNY Mellon) to be used for temporary or emergency purposes as an additional source of liquidity to fund redemptions of investor shares. Under the agreement, the Participants are charged an annual commitment fee, which is allocated across the Participants on the basis of each Participant’s allocation of the entire facility. The Participants may borrow up to a maximum of one third of their net assets under the agreement. The agreement expires on November 16, 2010. The Funds had no amounts outstanding as of July 31, 2010 or at any time during the year then ended.
8. Derivatives
U.S. GAAP requires enhanced disclosures that enable investors to understand: 1) how and why an entity uses derivatives, 2) how they are accounted for, and 3) how they affect an entity’s results of operations and financial position.
Foreign Currency Exchange Contracts — The Funds may enter into foreign currency exchange contracts as a way of managing foreign exchange rate risk. Each Fund may enter into these contracts to fix the U.S. dollar value of a security that it has agreed to buy or sell for the period between the date the trade was entered into and the date the security is delivered and paid for. The Funds may also use these contracts to hedge the U.S. dollar value of securities they already own that are denominated in foreign currencies. The change in value is recorded as an unrealized gain or loss. When the contract is closed, a realized gain or loss is recorded equal to the difference between the value of the contract at the time it was opened and the value at the time it was closed.
The use of foreign currency exchange contracts does not eliminate fluctuations in the underlying prices of the securities, but does establish a rate of exchange that can be achieved in the future. Although foreign currency exchange contracts limit the risk of loss due to a decline in the value of the hedged currency, they also limit any potential gain that might result should the value of the currency increase. In addition, the Funds could be exposed to risks if the counterparties to the contracts are unable to meet the terms of their contracts. Each Fund’s maximum risk of loss from counterparty credit risk is the value of its currency exchanged with the counterparty. The risk is generally mitigated by having a netting arrangement between the Funds and the counterparty and by the posting of collateral by the counterparty to the Funds to cover the Funds’ exposure to the counterparty.
Futures Contracts — A futures contract is an agreement in which the writer (or seller) of the contract agrees to deliver to the buyer an amount of cash or securities equal to a specific dollar amount times the difference between the value of a specific security or index at the close of the last trading day of the contract and the price at which the agreement is made. The Funds may use futures in the normal course of pursuing their investment objective. Each Fund may invest in futures contracts to hedge its existing portfolio securities against fluctuations in fair value caused by changes in prevailing market interest rates. Upon entering into a futures contract, the Funds deposit cash or pledges U.S. government securities to a broker, equal to the minimum
86
“initial margin” requirements of the exchange on which the contract is traded. Subsequent payments are received from the broker or paid to the broker each day, based on the daily fluctuation in the market value of the contract. These receipts or payments are known as “variation margin” and are recorded daily by the Funds as unrealized gains or losses until the contracts are closed. When the contracts are closed, the Funds record a realized gain or loss equal to the difference between the value of the contract at the time it was opened and the value at the time it was closed. Risks of entering into financial futures contracts include potential imperfect correlation between the financial futures contracts and the underlying securities and the possibility of an illiquid secondary market for these instruments. When investing in futures, there is minimal counterparty credit risk to a Fund because futures are exchange-tra ded and the exchange’s clearinghouse, as counterparty to all exchange-traded futures, guarantees against default.
Swap Contracts — Each Fund may enter into interest rate swap contracts, index swap contracts and CDS contracts in the normal course of pursuing its investment objective. The Funds may use interest rate swaps to adjust the Funds’ sensitivity to interest rates or to hedge against changes in interest rates. Index swaps may be used to gain exposure to markets that the Funds invest in, such as the corporate bond market. The Funds may also use index swaps as a substitute for futures or options contracts if such contracts are not directly available to the Funds on favorable terms. The Funds may enter into CDS contracts in order to hedge against a credit event, to enhance total return or to gain exposure to certain securities or markets.
Interest Rate Swaps. An interest rate swap contract is an exchange of interest rates between counterparties. In one instance, an interest rate swap involves payments received by the Funds from another party based on a variable or floating interest rate, in return for making payments based on a fixed interest rate. An interest rate swap can also work in reverse with the Funds receiving payments based on a fixed interest rate and making payments based on a variable or floating interest rate. Interest rate swaps may be used to adjust the Funds’ sensitivity to interest rates or to hedge against changes in interest rates. Periodic payments on such contracts are accrued daily and recorded as unrealized appreciation/depreciation on swap contracts. Upon periodic payment/receipt or termination of the contract, such amounts are recorded as realized gains or losses on swap contracts. The Funds’ maximum risk of loss from counterparty credi t risk is the discounted net value of the cash flows to be received from/paid to the counterparty over the interest rate swap contract’s remaining life, to the extent that the amount is positive. This risk is mitigated by having a netting arrangement between the Funds and the counterparty and by the posting of collateral by the counterparty to the Funds to cover the Funds’ exposure to the counterparty.
Index Swaps. Index swaps involve commitments to pay interest in exchange for a market linked return based on a notional amount. To the extent the total return of the security, instrument or basket of instruments underlying the transaction exceeds the offsetting interest obligation, each Fund will receive a payment from the counterparty. To the extent the total return of the security, instrument or basket of instruments underlying the transaction falls short of the offsetting interest obligation, each Fund will make a payment to the counterparty. The change in value of
87
Notes to financial statements
Delaware Corporate Bond Fund and Delaware Extended Duration Bond Fund
8. Derivatives (continued)
swap contracts outstanding, if any, is recorded as unrealized appreciation or depreciation daily. A realized gain or loss is recorded on maturity or termination of the swap contract. The Funds’ maximum risk of loss from counterparty credit risk is the discounted net value of the cash flows to be received from/paid to the counterparty over the index swap contract’s remaining life, to the extent that the amount is positive. This risk is mitigated by having a netting arrangement between the Funds and the counterparty and by the posting of collateral by the counterparty to the Funds to cover the Funds’ exposure to the counterparty.
Credit Default Swaps. A CDS contract is a risk-transfer instrument through which one party (purchaser of protection) transfers to another party (seller of protection) the financial risk of a credit event (as defined in the CDS agreement), as it relates to a particular reference security or basket of securities (such as an index). In exchange for the protection offered by the seller of protection, the purchaser of protection agrees to pay the seller of protection a periodic amount at a stated rate that is applied to the notional amount of the CDS contract. In addition, an upfront payment may be made or received by the Funds in connection with an unwinding or assignment of a CDS contract. Upon the occurrence of a credit event, the seller of protection would pay the par (or other agreed-upon) value of the reference security (or basket of securities) to the counterparty. Credit events generally include, among others, bankruptcy, failure to pay , and obligation default.
During the year ended July 31, 2010, the Funds entered into CDS contracts as a purchaser and seller of protection. Periodic payments (receipts) on such contracts are accrued daily and recorded as unrealized losses (gains) on swap contracts. Upon payment (receipt), such amounts are recorded as realized losses (gains) on swap contracts. Upfront payments made or received in connection with CDS contracts are amortized over the expected life of the CDS contracts as unrealized losses (gains) on swap contracts. The change in value of CDS contracts is recorded as unrealized appreciation or depreciation daily. A realized gain or loss is recorded upon a credit event (as defined in the CDS agreement) or the maturity or termination of the agreement.
At July 31, 2010, the aggregate unrealized depreciation of credit default swaps for each Fund was as follows:
| | Delaware | | Delaware |
| | Corporate | | Extended Duration |
| | Bond Fund | | Bond Fund |
| | $ | (583,854 | ) | | $ | (243,481 | ) |
Delaware Corporate Bond Fund had posted $580,000 cash collateral for certain open derivatives. If a credit event had occurred for all swap transactions where collateral posting was required as of July 31, 2010, the swaps’ credit-risk-related contingent features would have been triggered and the Funds would have received $24,058,000 and $10,095,000, respectively, less the value of the contracts’ related reference obligations. Delaware Corporate Bond and Delaware Extended Duration Bond Fund received collateral of $1,054,000 and $384,000, respectively, for certain open derivatives.
88
As disclosed in the footnotes to the statements of net assets, at July 31, 2010, the notional value of the protection sold for each Fund was as follows:
| | | Delaware | | Delaware |
| | | Corporate | | Extended Duration |
| | | Bond Fund | | Bond Fund |
| | | $7,130,000 | | $3,015,000 |
This reflects the maximum potential amount the Funds could be required to make as a seller of credit protection if a credit event had occurred. The quoted market prices and resulting market values for credit default swap agreements on securities and credit indices serve as an indicator of the current status of the payment/performance risk and represent the likelihood of an expected liability (or profit) for the credit derivative if the swap agreement had been closed/sold as of the period end. Increasing market values, in absolute terms when compared to the notional amount of the swap, represent a deterioration of the reference entity’s credit soundness and a greater likelihood or risk of default or other credit event occurring as defined under the terms of the agreement. At July 31, 2010, the net unrealized appreciation of the protection sold for each Fund was as follows:
| | Delaware | | Delaware |
| | Corporate | | Extended Duration |
| | Bond Fund | | Bond Fund |
| | $36,533 | | $31,678 |
Credit default swaps may involve greater risks than if the Funds had invested in the reference obligation directly. Credit default swaps are subject to general market risk, liquidity risk, counterparty risk and credit risk. The Funds’ maximum risk of loss from counterparty credit risk, either as the seller of protection or the buyer of protection, is the fair value of the contract. This risk is mitigated by having a netting arrangement between the Funds and the counterparty and by the posting of collateral by the counterparty to the Funds to cover the Funds’ exposure to the counterparty.
Swaps Generally. Because there is no organized market for swap contracts, the value of open swaps may differ from that which would be realized in the event each Fund terminated its position in the agreement. Risks of entering into these contracts include the potential inability of the counterparty to meet the terms of the contracts. This type of risk is generally limited to the amount of favorable movement in the value of the underlying security, instrument or basket of instruments, if any, at the day of default. Risks also arise from potential losses from adverse market movements and such losses could exceed the unrealized amounts shown on the statements of net assets.
89
Notes to financial statements
Delaware Corporate Bond Fund and Delaware Extended Duration Bond Fund
8. Derivatives (continued)
Fair values of derivative instruments as of July 31, 2010 was as follows:
| | Delaware Corporate Bond Fund |
| | Asset Derivatives | | Liability Derivatives |
| | Statement of Net | | | | | Statement of Net | | | | |
| | Assets Location | | Fair Value | | Assets Location | | Fair Value | |
| Foreign exchange contracts | | | | | | | | | | |
| (Forward currency contracts) | Receivables and | | | | | Liabilities net of | | | | |
| | other assets net | | | | | receivables and | | | | |
| | of liabilities | | $ | 95,167 | | other assets | | $ | (24,482 | ) |
| Interest rate contracts | | | | | | | | | | |
| (Futures contracts) | Receivables and | | | | | Liabilities net of | | | | |
| | other assets net | | | | | receivables and | | | | |
| | of liabilities | | | 2,502,985 | | other assets | | | (1,092,416 | ) |
| Credit contracts | | | | | | | | | | |
| (Swaps contracts) | Receivables and | | | | | Liabilities net of | | | | |
| | other assets net | | | | | receivables and | | | | |
| | of liabilities | | | 73,501 | | other assets | | | (657,355 | ) |
| Total | | | $ | 2,671,653 | | | | $ | (1,774,253 | ) |
| |
| | Delaware Extended Duration Bond Fund |
| | Asset Derivatives | | Liability Derivatives |
| | Statement of Net | | | | | Statement of Net | | | | |
| | Assets Location | | Fair Value | | Assets Location | | Fair Value |
| Foreign exchange contracts | | | | | | | | | | |
| (Forward currency contracts) | Receivables and | | | | | Liabilities net of | | | | |
| | other assets net | | | | | receivables and | | | | |
| | of liabilities | | $ | 34,381 | | other assets | | $ | (6,792 | ) |
| Interest rate contracts | | | | | | | | | | |
| (Futures contracts) | Receivables and | | | | | Liabilities net of | | | | |
| | other assets net | | | | | receivables and | | | | |
| | of liabilities | | | 2,336,803 | | other assets | | | (218,506 | ) |
| Credit contracts | | | | | | | | | | |
| (Swaps contracts) | Receivables and | | | | | Liabilities net of | | | | |
| | other assets net | | | | | receivables and | | | | |
| | of liabilities | | | 25,219 | | other assets | | | (268,700 | ) |
| Total | | | $ | 2,396,403 | | | | $ | (493,998 | ) |
90
The effect of derivative instruments on the statement of operations for the year ended July 31, 2010 was as follows:
| | | Delaware Corporate Bond Fund |
| | | | | Realized Gain | | Change in Unrealized |
| | | | | or Loss on | | Appreciation |
| | | | | Derivatives | | or Depreciation |
| | | Location of Gain or Loss on | | Recognized in | | on Derivatives |
| | | Derivatives Recognized in Income | | Income | | Recognized in Income |
| Foreign exchange contracts | | | | | | | | | | |
| (Forward currency contracts) | | Net realized loss on forward | | | | | | | | |
| | | currency contracts and | | | | | | | | |
| | | net change in unrealized | | | | | | | | |
| | | appreciation/depreciation | | | | | | | | |
| | | of investments and foreign | | | | | | | | |
| | | currency contracts | | $ | (147,683 | ) | | $ | 3,743 | |
| Interest rate contracts | | | | | | | | | | |
| (Futures contracts) | | Net realized gain on futures | | | | | | | | |
| | | contracts and net change | | | | | | | | |
| | | in unrealized appreciation/ | | | | | | | | |
| | | depreciation of investments | | | | | | | | |
| | | and futures contracts | | | 1,849,024 | | | | 1,410,569 | |
| Credit contracts | | | | | | | | | | |
| (Swaps contracts) | | Net realized loss in on swap | | | | | | | | |
| | | contracts and net change | | | | | | | | |
| | | in unrealized appreciation/ | | | | | | | | |
| | | depreciation of investments | | | | | | | | |
| | | and swap contracts | | | | (92,489 | ) | | | | (91,708 | ) |
| Total | | | | | $ | 1,608,852 | | | | $ | 1,322,604 | |
91
Notes to financial statements
Delaware Corporate Bond Fund and Delaware Extended Duration Bond Fund
8. Derivatives (continued)
| | Delaware Extended Duration Bond Fund |
| | | | Realized Gain | | Change in Unrealized |
| | | | or Loss on | | Appreciation |
| | | | Derivatives | | or Depreciation |
| | Location of Gain or Loss on | | Recognized in | | on Derivatives |
| | Derivatives Recognized in Income | | Income | | Recognized in Income |
| Foreign exchange contracts | | | | | | | | | |
| (Forward currency contracts) | Net realized loss on forward | | | | | | | | |
| | currency contracts and | | | | | | | | |
| | net change in unrealized | | | | | | | | |
| | appreciation/depreciation | | | | | | | | |
| | of investments and foreign | | | | | | | | |
| | currency contracts | | $ | (106,415 | ) | | $ | 3,245 | |
| Interest rate contracts | | | | | | | | | |
| (Futures contracts) | Net realized gain on futures | | | | | | | | |
| | contracts and net change | | | | | | | | |
| | in unrealized appreciation/ | | | | | | | | |
| | depreciation of investments | | | | | | | | |
| | and futures contracts | | | 7,313,387 | | | | 1,306,452 | |
| Credit contracts | | | | | | | | | |
| (Swaps contracts) | Net realized loss in on swap | | | | | | | | |
| | contracts and net change | | | | | | | | |
| | in unrealized appreciation/ | | | | | | | | |
| | depreciation of investments | | | | | | | | |
| | and swap contracts | | | | (26,826 | ) | | | | (70,585 | ) |
| Total | | | | $ | 7,180,146 | | | | $ | 1,239,112 | |
9. Securities Lending
The Funds, along with other funds in the Delaware Investments® Family of Funds, may lend their securities pursuant to a security lending agreement (Lending Agreement) with BNY Mellon. With respect to each loan, if on any business day the aggregate market value of securities collateral plus cash collateral held is less than the aggregate market value of the securities which are the subject of such loan, the borrower will be notified to provide additional collateral by the end of the following business day which, together with the collateral already held, will be not less than the applicable collateral requirements for such security loan. If the aggregate market value of securities collateral and cash collateral held with respect to a security loan exceeds the applicable collateral requirement, upon request of the borrower BNY Mellon must return enough collateral to the borrower by the end of the following business day to reduce the value of the remaining collateral to the applicable collateral requirement for such security loan. As a result of the foregoing, the value of the collateral held with respect to a loaned security may be temporarily more or less than the value of security on loan.
Cash collateral received is generally invested in the BNY Mellon Securities Lending Overnight Fund (the “Collective Trust”) established by BNY Mellon for the purpose of investment on behalf of clients participating in its securities lending programs. The Collective Trust may invest in U.S. government
92
securities and high quality corporate debt, asset-backed and other money market securities and in repurchase agreements collateralized by such securities, provided that the Collective Trust will only hold such assets with a maturity of one business day or less (“Overnight Assets”). The Collective Trust seeks to maintain a net asset value per unit of $1.00, but there can be no assurance that it will always be able to do so. The Funds may incur investment losses as a result of investing securities lending collateral in the Collective Trust or another collateral investment pool. This could occur if an investment in a collateral investment pool defaulted or if it were necessary to liquidate assets in the collateral investment pool to meet returns on outstanding security loans at a time when the collateral investment pool’s net asset value per unit was less than $1.00. Under those circumstances, the Funds may not receive an am ount from the collateral investment pool that is equal in amount to the collateral the Funds would be required to return to the borrower of the securities and the Funds would be required to make up for this shortfall. Effective April 20, 2009, BNY Mellon transferred the assets of the Funds’ previous collateral investment pool other than cash and Overnight Assets to the BNY Mellon SL DBT II Liquidating Fund (the “Liquidating Fund”), effectively bifurcating the previous collateral investment pool. The Funds’ exposure to the Liquidating Fund is expected to decrease as the Liquidating Fund’s assets mature or are sold. In October 2008, BNY Mellon transferred certain distressed securities from the previous collateral investment pool into the Mellon GSL Reinvestment Trust II. The Funds can also accept U.S. government securities and letters of credit (non-cash collateral) in connection with securities loans. In the event of default or bankruptcy by the lending agent, realization and/or retention of the collateral may be subject to legal proceedings. In the event the borrower fails to return loaned securities and the collateral received is insufficient to cover the value of the loaned securities and provided such collateral shortfall is not the result of investment losses, the lending agent has agreed to pay the amount of the shortfall to the Funds, or at the discretion of the lending agent, replace the loaned securities. The Funds continue to record dividends or interest, as applicable, on the securities loaned and are subject to change in value of the securities loaned that may occur during the term of the loan. The Funds have the right under the Lending Agreement to recover the securities from the borrower on demand. With respect to security loans collateralized by cash collateral, the earnings from the collateral investments are shared among the Funds, the security lending agent and the borrower. The Funds record security lending income net of allocations to the security lending agent a nd the borrower.
At July 31, 2010, the value of securities on loan for each Fund is presented below, for which the Funds received collateral, comprised of non-cash collateral and cash collateral. At July 31, 2010, the value of invested collateral for each Fund is also presented below. Investments purchased with cash collateral are presented on the statements of net assets under the caption “Securities Lending Collateral.”
| | Delaware | | Delaware |
| | Corporate | | Extended Duration |
| | Bond Fund | | Bond Fund |
| Value of securities on loan | $ | 11,540,153 | | | $ | 4,857,782 | |
| Value of invested collateral | | 11,676,805 | | | | 4,900,808 | |
| Cash collateral | | 11,914,916 | | | | 5,001,174 | |
| Non-cash collateral | | 60,632 | | | | 3,077 | |
93
Notes to financial statements
Delaware Corporate Bond Fund and Delaware Extended Duration Bond Fund
10. Credit and Market Risk
Some countries in which the Funds may invest require governmental approval for the repatriation of investment income, capital or the proceeds of sales of securities by foreign investors. In addition, if there is deterioration in a country’s balance of payments or for other reasons, a country may impose temporary restrictions on foreign capital remittances abroad.
The securities exchanges of certain foreign markets are substantially smaller, less liquid and more volatile than the major securities markets in the United States. Consequently, acquisition and disposition of securities by the Funds may be inhibited. In addition, a significant portion of the aggregate market value of equity securities listed on the major securities exchanges in emerging markets is held by a smaller number of investors. This may limit the number of shares available for acquisition or disposition by a Fund.
Each Fund may invest a portion of its assets in high yield fixed income securities, which carry ratings of BB or lower by Standard & Poor Rating Group (S&P) and/or Ba or lower by Moody’s Investor Services, Inc. (Moody’s). Investments in these higher yielding securities are generally accompanied by a greater degree of credit risk than higher rated securities. Additionally, lower rated securities may be more susceptible to adverse economic and competitive industry conditions than investment grade securities.
Each Fund invests in fixed income securities whose value is derived from an underlying pool of mortgages or consumer loans. The value of these securities is sensitive to changes in economic conditions, including delinquencies and/or defaults, and may be adversely affected by shifts in the market’s perception of issuers and changes in interest rates. Investors receive principal and interest payments as the underlying mortgages and consumer loans are paid back. Some of these securities are collateralized mortgage obligations (CMOs). CMOs are debt securities issued by U.S. government agencies or by financial institutions and other mortgage lenders, which are collateralized by a pool of mortgages held under an indenture. Prepayment of mortgages may shorten the stated maturity of the obligation and can result in a loss of premium, if any has been paid. Certain of these securities may be stripped (securities, which provide only the princip al or interest feature of the underlying security). The yield to maturity on an interest-only CMO is extremely sensitive not only to changes in prevailing interest rates, but also to the rate of principal payments (including prepayments) on the related underlying mortgage assets. A rapid rate of principal payments may have a material adverse effect on each Fund’s yield to maturity. If the underlying mortgage assets experience greater than anticipated prepayments of principal, each Fund may fail to fully recoup its initial investment in these securities even if the securities are rated in the highest rating categories.
Each Fund may invest up to 15% of its net assets in illiquid securities, which may include securities with contractual restrictions on resale, securities exempt from registration under Rule 144A of the Securities Act of 1933, as amended, and other securities which may not be readily marketable. The relative illiquidity of these securities may impair each Fund from disposing of them in a timely manner and at a fair price when it is necessary or desirable to do so. While maintaining oversight,
94
the Funds’ Board has delegated to DMC, the day-to-day functions of determining whether individual securities are liquid for purposes of the Funds’ limitation on investments in illiquid assets. Securities eligible for resale pursuant to Rule 144A, which are determined to be liquid, are not subject to the Funds’ 15% limit on investments in illiquid securities. Rule 144A and illiquid securities have been identified on the statements of net assets.
11. Contractual Obligations
The Funds enter into contracts in the normal course of business that contain a variety of indemnifications. The Funds’ maximum exposure under these arrangements is unknown. However, the Funds have not had prior claims or losses pursuant to these contracts. Management has reviewed the Funds’ existing contracts and expects the risk of loss to be remote.
12. Subsequent Events
Management has determined no material events or transactions occurred subsequent to July 31, 2010 that would require recognition or disclosure in the Funds’ financial statements.
13. Tax Information (Unaudited)
The information set forth below is for each Fund’s fiscal year as required by federal income tax laws. Shareholders, however, must report distributions on a calendar year basis for income tax purposes, which may include distributions for portions of two fiscal years of a fund. Accordingly, the information needed by shareholders for income tax purposes will be sent to them in January of each year. Please consult your tax advisor for proper treatment of this information.
For the fiscal year ended July 31, 2010, each Fund designates distributions paid during the year as follows:
| | (A) | | | | | | |
| | Ordinary | | | | | | |
| | Income | | Total | | | |
| | Distribution | | Distributions | | Qualifying |
| | (Tax Basis)* | | (Tax Basis) | | Dividends1 |
| Delaware Corporate Bond Fund | 100.00 | % | | 100.00 | % | | 0.40 | % |
| Delaware Extended Duration Bond Fund | 100.00 | % | | 100.00 | % | | 0.75 | % |
(A) is based on a percentage of each Fund’s total distributions.
1Qualifying dividends represent dividends, which qualify for the corporate dividends received deduction.
*For the fiscal year ended July 31, 2010, certain dividends paid by the Funds may be subject to a maximum tax rate of 15%, as provided for by the Jobs and Growth Tax Relief Reconciliation Act of 2003. The Funds intend to designate up to a maximum amount as listed below to be taxed at a maximum rate of 15%. Complete information will be computed and reported in conjunction with your 2010 Form 1099-DIV.
| | | Delaware | | Delaware |
| | | Corporate | | Extended Duration |
| | | Bond Fund | | Bond Fund |
| | | $280,534 | | $133,238 |
95
Notes to financial statements
Delaware Corporate Bond Fund and Delaware Extended Duration Bond Fund
13. Tax Information (Unaudited) (continued)
For the fiscal year ended July 31, 2010, certain interest income paid by the Funds, determined to be Qualified Interest Income may be subject to relief from U.S. withholding for foreign shareholders, as provided by the American Jobs Creation Act of 2004. For the fiscal year ended July 31, 2010, the Funds have designated maximum Qualified Interest Income distributions as follows:
| | Delaware | | Delaware |
| | Corporate | | Extended Duration |
| | Bond Fund | | Bond Fund |
| | $45,804,700 | | $17,430,173 |
96
Report of independent
registered public accounting firm
To the Board of Trustees of Delaware Group® Income Funds and the
Shareholders of Delaware Corporate Bond Fund and Delaware Extended Duration Bond Fund:
In our opinion, the accompanying statements of net assets and the related statements of operations and of changes in net assets and the financial highlights present fairly, in all material respects, the financial position of Delaware Corporate Bond Fund and Delaware Extended Duration Bond Fund (two of the series constituting Delaware Group Income Funds, hereafter referred to as the “Funds”) at July 31, 2010, and the results of their operations, the changes in each of their net assets and the financial highlights for the year then ended, in conformity with accounting principles generally accepted in the United States of America. These financial statements and financial highlights (hereafter referred to as “financial statements”) are the responsibility of the Funds’ management; our responsibility is to express an opinion on these financial statements based on our audits. We conducted our audits of these financia l statements in accordance with the standards of the Public Company Accounting Oversight Board (United States). Those standards require that we plan and perform the audit to obtain reasonable assurance about whether the financial statements are free of material misstatement. An audit includes examining, on a test basis, evidence supporting the amounts and disclosures in the financial statements, assessing the accounting principles used and significant estimates made by management, and evaluating the overall financial statement presentation. We believe that our audits, which included confirmation of securities at July 31, 2010 by correspondence with the custodian and brokers, provide a reasonable basis for our opinion. The statements of changes in net assets for the year ended July 31, 2009 and the financial highlights for each of the four years in the period ended July 31, 2009 were audited by other independent accountants whose report dated September 21, 2009 expressed an unqualified opinion on those statem ents.
PricewaterhouseCoopers LLP
Philadelphia, Pennsylvania
September 22, 2010
97
Other Fund information
(Unaudited)
Delaware Corporate Bond Fund
Proxy Results
At Joint Special Meetings of Shareholders of Delaware Group® Income Funds (the “Trust”), on behalf of Delaware Corporate Bond Fund (the “Fund”), the shareholders of the Fund voted to (i) elect a Board of Trustees for the Trust at a meeting held on November 12, 2009 and reconvened to March 16, 2010; and to (ii) approve a new investment advisory agreement between the Trust, on behalf of the Fund, and Delaware Management Company at a meeting held on November 12, 2009 and reconvened to December 4, 2009. At the meeting, the following people were elected to serve as Independent Trustees: Thomas L. Bennett, John A. Fry, Anthony D. Knerr, Lucinda S. Landreth, Ann R. Leven, Thomas F. Madison, Janet L. Yeomans, and J. Richard Zecher. In additio n, Patrick P. Coyne was elected to serve as an Interested Trustee.
The following proposals were submitted for a vote of the shareholders:
1. To elect a Board of Trustees for the Trust.
| | | | % of | | % of | | | | % of | | % of |
| | | | Outstanding | | Shares | | | | Outstanding | | Shares |
| | Shares Voted For | | Shares | | Voted | | Shares Withheld | | Shares | | Voted |
| Thomas L. Bennett | 177,463,481.025 | | 64.960 | | 96.382 | | 6,662,426.895 | | 2.439 | | 3.618 |
| Patrick P. Coyne | 177,537,391.529 | | 64.987 | | 96.422 | | 6,588,516.391 | | 2.412 | | 3.578 |
| John A. Fry | 177,569,351.590 | | 64.999 | | 96.439 | | 6,556,556.330 | | 2.400 | | 3.561 |
| Anthony D. Knerr | 177,501,127.825 | | 64.974 | | 96.402 | | 6,624,780.095 | | 2.425 | | 3.598 |
| Lucinda S. Landreth | 177,497,831.093 | | 64.973 | | 96.400 | | 6,628,076.827 | | 2.426 | | 3.600 |
| Ann R. Leven | 177,337,196.822 | | 64.914 | | 96.313 | | 6,788,711.098 | | 2.485 | | 3.687 |
| Thomas F. Madison | 177,494,821.896 | | 64.972 | | 96.399 | | 6,631,086.024 | | 2.427 | | 3.601 |
| Janet L. Yeomans | 177,526,408.755 | | 64.983 | | 96.416 | | 6,599,499.165 | | 2.416 | | 3.584 |
| J. Richard Zecher | 177,459,458.860 | | 64.959 | | 96.379 | | 6,666,449.060 | | 2.440 | | 3.621 |
| 2. | | To approve a new investment advisory agreement between each Fund and Delaware Management Company, a series of Delaware Management Business Trust. |
| Shares Voted For | 45,417,938.435 |
| Percentage of Outstanding Shares | 36.995% |
| Percentage of Shares Voted | 67.787% |
| Shares Voted Against | 2,069,842.085 |
| Percentage of Outstanding Shares | 1.686% |
| Percentage of Shares Voted | 3.089% |
| Shares Abstained | 1,482,298.679 |
| Percentage of Outstanding Shares | 1.208% |
| Percentage of Shares Voted | 2.213% |
| Broker Non-Votes | 18,030,910.900 |
98
Extended Duration Bond Fund
Proxy Results
At Joint Special Meetings of Shareholders of Delaware Group® Income Funds (the “Trust”), on behalf of Delaware Extended Duration Bond Fund (the “Fund”), the shareholders of the Fund voted to (i) elect a Board of Trustees for the Trust at a meeting held on November 12, 2009 and reconvened to March 16, 2010; and to (ii) approve a new investment advisory agreement between the Trust, on behalf of the Fund, and Delaware Management Company at a meeting held on November 12, 2009 and reconvened to January 28, 2010. At the meeting, the following people were elected to serve as Independent Trustees: Thomas L. Bennett, John A. Fry, Anthony D. Knerr, Lucinda S. Landreth, Ann R. Leven, Thomas F. Madison, Janet L. Yeomans, and J. Richard Zecher. In addition, Patrick P. Coyne was elected to serve as an Interested Trustee.
The following proposals were submitted for a vote of the shareholders:
1. To elect a Board of Trustees for the Trust.
| | | | | % of | | % of | | | | % of | | % of |
| | | | | Outstanding | | Shares | | | | Outstanding | | Shares |
| | | Shares Voted For | | Shares | | Voted | | Shares Withheld | | Shares | | Voted |
| Thomas L. Bennett | | 177,463,481.025 | | 64.960 | | 96.382 | | 6,662,426.895 | | 2.439 | | 3.618 |
| Patrick P. Coyne | | 177,537,391.529 | | 64.987 | | 96.422 | | 6,588,516.391 | | 2.412 | | 3.578 |
| John A. Fry | | 177,569,351.590 | | 64.999 | | 96.439 | | 6,556,556.330 | | 2.400 | | 3.561 |
| Anthony D. Knerr | | 177,501,127.825 | | 64.974 | | 96.402 | | 6,624,780.095 | | 2.425 | | 3.598 |
| Lucinda S. Landreth | | 177,497,831.093 | | 64.973 | | 96.400 | | 6,628,076.827 | | 2.426 | | 3.600 |
| Ann R. Leven | | 177,337,196.822 | | 64.914 | | 96.313 | | 6,788,711.098 | | 2.485 | | 3.687 |
| Thomas F. Madison | | 177,494,821.896 | | 64.972 | | 96.399 | | 6,631,086.024 | | 2.427 | | 3.601 |
| Janet L. Yeomans | | 177,526,408.755 | | 64.983 | | 96.416 | | 6,599,499.165 | | 2.416 | | 3.584 |
| J. Richard Zecher | | 177,459,458.860 | | 64.959 | | 96.379 | | 6,666,449.060 | | 2.440 | | 3.621 |
| 2. | | To approve a new investment advisory agreement between each Fund and Delaware Management Company, a series of Delaware Management Business Trust. |
| Shares Voted For | 22,126,814.312 |
| Percentage of Outstanding Shares | 51.834% |
| Percentage of Shares Voted | 64.565% |
| Shares Voted Against | 430,324.689 |
| Percentage of Outstanding Shares | 1.008% |
| Percentage of Shares Voted | 1.255% |
| Shares Abstained | 551,127.543 |
| Percentage of Outstanding Shares | 1.291% |
| Percentage of Shares Voted | 1.609% |
| Broker Non-Votes | 11,162,532.756 |
99
Other Fund information
(Unaudited)
Delaware Corporate Bond Fund and Delaware Extended Duration Bond Fund
Change in Independent Registered Public Accounting Firm
Due to independence matters under the Securities and Exchange Commission’s auditor independence rules relating to the January 4, 2010 acquisition of Delaware Investments (including DMC, DDLP and DSC) by Macquarie Group, Ernst & Young LLP (E&Y) has resigned as the independent registered public accounting firm for Delaware Group® Income Funds (the Trust) effective May 20, 2010. At a meeting held on May 20, 2010, the Board of Trustees of the Trust, upon recommendation of the Audit Committee, selected PricewaterhouseCoopers LLP (PwC) to serve as the independent registered public accounting firm for the Trust for the fiscal year ending July 31, 2010. During the fiscal years ended July 31, 2009 and 2008, E&Y’s audit reports on the financial statements of the Funds did not contain any adverse opinion or disclaimer of opinion, nor were they qualified or modified as to uncertainty, audit scope, or accounting principles. In addition, there were no disagreements between the Trust and E&Y on accounting principles, financial statements disclosures or audit scope, which, if not resolved to the satisfaction of E&Y, would have caused them to make reference to the disagreement in their reports. Neither the Trust nor anyone on its behalf has consulted with PwC at any time prior to their selection with respect to the application of accounting principles to a specified transaction, either completed or proposed or the type of audit opinion that might be rendered on the Fund’s financial statements.
100
Board of trustees/directors and officers addendum
Delaware Investments® Family of Funds
A mutual fund is governed by a Board of Trustees/Directors (“Trustees”), which has oversight responsibility for the management of a fund’s business affairs. Trustees establish procedures and oversee and review the performance of the investment manager, the distributor, and others who perform services for the fund. The independent fund trustees, in particular, are advocates
| Name, Address, | | Position(s) | | Length of |
| and Birth Date | | Held with Fund(s) | | Time Served |
| Interested Trustees | | | | |
| | | | | |
| Patrick P. Coyne1 | | Chairman, President, | | Chairman and Trustee |
| 2005 Market Street | | Chief Executive Officer, | | since August 16, 2006 |
| Philadelphia, PA 19103 | | and Trustee | | |
| April 1963 | | | | President and |
| | | | | Chief Executive Officer |
| | | | | since August 1, 2006 |
| | | | | |
| | | | | |
| | | | | |
| | | | | |
| | | | | |
| | | | | |
| | | | | |
| | | | | |
| | | | | |
| | | | | |
| | | | | |
| | | | | |
| | | | | |
| | | | | |
| | | | | |
| | | | | |
| | | | | |
| | | | | |
1 Patrick P. Coyne is considered to be an “Interested Trustee” because he is an executive officer of the Fund’s(s’) investment advisor.
102
for shareholder interests. Each trustee has served in that capacity since he or she was elected to or appointed to the Board of Trustees, and will continue to serve until his or her retirement or the election of a new trustee in his or her place. The following is a list of the Trustees and Officers with certain background and related information.
| | | Number of Portfolios in | | |
| Principal Occupation(s) | | Fund Complex Overseen | | Other Directorships |
| During Past 5 Years | | by Trustee or Officer | | Held by Trustee or Officer |
| |
| |
| Patrick P. Coyne has served in | | 81 | | Director |
| various executive capacities | | | | Kaydon Corp. |
| at different times at | | | | |
| Delaware Investments.2 | | | | Board of Governors Member |
| | | | | Investment Company |
| | | | | Institute (ICI) |
| | | | | |
| | | | | Finance Committee Member |
| | | | | St. John Vianney Roman |
| | | | | Catholic Church |
| |
| | | | | Board of Trustees |
| | | | | Agnes Irwin School |
| |
| | | | | Member of Investment |
| | | | | Committee |
| | | | | Cradle of Liberty Council, |
| | | | | BSA |
| | | | | (2007 – 2010) |
| | | | | |
| |
| | | | | |
| | | | | |
| |
2 Delaware Investments is the marketing name for Delaware Management Holdings, Inc. and its subsidiaries, including the Fund’s(s’) investment advisor, principal underwriter, and its transfer agent.
103
Board of trustees/directors and officers addendum
Delaware Investments® Family of Funds
| Name, Address, | | Position(s) | | Length of |
| and Birth Date | | Held with Fund(s) | | Time Served |
| Independent Trustees | | | | |
| |
| Thomas L. Bennett | | Trustee | | Since March 2005 |
| 2005 Market Street | | | | |
| Philadelphia, PA 19103 | | | | |
| October 1947 | | | | |
| |
| |
| |
| |
| |
| |
| |
| |
| |
| |
| John A. Fry | | Trustee | | Since January 2001 |
| 2005 Market Street | | | | |
| Philadelphia, PA 19103 | | | | |
| May 1960 | | | | |
| |
| |
| |
| |
| |
| |
| |
| |
| Anthony D. Knerr | | Trustee | | Since April 1990 |
| 2005 Market Street | | | | |
| Philadelphia, PA 19103 | | | | |
| December 1938 | | | | |
| |
| |
| Lucinda S. Landreth | | Trustee | | Since March 2005 |
| 2005 Market Street | | | | |
| Philadelphia, PA 19103 | | | | |
| June 1947 | | | | |
| |
104
| | | Number of Portfolios in | | |
| Principal Occupation(s) | | Fund Complex Overseen | | Other Directorships |
| During Past 5 Years | | by Trustee or Officer | | Held by Trustee or Officer |
| | | | | |
| |
| Private Investor | | 81 | | Director |
| (March 2004–Present) | | | | Bryn Mawr Bank Corp. (BMTC) |
| | | | | |
| Investment Manager | | | | Chairman of Investment |
| Morgan Stanley & Co. | | | | Committee |
| (January 1984–March 2004) | | | | Pennsylvania Academy of |
| | | | | Fine Arts |
| | | | | |
| | | | | Investment Committee and |
| | | | | Governance Committee |
| | | | | Member |
| | | | | Pennsylvania Horticultural |
| | | | | Society |
| |
| President | | 81 | | Director |
| Drexel University | | | | Community Health Systems |
| (August 2010–Present) | | | | |
| | | | | Director — Ecore |
| President | | | | International |
| Franklin & Marshall College | | | | (2009-2010) |
| (July 2002–July 2010) | | | | |
| | | | | Director — Allied |
| Executive Vice President | | | | Barton Securities Holdings |
| University of Pennsylvania | | | | (2005 to 2008) |
| (April 1995–June 2002) | | | | |
| |
| Founder and | | 81 | | None |
| Managing Director | | | | |
| Anthony Knerr & Associates | | | | |
| (Strategic Consulting) | | | | |
| (1990–Present) | | | | |
| |
| Chief Investment Officer | | 81 | | None |
| Assurant, Inc. (Insurance) | | | | |
| (2002–2004) | | | | |
| | | | | |
| |
105
Board of trustees/directors and officers addendum
Delaware Investments® Family of Funds
| Name, Address, | | Position(s) | | Length of |
| and Birth Date | | Held with Fund(s) | | Time Served |
| Independent Trustees (continued) | | | | |
| |
| Ann R. Leven | | Trustee | | Since October 1989 |
| 2005 Market Street | | | | |
| Philadelphia, PA 19103 | | | | |
| November 1940 | | | | |
| |
| |
| |
| |
| |
| |
| Thomas F. Madison | | Trustee | | Since May 19973 |
| 2005 Market Street | | | | |
| Philadelphia, PA 19103 | | | | |
| February 1936 | | | | |
| |
| |
| |
| |
| |
| |
| |
| |
| | | | | |
| | | | | |
| | | | | |
| | | | | |
| |
| |
| |
| | | | | |
| | | | | |
| | | | | |
| | | | | |
| | | | | |
| | | | | |
| | | | | |
| | | | | |
| |
3 In 1997, several funds managed by Voyageur Fund Managers, Inc. (the “Voyageur Funds”) were incorporated into the Delaware Investments Family of Funds. Mr. Madison served as a director of the Voyageur Funds from 1993 until 1997.
106
| | | Number of Portfolios in | | |
| Principal Occupation(s) | | Fund Complex Overseen | | Other Directorships |
| During Past 5 Years | | by Trustee or Officer | | Held by Trustee or Officer |
| | | | | |
| |
| Consultant | | 81 | | Director and Audit |
| ARL Associates | | | | Committee Chair – |
| (Financial Planning) | | | | Systemax Inc. |
| (1983–Present) | | | | (2001 – 2009) |
| | | | | |
| | | | | Director and Audit |
| | | | | Committee Chairperson – |
| | | | | Andy Warhol Foundation |
| | | | | (1999 – 2007) |
| |
| President and | | 81 | | Director and Chair of |
| Chief Executive Officer | | | | Compensation Committee, |
| MLM Partners, Inc. | | | | Governance Committee |
| (Small Business Investing | | | | Member |
| and Consulting) | | | | CenterPoint Energy |
| (January 1993–Present) | | | | |
| | | | | Lead Director and Chair of |
| | | | | Audit and Governance |
| | | | | Committees, Member of |
| | | | | Compensation Committee |
| | | | | Digital River, Inc. |
| | | | | |
| | | | | Director and Chair of |
| | | | | Governance Committee, |
| | | | | Audit Committee |
| | | | | Member |
| | | | | Rimage Corporation |
| | | | | |
| | | | | Director and Chair of |
| | | | | Compensation Committee |
| | | | | Spanlink Communications |
| | | | | |
| | | | | Lead Director and Member of |
| | | | | Compensation and |
| | | | | Governance Committees |
| | | | | Valmont Industries, Inc. |
| | | | | (1987 – 2010) |
| |
107
Board of trustees/directors and officers addendum
Delaware Investments® Family of Funds
| Name, Address, | | Position(s) | | Length of |
| and Birth Date | | Held with Fund(s) | | Time Served |
| Independent Trustees (continued) | | | | |
| |
| Thomas F. Madison | | | | |
| 2005 Market Street | | | | |
| Philadelphia, PA 19103 | | | | |
| February 1936 | | | | |
| |
| Janet L. Yeomans | | Trustee | | Since April 1999 |
| 2005 Market Street | | | | |
| Philadelphia, PA 19103 | | | | |
| July 1948 | | | | |
| |
| |
| |
| |
| J. Richard Zecher | | Trustee | | Since March 2005 |
| 2005 Market Street | | | | |
| Philadelphia, PA 19103 | | | | |
| July 1940 | | | | |
| |
| |
| | | | | |
| | | | | |
| | | | | |
| | | | | |
| | | | | |
| | | | | |
| | | | | |
| | | | | |
| | | | | |
| | | | | |
| | | | | |
| | | | | |
| | | | | |
| | | | | |
| |
108
| | | Number of Portfolios in | | |
| Principal Occupation(s) | | Fund Complex Overseen | | Other Directorships |
| During Past 5 Years | | by Trustee or Officer | | Held by Trustee or Officer |
| | | | | |
| |
| | | | | Director |
| | | | | Banner Health |
| | | | | (1996 to 2007) |
| | | | | |
| |
| Vice President and Treasurer | | 81 | | Director |
| (January 2006–Present) | | | | Okabena Company |
| Vice President — Mergers & Acquisitions | | | | |
| (January 2003–January 2006), and | | | | |
| Vice President | | | | |
| (July 1995–January 2003) | | | | |
| 3M Corporation | | | | |
| |
| Founder | | 81 | | Director and Audit |
| Investor Analytics | | | | Committee Member |
| (Risk Management) | | | | Investor Analytics |
| (May 1999–Present) | | | | |
| | | | | |
| Founder | | | | Director |
| Sutton Asset Management | | | | Oxigene, Inc. |
| (Hedge Fund) | | | | (2003 to 2008) |
| (September 1996–Present) | | | | |
| | | | | |
| | | | | |
| | | | | |
| | | | | |
| | | | | |
| | | | | |
| | | | | |
| | | | | |
| | | | | |
| | | | | |
| | | | | |
| |
109
Board of trustees/directors and officers addendum
Delaware Investments® Family of Funds
| Name, Address, | | Position(s) | | Length of |
| and Birth Date | | Held with Fund(s) | | Time Served |
| Officers | | | | |
| | | | | |
| David F. Connor | | Vice President, | | Vice President since |
| 2005 Market Street | | Deputy General | | September 2000 |
| Philadelphia, PA 19103 | | Counsel, and Secretary | | and Secretary since |
| December 1963 | | | | October 2005 |
| |
| |
| Daniel V. Geatens | | Vice President | | Treasurer |
| 2005 Market Street | | and Treasurer | | since October 25, 2007 |
| Philadelphia, PA 19103 | | | | |
| October 1972 | | | | |
| |
| David P. O’Connor | | Senior Vice President, | | Senior Vice President, |
| 2005 Market Street | | General Counsel, | | General Counsel, and |
| Philadelphia, PA 19103 | | and Chief Legal Officer | | Chief Legal Officer |
| February 1966 | | | | since October 2005 |
| |
| Richard Salus | | Senior Vice President | | Chief Financial Officer |
| 2005 Market Street | | and Chief Financial Officer | | since November 2006 |
| Philadelphia, PA 19103 | | | | |
| October 1963 | | | | |
| |
The Statement of Additional Information for the Fund(s) includes additional information about the Trustees and Officers and is available, without charge, upon request by calling 800 523-1918.
110
| | | Number of Portfolios in | | |
| Principal Occupation(s) | | Fund Complex Overseen | | Other Directorships |
| During Past 5 Years | | by Trustee or Officer | | Held by Trustee or Officer |
| |
| |
| David F. Connor has served as | | 81 | | None4 |
| Vice President and Deputy | | | | |
| General Counsel of | | | | |
| Delaware Investments | | | | |
| since 2000. | | | | |
| |
| Daniel V. Geatens has served | | 81 | | None4 |
| in various capacities at | | | | |
| different times at | | | | |
| Delaware Investments. | | | | |
| |
| David P. O’Connor has served in | | 81 | | None4 |
| various executive and legal | | | | |
| capacities at different times | | | | |
| at Delaware Investments. | | | | |
| |
| Richard Salus has served in | | 81 | | None4 |
| various executive capacities | | | | |
| at different times at | | | | |
| Delaware Investments. | | | | |
| |
4 David F. Connor, Daniel V. Geatens, David P. O’Connor, and Richard Salus serve in similar capacities for the six portfolios of the Optimum Fund Trust, which have the same investment advisor, principal underwriter, and transfer agent as the registrant.
111
About the organization
| Board of trustees | | | |
| | | | |
Patrick P. Coyne
Chairman, President, and
Chief Executive Officer
Delaware Investments®
Family of Funds
Philadelphia, PA Thomas L. Bennett
Private Investor
Rosemont, PA John A. Fry
President
Drexel University
Philadelphia, PA | Anthony D. Knerr
Founder and Managing
Director
Anthony Knerr &
Associates
New York, NY Lucinda S. Landreth
Former Chief Investment
Officer
Assurant, Inc.
Philadelphia, PA | Ann R. Leven
Consultant
ARL Associates
New York, NY Thomas F. Madison
President and
Chief Executive Officer
MLM Partners, Inc.
Minneapolis, MN | Janet L. Yeomans
Vice President and
Treasurer
3M Corporation
St. Paul, MN J. Richard Zecher
Founder
Investor Analytics
Scottsdale, AZ |
| | | | |
| Affiliated officers | | | |
| | | | |
David F. Connor
Vice President, Deputy
General Counsel, and
Secretary
Delaware Investments
Family of Funds
Philadelphia, PA | Daniel V. Geatens
Vice President and
Treasurer
Delaware Investments
Family of Funds
Philadelphia, PA | David P. O’Connor
Senior Vice President,
General Counsel,
and Chief Legal Officer
Delaware Investments
Family of Funds
Philadelphia, PA | Richard Salus
Senior Vice President and
Chief Financial Officer
Delaware Investments
Family of Funds
Philadelphia, PA |
This annual report is for the information of Delaware Corporate Bond Fund and Delaware Extended Duration Bond Fund shareholders, but it may be used with prospective investors when preceded or accompanied by a current prospectus for Delaware Corporate Bond Fund and Delaware Extended Duration Bond Fund and the Delaware Investments Fund fact sheet for the most recently completed calendar quarter. These documents are available at www.delawareinvestments.com. The prospectus sets forth details about charges, expenses, investment objectives, and operating policies of the investment company. You should read the prospectus carefully before you invest. The figures in this report represent past results that are not a guarantee of future results. The return and principal value of an investment in the investment company will fluctuate so that shares, when redeemed, may be worth more or less than their original cost. |
Delaware Investments is the marketing name of Delaware Management Holdings, Inc. and its subsidiaries. Each Fund files its complete schedule of portfolio holdings with the Securities and Exchange Commission (SEC) for the first and third quarters of each fiscal year on Form N-Q. Each Fund’s Forms N-Q, as well as a description of the policies and procedures that each Fund uses to determine how to vote proxies (if any) relating to portfolio securities are available without charge (i) upon request, by calling 800 523-1918; and (ii) on the SEC’s Web site at www.sec.gov. In addition, a description of the policies and procedures that each Fund uses to determine how to vote proxies (if any) relating to portfolio securities and each Fund’s Schedule of Investments are available withou t charge on each Fund’s Web site at www.delawareinvestments.com. Each Fund’s Forms N-Q may be reviewed and copied at the SEC’s Public Reference Room in Washington, D.C.; information on the operation of the Public Reference Room may be obtained by calling 800 SEC-0330. Information (if any) regarding how each Fund voted proxies relating to portfolio securities during the most recently disclosed 12-month period ended June 30 is available without charge (i) through each Fund’s Web site at www.delawareinvestments.com; and (ii) on the SEC’s Web site at www.sec.gov. |
Annual report Delaware Diversified Floating Rate Fund July 31, 2010 Fixed income mutual fund |
This annual report is for the information of Delaware Diversified Floating Rate Fund shareholders, but it may be used with prospective investors when preceded or accompanied by a current prospectus for Delaware Diversified Floating Rate Fund. The figures in the annual report for Delaware Diversified Floating Rate Fund represent past results, which are not a guarantee of future results. The return and principal value of an investment in the Fund will fluctuate so that shares, when redeemed, may be worth more or less than their original cost. Current performance may be higher or lower than the performance data quoted.
You should consider the investment objectives, risks, charges, and expenses of the Fund carefully before investing. The Delaware Diversified Floating Rate Fund prospectus contains this and other important information about the Fund. Prospectuses for all open-end funds in the Delaware Investments® Family of Funds are available from your financial advisor, online at www.delawareinvestments.com, or by phone at 800 523-1918. Please read the prospectus carefully before you invest or send money.
|
You can obtain shareholder reports and prospectuses online instead of in the mail.
Visit www.delawareinvestments.com/edelivery. |
Experience Delaware Investments
Delaware Investments is committed to the pursuit of consistently superior asset management and unparalleled client service. We believe in our investment processes, which seek to deliver consistent results, and in convenient services that help add value for our clients.
If you are interested in learning more about creating an investment plan, contact your financial advisor.
You can learn more about Delaware Investments or obtain a prospectus for Delaware Diversified Floating Rate Fund at www.delawareinvestments.com.
| Manage your investments online |
- 24-hour access to your account information
- Obtain share prices
- Check your account balance and recent transactions
- Request statements or literature
- Make purchases and redemptions
|
Delaware Management Holdings, Inc., and its subsidiaries (collectively known by the marketing name of Delaware Investments) are wholly owned subsidiaries of Macquarie Group Limited, a global provider of banking, financial, advisory, investment and funds management services.
Investments in Delaware Diversified Floating Rate Fund are not and will not be deposits with or liabilities of Macquarie Bank Limited ABN 46 008 583 542 and its holding companies, including their subsidiaries or related companies (Macquarie Group), and are subject to investment risk, including possible delays in repayment and loss of income and capital invested. No Macquarie Group company guarantees or will guarantee the performance of the Fund, the repayment of capital from the Fund, or any particular rate of return.
| Table of contents | |
| Portfolio management review | 1 |
| Performance summary | 4 |
| Disclosure of Fund expenses | 8 |
| Security type | 10 |
| Statement of net assets | 11 |
| Statement of operations | 21 |
| Statement of changes in net assets | 22 |
| Financial highlights | 24 |
| Notes to financial statements | 28 |
| Report of independent registered public accounting firm | 41 |
| Other Fund information | 42 |
| Board of trustees/directors and officers addendum | 44 |
| About the organization | 54 |
Unless otherwise noted, views expressed herein are current as of July 31, 2010, and are subject to change.
Funds are not FDIC insured and are not guaranteed. It is possible to lose the principal amount invested.
Mutual fund advisory services provided by Delaware Management Company, a series of Delaware Management Business Trust, which is a registered investment advisor. Delaware Investments, a member of Macquarie Group, refers to Delaware Management Holdings, Inc. and its subsidiaries, including the Fund’s distributor, Delaware Distributors, L.P. Macquarie Group refers to Macquarie Group Limited and its subsidiaries and affiliates worldwide.
© 2010 Delaware Management Holdings, Inc.
All third-party trademarks cited are the property of their respective owners.
| Portfolio management review |
| Delaware Diversified Floating Rate Fund | Aug. 10, 2010 |
| Performance preview (for the period ended July 31, 2010) | | | | |
| Delaware Diversified Floating Rate Fund (Class A shares) | | return since Feb. 26, 2010 (inception) | | +0.87% |
BofA Merrill Lynch U.S. Dollar 3-Month LIBOR
Constant Maturity Index (benchmark) | | return since Feb. 26, 2010 | | +0.13% |
Past performance does not guarantee future results.
For complete, annualized performance for Delaware Diversified Floating Rate Fund, please see the table on page 4.
The performance of Class A shares excludes the applicable sales charge and reflects the reinvestment of all distributions. Index performance returns do not reflect any management fees, transaction costs, or expenses. Indices are unmanaged and one cannot invest directly in an index. |
Delaware Diversified Floating Rate Fund Class A shares returned +0.87% at net asset value and -1.90% at maximum offer price for the fiscal period, which began with the inception of the Fund on Feb. 26, 2010, and ended July 31, 2010. Both return figures reflect the reinvestment of all distributions. During the same period, the Fund’s benchmark, the BofA Merrill Lynch U.S. Dollar 3-Month LIBOR Constant Maturity Index, advanced 0.13%. For complete, annualized performance of Delaware Diversified Floating Rate Fund, please the table on page 4.
Delaware Diversified Floating Rate Fund was launched in a period of gradually improving financial markets. At that time, leading economic indicators were reflecting growth, but at a slowing pace. During the first quarter of 2010, many investors entertained the possibility of a near-term move by the Federal Reserve to marginally raise the fed funds rate, which was at a historical low. In response, floating-rate securities began to receive stronger interest in the market. Interest rates across fixed income sectors were volatile, but most sectors booked moderately positive returns. The broad Barclays Capital U.S. Aggregate Index recorded a solid positive return for the quarter. (Source: Bloomberg.)
As the second quarter of 2010 progressed, doubts about the strength of the global
Delaware Diversified Floating Rate Fund was launched in a period of gradually improving financial markets. At that time, leading economic indicators were reflecting growth, but at a slowing pace. During the first quarter of 2010, many investors entertained the possibility of a near-term move by the Federal Reserve to marginally raise the fed funds rate, which was at a historical low. In response, floating-rate securities began to receive stronger interest in the market. Interest rates across fixed income sectors were volatile, but most sectors booked moderately positive returns.
1
Portfolio management review
Delaware Diversified Floating Rate Fund
economic recovery began to weigh on many investors, who turned in increasing numbers to higher-quality fixed income instruments. One clear driver of investor uneasiness was the level of debt maintained by governments in developed markets across the globe. As a series of sovereign-debt crises evolved in several southern European countries, including, most notably, Greece, investors became more risk averse. This was reflected in multiple indicators, including falling U.S. Treasury yields, rising yields among non-Treasury credits, the U.S. dollar’s strength, and rising borrowing rates (represented by the London interbank offered rate, or Libor).
A shifting investment environment
At the time of the Fund’s inception, stabilizing elements in the U.S. economy appeared to have the upper hand, and the market was still trending higher. For the first several weeks of the Fund’s existence, higher-yielding, riskier assets were generally the best performers. These were primarily bank loans, as well as investment grade credits.
The turnaround, and our response to it, came as European sovereign issues began to sell off and funding concerns arising from the beleaguered southern European economies began to weigh on U.S. markets.
These concerns spilled over into European bank issues. In addition, the uncertainty associated with the potential effect of new financial regulations that were being deliberated in the U.S. Congress increased the pressure on domestic financial industry credits. These factors were the primary catalysts for the rise in volatility that emerged about midway through the second quarter of 2010. As a result, Treasurys began to rally, and the Fund’s higher-beta, riskier assets came under selling pressure.
An important component of the Fund’s total return is derived from its floating rate strategy. In addition to typical floating-rate securities, the Fund may also utilize derivative instruments to effectively convert the fixed rate interest payments from a group of Fund portfolio securities into floating-rate payments. The derivatives we have primarily been utilizing with this strategy are bond swaps, which allow us to exchange into fixed-rate bonds when we feel they may offer advantages over floating rate securities. This also provides the Fund a measure of diversification into sectors outside the traditional floating-rate market. At times the Fund will hold more floating rate securities; at others, the derivatives strategy described above which utilizes fixed-rate securities predominates. This often depends on our outlook at a given time for the return potential offered by the asset mix, and related risk considerations in general.
2
These trends have persisted through the close of the Fund’s fiscal year. Riskier credits have, increasingly, been the bond market’s poorest performers, with non-U.S. currency issues and low credit quality instruments topping the list as the primary sources of negative returns. This is in contrast to the strong return recorded by the broad Barclays Capital U.S. Aggregate Index for the second quarter of 2010, and solid returns delivered by most U.S. investment grade sectors in recent months.
During the first weeks of March, the Fund held close to 40% of its assets in below-investment-grade credits. As that asset class began to negatively affect the Fund’s performance, we lowered the Fund’s risk positioning, restructuring the portfolio to its allocation as of the end of the fiscal period of approximately 25% high yield instruments, which includes bonds, loans (including high yield bank loans), and convertibles. Although these instruments take up a relatively small percentage of the Fund’s assets, these holdings represent a high degree of the beta within the Fund.
Maintaining our focus on managing risk
The Fund underperformed the benchmark index in a few areas. In particular, performance was lower, as a result of the Fund’s exposure to bank loans as many investors’ appetite for risk waned during the second quarter of 2010. In addition, because financial industry credits also experienced selling pressure, the Fund’s performance in these investment grade instruments pulled down both absolute and relative performance.
An important component of the Fund’s total return is derived from its floating rate strategy. In addition to typical floating-rate securities, the Fund may also utilize derivative instruments to effectively convert the fixed rate interest payments from a group of Fund portfolio securities into floating-rate payments. The derivatives we have primarily been utilizing with this strategy are bond swaps, which allow us to exchange into fixed-rate bonds when we feel they may offer advantages over floating rate securities. This also provides the Fund a measure of diversification into sectors outside the traditional floating-rate market.
At times the Fund will hold more floating rate securities; at others, the derivatives strategy described above which utilizes fixed-rate securities predominates. This often depends on our outlook at a given time for the return potential offered by the asset mix, and related risk considerations in general.
When Treasurys rallied, as they did in recent months, the Fund did not perform to our expectations, due to its focus on high-quality asset strategies. Non-Treasury interest rates moved higher (and prices lower) during that period, and as our bond swaps offset the Treasury rally, it generally served as a drag on overall Fund performance. However, we do believe that our emphasis on risk management and diversification was the prudent strategy given the market environment.
Looking ahead, the general demand for floating-rate securities seems to be waning somewhat, in expectation that the Fed may maintain its hold on interest rates well into 2011. Should the Fed hold rates steady, floating-rate notes could cheapen relative to fixed rate bonds, in which case we would consider working to build out more floating-rate positions.
At this stage, the Fund’s risk and credit exposure are holding steady at what we call “a little closer to home.” We do not anticipate moving to a 40% or 45% holding to below-investment-grade allocations unless what we view as meaningful changes occur in the economy.
3
| Performance summary | |
| Delaware Diversified Floating Rate Fund | July 31, 2010 |
The performance data quoted represent past performance; past performance does not guarantee future results. Investment return and principal value will fluctuate so your shares, when redeemed, may be worth more or less than their original cost. Please obtain the performance data current for the most recent month end by calling 800 523-1918 or visiting our Web site at www.delawareinvestments.com/performance. Current performance may be lower or higher than the performance data quoted.
You should consider the investment objectives, risks, charges, and expenses of the investment company carefully before investing. The Delaware Diversified Floating Rate Fund prospectus contains this and other important information about the investment company. Please request a prospectus through your financial advisor or by calling 800 523-1918 or visiting our Web site at www.delawareinvestments.com. Read the prospectus carefully before you invest or send money.
| Fund performance | Average annual total returns through July 31, 2010 |
| | | Lifetime | |
| Class A (Est. Feb. 26, 2010) | | | |
| Excluding sales charge | | +0.87% | |
| Including sales charge | | -1.90% | |
| Class C (Est. Feb. 26, 2010) | | | |
| Excluding sales charge | | +0.56% | |
| Including sales charge | | -0.44% | |
| Class R (Est. Feb. 26, 2010) | | | |
| Excluding sales charge | | +0.89% | |
| Including sales charge | | +0.89% | |
| Institutional Class (Est. Feb. 26, 2010) | | | |
| Excluding sales charge | | +0.97% | |
| Including sales charge | | +0.97% | |
Returns reflect the reinvestment of all distributions and any applicable sales charges as noted in the following paragraphs.
Performance for Class C shares, excluding sales charges, assumes either that contingent deferred sales charges did not apply or that the investment was not redeemed.
Expense limitations were in effect for the periods shown in the “Fund performance” chart and in the “Performance of a $10,000 investment” chart. The current expenses for each class are listed on the “Fund expense ratios” chart. (Note that all charts and graphs referred to in the “Performance summary” section of this report are found on pages 4 through 7.) Performance would have been lower had the expense limitations not been in effect.
The Fund offers Class A, C, R, and Institutional Class shares.
Class A shares are sold with a maximum front-end sales charge of up to 2.75%, and have an annual distribution and service fee of up to 0.30% of average daily net assets. This fee has been contractually limited to 0.25% of average daily net assets from Feb. 26, 2010 through Feb. 28, 2011.
4
Class C shares are sold with a contingent deferred sales charge of 1.00% if redeemed during the first 12 months. They are also subject to an annual distribution and service fee of up to 1.00% of average daily net assets.
Class R shares are available only for certain retirement plan products. They are sold without a sales charge and have an annual distribution and service fee of up to 0.60% of average daily net assets, which has been limited contractually to 0.50% from Feb. 26, 2010, through Feb. 28, 2011.
Institutional Class shares are available without sales or asset-based distribution charges only to certain eligible institutional accounts.
The “Fund performance” table and the “Performance of a $10,000 investment” graph do not reflect the deduction of taxes the shareholder would pay on Fund distributions or redemptions of Fund shares.
Fixed income securities and bond funds can lose value, and investors can lose principal, as interest rates rise. They also may be affected by economic conditions that hinder an issuer’s ability to make interest and principal payments on its debt.
The Fund may also be subject to prepayment risk, the risk that the principal of a fixed income security that is held by the Fund may be prepaid prior to maturity, potentially forcing the Fund to reinvest that money at a lower interest rate.
High yielding, noninvestment grade bonds (junk bonds) involve higher risk than investment grade bonds. The high yield secondary market is particularly susceptible to liquidity problems when institutional investors, such as mutual funds and certain other financial institutions, temporarily stop buying bonds for regulatory, financial, or other reasons. In addition, a less liquid secondary market makes it more difficult for the Fund to obtain precise valuations of the high yield securities in its portfolio.
The Fund may invest in derivatives, which may involve additional expenses and are subject to risk, including the risk that an underlying security or securities index moves in the opposite direction from what the portfolio manager anticipated. A derivative transaction depends upon the counterparties’ ability to fulfill their contractual obligations.
International investments entail risks not ordinarily associated with U.S. investments including fluctuation in currency values, differences in accounting principles, or economic or political instability in other nations. Investing in emerging markets can be riskier than investing in established foreign markets due to increased volatility and lower trading volume.
5
Performance summary
Delaware Diversified Floating Rate Fund
The Fund’s expense ratios, as described in the most recent prospectus, are disclosed in the following “Fund expense ratios” chart. Delaware Investments has agreed to reimburse certain expenses and/or waive certain fees from Feb. 26, 2010, through Feb. 28, 2011. Please see the most recent prospectus and any applicable supplement(s) for additional information on these fee waivers and/or reimbursements.
| Fund expense ratios | Class A | | Class C | | Class R | | Institutional Class |
| Total annual operating expenses | | | | | | | |
| (without fee waivers) | 1.28% | | 1.98% | | 1.58% | | 0.98% |
| Net expenses | | | | | | | |
| (including fee waivers, if any) | 1.05% | | 1.80% | | 1.30% | | 0.80% |
| Type of waiver | Contractual | | Contractual | | Contractual | | Contractual |
Performance of a $10,000 investment
Average annual total returns from Feb. 26, 2010 (Fund’s inception), through July 31, 2010
| For period beginning Feb. 26, 2010, through July 31, 2010 | Starting value | Ending value |
| | BofA Merrill Lynch U.S. Dollar 3-Month LIBOR
Constant Maturity Index | $10,000 | $10,013 |
| | Delaware Diversified Floating Rate Fund — Class A Shares | $9,725 | $9,802 |
6
The chart assumes $10,000 invested in the Fund on Feb. 26, 2010, and includes the effect of a 2.75% front-end sales charge and the reinvestment of all distributions. Please note additional details on these fees in the “Performance summary” section of this report, which includes pages 4 through 7.
The chart also assumes $10,000 invested in the BofA Merrill Lynch U.S. Dollar 3-Month LIBOR Constant Maturity Index as of Feb. 26, 2010.
The BofA Merrill Lynch U.S. Dollar 3-Month LIBOR Constant Maturity Index represents the London intrabank offered rate (LIBOR) with a constant 3-month average maturity. LIBOR, published by the British Bankers’ Association, is a composite of the rates of interest at which banks borrow from one another in the London market, and it is a widely used benchmark for short-term interest rates.
The Barclays Capital U.S. Aggregate Index is a broad composite of more than 8,000 securities that tracks the investment grade domestic bond market.
Index performance returns do not reflect any management fees, transaction costs or expenses. Indices are unmanaged and one cannot invest directly in an index. Past performance is not a guarantee of future results.
Performance of other Fund classes will vary due to different charges and expenses.
The “Fund performance” chart and the “Performance of a $10,000 investment” graph do not reflect the deduction of taxes shareholders would pay on Fund distributions or redemptions of Fund shares.
| | | Nasdaq symbols | | CUSIPs | |
| Class A | | | DDFAX | | | 245908660 | |
| Class C | | | DDFCX | | | 245908652 | |
| Class R | | | DDFFX | | | 245908645 | |
| Institutional Class | | | DDFLX | | | 245908637 | |
7
Disclosure of Fund expenses
For the six-month period February 26, 2010 to July 31, 2010
As a shareholder of the Fund, you incur two types of costs: (1) transaction costs, including sales charges (loads) on purchase payments, reinvested dividends, or other distributions; redemption fees; and exchange fees; and (2) ongoing costs, including management fees; distribution and/or service (12b-1) fees; and other Fund expenses. This example is intended to help you understand your ongoing costs (in dollars) of investing in the Fund and to compare these costs with the ongoing costs of investing in other mutual funds.
The example is based on an investment of $1,000 invested at the beginning of the period and held for the entire six-month period from February 26, 2010 to July 31, 2010.
Actual expenses
The first section of the table shown, “Actual Fund return,” provides information about actual account values and actual expenses. You may use the information in this section of the table, together with the amount you invested, to estimate the expenses that you paid over the period. Simply divide your account value by $1,000 (for example, an $8,600 account value divided by $1,000 = 8.6), then multiply the result by the number in the first section under the heading entitled “Expenses Paid During Period” to estimate the expenses you paid on your account during this period.
Hypothetical example for comparison purposes
The second section of the table shown, “Hypothetical 5% return,” provides information about hypothetical account values and hypothetical expenses based on the Fund’s actual expense ratio and an assumed rate of return of 5% per year before expenses, which is not the Fund’s actual return. The hypothetical account values and expenses may not be used to estimate the actual ending account balance or expenses you paid for the period. You may use this information to compare the ongoing costs of investing in the Fund and other funds. To do so, compare this 5% hypothetical example with the 5% hypothetical examples that appear in the shareholder reports of the other funds. Because the hypothetical example is designed for comparative purposes, it reflects a full six-month period.
Please note that the expenses shown in the table are meant to highlight your ongoing costs only and do not reflect any transactional costs, such as sales charges (loads), redemption fees, or exchange fees. Therefore, the second section of the table is useful in comparing ongoing costs only, and will not help you determine the relative total costs of owning different funds. In addition, if these transactional costs were included, your costs would have been higher. The Fund’s expenses shown in the table reflect fee waivers in effect. The expenses shown in the table assume reinvestment of all dividends and distributions.
8
Delaware Diversified Floating Rate Fund
Expense analysis of an investment of $1,000
| | Beginning | | Ending | | | | Expenses |
| | Account Value | | Account Value | | Annualized | | Paid During Period |
| | 2/26/10* | | 7/31/10 | | Expense Ratio | | 2/26/10 to 7/31/10** |
| Actual Fund return | | | | | | | | | | |
| Class A | $1,000.00 | | | $1,008.70 | | | 1.04% | | $4.46 | |
| Class C | 1,000.00 | | | 1,005.60 | | | 1.79% | | 7.67 | |
| Class R | 1,000.00 | | | 1,008.90 | | | 1.29% | | 5.54 | |
| Institutional Class | 1,000.00 | | | 1,009.70 | | | 0.79% | | 3.39 | |
| | Beginning | | Ending | | | | Expenses |
| | Account Value | | Account Value | | Annualized | | Paid During Period |
| | 2/1/10 | | 7/31/10 | | Expense Ratio | | 2/1/10 to 7/31/10** |
| Hypothetical 5% return (5% return before expenses) | | | | | | |
| Class A | $1,000.00 | | | $1,019.64 | | | 1.04% | | $5.21 | |
| Class C | 1,000.00 | | | 1,015.92 | | | 1.79% | | 8.95 | |
| Class R | 1,000.00 | | | 1,018.40 | | | 1.29% | | 6.46 | |
| Institutional Class | 1,000.00 | | | 1,020.88 | | | 0.79% | | 3.96 | |
| * | The Fund commenced operations on February 26, 2010. The ending account value for “Actual Fund Return” uses the performance since inception and is not annualized. The expenses paid during period for “Actual Fund Return” are equal to the Fund’s annualized expense ratio, multiplied by the average account value over the period, multiplied by 156/365 (to reflect the actual since inception). |
| | |
| ** | The expenses paid during period for “Hypothetical 5% Return” are equal to the Fund’s annualized expense ratio, multiplied by the average account value over the period, multiplied by 181/365 (to reflect the one-half year period). |
9
| Security type | |
| Delaware Diversified Floating Rate Fund | As of July 31, 2010 |
Sector designations may be different than the sector designations presented in other Fund materials. The sector designations may represent the investment manager’s internal sector classifications, which may result in the sector designations for one fund being different than another fund’s sector designations.
| Security type | | Percentage of net assets |
| Agency Collateralized Mortgage Obligations | | 9.27 | % |
| Agency Mortgage-Backed Securities | | 1.73 | % |
| Convertible Bonds | | 0.29 | % |
| Corporate Bonds | | 40.04 | % |
| Banking | | 5.40 | % |
| Basic Industry | | 2.25 | % |
| Brokerage | | 1.26 | % |
| Capital Goods | | 0.68 | % |
| Communications | | 9.78 | % |
| Consumer Non-Cyclical | | 7.16 | % |
| Electric | | 3.91 | % |
| Energy | | 2.86 | % |
| Finance Companies | | 1.65 | % |
| Insurance | | 1.24 | % |
| Natural Gas | | 3.50 | % |
| Technology | | 0.35 | % |
| Municipal Bonds | | 4.01 | % |
| Non-Agency Asset-Backed Securities | | 10.64 | % |
| Foreign Debt | | 0.93 | % |
| Senior Secured Loans | | 24.95 | % |
| Supranational Bank | | 1.25 | % |
| U.S. Treasury Obligations | | 0.55 | % |
| Discount Note | | 9.34 | % |
| Total Value of Securities | | 103.00 | % |
| Liabilities Net of Receivables and Other Assets | | (3.00 | %) |
| Total Net Assets | | 100.00 | % |
10
| Statement of net assets | |
| Delaware Diversified Floating Rate Fund | July 31, 2010 |
| | | | Principal amount° | | Value (U.S. $) |
| Agency Collateralized Mortgage Obligations – 9.27% | | | | | | | | |
| • | Fannie Mae REMICs | | | | | | | | |
| | Series 2003-121 FC 0.729% 2/25/28 | | USD | | 97,669 | | | $ | 97,687 |
| | Series 2004-36 FA 0.729% 5/25/34 | | | | 121,257 | | | | 121,342 |
| | Series 2005-66 FD 0.629% 7/25/35 | | | | 145,642 | | | | 145,340 |
| | Series 2007-36 FL 0.729% 4/25/37 | | | | 150,665 | | | | 150,189 |
| | Series 2007-109 NF 0.879% 12/25/37 | | | | 66,346 | | | | 66,568 |
| • | Freddie Mac REMICs | | | | | | | | |
| | Series 2535 FK 0.741% 10/15/31 | | | | 31,877 | | | | 31,888 |
| | Series 3239 EF 0.691% 11/15/36 | | | | 71,677 | | | | 71,572 |
| | Series 3241 FM 0.721% 11/15/36 | | | | 64,169 | | | | 64,123 |
| Total Agency Collateralized Mortgage Obligations | | | | | | | | |
| | (cost $746,133) | | | | | | | | 748,709 |
| | | | | | | | | |
| Agency Mortgage-Backed Securities – 1.73% | | | | | | | | |
| | Fannie Mae S.F. 30 yr TBA 5.00% 9/1/40 | | | | 70,000 | | | | 74,353 |
| • | Freddie Mac ARM 4.82% 2/1/35 | | | | 62,211 | | | | 65,123 |
| Total Agency Mortgage-Backed Securities (cost $139,976) | | | | | | | | 139,476 |
| | | | | | | | | |
| Convertible Bonds – 0.29% | | | | | | | | |
| | Live Nation Entertainment 2.875% exercise | | | | | | | | |
| | price $27.14, expiration date 7/14/27 | | | | 3,000 | | | | 2,531 |
| # | SVB Financial Group 144A 3.875% exercise | | | | | | | | |
| | price $53.04, expiration date 4/15/11 | | | | 20,000 | | | | 20,675 |
| Total Convertible Bonds (cost $22,888) | | | | | | | | 23,206 |
| | | | | | | | | |
| Corporate Bonds – 40.04% | | | | | | | | |
| Banking – 5.40% | | | | | | | | |
| • | Bank of America 0.817% 6/15/16 | | | | 70,000 | | | | 62,981 |
| • | Citigroup 0.627% 11/5/14 | | | | 60,000 | | | | 55,510 |
| •# | CoBank ACB 144A 1.137% 6/15/22 | | | | 75,000 | | | | 59,326 |
| • | Credit Suisse USA 0.778% 4/12/13 | | | | 24,000 | | | | 23,638 |
| • | JPMorgan Chase 5.10% 6/21/12 | | AUD | | 100,000 | | | | 88,993 |
| • | PNC Funding 0.675% 1/31/14 | | USD | | 75,000 | | | | 72,504 |
| • | USB Capital IX 6.189% 4/15/49 | | | | 35,000 | | | | 27,279 |
| • | Wachovia 0.896% 10/15/16 | | | | 25,000 | | | | 22,633 |
| • | Wachovia Capital Trust II 1.026% 1/15/27 | | | | 30,000 | | | | 23,109 |
| | | | | | | | | | 435,973 |
11
Statement of net assets
Delaware Diversified Floating Rate Fund
| | | | Principal amount° | | Value (U.S. $) |
| Corporate Bonds (continued) | | | | | | | | |
| Basic Industry – 2.25% | | | | | | | | |
| | ArcelorMittal | | | | | | | | |
| | 6.125% 6/1/18 | | USD | | 30,000 | | | $ | 32,602 |
| | 9.85% 6/1/19 | | | | 25,000 | | | | 32,352 |
| | Cytec Industries 8.95% 7/1/17 | | | | 25,000 | | | | 30,772 |
| | Dow Chemical 8.55% 5/15/19 | | | | 20,000 | | | | 25,018 |
| | Teck Resources 9.75% 5/15/14 | | | | 50,000 | | | | 60,828 |
| | | | | | | | | | 181,572 |
| Brokerage – 1.26% | | | | | | | | |
| • | Goldman Sachs Group 0.988% 3/22/16 | | | | 35,000 | | | | 32,455 |
| | Lazard Group 7.125% 5/15/15 | | | | 65,000 | | | | 69,484 |
| | | | | | | | | | 101,939 |
| Capital Goods – 0.68% | | | | | | | | |
| | Thermo Fisher Scientific 4.70% 5/1/20 | | | | 50,000 | | | | 54,992 |
| | | | | | | | | | 54,992 |
| Communications – 9.78% | | | | | | | | |
| | American Tower 7.00% 10/15/17 | | | | 55,000 | | | | 63,181 |
| | Comcast 5.15% 3/1/20 | | | | 55,000 | | | | 59,029 |
| | DirecTV Holdings/Financing 7.625% 5/15/16 | | | | 110,000 | | | | 122,245 |
| # | NBC Universal 144A 5.15% 4/30/20 | | | | 50,000 | | | | 53,247 |
| • | Qwest 3.787% 6/15/13 | | | | 85,000 | | | | 86,275 |
| | Rogers Communications 6.75% 3/15/15 | | | | 55,000 | | | | 64,909 |
| | Telecom Italia Capital 6.175% 6/18/14 | | | | 30,000 | | | | 32,629 |
| • | Telefonica Emisiones 0.674% 2/4/13 | | | | 40,000 | | | | 38,727 |
| | Time Warner Cable 8.25% 4/1/19 | | | | 40,000 | | | | 50,320 |
| # | Vivendi 144A 6.625% 4/4/18 | | | | 30,000 | | | | 33,819 |
| • | Vodafone Group | | | | | | | | |
| | 0.816% 2/27/12 | | | | 110,000 | | | | 109,934 |
| | 0.877% 6/15/11 | | | | 75,000 | | | | 75,073 |
| | | | | | | | | | 789,388 |
| Consumer Non-Cyclical – 7.16% | | | | | | | | |
| •# | Anheuser-Busch InBev Worldwide 144A 1.267% 3/26/13 | | | | 110,000 | | | | 110,142 |
| | Kraft Foods 5.375% 2/10/20 | | | | 55,000 | | | | 60,275 |
| | Life Technologies 6.00% 3/1/20 | | | | 30,000 | | | | 33,136 |
| • | Select Medical Holdings 6.143% 9/15/15 | | | | 50,000 | | | | 43,813 |
| • | Teva Pharmaceutical Finance III 0.939% 12/19/11 | | | | 100,000 | | | | 100,242 |
| • | UnitedHealth Group 1.66% 2/7/11 | | | | 100,000 | | | | 100,466 |
12
| | | Principal amount° | | Value (U.S. $) |
| Corporate Bonds (continued) | | | | | | | |
| Consumer Non-Cyclical (continued) | | | | | | | |
| • | Universal Hospital Services 4.134% 6/1/15 | USD | | 35,000 | | | $ | 30,100 |
| •# | Wrigley Jr. (W.M.) 144A 1.912% 6/28/11 | | | 100,000 | | | | 100,018 |
| | | | | | | | | 578,192 |
| Electric – 3.91% | | | | | | | |
| # | American Transmission Systems 144A 5.25% 1/15/22 | | | 75,000 | | | | 79,080 |
| | CMS Energy 6.55% 7/17/17 | | | 30,000 | | | | 31,236 |
| • | Columbus Southern Power 0.937% 3/16/12 | | | 145,000 | | | | 145,149 |
| • | Georgia Power 0.857% 3/15/13 | | | 60,000 | | | | 60,125 |
| | | | | | | | | 315,590 |
| Energy – 2.86% | | | | | | | |
| | Petrobras International Finance 5.75% 1/20/20 | | | 30,000 | | | | 32,045 |
| | Pride International 8.50% 6/15/19 | | | 30,000 | | | | 33,675 |
| • | Shell International Finance 0.888% 6/22/12 | | | 75,000 | | | | 75,288 |
| | Weatherford International 4.95% 10/15/13 | | | 30,000 | | | | 31,739 |
| # | Woodside Finance 144A 8.125% 3/1/14 | | | 50,000 | | | | 57,848 |
| | | | | | | | | 230,595 |
| Finance Companies – 1.65% | | | | | | | |
| • | General Electric Capital 0.628% 5/11/16 | | | 145,000 | | | | 133,458 |
| | | | | | | | | 133,458 |
| Insurance – 1.24% | | | | | | | |
| • | Berkshire Hathaway 0.858% 2/11/13 | | | 100,000 | | | | 100,420 |
| | | | | | | | | 100,420 |
| Natural Gas – 3.50% | | | | | | | |
| • | Enbridge Energy Partners 8.05% 10/1/37 | | | 35,000 | | | | 34,525 |
| # | Midcontinent Express Pipeline 144A 6.70% 9/15/19 | | | 30,000 | | | | 31,921 |
| | Plains All American Pipeline 8.75% 5/1/19 | | | 40,000 | | | | 49,916 |
| • | TransCanada PipeLines 6.35% 5/15/67 | | | 35,000 | | | | 31,892 |
| •# | Williams 144A 2.533% 10/1/10 | | | 75,000 | | | | 74,972 |
| | Williams Partners 5.25% 3/15/20 | | | 55,000 | | | | 58,844 |
| | | | | | | | | 282,070 |
| Technology – 0.35% | | | | | | | |
| | National Semiconductor 6.60% 6/15/17 | | | 25,000 | | | | 28,247 |
| | | | | | | | | 28,247 |
| Total Corporate Bonds (cost $3,191,319) | | | | | | | 3,232,436 |
13
Statement of net assets
Delaware Diversified Floating Rate Fund
| | | Principal amount° | | Value (U.S. $) |
| Municipal Bonds – 4.01% | | | | | | | |
| • | Kentucky Higher Education Student Loan Revenue | | | | | | | |
| | Series A-1 0.95% 5/1/20 | USD | | 100,000 | | | $ | 99,949 |
| • | Missouri Higher Education Loan Authority Student Loan | | | | | | | |
| | Revenue Series A-1 1.38% 8/27/29 | | | 75,000 | | | | 74,398 |
| • | New Jersey Economic Development Authority Revenue | | | | | | | |
| | (Build America Bonds) 1.48% 6/15/13 | | | 75,000 | | | | 75,087 |
| • | North Texas Higher Education Authority Student Loan | | | | | | | |
| | Revenue Series A-2 1.46% 7/1/30 | | | 75,000 | | | | 74,657 |
| Total Municipal Bonds (cost $325,000) | | | | | | | 324,091 |
| | | | | | | | |
| Non-Agency Asset-Backed Securities – 10.64% | | | | | | | |
| • | American Express Issuance Trust | | | | | | | |
| | Series 2005-2 A 0.411% 8/15/13 | | | 25,000 | | | | 24,900 |
| • | Bank of America Credit Card Trust | | | | | | | |
| | Series 2007-A9 A9 0.381% 11/17/14 | | | 50,000 | | | | 49,772 |
| | Series 2008-A5 A5 1.541% 12/16/13 | | | 20,000 | | | | 20,183 |
| | Series 2010-A1 A1 0.641% 9/15/15 | | | 200,000 | | | | 199,767 |
| • | Capital One Multi-Asset Execution Trust | | | | | | | |
| | Series 2007-A4 A4 0.371% 3/16/15 | | | 100,000 | | | | 99,382 |
| • | Citibank Credit Card Issuance Trust | | | | | | | |
| | Series 2009-A1 A1 2.091% 3/17/14 | | | 100,000 | | | | 102,467 |
| | CNH Equipment Trust Series 2010-A A4 2.49% 1/15/16 | | | 10,000 | | | | 10,303 |
| • | Discover Card Master Trust | | | | | | | |
| | Series 2009-A1 A1 1.641% 12/15/14 | | | 100,000 | | | | 101,583 |
| | Series 2010-A1 A1 0.991% 9/15/15 | | | 100,000 | | | | 100,778 |
| • | MBNA Credit Card Master Note Trust | | | | | | | |
| | Series 2005-A2 A2 0.421% 10/15/14 | | | 100,000 | | | | 99,641 |
| •# | Nissan Master Owner Trust Receivables | | | | | | | |
| | Series 2010-AA A 144A 1.491% 1/15/15 | | | 50,000 | | | | 50,132 |
| Total Non-Agency Asset-Backed Securities (cost $858,431) | | | | 858,908 |
| | | | | | | | |
| Foreign Debt – 0.93%Δ | | | | | | | |
| Canada – 0.93% | | | | | | | |
| • | Province of Ontario 0.52% 5/7/13 | | | 75,000 | | | | 74,979 |
| Total Foreign Debt (cost $74,979) | | | | | | | 74,979 |
| | | | | | | | |
| «Senior Secured Loans – 24.95% | | | | | | | |
| | Affinion Group Term Tranche Loan B 5.00% 10/7/16 | | | 19,938 | | | | 19,260 |
| | AGFS Funding Term Tranche Loan 7.25% 4/21/15 | | | 10,000 | | | | 9,952 |
14
| | | | Principal amount° | | Value (U.S. $) |
| «Senior Secured Loans (continued) | | | | | | | | |
| | AIG | | | | | | | | |
| | Term Tranche Loan 1 6.75% 2/23/15 | | USD | | 14,423 | | | $ | 14,637 |
| | Term Tranche Loan 2 7.00% 3/7/16 | | | | 10,577 | | | | 10,709 |
| | Allen System Term Tranche Loan 8.50% 10/18/13 | | | | 74,051 | | | | 74,328 |
| | Allied Security Holdings Term Tranche Loan 6.75% 2/23/15 | | | | 49,561 | | | | 49,809 |
| | Anchor Glass Term Tranche Loan 6.00% 2/3/16 | | | | 22,139 | | | | 21,992 |
| | Aspect Software Term Tranche Loan B 6.25% 4/19/16 | | | | 24,938 | | | | 24,750 |
| | ATI Holdings Term Tranche Loan 7.00% 2/18/16 | | | | 24,938 | | | | 24,283 |
| | Avaya Term Tranche Loan B2 10.50% 10/27/14 | | | | 50,809 | | | | 51,995 |
| | BE Aerospace Term Tranche Loan 5.75% 7/28/14 | | | | 43,519 | | | | 44,117 |
| | Butler Schein Animal Health Term Tranche | | | | | | | | |
| | Loan B 5.50% 12/31/15 | | | | 64,837 | | | | 64,999 |
| | BWAY Holding Term Tranche Loan B 5.50% 3/28/17 | | | | 45,714 | | | | 45,943 |
| | Cengage Learning Term Tranche Loan 7.50% 7/7/14 | | | | 74,683 | | | | 75,196 |
| | CF Industries Holdings Term Tranche | | | | | | | | |
| | Loan B 5.50% 11/3/14 | | | | 36,250 | | | | 36,592 |
| | Charter Communications Operating Term Tranche | | | | | | | | |
| | Loan B 2.25% 3/6/14 | | | | 49,811 | | | | 47,476 |
| | Chester Downs & Marina Term Tranche | | | | | | | | |
| | Loan 12.375% 12/31/16 | | | | 48,558 | | | | 48,982 |
| | Delta Air Lines Term Tranche Loan 8.75% 9/16/13 | | | | 49,812 | | | | 50,559 |
| | Energy Future Holdings Term Tranche | | | | | | | | |
| | Loan B2 3.729% 10/10/14 | | | | 64,834 | | | | 50,751 |
| | Fidelity National Information Term Tranche | | | | | | | | |
| | Loan B 5.25% 7/18/16 | | | | 85,000 | | | | 85,731 |
| | Ford Motor Term Tranche Loan B 3.258% 12/15/13 | | | | 74,614 | | | | 72,789 |
| | Graham Packaging Term Tranche Loan C 6.75% 4/5/14 | | | | 23,677 | | | | 23,988 |
| | ICL Industrial Containers Term Tranche | | | | | | | | |
| | Loan C 5.50% 6/16/17 | | | | 4,286 | | | | 4,307 |
| | InfoGROUP Term Tranche Loan B 6.25% 3/30/16 | | | | 25,000 | | | | 24,792 |
| | InVentiv Health Term Tranche Loan 6.50% 5/7/16 | | | | 50,000 | | | | 50,188 |
| | JohnsonDiversey Term Tranche Loan B 5.50% 11/24/15 | | | | 34,912 | | | | 35,058 |
| | Level 3 Communications Term Tranche | | | | | | | | |
| | Loan B 11.50% 3/13/14 | | | | 50,000 | | | | 54,344 |
| | Live Nation Entertainment Term Tranche | | | | | | | | |
| | Loan B 4.50% 10/20/16 | | | | 49,875 | | | | 49,267 |
| | MGM MIRAGE Term Tranche Loan E 5.00% 2/21/14 | | | | 25,000 | | | | 21,656 |
| | New Development Holdings Term Tranche Loan 7.00% 4/21/17 | | | | 55,000 | | | | 56,054 |
| | Nuveen Investment 2nd Lien Term Tranche Loan 12.50% 7/9/15 | | | | 75,000 | | | | 83,063 |
15
Statement of net assets
Delaware Diversified Floating Rate Fund
| | | Principal amount° | | Value (U.S. $) |
| «Senior Secured Loans (continued) | | | | | | | |
| | Phillips-Van Heusen Term Tranche Loan B 4.75% 3/15/16 | USD | | 28,389 | | | $ | 28,647 |
| | Pinnacle Foods Finance Term Tranche | | | | | | | |
| | Loan C 7.50% 4/2/14 | | | 49,774 | | | | 50,161 |
| | PQ Term Tranche Loan 6.73% 7/30/15 | | | 50,000 | | | | 46,054 |
| | Prime Healthcare Services Term Tranche | | | | | | | |
| | Loan B 7.25% 2/19/15 | | | 24,938 | | | | 24,065 |
| | Radnet Management Term Tranche Loan B 5.75% 3/12/16 | | | 24,938 | | | | 24,750 |
| | Rental Services 2nd Lien Term Tranche | | | | | | | |
| | Loan 3.817% 10/7/13 | | | 45,000 | | | | 42,835 |
| | Revlon Consumer Products Term Tranche | | | | | | | |
| | Loan 6.00% 8/17/15 | | | 49,875 | | | | 49,556 |
| | Reynolds & Reynolds Term Tranche Loan 5.25% 4/3/17 | | | 23,832 | | | | 23,724 |
| | Rockwood Specialties Group Term Tranche | | | | | | | |
| | Loan H 6.00% 5/15/14 | | | 20,939 | | | | 21,109 |
| | Roundy’s Supermarkets Term Tranche Loan 10.50% 4/5/16 | | | 50,000 | | | | 51,084 |
| | Sinclair Television Group Term Tranche | | | | | | | |
| | Loan B 6.50% 10/16/15 | | | 50,106 | | | | 50,670 |
| | Smurfit-Stone Container Enterprises Term Tranche | | | | | | | |
| | Loan 6.75% 1/2/16 | | | 25,000 | | | | 25,232 |
| | TASC Term Tranche Loan B 5.75% 12/19/14 | | | 14,900 | | | | 14,967 |
| | Telepacific Term Tranche Loan 9.50% 7/27/15 | | | 74,813 | | | | 75,299 |
| | Universal Health Services Term Tranche | | | | | | | |
| | Loan 5.50% 5/16/16 | | | 100,000 | | | | 99,610 |
| | Univision Communications Term Tranche | | | | | | | |
| | Loan B 2.533% 9/29/14 | | | 32,659 | | | | 28,638 |
| | Wendy’s/Arby’s Restaurants Term Tranche | | | | | | | |
| | Loan 5.00% 5/3/17 | | | 30,000 | | | | 30,210 |
| Total Senior Secured Loans (cost $2,009,643) | | | | | | | 2,014,178 |
| | | | | | | | |
| Supranational Bank – 1.25% | | | | | | | |
| • | African Development Bank 0.67% 8/4/14 | | | 100,000 | | | | 100,830 |
| Total Supranational Bank (cost $100,609) | | | | | | | 100,830 |
| | | | | | | | |
| U.S. Treasury Obligations – 0.55% | | | | | | | |
| | U.S. Treasury Notes | | | | | | | |
| | 1.875% 6/30/15 | | | 30,000 | | | | 30,448 |
| | 3.50% 5/15/20 | | | 13,000 | | | | 13,654 |
| Total U.S. Treasury Obligations (cost $42,771) | | | | | | | 44,102 |
16
| | | Principal amount° | | Value (U.S. $) |
| ≠Discount Note – 9.34% | | | | | | | | | |
| | Federal Home Loan Bank 0.06% 8/2/10 | | USD | | 754,004 | | | $ | 754,002 | |
| Total Discount Note (cost $754,002) | | | | | | | | 754,002 | |
| | | | | | | | | | |
| Total Value of Securities – 103.00% | | | | | | | | | |
| | (cost $8,265,751) | | | | | | | | 8,314,917 | |
| Liabilities Net of Receivables | | | | | | | | | |
| | and Other Assets – (3.00%) | | | | | | | | (242,438 | ) |
| Net Assets Applicable to 951,037 | | | | | | | | | |
| | Shares Outstanding – 100.00% | | | | | | | $ | 8,072,479 | |
| | | | | | | | | | |
| Net Asset Value – Delaware Diversified Floating Rate Fund | | | | | | | | | |
| | Class A ($2,959,392 / 348,629 Shares) | | | | | | | | | $8.49 | |
| Net Asset Value – Delaware Diversified Floating Rate Fund | | | | | | | | | |
| | Class C ($1,714,398 / 201,989 Shares) | | | | | | | | | $8.49 | |
| Net Asset Value – Delaware Diversified Floating Rate Fund | | | | | | | | | |
| | Class R ($5,072 / 597 Shares) | | | | | | | | | $8.50 | |
| Net Asset Value – Delaware Diversified Floating Rate Fund | | | | | | | | | |
| | Institutional Class ($3,393,617 / 399,822 Shares) | | | | | | | | | $8.49 | |
| | | | | | | | | | |
| Components of Net Assets at July 31, 2010: | | | | | | | | | |
| Shares of beneficial interest (unlimited authorization – no par) | | | | | | | $ | 8,112,293 | |
| Distributions in excess of net investment income | | | | | | | | (3,336 | ) |
| Accumulated net realized loss on investments | | | | | | | | (71,772 | ) |
| Net unrealized appreciation of investments and foreign currencies | | | | | | | | 35,294 | |
| Total net assets | | | | | | | $ | 8,072,479 | |
°Principal amount shown is stated in the currency in which each security is denominated.
AUD — Australian Dollar
EUR — European Monetary Unit
USD — United States Dollar
| • | Variable rate security. The rate shown is the rate as of July 31, 2010. Interest rates reset periodically. |
| ≠ | The rate shown is the effective yield at the time of purchase. |
17
Statement of net assets
Delaware Diversified Floating Rate Fund
| |
| « | Senior Secured Loans generally pay interest at rates which are periodically redetermined by reference to a base lending rate plus a premium. These base lending rates are generally: (i) the prime rate offered by one or more United States banks, (ii) the lending rate offered by one or more European banks such as the London Inter-Bank Offered Rate (LIBOR), and (iii) the certificate of deposit rate. Senior Secured Loans may be subject to restrictions on resale. Stated rate in effect at July 31, 2010. |
| # | Security exempt from registration under Rule 144A of the Securities Act of 1933, as amended. At July 31, 2010, the aggregate amount of Rule 144A securities was $671,180, which represented 8.31% of the Fund’s net assets. See Note 10 in “Notes to financial statements.” |
| Δ | Securities have been classified by country of origin. |
Summary of abbreviations:
ARM — Adjustable Rate Mortgage
HKSB — Hong Kong Shanghai Bank
MSC — Morgan Stanley & Co.
REMIC — Real Estate Mortgage Investment Conduits
S.F. — Single Family
TBA — To be announced
yr — Year
| Net Asset Value and Offering Price Per Share – | | | |
| Delaware Diversified Floating Rate Fund | | | |
| Net asset value Class A (A) | | $ | 8.49 |
| Sales charge (2.75% of offering price) (B) | | | 0.24 |
| Offering price | | $ | 8.73 |
| (A) | | Net asset value per share, as illustrated, is the amount which would be paid upon redemption or repurchase of shares. |
| (B) | | See the current prospectus for purchase of $100,000 or more. |
1The following foreign currency exchange contracts and swap contracts were outstanding at July 31, 2010:
Foreign Currency Exchange Contracts
| | | | | | | | | | | Unrealized |
| Counterparty | | Contracts to Deliver | | In Exchange For | | Settlement Date | | Depreciation |
| HKSB | | AUD 58,513 | | USD | | 52,613 | | 9/15/10 | | | $ | 13 | |
| MSC | | EUR 34,588 | | USD | | 44,892 | | 9/15/10 | | | | 181 | |
| | | | | | | | | | | | $ | 194 | |
18
| |
Swap Contracts
Interest Rate Swap Contracts |
| | | | | | Fixed | | Floating | | | | | |
| | | | | | Interest Rate | | Interest Rate | | | | | |
| Counterparty & | | | | | Received | | Received | | Termination | | Unrealized |
| Referenced Obligation | | | Notional Value | | (Paid) | | (Paid) | | Date | | Depreciation |
| Morgan Stanley | | | | | | | | | | | | | | |
| 3 yr Interest Rate Swap | | $ | 350,000 | | (1.228 | %) | | 0.525 | % | | 7/19/13 | | $ | 1,686 |
| 5 yr Interest Rate Swap | | | 350,000 | | (1.973 | %) | | 0.525 | % | | 7/19/15 | | | 3,421 |
| 7 yr Interest Rate Swap | | | 325,000 | | (2.52 | %) | | 0.525 | % | | 7/19/17 | | | 3,538 |
| 10 yr Interest Rate Swap | | | 425,000 | | (2.999 | %) | | 0.525 | % | | 7/19/20 | | | 4,031 |
| Total | | $ | 1,450,000 | | | | | | | | | | $ | 12,676 |
The use of foreign currency exchange contracts and swap contracts involves elements of market risk and risks in excess of the amounts recognized in the financial statements. The notional values presented above represent the Fund’s total exposure in such contracts, whereas only the net unrealized appreciation (depreciation) is reflected in the Fund’s net assets.
1See Note 8 in “Notes to financial statements.”
See accompanying Notes, which are an integral part of the financial statements.
19
| Statement of operations | |
| Delaware Diversified Floating Rate Fund | February 26, 2010* to July 31, 2010 |
| Investment Income: | | | | | | | |
| | Interest | | | | | $ | 83,284 | |
| | | | | | | | |
| Expenses: | | | | | | | |
| | Registration fees | | $ | 29,678 | | | | |
| | Reports and statements to shareholders | | | 23,210 | | | | |
| | Legal fees | | | 17,195 | | | | |
| | Management fees | | | 11,980 | | | | |
| | Audit and tax | | | 11,357 | | | | |
| | Dividend disbursing and transfer agent fees and expenses | | | 8,761 | | | | |
| | Distribution expenses – Class A | | | 1,923 | | | | |
| | Distribution expenses – Class C | | | 3,434 | | | | |
| | Distribution expenses – Class R | | | 12 | | | | |
| | Pricing fees | | | 3,593 | | | | |
| | Dues and services | | | 2,825 | | | | |
| | Custodian fees | | | 1,064 | | | | |
| | Accounting and administration expenses | | | 960 | | | | |
| | Trustees’ fees | | | 114 | | | | |
| | Consulting fees | | | 43 | | | | |
| | Trustees’ expenses | | | 4 | | | 116,153 | |
| | Less fees waived | | | | | | (91,774 | ) |
| | Less waived distribution expenses – Class A | | | | | | (320 | ) |
| | Less waived distribution expenses – Class R | | | | | | (2 | ) |
| | Less expense paid indirectly | | | | | | (5 | ) |
| | Total operating expenses | | | | | | 24,052 | |
| Net Investment Income | | | | | | 59,232 | |
| | | | | | | | | |
| Net Realized and Unrealized Loss on Investments | | | | | | | |
| | and Foreign Currencies: | | | | | | | |
| | Net realized loss on: | | | | | | | |
| | Investments | | | | | | (4,086 | ) |
| | Foreign currencies | | | | | | (4,230 | ) |
| | Swap contracts | | | | | | (67,204 | ) |
| | Net realized loss | | | | | | (75,520 | ) |
| | Unrealized appreciation/depreciation of | | | | | | | |
| | investments and foreign currencies | | | | | | 35,294 | |
| Net Realized and Unrealized Loss on Investments | | | | | | | |
| | and Foreign Currencies | | | | | | (40,226 | ) |
| | | | | | | | |
| Net Increase in Net Assets Resulting from Operations | | | | | $ | 19,006 | |
*Date of commencement of operations.
See accompanying Notes, which are an integral part of the financial statements.
21
Statement of changes in net assets
Delaware Diversified Floating Rate Fund
| | | 2/26/10* |
| | | to |
| | | 7/31/10 |
| Increase (Decrease) in Net Assets from Operations: | | | | |
| Net investment income | | $ | 59,232 | |
| Net realized loss on investments and | | | | |
| foreign currencies | | | (75,520 | ) |
| Unrealized appreciation/depreciation of | | | | |
| investments and foreign currencies | | | 35,294 | |
| Net increase in net assets resulting from operations | | | 19,006 | |
| |
| Dividends and Distributions to Shareholders from: | | | | |
| Net investment income: | | | | |
| Class A | | | (16,446 | ) |
| Class C | | | (6,280 | ) |
| Class R | | | (35 | ) |
| Institutional Class | | | (36,059 | ) |
| | | | (58,820 | ) |
| |
| Capital Share Transactions: | | | | |
| Proceeds from shares sold: | | | | |
| Class A | | | 3,329,802 | |
| Class C | | | 1,754,712 | |
| Class R | | | 5,028 | |
| Institutional Class | | | 3,865,434 | |
| |
| Net asset value of shares issued upon reinvestment | | | | |
| of dividends and distributions: | | | | |
| Class A | | | 11,100 | |
| Class C | | | 5,272 | |
| Class R | | | 41 | |
| Institutional Class | | | 32,117 | |
| | | | 9,003,506 | |
22
| | | 2/26/10* |
| | | to |
| | | 7/31/10 |
| Capital Share Transactions (continued): | | | | |
| Cost of shares repurchased: | | | | |
| Class A | | $ | (360,801 | ) |
| Class C | | | (40,000 | ) |
| Institutional Class | | | (490,412 | ) |
| | | | (891,213 | ) |
| Increase in net assets derived from capital share transactions | | | 8,112,293 | |
| Net Increase in Net Assets | | | 8,072,479 | |
| |
| Net Assets: | | | | |
| Beginning of period | | | — | |
| End of period (including distributions in excess of net investment | | | | |
| income of $3,336) | | $ | 8,072,479 | |
*Date of commencement of operations.
See accompanying Notes, which are an integral part of the financial statements.
23
Financial highlights
Delaware Diversified Floating Rate Fund Class A
Selected data for each share of the Fund outstanding throughout the period was as follows:
| | | 2/26/101 | |
| | | to | |
| | | 7/31/10 | |
| Net asset value, beginning of period | | $8.500 | | |
| | |
| Income (loss) from investment operations: | | | | |
| Net investment income2 | | 0.088 | | |
| Net realized and unrealized loss on investments and foreign currencies | | (0.014 | ) | |
| Total from investment operations | | 0.074 | | |
| | |
| Less dividends and distributions from: | | | | |
| Net investment income | | (0.084 | ) | |
| Total dividends and distributions | | (0.084 | ) | |
| | |
| Net asset value, end of period | | $8.490 | | |
| | |
| Total return3 | | 0.87% | | |
| | |
| Ratios and supplemental data: | | | | |
| Net assets, end of period (000 omitted) | | $2,959 | | |
| Ratio of expenses to average net assets | | 1.04% | | |
| Ratio of expenses to average net assets | | | | |
| prior to fees waived and expense paid indirectly | | 4.92% | | |
| Ratio of net investment income to average net assets | | 2.43% | | |
| Ratio of net investment loss to average net assets | | | | |
| prior to fees waived and expense paid indirectly | | (1.45% | ) | |
| Portfolio turnover | | 39% | | |
1 Date of commencement of operations; ratios have been annualized and total return and portfolio turnover have not been annualized. |
2 The average shares outstanding method has been applied for per share information. |
3 Total investment return is based on the change in net asset value of a share during the period and assumes reinvestment of dividends and distributions at net asset value and does not reflect the impact of a sales charge. Total investment return during the period reflects waivers by the manager and the distributor. Performance would have been lower had the waivers not been in effect. |
See accompanying Notes, which are an integral part of the financial statements.
24
Delaware Diversified Floating Rate Fund Class C
Selected data for each share of the Fund outstanding throughout the period was as follows:
| | | 2/26/101 | |
| | | to | |
| | | 7/31/10 | |
| Net asset value, beginning of period | | $8.500 | | |
| | |
| Income (loss) from investment operations: | | | | |
| Net investment income2 | | 0.062 | | |
| Net realized and unrealized loss on investments and foreign currencies | | (0.014 | ) | |
| Total from investment operations | | 0.048 | | |
| | |
| Less dividends and distributions from: | | | | |
| Net investment income | | (0.058 | ) | |
| Total dividends and distributions | | (0.058 | ) | |
| | |
| Net asset value, end of period | | $8.490 | | |
| | |
| Total return3 | | 0.56% | | |
| | |
| Ratios and supplemental data: | | | | |
| Net assets, end of period (000 omitted) | | $1,714 | | |
| Ratio of expenses to average net assets | | 1.79% | | |
| Ratio of expenses to average net assets | | | | |
| prior to fees waived and expense paid indirectly | | 5.62% | | |
| Ratio of net investment income to average net assets | | 1.68% | | |
| Ratio of net investment loss to average net assets | | | | |
| prior to fees waived and expense paid indirectly | | (2.15% | ) | |
| Portfolio turnover | | 39% | | |
1 Date of commencement of operations; ratios have been annualized and total return and portfolio turnover have not been annualized. |
2 The average shares outstanding method has been applied for per share information. |
3 Total investment return is based on the change in net asset value of a share during the period and assumes reinvestment of dividends and distributions at net asset value and does not reflect the impact of a sales charge. Total investment return during the period reflects a waiver by the manager. Performance would have been lower had the waiver not been in effect. |
See accompanying Notes, which are an integral part of the financial statements.
25
Financial highlights
Delaware Diversified Floating Rate Fund Class R
Selected data for each share of the Fund outstanding throughout the period was as follows:
| | | 2/26/101 | |
| | | to | |
| | | 7/31/10 | |
| Net asset value, beginning of period | | $8.500 | | |
| | |
| Income (loss) from investment operations: | | | | |
| Net investment income2 | | 0.079 | | |
| Net realized and unrealized loss on investments and foreign currencies | | (0.004 | ) | |
| Total from investment operations | | 0.075 | | |
| | |
| Less dividends and distributions from: | | | | |
| Net investment income | | (0.075 | ) | |
| Total dividends and distributions | | (0.075 | ) | |
| | |
| Net asset value, end of period | | $8.500 | | |
| | |
| Total return3 | | 0.89% | | |
| | |
| Ratios and supplemental data: | | | | |
| Net assets, end of period (000 omitted) | | $5 | | |
| Ratio of expenses to average net assets | | 1.29% | | |
| Ratio of expenses to average net assets | | | | |
| prior to fees waived and expense paid indirectly | | 5.22% | | |
| Ratio of net investment income to average net assets | | 2.18% | | |
| Ratio of net investment loss to average net assets | | | | |
| prior to fees waived and expense paid indirectly | | (1.75% | ) | |
| Portfolio turnover | | 39% | | |
1 Date of commencement of operations; ratios have been annualized and total return and portfolio turnover have not been annualized. |
2 The average shares outstanding method has been applied for per share information. |
3 Total investment return is based on the change in net asset value of a share during the period and assumes reinvestment of dividends and distributions at net asset value. Total investment return during the period reflects waivers by the manager and the distributor. Performance would have been lower had the waivers not been in effect. |
See accompanying Notes, which are an integral part of the financial statements.
26
Delaware Diversified Floating Rate Fund Institutional Class
Selected data for each share of the Fund outstanding throughout the period was as follows:
| | | 2/26/101 | |
| | | to | |
| | | 7/31/10 | |
| Net asset value, beginning of period | | $8.500 | | |
| | |
| Income (loss) from investment operations: | | | | |
| Net investment income2 | | 0.098 | | |
| Net realized and unrealized loss on investments and foreign currencies | | (0.016 | ) | |
| Total from investment operations | | 0.082 | | |
| | |
| Less dividends and distributions from: | | | | |
| Net investment income | | (0.092 | ) | |
| Total dividends and distributions | | (0.092 | ) | |
| | |
| Net asset value, end of period | | $8.490 | | |
| | |
| Total return3 | | 0.97% | | |
| | |
| Ratios and supplemental data: | | | | |
| Net assets, end of period (000 omitted) | | $3,394 | | |
| Ratio of expenses to average net assets | | 0.79% | | |
| Ratio of expenses to average net assets | | | | |
| prior to fees waived and expense paid indirectly | | 4.62% | | |
| Ratio of net investment income to average net assets | | 2.68% | | |
| Ratio of net investment loss to average net assets | | | | |
| prior to fees waived and expense paid indirectly | | (1.15% | ) | |
| Portfolio turnover | | 39% | | |
1 Date of commencement of operations; ratios have been annualized and total return and portfolio turnover have not been annualized. |
2 The average shares outstanding method has been applied for per share information. |
3 Total investment return is based on the change in net asset value of a share during the period and assumes reinvestment of dividends and distributions at net asset value. Total investment return during the period reflects a waiver by the manager. Performance would have been lower had the waiver not been in effect. |
See accompanying Notes, which are an integral part of the financial statements.
27
| Notes to financial statements | |
| Delaware Diversified Floating Rate Fund | July 31, 2010 |
Delaware Group® Income Funds (Trust) is organized as a Delaware statutory trust and offers five Series: Delaware Core Bond Fund, Delaware Corporate Bond Fund, Delaware Extended Duration Bond Fund, Delaware Diversified Floating Rate Fund and Delaware High-Yield Opportunities Fund. These financial statements and the related notes pertain to Delaware Diversified Floating Rate Fund (Fund). The Trust is an open-end investment company. The Fund is considered diversified under the Investment Company Act of 1940, as amended, and offers Class A, Class C, Class R and Institutional Class shares. Class A shares are sold with a maximum front-end sales charge of up to 2.75%. Class A share purchases of $1,000,000 or more will incur a contingent deferred sales charge (CDSC) of 1% if redeemed during the first year and 0.50% during the second year, provided that Delaware Distributors, L.P. ( DDLP) paid a financial advisor a commission on the purchase of those shares. Class C shares are sold with a CDSC of 1%, if redeemed during the first twelve months. Class R and Institutional Class shares are not subject to a sales charge and are offered for sale exclusively to certain eligible investors.
The investment objective of the Fund is to seek total return.
1. Significant Accounting Policies
The following accounting policies are in accordance with U.S. generally accepted accounting principles (U.S. GAAP) and are consistently followed by the Fund.
Security Valuation — U.S. government and agency securities are valued at the mean between the bid and ask prices. Securities listed on a foreign exchange are valued at the last quoted sales price on the valuation date. Short-term debt securities are valued at market value. Other debt securities, credit default swap (CDS) contracts and interest rate swap contracts are valued by an independent pricing service or broker. To the extent current market prices are not available, the pricing service may take into account developments related to the specific security, as well as transactions in comparable securities. Investment companies are valued at net asset value per share. Foreign currency exchange contracts are valued at the mean between the bid and ask prices. Interpolated values are derived when the settlement date of the contract is an interim date for which quotations are not available. Futures contracts and options on futures contracts are valued at the daily quoted settlement prices. Generally, other securities and assets for which market quotations are not readily available are valued at fair value as determined in good faith under the direction of the Fund’s Board of Trustees (Board). In determining whether market quotations are readily available or fair valuation will be used, various factors will be taken into consideration, such as market closures or suspension of trading in a security. The Fund may use fair value pricing more frequently for securities traded primarily in non-U.S. markets because, among other things, most foreign markets close well before the Fund values its securities at 4:00 p.m. Eastern time. The earlier close of these foreign markets gives rise to the possibility that significant events, including broad market moves, government actions or pronouncements, aftermarket trading, or news events may have occurred in the interim. To account for this, the Fund may frequently value foreign securities using fair value prices based on third-party vendor modeling tools (international fair value pricing).
28
Federal Income Taxes — No provision for federal income taxes has been made as the Fund intends to qualify for federal income tax purposes as a regulated investment company under Subchapter M of the Internal Revenue Code of 1986, as amended, and make the requisite distributions to shareholders. The Fund evaluates tax positions taken or expected to be taken in the course of preparing the Fund’s tax returns to determine whether the tax positions are “more-likely-than-not” of being sustained by the applicable tax authority. Tax positions not deemed to meet the more-likely-than-not threshold are recorded as a tax benefit or expense in the current year. Management has analyzed the Fund’s tax positions for the open tax year ended July 31, 2010, and has concluded that no provision for federal income tax i s required in the Fund’s financial statements.
Class Accounting — Investment income and common expenses are allocated to the various classes of the Fund on the basis of “settled shares” of each class in relation to the net assets of the Fund. Realized and unrealized gain (loss) on investments are allocated to the various classes of the Fund on the basis of daily net assets of each class. Distribution expenses relating to a specific class are charged directly to that class.
Repurchase Agreements — The Fund may invest in a pooled cash account along with other members of the Delaware Investments® Family of Funds pursuant to an exemptive order issued by the Securities and Exchange Commission. The aggregate daily balance of the pooled cash account is invested in repurchase agreements secured by obligations of the U.S. government. The respective collateral is held by the Fund’s custodian bank until the maturity of the respective repurchase agreements. Each repurchase agreement is at least 102% collateralized. However, in the event of default or bankruptcy by the counterparty to the agreement, realization of the collateral may be subject to legal proceedings. At July 31, 2010, the Fund held no investments in repurchase agree ments.
To Be Announced Trades — The Fund may contract to purchase securities for a fixed price at a transaction date beyond the customary settlement period (i.e., “when issued,” “delayed delivery,” “forward commitment,” or “TBA transactions”) consistent with the Fund’s ability to manage its investment portfolio and meet redemption requests. These transactions involve a commitment by the Fund to purchase securities for a predetermined price or yield with payment and delivery taking place more than three days in the future, or after a period longer than the customary settlement period for that type of sec urity. No interest will be earned by the Fund on such purchases until the securities are delivered; however the market value may change prior to delivery.
Foreign Currency Transactions — Transactions denominated in foreign currencies are recorded at the prevailing exchange rates on the valuation date in accordance with the Fund’s prospectus. The value of all assets and liabilities denominated in foreign currencies is translated into U.S. dollars at the exchange rate of such currencies against the U.S. dollar daily. Transaction gains or losses resulting from changes in exchange rates during the reporting period or upon settlement of the foreign currency transaction are reported in operations for the current period. The Fund isolates that portion of realized gains and losses on investments in debt securities which
29
Notes to financial statements
Delaware Diversified Floating Rate Fund
1. Significant Accounting Policies (continued)
is due to changes in foreign exchange rates from that which is due to changes in market prices of debt securities. The Fund reports certain foreign currency related transactions as components of realized gains (losses) for financial reporting purposes, whereas such components are treated as ordinary income (loss) for federal income tax purposes.
Use of Estimates — The preparation of financial statements in conformity with U.S. GAAP requires management to make estimates and assumptions that affect the reported amounts of assets and liabilities and disclosure of contingent assets and liabilities at the date of the financial statements and the reported amounts of revenues and expenses during the reporting period. Actual results could differ from those estimates and such differences could be material.
Other — Expenses directly attributable to the Fund are charged directly to the Fund. Other expenses common to various funds within the Delaware Investments® Family of Funds are generally allocated amongst such funds on the basis of average net assets. Management fees and some other expenses are paid monthly. Security transactions are recorded on the date the securities are purchased or sold (trade date) for financial reporting purposes. Costs used in calculating realized gains and losses on the sale of investment securities are those of the specific securities sold. Interest income is recorded on the accrual basis. Discounts and premiums on non-convertible bonds are amortized to interest income over the lives of the respective securities. Realized gains ( losses) on paydowns of asset- and mortgage-backed securities are classified as interest income. The Fund declares dividends daily from net investment income and pays such dividends monthly and declares and pays distributions from net realized gain on investments, if any, annually. Such dividends and distributions, if any, are recorded on ex-dividend date.
The Fund may receive earnings credits from its custodian when positive cash balances are maintained, which are used to offset custody fees. There were no earnings credits for the period February 26, 2010 through July 31, 2010.
The Fund may receive earnings credits from its transfer agent when positive cash balances are maintained, which may be used to offset transfer agent fees. For the period ended July 31, 2010, the Fund earned $5 under this agreement.
2. Investment Management, Administration Agreements and Other Transactions with Affiliates
In accordance with the terms of its investment management agreement, the Fund pays Delaware Management Company (DMC), a series of Delaware Management Business Trust and the investment manager, an annual fee which is calculated daily at the rate of 0.50% on the first $500 million of average daily net assets of the Fund, 0.475% on the next $500 million, 0.45% on the next $1.5 billion, and 0.425% on average daily net assets in excess of $2.5 billion.
DMC had contractually agreed to waive that portion, if any, of its management fee and/or pay/ reimburse the Fund to the extent necessary to ensure that total annual operating expenses, (excluding any 12b-1 plan expenses and certain non-routine expenses), do not exceed 0.80% of average daily net assets of the Fund from February 26, 2010 through November 30, 2010.
30
For purposes of this waiver and reimbursement, nonroutine expenses may also include such additional costs and expenses, as may be agreed upon from time to time by the Fund’s Board and DMC. This expense waiver and reimbursement applied only to expenses paid directly by the Fund.
Delaware Service Company, Inc. (DSC), an affiliate of DMC, provides fund accounting and financial administration oversight services to the Fund. For these services, the Fund pays DSC fees based on the aggregate daily net assets of the Delaware Investments Family of Funds at the following annual rate: 0.0050% of the first $30 billion; 0.0045% of the next $10 billion; 0.0040% of the next $10 billion; and 0.0025% of aggregate average daily net assets in excess of $50 billion. The fees payable to DSC under the service agreement described above are allocated among all Funds in the Delaware Investments® Family of Funds on a relative net asset value basis . For the period February 26, 2010 through July 31, 2010, the Fund was charged $129 for these services.
DSC also provides dividend disbursing and transfer agency services. The Fund pays DSC a monthly fee based on the number of shareholder accounts for dividend disbursing and transfer agent services.
Pursuant to a distribution agreement and distribution plan, the Fund pays DDLP, the distributor and an affiliate of DMC, an annual distribution and service fee not to exceed 0.30% of the average daily net assets of the Class A shares, 1.00% of the average daily net assets of the C shares and 0.60% of the average daily net assets of Class R shares. Institutional Class shares pay no distribution and service expenses. DDLP has contracted to limit the Class A and Class R shares’ 12b-1 fees for the Fund from February 26, 2010 through November 30, 2010 to no more than 0.25% and 0.50% of average daily net assets, respectively.
At July 31, 2010, the Fund had receivables due from or liabilities payable to affiliates as follows:
| Receivable from DMC under expense limitation agreement | | $ | 27,992 | |
| Dividend disbursing, transfer agent and fund accounting | | | | |
| oversight fees and other expenses payable to DSC | | | (281 | ) |
| Distribution fees payable to DDLP | | | (1,963 | ) |
| Other expenses payable to DMC and affiliates* | | | (1,592 | ) |
*DMC, as part of its administrative services, pays operating expenses on behalf of the Fund and is reimbursed on a periodic basis. Such expenses include items such as printing of shareholder reports, fees for audit, legal and tax services, registration fees and trustees’ fees.
As provided in the investment management agreement, the Fund bears the cost of certain legal and tax services, including internal legal and tax services provided to the Fund by DMC and/ or its affiliates’ employees. For the period February 26, 2010 through July 31, 2010, the Fund was charged $181 for internal legal and tax services provided by DMC and/or its affiliates’ employees.
For the period February 26, 2010 through July 31, 2010, DDLP earned $421 for commissions on sales of the Fund’s Class A shares.
Trustees’ fees include expenses accrued by the Fund for each Trustee’s retainer and meeting fees. Certain officers of DMC, DSC and DDLP are officers and/or Trustees of the Trust. These officers and Trustees are paid no compensation by the Fund.
31
Notes to financial statements
Delaware Diversified Floating Rate Fund
3. Investments
For the period February 26, 2010 through July 31, 2010, the Fund made purchases of $9,503,139 and sales of $2,261,432 of investment securities other than short-term investments.
At July 31, 2010, the cost of investments for federal income tax purposes was $8,269,693. At July 31, 2010, net unrealized appreciation was $45,224, of which $66,213 related to unrealized appreciation of investments and $20,989 related to unrealized depreciation of investments.
U.S. GAAP defines fair value as the price that the Fund would receive to sell an asset or pay to transfer a liability in an orderly transaction between market participants at the measurement date under current market conditions. A three level hierarchy for fair value measurements has been established based upon the transparency of inputs to the valuation of an asset or liability. Inputs may be observable or unobservable and refer broadly to the assumptions that market participants would use in pricing the asset or liability. Observable inputs reflect the assumptions market participants would use in pricing the asset or liability based on market data obtained from sources independent of the reporting entity. Unobservable inputs reflect the reporting entity’s own assumptions about the assumptions that market participants would use in pricing the asset or liability developed based on the best information available under the circumstance s. The Fund’s investment in its entirety is assigned a level based upon the observability of the inputs which are significant to the overall valuation. The three level hierarchy of inputs is summarized below.
| Level 1 – | inputs are quoted prices in active markets for identical investments |
| | |
| Level 2 – | other observable inputs (including, but not limited to: quoted prices for similar assets or liabilities in markets that are active, quoted prices for identical or similar assets or liabilities in markets that are not active, inputs other than quoted prices that are observable for the assets or liabilities (such as interest rates, yield curves, volatilities, prepayment speeds, loss severities, credit risks and default rates) or other market-corroborated inputs) |
| | |
| Level 3 – | inputs are significant unobservable inputs (including the fund’s own assumptions used to determine the fair value of investments) |
The following table summarizes the valuation of the Fund’s investments by fair value hierarchy levels as of July 31, 2010:
| | | Level 2 | |
| Agency, Asset-Backed & Mortgage-Backed Securities | | $ | 1,747,093 | |
| Corporate Debt | | | 5,269,820 | |
| Foreign Debt | | | 175,809 | |
| Municipal Bonds | | | 324,091 | |
| U.S. Treasury Obligations | | | 44,102 | |
| Short-Term | | | 754,002 | |
| Total | | $ | 8,314,917 | |
| | |
| Foreign Currency Exchange Contracts | | $ | (194 | ) |
| Swap Contracts | | $ | (12,676 | ) |
32
There were no Level 3 securities at the beginning or end of the period.
In January 2010, the FASB issued an Accounting Standards Update, Improving Disclosures about Fair Value Measurements, which introduced new disclosure requirements and clarified certain existing disclosure requirements around fair value measurements currently presented above. The new disclosures and clarifications of existing disclosures are generally effective for the Fund’s fiscal period ending July 31, 2011 and interim periods therein. Management has evaluated the impact of this update on its current disclosures and determined that there were no transfers of securities between Level 1 investments and Level 2 investments that had a material impact to the Fund. Utilizing international fair value pricing could cause transfers from Level 1 investments to Level 2 investments in the hierarchy.
4. Dividend and Distribution Information
Income and long-term capital gain distributions are determined in accordance with federal income tax regulations, which may differ from U.S. GAAP. Additionally, distributions from net gains on foreign currency transactions and net short-term gains on sales of investment securities are treated as ordinary income for federal income tax purposes. The tax character of dividends and distributions paid during the period February 26, 2010 through July 31, 2010 was as follows:
| | | 2/26/10* |
| | | to |
| | | 7/31/10 |
| Ordinary income | | | $58,820 |
*Date of commencement of operations.
5. Components of Net Assets on a Tax Basis
As of July 31, 2010, the components of net asset on a tax basis were as follows:
| Shares of beneficial interest | | $ | 8,112,293 | |
| Undistributed ordinary income | | | 1,169 | |
| Distributions payable | | | (5,761 | ) |
| Capital loss carryforwards | | | (67,830 | ) |
| Unrealized appreciation of investments and foreign currencies | | | 32,608 | |
| Net assets | | $ | 8,072,479 | |
The differences between book basis and tax basis components of net assets are primarily attributable to tax deferral of losses on wash sales, tax treatment of distribution payable, mark-to-market of forward foreign currency contracts, tax treatment of interest rate swap contracts and tax treatment of market discount and premium on debt instrument.
For financial reporting purposes, capital accounts are adjusted to reflect the tax character of permanent book/tax differences. Reclassifications are primarily due to tax treatment of gain (loss) on foreign currency transactions, market discount and premium on certain debt instruments
33
Notes to financial statements
Delaware Diversified Floating Rate Fund
5. Components of Net Assets on a Tax Basis (continued)
and paydowns of mortgage- and asset-backed securities. Results of operations and net assets were not affected by these reclassifications. For the period February 26, 2010 through July 31, 2010, the Fund recorded the following reclassifications:
| Distribution in excess of net investment income | | $ | (3,748 | ) |
| Accumulated net realized loss | | | 3,748 | |
For federal income tax purposes, capital loss carryforwards may be carried forward and applied against future capital gains. Capital loss carryforwards remaining at July 31, 2010 will expire as follows: $67,830 expires in 2018.
6. Capital Shares
Transactions in capital shares were as follows:
| | | 2/26/10* |
| | | to |
| | | 7/31/10 |
| Shares sold: | | | |
| Class A | | 390,040 | |
| Class C | | 206,104 | |
| Class R | | 592 | |
| Institutional Class | | 454,149 | |
| |
| Shares issued upon reinvestment of dividends and distributions: | | | |
| Class A | | 1,312 | |
| Class C | | 623 | |
| Class R | | 5 | |
| Institutional Class | | 3,778 | |
| | | 1,056,603 | |
| |
| Shares repurchased: | | | |
| Class A | | (42,723 | ) |
| Class C | | (4,738 | ) |
| Institutional Class | | (58,105 | ) |
| | | (105,566 | ) |
| Net increase | | 951,037 | |
*Date of commencement of operations.
7. Line of Credit
The Fund, along with certain other funds in the Delaware Investments® Family of Funds (Participants), participates in a $35,000,000 revolving line of credit with The Bank of New York Mellon (BNY Mellon) to be used for temporary or emergency purposes as an additional source of liquidity to fund redemptions of investor shares. Under the agreement, Participants are charged
34
an annual commitment fee, which is allocated across the Participants on the basis of each Participant’s allocation of the entire facility. The Participants may borrow up to a maximum of one third of their net assets under the agreement. The agreement expires on November 16, 2010. The Fund had no amounts outstanding as of July 31, 2010, or at any time during the period then ended.
8. Derivatives
U.S. GAAP requires enhanced disclosures that enable investors to understand: 1) how and why an entity uses derivatives; 2) how they are accounted for; and 3) how they affect an entity’s results of operations and financial position.
Foreign Currency Exchange Contracts — The Fund may enter into foreign currency exchange contracts as a way of managing foreign exchange rate risk. The Fund may enter into these contracts to fix the U.S. dollar value of a security that it has agreed to buy or sell for the period between the date the trade was entered into and the date the security is delivered and paid for. The Fund may also use these contracts to hedge the U.S. dollar value of securities it already owns that are denominated in foreign currencies. The change in value is recorded as an unrealized gain or loss. When the contract is closed, a realized gain or loss is recorded equal to the difference between the value of the contract at the time it was opened and the value at the time it was closed.
The use of foreign currency exchange contracts does not eliminate fluctuations in the underlying prices of the securities, but does establish a rate of exchange that can be achieved in the future. Although foreign currency exchange contracts limit the risk of loss due to a decline in the value of the hedged currency, they also limit any potential gain that might result should the value of the currency increase. In addition, the Fund could be exposed to risks if the counterparties to the contracts are unable to meet the terms of their contracts. The Fund’s maximum risk of loss from counterparty credit risk is the value of its currency exchanged with the counterparty. The risk is generally mitigated by having a netting arrangement between the Fund and the counterparty and by the posting of collateral by the counterparty to the Fund to cover the Fund’s exposure to the counterparty.
Swap Contracts — The Fund may enter into interest rate swap contracts, index swap contracts and CDS contracts in the normal course of pursuing its investment objectives. The Fund may use interest rate swaps to adjust the Fund’s sensitivity to interest rates or to hedge against changes in interest rates. Index swaps may be used to gain exposure to markets that the Fund invests in, such as the corporate bond market. The Fund may also use index swaps as a substitute for futures or options contracts if such contracts are not directly available to the Fund on favorable terms. The Fund may enter into CDS contracts in order to hedge against a credit event, to enhance total return or to gain exposure to certai n securities or markets.
Interest Rate Swaps. An interest rate swap contract is an exchange of interest rates between counterparties. In one instance, an interest rate swap involves payments received by the Fund from another party based on a variable or floating interest rate, in return for making payments based on a fixed interest rate. An interest rate swap can also work in reverse with the Fund receiving payments based on a fixed interest rate and making payments based on a variable or floating
35
Notes to financial statements
Delaware Diversified Floating Rate Fund
8. Derivatives (continued)
interest rate. Interest rate swaps may be used to adjust the Fund’s sensitivity to interest rates or to hedge against changes in interest rates. Periodic payments on such contracts are accrued daily and recorded as unrealized appreciation/depreciation on swap contracts. Upon periodic payment/ receipt or termination of the contract, such amounts are recorded as realized gains or losses on swap contracts. The Fund’s maximum risk of loss from counterparty credit risk is the discounted net value of the cash flows to be received from/paid to the counterparty over the interest rate swap contract’s remaining life, to the extent that the amount is positive. This risk is mitigated by having a netting arrangement between the Fund and the counterparty and by the posting of collateral by the counterparty to the Fund to cover the Fund’s exposure to the counterparty.
Index Swaps. Index swaps involve commitments to pay interest in exchange for a market linked return based on a notional amount. To the extent the total return of the security, instrument or basket of instruments underlying the transaction exceeds the offsetting interest obligation, the Fund will receive a payment from the counterparty. To the extent the total return of the security, instrument or basket of instruments underlying the transaction falls short of the offsetting interest obligation, the Fund will make a payment to the counterparty. The change in value of swap contracts outstanding, if any, is recorded as unrealized appreciation or depreciation daily. A realized gain or loss is recorded on maturity or termination of the swap contract. The Fund’s maximum risk of loss from counterparty credit risk is the discounted net value of the cash flows to be received from/paid to the counterparty over the index swap contract’s r emaining life, to the extent that the amount is positive. This risk is mitigated by having a netting arrangement between the Fund and the counterparty and by the posting of collateral by the counterparty to the Fund to cover the Fund’s exposure to the counterparty.
Credit Default Swaps. A CDS contract is a risk-transfer instrument through which one party (purchaser of protection) transfers to another party (seller of protection) the financial risk of a credit event (as defined in the CDS agreement), as it relates to a particular referenced security or basket of securities (such as an index). In exchange for the protection offered by the seller of protection, the purchaser of protection agrees to pay the seller of protection a periodic amount at a stated rate that is applied to the notional amount of the CDS contract. In addition, an upfront payment may be made or received by the Fund in connection with an unwinding or assignment of a CDS contract. Upon the occurrence of a credit event, the seller of protection would pay the par (or other agreed-upon) value of the referenced security (or basket of securities) to the counterparty. Credit events generally include, among others, bankruptcy, failure to pa y, and obligation default.
During the period February 26, 2010 through July 31, 2010, the Fund did not enter into CDS contracts as a purchaser of protection or seller of protection. Periodic payments (receipts) on such contracts are accrued daily and recorded as unrealized losses (gains) on swap contracts. Upon payment (receipt), such amounts are recorded as realized losses (gains) on swap contracts. Upfront payments made or received in connection with CDS contracts are amortized over the expected life
36
of the CDS contracts as unrealized losses (gains) on swap contracts. The change in value of CDS contracts is recorded as unrealized appreciation or depreciation daily. A realized gain or loss is recorded upon a credit event (as defined in the CDS agreement) or the maturity or termination of the agreement.
CDS may involve greater risks than if the Fund had invested in the reference obligation directly. CDS are subject to general market risk, liquidity risk, counterparty risk and credit risk. The Fund’s maximum risk of loss from counterparty credit risk, either as the seller of protection or the buyer of protection, is the fair value of the contract. This risk is mitigated by having a netting arrangement between the Fund and the counterparty and by the posting of collateral by the counterparty to the Fund to cover the Fund’s exposure to the counterparty.
Swaps Generally. Because there is no organized market for swap contracts, the value of open swaps may differ from that which would be realized in the event each Fund terminated its position in the agreement. Risks of entering into these contracts include the potential inability of the counterparty to meet the terms of the contracts. This type of risk is generally limited to the amount of favorable movement in the value of the underlying security, instrument or basket of instruments, if any, at the day of default. Risks also arise from potential losses from adverse market movements and such losses could exceed the unrealized amounts shown on the statement of net assets.
Fair values of derivative instruments as of July 31, 2010 were as follows:
| | | Asset Derivatives | | Liability Derivatives |
| | | Statement of Net | | | | | | Statement of Net | | | | |
| | | Assets Location | | Fair Value | | Assets Location | | Fair Value |
| Foreign exchange contracts | | | | | | | | | | | | | |
| (Forward Currency Contracts) | | Receivables and other assets net of liabilities | | | $ | — | | | Liabilities net of receivables and other assets | | $ | (194 | ) |
| Interest rate contracts | | | | | | | | | | | | | |
| (Swaps) | | Receivables and other assets net of liabilities | | | | — | | | Liabilities net of receivables and other assets | | | (12,676 | ) |
| Total | | | | | $ | — | | | | | $ | (12,870 | ) |
37
Notes to financial statements
Delaware Diversified Floating Rate Fund
8. Derivatives (continued)
The effect of derivative instruments on the statement of operations for the period February 26, 2010 through July 31, 2010 was as follows:
| | | | | | | | Change in Unrealized |
| | | | | Realized Gain | | Appreciation |
| | | | | or Loss on | | or Depreciation |
| | | Location of Gain or Loss on | | Derivatives | | on Derivatives |
| | | Derivatives Recognized in | | Recognized in | | Recognized in |
| | | Income | | | Income | | Income |
| Foreign exchange contracts | | | | | | | | | | | | |
| (Forward Currency Contracts) | | Net realized loss on foreign currencies/net change in unrealized appreciation/depreciation of investments and foreign currencies | | | $ | (3,795 | ) | | | $ | (194 | ) |
| Interest rate contracts | | | | | | | | | | | | |
| (Swaps) | | Net realized loss on swap contracts/net change in unrealized appreciation/depreciation of investments and foreign currencies | | | | (67,204 | ) | | | | (12,676 | ) |
| Total | | | | | $ | (70,999 | ) | | | $ | (12,870 | ) |
9. Securities Lending
The Fund, along with other funds in the Delaware Investments® Family of Funds, may lend its securities pursuant to a security lending agreement (Lending Agreement) with BNY Mellon. With respect to each loan, if on any business day the aggregate market value of securities collateral plus cash collateral held is less than the aggregate market value of the securities which are the subject of such loan, the borrower will be notified to provide additional collateral by the end of the following business day which, together with the collateral already held, will be not less than the applicable collateral requirements for such security loan. If the aggregate market value of securities collateral and cash collateral held with respect to a security loan exceeds the applicable collateral requirement, upon the request of the borrower BNY Mellon must return enough collateral to the borr ower by the end of the following business day to reduce the value of the remaining collateral to the applicable collateral requirement for such security loan. As a result of the foregoing, the value of the collateral held with respect to a loaned security may be temporarily more or less than the value of the security on loan.
Cash collateral received is generally invested in the BNY Mellon Securities Lending Overnight Fund (the “Collective Trust”) established by BNY Mellon for the purpose of investment on behalf of clients participating in its securities lending programs. The Collective Trust may only invest in
38
U.S. government securities and high quality corporate debt, asset-backed and other money market securities and in repurchase agreements collateralized by such securities, provided that the Collective Trust will only hold such assets with a maturity of one business day or less. The Collective Trust seeks to maintain a net asset value per unit of $1.00, but there can be no assurance that it will always be able to do so. The Fund may incur investment losses as a result of investing securities lending collateral in the Collective Trust. This could occur if an investment in the Collective Trust defaulted or if it were necessary to liquidate assets in the Collective Trust to meet returns on outstanding security loans at a time when the Collective Trust’s net asset value per unit was less than $1.00. Under those circumstances, the Fund may not receive an amount from the Collective Trust that is equal in amount to the collateral the Fund wou ld be required to return to the borrower of the securities and the Fund would be required to make up for this shortfall. The Fund can also accept U.S. government securities and letters of credit (non-cash collateral) in connection with securities loans. In the event of default or bankruptcy by the lending agent, realization and/or retention of the collateral may be subject to legal proceedings. In the event the borrower fails to return loaned securities and the collateral received is insufficient to cover the value of the loaned securities and provided such collateral shortfall is not the result of investment losses, the lending agent has agreed to pay the amount of the shortfall to the Fund, or at the discretion of the lending agent, replace the loaned securities. The Fund continues to record dividends or interest, as applicable, on the securities loaned and are subject to change in value of the securities loaned that may occur during the term of the loan. The Fund has the right under the Lending Agreement to recover the securities from the borrower on demand. With respect to security loans collateralized by non-cash collateral, the Fund receives loan premiums paid by the borrower. With respect to security loans collateralized by cash collateral, the earnings from the collateral investments are shared among the Fund, the security lending agent and the borrower. The Fund records security lending income net of allocations to the security lending agent and the borrower. The Fund had no securities out on loan as of July 31, 2010.
10. Credit and Market Risk
The Fund may invest a portion of it assets in high yield fixed income securities, which carry ratings of BB or lower by Standard & Poor’s Rating Group (S&P) and/or Ba or lower by Moody’s Investors Service, Inc. (Moody’s). Investments in these higher yielding securities are generally accompanied by a greater degree of credit risk than higher rated securities. Additionally, lower rated securities may be more susceptible to adverse economic and competitive industry conditions than investment grade securities.
The Fund may invest in fixed income securities whose value is derived from an underlying pool of mortgages or consumer loans. The value of these securities is sensitive to changes in economic conditions, including delinquencies and/or defaults, and may be adversely affected by shifts in the market’s perception of the issuers and changes in interest rates. Investors receive principal and interest payments as the underlying mortgages and consumer loans are paid back. Some of these securities are collateralized mortgage obligations (CMOs). CMOs are debt securities issued by U.S. government agencies or by financial institutions and other mortgage lenders, which are collateralized by a pool of mortgages held under an indenture. Prepayment of mortgages may shorten the stated maturity of the obligations and can result in a loss of premium, if any has been paid. Certain of these securities may be stripped (securities which provide only the p rincipal or interest feature of the underlying security). The yield to maturity on an interest-only CMO is
39
Notes to financial statements
Delaware Diversified Floating Rate Fund
10. Credit and Market Risk (continued)
extremely sensitive not only to changes in prevailing interest rates, but also to the rate of principal payments (including prepayments) on the related underlying mortgage assets. A rapid rate of principal payments may have a material adverse affect on the Fund’s yield to maturity. If the underlying mortgage assets experience greater than anticipated prepayments of principal, the Fund may fail to fully recoup its initial investment in these securities even if the securities are rated in the highest rating categories.
The Fund may invest up to 15% of its net assets in illiquid securities, which may include securities with contractual restrictions on resale, securities exempt from registration under Rule 144A of the Securities Act of 1933, as amended, and other securities which may not be readily marketable. The relative illiquidity of these securities may impair the Fund from disposing of them in a timely manner and at a fair price when it is necessary or desirable to do so. While maintaining oversight, the Fund’s Board has delegated to DMC the day-to-day functions of determining whether individual securities are liquid for purposes of the Fund’s limitation on investments in illiquid assets. Securities eligible for resale pursuant to Rule 144A, which are determined to be liquid, are not subject to the Fund’s 15% limit on investments in illiquid securities. As of July 31, 2010, no securities have been determined be illiquid under the Fu nd’s Liquidity Procedures. Rule 144A have been identified on the statement of net assets.
11. Contractual Obligations
The Fund enters into contracts in the normal course of business that contain a variety of indemnifications. The Fund’s maximum exposure under these arrangements is unknown. However, the Fund has not had prior claims or losses pursuant to these contracts. Management has reviewed the Fund’s existing contracts and expects the risk of loss to be remote.
12. Subsequent Events
Management has determined no material events or transactions occurred subsequent to July 31, 2010 that would require recognition or disclosure in the Fund’s financial statements.
13. Tax Information (Unaudited)
The information set forth below is for the Fund’s fiscal period as required by federal income tax laws. Shareholders, however, must report distributions on a calendar year basis for income tax purposes, which may include distributions for portions of two fiscal years of a fund. Accordingly, the information needed by shareholders for income tax purposes will be sent to them in January of each year. Please consult your tax advisor for proper treatment of this information.
For the fiscal period ended July 31, 2010, the Fund designates distributions paid during the year as follows:
| (A) Ordinary Income Distribution (Tax Basis) | 100% |
(A) is based on a percentage of the Fund’s total distributions.
40
Report of independent
registered public accounting firm
To the Board of Trustees of Delaware Group® Income Funds and the
Shareholders of Delaware Diversified Floating Rate Fund:
In our opinion, the accompanying statement of net assets and the related statements of operations and of changes in net assets and the financial highlights present fairly, in all material respects, the financial position of Delaware Diversified Floating Rate Fund (one of the series constituting Delaware Group Income Funds, hereafter referred to as the “Fund”) at July 31, 2010, and the results of its operations, the changes in its net assets and the financial highlights for the period February 26, 2010 (commencement of operations) through July 31, 2010, in conformity with accounting principles generally accepted in the United States of America. These financial statements and financial highlights (hereafter referred to as “financial statements”) are the responsibility of the Fund’s management; our responsibility is to express an opinion on these financial statements based on our audit. We conducted our audit of these financial statements in accordance with the standards of the Public Company Accounting Oversight Board (United States). Those standards require that we plan and perform the audit to obtain reasonable assurance about whether the financial statements are free of material misstatement. An audit includes examining, on a test basis, evidence supporting the amounts and disclosures in the financial statements, assessing the accounting principles used and significant estimates made by management, and evaluating the overall financial statement presentation. We believe that our audit, which included confirmation of securities at July 31, 2010 by correspondence with the custodian and brokers, provides a reasonable basis for our opinion.
PricewaterhouseCoopers LLP
Philadelphia, Pennsylvania
September 22, 2010
41
Other Fund information
(Unaudited)
Delaware Diversified Floating Rate Fund
Board Consideration of Delaware Diversified Floating Rate Fund Investment Advisory Agreement
At a meeting held on November 17-19, 2009 (the “Meeting”), the Board of Trustees of the Delaware Investments® Family of Funds (the “Board”), including the independent Trustees, unanimously approved the investment advisory agreement for the Delaware Diversified Floating Rate Fund (the “Fund”). In making its decision, the Board considered information furnished specifically in connection with the approval of the investment advisory agreement with Delaware Management Company (“DMC”).
In considering information relating to the approval of the Fund’s advisory agreement, the independent Trustees received assistance and advice from and met separately with counsel to the independent Trustees. Although the Board gave attention to all information furnished, the following discussion identifies, under separate headings, the primary factors taken into account by the Board during its contract approval considerations.
Nature, Extent and Quality of Service. The Board considered the services to be provided by Delaware Investments to the Fund and its shareholders. In reviewing the nature, extent and quality of services, the Board noted that reports will be furnished to it throughout the year at regular Board Meetings covering matters such as relative performance of the Fund, compliance of portfolio managers with the investment policies, strategies and restrictions for the Fund, compliance by DMC and Delaware Distributors, L.P. (together, “Management”) personnel with the Code of Ethics adopted throughout the Delaware Investments Family of Funds complex and adherence to fair value pricing procedures as established by the Board. The Board was pleased with the current staffing of the Fund’s investment advisor and the emphasis pla ced on research in the investment process. The Board gave favorable consideration to DMC’s efforts to control expenditures while maintaining service levels committed to Delaware Investments fund matters. The Board also considered the transfer agent and shareholder services provided to Delaware Investments fund shareholders by DMC’s affiliate, Delaware Service Company, Inc. (“DSC”), noting DSC’s high level of service. The Board noted that Management finished upgrading investment accounting functions through outsourcing to improve the quality and lower the cost of delivering investment accounting services to the Delaware Investments funds. The Board once again noted the benefits provided to Fund shareholders through each shareholder’s ability to exchange an investment in one Delaware Investments fund for the same class of shares in another Delaware Investments fund without a sales charge, to reinvest Fund dividends into additional shares of the Fund or into additional shares of other Delaware Investments funds and the privilege to combine holdings in other Delaware Investments funds to obtain a reduced sales charge. The Board was satisfied with the nature, extent and quality of the overall services provided by Delaware Investments.
Investment Performance. The Board considered the investment performance of the Delaware Investments funds and DMC.
42
Comparative Expenses. The Board considered management fee and total expense comparison data for the Fund and other comparable funds presented in the Board materials. Management provided the Board with information on pricing levels and fee structures for the Fund. The Board focused on the comparative analysis of the effective management fees and total expense ratios of the Fund versus the effective management fees and expense ratios of a group of similar funds (the “Expense Group”). The Board was satisfied with the proposed management fee and total expenses of the Fund in comparison to other similar bond funds.
Management Profitability. The Board considered the level of profits to be realized by Delaware Investments in connection with the operation of the Fund. In this respect, the Board reviewed the pro forma expense statement for the Fund included in the Board materials which reflected varying projected levels of expense reimbursement at varying asset levels. The Board also considered the extent to which Delaware Investments might derive ancillary benefits from Delaware Investments fund operations, including the potential for procuring additional business as a result of the prestige and visibility associated with its role as service provider to the Delaware Investments Family of Funds and the benefits from allocation of Delaware Investments fund brokerage to improve trading efficiencies. The Board found that the management fees wer e reasonable in light of the services rendered and the level of profitability of Delaware Investments.
Economies of Scale. The Trustees considered whether economies of scale are realized by Delaware Investments as the Fund’s assets increase and the extent to which any economies of scale are reflected in the level of management fees charged. The Trustees considered the standardized advisory fee pricing and structure, approved by the Board and shareholders. The Board noted that the fee under the Fund’s proposed management contract fell within the standard structure for bond funds. Management believed, and the Board agreed, that the Fund was priced with a relatively low management fee to reflect potential economies of scale at all asset levels.
Change in Independent Registered Public Accounting Firm
Due to independence matters under the Securities and Exchange Commission’s auditor independence rules relating to the January 4, 2010 acquisition of Delaware Investments (including DMC, DDLP and DSC) by Macquarie Group, Ernst & Young LLP (E&Y) has resigned as the independent registered public accounting firm for Delaware Group® Income Funds (the Trust) effective May 20, 2010. At a meeting held on May 20, 2010, the Board of Trustees of the Trust, upon recommendation of the Audit Committee, selected PricewaterhouseCoopers LLP ( PwC) to serve as the independent registered public accounting firm for the Fund for the fiscal period ending July 31, 2010. Because the Fund launched on February 26, 2010, E&Y has not issued any audit reports f or the Fund. Neither the Fund nor anyone on its behalf has consulted with PwC at any time prior to their selection with respect to the application of accounting principles to a specified transaction, either completed or proposed or the type of audit opinion that might be rendered on the Fund’s financial statements.
43
Board of trustees/directors and officers addendum
Delaware Investments® Family of Funds
A mutual fund is governed by a Board of Trustees/Directors (“Trustees”), which has oversight responsibility for the management of a fund’s business affairs. Trustees establish procedures and oversee and review the performance of the investment manager, the distributor, and others who perform services for the fund. The independent fund trustees, in particular, are advocates
| Name, Address, | | Position(s) | | Length of |
| and Birth Date | | Held with Fund(s) | | Time Served |
| Interested Trustees | | | | |
| | | | | |
| Patrick P. Coyne1 | | Chairman, President, | | Chairman and Trustee |
| 2005 Market Street | | Chief Executive Officer, | | since August 16, 2006 |
| Philadelphia, PA 19103 | | and Trustee | | |
| April 1963 | | | | President and |
| | | | | Chief Executive Officer |
| | | | | since August 1, 2006 |
| | | | | |
| | | | | |
| | | | | |
| | | | | |
| | | | | |
| | | | | |
| | | | | |
| | | | | |
| | | | | |
| | | | | |
| | | | | |
| | | | | |
| | | | | |
| | | | | |
| | | | | |
| | | | | |
| | | | | |
| | | | | |
1 Patrick P. Coyne is considered to be an “Interested Trustee” because he is an executive officer of the Fund’s(s’) investment advisor.
44
for shareholder interests. Each trustee has served in that capacity since he or she was elected to or appointed to the Board of Trustees, and will continue to serve until his or her retirement or the election of a new trustee in his or her place. The following is a list of the Trustees and Officers with certain background and related information.
| | | Number of Portfolios in | | |
| Principal Occupation(s) | | Fund Complex Overseen | | Other Directorships |
| During Past 5 Years | | by Trustee or Officer | | Held by Trustee or Officer |
| |
| |
| Patrick P. Coyne has served in | | 81 | | Director |
| various executive capacities | | | | Kaydon Corp. |
| at different times at | | | | |
| Delaware Investments.2 | | | | Board of Governors Member |
| | | | | Investment Company |
| | | | | Institute (ICI) |
| | | | | |
| | | | | Finance Committee Member |
| | | | | St. John Vianney Roman |
| | | | | Catholic Church |
| |
| | | | | Board of Trustees |
| | | | | Agnes Irwin School |
| |
| | | | | Member of Investment |
| | | | | Committee |
| | | | | Cradle of Liberty Council, |
| | | | | BSA |
| | | | | (2007 – 2010) |
| | | | | |
| |
| | | | | |
| | | | | |
| |
2 Delaware Investments is the marketing name for Delaware Management Holdings, Inc. and its subsidiaries, including the Fund’s(s’) investment advisor, principal underwriter, and its transfer agent.
45
Board of trustees/directors and officers addendum
Delaware Investments® Family of Funds
| Name, Address, | | Position(s) | | Length of |
| and Birth Date | | Held with Fund(s) | | Time Served |
| Independent Trustees | | | | |
| |
| Thomas L. Bennett | | Trustee | | Since March 2005 |
| 2005 Market Street | | | | |
| Philadelphia, PA 19103 | | | | |
| October 1947 | | | | |
| |
| |
| |
| |
| |
| |
| |
| |
| |
| |
| John A. Fry | | Trustee | | Since January 2001 |
| 2005 Market Street | | | | |
| Philadelphia, PA 19103 | | | | |
| May 1960 | | | | |
| |
| |
| |
| |
| |
| |
| |
| |
| Anthony D. Knerr | | Trustee | | Since April 1990 |
| 2005 Market Street | | | | |
| Philadelphia, PA 19103 | | | | |
| December 1938 | | | | |
| |
| |
| Lucinda S. Landreth | | Trustee | | Since March 2005 |
| 2005 Market Street | | | | |
| Philadelphia, PA 19103 | | | | |
| June 1947 | | | | |
| |
46
| | | Number of Portfolios in | | |
| Principal Occupation(s) | | Fund Complex Overseen | | Other Directorships |
| During Past 5 Years | | by Trustee or Officer | | Held by Trustee or Officer |
| | | | | |
| |
| Private Investor | | 81 | | Director |
| (March 2004–Present) | | | | Bryn Mawr Bank Corp. (BMTC) |
| | | | | |
| Investment Manager | | | | Chairman of Investment |
| Morgan Stanley & Co. | | | | Committee |
| (January 1984–March 2004) | | | | Pennsylvania Academy of |
| | | | | Fine Arts |
| | | | | |
| | | | | Investment Committee and |
| | | | | Governance Committee |
| | | | | Member |
| | | | | Pennsylvania Horticultural |
| | | | | Society |
| |
| President | | 81 | | Director |
| Drexel University | | | | Community Health Systems |
| (August 2010–Present) | | | | |
| | | | | Director — Ecore |
| President | | | | International |
| Franklin & Marshall College | | | | (2009-2010) |
| (July 2002–July 2010) | | | | |
| | | | | Director — Allied |
| Executive Vice President | | | | Barton Securities Holdings |
| University of Pennsylvania | | | | (2005 to 2008) |
| (April 1995–June 2002) | | | | |
| |
| Founder and | | 81 | | None |
| Managing Director | | | | |
| Anthony Knerr & Associates | | | | |
| (Strategic Consulting) | | | | |
| (1990–Present) | | | | |
| |
| Chief Investment Officer | | 81 | | None |
| Assurant, Inc. (Insurance) | | | | |
| (2002–2004) | | | | |
| | | | | |
| |
47
Board of trustees/directors and officers addendum
Delaware Investments® Family of Funds
| Name, Address, | | Position(s) | | Length of |
| and Birth Date | | Held with Fund(s) | | Time Served |
| Independent Trustees (continued) | | | | |
| |
| Ann R. Leven | | Trustee | | Since October 1989 |
| 2005 Market Street | | | | |
| Philadelphia, PA 19103 | | | | |
| November 1940 | | | | |
| |
| |
| |
| |
| |
| |
| Thomas F. Madison | | Trustee | | Since May 19973 |
| 2005 Market Street | | | | |
| Philadelphia, PA 19103 | | | | |
| February 1936 | | | | |
| |
| |
| |
| |
| |
| |
| |
| |
| | | | | |
| | | | | |
| | | | | |
| | | | | |
| |
| |
| |
| | | | | |
| | | | | |
| | | | | |
| | | | | |
| | | | | |
| | | | | |
| | | | | |
| | | | | |
| |
3 In 1997, several funds managed by Voyageur Fund Managers, Inc. (the “Voyageur Funds”) were incorporated into the Delaware Investments Family of Funds. Mr. Madison served as a director of the Voyageur Funds from 1993 until 1997.
48
| | | Number of Portfolios in | | |
| Principal Occupation(s) | | Fund Complex Overseen | | Other Directorships |
| During Past 5 Years | | by Trustee or Officer | | Held by Trustee or Officer |
| | | | | |
| |
| Consultant | | 81 | | Director and Audit |
| ARL Associates | | | | Committee Chair – |
| (Financial Planning) | | | | Systemax Inc. |
| (1983–Present) | | | | (2001 – 2009) |
| | | | | |
| | | | | Director and Audit |
| | | | | Committee Chairperson – |
| | | | | Andy Warhol Foundation |
| | | | | (1999 – 2007) |
| |
| President and | | 81 | | Director and Chair of |
| Chief Executive Officer | | | | Compensation Committee, |
| MLM Partners, Inc. | | | | Governance Committee |
| (Small Business Investing | | | | Member |
| and Consulting) | | | | CenterPoint Energy |
| (January 1993–Present) | | | | |
| | | | | Lead Director and Chair of |
| | | | | Audit and Governance |
| | | | | Committees, Member of |
| | | | | Compensation Committee |
| | | | | Digital River, Inc. |
| | | | | |
| | | | | Director and Chair of |
| | | | | Governance Committee, |
| | | | | Audit Committee |
| | | | | Member |
| | | | | Rimage Corporation |
| | | | | |
| | | | | Director and Chair of |
| | | | | Compensation Committee |
| | | | | Spanlink Communications |
| | | | | |
| | | | | Lead Director and Member of |
| | | | | Compensation and |
| | | | | Governance Committees |
| | | | | Valmont Industries, Inc. |
| | | | | (1987 – 2010) |
| |
49
Board of trustees/directors and officers addendum
Delaware Investments® Family of Funds
| Name, Address, | | Position(s) | | Length of |
| and Birth Date | | Held with Fund(s) | | Time Served |
| Independent Trustees (continued) | | | | |
| |
| Thomas F. Madison | | | | |
| 2005 Market Street | | | | |
| Philadelphia, PA 19103 | | | | |
| February 1936 | | | | |
| |
| Janet L. Yeomans | | Trustee | | Since April 1999 |
| 2005 Market Street | | | | |
| Philadelphia, PA 19103 | | | | |
| July 1948 | | | | |
| |
| |
| |
| |
| J. Richard Zecher | | Trustee | | Since March 2005 |
| 2005 Market Street | | | | |
| Philadelphia, PA 19103 | | | | |
| July 1940 | | | | |
| |
| |
| | | | | |
| | | | | |
| | | | | |
| | | | | |
| | | | | |
| | | | | |
| | | | | |
| | | | | |
| | | | | |
| | | | | |
| | | | | |
| | | | | |
| | | | | |
| | | | | |
| |
50
| | | Number of Portfolios in | | |
| Principal Occupation(s) | | Fund Complex Overseen | | Other Directorships |
| During Past 5 Years | | by Trustee or Officer | | Held by Trustee or Officer |
| | | | | |
| |
| | | | | Director |
| | | | | Banner Health |
| | | | | (1996 to 2007) |
| | | | | |
| |
| Vice President and Treasurer | | 81 | | Director |
| (January 2006–Present) | | | | Okabena Company |
| Vice President — Mergers & Acquisitions | | | | |
| (January 2003–January 2006), and | | | | |
| Vice President | | | | |
| (July 1995–January 2003) | | | | |
| 3M Corporation | | | | |
| |
| Founder | | 81 | | Director and Audit |
| Investor Analytics | | | | Committee Member |
| (Risk Management) | | | | Investor Analytics |
| (May 1999–Present) | | | | |
| | | | | |
| Founder | | | | Director |
| Sutton Asset Management | | | | Oxigene, Inc. |
| (Hedge Fund) | | | | (2003 to 2008) |
| (September 1996–Present) | | | | |
| | | | | |
| | | | | |
| | | | | |
| | | | | |
| | | | | |
| | | | | |
| | | | | |
| | | | | |
| | | | | |
| | | | | |
| | | | | |
| |
51
Board of trustees/directors and officers addendum
Delaware Investments® Family of Funds
| Name, Address, | | Position(s) | | Length of |
| and Birth Date | | Held with Fund(s) | | Time Served |
| Officers | | | | |
| | | | | |
| David F. Connor | | Vice President, | | Vice President since |
| 2005 Market Street | | Deputy General | | September 2000 |
| Philadelphia, PA 19103 | | Counsel, and Secretary | | and Secretary since |
| December 1963 | | | | October 2005 |
| |
| |
| Daniel V. Geatens | | Vice President | | Treasurer |
| 2005 Market Street | | and Treasurer | | since October 25, 2007 |
| Philadelphia, PA 19103 | | | | |
| October 1972 | | | | |
| |
| David P. O’Connor | | Senior Vice President, | | Senior Vice President, |
| 2005 Market Street | | General Counsel, | | General Counsel, and |
| Philadelphia, PA 19103 | | and Chief Legal Officer | | Chief Legal Officer |
| February 1966 | | | | since October 2005 |
| |
| Richard Salus | | Senior Vice President | | Chief Financial Officer |
| 2005 Market Street | | and Chief Financial Officer | | since November 2006 |
| Philadelphia, PA 19103 | | | | |
| October 1963 | | | | |
| |
The Statement of Additional Information for the Fund(s) includes additional information about the Trustees and Officers and is available, without charge, upon request by calling 800 523-1918.
52
| | | Number of Portfolios in | | |
| Principal Occupation(s) | | Fund Complex Overseen | | Other Directorships |
| During Past 5 Years | | by Trustee or Officer | | Held by Trustee or Officer |
| |
| |
| David F. Connor has served as | | 81 | | None4 |
| Vice President and Deputy | | | | |
| General Counsel of | | | | |
| Delaware Investments | | | | |
| since 2000. | | | | |
| |
| Daniel V. Geatens has served | | 81 | | None4 |
| in various capacities at | | | | |
| different times at | | | | |
| Delaware Investments. | | | | |
| |
| David P. O’Connor has served in | | 81 | | None4 |
| various executive and legal | | | | |
| capacities at different times | | | | |
| at Delaware Investments. | | | | |
| |
| Richard Salus has served in | | 81 | | None4 |
| various executive capacities | | | | |
| at different times at | | | | |
| Delaware Investments. | | | | |
| |
4 David F. Connor, Daniel V. Geatens, David P. O’Connor, and Richard Salus serve in similar capacities for the six portfolios of the Optimum Fund Trust, which have the same investment advisor, principal underwriter, and transfer agent as the registrant.
53
About the organization
| Board of trustees | | | |
| | | | |
Patrick P. Coyne
Chairman, President, and
Chief Executive Officer
Delaware Investments®
Family of Funds
Philadelphia, PA Thomas L. Bennett
Private Investor
Rosemont, PA John A. Fry
President
Drexel University
Philadelphia, PA | Anthony D. Knerr
Founder and Managing
Director
Anthony Knerr &
Associates
New York, NY Lucinda S. Landreth
Former Chief Investment
Officer
Assurant, Inc.
Philadelphia, PA | Ann R. Leven
Consultant
ARL Associates
New York, NY Thomas F. Madison
President and
Chief Executive Officer
MLM Partners, Inc.
Minneapolis, MN | Janet L. Yeomans
Vice President and
Treasurer
3M Corporation
St. Paul, MN J. Richard Zecher
Founder
Investor Analytics
Scottsdale, AZ |
| | | | |
| Affiliated officers | | | |
| | | | |
David F. Connor
Vice President, Deputy
General Counsel, and
Secretary
Delaware Investments
Family of Funds
Philadelphia, PA | Daniel V. Geatens
Vice President and
Treasurer
Delaware Investments
Family of Funds
Philadelphia, PA | David P. O’Connor
Senior Vice President,
General Counsel,
and Chief Legal Officer
Delaware Investments
Family of Funds
Philadelphia, PA | Richard Salus
Senior Vice President and
Chief Financial Officer
Delaware Investments
Family of Funds
Philadelphia, PA |
This annual report is for the information of Delaware Diversified Floating Rate Fund shareholders, but it may be used with prospective investors when preceded or accompanied by a current prospectus for Delaware Diversified Floating Rate Fund and the Delaware Investments Fund fact sheet for the most recently completed calendar quarter. These documents are available at www.delawareinvestments.com. The prospectus sets forth details about charges, expenses, investment objectives, and operating policies of the investment company. You should read the prospectus carefully before you invest. The figures in this report represent past results that are not a guarantee of future results. The return and principal value of an investment in the investment company will fluctuate so that shares, when redeemed, may be worth more or less than their original cost. |
Delaware Investments is the marketing name of Delaware Management Holdings, Inc. and its subsidiaries. The Fund files its complete schedule of portfolio holdings with the Securities and Exchange Commission (SEC) for the first and third quarters of each fiscal year on Form N-Q. The Fund’s Forms N-Q, as well as a description of the policies and procedures that the Fund uses to determine how to vote proxies (if any) relating to portfolio securities are available without charge (i) upon request, by calling 800 523-1918; and (ii) on the SEC’s Web site at www.sec.gov. In addition, a description of the policies and procedures that the Fund uses to determine how to vote proxies (if any) relating to portfolio securities and the Fund’s Schedule of Investments are available without charge on the Fund’s Web site at www.delawareinvestments.com. The Fund’s Forms N-Q may be reviewed and copied at the SEC’s Public Reference Room in Washington, D.C.; information on the o peration of the Public Reference Room may be obtained by calling 800 SEC-0330. Information (if any) regarding how the Fund voted proxies relating to portfolio securities during the most recently disclosed 12-month period ended June 30 is available without charge (i) through the Fund’s Web site at www.delawareinvestments.com; and (ii) on the SEC’s Web site at www.sec.gov. |
Annual report Delaware High-Yield Opportunities Fund July 31, 2010 Fixed income mutual fund |
This annual report is for the information of Delaware High-Yield Opportunities Fund shareholders, but it may be used with prospective investors when preceded or accompanied by a current prospectus for Delaware High-Yield Opportunities Fund. The figures in the annual report for Delaware High-Yield Opportunities Fund represent past results, which are not a guarantee of future results. The return and principal value of an investment in the Fund will fluctuate so that shares, when redeemed, may be worth more or less than their original cost. Current performance may be higher or lower than the performance data quoted.
You should consider the investment objectives, risks, charges, and expenses of the Fund carefully before investing. The Delaware High-Yield Opportunities Fund prospectus contains this and other important information about the Fund. Prospectuses for all open-end funds in the Delaware Investments® Family of Funds are available from your financial advisor, online at www.delawareinvestments.com, or by phone at 800 523-1918. Please read the prospectus carefully before you invest or send money.
|
You can obtain shareholder reports and prospectuses online instead of in the mail.
Visit www.delawareinvestments.com/edelivery. |
Experience Delaware Investments
Delaware Investments is committed to the pursuit of consistently superior asset management and unparalleled client service. We believe in our investment processes, which seek to deliver consistent results, and in convenient services that help add value for our clients.
If you are interested in learning more about creating an investment plan, contact your financial advisor.
You can learn more about Delaware Investments or obtain a prospectus for Delaware High-Yield Opportunities Fund at www.delawareinvestments.com.
Manage your investments online
- 24-hour access to your account information
- Obtain share prices
- Check your account balance and recent transactions
- Request statements or literature
- Make purchases and redemptions
Delaware Management Holdings, Inc., and its subsidiaries (collectively known by the marketing name of Delaware Investments) are wholly owned subsidiaries of Macquarie Group Limited, a global provider of banking, financial, advisory, investment and funds management services.
Investments in Delaware High-Yield Opportunities Fund are not and will not be deposits with or liabilities of Macquarie Bank Limited ABN 46 008 583 542 and its holding companies, including their subsidiaries or related companies (Macquarie Group), and are subject to investment risk, including possible delays in repayment and loss of income and capital invested. No Macquarie Group company guarantees or will guarantee the performance of the Fund, the repayment of capital from the Fund, or any particular rate of return.
| Table of contents | |
| Portfolio management review | 1 |
| Performance summary | 4 |
| Disclosure of Fund expenses | 8 |
| Security type | 10 |
| Statement of net assets | 11 |
| Statement of operations | 23 |
| Statements of changes in net assets | 24 |
| Financial highlights | 26 |
| Notes to financial statements | 36 |
| Report of independent registered | |
| public accounting firm | 50 |
| Other Fund information | 51 |
| Board of trustees/directors and | |
| officers addendum | 54 |
| About the organization | 64 |
Unless otherwise noted, views expressed herein are current as of July 31, 2010, and are subject to change.
Funds are not FDIC insured and are not guaranteed. It is possible to lose the principal amount invested.
Mutual fund advisory services provided by Delaware Management Company, a series of Delaware Management Business Trust, which is a registered investment advisor. Delaware Investments, a member of Macquarie Group, refers to Delaware Management Holdings, Inc. and its subsidiaries, including the Fund’s distributor, Delaware Distributors, L.P. Macquarie Group refers to Macquarie Group Limited and its subsidiaries and affiliates worldwide.
© 2010 Delaware Management Holdings, Inc.
All third-party trademarks cited are the property of their respective owners.
| Portfolio management review | |
| Delaware High-Yield Opportunities Fund | Aug. 10, 2010 |
| Performance preview (for the period ended July 31, 2010) | | |
| Delaware High-Yield Opportunities Fund (Class A shares) | 1-year return | | +22.30% |
| BofA Merrill Lynch U.S. High Yield Constrained Index (benchmark) | 1-year return | | +24.24% |
| (formerly, the Merrill Lynch U.S. High Yield Master II Constrained Index) | | | |
Past performance does not guarantee future results.
For complete, annualized performance for Delaware High-Yield Opportunities Fund, please see the table on page 4. The performance of Class A shares excludes the applicable sales charge and reflects the reinvestment of all distributions. Index performance returns do not reflect any management fees, transaction costs, or expenses. Indices are unmanaged and one cannot invest directly in an index.
As the Fund’s fiscal year began on Aug. 1, 2009, the U.S. economy was in the early stages of recovering from the worst recession since the 1930s. While high yield bonds usually underperform Treasurys during economic downturns, the near-panic conditions that infected risk markets during the global financial crisis had caused credit spreads (the yield differential between government and corporate bonds of similar maturities) to widen to virtually unprecedented levels (as yields rise, prices decline). Spreads eventually moderated as financial conditions improved, sparking strong rallies in the high yield sector. We believe favorable sentiment toward fixed income in general was aided by the sovereign debt crisis in the euro zone, attempts by the Chinese government to cool its overheated property sector, and by fears of a double-dip recession in major industrialized economies. It seems as though investors felt those factors implied an ext ended period of low interest rates while virtually eliminating inflation as an immediate threat.
Not surprisingly, default rates among high yield bonds rose sharply as economic conditions worsened. By one measure, defaults peaked at about 10% during the fourth quarter of 2009. Still, defaults never soared to the stratospheric levels
| As the Fund’s fiscal year ended, the U.S. economy was experiencing a significant deceleration in activity. Though we do not expect the slowdown to lead to another recession, there is clearly a “disconnect” between the finances of households, many which are still deleveraging, and those of corporations, which, generally speaking, undertook strong measures earlier in the economic cycle and are now reaping the benefits. |
1
Portfolio management review
Delaware High-Yield Opportunities Fund
that many investors had once feared, because most companies had gone into full survival mode as the recession deepened. With new issuance at a virtual standstill during the credit crunch — thus cutting off fresh sources of capital — businesses were generally forced to cut expenses to the bone. The repair of corporate finances received a further boost as the new-issuance market revived, allowing companies to pay down or refinance their debt. The ensuing rebound in corporate profitability — and the accompanying drop in default rates to around 3% by the end of the fiscal year — reflected major fortifications to company balance sheets. Still, the rally in high yield stalled during the second quarter of 2010, as macroeconomic fears trumped what we viewed as still-attractive valuations among speculative-grade bonds. (Source: Bloomberg.)
Fund performance
For its fiscal year ended July 31, 2010, Delaware High-Yield Opportunities Fund returned +22.30% for Class A shares at net asset value and +16.72% at maximum offer price. Both figures reflect all distributions reinvested. During the same period, the Fund’s benchmark, the BofA Merrill Lynch U.S. High Yield Constrained Index, advanced 24.24%. For complete, annualized performance of the Delaware High-Yield Opportunities Fund, please see the table on page 4.
At the beginning of the Fund’s fiscal year, we sought to position the Fund to benefit from the potential for “snap-back rallies” in sectors that we believed had sustained the most damage during the preceding selloff. Specifically, we had taken large overweight positions in CCC and B-rated bonds from economically sensitive cyclical sectors such as basic materials. Meanwhile, we underweighted higher-rated BB securities and bonds from defensive industries such as energy, healthcare, and utilities. Those credit and sector allocation decisions contributed to the Fund’s relative performance, since total returns from lower-rated credits beat their higher-quality cousins by a wide margin during the period. Notably, the outperformance of lower-quality speculative debt during the Fund’s fiscal year contrasted the pattern over the previous fiscal year, when bonds from the more “conservative” high yield sectors suffered the smallest losses during the market meltdown.
In our view, performing highly detailed, bottom-up credit research remained vital to the process of seeking opportunities among lower-rated securities. Though we were overweight CCC bonds during the entire fiscal year, we identified several issuers from that category (Nuveen Investments, MacDermid, Burlington Coat Factory, among others) that our analysis flagged as improperly rated. In a typical recession, it has been our experience that ratings agencies often apply a broad brush and quickly downgrade large amounts of debt, causing those bonds to lag. Once a recovery begins, ratings agencies are typically slower to issue upgrades as conditions improve. Normally, the CCC sector (the most speculative area of the high yield market) is the last to be rerated. In performing our own credit rating analyses, we found several companies that were rated CCC by the credit rating agencies had made significant improvements to their balance sheets and appeared to deserve a higher rating. As that rerating process played out, several of those bonds tended to outperform.
2
The Fund’s relative performance also benefited from what we believe was a rare opportunity to buy the junior debt of large banks, including Wells Fargo, J.P. Morgan, and Bank of America. Historically, the high yield sector has lacked any banking component; however, in the aftermath of the credit crisis, several major financial institutions issued BB-rated hybrid securities that carried what we viewed as compelling yields, especially considering they were issued by banks that enjoyed global franchises whose senior debt was rated investment grade. Our allocation to the freshly minted high yield banking sector returned 30% versus 24% for the Fund’s benchmark index during the Fund’s fiscal year.
Meanwhile, two allocation decisions detracted from relative performance. We retained an approximate 300 basis point overweight to telecommunications companies, including MetroPCS Communications and Leap Wireless. Telecommunications lagged the benchmark through the fiscal year, in large part because the sector was seemingly deemed too conservative in an environment that favored speculative debt. The Fund also sustained some underperformance by underweighting debt of insurance and real estate companies, both of which were viewed as distressed industries that had become generally oversold during the r ecession.
Outlook
As the Fund’s fiscal year ended, the U.S. economy was experiencing a significant deceleration in economic activity. Though we do not expect the slowdown to lead to another recession, there is clearly a “disconnect” between the finances of households, many which are still deleveraging, and those of corporations, which, generally speaking, undertook strong measures earlier in the economic cycle and are now reaping the benefits.
Accordingly, we think the high yield market has the potential to perform reasonably well in the near future even if consumer spending is slow to bounce back, which we believe is likely. Corporate cash flows have improved, the new-issuance market is vibrant, and out-of-court restructurings could continue to avert significant defaults. In fact, we recently lowered our default projection for high yield bonds in 2010 from 5% to 3%. Though the high yield market sustained an outflow of funds late in the Fund’s fiscal year, the resulting widening of credit spreads could actually make the sector more attractive over the long term, assuming economic conditions gradually stabilize. The main risk to our relatively optimistic outlook for the high yield market lies in the potential for a freeze in liquidity and new issuance if the macroeconomic environment deteriorates.
As always, independent, company-specific credit research that seeks to identify market inefficiencies could be critical to generating strong relative performance.
3
| Performance summary | |
| Delaware High-Yield Opportunities Fund | July 31, 2010 |
The performance data quoted represent past performance; past performance does not guarantee future results. Investment return and principal value will fluctuate so your shares, when redeemed, may be worth more or less than their original cost. Please obtain the performance data current for the most recent month end by calling 800 523-1918 or visiting our Web site at www.delawareinvestments.com/performance. Current performance may be lower or higher than the performance data quoted.
You should consider the investment objectives, risks, charges, and expenses of the investment company carefully before investing. The Delaware High-Yield Opportunities Fund prospectus contains this and other important information about the investment company. Please request a prospectus through your financial advisor or by calling 800 523-1918 or visiting our Web site at www.delawareinvestments.com. Read the prospectus carefully before you invest or send money.
| Fund performance | | Average annual total returns through July 31, 2010 |
| | | 1 year | | 5 years | | 10 years | | Lifetime |
| Class A (Est. Dec. 30, 1996) | | | | | | | | | | | | |
| Excluding sales charge | | +22.30 | % | | +6.62 | % | | +6.95 | % | | n/a | |
| Including sales charge | | +16.72 | % | | +5.62 | % | | +6.46 | % | | n/a | |
| Class B (Est. Feb. 17, 1998) | | | | | | | | | | | | |
| Excluding sales charge | | +21.46 | % | | +5.88 | % | | +6.32 | % | | n/a | |
| Including sales charge | | +17.46 | % | | +5.66 | % | | +6.32 | % | | n/a | |
| Class C (Est. Feb. 17, 1998) | | | | | | | | | | | | |
| Excluding sales charge | | +21.75 | % | | +5.92 | % | | +6.22 | % | | n/a | |
| Including sales charge | | +20.75 | % | | +5.92 | % | | +6.22 | % | | n/a | |
| Class R (Est. June 2, 2003) | | | | | | | | | | | | |
| Excluding sales charge | | +22.01 | % | | +6.40 | % | | n/a | | | +8.28 | % |
| Including sales charge | | +22.01 | % | | +6.40 | % | | n/a | | | +8.28 | % |
| Institutional Class (Est. Dec. 30, 1996) | | | | | | | | | | | | |
| Excluding sales charge | | +22.65 | % | | +6.94 | % | | +7.28 | % | | n/a | |
| Including sales charge | | +22.65 | % | | +6.94 | % | | +7.28 | % | | n/a | |
Returns reflect the reinvestment of all distributions and any applicable sales charges as noted in the following paragraphs.
Performance for Class B and C shares, excluding sales charges, assumes either that contingent deferred sales charges did not apply or that the investment was not redeemed.
Expense limitations were in effect for certain classes during the periods shown in the “Fund performance” chart and in the “Performance of a $10,000 investment” chart. The current expenses for each class are listed on the “Fund expense ratios” chart. (Note that all charts and graphs referred to in the “Performance summary” section of this report are found on pages 4 through 7.) Performance would have been lower had the expense limitations not been in effect.
4
The Fund offers Class A, B, C, R, and Institutional Class shares.
Class A shares are sold with a maximum front-end sales charge of up to 4.50%, and have an annual distribution and service fee of up to 0.30% of average daily net assets.
The Board of Trustees has adopted a formula for calculating 12b-1 fees for the Fund’s Class A shares that went into effect on June 1, 1992. The total 12b-1 fees to be paid by Class A shareholders of the Fund is the sum of 0.10% of the average daily net assets representing shares that were acquired prior to June 1, 1992, and 0.30% of the average daily net assets representing shares that were acquired on or after June 1, 1992. All Class A shareholders bear 12b-1 fees at the same rate, the blended rate based upon the allocation of the 0.10% and 0.30% rates described above.
Class B shares may only be purchased through dividend reinvestment and certain permitted exchanges as described in the prospectus. Please see the prospectus for additional information on Class B purchase and sales charges. Class B shares have a contingent deferred sales charge that declines from 4.00% to zero depending on the period of time the shares are held.
Class B shares will automatically convert to Class A shares on a quarterly basis approximately eight years after purchase. They are also subject to an annual distribution and service fee of up to 1.00% of average daily net assets.
Ten-year performance figures for Class B shares reflect conversion to Class A shares after approximately eight years.
Class C shares are sold with a contingent deferred sales charge of 1.00% if redeemed during the first 12 months. They are also subject to an annual distribution and service fee of up to 1.00% of average daily net assets.
Class R shares are available only for certain retirement plan products. They are sold without a sales charge and have an annual distribution and service fee of up to 0.60% of average daily net assets, which has been limited contractually to 0.50% from Dec. 1, 2009, through Nov. 30, 2010.
Institutional Class shares are available without sales or asset-based distribution charges only to certain eligible institutional accounts.
The “Fund performance” table and the “Performance of a $10,000 investment” graph do not reflect the deduction of taxes the shareholder would pay on Fund distributions or redemptions of Fund shares.
Instances of high double-digit returns are unusual, cannot be sustained, and were primarily achieved during favorable market conditions.
Fixed income securities and bond funds can lose value, and investors can lose principal, as interest rates rise. They also may be affected by economic conditions that hinder an issuer’s ability to make interest and principal payments on its debt.
The Fund may also be subject to prepayment risk, the risk that the principal of a fixed income security that is held by the Fund may be prepaid prior to maturity, potentially forcing the Fund to reinvest that money at a lower interest rate.
High yielding, noninvestment grade bonds (junk bonds) involve higher risk than investment grade bonds. The high yield secondary market is particularly susceptible to liquidity problems when institutional investors, such as mutual funds and certain other financial institutions, temporarily stop
5
Performance summary
Delaware High-Yield Opportunities Fund
buying bonds for regulatory, financial, or other reasons. In addition, a less liquid secondary market makes it more difficult for the Fund to obtain precise valuations of the high yield securities in its portfolio.
The Fund may experience portfolio turnover in excess of 100%, which could result in higher transaction costs and tax liability.
The Fund may invest in derivatives, which may involve additional expenses and are subject to risk, including the risk that an underlying security or securities index moves in the opposite direction from what the portfolio manager anticipated. A derivative transaction depends upon the counterparties’ ability to fulfill their contractual obligations.
International investments entail risks not ordinarily associated with U.S. investments including fluctuation in currency values, differences in accounting principles, or economic or political instability in other nations. Investing in emerging markets can be riskier than investing in established foreign markets due to increased volatility and lower trading volume.
The Fund’s expense ratios, as described in the most recent prospectus, are disclosed in the following “Fund expense ratios” chart. Delaware Investments has agreed to (1) voluntarily waive all or a portion of its investment advisory fees and/or reimburse certain expenses (excluding certain expenses) to prevent total annual fund operating expenses from exceeding 0.81% of the Fund’s average daily net assets from Dec. 1, 2009, until the voluntary cap is discontinued; and (2) contractually limit the Class R shares distribution and service fees from Dec. 1, 2009, through Nov. 30, 2010, to 0.50%. Please see the most recent prospectus and any applicable supplement(s) for additional information on these fee waivers and/or reimbursements.
| Fund expense ratios | | Class A | | Class B | | Class C | | Class R | | Institutional Class |
| Total annual operating expenses | | 1.37% | | 2.07% | | 2.07% | | 1.67% | | 1.07% |
| (without fee waivers) | | | | | | | | | | |
| Net expenses | | 1.37% | | 2.07% | | 2.07% | | 1.57% | | 1.07% |
| (including fee waivers, if any) | | | | | | | | | | |
| Type of waiver | | Contractual | | Voluntary | | Voluntary | | Contractual | | Voluntary |
| | | and | | | | | | and | | |
| | | voluntary | | | | | | voluntary | | |
6
Performance of a $10,000 investment
Average annual total returns from July 31, 2000, through July 31, 2010
| For period beginning July 31, 2000, through July 31, 2010 | Starting value | Ending value |
| | BofA Merrill Lynch U.S. High Yield | $10,000 | $20,753 |
| | | Constrained Index | | |
| | Delaware High-Yield Opportunities Fund — | $9,550 | $18,665 |
| | | Class A shares | | |
The chart assumes $10,000 invested in the Fund on July 31, 2000, and includes the effect of a 4.50% front-end sales charge and the reinvestment of all distributions. Please note additional details on these fees in the “Performance summary” section of this report, which includes pages 4 through 7.
The chart also assumes $10,000 invested in the BofA Merrill Lynch U.S. High Yield Constrained Index as of July 31, 2000.
The BofA Merrill Lynch U.S. High Yield Constrained Index, formerly the Merrill Lynch U.S. High Yield Master II Constrained Index, tracks the performance of U.S. dollar–denominated high yield corporate debt publicly issued in the U.S. domestic market, but caps individual issuer exposure at 2% of the benchmark.
Index performance returns do not reflect any management fees, transaction costs or expenses. Indices are unmanaged and one cannot invest directly in an index. Past performance is not a guarantee of future results.
Performance of other Fund classes will vary due to different charges and expenses.
The “Fund performance” chart and the “Performance of a $10,000 investment” graph do not reflect the deduction of taxes shareholders would pay on Fund distributions or redemptions of Fund shares.
| | | Nasdaq symbols | | CUSIPs | |
| Class A | | | DHOAX | | | 245908876 | |
| Class B | | | DHOBX | | | 245908868 | |
| Class C | | | DHOCX | | | 245908850 | |
| Class R | | | DHIRX | | | 245908736 | |
| Institutional Class | | | DHOIX | | | 245908843 | |
7
Disclosure of Fund expenses
For the six-month period February 1, 2010 to July 31, 2010
As a shareholder of the Fund, you incur two types of costs: (1) transaction costs, including sales charges (loads) on purchase payments, reinvested dividends, or other distributions; redemption fees; and exchange fees; and (2) ongoing costs, including management fees; distribution and/or service (12b-1) fees; and other Fund expenses. This example is intended to help you understand your ongoing costs (in dollars) of investing in the Fund and to compare these costs with the ongoing costs of investing in other mutual funds.
The example is based on an investment of $1,000 invested at the beginning of the period and held for the entire six-month period from February 1, 2010 to July 31, 2010.
Actual expenses
The first section of the table shown, “Actual Fund return,” provides information about actual account values and actual expenses. You may use the information in this section of the table, together with the amount you invested, to estimate the expenses that you paid over the period. Simply divide your account value by $1,000 (for example, an $8,600 account value divided by $1,000 = 8.6), then multiply the result by the number in the first section under the heading entitled “Expenses Paid During Period” to estimate the expenses you paid on your account during this period.
Hypothetical example for comparison purposes
The second section of the table shown, “Hypothetical 5% return,” provides information about hypothetical account values and hypothetical expenses based on the Fund’s actual expense ratio and an assumed rate of return of 5% per year before expenses, which is not the Fund’s actual return. The hypothetical account values and expenses may not be used to estimate the actual ending account balance or expenses you paid for the period. You may use this information to compare the ongoing costs of investing in the Fund and other funds. To do so, compare this 5% hypothetical example with the 5% hypothetical examples that appear in the shareholder reports of the other funds.
Please note that the expenses shown in the table are meant to highlight your ongoing costs only and do not reflect any transactional costs, such as sales charges (loads), redemption fees, or exchange fees. Therefore, the second section of the table is useful in comparing ongoing costs only, and will not help you determine the relative total costs of owning different funds. In addition, if these transactional costs were included, your costs would have been higher. The Fund’s expenses shown in the table reflect fee waivers in effect. The expenses shown in the table assume reinvestment of all dividends and distributions.
8
Delaware High-Yield Opportunities Fund
Expense analysis of an investment of $1,000
| | | Beginning | | Ending | | | | Expenses |
| | | Account Value | | Account Value | | Annualized | | Paid During Period |
| | | 2/1/10 | | 7/31/10 | | Expense Ratios | | 2/1/10 to 7/31/10* |
| Actual Fund return | | | | | | | | | | | | | | |
| Class A | | | $ | 1,000.00 | | | | $ | 1,067.10 | | | 1.11% | | $5.69 |
| Class B | | | | 1,000.00 | | | | | 1,063.50 | | | 1.81% | | 9.26 |
| Class C | | | | 1,000.00 | | | | | 1,066.10 | | | 1.81% | | 9.27 |
| Class R | | | | 1,000.00 | | | | | 1,066.00 | | | 1.31% | | 6.71 |
| Institutional Class | | | | 1,000.00 | | | | | 1,068.70 | | | 0.81% | | 4.15 |
| Hypothetical 5% return (5% return before expenses) | | | | | |
| Class A | | | $ | 1,000.00 | | | | $ | 1,019.29 | | | 1.11% | | $5.56 |
| Class B | | | | 1,000.00 | | | | | 1,015.82 | | | 1.81% | | 9.05 |
| Class C | | | | 1,000.00 | | | | | 1,015.82 | | | 1.81% | | 9.05 |
| Class R | | | | 1,000.00 | | | | | 1,018.30 | | | 1.31% | | 6.56 |
| Institutional Class | | | | 1,000.00 | | | | | 1,020.78 | | | 0.81% | | 4.06 |
| * | “Expenses Paid During Period” are equal to the Fund’s annualized expense ratio, multiplied by the average account value over the period, multiplied by 181/365 (to reflect the one-half year period). |
9
| Security type | |
| Delaware High-Yield Opportunities Fund | As of July 31, 2010 |
Sector designations may be different than the sector designations presented in other Fund materials. The sector designations may represent the investment manager’s internal sector classifications, which may result in the sector designations for one fund being different than another fund’s sector designations.
| Security type | Percentage of net assets |
| Convertible Bonds | 0.96 | % |
| Corporate Bonds | 94.17 | % |
| Basic Industry | 8.69 | % |
| Brokerage | 2.02 | % |
| Capital Goods | 6.54 | % |
| Consumer Cyclical | 10.83 | % |
| Consumer Non-Cyclical | 9.03 | % |
| Energy | 11.76 | % |
| Finance & Investments | 6.24 | % |
| Media | 7.77 | % |
| Real Estate | 0.43 | % |
| Services Cyclical | 8.68 | % |
| Services Non-Cyclical | 2.84 | % |
| Technology & Electronics | 3.65 | % |
| Telecommunications | 13.04 | % |
| Utilities | 2.65 | % |
| Senior Secured Loans | 0.96 | % |
| Common Stock | 0.47 | % |
| Preferred Stock | 0.50 | % |
| Warrants | 0.00 | % |
| Discount Note | 0.99 | % |
| Securities Lending Collateral | 5.68 | % |
| Total Value of Securities | 103.73 | % |
| Obligation to Return Securities Lending Collateral | (5.80 | %) |
| Receivables and Other Assets Net of Liabilities | 2.07 | % |
| Total Net Assets | 100.00 | % |
10
| Statement of net assets | |
| Delaware High-Yield Opportunities Fund | July 31, 2010 |
| | | Principal | | |
| | | amount (U.S. $) | | Value (U.S. $) |
| Convertible Bonds – 0.96% | | | | | | | |
| * | Leap Wireless International 4.50% | | | | | | | |
| | exercise price $93.21, expiration date 7/15/24 | | $ | 1,403,000 | | | $ | 1,217,102 |
| | Live Nation Entertainment 2.875% | | | | | | | |
| | exercise price $27.15, expiration date 7/15/27 | | | 1,365,000 | | | | 1,151,719 |
| † | Mirant (Escrow) 2.50% | | | | | | | |
| | exercise price $67.95, expiration date 6/15/21 | | | 1,685,000 | | | | 0 |
| | Standard Pacific 6.00% | | | | | | | |
| | exercise price $8.37, expiration date 10/1/12 | | | 2,010,000 | | | | 1,999,950 |
| Total Convertible Bonds (cost $4,259,368) | | | | | | | 4,368,771 |
| | | | | | | | |
| Corporate Bonds – 94.17% | | | | | | | |
| Basic Industry – 8.69% | | | | | | | |
| * | AK Steel 7.625% 5/15/20 | | | 2,074,000 | | | | 2,092,148 |
| # | Algoma Acquisition 144A 9.875% 6/15/15 | | | 2,408,000 | | | | 2,137,100 |
| *# | Appleton Papers 144A 10.50% 6/15/15 | | | 1,879,000 | | | | 1,869,605 |
| | Century Aluminum 8.00% 5/15/14 | | | 1,849,500 | | | | 1,794,200 |
| # | Essar Steel Algoma 144A 9.375% 3/15/15 | | | 250,000 | | | | 241,563 |
| # | FMG Finance 144A 10.625% 9/1/16 | | | 4,199,000 | | | | 4,807,854 |
| * | Hexion US Finance 9.75% 11/15/14 | | | 2,826,000 | | | | 2,829,532 |
| | Lyondell Chemical 11.00% 5/1/18 | | | 2,300,000 | | | | 2,486,874 |
| # | MacDermid 144A 9.50% 4/15/17 | | | 4,331,000 | | | | 4,460,929 |
| | Millar Western Forest Products 7.75% 11/15/13 | | | 2,436,000 | | | | 2,155,860 |
| | NewPage | | | | | | | |
| | 11.375% 12/31/14 | | | 192,000 | | | | 178,800 |
| | #144A 11.375% 12/31/14 | | | 2,075,000 | | | | 1,932,344 |
| • | Noranda Aluminium Acquisition PIK 5.373% 5/15/15 | | | 1,499,747 | | | | 1,196,048 |
| | Novelis | | | | | | | |
| | 7.25% 2/15/15 | | | 1,007,000 | | | | 1,034,693 |
| | 11.50% 2/15/15 | | | 957,000 | | | | 1,081,410 |
| # | PE Paper Escrow 144A 12.00% 8/1/14 | | | 1,055,000 | | | | 1,188,776 |
| @= | Port Townsend 7.32% 8/27/12 | | | 962,902 | | | | 698,104 |
| | Ryerson | | | | | | | |
| | •7.719% 11/1/14 | | | 932,000 | | | | 872,585 |
| | 12.00% 11/1/15 | | | 2,159,000 | | | | 2,272,348 |
| # | Steel Dynamics 144A 7.625% 3/15/20 | | | 1,720,000 | | | | 1,769,450 |
| | Teck Resources 10.25% 5/15/16 | | | 484,000 | | | | 586,300 |
| * | Verso Paper Holdings 11.375% 8/1/16 | | | 2,129,000 | | | | 1,974,648 |
| | | | | | | | | 39,661,171 |
11
Statement of net assets
Delaware High-Yield Opportunities Fund
| | | Principal | | | |
| | | amount (U.S. $) | | Value (U.S. $) |
| Corporate Bonds (continued) | | | | | | | |
| Brokerage – 2.02% | | | | | | | |
| # | Cemex Finance 144A 9.50% 12/14/16 | | $ | 2,130,000 | | | $ | 2,082,075 |
| | E Trade Financial PIK 12.50% 11/30/17 | | | 4,114,000 | | | | 4,648,820 |
| # | Penson Worldwide 144A 12.50% 5/15/17 | | | 2,492,000 | | | | 2,479,540 |
| | | | | | | | | 9,210,435 |
| Capital Goods – 6.54% | | | | | | | |
| | Casella Waste Systems | | | | | | | |
| | 9.75% 2/1/13 | | | 2,142,000 | | | | 2,158,065 |
| | 11.00% 7/15/14 | | | 1,286,000 | | | | 1,409,778 |
| # | Cemex Espana Luxembourg 144A 9.25% 5/12/20 | | | 1,605,000 | | | | 1,448,513 |
| # | DAE Aviation Holdings 144A 11.25% 8/1/15 | | | 2,064,000 | | | | 2,074,320 |
| # | DynCorp International 144A 10.375% 7/1/17 | | | 1,080,000 | | | | 1,121,850 |
| | Intertape Polymer 8.50% 8/1/14 | | | 1,266,000 | | | | 1,031,790 |
| * | Manitowoc 9.50% 2/15/18 | | | 2,218,000 | | | | 2,273,450 |
| # | Plastipak Holdings 144A 10.625% 8/15/19 | | | 912,000 | | | | 1,028,280 |
| | Ply Gem Industries 13.125% 7/15/14 | | | 2,502,000 | | | | 2,589,569 |
| | Pregis 12.375% 10/15/13 | | | 4,617,000 | | | | 4,588,143 |
| * | RBS Global/Rexnord 11.75% 8/1/16 | | | 2,174,000 | | | | 2,337,050 |
| | Solo Cup 8.50% 2/15/14 | | | 1,208,000 | | | | 1,099,280 |
| # | Susser Holdings/Finance 144A 8.50% 5/15/16 | | | 2,203,000 | | | | 2,291,120 |
| | Thermadyne Holdings 10.50% 2/1/14 | | | 2,252,000 | | | | 2,291,410 |
| # | Trimas 144A 9.75% 12/15/17 | | | 1,662,000 | | | | 1,705,628 |
| # | USG 144A 9.75% 8/1/14 | | | 397,000 | | | | 416,850 |
| | | | | | | | | 29,865,096 |
| Consumer Cyclical – 10.83% | | | | | | | |
| *# | Allison Transmission 144A 11.00% 11/1/15 | | | 2,567,000 | | | | 2,772,360 |
| * | American Axle & Manufacturing 7.875% 3/1/17 | | | 3,334,000 | | | | 3,117,290 |
| | Ames True Temper 10.00% 7/15/12 | | | 1,466,000 | | | | 1,476,995 |
| | ArvinMeritor | | | | | | | |
| | *8.125% 9/15/15 | | | 2,240,000 | | | | 2,262,400 |
| | 10.625% 3/15/18 | | | 1,291,000 | | | | 1,413,645 |
| | Beazer Homes USA | | | | | | | |
| | 8.125% 6/15/16 | | | 1,710,000 | | | | 1,543,275 |
| | 9.125% 6/15/18 | | | 803,000 | | | | 734,745 |
| | Burlington Coat Factory Investment Holdings | | | | | | | |
| | 14.50% 10/15/14 | | | 4,272,000 | | | | 4,613,759 |
| *# | CKE Restaurants 144A 11.375% 7/15/18 | | | 2,190,000 | | | | 2,239,275 |
| * | Ford Motor 7.45% 7/16/31 | | | 3,768,000 | | | | 3,673,800 |
12
| | | Principal | | | |
| | | amount (U.S. $) | | Value (U.S. $) |
| Corporate Bonds (continued) | | | | | | | |
| Consumer Cyclical (continued) | | | | | | | |
| | Ford Motor Credit 12.00% 5/15/15 | | $ | 2,875,000 | | | $ | 3,425,054 |
| # | Games Merger 144A 11.00% 6/1/18 | | | 2,084,000 | | | | 2,167,360 |
| | GMAC 8.00% 12/31/18 | | | 2,343,000 | | | | 2,287,354 |
| | Interface | | | | | | | |
| | 9.50% 2/1/14 | | | 195,000 | | | | 202,069 |
| | 11.375% 11/1/13 | | | 674,000 | | | | 764,990 |
| | K Hovnanian Enterprises | | | | | | | |
| | 6.25% 1/15/15 | | | 2,046,000 | | | | 1,554,960 |
| | 7.50% 5/15/16 | | | 941,000 | | | | 668,110 |
| | Landry’s Restaurants 11.625% 12/1/15 | | | 2,976,000 | | | | 3,199,200 |
| | M/I Homes 6.875% 4/1/12 | | | 975,000 | | | | 972,563 |
| | Norcraft Finance 10.50% 12/15/15 | | | 1,472,000 | | | | 1,552,960 |
| | Norcraft Holdings/Capital 9.75% 9/1/12 | | | 1,928,000 | | | | 1,814,730 |
| * | OSI Restaurant Partners 10.00% 6/15/15 | | | 1,578,000 | | | | 1,542,495 |
| | Quiksilver 6.875% 4/15/15 | | | 3,340,000 | | | | 3,156,300 |
| * | Rite Aid 9.375% 12/15/15 | | | 1,374,000 | | | | 1,157,595 |
| | Standard Pacific 10.75% 9/15/16 | | | 1,051,000 | | | | 1,135,080 |
| | | | | | | | | 49,448,364 |
| Consumer Non-Cyclical – 9.03% | | | | | | | |
| | Accellent 10.50% 12/1/13 | | | 1,467,000 | | | | 1,485,338 |
| | Alere 9.00% 5/15/16 | | | 1,357,000 | | | | 1,384,140 |
| # | Alion Science & Technology PIK 144A 12.00% 11/1/14 | | | 1,808,980 | | | | 1,790,890 |
| | Alliance One International 10.00% 7/15/16 | | | 1,849,000 | | | | 1,920,649 |
| | Bausch & Lomb 9.875% 11/1/15 | | | 1,081,000 | | | | 1,145,860 |
| # | BioScrip 144A 10.25% 10/1/15 | | | 2,248,000 | | | | 2,292,960 |
| # | Cott Beverages 144A 8.375% 11/15/17 | | | 1,271,000 | | | | 1,318,663 |
| | Dean Foods | | | | | | | |
| | 6.90% 10/15/17 | | | 375,000 | | | | 348,281 |
| | 7.00% 6/1/16 | | | 1,346,000 | | | | 1,295,525 |
| | DJO Finance 11.75% 11/15/14 | | | 2,817,000 | | | | 2,971,935 |
| # | JohnsonDiversey Holdings 144A 10.50% 5/15/20 | | | 4,804,509 | | | | 5,381,049 |
| # | Lantheus Medical Imaging 144A 9.75% 5/15/17 | | | 1,300,000 | | | | 1,326,000 |
| | LVB Acquisition 11.625% 10/15/17 | | | 2,041,000 | | | | 2,298,676 |
| # | Novasep Holding 144A 9.75% 12/15/16 | | | 2,115,000 | | | | 1,914,075 |
| | Pinnacle Foods Finance 10.625% 4/1/17 | | | 1,670,000 | | | | 1,791,075 |
| # | Quintiles Transnational PIK 144A 9.50% 12/30/14 | | | 992,000 | | | | 1,016,800 |
| # | ServiceMaster PIK 144A 10.75% 7/15/15 | | | 1,987,000 | | | | 2,093,801 |
| | Smithfield Foods 7.75% 7/1/17 | | | 1,731,000 | | | | 1,698,544 |
13
Statement of net assets
Delaware High-Yield Opportunities Fund
| | | Principal | | | |
| | | amount (U.S. $) | | Value (U.S. $) |
| Corporate Bonds (continued) | | | | | | | |
| Consumer Non-Cyclical (continued) | | | | | | | |
| # | Tops Markets 144A 10.125% 10/15/15 | | $ | 1,954,000 | | | $ | 2,081,010 |
| | Universal Hospital Services PIK 8.50% 6/1/15 | | | 864,000 | | | | 879,120 |
| # | Viskase 144A 9.875% 1/15/18 | | | 2,555,000 | | | | 2,606,100 |
| * | Yankee Acquisition 9.75% 2/15/17 | | | 2,073,000 | | | | 2,166,285 |
| | | | | | | | | 41,206,776 |
| Energy – 11.76% | | | | | | | |
| # | American Petroleum Tankers 144A 10.25% 5/1/15 | | | 2,289,000 | | | | 2,300,445 |
| | Antero Resources Finance 9.375% 12/1/17 | | | 1,586,000 | | | | 1,661,335 |
| # | Aquilex Holdings 144A 11.125% 12/15/16 | | | 2,085,000 | | | | 2,157,975 |
| | Chesapeake Energy | | | | | | | |
| | 7.25% 12/15/18 | | | 175,000 | | | | 185,938 |
| | 9.50% 2/15/15 | | | 1,226,000 | | | | 1,382,315 |
| | Complete Production Service 8.00% 12/15/16 | | | 1,112,000 | | | | 1,131,460 |
| | Copano Energy 7.75% 6/1/18 | | | 1,008,000 | | | | 1,028,160 |
| * | Crosstex Energy/Finance 8.875% 2/15/18 | | | 1,785,000 | | | | 1,874,250 |
| # | Drummond 144A 9.00% 10/15/14 | | | 1,999,000 | | | | 2,118,940 |
| # | Global Geophysical Services 144A 10.50% 5/1/17 | | | 1,052,000 | | | | 1,046,740 |
| | Headwaters 11.375% 11/1/14 | | | 2,016,000 | | | | 2,056,320 |
| # | Helix Energy Solutions Group 144A 9.50% 1/15/16 | | | 2,935,000 | | | | 2,861,625 |
| # | Hercules Offshore 144A 10.50% 10/15/17 | | | 2,232,000 | | | | 2,008,800 |
| # | Hilcorp Energy I 144A 8.00% 2/15/20 | | | 2,487,000 | | | | 2,574,045 |
| | Holly 9.875% 6/15/17 | | | 1,677,000 | | | | 1,754,561 |
| | International Coal Group 9.125% 4/1/18 | | | 2,213,000 | | | | 2,307,053 |
| * | Key Energy Services 8.375% 12/1/14 | | | 1,863,000 | | | | 1,928,205 |
| # | Linn Energy/Finance 144A 8.625% 4/15/20 | | | 1,999,000 | | | | 2,133,933 |
| # | Murray Energy 144A 10.25% 10/15/15 | | | 2,185,000 | | | | 2,272,400 |
| # | NFR Energy/Finance 144A 9.75% 2/15/17 | | | 2,472,000 | | | | 2,533,800 |
| | OPTI Canada | | | | | | | |
| | 7.875% 12/15/14 | | | 1,897,000 | | | | 1,650,390 |
| | 8.25% 12/15/14 | | | 2,581,000 | | | | 2,255,149 |
| | PetroHawk Energy | | | | | | | |
| | 7.875% 6/1/15 | | | 2,208,000 | | | | 2,296,320 |
| | 10.50% 8/1/14 | | | 140,000 | | | | 156,800 |
| | Petroleum Development 12.00% 2/15/18 | | | 2,071,000 | | | | 2,205,615 |
| # | Pioneer Drilling 144A 9.875% 3/15/18 | | | 1,122,000 | | | | 1,133,220 |
| | Quicksilver Resources 7.125% 4/1/16 | | | 2,939,000 | | | | 2,894,914 |
14
| | | Principal | | | |
| | | amount (U.S. $) | | Value (U.S. $) |
| Corporate Bonds (continued) | | | | | | | |
| Energy (continued) | | | | | | | |
| # | SandRidge Energy 144A | | | | | | | |
| | 8.75% 1/15/20 | | $ | 1,814,000 | | | $ | 1,859,350 |
| | 9.875% 5/15/16 | | | 1,770,000 | | | | 1,893,900 |
| | | | | | | | | 53,663,958 |
| Finance & Investments – 6.24% | | | | | | | |
| • | American International Group 8.175% 5/15/58 | | | 4,110,000 | | | | 3,585,975 |
| # | Express Finance 144A 8.75% 3/1/18 | | | 1,550,000 | | | | 1,619,750 |
| • | Genworth Financial 6.15% 11/15/66 | | | 4,411,000 | | | | 3,220,030 |
| •# | HBOS Capital Funding 144A 6.071% 6/29/49 | | | 2,901,000 | | | | 2,262,780 |
| •# | ILFC E-Capital Trust II 144A 6.25% 12/21/65 | | | 3,450,000 | | | | 2,363,250 |
| *# | International Lease Finance 144A 8.75% 3/15/17 | | | 1,156,000 | | | | 1,182,010 |
| •# | Liberty Mutual Group 144A 7.00% 3/15/37 | | | 2,921,000 | | | | 2,430,476 |
| | Nuveen Investments 10.50% 11/15/15 | | | 7,320,000 | | | | 7,228,501 |
| •# | Rabobank Nederland 144A 11.00% 12/29/49 | | | 2,589,000 | | | | 3,279,038 |
| ∏• | XL Capital 6.50% 12/31/49 | | | 1,366,000 | | | | 1,051,820 |
| | Zions Bancorporation 5.65% 5/15/14 | | | 295,000 | | | | 279,299 |
| | | | | | | | | 28,502,929 |
| Media – 7.77% | | | | | | | |
| | Affinion Group 11.50% 10/15/15 | | | 869,000 | | | | 923,313 |
| | Cablevision Systems | | | | | | | |
| | 8.00% 4/15/20 | | | 270,000 | | | | 286,875 |
| | #144A 8.625% 9/15/17 | | | 628,000 | | | | 677,455 |
| # | CCO Holdings/Capital 144A | | | | | | | |
| | 7.875% 4/30/18 | | | 518,000 | | | | 545,195 |
| | *8.125% 4/30/20 | | | 653,000 | | | | 693,813 |
| *# | Charter Communications Operating | | | | | | | |
| | 144A 10.875% 9/15/14 | | | 1,027,000 | | | | 1,155,375 |
| * | Clear Channel Communications 10.75% 8/1/16 | | | 1,328,000 | | | | 1,020,900 |
| # | Columbus International 144A 11.50% 11/20/14 | | | 2,905,000 | | | | 3,242,705 |
| | DISH DBS 7.875% 9/1/19 | | | 2,029,000 | | | | 2,165,958 |
| *# | Gray Television 144A 10.50% 6/29/15 | | | 2,542,000 | | | | 2,529,290 |
| # | inVentiv Health 144A 10.00% 8/15/18 | | | 2,495,000 | | | | 2,538,663 |
| # | MDC Partners 144A 11.00% 11/1/16 | | | 1,082,000 | | | | 1,184,790 |
| # | Nexstar Broadcasting 144A 8.875% 4/15/17 | | | 2,238,000 | | | | 2,316,330 |
15
Statement of net assets
Delaware High-Yield Opportunities Fund
| | | Principal | | | |
| | | amount (U.S. $) | | Value (U.S. $) |
| Corporate Bonds (continued) | | | | | | | |
| Media (continued) | | | | | | | |
| | Nielsen Finance | | | | | | | |
| | 11.50% 5/1/16 | | $ | 329,000 | | | $ | 370,948 |
| | 11.625% 2/1/14 | | | 206,000 | | | | 232,265 |
| | Ω12.50% 8/1/16 | | | 2,614,000 | | | | 2,561,719 |
| # | Sinclair Television Group 144A 9.25% 11/1/17 | | | 1,519,000 | | | | 1,594,950 |
| # | Sitel Finance 144A 11.50% 4/1/18 | | | 2,243,000 | | | | 1,805,615 |
| *# | Umbrella Acquisition PIK 144A 9.75% 3/15/15 | | | 2,618,983 | | | | 2,380,001 |
| # | UPC Holding 144A 9.875% 4/15/18 | | | 1,500,000 | | | | 1,575,000 |
| # | XM Satellite Radio Holdings 144A 13.00% 8/1/13 | | | 4,971,000 | | | | 5,654,512 |
| | | | | | | | | 35,455,672 |
| Real Estate – 0.43% | | | | | | | |
| * | Felcor Lodging 10.00% 10/1/14 | | | 1,833,000 | | | | 1,961,310 |
| | | | | | | | | 1,961,310 |
| Services Cyclical – 8.68% | | | | | | | |
| | AMH Holdings 11.25% 3/1/14 | | | 2,212,000 | | | | 2,278,360 |
| # | Delta Air Lines 144A 12.25% 3/15/15 | | | 2,124,000 | | | | 2,339,055 |
| | DryShips 5.00% 12/1/14 | | | 1,500,000 | | | | 1,286,250 |
| # | Equinox Holdings 144A 9.50% 2/1/16 | | | 2,199,000 | | | | 2,253,975 |
| *# | General Maritime 144A 12.00% 11/15/17 | | | 2,121,000 | | | | 2,242,958 |
| | Harrah’s Operating | | | | | | | |
| | *10.00% 12/15/18 | | | 1,581,000 | | | | 1,337,921 |
| | #144A 10.00% 12/15/18 | | | 2,930,000 | | | | 2,479,513 |
| | Kansas City Southern de Mexico | | | | | | | |
| | 12.50% 4/1/16 | | | 225,000 | | | | 271,688 |
| | *#144A 8.00% 2/1/18 | | | 1,600,000 | | | | 1,704,000 |
| *# | MCE Finance 144A 10.25% 5/15/18 | | | 2,180,000 | | | | 2,329,875 |
| | MGM MIRAGE | | | | | | | |
| | 13.00% 11/15/13 | | | 795,000 | | | | 930,150 |
| | *#144A 11.375% 3/1/18 | | | 6,119,000 | | | | 5,813,049 |
| | Mohegan Tribal Gaming Authority | | | | | | | |
| | *6.875% 2/15/15 | | | 539,000 | | | | 355,740 |
| | 7.125% 8/15/14 | | | 1,366,000 | | | | 949,370 |
| | NCL 11.75% 11/15/16 | | | 2,390,000 | | | | 2,667,838 |
| @‡ | Northwest Airlines 10.00% 2/1/11 | | | 575,000 | | | | 2,588 |
| | Peninsula Gaming 10.75% 8/15/17 | | | 2,443,000 | | | | 2,552,935 |
| # | Pinnacle Entertainment 144A 8.75% 5/15/20 | | | 1,386,000 | | | | 1,361,745 |
16
| | | Principal | | | |
| | | amount (U.S. $) | | Value (U.S. $) |
| Corporate Bonds (continued) | | | | | | | |
| Services Cyclical (continued) | | | | | | | |
| # | Shingle Springs Tribal Gaming Authority | | | | | | | |
| | 144A 9.375% 6/15/15 | | $ | 2,687,000 | | | $ | 2,216,775 |
| *# | Swift Transportation 12.50% 5/15/17 | | | 1,250,000 | | | | 1,237,500 |
| # | United Air Lines 144A 12.00% 11/1/13 | | | 2,773,000 | | | | 2,991,373 |
| | | | | | | | | 39,602,658 |
| Services Non-Cyclical – 2.84% | | | | | | | |
| # | Ashtead Capital 144A 9.00% 8/15/16 | | | 1,995,000 | | | | 2,024,925 |
| | HCA 9.25% 11/15/16 | | | 493,000 | | | | 533,673 |
| # | Radiation Therapy Services 144A 9.875% 4/15/17 | | | 2,328,000 | | | | 2,322,179 |
| # | Radnet Management 144A 10.375% 4/1/18 | | | 2,438,000 | | | | 2,172,867 |
| | RSC Equipment Rental III | | | | | | | |
| | 9.50% 12/1/14 | | | 1,919,000 | | | | 1,981,368 |
| | #144A 10.25% 11/15/19 | | | 215,000 | | | | 220,913 |
| | Select Medical 7.625% 2/1/15 | | | 1,600,000 | | | | 1,540,000 |
| • | US Oncology PIK 6.643% 3/15/12 | | | 2,299,000 | | | | 2,189,797 |
| | | | | | | | | 12,985,722 |
| Technology & Electronics – 3.65% | | | | | | | |
| # | Aspect Software 144A 10.625% 5/15/17 | | | 2,363,000 | | | | 2,427,983 |
| | First Data | | | | | | | |
| | *9.875% 9/24/15 | | | 1,046,000 | | | | 847,260 |
| | 11.25% 3/31/16 | | | 2,830,000 | | | | 1,825,350 |
| # | International Wire Group 144A 9.75% 4/15/15 | | | 2,135,000 | | | | 2,156,350 |
| # | MagnaChip Semiconductor/Finance | | | | | | | |
| | 144A 10.50% 4/15/18 | | | 1,690,000 | | | | 1,766,050 |
| | NXP BV Funding 9.50% 10/15/15 | | | 3,500,000 | | | | 3,438,749 |
| | Sanmina-SCI 8.125% 3/1/16 | | | 2,001,000 | | | | 2,046,023 |
| | SunGard Data Systems 10.25% 8/15/15 | | | 2,033,000 | | | | 2,144,815 |
| | | | | | | | | 16,652,580 |
| Telecommunications – 13.04% | | | | | | | |
| @=‡ | Allegiance Telecom 11.75% 2/15/11 | | | 2,300,000 | | | | 0 |
| *# | Clearwire Communications/Finance 144A | | | | | | | |
| | 12.00% 12/1/15 | | | 5,304,147 | | | | 5,775,997 |
| * | Cricket Communications 10.00% 7/15/15 | | | 2,318,000 | | | | 2,491,850 |
| # | Digicel 144A 8.25% 9/1/17 | | | 1,005,000 | | | | 1,032,638 |
17
Statement of net assets
Delaware High-Yield Opportunities Fund
| | | Principal | | | |
| | | amount (U.S. $) | | Value (U.S. $) |
| Corporate Bonds (continued) | | | | | | | |
| Telecommunications (continued) | | | | | | | |
| # | Digicel Group 144A | | | | | | | |
| | *8.875% 1/15/15 | | $ | 1,225,000 | | | $ | 1,251,031 |
| | 10.50% 4/15/18 | | | 1,075,000 | | | | 1,155,625 |
| | PIK 9.125% 1/15/15 | | | 1,025,000 | | | | 1,040,375 |
| | GCI 8.625% 11/15/19 | | | 1,073,000 | | | | 1,115,920 |
| # | Global Crossing 144A 12.00% 9/15/15 | | | 3,065,000 | | | | 3,417,474 |
| # | GXS Worldwide 144A 9.75% 6/15/15 | | | 2,138,000 | | | | 2,063,170 |
| | Intelsat 6.50% 11/1/13 | | | 1,471,000 | | | | 1,412,160 |
| | Intelsat Bermuda | | | | | | | |
| | 11.25% 2/4/17 | | | 4,921,000 | | | | 5,240,864 |
| | PIK 11.50% 2/4/17 | | | 2,510,563 | | | | 2,673,750 |
| | Level 3 Financing 10.00% 2/1/18 | | | 2,539,000 | | | | 2,326,359 |
| | MetroPCS Wireless 9.25% 11/1/14 | | | 197,000 | | | | 206,850 |
| | NII Capital 10.00% 8/15/16 | | | 1,799,000 | | | | 1,996,890 |
| * | PAETEC Holding | | | | | | | |
| | 8.875% 6/30/17 | | | 628,000 | | | | 652,335 |
| | 9.50% 7/15/15 | | | 1,171,000 | | | | 1,176,855 |
| # | Primus Telecommunications Holding | | | | | | | |
| | 144A 13.00% 12/15/16 | | | 2,038,000 | | | | 2,068,570 |
| | Sprint Capital 8.75% 3/15/32 | | | 4,558,000 | | | | 4,643,462 |
| # | Telcordia Technologies 144A 11.00% 5/1/18 | | | 2,762,000 | | | | 2,689,498 |
| | Telesat Canada | | | | | | | |
| | 11.00% 11/1/15 | | | 1,107,000 | | | | 1,273,050 |
| | 12.50% 11/1/17 | | | 2,893,000 | | | | 3,384,810 |
| | Terremark Worldwide 12.00% 6/15/17 | | | 1,800,000 | | | | 2,061,000 |
| | Viasat 8.875% 9/15/16 | | | 1,047,000 | | | | 1,128,143 |
| | Virgin Media Finance 8.375% 10/15/19 | | | 1,245,000 | | | | 1,357,050 |
| | West 11.00% 10/15/16 | | | 2,320,000 | | | | 2,465,000 |
| # | Wind Acquisition Finance 144A | | | | | | | |
| | 11.75% 7/15/17 | | | 2,230,000 | | | | 2,380,525 |
| | 12.00% 12/1/15 | | | 955,000 | | | | 1,014,688 |
| | | | | | | | | 59,495,939 |
| Utilities – 2.65% | | | | | | | |
| | AES | | | | | | | |
| | 7.75% 3/1/14 | | | 300,000 | | | | 315,000 |
| | 8.00% 6/1/20 | | | 1,706,000 | | | | 1,814,758 |
| | Dynergy Holdings 7.75% 6/1/19 | | | 2,236,000 | | | | 1,576,380 |
18
| | | Principal | | | |
| | | amount (U.S. $) | | Value (U.S. $) |
| Corporate Bonds (continued) | | | | | | | |
| Utilities (continued) | | | | | | | |
| | Edison Mission Energy | | | | | | | |
| | 7.00% 5/15/17 | | $ | 1,027,000 | | | $ | 703,495 |
| | 7.20% 5/15/19 | | | 389,000 | | | | 264,520 |
| | Elwood Energy 8.159% 7/5/26 | | | 1,465,969 | | | | 1,392,671 |
| | Energy Future Holdings | | | | | | | |
| | 5.55% 11/15/14 | | | 1,438,000 | | | | 822,453 |
| | 10.875% 11/1/17 | | | 889,000 | | | | 626,745 |
| * | Mirant Americas Generation 8.50% 10/1/21 | | | 2,275,000 | | | | 2,172,624 |
| • | Puget Sound Energy 6.974% 6/1/67 | | | 1,391,000 | | | | 1,299,778 |
| * | Texas Competitive Electric Holdings 10.25% 11/1/15 | | | 1,668,000 | | | | 1,125,900 |
| | | | | | | | | 12,114,324 |
| Total Corporate Bonds (cost $410,956,464) | | | | | | | 429,826,934 |
| | | | | | | | |
| «Senior Secured Loans – 0.96% | | | | | | | |
| | Chester Downs & Marina Term Tranche Loan | | | | | | | |
| | 12.375% 12/31/16 | | | 896,563 | | | | 904,407 |
| | Energy Futures Holdings Term Tranche Loan | | | | | | | |
| | B2 3.729% 10/10/14 | | | 1,486,605 | | | | 1,163,700 |
| | PQ Term Tranche Loan 6.73% 7/30/15 | | | 2,504,000 | | | | 2,306,359 |
| Total Senior Secured Loans (cost $4,081,292) | | | | | | | 4,374,466 |
| | | | | | |
| | | Number of shares | | | |
| Common Stock – 0.47% | | | | | | | |
| @† | Alliance HealthCare Service | | | 107,528 | | | | 451,618 |
| ∏=† | Avado Brands | | | 10,210 | | | | 0 |
| =† | Calpine Escrow | | | 2,490,000 | | | | 0 |
| =† | Century Communications | | | 4,250,000 | | | | 0 |
| † | Delta Air Lines | | | 99 | | | | 1,176 |
| † | DIRECTV Class A | | | 19,150 | | | | 711,614 |
| † | Flextronics International | | | 49,950 | | | | 310,689 |
| † | GeoEye | | | 7,900 | | | | 272,708 |
| † | Mirant | | | 1,775 | | | | 19,472 |
| † | Mobile Mini | | | 22,073 | | | | 378,331 |
| ∏=† | PT Holdings | | | 3,285 | | | | 33 |
| † | USgen | | | 1,950,000 | | | | 0 |
| Total Common Stock (cost $5,186,800) | | | | | | | 2,145,641 |
19
Statement of net assets
Delaware High-Yield Opportunities Fund
| | | Number of shares | | Value (U.S. $) | |
| Preferred Stock – 0.50% | | | | | | | | |
| # | Ally Financial 144A 7.00% | | | 2,800 | | | $ | 2,299,588 | |
| = | Port Townsend | | | 657 | | | | 0 | |
| Total Preferred Stock (cost $2,897,430) | | | | | | | 2,299,588 | |
| | | | | | | | | |
| Warrants – 0.00% | | | | | | | | |
| † | Alion Science & Technology | | | 1,835 | | | | 18 | |
| =† | Port Townsend | | | 657 | | | | 7 | |
| Total Warrants (cost $15,768) | | | | | | | 25 | |
| | | | | | | | | | |
| | | Principal | | | | |
| | | amount (U.S. $) | | | | |
| ≠Discount Note – 0.99% | | | | | | | | |
| | Federal Home Loan Bank 0.06% 8/2/10 | | $ | 4,519,023 | | | | 4,519,016 | |
| Total Discount Note (cost $4,519,016) | | | | | | | 4,519,016 | |
| | | | | | | | | |
| Total Value of Securities Before Securities | | | | | | | | |
| | Lending Collateral – 98.05% (cost $431,916,138) | | | | | | | 447,534,441 | |
| | | | | | | | | | |
| | | Number of shares | | | | |
| Securities Lending Collateral** – 5.68% | | | | | | | | |
| | Investment Companies | | | | | | | | |
| | BNY Mellon Securities Lending Overnight Fund | | | 24,808,927 | | | | 24,808,927 | |
| | BNY Mellon SL DBT II Liquidating Fund | | | 1,118,581 | | | | 1,097,999 | |
| | @†Mellon GSL Reinvestment Trust II | | | 542,043 | | | | 23,037 | |
| Total Securities Lending Collateral (cost $26,469,551) | | | | | | | 25,929,963 | |
| | | | | | | | | |
| Total Value of Securities – 103.73% | | | | | | | | |
| | (cost $458,385,689) | | | | | | | 473,464,404 | © |
| Obligation to Return Securities | | | | | | | | |
| | Lending Collateral** – (5.80%) | | | | | | | (26,469,551 | ) |
| Receivables and Other Assets | | | | | | | | |
| | Net of Liabilities – 2.07% | | | | | | | 9,430,859 | |
| Net Assets Applicable to 114,621,736 | | | | | | | | |
| | Shares Outstanding – 100.00% | | | | | | $ | 456,425,712 | |
20
| | |
| Net Asset Value – Delaware High-Yield Opportunities Fund | | | |
| Class A ($335,683,766 / 84,323,327 Shares) | | | $3.98 | |
| Net Asset Value – Delaware High-Yield Opportunities Fund | | | |
| Class B ($10,142,753 / 2,548,492 Shares) | | | $3.98 | |
| Net Asset Value – Delaware High-Yield Opportunities Fund | | | |
| Class C ($36,060,092 / 9,043,115 Shares) | | | $3.99 | |
| Net Asset Value – Delaware High-Yield Opportunities Fund | | | |
| Class R ($14,708,456 / 3,682,660 Shares) | | | $3.99 | |
| Net Asset Value – Delaware High-Yield Opportunities Fund | | | |
| Institutional Class ($59,830,645 / 15,024,142 Shares) | | | $3.98 | |
| | | | |
| Components of Net Assets at July 31, 2010: | | | |
| Shares of beneficial interest (unlimited authorization – no par) | $ | 512,082,394 | |
| Undistributed net investment income | | 158,107 | |
| Accumulated net realized loss on investments | | (70,893,504 | ) |
| Net unrealized appreciation of investments | | 15,078,715 | |
| Total net assets | $ | 456,425,712 | |
| † | Non income producing security. |
| ‡ | Non income producing security. Security is currently in default. |
| ≠ | The rate shown is the effective yield at the time of purchase. |
| * | Fully or partially on loan. |
| ** | See Note 10 in “Notes to financial statements.” |
| Ω | Step coupon bond. Indicates security that has a zero coupon that remains in effect until a predetermined date at which time the stated interest rate becomes effective. |
| # | Security exempt from registration under Rule 144A of the Securities Act of 1933, as amended. At July 31, 2010, the aggregate amount of Rule 144A securities was $196,232,575 which represented 42.99% of the Fund’s net assets. See Note 11 in “Notes to financial statements.” |
| = | Security is being fair valued in accordance with the Fund’s fair valuation policy. At July 31, 2010, the aggregate amount of fair valued securities was $698,144, which represented 0.15% of the Fund’s net assets. See Note 1 in “Notes to financial statements.” |
| • | Variable rate security. The rate shown is the rate as of July 31, 2010. Interest rates reset periodically. |
21
Statement of net assets
Delaware High-Yield Opportunities Fund
| | |
| « | Senior Secured Loans generally pay interest at rates which are periodically redetermined by reference to a base lending rate plus a premium. These base lending rates are generally: (i) the prime rate offered by one or more United States banks, (ii) the lending rate offered by one or more European banks such as the London Inter-Bank Offered Rate (LIBOR), and (iii) the certificate of deposit rate. Senior Secured Loans may be subject to restrictions on resale. Stated rate in effect at July 31, 2010. |
| @ | Illiquid security. At July 31, 2010, the aggregate amount of illiquid securities was $1,175,347, which represented 0.26% of the Fund’s net assets. See Note 11 in “Notes to financial statements.” |
| ∏ | Restricted security. These investments are in securities not registered under the Securities Act of 1933, as amended and have certain restrictions on resale which may limit their liquidity. At July 31, 2010, the aggregate amount of restricted securities was $1,051,820 or 0.23% of the Fund’s net assets. See Note 11 in “Notes to financial statements.” |
| © | Includes $25,324,416 of securities loaned. |
PIK — Pay-in-kind
| Net Asset Value and Offering Price Per Share – | | |
| Delaware High-Yield Opportunities Fund | | |
| Net asset value Class A (A) | | $3.98 |
| Sales charge (4.50% of offering price) (B) | | 0.19 |
| Offering price | | $4.17 |
| (A) | Net asset value per share, as illustrated, is the amount which would be paid upon redemption or repurchase of shares. |
| (B) | See the current prospectus for purchase of $100,000 or more. |
See accompanying Notes, which are an integral part of the financial statements.
22
| Statement of operations | |
| Delaware High-Yield Opportunities Fund | Year Ended July 31, 2010 |
| Investment Income: | | | | | | |
| | Interest | $ | 45,010,212 | | | | |
| | Dividends | | 184,936 | | | | |
| | Securities lending income | | 170,126 | | $ | 45,365,274 | |
| | | | | | | | |
| Expenses: | | | | | | |
| | Management fees | | 2,845,691 | | | | |
| | Distribution expenses – Class A | | 968,757 | | | | |
| | Distribution expenses – Class B | | 113,125 | | | | |
| | Distribution expenses – Class C | | 347,468 | | | | |
| | Distribution expenses – Class R | | 109,500 | | | | |
| | Dividend disbursing and transfer agent fees and expenses | | 741,153 | | | | |
| | Accounting and administration expenses | | 174,346 | | | | |
| | Registration fees | | 116,477 | | | | |
| | Reports and statements to shareholders | | 72,114 | | | | |
| | Legal fees | | 65,614 | | | | |
| | Audit and tax | | 45,466 | | | | |
| | Trustees’ fees | | 25,379 | | | | |
| | Insurance fees | | 20,398 | | | | |
| | Dues and services | | 18,108 | | | | |
| | Pricing fees | | 16,430 | | | | |
| | Custodian fees | | 13,991 | | | | |
| | Consulting fees | | 12,664 | | | | |
| | Trustees’ expenses | | 3,434 | | | 5,710,115 | |
| | Less fees waived | | | | | (611,609 | ) |
| | Less waived distribution expenses – Class R | | | | | (18,219 | ) |
| | Less expense paid indirectly | | | | | (565 | ) |
| | Total operating expenses | | | | | 5,079,722 | |
| Net Investment Income | | | | | 40,285,552 | |
| | | | | | | | |
| Net Realized and Unrealized Gain (Loss) on Investments: | | | | | | |
| | Net realized gain (loss) on: | | | | | | |
| | Investments | | | | | 43,004,582 | |
| | Swap contracts | | | | | (30,628 | ) |
| | Net realized gain | | | | | 42,973,954 | |
| | Net change in unrealized appreciation/depreciation of investments | | | | | 2,298,932 | |
| Net Realized and Unrealized Gain on Investments | | | | | 45,272,886 | |
| | | | | | | | |
| Net Increase in Net Assets Resulting from Operations | | | | $ | 85,558,438 | |
See accompanying Notes, which are an integral part of the financial statements
23
Statements of changes in net assets
Delaware High-Yield Opportunities Fund
| | Year Ended |
| | 7/31/10 | | 7/31/09 |
| Increase (Decrease) in Net Assets from Operations: | | | | | | | |
| Net investment income | $ | 40,285,552 | | | $ | 18,419,287 | |
| Net realized gain (loss) on investments | | 42,973,954 | | | | (27,783,028 | ) |
| Net change in unrealized appreciation/depreciation | | | �� | | | | |
| of investments | | 2,298,932 | | | | 40,906,115 | |
| Net increase in net assets resulting from operations | | 85,558,438 | | | | 31,542,374 | |
| | | | | | | | |
| Dividends and Distributions to Shareholders from: | | | | | | | |
| Net investment income: | | | | | | | |
| Class A | | (29,460,917 | ) | | | (9,724,074 | ) |
| Class B | | (947,675 | ) | | | (612,122 | ) |
| Class C | | (2,906,880 | ) | | | (1,594,976 | ) |
| Class R | | (1,618,544 | ) | | | (1,003,740 | ) |
| Institutional Class | | (4,490,067 | ) | | | (3,912,812 | ) |
| | | (39,424,083 | ) | | | (16,847,724 | ) |
| | | | | | | | |
| Capital Share Transactions: | | | | | | | |
| Proceeds from shares sold: | | | | | | | |
| Class A | | 167,859,742 | | | | 85,030,369 | |
| Class B | | 308,444 | | | | 730,332 | |
| Class C | | 8,696,441 | | | | 6,123,033 | |
| Class R | | 12,483,630 | | | | 9,444,371 | |
| Institutional Class | | 36,358,388 | | | | 48,085,976 | |
| | | | | | | | |
| Net asset value of shares issued upon reinvestment of | | | | | | | |
| dividends and distributions: | | | | | | | |
| Class A | | 20,974,439 | | | | 3,890,250 | |
| Class B | | 532,742 | | | | 177,432 | |
| Class C | | 1,484,481 | | | | 440,724 | |
| Class R | | 1,388,706 | | | | 458,625 | |
| Institutional Class | | 2,797,535 | | | | 1,535,908 | |
24
| | | Year Ended |
| | | 7/31/10 | | 7/31/09 |
| Capital Share Transactions (continued): | | | | | | | | |
| Net asset from merger* | | | | | | | | |
| Class A | | $ | — | | | $ | 117,921,329 | |
| Class B | | | — | | | | 6,250,672 | |
| Class C | | | — | | | | 10,338,149 | |
| Institutional Class | | | | | | | 10,053,664 | |
| | | | 252,884,548 | | | | 300,480,834 | |
| Cost of shares repurchased: | | | | | | | | |
| Class A | | | (148,761,801 | ) | | | (45,783,019 | ) |
| Class B | | | (3,977,335 | ) | | | (3,163,862 | ) |
| Class C | | | (9,316,161 | ) | | | (6,403,923 | ) |
| Class R | | | (16,181,518 | ) | | | (5,395,479 | ) |
| Institutional Class | | | (29,512,003 | ) | | | (53,825,987 | ) |
| | | | (207,748,818 | ) | | | (114,572,270 | ) |
| Increase in net assets derived from capital | | | | | | | | |
| share transactions | | | 45,135,730 | | | | 185,908,564 | |
| Net Increase in Net Assets | | | 91,270,085 | | | | 200,603,214 | |
| |
| Net Assets: | | | | | | | | |
| Beginning of year | | | 365,155,627 | | | | 164,552,413 | |
| End of year (including undistributed net investment | | | | | | | | |
| income of $158,107 and $139,424, respectively) | | $ | 456,425,712 | | | $ | 365,155,627 | |
*See Note 7 in “Notes to financial statements.”
See accompanying Notes, which are an integral part of the financial statements
25
Financial highlights
Delaware High-Yield Opportunities Fund Class A
Selected data for each share of the Fund outstanding throughout each period were as follows:
| Net asset value, beginning of period |
| |
| Income (loss) from investment operations: |
| Net investment income |
| Net realized and unrealized gain (loss) on investments |
| Total from investment operations |
| |
| Less dividends and distributions from: |
| Net investment income |
| Total dividends and distributions |
| |
| Net asset value, end of period |
| |
| Total return1 |
| |
| Ratios and supplemental data: |
| Net assets, end of period (000 omitted) |
| Ratio of expenses to average net assets |
| Ratio of expenses to average net assets |
| prior to fees waived and expense paid indirectly |
| Ratio of net investment income to average net assets |
| Ratio of net investment income to average net assets |
| prior to fees waived and expense paid indirectly |
| Portfolio turnover |
1 Total investment return is based on the change in net asset value of a share during the period and assumes reinvestment of dividends and distributions at net asset value and does not reflect the impact of a sales charge. Total investment return during all of the periods shown reflects a waiver by the manager. Performance would have been lower had the waiver not been in effect. |
See accompanying Notes, which are an integral part of the financial statements
26
| | Year Ended | |
| | 7/31/10 | | | 7/31/09 | | | 7/31/08 | | | 7/31/07 | | | 7/31/06 | |
| | $3.560 | | | $3.880 | | | $4.260 | | | $4.260 | | | $4.360 | |
| | | |
| | | | | | | | | | | | | | | |
| | 0.356 | | | 0.323 | | | 0.299 | | | 0.321 | | | 0.319 | |
| | 0.412 | | | (0.347 | ) | | (0.368 | ) | | 0.012 | | | (0.090 | ) |
| | 0.768 | | | (0.024 | ) | | (0.069 | ) | | 0.333 | | | 0.229 | |
| | | |
| | | | | | | | | | | | | | | |
| | (0.348 | ) | | (0.296 | ) | | (0.311 | ) | | (0.333 | ) | | (0.329 | ) |
| | (0.348 | ) | | (0.296 | ) | | (0.311 | ) | | (0.333 | ) | | (0.329 | ) |
| | | |
| | $3.980 | | | $3.560 | | | $3.880 | | | $4.260 | | | $4.260 | |
| | | |
| | 22.30% | | | 0.81% | | | (1.74% | ) | | 7.82% | | | 5.49% | |
| | | |
| | | | | | | | | | | | | | | |
| | $335,684 | | | $261,286 | | | $86,809 | | | $102,420 | | | $63,405 | |
| | 1.11% | | | 1.15% | | | 1.13% | | | 1.13% | | | 1.13% | |
| | | | | | | | | | | | | | | |
| | 1.25% | | | 1.37% | | | 1.31% | | | 1.27% | | | 1.29% | |
| | 9.25% | | | 9.92% | | | 7.28% | | | 7.24% | | | 7.42% | |
| | | | | | | | | | | | | | | |
| | 9.11% | | | 9.70% | | | 7.10% | | | 7.10% | | | 7.26% | |
| | 141% | | | 89% | | | 143% | | | 149% | | | 151% | |
27
Financial highlights
Delaware High-Yield Opportunities Fund Class B
Selected data for each share of the Fund outstanding throughout each period were as follows:
| Net asset value, beginning of period |
| |
| Income (loss) from investment operations: |
| Net investment income |
| Net realized and unrealized gain (loss) on investments |
| Total from investment operations |
| |
| Less dividends and distributions from: |
| Net investment income |
| Total dividends and distributions |
| |
| Net asset value, end of period |
| |
| Total return1 |
| |
| Ratios and supplemental data: |
| Net assets, end of period (000 omitted) |
| Ratio of expenses to average net assets |
| Ratio of expenses to average net assets |
| prior to fees waived and expense paid indirectly |
| Ratio of net investment income to average net assets |
| Ratio of net investment income to average net assets |
| prior to fees waived and expense paid indirectly |
| Portfolio turnover |
1 Total investment return is based on the change in net asset value of a share during the period and assumes reinvestment of dividends and distributions at net asset value and does not reflect the impact of a sales charge. Total investment return during all of the periods shown reflects a waiver by the manager. Performance would have been lower had the waiver not been in effect. |
See accompanying Notes, which are an integral part of the financial statements
28
| | Year Ended | |
| | 7/31/10 | | | 7/31/09 | | | 7/31/08 | | | 7/31/07 | | | 7/31/06 | |
| | $3.560 | | | $3.880 | | | $4.260 | | | $4.260 | | | $4.360 | |
| | | |
| | | | | | | | | | | | | | | |
| | 0.329 | | | 0.300 | | | 0.271 | | | 0.291 | | | 0.289 | |
| | 0.412 | | | (0.347 | ) | | (0.368 | ) | | 0.012 | | | (0.090 | ) |
| | 0.741 | | | (0.047 | ) | | (0.097 | ) | | 0.303 | | | 0.199 | |
| | | |
| | | | | | | | | | | | | | | |
| | (0.321 | ) | | (0.273 | ) | | (0.283 | ) | | (0.303 | ) | | (0.299 | ) |
| | (0.321 | ) | | (0.273 | ) | | (0.283 | ) | | (0.303 | ) | | (0.299 | ) |
| | | |
| | $3.980 | | | $3.560 | | | $3.880 | | | $4.260 | | | $4.260 | |
| | | |
| | 21.46% | | | 0.11% | | | (2.42% | ) | | 7.08% | | | 4.75% | |
| | | |
| | | | | | | | | | | | | | | |
| | $10,143 | | | $11,966 | | | $7,827 | | | $12,446 | | | $13,597 | |
| | 1.81% | | | 1.85% | | | 1.83% | | | 1.83% | | | 1.83% | |
| | | | | | | | | | | | | | | |
| | 1.95% | | | 2.07% | | | 2.01% | | | 1.97% | | | 1.99% | |
| | 8.55% | | | 9.22% | | | 6.58% | | | 6.54% | | | 6.72% | |
| | | | | | | | | | | | | | | |
| | 8.41% | | | 9.00% | | | 6.40% | | | 6.40% | | | 6.56% | |
| | 141% | | | 89% | | | 143% | | | 149% | | | 151% | |
29
Financial highlights
Delaware High-Yield Opportunities Fund Class C
Selected data for each share of the Fund outstanding throughout each period were as follows:
| Net asset value, beginning of period |
| |
| Income (loss) from investment operations: |
| Net investment income |
| Net realized and unrealized gain (loss) on investments |
| Total from investment operations |
| |
| Less dividends and distributions from: |
| Net investment income |
| Total dividends and distributions |
| |
| Net asset value, end of period |
| |
| Total return1 |
| |
| Ratios and supplemental data: |
| Net assets, end of period (000 omitted) |
| Ratio of expenses to average net assets |
| Ratio of expenses to average net assets |
| prior to fees waived and expense paid indirectly |
| Ratio of net investment income to average net assets |
| Ratio of net investment income to average net assets |
| prior to fees waived and expense paid indirectly |
| Portfolio turnover |
1 Total investment return is based on the change in net asset value of a share during the period and assumes reinvestment of dividends and distributions at net asset value and does not reflect the impact of a sales charge. Total investment return during all of the periods shown reflects a waiver by the manager. Performance would have been lower had the waiver not been in effect. |
See accompanying Notes, which are an integral part of the financial statements
30
| | Year Ended | |
| | 7/31/10 | | | 7/31/09 | | | 7/31/08 | | | 7/31/07 | | | 7/31/06 | |
| | $3.560 | | | $3.880 | | | $4.260 | | | $4.260 | | | $4.360 | |
| | | |
| | | | | | | | | | | | | | | |
| | 0.329 | | | 0.300 | | | 0.270 | | | 0.290 | | | 0.289 | |
| | 0.422 | | | (0.347 | ) | | (0.368 | ) | | 0.012 | | | (0.090 | ) |
| | 0.751 | | | (0.047 | ) | | (0.098 | ) | | 0.302 | | | 0.199 | |
| | | |
| | | | | | | | | | | | | | | |
| | (0.321 | ) | | (0.273 | ) | | (0.282 | ) | | (0.302 | ) | | (0.299 | ) |
| | (0.321 | ) | | (0.273 | ) | | (0.282 | ) | | (0.302 | ) | | (0.299 | ) |
| | | |
| | $3.990 | | | $3.560 | | | $3.880 | | | $4.260 | | | $4.260 | |
| | | |
| | 21.75% | | | 0.10% | | | (2.44% | ) | | 7.07% | | | 4.75% | |
| | | |
| | | | | | | | | | | | | | | |
| | $36,060 | | | $31,415 | | | $21,146 | | | $27,179 | | | $16,285 | |
| | 1.81% | | | 1.85% | | | 1.83% | | | 1.83% | | | 1.83% | |
| | | | | | | | | | | | | | | |
| | 1.95% | | | 2.07% | | | 2.01% | | | 1.97% | | | 1.99% | |
| | 8.55% | | | 9.22% | | | 6.58% | | | 6.54% | | | 6.72% | |
| | | | | | | | | | | | | | | |
| | 8.41% | | | 9.00% | | | 6.40% | | | 6.40% | | | 6.56% | |
| | 141% | | | 89% | | | 143% | | | 149% | | | 151% | |
31
Financial highlights
Delaware High-Yield Opportunities Fund Class R
Selected data for each share of the Fund outstanding throughout each period were as follows:
| Net asset value, beginning of period |
| |
| Income (loss) from investment operations: |
| Net investment income |
| Net realized and unrealized gain (loss) on investments |
| Total from investment operations |
| |
| Less dividends and distributions from: |
| Net investment income |
| Total dividends and distributions |
| |
| Net asset value, end of period |
| |
| Total return1 |
| |
| Ratios and supplemental data: |
| Net assets, end of period (000 omitted) |
| Ratio of expenses to average net assets |
| Ratio of expenses to average net assets |
| prior to fees waived and expense paid indirectly |
| Ratio of net investment income to average net assets |
| Ratio of net investment income to average net assets |
| prior to fees waived and expense paid indirectly |
| Portfolio turnover |
1 Total investment return is based on the change in net asset value of a share during the period and assumes reinvestment of dividends and distributions at net asset value. Total investment return during some of the periods shown reflects waivers by the manager and distributor. Performance would have been lower had the waivers not been in effect. |
See accompanying Notes, which are an integral part of the financial statements
32
| | Year Ended | |
| | 7/31/10 | | | 7/31/09 | | | 7/31/08 | | | 7/31/07 | | | 7/31/06 | |
| | $3.570 | | | $3.890 | | | $4.270 | | | $4.270 | | | $4.370 | |
| | | |
| | | |
| | 0.349 | | | 0.316 | | | 0.291 | | | 0.313 | | | 0.310 | |
| | 0.412 | | | (0.347 | ) | | (0.368 | ) | | 0.012 | | | (0.090 | ) |
| | 0.761 | | | (0.031 | ) | | (0.077 | ) | | 0.325 | | | 0.220 | |
| | | |
| | | | | | | | | | | | | | | |
| | (0.341 | ) | | (0.289 | ) | | (0.303 | ) | | (0.325 | ) | | (0.320 | ) |
| | (0.341 | ) | | (0.289 | ) | | (0.303 | ) | | (0.325 | ) | | (0.320 | ) |
| | | |
| | $3.990 | | | $3.570 | | | $3.890 | | | $4.270 | | | $4.270 | |
| | | |
| | 22.01% | | | 0.62% | | | (1.93% | ) | | 7.59% | | | 5.27% | |
| | | |
| | | | | | | | | | | | | | | |
| | $14,708 | | | $15,323 | | | $11,305 | | | $9,251 | | | $3,704 | |
| | 1.31% | | | 1.35% | | | 1.33% | | | 1.33% | | | 1.33% | |
| | | | | | | | | | | | | | | |
| | 1.55% | | | 1.67% | | | 1.61% | | | 1.57% | | | 1.59% | |
| | 9.05% | | | 9.72% | | | 7.08% | | | 7.04% | | | 7.22% | |
| | | | | | | | | | | | | | | |
| | 8.81% | | | 9.40% | | | 6.80% | | | 6.80% | | | 6.96% | |
| | 141% | | | 89% | | | 143% | | | 149% | | | 151% | |
33
Financial highlights
Delaware High-Yield Opportunities Fund Institutional Class
Selected data for each share of the Fund outstanding throughout each period were as follows:
| Net asset value, beginning of period |
| |
| Income (loss) from investment operations: |
| Net investment income |
| Net realized and unrealized gain (loss) on investments |
| Total from investment operations |
| |
| Less dividends and distributions from: |
| Net investment income |
| Total dividends and distributions |
| |
| Net asset value, end of period |
| |
| Total return1 |
| |
| Ratios and supplemental data: |
| Net assets, end of period (000 omitted) |
| Ratio of expenses to average net assets |
| Ratio of expenses to average net assets |
| prior to fees waived and expense paid indirectly |
| Ratio of net investment income to average net assets |
| Ratio of net investment income to average net assets |
| prior to fees waived and expense paid indirectly |
| Portfolio turnover |
1 Total investment return is based on the change in net asset value of a share during the period and assumes reinvestment of dividends and distributions at net asset value. Total investment return during all of the periods shown reflects a waiver by the manager. Performance would have been lower had the waiver not been in effect. |
See accompanying Notes, which are an integral part of the financial statements
34
| | Year Ended | |
| | 7/31/10 | | | 7/31/09 | | | 7/31/08 | | | 7/31/07 | | | 7/31/06 | |
| | $3.560 | | | $3.880 | | | $4.260 | | | $4.260 | | | $4.360 | |
| | | |
| | | | | | | | | | | | | | | |
| | 0.367 | | | 0.332 | | | 0.312 | | | 0.335 | | | 0.332 | |
| | 0.412 | | | (0.347 | ) | | (0.368 | ) | | 0.012 | | | (0.090 | ) |
| | 0.779 | | | (0.015 | ) | | (0.056 | ) | | 0.347 | | | 0.242 | |
| | | |
| | | | | | | | | | | | | | | |
| | (0.359 | ) | | (0.305 | ) | | (0.324 | ) | | (0.347 | ) | | (0.342 | ) |
| | (0.359 | ) | | (0.305 | ) | | (0.324 | ) | | (0.347 | ) | | (0.342 | ) |
| | | |
| | $3.980 | | | $3.560 | | | $3.880 | | | $4.260 | | | $4.260 | |
| | | |
| | 22.65% | | | 1.11% | | | (1.45% | ) | | 8.15% | | | 5.80% | |
| | | |
| | | | | | | | | | | | | | | |
| | $59,831 | | | $45,166 | | | $37,465 | | | $26,557 | | | $13,837 | |
| | 0.81% | | | 0.85% | | | 0.83% | | | 0.83% | | | 0.83% | |
| | | | | | | | | | | | | | | |
| | 0.95% | | | 1.07% | | | 1.01% | | | 0.97% | | | 0.99% | |
| | 9.55% | | | 10.22% | | | 7.58% | | | 7.54% | | | 7.72% | |
| | | | | | | | | | | | | | | |
| | 9.41% | | | 10.00% | | | 7.40% | | | 7.40% | | | 7.56% | |
| | 141% | | | 89% | | | 143% | | | 149% | | | 151% | |
35
| Notes to financial statements | |
| Delaware High-Yield Opportunities Fund | July 31, 2010 |
Delaware Group® Income Funds (Trust) is organized as a Delaware statutory trust and offers five Series: Delaware Core Bond Fund, Delaware Corporate Bond Fund, Delaware Extended Duration Bond Fund, Delaware Diversified Floating Rate Fund and Delaware High-Yield Opportunities Fund. These financial statements and the related notes pertain to Delaware High-Yield Opportunities Fund (Fund). The Trust is an open-end investment company. The Fund is considered diversified under the Investment Company Act of 1940, as amended, and offers Class A, Class B, Class C, Class R and Institutional Class shares. Class A shares are sold with a maximum front-end sales charge of up to 4.50%. Class A share purchases of $1,000,000 or more will incur a contingent deferred sales charge (CDSC) of 1% if redeemed during the first year and 0.50% during the second year, provided that Delaware Distributors , L.P. (DDLP) paid a financial advisor a commission on the purchase of those shares. Class B shares may only be purchased through dividend reinvestment and certain permitted exchanges. Prior to June 1, 2007, Class B shares were sold with a CDSC that declined from 4% to zero depending upon the period of time the shares were held. Class B shares will automatically convert to Class A shares on a quarterly basis approximately eight years after purchase. Class C shares are sold with a CDSC of 1%, if redeemed during the first twelve months. Class R and Institutional Class shares are not subject to a sales charge and are offered for sale exclusively to certain eligible investors.
The investment objective of the Fund is to seek total return and, as a secondary objective, high current income.
1. Significant Accounting Policies
The following accounting policies are in accordance with U.S. generally accepted accounting principles (U.S. GAAP) and are consistently followed by the Fund.
Security Valuation — Equity securities, except those traded on the Nasdaq Stock Market, Inc. (Nasdaq), are valued at the last quoted sales price as of the time of the regular close of the New York Stock Exchange (NYSE) on the valuation date. Securities traded on the Nasdaq are valued in accordance with the Nasdaq Official Closing Price, which may not be the last sales price. If on a particular day an equity security does not trade, then the mean between the bid and ask prices will be used. Short-term debt securities are valued at market value. Other debt securities, credit default swap (CDS) contracts and interest rate swap contracts are valued by an independent pricing service or broker. To the extent current market prices are not available, the pricing service may take into account developments related to the specific security, as well as transactions in comparable securities. Investment companies are valued at net asset value per share. Generally, index swap contracts and other securities and assets for which market quotations are not readily available are valued at fair value as determined in good faith under the direction of the Fund’s Board of Trustees (Board). In determining whether market quotations are readily available or fair valuation will be used, various factors will be taken into consideration, such as market closures or suspension of trading in a security. The Fund may use fair value pricing more frequently for securities traded primarily in non-U.S. markets because, among other things, most foreign markets close well before the Fund values its securities at 4:00 p.m. Eastern time. The earlier
36
close of these foreign markets gives rise to the possibility that significant events, including broad market moves, government actions or pronouncements, aftermarket trading, or news events may have occurred in the interim. To account for this, the Fund may frequently value foreign securities using fair value prices based on third-party vendor modeling tools (international fair value pricing).
Federal Income Taxes — No provision for federal income taxes has been made as the Fund intends to continue to qualify for federal income tax purposes as a regulated investment company under Subchapter M of the Internal Revenue Code of 1986, as amended, and make the requisite distributions to shareholders. The Fund evaluates tax positions taken or expected to be taken in the course of preparing the Fund’s tax returns to determine whether the tax positions are “more-likely-than-not” of being sustained by the applicable tax authority. Tax positions not deemed to meet the more-likely-than-not threshold are recorded as a tax benefit or expense in the current year. Management has analyzed the Fund’s tax positions taken on federal income tax returns for all open tax years (July 31, 2007 - July 31, 2010) and has concluded that no provision for federal income tax is required in the Fund’s financial statements.
Class Accounting — Investment income and common expenses are allocated to the various classes of the Fund on the basis of “settled shares” of each class in relation to the net assets of the Fund. Realized and unrealized gains (loss) on investments are allocated to the various classes of the Fund on the basis of daily net assets of each class. Distribution expenses relating to a specific class are charged directly to that class.
Repurchase Agreements — The Fund may invest in a pooled cash account along with other members of the Delaware Investments® Family of Funds pursuant to an exemptive order issued by the Securities and Exchange Commission. The aggregate daily balance of the pooled cash account is invested in repurchase agreements secured by obligations of the U.S. government. The respective collateral is held by the Fund’s custodian bank until the maturity of the respective repurchase agreements. Each repurchase agreement is at least 102% collateralized. However, in the event of default or bankruptcy by the counterparty to the agreement, realization of the collateral may be subject to legal proceedings. At July 31, 2010, the Fund held no investments in repurchase agree ments.
Use of Estimates — The preparation of financial statements in conformity with U.S. GAAP requires management to make estimates and assumptions that affect the reported amounts of assets and liabilities and disclosure of contingent assets and liabilities at the date of the financial statements and the reported amounts of revenues and expenses during the reporting period. Actual results could differ from those estimates and such differences could be material.
Other — Expenses directly attributable to the Fund are charged directly to the Fund. Other expenses common to various funds within the Delaware Investments® Family of Funds are generally allocated amongst such funds on the basis of average net assets. Management fees and some other expenses are paid monthly. Security transactions are recorded on the date the securities are purchased or sold (trade date) for financial reporting purposes. Costs used in
37
Notes to financial statements
Delaware High-Yield Opportunities Fund
1. Significant Accounting Policies (continued)
calculating realized gains and losses on the sale of investment securities are those of the specific securities sold. Dividend income is recorded on the ex-dividend date and interest income is recorded on the accrual basis. Discounts and premiums on non-convertible bonds are amortized to interest income over the lives of the respective securities. Realized gains (losses) on paydowns of mortgage- and asset-backed securities are classified as interest income. The Fund declares dividends daily from net investment income and pays such dividends monthly and declares and pays distributions from net realized gain on investments, if any, twice per year. Such dividends and distributions, if any, are recorded on ex-dividend date.
The Fund may receive earnings credits from its custodian when positive cash balances are maintained, which are used to offset custody fees. There were no earnings credits for the year ended July 31, 2010.
The Fund may receive earnings credits from its transfer agent when positive cash balances are maintained, which may be used to offset transfer agent fees. For the year ended July 31, 2010, the Fund earned $565 under this agreement.
2. Investment Management, Administration Agreements and Other Transactions with Affiliates
In accordance with the terms of its investment management agreement, the Fund pays Delaware Management Company (DMC), a series of Delaware Management Business Trust and the investment manager, an annual fee which is calculated daily at the rate of 0.65% on the first $500 million of average daily net assets of the Fund, 0.60% on the next $500 million, 0.55% on the next $1.5 billion, and 0.50% on average daily net assets in excess of $2.5 billion.
DMC had contractually agreed to waive that portion, if any, of its management fee and reimburse the Fund to the extent necessary to ensure that total annual operating expenses, (excluding any 12b-1 plan expenses, taxes, interest, inverse floater program expenses, brokerage fees, certain insurance costs, and nonroutine expenses or costs including, but not limited to, those relating to reorganizations, litigation, conducting shareholder meetings, and liquidations (collectively, nonroutine expenses)), did not exceed 0.83% of average daily net assets of the Fund through April 30, 2010. In addition, DMC has voluntarily agreed to waive that portion, if any, of its management fee and reimburse the Fund to the extent necessary to ensure that annual operating expenses, (excluding any 12b-1 plan expenses, taxes, interest, inverse floater program expenses, brokerage fees, certain insurance costs, and nonroutine expenses (as defined above)), do not ex ceed 0.81% of the average daily net assets of the Fund until such time as the waiver is discontinued. For purposes of this waiver and reimbursement, nonroutine expenses may also include such additional costs and expenses, as may be agreed upon from time to time by the Fund’s Board and DMC. This expense waiver and reimbursement applies only to expenses paid directly by the Fund.
38
Delaware Service Company, Inc. (DSC), an affiliate of DMC, provides fund accounting and financial administration oversight services to the Fund. For these services, the Fund pays DSC fees based on the aggregate daily net assets of the Delaware Investments® Family of Funds at the following annual rate: 0.0050% of the first $30 billion; 0.0045% of the next $10 billion; 0.0040% of the next $10 billion; and 0.0025% of aggregate average daily net assets in excess of $50 billion. The fees payable to DSC under the service agreement described above are allocated among all Funds in the Delaware Investments Family of Funds on a relative net asset value basis. For the year ended July 31, 2010, the Fund was charged $21,890 for these services.
DSC also provides dividend disbursing and transfer agency services. The Fund pays DSC a monthly fee based on the number of shareholder accounts for dividend disbursing and transfer agent services.
Pursuant to a distribution agreement and distribution plan, the Fund pays DDLP, the distributor and an affiliate of DMC, an annual distribution and service fee not to exceed 0.30% of the average daily net assets of the Class A shares, 1.00% of the average daily net assets of the Class B and C shares and 0.60% of the average daily net assets of the Class R shares. Institutional Class shares pay no distribution and service expenses. DDLP has contracted to limit distribution and service fees through November 30, 2010 in order to prevent distribution and service fees of Class R shares from exceeding 0.50% of average daily net assets.
At July 31, 2010, the Fund had liabilities payable to affiliates as follows:
| Investment management fee payable to DMC | | $ | 175,545 |
| Dividend disbursing, transfer agent and fund accounting | | | |
| oversight fees and other expenses payable to DSC | | | 25,787 |
| Distribution fees payable to DDLP | | | 129,580 |
| Other expenses payable to DMC and affiliates* | | | 16,567 |
| * | DMC, as part of its administrative services, pays operating expenses on behalf of the Fund and is reimbursed on a periodic basis. Such expenses include items such as printing of shareholder reports, fees for audit, legal and tax services, registration fees and trustees’ fees. |
As provided in the investment management agreement, the Fund bears the cost of certain legal and tax services, including internal legal and tax services provided to the Fund by DMC and/or its affiliates’ employees. For the year ended July 31, 2010, the Fund was charged $20,010 for internal legal and tax services provided by DMC and/or its affiliates’ employees.
For the year ended July 31, 2010, DDLP earned $42,711 for commissions on sales of the Fund’s Class A shares. For the year ended July 31, 2010, DDLP received gross CDSC commissions of $0, $11,576 and $5,397 on redemption of the Fund’s Class A, Class B and Class C shares, respectively, and these commissions were entirely used to offset up-front commissions previously paid by DDLP to broker/dealers on sales of those shares.
Trustees’ fees include expenses accrued by the Fund for each Trustee’s retainer and meeting fees. Certain officers of DMC, DSC, and DDLP are officers and/or Trustees of the Trust. These officers and Trustees are paid no compensation by the Fund.
39
Notes to financial statements
Delaware High-Yield Opportunities Fund
3. Investments
For the year ended July 31, 2010, the Fund made purchases of $629,313,910 and sales of $594,970,467 of investment securities other than short-term investments.
At July 31, 2010, the cost of investments for federal income tax purposes was $457,262,754. At July 31, 2010, net unrealized appreciation was $ 16,201,650, of which $26,342,135 related to unrealized appreciation of investments and $ 10,140,485 related to unrealized depreciation of investments.
U.S. GAAP defines fair value as the price that the Fund would receive to sell an asset or pay to transfer a liability in an orderly transaction between market participants at the measurement date under current market conditions. A three level hierarchy for fair value measurements has been established based upon the transparency of inputs to the valuation of an asset or liability. Inputs may be observable or unobservable and refer broadly to the assumptions that market participants would use in pricing the asset or liability. Observable inputs reflect the assumptions market participants would use in pricing the asset or liability based on market data obtained from sources independent of the reporting entity. Unobservable inputs reflect the reporting entity’s own assumptions about the assumptions that market participants would use in pricing the asset or liability developed based on the best information available under the circumstance s. The Fund’s investment in its entirety is assigned a level based upon the observability of the inputs which are significant to the overall valuation. The three level hierarchy of inputs is summarized below.
| Level 1 – | inputs are quoted prices in active markets for identical investments |
| | |
| Level 2 – | other observable inputs (including, but not limited to: quoted prices for similar assets or liabilities in markets that are active, quoted prices for identical or similar assets or liabilities in markets that are not active, inputs other than quoted prices that are observable for the assets or liabilities (such as interest rates, yield curves, volatilities, prepayment speeds, loss severities, credit risks and default rates) or other market-corroborated inputs) |
| | |
| Level 3 – | inputs are significant unobservable inputs (including the Fund’s own assumptions used to determine the fair value of investments) |
The following table summarizes the valuation of the Fund’s investments by fair value hierarchy levels as of July 31, 2010:
| | | Level 1 | | Level 2 | | Level 3 | | Total |
| Corporate Debt | | $ | — | | $ | 437,872,067 | | $ | 698,104 | | $ | 438,570,171 |
| Common Stock | | | 2,145,608 | | | — | | | 33 | | | 2,145,641 |
| Short-Term | | | — | | | 4,519,016 | | | — | | | 4,519,016 |
| Securities Lending Collateral | | | — | | | 25,906,926 | | | 23,037 | | | 25,929,963 |
| Other | | | — | | | 2,299,588 | | | 25 | | | 2,299,613 |
| Total | | $ | 2,145,608 | | $ | 470,597,597 | | $ | 721,199 | | $ | 473,464,404 |
40
The following is a reconciliation of investments in which significant unobservable inputs (Level 3) were used in determining fair value:
| | | | | | | | | Securities | | | | | |
| | | Corporate | | Common | | Lending | | | | | Total |
| | | Debt | | Stock | | Collateral | | Other | | Fund |
| Balance as of 7/31/09 | | $ | 698,104 | | | $ | 33 | | | $ | 54 | | $ | 7 | | $ | 698,198 | |
| Net change in unrealized | | | | | | | | | | | | | | | | | | |
| appreciation/depreciation | | | 9,892 | | | | 112 | | | | 22,983 | | | 18 | | | 33,005 | |
| Net realized gain (loss) | | | — | | | | (112 | ) | | | — | | | — | | | (112 | ) |
| Sales | | | (9,892 | ) | | | — | | | | — | | | — | | | (9,892 | ) |
| Balance as of 7/31/10 | | $ | 698,104 | | | $ | 33 | | | $ | 23,037 | | $ | 25 | | $ | 721,199 | |
| | | | | | | | | | | | | | | | | | | |
| Net change in unrealized | | | | | | | | | | | | | | | | | | |
| appreciation/depreciation | | | | | | | | | | | | | | | | | | |
| from investments still held | | | | | | | | | | | | | | | | | | |
| as of 7/31/10 | | $ | 9,892 | | | $ | 112 | | | $ | 22,983 | | $ | 18 | | $ | 33,005 | |
In January 2010, the Financial Accounting Standards Board issued an Accounting Standards Update, Improving Disclosures about Fair Value Measurements, which introduced new disclosure requirements and clarified certain existing disclosure requirements around fair value measurements currently presented above. The new disclosures and clarifications of existing disclosures are generally effective for the Fund’s fiscal year ending July 31, 2011 and interim periods therein. During the fiscal year ended July 31, 2010, the Fund made transfers out of Level 1 investments and into Level 2 investments in the amount of $24,808,927, based on management’s decision to classify the BNY Mellon Securities Lending Overnight Fund as Level 2 investments. Management has classified the BNY Mellon Securities Lending Overnight Fund as Level 2 investments because the price is not quoted in an active market or listed on a public exchange. The BNY Mellon Se curities Lending Overnight Fund is priced daily for investors in the Fund.
4. Dividend and Distribution Information
Income and long-term capital gain distributions are determined in accordance with federal income tax regulations, which may differ from U.S. GAAP. Additionally, distributions from net short-term gains on sales of investment securities are treated as ordinary income for federal income tax purposes. The tax character of dividends and distributions paid during the years ended July 31, 2010 and 2009 was as follows:
| | | Year Ended |
| | | 7/31/10 | | 7/31/09 |
| Ordinary income | | $39,424,083 | | $16,847,724 |
41
Notes to financial statements
Delaware High-Yield Opportunities Fund
5. Components of Net Assets on a Tax Basis
As of July 31, 2010, the components of net assets on a tax basis were as follows:
| Shares of beneficial interest | | $ | 512,082,394 | |
| Undistributed ordinary income | | | 1,139,855 | |
| Distributions payable | | | (981,748 | ) |
| Capital loss carryforwards* | | | (72,016,439 | ) |
| Unrealized appreciation of investments | | | 16,201,650 | |
| Net assets | | $ | 456,425,712 | |
*The amount of this loss which can be utilized in subsequent years is subject to an annual limitation in accordance with the Internal Revenue Code due to the Fund merger with Delaware Delchester® Fund in 2009.
The differences between book basis and tax basis components of the net assets are primarily attributable to tax deferral of losses on wash sales, tax treatment of distribution payable, and tax treatment of market discount and premium on debt instruments.
For financial reporting purposes, capital accounts are adjusted to reflect the tax character of permanent book/tax differences. Reclassifications are primarily due to tax treatment of CDS contracts and market discount and premium on certain debt instruments. Results of operations and net assets were not affected by these reclassifications. For the year ended July 31, 2010, the Fund recorded the following reclassifications:
| Undistributed net investment income | | $ | (842,786 | ) |
| Accumulated net realized gain | | | 842,786 | |
For federal income tax purposes, capital loss carryforwards may be carried forward and applied against future capital gains. $23,612,728 was utilized in 2010. Capital loss carryforwards remaining at July 31, 2010 will expire as follows: $1,421,123 expires in 2015, $30,094,931 expires in 2016 and $40,500,385 expires in 2017. The use of these losses are subject to an annual limitation in accordance with the Internal Revenue Code.
42
6. Capital Shares
Transactions in capital shares were as follows:
| | | Year Ended |
| | | 7/31/10 | | 7/31/09 |
| Shares sold: | | | | | | |
| Class A | | 43,830,346 | | | 26,129,812 | |
| Class B | | 82,502 | | | 240,686 | |
| Class C | | 2,249,268 | | | 1,919,047 | |
| Class R | | 3,232,698 | | | 2,963,086 | |
| Institutional Class | | 9,415,231 | | | 15,842,026 | |
| | | | | | | |
| Shares issued upon reinvestment of dividends and distributions: | | | | | | |
| Class A | | 5,432,839 | | | 1,181,475 | |
| Class B | | 139,237 | | | 54,317 | |
| Class C | | 384,265 | | | 134,888 | |
| Class R | | 358,991 | | | 142,266 | |
| Institutional Class | | 725,099 | | | 475,291 | |
| | | | | | | |
| Shares issued from merger*: | | | | | | |
| Class A | | — | | | 38,162,242 | |
| Class B | | — | | | 2,022,872 | |
| Class C | | — | | | 3,345,679 | |
| Institutional Class | | — | | | 3,253,613 | |
| | | 65,850,476 | | | 95,867,300 | |
| | | | | | | |
| Shares repurchased: | | | | | | |
| Class A | | (38,390,163 | ) | | (14,388,658 | ) |
| Class B | | (1,037,965 | ) | | (972,178 | ) |
| Class C | | (2,406,175 | ) | | (2,029,499 | ) |
| Class R | | (4,203,770 | ) | | (1,717,921 | ) |
| Institutional Class | | (7,810,320 | ) | | (16,530,437 | ) |
| | | (53,848,393 | ) | | (35,638,693 | ) |
| Net increase | | 12,002,083 | | | 60,228,607 | |
*See Note 7
For the years ended July 31, 2010 and 2009, 365,984 Class B shares were converted to 365,984 Class A shares valued at $1,407,892 and 280,415 Class B shares were converted to 280,215 Class A shares valued at $914,661, respectively. The respective amounts are included in Class B redemptions and Class A subscriptions in the table above and the statements of changes in net assets.
43
Notes to financial statements
Delaware High-Yield Opportunities Fund
7. Fund Merger
Effective April 17, 2009, the Fund acquired all of the assets and assumed all of the liabilities of Delaware Delchester® Fund (Acquired Fund), an open-end investment company, in exchange for shares of the Fund pursuant to a Plan and Agreement of Reorganization (Reorganization). The shareholders of the Acquired Fund received shares of the respective class of the Fund equal to the aggregate net asset value of their share in the Acquired Fund prior to the Reorganization.
The Reorganization was treated as a non-taxable event and, accordingly, the Fund’s basis in securities acquired reflected the historical cost basis as of the date of transfer. The net assets, net unrealized depreciation and accumulated net realized loss of the Acquired Fund as of the close of business on April 17, 2009, were as follows:
| Net assets | | $ | 144,563,814 | |
| Accumulated net realized loss | | | (283,001,676 | ) |
| Net unrealized depreciation | | | (20,252,523 | ) |
The net assets of the Fund prior to the Reorganization were $139,465,569. The combined net assets after Reorganization were $284,029,383.
8. Line of Credit
The Fund, along with certain other funds in the Delaware Investments® Family of Funds (Participants), participates in a $35,000,000 revolving line of credit with The Bank of New York Mellon (BNY Mellon) to be used for temporary or emergency purposes as an additional source of liquidity to fund redemptions of investor shares. Under the agreement, Participants are charged an annual commitment fee, which is allocated across the Participants on the basis of each Participant’s allocation of the entire facility. The Participants may borrow up to a maximum of one third of their net assets under the agreement. The agreement expires on November 16, 2010. The Fund had no amounts outstanding as of July 31, 2010, or at any time during the year then ended.
9. Derivatives
U.S. GAAP requires enhanced disclosures that enable investors to understand: 1) how and why an entity uses derivatives, 2) how they are accounted for, and 3) how they affect an entity’s results of operations and financial position.
Swap Contracts — The Fund may enter into interest rate swap contracts, index swap contracts and CDS contracts in the normal course of pursuing its investment objectives. The Fund may use interest rate swaps to adjust the Fund’s sensitivity to interest rates or to hedge against changes in interest rates. Index swaps may be used to gain exposure to markets that the Fund invests in, such as the corporate bond market. The Fund may also use index swaps as a substitute for futures or options contracts if such contracts are not directly available to the Fund on favorable terms. The Fund may enter into CDS contracts in order to hedge against a credit e vent, to enhance total return or to gain exposure to certain securities or markets.
44
Interest Rate Swaps. An interest rate swap contract is an exchange of interest rates between counterparties. In one instance, an interest rate swap involves payments received by the Fund from another party based on a variable or floating interest rate, in return for making payments based on a fixed interest rate. An interest rate swap can also work in reverse with the Fund receiving payments based on a fixed interest rate and making payments based on a variable or floating interest rate. Interest rate swaps may be used to adjust the Fund’s sensitivity to interest rates or to hedge against changes in interest rates. Periodic payments on such contracts are accrued daily and recorded as unrealized appreciation/depreciation on swap contracts. Upon periodic payment/ receipt or termination of the contract, such amounts are recorded as realized gains or losses on swap contracts. The Fund’s maximum risk of loss from counterparty credit risk is the discounted net value of the cash flows to be received from/paid to the counterparty over the interest rate swap contract’s remaining life, to the extent that the amount is positive. This risk is mitigated by having a netting arrangement between the Fund and the counterparty and by the posting of collateral by the counterparty to the Fund to cover the Fund’s exposure to the counterparty.
Index Swaps. Index swaps involve commitments to pay interest in exchange for a market linked return based on a notional amount. To the extent the total return of the security, instrument or basket of instruments underlying the transaction exceeds the offsetting interest obligation, the Fund will receive a payment from the counterparty. To the extent the total return of the security, instrument or basket of instruments underlying the transaction falls short of the offsetting interest obligation, the Fund will make a payment to the counterparty. The change in value of swap contracts outstanding, if any, is recorded as unrealized appreciation or depreciation daily. A realized gain or loss is recorded on maturity or termination of the swap contract. The Fund’s maximum risk of loss from counterparty credit risk is the discounted net value of the cash flows to be received from/paid to the counterparty over the index swap contract’s r emaining life, to the extent that the amount is positive. This risk is mitigated by having a netting arrangement between the Fund and the counterparty and by the posting of collateral by the counterparty to the Fund to cover the Fund’s exposure to the counterparty.
Credit Default Swaps. A CDS contract is a risk-transfer instrument through which one party (purchaser of protection) transfers to another party (seller of protection) the financial risk of a credit event (as defined in the CDS agreement), as it relates to a particular referenced security or basket of securities (such as an index). In exchange for the protection offered by the seller of protection, the purchaser of protection agrees to pay the seller of protection a periodic amount at a stated rate that is applied to the notional amount of the CDS contract. In addition, an upfront payment may be made or received by the Fund in connection with an unwinding or assignment of a CDS contract. Upon the occurrence of a credit event, the seller of protection would pay the par (or other agreed-upon) value of the referenced security (or basket of securities) to the counterparty. Credit events generally include, among others, bankruptcy, failure to pa y, and obligation default.
45
Notes to financial statements
Delaware High-Yield Opportunities Fund
9. Derivatives (continued)
During the year ended July 31, 2010, the Fund entered into CDS contracts as a seller of protection. Periodic receipts on such contracts are accrued daily and recorded as unrealized losses (gains) on swap contracts. Upon receipt, such amounts are recorded as realized losses (gains) on swap contracts. Upfront payments made or received in connection with CDS contracts are amortized over the expected life of the CDS contracts as unrealized losses (gains) on swap contracts. The change in value of CDS contracts is recorded as unrealized appreciation or depreciation daily. A realized gain or loss is recorded upon a credit event (as defined in the CDS agreement) or the maturity or termination of the agreement. During the year ended July 31, 2010, the Fund did not enter into any CDS contracts as a purchaser of protection. There were no outstanding swap contracts at July 31, 2010.
CDS may involve greater risks than if the Fund had invested in the reference obligation directly. CDSs are subject to general market risk, liquidity risk, counterparty risk and credit risk. The Fund’s maximum risk of loss from counterparty credit risk, either as the seller of protection or the buyer of protection, is the fair value of the contract. This risk is mitigated by having a netting arrangement between the Fund and the counterparty and by the posting of collateral by the counterparty to the Fund to cover the Fund’s exposure to the counterparty.
Swaps Generally. Because there is no organized market for swap contracts, the value of open swaps may differ from that which would be realized in the event the Fund terminated its position in the agreement. Risks of entering into these contracts include the potential inability of the counterparty to meet the terms of the contracts. This type of risk is generally limited to the amount of favorable movement in the value of the underlying security, instrument or basket of instruments, if any, at the day of default. Risks also arise from potential losses from adverse market movements and such losses could exceed the unrealized amounts shown on the statement of net assets.
10. Securities Lending
The Fund, along with other funds in the Delaware Investments® Family of Funds, may lend their securities pursuant to a security lending agreement (Lending Agreement) with BNY Mellon. With respect to each loan, if on any business day the aggregate market value of securities collateral plus cash collateral held is less than the aggregate market value of the securities which are the subject of such loan, the borrower will be notified to provide additional collateral by the end of the following business day which, together with the collateral already held, will be not less than the applicable collateral requirements for such security loan. If the aggregate market value of securities collateral and cash collateral held with respect to a security loan exceeds the applicable collateral requirement, upon request of the borrower BNY Mellon must return enough collateral to the borrow er by the end of the following business day to reduce the value of the remaining collateral to the applicable collateral requirement for such security loan. As a result of the foregoing, the value of the collateral held with respect to a loaned security may be temporarily more or less than the value of security on loan.
46
Cash collateral received is generally invested in the BNY Mellon Securities Lending Overnight Fund (the “Collective Trust”) established by BNY Mellon for the purpose of investment on behalf of clients participating in its securities lending programs. The Collective Trust may invest in U.S. government securities and high quality corporate debt, asset-backed and other money market securities and in repurchase agreements collateralized by such securities, provided that the Collective Trust will only hold such assets with a maturity of one business day or less (“Overnight Assets”). The Collective Trust seeks to maintain a net asset value per unit of $1.00, but there can be no assurance that it will always be able to do so. The Fund may incur investment losses as a result of investing securities lending collateral in the Collective Trust or another collateral investment pool. This could occur if an investment in a collat eral investment pool defaulted or if it were necessary to liquidate assets in the collateral investment pool to meet returns on outstanding security loans at a time when the collateral investment pool’s net asset value per unit was less than $1.00. Under those circumstances, the Fund may not receive an amount from the collateral investment pool that is equal in amount to the collateral the Fund would be required to return to the borrower of the securities and the Fund would be required to make up for this shortfall. Effective April 20, 2009, BNY Mellon transferred the assets of the Fund’s previous collateral investment pool other than cash and Overnight Assets to the BNY Mellon SL DBT II Liquidating Fund (the “Liquidating Fund”), effectively bifurcating the previous collateral investment pool. The Fund’s exposure to the Liquidating Fund is expected to decrease as the Liquidating Fund’s assets mature or are sold. In October 2008, BNY Mellon transferred certain distressed se curities from the previous collateral investment pool into the Mellon GSL Reinvestment Trust II. The Fund can also accept U.S. government securities and letters of credit (non-cash collateral) in connection with securities loans. In the event of default or bankruptcy by the lending agent, realization and/ or retention of the collateral may be subject to legal proceedings. In the event the borrower fails to return loaned securities and the collateral received is insufficient to cover the value of the loaned securities and provided such collateral shortfall is not the result of investment losses, the lending agent has agreed to pay the amount of the shortfall to the Fund, or at the discretion of the lending agent, replace the loaned securities. The Fund continues to record dividends or interest, as applicable, on the securities loaned and are subject to change in value of the securities loaned that may occur during the term of the loan. The Fund has the right under the Lending Agreement to recover the securiti es from the borrower on demand. With respect to security loans collateralized by cash collateral, the earnings from the collateral investments are shared among the Fund, the security lending agent and the borrower. The Fund records security lending income net of allocations to the security lending agent and the borrower.
At July 31, 2010, the value of securities on loan was $25,324,416, for which cash collateral was received and invested in accordance with the lending agreement. At July 31, 2010, the value of invested collateral was $25,929,963. Such investments are presented on the statement of net assets under the caption “Securities Lending Collateral.”
47
Notes to financial statements
Delaware High-Yield Opportunities Fund
11. Credit and Market Risk
The Fund invests in high yield fixed income securities, which carry ratings of BB or lower by Standard & Poor’s Ratings Group (S&P) and/or Ba or lower by Moody’s Investors Service, Inc. (Moody’s). Investments in these higher yielding securities are generally accompanied by a greater degree of credit risk than higher rated securities. Additionally, lower rated securities may be more susceptible to adverse economic and competitive industry conditions than investment-grade securities.
The Fund may invest up to 15% of its net assets in illiquid securities, which may include securities with contractual restrictions on resale, securities exempt from registration under Rule 144A of the Securities Act of 1933, as amended, and other securities which may not be readily marketable. The relative illiquidity of these securities may impair the Fund from disposing of them in a timely manner and at a fair price when it is necessary or desirable to do so. While maintaining oversight, the Fund’s Board has delegated to DMC the day-to-day functions of determining whether individual securities are liquid for purposes of the Fund’s limitation on investments in illiquid assets. Securities eligible for resale pursuant to Rule 144A, which are determined to be liquid, are not subject to the Fund’s 15% limit on investments in illiquid securities. Rule 144A and illiquid securities have been identified on the statement of net a ssets.
12. Contractual Obligations
The Fund enters into contracts in the normal course of business that contain a variety of indemnifications. The Fund’s maximum exposure under these arrangements is unknown. However, the Fund has not had prior claims or losses pursuant to these contracts. Management has reviewed the Fund’s existing contracts and expects the risk of loss to be remote.
13. Subsequent Events
Management has determined no material events or transactions occurred subsequent to July 3, 2010 that would require recognition or disclosure in the Fund’s financial statements.
48
14. Tax Information (Unaudited)
The information set forth below is for the Fund’s fiscal year as required by federal income tax laws. Shareholders, however, must report distributions on a calendar year basis for income tax purposes, which may include distributions for portions of two fiscal years of a fund. Accordingly, the information needed by shareholders for income tax purposes will be sent to them in January of each year. Please consult your tax advisor for proper treatment of this information.
For the fiscal year ended July 31, 2010, the Fund designates distributions paid during the year as follows:
| (A) Ordinary Income Distribution (Tax Basis) | 100% |
(A) is based on a percentage of the Fund’s total distributions.
49
Report of independent
registered public accounting firm
To the Board of Trustees of Delaware Group® Income Funds and the
Shareholders of Delaware High-Yield Opportunities Fund:
In our opinion, the accompanying statement of net assets and the related statements of operations and of changes in net assets and the financial highlights present fairly, in all material respects, the financial position of Delaware High-Yield Opportunities Fund (one of the series constituting Delaware Group Income Funds, hereafter referred to as the “Fund”) at July 31, 2010, and the results of its operations, the changes in its net assets and the financial highlights for the year then ended, in conformity with accounting principles generally accepted in the United States of America. These financial statements and financial highlights (hereafter referred to as “financial statements”) are the responsibility of the Fund’s management; our responsibility is to express an opinion on these financial statements based on our audit. We conducted our audit of these financial statements in accordance with the standards o f the Public Company Accounting Oversight Board (United States). Those standards require that we plan and perform the audit to obtain reasonable assurance about whether the financial statements are free of material misstatement. An audit includes examining, on a test basis, evidence supporting the amounts and disclosures in the financial statements, assessing the accounting principles used and significant estimates made by management, and evaluating the overall financial statement presentation. We believe that our audit, which included confirmation of securities at July 31, 2010 by correspondence with the custodian, provides a reasonable basis for our opinion. The statement of changes in net assets for the year ended July 31, 2009 and the financial highlights for each of the four years in the period ended July 31, 2009 were audited by other independent accountants whose report dated September 21, 2009 expressed an unqualified opinion on those statements.
PricewaterhouseCoopers LLP
Philadelphia, Pennsylvania
September 22, 2010
50
Other Fund information
(Unaudited)
Delaware High-Yield Opportunities Fund
Proxy Results
At Joint Special Meetings of Shareholders of Delaware Group® Income Funds (the “Trust”), on behalf of Delaware High-Yield Opportunities Fund (the “Fund”), the shareholders of the Fund voted to (i) elect a Board of Trustees for the Trust at a meeting held on November 12, 2009 and reconvened to March 16, 2010; and to (ii) approve a new investment advisory agreement between the Trust, on behalf of the Fund, and Delaware Management Company at a meeting held on November 12, 2009. At the meeting, the following people were elected to serve as Independent Trustees: Thomas L. Bennett, John A. Fry, Anthony D. Knerr, Lucinda S. Landreth, Ann R. Leven, Thomas F. Madison, Janet L. Yeomans, and J. Richard Zecher. In addition, Patrick P. Coyne was elected to serve as an Interested Trustee.
The following proposals were submitted for a vote of the shareholders:
1. To elect a Board of Trustees for the Trust.
| | | | | % of | | % of | | | | % of | | % of |
| | | | | Outstanding | | Shares | | | | Outstanding | | Shares |
| | | Shares Voted For | | Shares | | Voted | | Shares Withheld | | Shares | | Voted |
| Thomas L. Bennett | | 177,463,481.025 | | 64.960 | | 96.382 | | 6,662,426.895 | | 2.439 | | 3.618 |
| Patrick P. Coyne | | 177,537,391.529 | | 64.987 | | 96.422 | | 6,588,516.391 | | 2.412 | | 3.578 |
| John A. Fry | | 177,569,351.590 | | 64.999 | | 96.439 | | 6,556,556.330 | | 2.400 | | 3.561 |
| Anthony D. Knerr | | 177,501,127.825 | | 64.974 | | 96.402 | | 6,624,780.095 | | 2.425 | | 3.598 |
| Lucinda S. Landreth | | 177,497,831.093 | | 64.973 | | 96.400 | | 6,628,076.827 | | 2.426 | | 3.600 |
| Ann R. Leven | | 177,337,196.822 | | 64.914 | | 96.313 | | 6,788,711.098 | | 2.485 | | 3.687 |
| Thomas F. Madison | | 177,494,821.896 | | 64.972 | | 96.399 | | 6,631,086.024 | | 2.427 | | 3.601 |
| Janet L. Yeomans | | 177,526,408.755 | | 64.983 | | 96.416 | | 6,599,499.165 | | 2.416 | | 3.584 |
| J. Richard Zecher | | 177,459,458.860 | | 64.959 | | 96.379 | | 6,666,449.060 | | 2.440 | | 3.621 |
| 2. | To approve a new investment advisory agreement between each Fund and Delaware Management Company, a series of Delaware Management Business Trust. |
| Shares Voted For | 56,595,744.220 |
| Percentage of Outstanding Shares | 52.533% |
| Percentage of Shares Voted | 70.296% |
| Shares Voted Against | 951,872.119 |
| Percentage of Outstanding Shares | 0.883% |
| Percentage of Shares Voted | 1.182% |
| Shares Abstained | 1,215,593.671 |
| Percentage of Outstanding Shares | 1.129% |
| Percentage of Shares Voted | 1.510% |
| Broker Non-Votes | 21,747,483.479 |
51
Other Fund information
(Unaudited)
Delaware High-Yield Opportunities Fund
Change in Independent Registered Public Accounting Firm
Due to independence matters under the Securities and Exchange Commission’s auditor independence rules relating to the January 4, 2010 acquisition of Delaware Investments (including DMC, DDLP and DSC) by Macquarie Group, Ernst & Young LLP (E&Y) has resigned as the independent registered public accounting firm for Delaware Group® Income Funds (the Trust) effective May 20, 2010. At a meeting held on May 20, 2010, the Board of Trustees of the Fund, upon recommendation of the Audit Committee, selected PricewaterhouseCoopers LLP (PwC) to serve as the independent registered public accounting firm for the Trust for the fiscal year ending July 31, 2010. During the fiscal years ended July 31, 2009 and 2008, E&Y’s audit reports on the financial statements of the Fund did not contain any adverse opinion or disclaimer of opinion, nor were they qualified or modifi ed as to uncertainty, audit scope, or accounting principles. In addition, there were no disagreements between the Trust and E&Y on accounting principles, financial statements disclosures or audit scope, which, if not resolved to the satisfaction of E&Y, would have caused them to make reference to the disagreement in their reports. Neither the Trust nor anyone on its behalf has consulted with PwC at any time prior to their selection with respect to the application of accounting principles to a specified transaction, either completed or proposed or the type of audit opinion that might be rendered on the Fund’s financial statements.
52
Board of trustees/directors and officers addendum
Delaware Investments® Family of Funds
A mutual fund is governed by a Board of Trustees/Directors (“Trustees”), which has oversight responsibility for the management of a fund’s business affairs. Trustees establish procedures and oversee and review the performance of the investment manager, the distributor, and others who perform services for the fund. The independent fund trustees, in particular, are advocates for
| Name, Address, | | Position(s) | | Length of |
| and Birth Date | | Held with Fund(s) | | Time Served |
| Interested Trustees | | | | |
| | | | | |
| Patrick P. Coyne1 | | Chairman, President, | | Chairman and Trustee |
| 2005 Market Street | | Chief Executive Officer, | | since August 16, 2006 |
| Philadelphia, PA 19103 | | and Trustee | | |
| April 1963 | | | | President and |
| | | | | Chief Executive Officer |
| | | | | since August 1, 2006 |
| | | | | |
| | | | | |
| | | | | |
| | | | | |
| | | | | |
| | | | | |
| | | | | |
| | | | | |
| | | | | |
| | | | | |
| | | | | |
| | | | | |
| | | | | |
| | | | | |
| | | | | |
| | | | | |
| | | | | |
| | | | | |
1 Patrick P. Coyne is considered to be an “Interested Trustee” because he is an executive officer of the Fund’s(s’) investment advisor.
54
shareholder interests. Each trustee has served in that capacity since he or she was elected to or appointed to the Board of Trustees, and will continue to serve until his or her retirement or the election of a new trustee in his or her place. The following is a list of the Trustees and Officers with certain background and related information.
| | | Number of Portfolios in | | |
| Principal Occupation(s) | | Fund Complex Overseen | | Other Directorships |
| During Past 5 Years | | by Trustee or Officer | | Held by Trustee or Officer |
| |
| |
| Patrick P. Coyne has served in | | 81 | | Director |
| various executive capacities | | | | Kaydon Corp. |
| at different times at | | | | |
| Delaware Investments.2 | | | | Board of Governors Member |
| | | | | Investment Company |
| | | | | Institute (ICI) |
| | | | | |
| | | | | Finance Committee Member |
| | | | | St. John Vianney Roman |
| | | | | Catholic Church |
| |
| | | | | Board of Trustees |
| | | | | Agnes Irwin School |
| |
| | | | | Member of Investment |
| | | | | Committee |
| | | | | Cradle of Liberty Council, |
| | | | | BSA |
| | | | | (2007 – 2010) |
| | | | | |
| |
| | | | | |
| | | | | |
2 Delaware Investments is the marketing name for Delaware Management Holdings, Inc. and its subsidiaries, including the Fund’s(s’) investment advisor, principal underwriter, and its transfer agent.
55
Board of trustees/directors and officers addendum
Delaware Investments® Family of Funds
| Name, Address, | | Position(s) | | Length of |
| and Birth Date | | Held with Fund(s) | | Time Served |
| Independent Trustees | | | | |
| |
| Thomas L. Bennett | | Trustee | | Since March 2005 |
| 2005 Market Street | | | | |
| Philadelphia, PA 19103 | | | | |
| October 1947 | | | | |
| |
| |
| |
| |
| |
| |
| |
| |
| |
| |
| John A. Fry | | Trustee | | Since January 2001 |
| 2005 Market Street | | | | |
| Philadelphia, PA 19103 | | | | |
| May 1960 | | | | |
| |
| |
| |
| |
| |
| |
| |
| |
| Anthony D. Knerr | | Trustee | | Since April 1990 |
| 2005 Market Street | | | | |
| Philadelphia, PA 19103 | | | | |
| December 1938 | | | | |
| |
| |
| Lucinda S. Landreth | | Trustee | | Since March 2005 |
| 2005 Market Street | | | | |
| Philadelphia, PA 19103 | | | | |
| June 1947 | | | | |
| |
56
| | | Number of Portfolios in | | |
| Principal Occupation(s) | | Fund Complex Overseen | | Other Directorships |
| During Past 5 Years | | by Trustee or Officer | | Held by Trustee or Officer |
| | | | | |
| |
| Private Investor | | 81 | | Director |
| (March 2004–Present) | | | | Bryn Mawr Bank Corp. (BMTC) |
| | | | | |
| Investment Manager | | | | Chairman of Investment |
| Morgan Stanley & Co. | | | | Committee |
| (January 1984–March 2004) | | | | Pennsylvania Academy of |
| | | | | Fine Arts |
| | | | | |
| | | | | Investment Committee and |
| | | | | Governance Committee |
| | | | | Member |
| | | | | Pennsylvania Horticultural |
| | | | | Society |
| |
| President | | 81 | | Director |
| Drexel University | | | | Community Health Systems |
| (August 2010–Present) | | | | |
| | | | | Director — Ecore |
| President | | | | International |
| Franklin & Marshall College | | | | (2009-2010) |
| (July 2002–July 2010) | | | | |
| | | | | Director — Allied |
| Executive Vice President | | | | Barton Securities Holdings |
| University of Pennsylvania | | | | (2005 to 2008) |
| (April 1995–June 2002) | | | | |
| |
| Founder and | | 81 | | None |
| Managing Director | | | | |
| Anthony Knerr & Associates | | | | |
| (Strategic Consulting) | | | | |
| (1990–Present) | | | | |
| |
| Chief Investment Officer | | 81 | | None |
| Assurant, Inc. (Insurance) | | | | |
| (2002–2004) | | | | |
| | | | | |
| |
57
Board of trustees/directors and officers addendum
Delaware Investments® Family of Funds
| Name, Address, | | Position(s) | | Length of |
| and Birth Date | | Held with Fund(s) | | Time Served |
| Independent Trustees (continued) | | | | |
| |
| Ann R. Leven | | Trustee | | Since October 1989 |
| 2005 Market Street | | | | |
| Philadelphia, PA 19103 | | | | |
| November 1940 | | | | |
| |
| |
| |
| |
| |
| |
| Thomas F. Madison | | Trustee | | Since May 19973 |
| 2005 Market Street | | | | |
| Philadelphia, PA 19103 | | | | |
| February 1936 | | | | |
| |
| |
| |
| |
| |
| |
| |
| |
| | | | | |
| | | | | |
| | | | | |
| | | | | |
| |
| |
| |
| | | | | |
| | | | | |
| | | | | |
| | | | | |
| | | | | |
| | | | | |
| | | | | |
| | | | | |
| |
3 In 1997, several funds managed by Voyageur Fund Managers, Inc. (the “Voyageur Funds”) were incorporated into the Delaware Investments Family of Funds. Mr. Madison served as a director of the Voyageur Funds from 1993 until 1997.
58
| | | Number of Portfolios in | | |
| Principal Occupation(s) | | Fund Complex Overseen | | Other Directorships |
| During Past 5 Years | | by Trustee or Officer | | Held by Trustee or Officer |
| | | | | |
| |
| Consultant | | 81 | | Director and Audit |
| ARL Associates | | | | Committee Chair – |
| (Financial Planning) | | | | Systemax Inc. |
| (1983–Present) | | | | (2001 – 2009) |
| | | | | |
| | | | | Director and Audit |
| | | | | Committee Chairperson – |
| | | | | Andy Warhol Foundation |
| | | | | (1999 – 2007) |
| |
| President and | | 81 | | Director and Chair of |
| Chief Executive Officer | | | | Compensation Committee, |
| MLM Partners, Inc. | | | | Governance Committee |
| (Small Business Investing | | | | Member |
| and Consulting) | | | | CenterPoint Energy |
| (January 1993–Present) | | | | |
| | | | | Lead Director and Chair of |
| | | | | Audit and Governance |
| | | | | Committees, Member of |
| | | | | Compensation Committee |
| | | | | Digital River, Inc. |
| | | | | |
| | | | | Director and Chair of |
| | | | | Governance Committee, |
| | | | | Audit Committee |
| | | | | Member |
| | | | | Rimage Corporation |
| | | | | |
| | | | | Director and Chair of |
| | | | | Compensation Committee |
| | | | | Spanlink Communications |
| | | | | |
| | | | | Lead Director and Member of |
| | | | | Compensation and |
| | | | | Governance Committees |
| | | | | Valmont Industries, Inc. |
| | | | | (1987 – 2010) |
| |
59
Board of trustees/directors and officers addendum
Delaware Investments® Family of Funds
| Name, Address, | | Position(s) | | Length of |
| and Birth Date | | Held with Fund(s) | | Time Served |
| Independent Trustees (continued) | | | | |
| |
| Thomas F. Madison | | | | |
| 2005 Market Street | | | | |
| Philadelphia, PA 19103 | | | | |
| February 1936 | | | | |
| |
| Janet L. Yeomans | | Trustee | | Since April 1999 |
| 2005 Market Street | | | | |
| Philadelphia, PA 19103 | | | | |
| July 1948 | | | | |
| |
| |
| |
| |
| J. Richard Zecher | | Trustee | | Since March 2005 |
| 2005 Market Street | | | | |
| Philadelphia, PA 19103 | | | | |
| July 1940 | | | | |
| |
| |
| | | | | |
| | | | | |
| | | | | |
| | | | | |
| | | | | |
| | | | | |
| | | | | |
| | | | | |
| | | | | |
| | | | | |
| | | | | |
| | | | | |
| | | | | |
| | | | | |
| |
60
| | | Number of Portfolios in | | |
| Principal Occupation(s) | | Fund Complex Overseen | | Other Directorships |
| During Past 5 Years | | by Trustee or Officer | | Held by Trustee or Officer |
| | | | | |
| |
| | | | | Director |
| | | | | Banner Health |
| | | | | (1996 to 2007) |
| | | | | |
| |
| Vice President and Treasurer | | 81 | | Director |
| (January 2006–Present) | | | | Okabena Company |
| Vice President — Mergers & Acquisitions | | | | |
| (January 2003–January 2006), and | | | | |
| Vice President | | | | |
| (July 1995–January 2003) | | | | |
| 3M Corporation | | | | |
| |
| Founder | | 81 | | Director and Audit |
| Investor Analytics | | | | Committee Member |
| (Risk Management) | | | | Investor Analytics |
| (May 1999–Present) | | | | |
| | | | | |
| Founder | | | | Director |
| Sutton Asset Management | | | | Oxigene, Inc. |
| (Hedge Fund) | | | | (2003 to 2008) |
| (September 1996–Present) | | | | |
| | | | | |
| | | | | |
| | | | | |
| | | | | |
| | | | | |
| | | | | |
| | | | | |
| | | | | |
| | | | | |
| | | | | |
| | | | | |
| |
61
Board of trustees/directors and officers addendum
Delaware Investments® Family of Funds
| Name, Address, | | Position(s) | | Length of |
| and Birth Date | | Held with Fund(s) | | Time Served |
| Officers | | | | |
| | | | | |
| David F. Connor | | Vice President, | | Vice President since |
| 2005 Market Street | | Deputy General | | September 2000 |
| Philadelphia, PA 19103 | | Counsel, and Secretary | | and Secretary since |
| December 1963 | | | | October 2005 |
| |
| |
| Daniel V. Geatens | | Vice President | | Treasurer |
| 2005 Market Street | | and Treasurer | | since October 25, 2007 |
| Philadelphia, PA 19103 | | | | |
| October 1972 | | | | |
| |
| David P. O’Connor | | Senior Vice President, | | Senior Vice President, |
| 2005 Market Street | | General Counsel, | | General Counsel, and |
| Philadelphia, PA 19103 | | and Chief Legal Officer | | Chief Legal Officer |
| February 1966 | | | | since October 2005 |
| |
| Richard Salus | | Senior Vice President | | Chief Financial Officer |
| 2005 Market Street | | and Chief Financial Officer | | since November 2006 |
| Philadelphia, PA 19103 | | | | |
| October 1963 | | | | |
| |
The Statement of Additional Information for the Fund(s) includes additional information about the Trustees and Officers and is available, without charge, upon request by calling 800 523-1918.
62
| | | Number of Portfolios in | | |
| Principal Occupation(s) | | Fund Complex Overseen | | Other Directorships |
| During Past 5 Years | | by Trustee or Officer | | Held by Trustee or Officer |
| |
| |
| David F. Connor has served as | | 81 | | None4 |
| Vice President and Deputy | | | | |
| General Counsel of | | | | |
| Delaware Investments | | | | |
| since 2000. | | | | |
| |
| Daniel V. Geatens has served | | 81 | | None4 |
| in various capacities at | | | | |
| different times at | | | | |
| Delaware Investments. | | | | |
| |
| David P. O’Connor has served in | | 81 | | None4 |
| various executive and legal | | | | |
| capacities at different times | | | | |
| at Delaware Investments. | | | | |
| |
| Richard Salus has served in | | 81 | | None4 |
| various executive capacities | | | | |
| at different times at | | | | |
| Delaware Investments. | | | | |
| |
4 David F. Connor, Daniel V. Geatens, David P. O’Connor, and Richard Salus serve in similar capacities for the six portfolios of the Optimum Fund Trust, which have the same investment advisor, principal underwriter, and transfer agent as the registrant.
63
About the organization
| Board of trustees | | | |
| | | | |
Patrick P. Coyne
Chairman, President, and
Chief Executive Officer
Delaware Investments®
Family of Funds
Philadelphia, PA Thomas L. Bennett
Private Investor
Rosemont, PA John A. Fry
President
Drexel University
Philadelphia, PA | Anthony D. Knerr
Founder and Managing
Director
Anthony Knerr &
Associates
New York, NY Lucinda S. Landreth
Former Chief Investment
Officer
Assurant, Inc.
Philadelphia, PA
| Ann R. Leven
Consultant
ARL Associates
New York, NY Thomas F. Madison
President and
Chief Executive Officer
MLM Partners, Inc.
Minneapolis, MN
| Janet L. Yeomans
Vice President and
Treasurer
3M Corporation
St. Paul, MN J. Richard Zecher
Founder
Investor Analytics
Scottsdale, AZ |
| | | | |
| Affiliated officers | | | |
| | | | |
David F. Connor
Vice President, Deputy
General Counsel, and
Secretary
Delaware Investments
Family of Funds
Philadelphia, PA | Daniel V. Geatens
Vice President and
Treasurer
Delaware Investments
Family of Funds
Philadelphia, PA | David P. O’Connor
Senior Vice President,
General Counsel,
and Chief Legal Officer
Delaware Investments
Family of Funds
Philadelphia, PA | Richard Salus
Senior Vice President and
Chief Financial Officer
Delaware Investments
Family of Funds
Philadelphia, PA |
This annual report is for the information of Delaware High-Yield Opportunities Fund shareholders, but it may be used with prospective investors when preceded or accompanied by a current prospectus for Delaware High-Yield Opportunities Fund and the Delaware Investments Fund fact sheet for the most recently completed calendar quarter. These documents are available at www.delawareinvestments.com. The prospectus sets forth details about charges, expenses, investment objectives, and operating policies of the investment company. You should read the prospectus carefully before you invest. The figures in this report represent past results that are not a guarantee of future results. The return and principal value of an investment in the investment company will fluctuate so that shares, when redeemed, may be worth more or less than their original cost. |
Delaware Investments is the marketing name of Delaware Management Holdings, Inc. and its subsidiaries.
The Fund files its complete schedule of portfolio holdings with the Securities and Exchange Commission (SEC) for the first and third quarters of each fiscal year on Form N-Q. The Fund’s Forms N-Q, as well as a description of the policies and procedures that the Fund uses to determine how to vote proxies (if any) relating to portfolio securities are available without charge (i) upon request, by calling 800 523-1918; and (ii) on the SEC’s Web site at www.sec.gov. In addition, a description of the policies and procedures that the Fund uses to determine how to vote proxies (if any) relating to portfolio securities and the Fund’s Schedule of Investments are available without charge on the Fund’s Web site at www.delawareinvestments.com. The Fund’s Forms N-Q may be reviewed and copied at the SEC’s Public Reference Room in Washington, D.C.; information on the operation of the Public Reference Room may be obtaine d by calling 800 SEC-0330.
Information (if any) regarding how the Fund voted proxies relating to portfolio securities during the most recently disclosed 12-month period ended June 30 is available without charge (i) through the Fund’s Web site at www.delawareinvestments.com; and (ii) on the SEC’s Web site at www.sec.gov.
64
Item 2. Code of Ethics
The registrant has adopted a code of ethics that applies to the registrant’s principal executive officer, principal financial officer, principal accounting officer or controller, or persons performing similar functions, regardless of whether these individuals are employed by the registrant or a third party. A copy of the registrant’s Code of Business Ethics has been posted on the Delaware Investments Internet Web site at www.delawareinvestments.com. Any amendments to the Code of Business Ethics, and information on any waiver from its provisions granted by the registrant, will also be posted on this Web site within five business days of such amendment or waiver and will remain on the Web site for at least 12 months.
Item 3. Audit Committee Financial Expert
The registrant’s Board of Trustees/Directors has determined that each member of the registrant’s Audit Committee is an audit committee financial expert, as defined below. For purposes of this item, an “audit committee financial expert” is a person who has the following attributes:
a. An understanding of generally accepted accounting principles and financial statements;
b. The ability to assess the general application of such principles in connection with the accounting for estimates, accruals, and reserves;
c. Experience preparing, auditing, analyzing, or evaluating financial statements that present a breadth and level of complexity of accounting issues that are generally comparable to the breadth and complexity of issues that can reasonably be expected to be raised by the registrant’s financial statements, or experience actively supervising one or more persons engaged in such activities;
d. An understanding of internal controls and procedures for financial reporting; and
e. An understanding of audit committee functions.
An “audit committee financial expert” shall have acquired such attributes through:
a. Education and experience as a principal financial officer, principal accounting officer, controller, public accountant, or auditor or experience in one or more positions that involve the performance of similar functions;
b. Experience actively supervising a principal financial officer, principal accounting officer, controller, public accountant, auditor, or person performing similar functions;
c. Experience overseeing or assessing the performance of companies or public accountants with respect to the preparation, auditing, or evaluation of financial statements; or
d. Other relevant experience.
The registrant’s Board of Trustees/Directors has also determined that each member of the registrant’s Audit Committee is independent. In order to be “independent” for purposes of this item, the Audit Committee member may not: (i) other than in his or her capacity as a member of the Board of Trustees/Directors or any committee thereof, accept directly or indirectly any consulting, advisory or other compensatory fee from the issuer; or (ii) be an “interested person” of the registrant as defined in Section 2(a)(19) of the Investment Company Act of 1940.
The names of the audit committee financial experts on the registrant’s Audit Committee are set forth below:
Thomas L. Bennett 1
John A. Fry
Thomas F. Madison
Janet L. Yeomans
J. Richard Zecher
Item 4. Principal Accountant Fees and Services
(a) Audit fees.
The aggregate fees billed for services provided to the registrant by its independent auditors for the audit of the registrant’s annual financial statements and for services normally provided by the independent auditors in connection with statutory and regulatory filings or engagements were $114,700 for the fiscal year ended July 31, 2010.
____________________
1 The instructions to Form N-CSR require disclosure on the relevant experience of persons who qualify as audit committee financial experts based on “other relevant experience.” The Board of Trustees/Directors has determined that Mr. Bennett qualifies as an audit committee financial expert by virtue of his education, Chartered Financial Analyst designation, and his experience as a credit analyst, portfolio manager and the manager of other credit analysts and portfolio managers.
The aggregate fees billed for services provided to the registrant by its independent auditors for the audit of the registrant’s annual financial statements and for services normally provided by the independent auditors in connection with statutory and regulatory filings or engagements were $84,300 for the fiscal year ended July 31, 2009.
(b) Audit-related fees.
The aggregate fees billed by the registrant’s independent auditors for services relating to the performance of the audit of the registrant’s financial statements and not reported under paragraph (a) of this Item were $0 for the fiscal year ended July 31, 2010.
The aggregate fees billed by the registrant’s independent auditors for services relating to the performance of the audit of the financial statements of the registrant’s investment adviser and other service providers under common control with the adviser and that relate directly to the operations or financial reporting of the registrant were $ 84,000 for the registrant’s fiscal year ended July 31, 2010. The percentage of these fees relating to services approved by the registrant’s Audit Committee pursuant to the de minimis exception from the pre-approval requirement in Rule 2-01(c)(7)(i)(C) of Regulation S-X was 0%. These audit-related services were as follows: audit procedures performed on Delaware Investments for its consolidation into Macquarie's financial statements as of March 31, 2010.
The aggregate fees billed by the registrant’s independent auditors for services relating to the performance of the audit of the registrant’s financial statements and not reported under paragraph (a) of this Item were $0 for the fiscal year ended July 31, 2009.
The aggregate fees billed by the registrant’s independent auditors for services relating to the performance of the audit of the financial statements of the registrant’s investment adviser and other service providers under common control with the adviser and that relate directly to the operations or financial reporting of the registrant were $19,074 for the registrant’s fiscal year ended July 31, 2009. The percentage of these fees relating to services approved by the registrant’s Audit Committee pursuant to the de minimis exception from the pre-approval requirement in Rule 2-01(c)(7)(i)(C) of Regulation S-X was 0%. These audit-related services were as follows: issuance of report concerning transfer agent's system of internal accounting control pursuant to Rule 17Ad-13 of the Securities Exchange Act.
(c) Tax fees.
The aggregate fees billed by the registrant’s independent auditors for tax-related services provided to the registrant were $21,150 for the fiscal year ended July 31, 2010. The percentage of these fees relating to services approved by the registrant’s Audit Committee pursuant to the de minimis exception from the pre-approval re quirement in Rule 2-01(c)(7)(i)(C) of Regulation S-X was 0%.
The aggregate fees billed by the registrant’s independent auditors for tax-related services provided to the registrant’s investment adviser and other service providers under common control with the adviser and that relate directly to the operations or financial reporting of the registrant were $0 for the registrant’s fiscal year ended July 31, 2010.
The aggregate fees billed by the registrant’s independent auditors for tax-related services provided to the registrant were $ 28,550 for the fiscal year ended July 31, 2009. The percentage of these fees relating to services approved by the registrant’s Audit Committee pursuant to the de minimis exception from the pre-approval requirement in Rule 2-01(c)(7)(i)(C) of Regulation S-X was 0%. These tax-related services were as follows: review of income tax returns and review of annual excise distribution calculations.
The aggregate fees billed by the registrant’s independent auditors for tax-related services provided to the registrant’s adviser and other service providers under common control with the adviser and that relate directly to the operations or financial reporting of the registrant were $0 for the registrant’s fiscal year ended July 31, 2009.
(d) All other fees.
The aggregate fees billed for all services provided by the independent auditors to the registrant other than those set forth in paragraphs (a), (b) and (c) of this Item were $0 for the fiscal year ended July 31, 2010.
The aggregate fees billed for all services other than those set forth in paragraphs (b) and (c) of this Item provided by the registrant’s independent auditors to the registrant’s adviser and other service providers under common control with the adviser and that relate directly to the operations or financial reporting of the registrant were $0 for the registrant’s fiscal year ended July 31, 2010.
The aggregate fees billed for all services provided by the independent auditors to the registrant other than those set forth in paragraphs (a), (b) and (c) of this Item were $0 for the fiscal year ended July 31, 2009.
The aggregate fees billed for all services other than those set forth in paragraphs (b) and (c) of this Item provided by the registrant’s independent auditors to the registrant’s adviser and other service providers under common control with the adviser and that relate directly to the operations or financial reporting of the registrant were $0 for the registrant’s fiscal year ended July 31, 2009.
(e) The registrant’s Audit Committee has established pre-approval policies and procedures as permitted by Rule 2-01(c)(7)(i)(B) of Regulation S-X (the “Pre-Approval Policy”) with respect to services provided by the registrant’s independent auditors. Pursuant to the Pre-Approval Policy, the Audit Committee has pre-approved the services set forth in the table below with respect to the registrant up to the specified fee limits. Certain fee limits are based on aggregate fees to the registrant and other registrants within the Delaware Investments Family of Funds.
| Service | Range of Fees |
| Audit Services | |
| Statutory audits or financial audits for new Funds | up to $25,000 per Fund |
| Services associated with SEC registration statements (e.g., Form N-1A, Form N-14, etc.), periodic reports and other documents filed with the SEC or other documents issued in connection with securities offerings (e.g., comfort letters for closed-end Fund offerings, consents), and assistance in responding to SEC comment letters | up to $10,000 per Fund |
| Consultations by Fund management as to the accounting or disclosure treatment of transactions or events and/or the actual or potential impact of final or proposed rules, standards or interpretations by the SEC, FASB, or other regulatory or standard-setting bodies (Note: Under SEC rules, some consultations may be considered “audit-related services” rather than “audit services”) | up to $25,000 in the aggregate |
| Audit-Related Services | |
| Consultations by Fund management as to the accounting or disclosure treatment of transactions or events and /or the actual or potential impact of final or proposed rules, standards or interpretations by the SEC, FASB, or other regulatory or standard-setting bodies (Note: Under SEC rules, some consultations may be considered “audit services” rather than “audit-related services”) | up to $25,000 in the aggregate |
| Tax Services | |
| U.S. federal, state and local and international tax planning and advice (e.g., consulting on statutory, regulatory or administrative developments, evaluation of Funds’ tax compliance function, etc.) | up to $25,000 in the aggregate |
| U.S. federal, state and local tax compliance (e.g., excise distribution reviews, etc.) | up to $5,000 per Fund |
| Review of federal, state, local and international income, franchise and other tax returns | up to $5,000 per Fund |
Under the Pre-Approval Policy, the Audit Committee has also pre-approved the services set forth in the table below with respect to the registrant’s investment adviser and other entities controlling, controlled by or under common control with the investment adviser that provide ongoing services to the registrant (the “Control Affiliates”) up to the specified fee limit. This fee limit is based on aggregate fees to the investment adviser and its Control Affiliates.
| Service | Range of Fees |
| Non-Audit Services | |
| Services associated with periodic reports and other documents filed with the SEC and assistance in responding to SEC comment letters | up to $10,000 in the aggregate |
The Pre-Approval Policy requires the registrant’s independent auditors to report to the Audit Committee at each of its regular meetings regarding all services initiated since the last such report was rendered, including those services authorized by the Pre-Approval Policy.
(f) Not applicable.
(g) The aggregate non-audit fees billed by the registrant’s independent auditors for services rendered to the registrant and to its investment adviser and other service providers under common control with the adviser were $0 and $228,264 for the registrant’s fiscal years ended July 31, 2010 and July 31, 2009, respectively.
(h) In connection with its selection of the independent auditors, the registrant’s Audit Committee has considered the independent auditors’ provision of non-audit services to the registrant’s investment adviser and other service providers under common control with the adviser that were not required to be pre-approved pursuant to Rule 2-01(c)(7)(ii) of Regulation S-X. The Audit Committee has determined that the independent auditors’ provision of these services is compatible with maintaining the auditors’ independence.
Item 5. Audit Committee of Listed Registrants
Not applicable.
Item 6. Investments
(a) Included as part of report to shareholders filed under Item 1 of this Form N-CSR.
(b) Divestment of securities in accordance with Section 13(c) of the Investment Company Act of 1940.
Not applicable.
Item 7. Disclosure of Proxy Voting Policies and Procedures for Closed-End Management Investment Companies
Not applicable.
Item 8. Portfolio Managers of Closed-End Management Investment Companies
Not applicable.
Item 9. Purchases of Equity Securities by Closed-End Management Investment Company and Affiliated Purchasers
Not applicable.
Item 10. Submission of Matters to a Vote of Security Holders
Not applicable.
Item 11. Controls and Procedures
The registrant’s principal executive officer and principal financial officer have evaluated the registrant’s disclosure controls and procedures within 90 days of the filing of this report and have concluded that they are effective in providing reasonable assurance that the information required to be disclosed by the registrant in its reports or statements filed under the Securities Exchange Act of 1934 is recorded, processed, summarized and reported within the time periods specified in the rules and forms of the Securities and Exchange Commission.
There were no significant changes in the registrant’s internal control over financial reporting that occurred during the second fiscal quarter of the period covered by the report to stockholders included herein (i.e., the registrant’s fourth fiscal quarter) that have materially affected, or are reasonably likely to materially affect, the registrant’s internal control over financial reporting.
Item 12. Exhibits
| (a) | (1) | Code of Ethics |
| | | |
| | | Not applicable. |
| | | |
| | (2) Certifications of Principal Executive Officer and Principal Financial Officer pursuant to Rule 30a-2 under the Investment Company Act of 1940 are attached hereto as Exhibit 99.CERT. |
| | |
| | (3) Written solicitations to purchase securities pursuant to Rule 23c-1 under the Securities Exchange Act of 1934. |
| | |
| | | Not applicable. |
| | | |
| (b) | Certifications pursuant to Section 906 of the Sarbanes-Oxley Act of 2002 are furnished herewith as Exhibit 99.906CERT. |
SIGNATURES
Pursuant to the requirements of the Securities Exchange Act of 1934 and the Investment Company Act of 1940, the registrant has duly caused this report to be signed on its behalf, by the undersigned, thereunto duly authorized.
Name of Registrant: Delaware Group® Income Funds
| /S/ PATRICK P. COYNE |
| By: | Patrick P. Coyne |
| Title: | Chief Executive Officer |
| Date: | October 1, 2010 |
Pursuant to the requirements of the Securities Exchange Act of 1934 and the Investment Company Act of 1940, this report has been signed below by the following persons on behalf of the registrant and in the capacities and on the dates indicated.
| /S/ PATRICK P. COYNE |
| By: | Patrick P. Coyne |
| Title: | Chief Executive Officer |
| Date: | October 1, 2010 |
| /S/ RICHARD SALUS |
| By: | Richard Salus |
| Title: | Chief Financial Officer |
| Date: | October 1, 2010 |