UNITED STATES SECURITIES AND EXCHANGE COMMISSION
Washington, D.C. 20549
FORM N-CSR
CERTIFIED SHAREHOLDER REPORT OF REGISTERED MANAGEMENT
INVESTMENT COMPANIES
Investment Company Act file number: 811-02071
Exact name of registrant as specified in charter: Delaware Group® Income Funds
Address of principal executive offices:
2005 Market Street
Philadelphia, PA 19103
Name and address of agent for service:
David F. Connor, Esq.
2005 Market Street
Philadelphia, PA 19103
Registrant’s telephone number, including area code: (800) 523-1918
Date of fiscal year end: July 31
Date of reporting period: July 31, 2011
Item 1. Reports to Stockholders

Annual report Delaware Core Bond Fund
July 31, 2011 Fixed income mutual fund |
| Carefully consider the Fund’s investment objectives, risk factors, charges, and expenses before investing. This and other information can be found in the Fund’s prospectus and, if available, its summary prospectus, which may be obtained by visiting www.delawareinvestments.com or calling 800 523-1918. Investors should read the prospectus and, if available, the summary prospectus carefully before investing. |
You can obtain shareholder reports and prospectuses online instead of in the mail.
Visit www.delawareinvestments.com/edelivery. |
Experience Delaware Investments
Delaware Investments is committed to the pursuit of consistently superior asset management and unparalleled client service. We believe in our investment processes, which seek to deliver consistent results, and in convenient services that help add value for our clients.
If you are interested in learning more about creating an investment plan, contact your financial advisor.
You can learn more about Delaware Investments or obtain a prospectus for Delaware Core Bond Fund at www.delawareinvestments.com.
Manage your investments online
- 24-hour access to your account information
- Obtain share prices
- Check your account balance and recent transactions
- Request statements or literature
- Make purchases and redemptions
Delaware Management Holdings, Inc. and its subsidiaries (collectively known by the marketing name of Delaware Investments) are wholly owned subsidiaries of Macquarie Group Limited, a global provider of banking, financial, advisory, investment and funds management services.
Investments in Delaware Core Bond Fund are not and will not be deposits with or liabilities of Macquarie Bank Limited ABN 46 008 583 542 and its holding companies, including their subsidiaries or related companies (Macquarie Group), and are subject to investment risk, including possible delays in repayment and loss of income and capital invested. No Macquarie Group company guarantees or will guarantee the performance of the Fund, the repayment of capital from the Fund, or any particular rate of return.
| Table of contents | | |
| Portfolio management review | | 1 |
| Performance summary | | 4 |
| Disclosure of Fund expenses | | 8 |
| Security type/sector allocation | | 10 |
| Statement of net assets | | 11 |
| Statement of assets and liabilities | | 24 |
| Statement of operations | | 25 |
| Statements of changes in net assets | | 26 |
| Financial highlights | | 28 |
| Notes to financial statements | | 36 |
| Report of independent registered | | |
| public accounting firm | | 47 |
| Other Fund information | | 48 |
| Board of trustees/directors and | | |
| officers addendum | | 50 |
| About the organization | | 60 |
Unless otherwise noted, views expressed herein are current as of July 31, 2011, and subject to change.
Funds are not FDIC insured and are not guaranteed. It is possible to lose the principal amount invested.
Mutual fund advisory services provided by Delaware Management Company, a series of Delaware Management Business Trust, which is a registered investment advisor. Delaware Investments, a member of Macquarie Group, refers to Delaware Management Holdings, Inc. and its subsidiaries, including the Fund’s distributor, Delaware Distributors, L.P. Macquarie Group refers to Macquarie Group Limited and its subsidiaries and affiliates worldwide.
© 2011 Delaware Management Holdings, Inc.
All third-party trademarks cited are the property of their respective owners.
| Portfolio management review |
| Delaware Core Bond Fund | August 9, 2011 |
| Performance preview (for the year ended July 31, 2011) | | | | |
| Delaware Core Bond Fund (Class A shares) | | 1-year return | | +4.49% |
| Barclays Capital U.S. Aggregate Index (benchmark) | | 1-year return | | +4.44% |
Past performance does not guarantee future results.
For complete, annualized performance for Delaware Core Bond Fund, please see the table on page 4. The performance of Class A shares excludes the applicable sales charge and reflects the reinvestment of all distributions.
Index performance returns do not reflect any management fees, transaction costs, or expenses. Indices are unmanaged and one cannot invest directly in an index. |
The Fund’s fiscal year ended July 31, 2011, was characterized by an increasingly challenging economic environment. Bonds with lower credit ratings and higher yields enjoyed solid results for much of the fiscal year. However, in the final months of the fiscal year, many investors began to favor higher-quality securities as debt-related troubles heated up in Europe and the U.S. economy slowed.
Mounting data indicated a faltering global economic recovery and raised new fears of a double-dip recession in the United States. The nation’s gross domestic product, which measures the combined dollar value of goods and services the country produces, grew by an estimated 1.3% in the second quarter of 2011, on the heels of a mere 0.4% increase in the first three months of 2011. Unemployment was an especially big trouble spot, with the U.S. jobless rate finishing July 2011 at 9.1%, up from 8.8% as recently as March 2011. (Sources: U.S. Commerce Department, U.S. Labor Department.)
At the start of the Fund’s fiscal year, in an effort to stimulate the economy, the Federal Reserve announced a second round of quantitative easing, commonly known as QE2. The plan involved the Fed purchasing enormous quantities of government bonds to
| Relative to its benchmark, the Fund benefited from many of its higher-quality corporate bond positions, and from maintaining a significant overweighting in the corporate bond category. |
1
Portfolio management review
Delaware Core Bond Fund
lower long-term interest rates. In conjunction with a payroll tax cut and a two-year extension of federal income-tax rates following last year’s November elections, it led to a rally in riskier assets such as equities and corporate bonds.
Generally, investors remained tolerant of risk for several months during the Fund’s fiscal year. By spring 2011, however, risk aversion gradually returned to the market. Many bond investors once again began to favor higher-quality debt, while returns on assets such as commercial mortgage-backed securities (CMBS), nonagency residential mortgage-backed securities (MBS), high yield corporate bonds, and equities began to lag Treasurys, which generally benefited from their perceived increased safety.
Within the Fund
For the fiscal year, Delaware Core Bond Fund Class A shares returned +4.49% at net asset value and -0.24% at maximum offer price (both returns include reinvested distributions). In comparison, the Fund’s benchmark, the Barclays Capital U.S. Aggregate Index, returned +4.44%. For complete annualized performance for Delaware Core Bond Fund, please see the table on page 4.
Corporate and international government debt contributed
Relative to its benchmark, the Fund benefited from many of its higher-quality corporate bond positions, and from maintaining a significant overweighting in the corporate bond category. More specifically, increased exposure to high-quality U.S. banks and insurance companies helped, as did the Fund’s allocation to utility, natural resource, healthcare, and communication company bonds, as well as its stake in energy pipeline securities in the form of master limited partnerships.
Periodic investments in the government securities of Australia, Canada, and Brazil — three countries that benefited from conservative fiscal management, low deficits, and low debt ratios — also contributed to the Fund’s performance. The decline in the value of the dollar relative to these countries’ currencies also boosted returns for the Fund.
Mortgage-backed underperformance
For much of its fiscal year, the Fund’s portfolio was conservatively positioned with respect to its residential MBS and CMBS allocations. For example, the Fund had little exposure to riskier, nonagency-backed MBS. Among CMBS, we focused on securities with high credit ratings and whose issue dates occurred when underwriting standards were stricter (for example, many CMBS issued during 2006 and 2007 have lower credit quality). This positioning hampered performance for much of the Fund’s fiscal year, as many bond investors looked to obtain additional yield from riskier securities. However, during the final three months of the fiscal year, our defensive positioning helped the Fund close some of the gap.
A second source of underperformance was the Fund’s short position in the euro currency, given our concern about the region’s mounting debt challenges combined with slow economic growth. At times throughout the fiscal year, this strategy was unsuccessful due to, in our view, the euro’s surprising strength relative to the dollar. Of final note, the Fund’s more-limited exposure to high yield corporate bonds provided an opportunity cost for the first nine months of its fiscal year — essentially, owning more of these securities could have potentially helped relative performance during that time. That
2
said, this more defensive positioning generally proved helpful in the last several months of the Fund’s fiscal year, when many investors favored bonds with less credit risk.
Relatively few adjustments to the Fund
Changes to the Fund’s broad strategic allocations were generally modest throughout the fiscal year. Many of the tactical adjustments we made were more defensive in nature as we sought to reduce the portfolio’s risk exposure. Entering the fiscal year, for example, we had limited the Fund’s exposure to lower-rated, high yielding bonds. We did more of this in spring 2011 to further reduce the portfolio’s credit risk amid increased market volatility and economic uncertainty. This approach generally worked well in the final months of the fiscal year, as high yield bonds struggled amid an increasingly risk-averse market backdrop.
Interest rate positioning is not typically a part of our overall portfolio management approach, but in late 2010, we identified a tactical need to make the Fund less sensitive to rising rates, given the prevailing movements in rates at that time. Within several months, however, the potential for any further rate increases seemed reduced, and we once again allowed the portfolio to be somewhat more sensitive to interest rate movements. We maintained this positioning throughout the rest of the Fund’s fiscal year.
Two more modest portfolio adjustments were to reduce the Fund’s allocation to U.S. financial company bonds — which we believed were potentially vulnerable to European debt troubles and a slowing U.S. economy — and to focus on higher-rated credits.
Adhering to our approach
At the end of the fiscal year, we believed the Fund’s relatively defensive positioning was appropriate, given the risks we saw to the global economy. Another risk on the horizon was the potential for investors to perceive deterioration in U.S. credit quality, which could lead to higher bond yields in the future.
Despite the uncertainty, we intend to continue following our overall investment approach, concentrating on fixed income securities that we believe offer good value relative to their risks. We continue to focus on high-quality corporate bonds and on certain international bonds issued by what we view as financially healthy nations, while remaining relatively underweight in U.S. government securities as of the end of the Fund’s fiscal year, whose performance potential we viewed as more limited as of that time.
3
| Performance summary |
| Delaware Core Bond Fund | July 31, 2011 |
The performance data quoted represent past performance; past performance does not guarantee future results. Investment return and principal value will fluctuate so your shares, when redeemed, may be worth more or less than their original cost. Please obtain the performance data current for the most recent month end by calling 800 523-1918 or visiting our website at www.delawareinvestments.com/performance. Current performance may be lower or higher than the performance data quoted.
| Fund performance1,2 | | Average annual total returns through July 31, 2011 |
| | | 1 year | | 5 years | | 10 years | | Lifetime |
| Class A (Est. March 12, 1996) | | | | | | | | |
| Excluding sales charge | | +4.49% | | +6.53% | | +5.41% | | n/a |
| Including sales charge | | -0.24% | | +5.56% | | +4.93% | | n/a |
| Class C (Est. Sept. 30, 2009) | | | | | | | | |
| Excluding sales charge | | +3.70% | | n/a | | n/a | | +5.55% |
| Including sales charge | | +2.70% | | n/a | | n/a | | +5.55% |
| Class R (Est. Sept. 30, 2009) | | | | | | | | |
| Excluding sales charge | | +3.76% | | n/a | | n/a | | +6.03% |
| Including sales charge | | +3.76% | | n/a | | n/a | | +6.03% |
| Institutional Class (Est. Sept. 30, 2009) | | | | | | | | |
| Excluding sales charge | | +4.83% | | n/a | | n/a | | +6.93% |
| Including sales charge | | +4.83% | | n/a | | n/a | | +6.93% |
1 Returns reflect the reinvestment of all distributions and are presented both with and without the applicable sales charges described below. Returns do not reflect the deduction of taxes the shareholder would pay on Fund distributions or redemptions of Fund shares.
Delaware Core Bond Fund is the successor to The Intermediate Fixed Income Portfolio of the Delaware Pooled® Trust pursuant to the reorganization (Reorganization) of The Intermediate Fixed Income Portfolio into the Fund. Prior to the Reorganization, the Fund had no investment operations. Accordingly, for periods before Sept. 30, 2009, the performance information shown above that includes data from that period and on pages 6 and 7 is historical information for The Intermediate Fixed Income Portfolio. The Intermediate Fixed Income Portfolio had the same investment objective and a similar investment strategy as the Fund, and was managed by the same portfolio managers. Because the Fund’s fees and expenses are higher than those of The Intermediate Fixed Income Portfolio, the Fund’s performance would have been lower than that shown for relevant periods in this report.
Expense limitations were in effect for certain classes during some or all of the periods shown in the “Fund performance” chart. The current expenses for each class are listed on the “Fund expense ratios” table on page 6. Performance would have been lower had expense limitations not been in effect.
4
Class A shares are sold with a maximum front-end sales charge of up to 4.50%, and have an annual distribution and service fee of up to 0.30% of average daily net assets. Performance for Class A shares, excluding sales charges, assumes that no front-end sales charge applied. This fee has been contractually limited to 0.25% of average daily net assets from Nov. 26, 2010, through Nov. 28, 2011.
Class C shares are sold with a contingent deferred sales charge of 1.00% if redeemed during the first 12 months. They are also subject to an annual distribution and service fee of up to 1.00% of average daily net assets.
Performance for Class C shares, excluding sales charges, assumes either that contingent deferred sales charges did not apply or that the investment was not redeemed.
Class R shares are available only for certain retirement plan products. They are sold without a sales charge and have an annual distribution and service fee of up to 0.60% of average daily net assets, which has been limited contractually to 0.50% from Nov. 26, 2010, through Nov. 28, 2011.
Institutional Class shares are available without sales or asset-based distribution charges only to certain eligible institutional accounts.
The “Fund performance” table and the “Performance of a $10,000 investment” graph do not reflect the deduction of taxes the shareholder would pay on Fund distributions or redemptions of Fund shares.
Fixed income securities and bond funds can lose value, and investors can lose principal, as interest rates rise. They also may be affected by economic conditions that hinder an issuer’s ability to make interest and principal payments on its debt.
The Fund may also be subject to prepayment risk, the risk that the principal of a fixed income security that is held by the Fund may be prepaid prior to maturity, potentially forcing the Fund to reinvest that money at a lower interest rate.
The Fund may invest in derivatives, which may involve additional expenses and are subject to risk, including the risk that an underlying security or securities index moves in the opposite direction from what the portfolio manager anticipated. A derivative transaction depends upon the counterparties’ ability to fulfill their contractual obligations.
International investments entail risks not ordinarily associated with U.S. investments including fluctuation in currency values, differences in accounting principles, or economic or political instability in other nations.
The Fund may experience portfolio turnover in excess of 100%, which could result in higher transaction costs and tax liability.
Per Standard & Poor’s credit rating agency, bonds rated below AAA, including A, are more susceptible to the adverse effects of changes in circumstances and economic conditions than those in higher-rated categories, but the obligor’s capacity to meet its financial commitment on the obligation is still strong. Bonds rated BBB exhibit adequate protection parameters, although adverse economic conditions or changing circumstances are more likely to lead to a weakened capacity of the obligor to meet its financial commitments. Bonds rated BB, B, and CCC are regarded as having significant speculative characteristics with BB indicating the least degree of speculation.
5
Performance summary
Delaware Core Bond Fund
2 The Fund’s expense ratios, as described in the most recent prospectus, are disclosed in the following “Fund expense ratios” table. Delaware Investments has agreed to reimburse certain expenses and/or waive certain fees in order to prevent total fund operating expenses (excluding certain fees and expenses) from exceeding 0.65% of the Fund’s average daily net assets from Nov. 26, 2010, through Nov. 28, 2011. Please see the most recent prospectus and any applicable supplement(s) for additional information on these fee waivers and/ or reimbursements.
| Fund expense ratios | | Class A | | Class C | | Class R | | Institutional Class |
| Total annual operating expenses | | 2.25% | | 2.95% | | 2.55% | | 1.95% |
| (without fee waivers) | | | | | | | | |
| Net expenses | | 0.90% | | 1.65% | | 1.15% | | 0.65% |
| (including fee waivers, if any) | | | | | | | | |
| Type of waiver | | Contractual | | Contractual | | Contractual | | Contractual |
6
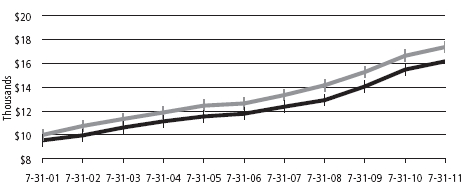
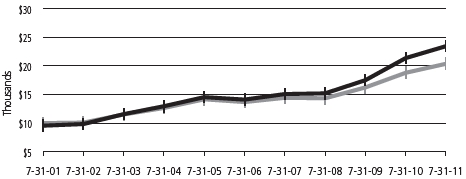
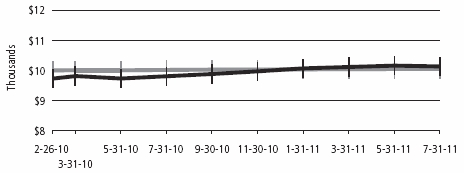
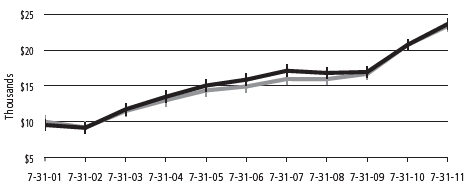
Performance of a $10,000 investment1
Average annual total returns from July 31, 2001, through July 31, 2011
| For period beginning July 31, 2001, through July 31, 2011 | Starting value | Ending value |
| | Barclays Capital U.S. Aggregate Index | $10,000 | $17,369 |
| | Delaware Core Bond Fund — Class A shares | $9,550 | $16,170 |
1 The “Performance of a $10,000 investment” graph assumes $10,000 invested in Class A shares of the Fund on July 31, 2001, and includes the effect of a 4.50% front-end sales charge and the reinvestment of all distributions. The graph does not reflect the deduction of taxes the shareholders would pay on Fund distributions or redemptions of Fund shares. Expense limitations were in effect for some or all of the periods shown. Performance would have been lower had expense limitations not been in effect. Current expenses are listed in the “Fund expense ratios” table on page 6. Please note additional details on pages 4 through 7.
The chart also assumes $10,000 invested in the Barclays Capital U.S. Aggregate Index as of July 31, 2001. The Barclays Capital U.S. Aggregate Index is a broad composite of more than 8,000 securities that tracks the investment grade domestic bond market.
Index performance returns do not reflect any management fees, transaction costs, or expenses. Indices are unmanaged and one cannot invest directly in an index. Past performance is not a guarantee of future results.
Performance of other Fund classes will vary due to different charges and expenses.
| | | Nasdaq symbols | | CUSIPs | |
| Class A | | | DPFIX | | | 245908710 | |
| Class C | | | DCBCX | | | 245908694 | |
| Class R | | | DEBRX | | | 245908686 | |
| Institutional Class | | | DCBIX | | | 245908678 | |
7
Disclosure of Fund expenses
For the six-month period from February 1, 2011 to July 31, 2011
As a shareholder of the Fund, you incur two types of costs: (1) transaction costs, including sales charges (loads) on purchase payments, reinvested dividends, or other distributions; redemption fees; and exchange fees; and (2) ongoing costs, including management fees; distribution and/or service (12b-1) fees; and other Fund expenses. This example is intended to help you understand your ongoing costs (in dollars) of investing in the Fund and to compare these costs with the ongoing costs of investing in other mutual funds.
The example is based on an investment of $1,000 invested at the beginning of the period and held for the entire six-month period from February 1, 2011 to July 31, 2011.
Actual expenses
The first section of the table shown, “Actual Fund return,” provides information about actual account values and actual expenses. You may use the information in this section of the table, together with the amount you invested, to estimate the expenses that you paid over the period. Simply divide your account value by $1,000 (for example, an $8,600 account value divided by $1,000 = 8.6), then multiply the result by the number in the first section under the heading entitled “Expenses Paid During Period” to estimate the expenses you paid on your account during this period.
Hypothetical example for comparison purposes
The second section of the table shown, “Hypothetical 5% return,” provides information about hypothetical account values and hypothetical expenses based on the Fund’s actual expense ratio and an assumed rate of return of 5% per year before expenses, which is not the Fund’s actual return. The hypothetical account values and expenses may not be used to estimate the actual ending account balance or expenses you paid for the period. You may use this information to compare the ongoing costs of investing in the Fund and other funds. To do so, compare this 5% hypothetical example with the 5% hypothetical examples that appear in the shareholder reports of the other funds.
Please note that the expenses shown in the table are meant to highlight your ongoing costs only and do not reflect any transactional costs, such as sales charges (loads), redemption fees, or exchange fees. Therefore, the second section of the table is useful in comparing ongoing costs only, and will not help you determine the relative total costs of owning different funds. In addition, if these transactional costs were included, your costs would have been higher. The Fund’s expenses shown in the table reflect fee waivers in effect. The expenses shown in the table assume reinvestment of all dividends and distributions.
8
Delaware Core Bond Fund
Expense analysis of an investment of $1,000
| | | Beginning | | Ending | | | | Expenses |
| | | Account Value | | Account Value | | Annualized | | Paid During Period |
| | | 2/1/11 | | 7/31/11 | | Expense Ratio | | 2/1/11 to 7/31/11* |
| Actual Fund return | | | | | | | | | | | | | | | | | |
| Class A | | | $ | 1,000.00 | | | | $ | 1,043.10 | | | 0.90% | | | $ | 4.56 | |
| Class C | | | | 1,000.00 | | | | | 1,039.10 | | | 1.65% | | | | 8.34 | |
| Class R | | | | 1,000.00 | | | | | 1,035.80 | | | 1.15% | | | | 5.80 | |
| Institutional Class | | | | 1,000.00 | | | | | 1,044.10 | | | 0.65% | | | | 3.29 | |
| Hypothetical 5% return (5% return before expenses) | | | | | | | | |
| Class A | | | $ | 1,000.00 | | | | $ | 1,020.33 | | | 0.90% | | | $ | 4.51 | |
| Class C | | | | 1,000.00 | | | | | 1,016.61 | | | 1.65% | | | | 8.25 | |
| Class R | | | | 1,000.00 | | | | | 1,019.09 | | | 1.15% | | | | 5.76 | |
| Institutional Class | | | | 1,000.00 | | | | | 1,021.57 | | | 0.65% | | | | 3.26 | |
*“Expenses Paid During Period” are equal to the Fund’s annualized expense ratio, multiplied by the average account value over the period, multiplied by 181/365 (to reflect the one-half year period).
9
| Security type/sector allocation | |
| Delaware Core Bond Fund | As of July 31, 2011 |
Sector designations may be different than the sector designations presented in other Fund materials. The sector designations may represent the investment manager’s internal sector classifications, which may result in the sector designations for one fund being different than another fund’s sector designations.
| Security type/sector | | Percentage of net assets |
| Agency Asset-Backed Securities | | | 0.09 | % | |
| Agency Collateralized Mortgage Obligations | | | 2.01 | % | |
| Agency Mortgage-Backed Securities | | | 27.90 | % | |
| Commercial Mortgage-Backed Securities | | | 4.70 | % | |
| Corporate Bonds | | | 27.73 | % | |
| Banking | | | 6.64 | % | |
| Basic Industry | | | 2.01 | % | |
| Brokerage | | | 0.32 | % | |
| Capital Goods | | | 0.12 | % | |
| Communications | | | 2.86 | % | |
| Consumer Cyclical | | | 0.79 | % | |
| Consumer Non-Cyclical | | | 3.93 | % | |
| Electric | | | 0.77 | % | |
| Energy | | | 2.27 | % | |
| Financials | | | 0.86 | % | |
| Insurance | | | 1.41 | % | |
| Natural Gas | | | 1.96 | % | |
| Real Estate | | | 1.21 | % | |
| Technology | | | 1.64 | % | |
| Transportation | | | 0.94 | % | |
| Municipal Bond | | | 0.79 | % | |
| Non-Agency Asset-Backed Securities | | | 3.05 | % | |
| Regional Bonds | | | 0.65 | % | |
| Sovereign Bonds | | | 0.91 | % | |
| U.S. Treasury Obligations | | | 30.87 | % | |
| Preferred Stock | | | 0.22 | % | |
| Short-Term Investments | | | 17.18 | % | |
| Total Value of Securities | | | 116.10 | % | |
| Liabilities Net of Receivables and Other Assets | | | (16.10 | %) | |
| Total Net Assets | | | 100.00 | % | |
10
Statement of net assets
| Delaware Core Bond Fund | July 31, 2011 |
| | | Principal amount (U.S. $) | | Value (U.S. $) |
| Agency Asset-Backed Securities – 0.09% | | | | | |
| | Fannie Mae Grantor Trust | | | | | |
| | Series 2003-T4 2A5 5.407% 9/26/33 | $ | 11,004 | | $ | 11,496 |
| | Fannie Mae Whole Loan | | | | | |
| | Series 2001-W2 AS5 6.473% 10/25/31 | | 9,281 | | | 9,593 |
| | •Series 2002-W11 AV1 0.527% 11/25/32 | | 1,247 | | | 1,201 |
| Total Agency Asset-Backed Securities | | | | | |
| | (cost $21,420) | | | | | 22,290 |
| | | | | | | |
| Agency Collateralized Mortgage Obligations – 2.01% | | | | | |
| | Fannie Mae REMICs | | | | | |
| | Series 2004-49 EB 5.00% 7/25/24 | | 64,378 | | | 70,847 |
| | Series 2010-116 Z 4.00% 10/25/40 | | 36,184 | | | 32,116 |
| | Fannie Mae Whole Loan | | | | | |
| | Series 2003-W15 2A7 5.55% 8/25/43 | | 24,334 | | | 26,611 |
| | Freddie Mac REMICs | | | | | |
| | Series 2326 ZQ 6.50% 6/15/31 | | 41,243 | | | 47,548 |
| | Series 3027 DE 5.00% 9/15/25 | | 60,000 | | | 66,108 |
| | Series 3656 PM 5.00% 4/15/40 | | 10,000 | | | 10,822 |
| | •Series 3800 AF 0.687% 2/15/41 | | 172,489 | | | 172,471 |
| | GNMA Series 2010-113 KE 4.50% 9/20/40 | | 50,000 | | | 52,038 |
| | NCUA Guaranteed Notes | | | | | |
| | Series 2010-C1 A2 2.90% 10/29/20 | | 20,000 | | | 20,411 |
| • | Vendee Mortgage Trust | | | | | |
| | Series 2000-1 1A 6.814% 1/15/30 | | 21,639 | | | 25,374 |
| Total Agency Collateralized Mortgage | | | | | |
| | Obligations (cost $509,929) | | | | | 524,346 |
| | | | | | |
| Agency Mortgage-Backed Securities – 27.90% | | | | | |
| • | Fannie Mae ARM | | | | | |
| | 2.474% 12/1/33 | | 18,965 | | | 19,886 |
| | 2.499% 8/1/34 | | 24,346 | | | 25,599 |
| | Fannie Mae Relocation 30 yr 5.00% 1/1/34 | | 1,868 | | | 1,977 |
| | Fannie Mae S.F. 15 yr | | | | | |
| | 3.50% 7/1/26 | | 255,000 | | | 262,576 |
| | 4.00% 7/1/25 | | 218,291 | | | 229,142 |
| | 4.00% 8/1/25 | | 292,403 | | | 306,939 |
| | 4.00% 11/1/25 | | 312,307 | | | 328,856 |
| | 5.00% 9/1/25 | | 578,407 | | | 621,400 |
| | 8.00% 10/1/14 | | 63 | | | 64 |
11
Statement of net assets
Delaware Core Bond Fund
| | | Principal amount (U.S. $) | | Value (U.S. $) |
| Agency Mortgage-Backed Securities (continued) | | | | | |
| | Fannie Mae S.F. 15 yr TBA | | | | | |
| | 3.50% 9/1/26 | $ | 180,000 | | $ | 184,472 |
| | 4.50% 9/1/26 | | 1,010,000 | | | 1,071,074 |
| | Fannie Mae S.F. 20 yr 5.50% 8/1/28 | | 56,445 | | | 61,364 |
| | Fannie Mae S.F. 30 yr | | | | | |
| | 5.00% 12/1/37 | | 4,819 | | | 5,154 |
| | 5.00% 2/1/38 | | 4,318 | | | 4,615 |
| | 5.00% 7/1/40 | | 183,345 | | | 195,980 |
| | 6.00% 9/1/38 | | 263,514 | | | 290,131 |
| | 6.00% 3/1/39 | | 90,855 | | | 100,203 |
| | 7.50% 12/1/32 | | 5,094 | | | 5,997 |
| | 9.50% 4/1/18 | | 734 | | | 868 |
| | Fannie Mae S.F. 30 yr TBA | | | | | |
| | 4.00% 9/1/41 | | 510,000 | | | 516,216 |
| | 5.50% 9/1/41 | | 520,000 | | | 562,169 |
| | 6.00% 9/1/41 | | 1,795,000 | | | 1,969,382 |
| | 6.50% 8/1/41 | | 75,000 | | | 83,273 |
| • | Freddie Mac ARM | | | | | |
| | 2.48% 4/1/33 | | 5,621 | | | 5,666 |
| | 2.822% 4/1/34 | | 3,666 | | | 3,858 |
| | 5.029% 8/1/38 | | 221,107 | | | 237,854 |
| | 5.181% 7/1/36 | | 8,676 | | | 9,116 |
| | Freddie Mac Relocation 15 yr 3.50% 10/1/18 | | 2,273 | | | 2,352 |
| | Freddie Mac S.F. 15 yr | | | | | |
| | 5.00% 4/1/20 | | 11,796 | | | 12,763 |
| | 5.50% 7/1/24 | | 132,886 | | | 143,983 |
| | GNMA I S.F. 15 yr 7.50% 4/15/13 | | 251 | | | 256 |
| | GNMA I S.F. 30 yr 7.50% 2/15/32 | | 2,568 | | | 3,026 |
| Total Agency Mortgage-Backed Securities | | | | | |
| | (cost $7,220,493) | | | | | 7,266,211 |
| | | | | | |
| Commercial Mortgage-Backed Securities – 4.70% | | | | | |
| | Bank of America Merrill Lynch Commercial Mortgage | | | | | |
| | Series 2004-2 A3 4.05% 11/10/38 | | 12,612 | | | 12,767 |
| | Series 2005-1 A3 4.877% 11/10/42 | | 13,397 | | | 13,420 |
| | Bear Stearns Commercial Mortgage Securities | | | | | |
| | •Series 2005-PW10 A4 5.405% 12/11/40 | | 125,000 | | | 137,180 |
| | Series 2007-PW15 A4 5.331% 2/11/44 | | 25,000 | | | 26,330 |
| w• | Commercial Mortgage Pass Through Certificates | | | | | |
| | Series 2005-C6 A5A 5.116% 6/10/44 | | 120,000 | | | 130,480 |
12
| | | Principal amount (U.S. $) | | Value (U.S. $) |
| Commercial Mortgage-Backed Securities (continued) | | | | | |
| • | Credit Suisse Mortgage Capital Certificates | | | | | |
| | Series 2006-C1 AAB 5.422% 2/15/39 | $ | 18,103 | | $ | 19,058 |
| • | General Electric Capital Commercial Mortgage | | | | | |
| | Series 2005-C4 A2 5.305% 11/10/45 | | 8,391 | | | 8,387 |
| | Goldman Sachs Mortgage Securities II | | | | | |
| | •Series 2004-GG2 A6 5.396% 8/10/38 | | 20,000 | | | 21,571 |
| | Series 2005-GG4 A4 4.761% 7/10/39 | | 35,000 | | | 37,213 |
| | Series 2005-GG4 A4A 4.751% 7/10/39 | | 105,000 | | | 112,080 |
| | •Series 2006-GG6 A4 5.553% 4/10/38 | | 120,000 | | | 130,469 |
| • | JPMorgan Chase Commercial Mortgage Securities | | | | | |
| | Series 2005-LDP4 A4 4.918% 10/15/42 | | 30,000 | | | 32,476 |
| | Series 2005-LDP5 A4 5.205% 12/15/44 | | 15,000 | | | 16,434 |
| | Lehman Brothers-UBS Commercial Mortgage Trust | | | | | |
| | Series 2004-C1 A4 4.568% 1/15/31 | | 100,000 | | | 105,698 |
| | Morgan Stanley Capital I | | | | | |
| | Series 2005-HQ6 A4A 4.989% 8/13/42 | | 160,000 | | | 172,149 |
| | •Series 2007-T27 A4 5.641% 6/11/42 | | 190,000 | | | 210,944 |
| # | TimberStar Trust | | | | | |
| | Series 2006-1A A 144A 5.668% 10/15/36 | | 35,000 | | | 38,469 |
| Total Commercial Mortgage-Backed Securities | | | | | |
| | (cost $1,114,023) | | | | | 1,225,125 |
| | | | | | | |
| Corporate Bonds – 27.73% | | | | | |
| Banking – 6.64% | | | | | |
| | Abbey National Treasury Services 4.00% 4/27/16 | | 70,000 | | | 68,627 |
| # | Bank Nederlandse Gemeenten 144A | | | | | |
| | 1.75% 10/6/15 | | 40,000 | | | 40,365 |
| | 4.375% 2/16/21 | | 74,000 | | | 78,837 |
| | BB&T | | | | | |
| | 5.20% 12/23/15 | | 30,000 | | | 33,132 |
| | 5.25% 11/1/19 | | 101,000 | | | 108,479 |
| | Capital One Capital V 10.25% 8/15/39 | | 30,000 | | | 31,928 |
| | Capital One Financial 4.75% 7/15/21 | | 110,000 | | | 111,409 |
| | City National 5.25% 9/15/20 | | 30,000 | | | 31,373 |
| | Fifth Third Bancorp 3.625% 1/25/16 | | 85,000 | | | 87,235 |
| | Goldman Sachs Group | | | | | |
| | 5.25% 7/27/21 | | 40,000 | | | 40,911 |
| | 5.375% 3/15/20 | | 30,000 | | | 31,165 |
| | JPMorgan Chase 5.60% 7/15/41 | | 80,000 | | | 81,026 |
| | JPMorgan Chase Capital XXV 6.80% 10/1/37 | | 70,000 | | | 71,180 |
13
Statement of net assets
Delaware Core Bond Fund
| | | Principal amount (U.S. $) | | Value (U.S. $) |
| Corporate Bonds (continued) | | | | | |
| Banking (continued) | | | | | |
| | KeyCorp 5.10% 3/24/21 | $ | 105,000 | | $ | 110,063 |
| | PNC Funding | | | | | |
| | 5.125% 2/8/20 | | 170,000 | | | 185,762 |
| | 5.25% 11/15/15 | | 15,000 | | | 16,560 |
| | Santander Holdings USA 4.625% 4/19/16 | | 20,000 | | | 20,685 |
| | SunTrust Banks 3.60% 4/15/16 | | 20,000 | | | 20,545 |
| | SVB Financial Group 5.375% 9/15/20 | | 50,000 | | | 51,627 |
| | US Bancorp | | | | | |
| | 3.15% 3/4/15 | | 55,000 | | | 57,835 |
| | 4.125% 5/24/21 | | 80,000 | | | 82,386 |
| • | USB Capital IX 3.50% 10/29/49 | | 70,000 | | | 57,311 |
| | Wachovia | | | | | |
| | •0.619% 10/15/16 | | 20,000 | | | 18,714 |
| | 5.25% 8/1/14 | | 200,000 | | | 216,526 |
| | 5.625% 10/15/16 | | 35,000 | | | 38,887 |
| | Wells Fargo 4.60% 4/1/21 | | 35,000 | | | 36,502 |
| | | | | | | 1,729,070 |
| Basic Industry – 2.01% | | | | | |
| | Alcoa 6.75% 7/15/18 | | 70,000 | | | 79,945 |
| | ArcelorMittal | | | | | |
| | 5.50% 3/1/21 | | 50,000 | | | 51,316 |
| | 9.85% 6/1/19 | | 55,000 | | | 71,689 |
| # | Barrick North America Finance 144A | | | | | |
| | 5.70% 5/30/41 | | 40,000 | | | 41,270 |
| | Dow Chemical | | | | | |
| | 4.25% 11/15/20 | | 40,000 | | | 41,133 |
| | 8.55% 5/15/19 | | 68,000 | | | 89,969 |
| | International Paper 9.375% 5/15/19 | | 40,000 | | | 52,966 |
| | Lubrizol 5.50% 10/1/14 | | 15,000 | | | 16,908 |
| | Teck Resources | | | | | |
| | 4.75% 1/15/22 | | 45,000 | | | 47,082 |
| | 9.75% 5/15/14 | | 26,000 | | | 31,709 |
| | | | | | | 523,987 |
| Brokerage – 0.32% | | | | | |
| | Jefferies Group | | | | | |
| | 5.875% 6/8/14 | | 10,000 | | | 10,886 |
| | 6.45% 6/8/27 | | 15,000 | | | 15,234 |
| | Lazard Group 6.85% 6/15/17 | | 50,000 | | | 56,179 |
| | | | | | | 82,299 |
14
| | | Principal amount (U.S. $) | | Value (U.S. $) |
| Corporate Bonds (continued) | | | | | |
| Capital Goods – 0.12% | | | | | |
| | Republic Services | | | | | |
| | 4.75% 5/15/23 | $ | 20,000 | | $ | 20,678 |
| | 5.25% 11/15/21 | | 10,000 | | | 10,914 |
| | | | | | | 31,592 |
| Communications – 2.86% | | | | | |
| | AT&T 4.45% 5/15/21 | | 55,000 | | | 58,273 |
| # | Crown Castle Towers 144A 4.883% 8/15/20 | | 85,000 | | | 87,875 |
| | DIRECTV Holdings 5.00% 3/1/21 | | 20,000 | | | 21,384 |
| | Discovery Communications 4.375% 6/15/21 | | 65,000 | | | 67,140 |
| # | NBC Universal Media 144A 4.375% 4/1/21 | | 60,000 | | | 61,457 |
| | Qwest 8.375% 5/1/16 | | 90,000 | | | 107,101 |
| | Telefonica Emisiones | | | | | |
| | 5.462% 2/16/21 | | 15,000 | | | 15,070 |
| | 6.421% 6/20/16 | | 85,000 | | | 93,393 |
| | Time Warner Cable | | | | | |
| | 8.25% 2/14/14 | | 5,000 | | | 5,822 |
| | 8.25% 4/1/19 | | 45,000 | | | 57,756 |
| | Verizon Communications 4.60% 4/1/21 | | 100,000 | | | 107,689 |
| # | Vivendi 144A 6.625% 4/4/18 | | 55,000 | | | 63,277 |
| | | | | | | 746,237 |
| Consumer Cyclical – 0.79% | | | | | |
| | CVS Caremark 4.75% 5/18/20 | | 55,000 | | | 59,178 |
| | Historic TW 6.875% 6/15/18 | | 35,000 | | | 42,016 |
| | Time Warner 4.75% 3/29/21 | | 100,000 | | | 105,314 |
| | | | | | | 206,508 |
| Consumer Non-Cyclical – 3.93% | | | | | |
| | Amgen | | | | | |
| | 3.45% 10/1/20 | | 15,000 | | | 14,793 |
| | 4.10% 6/15/21 | | 105,000 | | | 108,024 |
| | Celgene 3.95% 10/15/20 | | 90,000 | | | 90,493 |
| | Coca-Cola Enterprises 3.50% 9/15/20 | | 75,000 | | | 74,546 |
| | Express Scripts 3.125% 5/15/16 | | 45,000 | | | 46,028 |
| | Kraft Foods 6.125% 8/23/18 | | 40,000 | | | 47,342 |
| | McKesson 4.75% 3/1/21 | | 170,000 | | | 185,168 |
| | Medco Health Solutions | | | | | |
| | 4.125% 9/15/20 | | 20,000 | | | 19,875 |
| | 7.125% 3/15/18 | | 65,000 | | | 77,838 |
15
Statement of net assets
Delaware Core Bond Fund
| | | Principal amount (U.S. $) | | Value (U.S. $) |
| Corporate Bonds (continued) | | | | | |
| Consumer Non-Cyclical (continued) | | | | | |
| | Quest Diagnostics | | | | | |
| | 4.70% 4/1/21 | $ | 120,000 | | $ | 127,382 |
| | 4.75% 1/30/20 | | 5,000 | | | 5,354 |
| | Whirlpool 4.85% 6/15/21 | | 40,000 | | | 40,853 |
| # | Woolworths 144A | | | | | |
| | 3.15% 4/12/16 | | 40,000 | | | 41,317 |
| | 4.55% 4/12/21 | | 40,000 | | | 41,987 |
| | Yale University 2.90% 10/15/14 | | 20,000 | | | 21,171 |
| | Zimmer Holdings 4.625% 11/30/19 | | 75,000 | | | 80,719 |
| | | | | | | 1,022,890 |
| Electric – 0.77% | | | | | |
| | Duke Energy Carolinas 3.90% 6/15/21 | | 50,000 | | | 51,958 |
| | Great Plains Energy 4.85% 6/1/21 | | 45,000 | | | 46,678 |
| | Southern California Edison 5.50% 8/15/18 | | 40,000 | | | 46,496 |
| • | Wisconsin Energy 6.25% 5/15/67 | | 55,000 | | | 55,507 |
| | | | | | | 200,639 |
| Energy – 2.27% | | | | | |
| | Noble Energy 8.25% 3/1/19 | | 50,000 | | | 65,577 |
| | Noble Holding International 4.625% 3/1/21 | | 75,000 | | | 79,136 |
| | Petrobras International Finance 5.375% 1/27/21 | | 55,000 | | | 58,856 |
| | Pride International 6.875% 8/15/20 | | 55,000 | | | 66,295 |
| # | Ras Laffan Liquefied Natural Gas III 144A | | | | | |
| | 5.832% 9/30/16 | | 75,645 | | | 83,020 |
| | Transocean 6.50% 11/15/20 | | 100,000 | | | 117,541 |
| | Weatherford International 9.625% 3/1/19 | | 35,000 | | | 46,921 |
| # | Woodside Finance 144A | | | | | |
| | 8.125% 3/1/14 | | 30,000 | | | 34,737 |
| | 8.75% 3/1/19 | | 30,000 | | | 38,852 |
| | | | | | | 590,935 |
| Financials – 0.86% | | | | | |
| | General Electric Capital | | | | | |
| | 4.375% 9/16/20 | | 105,000 | | | 106,871 |
| | 5.30% 2/11/21 | | 30,000 | | | 32,038 |
| | 6.00% 8/7/19 | | 75,000 | | | 84,931 |
| | | | | | | 223,840 |
16
| | | Principal amount (U.S. $) | | Value (U.S. $) |
| Corporate Bonds (continued) | | | | | |
| Insurance – 1.41% | | | | | |
| • | Chubb 6.375% 3/29/67 | $ | 35,000 | | $ | 36,313 |
| # | Highmark 144A | | | | | |
| | 4.75% 5/15/21 | | 35,000 | | | 35,773 |
| | 6.125% 5/15/41 | | 5,000 | | | 5,234 |
| | MetLife 6.817% 8/15/18 | | 185,000 | | | 221,585 |
| | Prudential Financial | | | | | |
| | 3.875% 1/14/15 | | 20,000 | | | 21,205 |
| | 6.00% 12/1/17 | | 40,000 | | | 46,088 |
| | | | | | | 366,198 |
| Natural Gas – 1.96% | | | | | |
| | Energy Transfer Partners | | | | | |
| | 4.65% 6/1/21 | | 45,000 | | | 45,073 |
| | 9.70% 3/15/19 | | 40,000 | | | 51,937 |
| | Enterprise Products Operating 9.75% 1/31/14 | | 70,000 | | | 84,024 |
| | Kinder Morgan Energy Partners 9.00% 2/1/19 | | 55,000 | | | 72,039 |
| | NiSource Finance | | | | | |
| | 6.40% 3/15/18 | | 40,000 | | | 46,214 |
| | 6.80% 1/15/19 | | 15,000 | | | 17,823 |
| | Plains All American Pipeline 8.75% 5/1/19 | | 55,000 | | | 71,063 |
| | Sempra Energy 6.15% 6/15/18 | | 40,000 | | | 46,477 |
| # | Southern Natural Gas 144A 4.40% 6/15/21 | | 20,000 | | | 20,415 |
| • | TransCanada PipeLines 6.35% 5/15/67 | | 55,000 | | | 56,404 |
| | | | | | | 511,469 |
| Real Estate – 1.21% | | | | | |
| | Brandywine Operating Partnership 4.95% 4/15/18 | | 30,000 | | | 31,179 |
| | Digital Realty Trust | | | | | |
| | 5.25% 3/15/21 | | 35,000 | | | 35,826 |
| | 5.875% 2/1/20 | | 35,000 | | | 37,731 |
| | Health Care REIT 5.25% 1/15/22 | | 70,000 | | | 72,691 |
| | Regency Centers | | | | | |
| | 4.80% 4/15/21 | | 15,000 | | | 15,574 |
| | 5.875% 6/15/17 | | 14,000 | | | 15,818 |
| | UDR 4.25% 6/1/18 | | 20,000 | | | 20,343 |
| | Ventas Realty 4.75% 6/1/21 | | 40,000 | | | 40,695 |
| # | WEA Finance 144A 4.625% 5/10/21 | | 45,000 | | | 45,516 |
| | | | | | | 315,373 |
17
Statement of net assets
Delaware Core Bond Fund
| | | Principal amount (U.S. $) | | Value (U.S. $) |
| Corporate Bonds (continued) | | | | | |
| Technology – 1.64% | | | | | |
| | Applied Materials 4.30% 6/15/21 | $ | 120,000 | | $ | 125,617 |
| | Hewlett-Packard 4.30% 6/1/21 | | 75,000 | | | 79,259 |
| | National Semiconductor 6.60% 6/15/17 | | 50,000 | | | 60,323 |
| # | Seagate Technology International 144A 10.00% 5/1/14 | | 25,000 | | | 28,875 |
| | Symantec 4.20% 9/15/20 | | 20,000 | | | 19,957 |
| | Xerox 4.50% 5/15/21 | | 110,000 | | | 113,529 |
| | | | | | | 427,560 |
| Transportation – 0.94% | | | | | |
| | Burlington Northern Santa Fe | | | | | |
| | 4.10% 6/1/21 | | 60,000 | | | 61,620 |
| | 4.70% 10/1/19 | | 25,000 | | | 27,302 |
| | 5.75% 3/15/18 | | 5,000 | | | 5,784 |
| | CSX | | | | | |
| | 4.25% 6/1/21 | | 95,000 | | | 98,490 |
| | 5.50% 4/15/41 | | 5,000 | | | 5,193 |
| | Ryder System 3.50% 6/1/17 | | 45,000 | | | 46,429 |
| | | | | | | 244,818 |
| Total Corporate Bonds (cost $6,904,307) | | | | | 7,223,415 |
| | | | | | | |
| Municipal Bond – 0.79% | | | | | |
| | Massachusetts Development Finance | | | | | |
| | Agency Revenue (Harvard University) | | | | | |
| | Series B-1 5.00% 10/15/40 | | 195,000 | | | 205,204 |
| Total Municipal Bond (cost $203,883) | | | | | 205,204 |
| | | | | | | |
| Non-Agency Asset-Backed Securities – 3.05% | | | | | |
| • | Capital One Multi-Asset Execution Trust | | | | | |
| | Series 2007-A4 A4 0.217% 3/16/15 | | 100,000 | | | 99,911 |
| • | Citibank Credit Card Issuance Trust | | | | | |
| | Series 2008-A6 A6 1.386% 5/22/17 | | 115,000 | | | 119,441 |
| | Series 2009-A1 A1 1.937% 3/17/14 | | 100,000 | | | 101,051 |
| | Series 2009-A2 A2 1.737% 5/15/14 | | 100,000 | | | 101,168 |
| | CNH Equipment Trust | | | | | |
| | Series 2010-A A4 2.49% 1/15/16 | | 50,000 | | | 51,258 |
| # | Great America Leasing Receivables | | | | | |
| | Series 2011-1 A3 144A 1.69% 2/15/14 | | 35,000 | | | 35,282 |
| | Harley Davidson Motorcycle Trust | | | | | |
| | Series 2008-1 A4 4.90% 12/15/13 | | 85,909 | | | 87,608 |
18
| | | Principal amount (U.S. $) | | Value (U.S. $) |
| Non-Agency Asset-Backed Securities (continued) | | | | | |
| | John Deere Owner Trust | | | | | |
| | Series 2009-A A4 3.96% 5/16/16 | $ | 50,000 | | $ | 51,296 |
| | Series 2010-A A4 2.13% 10/17/16 | | 35,000 | | | 35,843 |
| | Series 2011-A A4 1.96% 4/16/18 | | 35,000 | | | 35,805 |
| • | Merrill Auto Trust Securitization | | | | | |
| | Series 2007-1 A4 0.247% 12/15/13 | | 1,423 | | | 1,422 |
| | Mid-State Trust Series 11 A1 4.864% 7/15/38 | | 25,592 | | | 25,463 |
| # | Navistar Financial Owner Trust | | | | | |
| | Series 2010-B A3 144A 1.08% 3/18/14 | | 50,000 | | | 50,015 |
| Total Non-Agency Asset-Backed Securities | | | | | |
| | (cost $796,370) | | | | | 795,563 |
| | | | | | | |
| Regional Bonds – 0.65%Δ | | | | | |
| Canada – 0.65% | | | | | |
| | Province of New Brunswick 2.75% 6/15/18 | | 40,000 | | | 40,435 |
| | Province of Ontario | | | | | |
| | 2.30% 5/10/16 | | 60,000 | | | 61,412 |
| | 3.00% 7/16/18 | | 65,000 | | | 66,202 |
| Total Regional Bonds (cost $165,072) | | | | | 168,049 |
| | | | | | | |
| Sovereign Bonds – 0.91%Δ | | | | | |
| Norway – 0.75% | | | | | |
| | Eksportfinans | | | | | |
| | 2.375% 5/25/16 | | 35,000 | | | 35,788 |
| | 3.00% 11/17/14 | | 150,000 | | | 158,555 |
| | | | | | | 194,343 |
| Sweden – 0.16% | | | | | |
| | Svensk Exportkredit 2.125% 7/13/16 | | 40,000 | | | 40,493 |
| | | | | | | 40,493 |
| Total Sovereign Bonds (cost $225,584) | | | | | 234,836 |
| | | | | | | |
| U.S. Treasury Obligations – 30.87% | | | | | |
| | U.S. Treasury Notes | | | | | |
| | 0.375% 6/30/13 | | 90,000 | | | 90,049 |
| | 0.625% 7/15/14 | | 770,000 | | | 771,806 |
| | 1.50% 6/30/16 | | 2,525,000 | | | 2,544,738 |
| | 3.125% 5/15/21 | | 4,510,000 | | | 4,634,008 |
| Total U.S. Treasury Obligations (cost $7,894,802) | | | | | 8,040,601 |
19
Statement of net assets
Delaware Core Bond Fund
| | | Number of shares | | Value (U.S. $) | |
| Preferred Stock – 0.22% | | | | | | |
| | Alabama Power 5.625% | | 825 | | $ | 20,625 | |
| • | PNC Financial Services Group 8.25% | | 35,000 | | | 37,528 | |
| Total Preferred Stock (cost $50,477) | | | | | 58,153 | |
| | | | | | | |
| | | Principal amount (U.S. $) | | | | |
| Short-Term Investments – 17.18% | | | | | | |
| ≠Discount Notes – 9.40% | | | | | | |
| | Federal Home Loan Bank | | | | | | |
| | 0.006% 8/3/11 | $ | 484,863 | | | 484,861 | |
| | 0.01% 8/11/11 | | 336,108 | | | 336,105 | |
| | 0.015% 9/1/11 | | 36,555 | | | 36,552 | |
| | 0.02% 9/20/11 | | 73,109 | | | 73,099 | |
| | 0.04% 11/2/11 | | 73,109 | | | 73,087 | |
| | 0.05% 8/6/11 | | 1,200,285 | | | 1,200,285 | |
| | Freddie Mac | | | | | | |
| | 0.001% 8/15/11 | | 3,249 | | | 3,249 | |
| | 0.05% 11/2/11 | | 242,204 | | | 242,129 | |
| | | | | | | 2,449,367 | |
| Repurchase Agreements – 1.58% | | | | | | |
| | BNP Paribas 0.14%, dated 7/29/11, to be | | | | | | |
| | repurchased on 8/1/11, repurchase price $411,005 | | | | | | |
| | (collateralized by U.S. government obligations | | | | | | |
| | 3.875% 4/15/29; market value $418,934) | | 410,719 | | | 410,719 | |
| | | | | | | 410,719 | |
| ≠U.S. Treasury Obligations – 6.20% | | | | | | |
| | U.S. Treasury Bills | | | | | | |
| | 0.002% 8/11/11 | | 663,830 | | | 663,783 | |
| | 0.037% 8/4/11 | | 951,133 | | | 951,114 | |
| | | | | | | 1,614,897 | |
| Total Short-Term Investments (cost $4,475,352) | | | | | 4,474,983 | |
| | | | | | | | |
| Total Value of Securities – 116.10% | | | | | | |
| | (cost $29,581,712) | | | | | 30,238,776 | |
| Liabilities Net of Receivables and | | | | | | |
| | Other Assets – (16.10%) | | | | | (4,192,155 | ) |
| Net Assets Applicable to 2,375,397 | | | | | | |
| | Shares Outstanding – 100.00% | | | | $ | 26,046,621 | |
20
| | | | |
| Net Asset Value – Delaware Core Bond Fund | | | |
| Class A ($4,347,938 / 399,097 Shares) | | | | $10.89 |
| Net Asset Value – Delaware Core Bond Fund | | | |
| Class C ($347,116 / 31,745 Shares) | | | | $10.93 |
| Net Asset Value – Delaware Core Bond Fund | | | |
| Class R ($2,249 / 206 Shares) | | | | $10.92 |
| Net Asset Value – Delaware Core Bond Fund | | | |
| Institutional Class ($21,349,318 / 1,944,349 Shares) | | | | $10.98 |
| | | | |
| Components of Net Assets at July 31, 2011: | | | |
| Shares of beneficial interest (unlimited authorization – no par) | | $ | 25,306,796 |
| Undistributed net investment income | | | 5,065 |
| Accumulated net realized gain on investments | | | 77,696 |
| Net unrealized appreciation of investments | | | 657,064 |
| Total net assets | | $ | 26,046,621 |
| # | Security exempt from registration under Rule 144A of the Securities Act of 1933, as amended. At July 31, 2011, the aggregate amount of Rule 144A securities was $872,573, which represented 3.35% of the Fund’s net assets. See Note 9 in “Notes to financial statements.” |
| • | Variable rate security. The rate shown is the rate as of July 31, 2011. Interest rates reset periodically. |
| w | Pass Through Agreement. Security represents the contractual right to receive a proportionate amount of underlying payments due to the counterparty pursuant to various agreements related to the rescheduling of obligations and the exchange of certain notes. |
| Δ | Securities have been classified by country of origin. |
| ≠ | The rate shown is the effective yield at the time of purchase. |
Summary of Abbreviations:
ARM — Adjustable Rate Mortgage
GNMA — Government National Mortgage Association
NCUA — National Credit Union Administration
REIT — Real Estate Investment Trust
REMIC — Real Estate Mortgage Investment Conduit
S.F. — Single Family
TBA — To be announced
yr — Year
21
Statement of net assets
Delaware Core Bond Fund
| | | | |
| Net Asset Value and Offering Price Per Share – | | | |
| Delaware Core Bond Fund | | | |
| Net asset value Class A (A) | | $ | 10.89 |
| Sales charge (4.50% of offering price) (B) | | | 0.51 |
| Offering price | | $ | 11.40 |
| (A) | Net asset value per share, as illustrated, is the amount which would be paid upon redemption or repurchase of shares. |
| (B) | See the current prospectus for purchases of $100,000 or more. |
See accompanying notes, which are an integral part of the financial statements.
22
| Statement of assets and liabilities | |
| Delaware Core Bond Fund | Year Ended July 31, 2011 |
| Assets: | | |
| Investments, at value | $ | 25,763,793 |
| Short-term investments, at value | | 4,474,983 |
| Cash | | 206,878 |
| Receivable for securities sold | | 2,386,293 |
| Dividends and interest receivable | | 168,800 |
| Total assets | | 33,000,747 |
| |
| Liabilities: | | |
| Payable for securities purchased | | 6,891,612 |
| Distributions payable | | 14,872 |
| Payable for fund shares redeemed | | 5,290 |
| Due to manager and affiliates | | 9,953 |
| Other accrued expenses | | 32,399 |
| Total liabilities | | 6,954,126 |
| |
| Total Net Assets | $ | 26,046,621 |
| |
| Investments, at cost | $ | 25,106,360 |
| Short-term investments, at cost | | 4,475,352 |
See accompanying notes, which are an integral part of the financial statements.
24
| Statement of operations | |
| Delaware Core Bond Fund | Year Ended July 31, 2011 |
| Investment Income: | | | | | | | |
| Interest | | $ | 611,547 | | | | |
| Dividends | | | 3,468 | | $ | 615,015 | |
| |
| Expenses: | | | | | | | |
| Management fees | | | 111,614 | | | | |
| Registration fees | | | 51,625 | | | | |
| Reports and statements to shareholders | | | 24,831 | | | | |
| Dividend disbursing and transfer agent fees and expenses | | | 21,648 | | | | |
| Distribution expense – Class A | | | 11,962 | | | | |
| Distribution expense – Class C | | | 2,440 | | | | |
| Distribution expense – Class R | | | 13 | | | | |
| Audit and tax | | | 11,916 | | | | |
| Pricing fees | | | 10,571 | | | | |
| Dues and services | | | 10,483 | | | | |
| Accounting and administration expenses | | | 8,786 | | | | |
| Custodian fees | | | 2,823 | | | | |
| Legal fees | | | 2,403 | | | | |
| Trustees’ fees | | | 1,194 | | | | |
| Insurance fees | | | 324 | | | | |
| Consulting fees | | | 249 | | | | |
| Trustees’ expenses | | | 73 | | | 272,955 | |
| Less fees waived | | | | | | (113,449 | ) |
| Less waived distribution expenses – Class A | | | | | | (1,994 | ) |
| Less waived distribution expenses – Class R | | | | | | (2 | ) |
| Less expense paid indirectly | | | | | | (7 | ) |
| Total operating expenses | | | | | | 157,503 | |
| Net Investment Income | | | | | | 457,512 | |
| |
| Net Realized and Unrealized Gain on Investments: | | | | | | | |
| Net realized gain on investments | | | | | | 499,079 | |
| Net change in unrealized appreciation/depreciation of investments | | | | | | 154,330 | |
| Net Realized and Unrealized Gain on Investments | | | | | | 653,409 | |
| |
| Net Increase in Net Assets Resulting from Operations | | | | | $ | 1,110,921 | |
See accompanying notes, which are an integral part of the financial statements.
25
Statements of changes in net assets
Delaware Core Bond Fund
| | | Year | | 11/1/09 | | Year |
| | | Ended | | to | | Ended |
| | | 7/31/11 | | 7/31/10* | | 10/31/09 |
| Increase in Net Assets from Operations: | | | | | | | | | | | | |
| Net investment income | | $ | 457,512 | | | $ | 254,035 | | | $ | 318,523 | |
| Net realized gain on investments | | | 499,079 | | | | 300,943 | | | | 210,351 | |
| Net change in unrealized appreciation/ | | | | | | | | | | | | |
| depreciation of investments | | | 154,330 | | | | 396,380 | | | | 641,103 | |
| Net increase in net assets resulting | | | | | | | | | | | | |
| from operations | | | 1,110,921 | | | | 951,358 | | | | 1,169,977 | |
| |
| Dividends and Distributions | | | | | | | | | | | | |
| to Shareholders from: | | | | | | | | | | | | |
| Net investment income: | | | | | | | | | | | | |
| Class A | | | (92,817 | ) | | | (104,466 | ) | | | (337,265 | ) |
| Class C | | | (3,937 | ) | | | (507 | ) | | | (6 | ) |
| Class R | | | (57 | ) | | | (24 | ) | | | (6 | ) |
| Institutional Class | | | (467,492 | ) | | | (198,771 | ) | | | (7 | ) |
| |
| Net realized gain on investments: | | | | | | | | | | | | |
| Class A | | | (28,966 | ) | | | — | | | | — | |
| Class C | | | (1,782 | ) | | | — | | | | — | |
| Class R | | | (17 | ) | | | — | | | | — | |
| Institutional Class | | | (132,171 | ) | | | — | | | | — | |
| | | | (727,239 | ) | | | (303,768 | ) | | | (337,284 | ) |
| |
| Capital Share Transactions: | | | | | | | | | | | | |
| Proceeds from shares sold: | | | | | | | | | | | | |
| Class A | | | 840,175 | | | | 415,835 | | | | 153,596 | |
| Class C | | | 258,795 | | | | 140,412 | | | | 2,022 | |
| Class R | | | 14 | | | | — | | | | 2,022 | |
| Institutional Class | | | 5,415,653 | | | | 16,968,441 | | | | 2,022 | |
| |
| Net asset value of shares issued upon | | | | | | | | | | | | |
| reinvestment of dividends and distributions: | | | | | | | | | | | | |
| Class A | | | 119,982 | | | | 104,466 | | | | 300,080 | |
| Class C | | | 4,899 | | | | 483 | | | | 4 | |
| Class R | | | 49 | | | | 24 | | | | 5 | |
| Institutional Class | | | 549,038 | | | | 190,236 | | | | 6 | |
| | | | 7,188,605 | | | | 17,819,897 | | | | 459,757 | |
26
| | | Year | | 11/1/09 | | Year |
| | | Ended | | to | | Ended |
| | | 7/31/11 | | 7/31/10* | | 10/31/09 |
| Capital Share Transactions (continued): | | | | | | | | | | | | |
| Cost of shares repurchased: | | | | | | | | | | | | |
| Class A | | $ | (704,664 | ) | | $ | (3,001,525 | ) | | $ | (1,697,319 | ) |
| Class C | | | (65,899 | ) | | | — | | | | — | |
| Institutional Class | | | (819,537 | ) | | | (1,754,001 | ) | | | — | |
| | | | (1,590,100 | ) | | | (4,755,526 | ) | | | (1,697,319 | ) |
| Increase (decrease) in net assets derived from | | | | | | | | | | | | |
| capital share transactions | | | 5,598,505 | | | | 13,064,371 | | | | (1,237,562 | ) |
| Net Increase (Decrease) in Net Assets | | | 5,982,187 | | | | 13,711,961 | | | | (404,869 | ) |
| |
| Net Assets: | | | | | | | | | | | | |
| Beginning of period | | | 20,064,434 | | | | 6,352,473 | | | | 6,757,342 | |
| End of period (including undistributed net | | | | | | | | | | | | |
| investment income of $5,065, $3,325 and | | | | | | | | | | | | |
| $9,166, respectively) | | $ | 26,046,621 | | | $ | 20,064,434 | | | $ | 6,352,473 | |
*During the period ended July 31, 2010 the Fund changed its fiscal year end from October to July.
See accompanying notes, which are an integral part of the financial statements
27
Financial highlights
Delaware Core Bond Fund Class A
Selected data for each share of the Fund outstanding throughout each period were as follows:
| Net asset value, beginning of period |
| |
| Income (loss) from investment operations: |
| Net investment income3 |
| Net realized and unrealized gain (loss) on investments |
| Total from investment operations |
| |
| Less dividends and distributions from: |
| Net investment income |
| Net realized gain on investments |
| Total dividends and distributions |
| |
| Net asset value, end of period |
| |
| Total return4 |
| |
| Ratios and supplemental data: |
| Net assets, end of period (000 omitted) |
| Ratio of expenses to average net assets |
| Ratio of expenses to average net assets |
| prior to fees waived and expense paid indirectly |
| Ratio of net investment income to average net assets |
| Ratio of net investment income to average net assets |
| prior to fees waived and expense paid indirectly |
| Portfolio turnover |
1 During the period ended July 31, 2010 the Fund changed its fiscal year end from October to July. Ratios have been annualized and total return and portfolio turnover have not been annualized.
2 Effective September 30, 2009, the Fund received all of the assets and liabilities of the Delaware Pooled® Trust – The Intermediate Fixed Income Portfolio (the Portfolio). The Class A shares financial highlights for the periods prior to September 30, 2009 reflect the performance of the Institutional Class shares of the Portfolio. Fees paid by the Portfolio were less than Class A share fees, and performance would have been lower if Class A fees were paid.
See accompanying notes, which are an integral part of the financial statements
28
| | | | | | | 11/1/09 | | | | | | | | | | | | | | |
| | | Year Ended | | | to | | | Year Ended |
| | | 7/31/11 | | | 7/31/101 | | | 10/31/092 | | 10/31/082 | | 10/31/072 | | 10/31/062 | |
| | | $10.750 | | | | $10.370 | | | | $9.200 | | | $9.880 | | | $9.940 | | | $9.960 | | |
| | | |
| | | |
| | | 0.199 | | | | 0.159 | | | | 0.445 | | | 0.460 | | | 0.457 | | | 0.427 | | |
| | | 0.274 | | | | 0.434 | | | | 1.195 | | | (0.643 | ) | | (0.014 | ) | | 0.025 | | |
| | | 0.473 | | | | 0.593 | | | | 1.640 | | | (0.183 | ) | | 0.443 | | | 0.452 | | |
| | | |
| | | |
| | | (0.249 | ) | | | (0.213 | ) | | | (0.470 | ) | | (0.497 | ) | | (0.503 | ) | | (0.472 | ) | |
| | | (0.084 | ) | | | — | | | | — | | | — | | | — | | | — | | |
| | | (0.333 | ) | | | (0.213 | ) | | | (0.470 | ) | | (0.497 | ) | | (0.503 | ) | | (0.472 | ) | |
| | | |
| | | $10.890 | | | | $10.750 | | | | $10.370 | | | $9.200 | | | $9.880 | | | $9.940 | | |
| | | |
| | | 4.49% | | | | 5.89% | | | | 18.29% | | | (2.07% | ) | | 4.68% | | | 4.68% | | |
| | | |
| | | |
| | | $4,348 | | | | $4,022 | | | | $6,346 | | | $6,757 | | | $13,791 | | | $28,795 | | |
| | | 0.90% | | | | 0.90% | | | | 0.70% | | | 0.39% | | | 0.39% | | | 0.43% | 5 | |
| | | |
| | | 1.46% | | | | 2.25% | | | | 1.60% | | | 1.12% | | | 0.66% | | | 0.67% | | |
| | | 1.86% | | | | 2.04% | | | | 4.35% | | | 4.66% | | | 4.61% | | | 4.38% | | |
| | | |
| | | 1.30% | | | | 0.69% | | | | 3.45% | | | 3.93% | | | 4.33% | | | 4.14% | | |
| | | 503% | | | | 528% | | | | 346% | | | 391% | | | 251% | | | 342% | | |
3 The average shares outstanding method has been applied for per share information. |
4 Total investment return is based on the change in net asset value of a share during the period and assumes reinvestment of dividends and distributions at net asset value and does not reflect the impact of a sales charge. Total investment return during some of the periods shown reflects waivers by the manager and/or distributor. Performance would have been lower had the waivers not been in effect. |
5 Ratio for the year ended October 31, 2006, including fees paid indirectly in accordance with Securities and Exchange Commission rules, was 0.44%. |
29
Financial highlights
Delaware Core Bond Fund Class C
Selected data for each share of the Fund outstanding throughout each period were as follows:
| Net asset value, beginning of period |
| |
| Income from investment operations: |
| Net investment income3 |
| Net realized and unrealized gain on investments |
| Total from investment operations |
| |
| Less dividends and distributions from: |
| Net investment income |
| Net realized gain on investments |
| Total dividends and distributions |
| |
| Net asset value, end of period |
| |
| Total return4 |
| |
| Ratios and supplemental data: |
| Net assets, end of period (000 omitted) |
| Ratio of expenses to average net assets |
| Ratio of expenses to average net assets prior to fees waived |
| Ratio of net investment income to average net assets |
| Ratio of net investment income (loss) to average net assets |
| prior to fees waived |
| Portfolio turnover |
1 During the period ended July 31, 2010 the Fund changed its fiscal year end from October to July. Ratios have been annualized and total return and portfolio turnover have not been annualized. |
2 Date of commencement of operations; ratios have been annualized and total return has not been annualized. |
3 The average shares outstanding method has been applied for per share information. |
See accompanying notes, which are an integral part of the financial statements
30
| | | | | | 11/1/09 | | 9/30/092 | |
| | | Year Ended | | | to | | to | |
| | | 7/31/11 | | | 7/31/101 | | 10/31/09 | |
| | | $10.790 | | | $10.370 | | | $10.310 | | |
| | |
| | |
| | | 0.120 | | | 0.103 | | | 0.030 | | |
| | | 0.273 | | | 0.469 | | | 0.059 | | |
| | | 0.393 | | | 0.572 | | | 0.089 | | |
| | |
| | |
| | | (0.169 | ) | | (0.152 | ) | | (0.029 | ) | |
| | | (0.084 | ) | | — | | | — | | |
| | | (0.253 | ) | | (0.152 | ) | | (0.029 | ) | |
| | |
| | | $10.930 | | | $10.790 | | | $10.370 | | |
| | |
| | | 3.70% | | | 5.67% | | | 0.86% | | |
| | |
| | |
| | | $347 | | | $145 | | | $2 | | |
| | | 1.65% | | | 1.65% | | | 1.65% | | |
| | | 2.16% | | | 2.95% | | | 5.32% | | |
| | | 1.11% | | | 1.29% | | | 3.33% | | |
| | |
| | | 0.60% | | | (0.01% | ) | | (0.34% | ) | |
| | | 503% | | | 528% | | | 346% | 5 | |
4 Total investment return is based on the change in net asset value of a share during the period and assumes reinvestment of dividends and distributions at net asset value and does not reflect the impact of a sales charge. Total investment return during all of the periods shown reflects a waiver by the manager. Performance would have been lower had the waiver not been in effect. |
5 Portfolio turnover is representative of the Fund for the entire year. |
31
Financial highlights
Delaware Core Bond Fund Class R
Selected data for each share of the Fund outstanding throughout each period were as follows:
| Net asset value, beginning of period |
| |
| Income from investment operations: |
| Net investment income3 |
| Net realized and unrealized gain on investments |
| Total from investment operations |
| |
| Less dividends and distributions from: |
| Net investment income |
| Net realized gain on investments |
| Total dividends and distributions |
| |
| Net asset value, end of period |
| |
| Total return5 |
| |
| Ratios and supplemental data: |
| Net assets, end of period (000 omitted) |
| Ratio of expenses to average net assets |
| Ratio of expenses to average net assets prior to fees waived |
| Ratio of net investment income to average net assets |
| Ratio of net investment income to average net assets |
| prior to fees waived |
| Portfolio turnover |
1 During the period ended July 31, 2010 the Fund changed its fiscal year end from October to July. Ratios have been annualized and total return and portfolio turnover have not been annualized. |
2 Date of commencement of operations; ratios have been annualized and total return has not been annualized. |
3 The average shares outstanding method has been applied for per share information. |
4 Includes adjustments from the period ending July 31, 2010 in the amount of $13 (or $0.063 per share) which impacted total return by -0.59%. The adjustment is to correct a mis-allocation of distributions among share classes which had no impact on distribution amounts reported and paid to shareholders. |
See accompanying notes, which are an integral part of the financial statements
32
| | | | | | | 11/1/09 | | 9/30/092 | |
| | | Year Ended | | | to | | to | |
| | | 7/31/11 | | | 7/31/101 | | 10/31/09 | |
| | | $10.830 | | | | $10.370 | | | $10.310 | | |
| | | |
| | | |
| | | 0.174 | | | | 0.141 | | | 0.035 | | |
| | | 0.226 | 4 | | | 0.510 | | | 0.059 | | |
| | | 0.400 | 4 | | | 0.651 | | | 0.094 | | |
| | | |
| | | |
| | | (0.226 | ) | | | (0.191 | ) | | (0.034 | ) | |
| | | (0.084 | ) | | | — | | | — | | |
| | | (0.310 | ) | | | (0.191 | ) | | (0.034 | ) | |
| | | |
| | | $10.920 | 4 | | | $10.830 | | | $10.370 | | |
| | | |
| | | 3.76% | 4 | | | 6.44% | | | 0.90% | | |
| | | |
| | | |
| | | $2 | | | | $2 | | | $2 | | |
| | | 1.15% | | | | 1.15% | | | 1.15% | | |
| | | 1.76% | | | | 2.55% | | | 4.92% | | |
| | | 1.61% | | | | 1.79% | | | 3.83% | | |
| | | |
| | | 1.00% | | | | 0.39% | | | 0.06% | | |
| | | 503% | | | | 528% | | | 346% | 6 | |
5 Total investment return is based on the change in net asset value of a share during the period and assumes reinvestment of dividends and distributions at net asset value. Total investment return during all of the periods shown reflects waivers by the manager and distributor. Performance would have been lower had the waivers not been in effect. |
6 Portfolio turnover is representative of the Fund for the entire year. |
33
Financial highlights
Delaware Core Bond Fund Institutional Class
Selected data for each share of the Fund outstanding throughout each period were as follows:
| Net asset value, beginning of period |
| |
| Income from investment operations: |
| Net investment income3 |
| Net realized and unrealized gain on investments |
| Total from investment operations |
| |
| Less dividends and distributions from: |
| Net investment income |
| Net realized gain on investments |
| Total dividends and distributions |
| |
| Net asset value, end of period |
| |
| Total return4 |
| |
| Ratios and supplemental data: |
| Net assets, end of period (000 omitted) |
| Ratio of expenses to average net assets |
| Ratio of expenses to average net assets prior to fees waived |
| Ratio of net investment income to average net assets |
| Ratio of net investment income to average net assets |
| prior to fees waived |
| Portfolio turnover |
1 During the period ended July 31, 2010 the Fund changed its fiscal year end from October to July. Ratios have been annualized and total return and portfolio turnover have not been annualized. |
2 Date of commencement of operations; ratios have been annualized and total return has not been annualized. |
3 The average shares outstanding method has been applied for per share information. |
See accompanying notes, which are an integral part of the financial statements
34
| | | | | | | 11/1/09 | | 9/30/092 | |
| | Year Ended | | to | | to | |
| | 7/31/11 | | 7/31/101 | | 10/31/09 | |
| | | $10.830 | | | | $10.370 | | | $10.310 | | |
| | |
| | |
| | | 0.227 | | | | 0.181 | | | 0.039 | | |
| | | 0.285 | | | | 0.512 | | | 0.060 | | |
| | | 0.512 | | | | 0.693 | | | 0.099 | | |
| | |
| | |
| | | (0.278 | ) | | | (0.233 | ) | | (0.039 | ) | |
| | | (0.084 | ) | | | — | | | — | | |
| | | (0.362 | ) | | | (0.233 | ) | | (0.039 | ) | |
| | |
| | | $10.980 | | | | $10.830 | | | $10.370 | | |
| | |
| | | 4.83% | | | | 6.76% | | | 0.96% | | |
| | |
| | |
| | | $21,350 | | | | $15,895 | | | $2 | | |
| | | 0.65% | | | | 0.65% | | | 0.65% | | |
| | | 1.16% | | | | 1.95% | | | 4.32% | | |
| | | 2.11% | | | | 2.29% | | | 4.33% | | |
| | |
| | | 1.60% | | | | 0.99% | | | 0.66% | | |
| | | 503% | | | | 528% | | | 346% | 5 | |
4 Total investment return is based on the change in net asset value of a share during the period and assumes reinvestment of dividends and distributions at net asset value. Total investment return during all of the periods shown reflects a waiver by the manager. Performance would have been lower had the waiver not been in effect. |
5 Portfolio turnover is representative of the Fund for the entire year. |
35
| Notes to financial statements | |
| Delaware Core Bond Fund | July 31, 2011 |
Delaware Group® Income Funds (Trust) is organized as a Delaware statutory trust and offers five Series: Delaware Core Bond Fund, Delaware Corporate Bond Fund, Delaware Diversified Floating Rate Fund, Delaware Extended Duration Bond Fund and Delaware High-Yield Opportunities Fund. These financial statements and the related notes pertain to Delaware Core Bond Fund (Fund). The Trust is an open-end investment company. The Fund is considered diversified under the Investment Company Act of 1940, as amended, and offers Class A, Class C, Class R and Institutional Class shares. Class A shares are sold with a maximum front-end sales charge of up to 4.50%. Class A share purchases of $1,000,000 or more will incur a contingent deferred sales charge (CDSC) of 1% if redeemed during the first year and 0.50% during the second year, provided that Delaware Distributors, L.P. (DDLP) paid a financial advisor a commission on the purchase of those shares. Class C shares are sold with a CDSC of 1%, if redeemed during the first twelve months. Class R and Institutional Class shares are not subject to a sales charge and are offered for sale exclusively to certain eligible investors.
The investment objective of the Fund is to seek maximum long term total return, consistent with reasonable risk.
1. Significant Accounting Policies
The following accounting policies are in accordance with U.S. generally accepted accounting principles (U.S. GAAP) and are consistently followed by the Fund.
Security Valuation — Equity securities, except those traded on the Nasdaq Stock Market, Inc. (Nasdaq), are valued at the last quoted sales price as of the time of the regular close of the New York Stock Exchange (NYSE) on the valuation date. Securities traded on the Nasdaq are valued in accordance with the Nasdaq Official Closing Price, which may not be the last sales price. If on a particular day an equity security does not trade, then the mean between the bid and ask prices will be used. Securities listed on a foreign exchange are valued at the last quoted sales price on the valuation date. Short-term debt securities are valued at market value. U.S. government and agency securities are valued based upon valuations provided at the mean between the bid and ask prices. Other debt securities are valued by an independent pricing service or broker and reviewed by management. To the extent current market prices are not available, the pricing service may take into account developments related to the specific security, as well as transactions in comparable securities. Generally, other securities and assets for which market quotations are not readily available are valued at fair value as determined in good faith under the direction of the Fund’s Board of Trustees (Board). In determining whether market quotations are readily available or fair valuation will be used, various factors will be taken into consideration, such as market closures or suspension of trading in a security. The Fund may use fair value pricing more frequently for securities traded primarily in non-U.S. markets because, among other things, most foreign markets close well before the Fund values its securities generally as of 4:00 p.m. Eastern time. The earlier close of these foreign markets gives rise to the possibility that significant events, including broad market moves, government actions or pronouncements, aftermarket trading, or news events may have occurred in the interim. To account for this, the Fund may frequently value foreign securities using fair value prices based on third-party vendor modeling tools (international fair value pricing).
36
Federal Income Taxes — No provision for federal income taxes has been made as the Fund intends to continue to qualify for federal income tax purposes as a regulated investment company under Subchapter M of the Internal Revenue Code of 1986, as amended, and make the requisite distributions to shareholders. The Fund evaluates tax positions taken or expected to be taken in the course of preparing the Fund’s tax returns to determine whether the tax positions are “more-likely-than-not” of being sustained by the applicable tax authority. Tax positions not deemed to meet the more-likely-than-not threshold are recorded as a tax benefit or expense in the current year. Management has analyzed the Fund’s tax positions taken on federal income tax returns for all open tax years (October 31, 2008–July 31, 2011), and has concluded that no provision for federal income tax is required in the Fund’s financial statements.
Class Accounting — Investment income and common expenses are allocated to the various classes of the Fund on the basis of “settled shares” of each class in relation to the relative net assets of the Fund. Realized and unrealized gain (loss) on investments are allocated to the various classes of the Fund on the basis of daily net assets of each class. Distribution expenses relating to a specific class are charged directly to that class.
Repurchase Agreements — The Fund may purchase certain U.S. government securities subject to the counterparty’s agreement to repurchase them at an agreed upon date and price. The counterparty will be required on a daily basis to maintain the value of the collateral subject to the agreement at not less than the repurchase price (including accrued interest). The agreements are conditioned upon the collateral being deposited under the Federal Reserve book-entry system with the Fund’s custodian or a third party sub-custodian. In the event of default or bankruptcy by the other party to the agreement, retention of the collateral may be subject to legal proceedings. All open repurchase agreements were entered into on July 29, 2011.
To Be Announced Trades — The Fund may contract to purchase securities for a fixed price at a transaction date beyond the customary settlement period (e.g., “when issued,” “delayed delivery,” “forward commitment,” or “TBA transactions”) consistent with the Fund’s ability to manage its investment portfolio and meet redemption requests. These transactions involve a commitment by the Fund to purchase securities for a predetermined price or yield with payment and delivery taking place more than three days in the future, or after a period longer than the customary settlement period for that type of security. No interest will be earned by the Fund on such purchases until the securities are delivered; however the market value may change prior to delivery.
Mortgage Dollar Rolls — The Fund may enter into mortgage “dollar rolls” in which the Fund sells mortgage-backed securities for delivery in the current month and simultaneously contracts to repurchase substantially similar (same type, coupon, and maturity) securities on a specified future date. Any difference between the sale price and the purchase price is netted against the interest income foregone on the securities to arrive at an implied borrowing (reverse repurchase) rate. Alternatively, the sale and purchase transactions that constitute the dollar roll can be executed at the same price, with the Fund being paid a fee as consideration for entering into the commitment to purchase. Dollar rolls may be renewed prior to cash settlement and initially may involve only
37
Notes to financial statements
Delaware Core Bond Fund
1. Significant Accounting Policies (continued)
a firm commitment by the Fund to buy a security. The Fund accounts for mortgage-dollar-roll transactions as purchases and sales. These transactions will increase the Fund’s portfolio turnover rate.
Use of Estimates — The preparation of financial statements in conformity with U.S. GAAP requires management to make estimates and assumptions that affect the reported amounts of assets and liabilities and disclosure of contingent assets and liabilities at the date of the financial statements and the reported amounts of revenues and expenses during the reporting period. Actual results could differ from those estimates and the differences could be material.
Other — Expenses directly attributable to the Fund are charged directly to the Fund. Other expenses common to various funds within the Delaware Investments® Family of Funds are generally allocated amongst such funds on the basis of average net assets. Management fees and some other expenses are paid monthly. Security transactions are recorded on the date the securities are purchased or sold (trade date) for financial reporting purposes. Costs used in calculating realized gains and losses on the sale of investment securities are those of the specific securities sold. Dividend income is recorded on the ex-dividend date and interest income is recorded on the accrual basis. Discounts and premiums on non-convertible debt securities are amortized to interest income over the lives of the respective securities. Realized gains (losses) on paydowns of mortgage- and asset-backed securities are classified as interest income. The Fund declares dividends daily from net investment income and pays dividends monthly and declares and pays distributions from net realized gain on investments, if any, annually. Dividends and distributions, if any, are recorded on the ex-dividend date. The Fund may distribute income dividends and capital gains more frequently, if necessary for tax purposes.
The Fund may receive earnings credits from its custodian when positive cash balances are maintained, which are used to offset custody fees. There were no earnings credits for the year ended July 31, 2011.
The Fund receives earnings credits from its transfer agent when positive cash balances are maintained, which are used to offset transfer agent fees. The expense paid under this arrangement is included in dividend disbursing and transfer agent fees and expenses on the statement of operations with the corresponding expense offset shown as “expense paid indirectly.” For the year ended July 31, 2011, the Fund earned the $7 under this agreement.
2. Investment Management, Administration Agreements and Other Transactions with Affiliates
In accordance with the terms of its investment management agreement, the Fund pays Delaware Management Company (DMC), a series of Delaware Management Business Trust and the investment manager, an annual fee which is calculated daily at the rate of 0.50% on the first $500 million of average daily net assets of the Fund, 0.475% on the next $500 million, 0.45% on the next $1.5 billion, and 0.425% on average daily net assets in excess of $2.5 billion.
38
DMC has contractually agreed to waive that portion, if any, of its management fee and reimburse the Fund to the extent necessary to ensure the annual operating expenses, (excluding any 12b-1 plan expenses, taxes, interest, inverse floater program expenses, brokerage fees, certain insurance costs, and nonroutine expenses or costs including, but not limited to, those relating to reorganizations, litigation, conducting shareholder meetings, and liquidations (collectively, nonroutine expenses)), do not exceed 0.65% of average daily net assets of the Fund through November 28, 2011. For purposes of this waiver and reimbursement, nonroutine expenses may also include such additional costs and expenses, as may be agreed upon from time to time by the Fund’s Board and DMC. This expense waiver and reimbursement applies only to expenses paid directly by the Fund.
Delaware Service Company, Inc. (DSC), an affiliate of DMC, provides fund accounting and financial administration oversight services to the Fund. For these services, the Fund pays DSC fees based on the aggregate daily net assets of the Delaware Investments® Family of Funds at the following annual rate: 0.0050% of the first $30 billion; 0.0045% of the next $10 billion; 0.0040% of the next $10 billion; and 0.0025% of aggregate average daily net assets in excess of $50 billion. The fees payable to DSC under the service agreement described above are allocated among all Funds in the Delaware Investments Family of Funds on a relative net asset value basis. For the year ended July 31, 2011, the Fund was charged $1,106 for these services.
DSC also provides dividend disbursing and transfer agent services. The Fund paid DSC a monthly fee based on the number of shareholder accounts for dividend disbursing and transfer agent services. Effective July 18, 2011, the Fund pays DSC a monthly asset-based fee for these services.
Pursuant to a distribution agreement and distribution plan, the Fund pays DDLP, the distributor and an affiliate of DMC, an annual distribution and service fee not to exceed 0.30% of the average daily net assets of the Class A shares, 1.00% of the average daily net assets of the Class C shares and 0.60% of the average daily net assets of the Class R shares. Institutional Class shares pay no distribution and service expenses. DDLP has contracted to limit the Class A and Class R shares’ 12b-1 fee through November 28, 2011 to no more than 0.25% and 0.50%, respectively, of the classes’ average daily net assets.
At July 31, 2011, the Fund had liabilities payable to affiliates as follows:
| Investment management fees payable to DMC | | $ | 7,227 |
| Dividend disbursing, transfer agent and fund accounting | | | |
| oversight fees and other expenses payable to DSC | | | 442 |
| Distribution fees payable to DDLP | | | 1,190 |
| Other expenses payable to DMC and affiliates* | | | 1,094 |
*DMC, as part of its administrative services, pays operating expenses on behalf of the Fund and is reimbursed on a periodic basis. Expenses include items such as printing of shareholder reports, fees for audit, legal and tax services, registration fees and trustees’ fees.
39
Notes to financial statements
Delaware Core Bond Fund
| 2. | Investment Management, Administration Agreements and Other Transactions with Affiliates (continued) |
As provided in the investment management agreement, the Fund bears the cost of certain legal and tax services, including internal legal and tax services provided to the Fund by DMC and/or its affiliates’ employees. For the year ended July 31, 2011, the Fund was charged $ 535 for internal legal and tax services provided by DMC and/or its affiliates’ employees.
For the year ended July 31, 2011, DDLP earned $1,190 for commissions on sales of the Fund’s Class A shares. For the year ended July 31, 2011, DDLP received gross CDSC commissions of $ 16 on redemption of Class C shares and these commissions were entirely used to offset up-front commissions previously paid by DDLP to broker/dealers on sales of those shares.
Trustees’ fees include expenses accrued by the Fund for each Trustee’s retainer and meeting fees. Certain officers of DMC, DSC, and DDLP are officers and/or Trustees of the Trust. These officers and Trustees are paid no compensation by the Fund.
3. Investments
For the year ended July 31, 2011, the Fund made purchases of $ 79,798,095 and sales of $ 80,263,173 of investment securities other than U.S. government securities and short-term investments. For the year ended July 31, 2011, the Fund made purchases of $37,415,448 and sales of $31,769,929 of long-term U.S. government securities.
At July 31, 2011, the cost of investments for federal income tax purposes was $29,654,320. At July 31, 2011, the net unrealized appreciation was $584,456, of which $613,831 related to unrealized appreciation of investments and $29,375 related to unrealized depreciation of investments.
U.S. GAAP defines fair value as the price that the Fund would receive to sell an asset or pay to transfer a liability in an orderly transaction between market participants at the measurement date under current market conditions. A three level hierarchy for fair value measurements has been established based upon the transparency of inputs to the valuation of an asset or liability. Inputs may be observable or unobservable and refer broadly to the assumptions market participants would use in pricing the asset or liability. Observable inputs reflect the assumptions market participants would use in pricing the asset or liability based on market data obtained from sources independent of the reporting entity. Unobservable inputs reflect the reporting entity’s own assumptions about the assumptions that market participants would use in pricing the asset or liability developed based on the best information available under the circumstances. The Fund’s investment in its entirety is assigned a level based upon the observability of the inputs which are significant to the overall valuation. The three level hierarchy of inputs is summarized below.
| Level 1 | – | inputs are quoted prices in active markets for identical investments (e.g., equity securities, open-end investment companies, futures contracts, options contracts) |
40
| Level 2 | – | other observable inputs (including, but not limited to: quoted prices for similar assets or liabilities in markets that are active, quoted prices for identical or similar assets or liabilities in markets that are not active, inputs other than quoted prices that are observable for the assets or liabilities (such as interest rates, yield curves, volatilities, prepayment speeds, loss severities, credit risks and default rates) or other market-corroborated inputs) (e.g., debt securities, government securities, swap contracts, foreign currency exchange contracts, foreign securities utilizing international fair value pricing) |
| | | |
| Level 3 | – | inputs are significant unobservable inputs (including the Fund’s own assumptions used to determine the fair value of investments) (e.g., broker-quoted securities, fair valued securities) |
The following table summarizes the valuation of the Fund’s investments by fair value hierarchy levels as of July 31, 2011:
| | | Level 1 | | Level 2 | | Total |
| Agency, Asset-Backed & | | | | | | | | | |
| Mortgage-Backed Securities | | $ | — | | $ | 9,833,535 | | $ | 9,833,535 |
| Corporate Debt | | | — | | | 7,223,415 | | | 7,223,415 |
| Foreign Debt | | | — | | | 402,885 | | | 402,885 |
| Municipal Bond | | | — | | | 205,204 | | | 205,204 |
| U.S. Treasury Obligations | | | — | | | 8,040,601 | | | 8,040,601 |
| Short-Term Investments | | | 410,719 | | | 4,064,264 | | | 4,474,983 |
| Preferred Stock | | | 20,625 | | | 37,528 | | | 58,153 |
| Total | | $ | 431,344 | | $ | 29,807,432 | | $ | 30,238,776 |
The following is a reconciliation of investments in which significant unobservable inputs (Level 3) were used in determining fair value:
| | | Foreign |
| | | Debt |
| Balance as of 7/31/10 | | $ | 40,931 | |
| Sales | | | (41,110 | ) |
| Net realized gain | | | 1,340 | |
| Net change in unrealized appreciation/depreciation | | | (1,161 | ) |
| Balance as of 7/31/11 | | $ | — | |
| |
| Net change in unrealized appreciation/depreciation from investments | | | | |
| still held as of 7/31/11 | | $ | — | |
During the year ended July 31, 2011, there were no transfers between Level 1 investments, Level 2 investments and Level 3 investments that had a material impact to the Fund.
41
Notes to financial statements
Delaware Core Bond Fund
4. Dividend and Distribution Information
Income and long-term capital gain distributions are determined in accordance with federal income tax regulations, which may differ from U.S. GAAP. Additionally, distributions from net short-term gains on sales of investment securities are treated as ordinary income for federal income tax purposes. The tax character of dividends and distributions paid during the year ended July 31, 2011 and period ended July 31, 2010 was as follows:
| | | Year | | 11/1/09 |
| | | Ended | | to |
| | | 7/31/11 | | 7/31/10 |
| Ordinary income | | $ | 727,239 | | $ | 303,768 |
5. Components of Net Assets on a Tax Basis
As of July 31, 2011, the components of net assets on a tax basis were as follows:
| Shares of beneficial interest | $ | 25,306,796 | |
| Undistributed ordinary income | | 130,020 | |
| Undistributed long-term capital gains | | 50,402 | |
| Distributions payable | | (14,872 | ) |
| Other temporary differences | | (10,181 | ) |
| Unrealized appreciation of investments | | 584,456 | |
| Net assets | $ | 26,046,621 | |
The differences between book basis and tax basis components of net assets are primarily attributable to tax deferral of losses on wash sales, straddles, tax treatment of distribution payable and tax treatment of market discount and premium on debt instruments.
For financial reporting purposes, capital accounts are adjusted to reflect the tax character of permanent book/tax differences. Reclassifications are primarily due to market discount and premium on certain debt instruments and paydowns of asset- and mortgage-backed securities. Results of operations and net assets were not affected by these reclassifications. For the year ended July 31, 2011, the Fund recorded the following reclassifications.
| Undistributed net investment income | | $ | 108,531 | |
| Accumulated net realized loss | | | (108,531 | ) |
For federal income tax purposes, $108,492 of capital loss carryforwards from prior years was utilized in the year ended July 31, 2011.
42
6. Capital Shares
Transactions in capital shares were as follows:
| | | Year | | 11/1/09 | | Year |
| | | Ended | | to | | Ended |
| | | 7/31/11 | | 7/31/10 | | 10/31/09 |
| Shares Sold: | | | | | | | | | |
| Class A | | 78,477 | | | 39,518 | | | 16,224 | |
| Class C | | 24,029 | | | 13,230 | | | 196 | |
| Class R | | 4 | | | — | | | 196 | |
| Institutional Class | | 503,198 | | | 1,613,491 | | | 196 | |
| |
| Shares issued upon reinvestment of dividends and distributions: | | | | | | | | | |
| Class A | | 11,190 | | | 10,133 | | | 30,960 | |
| Class C | | 455 | | | 46 | | | — | |
| Class R | | 2 | | | 3 | | | 1 | |
| Institutional Class | | 50,814 | | | 17,915 | | | 1 | |
| | | 668,169 | | | 1,694,336 | | | 47,774 | |
| Shares repurchased: | | | | | | | | | |
| Class A | | (64,858 | ) | | (287,460 | ) | | (169,379 | ) |
| Class C | | (6,211 | ) | | — | | | — | |
| Institutional Class | | (77,235 | ) | | (164,031 | ) | | — | |
| | | (148,304 | ) | | (451,491 | ) | | (169,379 | ) |
| Net increase (decrease) | | 519,865 | | | 1,242,845 | | | (121,605 | ) |
7. Line of Credit
The Fund, along with certain other funds in the Delaware Investments® Family of Funds (Participants), was a participant in a $35,000,000 revolving line of credit to be used for temporary or emergency purposes as an additional source of liquidity to fund redemptions of investor shares. Under the agreement, the Participants were charged an annual commitment fee, which was allocated across the Participants on the basis of each Participant’s allocation of the entire facility. The Participants were permitted to borrow up to a maximum of one third of their net assets under the agreement. The line of credit expired on November 16, 2010.
On November 16, 2010, the Fund, along with the other Participants, entered into an amendment to the agreement for a $50,000,000 revolving line of credit. Effective as of August 1, 2011, the Fund, along with the other Participants, entered into an amendment to the agreement for a $100,000,000 revolving line of credit. The agreement as amended is to be used as described above and operates in substantially the same manner as the original agreement. The new line of credit under the agreement as amended expires on November 15, 2011. The Fund had no amounts outstanding as of July 31, 2011 or at any time during the period then ended.
43
Notes to financial statements
Delaware Core Bond Fund
8. Securities Lending
The Fund, along with other funds in the Delaware Investments® Family of Funds, may lend its securities pursuant to a security lending agreement (Lending Agreement) with The Bank of New York Mellon (BNY Mellon). At the time a security is loaned, the borrower must post collateral equal to the required percentage of the market value of the loaned security, including any accrued interest. The required percentage is: (i) 102% with respect to U.S. securities and foreign securities that are denominated and payable in U.S. dollars; and (ii) 105% with respect to foreign securities. With respect to each loan, if on any business day the aggregate market value of securities collateral plus cash collateral held is less than the aggregate market value of the securities which are the subject of such loan, the borrower will be notified to provide additional collateral by the end of the following business day which, together with the collateral already held, will be not less than the applicable initial collateral requirements for such security loan. If the aggregate market value of securities collateral and cash collateral held with respect to a security loan exceeds the applicable initial collateral requirement, upon the request of the borrower, BNY Mellon must return enough collateral to the borrower by the end of the following business day to reduce the value of the remaining collateral to the applicable initial collateral requirement for such security loan. As a result of the foregoing, the value of the collateral held with respect to a loaned security may be temporarily more or less than the value of the security on loan.
Cash collateral received is generally invested in the Delaware Investments Collateral Fund No. 1 (Collective Trust) established by BNY Mellon for the purpose of investment on behalf of funds managed by DMC that participate in BNY Mellon’s securities lending program. The Collective Trust may invest in U.S. government securities and high quality corporate debt, asset-backed and other money market securities and in repurchase agreements collateralized by such securities, provided that the Collective Trust will generally have a dollar-weighted average portfolio maturity of 60 days or less. The Collective Trust seeks to maintain a net asset value per unit of $1.00, but there can be no assurance that it will always be able to do so. The Fund may incur investment losses as a result of investing securities lending collateral in the Collective Trust. This could occur if an investment in the Collective Trust defaulted or if it were necessary to liquidate assets in the Collective Trust to meet returns on outstanding security loans at a time when the Collective Trust’s net asset value per unit was less than $1.00. Under those circumstances, the Fund may not receive an amount from the Collective Trust that is equal in amount to the collateral the Fund would be required to return to the borrower of the securities and the Fund would be required to make up for this shortfall. The Fund can also accept U.S. government securities and letters of credit (non-cash collateral) in connection with securities loans. In the event of default or bankruptcy by the lending agent, realization and/or retention of the collateral may be subject to legal proceedings. In the event the borrower fails to return loaned securities and the collateral received is insufficient to cover the value of the loaned securities and provided such collateral shortfall is not the result of investment losses, the lending agent has agreed to pay the amount of the shortfall to the Fund, or at the discretion of the lending agent, replace the loaned securities. The Fund continues to record dividends or interest, as applicable, on the securities loaned and is subject to change in value of the securities loaned that may occur during the term of the loan. The Fund has the right under the Lending Agreement to recover the securities from the borrower on demand. With respect to
44
security loans collateralized by non-cash collateral, the Fund receives loan premiums paid by the borrower. With respect to security loans collateralized by cash collateral, the earnings from the collateral investments are shared among the Fund, the security lending agent and the borrower. The Fund records security lending income net of allocations to the security lending agent and the borrower. The Fund had no securities out on loan during the year ended July 31, 2011.
9. Credit and Market Risk
The Fund invests in fixed income securities whose value is derived from an underlying pool of mortgages or consumer loans. The value of these securities is sensitive to changes in economic conditions, including delinquencies and/or defaults, and may be adversely affected by shifts in the market’s perception of the issuers and changes in interest rates. Investors receive principal and interest payments as the underlying mortgages and consumer loans are paid back. Some of these securities are collateralized mortgage obligations (CMOs). CMOs are debt securities issued by U.S. government agencies or by financial institutions and other mortgage lenders, which are collateralized by a pool of mortgages held under an indenture. Prepayment of mortgages may shorten the stated maturity of the obligations and can result in a loss of premium, if any has been paid. Certain of these securities may be stripped (securities which provide only the principal or interest feature of the underlying security). The yield to maturity on an interest-only CMO is extremely sensitive not only to changes in prevailing interest rates, but also to the rate of principal payments (including prepayments) on the related underlying mortgage assets. A rapid rate of principal payments may have a material adverse affect on the Fund’s yield to maturity. If the underlying mortgage assets experience greater than anticipated prepayments of principal, the Fund may fail to fully recoup its initial investment in these securities even if the securities are rated in the highest rating categories.
The Fund invests a portion of its assets in high yield fixed income securities, which are securities rated lower than BBB- by Standard & Poor’s and Baa3 by Moody’s Investor Services, or similarly rated by another nationally recognized statistical rating organization. Investments in these higher yielding securities are generally accompanied by a greater degree of credit risk than higher rated securities. Additionally, lower rated securities may be more susceptible to adverse economic and competitive industry conditions than investment grade securities.
The Fund may invest up to 15% of its net assets in illiquid securities, which may include securities with contractual restrictions on resale, securities exempt from registration under Rule 144A of the Securities Act of 1933, as amended, and other securities which may not be readily marketable. The relative illiquidity of these securities may impair the Fund from disposing of them in a timely manner and at a fair price when it is necessary or desirable to do so. While maintaining oversight, the Fund’s Board has delegated to DMC the day-to-day functions of determining whether individual securities are liquid for purposes of the Fund’s limitation on investments in illiquid securities. Securities eligible for resale pursuant to Rule 144A, which are determined to be liquid, are not subject to the Fund’s 15% limit on investments in illiquid securities. As of July 31, 2011, no securities have been determined to be illiquid under the Fund’s Liquidity Procedures. Rule 144A securities have been identified on the schedule of investments.
45
Notes to financial statements
Delaware Core Bond Fund
10. Contractual Obligations
The Fund enters into contracts in the normal course of business that contain a variety of indemnifications. The Fund’s maximum exposure under these arrangements is unknown. However, the Fund has not had prior claims or losses pursuant to these contracts. Management has reviewed the Fund’s existing contracts and expects the risk of loss to be remote.
11. Subsequent Events
Management has determined that no material events or transactions occurred subsequent to July 31, 2011 that would require recognition or disclosure in the Fund’s financial statements.
12. Tax Information (Unaudited)
The information set forth below is for the Fund’s fiscal year as required by federal income tax laws. Shareholders, however, must report distributions on a calendar year basis for income tax purposes, which may include distributions for portions of two fiscal years of a fund. Accordingly, the information needed by shareholders for income tax purposes will be sent to them in January of each year. Please consult your tax advisor for proper treatment of this information. All designations are based on financial information available as of the date of this annual report and, accordingly are subject to change. For any and all items requiring designation, it is the intention of the Fund to designate the maximum amount permitted under the Internal Revenue Code and the regulations thereunder.
For the fiscal year ended July 31, 2011, the Fund designates distributions paid during the year as follows:
| (A) Ordinary Income Distribution (Tax Basis) | | 100 | % |
(A) is based on a percentage of the Fund’s total distributions.
46
Report of independent
registered public accounting firm
To the Board of Trustees Delaware Group® Income Funds
and the Shareholders of Delaware Core Bond Fund:
In our opinion, the accompanying statement of net assets, statement of assets and liabilities and the related statements of operations and of changes in net assets and the financial highlights present fairly, in all material respects, the financial position of Delaware Core Bond Fund (one of the series constituting Delaware Group Income Funds, hereafter referred to as the “Fund”) at July 31, 2011, the results of its operations for the year then ended and the changes in its net assets and the financial highlights for the year then ended and for the period November 1, 2009 through July 31, 2010, in conformity with accounting principles generally accepted in the United States of America. These financial statements and financial highlights (hereafter referred to as “financial statements”) are the responsibility of the Fund’s management; our responsibility is to express an opinion on these financial statements based on our audits. We conducted our audits of these financial statements in accordance with the standards of the Public Company Accounting Oversight Board (United States). Those standards require that we plan and perform the audit to obtain reasonable assurance about whether the financial statements are free of material misstatement. An audit includes examining, on a test basis, evidence supporting the amounts and disclosures in the financial statements, assessing the accounting principles used and significant estimates made by management, and evaluating the overall financial statement presentation. We believe that our audits, which included confirmation of securities at July 31, 2011 by correspondence with the custodian, provide a reasonable basis for our opinion. The statement of changes in net assets for the year ended October 31, 2009 and the financial highlights for each of the four years in the period ended October 31, 2009 were audited by other independent accountants whose report dated December 22, 2009 expressed an unqualified opinion on those statements.
PricewaterhouseCoopers LLP
Philadelphia, Pennsylvania
September 28, 2011
47
Other Fund information
(Unaudited)
Delaware Core Bond Fund
Change in Independent Registered Public Accounting Firm
Due to independence matters under the Securities and Exchange Commission’s auditor independence rules relating to the January 4, 2010 acquisition of Delaware Investments (including DMC, DDLP and DSC) by Macquarie Group, Ernst & Young LLP (E&Y) has resigned as the independent registered public accounting firm for Delaware Group® Income Funds (the Trust) effective May 20, 2010. At a meeting held on May 20, 2010, the Board of Trustees of the Trust, upon recommendation of the Audit Committee, selected PricewaterhouseCoopers LLP (PwC) to serve as the independent registered public accounting firm for the Trust for the fiscal period ending July 31, 2010. During the fiscal years ended October 31, 2009 and 2008, E&Y’s audit reports on the financial statements of the Trust did not contain any adverse opinion or disclaimer of opinion, nor were they qualified or modified as to uncertainty, audit scope, or accounting principles. In addition, there were no disagreements between the Trust and E&Y on accounting principles, financial statements disclosures or audit scope, which, if not resolved to the satisfaction of E&Y, would have caused them to make reference to the disagreement in their reports. Neither the Trust nor anyone on its behalf has consulted with PwC at any time prior to their selection with respect to the application of accounting principles to a specified transaction, either completed or proposed or the type of audit opinion that might be rendered on the Trust’s financial statements.
48
Board of trustees/directors and officers addendum
Delaware Investments® Family of Funds
A mutual fund is governed by a Board of Trustees/Directors (“Trustees”), which has oversight responsibility for the management of a fund’s business affairs. Trustees establish procedures and oversee and review the performance of the investment manager, the distributor, and others who perform services for the fund. The independent fund trustees, in particular, are advocates
| Name, Address, | | Position(s) | | Length of |
| and Birth Date | | Held with Fund(s) | | Time Served |
| Interested Trustees | | | | |
| | | | | |
| Patrick P. Coyne1 | | Chairman, President, | | Chairman and Trustee |
| 2005 Market Street | | Chief Executive Officer, | | since August 16, 2006 |
| Philadelphia, PA 19103 | | and Trustee | | |
| April 1963 | | | | President and |
| | | | | Chief Executive Officer |
| | | | | since August 1, 2006 |
| | | | | |
| | | | | |
| | | | | |
| | | | | |
| | | | | |
| | | | | |
| | | | | |
| | | | | |
| | | | | |
| | | | | |
| | | | | |
| | | | | |
| | | | | |
| | | | | |
| | | | | |
| | | | | |
| | | | | |
| | | | | |
1 Patrick P. Coyne is considered to be an “Interested Trustee” because he is an executive officer of the Fund’s(s’) investment advisor.
50
for shareholder interests. Each trustee has served in that capacity since he or she was elected to or appointed to the Board of Trustees, and will continue to serve until his or her retirement or the election of a new trustee in his or her place. The following is a list of the Trustees and Officers with certain background and related information.
| | | Number of Portfolios in | | |
| Principal Occupation(s) | | Fund Complex Overseen | | Other Directorships |
| During Past 5 Years | | by Trustee or Officer | | Held by Trustee or Officer |
| |
| |
| Patrick P. Coyne has served in | | 75 | | Director and Audit |
| various executive capacities | | | | Committee Member |
| at different times at | | | | Kaydon Corp. |
| Delaware Investments.2 | | | | |
| | | | | Board of Governors Member |
| | | | | Investment Company |
| | | | | Institute (ICI) |
| | | | | |
| | | | | Finance Committee Member |
| | | | | St. John Vianney Roman |
| | | | | Catholic Church |
| |
| | | | | Board of Trustees |
| | | | | Agnes Irwin School |
| |
| | | | | Member of Investment |
| | | | | Committee |
| | | | | Cradle of Liberty Council, |
| | | | | BSA |
| | | | | (2007–2010) |
| | | | | |
| |
| | | | | |
| | | | | |
| |
2 Delaware Investments is the marketing name for Delaware Management Holdings, Inc. and its subsidiaries, including the Fund’s(s’) investment advisor, principal underwriter, and its transfer agent.
51
Board of trustees/directors and officers addendum
Delaware Investments® Family of Funds
| Name, Address, | | Position(s) | | Length of |
| and Birth Date | | Held with Fund(s) | | Time Served |
| Independent Trustees | | | | |
| |
| Thomas L. Bennett | | Trustee | | Since March 2005 |
| 2005 Market Street | | | | |
| Philadelphia, PA 19103 | | | | |
| October 1947 | | | | |
| |
| |
| |
| |
| |
| |
| |
| |
| |
| |
| |
| John A. Fry | | Trustee | | Since January 2001 |
| 2005 Market Street | | | | |
| Philadelphia, PA 19103 | | | | |
| May 1960 | | | | |
| |
| |
| |
| |
| |
| |
| |
| |
| |
| |
| |
| Anthony D. Knerr | | Trustee | | Since April 1990 |
| 2005 Market Street | | | | |
| Philadelphia, PA 19103 | | | | |
| December 1938 | | | | |
| |
| Lucinda S. Landreth | | Trustee | | Since March 2005 |
| 2005 Market Street | | | | |
| Philadelphia, PA 19103 | | | | |
| June 1947 | | | | |
| |
52
| | | Number of Portfolios in | | |
| Principal Occupation(s) | | Fund Complex Overseen | | Other Directorships |
| During Past 5 Years | | by Trustee or Officer | | Held by Trustee or Officer |
| | | | | |
| |
| Private Investor | | 75 | | Chairman of Investment |
| (March 2004–Present) | | | | Committee |
| | | | | Pennsylvania Academy of |
| Investment Manager | | | | Fine Arts |
| Morgan Stanley & Co. | | | | |
| (January 1984–March 2004) | | | | Investment Committee and |
| | | | | Governance Committee |
| | | | | Member |
| | | | | Pennsylvania Horticultural |
| | | | | Society |
| | | | | |
| | | | | Director |
| | | | | Bryn Mawr Bank Corp. (BMTC) |
| | | | | (2007–2011) |
| |
| President | | 75 | | Board of Governors Member — |
| Drexel University | | | | NASDAQ OMX PHLX LLC |
| (August 2010–Present) | | | | |
| | | | | Director and Audit |
| President | | | | Committee Member |
| Franklin & Marshall College | | | | Community Health Systems |
| (July 2002–July 2010) | | | | |
| | | | | Director — Ecore |
| | | | | International |
| | | | | (2009–2010) |
| | | | | |
| | | | | Director — Allied |
| | | | | Barton Securities Holdings |
| | | | | (2005–2008) |
| |
| Managing Director | | 75 | | None |
| Anthony Knerr & Associates | | | | |
| (Strategic Consulting) | | | | |
| (1990–Present) | | | | |
| |
| Chief Investment Officer | | 75 | | None |
| Assurant, Inc. (Insurance) | | | | |
| (2002–2004) | | | | |
| | | | | |
| |
53
Board of trustees/directors and officers addendum
Delaware Investments® Family of Funds
| Name, Address, | | Position(s) | | Length of |
| and Birth Date | | Held with Fund(s) | | Time Served |
| Independent Trustees (continued) | | | | |
| |
| Ann R. Leven | | Trustee | | Since October 1989 |
| 2005 Market Street | | | | |
| Philadelphia, PA 19103 | | | | |
| November 1940 | | | | |
| |
| |
| |
| |
| |
| |
| Frances A. Sevilla-Sacasa | | Trustee | | Since September 2011 |
| 2005 Market Street | | | | |
| Philadelphia, PA 19103 | | | | |
| January 1956 | | | | |
| |
| |
| |
| |
| |
| |
| |
| |
| | | | | |
| | | | | |
| | | | | |
| | | | | |
| |
| |
| |
| | | | | |
| | | | | |
| | | | | |
| | | | | |
| | | | | |
| | | | | |
| | | | | |
| | | | | |
| | | | | |
| |
54
| | | Number of Portfolios in | | |
| Principal Occupation(s) | | Fund Complex Overseen | | Other Directorships |
| During Past 5 Years | | by Trustee or Officer | | Held by Trustee or Officer |
| | | | | |
| |
| Consultant | | 75 | | Director and Audit |
| ARL Associates | | | | Committee Chair |
| (Financial Planning) | | | | Systemax Inc. |
| (1983–Present) | | | | (2001–2009) |
| | | | | |
| | | | | Director and Audit |
| | | | | Committee Chairperson |
| | | | | Andy Warhol Foundation |
| | | | | (1999–2007) |
| |
| Executive Advisor to Dean | | 75 | | Trust Manager — Camden |
| (since August 2011) and | | | | Property Trust |
| Interim Dean | | | | (since August 2011) |
| (January 2011–July 2011) — | | | | |
| University of Miami School of | | | | Board of Trustees |
| Business Administration | | | | Thunderbird School of |
| | | | | Global Management |
| President — U.S. Trust, | | | | (2007–2011) |
| Bank of America Private | | | | |
| Wealth Management | | | | Board of Trustees |
| (Private Banking) | | | | Carrollton School of the |
| (July 2007–December 2008) | | | | Sacred Heart |
| | | | | (since 2007) |
| President and Director | | | | |
| (November 2005–June 2007) and | | | | Board Member |
| Chief Executive Officer | | | | Foreign Policy Association |
| (April 2007–June 2007) — | | | | (since 2006) |
| U.S. Trust Company | | | | |
| (Private Banking) | | | | Board of Trustees |
| | | | | Georgetown Preparatory School |
| | | | | (2005–2011) |
| | | | | |
| | | | | Board of Trustees |
| | | | | Miami City Ballet |
| | | | | (2000–2011) |
| | | | | |
| | | | | Board of Trustees |
| | | | | St. Thomas University |
| | | | | (2005–2011) |
| |
55
Board of trustees/directors and officers addendum
Delaware Investments® Family of Funds
| Name, Address, | | Position(s) | | Length of |
| and Birth Date | | Held with Fund(s) | | Time Served |
| Independent Trustees (continued) | | | | |
| | | | | |
| Janet L. Yeomans | | Trustee | | Since April 1999 |
| 2005 Market Street | | | | |
| Philadelphia, PA 19103 | | | | |
| July 1948 | | | | |
| |
| |
| |
| |
| J. Richard Zecher | | Trustee | | Since March 2005 |
| 2005 Market Street | | | | |
| Philadelphia, PA 19103 | | | | |
| July 1940 | | | | |
| |
| |
| | | | | |
| | | | | |
| | | | | |
| | | | | |
| | | | | |
| | | | | |
| | | | | |
| | | | | |
| | | | | |
| | | | | |
| | | | | |
| | | | | |
| | | | | |
| | | | | |
| |
56
| | | Number of Portfolios in | | |
| Principal Occupation(s) | | Fund Complex Overseen | | Other Directorships |
| During Past 5 Years | | by Trustee or Officer | | Held by Trustee or Officer |
| | | | | |
| | | | | |
| Vice President and Treasurer | | 75 | | Director and Audit |
| (January 2006–Present) | | | | Committee Member |
| Vice President — Mergers & Acquisitions | | | | Okabena Company |
| (January 2003–January 2006), and | | | | |
| Vice President and Treasurer | | | | Chair — 3M |
| (July 1995–January 2003) | | | | Investment Management |
| 3M Corporation | | | | Company |
| |
| Founder | | 75 | | Director and Audit |
| Investor Analytics | | | | Committee Member |
| (Risk Management) | | | | Investor Analytics |
| (May 1999–Present) | | | | |
| | | | | |
| Founder | | | | Director |
| Sutton Asset Management | | | | Oxigene, Inc. |
| (Hedge Fund) | | | | (2003–2008) |
| (September 1996–Present) | | | | |
| | | | | |
| | | | | |
| | | | | |
| | | | | |
| | | | | |
| | | | | |
| | | | | |
| | | | | |
| | | | | |
| | | | | |
| | | | | |
| |
57
Board of trustees/directors and officers addendum
Delaware Investments® Family of Funds
| Name, Address, | | Position(s) | | Length of |
| and Birth Date | | Held with Fund(s) | | Time Served |
| Officers | | | | |
| | | | | |
| David F. Connor | | Vice President, | | Vice President since |
| 2005 Market Street | | Deputy General | | September 2000 |
| Philadelphia, PA 19103 | | Counsel, and Secretary | | and Secretary since |
| December 1963 | | | | October 2005 |
| |
| |
| Daniel V. Geatens | | Vice President | | Treasurer |
| 2005 Market Street | | and Treasurer | | since October 2007 |
| Philadelphia, PA 19103 | | | | |
| October 1972 | | | | |
| |
| David P. O’Connor | | Senior Vice President, | | Senior Vice President, |
| 2005 Market Street | | General Counsel, | | General Counsel, and |
| Philadelphia, PA 19103 | | and Chief Legal Officer | | Chief Legal Officer |
| February 1966 | | | | since October 2005 |
| |
| Richard Salus | | Senior Vice President | | Chief Financial Officer |
| 2005 Market Street | | and Chief Financial Officer | | since November 2006 |
| Philadelphia, PA 19103 | | | | |
| October 1963 | | | | |
| |
The Statement of Additional Information for the Fund(s) includes additional information about the Trustees and Officers and is available, without charge, upon request by calling 800 523-1918.
58
| | | Number of Portfolios in | | |
| Principal Occupation(s) | | Fund Complex Overseen | | Other Directorships |
| During Past 5 Years | | by Trustee or Officer | | Held by Trustee or Officer |
| |
| |
| David F. Connor has served as | | 75 | | None3 |
| Vice President and Deputy | | | | |
| General Counsel of | | | | |
| Delaware Investments | | | | |
| since 2000. | | | | |
| |
| Daniel V. Geatens has served | | 75 | | None3 |
| in various capacities at | | | | |
| different times at | | | | |
| Delaware Investments. | | | | |
| |
| David P. O’Connor has served in | | 75 | | None3 |
| various executive and legal | | | | |
| capacities at different times | | | | |
| at Delaware Investments. | | | | |
| |
| Richard Salus has served in | | 75 | | None3 |
| various executive capacities | | | | |
| at different times at | | | | |
| Delaware Investments. | | | | |
| |
3 David F. Connor, Daniel V. Geatens, David P. O’Connor, and Richard Salus serve in similar capacities for the six portfolios of the Optimum Fund Trust, which have the same investment advisor, principal underwriter, and transfer agent as the registrant.
59
About the organization
| Board of trustees |
Patrick P. Coyne
Chairman, President, and
Chief Executive Officer
Delaware Investments®
Family of Funds
Philadelphia, PA Thomas L. Bennett
Private Investor
Rosemont, PA John A. Fry
President
Drexel University
Philadelphia, PA | Anthony D. Knerr
Founder and Managing
Director
Anthony Knerr &
Associates
New York, NY Lucinda S. Landreth
Former Chief Investment
Officer
Assurant, Inc.
Philadelphia, PA | Ann R. Leven
Consultant
ARL Associates
New York, NY Frances A. Sevilla-Sacasa
Executive Advisor to Dean, University of Miami School of Business Administration Coral Gables, FL | Janet L. Yeomans
Vice President and
Treasurer
3M Corporation
St. Paul, MN J. Richard Zecher
Founder
Investor Analytics
Scottsdale, AZ |
| | | | |
| Affiliated officers |
David F. Connor
Vice President, Deputy
General Counsel, and
Secretary
Delaware Investments
Family of Funds
Philadelphia, PA | Daniel V. Geatens
Vice President and
Treasurer
Delaware Investments
Family of Funds
Philadelphia, PA | David P. O’Connor
Senior Vice President,
General Counsel,
and Chief Legal Officer
Delaware Investments
Family of Funds
Philadelphia, PA | Richard Salus
Senior Vice President and
Chief Financial Officer
Delaware Investments
Family of Funds
Philadelphia, PA |
| This annual report is for the information of Delaware Core Bond Fund shareholders, but it may be used with prospective investors when preceded or accompanied by the Delaware Investments Fund fact sheet for the most recently completed calendar quarter. These documents are available at www.delawareinvestments.com. |
Delaware Investments is the marketing name of Delaware Management Holdings, Inc. and its subsidiaries. The Fund files its complete schedule of portfolio holdings with the Securities and Exchange Commission (SEC) for the first and third quarters of each fiscal year on Form N-Q. The Fund’s Forms N-Q, as well as a description of the policies and procedures that the Fund uses to determine how to vote proxies (if any) relating to portfolio securities are available without charge (i) upon request, by calling 800 523-1918; and (ii) on the SEC’s website at www.sec.gov. In addition, a description of the policies and procedures that the Fund uses to determine how to vote proxies (if any) relating to portfolio securities and the Fund’s Schedule of Investments are available without charge on the Fund’s website at www.delawareinvestments.com. The Fund’s Forms N-Q may be reviewed and copied at the SEC’s Public Reference Room in Washington, D.C.; information on the operation of the Public Reference Room may be obtained by calling 800 SEC-0330. Information (if any) regarding how the Fund voted proxies relating to portfolio securities during the most recently disclosed 12-month period ended June 30 is available without charge (i) through the Funds’ website at www.delawareinvestments.com; and (ii) on the SEC’s website at www.sec.gov. |
60
Annual report Delaware Corporate Bond FundDelaware Extended Duration Bond Fund July 31, 2011 Fixed income mutual funds |
| Carefully consider the Funds’ investment objectives, risk factors, charges, and expenses before investing. This and other information can be found in the Funds’ prospectuses and, if available, their summary prospectuses, which may be obtained by visiting www.delawareinvestments.com or calling 800 523-1918. Investors should read the prospectus and, if available, the summary prospectus carefully before investing. |
You can obtain shareholder reports and prospectuses online instead of in the mail.
Visit www.delawareinvestments.com/edelivery. |
Experience Delaware Investments
Delaware Investments is committed to the pursuit of consistently superior asset management and unparalleled client service. We believe in our investment processes, which seek to deliver consistent results, and in convenient services that help add value for our clients.
If you are interested in learning more about creating an investment plan, contact your financial advisor.
You can learn more about Delaware Investments or obtain a prospectus for Delaware Corporate Bond Fund and Delaware Extended Duration Bond Fund at www.delawareinvestments.com.
| Manage your investments online |
- 24-hour access to your account information
- Obtain share prices
- Check your account balance and recent transactions
- Request statements or literature
- Make purchases and redemptions
|
Delaware Management Holdings, Inc. and its subsidiaries (collectively known by the marketing name of Delaware Investments) are wholly owned subsidiaries of Macquarie Group Limited, a global provider of banking, financial, advisory, investment and funds management services.
Investments in Delaware Corporate Bond Fund and Delaware Extended Duration Bond Fund are not and will not be deposits with or liabilities of Macquarie Bank Limited ABN 46 008 583 542 and its holding companies, including their subsidiaries or related companies (Macquarie Group), and are subject to investment risk, including possible delays in repayment and loss of income and capital invested. No Macquarie Group company guarantees or will guarantee the performance of the Funds, the repayment of capital from the Funds, or any particular rate of return.
Table of contents
| Portfolio management review | 1 |
| Performance summaries | 5 |
| Disclosure of Fund expenses | 14 |
| Security types/sector allocations | 16 |
| Statements of net assets | 18 |
| Statements of operations | 56 |
| Statements of changes in net assets | 58 |
| Financial highlights | 62 |
| Notes to financial statements | 82 |
| Report of independent registered | |
| public accounting firm | 107 |
| Other Fund information | 108 |
| Board of trustees/directors and | |
| officers addendum | 110 |
| About the organization | 120 |
Unless otherwise noted, views expressed herein are current as of July 31, 2011, and subject to change.
Funds are not FDIC insured and are not guaranteed. It is possible to lose the principal amount invested.
Mutual fund advisory services provided by Delaware Management Company, a series of Delaware Management Business Trust, which is a registered investment advisor. Delaware Investments, a member of Macquarie Group, refers to Delaware Management Holdings, Inc. and its subsidiaries, including the Funds’ distributor, Delaware Distributors, L.P. Macquarie Group refers to Macquarie Group Limited and its subsidiaries and affiliates worldwide.
© 2011 Delaware Management Holdings, Inc.
All third-party trademarks cited are the property of their respective owners.
| Portfolio management review | |
| Delaware Corporate Bond Fund and Delaware Extended Duration Bond Fund | August 9, 2011 |
| Performance preview (for the year ended July 31, 2011) | | |
| Delaware Corporate Bond Fund (Class A shares) | | 1-year return | | +9.44% |
| Barclays Capital U.S. Corporate Investment Grade Index (benchmark) | | 1-year return | | +6.87% |
Past performance does not guarantee future results.
For complete, annualized performance for Delaware Corporate Bond Fund, please see the table on page 5.
The performance of Class A shares excludes the applicable sales charge and reflects the reinvestment of all distributions. Index performance returns do not reflect any management fees, transaction costs, or expenses. Indices are unmanaged and one cannot invest directly in an index.
| Delaware Extended Duration Bond Fund (Class A shares) | | 1-year return | | +9.74% |
| Barclays Capital Long U.S. Corporate Index (benchmark) | | 1-year return | | +8.37% |
Past performance does not guarantee future results.
For complete, annualized performance for Delaware Extended Duration Bond Fund, please see the table on page 9.
The performance of Class A shares excludes the applicable sales charge and reflects the reinvestment of all distributions. Index performance returns do not reflect any management fees, transaction costs, or expenses. Indices are unmanaged and one cannot invest directly in an index.
The Funds’ fiscal year ended July 31, 2011, was generally characterized by an increasingly challenging economic environment. Three main developments weighed on investor sentiment. First, the European government debt crisis, which initially surfaced in the spring of 2010, re-emerged as the fiscal year was getting under way. Investors sought to gauge its effects on various troubled economies — most notably, Greece, Spain, and Italy — as well as the willingness and ability of European policy makers to react in a generally constructive way.
Second, in the United States, the federal government struggled to forge a compromise in the battle over lifting the nation’s debt ceiling. In the initial days following the end of the Funds’ fiscal year, elected representatives finally passed an extension agreement backed by spending cuts, after much debate. The accord didn’t fully soothe investors’ fears — nor did rating agency Standard & Poor’s first-ever downgrade of the country’s credit rating from AAA to AA+, based on further conflict and expected legislative delays — but at least it eliminated the immediate risk of a perceived, though unlikely, credit default.
Third, mounting data along with austerity measures indicated a faltering global economic recovery and raised new fears of a double-dip recession in the U.S. The nation’s gross domestic product, which measures the combined dollar value of goods and services the country produces, grew by an estimated 1.3% in the second quarter of 2011, on the heels of a mere 0.4% increase in the first three months of 2011. Unemployment was an especially big trouble spot, with the U.S. jobless rate finishing July 2011 at 9.1%, up from 8.8% as recently as March 2011. (Sources: U.S. Commerce Department, U.S. Labor Department.) Despite these difficulties, many investors were eager buyers of corporate bonds during most of the fiscal year.
1
Portfolio management review
Delaware Corporate Bond Fund and Delaware Extended Duration Bond Fund
Surprising strength from corporates
Despite the challenging economic backdrop, corporate bonds generally performed well during the Funds’ fiscal year. For the most part, many issuers were in good financial health after several years of paying down debt, reining in expenses, and stockpiling cash. In general over this period, bonds issued from defensive sectors such as high-quality industrials, utilities, and healthcare outperformed their counterparts that were generally perceived to have higher credit risk. Bonds of financial companies tended to lag, even though many issuers improved their balance sheets in recent years. Natural-resource, paper, and other highly economically sensitive bonds also generally trailed, given rising concern about a slowing global economy — especially in China, a huge source of demand for raw materials.
For its fiscal year, Delaware Corporate Bond Fund returned +9.44% for Class A shares at net asset value and +4.45% at maximum offer price (both figures reflect all distributions reinvested). For the same period, the Fund’s benchmark, the Barclays Capital U.S. Corporate Investment Grade Index, advanced 6.87%. For complete annualized performance of Delaware Corporate Bond Fund, please see the table on page 5.
During the same period, Delaware Extended Duration Bond Fund returned +9.74% for Class A shares at net asset value and +4.85% at maximum offer price (both figures reflect all distributions reinvested). For the same period, the Fund’s benchmark, the Barclays Capital Long U.S. Corporate Index, gained 8.37%. For complete annualized performance of Delaware Extended Duration Bond Fund, please see the table on page 9.
Despite the challenging economic backdrop, corporate bonds generally performed well during the Funds’ fiscal year. For the most part, many issuers were in good financial health after several years of paying down debt, reining in expenses, and stockpiling cash. In general over this period, bonds issued from defensive sectors such as high-quality industrials, utilities, and healthcare outperformed their counterparts that were generally perceived to have higher credit risk. Bonds of financial companies tended to lag, even though many issuers improved their balance sheets in recent years. Natural-resource, paper, and other highly economically sensitive bonds also generally trailed, given rising concern about a slowing global economy — especially in China, a huge source of demand for raw materials.
2
Helpful performance factors
Many factors helped drive the Funds’ outperformance relative to their benchmarks, including: |
| |
- Solid bond selection among the Funds’ European holdings.
- Limited exposure to European financial bonds, which was helpful in light of the region’s serious debt challenges.
- Strong performances from high-quality cyclical bonds whose issuers generally continued to improve financially and operationally.
- A number of bonds in the Funds’ portfolios having been redeemed for premium prices by their issuers.
- Strong performance from the Funds’ master limited partnership (MLP) investments — leveraged energy infrastructure companies with healthy cash flows that we believed offered a favorable risk-reward balance.
|
Also noteworthy, the Funds benefited from our decision to try to head off several mounting risks. We purchased credit default swaps in an attempt to protect the Funds’ portfolios from the potential default of several troubled European economies — specifically Portugal, Ireland, and Spain — that we saw as especially vulnerable. We also bought credit default swaps that are based on a broad measure of high yield corporate bonds, which had run up sharply in price and which we believed had increased potential to correct downward. Both of these positions contributed to the Funds’ performance as investor concern grew.
Sources of underperformance
On the negative side, the Funds’ allocation to high yield issues (bonds with credit ratings below BBB) hampered relative performance.
At the end of the fiscal year, the portfolios for Delaware Corporate Bond Fund and Delaware Extended Duration Bond Fund had high yield weightings of 17.60% and 15.66%, respectively. Although high yield bonds began the fiscal year on the rise, investors’ mounting concerns about the economy weighed on their performance over time. In retrospect, the Funds would have benefited instead from having added exposure to investment grade debt, which did better as a whole.
In addition, the Funds had more-limited exposure to relatively defensive companies, such as bonds issued by various large-cap industrial, healthcare, utility, and technology firms. We were cautious about these types of securities because we believed their prices had limited room to keep rising, or spread contracting, while their yields had fallen to already low levels (it’s important to remember that bond yields and prices move in opposite directions). Amid the challenging economic conditions, however, these bonds continued to rally, and the Funds would have benefited from additional exposure.
At the individual security level, the Funds’ notable detractors included a position in bonds issued by Canadian oil sands company Nexen, whose credit rating was downgraded by rating agency Moody’s Investors Service during the fiscal year. As a result, Nexen’s bonds lagged, as did those issued by OPTI Canada, a partner of Nexen in a joint Alberta oil sands development venture.
3
Portfolio management review
Delaware Corporate Bond Fund and Delaware Extended Duration Bond Fund
Positioned for challenges ahead
As the Funds’ fiscal year came to a close, the global economy and corporate bond investors were dealing with greater-than-usual uncertainty. For these reasons, we continued to position the Funds’ portfolios defensively. To that end, we maintained the Funds’ “tail risk” protection — that is, we attempted to reduce any potential effect from a cataclysmic decline in asset values likely to be triggered by European sovereign or financial-related contagion issues. At the same time, the Funds’ interest rate swaps may help hedge the portfolios against possible higher interest rates, a likely scenario in the event of an economic recovery.
As a final note, we think it’s worth pointing out that despite our generally defensive portfolio allocations, we continue to view corporate bonds’ valuations as relatively attractive compared to other alternatives in the investment grade bond asset class — whether agency debt, Treasurys, or asset-backed or commercial mortgage-backed securities. We view corporate bonds as a potentially productive complement to a general fixed income strategy, as well as an alternative to uncertain equity-related prospects.
4
| Performance summaries | |
| Delaware Corporate Bond Fund | July 31, 2011 |
The performance data quoted represent past performance; past performance does not guarantee future results. Investment return and principal value will fluctuate so your shares, when redeemed, may be worth more or less than their original cost. Please obtain the performance data current for the most recent month end by calling 800 523-1918 or visiting our website at www.delawareinvestments.com/performance. Current performance may be lower or higher than the performance data quoted.
| Fund performance1,2 | | Average annual total returns through July 31, 2011 |
| | | 1 year | | 5 years | | 10 years | | Lifetime |
| Class A (Est. Sept. 15, 1998) | | | | | | | | | |
| Excluding sales charge | | +9.44% | | +8.80% | | +7.92% | | n/a | |
| Including sales charge | | +4.45% | | +7.79% | | +7.43% | | n/a | |
| Class B (Est. Sept. 15, 1998) | | | | | | | | | |
| Excluding sales charge | | +8.62% | | +7.99% | | +7.27% | | n/a | |
| Including sales charge | | +4.64% | | +7.77% | | +7.27% | | n/a | |
| Class C (Est. Sept. 15, 1998) | | | | | | | | | |
| Excluding sales charge | | +8.44% | | +7.98% | | +7.11% | | n/a | |
| Including sales charge | | +7.44% | | +7.98% | | +7.11% | | n/a | |
| Class R (Est. June 2, 2003) | | | | | | | | | |
| Excluding sales charge | | +8.98% | | +8.52% | | n/a | | +6.56 | % |
| Including sales charge | | +8.98% | | +8.52% | | n/a | | +6.56 | % |
| Institutional Class (Est. Sept. 15, 1998) | | | | | | | | | |
| Excluding sales charge | | +9.52% | | +9.11% | | +8.19% | | n/a | |
| Including sales charge | | +9.52% | | +9.11% | | +8.19% | | n/a | |
1 Returns reflect the reinvestment of all distributions and are presented both with and without the applicable sales charges described below. Returns do not reflect the deduction of taxes the shareholder would pay on Fund distributions or redemptions of Fund shares.
Expense limitations were in effect for certain classes during some or all of the periods shown in the “Fund performance” chart. The current expenses for each class are listed on the “Fund expense ratios” table on page 7. Performance would have been lower had expense limitations not been in effect.
Class A shares are sold with a maximum front-end sales charge of up to 4.50%, and have an annual distribution and service fee of up to 0.30% of average daily net assets.
Performance for Class A shares, excluding sales charges, assumes that no front-end sales charge applied. This fee has been contractually limited to 0.25% of average daily net assets from Nov. 26, 2010, through Nov. 28, 2011.
Class B shares may be purchased only through dividend reinvestment and certain permitted exchanges as described in the prospectus. Please see the prospectus for additional information on Class B shares. Class B shares have a contingent deferred sales charge that declines from 4.00% to zero depending on the period of time the shares are held. They are also subject to an annual distribution and service fee of up to 1.00% of average daily net assets. Class B shares will automatically convert to Class A shares on a quarterly basis
5
Performance summaries
Delaware Corporate Bond Fund
approximately eight years after purchase. Ten-year and lifetime performance figures for Class B shares reflect conversion to Class A shares after approximately eight years.
Class C shares are sold with a contingent deferred sales charge of 1.00% if redeemed during the first 12 months. They are also subject to an annual distribution and service fee of up to 1.00% of average daily net assets.
Performance for Class B and C shares, excluding sales charges, assumes either that contingent deferred sales charges did not apply or that the investment was not redeemed.
Class R shares are available only for certain retirement plan products. They are sold without a sales charge and have an annual distribution and service fee of up to 0.60% of average daily net assets, which has been limited contractually to 0.50% from Nov. 26, 2010, through Nov. 28, 2011.
Institutional Class shares are available without sales or asset-based distribution charges only to certain eligible institutional accounts.
The “Fund performance” table and the “Performance of a $10,000 investment” graph do not reflect the deduction of taxes the shareholder would pay on Fund distributions or redemptions of Fund shares.
Fixed income securities and bond funds can lose value, and investors can lose principal, as interest rates rise. They also may be affected by economic conditions that hinder an issuer’s ability to make interest and principal payments on its debt.
The Fund may also be subject to prepayment risk, the risk that the principal of a fixed income security that is held by the Fund may be prepaid prior to maturity, potentially forcing the Fund to reinvest that money at a lower interest rate.
High yielding, noninvestment grade bonds (junk bonds) involve higher risk than investment grade bonds.
International investments entail risks not ordinarily associated with U.S. investments including fluctuation in currency values, differences in accounting principles, or economic or political instability in other nations.
Investing in emerging markets can be riskier than investing in established foreign markets due to increased volatility and lower trading volume.
The Fund may experience portfolio turnover in excess of 100%, which could result in higher transaction costs and tax liability.
Per Standard & Poor’s credit rating agency, bonds rated below AAA, including A, are more susceptible to the adverse effects of changes in circumstances and economic conditions than those in higher-rated categories, but the obligor’s capacity to meet its financial commitment on the obligation is still strong. Bonds rated BBB exhibit adequate protection parameters, although adverse economic conditions or changing circumstances are more likely to lead to a weakened capacity of the obligor to meet its financial commitments. Bonds rated BB, B, and CCC are regarded as having significant speculative characteristics with BB indicating the least degree of speculation.
6
2 The Fund’s expense ratios, as described in the most recent prospectus, are disclosed in the following “Fund expense ratios” table. Delaware Investments has agreed to reimburse certain expenses and/or waive certain fees in order to prevent total fund operating expenses (excluding certain fees and expenses) from exceeding 0.70% of the Fund’s average daily net assets from Nov. 26, 2010, through Nov. 28, 2011. Please see the most recent prospectus and any applicable supplement(s) for additional information on these fee waivers and/or reimbursements.
| Fund expense ratios | Class A | | Class B | | Class C | | Class R | | Institutional Class |
| Total annual operating expenses | 1.10% | | 1.80% | | 1.80% | | 1.40% | | 0.80% |
| (without fee waivers) | | | | | | | | | |
| Net expenses | 0.95% | | 1.70% | | 1.70% | | 1.20% | | 0.70% |
| (including fee waivers, if any) | | | | | | | | | |
| Type of waiver | Contractual | | Contractual | | Contractual | | Contractual | | Contractual |
7
Performance summaries
Delaware Corporate Bond Fund
Performance of a $10,000 investment1
Average annual total returns from July 31, 2001, through July 31, 2011
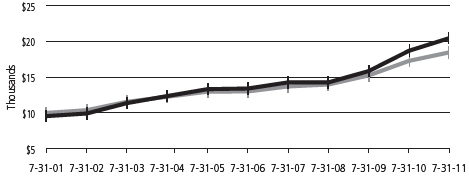
| For period beginning July 31, 2001, through July 31, 2011 | Starting value | Ending value |
| | Delaware Corporate Bond Fund — Class A shares | $9,550 | $20,433 |
| | Barclays Capital U.S. Corporate
Investment Grade Index | $10,000 | $18,447 |
1 The “Performance of a $10,000 investment” graph assumes $10,000 invested in Class A shares of the Fund on July 31, 2001, and includes the effect of a 4.50% front-end sales charge and the reinvestment of all distributions. The graph does not reflect the deduction of taxes the shareholders would pay on Fund distributions or redemptions of Fund shares. Expense limitations were in effect for some or all of the periods shown. Performance would have been lower had expense limitations not been in effect. Current expenses are listed in the “Fund expense ratios” table on page 7. Please note additional details on pages 5 through 8.
The chart also assumes $10,000 invested in the Barclays Capital U.S. Corporate Investment Grade Index as of July 31, 2001. The Barclays Capital U.S. Corporate Investment Grade Index is composed of U.S. dollar–denominated, investment grade, SEC-registered corporate bonds issued by industrial, utility, and financial companies. All bonds in the index have at least one year to maturity.
Index performance returns do not reflect any management fees, transaction costs, or expenses. Indices are unmanaged and one cannot invest directly in an index. Past performance is not a guarantee of future results.
Performance of other Fund classes will vary due to different charges and expenses.
| | | Nasdaq symbols | | CUSIPs | |
| Class A | | DGCAX | | 245908785 | |
| Class B | | DGCBX | | 245908777 | |
| Class C | | DGCCX | | 245908769 | |
| Class R | | DGCRX | | 245908744 | |
| Institutional Class | | DGCIX | | 245908751 | |
8
| Performance summaries | |
| Delaware Extended Duration Bond Fund | July 31, 2011 |
The performance data quoted represent past performance; past performance does not guarantee future results. Investment return and principal value will fluctuate so your shares, when redeemed, may be worth more or less than their original cost. Please obtain the performance data current for the most recent month end by calling 800 523-1918 or visiting our website at www.delawareinvestments.com/performance. Current performance may be lower or higher than the performance data quoted.
| Fund performance1,2 | Average annual total returns through July 31, 2011 |
| | 1 year | | 5 years | | 10 years | | Lifetime |
| Class A (Est. Sept. 15, 1998) | | | | | | | | | |
| Excluding sales charge | +9.74% | | | +10.67% | | | +9.40% | | n/a |
| Including sales charge | +4.85% | | | +9.68% | | | +8.89% | | n/a |
| Class B (Est. Sept. 15, 1998) | | | | | | | | | |
| Excluding sales charge | +8.93% | | | +9.82% | | | +8.73% | | n/a |
| Including sales charge | +4.97% | | | +9.62% | | | +8.73% | | n/a |
| Class C (Est. Sept. 15, 1998) | | | | | | | | | |
| Excluding sales charge | +9.09% | | | +9.85% | | | +8.59% | | n/a |
| Including sales charge | +8.10% | | | +9.85% | | | +8.59% | | n/a |
| Class R (Est. Oct. 1, 2005) | | | | | | | | | |
| Excluding sales charge | +9.63% | | | +10.43% | | | n/a | | +8.38% |
| Including sales charge | +9.63% | | | +10.43% | | | n/a | | +8.38% |
| Institutional Class (Est. Sept. 15, 1998) | | | | | | | | | |
| Excluding sales charge | +10.01% | | | +10.93% | | | +9.67% | | n/a |
| Including sales charge | +10.01% | | | +10.93% | | | +9.67% | | n/a |
1 Returns reflect the reinvestment of all distributions and are presented both with and without the applicable sales charges described below. Returns do not reflect the deduction of taxes the shareholder would pay on Fund distributions or redemptions of Fund shares.
Expense limitations were in effect for certain classes during some or all of the periods shown in the “Fund performance” chart. The current expenses for each class are listed on the “Fund expense ratios” table on page 11. Performance would have been lower had expense limitations not been in effect.
Class A shares are sold with a maximum front-end sales charge of up to 4.50%, and have an annual distribution and service fee of up to 0.30% of average daily net assets.
Performance for Class A shares, excluding sales charges, assumes that no front-end sales charge applied. This fee has been contractually limited to 0.25% of average daily net assets from Nov. 26, 2010, through Nov. 28, 2011.
Class B shares may be purchased only through dividend reinvestment and certain permitted exchanges as described in the prospectus. Please see the prospectus for additional information on Class B shares. Class B shares have a contingent deferred sales charge that declines from 4.00% to zero depending on the period of time the shares are held. They are also subject to an annual distribution and service fee of up to 1.00% of average daily net assets. Class B shares will automatically convert to Class A shares on a quarterly basis
9
Performance summaries
Delaware Extended Duration Bond Fund
approximately eight years after purchase. Ten-year and lifetime performance figures for Class B shares reflect conversion to Class A shares after approximately eight years.
Class C shares are sold with a contingent deferred sales charge of 1.00% if redeemed during the first 12 months. They are also subject to an annual distribution and service fee of up to 1.00% of average daily net assets.
Performance for Class B and C shares, excluding sales charges, assumes either that contingent deferred sales charges did not apply or that the investment was not redeemed.
Class R shares are available only for certain retirement plan products. They are sold without a sales charge and have an annual distribution and service fee of up to 0.60% of average daily net assets, which has been limited contractually to 0.50% from Nov. 26, 2010, through Nov. 28, 2011.
Institutional Class shares are available without sales or asset-based distribution charges only to certain eligible institutional accounts.
The “Fund performance” table and the “Performance of a $10,000 investment” graph do not reflect the deduction of taxes the shareholder would pay on Fund distributions or redemptions of Fund shares.
Fixed income securities and bond funds can lose value, and investors can lose principal, as interest rates rise. They also may be affected by economic conditions that hinder an issuer’s ability to make interest and principal payments on its debt.
The Fund may also be subject to prepayment risk, the risk that the principal of a fixed income security that is held by the Fund may be prepaid prior to maturity, potentially forcing the Fund to reinvest that money at a lower interest rate.
High yielding, noninvestment grade bonds (junk bonds) involve higher risk than investment grade bonds.
International investments entail risks not ordinarily associated with U.S. investments including fluctuation in currency values, differences in accounting principles, or economic or political instability in other nations.
Investing in emerging markets can be riskier than investing in established foreign markets due to increased volatility and lower trading volume.
The Fund may experience portfolio turnover in excess of 100%, which could result in higher transaction costs and tax liability.
Per Standard & Poor’s credit rating agency, bonds rated below AAA, including A, are more susceptible to the adverse effects of changes in circumstances and economic conditions than those in higher-rated categories, but the obligor’s capacity to meet its financial commitment on the obligation is still strong. Bonds rated BBB exhibit adequate protection parameters, although adverse economic conditions or changing circumstances are more likely to lead to a weakened capacity of the obligor to meet its financial commitments. Bonds rated BB, B, and CCC are regarded as having significant speculative characteristics with BB indicating the least degree of speculation.
10
2 The Fund’s expense ratios, as described in the most recent prospectus, are disclosed in the following “Fund expense ratios” table. Delaware Investments has agreed to reimburse certain expenses and/or waive certain fees in order to prevent total fund operating expenses (excluding certain fees and expenses) from exceeding 0.70% of the Fund’s average daily net assets from Nov. 26, 2010, through Nov. 28, 2011. Please see the most recent prospectus and any applicable supplement(s) for additional information on these fee waivers and/or reimbursements.
| Fund expense ratios | | Class A | | Class B | | Class C | | Class R | | Institutional Class |
| Total annual operating expenses | | 1.18% | | 1.88% | | 1.88% | | 1.48% | | 0.88% |
| (without fee waivers) | | | | | | | | | | |
| Net expenses | | 0.95% | | 1.70% | | 1.70% | | 1.20% | | 0.70% |
| (including fee waivers, if any) | | | | | | | | | | |
| Type of waiver | | Contractual | | Contractual | | Contractual | | Contractual | | Contractual |
11
Performance summaries
Delaware Extended Duration Bond Fund
Performance of a $10,000 investment1
Average annual total returns from July 31, 2001, through July 31, 2011
| For period beginning July 31, 2001, through July 31, 2011 | Starting value | Ending value |
| | Delaware Extended Duration Bond Fund — Class A shares | $9,550 | $23,423 |
| | Barclays Capital Long U.S. Corporate Index | $10,000 | $20,351 |
1 The “Performance of a $10,000 investment” graph assumes $10,000 invested in Class A shares of the Fund on July 31, 2001, and includes the effect of a 4.50% front-end sales charge and the reinvestment of all distributions. The graph does not reflect the deduction of taxes the shareholders would pay on Fund distributions or redemptions of Fund shares. Expense limitations were in effect for some or all of the periods shown. Performance would have been lower had expense limitations not been in effect. Current expenses are listed in the “Fund expense ratios” table on page 11. Please note additional details on pages 9 through 12.
The chart also assumes $10,000 invested in the Barclays Capital Long U.S. Corporate Index as of July 31, 2001. The Barclays Capital Long U.S. Corporate Index is composed of U.S. dollar–denominated, investment grade, SEC-registered corporate bonds issued by industrial, utility, and financial companies. All bonds in the index have at least 10 years to maturity.
Index performance returns do not reflect any management fees, transaction costs, or expenses. Indices are unmanaged and one cannot invest directly in an index. Past performance is not a guarantee of future results.
Performance of other Fund classes will vary due to different charges and expenses.
| | | Nasdaq symbols | | CUSIPs | |
| Class A | | | DEEAX | | 245908835 | |
| Class B | | | DEEBX | | 245908827 | |
| Class C | | | DEECX | | 245908819 | |
| Class R | | | DEERX | | 245908728 | |
| Institutional Class | | | DEEIX | | 245908793 | |
12
Disclosure of Fund expenses
For the six-month period from February 1, 2011 to July 31, 2011
As a shareholder of a Fund, you incur two types of costs: (1) transaction costs, including sales charges (loads) on purchase payments, reinvested dividends, or other distributions; redemption fees; and exchange fees; and (2) ongoing costs, including management fees; distribution and/or service (12b-1) fees; and other Fund expenses. These following examples are intended to help you understand your ongoing costs (in dollars) of investing in a Fund and to compare these costs with the ongoing costs of investing in other mutual funds.
The examples are based on an investment of $1,000 invested at the beginning of the period and held for the entire six-month period from February 1, 2011 to July 31, 2011.
Actual expenses
The first section of the tables shown, “Actual Fund return,” provides information about actual account values and actual expenses. You may use the information in this section of the table, together with the amount you invested, to estimate the expenses that you paid over the period. Simply divide your account value by $1,000 (for example, an $8,600 account value divided by $1,000 = 8.6), then multiply the result by the number in the first section under the heading entitled “Expenses Paid During Period” to estimate the expenses you paid on your account during this period.
Hypothetical example for comparison purposes
The second section of the tables shown, “Hypothetical 5% return,” provides information about hypothetical account values and hypothetical expenses based on the Funds’ actual expense ratios and an assumed rate of return of 5% per year before expenses, which is not the Funds’ actual return. The hypothetical account values and expenses may not be used to estimate the actual ending account balance or expenses you paid for the period. You may use this information to compare the ongoing costs of investing in each Fund and other funds. To do so, compare this 5% hypothetical example with the 5% hypothetical examples that appear in the shareholder reports of the other funds.
Please note that the expenses shown in the tables are meant to highlight your ongoing costs only and do not reflect any transactional costs, such as sales charges (loads), redemption fees, or exchange fees. Therefore, the second section of each table is useful in comparing ongoing costs only, and will not help you determine the relative total costs of owning different funds. In addition, if these transactional costs were included, your costs would have been higher. The Funds’ expenses shown in the tables reflect fee waivers in effect. The expenses shown in each table assume reinvestment of all dividends and distributions.
14
Delaware Corporate Bond Fund
Expense analysis of an investment of $1,000
| | Beginning | | Ending | | | | Expenses |
| | Account Value | | Account Value | | Annualized | | Paid During Period |
| | 2/1/11 | | 7/31/11 | | Expense Ratio | | 2/1/11 to 7/31/11* |
| Actual Fund return | | | | | | | | | | |
| Class A | $1,000.00 | | | $1,058.60 | | | 0.95% | | $4.85 | |
| Class B | 1,000.00 | | | 1,054.70 | | | 1.70% | | 8.66 | |
| Class C | 1,000.00 | | | 1,054.70 | | | 1.70% | | 8.66 | |
| Class R | 1,000.00 | | | 1,055.50 | | | 1.20% | | 6.12 | |
| Institutional Class | 1,000.00 | | | 1,059.90 | | | 0.70% | | 3.58 | |
| Hypothetical 5% return (5% return before expenses) | | | | | | |
| Class A | $1,000.00 | | | $1,020.08 | | | 0.95% | | $4.76 | |
| Class B | 1,000.00 | | | 1,016.36 | | | 1.70% | | 8.50 | |
| Class C | 1,000.00 | | | 1,016.36 | | | 1.70% | | 8.50 | |
| Class R | 1,000.00 | | | 1,018.84 | | | 1.20% | | 6.01 | |
| Institutional Class | 1,000.00 | | | 1,021.32 | | | 0.70% | | 3.51 | |
Delaware Extended Duration Bond Fund
Expense analysis of an investment of $1,000
| | Beginning | | Ending | | | | Expenses |
| | Account Value | | Account Value | | Annualized | | Paid During Period |
| | 2/1/11 | | 7/31/11 | | Expense Ratio | | 2/1/11 to 7/31/11* |
| Actual Fund return | | | | | | | | | | |
| Class A | $1,000.00 | | | $1,083.80 | | | 0.95% | | $4.91 | |
| Class B | 1,000.00 | | | 1,080.00 | | | 1.70% | | 8.77 | |
| Class C | 1,000.00 | | | 1,079.90 | | | 1.70% | | 8.77 | |
| Class R | 1,000.00 | | | 1,082.50 | | | 1.20% | | 6.20 | |
| Institutional Class | 1,000.00 | | | 1,083.50 | | | 0.70% | | 3.62 | |
| Hypothetical 5% return (5% return before expenses) | | | | | | |
| Class A | $1,000.00 | | | $1,020.08 | | | 0.95% | | $4.76 | |
| Class B | 1,000.00 | | | 1,016.36 | | | 1.70% | | 8.50 | |
| Class C | 1,000.00 | | | 1,016.36 | | | 1.70% | | 8.50 | |
| Class R | 1,000.00 | | | 1,018.84 | | | 1.20% | | 6.01 | |
| Institutional Class | 1,000.00 | | | 1,021.32 | | | 0.70% | | 3.51 | |
*“Expenses Paid During Period” are equal to the relevant Fund’s annualized expense ratios, multiplied by the average account value over the period, multiplied by 181/365 (to reflect the one-half year period).
15
| Security types/sector allocations |
| Delaware Corporate Bond Fund | | As of July 31, 2011 |
Sector designations may be different than the sector designations presented in other Fund materials. The sector designations may represent the investment manager’s internal sector classifications, which may result in the sector designations for one fund being different than another fund’s sector designations.
| Security type/sector | Percentage of net assets |
| Commercial Mortgage-Backed Security | 0.02% | |
| Convertible Bonds | 1.78% | |
| Corporate Bonds | 85.96% | |
| Banking | 15.98% | |
| Basic Industry | 9.15% | |
| Brokerage | 2.44% | |
| Capital Goods | 2.60% | |
| Communications | 9.00% | |
| Consumer Cyclical | 6.07% | |
| Consumer Non-Cyclical | 4.87% | |
| Electric | 6.14% | |
| Energy | 7.27% | |
| Finance Companies | 2.15% | |
| Insurance | 5.37% | |
| Natural Gas | 7.10% | |
| Real Estate | 3.83% | |
| Technology | 2.92% | |
| Transportation | 1.07% | |
| Municipal Bonds | 3.13% | |
| Regional Bonds | 0.28% | |
| Senior Secured Loans | 1.79% | |
| Sovereign Bonds | 3.35% | |
| Common Stock | 0.00% | |
| Convertible Preferred Stock | 0.18% | |
| Preferred Stock | 1.09% | |
| Purchased Options | 0.19% | |
| Short-Term Investments | 1.64% | |
| Securities Lending Collateral | 5.36% | |
| Total Value of Securities | 104.77% | |
| Written Options | 0.00% | |
| Obligation to Return Securities Lending Collateral | (5.39% | ) |
| Receivables and Other Assets Net of Other Liabilities | 0.62% | |
| Total Net Assets | 100.00% | |
16
| Delaware Extended Duration Bond Fund | As of July 31, 2011 |
Sector designations may be different than the sector designations presented in other Fund materials. The sector designations may represent the investment manager’s internal sector classifications, which may result in the sector designations for one fund being different than another fund’s sector designations.
| Security type/sector | Percentage of net assets |
| Commercial Mortgage-Backed Securities | 0.02% | |
| Convertible Bonds | 1.26% | |
| Corporate Bonds | 84.68% | |
| Banking | 12.80% | |
| Basic Industry | 7.41% | |
| Brokerage | 2.05% | |
| Capital Goods | 2.42% | |
| Communications | 9.90% | |
| Consumer Cyclical | 7.12% | |
| Consumer Non-Cyclical | 6.21% | |
| Electric | 8.84% | |
| Energy | 7.08% | |
| Finance Companies | 2.55% | |
| Insurance | 4.80% | |
| Natural Gas | 8.97% | |
| Real Estate | 2.24% | |
| Technology | 1.50% | |
| Transportation | 0.79% | |
| Municipal Bonds | 5.33% | |
| Regional Bonds | 0.22% | |
| Senior Secured Loans | 1.59% | |
| Sovereign Bonds | 2.75% | |
| U.S. Treasury Obligations | 0.68% | |
| Convertible Preferred Stock | 0.16% | |
| Preferred Stock | 1.04% | |
| Purchased Options | 0.15% | |
| Short-Term Investments | 0.93% | |
| Securities Lending Collateral | 9.85% | |
| Total Value of Securities | 108.66% | |
| Written Options | 0.00% | |
| Obligation to Return Securities Lending Collateral | (9.87% | ) |
| Receivables and Other Assets Net of Other Liabilities | 1.21% | |
| Total Net Assets | 100.00% | |
17
| Statements of net assets |
| Delaware Corporate Bond Fund | | July 31, 2011 |
| | | Principal amount° | | Value (U.S. $) |
| Commercial Mortgage-Backed Security – 0.02% | | | | | | |
| # | Merrill Lynch Mortgage Trust | | | | | | |
| | Series 2002-MW1 J 144A | | | | | | |
| | 5.695% 7/12/34 | USD | | 295,000 | | $ | 200,396 |
| Total Commercial Mortgage-Backed Security | | | | | | |
| | (cost $251,274) | | | | | | 200,396 |
| | |
| Convertible Bonds – 1.78% | | | | | | |
| | Amgen 0.375% exercise price $79.48, | | | | | | |
| | expiration date 2/1/13 | | | 1,102,000 | | | 1,108,888 |
| * | ArvinMeritor 4.00% exercise price $26.73, | | | | | | |
| | expiration date 2/15/27 | | | 2,612,000 | | | 2,334,475 |
| # | Clearwire Communications 144A 8.25% | | | | | | |
| | exercise price $7.08, | | | | | | |
| | expiration date 11/30/40 | | | 1,017,000 | | | 687,746 |
| # | Gaylord Entertainment 144A 3.75% | | | | | | |
| | exercise price $27.25, | | | | | | |
| | expiration date 9/29/14 | | | 840,000 | | | 1,058,400 |
| * | Health Care REIT 3.00% exercise price | | | | | | |
| | $51.08, expiration date 11/30/29 | | | 2,255,000 | | | 2,542,512 |
| Φ | Hologic 2.00% exercise price $38.59, | | | | | | |
| | expiration date 12/15/37 | | | 805,000 | | | 777,831 |
| * | Leap Wireless International 4.50% exercise | | | | | | |
| | price $93.21, expiration date 7/15/14 | | | 1,050,000 | | | 1,002,750 |
| | Level 3 Communications 3.50% exercise | | | | | | |
| | price $5.46, expiration date 6/15/12 | | | 1,934,000 | | | 1,931,583 |
| | Linear Technology 3.00% exercise price | | | | | | |
| | $44.11, expiration date 5/1/27 | | | 2,085,000 | | | 2,173,613 |
| | Live Nation Entertainment 2.875% exercise | | | | | | |
| | price $27.14, expiration date 7/14/27 | | | 2,607,000 | | | 2,479,908 |
| # | Owens-Brockway Glass Container 3.00% | | | | | | |
| | 144A exercise price $47.47, | | | | | | |
| | expiration date 5/28/15 | | | 2,072,000 | | | 1,996,890 |
| Total Convertible Bonds (cost $17,473,781) | | | | | | 18,094,596 |
| | |
| Corporate Bonds – 85.96% | | | | | | |
| Banking – 15.98% | | | | | | |
| | Abbey National Treasury Services | | | | | | |
| | 4.00% 4/27/16 | | | 7,875,000 | | | 7,720,532 |
| | AgriBank FCB 9.125% 7/15/19 | | | 4,517,000 | | | 5,796,743 |
18
| | | Principal amount° | | Value (U.S. $) |
| Corporate Bonds (continued) | | | | | | |
| Banking (continued) | | | | | | |
| | BAC Capital Trust VI 5.625% 3/8/35 | USD | | 2,250,000 | | $ | 1,977,901 |
| | Bank of America 3.75% 7/12/16 | | | 3,755,000 | | | 3,774,646 |
| • | BB&T Capital Trust IV 6.82% 6/12/57 | | | 11,400,000 | | | 11,585,251 |
| • | Bear Stearns 5.44% 12/7/12 | AUD | | 710,000 | | | 773,500 |
| * | Capital One Capital V 10.25% 8/15/39 | USD | | 2,785,000 | | | 2,963,936 |
| | Capital One Financial 4.75% 7/15/21 | | | 3,290,000 | | | 3,332,151 |
| | City National 5.25% 9/15/20 | | | 3,025,000 | | | 3,163,494 |
| @# | CoBank ACB 144A 7.875% 4/16/18 | | | 2,060,000 | | | 2,434,982 |
| # | Export-Import Bank of Korea 144A | | | | | | |
| | 5.25% 2/10/14 | | | 1,715,000 | | | 1,853,052 |
| • | Fifth Third Capital Trust IV 6.50% 4/15/37 | | | 4,880,000 | | | 4,782,400 |
| | Goldman Sachs Group 5.25% 7/27/21 | | | 5,000,000 | | | 5,113,830 |
| •# | HBOS Capital Funding 144A | | | | | | |
| | 6.071% 6/29/49 | | | 3,085,000 | | | 2,560,550 |
| # | HSBC Bank 144A 3.10% 5/24/16 | | | 7,290,000 | | | 7,386,578 |
| | JPMorgan Chase | | | | | | |
| | •5.19% 6/21/12 | AUD | | 1,800,000 | | | 1,964,888 |
| | 5.60% 7/15/41 | USD | | 1,250,000 | | | 1,266,026 |
| | 6.00% 10/1/17 | | | 6,430,000 | | | 7,251,715 |
| | JPMorgan Chase Capital XXV | | | | | | |
| | 6.80% 10/1/37 | | | 4,823,000 | | | 4,904,330 |
| | KeyBank 6.95% 2/1/28 | | | 4,700,000 | | | 5,273,240 |
| | KeyCorp 5.10% 3/24/21 | | | 4,310,000 | | | 4,517,807 |
| | Korea Development Bank 8.00% 1/23/14 | | | 3,030,000 | | | 3,461,387 |
| | Morgan Stanley 5.75% 1/25/21 | | | 2,705,000 | | | 2,852,863 |
| • | National City Bank 0.622% 6/7/17 | | | 2,030,000 | | | 1,906,192 |
| # | Nordea Bank 144A 4.875% 5/13/21 | | | 2,070,000 | | | 2,037,772 |
| | PNC Bank 6.875% 4/1/18 | | | 5,051,000 | | | 6,060,513 |
| • | PNC Financial Services Group | | | | | | |
| | 6.75% 7/29/49 | | | 3,185,000 | | | 3,189,879 |
| | PNC Funding | | | | | | |
| | 5.25% 11/15/15 | | | 115,000 | | | 126,963 |
| | 5.625% 2/1/17 | | | 25,000 | | | 27,815 |
| | Rabobank | | | | | | |
| | 4.50% 1/11/21 | | | 1,905,000 | | | 2,019,521 |
| | •#144A 11.00% 12/29/49 | | | 3,995,000 | | | 5,118,462 |
| • | Regions Financing Trust II | | | | | | |
| | 6.625% 5/15/47 | | | 4,300,000 | | | 3,814,332 |
19
Statements of net assets
Delaware Corporate Bond Fund
| | | Principal amount° | | Value (U.S. $) |
| Corporate Bonds (continued) | | | | | | |
| Banking (continued) | | | | | | |
| * | Santander Holdings USA 4.625% 4/19/16 | USD | | 1,900,000 | | $ | 1,965,028 |
| • | SunTrust Bank 0.548% 8/24/15 | | | 3,630,000 | | | 3,431,748 |
| • | SunTrust Capital VIII 6.10% 12/15/36 | | | 4,875,000 | | | 4,768,203 |
| * | SVB Financial Group 5.375% 9/15/20 | | | 3,785,000 | | | 3,908,126 |
| * | US Bancorp 4.125% 5/24/21 | | | 1,500,000 | | | 1,544,747 |
| • | USB Capital IX 3.50% 10/29/49 | | | 7,967,000 | | | 6,522,822 |
| • | Wachovia 0.619% 10/15/16 | | | 2,730,000 | | | 2,554,395 |
| * | Wachovia Bank 5.60% 3/15/16 | | | 4,075,000 | | | 4,498,307 |
| • | Wells Fargo Capital XIII 7.70% 12/29/49 | | | 7,306,000 | | | 7,570,843 |
| | Zions Bancorp | | | | | | |
| | *5.50% 11/16/15 | | | 1,933,000 | | | 2,011,805 |
| | 7.75% 9/23/14 | | | 1,940,000 | | | 2,138,910 |
| | | | | | | | 161,928,185 |
| Basic Industry – 9.15% | | | | | | |
| | Alcoa 6.75% 7/15/18 | | | 9,817,000 | | | 11,211,751 |
| | ArcelorMittal 9.85% 6/1/19 | | | 6,640,000 | | | 8,654,855 |
| # | Barrick North America Finance 144A | | | | | | |
| | 5.70% 5/30/41 | | | 6,320,000 | | | 6,520,704 |
| | Dow Chemical 8.55% 5/15/19 | | | 7,285,000 | | | 9,638,652 |
| | Georgia-Pacific | | | | | | |
| | 8.00% 1/15/24 | | | 3,490,000 | | | 4,312,551 |
| | #144A 5.40% 11/1/20 | | | 10,050,000 | | | 10,650,699 |
| | #144A 8.25% 5/1/16 | | | 450,000 | | | 512,414 |
| | Hexion US Finance 8.875% 2/1/18 | | | 1,685,000 | | | 1,794,525 |
| | International Paper | | | | | | |
| | 7.30% 11/15/39 | | | 1,000,000 | | | 1,152,847 |
| | 9.375% 5/15/19 | | | 4,065,000 | | | 5,382,649 |
| | Lubrizol | | | | | | |
| | 5.50% 10/1/14 | | | 2,105,000 | | | 2,372,745 |
| | 8.875% 2/1/19 | | | 2,765,000 | | | 3,683,807 |
| * | Lyondell Chemical 11.00% 5/1/18 | | | 2,450,000 | | | 2,786,875 |
| * | Momentive Performance Materials | | | | | | |
| | 11.50% 12/1/16 | | | 1,450,000 | | | 1,551,500 |
| *# | POSCO 144A 5.25% 4/14/21 | | | 6,585,000 | | | 6,885,935 |
| | Southern Copper 7.50% 7/27/35 | | | 5,895,000 | | | 6,693,678 |
| | Steel Dynamics 7.75% 4/15/16 | | | 832,000 | | | 884,000 |
20
| | | Principal amount° | | Value (U.S. $) |
| Corporate Bonds (continued) | | | | | | |
| Basic Industry (continued) | | | | | | |
| | Teck Resources | | | | | | |
| | 4.75% 1/15/22 | USD | | 415,000 | | $ | 434,199 |
| | 6.25% 7/15/41 | | | 3,515,000 | | | 3,784,492 |
| | 9.75% 5/15/14 | | | 3,180,000 | | | 3,878,239 |
| | | | | | | | 92,787,117 |
| Brokerage – 2.44% | | | | | | |
| | E Trade Financial PIK 12.50% 11/30/17 | | | 2,040,000 | | | 2,448,000 |
| | Jefferies Group | | | | | | |
| | 6.25% 1/15/36 | | | 2,620,000 | | | 2,527,173 |
| | 6.45% 6/8/27 | | | 6,627,000 | | | 6,730,361 |
| | Lazard Group 6.85% 6/15/17 | | | 8,495,000 | | | 9,544,889 |
| | Nuveen Investments | | | | | | |
| | 10.50% 11/15/15 | | | 1,975,000 | | | 2,068,813 |
| | #144A 10.50% 11/15/15 | | | 1,350,000 | | | 1,400,625 |
| | | | | | | | 24,719,861 |
| Capital Goods – 2.60% | | | | | | |
| # | ABB Treasury Center USA 144A | | | | | | |
| | 4.00% 6/15/21 | | | 2,390,000 | | | 2,423,434 |
| * | Ball 7.375% 9/1/19 | | | 798,000 | | | 881,790 |
| * | Clean Harbors 7.625% 8/15/16 | | | 1,342,000 | | | 1,432,585 |
| # | Meccanica Holdings USA 144A | | | | | | |
| | 6.25% 7/15/19 | | | 8,371,000 | | | 8,782,702 |
| # | Odebrecht Finance 144A 6.00% 4/5/23 | | | 3,439,000 | | | 3,507,780 |
| | Republic Services | | | | | | |
| | *4.75% 5/15/23 | | | 2,680,000 | | | 2,770,823 |
| | 5.25% 11/15/21 | | | 320,000 | | | 349,257 |
| | RSC Equipment Rental 10.25% 11/15/19 | | | 2,060,000 | | | 2,312,350 |
| # | Votorantim Cimentos 144A 7.25% 4/5/41 | | | 3,840,000 | | | 3,892,992 |
| | | | | | | | 26,353,713 |
| Communications – 9.00% | | | | | | |
| | Cablevision Systems 8.625% 9/15/17 | | | 600,000 | | | 666,000 |
| * | CenturyLink 6.45% 6/15/21 | | | 5,500,000 | | | 5,682,639 |
| # | Charter Communications Operating | | | | | | |
| | 144A 10.875% 9/15/14 | | | 1,349,000 | | | 1,494,018 |
| # | Clearwire Communications | | | | | | |
| | 144A 12.00% 12/1/15 | | | 3,000,000 | | | 3,067,500 |
| | Cricket Communications 7.75% 10/15/20 | | | 1,100,000 | | | 1,094,500 |
| | Crown Castle International 9.00% 1/15/15 | | | 719,000 | | | 790,900 |
21
Statements of net assets
Delaware Corporate Bond Fund
| | | Principal amount° | | Value (U.S. $) |
| Corporate Bonds (continued) | | | | | | |
| Communications (continued) | | | | | | |
| # | Crown Castle Towers 144A 4.883% 8/15/20 | USD | | 6,610,000 | | $ | 6,833,596 |
| | CSC Holdings | | | | | | |
| | *8.50% 4/15/14 | | | 612,000 | | | 685,440 |
| | 8.50% 6/15/15 | | | 460,000 | | | 499,100 |
| # | Digicel Group 144A 10.50% 4/15/18 | | | 775,000 | | | 869,938 |
| | Discovery Communications 4.375% 6/15/21 | | | 1,060,000 | | | 1,094,906 |
| * | Entravision Communications 8.75% 8/1/17 | | | 625,000 | | | 656,250 |
| | Intelsat Bermuda 11.25% 2/4/17 | | | 2,100,000 | | | 2,252,250 |
| | Intelsat Jackson Holdings 11.25% 6/15/16 | | | 513,000 | | | 547,628 |
| # | NBC Universal 144A 4.375% 4/1/21 | | | 500,000 | | | 512,138 |
| # | News America 144A 6.15% 2/15/41 | | | 5,080,000 | | | 5,085,364 |
| | PAETEC Holding 9.50% 7/15/15 | | | 900,000 | | | 942,750 |
| | Qwest 8.375% 5/1/16 | | | 4,957,000 | | | 5,898,830 |
| | Qwest Communications International | | | | | | |
| | 7.125% 4/1/18 | | | 2,000,000 | | | 2,150,000 |
| | Sprint Capital 6.875% 11/15/28 | | | 1,050,000 | | | 1,002,750 |
| | Telecom Italia Capital 7.721% 6/4/38 | | | 3,650,000 | | | 3,661,362 |
| | Telefonica Emisiones | | | | | | |
| | 5.462% 2/16/21 | | | 4,095,000 | | | 4,114,234 |
| | 6.421% 6/20/16 | | | 3,310,000 | | | 3,636,846 |
| | Telesat Canada 11.00% 11/1/15 | | | 665,000 | | | 731,500 |
| # | Telstra 144A 4.80% 10/12/21 | | | 3,000,000 | | | 3,088,074 |
| | Time Warner Cable 8.25% 4/1/19 | | | 5,481,000 | | | 7,034,694 |
| # | VimpelCom Holdings 144A 7.504% 3/1/22 | | | 2,940,000 | | | 2,947,350 |
| | Virgin Media Secured Finance | | | | | | |
| | 6.50% 1/15/18 | | | 7,650,000 | | | 8,453,249 |
| | #144A 5.25% 1/15/21 | | | 2,530,000 | | | 2,733,754 |
| # | Vivendi 144A 6.625% 4/4/18 | | | 7,877,000 | | | 9,062,480 |
| # | Wind Acquisition Finance 144A | | | | | | |
| | 11.75% 7/15/17 | | | 2,340,000 | | | 2,606,175 |
| # | XM Satellite Radio 144A 13.00% 8/1/13 | | | 1,160,000 | | | 1,365,900 |
| | | | | | | | 91,262,115 |
| Consumer Cyclical – 6.07% | | | | | | |
| * | Brinker International 5.75% 6/1/14 | | | 3,000,000 | | | 3,205,068 |
| | CVS Caremark 5.75% 5/15/41 | | | 5,920,000 | | | 6,186,743 |
| # | Delphi 144A 6.125% 5/15/21 | | | 3,340,000 | | | 3,390,100 |
| * | Ford Motor 7.45% 7/16/31 | | | 2,300,000 | | | 2,633,084 |
22
| | | Principal amount° | | Value (U.S. $) |
| Corporate Bonds (continued) | | | | | | |
| Consumer Cyclical (continued) | | | | | | |
| | Ford Motor Credit | | | | | | |
| | 5.00% 5/15/18 | USD | | 4,130,000 | | $ | 4,162,813 |
| | 5.875% 8/2/21 | | | 2,900,000 | | | 2,943,564 |
| | 7.50% 8/1/12 | | | 500,000 | | | 524,206 |
| | *9.875% 8/10/11 | | | 1,349,000 | | | 1,352,569 |
| * | Goodyear Tire & Rubber 10.50% 5/15/16 | | | 27,000 | | | 30,544 |
| | Harrah’s Operating 10.00% 12/15/18 | | | 1,335,000 | | | 1,201,500 |
| | Historic TW 6.875% 6/15/18 | | | 2,335,000 | | | 2,803,048 |
| | Host Hotels & Resorts | | | | | | |
| | 6.00% 11/1/20 | | | 2,745,000 | | | 2,823,919 |
| | *#144A 5.875% 6/15/19 | | | 2,175,000 | | | 2,210,344 |
| * | Macy’s Retail Holdings 8.125% 7/15/15 | | | 1,799,000 | | | 2,153,858 |
| | MGM Resorts International | | | | | | |
| | *10.375% 5/15/14 | | | 216,000 | | | 247,860 |
| | 11.125% 11/15/17 | | | 279,000 | | | 322,943 |
| | 11.375% 3/1/18 | | | 2,310,000 | | | 2,691,150 |
| | 13.00% 11/15/13 | | | 435,000 | | | 520,913 |
| * | OSI Restaurant Partners 10.00% 6/15/15 | | | 2,850,000 | | | 2,999,625 |
| * | Quiksilver 6.875% 4/15/15 | | | 2,000,000 | | | 1,957,500 |
| | Ryland Group 8.40% 5/15/17 | | | 378,000 | | | 413,910 |
| * | Sally Holdings 10.50% 11/15/16 | | | 621,000 | | | 667,575 |
| * | Time Warner 4.75% 3/29/21 | | | 370,000 | | | 389,663 |
| * | Wal-Mart Stores 5.625% 4/15/41 | | | 4,000,000 | | | 4,442,916 |
| | Wyndham Worldwide | | | | | | |
| | 5.625% 3/1/21 | | | 8,430,000 | | | 8,647,316 |
| | 5.75% 2/1/18 | | | 2,460,000 | | | 2,606,230 |
| | | | | | | | 61,528,961 |
| Consumer Non-Cyclical – 4.87% | | | | | | |
| | Amgen | | | | | | |
| | 3.45% 10/1/20 | | | 1,650,000 | | | 1,627,225 |
| | *4.10% 6/15/21 | | | 5,500,000 | | | 5,658,378 |
| | Bio-Rad Laboratories 4.875% 12/15/20 | | | 3,835,000 | | | 3,970,303 |
| | HCA | | | | | | |
| | 9.25% 11/15/16 | | | 1,343,000 | | | 1,439,528 |
| | PIK 9.625% 11/15/16 | | | 340,000 | | | 364,650 |
| *# | HCA Holdings 144A 7.75% 5/15/21 | | | 1,225,000 | | | 1,252,563 |
| # | inVentiv Health 144A 10.00% 8/15/18 | | | 2,010,000 | | | 1,969,800 |
| | Kraft Foods 6.50% 2/9/40 | | | 3,000,000 | | | 3,520,443 |
23
Statements of net assets
Delaware Corporate Bond Fund
| | | Principal amount° | | Value (U.S. $) |
| Corporate Bonds (continued) | | | | | | |
| Consumer Non-Cyclical (continued) | | | | | | |
| # | Mylan 144A 7.625% 7/15/17 | USD | | 2,895,000 | | $ | 3,191,738 |
| # | Pernod-Ricard 144A 5.75% 4/7/21 | | | 5,810,000 | | | 6,307,214 |
| * | Quest Diagnostics 4.70% 4/1/21 | | | 2,425,000 | | | 2,574,169 |
| | Sara Lee 4.10% 9/15/20 | | | 2,271,000 | | | 2,232,245 |
| * | Supervalu 7.50% 11/15/14 | | | 1,380,000 | | | 1,412,775 |
| | Whirlpool 4.85% 6/15/21 | | | 2,770,000 | | | 2,829,084 |
| # | Woolworths 144A | | | | | | |
| | 3.15% 4/12/16 | | | 1,775,000 | | | 1,833,458 |
| | 4.55% 4/12/21 | | | 8,770,000 | | | 9,205,719 |
| | | | | | | | 49,389,292 |
| Electric – 6.14% | | | | | | |
| | Ameren Illinois 9.75% 11/15/18 | | | 7,156,000 | | | 9,583,465 |
| # | American Transmission Systems 144A | | | | | | |
| | 5.25% 1/15/22 | | | 4,835,000 | | | 5,270,145 |
| | CenterPoint Energy 5.95% 2/1/17 | | | 5,155,000 | | | 5,902,351 |
| | CMS Energy 6.25% 2/1/20 | | | 1,430,000 | | | 1,567,589 |
| # | Enel Finance International 144A | | | | | | |
| | 6.00% 10/7/39 | | | 1,235,000 | | | 1,089,014 |
| | 6.25% 9/15/17 | | | 2,435,000 | | | 2,645,189 |
| | Great Plains Energy 4.85% 6/1/21 | | | 6,520,000 | | | 6,763,124 |
| *# | Ipalco Enterprises 144A 5.00% 5/1/18 | | | 2,450,000 | | | 2,437,689 |
| | Pennsylvania Electric 5.20% 4/1/20 | | | 4,281,000 | | | 4,660,887 |
| @# | Power Receivables Finance 144A | | | | | | |
| | 6.29% 1/1/12 | | | 19,479 | | | 19,498 |
| • | Puget Sound Energy 6.974% 6/1/67 | | | 7,145,000 | | | 7,385,758 |
| | South Carolina Electric & Gas 5.45% 2/1/41 | | | 4,600,000 | | | 4,916,025 |
| • | Wisconsin Energy 6.25% 5/15/67 | | | 9,859,000 | | | 9,949,812 |
| | | | | | | | 62,190,546 |
| Energy – 7.27% | | | | | | |
| | Canadian Natural Resources 6.25% 3/15/38 | | | 3,000,000 | | | 3,454,881 |
| | Chesapeake Energy 7.25% 12/15/18 | | | 1,439,000 | | | 1,604,485 |
| # | CNOOC Finance 2011 144A 4.25% 1/26/21 | | | 6,000,000 | | | 6,104,058 |
| # | ENI 144A 4.15% 10/1/20 | | | 4,885,000 | | | 4,694,343 |
| # | Hercules Offshore 144A 10.50% 10/15/17 | | | 825,000 | | | 866,250 |
| | Noble Energy 8.25% 3/1/19 | | | 5,644,000 | | | 7,402,367 |
| | Petrobras International Finance | | | | | | |
| | 3.875% 1/27/16 | | | 1,950,000 | | | 2,031,816 |
| | 5.375% 1/27/21 | | | 4,805,000 | | | 5,141,859 |
24
| | | Principal amount° | | Value (U.S. $) |
| Corporate Bonds (continued) | | | | | | |
| Energy (continued) | | | | | | |
| | Petrohawk Energy 7.25% 8/15/18 | USD | | 4,340,000 | | $ | 5,066,950 |
| | Pride International 6.875% 8/15/20 | | | 6,150,000 | | | 7,413,008 |
| | Sunoco Logistics Partners Operations | | | | | | |
| | 4.65% 2/15/22 | | | 4,415,000 | | | 4,496,708 |
| | Transocean 6.50% 11/15/20 | | | 6,255,000 | | | 7,352,114 |
| | Weatherford Bermuda 9.625% 3/1/19 | | | 4,420,000 | | | 5,925,425 |
| | Williams | | | | | | |
| | 7.75% 6/15/31 | | | 4,015,000 | | | 4,854,500 |
| | 8.75% 3/15/32 | | | 300,000 | | | 395,013 |
| # | Woodside Finance 144A 8.75% 3/1/19 | | | 5,355,000 | | | 6,935,046 |
| | | | | | | | 73,738,823 |
| Finance Companies – 2.15% | | | | | | |
| | FTI Consulting 6.75% 10/1/20 | | | 2,735,000 | | | 2,803,375 |
| | General Electric Capital | | | | | | |
| | 5.30% 2/11/21 | | | 2,315,000 | | | 2,472,288 |
| | 6.00% 8/7/19 | | | 4,289,000 | | | 4,856,932 |
| •# | ILFC E-Capital Trust I 144A 5.74% 12/21/65 | | | 2,400,000 | | | 2,018,376 |
| •# | ILFC E-Capital Trust II 144A 6.25% 12/21/65 | | | 3,065,000 | | | 2,635,900 |
| | International Lease Finance | | | | | | |
| | *6.25% 5/15/19 | | | 1,960,000 | | | 1,958,867 |
| | 8.75% 3/15/17 | | | 4,545,000 | | | 5,090,400 |
| | | | | | | | 21,836,138 |
| Insurance – 5.37% | | | | | | |
| | Allstate 7.45% 5/16/19 | | | 4,099,000 | | | 5,031,223 |
| | American International Group | | | | | | |
| | 8.25% 8/15/18 | | | 6,545,000 | | | 7,779,054 |
| • | Chubb 6.375% 3/29/67 | | | 6,606,000 | | | 6,853,725 |
| | Coventry Health Care 5.45% 6/15/21 | | | 5,030,000 | | | 5,333,686 |
| • | Genworth Financial 6.15% 11/15/66 | | | 1,040,000 | | | 686,400 |
| # | Highmark 144A | | | | | | |
| | 4.75% 5/15/21 | | | 4,445,000 | | | 4,543,119 |
| | 6.125% 5/15/41 | | | 920,000 | | | 963,115 |
| • | ING Groep 5.775% 12/29/49 | | | 2,050,000 | | | 1,865,500 |
| *•# | Liberty Mutual Group 144A 7.00% 3/15/37 | | | 2,775,000 | | | 2,703,635 |
| # | MetLife Capital Trust X 144A 9.25% 4/8/38 | | | 5,980,000 | | | 7,445,100 |
| | Prudential Financial 4.50% 11/15/20 | | | 5,505,000 | | | 5,687,045 |
| @=‡w# | Twin Reefs Pass Through Trust 144A | | | | | | |
| | 0.00% 12/29/49 | | | 3,100,000 | | | 0 |
25
Statements of net assets
Delaware Corporate Bond Fund
| | | Principal amount° | | Value (U.S. $) |
| Corporate Bonds (continued) | | | | | | |
| Insurance (continued) | | | | | | |
| #• | ZFS Finance USA Trust II 144A | | | | | | |
| | 6.45% 12/15/65 | USD | | 3,370,000 | | $ | 3,454,250 |
| #• | ZFS Finance USA Trust IV 144A | | | | | | |
| | 5.875% 5/9/32 | | | 2,015,000 | | | 2,040,667 |
| | | | | | | | 54,386,519 |
| Natural Gas – 7.10% | | | | | | |
| | El Paso Pipeline Partners Operating | | | | | | |
| | 6.50% 4/1/20 | | | 1,705,000 | | | 1,968,557 |
| | 7.50% 11/15/40 | | | 2,525,000 | | | 3,090,332 |
| • | Enbridge Energy Partners 8.05% 10/1/37 | | | 7,000,000 | | | 7,712,285 |
| | Energy Transfer Partners 9.70% 3/15/19 | | | 6,041,000 | | | 7,843,779 |
| | Enterprise Products Operating | | | | | | |
| | •7.034% 1/15/68 | | | 8,800,000 | | | 9,285,004 |
| | 9.75% 1/31/14 | | | 1,999,000 | | | 2,399,486 |
| * | Kinder Morgan Energy Partners | | | | | | |
| | 9.00% 2/1/19 | | | 5,105,000 | | | 6,686,544 |
| | NiSource Finance | | | | | | |
| | 6.40% 3/15/18 | | | 3,770,000 | | | 4,355,681 |
| | *6.80% 1/15/19 | | | 3,880,000 | | | 4,610,154 |
| | Plains All American Pipeline 8.75% 5/1/19 | | | 2,985,000 | | | 3,856,805 |
| | Sempra Energy 6.15% 6/15/18 | | | 5,785,000 | | | 6,721,719 |
| | TC Pipelines 4.65% 6/15/21 | | | 5,425,000 | | | 5,607,898 |
| • | TransCanada Pipelines 6.35% 5/15/67 | | | 7,652,000 | | | 7,847,386 |
| | | | | | | | 71,985,630 |
| Real Estate – 3.83% | | | | | | |
| | Brandywine Operating Partnership | | | | | | |
| | 4.95% 4/15/18 | | | 2,850,000 | | | 2,962,019 |
| | Developers Diversified Realty | | | | | | |
| | *4.75% 4/15/18 | | | 2,050,000 | | | 2,081,750 |
| | 7.50% 4/1/17 | | | 2,500,000 | | | 2,889,438 |
| | *7.875% 9/1/20 | | | 1,125,000 | | | 1,333,509 |
| | 9.625% 3/15/16 | | | 1,415,000 | | | 1,733,133 |
| | Digital Realty Trust | | | | | | |
| | 5.25% 3/15/21 | | | 4,535,000 | | | 4,642,003 |
| | 5.875% 2/1/20 | | | 1,680,000 | | | 1,811,087 |
| | Health Care REIT 5.25% 1/15/22 | | | 4,115,000 | | | 4,273,209 |
| | Regency Centers | | | | | | |
| | 4.80% 4/15/21 | | | 2,935,000 | | | 3,047,381 |
| | 5.875% 6/15/17 | | | 2,325,000 | | | 2,626,899 |
26
| | | Principal amount° | | Value (U.S. $) |
| Corporate Bonds (continued) | | | | | | |
| Real Estate (continued) | | | | | | |
| | UDR 4.25% 6/1/18 | USD | | 2,440,000 | | $ | 2,481,817 |
| | Ventas Realty 4.75% 6/1/21 | | | 4,890,000 | | | 4,974,925 |
| # | WEA Finance 144A 4.625% 5/10/21 | | | 3,875,000 | | | 3,919,431 |
| | | | | | | | 38,776,601 |
| Technology – 2.92% | | | | | | |
| | Applied Materials 5.85% 6/15/41 | | | 3,000,000 | | | 3,235,341 |
| * | First Data 11.25% 3/31/16 | | | 1,850,000 | | | 1,831,500 |
| * | GXS Worldwide 9.75% 6/15/15 | | | 1,700,000 | | | 1,725,500 |
| | Hewlett-Packard 4.30% 6/1/21 | | | 3,005,000 | | | 3,175,651 |
| | International Business Machines | | | | | | |
| | 1.95% 7/22/16 | | | 5,030,000 | | | 5,048,284 |
| | National Semiconductor 6.60% 6/15/17 | | | 6,644,000 | | | 8,015,667 |
| # | Seagate Technology International 144A | | | | | | |
| | 10.00% 5/1/14 | | | 4,083,000 | | | 4,715,865 |
| * | Xerox 4.50% 5/15/21 | | | 1,750,000 | | | 1,806,145 |
| | | | | | | | 29,553,953 |
| Transportation – 1.07% | | | | | | |
| * | CSX 4.25% 6/1/21 | | | 5,120,000 | | | 5,308,068 |
| | Ryder System 3.50% 6/1/17 | | | 5,320,000 | | | 5,488,974 |
| | | | | | | | 10,797,042 |
| Total Corporate Bonds (cost $822,120,042) | | | | | | 871,234,496 |
| | | | | | | | |
| Municipal Bonds – 3.13% | | | | | | |
| | Los Angeles, California Department of | | | | | | |
| | Water & Power Revenue Taxable Build | | | | | | |
| | America Bond 6.574% 7/1/45 | | | 5,365,000 | | | 6,382,580 |
| | Massachusetts Development Finance | | | | | | |
| | Agency Revenue (Harvard University) | | | | | | |
| | Series B-1 5.00% 10/15/40 | | | 10,010,000 | | | 10,533,822 |
| | Metropolitan Transportation Authority, | | | | | | |
| | New York Taxable Build America | | | | | | |
| | Bond (Dedicated Tax Fund) | | | | | | |
| | Series C-1 6.687% 11/15/40 | | | 4,500,000 | | | 5,072,580 |
| | San Francisco Bay Area Toll Authority, | | | | | | |
| | California Toll Bridge Revenue | | | | | | |
| | Taxable Build America Bond | | | | | | |
| | Series S3 6.907% 10/1/50 | | | 3,575,000 | | | 4,128,339 |
27
Statements of net assets
Delaware Corporate Bond Fund
| | | Principal amount° | | Value (U.S. $) |
| Municipal Bonds (continued) | | | | | | |
| | Triborough Bridge & Tunnel | | | | | | |
| | Authority, New York Revenue Taxable | | | | | | |
| | Build America Bond | | | | | | |
| | Series A-2 5.45% 11/15/32 | USD | | 5,560,000 | | $ | 5,565,060 |
| Total Municipal Bonds (cost $29,263,808) | | | | | | 31,682,381 |
| | | | | | | |
| Regional Bonds – 0.28%Δ | | | | | | |
| Australia – 0.12% | | | | | | |
| | New South Wales Treasury 6.00% 6/1/20 | AUD | | 1,081,000 | | | 1,255,591 |
| | | | | | | | 1,255,591 |
| Canada – 0.16% | | | | | | |
| | Quebec Province 4.50% 12/1/19 | CAD | | 1,395,000 | | | 1,584,383 |
| | | | | | | | 1,584,383 |
| Total Regional Bonds (cost $2,386,130) | | | | | | 2,839,974 |
| | | | | | | | |
| «Senior Secured Loans – 1.79% | | | | | | |
| | Alliance HealthCare Services 5.50% 6/1/16 | USD | | 1,182,000 | | | 1,179,293 |
| | Burlington Coat Factory Warehouse Tranche B | | | | | | |
| | 6.25% 2/10/17 | | | 1,705,000 | | | 1,707,660 |
| | Cengage Learning Acquisitions 7.50% 7/7/14 | | | 587,840 | | | 587,717 |
| | Chester Downs & Marina 12.375% 12/31/16 | | | 868,750 | | | 886,125 |
| | Chrysler Group 6.00% 4/28/17 | | | 3,000,000 | | | 2,925,014 |
| | Delta Air Lines Tranche B 5.50% 3/29/17 | | | 1,950,000 | | | 1,930,510 |
| | Goodman Global Tranche B 5.75% 10/28/16 | | | 992,500 | | | 998,882 |
| | Graham Packaging Tranche C 6.75% 4/5/14 | | | 2,134,471 | | | 2,140,181 |
| | MGM MIRAGE Tranche E 7.00% 2/21/14 | | | 1,095,000 | | | 1,076,013 |
| | Nuveen Investments 2nd Lien | | | | | | |
| | 12.50% 7/9/15 | | | 1,335,000 | | | 1,421,221 |
| | Reynolds Group Holdings 6.50% 7/7/18 | | | 2,525,000 | | | 2,512,690 |
| | Univision Communications 4.436% 3/29/17 | | | 794,088 | | | 753,752 |
| Total Senior Secured Loans (cost $17,974,037) | | | | | | 18,119,058 |
| | | | | | | |
| Sovereign Bonds – 3.35%Δ | | | | | | |
| Australia – 0.61% | | | | | | |
| | Australian Government Bond 4.50% 4/15/20 | AUD | | 2,473,000 | | | 2,666,064 |
| | Australian Government Inflation-Linked | | | | | | |
| | Bond 4.00% 8/20/15 | AUD | | 1,853,000 | | | 3,560,022 |
| | | | | | | | 6,226,086 |
28
| | | Principal amount° | | Value (U.S. $) |
| Sovereign Bonds (continued) | | | | | | |
| Brazil – 0.38% | | | | | | |
| | Brazil Notas do Tesouro Nacional Series F | | | | | | |
| | 10.00% 1/1/21 | BRL | | 6,988,000 | | $ | 3,855,450 |
| | | | | | | | 3,855,450 |
| Canada – 0.25% | | | | | | |
| | Canadian Government Bond | | | | | | |
| | 3.75% 6/1/19 | CAD | | 1,173,000 | | | 1,332,785 |
| | 4.00% 6/1/41 | CAD | | 993,000 | | | 1,180,311 |
| | | | | | | | 2,513,096 |
| Chile – 0.12% | | | | | | |
| | Chile Government International Bond | | | | | | |
| | 5.50% 8/5/20 | CLP | | 544,000,000 | | | 1,232,064 |
| | | | | | | | 1,232,064 |
| Germany – 0.05% | | | | | | |
| | Deutschland Republic 2.25% 9/4/20 | EUR | | 331,000 | | | 468,053 |
| | | | | | | | 468,053 |
| Indonesia – 0.43% | | | | | | |
| | Indonesia Treasury Bond 11.00% 11/15/20 | IDR | | 29,154,000,000 | | | 4,344,460 |
| | | | | | | | 4,344,460 |
| Lithuania – 0.15% | | | | | | |
| # | Lithuania Government International Bond | | | | | | |
| | 144A 6.125% 3/9/21 | USD | | 1,429,000 | | | 1,527,244 |
| | | | | | | | 1,527,244 |
| Poland – 0.50% | | | | | | |
| | Poland Government International Bond | | | | | | |
| | 5.125% 4/21/21 | | | 4,850,000 | | | 5,056,125 |
| | | | | | | | 5,056,125 |
| Republic of Korea – 0.60% | | | | | | |
| # | Korea Housing Finance 144A | | | | | | |
| | 3.50% 12/15/16 | | | 2,380,000 | | | 2,422,328 |
| | Korea Treasury Inflation-Linked Bond | | | | | | |
| | 2.75% 6/10/20 | KRW | | 3,464,765,406 | | | 3,677,953 |
| | | | | | | | 6,100,281 |
| Russia – 0.26% | | | | | | |
| | Russia-Eurobond 7.50% 3/31/30 | USD | | 2,223,050 | | | 2,662,102 |
| | | | | | | | 2,662,102 |
| Total Sovereign Bonds (cost $30,677,295) | | | | | | 33,984,961 |
29
Statements of net assets
Delaware Corporate Bond Fund
| | | Number of shares | | Value (U.S. $) |
| Common Stock– 0.00% | | | | | | |
| | Masco | | | 251 | | $ | 2,648 |
| *† | United Continental Holdings | | | 40 | | | 725 |
| Total Common Stock (cost $1,783) | | | | | | 3,373 |
| | | | | | | |
| Convertible Preferred Stock – 0.18% | | | | | | |
| # | Chesapeake Energy 144A 5.75% exercise | | | | | | |
| | price $27.94, expiration date 12/31/49 | | | 1,345 | | | 1,859,463 |
| Total Convertible Preferred Stock | | | | | | |
| | (cost $1,879,638) | | | | | | 1,859,463 |
| | | | | | | | |
| Preferred Stock – 1.09% | | | | | | |
| | Alabama Power 5.625% | | | 118,065 | | | 2,951,625 |
| | Ally Financial | | | | | | |
| | ∏•8.50% | | | 100,000 | | | 2,462,000 |
| | #144A 7.00% | | | 2,500 | | | 2,271,406 |
| • | PNC Financial Services Group 8.25% | | | 3,112,000 | | | 3,336,749 |
| Total Preferred Stock (cost $10,654,508) | | | | | | 11,021,780 |
| | | | | | | |
| | | Number of contracts | | | |
| Purchased Options – 0.19% | | | | | | |
| Put Options – 0.01% | | | | | | |
| | SPX, Strike Price $1,275, Expires 9/17/11 | | | 34 | | | 108,800 |
| | | | | | | | 108,800 |
| | | Notional amount° | | | |
| Put Swaptions – 0.18% | | | | | | |
| | 10-Yr IRS, Strike Rate 5.23%, Expires 1/13/14 | USD | | 10,000,000 | | | 279,981 |
| | 30-Yr IRS, Strike Rate 4.813%, Expires 1/13/14 | | | 20,000,000 | | | 1,497,148 |
| | | | | | | | 1,777,129 |
| Total Purchased Options (cost $2,523,803) | | | | | | 1,885,929 |
30
| | | Principal amount° | | Value (U.S. $) | |
| ≠ Short-Term Investments – 1.64% | | | | | | | | |
| Discount Notes – 0.42% | | | | | | | | |
| | Federal Home Loan Bank | | | | | | | | |
| | 0.006% 8/3/11 | USD | | 793,283 | | | $ | 793,281 | |
| | 0.010% 8/11/11 | | | 2,426,559 | | | | 2,426,541 | |
| | Freddie Mac 0.001% 8/15/11 | | | 994,740 | | | | 994,728 | |
| | | | | | | | | 4,214,550 | |
| U.S. Treasury Obligation – 1.22% | | | | | | | | |
| | U.S. Treasury Bill 0.037% 8/4/11 | | | 12,385,196 | | | | 12,384,936 | |
| | | | | | | | | 12,384,936 | |
| Total Short-Term Investments (cost $16,599,735) | | | | | | | 16,599,486 | |
| | | | | | | | | |
| Total Value of Securities Before Securities | | | | | | | | |
| | Lending Collateral – 99.41% (cost $951,805,834) | | | | | | | 1,007,525,893 | |
| | | | | | | | | | |
| | | Number of shares | | | | |
| Securities Lending Collateral** – 5.36% | | | | | | | | |
| | Investment Companies | | | | | | | | |
| | BNY Mellon SL DBT II Liquidating Fund | | | 87,120 | | | | 84,080 | |
| | Delaware Investments Collateral | | | | | | | | |
| | Fund No.1 | | | 54,288,558 | | | | 54,288,558 | |
| | @†Mellon GSL Reinvestment Trust II | | | 230,639 | | | | 0 | |
| Total Securities Lending Collateral | | | | | | | | |
| | (cost $54,606,317) | | | | | | | 54,372,638 | |
| | | | | | | | | | |
| Total Value of Securities – 104.77% | | | | | | | | |
| | (cost $1,006,412,151) | | | | | | | 1,061,898,531 | © |
| | | | | | | | |
| | | Number of contracts | | | | |
| Written Options – 0.00% | | | | | | | | |
| Put Options – 0.00% | | | | | | | | |
| | SPX, Strike Price $1,275, Expires 9/17/11 (MSC) | | | (34 | ) | | | (40,800 | ) |
| Total Written Options (premium received $(22,887)) | | | | | | | (40,800 | ) |
31
Statements of net assets
Delaware Corporate Bond Fund
| | | | Value (U.S. $) | |
| | | | | |
| Obligation to Return Securities | | | |
| | Lending Collateral** – (5.39%) | $ | (54,606,317 | ) |
| Receivables and Other Assets | | | |
| | Net of Other Liabilities – 0.62%*** | | 6,319,452 | |
| Net Assets Applicable to 167,607,501 | | | |
| | Shares Outstanding – 100.00% | $ | 1,013,570,866 | |
| | | | | |
| Net Asset Value – Delaware Corporate Bond Fund | | | |
| | Class A ($392,312,903 / 64,879,028 Shares) | | | $6.05 | |
| Net Asset Value – Delaware Corporate Bond Fund | | | |
| | Class B ($6,704,995 / 1,109,090 Shares) | | | $6.05 | |
| Net Asset Value – Delaware Corporate Bond Fund | | | |
| | Class C ($135,912,048 / 22,473,560 Shares) | | | $6.05 | |
| Net Asset Value – Delaware Corporate Bond Fund | | | |
| | Class R ($11,980,840 / 1,979,754 Shares) | | | $6.05 | |
| Net Asset Value – Delaware Corporate Bond Fund | | | |
| | Institutional Class ($466,660,080 / 77,166,069 Shares) | | | $6.05 | |
| | | | | |
| Components of Net Assets at July 31, 2011: | | | |
| Shares of beneficial interest (unlimited authorization – no par) | $ | 955,016,101 | |
| Distributions in excess of net investment income | | (361,280 | ) |
| Accumulated net realized gain on investments | | 2,157,324 | |
| Net unrealized appreciation of investments and foreign currencies | | 56,758,721 | |
| Total net assets | $ | 1,013,570,866 | |
°Principal amount is stated in the currency in which each security is denominated.
AUD — Australian Dollar
BRL — Brazilian Real
CAD — Canadian Dollar
CHF — Swiss Franc
CLP — Chilean Peso
EUR — European Monetary Unit
GBP — British Pound Sterling
IDR — Indonesian Rupiah
KRW — South Korean Won
NOK — Norwegian Kroner
USD — United States Dollar
32
| | |
| * | Fully or partially on loan. |
| # | Security exempt from registration under Rule 144A of the Securities Act of 1933, as amended. At July 31, 2011, the aggregate amount of Rule 144A securities was $211,520,467, which represented 20.87% of the Fund’s net assets. See Note 10 in “Notes to financial statements.” |
| Φ | Step coupon bond. Coupon increases or decreases periodically based on a predetermined schedule. Stated rate in effect at July 31, 2011. |
| • | Variable rate security. The rate shown is the rate as of July 31, 2011. Interest rates reset periodically. |
| @ | Illiquid security. At July 31, 2011, the aggregate amount of illiquid securities was $2,454,480, which represented 0.24% of the Fund’s net assets. See Note 10 in “Notes to financial statements.” |
| = | Security is being fair valued in accordance with the Fund’s fair valuation policy. At July 31, 2011, the aggregate amount of fair valued securities was $0, which represented 0.00% of the Fund’s net assets. See Note 1 in “Notes to financial statements.” |
| ‡ | Non income producing security. Security is currently in default. |
| w | Pass Through Agreement. Security represents the contractual right to receive a proportionate amount of underlying payments due to the counterparty pursuant to various agreements related to the rescheduling of obligations and the exchange of certain notes. |
| Δ | Securities have been classified by country of origin. |
| « | Senior Secured Loans generally pay interest at rates that are periodically redetermined by reference to a base lending rate plus a premium. These base lending rates are generally: (i) the prime rate offered by one or more United States banks, (ii) the lending rate offered by one or more European banks such as the London Inter-Bank Offered Rate (LIBOR), and (iii) the certificate of deposit rate. Senior Secured Loans may be subject to restrictions on resale. Stated rate in effect at July 31, 2011. |
| † | Non income producing security. |
| ∏ | Restricted security. This investment is in a security not registered under the Securities Act of 1933, as amended, and has certain restrictions on resale which may limit its liquidity. At July 31, 2011, the aggregate amount of the restricted security was $2,462,000, which represented 0.24% of the Fund’s net assets. See Note 10 in “Notes to financial statements.” |
| ≠ | The rate shown is the effective yield at the time of purchase. |
| ** | See Note 9 in “Notes to financial statements.” |
| © | Includes $48,364,704 of securities loaned. |
| *** | Includes $580,000 cash collateral for futures contracts. |
33
Statements of net assets
Delaware Corporate Bond Fund
Summary of abbreviations:
BAML — Bank of America Merrill Lynch
BCLY — Barclays Bank
CDS — Credit Default Swap
CITI — Citigroup Global Markets
CPI-U — Consumer Price Index-Urban
GSC — Goldman Sachs Capital
HSBC — Hong Kong Shanghai Bank
HY — High Yield
IRS — Interest Rate Swap
JPMC — JPMorgan Chase Bank
MSC — Morgan Stanley Capital
PIK — Pay-in-kind
REIT — Real Estate Investment Trust
SPX — S&P 500 Index
yr — Year
| Net Asset Value and Offering Price Per Share – | | | |
| Delaware Corporate Bond Fund | | | |
| Net asset value Class A (A) | | $ | 6.05 |
| Sales charge (4.50% of offering price) (B) | | | 0.29 |
| Offering price | | $ | 6.34 |
| (A) | | Net asset value per share, as illustrated, is the amount which would be paid upon redemption or repurchase of shares. |
| (B) | | See the current prospectus for purchases of $100,000 or more. |
34
The following foreign currency exchange contracts, futures contracts and swap contracts were outstanding at July 31, 20111:
Foreign Currency Exchange Contracts
| | | | | | | | | | | | | | Unrealized |
| | | | Contracts to | | | | | | | | Appreciation |
| Counterparty | | | Receive (Deliver) | | In Exchange For | | Settlement Date | | (Depreciation) |
| BAML | | | BRL | (3,258,373 | ) | | USD | 2,097,440 | | | 9/2/11 | | | $ | 15,778 | |
| BAML | | | CHF | 4,097,914 | | | USD | (5,087,385 | ) | | 9/2/11 | | | | 117,776 | |
| BAML | | | EUR | (1,550,563 | ) | | USD | 2,225,135 | | | 9/2/11 | | | | (1,137 | ) |
| BAML | | | NOK | (12,088,142 | ) | | USD | 2,229,069 | | | 9/2/11 | | | | (11,149 | ) |
| GSC | | | GBP | 1,531,701 | | | USD | (2,508,000 | ) | | 9/2/11 | | | | 5,727 | |
| HSBC | | | AUD | 1,331,430 | | | USD | (1,438,277 | ) | | 9/2/11 | | | | 17,261 | |
| HSBC | | | EUR | (6,605,931 | ) | | USD | 9,489,089 | | | 9/2/11 | | | | 4,405 | |
| HSBC | | | NOK | 19,662,240 | | | USD | (3,625,846 | ) | | 9/2/11 | | | | 18,031 | |
| JPMC | | | EUR | (1,180,000 | ) | | USD | 1,693,300 | | | 9/2/11 | | | | (924 | ) |
| MSC | | | EUR | (267,298 | ) | | USD | 384,082 | | | 9/2/11 | | | | 300 | |
| | | | | | | | | | | | | | | $ | 166,068 | |
| | | | | | | | | | | | | Unrealized |
| | | Notional Cost | | | | | | | | Appreciation |
| Contracts to Buy (Sell) | | | (Proceeds) | | Notional Value | | Expiration Date | | (Depreciation) |
| (882) U.S. Treasury 10 yr Note | | $ | (107,408,567 | ) | | $ | (110,856,375 | ) | | 9/21/11 | | | $ | (3,447,808 | ) | |
| 628 U.S. Treasury Long Bond | | | 77,726,279 | | | | 80,462,500 | | | 9/21/11 | | | | 2,736,221 | | |
| | | $ | (29,682,288 | ) | | | | | | | | | $ | (711,587 | ) | |
35
Statements of net assets
Delaware Corporate Bond Fund
Swap Contracts
CDS Contracts
| | | | | | | Annual | | | | Unrealized |
| | | Swap | | | | Protection | | Termination | | Appreciation |
| Counterparty | | Referenced Obligation | | Notional Value | | Payments | | Date | | (Depreciation) |
| | | Protection Purchased: | | | | | | | | | | | |
| BAML | | Kingdom of Spain 5 yr CDS | | $ | 3,800,000 | | 1.00% | | 6/20/16 | | $ | 201,556 | |
| BCLY | | ITRAXX Europe Subordinate | | | | | | | | | | | |
| | | Financials 15.1 5 yr CDS | | | 13,080,000 | | 1.00% | | 6/20/16 | | | 449,883 | |
| BCLY | | Kingdom of Spain 5 yr CDS | | | 2,486,000 | | 1.00% | | 3/20/16 | | | 7,173 | |
| BLCY | | United States of America | | | | | | | | | | | |
| | | 5 yr CDS | | | 2,911,000 | | 0.25% | | 3/20/16 | | | 21,878 | |
| CITI | | CDX.NA.HY.16 | | | 6,920,000 | | 5.00% | | 6/20/16 | | | 111,917 | |
| CITI | | Sara Lee 5 yr CDS | | | 2,100,000 | | 1.00% | | 3/20/16 | | | (91,437 | ) |
| GSC | | CDX.NA.HY.16 | | | 8,910,000 | | 5.00% | | 6/20/16 | | | 227,713 | |
| JPMC | | ITRAXX Europe Subordinate | | | | | | | | | | | |
| | | Financials 15.1 5 yr CDS | | | 2,400,000 | | 1.00% | | 6/20/16 | | | 155,831 | |
| JPMC | | Portuguese Republic 5 yr CDS | | | 2,042,000 | | 1.00% | | 6/22/15 | | | 493,523 | |
| MSC | | Kingdom of Spain 5 yr CDS | | | 3,910,000 | | 1.00% | | 6/20/16 | | | 104,294 | |
| | | | | $ | 48,559,000 | | | | | | $ | 1,682,331 | |
| | | Protection Sold / Moody’s Rating: | | | | | | | | | | | |
| CITI | | MetLife 5 yr CDS / A | | $ | 2,335,000 | | 5.00% | | 9/20/14 | | $ | 157,439 | |
| JPMC | | MetLife 5 yr CDS / A | | | 1,765,000 | | 1.00% | | 9/20/16 | | | (3,525 | ) |
| JPMC | | Tyson Foods 5 yrs CDS / Ba | | | 2,500,000 | | 1.00% | | 3/20/16 | | | 17,656 | |
| | | | | $ | 6,600,000 | | | | | | $ | 171,570 | |
| Total | | | | | | | | | | | $ | 1,853,901 | |
Inflation Swap Contract
| | | | | | | Unrealized |
| | | Expiration | | | | Appreciation |
| Notional Value | | Date | | Description | | (Depreciation) |
| $28,000,000 | | 2/29/16 | | Agreement with Barclays to receive the notional amount multiplied by the non-revised 5 yr zero coupon CPI-U and to pay the notional amount multiplied by the fixed rate of 2.555%. | | | $ | 169,242 | |
The use of foreign currency exchange contracts, futures contracts, options contracts and swap contracts involves elements of market risk and risks in excess of the amounts recognized in the financial statements. The notional values presented above represent the Fund’s total exposure in such contracts, whereas only the net unrealized appreciation (depreciation) is reflected in the Fund’s net assets.
1See Note 8 in “Notes to financial statements.”
See accompanying notes, which are an integral part of the financial statements.
36
Statements of net assets
| Delaware Extended Duration Bond Fund | July 31, 2011 |
| | | | Principal amount° | | Value (U.S. $) |
| Commercial Mortgage-Backed Securities – 0.02% | | | | | | | |
| | Merrill Lynch Mortgage Trust | | | | | | | |
| | #Series 2002-MW1 J 144A 5.695% 7/12/34 | | USD | | 110,000 | | $ | 74,724 |
| | Series 2005-CIP1 A2 4.96% 7/12/38 | | | | 35,402 | | | 36,086 |
| Total Commercial Mortgage-Backed Securities | | | | | | | |
| | (cost $121,337) | | | | | | | 110,810 |
| | | | | | | | | |
| Convertible Bonds – 1.26% | | | | | | | |
| | ArvinMeritor 4.00% exercise price $26.73, | | | | | | | |
| | expiration date 2/15/27 | | | | 1,115,000 | | | 996,531 |
| # | Clearwire Communications 144A 8.25% | | | | | | | |
| | exercise price $7.08, expiration date 11/30/40 | | | | 465,000 | | | 314,456 |
| # | Gaylord Entertainment 144A 3.75% | | | | | | | |
| | exercise price $27.25, expiration date 9/29/14 | | | | 320,000 | | | 403,200 |
| * | Health Care REIT 3.00% exercise price $51.08, | | | | | | | |
| | expiration date 11/30/29 | | | | 885,000 | | | 997,838 |
| | Level 3 Communications 3.50% | | | | | | | |
| | exercise price $5.46, expiration date 6/15/12 | | | | 1,003,000 | | | 1,001,746 |
| | Linear Technology 3.00% exercise price $44.11, | | | | | | | |
| | expiration date 5/1/27 | | | | 825,000 | | | 860,063 |
| | Live Nation Entertainment 2.875% | | | | | | | |
| | exercise price $27.14, expiration date 7/14/27 | | | | 1,180,000 | | | 1,122,474 |
| # | Owens-Brockway Glass Container | | | | | | | |
| | 3.00% 144A exercise price $47.47, | | | | | | | |
| | expiration date 5/28/15 | | | | 806,000 | | | 776,783 |
| Total Convertible Bonds (cost $6,394,161) | | | | | | | 6,473,091 |
| | | | | | | | |
| Corporate Bonds – 84.68% | | | | | | | |
| | Banking – 12.80% | | | | | | | |
| | Abbey National Treasury Services 4.00% 4/27/16 | | | | 4,035,000 | | | 3,955,852 |
| | AgriBank FCB 9.125% 7/15/19 | | | | 1,210,000 | | | 1,552,814 |
| | BAC Capital Trust VI 5.625% 3/8/35 | | | | 1,025,000 | | | 901,044 |
| | Bank of America 3.75% 7/12/16 | | | | 1,935,000 | | | 1,945,124 |
| | BB&T Capital Trust II 6.75% 6/7/36 | | | | 2,403,000 | | | 2,499,274 |
| • | BB&T Capital Trust IV 6.82% 6/12/57 | | | | 630,000 | | | 640,238 |
| • | Bear Stearns 5.44% 12/7/12 | | AUD | | 1,410,000 | | | 1,536,106 |
| | Capital One Capital V 10.25% 8/15/39 | | USD | | 2,430,000 | | | 2,586,128 |
| | Capital One Financial 4.75% 7/15/21 | | | | 1,000,000 | | | 1,012,812 |
| | City National 5.25% 9/15/20 | | | | 1,155,000 | | | 1,207,879 |
| @# | CoBank ACB 144A 7.875% 4/16/18 | | | | 935,000 | | | 1,105,198 |
37
Statements of net assets
Delaware Extended Duration Bond Fund
| | | | Principal amount° | | Value (U.S. $) |
| Corporate Bonds (continued) | | | | | | | |
| Banking (continued) | | | | | | | |
| • | Fifth Third Capital Trust IV 6.50% 4/15/37 | | USD | | 1,850,000 | | $ | 1,813,000 |
| | Goldman Sachs Group 5.25% 7/27/21 | | | | 3,080,000 | | | 3,150,119 |
| •# | HBOS Capital Funding 144A 6.071% 6/29/49 | | | | 1,350,000 | | | 1,120,500 |
| | JPMorgan Chase 5.60% 7/15/41 | | | | 500,000 | | | 506,411 |
| | JPMorgan Chase Capital XXV 6.80% 10/1/37 | | | | 4,395,000 | | | 4,469,112 |
| | KeyBank 6.95% 2/1/28 | | | | 2,467,000 | | | 2,767,890 |
| | Morgan Stanley 5.75% 1/25/21 | | | | 1,695,000 | | | 1,787,654 |
| # | Nordea Bank 144A 4.875% 5/13/21 | | | | 1,060,000 | | | 1,043,497 |
| • | PNC Financial Services Group 6.75% 7/29/49 | | | | 1,650,000 | | | 1,652,528 |
| •# | PNC Preferred Funding Trust II 144A 6.113% 3/29/49 | | | | 3,900,000 | | | 3,276,460 |
| | Rabobank | | | | | | | |
| | 5.25% 5/24/41 | | | | 2,465,000 | | | 2,535,728 |
| | •#144A 11.00% 12/29/49 | | | | 2,200,000 | | | 2,818,677 |
| • | Regions Financing Trust II 6.625% 5/15/47 | | | | 2,200,000 | | | 1,951,519 |
| * | Santander Holdings USA 4.625% 4/19/16 | | | | 875,000 | | | 904,947 |
| • | SunTrust Capital VIII 6.10% 12/15/36 | | | | 3,520,000 | | | 3,442,887 |
| | SVB Financial Group 5.375% 9/15/20 | | | | 1,705,000 | | | 1,760,464 |
| • | USB Capital IX 3.50% 10/29/49 | | | | 4,325,000 | | | 3,541,006 |
| | Wachovia Bank 6.60% 1/15/38 | | | | 2,910,000 | | | 3,370,406 |
| • | Wells Fargo Capital XIII 7.70% 12/29/49 | | | | 3,150,000 | | | 3,264,188 |
| | Zions Bancorp | | | | | | | |
| | *5.50% 11/16/15 | | | | 790,000 | | | 822,207 |
| | 7.75% 9/23/14 | | | | 750,000 | | | 826,898 |
| | | | | | | | | 65,768,567 |
| Basic Industry – 7.41% | | | | | | | |
| | Alcoa 6.75% 7/15/18 | | | | 2,193,000 | | | 2,504,570 |
| | ArcelorMittal 7.00% 10/15/39 | | | | 4,880,000 | | | 5,132,872 |
| # | Barrick North America Finance 144A | | | | | | | |
| | 5.70% 5/30/41 | | | | 1,470,000 | | | 1,516,683 |
| * | CF Industries 7.125% 5/1/20 | | | | 350,000 | | | 411,250 |
| | Dow Chemical 8.55% 5/15/19 | | | | 625,000 | | | 826,926 |
| | Georgia-Pacific | | | | | | | |
| | 8.00% 1/15/24 | | | | 2,345,000 | | | 2,897,688 |
| | #144A 5.40% 11/1/20 | | | | 4,500,000 | | | 4,768,970 |
| | #144A 8.25% 5/1/16 | | | | 185,000 | | | 210,659 |
| | Hexion US Finance 8.875% 2/1/18 | | | | 615,000 | | | 654,975 |
| | International Paper | | | | | | | |
| | 7.30% 11/15/39 | | | | 1,000,000 | | | 1,152,847 |
| | *9.375% 5/15/19 | | | | 2,385,000 | | | 3,158,086 |
38
| | | | Principal amount° | | Value (U.S. $) |
| Corporate Bonds (continued) | | | | | | | |
| Basic Industry (continued) | | | | | | | |
| | Lyondell Chemical 11.00% 5/1/18 | | USD | | 1,240,000 | | $ | 1,410,500 |
| * | Momentive Performance Materials | | | | | | | |
| | 11.50% 12/1/16 | | | | 575,000 | | | 615,250 |
| *# | POSCO 144A 5.25% 4/14/21 | | | | 3,015,000 | | | 3,152,786 |
| | Southern Copper 7.50% 7/27/35 | | | | 3,021,000 | | | 3,430,297 |
| | Steel Dynamics 7.75% 4/15/16 | | | | 420,000 | | | 446,250 |
| | Teck Resources 6.25% 7/15/41 | | | | 5,345,000 | | | 5,754,796 |
| | | | | | | | | 38,045,405 |
| Brokerage – 2.05% | | | | | | | |
| | E Trade Financial PIK 12.50% 11/30/17 | | | | 765,000 | | | 918,000 |
| | Jefferies Group | | | | | | | |
| | 6.25% 1/15/36 | | | | 1,930,000 | | | 1,861,620 |
| | 6.45% 6/8/27 | | | | 2,640,000 | | | 2,681,176 |
| | Lazard Group 6.85% 6/15/17 | | | | 3,271,000 | | | 3,675,260 |
| | Nuveen Investments | | | | | | | |
| | 10.50% 11/15/15 | | | | 810,000 | | | 848,475 |
| | #144A 10.50% 11/15/15 | | | | 550,000 | | | 570,625 |
| | | | | | | | | 10,555,156 |
| Capital Goods – 2.42% | | | | | | | |
| | Ball | | | | | | | |
| | 7.125% 9/1/16 | | | | 188,000 | | | 207,035 |
| | *7.375% 9/1/19 | | | | 282,000 | | | 311,610 |
| | Clean Harbors 7.625% 8/15/16 | | | | 468,000 | | | 499,590 |
| # | Meccanica Holdings USA 144A | | | | | | | |
| | 6.25% 7/15/19 | | | | 1,365,000 | | | 1,432,133 |
| | 6.25% 1/15/40 | | | | 2,585,000 | | | 2,188,022 |
| # | Odebrecht Finance 144A 6.00% 4/5/23 | | | | 1,561,000 | | | 1,592,220 |
| | RSC Equipment Rental 10.25% 11/15/19 | | | | 750,000 | | | 841,875 |
| # | Votorantim Cimentos 144A 7.25% 4/5/41 | | | | 2,900,000 | | | 2,940,020 |
| | Waste Management 7.75% 5/15/32 | | | | 900,000 | | | 1,163,214 |
| | WMX Technologies 7.10% 8/1/26 | | | | 1,025,000 | | | 1,259,044 |
| | | | | | | | | 12,434,763 |
| Communications – 9.90% | | | | | | | |
| | AT&T 5.35% 9/1/40 | | | | 2,750,000 | | | 2,749,065 |
| | Cablevision Systems 8.625% 9/15/17 | | | | 250,000 | | | 277,500 |
| # | CC Holdings GS V 144A 7.75% 5/1/17 | | | | 235,000 | | | 258,206 |
| | CenturyLink 6.45% 6/15/21 | | | | 2,240,000 | | | 2,314,384 |
39
Statements of net assets
Delaware Extended Duration Bond Fund
| | | Principal amount° | | Value (U.S. $) |
| Corporate Bonds (continued) | | | | | | |
| Communications (continued) | | | | | | |
| # | Charter Communications Operating 144A | | | | | | |
| | 10.875% 9/15/14 | USD | | 675,000 | | $ | 747,563 |
| # | Clearwire Communications 144A | | | | | | |
| | 12.00% 12/1/15 | | | 1,750,000 | | | 1,790,313 |
| | Comcast 6.95% 8/15/37 | | | 5,072,000 | | | 5,971,457 |
| | Cricket Communications 7.75% 10/15/20 | | | 425,000 | | | 422,875 |
| | Crown Castle International 9.00% 1/15/15 | | | 660,000 | | | 726,000 |
| # | Crown Castle Towers 144A 4.883% 8/15/20 | | | 2,000,000 | | | 2,067,654 |
| * | CSC Holdings 8.50% 4/15/14 | | | 329,000 | | | 368,480 |
| | Deutsche Telekom International Finance | | | | | | |
| | 8.75% 6/15/30 | | | 1,335,000 | | | 1,845,770 |
| # | Digicel Group 144A 10.50% 4/15/18 | | | 300,000 | | | 336,750 |
| | DIRECTV Holdings 6.375% 3/1/41 | | | 1,000,000 | | | 1,103,265 |
| | Discovery Communications 6.35% 6/1/40 | | | 1,955,000 | | | 2,205,424 |
| | DISH DBS 7.875% 9/1/19 | | | 380,000 | | | 419,425 |
| * | Entravision Communications 8.75% 8/1/17 | | | 200,000 | | | 210,000 |
| | Intelsat Bermuda 11.25% 2/4/17 | | | 740,000 | | | 793,650 |
| | Intelsat Jackson Holdings 11.25% 6/15/16 | | | 195,000 | | | 208,163 |
| # | News America 144A 6.15% 2/15/41 | | | 2,500,000 | | | 2,502,640 |
| * | PAETEC Holding 9.50% 7/15/15 | | | 350,000 | | | 366,625 |
| | Qwest Communications International 7.125% 4/1/18 | | | 700,000 | | | 752,500 |
| | Sprint Capital 6.875% 11/15/28 | | | 1,400,000 | | | 1,337,000 |
| | Telecom Italia Capital 7.721% 6/4/38 | | | 4,790,000 | | | 4,804,910 |
| | Telefonica Emisiones | | | | | | |
| | 5.134% 4/27/20 | | | 1,000,000 | | | 989,944 |
| | 5.462% 2/16/21 | | | 1,255,000 | | | 1,260,895 |
| | Telesat Canada 11.00% 11/1/15 | | | 230,000 | | | 253,000 |
| * | Time Warner Cable 5.875% 11/15/40 | | | 2,700,000 | | | 2,789,370 |
| | US West Communications 6.875% 9/15/33 | | | 3,510,000 | | | 3,492,449 |
| # | VimpelCom Holdings 144A 7.504% 3/1/22 | | | 1,520,000 | | | 1,523,800 |
| | Virgin Media Secured Finance | | | | | | |
| | 6.50% 1/15/18 | | | 2,445,000 | | | 2,701,725 |
| | #144A 5.25% 1/15/21 | | | 1,555,000 | | | 1,680,232 |
| # | Wind Acquisition Finance 144A 11.75% 7/15/17 | | | 860,000 | | | 957,825 |
| # | XM Satellite Radio 144A 13.00% 8/1/13 | | | 510,000 | | | 600,525 |
| | | | | | | | 50,829,384 |
| Consumer Cyclical – 7.12% | | | | | | |
| | CVS Caremark 5.75% 5/15/41 | | | 6,050,000 | | | 6,322,600 |
| # | Delphi 144A 6.125% 5/15/21 | | | 1,565,000 | | | 1,588,475 |
40
| | | | Principal amount° | | Value (U.S. $) |
| Corporate Bonds (continued) | | | | | | | |
| Consumer Cyclical (continued) | | | | | | | |
| * | Ford Motor 7.45% 7/16/31 | | USD | | 825,000 | | $ | 944,476 |
| | Ford Motor Credit | | | | | | | |
| | 5.00% 5/15/18 | | | | 2,010,000 | | | 2,025,969 |
| | *9.875% 8/10/11 | | | | 650,000 | | | 651,720 |
| * | Goodyear Tire & Rubber 10.50% 5/15/16 | | | | 10,000 | | | 11,313 |
| | Harrah’s Operating | | | | | | | |
| | *10.00% 12/15/18 | | | | 475,000 | | | 427,500 |
| | 11.25% 6/1/17 | | | | 335,000 | | | 370,594 |
| * | Home Depot 5.95% 4/1/41 | | | | 4,500,000 | | | 4,904,554 |
| | Host Hotels & Resorts | | | | | | | |
| | *6.00% 11/1/20 | | | | 1,295,000 | | | 1,332,231 |
| | #144A 5.875% 6/15/19 | | | | 1,010,000 | | | 1,026,413 |
| * | Macy’s Retail Holdings 8.375% 7/15/15 | | | | 150,000 | | | 179,588 |
| | MGM Resorts International | | | | | | | |
| | 10.375% 5/15/14 | | | | 90,000 | | | 103,275 |
| | 11.125% 11/15/17 | | | | 110,000 | | | 127,325 |
| | *11.375% 3/1/18 | | | | 900,000 | | | 1,048,500 |
| | 13.00% 11/15/13 | | | | 175,000 | | | 209,563 |
| * | OSI Restaurant Partners 10.00% 6/15/15 | | | | 1,425,000 | | | 1,499,813 |
| | Quiksilver 6.875% 4/15/15 | | | | 700,000 | | | 685,125 |
| | Ryland Group 8.40% 5/15/17 | | | | 475,000 | | | 520,125 |
| * | Sally Holdings 10.50% 11/15/16 | | | | 260,000 | | | 279,500 |
| * | Time Warner 6.25% 3/29/41 | | | | 3,200,000 | | | 3,478,326 |
| | Wal-Mart Stores | | | | | | | |
| | *4.875% 7/8/40 | | | | 3,650,000 | | | 3,640,320 |
| | 5.625% 4/15/41 | | | | 2,000,000 | | | 2,221,458 |
| | Wyndham Worldwide 5.625% 3/1/21 | | | | 2,880,000 | | | 2,954,244 |
| | | | | | | | | 36,553,007 |
| Consumer Non-Cyclical – 6.21% | | | | | | | |
| | Amgen | | | | | | | |
| | 4.95% 10/1/41 | | | | 2,972,000 | | | 2,854,044 |
| | 5.65% 6/15/42 | | | | 2,300,000 | | | 2,457,426 |
| * | Celgene 5.70% 10/15/40 | | | | 4,895,000 | | | 5,005,813 |
| | Corn Products International 6.625% 4/15/37 | | | | 2,950,000 | | | 3,318,927 |
| | Delhaize Group 5.70% 10/1/40 | | | | 1,895,000 | | | 1,873,056 |
| | HCA | | | | | | | |
| | 9.25% 11/15/16 | | | | 530,000 | | | 568,094 |
| | PIK 9.625% 11/15/16 | | | | 125,000 | | | 134,063 |
41
Statements of net assets
Delaware Extended Duration Bond Fund
| | | | Principal amount° | | Value (U.S. $) |
| Corporate Bonds (continued) | | | | | | | |
| Consumer Non-Cyclical (continued) | | | | | | | |
| *# | HCA Holdings 144A 7.75% 5/15/21 | | USD | | 500,000 | | $ | 511,250 |
| # | inVentiv Health 144A 10.00% 8/15/18 | | | | 785,000 | | | 769,300 |
| | Kraft Foods 6.50% 2/9/40 | | | | 1,560,000 | | | 1,830,630 |
| | McKesson 6.00% 3/1/41 | | | | 1,450,000 | | | 1,626,031 |
| # | Mylan 144A 7.625% 7/15/17 | | | | 1,480,000 | | | 1,631,700 |
| # | Pernod-Ricard 144A 5.75% 4/7/21 | | | | 2,415,000 | | | 2,621,673 |
| * | Quest Diagnostics 5.75% 1/30/40 | | | | 4,875,000 | | | 5,055,069 |
| | Sara Lee 4.10% 9/15/20 | | | | 1,178,000 | | | 1,157,897 |
| * | Supervalu 7.50% 11/15/14 | | | | 460,000 | | | 470,925 |
| | | | | | | | | 31,885,898 |
| Electric – 8.84% | | | | | | | |
| | AES 8.00% 6/1/20 | | | | 325,000 | | | 352,625 |
| | Ameren Illinois 9.75% 11/15/18 | | | | 2,180,000 | | | 2,919,502 |
| # | American Transmission Systems 144A | | | | | | | |
| | 5.25% 1/15/22 | | | | 1,140,000 | | | 1,242,599 |
| | CMS Energy 6.25% 2/1/20 | | | | 440,000 | | | 482,335 |
| * | Duke Energy Carolinas 5.30% 2/15/40 | | | | 1,500,000 | | | 1,615,364 |
| # | Enel Finance International 144A 6.00% 10/7/39 | | | | 5,300,000 | | | 4,673,503 |
| | Great Plains Energy 4.85% 6/1/21 | | | | 2,500,000 | | | 2,593,223 |
| *# | Ipalco Enterprises 144A 5.00% 5/1/18 | | | | 1,390,000 | | | 1,383,015 |
| * | NRG Energy 7.375% 1/15/17 | | | | 180,000 | | | 189,225 |
| | Pacific Gas & Electric 5.40% 1/15/40 | | | | 4,850,000 | | | 5,035,798 |
| | PPL Electric Utilities 5.20% 7/15/41 | | | | 2,800,000 | | | 2,921,204 |
| | Puget Sound Energy | | | | | | | |
| | *5.638% 4/15/41 | | | | 3,085,000 | | | 3,316,338 |
| | •6.974% 6/1/67 | | | | 2,495,000 | | | 2,579,072 |
| | South Carolina Electric & Gas 5.45% 2/1/41 | | | | 8,335,000 | | | 8,907,622 |
| * | Southern California Edison 6.65% 4/1/29 | | | | 2,310,000 | | | 2,746,777 |
| • | Wisconsin Energy 6.25% 5/15/67 | | | | 4,405,000 | | | 4,445,574 |
| | | | | | | | | 45,403,776 |
| Energy – 7.08% | | | | | | | |
| | Canadian Natural Resources 6.25% 3/15/38 | | | | 1,560,000 | | | 1,796,538 |
| * | Chesapeake Energy 7.25% 12/15/18 | | | | 610,000 | | | 680,150 |
| # | CNOOC Finance 2011 144A 4.25% 1/26/21 | | | | 1,800,000 | | | 1,831,217 |
| * | Encana 6.50% 2/1/38 | | | | 1,500,000 | | | 1,709,777 |
| # | ENI 144A 5.70% 10/1/40 | | | | 3,450,000 | | | 3,288,816 |
| # | Hercules Offshore 144A 10.50% 10/15/17 | | | | 315,000 | | | 330,750 |
42
| | | | Principal amount° | | Value (U.S. $) |
| Corporate Bonds (continued) | | | | | | | |
| Energy (continued) | | | | | | | |
| | Noble Energy | | | | | | | |
| | 6.00% 3/1/41 | | USD | | 3,500,000 | | $ | 3,790,772 |
| | 8.25% 3/1/19 | | | | 1,325,000 | | | 1,737,798 |
| * | Noble Holding International 6.20% 8/1/40 | | | | 4,120,000 | | | 4,598,838 |
| * | Petrobras International Finance 6.75% 1/27/41 | | | | 885,000 | | | 997,044 |
| | Petrohawk Energy 7.25% 8/15/18 | | | | 2,195,000 | | | 2,562,663 |
| | Suncor Energy 6.85% 6/1/39 | | | | 2,500,000 | | | 3,017,825 |
| | Sunoco Logistics Partners Operations | | | | | | | |
| | 4.65% 2/15/22 | | | | 2,220,000 | | | 2,261,086 |
| | Transocean 6.50% 11/15/20 | | | | 1,745,000 | | | 2,051,070 |
| | Weatherford Bermuda 6.75% 9/15/40 | | | | 2,300,000 | | | 2,625,892 |
| | Williams | | | | | | | |
| | 7.75% 6/15/31 | | | | 1,485,000 | | | 1,795,500 |
| | 8.75% 3/15/32 | | | | 1,000,000 | | | 1,316,709 |
| | | | | | | | | 36,392,445 |
| Finance Companies – 2.55% | | | | | | | |
| | FTI Consulting | | | | | | | �� |
| | 6.75% 10/1/20 | | | | 805,000 | | | 825,125 |
| | 7.75% 10/1/16 | | | | 375,000 | | | 391,875 |
| | General Electric Capital | | | | | | | |
| | 5.30% 2/11/21 | | | | 1,430,000 | | | 1,527,158 |
| | 5.875% 1/14/38 | | | | 5,845,000 | | | 6,038,920 |
| *•# | ILFC E-Capital Trust I 144A 5.74% 12/21/65 | | | | 1,000,000 | | | 840,990 |
| •# | ILFC E-Capital Trust II 144A 6.25% 12/21/65 | | | | 1,250,000 | | | 1,075,000 |
| | International Lease Finance | | | | | | | |
| | 6.25% 5/15/19 | | | | 1,292,000 | | | 1,291,253 |
| | *8.75% 3/15/17 | | | | 975,000 | | | 1,092,000 |
| | | | | | | | | 13,082,321 |
| Insurance – 4.80% | | | | | | | |
| | American International Group 8.25% 8/15/18 | | | | 2,470,000 | | | 2,935,716 |
| • | Chubb 6.375% 3/29/67 | | | | 2,555,000 | | | 2,650,813 |
| | Coventry Health Care 5.45% 6/15/21 | | | | 1,690,000 | | | 1,792,034 |
| • | Genworth Financial 6.15% 11/15/66 | | | | 525,000 | | | 346,500 |
| # | Highmark 144A 6.125% 5/15/41 | | | | 4,510,000 | | | 4,721,356 |
| • | ING Groep 5.775% 12/29/49 | | | | 990,000 | | | 900,900 |
| •# | Liberty Mutual Group 144A 7.00% 3/15/37 | | | | 1,050,000 | | | 1,022,997 |
| # | MetLife Capital Trust IV 144A 7.875% 12/15/37 | | | | 900,000 | | | 991,515 |
| # | MetLife Capital Trust X 144A 9.25% 4/8/38 | | | | 3,530,000 | | | 4,394,849 |
43
Statements of net assets
Delaware Extended Duration Bond Fund
| | | | Principal amount° | | Value (U.S. $) |
| Corporate Bonds (continued) | | | | | | | |
| Insurance (continued) | | | | | | | |
| | Prudential Financial 5.625% 5/12/41 | | USD | | 3,210,000 | | $ | 3,201,863 |
| | Transatlantic Holdings 8.00% 11/30/39 | | | | 704,000 | | | 776,875 |
| •# | ZFS Finance USA Trust II 144A 6.45% 12/15/65 | | | | 895,000 | | | 917,375 |
| | | | | | | | | 24,652,793 |
| Natural Gas – 8.97% | | | | | | | |
| * | AGL Capital 5.875% 3/15/41 | | | | 5,605,000 | | | 6,135,295 |
| @ | Boston Gas 6.95% 12/1/23 | | | | 200,000 | | | 230,762 |
| | El Paso Pipeline Partners Operating | | | | | | | |
| | 7.50% 11/15/40 | | | | 3,065,000 | | | 3,751,235 |
| • | Enbridge Energy Partners 8.05% 10/1/37 | | | | 2,875,000 | | | 3,167,546 |
| | Energy Transfer Partners | | | | | | | |
| | *6.05% 6/1/41 | | | | 3,250,000 | | | 3,262,009 |
| | 9.70% 3/15/19 | | | | 1,535,000 | | | 1,993,081 |
| • | Enterprise Products Operating 7.034% 1/15/68 | | | | 3,020,000 | | | 3,186,444 |
| # | KeySpan Gas East 144A 5.819% 4/1/41 | | | | 3,195,000 | | | 3,445,325 |
| | Kinder Morgan Energy Partners 6.95% 1/15/38 | | | | 4,500,000 | | | 5,194,035 |
| | NiSource Finance | | | | | | | |
| | *5.95% 6/15/41 | | | | 4,000,000 | | | 4,129,432 |
| | 6.25% 12/15/40 | | | | 1,710,000 | | | 1,819,785 |
| | Plains All American Pipeline 6.65% 1/15/37 | | | | 1,415,000 | | | 1,600,151 |
| * | Sempra Energy 6.00% 10/15/39 | | | | 4,660,000 | | | 5,140,083 |
| • | TransCanada Pipelines 6.35% 5/15/67 | | | | 2,940,000 | | | 3,015,070 |
| | | | | | | | | 46,070,253 |
| Real Estate – 2.24% | | | | | | | |
| * | Developers Diversified Realty 7.875% 9/1/20 | | | | 2,010,000 | | | 2,382,535 |
| | Digital Realty Trust 5.25% 3/15/21 | | | | 2,270,000 | | | 2,323,561 |
| | Health Care REIT 6.50% 3/15/41 | | | | 3,615,000 | | | 3,710,165 |
| | Regency Centers 5.875% 6/15/17 | | | | 1,140,000 | | | 1,288,028 |
| # | WEA Finance 144A 4.625% 5/10/21 | | | | 1,805,000 | | | 1,825,696 |
| | | | | | | | | 11,529,985 |
| Technology – 1.50% | | | | | | | |
| | Applied Materials 5.85% 6/15/41 | | | | 2,970,000 | | | 3,202,988 |
| | Cisco Systems 5.50% 1/15/40 | | | | 2,560,000 | | | 2,708,006 |
| * | First Data 11.25% 3/31/16 | | | | 800,000 | | | 792,000 |
| * | GXS Worldwide 9.75% 6/15/15 | | | | 1,000,000 | | | 1,015,000 |
| | | | | | | | | 7,717,994 |
44
| | | | Principal amount° | | Value (U.S. $) |
| Corporate Bonds (continued) | | | | | | | |
| Transportation – 0.79% | | | | | | | |
| | CSX 5.50% 4/15/41 | | USD | | 3,910,000 | | $ | 4,060,719 |
| | | | | | | | | 4,060,719 |
| Total Corporate Bonds (cost $410,868,224) | | | | | | | 434,982,466 |
| | |
| Municipal Bonds – 5.33% | | | | | | | |
| | Chicago, Illinois O’Hare International Airport | | | | | | | |
| | Taxable Build America Bond Series B | | | | | | | |
| | 6.395% 1/1/40 | | | | 3,800,000 | | | 4,203,787 |
| | Long Island Power Authority, New York Electric | | | | | | | |
| | System Revenue Taxable Build America Bond | | | | | | | |
| | 5.85% 5/1/41 | | | | 3,600,000 | | | 3,670,344 |
| | Los Angeles, California Department of Water & | | | | | | | |
| | Power Revenue Taxable Build America Bond | | | | | | | |
| | 6.574% 7/1/45 | | | | 2,225,000 | | | 2,647,016 |
| | Massachusetts Development Finance Agency | | | | | | | |
| | Revenue (Harvard University) Series B-1 | | | | | | | |
| | 5.00% 10/15/40 | | | | 3,975,000 | | | 4,183,012 |
| | Metropolitan Transportation Authority, | | | | | | | |
| | New York Taxable Build America Bond | | | | | | | |
| | Dedicated Tax Fund | | | | | | | |
| | Series A2 6.089% 11/15/40 | | | | 3,205,000 | | | 3,502,680 |
| | Series C-1 6.687% 11/15/40 | | | | 3,000,000 | | | 3,381,720 |
| | Oregon Department of Transportation Highway | | | | | | | |
| | User Revenue Taxable Build America Bond | | | | | | | |
| | (Subordinate Lien Direct Payment) Series A | | | | | | | |
| | 5.834% 11/15/34 | | | | 1,605,000 | | | 1,757,427 |
| | San Francisco Bay Area Toll Authority, California | | | | | | | |
| | Toll Bridge Revenue Taxable Build America | | | | | | | |
| | Bond Series S3 6.907% 10/1/50 | | | | 1,485,000 | | | 1,714,848 |
| | Triborough Bridge & Tunnel Authority, New York | | | | | | | |
| | Revenue Taxable Build America Bond Series A-2 | | | | | | | |
| | 5.45% 11/15/32 | | | | 2,310,000 | | | 2,312,102 |
| Total Municipal Bonds (cost $25,325,715) | | | | | | | 27,372,936 |
| | |
| Regional Bonds – 0.22%Δ | | | | | | | |
| Australia – 0.09% | | | | | | | |
| | New South Wales Treasury 6.00% 6/1/20 | | AUD | | 419,000 | | | 486,672 |
| | | | | | | | | 486,672 |
45
Statements of net assets
Delaware Extended Duration Bond Fund
| | | | Principal amount° | | Value (U.S. $) |
| Regional Bonds (continued) | | | | | | | |
| Canada – 0.13% | | | | | | | |
| | Quebec Province 4.50% 12/1/19 | | CAD | | 570,000 | | $ | 647,383 |
| | | | | | | | | 647,383 |
| Total Regional Bonds (cost $953,373) | | | | | | | 1,134,055 |
| | |
| «Senior Secure Loans – 1.59% | | | | | | | |
| | Alliance HealthCare Services 5.50% 6/1/16 | | USD | | 433,772 | | | 432,779 |
| | Burlington Coat Factory Warehouse Tranche B | | | | | | | |
| | 6.25% 2/10/17 | | | | 795,000 | | | 796,240 |
| | Cengage Learning Acquisitions 7.50% 7/7/14 | | | | 233,437 | | | 233,388 |
| | Chester Downs & Marina 12.375% 12/31/16 | | | | 339,828 | | | 346,624 |
| | Chrysler Group 6.00% 4/28/17 | | | | 1,400,000 | | | 1,365,007 |
| | Delta Air Lines Tranche B 5.50% 3/29/17 | | | | 900,000 | | | 891,005 |
| | Goodman Global Tranche B 5.75% 10/28/16 | | | | 397,000 | | | 399,553 |
| | Graham Packaging Tranche C 6.75% 4/5/14 | | | | 811,262 | | | 813,432 |
| | MGM MIRAGE Tranche E 7.00% 2/21/14 | | | | 505,000 | | | 496,243 |
| | Nuveen Investments 2nd Lien 12.50% 7/9/15 | | | | 620,000 | | | 660,043 |
| | Reynolds Group Holdings 6.50% 7/7/18 | | | | 1,255,000 | | | 1,248,882 |
| | Univision Communications 4.436% 3/29/17 | | | | 495,381 | | | 470,218 |
| Total Senior Secure Loans (cost $8,109,015) | | | | | | | 8,153,414 |
| | |
| Sovereign Bonds – 2.75%Δ | | | | | | | |
| Australia – 0.48% | | | | | | | |
| | Australian Government Bond 4.50% 4/15/20 | | AUD | | 1,041,000 | | | 1,122,270 |
| | Australian Government Inflation-Linked Bond | | | | | | | |
| | 4.00% 8/20/15 | | AUD | | 697,000 | | | 1,339,090 |
| | | | | | | | | 2,461,360 |
| Brazil – 0.29% | | | | | | | |
| | Brazil Notas do Tesouro Nacional Series F | | | | | | | |
| | 10.00% 1/1/21 | | BRL | 2,712,000 | | | 1,496,277 |
| | | | | | | | | 1,496,277 |
| Canada – 0.16% | | | | | | | |
| | Canadian Government Bond | | | | | | | |
| | 3.75% 6/1/19 | | CAD | | 418,000 | | | 474,940 |
| | 4.00% 6/1/41 | | CAD | | 303,000 | | | 360,155 |
| | | | | | | | | 835,095 |
46
| | | | Principal amount° | | Value (U.S. $) |
| Sovereign Bonds (continued) | | | | | | | |
| Chile – 0.10% | | | | | | | |
| | Chile Government International Bond | | | | | | | |
| | 5.50% 8/5/20 | | CLP | | 215,000,000 | | $ | 486,937 |
| | | | | | | | | 486,937 |
| Germany – 0.04% | | | | | | | |
| | Deutschland Republic 2.25% 9/4/20 | | EUR | | 132,000 | | | 186,656 |
| | | | | | | | | 186,656 |
| Indonesia – 0.37% | | | | | | | |
| | Indonesia Treasury Bond 11.00% 11/15/20 | | IDR | | 12,641,000,000 | | | 1,883,732 |
| | | | | | | | | 1,883,732 |
| Lithuania – 0.13% | | | | | | | |
| # | Lithuania Government International Bond | | | | | | | |
| | 144A 6.125% 3/9/21 | | USD | | 644,000 | | | 688,275 |
| | | | | | | | | 688,275 |
| Poland – 0.46% | | | | | | | |
| | Poland Government International Bond | | | | | | | |
| | 5.125% 4/21/21 | | | | 2,260,000 | | | 2,356,050 |
| | | | | | | | | 2,356,050 |
| Republic of Korea – 0.49% | | | | | | | |
| # | Korea Housing Finance 144A 3.50% 12/15/16 | | | | 1,100,000 | | | 1,119,564 |
| | Korea Treasury Inflation-Linked Bond | | | | | | | |
| | 2.75% 6/10/20 | | KRW | | 1,333,107,049 | | | 1,415,132 |
| | | | | | | | | 2,534,696 |
| Russia – 0.23% | | | | | | | |
| | Russia-Eurobond 7.50% 3/31/30 | | USD | | 1,003,400 | | | 1,201,572 |
| | | | | | | | | 1,201,572 |
| Total Sovereign Bonds (cost $12,794,202) | | | | | | | 14,130,650 |
| | |
| U.S. Treasury Obligations – 0.68% | | | | | | | |
| ∞ | U.S. Treasury Bond 4.75% 2/15/41 | | | | 1,156,000 | | | 1,280,632 |
| *^ | U.S Treasury Strip Principal 4.991% 5/15/41 | | | | 8,505,000 | | | 2,237,589 |
| Total U.S. Treasury Obligations (cost $3,449,839) | | | | | | | 3,518,221 |
47
Statements of net assets
Delaware Extended Duration Bond Fund
| | | | Number of shares | | Value (U.S. $) |
| Convertible Preferred Stock – 0.16% | | | | | | | |
| # | Chesapeake Energy 144A 5.75% exercise price | | | | | | | |
| | $27.94, expiration date 12/31/49 | | | | 610 | | $ | 843,325 |
| Total Convertible Preferred Stock | | | | | | | |
| | (cost $852,475) | | | | | | | 843,325 |
| |
| Preferred Stock – 1.04% | | | | | | | |
| | Alabama Power 5.625% | | | | 16,200 | | | 405,000 |
| | Ally Financial | | | | | | | |
| | ∏•8.50% | | | | 50,000 | | | 1,231,000 |
| | #144A 7.00% | | | | 2,175 | | | 1,976,124 |
| • | PNC Financial Services Group 8.25% | | | | 1,615,000 | | | 1,731,635 |
| Total Preferred Stock (cost $5,215,229) | | | | | | | 5,343,759 |
| |
| | | | Number of contracts | | | |
| Purchased Options – 0.15% | | | | | | | |
| Put Options – 0.01% | | | | | | | |
| | SPX, Strike Price $1,275, Expires 9/17/11 | | | | 17 | | | 54,400 |
| | | | | | | | | 54,400 |
| |
| | | | Notional amount° | | | |
| Put Swaptions – 0.14% | | | | | | | |
| | 10-Yr IRS, Strike Rate 5.23%, Expires 1/13/14 | | USD | | 4,000,000 | | | 111,992 |
| | 30-Yr IRS, Strike Rate 4.813%, Expires 1/13/14 | | | | 8,000,000 | | | 598,859 |
| | | | | | | | | 710,851 |
| Total Purchased Options (cost $1,016,846) | | | | | | | 765,251 |
| |
| | | | Principal amount° | | | |
| ≠Short-Term Investments – 0.93% | | | | | | | |
| Discount Notes – 0.14% | | | | | | | |
| | Federal Home Loan Bank | | | | | | | |
| | 0.010% 8/11/11 | | USD | | 9,313 | | | 9,313 |
| | 0.050% 8/6/11 | | | | 447,778 | | | 447,778 |
| | Freddie Mac 0.001% 8/15/11 | | | | 256,807 | | | 256,804 |
| | | | | | | | | 713,895 |
48
| | | | Principal amount° | | Value (U.S. $) | |
| ≠Short-Term Investments (continued) | | | | | | | |
| Repurchase Agreement – 0.03% | | | | | | | |
| | BNP Paribas 0.14%, dated 7/29/11, to be | | | | | | | |
| | repurchased on 8/1/11, repurchase price | | | | | | | |
| | $153,225 (collateralized by U.S. Government | | | | | | | |
| | obligations 3.875% 4/15/29; market | | | | | | | |
| | value $156,288) | | 153,223 | | | $ | 153,223 | |
| | | | | | | | 153,223 | |
| U.S. Treasury Obligations – 0.76% | | | | | | | |
| | U.S. Treasury Bills | | | | | | | |
| | 0.002% 8/11/11 | | 431,346 | | | | 431,315 | |
| | 0.037% 8/4/11 | | 3,460,150 | | | | 3,460,078 | |
| | | | | | | | 3,891,393 | |
| Total Short-Term Investments (cost $4,758,608) | | | | | | 4,758,511 | |
| | |
| Total Value of Securities Before Securities | | | | | | | |
| | Lending Collateral – 98.81% (cost $479,859,024) | | | | | | 507,586,489 | |
| | | | | | | | | |
| | | | Number of shares | | | | | |
| Securities Lending Collateral** – 9.85% | | | | | | | |
| | Investment Companies | | | | | | | |
| | BNY Mellon SL DBT II Liquidating Fund | | 50,088 | | | | 48,340 | |
| | Delaware Investments Collateral Fund No. 1 | | 50,568,927 | | | | 50,568,927 | |
| | @†Mellon GSL Reinvestment Trust II | | 96,378 | | | | 0 | |
| Total Securities Lending Collateral | | | | | | | |
| | (cost $50,715,393) | | | | | | 50,617,267 | |
| | |
| Total Value of Securities – 108.66% | | | | | | | |
| | (cost $530,574,417) | | | | | | 558,203,756 | © |
| | |
| | | | Number of contracts | | | | | |
| Written Options – 0.00% | | | | | | | |
| Put Options – 0.00% | | | | | | | |
| | SPX, Strike Price $1,275, Expires 9/17/11 (MSC) | | (17 | ) | | | (20,400 | ) |
| Total Written Options (premium received $(11,643)) | | | | | | (20,400 | ) |
49
Statements of net assets
Delaware Extended Duration Bond Fund
| | | | Value (U.S. $) | |
| | | | |
| Obligation to Return Securities | | | |
| | Lending Collateral** – (9.87%) | $ | (50,715,393 | ) |
| Receivables and Other Assets | | | |
| | Net of Other Liabilities – 1.21% | | 6,219,443 | |
| Net Assets Applicable to 80,514,188 | | | |
| | Shares Outstanding – 100.00% | $ | 513,687,406 | |
| | | | | |
| Net Asset Value – Delaware Extended Duration Bond Fund | | | |
| | Class A ($352,059,782 / 55,164,001 Shares) | | | $6.38 | |
| Net Asset Value – Delaware Extended Duration Bond Fund | | | |
| | Class B ($2,219,419 / 348,362 Shares) | | | $6.37 | |
| Net Asset Value – Delaware Extended Duration Bond Fund | | | |
| | Class C ($24,532,530 / 3,845,177 Shares) | | | $6.38 | |
| Net Asset Value – Delaware Extended Duration Bond Fund | | | |
| | Class R ($10,799,645 / 1,690,219 Shares) | | | $6.39 | |
| Net Asset Value – Delaware Extended Duration Bond Fund | | | |
| | Institutional Class ($124,076,030 / 19,466,429 Shares) | | | $6.37 | |
| | | | | |
| Components of Net Assets at July 31, 2011: | | | |
| Shares of beneficial interest (unlimited authorization – no par) | $ | 480,688,129 | |
| Undistributed net investment income | | 936,905 | |
| Accumulated net realized gain on investments | | 2,235,821 | |
| Net unrealized appreciation of investments and foreign currencies | | 29,826,551 | |
| Total net assets | $ | 513,687,406 | |
°Principal amount is stated in the currency in which each security is denominated.
AUD — Australian Dollar
BRL — Brazilian Real
CHF — Swiss Franc
CAD — Canadian Dollar
CLP — Chilean Peso
EUR — European Monetary Unit
GBP — British Pound Sterling
IDR — Indonesian Rupiah
KRW — South Korean Won
NOK — Norwegian Kroner
USD — United States Dollar
50
| | |
| # | Security exempt from registration under Rule 144A of the Securities Act of 1933, as amended. At July 31, 2011, the aggregate amount of Rule 144A securities was $86,532,223, which represented 16.85% of the Fund’s net assets. See Note 10 in “Notes to financial statements.” |
| * | Fully or partially on loan. |
| • | Variable rate security. The rate shown is the rate as of July 31, 2011. Interest rates reset periodically. |
| @ | Illiquid security. At July 31, 2011, the aggregate amount of illiquid securities was $1,335,960, which represented 0.26% of the Fund’s net assets. See Note 10 in “Notes to financial statements.” |
| Δ | Securities have been classified by country of origin. |
| « | Senior secured loans generally pay interest at rates that are periodically redetermined by reference to a base lending rate plus a premium. These base lending rates are generally: (i) the prime rate offered by one or more United States banks, (ii) the lending rate offered by one or more European banks such as the London Inter-Bank Offered Rate (LIBOR), and (iii) the certificate of deposit rate. Senior secured loans may be subject to restrictions on resale. Stated rate in effect at July 31, 2011. |
| ∞ | Fully or partially pledged as collateral for futures contracts. |
| ^ | Zero coupon security. The rate shown is the yield at the time of purchase. |
| ∏ | Restricted security. This investment is in a security not registered under the Securities Act of 1933, as amended, and has certain restrictions on resale which may limit its liquidity. At July 31, 2011, the aggregate amount of the restricted security was $1,231,000, which represented 0.24% of the Fund’s net assets. See Note 10 in “Notes to financial statements.” |
| ≠ | The rate shown is the effective yield at the time of purchase. |
| ** | See Note 9 in “Notes to financial statements”. |
| † | Non income producing security. |
| © | Includes $49,430,806 of securities loaned. |
51
Statements of net assets
Delaware Extended Duration Bond Fund
Summary of abbreviations:
BAML — Bank of America Merrill Lynch
BCLY — Barclays Bank
CDS — Credit Default Swap
CITI — Citigroup Global Markets
CPI-U — Consumer Price Index-Urban
GSC — Goldman Sachs Capital
HSBC — Hong Kong Shanghai Bank
HY — High Yield
IRS — Interest Rate Swap
JPMC — JPMorgan Chase Bank
MSC — Morgan Stanley Capital
PIK — Pay-in-kind
REIT — Real Estate Investment Trust
SPX — S&P 500 Index
yr — Year
| Net Asset Value and Offering Price Per Share – | | |
| Delaware Extended Duration Bond Fund | | |
| Net asset value Class A (A) | $ | 6.38 |
| Sales charge (4.50% of offering price) (B) | | 0.30 |
| Offering price | $ | 6.68 |
| (A) | | Net asset value per share, as illustrated, is the amount which would be paid upon redemption or repurchase of shares. |
| (B) | | See the current prospectus for purchases of $100,000 or more. |
52
The following foreign currency exchange contracts, futures contracts, options contracts and swap contracts were outstanding at July 31, 20111:
Foreign Currency Exchange Contracts
| | | | | | | | | | | | | | | Unrealized |
| | | Contracts to | | | | | | | | | Appreciation |
| Counterparty | | Receive (Deliver) | | In Exchange For | | Settlement Date | | (Depreciation) |
| BAML | | BRL | | (1,264,092 | ) | | USD | | 813,706 | | | 9/2/11 | | | $ | 6,121 | |
| BAML | | CHF | | 1,723,268 | | | USD | | (2,139,363 | ) | | 9/2/11 | | | | 49,528 | |
| BAML | | EUR | | (774,643 | ) | | USD | | 1,111,652 | | | 9/2/11 | | | | (568 | ) |
| BAML | | NOK | | (3,945,570 | ) | | USD | | 727,568 | | | 9/2/11 | | | | (3,639 | ) |
| GSC | | GBP | | 768,905 | | | USD | | (1,259,000 | ) | | 9/2/11 | | | | 2,874 | |
| HSBC | | AUD | | 522,505 | | | USD | | (564,436 | ) | | 9/2/11 | | | | 6,774 | |
| HSBC | | EUR | | (2,740,964 | ) | | USD | | 3,937,258 | | | 9/2/11 | | | | 1,828 | |
| HSBC | | NOK | | 6,856,687 | | | USD | | (1,264,418 | ) | | 9/2/11 | | | | 6,288 | |
| JPMC | | EUR | | (443,000 | ) | | USD | | 635,705 | | | 9/2/11 | | | | (347 | ) |
| MSC | | EUR | | (406,648 | ) | | USD | | 584,315 | | | 9/2/11 | | | | 456 | |
| | | | | | | | | | | | | | | | $ | 69,315 | |
Futures Contracts
| | | | | | | | | | | | | Unrealized |
| | | Notional Cost | | | | | | | | Appreciation |
| Contracts to Buy (Sell) | | | (Proceeds) | | Notional Value | | Expiration Date | | (Depreciation) |
| (533) U.S. Treasury 10 yr Note | | $ | (64,907,898 | ) | | $ | (66,991,438 | ) | | 9/21/11 | | $ | (2,083,540 | ) |
| 393 U.S. Treasury Long Bond | | | 48,640,808 | | | | 50,353,125 | | | 9/21/11 | | | 1,712,317 | |
| 400 U.S. Treasury Ultra Term Bond | | | 51,063,432 | | | | 52,775,000 | | | 9/21/11 | | | 1,711,568 | |
| | | $ | 34,796,342 | | | | | | | | | $ | 1,340,345 | |
53
Statements of net assets
Delaware Extended Duration Bond Fund
Swap Contracts
CDS Contracts
| | | | | | | | | Annual | | | | Unrealized |
| | | Swap | | | | | | Protection | | Termination | | Appreciation |
| Counterparty | | Referenced Obligation | | Notional Value | | Payments | | Date | | (Depreciation) |
| | | Protection Purchased: | | | | | | | | | | | | | | |
| BAML | | Kingdom of Spain 5 yr CDS | | $ | 1,730,000 | | | 1.00% | | 6/20/16 | | | $ | 91,761 | | |
| BCLY | | ITRAXX Europe Subordinate | | | | | | | | | | | | | | |
| | | Financials 15.1 5 yr CDS | | | 6,625,000 | | | 1.00% | | 6/20/16 | | | | 230,042 | | |
| BCLY | | Kingdom of Spain 5 yr CDS | | | 1,027,000 | | | 1.00% | | 3/20/16 | | | | 2,963 | | |
| BCLY | | United States of America | | | | | | | | | | | | | | |
| | | 5 yr CDS | | | 1,200,000 | | | 0.25% | | 3/20/16 | | | | 9,019 | | |
| CITI | | CDX.NA.HY.16 | | | 780,000 | | | 5.00% | | 6/20/16 | | | | 12,615 | | |
| CITI | | Sara Lee 5 yr CDS | | | 900,000 | | | 1.00% | | 3/20/16 | | | | (39,187 | ) | |
| GSC | | ITRAXX Europe Subordinate | | | | | | | | | | | | | | |
| | | Financials CDX.NA.HY.16 | | | 4,340,000 | | | 5.00% | | 6/20/16 | | | | 110,917 | | |
| JPMC | | ITRAXX Europe Subordinate | | | | | | | | | | | | | | |
| | | 15.1 5 yr CDS | | | 1,100,000 | | | 1.00% | | 6/20/16 | | | | 71,423 | | |
| JPMC | | Portuguese Republic 5 yr CDS | | | 756,000 | | | 1.00% | | 6/22/15 | | | | 183,832 | | |
| JPMC | | Viacom 5 yr CDS | | | 1,250,000 | | | 1.00% | | 9/20/15 | | | | (22,501 | ) | |
| MSC | | Kingdom of Spain 5 yr CDS | | | 2,010,000 | | | 1.00% | | 6/20/16 | | | | 53,614 | | |
| | | | | $ | 21,718,000 | | | | | | | | $ | 704,498 | | |
| | | Protection Sold / Moody’s Rating: | | | | | | | | | |
| CITI | | MetLife 5 yr CDS / A | | $ | 825,000 | | | 5.00% | | 9/20/14 | | | $ | 55,626 | | |
| JPMC | | Comcast 5 yr CDS / Baa | | | 1,250,000 | | | 1.00% | | 9/20/15 | | | | 30,790 | | |
| JPMC | | MetLife 5 yr CDS / A | | | 155,000 | | | 1.00% | | 9/20/16 | | | | (310 | ) | |
| JPMC | | Tyson Foods 5 yrs CDS / Ba | | | 1,100,000 | | | 1.00% | | 3/20/16 | | | | 7,769 | | |
| | | | | $ | 3,330,000 | | | | | | | | $ | 93,875 | | |
| Total | | | | | | | | | | | | | $ | 798,373 | | |
54
Inflation Swap Contract
| | | | | | | Unrealized |
| | | Expiration | | | | Appreciation |
| Notional Value | | Date | | Description | | (Depreciation) |
| $12,500,000 | | 2/29/16 | | Agreement with Barclays to receive the notional amount multiplied by the non-revised 5 yr zero coupon CPI-U and to pay the notional amount multiplied by the fixed rate of 2.555%. | | $75,554 |
The use of foreign currency exchange contracts, futures contracts, options contracts and swap contracts involves elements of market risk and risks in excess of the amounts recognized in the financial statements. The notional values presented above represent the Fund’s total exposure in such contracts, whereas only the net unrealized appreciation (depreciation) is reflected in the Fund’s net assets.
1See Note 8 in “Notes to financial statements.”
See accompanying notes, which are an integral part of the financial statements.
55
Statements of operations
Year Ended July 31, 2011
| | | Delaware | | Delaware |
| | | Corporate | | Extended |
| | | Bond | | Duration Bond |
| | | Fund | | Fund |
| Investment Income: | | | | | | | |
| | Interest | $ | 52,861,909 | | | $ | 25,524,998 | |
| | Dividends | | 635,673 | | | | 334,992 | |
| | Securities lending income | | 179,232 | | | | 64,392 | |
| | Foreign tax withheld | | (97,960 | ) | | | (44,705 | ) |
| | | | 53,578,854 | | | | 25,879,677 | |
| Expenses: | | | | | | | |
| | Management fees | | 4,832,147 | | | | 2,364,892 | |
| | Distribution expenses – Class A | | 1,194,681 | | | | 905,527 | |
| | Distribution expenses – Class B | | 83,443 | | | | 29,232 | |
| | Distribution expenses – Class C | | 1,379,277 | | | | 242,206 | |
| | Distribution expenses – Class R | | 66,849 | | | | 83,435 | |
| | Dividend disbursing and transfer agent fees and expenses | | 2,039,978 | | | | 656,388 | |
| | Accounting and administration expenses | | 390,392 | | | | 169,285 | |
| | Reports and statements to shareholders | | 199,319 | | | | 69,755 | |
| | Registration fees | | 92,871 | | | | 93,945 | |
| | Legal fees | | 86,913 | | | | 36,700 | |
| | Audit and tax | | 55,412 | | | | 27,962 | |
| | Trustees’ fees | | 53,658 | | | | 22,769 | |
| | Custodian fees | | 43,951 | | | | 22,586 | |
| | Insurance fees | | 30,257 | | | | 11,026 | |
| | Dues and services | | 14,143 | | | | 17,323 | |
| | Consulting fees | | 9,959 | | | | 4,162 | |
| | Pricing fees | | 8,998 | | | | 8,627 | |
| | Trustees’ expenses | | 3,543 | | | | 1,449 | |
| | | | 10,585,791 | | | | 4,767,269 | |
| | Less fees waived | | (904,768 | ) | | | (494,941 | ) |
| | Less waived distribution expenses – Class A | | (199,114 | ) | | | (150,921 | ) |
| | Less waived distribution expenses – Class R | | (11,142 | ) | | | (13,906 | ) |
| | Less expense paid indirectly | | (1,890 | ) | | | (1,217 | ) |
| | Total operating expenses | | 9,468,877 | | | | 4,106,284 | |
| Net Investment Income | | 44,109,977 | | | | 21,773,393 | |
56
| | Delaware | | Delaware |
| | Corporate | | Extended |
| | Bond | | Duration Bond |
| | Fund | | Fund |
| Net Realized and Unrealized Gain (Loss) on | | | | | | | |
| Investments and Foreign Currencies: | | | | | | | |
| Net realized gain (loss) on: | | | | | | | |
| Investments | $ | 38,133,320 | | | $ | 15,320,913 | |
| Foreign currencies | | 1,197,947 | | | | 459,120 | |
| Foreign currency exchange contracts | | (90,785 | ) | | | (53,591 | ) |
| Futures contracts | | (5,658,446 | ) | | | 1,157,315 | |
| Swap contracts | | 2,202 | | | | (112,794 | ) |
| Net realized gain | | 33,584,238 | | | | 16,770,963 | |
| Net change in unrealized appreciation/depreciation | | | | | | | |
| of investments and foreign currencies | | 7,684,323 | | | | 2,791,904 | |
| Net Realized and Unrealized Gain on | | | | | | | |
| Investments and Foreign Currencies | | 41,268,561 | | | | 19,562,867 | |
| | | | | | | | |
| Net Increase in Net Assets Resulting | | | | | | | |
| from Operations | $ | 85,378,538 | | | $ | 41,336,260 | |
See accompanying notes, which are an integral part of the financial statements.
57
Statements of changes in net assets
Delaware Corporate Bond Fund
| | Year Ended |
| | 7/31/11 | | 7/31/10 |
| Increase in Net Assets from Operations: | | | | | | | |
| Net investment income | $ | 44,109,977 | | | $ | 42,273,800 | |
| Net realized gain on investments | | | | | | | |
| and foreign currencies | | 33,584,238 | | | | 63,381,234 | |
| Net change in unrealized appreciation/depreciation | | | | | | | |
| of investments and foreign currencies | | 7,684,323 | | | | 24,337,227 | |
| Net increase in net assets resulting from operations | | 85,378,538 | | | | 129,992,261 | |
| | | | | | | | |
| Dividends and Distributions to Shareholders from: | | | | | | | |
| Net investment income: | | | | | | | |
| Class A | | (20,177,208 | ) | | | (29,498,681 | ) |
| Class B | | (360,259 | ) | | | (550,082 | ) |
| Class C | | (5,958,860 | ) | | | (6,879,814 | ) |
| Class R | | (536,724 | ) | | | (602,275 | ) |
| Institutional Class | | (23,146,689 | ) | | | (8,273,848 | ) |
| | | | | | | | |
| Net realized gain on investments: | | | | | | | |
| Class A | | (18,619,739 | ) | | | — | |
| Class B | | (400,441 | ) | | | — | |
| Class C | | (6,355,176 | ) | | | — | |
| Class R | | (474,102 | ) | | | — | |
| Institutional Class | | (20,157,143 | ) | | | — | |
| | | (96,186,341 | ) | | | (45,804,700 | ) |
| | | | | | | | |
| Capital Share Transactions: | | | | | | | |
| Proceeds from shares sold: | | | | | | | |
| Class A | | 155,538,522 | | | | 351,999,821 | |
| Class B | | 97,900 | | | | 286,236 | |
| Class C | | 36,483,043 | | | | 47,478,675 | |
| Class R | | 7,492,056 | | | | 5,484,669 | |
| Institutional Class | | 300,959,811 | | | | 346,602,990 | |
| | | | | | | | |
| Net asset value of shares issued upon reinvestment | | | | | | | |
| of dividends and distributions: | | | | | | | |
| Class A | | 31,298,663 | | | | 15,482,178 | |
| Class B | | 575,629 | | | | 325,321 | |
| Class C | | 9,519,702 | | | | 2,664,010 | |
| Class R | | 989,624 | | | | 381,206 | |
| Institutional Class | | 34,711,566 | | | | 1,611,278 | |
| | | 577,666,516 | | | | 772,316,384 | |
58
| | Year Ended |
| | 7/31/11 | | 7/31/10 |
| Capital Share Transactions (continued): | | | | | | | |
| Cost of shares repurchased: | | | | | | | |
| Class A | $ | (200,246,754 | ) | | $ | (473,604,171 | ) |
| Class B | | (3,680,277 | ) | | | (3,955,525 | ) |
| Class C | | (50,191,010 | ) | | | (45,346,480 | ) |
| Class R | | (6,651,589 | ) | | | (8,066,461 | ) |
| Institutional Class | | (221,334,191 | ) | | | (51,910,392 | ) |
| | | (482,103,821 | ) | | | (582,883,029 | ) |
| Increase in net assets derived | | | | | | | |
| from capital share transactions | | 95,562,695 | | | | 189,433,355 | |
| Net Increase in Net Assets | | 84,754,892 | | | | 273,620,916 | |
| | | | | | | | |
| Net Assets: | | | | | | | |
| Beginning of year | | 928,815,974 | | | | 655,195,058 | |
| End of year | $ | 1,013,570,866 | | | $ | 928,815,974 | |
| | | | | | | | |
| Distributions in excess of net investment income | $ | (361,280 | ) | | $ | (163,236 | ) |
See accompanying notes, which are an integral part of the financial statements.
59
Statements of changes in net assets
Delaware Extended Duration Bond Fund
| | Year Ended |
| | 7/31/11 | | 7/31/10 |
| Increase in Net Assets from Operations: | | | | | | | |
| Net investment income | $ | 21,773,393 | | | $ | 16,959,422 | |
| Net realized gain on investments | | | | | | | |
| and foreign currencies | | 16,770,963 | | | | 28,232,615 | |
| Net change in unrealized appreciation/depreciation | | | | | | | |
| of investments and foreign currencies | | 2,791,904 | | | | 12,929,876 | |
| Net increase in net assets resulting from operations | | 41,336,260 | | | | 58,121,913 | |
| | | | | | | | |
| Dividends and Distributions to Shareholders from: | | | | | | | |
| Net investment income: | | | | | | | |
| Class A | | (15,852,945 | ) | | | (13,787,748 | ) |
| Class B | | (131,629 | ) | | | (193,311 | ) |
| Class C | | (1,089,216 | ) | | | (1,074,872 | ) |
| Class R | | (695,505 | ) | | | (340,033 | ) |
| Institutional Class | | (4,741,267 | ) | | | (2,034,209 | ) |
| | | | | | | | |
| Net realized gain on investments: | | | | | | | |
| Class A | | (14,282,673 | ) | | | — | |
| Class B | | (157,648 | ) | | | — | |
| Class C | | (1,262,536 | ) | | | — | |
| Class R | | (744,442 | ) | | | — | |
| Institutional Class | | (3,440,914 | ) | | | — | |
| | | (42,398,775 | ) | | | (17,430,173 | ) |
| | | | | | | | |
| Capital Share Transactions: | | | | | | | |
| Proceeds from shares sold: | | | | | | | |
| Class A | | 153,640,124 | | | | 138,349,253 | |
| Class B | | 50,958 | | | | 62,238 | |
| Class C | | 11,682,865 | | | | 8,692,273 | |
| Class R | | 12,378,423 | | | | 14,196,170 | |
| Institutional Class | | 110,747,266 | | | | 28,357,875 | |
| | | | | | | | |
| Net asset value of shares issued upon reinvestment | | | | | | | |
| of dividends and distributions: | | | | | | | |
| Class A | | 28,522,062 | | | | 11,967,772 | |
| Class B | | 222,194 | | | | 117,338 | |
| Class C | | 1,924,842 | | | | 554,975 | |
| Class R | | 1,439,947 | | | | 323,298 | |
| Institutional Class | | 7,217,008 | | | | 1,509,711 | |
| | | 327,825,689 | | | | 204,130,903 | |
60
| | Year Ended |
| | 7/31/11 | | 7/31/10 |
| Capital Share Transactions (continued): | | | | | | | |
| Cost of shares repurchased: | | | | | | | |
| Class A | $ | (103,758,638 | ) | | $ | (91,290,016 | ) |
| Class B | | (1,462,031 | ) | | | (1,230,405 | ) |
| Class C | | (11,781,175 | ) | | | (8,143,235 | ) |
| Class R | | (16,929,980 | ) | | | (1,833,248 | ) |
| Institutional Class | | (44,476,105 | ) | | | (11,531,587 | ) |
| | | (178,407,929 | ) | | | (114,028,491 | ) |
| Increase in net assets derived | | | | | | | |
| from capital share transactions | | 149,417,760 | | | | 90,102,412 | |
| Net Increase in Net Assets | | 148,355,245 | | | | 130,794,152 | |
| | | | | | | | |
| Net Assets: | | | | | | | |
| Beginning of year | | 365,332,161 | | | | 234,538,009 | |
| End of year | $ | 513,687,406 | | | $ | 365,332,161 | |
| | | | | | | | |
| Undistributed net investment income | $ | 936,905 | | | $ | 1,078,126 | |
See accompanying notes, which are an integral part of the financial statements.
61
Financial highlights
Delaware Corporate Bond Fund Class A
Selected data for each share of the Fund outstanding throughout each period were as follows:
| Net asset value, beginning of period |
| |
| Income (loss) from investment operations: |
| Net investment income1 |
| Net realized and unrealized gain (loss) on investments and foreign currencies |
| Total from investment operations |
| |
| Less dividends and distributions from: |
| Net investment income |
| Net realized gain on investments |
| Total dividends and distributions |
| |
| Net asset value, end of period |
| |
| Total return2 |
| |
| Ratios and supplemental data: |
| Net assets, end of period (000 omitted) |
| Ratio of expenses to average net assets |
| Ratio of expenses to average net assets |
| prior to fees waived and expense paid indirectly |
| Ratio of net investment income to average net assets |
| Ratio of net investment income to average net assets |
| prior to fees waived and expense paid indirectly |
| Portfolio turnover |
1 The average shares outstanding method has been applied for per share information. |
2 Total investment return is based on the change in net asset value of a share during the period and assumes reinvestment of dividends and distributions at net asset value and does not reflect the impact of a sales charge. Total investment return during all of the periods shown reflect waivers by the manager and distributor. Performance would have been lower had the waivers not been in effect. |
See accompanying notes, which are an integral part of the financial statements.
62
| | | Year Ended | |
| | | 7/31/11 | | 7/31/10 | | 7/31/09 | | 7/31/08 | | 7/31/07 | |
| | | $6.080 | | | $5.460 | | | $5.240 | | | $5.520 | | | $5.490 | | |
| | | | | | | | | | | | | | | | | |
| | | | | | | | | | | | | | | | | |
| | | 0.268 | | | 0.309 | | | 0.314 | | | 0.279 | | | 0.301 | | |
| | | 0.278 | | | 0.647 | | | 0.216 | | | (0.272 | ) | | 0.046 | | |
| | | 0.546 | | | 0.956 | | | 0.530 | | | 0.007 | | | 0.347 | | |
| | | | | | | | | | | | | | | | | |
| | | | | | | | | | | | | | | | | |
| | | (0.305 | ) | | (0.336 | ) | | (0.310 | ) | | (0.287 | ) | | (0.317 | ) | |
| | | (0.271 | ) | | — | | | — | | | — | | | — | | |
| | | (0.576 | ) | | (0.336 | ) | | (0.310 | ) | | (0.287 | ) | | (0.317 | ) | |
| | | | | | | | | | | | | | | | | |
| | | $6.050 | | | $6.080 | | | $5.460 | | | $5.240 | | | $5.520 | | |
| | | | | | | | | | | | | | | | | |
| | | 9.44% | | | 17.91% | | | 11.04% | | | 0.04% | | | 6.35% | | |
| | | | | | | | | | | | | | | | | |
| | | $392,313 | | | $409,671 | | | $459,892 | | | $268,659 | | | $304,255 | | |
| | | | | | | | | | | | | | | | | |
| | | 0.95% | | | 0.94% | | | 0.90% | | | 0.90% | | | 0.82% | | |
| | | | | | | | | | | | | | | | | |
| | | 1.09% | | | 1.10% | | | 1.11% | | | 1.08% | | | 1.06% | | |
| | | 4.45% | | | 5.31% | | | 6.45% | | | 5.10% | | | 5.35% | | |
| | | | | | | | | | | | | | | | | |
| | | 4.31% | | | 5.15% | | | 6.24% | | | 4.92% | | | 5.11% | | |
| | | 204% | | | 219% | | | 271% | | | 355% | | | 244% | | |
63
Financial highlights
Delaware Corporate Bond Fund Class B
Selected data for each share of the Fund outstanding throughout each period were as follows:
| Net asset value, beginning of period |
| |
| Income (loss) from investment operations: |
| Net investment income1 |
| Net realized and unrealized gain (loss) on investments and foreign currencies |
| Total from investment operations |
| |
| Less dividends and distributions from: |
| Net investment income |
| Net realized gain on investments |
| Total dividends and distributions |
| |
| Net asset value, end of period |
| |
| Total return2 |
| |
| Ratios and supplemental data: |
| Net assets, end of period (000 omitted) |
| Ratio of expenses to average net assets |
| Ratio of expenses to average net assets |
| prior to fees waived and expense paid indirectly |
| Ratio of net investment income to average net assets |
| Ratio of net investment income to average net assets |
| prior to fees waived and expense paid indirectly |
| Portfolio turnover |
1 The average shares outstanding method has been applied for per share information. |
2 Total investment return is based on the change in net asset value of a share during the period and assumes reinvestment of dividends and distributions at net asset value and does not reflect the impact of a sales charge. Total investment return during all of the periods shown reflects a waiver by the manager. Performance would have been lower had the waiver not been in effect. |
See accompanying notes, which are an integral part of the financial statements.
64
| | | Year Ended | |
| | | 7/31/11 | | 7/31/10 | | 7/31/09 | | 7/31/08 | | 7/31/07 | |
| | | $ 6.080 | | | $ 5.460 | | | $ 5.230 | | | $ 5.520 | | | $ 5.480 | | |
| | | | | | | | | | | | | | | | | |
| | | | | | | | | | | | | | | | | |
| | | 0.223 | | | 0.265 | | | 0.278 | | | 0.238 | | | 0.259 | | |
| | | 0.278 | | | 0.647 | | | 0.225 | | | (0.283 | ) | | 0.055 | | |
| | | 0.501 | | | 0.912 | | | 0.503 | | | (0.045 | ) | | 0.314 | | |
| | | | | | | | | | | | | | | | | |
| | | (0.260 | ) | | (0.292 | ) | | (0.273 | ) | | (0.245 | ) | | (0.274 | ) | |
| | | (0.271 | ) | | — | | | — | | | — | | | — | | |
| | | (0.531 | ) | | (0.292 | ) | | (0.273 | ) | | (0.245 | ) | | (0.274 | ) | |
| | | | | | | | | | | | | | | | | |
| | | | | | | | | | | | | | | | | |
| | | $ 6.050 | | | $ 6.080 | | | $ 5.460 | | | $ 5.230 | | | $ 5.520 | | |
| | | | | | | | | | | | | | | | | |
| | | 8.62% | | | 17.04% | | | 10.43% | | | (0.90% | ) | | 5.56% | | |
| | | | | | | | | | | | | | | | | |
| | | | | | | | | | | | | | | | | |
| | | $6,705 | | | $9,807 | | | $11,938 | | | $15,525 | | | $22,694 | | |
| | | 1.70% | | | 1.69% | | | 1.65% | | | 1.65% | | | 1.57% | | |
| | | | | | | | | | | | | | | | | |
| | | 1.79% | | | 1.80% | | | 1.81% | | | 1.78% | | | 1.76% | | |
| | | 3.70% | | | 4.56% | | | 5.70% | | | 4.35% | | | 4.60% | | |
| | | | | | | | | | | | | | | | | |
| | | 3.61% | | | 4.45% | | | 5.54% | | | 4.22% | | | 4.41% | | |
| | | 204% | | | 219% | | | 271% | | | 355% | | | 244% | | |
65
Financial highlights
Delaware Corporate Bond Fund Class C
Selected data for each share of the Fund outstanding throughout each period were as follows:
| Net asset value, beginning of period |
| |
| Income (loss) from investment operations: |
| Net investment income1 |
| Net realized and unrealized gain (loss) on investments and foreign currencies |
| Total from investment operations |
| |
| Less dividends and distributions from: |
| Net investment income |
| Net realized gain on investments |
| Total dividends and distributions |
| |
| Net asset value, end of period |
| |
| Total return2 |
| |
| Ratios and supplemental data: |
| Net assets, end of period (000 omitted) |
| Ratio of expenses to average net assets |
| Ratio of expenses to average net assets |
| prior to fees waived and expense paid indirectly |
| Ratio of net investment income to average net assets |
| Ratio of net investment income to average net assets |
| prior to fees waived and expense paid indirectly |
| Portfolio turnover |
1 The average shares outstanding method has been applied for per share information. |
2 Total investment return is based on the change in net asset value of a share during the period and assumes reinvestment of dividends and distributions at net asset value and does not reflect the impact of a sales charge. Total investment return during all of the periods shown reflects a waiver by the manager. Performance would have been lower had the waiver not been in effect. |
See accompanying notes, which are an integral part of the financial statements.
66
| | | Year Ended | |
| | | 7/31/11 | | 7/31/10 | | 7/31/09 | | 7/31/08 | | 7/31/07 | |
| | | $6.090 | | | $5.470 | | | $5.240 | | | $5.520 | | | $5.490 | | |
| | | | | | | | | | | | | | | | | |
| | | | | | | | | | | | | | | | | |
| | | 0.223 | | | 0.266 | | | 0.278 | | | 0.238 | | | 0.259 | | |
| | | 0.268 | | | 0.646 | | | 0.225 | | | (0.273 | ) | | 0.045 | | |
| | | 0.491 | | | 0.912 | | | 0.503 | | | (0.035 | ) | | 0.304 | | |
| | | | | | | | | | | | | | | | | |
| | | | | | | | | | | | | | | | | |
| | | (0.260 | ) | | (0.292 | ) | | (0.273 | ) | | (0.245 | ) | | (0.274 | ) | |
| | | (0.271 | ) | | — | | | — | | | — | | | — | | |
| | | (0.531 | ) | | (0.292 | ) | | (0.273 | ) | | (0.245 | ) | | (0.274 | ) | |
| | | | | | | | | | | | | | | | | |
| | | $6.050 | | | $6.090 | | | $5.470 | | | $5.240 | | | $5.520 | | |
| | | | | | | | | | | | | | | | | |
| | | 8.44% | | | 17.01% | | | 10.41% | | | (0.71% | ) | | 5.55% | | |
| | | | | | | | | | | | | | | | | |
| | | | | | | | | | | | | | | | | |
| | | $135,912 | | | $141,328 | | | $121,901 | | | $62,211 | | | $67,693 | | |
| | | 1.70% | | | 1.69% | | | 1.65% | | | 1.65% | | | 1.57% | | |
| | | | | | | | | | | | | | | | | |
| | | 1.79% | | | 1.80% | | | 1.81% | | | 1.78% | | | 1.76% | | |
| | | 3.70% | | | 4.56% | | | 5.70% | | | 4.35% | | | 4.60% | | |
| | | | | | | | | | | | | | | | | |
| | | 3.61% | | | 4.45% | | | 5.54% | | | 4.22% | | | 4.41% | | |
| | | 204% | | | 219% | | | 271% | | | 355% | | | 244% | | |
67
Financial highlights
Delaware Corporate Bond Fund Class R
Selected data for each share of the Fund outstanding throughout each period were as follows:
| Net asset value, beginning of period |
| |
| Income (loss) from investment operations: |
| Net investment income1 |
| Net realized and unrealized gain (loss) on investments and foreign currencies |
| Total from investment operations |
| |
| Less dividends and distributions from: |
| Net investment income |
| Net realized gain on investments |
| Total dividends and distributions |
| |
| Net asset value, end of period |
| |
| Total return2 |
| |
| Ratios and supplemental data: |
| Net assets, end of period (000 omitted) |
| Ratio of expenses to average net assets |
| Ratio of expenses to average net assets |
| prior to fees waived and expense paid indirectly |
| Ratio of net investment income to average net assets |
| Ratio of net investment income to average net assets |
| prior to fees waived and expense paid indirectly |
| Portfolio turnover |
1 The average shares outstanding method has been applied for per share information. |
2 Total investment return is based on the change in net asset value of a share during the period and assumes reinvestment of dividends and distributions at net asset value. Total investment return during all of the periods shown reflect waivers by the manager and distributor. Performance would have been lower had the waivers not been in effect. |
See accompanying notes, which are an integral part of the financial statements.
68
| | | Year Ended | |
| | | 7/31/11 | | 7/31/10 | | 7/31/09 | | 7/31/08 | | 7/31/07 | |
| | | $6.090 | | | $5.470 | | | $5.240 | | | $5.520 | | | $5.490 | | |
| | | | | | | | | | | | | | | | | |
| | | | | | | | | | | | | | | | | |
| | | 0.253 | | | 0.295 | | | 0.302 | | | 0.265 | | | 0.287 | | |
| | | 0.268 | | | 0.646 | | | 0.226 | | | (0.272 | ) | | 0.045 | | |
| | | 0.521 | | | 0.941 | | | 0.528 | | | (0.007 | ) | | 0.332 | | |
| | | | | | | | | | | | | | | | | |
| | | | | | | | | | | | | | | | | |
| | | (0.290 | ) | | (0.321 | ) | | (0.298 | ) | | (0.273 | ) | | (0.302 | ) | |
| | | (0.271 | ) | | — | | | — | | | — | | | — | | |
| | | (0.561 | ) | | (0.321 | ) | | (0.298 | ) | | (0.273 | ) | | (0.302 | ) | |
| | | | | | | | | | | | | | | | | |
| | | $6.050 | | | $6.090 | | | $5.470 | | | $5.240 | | | $5.520 | | |
| | | | | | | | | | | | | | | | | |
| | | 8.98% | | | 17.60% | | | 10.97% | | | (0.21% | ) | | 6.07% | | |
| | | | | | | | | | | | | | | | | |
| | | | | | | | | | | | | | | | | |
| | | $11,981 | | | $10,209 | | | $11,229 | | | $11,973 | | | $15,802 | | |
| | | 1.20% | | | 1.19% | | | 1.15% | | | 1.15% | | | 1.07% | | |
| | | | | | | | | | | | | | | | | |
| | | 1.39% | | | 1.40% | | | 1.41% | | | 1.38% | | | 1.36% | | |
| | | 4.20% | | | 5.06% | | | 6.20% | | | 4.85% | | | 5.10% | | |
| | | | | | | | | | | | | | | | | |
| | | 4.01% | | | 4.85% | | | 5.94% | | | 4.62% | | | 4.81% | | |
| | | 204% | | | 219% | | | 271% | | | 355% | | | 244% | | |
69
Financial highlights
Delaware Corporate Bond Fund Institutional Class
Selected data for each share of the Fund outstanding throughout each period were as follows:
| Net asset value, beginning of period |
| |
| Income (loss) from investment operations: |
| Net investment income1 |
| Net realized and unrealized gain (loss) on investments and foreign currencies |
| Total from investment operations |
| |
| Less dividends and distributions from: |
| Net investment income |
| Net realized gain on investments |
| Total dividends and distributions |
| |
| Net asset value, end of period |
| |
| Total return2 |
| |
| Ratios and supplemental data: |
| Net assets, end of period (000 omitted) |
| Ratio of expenses to average net assets |
| Ratio of expenses to average net assets |
| prior to fees waived and expense paid indirectly |
| Ratio of net investment income to average net assets |
| Ratio of net investment income to average net assets |
| prior to fees waived and expense paid indirectly |
| Portfolio turnover |
1 The average shares outstanding method has been applied for per share information. |
2 Total investment return is based on the change in net asset value of a share during the period and assumes reinvestment of dividends and distributions at net asset value. Total investment return during all of the periods shown reflects a waiver by the manager. Performance would have been lower had the waiver not been in effect. |
See accompanying notes, which are an integral part of the financial statements.
70
| | | Year Ended | |
| | | 7/31/11 | | 7/31/10 | | 7/31/09 | | 7/31/08 | | 7/31/07 | |
| | | $6.090 | | | $5.470 | | | $5.240 | | | $5.520 | | | $5.480 | | |
| | | | | | | | | | | | | | | | | |
| | | | | | | | | | | | | | | | | |
| | | 0.283 | | | 0.329 | | | 0.327 | | | 0.293 | | | 0.315 | | |
| | | 0.268 | | | 0.641 | | | 0.225 | | | (0.273 | ) | | 0.056 | | |
| | | 0.551 | | | 0.970 | | | 0.552 | | | 0.020 | | | 0.371 | | |
| | | | | | | | | | | | | | | | | |
| | | | | | | | | | | | | | | | | |
| | | (0.320 | ) | | (0.350 | ) | | (0.322 | ) | | (0.300 | ) | | (0.331 | ) | |
| | | (0.271 | ) | | — | | | — | | | — | | | — | | |
| | | (0.591 | ) | | (0.350 | ) | | (0.322 | ) | | (0.300 | ) | | (0.331 | ) | |
| | | | | | | | | | | | | | | | | |
| | | $6.050 | | | $6.090 | | | $5.470 | | | $5.240 | | | $5.520 | | |
| | | | | | | | | | | | | | | | | |
| | | 9.52% | | | 18.40% | | | 11.53% | | | 0.10% | | | 6.81% | | |
| | | | | | | | | | | | | | | | | |
| | | | | | | | | | | | | | | | | |
| | | $466,660 | | | $357,801 | | | $50,235 | | | $205,197 | | | $180,631 | | |
| | | 0.70% | | | 0.69% | | | 0.65% | | | 0.65% | | | 0.57% | | |
| | | | | | | | | | | | | | | | | |
| | | 0.79% | | | 0.80% | | | 0.81% | | | 0.78% | | | 0.76% | | |
| | | 4.70% | | | 5.56% | | | 6.70% | | | 5.35% | | | 5.60% | | |
| | | | | | | | | | | | | | | | | |
| | | 4.61% | | | 5.45% | | | 6.54% | | | 5.22% | | | 5.41% | | |
| | | 204% | | | 219% | | | 271% | | | 355% | | | 244% | | |
71
Financial highlights
Delaware Extended Duration Bond Fund Class A
Selected data for each share of the Fund outstanding throughout each period were as follows:
| Net asset value, beginning of period |
| |
| Income (loss) from investment operations: |
| Net investment income1 |
| Net realized and unrealized gain (loss) on investments and foreign currencies |
| Total from investment operations |
| |
| Less dividends and distributions from: |
| Net investment income |
| Net realized gain on investments |
| Total dividends and distributions |
| |
| Net asset value, end of period |
| |
| Total return2 |
| |
| Ratios and supplemental data: |
| Net assets, end of period (000 omitted) |
| Ratio of expenses to average net assets |
| Ratio of expenses to average net assets |
| prior to fees waived and expense paid indirectly |
| Ratio of net investment income to average net assets |
| Ratio of net investment income to average net assets |
| prior to fees waived and expense paid indirectly |
| Portfolio turnover |
1 The average shares outstanding method has been applied for per share information. |
2 Total investment return is based on the change in net asset value of a share during the period and assumes reinvestment of dividends and distributions at net asset value and does not reflect the impact of a sales charge. Total investment return during all of the periods shown reflect waivers by the manager and distributor. Performance would have been lower had the waivers not been in effect. |
See accompanying notes, which are an integral part of the financial statements.
72
| | | Year Ended | |
| | | 7/31/11 | | 7/31/10 | | 7/31/09 | | 7/31/08 | | 7/31/07 | |
| | | $6.440 | | | $5.600 | | | $5.210 | | | $5.460 | | | $5.410 | | |
| | | | | | | | | | | | | | | | | |
| | | | | | | | | | | | | | | | | |
| | | 0.318 | | | 0.348 | | | 0.344 | | | 0.296 | | | 0.306 | | |
| | | 0.268 | | | 0.850 | | | 0.385 | | | (0.245 | ) | | 0.065 | | |
| | | 0.586 | | | 1.198 | | | 0.729 | | | 0.051 | | | 0.371 | | |
| | | | | | | | | | | | | | | | | |
| | | | | | | | | | | | | | | | | |
| | | (0.329 | ) | | (0.358 | ) | | (0.339 | ) | | (0.301 | ) | | (0.321 | ) | |
| | | (0.317 | ) | | — | | | — | | | — | | | — | | |
| | | (0.646 | ) | | (0.358 | ) | | (0.339 | ) | | (0.301 | ) | | (0.321 | ) | |
| | | | | | | | | | | | | | | | | |
| | | $6.380 | | | $6.440 | | | $5.600 | | | $5.210 | | | $5.460 | | |
| | | | | | | | | | | | | | | | | |
| | | 9.74% | | | 22.00% | | | 15.17% | | | 0.83% | | | 6.82% | | |
| | | | | | | | | | | | | | | | | |
| | | | | | | | | | | | | | | | | |
| | | $352,060 | | | $275,312 | | | $184,538 | | | $163,372 | | | $180,853 | | |
| | | 0.95% | | | 0.94% | | | 0.90% | | | 0.90% | | | 0.88% | | |
| | | | | | | | | | | | | | | | | |
| | | 1.12% | | | 1.18% | | | 1.29% | | | 1.23% | | | 1.20% | | |
| | | 5.07% | | | 5.77% | | | 7.03% | | | 5.42% | | | 5.44% | | |
| | | | | | | | | | | | | | | | | |
| | | 4.90% | | | 5.53% | | | 6.64% | | | 5.09% | | | 5.12% | | |
| | | 147% | | | 149% | | | 234% | | | 443% | | | 276% | | |
73
Financial highlights
Delaware Extended Duration Bond Fund Class B
Selected data for each share of the Fund outstanding throughout each period were as follows:
| Net asset value, beginning of period |
| |
| Income (loss) from investment operations: |
| Net investment income1 |
| Net realized and unrealized gain (loss) on investments and foreign currencies |
| Total from investment operations |
| |
| Less dividends and distributions from: |
| Net investment income |
| Net realized gain on investments |
| Total dividends and distributions |
| |
| Net asset value, end of period |
| |
| Total return2 |
| |
| Ratios and supplemental data: |
| Net assets, end of period (000 omitted) |
| Ratio of expenses to average net assets |
| Ratio of expenses to average net assets |
| prior to fees waived and expense paid indirectly |
| Ratio of net investment income to average net assets |
| Ratio of net investment income to average net assets |
| prior to fees waived and expense paid indirectly |
| Portfolio turnover |
1 The average shares outstanding method has been applied for per share information. |
2 Total investment return is based on the change in net asset value of a share during the period and assumes reinvestment of dividends and distributions at net asset value and does not reflect the impact of a sales charge. Total investment return during all of the periods shown reflects a waiver by the manager. Performance would have been lower had the waiver not been in effect. |
See accompanying notes, which are an integral part of the financial statements.
74
| | | Year Ended | |
| | | 7/31/11 | | 7/31/10 | | 7/31/09 | | 7/31/08 | | 7/31/07 | |
| | | $6.430 | | | $5.590 | | | $5.200 | | | $5.450 | | | $5.410 | | |
| | | | | | | | | | | | | | | | | |
| | | | | | | | | | | | | | | | | |
| | | 0.271 | | | 0.301 | | | 0.307 | | | 0.254 | | | 0.264 | | |
| | | 0.268 | | | 0.852 | | | 0.384 | | | (0.244 | ) | | 0.054 | | |
| | | 0.539 | | | 1.153 | | | 0.691 | | | 0.010 | | | 0.318 | | |
| | | | | | | | | | | | | | | | | |
| | | | | | | | | | | | | | | | | |
| | | (0.282 | ) | | (0.313 | ) | | (0.301 | ) | | (0.260 | ) | | (0.278 | ) | |
| | | (0.317 | ) | | — | | | — | | | — | | | — | | |
| | | (0.599 | ) | | (0.313 | ) | | (0.301 | ) | | (0.260 | ) | | (0.278 | ) | |
| | | | | | | | | | | | | | | | | |
| | | $6.370 | | | $6.430 | | | $5.590 | | | $5.200 | | | $5.450 | | |
| | | | | | | | | | | | | | | | | |
| | | 8.93% | | | 21.13% | | | 14.33% | | | 0.08% | | | 5.84% | | |
| | | | | | | | | | | | | | | | | |
| | | | | | | | | | | | | | | | | |
| | | $2,219 | | | $3,464 | | | $3,992 | | | $4,718 | | | $5,959 | | |
| | | 1.70% | | | 1.69% | | | 1.65% | | | 1.65% | | | 1.63% | | |
| | | | | | | | | | | | | | | | | |
| | | 1.82% | | | 1.88% | | | 1.99% | | | 1.93% | | | 1.90% | | |
| | | 4.32% | | | 5.02% | | | 6.28% | | | 4.67% | | | 4.69% | | |
| | | | | | | | | | | | | | | | | |
| | | 4.20% | | | 4.83% | | | 5.94% | | | 4.39% | | | 4.42% | | |
| | | 147% | | | 149% | | | 234% | | | 443% | | | 276% | | |
75
Financial highlights
Delaware Extended Duration Bond Fund Class C
Selected data for each share of the Fund outstanding throughout each period were as follows:
| Net asset value, beginning of period |
| |
| Income (loss) from investment operations: |
| Net investment income1 |
| Net realized and unrealized gain (loss) on investments and foreign currencies |
| Total from investment operations |
| |
| Less dividends and distributions from: |
| Net investment income |
| Net realized gain on investments |
| Total dividends and distributions |
| |
| Net asset value, end of period |
| |
| Total return2 |
| |
| Ratios and supplemental data: |
| Net assets, end of period (000 omitted) |
| Ratio of expenses to average net assets |
| Ratio of expenses to average net assets |
| prior to fees waived and expense paid indirectly |
| Ratio of net investment income to average net assets |
| Ratio of net investment income to average net assets |
| prior to fees waived and expense paid indirectly |
| Portfolio turnover |
1 The average shares outstanding method has been applied for per share information. |
2 Total investment return is based on the change in net asset value of a share during the period and assumes reinvestment of dividends and distributions at net asset value and does not reflect the impact of a sales charge. Total investment return during all of the periods shown reflects a waiver by the manager. Performance would have been lower had the waiver not been in effect. |
See accompanying notes, which are an integral part of the financial statements.
76
| | | Year Ended | |
| | | 7/31/11 | | 7/31/10 | | 7/31/09 | | 7/31/08 | | 7/31/07 | |
| | | $6.430 | | | $5.600 | | | $5.210 | | | $5.460 | | | $5.410 | | |
| | | | | | | | | | | | | | | | | |
| | | | | | | | | | | | | | | | | |
| | | 0.272 | | | 0.302 | | | 0.307 | | | 0.254 | | | 0.264 | | |
| | | 0.277 | | | 0.841 | | | 0.385 | | | (0.244 | ) | | 0.064 | | |
| | | 0.549 | | | 1.143 | | | 0.692 | | | 0.010 | | | 0.328 | | |
| | | | | | | | | | | | | | | | | |
| | | | | | | | | | | | | | | | | |
| | | (0.282 | ) | | (0.313 | ) | | (0.302 | ) | | (0.260 | ) | | (0.278 | ) | |
| | | (0.317 | ) | | — | | | — | | | — | | | — | | |
| | | (0.599 | ) | | (0.313 | ) | | (0.302 | ) | | (0.260 | ) | | (0.278 | ) | |
| | | | | | | | | | | | | | | | | |
| | | $6.380 | | | $6.430 | | | $5.600 | | | $5.210 | | | $5.460 | | |
| | | | | | | | | | | | | | | | | |
| | | 9.09% | | | 20.91% | | | 14.32% | | | 0.08% | | | 6.03% | | |
| | | | | | | | | | | | | | | | | |
| | | | | | | | | | | | | | | | | |
| | | $24,532 | | | $23,115 | | | $19,120 | | | $17,976 | | | $20,156 | | |
| | | 1.70% | | | 1.69% | | | 1.65% | | | 1.65% | | | 1.63% | | |
| | | | | | | | | | | | | | | | | |
| | | 1.82% | | | 1.88% | | | 1.99% | | | 1.93% | | | 1.90% | | |
| | | 4.32% | | | 5.02% | | | 6.28% | | | 4.67% | | | 4.69% | | |
| | | | | | | | | | | | | | | | | |
| | | 4.20% | | | 4.83% | | | 5.94% | | | 4.39% | | | 4.42% | | |
| | | 147% | | | 149% | | | 234% | | | 443% | | | 276% | | |
77
Financial highlights
Delaware Extended Duration Bond Fund Class R
Selected data for each share of the Fund outstanding throughout each period were as follows:
| Net asset value, beginning of period |
| |
| Income (loss) from investment operations: |
| Net investment income1 |
| Net realized and unrealized gain (loss) on investments and foreign currencies |
| Total from investment operations |
| |
| Less dividends and distributions from: |
| Net investment income |
| Net realized gain on investments |
| Total dividends and distributions |
| |
| Net asset value, end of period |
| |
| Total return2 |
| |
| Ratios and supplemental data: |
| Net assets, end of period (000 omitted) |
| Ratio of expenses to average net assets |
| Ratio of expenses to average net assets |
| prior to fees waived and expense paid indirectly |
| Ratio of net investment income to average net assets |
| Ratio of net investment income to average net assets |
| prior to fees waived and expense paid indirectly |
| Portfolio turnover |
1 The average shares outstanding method has been applied for per share information. |
2 Total investment return is based on the change in net asset value of a share during the period and assumes reinvestment of dividends and distributions at net asset value. Total investment return during all of the periods shown reflects waivers by the manager and distributor. Performance would have been lower had the waivers not been in effect. |
See accompanying notes, which are an integral part of the financial statements.
78
| | | Year Ended | |
| | | 7/31/11 | | 7/31/10 | | 7/31/09 | | 7/31/08 | | 7/31/07 | |
| | | $6.440 | | | $5.600 | | | $5.210 | | | $5.460 | | | $5.410 | | |
| | | | | | | | | | | | | | | | | |
| | | | | | | | | | | | | | | | | |
| | | 0.303 | | | 0.339 | | | 0.332 | | | 0.282 | | | 0.293 | | |
| | | 0.278 | | | 0.845 | | | 0.385 | | | (0.245 | ) | | 0.064 | | |
| | | 0.581 | | | 1.184 | | | 0.717 | | | 0.037 | | | 0.357 | | |
| | | | | | | | | | | | | | | | | |
| | | | | | | | | | | | | | | | | |
| | | (0.314 | ) | | (0.344 | ) | | (0.327 | ) | | (0.287 | ) | | (0.307 | ) | |
| | | (0.317 | ) | | — | | | — | | | — | | | — | | |
| | | (0.631 | ) | | (0.344 | ) | | (0.327 | ) | | (0.287 | ) | | (0.307 | ) | |
| | | | | | | | | | | | | | | | | |
| | | $6.390 | | | $6.440 | | | $5.600 | | | $5.210 | | | $5.460 | | |
| | | | | | | | | | | | | | | | | |
| | | 9.63% | | | 21.48% | | | 15.08% | | | 0.39% | | | 6.75% | | |
| | | | | | | | | | | | | | | | | |
| | | | | | | | | | | | | | | | | |
| | | $10,800 | | | $14,131 | | | $665 | | | $377 | | | $250 | | |
| | | 1.20% | | | 1.19% | | | 1.15% | | | 1.15% | | | 1.13% | | |
| | | | | | | | | | | | | | | | | |
| | | 1.42% | | | 1.48% | | | 1.59% | | | 1.53% | | | 1.50% | | |
| | | 4.82% | | | 5.52% | | | 6.78% | | | 5.17% | | | 5.19% | | |
| | | | | | | | | | | | | | | | | |
| | | 4.60% | | | 5.23% | | | 6.34% | | | 4.79% | | | 4.82% | | |
| | | 147% | | | 149% | | | 234% | | | 443% | | | 276% | | |
79
Financial highlights
Delaware Extended Duration Bond Fund Institutional Class
Selected data for each share of the Fund outstanding throughout each period were as follows:
| Net asset value, beginning of period |
| |
| Income (loss) from investment operations: |
| Net investment income1 |
| Net realized and unrealized gain (loss) on investments and foreign currencies |
| Total from investment operations |
| |
| Less dividends and distributions from: |
| Net investment income |
| Net realized gain on investments |
| Total dividends and distributions |
| |
| Net asset value, end of period |
| |
| Total return2 |
| |
| Ratios and supplemental data: |
| Net assets, end of period (000 omitted) |
| Ratio of expenses to average net assets |
| Ratio of expenses to average net assets |
| prior to fees waived and expense paid indirectly |
| Ratio of net investment income to average net assets |
| Ratio of net investment income to average net assets |
| prior to fees waived and expense paid indirectly |
| Portfolio turnover |
1 The average shares outstanding method has been applied for per share information. |
2 Total investment return is based on the change in net asset value of a share during the period and assumes reinvestment of dividends and distributions at net asset value. Total investment return during all of the periods shown reflects a waiver by the manager. Performance would have been lower had the waiver not been in effect. |
See accompanying notes, which are an integral part of the financial statements.
80
| | Year Ended |
| | | 7/31/11 | | | 7/31/10 | | | 7/31/09 | | | 7/31/08 | | | 7/31/07 | |
| | | $ 6.430 | | | $ 5.590 | | | $ 5.200 | | | $ 5.450 | | | $ 5.410 | |
| | | | |
| | | | |
| | | 0.332 | | | 0.364 | | | 0.356 | | | 0.309 | | | 0.320 | |
| | | 0.269 | | | 0.849 | | | 0.385 | | | (0.244 | ) | | 0.055 | |
| | | 0.601 | | | 1.213 | | | 0.741 | | | 0.065 | | | 0.375 | |
| | | | |
| | | | |
| | | (0.344 | ) | | (0.373 | ) | | (0.351 | ) | | (0.315 | ) | | (0.335 | ) |
| | | (0.317 | ) | | — | | | — | | | — | | | — | |
| | | (0.661 | ) | | (0.373 | ) | | (0.351 | ) | | (0.315 | ) | | (0.335 | ) |
| | | | |
| | | $ 6.370 | | | $ 6.430 | | | $ 5.590 | | | $ 5.200 | | | $ 5.450 | |
| | | | |
| | | 10.01% | | | 22.33% | | | 15.48% | | | 1.09% | | | 6.90% | |
| | | | |
| | | | |
| | | $124,076 | | | $49,310 | | | $26,223 | | | $36,494 | | | $65,537 | |
| | | 0.70% | | | 0.69% | | | 0.65% | | | 0.65% | | | 0.63% | |
| | | | |
| | | 0.82% | | | 0.88% | | | 0.99% | | | 0.93% | | | 0.90% | |
| | | 5.32% | | | 6.02% | | | 7.28% | | | 5.67% | | | 5.69% | |
| | | | |
| | | 5.20% | | | 5.83% | | | 6.94% | | | 5.39% | | | 5.42% | |
| | | 147% | | | 149% | | | 234% | | | 443% | | | 276% | |
81
| Notes to financial statements | |
| Delaware Corporate Bond Fund and Delaware Extended Duration Bond Fund | July 31, 2011 |
Delaware Group® Income Funds (Trust) is organized as a Delaware statutory trust and offers five series: Delaware Corporate Bond Fund, Delaware Extended Duration Bond Fund, Delaware Core Bond Fund, Delaware High-Yield Opportunities Fund and Delaware Diversified Floating Rate Fund. These financial statements and the related notes pertain to Delaware Corporate Bond Fund and Delaware Extended Duration Bond Fund (each, a Fund or collectively, the Funds). The Trust is an open-end investment company. The Funds are considered diversified under the Investment Company Act of 1940, as amended, and offer Class A, Class B, Class C, Class R and Institutional Class shares. Class A shares are sold with a front-end sales charge of up to 4.50%. Class A share purchases of $1,000,000 or more will incur a contingent deferred sales charge (CDSC) of 1% if redeemed during the first year and 0.50% during the second year, provided that Delaware Distributors, L.P. (DDLP) paid a financial advisor a commission on the purchase of those shares. Class B shares may be purchased only through dividend reinvestment and certain permitted exchanges. Prior to June 1, 2007, Class B shares were sold with a CDSC that declined from 4% to zero depending upon the period of time the shares were held. Class B shares will automatically convert to Class A shares on a quarterly basis approximately eight years after purchase. Class C shares are sold with a CDSC of 1%, if redeemed during the first twelve months. Class R and Institutional Class shares are not subject to a sales charge and are offered for sale exclusively to certain eligible investors.
The investment objective of the Funds is to seek to provide investors with total return.
1. Significant Accounting Policies
The following accounting policies are in accordance with U.S. generally accepted accounting principles (U.S. GAAP) and are consistently followed by the Funds.
Security Valuation — Equity securities, except those traded on the Nasdaq Stock Market, Inc. (Nasdaq), are valued at the last quoted sales price as of the time of the regular close of the New York Stock Exchange (NYSE) on the valuation date. Securities traded on the Nasdaq are valued in accordance with the Nasdaq Official Closing Price, which may not be the last sales price. If on a particular day an equity security does not trade, then the mean between the bid and ask prices will be used. Securities listed on a foreign exchange are valued at the last quoted sales price on the valuation date. Short-term debt securities are valued at market value. U.S. government and agency securities are valued at the mean between the bid and ask prices. Other debt securities and credit default swap (CDS) contracts are valued based upon valuations provided by an independent pricing service or broker and reviewed by management. To the extent current market prices are not available, the pricing service may take into account developments related to the specific security, as well as transactions in comparable securities. Investment company securities are valued at net asset value per share. Foreign currency exchange contracts are valued at the mean between the bid and ask prices. Interpolated values are derived when the settlement date of the contract is an interim date for which quotations are not available. Futures contracts are valued at the daily quoted settlement prices. Exchange-traded options are valued at the last reported sale price or, if no sales are reported, at the mean between the last reported bid and ask prices. Generally, index swap contracts and other securities and assets for which market quotations are
82
not readily available are valued at fair value as determined in good faith under the direction of each Fund’s Board of Trustees (Board). In determining whether market quotations are readily available or fair valuation will be used, various factors will be taken into consideration, such as market closures or suspension of trading in a security. The Funds may use fair value pricing more frequently for securities traded primarily in non-U.S. markets because, among other things, most foreign markets close well before each Fund values its securities, generally as of 4:00 p.m. Eastern time. The earlier close of these foreign markets gives rise to the possibility that significant events, including broad market moves, government actions or pronouncements, aftermarket trading, or news events may have occurred in the interim. To account for this, the Funds may frequently value foreign securities using fair value prices based on third-party vendor modeling tools (international fair value pricing).
Federal Income Taxes — No provision for federal income taxes has been made as the Funds intend to continue to qualify for federal income tax purposes as a regulated investment company under Subchapter M of the Internal Revenue Code of 1986, as amended, and make the requisite distributions to shareholders. The Funds evaluate tax positions taken or expected to be taken in the course of preparing the Funds’ tax returns to determine whether the tax positions are “more likely-than-not” of being sustained by the applicable tax authority. Tax positions not deemed to meet the more-likely-than-not threshold are recorded as a tax benefit or expense in the current year. Management has analyzed each Fund’s tax positions taken on federal income tax returns for all open tax years (July 31, 2008 – July 31, 2011), and has concluded that no provision for federal income tax is required in the Funds’ financial statements.
Class Accounting — Investment income and common expenses are allocated to the various classes of the Funds on the basis of “settled shares” of each class in relation to the net assets of the Funds. Realized and unrealized gains (loss) on investments are allocated to the various classes of the Funds on the basis of daily net assets of each class. Distribution expenses relating to a specific class are charged directly to that class.
Repurchase Agreements — Each Fund may purchase certain U.S. Government securities subject to the counterparty’s agreement to repurchase them at an agreed upon date and price. The counterparty will be required on a daily basis to maintain the value of the collateral subject to the agreement at not less than the repurchase price (including accrued interest). The agreements are conditioned upon the collateral being deposited under the Federal Reserve book-entry system with each Fund’s custodian or a third party sub-custodian. In the event of default or bankruptcy by the other party to the agreement, retention of the collateral may be subject to legal proceedings. All open repurchase agreements were entered into on July 29, 2011.
Foreign Currency Transactions — Transactions denominated in foreign currencies are recorded at the prevailing exchange rates on the valuation date in accordance with the Funds’ prospectus. The value of all assets and liabilities denominated in foreign currencies is translated into U.S. dollars at the exchange rate of such currencies against the U.S. dollar daily. Transaction gains or losses resulting from changes in exchange rates during the reporting period or upon settlement of the foreign currency transaction are reported in operations for the current period.
83
Notes to financial statements
Delaware Corporate Bond Fund and Delaware Extended Duration Bond Fund
1. Significant Accounting Policies (continued)
The Funds generally isolate that portion of realized gains and losses on investments in debt securities, which are due to changes in foreign exchange rates from that which are due to changes in market prices of debt securities. The Funds report certain foreign currency related transactions as components of realized gains (losses) for financial reporting purposes, whereas such components are treated as ordinary income (loss) for federal income tax purposes.
Use of Estimates — The preparation of financial statements in conformity with U.S. GAAP requires management to make estimates and assumptions that affect the reported amounts of assets and liabilities and disclosure of contingent assets and liabilities at the date of the financial statements and the reported amounts of revenues and expenses during the reporting period. Actual results could differ from those estimates and the differences could be material.
Other — Expenses directly attributable to a Fund are charged directly to that Fund. Other expenses common to various funds within the Delaware Investments® Family of Funds are generally allocated amongst such funds on the basis of average net assets. Management fees and some other expenses are paid monthly. Security transactions are recorded on the date the securities are purchased or sold (trade date) for financial reporting purposes. Costs used in calculating realized gains and losses on the sale of investment securities are those of the specific securities sold. Dividend income is recorded on the ex-dividend date and interest income is recorded on the accrual basis. Discounts and premiums on non-convertible debt securities are amortized to interest income over the lives of the respective securities. Realized gains (losses) on paydowns of asset- and mortgage-backed securities are classified as interest income. Withholding taxes on foreign interest have been recorded in accordance with each Fund’s understanding of the applicable country’s tax rules and rates. Each Fund declares dividends daily from net investment income and pays the dividends monthly and declares and pays distributions from net realized gain on investments, if any, at least annually. The Funds may distribute income dividends and capital gains more frequently, if necessary for tax purposes. Dividends and distributions, if any, are recorded on the ex-dividend date.
The Funds may receive earnings credits from their custodian when positive cash balances are maintained, which are used to offset custody fees. There were no earnings credits for the year ended July 31, 2011.
The Funds receive earnings credits from their transfer agent when positive cash balances are maintained, which are used to offset transfer agent fees. The expense paid under this arrangement is included in dividend disbursing and transfer agent fees and expenses on the statements of operations with the corresponding expense offset shown as “expense paid indirectly.” For the year ended July 31, 2011, the Funds earned the following amounts under this agreement:
| | Delaware | | Delaware |
| | Corporate | | Extended Duration |
| | Bond Fund | | Bond Fund |
| | $1,890 | | $1,217 |
84
2. Investment Management, Administration Agreements and Other Transactions with Affiliates
In accordance with the terms of its respective investment management agreement, each Fund pays Delaware Management Company (DMC), a series of Delaware Management Business Trust and the investment manager, an annual fee which is calculated based on each Fund’s average daily net assets as follows:
| | Delaware | | Delaware |
| | Corporate | | Extended Duration |
| | Bond Fund | | Bond Fund |
| On the first $500 million | 0.500% | | 0.550% |
| On the next $500 million | 0.475% | | 0.500% |
| On the next $1.5 billion | 0.450% | | 0.450% |
| In excess of $2.5 billion | 0.425% | | 0.425% |
Effective November 26, 2010, DMC has contractually agreed to waive that portion, if any, of its management fee and reimburse each Fund to the extent necessary to ensure that total annual operating expenses, (excluding any 12b-1 plan, taxes, interest, inverse floater program expenses, short sale and dividend interest expenses, brokerage fees, certain insurance costs, and nonroutine expenses or costs, including, but not limited to, those relating to reorganizations, litigation, conducting shareholder meetings, and liquidations (collectively, nonroutine expenses)), do not exceed 0.70% of each Fund’s average daily net assets through November 28, 2011. These waivers and reimbursements may only be terminated by agreement of the Manager and the Funds. Prior to November 26, 2010, this agreement was voluntary.
Delaware Service Company, Inc. (DSC), an affiliate of DMC, provides fund accounting and financial administration oversight services to the Funds. For these services, the Funds pay DSC fees based on the aggregate daily net assets of the Delaware Investments® Family of Funds at the following annual rate: 0.0050% of the first $30 billion; 0.0045% of the next $10 billion; 0.0040% of the next $10 billion; and 0.0025% of aggregate average daily net assets in excess of $50 billion. The fees payable to DSC under the service agreement described above are allocated among all Funds in the Delaware Investments Family of Funds on a relative net asset value basis. For the year ended July 31, 2011, the Funds were charged for these services as follows:
| | Delaware | | Delaware |
| | Corporate | | Extended Duration |
| | Bond Fund | | Bond Fund |
| | $49,167 | | $21,317 |
DSC also provides dividend disbursing and transfer agent services. Each Fund paid DSC a monthly fee based on the number of shareholder accounts for dividend disbursing and transfer agent services. Effective July 18, 2011, each Fund pays DSC a monthly asset-based fee for these services.
85
Notes to financial statements
Delaware Corporate Bond Fund and Delaware Extended Duration Bond Fund
2. Investment Management, Administration Agreements and Other Transactions with Affiliates (continued)
Pursuant to a distribution agreement and distribution plan, each Fund pays DDLP, the distributor and an affiliate of DMC, an annual distribution and service fee not to exceed 0.30% of the average daily net assets of the Class A shares, 1.00% of the average daily net assets of the Class B and Class C shares and 0.60% of the average daily net assets of Class R shares. Institutional Class shares pay no distribution and service expenses. DDLP has contracted to limit the Class A and Class R shares’ 12b-1 fees for each Fund through November 28, 2011 to no more than 0.25% and 0.50% of their respective average daily net assets.
At July 31, 2011, each Fund had liabilities payable to affiliates as follows:
| | Delaware | | Delaware |
| | Corporate | | Extended Duration |
| | Bond Fund | | Bond Fund |
| Investment management fees payable to DMC | $384,646 | | | $171,171 | |
| Dividend disbursing, transfer agent and fund accounting | | | | | |
| oversight fees and other expenses payable to DSC | 51,256 | | | 17,042 | |
| Distribution fees payable to DDLP | 206,416 | | | 100,136 | |
| Other expenses payable to DMC and affiliates* | 20,070 | | | 10,769 | |
*DMC, as part of its administrative services, pays operating expenses on behalf of each Fund and is reimbursed on a periodic basis. Expenses include items such as printing of shareholder reports, fees for audit, legal and tax services, registration fees and trustees’ fees.
As provided in the investment management agreement, each Fund bears the cost of certain legal and tax services, including internal legal and tax services provided to each Fund by DMC and/or its affiliates’ employees. For the year ended July 31, 2011, the Funds were charged for internal legal and tax services provided by DMC and/or its affiliates’ employees as follows:
| | Delaware | | Delaware |
| | Corporate | | Extended Duration |
| | Bond Fund | | Bond Fund |
| | $23,200 | | $10,336 |
For the year ended July 31, 2011, DDLP earned commissions on sales of Class A shares for each Fund as follows:
| | Delaware | | Delaware |
| | Corporate | | Extended Duration |
| | Bond Fund | | Bond Fund |
| | $81,213 | | $31,863 |
For the year ended July 31, 2011, DDLP received gross CDSC commissions on redemptions of each Fund’s Class A, Class B and Class C shares, respectively, and these commissions were entirely used
86
to offset up-front commissions previously paid by DDLP to broker/dealers on sales of those shares. The amounts received were as follows:
| | Delaware | | Delaware |
| | Corporate | | Extended Duration |
| | Bond Fund | | Bond Fund |
| Class A | $ | 0 | | $ | 0 | |
| Class B | | 8,206 | | | 1,750 | |
| Class C | | 8,011 | | | 5,712 | |
Trustees’ fees include expenses accrued by the Funds for each Trustee’s retainer and meeting fees. Certain officers of DMC, DSC and DDLP are officers and/or Trustees of the Trust. These officers and Trustees are paid no compensation by the Funds.
3. Investments
For the year ended July 31, 2011, the Funds made purchases and sales of investments securities other than short-term investments as follows:
| | Delaware | | Delaware |
| | Corporate | | Extended Duration |
| | Bond Fund | | Bond Fund |
| Purchases other than U.S. government securities | $1,812,364,897 | | $676,112,762 |
| Purchases of U.S. government securities | 198,749,460 | | 77,881,356 |
| Sales other than U.S. government securities | 1,766,349,906 | | 543,547,445 |
| Sales of U.S. government securities | 216,119,619 | | 76,111,812 |
At July 31, 2011, the cost of investments and unrealized appreciation (depreciation) for federal income tax purposes for each Fund were as follows:
| | Delaware | | Delaware |
| | Corporate | | Extended Duration |
| | Bond Fund | | Bond Fund |
| Cost of investments | $ | 1,011,177,699 | | | | $ | 531,302,518 | |
| Aggregate unrealized appreciation | $ | 58,823,443 | | | | $ | 29,439,324 | |
| Aggregate unrealized depreciation | | (8,143,411 | ) | | | | (2,558,486 | ) |
| Net unrealized appreciation | $ | 50,680,032 | | | | $ | 26,880,838 | |
U.S. GAAP defines fair value as the price that the Funds would receive to sell an asset or pay to transfer a liability in an orderly transaction between market participants at the measurement date under current market conditions. A three level hierarchy for fair value measurements has been established based upon the transparency of inputs to the valuation of an asset or liability. Inputs may be observable or unobservable and refer broadly to the assumptions that market participants would use in pricing the asset or liability. Observable inputs reflect the assumptions market participants would use in pricing the asset or liability based on market data obtained from sources independent of the reporting entity. Unobservable inputs reflect the reporting entity’s own assumptions about the assumptions that market participants would use in pricing the asset or
87
Notes to financial statements
Delaware Corporate Bond Fund and Delaware Extended Duration Bond Fund
3. Investments (continued)
liability developed based on the best information available under the circumstances. Each Fund’s investment in its entirety is assigned a level based upon the observability of the inputs which are significant to the overall valuation. The three level hierarchy of inputs is summarized below.
| Level 1 – | inputs are quoted prices in active markets for identical investments (e.g., equity securities, open-end investment companies, futures contracts, options contracts) |
| | |
| Level 2 – | other observable inputs (including, but not limited to: quoted prices for similar assets or liabilities in markets that are active, quoted prices for identical or similar assets or liabilities in markets that are not active, inputs other than quoted prices that are observable for the assets or liabilities (such as interest rates, yield curves, volatilities, prepayment speeds, loss severities, credit risks and default rates) or other market-corroborated inputs) (e.g., debt securities, government securities, swap contracts, foreign currency exchange contracts, foreign securities utilizing international fair value pricing) |
| | |
| Level 3 – | inputs are significant unobservable inputs (including each Fund’s own assumptions used to determine the fair value of investments) (e.g., broker-quoted securities, fair valued securities) |
The following table summarizes the valuation of each Fund’s investments by fair value hierarchy levels as of July 31, 2011:
| | Delaware Corporate Bond Fund |
| | Level 1 | | Level 2 | | Level 3 | | Total |
| Commercial Mortgage- | | | | | | | | | | | | | |
| Backed Security | $ | — | | | $ | 200,396 | | $ | — | | $ | 200,396 | |
| Common Stock | | 3,373 | | | | — | | | — | | | 3,373 | |
| Corporate Debt | | — | | | | 909,307,613 | | | — | | | 909,307,613 | |
| Foreign Debt | | — | | | | 32,969,485 | | | 3,855,450 | | | 36,824,935 | |
| Municipal Bonds | | — | | | | 31,682,381 | | | — | | | 31,682,381 | |
| Preferred Stock | | 5,413,625 | | | | 5,608,155 | | | — | | | 11,021,780 | |
| Purchased Options | | 108,800 | | | | — | | | 1,777,129 | | | 1,885,929 | |
| Short-Term Investments | | — | | | | 16,599,486 | | | — | | | 16,599,486 | |
| Securities Lending Collateral | | — | | | | 54,372,638 | | | — | | | 54,372,638 | |
| Total | $ | 5,525,798 | | | $ | 1,050,740,154 | | $ | 5,632,579 | | $ | 1,061,898,531 | |
| | |
| Foreign Currency | | | | | | | | | | | | | |
| Exchange Contracts | $ | — | | | $ | 166,068 | | $ | — | | $ | 166,068 | |
| Futures Contracts | $ | (711,587 | ) | | $ | — | | $ | — | | $ | (711,587 | ) |
| Swap Contracts | $ | — | | | $ | 1,853,901 | | $ | 169,242 | | $ | 2,023,143 | |
| Written Options | $ | (40,800 | ) | | $ | — | | $ | — | | $ | (40,800 | ) |
88
| | Delaware Extended Duration Bond Fund |
| | Level 1 | | Level 2 | | Level 3 | | Total |
| Commercial Mortgage- | | | | | | | | | | | | | |
| Backed Securities | $ | — | | | $ | 110,810 | | $ | — | | $ | 110,810 | |
| Corporate Debt | | — | | | | 450,452,296 | | | — | | | 450,452,296 | |
| Foreign Debt | | — | | | | 13,768,428 | | | 1,496,277 | | | 15,264,705 | |
| Municipal Bonds | | — | | | | 27,372,936 | | | | | | 27,372,936 | |
| U.S. Treasury Obligations | | — | | | | 3,518,221 | | | — | | | 3,518,221 | |
| Preferred stock | | 1,636,000 | | | | 3,707,759 | | | — | | | 5,343,759 | |
| Purchased Options | | 54,400 | | | | — | | | 710,851 | | | 765,251 | |
| Short-Term Investments | | 153,223 | | | | 4,605,288 | | | — | | | 4,758,511 | |
| Securities Lending Collateral | | — | | | | 50,617,267 | | | — | | | 50,617,267 | |
| Total | $ | 1,843,623 | | | $ | 554,153,005 | | $ | 2,207,128 | | $ | 558,203,756 | |
| | |
| Foreign Currency | | | | | | | | | | | | | |
| Exchange Contracts | $ | — | | | $ | 69,315 | | $ | — | | $ | 69,315 | |
| Futures Contracts | $ | 1,340,345 | | | $ | — | | $ | — | | $ | 1,340,345 | |
| Swap Contracts | $ | — | | | $ | 798,373 | | $ | 75,554 | | $ | 873,927 | |
| Written Options | $ | (20,400 | ) | | $ | — | | $ | — | | $ | (20,400 | ) |
The following is a reconciliation of investments in which significant unobservable inputs (Level 3) were used in determining fair value:
| | Delaware Corporate Bond Fund |
| | | | | | | | | Securities | | | | | | | | |
| | Corporate | | Foreign | | Lending | | Purchased | | | | |
| | Debt | | Debt | | Collateral | | Options | | Total |
| Balance as of 7/31/10 | $ | 1,163,928 | | | $ | — | | $ | 10,325 | | | $ | — | | | $ | 1,174,253 | |
| Purchases | | — | | | | 3,568,570 | | | — | | | | 2,456,000 | | | | 6,024,570 | |
| Sales | | (1,224,089 | ) | | | — | | | (12,293 | ) | | | — | | | | (1,236,382 | ) |
| Net realized gain | | 92,180 | | | | — | | | — | | | | — | | | | 92,180 | |
| Transfers into Level 3 | | 3,106,005 | | | | — | | | — | | | | — | | | | 3,106,005 | |
| Net change in unrealized | | | | | | | | | | | | | | | | | | |
| appreciation/depreciation | | (3,138,024 | ) | | | 286,880 | | | 1,968 | | | | (678,871 | ) | | | (3,528,047 | ) |
| Balance as of 7/31/11 | $ | — | | | $ | 3,855,450 | | $ | — | | | $ | 1,777,129 | | | $ | 5,632,579 | |
| | |
| Net change in unrealized | | | | | | | | | | | | | | | | | | |
| appreciation/depreciation | | | | | | | | | | | | | | | | | | |
| from investments still held | | | | | | | | | | | | | | | | | | |
| as of 7/31/11 | $ | (3,106,005 | ) | | $ | 286,880 | | $ | (9,803 | ) | | $ | (678,871 | ) | | $ | (3,507,799 | ) |
89
Notes to financial statements
Delaware Corporate Bond Fund and Delaware Extended Duration Bond Fund
3. Investments (continued)
| | | Swap |
| | | Contracts |
| Balance as of 7/31/10 | | $ | — |
| Purchases | | | — |
| Net unrealized appreciation | | | 169,242 |
| Balance as of 7/31/11 | | $ | 169,242 |
| |
| Net change in unrealized | | | |
| appreciation/depreciation | | | |
| from investments still held | | | |
| as of 7/31/11 | | $ | 169,242 |
| | | | | | | Delaware Extended Duration Bond Fund | | | | |
| | | | | | | | | | Securities | | | | | | | | |
| | | Corporate | | | Foreign | | Lending | | Purchased | | | | |
| | | Debt | | | Debt | | Collateral | | | Options | | | Total |
| Balance as of 7/31/10 | | $ | 414,767 | | | $ | — | | $ | 4,314 | | | $ | — | | | $ | 419,081 | |
| Purchases | | | — | | | | 1,384,940 | | | — | | | | 982,400 | | | | 2,367,340 | |
| Sales | | | (436,206 | ) | | | — | | | (5,137 | ) | | | — | | | | (441,343 | ) |
| Net realized gain | | | 32,849 | | | | — | | | — | | | | — | | | | 32,849 | |
| Net change in unrealized | | | | | | | | | | | | | | | | | | | |
| appreciation/depreciation | | | (11,410 | ) | | | 111,337 | | | 823 | | | | (271,549 | ) | | | (170,799 | ) |
| Balance as of 7/31/11 | | $ | — | | | $ | 1,496,277 | | $ | — | | | $ | 710,851 | | | $ | 2,207,128 | |
| | | | | | | | | | | | | | | | | | | | |
| Net change in unrealized | | | | | | | | | | | | | | | | | | | |
| appreciation/depreciation | | | | | | | | | | | | | | | | | | | |
| from investments still held | | | | | | | | | | | | | | | | | | | |
| as of 7/31/11 | | $ | — | | | $ | 111,337 | | $ | (4,096 | ) | | $ | (271,549 | ) | | $ | (164,308 | ) |
| | | Swap |
| | | Contracts |
| Balance as of 7/31/10 | | $ | — |
| Purchases | | | — |
| Net unrealized appreciation | | | 75,554 |
| Balance as of 7/31/11 | | $ | 75,554 |
| |
| Net change in unrealized | | | |
| appreciation/depreciation | | | |
| from investments still held | | | |
| as of 7/31/11 | | $ | 75,554 |
90
During the year ended July 31, 2011, transfers into Level 3 investments out of Level 2 investments were made in the amount of $3,106,005 for Delaware Corporate Bond Fund. This was due to the Fund’s pricing vendor dropping pricing of a security.
During the year ended July 31, 2011, there were no transfers between Level 1 investments and Level 2 investments that had a material impact to the Delaware Corporate Bond Fund.
During the year ended July 31, 2011, there were no transfers between Level 1 investments, Level 2 investments or Level 3 investments that had a material impact to the Delaware Extended Duration Bond Fund.
Each Fund’s policy is to recognize transfers between levels at the end of the reporting period.
4. Dividend and Distribution Information
Income and long-term capital gain distributions are determined in accordance with federal income tax regulations, which may differ from U.S. GAAP. Additionally, distributions from net gains on foreign currency transactions and net short-term gains on sales of investment securities are treated as ordinary income for federal income tax purposes. The tax character of dividends and distributions paid during the years ended July 31, 2011 and 2010 was as follows:
| | | Delaware | | Delaware |
| | | Corporate | | Extended Duration |
| | | Bond Fund | | Bond Fund |
| | | Year Ended | | Year Ended |
| | | 7/31/11 | | 7/31/10 | | 7/31/11 | | 7/31/10 |
| Ordinary income | | $ | 88,886,401 | | $ | 45,804,700 | | $ | 32,799,733 | | $ | 17,430,173 |
| Long-term capital gains | | | 7,299,940 | | | — | | | 9,599,043 | | | — |
| Total | | $ | 96,186,341 | | $ | 45,804,700 | | $ | 42,398,776 | | $ | 17,430,173 |
5. Components of Net Assets on a Tax Basis
As of July 31, 2011, the components of net assets on a tax basis were as follows:
| | | Delaware | | Delaware |
| | | Corporate | | Extended Duration |
| | | Bond Fund | | Bond Fund |
| Shares of beneficial interest | | $ | 955,016,101 | | | $ | 480,688,129 | |
| Undistributed ordinary income | | | 5,309,711 | | | | 3,226,543 | |
| Distributions payable | | | (1,234,441 | ) | | | (674,094 | ) |
| Undistributed long-term capital gains | | | 4,360,282 | | | | 3,868,179 | |
| Other temporary differences | | | (661,066 | ) | | | (344,556 | ) |
| Unrealized appreciation of investments | | | | | | | | |
| and foreign currencies | | | 50,780,279 | | | | 26,923,205 | |
| Net assets | | $ | 1,013,570,866 | | | $ | 513,687,406 | |
91
Notes to financial statements
Delaware Corporate Bond Fund and Delaware Extended Duration Bond Fund
5. Components of Net Assets on a Tax Basis (continued)
The differences between book basis and tax basis components of net assets are primarily attributable to tax deferral of losses on wash sales, mark-to-market of futures contracts, mark-to-market of foreign currency exchange contracts, tax deferral of losses on straddles, tax treatment of CDS contracts, and tax treatment of market discount and premium on debt instruments and contingent payment debt instruments.
For financial reporting purposes, capital accounts are adjusted to reflect the tax character of permanent book/tax differences. Reclassifications are primarily due to tax treatment of gain (loss) on foreign currency transactions, market discount and premium on certain debt instruments, paydowns of asset- and mortgage-backed securities and CDS contracts. Results of operations and net assets were not affected by these reclassifications. For the year ended July 31, 2011, the Funds recorded the following reclassifications:
| | | Delaware | | Delaware |
| | | Corporate | | Extended Duration |
| | | Bond Fund | | Bond Fund |
| Distributions in excess of net investment income | | $ | 5,871,719 | | | $ | 595,948 | |
| Accumulated net realized gain | | | (5,871,719 | ) | | | (595,948 | ) |
92
6. Capital Shares
Transactions in capital shares were as follows:
| | | Delaware | | Delaware |
| | | Corporate | | Extended Duration |
| | | Bond Fund | | Bond Fund |
| | | Year Ended | | Year Ended |
| | | 7/31/11 | | 7/31/10 | | 7/31/11 | | 7/31/10 |
| Shares sold: | | | | | | | | | | | | |
| Class A | | 25,899,488 | | | 60,801,418 | | | 24,425,937 | | | 22,984,097 | |
| Class B | | 16,369 | | | 49,767 | | | 8,189 | | | 10,437 | |
| Class C | | 6,055,130 | | | 8,191,772 | | | 1,814,217 | | | 1,432,071 | |
| Class R | | 1,246,714 | | | 941,376 | | | 2,008,490 | | | 2,319,099 | |
| Institutional Class | | 49,659,946 | | | 58,201,643 | | | 17,772,089 | | | 4,659,277 | |
| |
| Shares issued upon reinvestment of dividends and distributions: | | | | | | | |
| Class A | | 5,245,037 | | | 2,649,551 | | | 4,583,991 | | | 1,978,252 | |
| Class B | | 96,453 | | | 55,807 | | | 35,777 | | | 19,523 | |
| Class C | | 1,594,147 | | | 455,847 | | | 309,766 | | | 91,993 | |
| Class R | | 165,556 | | | 65,325 | | | 231,677 | | | 52,485 | |
| Institutional Class | | 5,813,001 | | | 276,079 | | | 1,164,018 | | | 249,693 | |
| | | 95,791,841 | | | 131,688,585 | | | 52,354,151 | | | 33,796,927 | |
| |
| Shares repurchased: | | | | | | | | | | | | |
| Class A | | (33,592,983 | ) | | (80,288,313 | ) | | (16,621,429 | ) | | (15,151,966 | ) |
| Class B | | (615,775 | ) | | (679,104 | ) | | (234,753 | ) | | (205,164 | ) |
| Class C | | (8,397,145 | ) | | (7,730,878 | ) | | (1,871,364 | ) | | (1,347,983 | ) |
| Class R | | (1,109,000 | ) | | (1,383,742 | ) | | (2,743,122 | ) | | (297,005 | ) |
| Institutional Class | | (37,098,717 | ) | | (8,878,024 | ) | | (7,142,279 | ) | | (1,927,229 | ) |
| | | (80,813,620 | ) | | (98,960,061 | ) | | (28,612,947 | ) | | (18,929,347 | ) |
| Net increase | | 14,978,221 | | | 32,728,524 | | | 23,741,204 | | | 14,867,580 | |
For the years ended July 31, 2011 and 2010, the following shares and values were converted from Class B to Class A shares. The respective amounts are included in Class B redemptions and Class A subscriptions in the tables above and the statements of changes in net assets.
| | | Year Ended | | Year Ended |
| | | | | 7/31/11 | | | | | | | 7/31/10 | | | |
| | | Class B | | Class A | | | | | Class B | | Class A | | | |
| | | Shares | | Shares | | Value | | Shares | | Shares | | Value |
| Delaware Corporate Bond Fund | | 233,042 | | 232,847 | | $ | 1,383,913 | | 139,620 | | 139,406 | | $ | 812,537 |
| Delaware Extended Duration | | | | | | | | | | | | | | |
| Bond Fund | | 56,970 | | 56,858 | | | 353,603 | | 47,473 | | 47,393 | | | 284,985 |
93
Notes to financial statements
Delaware Corporate Bond Fund and Delaware Extended Duration Bond Fund
7. Line of Credit
The Funds, along with certain other funds in the Delaware Investments® Family of Funds (Participants), was a participant in a $35,000,000 revolving line of credit to be used for temporary or emergency purposes as an additional source of liquidity to fund redemptions of investor shares. Under the agreement, the Participants were charged an annual commitment fee, which was allocated across the Participants on the basis of each Participant’s allocation of the entire facility. The Participants were permitted to borrow up to a maximum of one third of their net assets under the agreement. The line of credit expired on November 16, 2010.
On November 16, 2010, the Funds, along with the other Participants, entered into an amendment to the agreement for a $50,000,000 revolving line of credit. Effective as of August 1, 2011, the Funds, along with the other Participants, entered into an amendment to the agreement for a $100,000,000 revolving line of credit. The agreement as amended is to be used as described above and operates in substantially the same manner as the original agreement. The new line of credit under the agreement as amended expires on November 15, 2011. The Funds had no amounts outstanding as of July 31, 2011 or at any time during the year then ended.
8. Derivatives
U.S. GAAP requires enhanced disclosures that enable investors to understand: 1) how and why an entity uses derivatives; 2) how they are accounted for; and 3) how they affect an entity’s results of operations and financial position.
Foreign Currency Exchange Contracts — The Funds enter into foreign currency exchange contracts as a way of managing foreign exchange rate risk. Each Fund may enter into these contracts to fix the U.S. dollar value of a security that it has agreed to buy or sell for the period between the date the trade was entered into and the date the security is delivered and paid for. Each Fund may also use these contracts to hedge the U.S. dollar value of securities it already owns that are denominated in foreign currencies. The change in value is recorded as an unrealized gain or loss. When the contract is closed, a realized gain or loss is recorded equal to the difference between the value of the contract at the time it was opened and the value at the time it was closed.
The use of foreign currency exchange contracts does not eliminate fluctuations in the underlying prices of the securities, but does establish a rate of exchange that can be achieved in the future. Although foreign currency exchange contracts limit the risk of loss due to an unfavorable change of the hedged currency, they also limit any potential gain that might result should the value of the currency change favorably. In addition, the Funds could be exposed to risks if the counterparties to the contracts are unable to meet the terms of their contracts. Each Fund’s maximum risk of loss from counterparty credit risk is the value of its currency exchanged with the counterparty. The risk is generally mitigated by having a netting arrangement between the Funds and the counterparty and by the posting of collateral by the counterparty to the Funds to cover the Funds’ exposure to the counterparty.
94
Futures Contracts — A futures contract is an agreement in which the writer (or seller) of the contract agrees to deliver to the buyer an amount of cash or securities equal to a specific dollar amount times the difference between the value of a specific security or index at the close of the last trading day of the contract and the price at which the agreement is made. The Funds may use futures contacts in the normal course of pursuing their investment objective. Each Fund may invest in futures contracts to hedge its existing portfolio securities against fluctuations in fair value caused by changes in prevailing market interest rates. Upon entering into a futures contract, the Funds deposit cash or pledges U.S. government securities to a broker, equal to the minimum “initial margin” requirements of the exchange on which the contract is traded. Subsequent payments are received from the broker or paid to the broker each day, based on the daily fluctuation in the market value of the contract. These receipts or payments are known as “variation margin” and are recorded daily by the Funds as unrealized gains or losses until the contracts are closed. When the contracts are closed, the Funds record a realized gain or loss equal to the difference between the value of the contract at the time it was opened and the value at the time it was closed. Risks of entering into futures contracts include potential imperfect correlation between the futures contracts and the underlying securities and the possibility of an illiquid secondary market for these instruments. When investing in futures, there is minimal counterparty credit risk to a Fund because futures are exchange-traded and the exchange’s clearinghouse, as counterparty to all exchange-traded futures, guarantees against default.
Options Contracts — During the year ended July 31, 2011, each Fund entered into options contracts in the normal course of pursuing its investment objective. Each Fund may buy or write options contracts for any number of reasons, including without limitation: to manage each Fund’s exposure to changes in securities prices and foreign currencies; as an efficient means of adjusting the Funds’ overall exposure to certain markets; to protect the value of portfolio securities; and as a cash management tool. Each Fund may buy or write call or put options on securities, futures, swaps “swaptions”, financial indices, and foreign currencies. When the Funds buy an option, a premium is paid and an asset is recorded and adjusted on a daily basis to reflect the current market value of the options purchased. When the Funds write an option, a premium is received and a liability is recorded and adjusted on a daily basis to reflect the current market value of the options written. Premiums received from writing options that expire unexercised are treated by each Fund on the expiration date as realized gains. The difference between the premium received and the amount paid on effecting a closing purchase transaction, including brokerage commissions, is treated as realized gain or loss. If a call option is exercised, the premium is added to the proceeds from the sale of the underlying security in determining whether each Fund has a realized gain or loss. If a put option is exercised, the premium reduces the cost basis of the securities purchased by each Fund. Each Fund, as writer of an option, bears the market risk of an unfavorable change in the price of the security underlying the written option. When writing options, each Fund is subject to minimal counterparty risk because the counterparty is only obligated to pay premiums and does not bear the market risk of an unfavorable market change.
95
Notes to financial statements
Delaware Corporate Bond Fund and Delaware Extended Duration Bond Fund
8. Derivatives (continued)
Transactions in written options during the year ended July 31, 2011 for each Fund were as follows:
| | | Delaware | | Delaware |
| | | Corporate | | Extended Duration |
| | | Bond Fund | | Bond Fund |
| | | Number of | | | | | Number of | | | |
| | | contracts | | Premiums | | contracts | | Premiums |
| Options outstanding at July 31, 2010 | | — | | $ | — | | — | | $ | — |
| Options written | | 34 | | | 22,887 | | 17 | | | 11,643 |
| Options terminated in closing | | | | | | | | | | |
| purchase transactions | | — | | | — | | — | | | — |
| Options outstanding at July 31, 2011 | | 34 | | $ | 22,887 | | 17 | | $ | 11,643 |
Swap Contracts — Each Fund enters into index swap contracts, inflation swap contracts and CDS contracts in the normal course of pursuing its investment objective. The Funds may also use index swaps as a substitute for futures or options contracts if such contracts are not directly available to the Funds on favorable terms. The Funds may use inflation swaps to hedge the inflation risk in nominal bonds, thereby creating synthetic inflation-indexed bonds. The Funds may enter into CDS contracts in order to hedge against a credit event, to enhance total return or to gain exposure to certain securities or markets.
Index Swaps. Index swaps involve commitments to pay interest in exchange for a market linked return based on a notional amount. To the extent the total return of the security, instrument or basket of instruments underlying the transaction exceeds the offsetting interest obligation, the Funds will receive a payment from the counterparty. To the extent the total return of the security, instrument or basket of instruments underlying the transaction falls short of the offsetting interest obligation, the Funds will make a payment to the counterparty. The change in value of swap contracts outstanding, if any, is recorded as unrealized appreciation or depreciation daily. A realized gain or loss is recorded on maturity or termination of the swap contract. The Funds’ maximum risk of loss from counterparty credit risk is the discounted net value of the cash flows to be received from/paid to the counterparty over the index swap contract’s remaining life, to the extent that the amount is positive. This risk is mitigated by having a netting arrangement between the Funds and the counterparty and by the posting of collateral by the counterparty to the Funds to cover the Funds’ exposure to the counterparty.
Inflations swaps. Inflation swap agreements involve commitments to pay a regular stream of inflation-indexed cash payments in exchange for receiving a stream of nominal interest payments (or vice versa), where both payment streams are based on notional amounts. The nominal interest payments may be based on either a fixed interest rate or variable interest rate such as London Interbank Offered Rate (LIBOR). The change in value of swap contracts outstanding, if any, is recorded as unrealized appreciation or depreciation daily. A realized gain or loss is recorded on maturity or termination of the swap contract. The Funds’ maximum risk of loss from
96
counterparty credit risk is the discounted net value of the cash flows to be received from/paid to the counterparty over the index swap contract’s remaining life, to the extent that the amount is positive. This risk is mitigated by having a netting arrangement between the Funds and the counterparty and by the posting of collateral by the counterparty to the Funds to cover the Funds’ exposure to the counterparty.
Credit Default Swaps. A CDS contract is a risk-transfer instrument through which one party (purchaser of protection) transfers to another party (seller of protection) the financial risk of a credit event (as defined in the CDS agreement), as it relates to a particular reference security or basket of securities (such as an index). In exchange for the protection offered by the seller of protection, the purchaser of protection agrees to pay the seller of protection a periodic amount at a stated rate that is applied to the notional amount of the CDS contract. In addition, an upfront payment may be made or received by the Funds in connection with an unwinding or assignment of a CDS contract. Upon the occurrence of a credit event, the seller of protection would pay the par (or other agreed-upon) value of the reference security (or basket of securities) to the counterparty. Credit events generally include, among others, bankruptcy, failure to pay, and obligation default.
During the year ended July 31, 2011, the Funds entered into CDS contracts as a purchaser and seller of protection. Periodic payments (receipts) on such contracts are accrued daily and recorded as unrealized losses (gains) on swap contracts. Upon payment (receipt), such amounts are recorded as realized losses (gains) on swap contracts. Upfront payments made or received in connection with CDS contracts are amortized over the expected life of the CDS contracts as unrealized losses (gains) on swap contracts. The change in value of CDS contracts is recorded as unrealized appreciation or depreciation daily. A realized gain or loss is recorded upon a credit event (as defined in the CDS agreement) or the maturity or termination of the agreement. At July 31, 2011, the net unrealized appreciation of CDS contracts for each Fund was as follows:
| | | Delaware | | Delaware |
| | | Corporate | | Extended Duration |
| | | Bond Fund | | Bond Fund |
| | | $1,853,901 | | $798,373 |
The Funds had posted cash collateral for open swap contracts as follows:
| | | Delaware | | Delaware |
| | | Corporate | | Extended Duration |
| | | Bond Fund | | Bond Fund |
| Cash | | $170,000 | | $110,000 |
97
Notes to financial statements
Delaware Corporate Bond Fund and Delaware Extended Duration Bond Fund
8. Derivatives (continued)
If a credit event had occurred for all swap transactions where collateral posting was required as of July 31, 2011, the swaps’ credit-risk-related contingent features would have been triggered and the Funds would have received $41,959,000 and $18,388,000, respectively, less the value of the contracts’ related reference obligations. The Funds received collateral for open swap contracts as follows:
| | | Delaware | | Delaware |
| | | Corporate | | Extended Duration |
| | | Bond Fund | | Bond Fund |
| Cash | | $ | 510,000 | | $ | 310,000 |
| Securities | | | 4,786,000 | | | 2,108,000 |
As disclosed in the footnotes to the statements of net assets, at July 31, 2011, the notional value of the protection sold for each Fund was as follows:
| | Delaware | | Delaware |
| | Corporate | | Extended Duration |
| | Bond Fund | | Bond Fund |
| | $6,600,000 | | $3,330,000 |
This reflects the maximum potential amount the Funds would have been required to make as a seller of credit protection if a credit event had occurred. The quoted market prices and resulting market values for credit default swap agreements on securities and credit indices serve as an indicator of the current status of the payment/performance risk and represent the likelihood of an expected liability (or profit) for the credit derivative if the swap agreement has been closed/sold as of the period end. Increasing market values, in absolute terms when compared to the notional amount of the swap, represent a deterioration of the reference entity’s credit soundness and a greater likelihood of risk of default or other credit event occurring as defined under the terms of the agreement. At July 31, 2011, the net unrealized appreciation of the protection sold for each Fund was as follows:
| | Delaware | | Delaware |
| | Corporate | | Extended Duration |
| | Bond Fund | | Bond Fund |
| | $171,570 | | $93,875 |
CDS contracts may involve greater risks than if the Funds had invested in the reference obligation directly. CDS contracts are subject to general market risk, liquidity risk, counterparty risk and credit risk. The Funds’ maximum risk of loss from counterparty credit risk, either as the seller of protection or the buyer of protection, is the fair value of the contract. This risk is mitigated by having a netting arrangement between the Funds and the counterparty and by the posting of collateral by the counterparty to the Funds to cover the Fund’s exposure to the counterparty.
98
Swaps Generally. Because there is no organized market for swap contracts, the value of open swaps may differ from that which would be realized in the event each Fund terminated its position in the agreement. Risks of entering into these contracts include the potential inability of the counterparty to meet the terms of the contracts. This type of risk is generally limited to the amount of favorable movement in the value of the underlying security, instrument or basket of instruments, if any, at the day of default. Risks also arise from potential losses from adverse market movements and such losses could exceed the unrealized amounts shown on the statements of net assets.
Fair values of derivative instruments as of July 31, 2011 was as follows:
| | | Delaware Corporate Bond Fund |
| | | Asset Derivatives | | Liability Derivatives |
| | | Statement of Net | | | | | Statement of Net | | | | |
| | | Assets Location | | Fair Value | | Assets Location | | Fair Value |
| | | | | | | | | | | | |
Forward currency exchange contracts
(Foreign currency exchange contracts) | | Receivables and other assets net of other liabilities | | $ | 166,992 | |
Receivables and other assets net of other liabilities | | $ | (924 | ) |
Interest rate contracts
(Futures contracts) | | Receivables and other assets net of other liabilities | | | — | |
Receivables and other assets net of other liabilities | | | (711,587 | ) |
Equity contracts (Written options) | |
Written options, at value | | | — | |
Written options, at value | | | (40,800 | ) |
Interest rate and credit contracts
(Swap contracts) | | Receivables and other assets net of other liabilities | | | 2,023,143 | |
Receivables and other assets net of other liabilities | | | — | |
| Total | | | | $ | 2,190,135 | | | | $ | (753,311 | ) |
99
Notes to financial statements
Delaware Corporate Bond Fund and Delaware Extended Duration Bond Fund
8. Derivatives (continued)
| | | Delaware Extended Duration Bond Fund | |
| | | Asset Derivatives | | Liability Derivatives |
| | | Statement of Net | | | | | Statement of Net | | | | |
| | | Assets Location | | Fair Value | | Assets Location | | Fair Value |
Forward currency exchange contracts (Foreign currency exchange contracts) | | Receivables and other assets net of other liabilities | | $ | 69,662 | | Receivables and other assets net of other liabilities | | $ | (347 | ) |
Interest rate contracts (Futures contracts) | | Receivables and other assets net of other liabilities | | | 1,340,345 | | Receivables and other assets net of other liabilities | | | — | |
Equity contracts (Written options) | | Written options, at value | | | — | | Written options, at value | | | (20,400 | ) |
Interest and credit contracts (Swap contracts) | | Receivables and other assets net of other liabilities | | | 873,927 | | Receivables and other assets net of other liabilities | | | — | |
| Total | | | | $ | 2,283,934 | | | | $ | (20,747 | ) |
100
The effect of derivative instruments on the statements of operations for the year ended July 31, 2011 was as follows:
| | | Delaware Corporate Bond Fund |
| | | | | Realized Gain | | Change in Unrealized |
| | | | | or Loss on | | Appreciation |
| | | | | Derivatives | | or Depreciation |
| | | Location of Gain or Loss on | | Recognized in | | on Derivatives |
| | | Derivatives Recognized in Income | | Income | | Recognized in Income |
Forward currency exchange contracts (Foreign currency exchange contracts) | | Net realized loss on foreign currency exchange contracts and net change in unrealized appreciation/depreciation of investments and foreign currencies | | $ | (90,785 | ) | | | $ | 95,383 | |
Interest rate contracts (Futures contracts) | | Net realized loss on futures contracts and net change in unrealized appreciation/depreciation of investments and foreign currencies | | | (5,658,446 | ) | | | | (2,122,156 | ) |
Equity contracts (Written options) | | Net realized gain on written options and net change in unrealized appreciation/depreciation of investments and foreign currencies | | | — | | | | | (17,913 | ) |
Credit contracts (Swap contracts) | | Net realized gain on swap contracts and net change in unrealized appreciation/depreciation of investments and foreign currencies | | | 2,202 | | | | | 2,606,997 | |
| Total | | | | $ | (5,747,029 | ) | | | $ | 562,311 | |
101
Notes to financial statements
Delaware Corporate Bond Fund and Delaware Extended Duration Bond Fund
8. Derivatives (continued)
| | | Delaware Extended Duration Bond Fund |
| | | | | Realized Gain | | Change in Unrealized |
| | | | | or Loss on | | Appreciation |
| | | | | Derivatives | | or Depreciation |
| | | Location of Gain or Loss on | | Recognized in | | on Derivatives |
| | | Derivatives Recognized in Income | | Income | | Recognized in Income |
Forward currency exchange contracts (Foreign currency exchange contracts) | | Net realized loss on foreign currency exchange contracts and net change in unrealized appreciation/depreciation of investments and foreign currencies | | $ | (53,591 | ) | | | $ | 41,726 | |
Interest rate contracts (Futures contracts) | | Net realized gain on futures contracts and net change in unrealized appreciation/depreciation of investments and foreign currencies | | | 1,157,315 | | | | | (777,952 | ) |
Equity contracts (Written options) | | Net realized gain on written options and net change in unrealized appreciation/depreciation of investments and foreign currencies | | | — | | | | | (8,757 | ) |
Credit contracts (Swap contracts) | | Net realized loss on swap contracts and net change in unrealized appreciation/depreciation of investments and foreign currencies | | | (112,794 | ) | | | | 1,117,408 | |
| Total | | | | $ | 990,930 | | | | $ | 372,425 | |
The volume of derivative transactions varies throughout the period. Information about derivative transactions reflected is as of the date of this report, and generally similar to the volume of derivative activity for the year ended July 31, 2011.
102
9. Securities Lending
Each Fund, along with other funds in the Delaware Investments® Family of Funds, may lend its securities pursuant to a security lending agreement (Lending Agreement) with The Bank of New York Mellon (BNY Mellon). At the time a security is loaned, the borrower must post collateral equal to the required percentage of the market value of the loaned security, including any accrued interest. The required percentage is: (i) 102% with respect to U.S. securities and foreign securities that are denominated and payable in U.S. dollars; and (ii) 105% with respect to foreign securities. With respect to each loan, if on any business day the aggregate market value of securities collateral plus cash collateral held is less than the aggregate market value of the securities which are the subject of such loan, the borrower will be notified to provide additional collateral by the end of the following business day which, together with the collateral already held, will be not less than the applicable initial collateral requirements for such security loan. If the aggregate market value of securities collateral and cash collateral held with respect to a security loan exceeds the applicable initial collateral requirement, upon request of the borrower BNY Mellon must return enough collateral to the borrower by the end of the following business day to reduce the value of the remaining initial collateral to the applicable collateral requirement for such security loan. As a result of the foregoing, the value of the collateral held with respect to a loaned security may be temporarily more or less than the value of the security on loan.
Cash collateral received is generally invested in the Delaware Investments Collateral Fund No. 1 (Collective Trust) established by BNY Mellon for the purpose of investment on behalf of funds managed by DMC, that participate in BNY Mellon’s securities lending program. The Collective Trust may invest in U.S. government securities and high quality corporate debt, asset-backed and other money market securities and in repurchase agreements collateralized by such securities, provided that the Collective Trust will generally have a dollar-weighted average portfolio maturity of 60 days or less. The Collective Trust seeks to maintain a net asset value per unit of $1.00, but there can be no assurance that it will always be able to do so. The Funds may incur investment losses as a result of investing securities lending collateral in the Collective Trust or another collateral investment pool. This could occur if an investment in a collateral investment pool defaulted or if it were necessary to liquidate assets in the collateral investment pool to meet returns on outstanding security loans at a time when the collateral investment pool’s net asset value per unit was less than $1.00. Under those circumstances, the Funds may not receive an amount from the collateral investment pool that is equal in amount to the collateral the Funds would be required to return to the borrower of the securities and the Funds would be required to make up for this shortfall. Effective April 20, 2009, BNY Mellon transferred the assets of the Fund’s previous collateral investment pool other than cash and assets with a maturity of one business day or less to the BNY Mellon SL DBT II Liquidating Fund (Liquidating Fund), effectively bifurcating the previous collateral investment pool. The Funds’ exposure to the Liquidating Fund is expected to decrease as the Liquidating Fund’s assets mature or are sold. In October 2008, BNY Mellon transferred certain distressed securities from the previous collateral investment pool into the Mellon GSL Reinvestment Trust II. The Funds can also accept U.S. government securities and letters of credit (non-cash collateral) in connection with securities loans. In the event of default
103
Notes to financial statements
Delaware Corporate Bond Fund and Delaware Extended Duration Bond Fund
9. Securities Lending (continued)
or bankruptcy by the lending agent, realization and/or retention of the collateral may be subject to legal proceedings. In the event the borrower fails to return loaned securities and the collateral received is insufficient to cover the value of the loaned securities and provided such collateral shortfall is not the result of investment losses, the lending agent has agreed to pay the amount of the shortfall to the Funds, or at the discretion of the lending agent, replace the loaned securities. The Funds continue to record dividends or interest, as applicable, on the securities loaned and are subject to change in value of the securities loaned that may occur during the term of the loan. The Funds have the right under the Lending Agreement to recover the securities from the borrower on demand. With respect to security loans collateralized by non-cash collateral, the Funds receive loan premiums paid by the borrower. With respect to security loans collateralized by cash collateral, the earnings from the collateral investments are shared among the Funds, the security lending agent and the borrower. The Funds record security lending income net of allocations to the security lending agent and the borrower.
At July 31, 2011, the values of securities on loan and the values of invested collateral for each Fund is presented below, for which the Funds received collateral, comprised of non-cash collateral and cash collateral. Investments purchased with cash collateral are presented on the statements of net assets under the caption “Securities Lending Collateral.”
| | | Delaware | | Delaware |
| | | Corporate | | Extended Duration |
| | | Bond Fund | | Bond Fund |
| Values of securities on loan | | $ | 48,364,704 | | | $ | 49,430,806 | |
| Values of invested collateral | | | 54,372,638 | | | | 50,617,267 | |
| Cash collateral | | | 54,606,317 | | | | 50,715,393 | |
| Non-cash collateral | | | 710,030 | | | | 1,195,303 | |
10. Credit and Market Risk
Some countries in which the Funds may invest require governmental approval for the repatriation of investment income, capital or the proceeds of sales of securities by foreign investors. In addition, if there is deterioration in a country’s balance of payments or for other reasons, a country may impose temporary restrictions on foreign capital remittances abroad.
The securities exchanges of certain foreign markets are substantially smaller, less liquid and more volatile than the major securities markets in the United States. Consequently, acquisition and disposition of securities by the Funds may be inhibited. In addition, a significant portion of the aggregate market value of equity securities listed on the major securities exchanges in emerging markets are held by a smaller number of investors. This may limit the number of shares available for acquisition or disposition by the Funds.
Each Fund may invest a portion of its assets in high yield fixed income securities, which are securities rated lower than BBB- by Standard & Poor’s and Baa3 by Moody’s Investor Services, or similarly rated by another nationally recognized statistical rating organization. Investments in
104
these higher yielding securities are generally accompanied by a greater degree of credit risk than higher rated securities. Additionally, lower rated securities may be more susceptible to adverse economic and competitive industry conditions than investment-grade securities.
Each Fund invests in fixed income securities whose value is derived from an underlying pool of mortgages or consumer loans. The value of these securities is sensitive to changes in economic conditions, including delinquencies and/or defaults, and may be adversely affected by shifts in the market’s perception of the issuers and changes in interest rates. Investors receive principal and interest payments as the underlying mortgages or consumer loans are paid back. Some of these securities are collateralized mortgage obligations (CMOs). CMOs are debt securities issued by U.S. government agencies or by financial institutions and other mortgage lenders, which are collateralized by a pool of mortgages held under an indenture. Prepayment of mortgages may shorten the stated maturity of the obligations and can result in a loss of premium, if any has been paid. Certain of these securities may be stripped (securities which provide only the principal or interest feature of the underlying security). The yield to maturity on an interest-only CMO is extremely sensitive not only to changes in prevailing interest rates, but also to the rate of principal payments (including prepayments) on the related underlying mortgage assets. A rapid rate of principal payments may have a material adverse effect on each Fund’s yield to maturity. If the underlying mortgage assets experience greater than anticipated prepayments of principal, each Fund may fail to fully recoup its initial investment in these securities even if the securities are rated in the highest rating categories.
Each Fund may invest up to 15% of its net assets in illiquid securities, which may include securities with contractual restrictions on resale, securities exempt from registration under Rule 144A of the Securities Act of 1933, as amended, and other securities which may not be readily marketable. The relative illiquidity of these securities may impair each Fund from disposing of them in a timely manner and at a fair price when it is necessary or desirable to do so. While maintaining oversight, the Funds’ Board has delegated to DMC, the day-to-day functions of determining whether individual securities are liquid for purposes of the Funds’ limitation on investments in illiquid securities. Securities eligible for resale pursuant to Rule 144A, which are determined to be liquid, are not subject to the Funds’ 15% limit on investments in illiquid securities. Rule 144A and illiquid securities have been identified on the statements of net assets.
11. Contractual Obligations
The Funds enter into contracts in the normal course of business that contain a variety of indemnifications. The Funds’ maximum exposure under these arrangements is unknown. However, the Funds have not had prior claims or losses pursuant to these contracts. Management has reviewed the Funds’ existing contracts and expects the risk of loss to be remote.
12. Subsequent Events
Management has determined that no material events or transactions occurred subsequent to July 31, 2011 that would require recognition or disclosure in the Funds’ financial statements.
105
Notes to financial statements
Delaware Corporate Bond Fund and Delaware Extended Duration Bond Fund
13. Tax Information (Unaudited)
The information set forth below is for each Fund’s fiscal year as required by federal income tax laws. Shareholders, however, must report distributions on a calendar year basis for income tax purposes, which may include distributions for portions of two fiscal years of a fund. Accordingly, the information needed by shareholders for income tax purposes will be sent to them in January of each year. Please consult your tax advisor for proper treatment of this information.
All designations are based on financial information available as of the date of this annual report, and accordingly, are subject to change. For any and all items requiring designation, it is the intention of the Fund to designate the maximum amount permitted under the Internal Revenue Code and the regulations thereunder.
For the fiscal year ended July 31, 2011, each Fund designates distributions paid during the year as follows:
| | | (A) | | (B) | | | | |
| | | Long-Term | | Ordinary | | | | |
| | | Capital Gain | | Income | | Total | | (C) |
| | | Distributions | | Distributions* | | Distributions | | Qualifying |
| | | (Tax Basis)* | | (Tax Basis) | | (Tax Basis) | | Dividends1 |
| Delaware Corporate Bond Fund | | | 7.59 | % | | | 92.41% | | 100.00% | | 0.66% |
| Delaware Extended Duration Bond Fund | | | 22.76 | % | | | 77.24% | | 100.00% | | 0.81% |
A and (B) are based on a percentage of each Fund’s total distributions.
(C) is based on a percentage of each Fund’s ordinary income distributions.
1Qualifying dividends represent dividends which qualify for the corporate dividends received deduction.
*For the fiscal year ended July 31, 2011, certain dividends paid by the Funds may be subject to a maximum tax rate of 15%, as provided for by the Jobs and Growth Tax Relief Reconciliation Act of 2003. The Funds intend to designate the following up to a maximum amount as listed below to be taxed at a maximum rate of 15%. Complete information will be computed and reported in conjunction with your 2011 Form 1099-DIV.
| | Delaware | | Delaware |
| | Corporate | | Extended Duration |
| | Bond Fund | | Bond Fund |
| | $ 585,800 | | $ 262,790 |
For the fiscal year ended July 31, 2011, certain interest income paid by the Funds, determined to be Qualified Interest Income and Qualified Short-Term Capital Gains, may be subject to relief from U.S. withholding for foreign shareholders, as provided by the American Jobs Creation Act of 2004 and as extended by Tax Relief, Unemployment Insurance Reauthorization and Jobs Creation Act of 2010. For the fiscal year ended July 31, 2011, the Funds have designated maximum Qualified Interest Income and Qualified Short-Term Capital Gains, distributions as follows:
| | | Delaware | | Delaware |
| | | Corporate | | Extended Duration |
| | | Bond Fund | | Bond Fund |
| | | $ 38,706,661 | | $ 10,289,170 |
106
Report of independent
registered public accounting firm
To the Board of Trustees of Delaware Group® Income Funds and the
Shareholders of Delaware Corporate Bond Fund and Delaware Extended Duration Bond Fund:
In our opinion, the accompanying statements of net assets and the related statements of operations and of changes in net assets and the financial highlights present fairly, in all material respects, the financial position of Delaware Corporate Bond Fund and Delaware Extended Duration Bond Fund (two of the series constituting Delaware Group Income Funds, hereafter referred to as the “Funds”) at July 31, 2011, the results of each of their operations for the year then ended and the changes in each of their net assets and the financial highlights of each of the two years in the period then ended, in conformity with accounting principles generally accepted in the United States of America. These financial statements and financial highlights (hereafter referred to as “financial statements”) are the responsibility of the Funds’ management; our responsibility is to express an opinion on these financial statements based on our audits. We conducted our audits of these financial statements in accordance with the standards of the Public Company Accounting Oversight Board (United States). Those standards require that we plan and perform the audit to obtain reasonable assurance about whether the financial statements are free of material misstatement. An audit includes examining, on a test basis, evidence supporting the amounts and disclosures in the financial statements, assessing the accounting principles used and significant estimates made by management, and evaluating the overall financial statement presentation. We believe that our audits, which included confirmation of securities at July 31, 2011 by correspondence with the custodian and brokers, provide a reasonable basis for our opinion. The financial highlights for each of the three years in the period ended July 31, 2009 were audited by other independent accountants whose report dated September 21, 2009 expressed an unqualified opinion on those statements.
PricewaterhouseCoopers LLP
Philadelphia, Pennsylvania
September 28, 2011
107
Other Fund information
(Unaudited)
Delaware Corporate Bond Fund and Delaware Extended Duration Bond Fund
Change in Independent Registered Public Accounting Firm
Due to independence matters under the Securities and Exchange Commission’s auditor independence rules relating to the January 4, 2010 acquisition of Delaware Investments (including DMC, DDLP and DSC) by Macquarie Group, Ernst & Young LLP (E&Y) has resigned as the independent registered public accounting firm for Delaware Group® Income Funds (the Trust) effective May 20, 2010. At a meeting held on May 20, 2010, the Board of Trustees of the Trust upon recommendation of the Audit Committee, selected PricewaterhouseCoopers LLP (PwC) to serve as the independent registered public accounting firm for the Trust for the fiscal year ended July 31, 2010. During the fiscal years ended July 31, 2009 and 2008, E&Y’s audit reports on the financial statements of the Trust did not contain any adverse opinion or disclaimer of opinion, nor were they qualified or modified as to uncertainty, audit scope, or accounting principles. In addition, there were no disagreements between the Trust and E&Y on accounting principles, financial statements disclosures or audit scope, which, if not resolved to the satisfaction of E&Y, would have caused them to make reference to the disagreement in their reports. Neither the Trust nor anyone on its behalf has consulted with PwC at any time prior to their selection with respect to the application of accounting principles to a specified transaction, either completed or proposed or the type of audit opinion that might be rendered on the Trust’s financial statements.
108
Board of trustees/directors and officers addendum
Delaware Investments® Family of Funds
A mutual fund is governed by a Board of Trustees/Directors (“Trustees”), which has oversight responsibility for the management of a fund’s business affairs. Trustees establish procedures and oversee and review the performance of the investment manager, the distributor, and others who perform services for the fund. The independent fund trustees, in particular, are advocates
| Name, Address, | | Position(s) | | Length of |
| and Birth Date | | Held with Fund(s) | | Time Served |
| Interested Trustees | | | | |
| | | | | |
| Patrick P. Coyne1 | | Chairman, President, | | Chairman and Trustee |
| 2005 Market Street | | Chief Executive Officer, | | since August 16, 2006 |
| Philadelphia, PA 19103 | | and Trustee | | |
| April 1963 | | | | President and |
| | | | | Chief Executive Officer |
| | | | | since August 1, 2006 |
| | | | | |
| | | | | |
| | | | | |
| | | | | |
| | | | | |
| | | | | |
| | | | | |
| | | | | |
| | | | | |
| | | | | |
| | | | | |
| | | | | |
| | | | | |
| | | | | |
| | | | | |
| | | | | |
| | | | | |
| | | | | |
1 Patrick P. Coyne is considered to be an “Interested Trustee” because he is an executive officer of the Fund’s(s’) investment advisor.
110
for shareholder interests. Each trustee has served in that capacity since he or she was elected to or appointed to the Board of Trustees, and will continue to serve until his or her retirement or the election of a new trustee in his or her place. The following is a list of the Trustees and Officers with certain background and related information.
| | | Number of Portfolios in | | |
| Principal Occupation(s) | | Fund Complex Overseen | | Other Directorships |
| During Past 5 Years | | by Trustee or Officer | | Held by Trustee or Officer |
| |
| |
| Patrick P. Coyne has served in | | 75 | | Director and Audit |
| various executive capacities | | | | Committee Member |
| at different times at | | | | Kaydon Corp. |
| Delaware Investments.2 | | | | |
| | | | | Board of Governors Member |
| | | | | Investment Company |
| | | | | Institute (ICI) |
| | | | | |
| | | | | Finance Committee Member |
| | | | | St. John Vianney Roman |
| | | | | Catholic Church |
| |
| | | | | Board of Trustees |
| | | | | Agnes Irwin School |
| |
| | | | | Member of Investment |
| | | | | Committee |
| | | | | Cradle of Liberty Council, |
| | | | | BSA |
| | | | | (2007–2010) |
| | | | | |
| |
| | | | | |
| | | | | |
| |
2 Delaware Investments is the marketing name for Delaware Management Holdings, Inc. and its subsidiaries, including the Fund’s(s’) investment advisor, principal underwriter, and its transfer agent.
111
Board of trustees/directors and officers addendum
Delaware Investments® Family of Funds
| Name, Address, | | Position(s) | | Length of |
| and Birth Date | | Held with Fund(s) | | Time Served |
| Independent Trustees | | | | |
| |
| Thomas L. Bennett | | Trustee | | Since March 2005 |
| 2005 Market Street | | | | |
| Philadelphia, PA 19103 | | | | |
| October 1947 | | | | |
| |
| |
| |
| |
| |
| |
| |
| |
| |
| |
| |
| John A. Fry | | Trustee | | Since January 2001 |
| 2005 Market Street | | | | |
| Philadelphia, PA 19103 | | | | |
| May 1960 | | | | |
| |
| |
| |
| |
| |
| |
| |
| |
| |
| |
| |
| Anthony D. Knerr | | Trustee | | Since April 1990 |
| 2005 Market Street | | | | |
| Philadelphia, PA 19103 | | | | |
| December 1938 | | | | |
| |
| Lucinda S. Landreth | | Trustee | | Since March 2005 |
| 2005 Market Street | | | | |
| Philadelphia, PA 19103 | | | | |
| June 1947 | | | | |
| |
112
| | | Number of Portfolios in | | |
| Principal Occupation(s) | | Fund Complex Overseen | | Other Directorships |
| During Past 5 Years | | by Trustee or Officer | | Held by Trustee or Officer |
| | | | | |
| |
| Private Investor | | 75 | | Chairman of Investment |
| (March 2004–Present) | | | | Committee |
| | | | | Pennsylvania Academy of |
| Investment Manager | | | | Fine Arts |
| Morgan Stanley & Co. | | | | |
| (January 1984–March 2004) | | | | Investment Committee and |
| | | | | Governance Committee |
| | | | | Member |
| | | | | Pennsylvania Horticultural |
| | | | | Society |
| | | | | |
| | | | | Director |
| | | | | Bryn Mawr Bank Corp. (BMTC) |
| | | | | (2007–2011) |
| |
| President | | 75 | | Board of Governors Member — |
| Drexel University | | | | NASDAQ OMX PHLX LLC |
| (August 2010–Present) | | | | |
| | | | | Director and Audit |
| President | | | | Committee Member |
| Franklin & Marshall College | | | | Community Health Systems |
| (July 2002–July 2010) | | | | |
| | | | | Director — Ecore |
| | | | | International |
| | | | | (2009–2010) |
| | | | | |
| | | | | Director — Allied |
| | | | | Barton Securities Holdings |
| | | | | (2005–2008) |
| |
| Managing Director | | 75 | | None |
| Anthony Knerr & Associates | | | | |
| (Strategic Consulting) | | | | |
| (1990–Present) | | | | |
| |
| Chief Investment Officer | | 75 | | None |
| Assurant, Inc. (Insurance) | | | | |
| (2002–2004) | | | | |
| | | | | |
| |
113
Board of trustees/directors and officers addendum
Delaware Investments® Family of Funds
| Name, Address, | | Position(s) | | Length of |
| and Birth Date | | Held with Fund(s) | | Time Served |
| Independent Trustees (continued) | | | | |
| |
| Ann R. Leven | | Trustee | | Since October 1989 |
| 2005 Market Street | | | | |
| Philadelphia, PA 19103 | | | | |
| November 1940 | | | | |
| |
| |
| |
| |
| |
| |
| Frances A. Sevilla-Sacasa | | Trustee | | Since September 2011 |
| 2005 Market Street | | | | |
| Philadelphia, PA 19103 | | | | |
| January 1956 | | | | |
| |
| |
| |
| |
| |
| |
| |
| |
| | | | | |
| | | | | |
| | | | | |
| | | | | |
| |
| |
| |
| | | | | |
| | | | | |
| | | | | |
| | | | | |
| | | | | |
| | | | | |
| | | | | |
| | | | | |
| | | | | |
| |
114
| | | Number of Portfolios in | | |
| Principal Occupation(s) | | Fund Complex Overseen | | Other Directorships |
| During Past 5 Years | | by Trustee or Officer | | Held by Trustee or Officer |
| | | | | |
| |
| Consultant | | 75 | | Director and Audit |
| ARL Associates | | | | Committee Chair |
| (Financial Planning) | | | | Systemax Inc. |
| (1983–Present) | | | | (2001–2009) |
| | | | | |
| | | | | Director and Audit |
| | | | | Committee Chairperson |
| | | | | Andy Warhol Foundation |
| | | | | (1999–2007) |
| |
| Executive Advisor to Dean | | 75 | | Trust Manager — Camden |
| (since August 2011) and | | | | Property Trust |
| Interim Dean | | | | (since August 2011) |
| (January 2011–July 2011) — | | | | |
| University of Miami School of | | | | Board of Trustees |
| Business Administration | | | | Thunderbird School of |
| | | | | Global Management |
| President — U.S. Trust, | | | | (2007–2011) |
| Bank of America Private | | | | |
| Wealth Management | | | | Board of Trustees |
| (Private Banking) | | | | Carrollton School of the |
| (July 2007–December 2008) | | | | Sacred Heart |
| | | | | (since 2007) |
| President and Director | | | | |
| (November 2005–June 2007) and | | | | Board Member |
| Chief Executive Officer | | | | Foreign Policy Association |
| (April 2007–June 2007) — | | | | (since 2006) |
| U.S. Trust Company | | | | |
| (Private Banking) | | | | Board of Trustees |
| | | | | Georgetown Preparatory School |
| | | | | (2005–2011) |
| | | | | |
| | | | | Board of Trustees |
| | | | | Miami City Ballet |
| | | | | (2000–2011) |
| | | | | |
| | | | | Board of Trustees |
| | | | | St. Thomas University |
| | | | | (2005–2011) |
| |
115
Board of trustees/directors and officers addendum
Delaware Investments® Family of Funds
| Name, Address, | | Position(s) | | Length of |
| and Birth Date | | Held with Fund(s) | | Time Served |
| Independent Trustees (continued) | | | | |
| | | | | |
| Janet L. Yeomans | | Trustee | | Since April 1999 |
| 2005 Market Street | | | | |
| Philadelphia, PA 19103 | | | | |
| July 1948 | | | | |
| |
| |
| |
| |
| J. Richard Zecher | | Trustee | | Since March 2005 |
| 2005 Market Street | | | | |
| Philadelphia, PA 19103 | | | | |
| July 1940 | | | | |
| |
| |
| | | | | |
| | | | | |
| | | | | |
| | | | | |
| | | | | |
| | | | | |
| | | | | |
| | | | | |
| | | | | |
| | | | | |
| | | | | |
| | | | | |
| | | | | |
| | | | | |
| |
116
| | | Number of Portfolios in | | |
| Principal Occupation(s) | | Fund Complex Overseen | | Other Directorships |
| During Past 5 Years | | by Trustee or Officer | | Held by Trustee or Officer |
| | | | | |
| | | | | |
| Vice President and Treasurer | | 75 | | Director and Audit |
| (January 2006–Present) | | | | Committee Member |
| Vice President — Mergers & Acquisitions | | | | Okabena Company |
| (January 2003–January 2006), and | | | | |
| Vice President and Treasurer | | | | Chair — 3M |
| (July 1995–January 2003) | | | | Investment Management |
| 3M Corporation | | | | Company |
| |
| Founder | | 75 | | Director and Audit |
| Investor Analytics | | | | Committee Member |
| (Risk Management) | | | | Investor Analytics |
| (May 1999–Present) | | | | |
| | | | | |
| Founder | | | | Director |
| Sutton Asset Management | | | | Oxigene, Inc. |
| (Hedge Fund) | | | | (2003–2008) |
| (September 1996–Present) | | | | |
| | | | | |
| | | | | |
| | | | | |
| | | | | |
| | | | | |
| | | | | |
| | | | | |
| | | | | |
| | | | | |
| | | | | |
| | | | | |
| |
117
Board of trustees/directors and officers addendum
Delaware Investments® Family of Funds
| Name, Address, | | Position(s) | | Length of |
| and Birth Date | | Held with Fund(s) | | Time Served |
| Officers | | | | |
| | | | | |
| David F. Connor | | Vice President, | | Vice President since |
| 2005 Market Street | | Deputy General | | September 2000 |
| Philadelphia, PA 19103 | | Counsel, and Secretary | | and Secretary since |
| December 1963 | | | | October 2005 |
| |
| |
| Daniel V. Geatens | | Vice President | | Treasurer |
| 2005 Market Street | | and Treasurer | | since October 2007 |
| Philadelphia, PA 19103 | | | | |
| October 1972 | | | | |
| |
| David P. O’Connor | | Senior Vice President, | | Senior Vice President, |
| 2005 Market Street | | General Counsel, | | General Counsel, and |
| Philadelphia, PA 19103 | | and Chief Legal Officer | | Chief Legal Officer |
| February 1966 | | | | since October 2005 |
| |
| Richard Salus | | Senior Vice President | | Chief Financial Officer |
| 2005 Market Street | | and Chief Financial Officer | | since November 2006 |
| Philadelphia, PA 19103 | | | | |
| October 1963 | | | | |
| |
The Statement of Additional Information for the Fund(s) includes additional information about the Trustees and Officers and is available, without charge, upon request by calling 800 523-1918.
118
| | | Number of Portfolios in | | |
| Principal Occupation(s) | | Fund Complex Overseen | | Other Directorships |
| During Past 5 Years | | by Trustee or Officer | | Held by Trustee or Officer |
| |
| |
| David F. Connor has served as | | 75 | | None3 |
| Vice President and Deputy | | | | |
| General Counsel of | | | | |
| Delaware Investments | | | | |
| since 2000. | | | | |
| |
| Daniel V. Geatens has served | | 75 | | None3 |
| in various capacities at | | | | |
| different times at | | | | |
| Delaware Investments. | | | | |
| |
| David P. O’Connor has served in | | 75 | | None3 |
| various executive and legal | | | | |
| capacities at different times | | | | |
| at Delaware Investments. | | | | |
| |
| Richard Salus has served in | | 75 | | None3 |
| various executive capacities | | | | |
| at different times at | | | | |
| Delaware Investments. | | | | |
| |
3 David F. Connor, Daniel V. Geatens, David P. O’Connor, and Richard Salus serve in similar capacities for the six portfolios of the Optimum Fund Trust, which have the same investment advisor, principal underwriter, and transfer agent as the registrant.
119
About the organization
| Board of trustees |
Patrick P. Coyne
Chairman, President, and
Chief Executive Officer
Delaware Investments®
Family of Funds
Philadelphia, PA Thomas L. Bennett
Private Investor
Rosemont, PA John A. Fry
President
Drexel University
Philadelphia, PA | Anthony D. Knerr
Founder and Managing
Director
Anthony Knerr &
Associates
New York, NY Lucinda S. Landreth
Former Chief Investment
Officer
Assurant, Inc.
Philadelphia, PA | Ann R. Leven
Consultant
ARL Associates
New York, NY Frances A. Sevilla-Sacasa
Executive Advisor to Dean, University of Miami School of Business Administration Coral Gables, FL | Janet L. Yeomans
Vice President and
Treasurer
3M Corporation
St. Paul, MN J. Richard Zecher
Founder
Investor Analytics
Scottsdale, AZ |
| | | | |
| Affiliated officers |
David F. Connor
Vice President, Deputy
General Counsel, and
Secretary
Delaware Investments
Family of Funds
Philadelphia, PA | Daniel V. Geatens
Vice President and
Treasurer
Delaware Investments
Family of Funds
Philadelphia, PA | David P. O’Connor
Senior Vice President,
General Counsel,
and Chief Legal Officer
Delaware Investments
Family of Funds
Philadelphia, PA | Richard Salus
Senior Vice President and
Chief Financial Officer
Delaware Investments
Family of Funds
Philadelphia, PA |
| This annual report is for the information of Delaware Corporate Bond Fund and Delaware Extended Duration Bond Fund shareholders, but it may be used with prospective investors when preceded or accompanied by the Delaware Investments Fund fact sheet for the most recently completed calendar quarter. These documents are available at www.delawareinvestments.com. |
Delaware Investments is the marketing name of Delaware Management Holdings, Inc. and its subsidiaries. Each Fund files its complete schedule of portfolio holdings with the Securities and Exchange Commission (SEC) for the first and third quarters of each fiscal year on Form N-Q. Each Fund’s Forms N-Q, as well as a description of the policies and procedures that each Fund uses to determine how to vote proxies (if any) relating to portfolio securities are available without charge (i) upon request, by calling 800 523-1918; and (ii) on the SEC’s website at www.sec.gov. In addition, a description of the policies and procedures that each Fund uses to determine how to vote proxies (if any) relating to portfolio securities and each Fund’s Schedule of Investments are available without charge on each Fund’s website at www.delawareinvestments.com. Each Fund’s Forms N-Q may be reviewed and copied at the SEC’s Public Reference Room in Washington, D.C.; information on the operation of the Public Reference Room may be obtained by calling 800 SEC-0330. Information (if any) regarding how each Fund voted proxies relating to portfolio securities during the most recently disclosed 12-month period ended June 30 is available without charge (i) through the Funds’ website at www.delawareinvestments.com; and (ii) on the SEC’s website at www.sec.gov. |
120
Annual report Delaware Diversified Floating Rate Fund July 31, 2011 Fixed income mutual fund |
| Carefully consider the Fund’s investment objectives, risk factors, charges, and expenses before investing. This and other information can be found in the Fund’s prospectus and, if available, its summary prospectus, which may be obtained by visiting www.delawareinvestments.com or calling 800 523-1918. Investors should read the prospectus and, if available, the summary prospectus carefully before investing. |
You can obtain shareholder reports and prospectuses online instead of in the mail.
Visit www.delawareinvestments.com/edelivery. |
Experience Delaware Investments
Delaware Investments is committed to the pursuit of consistently superior asset management and unparalleled client service. We believe in our investment processes, which seek to deliver consistent results, and in convenient services that help add value for our clients.
If you are interested in learning more about creating an investment plan, contact your financial advisor.
You can learn more about Delaware Investments or obtain a prospectus for Delaware Diversified Floating Rate Fund at www.delawareinvestments.com.
Manage your investments online
24-hour access to your account information
Obtain share prices
Check your account balance and recent transactions
Request statements or literature
Make purchases and redemptions
Delaware Management Holdings, Inc. and its subsidiaries (collectively known by the marketing name of Delaware Investments) are wholly owned subsidiaries of Macquarie Group Limited, a global provider of banking, financial, advisory, investment and funds management services.
Investments in Delaware Diversified Floating Rate Fund are not and will not be deposits with or liabilities of Macquarie Bank Limited ABN 46 008 583 542 and its holding companies, including their subsidiaries or related companies (Macquarie Group), and are subject to investment risk, including possible delays in repayment and loss of income and capital invested. No Macquarie Group company guarantees or will guarantee the performance of the Fund, the repayment of capital from the Fund, or any particular rate of return.
| Table of contents | |
| Portfolio management review | 1 |
| Performance summary | 4 |
| Disclosure of Fund expenses | 8 |
| Security type/sector allocation | 10 |
| Statement of net assets | 12 |
| Statement of operations | 29 |
| Statements of changes in net assets | 30 |
| Financial highlights | 32 |
| Notes to financial statements | 36 |
| Report of independent registered | |
| public accounting firm | 51 |
| Other Fund information | 52 |
| Board of trustees/directors and | |
| officers addendum | 54 |
| About the organization | 64 |
Unless otherwise noted, views expressed herein are current as of July 31, 2011, and subject to change.
Funds are not FDIC insured and are not guaranteed. It is possible to lose the principal amount invested.
Mutual fund advisory services provided by Delaware Management Company, a series of Delaware Management Business Trust, which is a registered investment advisor. Delaware Investments, a member of Macquarie Group, refers to Delaware Management Holdings, Inc. and its subsidiaries, including the Fund’s distributor, Delaware Distributors, L.P. Macquarie Group refers to Macquarie Group Limited and its subsidiaries and affiliates worldwide.
© 2011 Delaware Management Holdings, Inc.
All third-party trademarks cited are the property of their respective owners.
| Portfolio management review | | |
| Delaware Diversified Floating Rate Fund | | August 9, 2011 |
| Performance preview (for the year ended July 31, 2011) | | |
| Delaware Diversified Floating Rate Fund (Class A shares) | 1-year return | | +3.33% |
| BofA Merrill Lynch U.S. Dollar 3-month LIBOR | | | |
| Constant Maturity Index (benchmark) | 1-year return | | +0.34% |
Past performance does not guarantee future results.
For complete, annualized performance for Delaware Diversified Floating Rate Fund, please see the table on page 4.
The performance of Class A shares excludes the applicable sales charge and reflects the reinvestment of all distributions.
Index performance returns do not reflect any management fees, transaction costs, or expenses. Indices are unmanaged and one cannot invest directly in an index.
For the fiscal year ended July 31, 2011, Delaware Diversified Floating Rate Fund Class A shares returned +3.33% at net asset value and +0.48% at maximum offer price. Both return figures reflect the reinvestment of all distributions. The Fund’s benchmark, the BofA Merrill Lynch U.S. Dollar 3-Month LIBOR Constant Maturity Index, returned +0.34% for the same period.
The Fund’s fiscal year began with weak domestic economic reports, and the Federal Reserve maintaining its stance to keep interest rates low to spur lending and economic growth. In August 2010, the Fed announced its decision to implement a second round of quantitative easing (or QE2), which it launched in November 2010. Ultimately, the Fed pledged to buy $600 billion of Treasury bonds as part of this action.
Heading into the fiscal year, many investors assumed that yields would hold steady or even potentially go lower; instead, yields in general widened dramatically. From October 2010 to February 2011, 10-year Treasury yields moved higher by nearly 1.30 percentage points, which seemed to highlight many investors’ concerns over the additional liquidity that was being pumped into the system through QE2. During this time, U.S. economic data were showing signs of stabilization and improvement; however, gross domestic product numbers began to wane, and many investors became concerned that interest rates would start to move higher once the Fed ended its buying spree.
Arguably, fixed income markets faced more challenges than usual during the Fund’s fiscal year, which included ongoing credit concerns in the euro zone and tightening policy actions in China. Economic fundamentals and investor confidence showed signs of deterioration, particularly after the March earthquake and tsunami in Japan. Ramped-up volatility continued to be the story coming out of Europe.
The Fund’s defensive positioning
Investors’ hopes for steady, modest growth, which seemed achievable at the start of the Fund’s fiscal year, were generally unfulfilled by the close of the period. In late June, the U.S. Commerce Department’s GDP revision for the first quarter of 2011 — a downward revision from 1.9% to 0.4% — pointed to the extreme challenges ahead for this economy, in our opinion.
We believe that emerging from a balance-sheet recession, such as the one the United States has experienced, takes time. The
1
Portfolio management review
Delaware Diversified Floating Rate Fund
government spending cuts that were necessary on the fiscal side of the equation will likely have a negative effect on growth, and growth on the whole has been difficult to achieve without a return of consumer confidence, which typically comes with employment and income growth. That said, corporate balance sheets were generally in good shape at the end of the Fund’s fiscal year, and we believe they should be able to weather a slight economic slowdown. As a result, investment grade corporate credit, an area in which the Fund held an overweight position, was a particular sweet spot in our opinion.
At the beginning of the Fund’s fiscal year, we positioned the Fund with a modestly defensive bias. Early on, however, we began adding more risk in the Fund’s portfolio, anticipating that a rally might occur in some higher-risk assets. We believed QE2 was supportive for risk assets in general, and corporate balance sheets reflected strong fundamentals. For example, we positioned the Fund’s portfolio with close to 40% in bank loans and below-investment-grade assets. By the end of the Fund’s fiscal year, we had pared back that allocation to below 30%, settling into a more conservatively positioned stance. In general, we dialed down risk across the board over the last six months of the Fund’s fiscal year in expectation of an economic slowdown.
Outperforming the Libor benchmark and hedging out volatility
The chief contributor to the Fund’s outperformance of its Libor benchmark came from trades in below-investment-grade assets, particularly in the bank loan markets. High yield and convertible bonds also did well for the Fund, although the Fund’s position in convertibles was relatively small.
Higher-quality assets including asset-backed and mortgage-backed securities underperformed on an absolute basis in the Fund’s portfolio, dragging down the overall performance of the Fund as a result. In final months of the Fund’s fiscal year, however, down-in-quality trades such as the bank loan market did not pay dividends as they had previously, and many investors were stepping back from the asset class.
An important component of the Fund’s total return is derived from its floating-rate strategy: In addition to typical floating-rate securities, the Fund may also utilize derivative instruments to effectively convert the fixed-rate interest payments from a group of fixed-rate securities into floating-rate payments. The derivatives we utilize with this strategy are primarily interest rate swaps, which allow us to seek to take advantage of potential investment opportunities that may exist between fixed-rate and floating-rate securities. Our use of interest rate swaps is essentially meant to provide the Fund with a measure of diversification into sectors outside the traditional floating-rate market.
During the course of the Fund’s fiscal year, many investors in floating-rate products did not benefit from a rise in rates because Libor, or the front end of the curve, was essentially anchored by the Fed. However, floating-rate products did smooth out some of the price volatility in the Fund, given the extreme changes in absolute yields during Fund’s fiscal year.
2
Over the short-to-intermediate time horizon, we do not anticipate a significant rise in short-term rates. This does not rule out possible periods of rate volatility, however. The potential market implications of fiscal policies in the U.S. and abroad, the possibility for further sovereign downgrades by rating agencies, or a monetary policy mistake are all topics that we believe could individually or collectively result in additional rate volatility. We will continue to keep a close eye on rate volatility for the upcoming fiscal year.
3
| Performance summary | |
| Delaware Diversified Floating Rate Fund | July 31, 2011 |
The performance data quoted represent past performance; past performance does not guarantee future results. Investment return and principal value will fluctuate so your shares, when redeemed, may be worth more or less than their original cost. Please obtain the performance data current for the most recent month end by calling 800 523-1918 or visiting our website at www.delawareinvestments.com/performance. Current performance may be lower or higher than the performance data quoted.
| Fund performance1,2 | Average annual total returns through July 31, 2011 |
| | 1 year | | Lifetime |
| Class A (Est. Feb. 26, 2010) | | | |
| Excluding sales charge | +3.33% | | +2.94% |
| Including sales charge | +0.48% | | +0.95% |
| Class C (Est. Feb. 26, 2010) | | | |
| Excluding sales charge | +2.58% | | +2.20% |
| Including sales charge | +1.58% | | +2.20% |
| Class R (Est. Feb. 26, 2010) | | | |
| Excluding sales charge | +2.96% | | +2.69% |
| Including sales charge | +2.96% | | +2.69% |
| Institutional Class (Est. Feb. 26, 2010) | | | |
| Excluding sales charge | +3.61% | | +3.21% |
| Including sales charge | +3.61% | | +3.21% |
1 Returns reflect the reinvestment of all distributions and are presented both with and without the applicable sales charges described below. Returns do not reflect the deduction of taxes the shareholder would pay on Fund distributions or redemptions of Fund shares.
Expense limitations were in effect for certain classes during some or all of the periods shown in the “Fund performance” chart. The current expenses for each class are listed on the “Fund expense ratios” table below. Performance would have been lower had expense limitations not been in effect.
Class A shares are sold with a maximum front-end sales charge of up to 2.75%, and have an annual distribution and service fee of up to 0.30% of average daily net assets. Performance for Class A shares, excluding sales charges, assumes that no front-end sales charge applied. This fee has been contractually limited to 0.25% of average daily net assets from Nov. 26, 2010, through Nov. 30, 2011.
Class C shares are sold with a contingent deferred sales charge of 1.00% if redeemed during the first 12 months. They are also subject to an annual distribution and service fee of up to 1.00% of average daily net assets.
Performance for Class C shares, excluding sales charges, assumes either that contingent deferred sales charges did not apply or that the investment was not redeemed.
Class R shares are available only for certain retirement plan products. They are sold without a sales charge and have an annual distribution and service fee of up to 0.60% of
4
average daily net assets, which has been limited contractually to 0.50% from Nov. 26, 2010, through Nov. 30, 2011.
Institutional Class shares are available without sales or asset-based distribution charges only to certain eligible institutional accounts.
The “Fund performance” table and the “Performance of a $10,000 investment” graph do not reflect the deduction of taxes the shareholder would pay on Fund distributions or redemptions of Fund shares.
Fixed income securities and bond funds can lose value, and investors can lose principal, as interest rates rise. They also may be affected by economic conditions that hinder an issuer’s ability to make interest and principal payments on its debt.
The Fund may also be subject to prepayment risk, the risk that the principal of a fixed income security that is held by the Fund may be prepaid prior to maturity, potentially forcing the Fund to reinvest that money at a lower interest rate.
High yielding, noninvestment grade bonds (junk bonds) involve higher risk than investment grade bonds. The high yield secondary market is particularly susceptible to liquidity problems when institutional investors, such as mutual funds and certain other financial institutions, temporarily stop buying bonds for regulatory, financial, or other reasons. In addition, a less liquid secondary market makes it more difficult for the Fund to obtain precise valuations of the high yield securities in its portfolio.
International investments entail risks not ordinarily associated with U.S. investments including fluctuation in currency values, differences in accounting principles, or economic or political instability in other nations.
Investing in emerging markets can be riskier than investing in established foreign markets due to increased volatility and lower trading volume.
The Fund may invest in derivatives, which may involve additional expenses and are subject to risk, including the risk that an underlying security or securities index moves in the opposite direction from what the portfolio manager anticipated. A derivative transaction depends upon the counterparties’ ability to fulfill their contractual obligations.
Because the Fund may invest in bank loans and other direct indebtedness, it is subject to the risk that the Fund will not receive payment of principal, interest, and other amounts due in connection with these investments, which primarily depend on the financial condition of the borrower and the lending institution.
5
Performance summary
Delaware Diversified Floating Rate Fund
2 The Fund’s expense ratios, as described in the most recent prospectus, are disclosed in the following “Fund expense ratios” table. Delaware Investments has agreed to reimburse certain expenses and/or waive certain fees in order to prevent total fund operating expenses (excluding any 12b-1 fees and certain other expenses) from exceeding 0.80% of the Fund’s average daily net assets from Nov. 26, 2010, through Nov. 30, 2011. Please see the most recent prospectus and any applicable supplement(s) for additional information on these fee waivers and/or reimbursements.
| Fund expense ratios | Class A | | Class C | | Class R | | Institutional Class |
| Total annual operating expenses | | | | | | | |
| (without fee waivers) | 4.92% | | 5.62% | | 5.22% | | 4.62% |
| Net expenses | | | | | | | |
| (including fee waivers, if any) | 1.05% | | 1.80% | | 1.30% | | 0.80% |
| Type of waiver | Contractual | | Contractual | | Contractual | | Contractual |
6
Performance of a $10,000 investment1
Average annual total returns from Feb. 26, 2010 (Fund’s inception) through July 31, 2011
| For period beginning Feb. 26, 2010, through July 31, 2011 | Starting value | Ending value |
| | Delaware Diversified Floating Rate Fund —
Class A Shares | $9,725 | $10,130 |
| | BofA Merrill Lynch U.S. Dollar 3-Month LIBOR
Constant Maturity Index | $10,000 | $10,047 |
1 The “Performance of a $10,000 investment” graph assumes $10,000 invested in Class A shares of the Fund on Feb. 26, 2010, and includes the effect of a 2.75% front-end sales charge and the reinvestment of all distributions. The graph does not reflect the deduction of taxes the shareholders would pay on Fund distributions or redemptions of Fund shares. Expense limitations were in effect for some or all of the periods shown. Performance would have been lower had expense limitations not been in effect. Current expenses are listed in the “Fund expense ratios” table on page 6. Please note additional details on pages 4 through 7.
The chart also assumes $10,000 invested in the BofA Merrill Lynch U.S. Dollar 3-Month LIBOR Constant Maturity Index as of Feb. 26, 2010. The BofA Merrill Lynch U.S. Dollar 3-Month LIBOR Constant Maturity Index represents the London interbank offered rate (LIBOR) with a constant 3-month average maturity. LIBOR, published by the British Bankers’ Association, is a composite of the rates of interest at which banks borrow from one another in the London market, and it is a widely used benchmark for short-term interest rates.
Index performance returns do not reflect any management fees, transaction costs, or expenses. Indices are unmanaged and one cannot invest directly in an index. Past performance is not a guarantee of future results.
Performance of other Fund classes will vary due to different charges and expenses.
| | | Nasdaq symbols | | CUSIPs | |
| Class A | | DDFAX | | 245908660 | |
| Class C | | DDFCX | | 245908652 | |
| Class R | | DDFFX | | 245908645 | |
| Institutional Class | | DDFLX | | 245908637 | |
7
Disclosure of Fund expenses
For the six-month period from February 1, 2011 to July 31, 2011
As a shareholder of the Fund, you incur two types of costs: (1) transaction costs, including sales charges (loads) on purchase payments, reinvested dividends, or other distributions; redemption fees; and exchange fees; and (2) ongoing costs, including management fees; distribution and/or service (12b-1) fees; and other Fund expenses. This example is intended to help you understand your ongoing costs (in dollars) of investing in the Fund and to compare these costs with the ongoing costs of investing in other mutual funds.
The example is based on an investment of $1,000 invested at the beginning of the period and held for the entire six-month period from February 1, 2011 to July 31, 2011.
Actual expenses
The first section of the table shown, “Actual Fund return,” provides information about actual account values and actual expenses. You may use the information in this section of the table, together with the amount you invested, to estimate the expenses that you paid over the period. Simply divide your account value by $1,000 (for example, an $8,600 account value divided by $1,000 = 8.6), then multiply the result by the number in the first section under the heading entitled “Expenses Paid During Period” to estimate the expenses you paid on your account during this period.
Hypothetical example for comparison purposes
The second section of the table shown, “Hypothetical 5% return,” provides information about hypothetical account values and hypothetical expenses based on the Fund’s actual expense ratio and an assumed rate of return of 5% per year before expenses, which is not the Fund’s actual return. The hypothetical account values and expenses may not be used to estimate the actual ending account balance or expenses you paid for the period. You may use this information to compare the ongoing costs of investing in the Fund and other funds. To do so, compare this 5% hypothetical example with the 5% hypothetical examples that appear in the shareholder reports of the other funds.
Please note that the expenses shown in the table are meant to highlight your ongoing costs only and do not reflect any transactional costs, such as sales charges (loads), redemption fees, or exchange fees. Therefore, the second section of the table is useful in comparing ongoing costs only, and will not help you determine the relative total costs of owning different funds. In addition, if these transactional costs were included, your costs would have been higher. The Fund’s expenses shown in the table reflect fee waivers in effect. The expenses shown in the table assume reinvestment of all dividends and distributions.
8
Delaware Diversified Floating Rate Fund
Expense analysis of an investment of $1,000
| | | Beginning | | Ending | | | | Expenses |
| | | Account Value | | Account Value | | Annualized | | Paid During Period |
| | | 2/1/11 | | 7/31/11 | | Expense Ratio | | 2/1/11 to 7/31/11* |
| Actual Fund return | | | | | | | | | | | | |
| Class A | | $ | 1,000.00 | | $ | 1,006.50 | | 1.05% | | $ | 5.22 | |
| Class C | | | 1,000.00 | | | 1,003.00 | | 1.80% | | | 8.94 | |
| Class R | | | 1,000.00 | | | 997.30 | | 1.30% | | | 6.44 | |
| Institutional Class | | | 1,000.00 | | | 1,008.00 | | 0.80% | | | 3.98 | |
| Hypothetical 5% return (5% return before expenses) | | | | | | |
| Class A | | $ | 1,000.00 | | $ | 1,019.59 | | 1.05% | | $ | 5.26 | |
| Class C | | | 1,000.00 | | | 1,015.87 | | 1.80% | | | 9.00 | |
| Class R | | | 1,000.00 | | | 1,018.35 | | 1.30% | | | 6.51 | |
| Institutional Class | | | 1,000.00 | | | 1,020.83 | | 0.80% | | | 4.01 | |
*The expenses paid during period for “Hypothetical 5% Return” are equal to the Fund’s annualized expense ratio, multiplied by the average account value over the period, multiplied by 181/365 (to reflect the one-half year period).
9
| Security type/sector allocation | | |
| Delaware Diversified Floating Rate Fund | | As of July 31, 2011 |
Sector designations may be different than the sector designations presented in other Fund materials. The sector designations may represent the investment manager’s internal sector classifications, which may result in the sector designations for one fund being different than another fund’s sector designations.
| Security type/sector | | Percentage of net assets |
| Agency Collateralized Mortgage Obligations | | 1.65 | % |
| Agency Mortgage-Backed Security | | 0.04 | % |
| Commercial Mortgage-Backed Securities | | 0.73 | % |
| Convertible Bonds | | 0.87 | % |
| Corporate Bonds | | 56.58 | % |
| Agriculture | | 0.44 | % |
| Auto Parts & Equipment | | 1.31 | % |
| Banking | | 12.90 | % |
| Beverages | | 3.40 | % |
| Building Materials | | 0.45 | % |
| Chemicals | | 1.83 | % |
| Commercial Services | | 0.42 | % |
| Diversified Financial Services | | 5.36 | % |
| Electric | | 4.47 | % |
| Electronics | | 1.12 | % |
| Food | | 1.79 | % |
| Forest Products & Paper | | 0.54 | % |
| Gas | | 0.79 | % |
| Healthcare Products | | 0.08 | % |
| Healthcare Services | | 1.09 | % |
| Insurance | | 2.43 | % |
| Iron/Steel | | 0.42 | % |
| Machinery – Construction & Mining | | 0.88 | % |
| Media | | 0.84 | % |
| Mining | | 0.76 | % |
| Miscellaneous Manufacturing | | 2.34 | % |
| Office/Business Equipment | | 1.41 | % |
| Oil & Gas | | 2.80 | % |
| Pharmaceuticals | | 1.01 | % |
| Pipelines | | 1.41 | % |
| Real Estate | | 0.28 | % |
| Retail | | 0.97 | % |
| Technology | | 1.07 | % |
| Telecommunications | | 3.90 | % |
| Transportation | | 0.07 | % |
10
| Security type/sector | | Percentage of net assets |
| Municipal Bonds | | 2.51 | % |
| Non-Agency Asset-Backed Securities | | 4.97 | % |
| Regional Bond | | 0.31 | % |
| Senior Secured Loans | | 26.55 | % |
| Sovereign Bonds | | 0.85 | % |
| Supranational Bank | | 0.09 | % |
| U.S. Treasury Obligation | | 0.07 | % |
| Convertible Preferred Stock | | 0.00 | % |
| Short-Term Investments | | 5.67 | % |
| Total Value of Securities | | 100.89 | % |
| Liabilities Net of Receivables and Other Assets | | (0.89 | %) |
| Total Net Assets | | 100.00 | % |
11
| Statement of net assets | |
| Delaware Diversified Floating Rate Fund | July 31, 2011 |
| | | | | Principal amount° | | Value (U.S. $) |
| Agency Collateralized Mortgage Obligations – 1.65% | | | | | | | |
| • | Fannie Mae REMICs | | | | | | | |
| | Series 2003-121 FC 0.587% 2/25/28 | | USD | | 9,139 | | $ | 9,138 |
| | Series 2004-36 FA 0.587% 5/25/34 | | | | 103,678 | | | 103,394 |
| | Series 2005-66 FD 0.487% 7/25/35 | | | | 122,271 | | | 122,003 |
| | Series 2005-106 QF 0.697% 12/25/35 | | | | 694,873 | | | 695,078 |
| | Series 2006-105 FB 0.607% 11/25/36 | | | | 228,158 | | | 227,590 |
| | Series 2007-109 NF 0.737% 12/25/37 | | | | 57,894 | | | 58,007 |
| • | Freddie Mac REMICs | | | | | | | |
| | Series 2535 FK 0.587% 10/15/31 | | | | 2,798 | | | 2,798 |
| | Series 3067 FA 0.537% 11/15/35 | | | | 282,881 | | | 281,739 |
| | Series 3239 EF 0.537% 11/15/36 | | | | 283,325 | | | 282,286 |
| | Series 3241 FM 0.567% 11/15/36 | | | | 43,398 | | | 43,255 |
| | Series 3780 LF 0.587% 3/15/29 | | | | 60,593 | | | 60,258 |
| Total Agency Collateralized Mortgage Obligations | | | | | | | |
| | (cost $1,881,263) | | | | | | | 1,885,546 |
| | | | | | | | | |
| Agency Mortgage-Backed Security – 0.04% | | | | | | | |
| • | Freddie Mac ARM 4.813% 2/1/35 | | | | 38,944 | | | 41,064 |
| Total Agency Mortgage-Backed Security (cost $41,134) | | | | | | | 41,064 |
| | | | | | | | |
| Commercial Mortgage-Backed Securities – 0.73% | | | | | | | |
| •# | American Tower Trust | | | | | | | |
| | Series 2007-1A AFL 144A 0.377% 4/15/37 | | | | 625,000 | | | 605,349 |
| •# | Goldman Sachs Mortgage Securities II | | | | | | | |
| | Series 2010-C1 C 144A 5.635% 8/10/43 | | | | 100,000 | | | 93,676 |
| # | WF-RBS Commercial Mortgage Trust | | | | | | | |
| | Series 2011-C3 A4 144A 4.375% 3/15/44 | | | | 135,000 | | | 136,009 |
| Total Commercial Mortgage-Backed Securities | | | | | | | |
| | (cost $843,136) | | | | | | | 835,034 |
| | | | | | | | | |
| Convertible Bonds – 0.87% | | | | | | | |
| | Euronet Worldwide 3.50% exercise price $40.48, | | | | | | | |
| | expiration date 10/15/25 | | | | 205,000 | | | 206,025 |
| | Health Care REIT 3.00% exercise price $51.08, | | | | | | | |
| | expiration date 11/30/29 | | | | 160,000 | | | 180,400 |
| | Level 3 Communications 3.50% exercise price $5.46, | | | | | | | |
| | expiration date 6/15/12 | | | | 275,000 | | | 274,656 |
12
| | | | Principal amount° | Value (U.S. $) |
| Convertible Bonds (continued) | | | | | | | |
| | Linear Technology 3.00% exercise price $44.11, | | | | | | | |
| | expiration date 5/1/27 | | USD | | 205,000 | | $ | 213,713 |
| | Live Nation Entertainment 2.875% exercise price $27.14, | | | | | | | |
| | expiration date 7/14/27 | | | | 3,000 | | | 2,854 |
| | SanDisk 1.50% exercise price $52.37, | | | | | | | |
| | expiration date 8/11/17 | | | | 14,000 | | | 15,155 |
| | Transocean 1.50% exercise price $166.65, | | | | | | | |
| | expiration date 12/15/37 | | | | 4,000 | | | 3,945 |
| • | U.S. Bancorp 0.00% exercise price $37.86, | | | | | | | |
| | expiration date 9/20/36 | | | | 100,000 | | | 99,630 |
| Total Convertible Bonds (cost $1,001,223) | | | | | | | 996,378 |
| | | | | | | | |
| Corporate Bonds – 56.58% | | | | | | | |
| Agriculture – 0.44% | | | | | | | |
| • | Archer-Daniels-Midland 0.422% 8/13/12 | | | | 500,000 | | | 501,033 |
| | | | | | | | | 501,033 |
| Auto Parts & Equipment – 1.31% | | | | | | | |
| # | Delphi 144A 6.125% 5/15/21 | | | | 265,000 | | | 268,975 |
| • | Johnson Controls 0.683% 2/4/14 | | | | 1,225,000 | | | 1,229,263 |
| | | | | | | | | 1,498,238 |
| Banking – 12.90% | | | | | | | |
| • | Abbey National Treasury Services 1.832% 4/25/14 | | | | 785,000 | | | 777,986 |
| | American Express Bank 5.55% 10/17/12 | | | | 250,000 | | | 263,069 |
| •# | Australia & New Zealand Banking Group 144A | | | | | | | |
| | 0.986% 1/10/14 | | | | 350,000 | | | 351,296 |
| • | Bank of America 0.527% 6/15/16 | | | | 260,000 | | | 234,966 |
| • | Bank of Montreal 0.723% 4/29/14 | | | | 625,000 | | | 625,877 |
| • | Barclays Bank 1.286% 1/13/14 | | | | 595,000 | | | 596,632 |
| • | Branch Banking & Trust | | | | | | | |
| | 0.559% 5/23/17 | | | | 750,000 | | | 687,854 |
| | 0.57% 9/13/16 | | | | 525,000 | | | 486,813 |
| • | Capital One Financial 1.40% 7/15/14 | | | | 565,000 | | | 566,138 |
| | Citigroup 5.125% 5/5/14 | | | | 535,000 | | | 574,296 |
| | City National 5.25% 9/15/20 | | | | 50,000 | | | 52,289 |
| •# | CoBank 144A 0.847% 6/15/22 | | | | 75,000 | | | 67,291 |
| • | Credit Suisse 1.209% 1/14/14 | | | | 500,000 | | | 500,648 |
| • | Fifth Third Bank 0.371% 5/17/13 | | | | 700,000 | | | 689,473 |
| • | Fifth Third Capital Trust IV 6.50% 4/15/37 | | | | 50,000 | | | 49,000 |
13
Statement of net assets
Delaware Diversified Floating Rate Fund
| | | | Principal amount° | | Value (U.S. $) |
| Corporate Bonds (continued) | | | | | | | |
| Banking (continued) | | | | | | | |
| | Goldman Sachs Group | | | | | | | |
| | •0.697% 3/22/16 | | USD | | 320,000 | | $ | 301,692 |
| | 5.25% 7/27/21 | | | | 375,000 | | | 383,537 |
| • | JPMorgan Chase Bank | | | | | | | |
| | 0.58% 6/13/16 | | | | 750,000 | | | 698,989 |
| | 5.19% 6/21/12 | | AUD | | 100,000 | | | 109,160 |
| • | Morgan Stanley 1.853% 1/24/14 | | USD | | 735,000 | | | 734,728 |
| •# | National Australia Bank 144A 0.966% 4/11/14 | | | | 990,000 | | | 989,805 |
| • | National City Bank 0.622% 6/7/17 | | | | 250,000 | | | 234,753 |
| • | PNC Funding 0.453% 1/31/14 | | | | 935,000 | | | 928,541 |
| •# | Rabobank 144A 11.00% 12/29/49 | | | | 250,000 | | | 320,304 |
| •# | Standard Chartered 144A 1.214% 5/12/14 | | | | 500,000 | | | 499,727 |
| • | SunTrust Bank 0.548% 8/24/15 | | | | 985,000 | | | 931,203 |
| •# | Swedbank 144A 0.699% 1/14/13 | | | | 100,000 | | | 100,192 |
| • | U.S. Bank 0.529% 10/14/14 | | | | 420,000 | | | 417,150 |
| • | UBS 1.253% 1/28/14 | | | | 300,000 | | | 300,675 |
| • | USB Capital IX 3.50% 10/29/49 | | | | 460,000 | | | 376,616 |
| • | Wachovia 0.619% 10/15/16 | | | | 695,000 | | | 650,295 |
| • | Wells Fargo Bank 0.471% 5/16/16 | | | | 250,000 | | | 234,728 |
| | | | | | | | | 14,735,723 |
| Beverages – 3.40% | | | | | | | |
| • | Anheuser-Busch InBev Worldwide | | | | | | | |
| | 0.609% 7/14/14 | | | | 1,050,000 | | | 1,054,293 |
| | 0.802% 1/27/14 | | | | 825,000 | | | 831,202 |
| | 0.977% 3/26/13 | | | | 400,000 | | | 403,496 |
| • | Coca-Cola Enterprises 0.561% 2/18/14 | | | | 1,050,000 | | | 1,052,413 |
| # | Pernod-Ricard 144A 5.75% 4/7/21 | | | | 500,000 | | | 542,790 |
| | | | | | | | | 3,884,194 |
| Building Materials – 0.45% | | | | | | | |
| •# | Cemex SAB 144A 5.246% 9/30/15 | | | | 550,000 | | | 508,750 |
| | | | | | | | | 508,750 |
| Chemicals – 1.83% | | | | | | | |
| | Dow Chemical | | | | | | | |
| | •2.518% 8/8/11 | | | | 250,000 | | | 250,083 |
| | 4.25% 11/15/20 | | | | 255,000 | | | 262,223 |
| • | duPont (E.I.) deNemours 0.667% 3/25/14 | | | | 1,570,000 | | | 1,580,032 |
| | | | | | | | | 2,092,338 |
14
| | | | Principal amount° | Value (U.S. $) |
| Corporate Bonds (continued) | | | | | | | |
| Commercial Services – 0.42% | | | | | | | |
| • | Western Union 0.832% 3/7/13 | | USD | | 475,000 | | $ | 476,984 |
| | | | | | | | | 476,984 |
| Diversified Financial Services – 5.36% | | | | | | | |
| •# | American Honda Finance 144A 0.638% 11/7/12 | | | | 250,000 | | | 249,626 |
| • | Caterpillar Financial Services 0.42% 2/22/13 | | | | 250,000 | | | 250,320 |
| # | CDP Financial 144A 4.40% 11/25/19 | | | | 250,000 | | | 264,650 |
| # | Crown Castle Towers 144A 4.883% 8/15/20 | | | | 1,200,000 | | | 1,240,592 |
| # | ERAC USA Finance 144A 2.25% 1/10/14 | | | | 340,000 | | | 346,576 |
| | General Electric Capital | | | | | | | |
| | •0.466% 5/11/16 | | | | 600,000 | | | 573,491 |
| | •1.246% 9/23/13 | | | | 168,000 | | | 170,075 |
| | 5.30% 2/11/21 | | | | 250,000 | | | 266,986 |
| | International Lease Finance 6.25% 5/15/19 | | | | 360,000 | | | 359,792 |
| • | John Deere Capital | | | | | | | |
| | 0.399% 7/15/13 | | | | 400,000 | | | 400,932 |
| | 0.473% 3/3/14 | | | | 750,000 | | | 752,541 |
| | Lazard Group 6.85% 6/15/17 | | | | 250,000 | | | 280,897 |
| •# | MassMutual Global Funding II 144A 0.747% 9/27/13 | | | | 300,000 | | | 301,619 |
| •# | ZFS Finance USA Trust IV 144A 5.875% 5/9/32 | | | | 650,000 | | | 658,280 |
| | | | | | | | | 6,116,377 |
| Electric – 4.47% | | | | | | | |
| • | CMS Energy 1.199% 1/15/13 | | | | 600,000 | | | 597,000 |
| • | Columbus Southern Power 0.645% 3/16/12 | | | | 815,000 | | | 816,769 |
| • | DTE Energy 0.955% 6/3/13 | | | | 900,000 | | | 904,098 |
| # | Enel Finance International 144A 6.25% 9/15/17 | | | | 115,000 | | | 124,927 |
| • | FPL Group Capital 0.668% 11/9/12 | | | | 1,510,000 | | | 1,516,302 |
| • | Georgia Power | | | | | | | |
| | 0.519% 1/15/13 | | | | 250,000 | | | 250,464 |
| | 0.567% 3/15/13 | | | | 842,000 | | | 844,239 |
| • | Wisconsin Energy 6.25% 5/15/67 | | | | 55,000 | | | 55,507 |
| | | | | | | | | 5,109,306 |
| Electronics – 1.12% | | | | | | | |
| | National Semiconductor 6.60% 6/15/17 | | | | 310,000 | | | 374,000 |
| • | Texas Instruments 0.439% 5/15/13 | | | | 900,000 | | | 902,404 |
| | | | | | | | | 1,276,404 |
15
Statement of net assets
Delaware Diversified Floating Rate Fund
| | | | Principal amount° | Value (U.S. $) |
| Corporate Bonds (continued) | | | | | | | |
| Food – 1.79% | | | | | | | |
| | Delhaize Group 6.50% 6/15/17 | | USD | | 40,000 | | $ | 47,212 |
| • | General Mills 0.611% 5/16/14 | | | | 1,280,000 | | | 1,284,307 |
| | Kraft Foods 5.375% 2/10/20 | | | | 255,000 | | | 288,193 |
| | Safeway 3.95% 8/15/20 | | | | 425,000 | | | 428,276 |
| | | | | | | | | 2,047,988 |
| Forest Products & Paper – 0.54% | | | | | | | |
| | Georgia-Pacific | | | | | | | |
| | 8.00% 1/15/24 | | | | 265,000 | | | 327,457 |
| | #144A 5.40% 11/1/20 | | | | 270,000 | | | 286,138 |
| | | | | | | | | 613,595 |
| Gas – 0.79% | | | | | | | |
| • | Sempra Energy 1.007% 3/15/14 | | | | 900,000 | | | 904,491 |
| | | | | | | | | 904,491 |
| Healthcare Products – 0.08% | | | | | | | |
| | Hospira 6.40% 5/15/15 | | | | 50,000 | | | 57,468 |
| • | Universal Hospital Services 3.778% 6/1/15 | | | | 35,000 | | | 33,250 |
| | | | | | | | | 90,718 |
| Healthcare Services – 1.09% | | | | | | | |
| | Coventry Health Care 5.45% 6/15/21 | | | | 65,000 | | | 68,924 |
| • | Quest Diagnostics 1.096% 3/24/14 | | | | 1,115,000 | | | 1,124,115 |
| • | Select Medical Holdings 6.211% 9/15/15 | | | | 50,000 | | | 48,063 |
| | | | | | | | | 1,241,102 |
| Insurance – 2.43% | | | | | | | |
| | American International Group 5.45% 5/18/17 | | | | 40,000 | | | 42,506 |
| • | Berkshire Hathaway Finance 0.576% 1/10/14 | | | | 820,000 | | | 823,174 |
| • | Chubb 6.375% 3/29/67 | | | | 260,000 | | | 269,750 |
| •# | MetLife Institutional Funding II 144A 1.146% 4/4/14 | | | | 1,150,000 | | | 1,153,405 |
| •# | New York Life Global Funding 144A 0.506% 4/4/14 | | | | 485,000 | | | 485,555 |
| | | | | | | | | 2,774,390 |
| Iron/Steel – 0.42% | | | | | | | |
| | ArcelorMittal | | | | | | | |
| | 5.50% 3/1/21 | | | | 305,000 | | | 313,025 |
| | 9.85% 6/1/19 | | | | 125,000 | | | 162,930 |
| | | | | | | | | 475,955 |
16
| | | | Principal amount° | Value (U.S. $) |
| Corporate Bonds (continued) | | | | | | | |
| Machinery – Construction & Mining – 0.88% | | | | | | | |
| • | Caterpillar 0.355% 11/21/12 | | USD | | 1,000,000 | | $ | 1,001,038 |
| | | | | | | | | 1,001,038 |
| Media – 0.84% | | | | | | | |
| # | NBC Universal Media 144A 5.15% 4/30/20 | | | | 480,000 | | | 523,015 |
| | Time Warner Cable 8.25% 4/1/19 | | | | 125,000 | | | 160,434 |
| # | Vivendi 144A 6.625% 4/4/18 | | | | 245,000 | | | 281,872 |
| | | | | | | | | 965,321 |
| Mining – 0.76% | | | | | | | |
| | Alcoa 6.75% 7/15/18 | | | | 500,000 | | | 571,038 |
| | Freeport-McMoRan Copper & Gold 8.375% 4/1/17 | | | | 275,000 | | | 300,778 |
| | | | | | | | | 871,816 |
| Miscellaneous Manufacturing – 2.34% | | | | | | | |
| • | Danaher 0.497% 6/21/13 | | | | 1,565,000 | | | 1,569,692 |
| • | Eaton 0.575% 6/16/14 | | | | 1,100,000 | | | 1,102,181 |
| | | | | | | | | 2,671,873 |
| Office/Business Equipment – 1.41% | | | | | | | |
| • | Xerox 1.081% 5/16/14 | | | | 1,605,000 | | | 1,616,045 |
| | | | | | | | | 1,616,045 |
| Oil & Gas – 2.80% | | | | | | | |
| • | BP Capital Markets 0.85% 3/11/14 | | | | 983,000 | | | 986,099 |
| | Noble Holding International 3.05% 3/1/16 | | | | 615,000 | | | 633,220 |
| | Petrobras International Finance 5.375% 1/27/21 | | | | 355,000 | | | 379,888 |
| • | Total Capital Canada 0.63% 1/17/14 | | | | 470,000 | | | 473,387 |
| | Transocean 6.50% 11/15/20 | | | | 175,000 | | | 205,695 |
| | Weatherford International | | | | | | | |
| | 4.95% 10/15/13 | | | | 30,000 | | | 32,030 |
| | 5.125% 9/15/20 | | | | 315,000 | | | 338,645 |
| # | Woodside Finance 144A 8.125% 3/1/14 | | | | 125,000 | | | 144,739 |
| | | | | | | | | 3,193,703 |
| Pharmaceuticals – 1.01% | | | | | | | |
| • | Teva Pharmaceutical Finance III 0.747% 3/21/14 | | | | 1,150,000 | | | 1,158,809 |
| | | | | | | | | 1,158,809 |
| Pipelines – 1.41% | | | | | | | |
| | Buckeye Partners 4.875% 2/1/21 | | | | 215,000 | | | 225,785 |
| • | Enbridge Energy Partners 8.05% 10/1/37 | | | | 511,000 | | | 562,997 |
| | Energy Transfer Partners 8.50% 4/15/14 | | | | 180,000 | | | 210,018 |
17
Statement of net assets
Delaware Diversified Floating Rate Fund
| | | | Principal amount° | | Value (U.S. $) |
| Corporate Bonds (continued) | | | | | | | |
| Pipelines (continued) | | | | | | | |
| • | Enterprise Products Operating 7.034% 1/15/68 | | USD | | 100,000 | | $ | 105,511 |
| | Kinder Morgan Energy Partners 6.00% 2/1/17 | | | | 160,000 | | | 184,472 |
| | Plains All American Pipeline | | | | | | | |
| | 5.00% 2/1/21 | | | | 120,000 | | | 128,053 |
| | 8.75% 5/1/19 | | | | 45,000 | | | 58,143 |
| • | TransCanada PipeLines 6.35% 5/15/67 | | | | 135,000 | | | 138,447 |
| | | | | | | | | 1,613,426 |
| Real Estate – 0.28% | | | | | | | |
| | Digital Realty Trust 5.25% 3/15/21 | | | | 310,000 | | | 317,314 |
| | | | | | | | | 317,314 |
| Retail – 0.97% | | | | | | | |
| • | Target 0.42% 7/18/14 | | | | 1,100,000 | | | 1,102,582 |
| | | | | | | | | 1,102,582 |
| Technology – 1.07% | | | | | | | |
| • | Hewlett-Packard | | | | | | | |
| | 0.534% 5/24/13 | | | | 1,000,000 | | | 1,002,702 |
| | 0.654% 5/30/14 | | | | 75,000 | | | 75,527 |
| # | Seagate Technology International 144A 10.00% 5/1/14 | | | | 126,000 | | | 145,530 |
| | | | | | | | | 1,223,759 |
| Telecommunications – 3.90% | | | | | | | |
| • | Qwest 3.497% 6/15/13 | | | | 1,325,000 | | | 1,363,095 |
| | Telefonica Emisiones | | | | | | | |
| | •0.603% 2/4/13 | | | | 505,000 | | | 496,407 |
| | 5.462% 2/16/21 | | | | 15,000 | | | 15,070 |
| • | Verizon Communications 0.856% 3/28/14 | | | | 1,295,000 | | | 1,309,790 |
| •# | VimpelCom Holdings 144A 4.246% 6/29/14 | | | | 470,000 | | | 476,756 |
| | Virgin Media Secured Finance | | | | | | | |
| | 6.50% 1/15/18 | | | | 350,000 | | | 386,750 |
| | #144A 5.25% 1/15/21 | | | | 200,000 | | | 216,107 |
| • | Vodafone Group 0.535% 2/27/12 | | | | 190,000 | | | 190,203 |
| | | | | | | | | 4,454,178 |
| Transportation – 0.07% | | | | | | | |
| | CSX 4.25% 6/1/21 | | | | 80,000 | | | 82,939 |
| | | | | | | | | 82,939 |
| Total Corporate Bonds (cost $64,020,824) | | | | | | | 64,620,389 |
18
| | | | Principal amount° | | Value (U.S. $) |
| Municipal Bonds – 2.51% | | | | | | | |
| • | Connecticut State Series A 1.63% 3/1/21 | | USD | | 750,000 | | $ | 749,730 |
| • | Kentucky Higher Education Student Loan Revenue | | | | | | | |
| | Series A-1 0.773% 5/1/20 | | | | 60,000 | | | 60,074 |
| • | Missouri Higher Education Loan Authority Student Revenue | | | | | | | |
| | Series A-1 1.107% 8/27/29 | | | | 65,371 | | | 65,200 |
| • | New Jersey Economic Development Authority Revenue | | | | | | | |
| | (Build America Bonds) 1.247% 6/15/13 | | | | 75,000 | | | 75,137 |
| • | New Mexico Educational Assistance Foundation | | | | | | | |
| | Series A-3 1.51% 12/1/38 | | | | 120,000 | | | 119,066 |
| • | North Texas Higher Education Authority Student Loan Revenue | | | | | | | |
| | Series A-1 1.346% 4/1/40 | | | | 388,226 | | | 389,162 |
| | Series A-2 1.146% 7/1/30 | | | | 75,000 | | | 73,951 |
| • | Oklahoma State Student Loan Authority Revenue | | | | | | | |
| | Series A-1 1.498% 6/1/40 | | | | 1,250,000 | | | 1,243,750 |
| | Series A-2A 1.511% 9/1/37 | | | | 95,000 | | | 94,861 |
| Total Municipal Bonds (cost $2,878,598) | | | | | | | 2,870,931 |
| | | | | | | | |
| Non-Agency Asset-Backed Securities – 4.97% | | | | | | | |
| • | American Express Credit Account Master Trust Series 2010-1 B | | | | | | | |
| | 0.787% 11/16/15 | | | | 500,000 | | | 499,975 |
| • | American Express Issuance Trust Series 2007-2 A | | | | | | | |
| | 0.437% 7/15/13 | | | | 200,000 | | | 200,206 |
| • | Bank of America Credit Card Trust Series 2007-A6 A6 | | | | | | | |
| | 0.247% 9/15/16 | | | | 250,000 | | | 249,220 |
| • | Capital One Multi-Asset Execution Trust | | | | | | | |
| | Series 2004-A4 A4 0.407% 3/15/17 | | | | 250,000 | | | 249,913 |
| | Series 2005-A1 A1 0.257% 1/15/15 | | | | 200,000 | | | 199,923 |
| | Series 2007-A4 A4 0.217% 3/16/15 | | | | 350,000 | | | 349,688 |
| • | Citibank Credit Card Issuance Trust Series 2009-A1 A1 | | | | | | | |
| | 1.937% 3/17/14 | | | | 100,000 | | | 101,051 |
| •# | Citibank Omni Master Trust 144A | | | | | | | |
| | Series 2009-A8 A8 2.287% 5/16/16 | | | | 700,000 | | | 708,439 |
| | Series 2009-A14A A14 2.937% 8/15/18 | | | | 500,000 | | | 526,191 |
| | CNH Equipment Trust Series 2010-A A4 2.49% 1/15/16 | | | | 10,000 | | | 10,252 |
| • | Discover Card Master Trust Series 2010-A1 A1 | | | | | | | |
| | 0.837% 9/15/15 | | | | 350,000 | | | 352,823 |
| • | Discover Card Master Trust I Series 2005-4 A2 | | | | | | | |
| | 0.277% 6/16/15 | | | | 200,000 | | | 199,823 |
19
Statement of net assets
Delaware Diversified Floating Rate Fund
| | | | Principal amount° | | Value (U.S. $) |
| Non-Agency Asset-Backed Securities (continued) | | | | | | | |
| •# | Ford Credit Floorplan Master Owner Trust 144A | | | | | | | |
| | Series 2010-1 A 1.837% 12/15/14 | | USD | | 500,000 | | $ | 508,248 |
| | Series 2010-3 A2 1.887% 2/15/17 | | | | 1,000,000 | | | 1,036,478 |
| • | MBNA Credit Card Master Note Trust Series 2005-A2 A2 | | | | | | | |
| | 0.27% 10/15/14 | | | | 100,000 | | | 99,984 |
| •# | Nissan Master Owner Trust Receivables Series 2010-AA A | | | | | | | |
| | 144A 1.337% 1/15/15 | | | | 375,000 | | | 378,817 |
| Total Non-Agency Asset-Backed Securities | | | | | | | |
| | (cost $5,681,305) | | | �� | | | | 5,671,031 |
| | | | | | | | | |
| Regional Bond – 0.31%Δ | | | | | | | |
| Canada – 0.31% | | | | | | | |
| • | Province of Ontario 0.428% 5/7/13 | | | | 350,000 | | | 350,310 |
| Total Regional Bond (cost $350,406) | | | | | | | 350,310 |
| | | | | | | | |
| «Senior Secured Loans – 26.55% | | | | | | | |
| | AIG | | | | | | | |
| | Tranche 1 6.75% 3/17/15 | | | | 14,423 | | | 14,486 |
| | Tranche 2 7.00% 3/17/16 | | | | 10,577 | | | 10,689 |
| | Alliance HealthCare Services 5.50% 6/1/16 | | | | 29,698 | | | 29,630 |
| | Allied Security Holdings Tranche 2L 8.50% 1/21/18 | | | | 150,000 | | | 153,000 |
| | Ameristar Casinos Tranche B 4.00% 3/29/18 | | | | 219,450 | | | 219,656 |
| | Anchor Glass Container 6.00% 2/3/16 | | | | 14,572 | | | 14,670 |
| | API Technologies Tranche B 3.496% 6/1/16 | | | | 500,000 | | | 492,500 |
| | Ashland Tranche B 3.75% 5/31/18 | | | | 1,000,000 | | | 1,002,890 |
| | Aspect Software Tranche B 6.25% 5/7/16 | | | | 24,688 | | | 24,729 |
| | ATI Holdings 7.50% 3/12/16 | | | | 24,544 | | | 24,431 |
| | Attachmate 6.50% 11/21/16 | | | | 625,000 | | | 625,703 |
| | Autoparts Holdings | | | | | | | |
| | 1st Lien 6.50% 7/5/17 | | | | 345,000 | | | 347,372 |
| | 2nd Lien 10.50% 7/5/18 | | | | 345,000 | | | 351,038 |
| | BNY ConvergEx Group | | | | | | | |
| | 7.50% 12/16/17 | | | | 313,468 | | | 321,044 |
| | 8.75% 11/29/17 | | | | 131,532 | | | 134,712 |
| | Bresnan Broadband Holdings 4.50% 12/6/17 | | | | 273,625 | | | 273,952 |
| | Brickman Group Holdings Tranche B 7.25% 10/14/16 | | | | 164,175 | | | 166,484 |
| | Brock Holdings III | | | | | | | |
| | 10.00% 2/15/18 | | | | 345,000 | | | 355,783 |
| | Tranche B 6.00% 2/15/17 | | | | 109,725 | | | 110,445 |
20
| | | | Principal amount° | | Value (U.S. $) |
| «Senior Secured Loans (continued) | | | | | | | |
| | Burlington Coat Factory Warehouse Tranche B | | | | | | | |
| | 6.25% 2/10/17 | | USD | | 1,308,437 | | $ | 1,310,478 |
| | Caesars Entertainment Operating | | | | | | | |
| | Tranche B1 3.253% 1/28/15 | | | | 490,000 | | | 442,416 |
| | Tranche B2 3.23% 1/28/15 | | | | 295,000 | | | 266,353 |
| | Cengage Learning Acquisitions | | | | | | | |
| | 2.50% 7/3/14 | | | | 149,225 | | | 131,590 |
| | 7.50% 7/7/14 | | | | 73,921 | | | 73,905 |
| | Charter Communications Operating Tranche B | | | | | | | |
| | 2.19% 3/6/14 | | | | 30,045 | | | 30,066 |
| | 7.25% 3/6/14 | | | | 17,788 | | | 17,862 |
| | Chester Downs & Marina 12.375% 12/31/16 | | | | 44,699 | | | 45,593 |
| | Chrysler Group 6.00% 4/28/17 | | | | 675,000 | | | 658,128 |
| | Citadel Broadcasting Tranche B 4.25% 11/29/16 | | | | 211,786 | | | 211,942 |
| | CityCenter Holdings 7.50% 1/10/15 | | | | 470,000 | | | 472,703 |
| | Clear Channel Communication Tranche B 3.836% 1/29/16 | | | | 843,991 | | | 703,007 |
| | Consolidated Container 5.688% 9/28/14 | | | | 790,000 | | | 722,850 |
| | DaVita Tranche B 4.50% 10/20/16 | | | | 248,750 | | | 249,721 |
| | Del Monte Tranche B 4.50% 11/26/17 | | | | 80,000 | | | 79,836 |
| | Delta Air Lines Tranche B 5.50% 3/29/17 | | | | 1,000,000 | | | 990,005 |
| | DineEquity Tranche B 4.25% 10/31/17 | | | | 202,790 | | | 203,031 |
| | Dunkin Brands Tranche B2 4.25% 11/23/17 | | | | 497,503 | | | 497,729 |
| | Endo Pharmaceutical Holdings Tranche B 4.00% 4/14/18 | | | | 1,000,000 | | | 1,003,259 |
| | First Data Tranche B2 2.937% 9/24/14 | | | | 1,107,410 | | | 1,032,659 |
| | Ford Motor Tranche B 2.94% 12/15/13 | | | | 52,171 | | | 52,205 |
| | Frac Tech International Tranche B 6.25% 4/19/16 | | | | 684,168 | | | 684,263 |
| | GenOn Energy Tranche B 6.00% 6/20/17 | | | | 188,575 | | | 188,737 |
| | Goodman Global Tranche B 5.75% 10/28/16 | | | | 253,336 | | | 254,965 |
| | Graham Packaging | | | | | | | |
| | Tranche C 6.75% 4/5/14 | | | | 162,624 | | | 163,059 |
| | Tranche D 6.00% 9/23/16 | | | | 49,625 | | | 49,762 |
| | Grifols Tranche B 6.00% 6/4/16 | | | | 165,000 | | | 165,825 |
| | HGI Holdings 6.75% 7/27/17 | | | | 167,016 | | | 168,270 |
| | Houghton International Tranche B 6.75% 1/11/16 | | | | 332,726 | | | 336,366 |
| | IASIS Healthcare Tranche B 5.00% 4/18/18 | | | | 997,500 | | | 993,675 |
| | Knology Tranche B 4.00% 8/8/17 | | | | 233,825 | | | 233,136 |
| | Level 3 Financing Tranche B 11.15% 3/13/14 | | | | 50,000 | | | 52,813 |
| | Live Nation Entertainment Tranche B 4.50% 11/6/16 | | | | 49,375 | | | 49,468 |
| | MedAssets Tranche B 5.25% 11/15/16 | | | | 172,013 | | | 172,379 |
21
Statement of net assets
Delaware Diversified Floating Rate Fund
| | | | Principal amount° | | Value (U.S. $) |
| «Senior Secured Loans (continued) | | | | | | | |
| | Mediacom Illinois 5.50% 3/31/17 | | USD | | 273,608 | | $ | 273,950 |
| | MGM Resorts International Tranche E 7.00% 2/21/14 | | | | 874,699 | | | 859,532 |
| | Moneygram International Tranche B 4.50% 9/8/17 | | | | 435,897 | | | 437,168 |
| | NBTY Tranche B 4.25% 10/1/17 | | | | 547,250 | | | 547,748 |
| | Nortek 5.25% 4/12/17 | | | | 498,750 | | | 499,064 |
| | Nuveen Investment | | | | | | | |
| | 5.757% 5/13/17 | | | | 260,826 | | | 260,966 |
| | 2nd Lien 12.50% 7/9/15 | | | | 635,000 | | | 676,011 |
| | OM Group Tranche B 5.75% 7/5/17 | | | | 325,000 | | | 325,203 |
| | OSI Restaurant Partners | | | | | | | |
| | 2.319% 6/14/13 | | | | 30,869 | | | 29,851 |
| | 2.50% 6/13/14 | | | | 317,112 | | | 306,655 |
| | Pierre Foods 7.00% 9/29/16 | | | | 99,250 | | | 100,243 |
| | Pinnacle Foods Finance Tranche D 6.00% 4/2/14 | | | | 24,974 | | | 25,136 |
| | PQ 6.69% 7/30/15 | | | | 495,000 | | | 486,338 |
| | Prime Healthcare Services Tranche B 7.25% 4/28/15 | | | | 24,688 | | | 24,132 |
| | Radnet Management Tranche B 5.75% 4/2/16 | | | | 124,059 | | | 124,121 |
| | Remy International Tranche B 6.25% 12/16/16 | | | | 194,025 | | | 194,914 |
| | Reynolds & Reynolds Tranche B 3.75% 3/9/18 | | | | 1,000,000 | | | 1,002,945 |
| | Reynolds Group Holdings 6.50% 7/7/18 | | | | 1,050,000 | | | 1,044,880 |
| | Rockwood Specialties Group Tranche B 3.75% 1/25/18 | | | | 225,000 | | | 226,368 |
| | Roundy’s Supermarkets 10.00% 4/16/16 | | | | 20,000 | | | 20,281 |
| | Sensus USA 2nd Lien 8.50% 4/13/18 | | | | 565,000 | | | 572,947 |
| | Sinclair Television Group Tranche B 4.00% 10/29/16 | | | | 202,137 | | | 202,867 |
| | STP Products Manufacturing Tranche B 6.00% 11/5/16 | | | | 24,875 | | | 24,657 |
| | Surgical Care Affiliates Tranche B 5.50% 5/26/18 | | | | 770,000 | | | 755,081 |
| | Texas Competitive Electric Holdings 3.686% 10/10/14 | | | | 805,249 | | | 634,134 |
| | Toys R US Tranche B 6.00% 9/1/16 | | | | 198,873 | | | 199,425 |
| | TransDigm Group 1st Lien 4.00% 2/3/17 | | | | 173,130 | | | 173,564 |
| | Univision Communications 4.436% 3/29/17 | | | | 820,104 | | | 778,447 |
| | US TelePacific 5.75% 2/10/17 | | | | 696,210 | | | 695,887 |
| | Visant 5.25% 12/31/16 | | | | 156,875 | | | 156,078 |
| | Walter Energy Tranche B 4.00% 2/3/18 | | | | 997,500 | | | 998,847 |
| | Wyle Services 5.75% 3/31/17 | | | | 279,504 | | | 280,831 |
| Total Senior Secured Loans (cost $30,382,452) | | | | | | | 30,319,541 |
22
| | | | Principal amount° | | Value (U.S. $) |
| Sovereign Bonds – 0.85%Δ | | | | | | | |
| Australia – 0.48% | | | | | | | |
| | Australia Government Inflation-Linked Bond | | | | | | | |
| | 4.00% 8/20/15 | | AUD | | 286,000 | | $ | 549,469 |
| | | | | | | | | 549,469 |
| South Africa – 0.37% | | | | | | | |
| | South Africa Government Inflation-Linked Bond | | | | | | | |
| | 2.75% 1/31/22 | | ZAR | | 2,797,288 | | | 425,837 |
| | | | | | | | | 425,837 |
| Total Sovereign Bonds (cost $959,600) | | | | | | | 975,306 |
| | | | | | | | |
| Supranational Bank – 0.09% | | | | | | | |
| • | African Development Bank 0.603% 8/4/14 | | USD | | 100,000 | | | 100,837 |
| Total Supranational Bank (cost $100,609) | | | | | | | 100,837 |
| | | | | | | | |
| U.S. Treasury Obligation – 0.07% | | | | | | | |
| | U.S. Treasury Note 1.50% 6/30/16 | | | | 80,000 | | | 80,625 |
| Total U.S. Treasury Obligation (cost $79,200) | | | | | | | 80,625 |
| | | | | | | | |
| | | | Number of shares | | | |
| Convertible Preferred Stock – 0.00% | | | | | |
| | Bank of America 7.25% exercise price $50.00, | | | | | | | |
| | expiration date 12/31/49 | | | | 6 | | | 5,837 |
| Total Convertible Preferred Stock (cost $5,783) | | | | | | | 5,837 |
| | | | | | | | |
| | | | Principal amount° | | | |
| Short-Term Investments – 5.67% | | | | | | | |
| ≠Discount Notes – 2.76% | | | | | | | |
| | Federal Home Loan Bank | | | | | | | |
| | 0.006% 8/3/11 | | USD | | 399,487 | | | 399,487 |
| | 0.01% 8/11/11 | | | | 572,769 | | | 572,764 |
| | 0.015% 9/1/11 | | | | 15,535 | | | 15,534 |
| | 0.02% 9/20/11 | | | | 31,070 | | | 31,066 |
| | 0.04% 11/2/11 | | | | 31,070 | | | 31,060 |
| | 0.05% 8/6/11 | | | | 1,738,960 | | | 1,738,960 |
| | Freddie Mac | | | | | | | |
| | 0.001% 8/15/11 | | | | 264,116 | | | 264,113 |
| | 0.05% 11/2/11 | | | | 102,932 | | | 102,900 |
| | | | | | | | | 3,155,884 |
23
Statement of net assets
Delaware Diversified Floating Rate Fund
| | | | Principal amount° | | Value (U.S. $) |
| Short-Term Investments (continued) | | | | | | | | |
| Repurchase Agreement – 0.52% | | | | | | | | |
| | BNP Paribas 0.14%, dated 7/29/11, to be | | | | | | | | |
| | repurchased on 8/1/11, repurchase price $595,007 | | | | | | | | |
| | (collateralized by U.S. government obligations 3.875% | | | | | | | | |
| | 4/15/29; market value $606,946) | | USD | | 595,045 | | $ | 595,045 | |
| | | | | | | | | 595,045 | |
| ≠U.S. Treasury Obligations – 2.39% | | | | | | | | |
| | U.S. Treasury Bills | | | | | | | | |
| | 0.002% 8/11/11 | | | | 1,512,880 | | | 1,512,773 | |
| | 0.037% 8/4/11 | | | | 1,216,767 | | | 1,216,741 | |
| | | | | | | | | 2,729,514 | |
| Total Short-Term Investments (cost $6,480,609) | | | | | | | 6,480,443 | |
| | | | | | | | | |
| Total Value of Securities – 100.89% | | | | | | | | |
| | (cost $114,706,142) | | | | | | | 115,233,272 | |
| Liabilities Net of Receivables | | | | | | | | |
| | and Other Assets – (0.89%) | | | | | | | (1,019,706 | ) |
| | | | | | | | | | |
| Net Assets Applicable to 13,292,229 | | | | | | | | |
| | Shares Outstanding – 100.00% | | | | | | $ | 114,213,566 | |
| | | | | | | | | |
| Net Asset Value – Delaware Diversified Floating Rate Fund | | | | | | | | |
| | Class A ($55,208,846 / 6,424,207 Shares) | | | | | | | $8.59 | |
| Net Asset Value – Delaware Diversified Floating Rate Fund | | | | | | | | |
| | Class C ($25,768,300 / 2,999,376 Shares) | | | | | | | $8.59 | |
| Net Asset Value – Delaware Diversified Floating Rate Fund | | | | | | | | |
| | Class R ($5,222 / 608 Shares) | | | | | | | $8.59 | |
| Net Asset Value – Delaware Diversified Floating Rate Fund | | | | | | | | |
| | Institutional Class ($33,231,198 / 3,868,038 Shares) | | | | | | | $8.59 | |
| | | | | | | | | |
| Components of Net Assets at July 31, 2011: | | | | | | | | |
| Shares of beneficial interest (unlimited authorization – no par) | | | | $ | 114,426,145 | |
| Distributions in excess of net investment income | | | | | | | (83,896 | ) |
| Accumulated net realized loss on investments | | | | | | | (429,905 | ) |
| Net unrealized appreciation of investments and foreign currencies | | | | | 301,222 | |
| Total net assets | | | | | | $ | 114,213,566 | |
24
| |
| °Principal amount shown is stated in the currency in which each security is denominated. |
AUD — Australian Dollar
CHF — Swiss Franc
EUR — European Monetary Unit
USD — United States Dollar
ZAR — South African Rand
| • | Variable rate security. The rate shown is the rate as of July 31, 2011. Interest rates reset periodically. |
| # | Security exempt from registration under Rule 144A of the Securities Act of 1933, as amended. At July 31, 2011 the aggregate amount of Rule 144A securities was $14,541,724, which represented 12.73% of the Fund’s net assets. See Note 10 in “Notes to Financial Statements.” |
| Δ | Securities have been classified by country of origin. |
| « | Senior Secured Loans generally pay interest at rates which are periodically redetermined by reference to a base lending rate plus a premium. These base lending rates are generally: (i) the prime rate offered by one or more United States banks, (ii) the lending rate offered by one or more European banks such as the London Inter-Bank Offered Rate (LIBOR), and (iii) the certificate of deposit rate. Senior Secured Loans may be subject to restrictions on resale. Stated rate in effect at July 31, 2011. |
| ≠ | The rate shown is the effective yield at time of purchase. |
Summary of abbreviations:
ARM — Adjustable Rate Mortgage
BAML — Bank of America Merrill Lynch
BCLY — Barclays Bank
CDS — Credit Default Swap
HSBC — Hong Kong Shanghai Bank
JPMC — JPMorgan Chase Bank
MSC — Morgan Stanley Capital
REIT — Real Estate Investment Trust
REMIC — Real Estate Mortgage Investment Conduit
yr — Year
25
Statement of net assets
Delaware Diversified Floating Rate Fund
| | | |
| Net Asset Value and Offering Price Per Share – | | |
| Delaware Diversified Floating Rate Fund | | |
| Net asset value Class A (A) | $ | 8.59 |
| Sales charge (2.75% of offering price) (B) | | 0.24 |
| Offering price | $ | 8.83 |
| (A) | Net asset value per share, as illustrated, is the amount which would be paid upon redemption or repurchase of shares. |
| (B) | See the current prospectus for purchases of $100,000 or more. |
The following foreign currency exchange contracts and swap contracts were outstanding at July 31, 20111:
Foreign Currency Exchange Contracts
| | | | | | | | | | | | | | Unrealized |
| | | | | | | | | | | | | | Appreciation |
| Counterparty | | | Contracts to Receive (Deliver) | | In Exchange For | | Settlement Date | | (Depreciation) |
| BAML | | EUR | | 51,823 | | | USD | (74,516 | ) | | 8/1/11 | | | $ | (54 | ) |
| BCLY | | CHF | | 457,088 | | | USD | (570,000 | ) | | 9/2/11 | | | | 10,593 | |
| HSBC | | AUD | | (58,513 | ) | | USD | 63,209 | | | 9/2/11 | | | | (759 | ) |
| MSC | | EUR | | (691,849 | ) | | USD | 994,264 | | | 9/2/11 | | | | 776 | |
| | | | | | | | | | | | | | | $ | 10,556 | |
Swap Contracts
CDS Contracts
| | | | | | | | | | | | | Unrealized |
| | | | | | | | | Annual Protection | | Termination | | Appreciation |
| Counterparty | | | Swap Referenced Obligation | | Notional Value | | Payments | | Date | | (Depreciation) |
| | | Protection Purchased: | | | | | | | | | | | | | |
| BCLY | | ITRAXX Europe Subordinate | | | | | | | | | | | | | |
| | | Financials 15.1 5 yr CDS | | | $ 650,000 | | | 1.00% | | 6/20/16 | | | $ | 22,819 | |
| MSC | | ITRAXX Europe Subordinate | | | | | | | | | | | | | |
| | | Financials 15.1 5 yr CDS | | | 600,000 | | | 1.00% | | 6/20/16 | | | | 1,877 | |
| Total | | | | | $1,250,000 | | | | | | | | $ | 24,696 | |
26
| |
| Interest Rate Swap Contracts |
| | | | | | Fixed | | Floating | | | | | | |
| | | | | | Interest Rate | | Interest Rate | | | | Unrealized |
| Counterparty & | | | | | Received | | Received | | Termination | | Appreciation |
| Referenced Obligation | | | Notional Value | | (Paid) | | (Paid) | | Date | | (Depreciation) |
| JPMC | | | | | | | | | | | | | | |
| 7 yr Interest Rate Swap | | $ | 3,000,000 | | (2.603% | ) | | 0.246% | | 7/1/18 | | $ | (66,571 | ) |
| 10 yr Interest Rate Swap | | | 4,000,000 | | (3.198% | ) | | 0.246% | | 7/1/21 | | | (104,602 | ) |
| MSC | | | | | | | | | | | | | | |
| 3 yr Interest Rate Swap | | | 2,300,000 | | (1.105% | ) | | 0.246% | | 7/1/14 | | | (17,867 | ) |
| 5 yr Interest Rate Swap | | | 5,500,000 | | (1.953% | ) | | 0.246% | | 7/1/16 | | | (95,316 | ) |
| Total | | $ | 14,800,000 | | | | | | | | | $ | (284,356 | ) |
The use of foreign currency exchange contracts and swap contracts involves elements of market risk and risks in excess of the amounts recognized in the financial statements. The notional values presented above represent the Fund’s total exposure in such contracts, whereas only the net unrealized appreciation (depreciation) is reflected in the Fund’s net assets.
1See Note 8 in “Notes to financial statements.”
See accompanying notes, which are an integral part of the financial statements.
27
| Statement of operations | |
| Delaware Diversified Floating Rate Fund | Year Ended July 31, 2011 |
| Investment Income: | | | | | | | |
| Interest | | $ | 1,520,844 | | | | |
| Dividends | | | 217 | | $ | 1,521,061 | |
| | | | | | | | |
| Expenses: | | | | | | | |
| Management fees | | | 256,664 | | | | |
| Distribution expenses – Class A | | | 83,588 | | | | |
| Distribution expenses – Class C | | | 113,014 | | | | |
| Distribution expenses – Class R | | | 32 | | | | |
| Registration fees | | | 111,545 | | | | |
| Dividend disbursing and transfer agent fees and expenses | | | 69,356 | | | | |
| Reports and statements to shareholders | | | 27,148 | | | | |
| Accounting and administration expenses | | | 20,171 | | | | |
| Audit and tax | | | 11,412 | | | | |
| Pricing fees | | | 10,905 | | | | |
| Dues and services | | | 8,210 | | | | |
| Custodian fees | | | 7,701 | | | | |
| Legal fees | | | 6,044 | | | | |
| Trustees’ fees | | | 2,387 | | | | |
| Insurance | | | 247 | | | | |
| Consulting fees | | | 207 | | | | |
| Trustees’ expenses | | | 120 | | | 728,751 | |
| Less fees waived | | | | | | (124,760 | ) |
| Less waived distribution expenses – Class A | | | | | | (13,931 | ) |
| Less waived distribution expenses – Class R | | | | | | (7 | ) |
| Less expense paid indirectly | | | | | | (49 | ) |
| Total operating expenses | | | | | | 590,004 | |
| Net Investment Income | | | | | | 931,057 | |
| | | | | | | | |
| Net Realized and Unrealized Gain (Loss) on Investments | | | | | | | |
| and Foreign Currencies: | | | | | | | |
| Net realized gain (loss) on: | | | | | | | |
| Investments | | | | | | 85,162 | |
| Foreign currencies | | | | | | 12,144 | |
| Foreign currency contracts | | | | | | (43,443 | ) |
| Swap Contracts | | | | | | (454,067 | ) |
| Net realized loss | | | | | | (400,204 | ) |
| Net change in unrealized appreciation/depreciation of | | | | | | | |
| investments and foreign currencies | | | | | | 265,928 | |
| Net Realized and Unrealized Loss on Investments | | | | | | | |
| and Foreign Currencies | | | | | | (134,276 | ) |
| | | | | | | | |
| Net Increase in Net Assets Resulting from Operations | | | | | $ | 796,781 | |
See accompanying notes, which are an integral part of the financial statements.
29
Statements of changes in net assets
Delaware Diversified Floating Rate Fund
| | | Year | | 2/26/10* |
| | | Ended | | to |
| | | 7/31/11 | | 7/31/10 |
| Increase (Decrease) in Net Assets from Operations: | | | | | | | | |
| Net investment income | | $ | 931,057 | | | $ | 59,232 | |
| Net realized loss on investments and foreign currencies | | | (400,204 | ) | | | (75,520 | ) |
| Unrealized appreciation/depreciation | | | | | | | | |
| of investments and foreign currencies | | | 265,928 | | | | 35,294 | |
| Net increase in net assets resulting from operations | | | 796,781 | | | | 19,006 | |
| | | | | | | | | |
| Dividends and Distributions to Shareholders from: | | | | | | | | |
| Net investment income: | | | | | | | | |
| Class A | | | (556,521 | ) | | | (16,446 | ) |
| Class C | | | (145,889 | ) | | | (6,280 | ) |
| Class R | | | (107 | ) | | | (35 | ) |
| Institutional Class | | | (267,029 | ) | | | (36,059 | ) |
| | | | (969,546 | ) | | | (58,820 | ) |
| Capital Share Transactions: | | | | | | | | |
| Proceeds from shares sold: | | | | | | | | |
| Class A | | | 70,402,085 | | | | 3,329,802 | |
| Class C | | | 26,119,241 | | | | 1,754,712 | |
| Class R | | | 1 | | | | 5,028 | |
| Institutional Class | | | 40,446,138 | | | | 3,865,434 | |
| | | | | | | | | |
| Net asset value of shares issued upon reinvestment | | | | | | | | |
| of dividends and distributions: | | | | | | | | |
| Class A | | | 300,447 | | | | 11,100 | |
| Class C | | | 106,805 | | | | 5,272 | |
| Class R | | | 44 | | | | 41 | |
| Institutional Class | | | 218,783 | | | | 32,117 | |
| | | | 137,593,544 | | | | 9,003,506 | |
30
| | Year | | 2/26/10* |
| | Ended | | to |
| | 7/31/11 | | 7/31/10 |
| Capital Share Transactions (continued): | | | | | | | |
| Cost of shares repurchased: | | | | | | | |
| Class A | $ | (18,418,469 | ) | | $ | (360,801 | ) |
| Class C | | (2,127,988 | ) | | | (40,000 | ) |
| Institutional Class | | (10,733,235 | ) | | | (490,412 | ) |
| | | (31,279,692 | ) | | | (891,213 | ) |
| Increase in net assets derived from capital share transactions | | 106,313,852 | | | | 8,112,293 | |
| Net Increase in Net Assets | | 106,141,087 | | | | 8,072,479 | |
| | |
| Net Assets: | | | | | | | |
| Beginning of period | | 8,072,479 | | | | — | |
| End of period (including distributions in excess of net | | | | | | | |
| investment income of $83,896 and $3,336, respectively) | | $114,213,566 | | | | $8,072,479 | |
*Date of commencement of operations.
See accompanying notes, which are an integral part of the financial statements.
31
Financial highlights
Delaware Diversified Floating Rate Fund Class A
Selected data for each share of the Fund outstanding throughout each period was as follows:
| | | Year Ended | | 2/26/101 to | |
| | | 7/31/11 | | 7/31/10 | |
| Net asset value, beginning of period | | $ 8.490 | | | $ 8.500 | | |
| | | |
| Income (loss) from investment operations: | | | | | | | |
| Net investment income2 | | 0.166 | | | 0.088 | | |
| Net realized and unrealized gain (loss) on investments and | | | | | | | |
| foreign currencies | | 0.114 | | | (0.014 | ) | |
| Total from investment operations | | 0.280 | | | 0.074 | | |
| | | |
| Less dividends and distributions from: | | | | | | | |
| Net investment income | | (0.180 | ) | | (0.084 | ) | |
| Total dividends and distributions | | (0.180 | ) | | (0.084 | ) | |
| | | |
| Net asset value, end of period | | $ 8.590 | | | $ 8.490 | | |
| | | |
| Total return3 | | 3.33% | | | 0.87% | | |
| | | |
| Ratios and supplemental data: | | | | | | | |
| Net assets, end of period (000 omitted) | | $55,209 | | | $2,959 | | |
| Ratio of expenses to average net assets | | 1.05% | | | 1.04% | | |
| Ratio of expenses to average net assets | | | | | | | |
| prior to fees waived and expense paid indirectly | | 1.34% | | | 4.92% | | |
| Ratio of net investment income to average net assets | | 1.92% | | | 2.43% | | |
| Ratio of net investment income (loss) to average net assets | | | | | | | |
| prior to fees waived and expense paid indirectly | | 1.63% | | | (1.45% | ) | |
| Portfolio turnover | | 75% | | | 39% | | |
1 Date of commencement of operations; ratios have been annualized and total return and portfolio turnover have not been annualized. |
2 The average shares outstanding method has been applied for per share information. |
3 Total investment return is based on the change in net asset value of a share during the period and assumes reinvestment of dividends and distributions at net asset value and does not reflect the impact of a sales charge. Total investment return during both periods reflects waivers by the manager and the distributor. Performance would have been lower had the waivers not been in effect. |
See accompanying notes, which are an integral part of the financial statements.
32
Delaware Diversified Floating Rate Fund Class C
Selected data for each share of the Fund outstanding throughout each period was as follows:
| | | Year Ended | | 2/26/101 to | |
| | | 7/31/11 | | 7/31/10 | |
| Net asset value, beginning of period | | $ 8.490 | | | $ 8.500 | | |
| | | |
| Income (loss) from investment operations: | | | | | | | |
| Net investment income2 | | 0.102 | | | 0.062 | | |
| Net realized and unrealized gain (loss) on investments and | | | | | | | |
| foreign currencies | | 0.116 | | | (0.014 | ) | |
| Total from investment operations | | 0.218 | | | 0.048 | | |
| | | |
| Less dividends and distributions from: | | | | | | | |
| Net investment income | | (0.118 | ) | | (0.058 | ) | |
| Total dividends and distributions | | (0.118 | ) | | (0.058 | ) | |
| | | |
| Net asset value, end of period | | $ 8.590 | | | $ 8.490 | | |
| | | |
| Total return3 | | 2.58% | | | 0.56% | | |
| | | |
| Ratios and supplemental data: | | | | | | | |
| Net assets, end of period (000 omitted) | | $25,769 | | | $1,714 | | |
| Ratio of expenses to average net assets | | 1.80% | | | 1.79% | | |
| Ratio of expenses to average net assets | | | | | | | |
| prior to fees waived and expense paid indirectly | | 2.04% | | | 5.62% | | |
| Ratio of net investment income to average net assets | | 1.17% | | | 1.68% | | |
| Ratio of net investment income (loss) to average net assets | | | | | | | |
| prior to fees waived and expense paid indirectly | | 0.93% | | | (2.15% | ) | |
| Portfolio turnover | | 75% | | | 39% | | |
1 Date of commencement of operations; ratios have been annualized and total return and portfolio turnover have not been annualized. |
2 The average shares outstanding method has been applied for per share information. |
3 Total investment return is based on the change in net asset value of a share during the period and assumes reinvestment of dividends and distributions at net asset value and does not reflect the impact of a sales charge. Total investment return during both periods reflects a waiver by the manager. Performance would have been lower had the waiver not been in effect. |
See accompanying notes, which are an integral part of the financial statements.
33
Financial highlights
Delaware Diversified Floating Rate Fund Class R
Selected data for each share of the Fund outstanding throughout each period was as follows:
| | | Year Ended | | 2/26/101 to | |
| | | 7/31/11 | | 7/31/10 | |
| Net asset value, beginning of period | | $ 8.500 | | | $ 8.500 | | |
| | | |
| Income (loss) from investment operations: | | | | | | | |
| Net investment income2 | | 0.145 | | | 0.079 | | |
| Net realized and unrealized gain (loss) on investments and | | | | | | | |
| foreign currencies | | 0.106 | 3 | | (0.004 | ) | |
| Total from investment operations | | 0.251 | 3 | | 0.075 | | |
| | | |
| Less dividends and distributions from: | | | | | | | |
| Net investment income | | (0.161 | ) | | (0.075 | ) | |
| Total dividends and distributions | | (0.161 | ) | | (0.075 | ) | |
| | | |
| Net asset value, end of period | | $ 8.590 | 3 | | $ 8.500 | | |
| | | |
| Total return4 | | 2.96% | | | 0.89% | | |
| | | |
| Ratios and supplemental data: | | | | | | | |
| Net assets, end of period (000 omitted) | | $5 | | | $5 | | |
| Ratio of expenses to average net assets | | 1.30% | | | 1.29% | | |
| Ratio of expenses to average net assets | | | | | | | |
| prior to fees waived and expense paid indirectly | | 1.64% | | | 5.22% | | |
| Ratio of net investment income to average net assets | | 1.67% | | | 2.18% | | |
| Ratio of net investment income (loss) to average net assets | | | | | | | |
| prior to fees waived and expense paid indirectly | | 1.33% | | | (1.75% | ) | |
| Portfolio turnover | | 75% | | | 39% | | |
1 Date of commencement of operations; ratios have been annualized and total return and portfolio turnover have not been annualized. |
2 The average shares outstanding method has been applied for per share information. |
3 Includes adjustments from the period ending July 31, 2010 in the amount of $9 (or $0.010 per share) which impacted total return by -0.12%. The adjustment is to correct a mis-allocation of distributions among share classes which had no impact on distribution amounts reported and paid to shareholders. |
4 Total investment return is based on the change in net asset value of a share during the period and assumes reinvestment of dividends and distributions at net asset value. Total investment return during both periods reflects waivers by the manager and the distributor. Performance would have been lower had the waivers not been in effect. |
See accompanying notes, which are an integral part of the financial statements.
34
Delaware Diversified Floating Rate Fund Institutional Class
Selected data for each share of the Fund outstanding throughout each period was as follows:
| | | Year Ended | | 2/26/101 to | |
| | | 7/31/11 | | 7/31/10 | |
| Net asset value, beginning of period | | $ 8.490 | | | $ 8.500 | | |
| | | |
| Income (loss) from investment operations: | | | | | | | |
| Net investment income2 | | 0.187 | | | 0.098 | | |
| Net realized and unrealized gain (loss) on investments and | | | | | | | |
| foreign currencies | | 0.117 | | | (0.016 | ) | |
| Total from investment operations | | 0.304 | | | 0.082 | | |
| | | |
| Less dividends and distributions from: | | | | | | | |
| Net investment income | | (0.204 | ) | | (0.092 | ) | |
| Total dividends and distributions | | (0.204 | ) | | (0.092 | ) | |
| | | |
| Net asset value, end of period | | $ 8.590 | | | $ 8.490 | | |
| | | |
| Total return3 | | 3.61% | | | 0.97% | | |
| | | |
| Ratios and supplemental data: | | | | | | | |
| Net assets, end of period (000 omitted) | | $33,231 | | | $3,394 | | |
| Ratio of expenses to average net assets | | 0.80% | | | 0.79% | | |
| Ratio of expenses to average net assets | | | | | | | |
| prior to fees waived and expense paid indirectly | | 1.04% | | | 4.62% | | |
| Ratio of net investment income to average net assets | | 2.17% | | | 2.68% | | |
| Ratio of net investment income (loss) to average net assets | | | | | | | |
| prior to fees waived and expense paid indirectly | | 1.93% | | | (1.15% | ) | |
| Portfolio turnover | | 75% | | | 39% | | |
1 Date of commencement of operations; ratios have been annualized and total return and portfolio turnover have not been annualized. |
2 The average shares outstanding method has been applied for per share information. |
3 Total investment return is based on the change in net asset value of a share during the period and assumes reinvestment of dividends and distributions at net asset value. Total investment return during both periods reflects a waiver by the manager. Performance would have been lower had the waiver not been in effect. |
See accompanying notes, which are an integral part of the financial statements.
35
| Notes to financial statements | |
| Delaware Diversified Floating Rate Fund | July 31, 2011 |
Delaware Group® Income Funds (Trust) is organized as a Delaware statutory trust and offers five Series: Delaware Core Bond Fund, Delaware Corporate Bond Fund, Delaware Diversified Floating Rate Fund, Delaware Extended Duration Bond Fund and Delaware High-Yield Opportunities Fund. These financial statements and the related notes pertain to Delaware Diversified Floating Rate Fund (Fund). The Trust is an open-end investment company. The Fund is considered diversified under the Investment Company Act of 1940, as amended, and offers Class A, Class C, Class R and Institutional Class shares. Class A shares are sold with a maximum front-end sales charge of up to 2.75%. Class A share purchases of $1,000,000 or more will incur a contingent deferred sales charge (CDSC) of 0.75% if redeemed during the first year provided that Delaware Distributors, L.P. (DDLP) paid a financial advisor a commission on the purchase of those shares. Class C shares are sold with a CDSC of 1%, if redeemed during the first twelve months. Class R and Institutional Class shares are not subject to a sales charge and are offered for sale exclusively to certain eligible investors.
The investment objective of the Fund is to seek total return.
1. Significant Accounting Policies
The following accounting policies are in accordance with U.S. generally accepted accounting principles (U.S. GAAP) and are consistently followed by the Fund.
Security Valuation — U.S. government and agency securities are valued at the mean between the bid and ask prices. Securities listed on a foreign exchange are valued at the last quoted sales price on the valuation date. Short-term debt securities are valued at market value. Other debt securities, credit default swaps (CDS) contracts and interest rate swap contracts are valued based upon valuations provided by an independent pricing service or broker and reviewed by management. To the extent current market prices are not available, the pricing service may take into account developments related to the specific security, as well as transactions in comparable securities. Foreign currency exchange contracts are valued at the mean between the bid and ask prices. Interpolated values are derived when the settlement date of the contract is an interim date for which quotations are not available. Generally, other securities and assets for which market quotations are not readily available are valued at fair value as determined in good faith under the direction of the Fund’s Board of Trustees (Board). In determining whether market quotations are readily available or fair valuation will be used, various factors will be taken into consideration, such as market closures or suspension of trading in a security. The Fund may use fair value pricing more frequently for securities traded primarily in non-U.S. markets because, among other things, most foreign markets close well before the Fund values its securities, generally as of 4:00 p.m. Eastern time. The earlier close of these foreign markets gives rise to the possibility that significant events, including broad market moves, government actions or pronouncements, aftermarket trading, or news events may have occurred in the interim. To account for this, the Fund may frequently value foreign securities using fair value prices based on third-party vendor modeling tools (international fair value pricing).
36
Federal Income Taxes — No provision for federal income taxes has been made as the Fund intends to continue to qualify for federal income tax purposes as a regulated investment company under Subchapter M of the Internal Revenue Code of 1986, as amended, and make the requisite distributions to shareholders. The Fund evaluates tax positions taken or expected to be taken in the course of preparing the Fund’s tax returns to determine whether the tax positions are “more-likely-than-not” of being sustained by the applicable tax authority. Tax positions not deemed to meet the more-likely-than-not threshold are recorded as a tax benefit or expense in the current year. Management has analyzed the Fund’s tax positions taken on federal income tax returns for all open tax years (July 31, 2010-July 31, 2011), and has concluded that no provision for federal income tax is required in the Fund’s financial statements.
Class Accounting — Investment income and common expenses are allocated to the various classes of the Fund on the basis of “settled shares” of each class in relation to the net assets of the Fund. Realized and unrealized gain (loss) on investments are allocated to the various classes of the Fund on the basis of daily net assets of each class. Distribution expenses relating to a specific class are charged directly to that class.
Repurchase Agreements — The Fund may purchase certain U.S. Government securities subject to the counterparty’s agreement to repurchase them at an agreed upon date and price. The counterparty will be required on a daily basis to maintain the value of the collateral subject to the agreement at not less than the repurchase price (including accrued interest). The agreements are conditioned upon the collateral being deposited under the Federal Reserve book-entry system with the Fund’s custodian or a third party sub-custodian. In the event of default or bankruptcy by the other party to the agreement, retention of the collateral may be subject to legal proceedings. All open repurchase agreements were entered into on July 29, 2011.
Mortgage Dollar Rolls — The Fund may enter into mortgage “dollar rolls” in which the Fund sells mortgage-backed securities for delivery in the current month and simultaneously contracts to repurchase substantially similar (same type, coupon, and maturity) securities on a specified future date. Any difference between the sale price and the purchase price is netted against the interest income foregone on the securities to arrive at an implied borrowing (reverse repurchase) rate. Alternatively, the sale and purchase transactions that constitute the dollar roll can be executed at the same price, with the Fund being paid a fee as consideration for entering into the commitment to purchase. Dollar rolls may be renewed prior to cash settlement and initially may involve only a firm commitment by the Fund to buy a security. The Fund accounts for mortgage-dollar-roll transactions as purchases and sales. These transactions will increase the Fund’s portfolio turnover rate. There were no mortgage dollar rolls open at the end of the year.
Foreign Currency Transactions — Transactions denominated in foreign currencies are recorded at the prevailing exchange rates on the valuation date in accordance with the Fund’s prospectus. The value of all assets and liabilities denominated in foreign currencies is translated into U.S. dollars at the exchange rate of such currencies against the U.S. dollar daily. Transaction
37
Notes to financial statements
Delaware Diversified Floating Rate Fund
1. Significant Accounting Policies (continued)
gains or losses resulting from changes in exchange rates during the reporting period or upon settlement of the foreign currency transaction are reported in operations for the current period. The Fund generally isolates that portion of realized gains and losses on investments in debt securities which is due to changes in foreign exchange rates from that which is due to changes in market prices of debt securities. The Fund reports certain foreign currency related transactions as components of realized gains (losses) for financial reporting purposes, whereas such components are treated as ordinary income (loss) for federal income tax purposes.
Use of Estimates — The preparation of financial statements in conformity with U.S. GAAP requires management to make estimates and assumptions that affect the reported amounts of assets and liabilities and disclosure of contingent assets and liabilities at the date of the financial statements and the reported amounts of revenues and expenses during the reporting period. Actual results could differ from those estimates and the differences could be material.
Other — Expenses directly attributable to the Fund are charged directly to the Fund. Other expenses common to various funds within the Delaware Investments® Family of Funds are generally allocated amongst such funds on the basis of average net assets. Management fees and some other expenses are paid monthly. Security transactions are recorded on the date the securities are purchased or sold (trade date) for financial reporting purposes. Costs used in calculating realized gains and losses on the sale of investment securities are those of the specific securities sold. Dividend income is recorded on the ex-dividend date and interest income is recorded on the accrual basis. Discounts and premiums on non-convertible debt securities are amortized to interest income over the lives of the respective securities. Realized gains (losses) on paydowns of mortgage- and asset-backed securities are classified as interest income. The Fund declares dividends daily from net investment income and pays dividends monthly and declares and pays distributions from net realized gain on investments, if any, annually. The Fund may distribute income dividends and capital gains more frequently, if necessary for tax purposes. Dividends and distributions, if any, are recorded on the ex-dividend date.
The Fund may receive earnings credits from its custodian when positive cash balances are maintained, which are used to offset custody fees. There were no earnings credits for the year ended July 31, 2011.
The Fund receives earnings credits from its transfer agent when positive cash balances are maintained, which are used to offset transfer agent fees. The expense paid under this arrangement is included in dividend disbursing and transfer agent fees and expenses on the statement of operations with the corresponding expense offset shown as “expense paid indirectly.” For the year ended July 31, 2011, the Fund earned $49 under this agreement.
38
2. Investment Management, Administration Agreements and Other Transactions with Affiliates
In accordance with the terms of its investment management agreement, the Fund pays Delaware Management Company (DMC), a series of Delaware Management Business Trust and the investment manager, an annual fee which is calculated daily at the rate of 0.50% on the first $500 million of average daily net assets of the Fund, 0.475% on the next $500 million, 0.45% on the next $1.5 billion, and 0.425% on average daily net assets in excess of $2.5 billion.
DMC has contractually agreed to waive that portion, if any, of its management fee and/or pay/reimburse the Fund to the extent necessary to ensure that total annual operating expenses, (excluding any 12b-1 plan expenses and certain nonroutine expenses), do not exceed 0.80% of average daily net assets of the Fund through November 30, 2011. For purposes of this waiver and reimbursement, nonroutine expenses may also include such additional costs and expenses, as may be agreed upon from time to time by the Fund’s Board and DMC. This expense waiver and reimbursement applies only to expenses paid directly by the Fund.
Delaware Service Company, Inc. (DSC), an affiliate of DMC, provides fund accounting and financial administration oversight services to the Fund. For these services, the Fund pays DSC fees based on the aggregate daily net assets of the Delaware Investments® Family of Funds at the following annual rate: 0.0050% of the first $30 billion; 0.0045% of the next $10 billion; 0.0040% of the next $10 billion; and 0.0025% of aggregate average daily net assets in excess of $50 billion. The fees payable to DSC under the service agreement described above are allocated among all Funds in the Delaware Investments® Family of Funds on a relative net asset value basis. For the year ended July 31, 2011, the Fund was charged $2,538 for these services.
DSC also provides dividend disbursing and transfer agency services. The Fund paid DSC a monthly fee based on the number of shareholder accounts for dividend disbursing and transfer agent services. Effective July 18, 2011, the Fund pays DSC a monthly asset-based fee for these services.
Pursuant to a distribution agreement and distribution plan, the Fund pays DDLP, the distributor and an affiliate of DMC, an annual distribution and service fee not to exceed 0.30% of the average daily net assets of the Class A shares, 1.00% of the average daily net assets of the C shares and 0.60% of the average daily net assets of Class R shares. Institutional Class shares pay no distribution and service expenses. DDLP has contracted to limit the Class A and Class R shares’ 12b-1 fees through November 30, 2011 to no more than 0.25% and 0.50% of average daily net assets, respectively.
39
Notes to financial statements
Delaware Diversified Floating Rate Fund
2. Investment Management, Administration Agreements and Other Transactions with Affiliates (continued)
At July 31, 2011, the Fund had liabilities payable to affiliates as follows:
| Investment management fees payable to DMC | $26,468 |
| Dividend disbursing, transfer agent and fund accounting | |
| oversight fees and other expenses payable to DSC | 3,853 |
| Distribution fees payable to DDLP | 32,920 |
| Other expenses payable to DMC and affiliates* | 1,723 |
*DMC, as part of its administrative services, pays operating expenses on behalf of the Fund and is reimbursed on a periodic basis. Expenses include items such as printing of shareholder reports, fees for audit, legal and tax services, registration fees and trustees’ fees.
As provided in the investment management agreement, the Fund bears the cost of certain legal and tax services, including internal legal and tax services provided to the Fund by DMC and/or its affiliates’ employees. For the year ended July 31, 2011, the Fund was charged $1,480 for internal legal and tax services provided by DMC and/or its affiliates’ employees.
For the year ended July 31, 2011, DDLP earned $9,557 for commissions on sales of the Fund’s Class A shares. For the year ended July 31, 2011, DDLP received gross CDSC commissions of $750 and $5,234 on redemption of the Fund’s Class A and Class C shares, respectively, and these commissions were entirely used to offset up-front commissions previously paid by DDLP to broker/dealers on sales of those shares.
Trustees’ fees include expenses accrued by the Fund for each Trustee’s retainer and meeting fees. Certain officers of DMC, DSC and DDLP are officers and/or Trustees of the Trust. These officers and Trustees are paid no compensation by the Fund.
3. Investments
For the year ended July 31, 2011, the Fund made purchases of $136,601,107 and sales of $36,264,301 of investment securities other than U.S. government securities and short-term investments. For the year ended July 31, 2011, the Fund made purchases of $663,689 and sales of $628,464 of long-term U.S. government securities.
At July 31, 2011, the cost of investments for federal income tax purposes was $114,735,467. At July 31, 2011, net unrealized appreciation was $497,805, of which $877,408 related to unrealized appreciation of investments and $379,603 related to unrealized depreciation of investments.
U.S. GAAP defines fair value as the price that the Fund would receive to sell an asset or pay to transfer a liability in an orderly transaction between market participants at the measurement date under current market conditions. A three level hierarchy for fair value measurements has been established based upon the transparency of inputs to the valuation of an asset or liability. Inputs may be observable or unobservable and refer broadly to the assumptions that market participants would use in pricing the asset or liability. Observable inputs reflect the assumptions
40
market participants would use in pricing the asset or liability based on market data obtained from sources independent of the reporting entity. Unobservable inputs reflect the reporting entity’s own assumptions about the assumptions that market participants would use in pricing the asset or liability developed based on the best information available under the circumstances. The Fund’s investment in its entirety is assigned a level based upon the observability of the inputs which are significant to the overall valuation. The three level hierarchy of inputs is summarized below.
| Level 1 – | inputs are quoted prices in active markets for identical investments (e.g., equity securities, open-end investment companies, futures contracts, options contracts) |
| | |
| Level 2 – | other observable inputs (including, but not limited to: quoted prices for similar assets or liabilities in markets that are active, quoted prices for identical or similar assets or liabilities in markets that are not active, inputs other than quoted prices that are observable for the assets or liabilities (such as interest rates, yield curves, volatilities, prepayment speeds, loss severities, credit risks and default rates) or other market-corroborated inputs) (e.g., debt securities, government securities, swap contracts, foreign currency exchange contracts, foreign securities utilizing international fair value pricing) |
| | |
| Level 3 – | inputs are significant unobservable inputs (including the Fund’s own assumptions used to determine the fair value of investments) (e.g., broker-quoted securities, fair valued securities) |
The following table summarizes the valuation of the Fund’s investments by fair value hierarchy levels as of July 31, 2011:
| | Level 1 | | Level 2 | | Total |
| Agency, Asset-Backed & | | | | | | | | | | |
| Mortgage-Backed Securities | $ | — | | $ | 8,432,675 | | | $ | 8,432,675 | |
| Corporate Debt | | — | | | 95,942,145 | | | | 95,942,145 | |
| Foreign Debt | | — | | | 1,426,453 | | | | 1,426,453 | |
| Municipal Bonds | | — | | | 2,870,931 | | | | 2,870,931 | |
| U.S. Treasury Obligations | | — | | | 80,625 | | | | 80,625 | |
| Short-Term Investments | | 595,045 | | | 5,885,398 | | | | 6,480,443 | |
| Total | $ | 595,045 | | $ | 114,638,227 | | | $ | 115,233,272 | |
| | |
| Foreign Currency Exchange Contracts | $ | — | | $ | 10,556 | | | $ | 10,556 | |
| Swap Contracts | $ | — | | $ | (259,660 | ) | | $ | (259,660 | ) |
There were no unobservable inputs used to value investments at the beginning or end of the year.
During the year ended July 31, 2011, there were no transfers between Level 1 investments, Level 2 investments, or Level 3 investments that had a material impact to the Fund.
41
Notes to financial statements
Delaware Diversified Floating Rate Fund
4. Dividend and Distribution Information
Income and long-term capital gain distributions are determined in accordance with federal income tax regulations, which may differ from U.S. GAAP. Additionally, distributions from net gains on foreign currency transactions and net short-term gains on sales of investment securities are treated as ordinary income for federal income tax purposes. The tax character of dividends and distributions paid during the year ended July 31, 2011 and the period February 26, 2010 through July 31, 2010 was as follows:
| | | Year | | 2/26/10* |
| | | Ended | | to |
| | | 7/31/11 | | 7/31/10 |
| Ordinary income | | $ | 969,546 | | $ | 58,820 |
*Date of commencement of operations.
5. Components of Net Assets on a Tax Basis
As of July 31, 2011, the components of net asset on a tax basis were as follows:
| Shares of beneficial interest | $ | 114,426,145 | |
| Undistributed ordinary income | | 50,300 | |
| Distributions payable | | (53,005 | ) |
| Post-October losses | | (371,933 | ) |
| Capital loss carryforwards | | (37,551 | ) |
| Other temporary differences | | (14,008 | ) |
| Unrealized appreciation of investments and foreign currencies | | 213,618 | |
| Net assets | $ | 114,213,566 | |
The differences between book basis and tax basis components of net assets are primarily attributable to tax deferral of losses on wash sales, mark-to-market of forward foreign currency contracts, tax treatment of CDS and interest rate swap contracts, tax treatment of distribution payable, tax treatment of contingent payment on debt instruments, tax deferral of losses on straddles and tax treatment of market discount and premium on debt instruments.
Post-October losses represent losses realized on investment transactions from November 1, 2010 through July 31, 2011 that, in accordance with federal income tax regulations, the Fund has elected to defer and treat as having arisen in the following year.
For financial reporting purposes, capital accounts are adjusted to reflect the tax character of permanent book/tax differences. Reclassifications are primarily due to tax treatment of gain (loss) on foreign currency transactions, market discount and premium on certain debt instruments, paydowns of mortgage- and asset-backed securities and tax treatment of CDS and interest rate swap contracts. Results of operations and net assets were not affected by these reclassifications. For the year ended July 31, 2011, the Fund recorded the following reclassifications:
| Undistributed net investment income | | $ | (42,071 | ) |
| Accumulated net realized loss | | | 42,071 | |
42
For federal income tax purposes, capital loss carryforwards may be carried forward and applied against future capital gains. $30,279 was utilized in 2011. Capital loss carryforwards remaining at July 31, 2011 will expire as follows: $37,551 expires in 2018.
On December 22, 2010, the Regulated Investment Company Modernization Act of 2010 (the “Act”) was enacted, which changed various technical rules governing the tax treatment of regulated investment companies. The changes are generally effective for taxable years beginning after the date of enactment. Under the Act, the Fund will be permitted to carry forward capital losses incurred in taxable years beginning after the date of enactment for an unlimited period. However, any losses incurred during those future taxable years will be required to be utilized prior to the losses incurred in pre-enactment taxable years, which carry an expiration date. As a result of this ordering rule, pre-enactment capital loss carryforwards may be more likely to expire unused. Additionally, post-enactment capital loss carryforwards will retain their character as either short-term or long-term capital losses rather than being considered all short-term as permitted under previous regulation.
6. Capital Shares
Transactions in capital shares were as follows:
| | | Year | | 2/26/10* |
| | | Ended | | to |
| | | 7/31/11 | | 7/31/10 |
| Shares sold: | | | | | | |
| Class A | | 8,177,801 | | | 390,040 | |
| Class C | | 3,032,005 | | | 206,104 | |
| Class R | | — | ** | | 592 | |
| Institutional Class | | 4,686,554 | | | 454,149 | |
| | | | | | | |
| Shares issued upon reinvestment of dividends and distributions: | |
| Class A | | 34,854 | | | 1,312 | |
| Class C | | 12,399 | | | 623 | |
| Class R | | 11 | | | 5 | |
| Institutional Class | | 25,419 | | | 3,778 | |
| | | 15,969,043 | | | 1,056,603 | |
| | | | | | | |
| Shares Repurchased: | | | | | | |
| Class A | | (2,137,077 | ) | | (42,723 | ) |
| Class C | | (247,017 | ) | | (4,738 | ) |
| Institutional Class | | (1,243,757 | ) | | (58,105 | ) |
| | | (3,627,851 | ) | | (105,566 | ) |
| Net increase | | 12,341,192 | | | 951,037 | |
*Date of commencement of operations.
**Share rounds to less than 1.
43
Notes to financial statements
Delaware Diversified Floating Rate Fund
7. Line of Credit
The Fund, along with certain other funds in the Delaware Investments® Family of Funds (Participants), was a participant in a $35,000,000 revolving line of credit to be used for temporary or emergency purposes as an additional source of liquidity to fund redemptions of investor shares. Under the agreement, the Participants were charged an annual commitment fee, which was allocated across the Participants on the basis of each Participant’s allocation of the entire facility. The Participants were permitted to borrow up to a maximum of one third of their net assets under the agreement. The line of credit expired on November 16, 2010.
On November 16, 2010, the Fund, along with the other Participants, entered into an amendment to the agreement for a $50,000,000 revolving line of credit. Effective as of August 1, 2011, the Fund, along with the other Participants, entered into an amendment to the agreement for a $100,000,000 revolving line of credit. The agreement as amended is to be used as described above and operates in substantially the same manner as the original agreement. The new line of credit under the agreement as amended expires on November 15, 2011. The Fund had no amounts outstanding as of July 31, 2011 or at any time during the year then ended.
8. Derivatives
U.S. GAAP requires enhanced disclosures that enable investors to understand: 1) how and why an entity uses derivatives; 2) how they are accounted for; and 3) how they affect an entity’s results of operations and financial position.
Foreign Currency Exchange Contracts — The Fund may enter into foreign currency exchange contracts as a way of managing foreign exchange rate risk. The Fund may enter into these contracts to fix the U.S. dollar value of a security that it has agreed to buy or sell for the period between the date the trade was entered into and the date the security is delivered and paid for. The Fund may also use these contracts to hedge the U.S. dollar value of securities it already owns that are denominated in foreign currencies. The change in value is recorded as an unrealized gain or loss. When the contract is closed, a realized gain or loss is recorded equal to the difference between the value of the contract at the time it was opened and the value at the time it was closed.
The use of foreign currency exchange contracts does not eliminate fluctuations in the underlying prices of the securities, but does establish a rate of exchange that can be achieved in the future. Although foreign currency exchange contracts limit the risk of loss due to an unfavorable change in the value of the hedged currency, they also limit any potential gain that might result should the value of the currency change favorably. In addition, the Fund could be exposed to risks if the counterparties to the contracts are unable to meet the terms of their contracts. The Fund’s maximum risk of loss from counterparty credit risk is the value of its currency exchanged with the counterparty. The risk is generally mitigated by having a netting arrangement between the Fund and the counterparty and by the posting of collateral by the counterparty to the Fund to cover the Fund’s exposure to the counterparty.
44
Swap Contracts — The Fund may enter into interest rate swap contracts and CDS contracts in the normal course of pursuing its investment objectives. The Fund may use interest rate swaps to adjust the Fund’s sensitivity to interest rates or to hedge against changes in interest rates. The Fund may enter into CDS contracts in order to hedge against a credit event, to enhance total return or to gain exposure to certain securities or markets.
Interest Rate Swaps. An interest rate swap contract is an exchange of interest rates between counterparties. In one instance, an interest rate swap involves payments received by the Fund from another party based on a variable or floating interest rate, in return for making payments based on a fixed interest rate. An interest rate swap can also work in reverse with the Fund receiving payments based on a fixed interest rate and making payments based on a variable or floating interest rate. Interest rate swaps may be used to adjust the Fund’s sensitivity to interest rates or to hedge against changes in interest rates. Periodic payments on such contracts are accrued daily and recorded as unrealized appreciation/depreciation on swap contracts. Upon periodic payment/receipt or termination of the contract, such amounts are recorded as realized gains or losses on swap contracts. The Fund’s maximum risk of loss from counterparty credit risk is the discounted net value of the cash flows to be received from/paid to the counterparty over the interest rate swap contract’s remaining life, to the extent that the amount is positive. This risk is mitigated by having a netting arrangement between the Fund and the counterparty and by the posting of collateral by the counterparty to the Fund to cover the Fund’s exposure to the counterparty.
Credit Default Swaps. A CDS contract is a risk-transfer instrument through which one party (purchaser of protection) transfers to another party (seller of protection) the financial risk of a credit event (as defined in the CDS agreement), as it relates to a particular referenced security or basket of securities (such as an index). In exchange for the protection offered by the seller of protection, the purchaser of protection agrees to pay the seller of protection a periodic amount at a stated rate that is applied to the notional amount of the CDS contract. In addition, an upfront payment may be made or received by the Fund in connection with an unwinding or assignment of a CDS contract. Upon the occurrence of a credit event, the seller of protection would pay the par (or other agreed-upon) value of the referenced security (or basket of securities) to the counterparty. Credit events generally include, among others, bankruptcy, failure to pay, and obligation default.
During the year ended July 31, 2011, the Fund entered into CDS contracts as a purchaser of protection. Periodic payments on such contracts are accrued daily and recorded as unrealized losses on swap contracts. Upon payment, such amounts are recorded as realized losses on swap contracts. Upfront payments made or received in connection with CDS contracts are amortized over the expected life of the CDS contracts as unrealized losses (gains) on swap contracts. The change in value of CDS contracts is recorded as unrealized appreciation or depreciation daily. A realized gain or loss is recorded upon a credit event (as defined in the CDS agreement) or the maturity or termination of the agreement. For the year ended July 31, 2011, the Fund did not enter
45
Notes to financial statements
Delaware Diversified Floating Rate Fund
8. Derivatives (continued)
into any CDS contracts as a seller of protection. At July 31, 2011, the net unrealized appreciation of credit default swaps was $24,696. The Fund posted $210,000 as collateral for certain open derivatives. If a credit event had occurred for all swap transactions where collateral posting was required as of July 31, 2011, the swaps’ credit-risk-related contingent features would have been triggered and the Fund would have received $1,250,000 less the value of the contracts’ related reference obligations. The Fund received securities collateral of $111,000 for certain open derivatives.
CDS contracts may involve greater risks than if the Fund had invested in the reference obligation directly. CDS are subject to general market risk, liquidity risk, counterparty risk and credit risk. The Fund’s maximum risk of loss from counterparty credit risk, either as the seller of protection or the buyer of protection, is the fair value of the contract. This risk is mitigated by having a netting arrangement between the Fund and the counterparty and by the posting of collateral by the counterparty to the Fund to cover the Fund’s exposure to the counterparty.
Swaps Generally. Because there is no organized market for swap contracts, the value of open swaps may differ from that which would be realized in the event each Fund terminated its position in the agreement. Risks of entering into these contracts include the potential inability of the counterparty to meet the terms of the contracts. This type of risk is generally limited to the amount of favorable movement in the value of the underlying security, instrument or basket of instruments, if any, at the day of default. Risks also arise from potential losses from adverse market movements and such losses could exceed the unrealized amounts shown on the statement of net assets.
Fair values of derivative instruments as of July 31, 2011 were as follows:
| | | Asset Derivatives | | Liability Derivatives |
| | | Statement of Net | | | | Statement of Net | | | | |
| | | Assets Location | | Fair value | | Assets Location | | Fair value |
| Forward currency exchange contracts | | | | | | | | | | |
| (Foreign currency exchange contracts) | | Liabilities net of receivables and other assets | | $11,369 | | Liabilities net of receivables and other assets | | $ | (813 | ) |
Credit and interest contracts
(Swap contracts) | | Liabilities net of receivables and other assets | | 22,819 | | Liabilities net of receivables and other assets | | | (282,479 | ) |
| Total | | | | $34,188 | | | | $ | (283,292 | ) |
46
The effect of derivative instruments on the statement of operations for the year ended July 31, 2011 was as follows:
| | | | | | | | Change in Unrealized |
| | | | Realized Gain | | Appreciation |
| | | | or Loss on | | or Depreciation |
| | Location of Gain or Loss on | | Derivatives | | on Derivatives |
| | Derivatives Recognized in | | Recognized in | | Recognized in |
| | Income | | Income | | Income |
| Forward currency exchange contracts | | | | | | | | | |
| (Foreign currency exchange contracts) | Net realized loss on foreign currency contracts and net change in unrealized appreciation/depreciation of investments and foreign currencies | | $ | (43,443 | ) | | | | $ 10,362 | |
| Credit and interest contracts | | | | | | | | | |
| (Swap contracts) | Net realized loss on swap contracts and net change in unrealized appreciation/ depreciation of investments and foreign currencies | | | (454,067 | ) | | | | (272,336 | ) |
| Total | | | $ | (497,510 | ) | | | | $(261,974 | ) |
The volume of derivative transactions varies throughout the period. Information about derivative transactions reflected is as of the date of this report and generally similar to the volume of derivative activity during the year ended July 31, 2011.
9. Securities Lending
The Fund, along with other funds in the Delaware Investments® Family of Funds, may lend its securities pursuant to a security lending agreement (Lending Agreement) with the Bank of New York Mellon (BNY Mellon). At the time a security is loaned, the borrower must post collateral equal to the required percentage of the market value of the loaned security, including any accrued interest. The required percentage is: (i) 102% with respect to U.S. securities and foreign securities that are denominated and payable in U.S. dollars; and (ii) 105% with respect to foreign securities. With respect to each loan, if on any business day the aggregate market value of securities collateral plus cash collateral held is less than the aggregate market value of the securities which are the subject of such loan, the borrower will be notified to provide additional collateral by the end of the following business day which, together with the collateral already held, will be not less
47
Notes to financial statements
Delaware Diversified Floating Rate Fund
9. Securities Lending (continued)
than the applicable initial collateral requirements for such security loan. If the aggregate market value of securities collateral and cash collateral held with respect to a security loan exceeds the applicable initial collateral requirement, upon request of the borrower BNY Mellon must return enough collateral to the borrower by the end of the following business day to reduce the value of the remaining collateral to the applicable initial collateral requirement for such security loan. As a result of the foregoing, the value of the collateral held with respect to a loaned security may be temporarily more or less than the value of the security on loan.
Cash collateral received is generally invested in the Delaware Investments Collateral Fund No. 1 (Collective Trust) established by BNY Mellon for the purpose of investment on behalf of funds managed by DMC that participate in BNY Mellon’s securities lending program. The Collective Trust may invest in U.S. government securities and high quality corporate debt, asset-backed and other money market securities and in repurchase agreements collateralized by such securities, provided that the Collective Trust will generally have a dollar-weighted average portfolio maturity of 60 days or less. The Collective Trust seeks to maintain a net asset value per unit of $1.00, but there can be no assurance that it will always be able to do so. The Fund may incur investment losses as a result of investing securities lending collateral in the Collective Trust. This could occur if an investment in the Collective Trust defaulted or if it were necessary to liquidate assets in the Collective Trust to meet returns on outstanding security loans at a time when the Collective Trust’s net asset value per unit was less than $1.00. Under those circumstances, the Fund may not receive an amount from the Collective Trust that is equal in amount to the collateral the Fund would be required to return to the borrower of the securities and the Fund would be required to make up for this shortfall. The Fund can also accept U.S. government securities and letters of credit (non-cash collateral) in connection with securities loans. In the event of default or bankruptcy by the lending agent, realization and/or retention of the collateral may be subject to legal proceedings. In the event the borrower fails to return loaned securities and the collateral received is insufficient to cover the value of the loaned securities and provided such collateral shortfall is not the result of investment losses, the lending agent has agreed to pay the amount of the shortfall to the Fund, or at the discretion of the lending agent, replace the loaned securities. The Fund continues to record dividends or interest, as applicable, on the securities loaned and is subject to change in value of the securities loaned that may occur during the term of the loan. The Fund has the right under the Lending Agreement to recover the securities from the borrower on demand. With respect to security loans collateralized by non-cash collateral, the Fund receives loan premiums paid by the borrower. With respect to security loans collateralized by cash collateral, the earnings from the collateral investments are shared among the Fund, the security lending agent and the borrower. The Fund records security lending income net of allocations to the security lending agent and the borrower. The Fund had no securities out on loan as of July 31, 2011.
48
10. Credit and Market Risk
The Fund invests a portion of its assets in high yield fixed income securities, which are securities rated lower than BBB- by Standard & Poor’s and Baa3 by Moody’s Investor Services, or similarly rated by another nationally recognized statistical rating organization. Investments in these higher yielding securities are generally accompanied by a greater degree of credit risk than higher rated securities. Additionally, lower rated securities may be more susceptible to adverse economic and competitive industry conditions than investment grade securities.
The Fund invests in fixed income securities whose value is derived from an underlying pool of mortgages or consumer loans. The value of these securities is sensitive to changes in economic conditions, including delinquencies and/or defaults, and may be adversely affected by shifts in the market’s perception of the issuers and changes in interest rates. Investors receive principal and interest payments as the underlying mortgages and consumer loans are paid back. Some of these securities are collateralized mortgage obligations (CMOs). CMOs are debt securities issued by U.S. government agencies or by financial institutions and other mortgage lenders, which are collateralized by a pool of mortgages held under an indenture. Prepayment of mortgages may shorten the stated maturity of the obligations and can result in a loss of premium, if any has been paid. Certain of these securities may be stripped (securities which provide only the principal or interest feature of the underlying security). The yield to maturity on an interest-only CMO is extremely sensitive not only to changes in prevailing interest rates, but also to the rate of principal payments (including prepayments) on the related underlying mortgage assets. A rapid rate of principal payments may have a material adverse effect on the Fund’s yield to maturity. If the underlying mortgage assets experience greater than anticipated prepayments of principal, the Fund may fail to fully recoup its initial investment in these securities even if the securities are rated in the highest rating categories.
The Fund may invest up to 15% of its net assets in illiquid securities, which may include securities with contractual restrictions on resale, securities exempt from registration under Rule 144A of the Securities Act of 1933, as amended, and other securities which may not be readily marketable. The relative illiquidity of these securities may impair the Fund from disposing of them in a timely manner and at a fair price when it is necessary or desirable to do so. While maintaining oversight, the Fund’s Board has delegated to DMC the day-to-day functions of determining whether individual securities are liquid for purposes of the Fund’s limitation on investments in illiquid securities. Securities eligible for resale pursuant to Rule 144A, which are determined to be liquid, are not subject to the Fund’s 15% limit on investments in illiquid securities. As of July 31, 2011, no securities have been determined to be illiquid under the Fund’s Liquidity Procedures. Rule 144A securities have been identified on the statement of net assets.
49
Notes to financial statements
Delaware Diversified Floating Rate Fund
11. Contractual Obligations
The Fund enters into contracts in the normal course of business that contain a variety of indemnifications. The Fund’s maximum exposure under these arrangements is unknown. However, the Fund has not had prior claims or losses pursuant to these contracts. Management has reviewed the Fund’s existing contracts and expects the risk of loss to be remote.
12. Subsequent Events
Management has determined that no material events or transactions occurred subsequent to July 31, 2011 that would require recognition or disclosure in the Fund’s financial statements.
13. Tax Information (Unaudited)
The information set forth below is for the Fund’s fiscal year as required by federal income tax laws. Shareholders, however, must report distributions on a calendar year basis for income tax purposes, which may include distributions for portions of two fiscal years of a fund. Accordingly, the information needed by shareholders for income tax purposes will be sent to them in January of each year. Please consult your tax advisor for proper treatment of this information. All designations are based on financial information available as of the date of this annual report and, accordingly are subject to change. For any and all items requiring designation, it is the intention of the Fund to designate the maximum amount permitted under the Internal Revenue Code and the regulations thereunder.
For the fiscal year ended July 31, 2011, the Fund designates distributions paid during the year as follows:
| (A) Ordinary Income Distribution (Tax Basis) | | 100% |
(A) is based on a percentage of the Fund’s total distributions.
50
Report of independent
registered public accounting firm
To the Board of Trustees of Delaware Group® Income Funds
and the Shareholders of Delaware Diversified Floating Rate Fund:
In our opinion, the accompanying statement of net assets and the related statements of operations and of changes in net assets and the financial highlights present fairly, in all material respects, the financial position of Delaware Diversified Floating Rate Fund (one of the series constituting Delaware Group Income Funds, hereafter referred to as the “Fund”) at July 31, 2011, the results of its operations for the year then ended and the changes in its net assets and the financial highlights for the year then ended and for the period February 26, 2010 (commencement of operations) through July 31, 2010, in conformity with accounting principles generally accepted in the United States of America. These financial statements and financial highlights (hereafter referred to as “financial statements”) are the responsibility of the Fund’s management; our responsibility is to express an opinion on these financial statements based on our audits. We conducted our audits of these financial statements in accordance with the standards of the Public Company Accounting Oversight Board (United States). Those standards require that we plan and perform the audit to obtain reasonable assurance about whether the financial statements are free of material misstatement. An audit includes examining, on a test basis, evidence supporting the amounts and disclosures in the financial statements, assessing the accounting principles used and significant estimates made by management, and evaluating the overall financial statement presentation. We believe that our audits, which included confirmation of securities at July 31, 2011 by correspondence with the custodian and brokers, provide a reasonable basis for our opinion.
PricewaterhouseCoopers LLP
Philadelphia, Pennsylvania
September 28, 2011
51
Other Fund information
(Unaudited)
Delaware Diversified Floating Rate Fund
Change in Independent Registered Public Accounting Firm
Due to independence matters under the Securities and Exchange Commission’s auditor independence rules relating to the January 4, 2010 acquisition of Delaware Investments (including DMC, DDLP and DSC) by Macquarie Group, Ernst & Young LLP (E&Y) has resigned as the independent registered public accounting firm for Delaware Group® Income Funds (the Trust) effective May 20, 2010. At a meeting held on May 20, 2010, the Board of Trustees of the Trust, upon recommendation of the Audit Committee, selected PricewaterhouseCoopers LLP (PwC) to serve as the independent registered public accounting firm for the Trust for the fiscal year ending July 31, 2010. Because the Fund launched on February 26, 2010, E&Y has not issued any audit reports for the Fund. Neither the Trust nor anyone on its behalf has consulted with PwC at any time prior to their selection with respect to the application of accounting principles to a specified transaction, either completed or proposed, or the type of audit opinion that might be rendered on the Trust’s financial statements.
52
Board of trustees/directors and officers addendum
Delaware Investments® Family of Funds
A mutual fund is governed by a Board of Trustees/Directors (“Trustees”), which has oversight responsibility for the management of a fund’s business affairs. Trustees establish procedures and oversee and review the performance of the investment manager, the distributor, and others who perform services for the fund. The independent fund trustees, in particular, are advocates
| Name, Address, | | Position(s) | | Length of |
| and Birth Date | | Held with Fund(s) | | Time Served |
| Interested Trustees | | | | |
| | | | | |
| Patrick P. Coyne1 | | Chairman, President, | | Chairman and Trustee |
| 2005 Market Street | | Chief Executive Officer, | | since August 16, 2006 |
| Philadelphia, PA 19103 | | and Trustee | | |
| April 1963 | | | | President and |
| | | | | Chief Executive Officer |
| | | | | since August 1, 2006 |
| | | | | |
| | | | | |
| | | | | |
| | | | | |
| | | | | |
| | | | | |
| | | | | |
| | | | | |
| | | | | |
| | | | | |
| | | | | |
| | | | | |
| | | | | |
| | | | | |
| | | | | |
| | | | | |
| | | | | |
| | | | | |
1 Patrick P. Coyne is considered to be an “Interested Trustee” because he is an executive officer of the Fund’s(s’) investment advisor.
54
for shareholder interests. Each trustee has served in that capacity since he or she was elected to or appointed to the Board of Trustees, and will continue to serve until his or her retirement or the election of a new trustee in his or her place. The following is a list of the Trustees and Officers with certain background and related information.
| | | Number of Portfolios in | | |
| Principal Occupation(s) | | Fund Complex Overseen | | Other Directorships |
| During Past 5 Years | | by Trustee or Officer | | Held by Trustee or Officer |
| |
| |
| Patrick P. Coyne has served in | | 75 | | Director and Audit |
| various executive capacities | | | | Committee Member |
| at different times at | | | | Kaydon Corp. |
| Delaware Investments.2 | | | | |
| | | | | Board of Governors Member |
| | | | | Investment Company |
| | | | | Institute (ICI) |
| | | | | |
| | | | | Finance Committee Member |
| | | | | St. John Vianney Roman |
| | | | | Catholic Church |
| |
| | | | | Board of Trustees |
| | | | | Agnes Irwin School |
| |
| | | | | Member of Investment |
| | | | | Committee |
| | | | | Cradle of Liberty Council, |
| | | | | BSA |
| | | | | (2007–2010) |
| | | | | |
| |
| | | | | |
| | | | | |
| |
2 Delaware Investments is the marketing name for Delaware Management Holdings, Inc. and its subsidiaries, including the Fund’s(s’) investment advisor, principal underwriter, and its transfer agent.
55
Board of trustees/directors and officers addendum
Delaware Investments® Family of Funds
| Name, Address, | | Position(s) | | Length of |
| and Birth Date | | Held with Fund(s) | | Time Served |
| Independent Trustees | | | | |
| |
| Thomas L. Bennett | | Trustee | | Since March 2005 |
| 2005 Market Street | | | | |
| Philadelphia, PA 19103 | | | | |
| October 1947 | | | | |
| |
| |
| |
| |
| |
| |
| |
| |
| |
| |
| |
| John A. Fry | | Trustee | | Since January 2001 |
| 2005 Market Street | | | | |
| Philadelphia, PA 19103 | | | | |
| May 1960 | | | | |
| |
| |
| |
| |
| |
| |
| |
| |
| |
| |
| |
| Anthony D. Knerr | | Trustee | | Since April 1990 |
| 2005 Market Street | | | | |
| Philadelphia, PA 19103 | | | | |
| December 1938 | | | | |
| |
| Lucinda S. Landreth | | Trustee | | Since March 2005 |
| 2005 Market Street | | | | |
| Philadelphia, PA 19103 | | | | |
| June 1947 | | | | |
| |
56
| | | Number of Portfolios in | | |
| Principal Occupation(s) | | Fund Complex Overseen | | Other Directorships |
| During Past 5 Years | | by Trustee or Officer | | Held by Trustee or Officer |
| | | | | |
| |
| Private Investor | | 75 | | Chairman of Investment |
| (March 2004–Present) | | | | Committee |
| | | | | Pennsylvania Academy of |
| Investment Manager | | | | Fine Arts |
| Morgan Stanley & Co. | | | | |
| (January 1984–March 2004) | | | | Investment Committee and |
| | | | | Governance Committee |
| | | | | Member |
| | | | | Pennsylvania Horticultural |
| | | | | Society |
| | | | | |
| | | | | Director |
| | | | | Bryn Mawr Bank Corp. (BMTC) |
| | | | | (2007–2011) |
| |
| President | | 75 | | Board of Governors Member — |
| Drexel University | | | | NASDAQ OMX PHLX LLC |
| (August 2010–Present) | | | | |
| | | | | Director and Audit |
| President | | | | Committee Member |
| Franklin & Marshall College | | | | Community Health Systems |
| (July 2002–July 2010) | | | | |
| | | | | Director — Ecore |
| | | | | International |
| | | | | (2009–2010) |
| | | | | |
| | | | | Director — Allied |
| | | | | Barton Securities Holdings |
| | | | | (2005–2008) |
| |
| Managing Director | | 75 | | None |
| Anthony Knerr & Associates | | | | |
| (Strategic Consulting) | | | | |
| (1990–Present) | | | | |
| |
| Chief Investment Officer | | 75 | | None |
| Assurant, Inc. (Insurance) | | | | |
| (2002–2004) | | | | |
| | | | | |
| |
57
Board of trustees/directors and officers addendum
Delaware Investments® Family of Funds
| Name, Address, | | Position(s) | | Length of |
| and Birth Date | | Held with Fund(s) | | Time Served |
| Independent Trustees (continued) | | | | |
| |
| Ann R. Leven | | Trustee | | Since October 1989 |
| 2005 Market Street | | | | |
| Philadelphia, PA 19103 | | | | |
| November 1940 | | | | |
| |
| |
| |
| |
| |
| |
| Frances A. Sevilla-Sacasa | | Trustee | | Since September 2011 |
| 2005 Market Street | | | | |
| Philadelphia, PA 19103 | | | | |
| January 1956 | | | | |
| |
| |
| |
| |
| |
| |
| |
| |
| | | | | |
| | | | | |
| | | | | |
| | | | | |
| |
| |
| |
| | | | | |
| | | | | |
| | | | | |
| | | | | |
| | | | | |
| | | | | |
| | | | | |
| | | | | |
| | | | | |
| |
58
| | | Number of Portfolios in | | |
| Principal Occupation(s) | | Fund Complex Overseen | | Other Directorships |
| During Past 5 Years | | by Trustee or Officer | | Held by Trustee or Officer |
| | | | | |
| |
| Consultant | | 75 | | Director and Audit |
| ARL Associates | | | | Committee Chair |
| (Financial Planning) | | | | Systemax Inc. |
| (1983–Present) | | | | (2001–2009) |
| | | | | |
| | | | | Director and Audit |
| | | | | Committee Chairperson |
| | | | | Andy Warhol Foundation |
| | | | | (1999–2007) |
| |
| Executive Advisor to Dean | | 75 | | Trust Manager — Camden |
| (since August 2011) and | | | | Property Trust |
| Interim Dean | | | | (since August 2011) |
| (January 2011–July 2011) — | | | | |
| University of Miami School of | | | | Board of Trustees |
| Business Administration | | | | Thunderbird School of |
| | | | | Global Management |
| President — U.S. Trust, | | | | (2007–2011) |
| Bank of America Private | | | | |
| Wealth Management | | | | Board of Trustees |
| (Private Banking) | | | | Carrollton School of the |
| (July 2007–December 2008) | | | | Sacred Heart |
| | | | | (since 2007) |
| President and Director | | | | |
| (November 2005–June 2007) and | | | | Board Member |
| Chief Executive Officer | | | | Foreign Policy Association |
| (April 2007–June 2007) — | | | | (since 2006) |
| U.S. Trust Company | | | | |
| (Private Banking) | | | | Board of Trustees |
| | | | | Georgetown Preparatory School |
| | | | | (2005–2011) |
| | | | | |
| | | | | Board of Trustees |
| | | | | Miami City Ballet |
| | | | | (2000–2011) |
| | | | | |
| | | | | Board of Trustees |
| | | | | St. Thomas University |
| | | | | (2005–2011) |
| |
59
Board of trustees/directors and officers addendum
Delaware Investments® Family of Funds
| Name, Address, | | Position(s) | | Length of |
| and Birth Date | | Held with Fund(s) | | Time Served |
| Independent Trustees (continued) | | | | |
| | | | | |
| Janet L. Yeomans | | Trustee | | Since April 1999 |
| 2005 Market Street | | | | |
| Philadelphia, PA 19103 | | | | |
| July 1948 | | | | |
| |
| |
| |
| |
| J. Richard Zecher | | Trustee | | Since March 2005 |
| 2005 Market Street | | | | |
| Philadelphia, PA 19103 | | | | |
| July 1940 | | | | |
| |
| |
| | | | | |
| | | | | |
| | | | | |
| | | | | |
| | | | | |
| | | | | |
| | | | | |
| | | | | |
| | | | | |
| | | | | |
| | | | | |
| | | | | |
| | | | | |
| | | | | |
| |
60
| | | Number of Portfolios in | | |
| Principal Occupation(s) | | Fund Complex Overseen | | Other Directorships |
| During Past 5 Years | | by Trustee or Officer | | Held by Trustee or Officer |
| | | | | |
| | | | | |
| Vice President and Treasurer | | 75 | | Director and Audit |
| (January 2006–Present) | | | | Committee Member |
| Vice President — Mergers & Acquisitions | | | | Okabena Company |
| (January 2003–January 2006), and | | | | |
| Vice President and Treasurer | | | | Chair — 3M |
| (July 1995–January 2003) | | | | Investment Management |
| 3M Corporation | | | | Company |
| |
| Founder | | 75 | | Director and Audit |
| Investor Analytics | | | | Committee Member |
| (Risk Management) | | | | Investor Analytics |
| (May 1999–Present) | | | | |
| | | | | |
| Founder | | | | Director |
| Sutton Asset Management | | | | Oxigene, Inc. |
| (Hedge Fund) | | | | (2003–2008) |
| (September 1996–Present) | | | | |
| | | | | |
| | | | | |
| | | | | |
| | | | | |
| | | | | |
| | | | | |
| | | | | |
| | | | | |
| | | | | |
| | | | | |
| | | | | |
| |
61
Board of trustees/directors and officers addendum
Delaware Investments® Family of Funds
| Name, Address, | | Position(s) | | Length of |
| and Birth Date | | Held with Fund(s) | | Time Served |
| Officers | | | | |
| | | | | |
| David F. Connor | | Vice President, | | Vice President since |
| 2005 Market Street | | Deputy General | | September 2000 |
| Philadelphia, PA 19103 | | Counsel, and Secretary | | and Secretary since |
| December 1963 | | | | October 2005 |
| |
| |
| Daniel V. Geatens | | Vice President | | Treasurer |
| 2005 Market Street | | and Treasurer | | since October 2007 |
| Philadelphia, PA 19103 | | | | |
| October 1972 | | | | |
| |
| David P. O’Connor | | Senior Vice President, | | Senior Vice President, |
| 2005 Market Street | | General Counsel, | | General Counsel, and |
| Philadelphia, PA 19103 | | and Chief Legal Officer | | Chief Legal Officer |
| February 1966 | | | | since October 2005 |
| |
| Richard Salus | | Senior Vice President | | Chief Financial Officer |
| 2005 Market Street | | and Chief Financial Officer | | since November 2006 |
| Philadelphia, PA 19103 | | | | |
| October 1963 | | | | |
| |
The Statement of Additional Information for the Fund(s) includes additional information about the Trustees and Officers and is available, without charge, upon request by calling 800 523-1918.
62
| | | Number of Portfolios in | | |
| Principal Occupation(s) | | Fund Complex Overseen | | Other Directorships |
| During Past 5 Years | | by Trustee or Officer | | Held by Trustee or Officer |
| |
| |
| David F. Connor has served as | | 75 | | None3 |
| Vice President and Deputy | | | | |
| General Counsel of | | | | |
| Delaware Investments | | | | |
| since 2000. | | | | |
| |
| Daniel V. Geatens has served | | 75 | | None3 |
| in various capacities at | | | | |
| different times at | | | | |
| Delaware Investments. | | | | |
| |
| David P. O’Connor has served in | | 75 | | None3 |
| various executive and legal | | | | |
| capacities at different times | | | | |
| at Delaware Investments. | | | | |
| |
| Richard Salus has served in | | 75 | | None3 |
| various executive capacities | | | | |
| at different times at | | | | |
| Delaware Investments. | | | | |
| |
3 David F. Connor, Daniel V. Geatens, David P. O’Connor, and Richard Salus serve in similar capacities for the six portfolios of the Optimum Fund Trust, which have the same investment advisor, principal underwriter, and transfer agent as the registrant.
63
About the organization
| Board of trustees |
Patrick P. Coyne
Chairman, President, and
Chief Executive Officer
Delaware Investments®
Family of Funds
Philadelphia, PA Thomas L. Bennett
Private Investor
Rosemont, PA John A. Fry
President
Drexel University
Philadelphia, PA | Anthony D. Knerr
Founder and Managing
Director
Anthony Knerr &
Associates
New York, NY Lucinda S. Landreth
Former Chief Investment
Officer
Assurant, Inc.
Philadelphia, PA | Ann R. Leven
Consultant
ARL Associates
New York, NY Frances A.
Sevilla-Sacasa
Executive Advisor
to Dean, University of
Miami School of
Business Administration
Coral Gables, FL | Janet L. Yeomans
Vice President and
Treasurer
3M Corporation
St. Paul, MN J. Richard Zecher
Founder
Investor Analytics
Scottsdale, AZ |
| | | | |
| Affiliated officers |
David F. Connor
Vice President, Deputy
General Counsel, and
Secretary
Delaware Investments
Family of Funds
Philadelphia, PA | Daniel V. Geatens
Vice President and
Treasurer
Delaware Investments
Family of Funds
Philadelphia, PA | David P. O’Connor
Senior Vice President,
General Counsel,
and Chief Legal Officer
Delaware Investments
Family of Funds
Philadelphia, PA | Richard Salus
Senior Vice President and
Chief Financial Officer
Delaware Investments
Family of Funds
Philadelphia, PA |
| This annual report is for the information of Delaware Diversified Floating Rate Fund shareholders, but it may be used with prospective investors when preceded or accompanied by the Delaware Investments Fund fact sheet for the most recently completed calendar quarter. These documents are available at www.delawareinvestments.com. |
Delaware Investments is the marketing name of Delaware Management Holdings, Inc. and its subsidiaries.
The Fund files its complete schedule of portfolio holdings with the Securities and Exchange Commission (SEC) for the first and third quarters of each fiscal year on Form N-Q. The Fund’s Forms N-Q, as well as a description of the policies and procedures that the Fund uses to determine how to vote proxies (if any) relating to portfolio securities are available without charge (i) upon request, by calling 800 523-1918; and (ii) on the SEC’s website at www.sec.gov. In addition, a description of the policies and procedures that the Fund uses to determine how to vote proxies (if any) relating to portfolio securities and the Fund’s Schedule of Investments are available without charge on the Fund’s website at www.delawareinvestments.com. The Fund’s Forms N-Q may be reviewed and copied at the SEC’s Public Reference Room in Washington, D.C.; information on the operation of the Public Reference Room may be obtained by calling 800 SEC-0330.
Information (if any) regarding how the Fund voted proxies relating to portfolio securities during the most recently disclosed 12-month period ended June 30 is available without charge (i) through the Funds’ website at www.delawareinvestments.com; and (ii) on the SEC’s website at www.sec.gov.
|
Annual report Delaware High-Yield Opportunities Fund July 31, 2011 Fixed income mutual fund |
Carefully consider the Fund’s investment objectives, risk factors, charges, and expenses before investing. This and other information can be found in the Fund’s prospectus and, if available, its summary prospectus, which may be obtained by visiting www.delawareinvestments.com or calling 800 523-1918. Investors should read the prospectus and, if available, the summary prospectus carefully before investing. |
You can obtain shareholder reports and prospectuses online instead of in the mail.
Visit www.delawareinvestments.com/edelivery. |
Experience Delaware Investments
Delaware Investments is committed to the pursuit of consistently superior asset management and unparalleled client service. We believe in our investment processes, which seek to deliver consistent results, and in convenient services that help add value for our clients.
If you are interested in learning more about creating an investment plan, contact your financial advisor.
You can learn more about Delaware Investments or obtain a prospectus for Delaware High-Yield Opportunities Fund at www.delawareinvestments.com.
Manage your investments online
- 24-hour access to your account information
- Obtain share prices
- Check your account balance and recent transactions
- Request statements or literature
- Make purchases and redemptions
Delaware Management Holdings, Inc. and its subsidiaries (collectively known by the marketing name of Delaware Investments) are wholly owned subsidiaries of Macquarie Group Limited, a global provider of banking, financial, advisory, investment and funds management services.
Investments in Delaware High-Yield Opportunities Fund are not and will not be deposits with or liabilities of Macquarie Bank Limited ABN 46 008 583 542 and its holding companies, including their subsidiaries or related companies (Macquarie Group), and are subject to investment risk, including possible delays in repayment and loss of income and capital invested. No Macquarie Group company guarantees or will guarantee the performance of the Fund, the repayment of capital from the Fund, or any particular rate of return.
| Table of contents | | |
| Portfolio management review | | 1 |
| Performance summary | | 4 |
| Disclosure of Fund expenses | | 8 |
| Security type/sector allocation | | 10 |
| Statement of net assets | | 11 |
| Statement of operations | | 23 |
| Statements of changes in net assets | | 24 |
| Financial highlights | | 26 |
| Notes to financial statements | | 36 |
| Report of independent registered | | |
| public accounting firm | | 47 |
| Other Fund information | | 48 |
| Board of trustees/directors and | | |
| officers addendum | | 50 |
| About the organization | | 60 |
Unless otherwise noted, views expressed herein are current as of July 31, 2011, and subject to change.
Funds are not FDIC insured and are not guaranteed. It is possible to lose the principal amount invested.
Mutual fund advisory services provided by Delaware Management Company, a series of Delaware Management Business Trust, which is a registered investment advisor. Delaware Investments, a member of Macquarie Group, refers to Delaware Management Holdings, Inc. and its subsidiaries, including the Fund’s distributor, Delaware Distributors, L.P. Macquarie Group refers to Macquarie Group Limited and its subsidiaries and affiliates worldwide.
© 2011 Delaware Management Holdings, Inc.
All third-party trademarks cited are the property of their respective owners.
| Portfolio management review |
| Delaware High-Yield Opportunities Fund | August 9, 2011 |
| Performance preview (for the year ended July 31, 2011) |
| Delaware High-Yield Opportunities Fund (Class A shares) | | 1-year return | | +14.11% |
| BofA Merrill Lynch U.S. High Yield Constrained Index (benchmark) | | 1-year return | | +12.82% |
Past performance does not guarantee future results.
For complete, annualized performance for Delaware High-Yield Opportunities Fund, please see the table on page 4. The performance of Class A shares excludes the applicable sales charge and reflects the reinvestment of all distributions. Index performance returns do not reflect any management fees, transaction costs, or expenses. Indices are unmanaged and one cannot invest directly in an index. |
Despite tepid economic growth, high unemployment, and policy gridlock on both sides of the Atlantic, high yield bonds generated solid performance over the Fund’s fiscal year ended July 31, 2011. High yield bonds generally benefited from an environment in which corporate balance sheets continued to heal despite a range of stresses on government and household finances, providing a solid fundamental underpinning to the high yield market.
With the notable exception of housing-related businesses, many companies benefited from additional cost cutting and modest revenue growth, including those in the ailing banking, finance, and consumer sectors. Meanwhile, companies all along the credit spectrum were generally able to access the debt markets at reasonable interest rates to refinance debt and raise equity. Notably, merger and acquisition activity grew strongly for the first time in several years, an indication that managements seemed willing to move from merely conserving capital and repairing balance sheets to growing their businesses. Given the generally healthy state of corporate finances, below-investment-grade default rates were only about 4% over the Fund’s fiscal year, not far above the historical norm and significantly below most analysts’ expectations. (Source: Bloomberg.) The default rate among the Fund’s holdings, however, was negligible.
High yield bonds generally benefited from an environment in which corporate balance sheets continued to heal despite a range of stresses on government and household finances, providing a solid fundamental underpinning to the high yield market. Given the generally healthy state of corporate finances, below-investment-grade default rates were only about 4% over the Fund’s fiscal year, not far above the historical norm and significantly below most analysts’ expectations. (Source: Bloomberg.) The default rate among the Fund’s holdings, however, was negligible.
|
1
Portfolio management review
Delaware High-Yield Opportunities Fund
Fund performance
For its fiscal year, Delaware High-Yield Opportunities Fund returned +14.11% for Class A shares at net asset value and +8.91% at maximum offer price. Both figures reflect all distributions reinvested. During the same period, the Fund’s benchmark, the BofA Merrill Lynch U.S. High Yield Constrained Index, returned +12.82% (source: BofA Merrill Lynch). For complete, annualized performance of the Fund, please see the table on page 4.
Several factors contributed to the Fund’s outperformance versus its benchmark. First, the Fund had a higher weighting in the lower credit portion of the market, with roughly double the benchmark’s allocation to CCC-rated bonds, which are considered highly speculative securities. Also, the Fund was generally overweight in B-rated bonds (rated just above CCC-rated bonds) and underweight in higher-rated BB-rated debt. The Fund’s overweight allocation to lower-rated issues resulted from our proprietary bottom-up credit analysis, which suggested to us a higher probability of ratings upgrades within that sector.
Among the contributors to the Fund’s relative performance was gaming company MGM Resorts International. MGM experienced improved access to financing and generally cleaned up its balance sheet during the fiscal year. The Fund’s holdings in Australian iron-ore producer FMG Resources also enhanced relative performance. The company tendered for a secured bond held by the Fund, on generous terms in our view. The Fund also benefited from its holdings in Telcordia Technologies, a New Jersey–based telecom services business that was acquired in June 2011 by Ericsson, the Swedish networking equipment maker whose credit is rated investment grade. The Fund’s debt holdings in insurance behemoth American International Group (AIG) also contributed to relative performance. Investors rewarded AIG during the year due to its ability to successfully restructure itself in the aftermath of the global financial crisis.
OPTI Canada was among the detractors from relative performance. The company’s potentially lucrative oil-sands asset proved to be more capital intensive than we, or the company, anticipated. With production only slowly increasing, we exited the position. Another detractor was container shipping company CMA CGM, whose bonds we liquidated during the fiscal year as the company suffered from a sluggish recovery in utilization rates and a lack of pricing power amid too much supply. The Fund’s holdings in pharmaceutical contract manufacturer Novasep also detracted from relative performance. The company suffered from weak operations, a deteriorating order book, and excessive leverage. We exited the position during the fiscal year. It is important to note that during the Fund’s fiscal year, the Fund held on average only 13% of assets in companies domiciled overseas, and all of those positions were in dollar-denominated bonds.
From a sector standpoint, the Fund benefited from strong credit selection in most industries and sectors, especially automotive, banking, basic industries, utilities, and media. In fact, overall credit selection was the major contributor to the Fund’s strong relative performance during its fiscal year. However, credit issues in the Fund’s energy and healthcare bonds were a minor detractor from performance.
2
Disconcerting macroeconomic news notwithstanding, we believe conditions in the high yield market remained favorable at the end of the Fund’s fiscal year. From a fundamental perspective, many businesses were reporting further increases in top- and bottom-line growth despite more difficult year-over-year comparisons. Market technicals were generally positive as well, with most of the funds raised in the new-issue market by below-investment-grade credits being used for bondholder-friendly activities such as reducing leverage and refinancing debt. We caution, however, that unnerving headlines related to sovereign debt issues in Europe and the United States may have the potential to undermine liquidity, causing significant short-term volatility.
At the close of the fiscal year, we retained the Fund’s overweight to lower-rated credits, given the historical tendency of rating agencies to issue upgrades well after companies have already made meaningful improvements to their balance sheets. It should be noted, however, that past performance does not guarantee future results. As bottom-up, credit-intensive bond investors, we are detecting what we believe to be a significant amount of such rating anomalies, especially among the smaller companies that dominate the CCC- and B-rated sectors. Finally, with benchmark interest rates likely to remain near zero for the next two years (based on the Fed’s recent announcement), we believe below-investment-grade bonds could benefit from the sector’s higher yields, potentially providing solid income in the current low-interest-rate environment.
3
| Performance summary |
| Delaware High-Yield Opportunities Fund | July 31, 2011 |
The performance data quoted represent past performance; past performance does not guarantee future results. Investment return and principal value will fluctuate so your shares, when redeemed, may be worth more or less than their original cost. Please obtain the performance data current for the most recent month end by calling 800 523-1918 or visiting our website at www.delawareinvestments.com/performance. Current performance may be lower or higher than the performance data quoted.
| Fund performance1,2 | | Average annual total returns through July 31, 2011 |
| | | 1 year | | 5 years | | 10 years | | Lifetime |
| Class A (Est. Dec. 30, 1996) | | | | | | | | |
| Excluding sales charge | | +14.11% | | +8.31% | | +9.52% | | n/a |
| Including sales charge | | +8.91% | | +7.32% | | +9.00% | | n/a |
| Class B (Est. Feb. 17, 1998) | | | | | | | | |
| Excluding sales charge | | +13.06% | | +7.51% | | +8.85% | | n/a |
| Including sales charge | | +9.06% | | +7.29% | | +8.85% | | n/a |
| Class C (Est. Feb. 17, 1998) | | | | | | | | |
| Excluding sales charge | | +13.04% | | +7.55% | | +8.72% | | n/a |
| Including sales charge | | +12.04% | | +7.55% | | +8.72% | | n/a |
| Class R (Est. June 2, 2003) | | | | | | | | |
| Excluding sales charge | | +13.87% | | +8.08% | | n/a | | +8.95% |
| Including sales charge | | +13.87% | | +8.08% | | n/a | | +8.95% |
| Institutional Class (Est. Dec. 30, 1996) | | | | | | | | |
| Excluding sales charge | | +14.45% | | +8.63% | | +9.85% | | n/a |
| Including sales charge | | +14.45% | | +8.63% | | +9.85% | | n/a |
1 Returns reflect the reinvestment of all distributions and are presented both with and without the applicable sales charges described below. Returns do not reflect the deduction of taxes the shareholder would pay on Fund distributions or redemptions of Fund shares.
Expense limitations were in effect for certain classes during some or all of the periods shown in the “Fund performance” chart. The current expenses for each class are listed on the “Fund expense ratios” table on page 6. Performance would have been lower had expense limitations not been in effect.
Class A shares are sold with a maximum front-end sales charge of up to 4.50%. Additionally, the Fund’s Class A shares are subject to a blended 12b-1 fee of 0.10% of average daily net assets on all shares acquired prior to June 1, 1992, and 0.30% of average daily net assets on all shares acquired on or after June 1, 1992. Performance for Class A shares, excluding sales charges, assumes that no front-end sales charge applied.
Class B shares may be purchased only through dividend reinvestment and certain permitted exchanges as described in the prospectus.
4
Please see the prospectus for additional information on Class B shares. Class B shares have a contingent deferred sales charge that declines from 4.00% to zero depending on the period of time the shares are held. They are also subject to an annual distribution and service fee of up to 1.00% of average daily net assets. Class B shares will automatically convert to Class A shares on a quarterly basis approximately eight years after purchase. Ten-year and lifetime performance figures for Class B shares reflect conversion to Class A shares after approximately eight years.
Class C shares are sold with a contingent deferred sales charge of 1.00% if redeemed during the first 12 months. They are also subject to an annual distribution and service fee of up to 1.00% of average daily net assets.
Performance for Class B and C shares, excluding sales charges, assumes either that contingent deferred sales charges did not apply or that the investment was not redeemed.
Class R shares are available only for certain retirement plan products. They are sold without a sales charge and have an annual distribution and service fee of up to 0.60% of average daily net assets, which has been limited contractually to 0.50% from Nov. 26, 2010, through Nov. 28, 2011.
Institutional Class shares are available without sales or asset-based distribution charges only to certain eligible institutional accounts.
The “Fund performance” table and the “Performance of a $10,000 investment” graph do not reflect the deduction of taxes the shareholder would pay on Fund distributions or redemptions of Fund shares.
Fixed income securities and bond funds can lose value, and investors can lose principal, as interest rates rise. They also may be affected by economic conditions that hinder an issuer’s ability to make interest and principal payments on its debt.
The Fund may also be subject to prepayment risk, the risk that the principal of a fixed income security that is held by the Fund may be prepaid prior to maturity, potentially forcing the Fund to reinvest that money at a lower interest rate.
High yielding, noninvestment grade bonds (junk bonds) involve higher risk than investment grade bonds. The high yield secondary market is particularly susceptible to liquidity problems when institutional investors, such as mutual funds and certain other financial institutions, temporarily stop buying bonds for regulatory, financial, or other reasons. In addition, a less liquid secondary market makes it more difficult for the Fund to obtain precise valuations of the high yield securities in its portfolio.
International investments entail risks not ordinarily associated with U.S. investments including fluctuation in currency values, differences in accounting principles, or economic or political instability in other nations.
Investing in emerging markets can be riskier than investing in established foreign markets due to increased volatility and lower trading volume.
The Fund may experience portfolio turnover in excess of 100%, which could result in higher transaction costs and tax liability.
Per Standard & Poor’s credit rating agency, bonds rated AA and A are more susceptible to the adverse effects of changes in circumstances and economic conditions than those in the higher-rated AAA category, but the obligor’s capacity to meet its financial
5
Performance summary
Delaware High-Yield Opportunities Fund
commitment on the obligation is still strong. Bonds rated BBB exhibit adequate protection parameters, although adverse economic conditions or changing circumstances are more likely to lead to a weakened capacity of the obligor to meet its financial commitments. Bonds rated BB, B, and CCC are regarded as having significant speculative characteristics, with BB indicating the least degree of speculation of the three.
2 The Fund’s expense ratios, as described in the most recent prospectus, are disclosed in the following “Fund expense ratios” table. Delaware Investments has agreed to reimburse certain expenses and/or waive certain fees in order to prevent total fund operating expenses (excluding any 12b-1 fees and certain other expenses) from exceeding 0.81% of the Fund’s average daily net assets from Nov. 26, 2010, through Nov. 28, 2011. Please see the most recent prospectus and any applicable supplement(s) for additional information on these fee waivers and/or reimbursements.
| Fund expense ratios | Class A | | Class B | | Class C | | Class R | | Institutional Class |
| Total annual operating expenses | 1.25% | | 1.95% | | 1.95% | | 1.55% | | 0.95% |
| (without fee waivers) | | | | | | | | | |
| Net expenses | 1.11% | | 1.81% | | 1.81% | | 1.31% | | 0.81% |
| (including fee waivers, if any) | | | | | | | | | |
| Type of waiver | Contractual | | Contractual | | Contractual | | Contractual | | Contractual |
6
Performance of a $10,000 investment1
Average annual total returns from July 31, 2001, through July 31, 2011
| For period beginning July 31, 2001, through July 31, 2011 | Starting value | Ending value |
| | Delaware High-Yield Opportunities Fund —
Class A shares | $9,550 | $23,657 |
| | BofA Merrill Lynch U.S. High Yield
Constrained Index | $10,000 | $23,385 |
1 The “Performance of a $10,000 investment” graph assumes $10,000 invested in Class A shares of the Fund on July 31, 2001, and includes the effect of a 4.50% front-end sales charge and the reinvestment of all distributions. The graph does not reflect the deduction of taxes the shareholders would pay on Fund distributions or redemptions of Fund shares. Expense limitations were in effect for some or all of the periods shown. Performance would have been lower had expense limitations not been in effect. Current expenses are listed in the “Fund expense ratios” table on page 6. Please note additional details on pages 4 through 7.
The chart also assumes $10,000 invested in the BofA Merrill Lynch U.S. High Yield Constrained Index as of July 31, 2001. The BofA Merrill Lynch U.S. High Yield Constrained Index tracks the performance of U.S. dollar–denominated high yield corporate debt publicly issued in the U.S. domestic market, but caps individual issuer exposure at 2% of the benchmark.
Index performance returns do not reflect any management fees, transaction costs, or expenses. Indices are unmanaged and one cannot invest directly in an index. Past performance is not a guarantee of future results.
Performance of other Fund classes will vary due to different charges and expenses.
| | | Nasdaq symbols | | CUSIPs | |
| Class A | | | DHOAX | | | 245908876 | |
| Class B | | | DHOBX | | | 245908868 | |
| Class C | | | DHOCX | | | 245908850 | |
| Class R | | | DHIRX | | | 245908736 | |
| Institutional Class | | | DHOIX | | | 245908843 | |
7
Disclosure of Fund expenses
For the six-month period from February 1, 2011 to July 31, 2011
As a shareholder of the Fund, you incur two types of costs: (1) transaction costs, including sales charges (loads) on purchase payments, reinvested dividends, or other distributions; redemption fees; and exchange fees; and (2) ongoing costs, including management fees; distribution and/or service (12b-1) fees; and other Fund expenses. This example is intended to help you understand your ongoing costs (in dollars) of investing in the Fund and to compare these costs with the ongoing costs of investing in other mutual funds.
The example is based on an investment of $1,000 invested at the beginning of the period and held for the entire six-month period from February 1, 2011 to July 31, 2011.
Actual expenses
The first section of the table shown, “Actual Fund return,” provides information about actual account values and actual expenses. You may use the information in this section of the table, together with the amount you invested, to estimate the expenses that you paid over the period. Simply divide your account value by $1,000 (for example, an $8,600 account value divided by $1,000 = 8.6), then multiply the result by the number in the first section under the heading entitled “Expenses Paid During Period” to estimate the expenses you paid on your account during this period.
Hypothetical example for comparison purposes
The second section of the table shown, “Hypothetical 5% return,” provides information about hypothetical account values and hypothetical expenses based on the Fund’s actual expense ratio and an assumed rate of return of 5% per year before expenses, which is not the Fund’s actual return. The hypothetical account values and expenses may not be used to estimate the actual ending account balance or expenses you paid for the period. You may use this information to compare the ongoing costs of investing in the Fund and other funds. To do so, compare this 5% hypothetical example with the 5% hypothetical examples that appear in the shareholder reports of the other funds.
Please note that the expenses shown in the table are meant to highlight your ongoing costs only and do not reflect any transactional costs, such as sales charges (loads), redemption fees, or exchange fees. Therefore, the second section of the table is useful in comparing ongoing costs only, and will not help you determine the relative total costs of owning different funds. In addition, if these transactional costs were included, your costs would have been higher. The Fund’s expenses shown in the table reflect fee waivers in effect. The expenses shown in the table assume reinvestment of all dividends and distributions.
8
| Delaware High-Yield Opportunities Fund |
| Expense Analysis of an Investment of $1,000 |
| | | Beginning | | Ending | | | | Expenses |
| | | Account Value | | Account Value | | Annualized | | Paid During Period |
| | | 2/1/11 | | 7/31/11 | | Expense Ratio | | 2/1/11 to 7/31/11* |
| Actual Fund return | | | | | | | | | | | | | | |
| Class A | | | $1,000.00 | | | | $1,035.50 | | | 1.11% | | | $5.60 | |
| Class B | | | 1,000.00 | | | | 1,029.40 | | | 1.81% | | | 9.11 | |
| Class C | | | 1,000.00 | | | | 1,029.40 | | | 1.81% | | | 9.11 | |
| Class R | | | 1,000.00 | | | | 1,034.40 | | | 1.31% | | | 6.61 | |
| Institutional Class | | | 1,000.00 | | | | 1,037.00 | | | 0.81% | | | 4.09 | |
| Hypothetical 5% return (5% return before expenses) | | | | | | | |
| Class A | | | $1,000.00 | | | | $1,019.29 | | | 1.11% | | | $5.56 | |
| Class B | | | 1,000.00 | | | | 1,015.82 | | | 1.81% | | | 9.05 | |
| Class C | | | 1,000.00 | | | | 1,015.82 | | | 1.81% | | | 9.05 | |
| Class R | | | 1,000.00 | | | | 1,018.30 | | | 1.31% | | | 6.56 | |
| Institutional Class | | | 1,000.00 | | | | 1,020.78 | | | 0.81% | | | 4.06 | |
| * | “Expenses Paid During Period” are equal to the Fund’s annualized expense ratio, multiplied by the average account value over the period, multiplied by 181/365 (to reflect the one-half year period). |
9
| Security type/sector allocation | |
| Delaware High-Yield Opportunities Fund | As of July 31, 2011 |
Sector designations may be different than the sector designations presented in other Fund materials. The sector designations may represent the investment manager’s internal sector classifications, which may result in the sector designations for one fund being different than another fund’s sector designations.
| Security type/sector | | Percentage of net assets |
| Corporate Bonds | | 91.90 | % |
| Automotive | | 4.10 | % |
| Banking | | 3.45 | % |
| Basic Industry | | 13.25 | % |
| Capital Goods | | 5.18 | % |
| Consumer Cyclical | | 4.92 | % |
| Consumer Non-Cyclical | | 3.30 | % |
| Energy | | 10.97 | % |
| Financial Services | | 2.69 | % |
| Healthcare | | 6.39 | % |
| Insurance | | 2.56 | % |
| Media | | 7.10 | % |
| Services | | 11.06 | % |
| Technology & Electronics | | 5.85 | % |
| Telecommunications | | 8.90 | % |
| Utilities | | 2.18 | % |
| Senior Secured Loans | | 1.18 | % |
| Common Stock | | 0.49 | % |
| Preferred Stock | | 1.57 | % |
| Warrant | | 0.00 | % |
| Short-Term Investments | | 3.76 | % |
| Securities Lending Collateral | | 14.70 | % |
| Total Value of Securities | | 113.60 | % |
| Obligation to Return Securities Lending Collateral | | (14.80 | %) |
| Receivables and Other Assets Net of Other Liabilities | | 1.20 | % |
| Total Net Assets | | 100.00 | % |
10
| Statement of net assets | |
| Delaware High-Yield Opportunities Fund | July 31, 2011 |
| | | | Principal | | |
| | | | amount (U.S. $) | | Value (U.S. $) |
| Corporate Bonds – 91.90% | | | | | | |
| Automotive – 4.10% | | | | | | |
| * | American Axle & Manufacturing 7.875% 3/1/17 | | $ | 2,334,000 | | $ | 2,395,268 |
| * | ArvinMeritor 8.125% 9/15/15 | | | 2,119,000 | | | 2,209,058 |
| # | Chrysler Group 144A 8.25% 6/15/21 | | | 2,770,000 | | | 2,728,450 |
| * | Dana Holding 6.75% 2/15/21 | | | 1,368,000 | | | 1,397,070 |
| * | Ford Motor 7.45% 7/16/31 | | | 2,422,000 | | | 2,772,752 |
| | Ford Motor Credit 12.00% 5/15/15 | | | 1,971,000 | | | 2,476,650 |
| # | International Automotive Components Group 144A | | | | | | |
| | 9.125% 6/1/18 | | | 1,860,000 | | | 1,920,450 |
| *# | Jaguar Land Rover 144A 8.125% 5/15/21 | | | 2,740,000 | | | 2,787,950 |
| # | Pinafore 144A 9.00% 10/1/18 | | | 1,982,000 | | | 2,175,245 |
| | | | | | | | 20,862,893 |
| Banking – 3.45% | | | | | | |
| | BAC Capital Trust VI 5.625% 3/8/35 | | | 4,740,000 | | | 4,166,777 |
| • | Fifth Third Capital Trust IV 6.50% 4/15/37 | | | 2,816,000 | | | 2,759,680 |
| •# | HBOS Capital Funding 144A 6.071% 6/29/49 | | | 3,175,000 | | | 2,635,250 |
| *• | Regions Financing Trust II 6.625% 5/15/47 | | | 4,400,000 | | | 3,903,038 |
| • | SunTrust Capital VIII 6.10% 12/15/36 | | | 4,170,000 | | | 4,078,648 |
| | | | | | | | 17,543,393 |
| Basic Industry – 13.25% | | | | | | |
| * | AK Steel 7.625% 5/15/20 | | | 2,431,000 | | | 2,497,853 |
| # | Algoma Acquisition 144A 9.875% 6/15/15 | | | 2,834,000 | | | 2,578,940 |
| # | APERAM 144A 7.75% 4/1/18 | | | 2,445,000 | | | 2,469,450 |
| # | Appleton Papers 144A 10.50% 6/15/15 | | | 1,712,000 | | | 1,819,000 |
| # | Building Materials Corporation of America 144A | | | | | | |
| | 6.75% 5/1/21 | | | 2,760,000 | | | 2,804,849 |
| *# | Cemex Espana Luxembourg 144A 9.25% 5/12/20 | | | 5,462,000 | | | 5,066,004 |
| # | FMG Resources August 2006 144A 7.00% 11/1/15 | | | 1,936,000 | | | 2,015,860 |
| | Georgia-Pacific 8.00% 1/15/24 | | | 2,420,000 | | | 2,990,365 |
| | Headwaters 7.625% 4/1/19 | | | 2,846,000 | | | 2,717,930 |
| * | Hexion US Finance 9.00% 11/15/20 | | | 1,413,000 | | | 1,469,520 |
| | Interface 7.625% 12/1/18 | | | 1,735,000 | | | 1,856,450 |
| # | International Wire Group Holdings 144A | | | | | | |
| | 9.75% 4/15/15 | | | 2,060,000 | | | 2,168,150 |
| *# | James River Escrow 144A 7.875% 4/1/19 | | | 2,499,000 | | | 2,530,238 |
| # | JMC Steel Group 144A 8.25% 3/15/18 | | | 2,777,000 | | | 2,895,023 |
| # | Kinove German Bondco 144A 9.625% 6/15/18 | | | 2,295,000 | | | 2,421,225 |
11
Statement of net assets
Delaware High-Yield Opportunities Fund
| | | | Principal | | | |
| | | | amount (U.S. $) | | Value (U.S. $) |
| Corporate Bonds (continued) | | | | | | |
| Basic Industry (continued) | | | | | | |
| # | Longview Fibre Paper & Packaging 144A | | | | | | |
| | 8.00% 6/1/16 | | $ | 2,735,000 | | $ | 2,817,050 |
| # | MacDermid 144A 9.50% 4/15/17 | | | 2,382,000 | | | 2,518,965 |
| *# | Masonite International 144A 8.25% 4/15/21 | | | 2,635,000 | | | 2,667,938 |
| # | Millar Western Forest Products 144A 8.50% 4/1/21 | | | 1,370,000 | | | 1,198,750 |
| * | Momentive Performance Materials 9.00% 1/15/21 | | | 3,287,000 | | | 3,402,044 |
| # | Murray Energy 144A 10.25% 10/15/15 | | | 2,272,000 | | | 2,396,960 |
| | Norcraft | | | | | | |
| | 10.50% 12/15/15 | | | 1,336,000 | | | 1,309,280 |
| | #144A 10.50% 12/15/15 | | | 1,695,000 | | | 1,661,100 |
| # | Nortek 144A 8.50% 4/15/21 | | | 2,820,000 | | | 2,643,750 |
| * | Ply Gem Industries 13.125% 7/15/14 | | | 2,363,000 | | | 2,439,798 |
| | Polypore International 7.50% 11/15/17 | | | 2,407,000 | | | 2,569,473 |
| =@ | PT Holdings 12.431% 8/27/12 | | | 962,902 | | | 438,120 |
| | Ryerson | | | | | | |
| | •7.648% 11/1/14 | | | 884,000 | | | 872,950 |
| | 12.00% 11/1/15 | | | 2,039,000 | | | 2,176,633 |
| | | | | | | | 67,413,668 |
| Capital Goods – 5.18% | | | | | | |
| * | Associated Materials 9.125% 11/1/17 | | | 1,733,000 | | | 1,758,995 |
| | Berry Plastics | | | | | | |
| | 9.75% 1/15/21 | | | 2,558,000 | | | 2,558,000 |
| | *10.25% 3/1/16 | | | 1,699,000 | | | 1,686,258 |
| # | DAE Aviation Holdings 144A 11.25% 8/1/15 | | | 2,517,000 | | | 2,605,095 |
| | Kratos Defense & Security Solutions 10.00% 6/1/17 | | | 2,425,000 | | | 2,600,813 |
| * | Mueller Water Products 7.375% 6/1/17 | | | 2,721,000 | | | 2,612,160 |
| | Pregis 12.375% 10/15/13 | | | 2,589,000 | | | 2,576,055 |
| # | Reynolds Group Issuer 144A | | | | | | |
| | 8.25% 2/15/21 | | | 820,000 | | | 760,550 |
| | 9.00% 4/15/19 | | | 3,961,000 | | | 3,960,999 |
| | 9.875% 8/15/19 | | | 3,535,000 | | | 3,574,769 |
| | TriMas 9.75% 12/15/17 | | | 1,516,000 | | | 1,675,180 |
| | | | | | | | 26,368,874 |
| Consumer Cyclical – 4.92% | | | | | | |
| # | Brown Group 144A 7.125% 5/15/19 | | | 2,160,000 | | | 2,106,000 |
| # | Burlington Coat Factory Warehouse 144A | | | | | | |
| | 10.00% 2/15/19 | | | 2,614,000 | | | 2,633,605 |
12
| | | | Principal | | | |
| | | | amount (U.S. $) | | Value (U.S. $) |
| Corporate Bonds (continued) | | | | | | |
| Consumer Cyclical (continued) | | | | | | |
| | CKE Restaurants 11.375% 7/15/18 | | $ | 1,901,000 | | $ | 2,105,358 |
| | Dave & Buster’s 11.00% 6/1/18 | | | 2,896,000 | | | 3,185,599 |
| | DineEquity 9.50% 10/30/18 | | | 2,387,000 | | | 2,634,651 |
| | Express 8.75% 3/1/18 | | | 1,395,000 | | | 1,513,575 |
| # | Icon Health & Fitness 144A 11.875% 10/15/16 | | | 1,241,000 | | | 1,284,435 |
| | Levi Strauss 7.625% 5/15/20 | | | 1,300,000 | | | 1,314,625 |
| | OSI Restaurant Partners 10.00% 6/15/15 | | | 2,475,000 | | | 2,604,938 |
| * | Quiksilver 6.875% 4/15/15 | | | 3,347,000 | | | 3,275,875 |
| | Tops Markets 10.125% 10/15/15 | | | 1,115,000 | | | 1,194,444 |
| | Yankee Candle 9.75% 2/15/17 | | | 1,129,000 | | | 1,205,208 |
| | | | | | | | 25,058,313 |
| Consumer Non-Cyclical – 3.30% | | | | | | |
| # | Armored Autogroup 144A 9.25% 11/1/18 | | | 2,673,000 | | | 2,632,905 |
| # | Blue Merger Sub 144A 7.625% 2/15/19 | | | 2,722,000 | | | 2,813,868 |
| # | Bumble Bee Acquisition 144A 9.00% 12/15/17 | | | 1,654,000 | | | 1,676,743 |
| | Cott Beverages 8.375% 11/15/17 | | | 1,155,000 | | | 1,230,075 |
| * | Dean Foods 7.00% 6/1/16 | | | 2,870,000 | | | 2,855,650 |
| * | Pinnacle Foods Finance 10.625% 4/1/17 | | | 1,581,000 | | | 1,707,480 |
| * | Visant 10.00% 10/1/17 | | | 1,373,000 | | | 1,426,204 |
| # | Viskase 144A 9.875% 1/15/18 | | | 2,324,000 | | | 2,451,820 |
| | | | | | | | 16,794,745 |
| Energy – 10.97% | | | | | | |
| | American Petroleum Tankers 10.25% 5/1/15 | | | 1,881,000 | | | 1,956,240 |
| | Antero Resources Finance 9.375% 12/1/17 | | | 2,400,000 | | | 2,640,000 |
| * | Aquilex Holdings 11.125% 12/15/16 | | | 1,892,000 | | | 1,823,415 |
| # | Calumet Specialty Products Partners 144A | | | | | | |
| | 9.375% 5/1/19 | | | 2,735,000 | | | 2,817,050 |
| | Chaparral Energy 8.25% 9/1/21 | | | 4,017,000 | | | 4,167,637 |
| | Chesapeake Energy | | | | | | |
| | 6.625% 8/15/20 | | | 795,000 | | | 862,575 |
| | 6.875% 11/15/20 | | | 288,000 | | | 313,920 |
| | 7.25% 12/15/18 | | | 153,000 | | | 170,595 |
| | Comstock Resources 7.75% 4/1/19 | | | 2,715,000 | | | 2,826,993 |
| | Copano Energy 7.75% 6/1/18 | | | 1,441,000 | | | 1,505,845 |
| | Crosstex Energy 8.875% 2/15/18 | | | 1,622,000 | | | 1,772,035 |
| # | Helix Energy Solutions Group 144A 9.50% 1/15/16 | | | 3,133,000 | | | 3,305,314 |
| # | Hercules Offshore 144A 10.50% 10/15/17 | | | 2,579,000 | | | 2,707,950 |
13
Statement of net assets
Delaware High-Yield Opportunities Fund
| | | | Principal | | | |
| | | | amount (U.S. $) | | Value (U.S. $) |
| Corporate Bonds (continued) | | | | | | |
| Energy (continued) | | | | | | |
| # | Hilcorp Energy I 144A 8.00% 2/15/20 | | $ | 2,264,000 | | $ | 2,456,440 |
| | Holly 9.875% 6/15/17 | | | 1,525,000 | | | 1,719,438 |
| # | Laredo Petroleum 144A 9.50% 2/15/19 | | | 2,845,000 | | | 3,037,037 |
| | Linn Energy | | | | | | |
| | 8.625% 4/15/20 | | | 1,820,000 | | | 2,024,750 |
| | #144A 6.50% 5/15/19 | | | 905,000 | | | 906,131 |
| # | NFR Energy 144A 9.75% 2/15/17 | | | 3,189,000 | | | 3,141,165 |
| # | Oasis Petroleum 144A 7.25% 2/1/19 | | | 2,121,000 | | | 2,189,933 |
| | Offshore Group Investments | | | | | | |
| | 11.50% 8/1/15 | | | 1,906,000 | | | 2,120,425 |
| | #144A 11.50% 8/1/15 | | | 255,000 | | | 283,688 |
| | Petrohawk Energy 7.25% 8/15/18 | | | 2,707,000 | | | 3,160,423 |
| | Petroleum Development 12.00% 2/15/18 | | | 1,883,000 | | | 2,108,960 |
| | Pioneer Drilling 9.875% 3/15/18 | | | 1,022,000 | | | 1,101,205 |
| * | Quicksilver Resources 7.125% 4/1/16 | | | 1,601,000 | | | 1,617,010 |
| | SandRidge Energy | | | | | | |
| | 8.75% 1/15/20 | | | 429,000 | | | 472,973 |
| | #144A 7.50% 3/15/21 | | | 2,506,000 | | | 2,634,433 |
| | | | | | | | 55,843,580 |
| Financial Services – 2.69% | | | | | | |
| | E Trade Financial PIK 12.50% 11/30/17 | | | 2,158,000 | | | 2,589,600 |
| *•# | ILFC E-Capital Trust I 144A 5.74% 12/21/65 | | | 2,460,000 | | | 2,068,835 |
| *•# | ILFC E-Capital Trust II 144A 6.25% 12/21/65 | | | 4,420,000 | | | 3,801,200 |
| | Nuveen Investments 10.50% 11/15/15 | | | 4,980,000 | | | 5,216,549 |
| | | | | | | | 13,676,184 |
| Healthcare – 6.39% | | | | | | |
| | Accellent 10.00% 11/1/17 | | | 1,355,000 | | | 1,338,063 |
| # | AMGH Merger Sub 144A 9.25% 11/1/18 | | | 2,570,000 | | | 2,762,750 |
| | Community Health Systems 8.875% 7/15/15 | | | 2,500,000 | | | 2,590,625 |
| # | DJO Finance 144A 9.75% 10/15/17 | | | 4,094,000 | | | 4,175,879 |
| * | HealthSouth 7.75% 9/15/22 | | | 533,000 | | | 570,310 |
| # | inVentiv Health 144A 10.00% 8/15/18 | | | 1,903,000 | | | 1,864,940 |
| | Lantheus Medical Imaging 9.75% 5/15/17 | | | 3,422,000 | | | 3,507,550 |
| | LVB Acquisition 11.625% 10/15/17 | | | 2,368,000 | | | 2,619,600 |
| # | Multiplan 144A 9.875% 9/1/18 | | | 2,777,000 | | | 2,992,218 |
| | NBTY 9.00% 10/1/18 | | | 2,999,000 | | | 3,220,176 |
14
| | | | Principal | | | |
| | | | amount (U.S. $) | | Value (U.S. $) |
| Corporate Bonds (continued) | | | | | | |
| Healthcare (continued) | | | | | | |
| * | Radiation Therapy Services 9.875% 4/15/17 | | $ | 2,278,000 | | $ | 2,232,440 |
| | Radnet Management 10.375% 4/1/18 | | | 1,979,000 | | | 2,018,580 |
| # | STHI Holding 144A 8.00% 3/15/18 | | | 2,533,000 | | | 2,608,990 |
| | | | | | | | 32,502,121 |
| Insurance – 2.56% | | | | | | |
| *• | American International Group 8.175% 5/15/58 | | | 3,416,000 | | | 3,736,250 |
| • | Genworth Financial 6.15% 11/15/66 | | | 1,422,000 | | | 938,520 |
| • | ING Groep 5.775% 12/29/49 | | | 3,513,000 | | | 3,196,830 |
| •# | Liberty Mutual Group 144A 7.00% 3/15/37 | | | 2,698,000 | | | 2,628,616 |
| • | XL Group 6.50% 12/31/49 | | | 2,700,000 | | | 2,548,125 |
| | | | | | | | 13,048,341 |
| Media – 7.10% | | | | | | |
| # | Affinion Group 144A 7.875% 12/15/18 | | | 3,057,000 | | | 2,904,150 |
| # | AMC Networks 144A 7.75% 7/15/21 | | | 2,675,000 | | | 2,822,125 |
| # | AMO Escrow 144A 11.50% 12/15/17 | | | 1,255,000 | | | 1,352,263 |
| | Cablevision Systems 8.00% 4/15/20 | | | 1,153,000 | | | 1,268,300 |
| | CCO Holdings | | | | | | |
| | *8.125% 4/30/20 | | | 2,199,000 | | | 2,424,398 |
| | #144A 7.00% 1/15/19 | | | 284,000 | | | 296,070 |
| # | Clear Channel Communications 144A 9.00% 3/1/21 | | | 2,684,000 | | | 2,549,800 |
| * | Entravision Communications 8.75% 8/1/17 | | | 1,560,000 | | | 1,638,000 |
| *# | Kabel BW Erste Beteiligungs 144A 7.50% 3/15/19 | | | 1,980,000 | | | 2,049,300 |
| | MDC Partners | | | | | | |
| | 11.00% 11/1/16 | | | 2,275,000 | | | 2,522,406 |
| | #144A 11.00% 11/1/16 | | | 1,260,000 | | | 1,384,425 |
| | Nexstar Broadcasting 8.875% 4/15/17 | | | 2,039,000 | | | 2,156,243 |
| *# | Ono Finance II 144A 10.875% 7/15/19 | | | 3,541,000 | | | 3,709,197 |
| # | Sinclair Television Group 144A 9.25% 11/1/17 | | | 1,380,000 | | | 1,524,900 |
| # | UPC Holding 144A 9.875% 4/15/18 | | | 2,072,000 | | | 2,305,100 |
| | Virgin Media Finance 8.375% 10/15/19 | | | 1,249,000 | | | 1,402,003 |
| * | WMG Acquisition 9.50% 6/15/16 | | | 1,590,000 | | | 1,695,338 |
| # | XM Satellite Radio 144A 7.625% 11/1/18 | | | 1,999,000 | | | 2,128,935 |
| | | | | | | | 36,132,953 |
15
Statement of net assets
Delaware High-Yield Opportunities Fund
| | | | Principal | | | |
| | | | amount (U.S. $) | | Value (U.S. $) |
| Corporate Bonds (continued) | | | | | | |
| Services – 11.06% | | | | | | |
| *# | ARAMARK Holdings PIK 144A 8.625% 5/1/16 | | $ | 2,725,000 | | $ | 2,820,375 |
| | Beazer Homes USA | | | | | | |
| | 9.125% 6/15/18 | | | 723,000 | | | 610,935 |
| | 9.125% 5/15/19 | | | 3,104,000 | | | 2,607,360 |
| | Cardtronics 8.25% 9/1/18 | | | 997,000 | | | 1,061,805 |
| # | Casella Waste Systems 144A 7.75% 2/15/19 | | | 1,571,000 | | | 1,563,145 |
| # | CMA CGM 144A 8.50% 4/15/17 | | | 2,805,000 | | | 2,103,750 |
| | Darling International 8.50% 12/15/18 | | | 1,248,000 | | | 1,380,600 |
| *# | Delta Air Lines 144A 12.25% 3/15/15 | | | 1,931,000 | | | 2,160,306 |
| # | Equinox Holdings 144A 9.50% 2/1/16 | | | 2,004,000 | | | 2,134,260 |
| | Harrah’s Operating 10.00% 12/15/18 | | | 6,041,000 | | | 5,436,899 |
| | Kansas City Southern de Mexico | | | | | | |
| | 8.00% 2/1/18 | | | 1,744,000 | | | 1,940,549 |
| | #144A 6.125% 6/15/21 | | | 850,000 | | | 873,375 |
| | Kansas City Southern Railway 13.00% 12/15/13 | | | 1,000 | | | 1,170 |
| * | Marina District Finance 9.875% 8/15/18 | | | 1,385,000 | | | 1,423,088 |
| | MGM Resorts International 11.375% 3/1/18 | | | 6,116,000 | | | 7,125,139 |
| | M/I Homes 8.625% 11/15/18 | | | 4,014,000 | | | 3,993,929 |
| @‡ | Northwest Airlines 10.00% 2/1/12 | | | 575,000 | | | 3,910 |
| | PHH 9.25% 3/1/16 | | | 2,025,000 | | | 2,227,500 |
| | RSC Equipment Rental | | | | | | |
| | 8.25% 2/1/21 | | | 1,416,000 | | | 1,469,100 |
| | 10.25% 11/15/19 | | | 194,000 | | | 217,765 |
| # | Seven Seas Cruises 144A 9.125% 5/15/19 | | | 2,660,000 | | | 2,786,350 |
| | Standard Pacific 10.75% 9/15/16 | | | 958,000 | | | 1,096,910 |
| | Swift Services Holdings 10.00% 11/15/18 | | | 1,115,000 | | | 1,205,594 |
| *# | Swift Transportation 144A 12.50% 5/15/17 | | | 1,509,000 | | | 1,618,403 |
| # | United Air Lines 144A 12.00% 11/1/13 | | | 2,625,000 | | | 2,802,188 |
| # | West 144A 7.875% 1/15/19 | | | 2,735,000 | | | 2,741,838 |
| | Wynn Las Vegas 7.75% 8/15/20 | | | 2,600,000 | | | 2,886,000 |
| | | | | | | | 56,292,243 |
| Technology & Electronics – 5.85% | | | | | | |
| * | Advanced Micro Devices 7.75% 8/1/20 | | | 2,575,000 | | | 2,723,063 |
| | Aspect Software 10.625% 5/15/17 | | | 2,135,000 | | | 2,295,125 |
| | Avaya | | | | | | |
| | 9.75% 11/1/15 | | | 440,000 | | | 449,900 |
| | #144A 7.00% 4/1/19 | | | 2,951,000 | | | 2,869,848 |
| | PIK 10.125% 11/1/15 | | | 585,000 | | | 601,088 |
16
| | | | Principal | | | |
| | | | amount (U.S. $) | | Value (U.S. $) |
| Corporate Bonds (continued) | | | | | | |
| Technology & Electronics (continued) | | | | | | |
| # | Buccaneer Merger Sub 144A 9.125% 1/15/19 | | $ | 2,065,000 | | $ | 2,170,831 |
| * | First Data | | | | | | |
| | 9.875% 9/24/15 | | | 3,000,000 | | | 3,059,999 |
| | 11.25% 3/31/16 | | | 2,747,000 | | | 2,719,530 |
| * | GXS Worldwide 9.75% 6/15/15 | | | 2,531,000 | | | 2,568,965 |
| # | iGate 144A 9.00% 5/1/16 | | | 2,660,000 | | | 2,673,300 |
| | MagnaChip Semiconductor 10.50% 4/15/18 | | | 1,540,000 | | | 1,713,250 |
| # | MedAssets 144A 8.00% 11/15/18 | | | 1,205,000 | | | 1,223,075 |
| # | Seagate HDD Cayman 144A 7.75% 12/15/18 | | | 2,649,000 | | | 2,794,695 |
| * | SunGard Data Systems 10.25% 8/15/15 | | | 1,842,000 | | | 1,915,680 |
| | | | | | | | 29,778,349 |
| Telecommunications – 8.90% | | | | | | |
| # | Clearwire Communications 144A | | | | | | |
| | 12.00% 12/1/15 | | | 1,363,000 | | | 1,393,668 |
| | *12.00% 12/1/15 | | | 1,637,000 | | | 1,679,971 |
| | *12.00% 12/1/17 | | | 3,579,538 | | | 3,311,133 |
| # | Columbus International 144A 11.50% 11/20/14 | | | 2,800,000 | | | 3,157,783 |
| * | Cricket Communications 7.75% 10/15/20 | | | 2,764,000 | | | 2,750,180 |
| # | Digicel Group 144A 10.50% 4/15/18 | | | 2,439,000 | | | 2,737,778 |
| # | EH Holding 144A 7.625% 6/15/21 | | | 2,190,000 | | | 2,266,650 |
| # | Integra Telecom Holdings 144A 10.75% 4/15/16 | | | 2,025,000 | | | 2,111,063 |
| | Intelsat Bermuda | | | | | | |
| | 11.25% 2/4/17 | | | 3,550,000 | | | 3,807,375 |
| | PIK 11.50% 2/4/17 | | | 3,708,300 | | | 3,995,692 |
| # | Level 3 Communications 144A 11.875% 2/1/19 | | | 1,100,000 | | | 1,207,250 |
| | Level 3 Financing 10.00% 2/1/18 | | | 2,586,000 | | | 2,799,345 |
| | NII Capital 7.625% 4/1/21 | | | 1,356,000 | | | 1,430,580 |
| | PAETEC Holding 9.875% 12/1/18 | | | 1,720,000 | | | 1,853,300 |
| *# | Satmex Escrow 144A 9.50% 5/15/17 | | | 1,330,000 | | | 1,369,900 |
| * | Sprint Capital 8.75% 3/15/32 | | | 2,609,000 | | | 2,837,288 |
| | Telesat Canada 12.50% 11/1/17 | | | 1,403,000 | | | 1,653,786 |
| # | Wind Acquisition Finance 144A 11.75% 7/15/17 | | | 4,400,000 | | | 4,900,499 |
| | | | | | | | 45,263,241 |
| Utilities – 2.18% | | | | | | |
| # | Calpine 144A | | | | | | |
| | 7.50% 2/15/21 | | | 1,625,000 | | | 1,690,000 |
| | 7.875% 1/15/23 | | | 1,050,000 | | | 1,103,813 |
17
Statement of net assets
Delaware High-Yield Opportunities Fund
| | | | Principal | | | |
| | | | amount (U.S. $) | | Value (U.S. $) |
| Corporate Bonds (continued) | | | | | | |
| Utilities (continued) | | | | | | |
| | Elwood Energy 8.159% 7/5/26 | | $ | 1,326,373 | | $ | 1,339,636 |
| | GenOn Energy 9.50% 10/15/18 | | | 1,479,000 | | | 1,556,648 |
| * | Mirant Americas 8.50% 10/1/21 | | | 2,712,000 | | | 2,779,799 |
| # | NRG Energy 144A 7.875% 5/15/21 | | | 2,600,000 | | | 2,626,000 |
| | | | | | | | 11,095,896 |
| Total Corporate Bonds (cost $452,272,184) | | | | | | 467,674,794 |
| |
| «Senior Secured Loans – 1.18% | | | | | | |
| | Brock Holdings III 10.00% 2/15/18 | | | 925,000 | | | 953,911 |
| | PQ 6.69% 7/30/15 | | | 2,504,000 | | | 2,460,180 |
| | Texas Competitive Electric Holdings 3.686% 10/10/14 | | | 3,295,000 | | | 2,594,812 |
| Total Senior Secured Loans (cost $5,898,356) | | | | | | 6,008,903 |
| |
| | | | Number of shares | | | |
| Common Stock – 0.49% | | | | | | |
| † | Alliance HealthCare Service | | | 107,528 | | | 388,176 |
| =∏† | Avado Brands | | | 10,210 | | | 0 |
| =† | Century Communications | | | 4,250,000 | | | 0 |
| † | Delta Air Lines | | | 208 | | | 1,641 |
| † | DIRECTV Class A | | | 19,150 | | | 970,522 |
| † | Flextronics International | | | 49,950 | | | 322,178 |
| *† | GenOn Energy | | | 5,032 | | | 19,574 |
| † | GeoEye | | | 7,900 | | | 315,684 |
| *† | Mobile Mini | | | 22,073 | | | 465,961 |
| =∏† | PT Holdings | | | 3,285 | | | 33 |
| Total Common Stock (cost $5,166,712) | | | | | | 2,483,769 |
| |
| Preferred Stock – 1.57% | | | | | | |
| | Ally Financial | | | | | | |
| | ∏•8.50% | | | 50,000 | | | 1,231,000 |
| | #144A 7.00% | | | 4,200 | | | 3,815,963 |
| •† | GMAC Capital Trust I 8.125% | | | 115,000 | | | 2,946,300 |
| =† | PT Holdings | | | 657 | | | 0 |
| Total Preferred Stock (cost $8,344,280) | | | | | | 7,993,263 |
18
| | | | Number of shares | | Value (U.S. $) | |
| Warrant – 0.00% | | | | | | | |
| =∏@† | PT Holdings | | | 657 | | $ | 7 | |
| Total Warrant (cost $15,768) | | | | | | 7 | |
| | | | | | | | | |
| | | | Principal | | | | |
| | | | amount (U.S. $) | | | | |
| Short-Term Investments – 3.76% | | | | | | | |
| ≠Discount Note – 2.80% | | | | | | | |
| | Federal Home Loan Bank 0.05% 8/6/11 | | $ | 14,264,091 | | | 14,264,091 | |
| | | | | | | | 14,264,091 | |
| Repurchase Agreement – 0.96% | | | | | | | |
| | BNP Paribas 0.14%, dated 7/29/11, to be | | | | | | | |
| | repurchased on 8/1/11, repurchase price | | | | | | | |
| | $4,881,010 (collateralized by U.S. | | | | | | | |
| | Government obligations 3.875% 4/15/29, | | | | | | | |
| | market value $4,978,575) | | | 4,880,953 | | | 4,880,953 | |
| | | | | | | | 4,880,953 | |
| Total Short-Term Investments (cost $19,145,044) | | | | | | 19,145,044 | |
| | | | | | | | | |
| Total Value of Securities Before Securities | | | | | | | |
| | Lending Collateral – 98.90% (cost $490,842,344) | | | | | | 503,305,780 | |
| | | | | | | | |
| | | | Number of shares | | | | |
| Securities Lending Collateral** – 14.70% | | | | | | | |
| | Investment Companies | | | | | | | |
| | BNY Mellon SL DBT II Liquidating Fund | | | 325,764 | | | 314,395 | |
| | Delaware Investments Collateral Fund No. 1 | | | 74,493,052 | | | 74,493,052 | |
| | †@Mellon GSL Reinvestment Trust II | | | 514,615 | | | 0 | |
| Total Securities Lending Collateral (cost $75,333,431) | | | | | | 74,807,447 | |
| | | | | | | | | |
| Total Value of Securities – 113.60% | | | | | | | |
| | (cost $566,175,775) | | | | | | 578,113,227 | © |
| Obligation to Return Securities | | | | | | | |
| | Lending Collateral** – (14.80%) | | | | | | (75,333,431 | ) |
| Receivables and Other Assets | | | | | | | |
| | Net of Other Liabilities – 1.20% | | | | | | 6,103,759 | |
| Net Assets Applicable to 121,267,918 | | | | | | | |
| | Shares Outstanding – 100.00% | | | | | $ | 508,883,555 | |
19
Statement of net assets
Delaware High-Yield Opportunities Fund
| | | | | |
| Net Asset Value – Delaware High-Yield Opportunities Fund | | | | |
| | Class A ($306,303,707 / 73,015,498 Shares) | | $ | 4.20 | |
| Net Asset Value – Delaware High-Yield Opportunities Fund | | | | |
| | Class B ($7,527,206 / 1,795,089 Shares) | | $ | 4.19 | |
| Net Asset Value – Delaware High-Yield Opportunities Fund | | | | |
| | Class C ($53,151,229 / 12,650,568 Shares) | | $ | 4.20 | |
| Net Asset Value – Delaware High-Yield Opportunities Fund | | | | |
| | Class R ($19,046,109 / 4,525,912 Shares) | | $ | 4.21 | |
| Net Asset Value – Delaware High-Yield Opportunities Fund | | | | |
| | Institutional Class ($122,855,304 / 29,280,851 Shares) | | $ | 4.20 | |
| Components of Net Assets at July 31, 2011: | | | | |
| Shares of beneficial interest (unlimited authorization – no par) | | $ | 538,824,815 | |
| Undistributed net investment income | | | 716,341 | |
| Accumulated net realized loss on investments | | | (42,594,732 | ) |
| Net unrealized appreciation of investments | | | 11,937,131 | |
| Total net assets | | $ | 508,883,555 | |
| * | Fully or partially on loan. |
| # | Security exempt from registration under Rule 144A of the Securities Act of 1933, as amended. At July 31, 2011, the aggregate amount of Rule 144A securities was $217,537,430, which represented 42.75% of the Fund’s net assets. See Note 9 in “Notes to financial statements.” |
| • | Variable rate security. The rate shown is the rate as of July 31, 2011. Interest rates reset periodically. |
| = | Security is being fair valued in accordance with the Fund’s fair valuation policy. At July 31, 2011, the aggregate amount of fair valued securities was $438,160, which represented 0.09% of the Fund’s net assets. See Note 1 in “Notes to financial statements.” |
| @ | Illiquid securities. At July 31, 2011, the aggregate amount of illiquid securities was $442,037, which represented 0.09% of the Fund’s net assets. See Note 9 in “Notes to financial statements.” |
| ‡ | Non income producing security. Security is currently in default. |
| « | Senior Secured Loans generally pay interest at rates which are periodically redetermined by reference to a base lending rate plus a premium. These base lending rates are generally: (i) the prime rate offered by one or more United States banks, (ii) the lending rate offered by one or more European banks such as the London Inter-Bank Offered Rate (LIBOR), and (iii) the certificate of deposit rate. Senior Secured Loans may be subject to restrictions on resale. Stated rate in effect at July 31, 2011. |
20
| | |
| † | Non income producing security. |
| ∏ | Restricted securities. These investments are in securities not registered under the Securities Act of 1933, as amended and have certain restrictions on resale which may limit their liquidity. At July 31, 2011, the aggregate amount of restricted securities was $1,231,040, which represented 0.24% of the Fund’s net assets. See Note 9 in “Notes to financial statements.” |
| ≠ | The rate shown is the effective yield at the time of purchase. |
| ** | See Note 8 in “Notes to financial statements.” |
| © | Includes $72,427,569 of securities loaned. |
PIK — Pay-in-kind
| Net Asset Value and Offering Price Per Share – | | | |
| Delaware High-Yield Opportunities Fund | | | |
| Net asset value Class A (A) | | $ | 4.20 |
| Sales charge (4.50% of offering price) (B) | | | 0.20 |
| Offering price | | $ | 4.40 |
| (A) | | Net asset value per share, as illustrated, is the amount which would be paid upon redemption or repurchase of shares. |
| (B) | | See the current prospectus for purchase of $100,000 or more. |
See accompanying notes, which are an integral part of the financial statements.
21
| Statement of operations | |
| Delaware High-Yield Opportunities Fund | Year Ended July 31, 2011 |
| Investment Income: | | | | | | | |
| | Interest | | $ | 44,797,642 | | | | |
| | Dividends | | | 465,811 | | | | |
| | Securities lending income | | | 460,745 | | $ | 45,724,198 | |
| | | | | | | | |
| Expenses: | | | | | | | |
| | Management fees | | | 3,393,472 | | | | |
| | Distribution expenses – Class A | | | 1,084,498 | | | | |
| | Distribution expenses – Class B | | | 92,239 | | | | |
| | Distribution expenses – Class C | | | 463,552 | | | | |
| | Distribution expenses – Class R | | | 100,576 | | | | |
| | Dividend disbursing and transfer agent fees and expenses | | | 789,090 | | | | |
| | Accounting and administration expenses | | | 206,449 | | | | |
| | Registration fees | | | 102,079 | | | | |
| | Reports and statements to shareholders | | | 62,734 | | | | |
| | Legal fees | | | 43,069 | | | | |
| | Audit and tax | | | 34,116 | | | | |
| | Insurance fees | | | 30,814 | | | | |
| | Trustees’ fees | | | 27,909 | | | | |
| | Dues and services | | | 23,835 | | | | |
| | Custodian fees | | | 12,567 | | | | |
| | Consulting fees | | | 8,273 | | | | |
| | Pricing fees | | | 6,119 | | | | |
| | Trustees’ expenses | | | 3,102 | | | 6,484,493 | |
| | Less fees waived | | | | | | (477,332 | ) |
| | Less waived distribution expenses – Class R | | | | | | (16,763 | ) |
| | Less expense paid indirectly | | | | | | (1,377 | ) |
| | Total operating expenses | | | | | | 5,989,021 | |
| Net Investment Income | | | | | | 39,735,177 | |
| | | | | | | | | |
| Net Realized and Unrealized Gain (Loss) on Investments: | | | | | | | |
| | Net realized gain on investments | | | | | | 30,062,333 | |
| | Net change in unrealized appreciation/depreciation of investments | | | | | | (3,141,584 | ) |
| Net Realized and Unrealized Gain on Investments | | | | | | 26,920,749 | |
| | | | | | | | | |
| Net Increase in Net Assets Resulting from Operations | | | | | $ | 66,655,926 | |
See accompanying notes, which are an integral part of the financial statements.
23
Statements of changes in net assets
Delaware High-Yield Opportunities Fund
| | | Year Ended |
| | | 7/31/11 | | 7/31/10 |
| Increase (Decrease) in Net Assets from Operations: | | | | | | | | |
| Net investment income | | $ | 39,735,177 | | | $ | 40,285,552 | |
| Net realized gain on investments | | | 30,062,333 | | | | 42,973,954 | |
| Net change in unrealized appreciation/depreciation | | | | | | | | |
| of investments | | | (3,141,584 | ) | | | 2,298,932 | |
| Net increase in net assets resulting from operations | | | 66,655,926 | | | | 85,558,438 | |
| | | | | | | | | |
| Dividends and Distributions to Shareholders from: | | | | | | | | |
| Net investment income: | | | | | | | | |
| Class A | | | (28,743,438 | ) | | | (29,460,917 | ) |
| Class B | | | (663,551 | ) | | | (947,675 | ) |
| Class C | | | (3,302,907 | ) | | | (2,906,880 | ) |
| Class R | | | (1,280,922 | ) | | | (1,618,544 | ) |
| Institutional Class | | | (6,949,686 | ) | | | (4,490,067 | ) |
| | | | (40,940,504 | ) | | | (39,424,083 | ) |
| | | | | | | | | |
| Capital Share Transactions: | | | | | | | | |
| Proceeds from shares sold: | | | | | | | | |
| Class A | | | 147,142,944 | | | | 167,859,742 | |
| Class B | | | 89,206 | | | | 308,444 | |
| Class C | | | 24,959,490 | | | | 8,696,441 | |
| Class R | | | 10,148,940 | | | | 12,483,630 | |
| Institutional Class | | | 107,327,461 | | | | 36,358,388 | |
| | | | | | | | | |
| Net asset value of shares issued upon reinvestment of | | | | | | | | |
| dividends and distributions: | | | | | | | | |
| Class A | | | 21,600,062 | | | | 20,974,439 | |
| Class B | | | 378,617 | | | | 532,742 | |
| Class C | | | 2,000,469 | | | | 1,484,481 | |
| Class R | | | 1,262,481 | | | | 1,388,706 | |
| Institutional Class | | | 4,633,841 | | | | 2,797,535 | |
| | | | 319,543,511 | | | | 252,884,548 | |
24
| | | Year Ended |
| | | 7/31/11 | | 7/31/10 |
| Capital Share Transactions (continued): | | | | | | | | |
| Cost of shares repurchased: | | | | | | | | |
| Class A | | $ | (216,729,375 | ) | | $ | (148,761,801 | ) |
| Class B | | | (3,578,810 | ) | | | (3,977,335 | ) |
| Class C | | | (11,892,841 | ) | | | (9,316,161 | ) |
| Class R | | | (7,872,999 | ) | | | (16,181,518 | ) |
| Institutional Class | | | (52,727,065 | ) | | | (29,512,003 | ) |
| | | | (292,801,090 | ) | | | (207,748,818 | ) |
| Increase in net assets derived from | | | | | | | | |
| capital share transactions | | | 26,742,421 | | | | 45,135,730 | |
| Net Increase in Net Assets | | | 52,457,843 | | | | 91,270,085 | |
| | | | | | | | | |
| Net Assets: | | | | | | | | |
| Beginning of year | | | 456,425,712 | | | | 365,155,627 | |
| End of year (including undistributed net investment | | | | | | | | |
| income of $716,341 and $158,107, respectively) | | $ | 508,883,555 | | | $ | 456,425,712 | |
See accompanying notes, which are an integral part of the financial statements.
25
Financial highlights
Delaware High-Yield Opportunities Fund Class A
Selected data for each share of the Fund outstanding throughout each period were as follows:
| Net asset value, beginning of period |
| |
| Income (loss) from investment operations: |
| Net investment income |
| Net realized and unrealized gain (loss) on investments |
| Total from investment operations |
| |
| Less dividends and distributions from: |
| Net investment income |
| Total dividends and distributions |
| |
| Net asset value, end of period |
| |
| Total return1 |
| |
| Ratios and supplemental data: |
| Net assets, end of period (000 omitted) |
| Ratio of expenses to average net assets |
Ratio of expenses to average net assets
prior to fees waived and expense paid indirectly |
| Ratio of net investment income to average net assets |
Ratio of net investment income to average net assets
prior to fees waived and expense paid indirectly |
| Portfolio turnover |
1 Total investment return is based on the change in net asset value of a share during the period and assumes reinvestment of dividends and distributions at net asset value and does not reflect the impact of a sales charge. Total investment return during all of the periods shown reflects a waiver by the manager. Performance would have been lower had the waiver not been in effect. |
See accompanying notes, which are an integral part of the financial statements.
26
| | | Year Ended | |
| | | 7/31/11 | | 7/31/10 | | 7/31/09 | | 7/31/08 | | 7/31/07 | |
| | | $3.980 | | | $3.560 | | | $3.880 | | | $4.260 | | | $4.260 | | |
| | | | | | | | | | | | | | | | | |
| | | | | | | | | | | | | | | | | |
| | | 0.315 | | | 0.356 | | | 0.323 | | | 0.299 | | | 0.321 | | |
| | | 0.231 | | | 0.412 | | | (0.347 | ) | | (0.368 | ) | | 0.012 | | |
| | | 0.546 | | | 0.768 | | | (0.024 | ) | | (0.069 | ) | | 0.333 | | |
| | | | | | | | | | | | | | | | | |
| | | | | | | | | | | | | | | | | |
| | | (0.326 | ) | | (0.348 | ) | | (0.296 | ) | | (0.311 | ) | | (0.333 | ) | |
| | | (0.326 | ) | | (0.348 | ) | | (0.296 | ) | | (0.311 | ) | | (0.333 | ) | |
| | | | | | | | | | | | | | | | | |
| | | $4.200 | | | $3.980 | | | $3.560 | | | $3.880 | | | $4.260 | | |
| | | | | | | | | | | | | | | | | |
| | | 14.11% | | | 22.30% | | | 0.81% | | | (1.74% | ) | | 7.82% | | |
| | | | | | | | | | | | | | | | | |
| | | | | | | | | | | | | | | | | |
| | | $306,304 | | | $335,684 | | | $261,286 | | | $86,809 | | | $102,420 | | |
| | | 1.11% | | | 1.11% | | | 1.15% | | | 1.13% | | | 1.13% | | |
| | | | | | | | | | | | | | | | | |
| | | 1.20% | | | 1.25% | | | 1.37% | | | 1.31% | | | 1.27% | | |
| | | 7.60% | | | 9.25% | | | 9.92% | | | 7.28% | | | 7.24% | | |
| | | | | | | | | | | | | | | | | |
| | | 7.51% | | | 9.11% | | | 9.70% | | | 7.10% | | | 7.10% | | |
| | | 115% | | | 141% | | | 89% | | | 143% | | | 149% | | |
27
Financial highlights
Delaware High-Yield Opportunities Fund Class B
Selected data for each share of the Fund outstanding throughout each period were as follows:
| Net asset value, beginning of period |
| |
| Income (loss) from investment operations: |
| Net investment income |
| Net realized and unrealized gain (loss) on investments |
| Total from investment operations |
| |
| Less dividends and distributions from: |
| Net investment income |
| Total dividends and distributions |
| |
| Net asset value, end of period |
| |
| Total return1 |
| |
| Ratios and supplemental data: |
| Net assets, end of period (000 omitted) |
| Ratio of expenses to average net assets |
Ratio of expenses to average net assets
prior to fees waived and expense paid indirectly |
| Ratio of net investment income to average net assets |
Ratio of net investment income to average net assets
prior to fees waived and expense paid indirectly |
| Portfolio turnover |
1 Total investment return is based on the change in net asset value of a share during the period and assumes reinvestment of dividends and distributions at net asset value and does not reflect the impact of a sales charge. Total investment return during all of the periods shown reflects a waiver by the manager. Performance would have been lower had the waiver not been in effect. |
See accompanying notes, which are an integral part of the financial statements.
28
| | | Year Ended | |
| | | 7/31/11 | | 7/31/10 | | 7/31/09 | | 7/31/08 | | 7/31/07 | |
| | | $3.980 | | | $3.560 | | | $3.880 | | | $4.260 | | | $4.260 | | |
| | | | | | | | | | | | | | | | | |
| | | | | | | | | | | | | | | | | |
| | | 0.286 | | | 0.329 | | | 0.300 | | | 0.271 | | | 0.291 | | |
| | | 0.221 | | | 0.412 | | | (0.347 | ) | | (0.368 | ) | | 0.012 | | |
| | | 0.507 | | | 0.741 | | | (0.047 | ) | | (0.097 | ) | | 0.303 | | |
| | | | | | | | | | | | | | | | | |
| | | | | | | | | | | | | | | | | |
| | | (0.297 | ) | | (0.321 | ) | | (0.273 | ) | | (0.283 | ) | | (0.303 | ) | |
| | | (0.297 | ) | | (0.321 | ) | | (0.273 | ) | | (0.283 | ) | | (0.303 | ) | |
| | | | | | | | | | | | | | | | | |
| | | $4.190 | | | $3.980 | | | $3.560 | | | $3.880 | | | $4.260 | | |
| | | | | | | | | | | | | | | | | |
| | | 13.06% | | | 21.46% | | | 0.11% | | | (2.42% | ) | | 7.08% | | |
| | | | | | | | | | | | | | | | | |
| | | | | | | | | | | | | | | | | |
| | | $7,527 | | | $10,143 | | | $11,966 | | | $7,827 | | | $12,446 | | |
| | | 1.81% | | | 1.81% | | | 1.85% | | | 1.83% | | | 1.83% | | |
| | | | | | | | | | | | | | | | | |
| | | 1.90% | | | 1.95% | | | 2.07% | | | 2.01% | | | 1.97% | | |
| | | 6.90% | | | 8.55% | | | 9.22% | | | 6.58% | | | 6.54% | | |
| | | | | | | | | | | | | | | | | |
| | | 6.81% | | | 8.41% | | | 9.00% | | | 6.40% | | | 6.40% | | |
| | | 115% | | | 141% | | | 89% | | | 143% | | | 149% | | |
29
Financial highlights
Delaware High-Yield Opportunities Fund Class C
Selected data for each share of the Fund outstanding throughout each period were as follows:
| Net asset value, beginning of period |
| |
| Income (loss) from investment operations: |
| Net investment income |
| Net realized and unrealized gain (loss) on investments |
| Total from investment operations |
| |
| Less dividends and distributions from: |
| Net investment income |
| Total dividends and distributions |
| |
| Net asset value, end of period |
| |
| Total return1 |
| |
| Ratios and supplemental data: |
| Net assets, end of period (000 omitted) |
| Ratio of expenses to average net assets |
| Ratio of expenses to average net assets |
| prior to fees waived and expense paid indirectly |
| Ratio of net investment income to average net assets |
| Ratio of net investment income to average net assets |
| prior to fees waived and expense paid indirectly |
| Portfolio turnover |
1 Total investment return is based on the change in net asset value of a share during the period and assumes reinvestment of dividends and distributions at net asset value and does not reflect the impact of a sales charge. Total investment return during all of the periods shown reflects a waiver by the manager. Performance would have been lower had the waiver not been in effect.
See accompanying notes, which are an integral part of the financial statements.
30
| | Year Ended |
| | | 7/31/11 | | 7/31/10 | | 7/31/09 | | 7/31/08 | | 7/31/07 | |
| | | $3.990 | | | $3.560 | | | $3.880 | | | $4.260 | | | $4.260 | | |
| | | | | | | | | | | | | | | | | |
| | | | | | | | | | | | | | | | | |
| | | 0.287 | | | 0.329 | | | 0.300 | | | 0.270 | | | 0.290 | | |
| | | 0.221 | | | 0.422 | | | (0.347 | ) | | (0.368 | ) | | 0.012 | | |
| | | 0.508 | | | 0.751 | | | (0.047 | ) | | (0.098 | ) | | 0.302 | | |
| | | | | | | | | | | | | | | | | |
| | | | | | | | | | | | | | | | | |
| | | (0.298 | ) | | (0.321 | ) | | (0.273 | ) | | (0.282 | ) | | (0.302 | ) | |
| | | (0.298 | ) | | (0.321 | ) | | (0.273 | ) | | (0.282 | ) | | (0.302 | ) | |
| | | | | | | | | | | | | | | | | |
| | | $4.200 | | | $3.990 | | | $3.560 | | | $3.880 | | | $4.260 | | |
| | | | | | | | | | | | | | | | | |
| | | 13.04% | | | 21.75% | | | 0.10% | | | (2.44% | ) | | 7.07% | | |
| | | | | | | | | | | | | | | | | |
| | | | | | | | | | | | | | | | | |
| | | $53,151 | | | $36,060 | | | $31,415 | | | $21,146 | | | $27,179 | | |
| | | 1.81% | | | 1.81% | | | 1.85% | | | 1.83% | | | 1.83% | | |
| | | | | | | | | | | | | | | | | |
| | | 1.90% | | | 1.95% | | | 2.07% | | | 2.01% | | | 1.97% | | |
| | | 6.90% | | | 8.55% | | | 9.22% | | | 6.58% | | | 6.54% | | |
| | | | | | | | | | | | | | | | | |
| | | 6.81% | | | 8.41% | | | 9.00% | | | 6.40% | | | 6.40% | | |
| | | 115% | | | 141% | | | 89% | | | 143% | | | 149% | | |
31
Financial highlights
Delaware High-Yield Opportunities Fund Class R
Selected data for each share of the Fund outstanding throughout each period were as follows:
| Net asset value, beginning of period |
| |
| Income (loss) from investment operations: |
| Net investment income |
| Net realized and unrealized gain (loss) on investments |
| Total from investment operations |
| |
| Less dividends and distributions from: |
| Net investment income |
| Total dividends and distributions |
| |
| Net asset value, end of period |
| |
| Total return1 |
| |
| Ratios and supplemental data: |
| Net assets, end of period (000 omitted) |
| Ratio of expenses to average net assets |
| Ratio of expenses to average net assets |
| prior to fees waived and expense paid indirectly |
| Ratio of net investment income to average net assets |
| Ratio of net investment income to average net assets |
| prior to fees waived and expense paid indirectly |
| Portfolio turnover |
1 Total investment return is based on the change in net asset value of a share during the period and assumes reinvestment of dividends and distributions at net asset value. Total investment return during all of the periods shown reflects a waiver by the manager and during some of the periods shown reflects a waiver by the distributor. Performance would have been lower had the waivers not been in effect.
See accompanying notes, which are an integral part of the financial statements.
32
| | Year Ended |
| | | 7/31/11 | | | 7/31/10 | | | 7/31/09 | | | 7/31/08 | | | 7/31/07 | | |
| | | $3.990 | | | $3.570 | | | $3.890 | | | $4.270 | | | $4.270 | | |
| | | | | | | | | | | | | | | | | |
| | | | | | | | | | | | | | | | | |
| | | 0.308 | | | 0.349 | | | 0.316 | | | 0.291 | | | 0.313 | | |
| | | 0.231 | | | 0.412 | | | (0.347 | ) | | (0.368 | ) | | 0.012 | | |
| | | 0.539 | | | 0.761 | | | (0.031 | ) | | (0.077 | ) | | 0.325 | | |
| | | | | | | | | | | | | | | | | |
| | | | | | | | | | | | | | | | | |
| | | (0.319 | ) | | (0.341 | ) | | (0.289 | ) | | (0.303 | ) | | (0.325 | ) | |
| | | (0.319 | ) | | (0.341 | ) | | (0.289 | ) | | (0.303 | ) | | (0.325 | ) | |
| | | | | | | | | | | | | | | | | |
| | | $4.210 | | | $3.990 | | | $3.570 | | | $3.890 | | | $4.270 | | |
| | | | | | | | | | | | | | | | | |
| | | 13.87% | | | 22.01% | | | 0.62% | | | (1.93% | ) | | 7.59% | | |
| | | | | | | | | | | | | | | | | |
| | | | | | | | | | | | | | | | | |
| | | $19,046 | | | $14,708 | | | $15,323 | | | $11,305 | | | $9,251 | | |
| | | 1.31% | | | 1.31% | | | 1.35% | | | 1.33% | | | 1.33% | | |
| | | | | | | | | | | | | | | | | |
| | | 1.50% | | | 1.55% | | | 1.67% | | | 1.61% | | | 1.57% | | |
| | | 7.40% | | | 9.05% | | | 9.72% | | | 7.08% | | | 7.04% | | |
| | | | | | | | | | | | | | | | | |
| | | 7.21% | | | 8.81% | | | 9.40% | | | 6.80% | | | 6.80% | | |
| | | 115% | | | 141% | | | 89% | | | 143% | | | 149% | | |
33
Financial highlights
Delaware High-Yield Opportunities Fund Institutional Class
Selected data for each share of the Fund outstanding throughout each period were as follows:
| Net asset value, beginning of period |
| |
| Income (loss) from investment operations: |
| Net investment income |
| Net realized and unrealized gain (loss) on investments |
| Total from investment operations |
| |
| Less dividends and distributions from: |
| Net investment income |
| Total dividends and distributions |
| |
| Net asset value, end of period |
| |
| Total return1 |
| |
| Ratios and supplemental data: |
| Net assets, end of period (000 omitted) |
| Ratio of expenses to average net assets |
| Ratio of expenses to average net assets |
| prior to fees waived and expense paid indirectly |
| Ratio of net investment income to average net assets |
| Ratio of net investment income to average net assets |
| prior to fees waived and expense paid indirectly |
| Portfolio turnover |
1 Total investment return is based on the change in net asset value of a share during the period and assumes reinvestment of dividends and distributions at net asset value. Total investment return during all of the periods shown reflects a waiver by the manager. Performance would have been lower had the waiver not been in effect.
See accompanying notes, which are an integral part of the financial statements.
34
| | Year Ended |
| | | 7/31/11 | | 7/31/10 | | 7/31/09 | | 7/31/08 | | 7/31/07 | |
| | | $3.980 | | | $3.560 | | | $3.880 | | | $4.260 | | | $4.260 | | |
| | | | | | | | | | | | | | | | | |
| | | | | | | | | | | | | | | | | |
| | | 0.328 | | | 0.367 | | | 0.332 | | | 0.312 | | | 0.335 | | |
| | | 0.231 | | | 0.412 | | | (0.347 | ) | | (0.368 | ) | | 0.012 | | |
| | | 0.559 | | | 0.779 | | | (0.015 | ) | | (0.056 | ) | | 0.347 | | |
| | | | | | | | | | | | | | | | | |
| | | | | | | | | | | | | | | | | |
| | | (0.339 | ) | | (0.359 | ) | | (0.305 | ) | | (0.324 | ) | | (0.347 | ) | |
| | | (0.339 | ) | | (0.359 | ) | | (0.305 | ) | | (0.324 | ) | | (0.347 | ) | |
| | | | | | | | | | | | | | | | | |
| | | $4.200 | | | $3.980 | | | $3.560 | | | $3.880 | | | $4.260 | | |
| | | | | | | | | | | | | | | | | |
| | | 14.45% | | | 22.65% | | | 1.11% | | | (1.45% | ) | | 8.15% | | |
| | | | | | | | | | | | | | | | | |
| | | | | | | | | | | | | | | | | |
| | | $122,855 | | | $59,831 | | | $45,166 | | | $37,465 | | | $26,557 | | |
| | | 0.81% | | | 0.81% | | | 0.85% | | | 0.83% | | | 0.83% | | |
| | | | | | | | | | | | | | | | | |
| | | 0.90% | | | 0.95% | | | 1.07% | | | 1.01% | | | 0.97% | | |
| | | 7.90% | | | 9.55% | | | 10.22% | | | 7.58% | | | 7.54% | | |
| | | | | | | | | | | | | | | | | |
| | | 7.81% | | | 9.41% | | | 10.00% | | | 7.40% | | | 7.40% | | |
| | | 115% | | | 141% | | | 89% | | | 143% | | | 149% | | |
35
Notes to financial statements
| Delaware High-Yield Opportunities Fund | July 31, 2011 |
Delaware Group® Income Funds (Trust) is organized as a Delaware statutory trust and offers five Series: Delaware Core Bond Fund, Delaware Corporate Bond Fund, Delaware Extended Duration Bond Fund, Delaware Diversified Floating Rate Fund and Delaware High-Yield Opportunities Fund. These financial statements and the related notes pertain to Delaware High-Yield Opportunities Fund (Fund). The Trust is an open-end investment company. The Fund is considered diversified under the Investment Company Act of 1940, as amended, and offers Class A, Class B, Class C, Class R and Institutional Class shares. Class A shares are sold with a maximum front-end sales charge of up to 4.50%. Class A share purchases of $1,000,000 or more will incur a contingent deferred sales charge (CDSC) of 1% if redeemed during the first year and 0.50% during the second year, provided that Delaware Distributors, L.P. (DDLP) paid a financial advisor a commission on the purchase of those shares. Class B shares may only be purchased through dividend reinvestment and certain permitted exchanges. Prior to June 1, 2007, Class B shares were sold with a CDSC that declined from 4% to zero depending upon the period of time the shares were held. Class B shares will automatically convert to Class A shares on a quarterly basis approximately eight years after purchase. Class C shares are sold with a CDSC of 1%, if redeemed during the first twelve months. Class R and Institutional Class shares are not subject to a sales charge and are offered for sale exclusively to certain eligible investors.
The investment objective of the Fund is to seek total return and, as a secondary objective, high current income.
1. Significant Accounting Policies
The following accounting policies are in accordance with U.S. generally accepted accounting principles (U.S. GAAP) and are consistently followed by the Fund.
Security Valuation — Equity securities, except those traded on the Nasdaq Stock Market, Inc. (Nasdaq), are valued at the last quoted sales price as of the time of the regular close of the New York Stock Exchange (NYSE) on the valuation date. Securities traded on the Nasdaq are valued in accordance with the Nasdaq Official Closing Price, which may not be the last sales price. If on a particular day an equity security does not trade, then the mean between the bid and ask prices will be used. Short-term debt securities are valued at market value. U.S. government and agency securities are valued at the mean between the bid and ask prices. Other debt securities are valued by an independent pricing service or broker. To the extent current market prices are not available, the pricing service may take into account developments related to the specific security, as well as transactions in comparable securities. Investment company securities are valued at net asset value per share. Generally, other securities and assets for which market quotations are not readily available are valued at fair value as determined in good faith under the direction of the Fund’s Board of Trustees (Board). In determining whether market quotations are readily available or fair valuation will be used, various factors will be taken into consideration, such as market closures or suspension of trading in a security. The Fund may use fair value pricing more frequently for securities traded primarily in non-U.S. markets because, among other things, most foreign markets close well before the Fund values its securities, generally as of 4:00 p.m. Eastern time. The
36
earlier close of these foreign markets gives rise to the possibility that significant events, including broad market moves, government actions or pronouncements, aftermarket trading, or news events may have occurred in the interim. To account for this, the Fund may frequently value foreign securities using fair value prices based on third-party vendor modeling tools (international fair value pricing).
Federal Income Taxes — No provision for federal income taxes has been made as the Fund intends to continue to qualify for federal income tax purposes as a regulated investment company under Subchapter M of the Internal Revenue Code of 1986, as amended, and make the requisite distributions to shareholders. The Fund evaluates tax positions taken or expected to be taken in the course of preparing the Fund’s tax returns to determine whether the tax positions are “more-likely-than-not” of being sustained by the applicable tax authority. Tax positions not deemed to meet the more-likely-than-not threshold are recorded as a tax benefit or expense in the current year. Management has analyzed the Fund’s tax positions taken on federal income tax returns for all open tax years (July 31, 2008-July 31, 2011), and has concluded that no provision for federal income tax is required in the Fund’s financial statements.
Class Accounting — Investment income and common expenses are allocated to the various classes of the Fund on the basis of “settled shares” of each class in relation to the net assets of the Fund. Realized and unrealized gain (loss) on investments are allocated to the various classes of the Fund on the basis of daily net assets of each class. Distribution expenses relating to a specific class are charged directly to that class.
Repurchase Agreements — The Fund may purchase certain U.S. Government securities subject to the counterparty’s agreement to repurchase them at an agreed upon date and price. The counterparty will be required on a daily basis to maintain the value of the collateral subject to the agreement at not less than the repurchase price (including accrued interest). The agreements are conditioned upon the collateral being deposited under the Federal Reserve book-entry system with the Fund’s custodian or a third party sub-custodian. In the event of default or bankruptcy by the other party to the agreement, retention of the collateral may be subject to legal proceedings. All open repurchase agreements were entered into on July 29, 2011.
Use of Estimates — The preparation of financial statements in conformity with U.S. GAAP requires management to make estimates and assumptions that affect the reported amounts of assets and liabilities and disclosure of contingent assets and liabilities at the date of the financial statements and the reported amounts of revenues and expenses during the reporting period. Actual results could differ from those estimates and the differences could be material.
Other — Expenses directly attributable to the Fund are charged directly to the Fund. Other expenses common to various funds within the Delaware Investments® Family of Funds are generally allocated amongst such funds on the basis of average net assets. Management fees and some other expenses are paid monthly. Security transactions are recorded on the date the securities are purchased or sold (trade date) for financial reporting purposes. Costs used in calculating realized gains and losses on the sale of investment securities are those of the specific
37
Notes to financial statements
Delaware High-Yield Opportunities Fund
1. Significant Accounting Policies (continued)
securities sold. Dividend income is recorded on the ex-dividend date and interest income is recorded on the accrual basis. Discounts and premiums on non-convertible debt securities are amortized to interest income over the lives of the respective securities. The Fund declares dividends daily from net investment income and pays the dividends monthly and declares and pays distributions from net realized gain on investments, if any, annually. The Fund may distribute income dividends and capital gains more frequently, if necessary for tax purposes. Dividends and distributions, if any, are recorded on the ex-dividend date.
The Fund may receive earnings credits from its custodian when positive cash balances are maintained, which are used to offset custody fees. There were no earnings credits for the year ended July 31, 2011.
The Fund receives earnings credits from its transfer agent when positive cash balances are maintained, which are used to offset transfer agent fees. The expense paid under this arrangement is included in dividend disbursing and transfer agent fees and expenses on the statement of operations with the corresponding expense offset shown as “expense paid indirectly.” For the year ended July 31, 2011, the Fund earned $1,377 under this agreement.
2. Investment Management, Administration Agreements and Other Transactions with Affiliates
In accordance with the terms of its investment management agreement, the Fund pays Delaware Management Company (DMC), a series of Delaware Management Business Trust and the investment manager, an annual fee which is calculated daily at the rate of 0.65% on the first $500 million of average daily net assets of the Fund, 0.60% on the next $500 million, 0.55% on the next $1.5 billion, and 0.50% on average daily net assets in excess of $2.5 billion.
DMC has contractually agreed to waive that portion, if any, of its management fee and reimburse the Fund to the extent necessary to ensure that total annual operating expenses, (excluding any 12b-1 plan, taxes, interest, inverse floater program expenses, short sale and dividend interest expenses, brokerage fees, certain insurance costs, and nonroutine expenses or costs, including, but not limited to, those relating to reorganizations, litigation, conducting shareholder meetings, and liquidations (collectively, nonroutine expenses)), do not exceed 0.81% of average daily net assets of the Fund through November 28, 2011. These waivers and reimbursements may only be terminated by agreement of the Manager and the Fund.
Delaware Service Company, Inc. (DSC), an affiliate of DMC, provides fund accounting and financial administration oversight services to the Fund. For these services, the Fund pays DSC fees based on the aggregate daily net assets of the Delaware Investments® Family of Funds at the following annual rate: 0.0050% of the first $30 billion; 0.0045% of the next $10 billion; 0.0040% of the next $10 billion; and 0.0025% of aggregate average daily net assets in excess of $50 billion. The
38
fees payable to DSC under the service agreement described above are allocated among all Funds in the Delaware Investments Family of Funds on a relative net asset value basis. For the year ended July 31, 2011, the Fund was charged $25,999 for these services.
DSC also provides dividend disbursing and transfer agency services. The Fund paid DSC a monthly fee based on the number of shareholder accounts for dividend disbursing and transfer agent services. Effective July 18, 2011, the Fund pays DSC a monthly asset-based fee for these services.
Pursuant to a distribution agreement and distribution plan, the Fund pays DDLP, the distributor and an affiliate of DMC, an annual distribution and service fee not to exceed 0.30% of the average daily net assets of the Class A shares, 1.00% of the average daily net assets of the Class B and Class C shares and 0.60% of the average daily net assets of the Class R shares. Institutional Class shares pay no distribution and service expenses. DDLP has contracted to limit the Class R shares’ 12b-1 fees through November 28, 2011 to no more than 0.50% of its average daily net assets. The total 12b-1 fees to be paid by Class A shareholders of the Fund will be the sum of 0.10% of the average daily net assets representing shares that were acquired prior to June 1, 1992 and 0.30% of the average daily net assets representing shares that were acquired on or after June 1, 1992. All Class A shareholders will bear 12b-1 fees at the same rate, the blended rate based upon the allocation of the rates described above.
At July 31, 2011, the Fund had liabilities payable to affiliates as follows:
| Investment management fees payable to DMC | | $ | 259,163 |
| Dividend disbursing, transfer agent and fund accounting | | | |
| oversight fees and other expenses payable to DSC | | | 21,944 |
| Distribution fees payable to DDLP | | | 141,781 |
| Other expenses payable to DMC and affiliates* | | | 14,449 |
*DMC, as part of its administrative services, pays operating expenses on behalf of the Fund and is reimbursed on a periodic basis. Expenses include items such as printing of shareholder reports, fees for audit, legal and tax services, registration fees and trustees’ fees.
As provided in the investment management agreement, the Fund bears the cost of certain legal and tax services, including internal legal and tax services provided to the Fund by DMC and/or its affiliates’ employees. For the year ended July 31, 2011, the Fund was charged $12,631 for internal legal and tax services provided by DMC and/or its affiliates’ employees.
For the year ended July 31, 2011, DDLP earned $ 88,466 for commissions on sales of the Fund’s Class A shares. For the year ended July 31, 2011, DDLP received gross CDSC commissions of $ 16, $ 3,693 and $ 5,759 on redemptions of the Fund’s Class A, Class B and Class C shares, respectively, and these commissions were entirely used to offset up-front commissions previously paid by DDLP to broker/dealers on sales of those shares.
Trustees’ fees include expenses accrued by the Fund for each Trustee’s retainer and meeting fees. Certain officers of DMC, DSC, and DDLP are officers and/or Trustees of the Trust. These officers and Trustees are paid no compensation by the Fund.
39
Notes to financial statements
Delaware High-Yield Opportunities Fund
3. Investments
For the year ended July 31, 2011, the Fund made purchases of $579,322,495 and sales of $566,033,323 of investment securities other than short-term investments.
At July 31, 2011, the cost of investments for federal income tax purposes was $565,825,513. At July 31, 2011, net unrealized appreciation was $12,287,714, of which $22,717,366 related to unrealized appreciation of investments and $10,429,652 related to unrealized depreciation of investments.
U.S. GAAP defines fair value as the price that the Fund would receive to sell an asset or pay to transfer a liability in an orderly transaction between market participants at the measurement date under current market conditions. A three level hierarchy for fair value measurements has been established based upon the transparency of inputs to the valuation of an asset or liability. Inputs may be observable or unobservable and refer broadly to the assumptions that market participants would use in pricing the asset or liability. Observable inputs reflect the assumptions market participants would use in pricing the asset or liability based on market data obtained from sources independent of the reporting entity. Unobservable inputs reflect the reporting entity’s own assumptions about the assumptions that market participants would use in pricing the asset or liability developed based on the best information available under the circumstances. The Fund’s investment in its entirety is assigned a level based upon the observability of the inputs which are significant to the overall valuation. The three level hierarchy of inputs is summarized below.
| Level 1 | – | inputs are quoted prices in active markets for identical investments (e.g., equity securities, open-end investment companies, futures contracts, options contracts) |
| | | |
| Level 2 | – | other observable inputs (including, but not limited to: quoted prices for similar assets or liabilities in markets that are active, quoted prices for identical or similar assets or liabilities in markets that are not active, inputs other than quoted prices that are observable for the assets or liabilities (such as interest rates, yield curves, volatilities, prepayment speeds, loss severities, credit risks and default rates) or other market-corroborated inputs) (e.g., debt securities, government securities, swap contracts, foreign currency exchange contracts, foreign securities utilizing international fair value pricing) |
| | | |
| Level 3 | – | inputs are significant unobservable inputs (including the Fund’s own assumptions used to determine the fair value of investments) (e.g., broker-quoted securities, fair valued securities) |
40
The following table summarizes the valuation of the Fund’s investments by fair value hierarchy levels as of July 31, 2011:
| | | Level 1 | | Level 2 | | Level 3 | | Total |
| Common Stock | | $ | 2,483,736 | | $ | — | | $ | 33 | | $ | 2,483,769 |
| Corporate Debt | | | — | | | 473,245,577 | | | 438,120 | | | 473,683,697 |
| Short-Term Investments | | | 4,880,953 | | | 14,264,091 | | | — | | | 19,145,044 |
| Securities Lending Collateral | | | — | | | 74,807,447 | | | — | | | 74,807,447 |
| Other | | | 4,177,300 | | | 3,815,963 | | | 7 | | | 7,993,270 |
| Total | | $ | 11,541,989 | | $ | 566,133,078 | | $ | 438,160 | | $ | 578,113,227 |
The following is a reconciliation of investments in which significant unobservable inputs (Level 3) were used in determining fair value:
| | | | | | | | | | | Securities | | | | | | | | |
| | | Common | | Corporate | | Lending | | | | | | | | |
| | | Stock | | Debt | | Collateral | | Other | | Total |
| Balance as of 7/31/10 | | $ | 33 | | | $ | 698,104 | | | $ | 23,037 | | | $ | 25 | | | $ | 721,199 | |
| Sales | | | (20,088 | ) | | | — | | | | (27,428 | ) | | | — | | | | (47,516 | ) |
| Net realized loss | | | — | | | | (1,105,297 | ) | | | — | | | | — | | | | (1,105,297 | ) |
| Net change in unrealized | | | | | | | | | | | | | | | | | | | | |
| appreciation/depreciation | | | 20,088 | | | | 845,313 | | | | 4,391 | | | | (18 | ) | | | 869,774 | |
| Balance as of 7/31/11 | | $ | 33 | | | $ | 438,120 | | | $ | — | | | $ | 7 | | | $ | 438,160 | |
| | | | | | | | | | | | | | | | | | | | | |
| Net change in unrealized | | | | | | | | | | | | | | | | | | | | |
| appreciation/depreciation | | | | | | | | | | | | | | | | | | | | |
| from investments still held | | | | | | | | | | | | | | | | | | | | |
| as of 7/31/11 | | $ | 20,088 | | | $ | (259,984 | ) | | $ | (21,871 | ) | | $ | (— | ) | | $ | (261,767 | ) |
During the year ended July 31, 2011, there were no transfers between Level 1 investments, Level 2 investments or Level 3 investments that had a material impact to the Fund. The Fund’s policy is to recognize transfers between levels at the end of the reporting period.
41
Notes to financial statements
Delaware High-Yield Opportunities Fund
4. Dividend and Distribution Information
Income and long-term capital gain distributions are determined in accordance with federal income tax regulations, which may differ from U.S. GAAP. Additionally, distributions from net short-term gains on sales of investment securities are treated as ordinary income for federal income tax purposes. The tax character of dividends and distributions paid during the years ended July 31, 2011 and 2010 was as follows:
| | | Year Ended |
| | | 7/31/11 | | 7/31/10 |
| Ordinary income | | $40,940,504 | | $39,424,083 |
5. Components of Net Assets on a Tax Basis
As of July 31, 2011, the components of net assets on a tax basis were as follows:
| Shares of beneficial interest | | $ | 538,824,815 | |
| Undistributed ordinary income | | | 1,771,936 | |
| Distributions payable | | | (1,055,595 | ) |
| Capital loss carryforwards | | | (42,944,994 | ) |
| Unrealized appreciation of investments | | | 12,287,393 | |
| Net assets | | $ | 508,883,555 | |
The differences between book basis and tax basis components of the net assets are primarily attributable to tax deferral of losses on wash sales, tax treatment of distributions payable, and tax treatment of market discount and premium on debt instruments.
For financial reporting purposes, capital accounts are adjusted to reflect the tax character of permanent book/tax differences. Reclassifications are primarily due to tax treatment of contingent payment on debt instruments and market discount and premium on certain debt instruments. Results of operations and net assets were not affected by these reclassifications. For the year ended July 31, 2011, the Fund recorded the following reclassifications:
| Undistributed net investment income | | $ | 1,763,561 | |
| Accumulated net realized loss | | | (1,763,561 | ) |
For federal income tax purposes, capital loss carryforwards may be carried forward and applied against future capital gains. $29,242,656 was utilized in 2011. Capital loss carryforwards remaining at July 31, 2011 will expire as follows: $2,444,609 expires in 2016 and $40,500,385 expires in 2017. The use of these losses is subject to an annual limitation in accordance with the internal revenue code.
On December 22, 2010, the Regulated Investment Company Modernization Act of 2010 (the “Act”) was enacted, which changed various technical rules governing the tax treatment of regulated investment companies. The changes are generally effective for taxable years beginning after the date of enactment. Under the Act, the Fund will be permitted to carry forward capital losses incurred in taxable years beginning after the date of enactment for an unlimited period. However,
42
any losses incurred during those future taxable years will be required to be utilized prior to the losses incurred in pre-enactment taxable years, which carry an expiration date. As a result of this ordering rule, pre-enactment capital loss carryforwards may be more likely to expire unused. Additionally, post-enactment capital loss carryforwards will retain their character as either short-term or long-term capital losses rather than being considered all short-term as permitted under previous regulation.
6. Capital Shares
Transactions in capital shares were as follows:
| | | Year Ended |
| | | 7/31/11 | | 7/31/10 |
| Shares sold: | | | | | | |
| Class A | | 35,395,485 | | | 43,830,346 | |
| Class B | | 21,522 | | | 82,502 | |
| Class C | | 5,978,891 | | | 2,249,268 | |
| Class R | | 2,418,512 | | | 3,232,698 | |
| Institutional Class | | 25,749,143 | | | 9,415,231 | |
| | | | | | | |
| Shares issued upon reinvestment of dividends and distributions: | | | | | | |
| Class A | | 5,202,322 | | | 5,432,839 | |
| Class B | | 91,383 | | | 139,237 | |
| Class C | | 480,119 | | | 384,265 | |
| Class R | | 302,749 | | | 358,991 | |
| Institutional Class | | 1,111,162 | | | 725,099 | |
| | | 76,751,288 | | | 65,850,476 | |
| | | | | | | |
| Shares repurchased: | | | | | | |
| Class A | | (51,905,636 | ) | | (38,390,163 | ) |
| Class B | | (866,308 | ) | | (1,037,965 | ) |
| Class C | | (2,851,557 | ) | | (2,406,175 | ) |
| Class R | | (1,878,009 | ) | | (4,203,770 | ) |
| Institutional Class | | (12,603,596 | ) | | (7,810,320 | ) |
| | | (70,105,106 | ) | | (53,848,393 | ) |
| Net increase | | 6,646,182 | | | 12,002,083 | |
For the years ended July 31, 2011 and 2010, 426,642 Class B shares were converted to 426,407 Class A shares valued at $1,754,683 and 365,984 Class B shares were converted to 365,984 Class A shares valued at $1,407,892, respectively. The respective amounts are included in Class B redemptions and Class A subscriptions in the table above and the statements of changes in net assets.
43
Notes to financial statements
Delaware High-Yield Opportunities Fund
7. Line of Credit
The Fund, along with certain other funds in the Delaware Investments® Family of Funds (Participants), was a participant in a $35,000,000 revolving line of credit to be used for temporary or emergency purposes as an additional source of liquidity to fund redemptions of investor shares. Under the agreement, the Participants were charged an annual commitment fee, which was allocated across the Participants on the basis of each Participant’s allocation of the entire facility. The Participants were permitted to borrow up to a maximum of one third of their net assets under the agreement. The line of credit expired on November 16, 2010.
On November 16, 2010, the Fund, along with the other Participants, entered into an amendment to the agreement for a $50,000,000 revolving line of credit. Effective as of August 1, 2011, the Fund, along with the other Participants, entered into an amendment to the agreement for a $100,000,000 revolving line of credit. The agreement as amended is to be used as described above and operates in substantially the same manner as the original agreement. The new line of credit under the agreement as amended expires on November 15, 2011. The Fund had no amounts outstanding as of July 31, 2011 or at any time during the year then ended.
8. Securities Lending
The Fund, along with other funds in the Delaware Investments® Family of Funds, may lend its securities pursuant to a security lending agreement (Lending Agreement) with The Bank of New York Mellon (BNY Mellon). At the time a security is loaned, the borrower must post collateral equal to the required percentage of the market value of the loaned security, including any accrued interest. The required percentage is: (i) 102% with respect to U.S. securities and foreign securities that are denominated and payable in U.S. dollars; and (ii) 105% with respect to foreign securities. With respect to each loan, if on any business day the aggregate market value of securities collateral plus cash collateral held is less than the aggregate market value of the securities which are the subject of such loan, the borrower will be notified to provide additional collateral by the end of the following business day which, together with the collateral already held, will be not less than the applicable initial collateral requirements for such security loan. If the aggregate market value of securities collateral and cash collateral held with respect to a security loan exceeds the applicable initial collateral requirement, upon request of the borrower, BNY Mellon must return enough collateral to the borrower by the end of the following business day to reduce the value of the remaining collateral to applicable initial collateral requirement for such security loan. As a result of the foregoing, the value of collateral held with respect to a loaned security may be temporarily more or less than the value of the security on loan.
Cash collateral received is generally invested in the Delaware Investment Collateral Fund No. 1 (Collective Trust) established by BNY Mellon for the purpose of investment on behalf of funds managed by DMC that participates in BNY Mellon’s securities lending program. The Collective Trust may invest in U.S. government securities and high quality corporate debt, asset-backed and other money market securities in repurchase agreements collateralized by such securities, provided that the Collective Trust will generally have a dollar-weighted average portfolio maturity of 60 days or less. The Collective Trust seeks to maintain a net asset value per unit of $1.00, but
44
there can be no assurance that it will always be able to do so. The Fund may incur investment losses as a result of investing securities lending collateral in the Collective Trust or another collateral investment pool. This could occur if an investment in a collateral investment pool defaulted or if it were necessary to liquidate assets in the collateral investment pool to meet returns on outstanding security loans at a time when the collateral investment pool’s net asset value per unit was less than $1.00. Under those circumstances, the Fund may not receive an amount from the collateral investment pool that is equal in amount to the collateral the Fund would be required to return to the borrower of the securities and the Fund would be required to make up for this shortfall. Effective April 20, 2009, BNY Mellon transferred the assets of the Fund’s previous collateral investment pool other than cash and assets with a maturity of one business day or less to the BNY Mellon SL DBT II Liquidating Fund (Liquidating Fund), effectively bifurcating the previous collateral investment pool. The Fund’s exposure to the Liquidating Fund is expected to decrease as the Liquidating Fund’s assets mature or are sold. In October 2008, BNY Mellon transferred certain distressed securities from the previous collateral investment pool into the Mellon GSL Reinvestment Trust II. The Fund can also accept U.S. government securities and letters of credit (non-cash collateral) in connection with securities loans. In the event of default or bankruptcy by the lending agent, realization and/or retention of the collateral may be subject to legal proceedings. In the event the borrower fails to return loaned securities and the collateral received is insufficient to cover the value of the loaned securities and provided such collateral shortfall is not the result of investment losses, the lending agent has agreed to pay the amount of the shortfall to the Fund, or at the discretion of the lending agent, replace the loaned securities. The Fund continues to record dividends or interest, as applicable, on the securities loaned and are subject to changes in value of the securities loaned that may occur during the term of the loan. The Fund has the right under the Lending Agreement to recover the securities from the borrower on demand. With respect to security loans collateralized by non-cash collateral, the Fund receives loan premiums paid by the borrower. With respect to security loans collateralized by cash collateral, the earnings from the collateral investments are shared among the Fund, the security lending agent and the borrower. The Fund records security lending income net of allocations to the security lending agent and the borrower.
At July 31, 2011, the value of the securities on loan was $72,427,569, for which the Fund received collateral, comprised of non-cash collateral valued at $262,552, and cash collateral of $75,333,431. At July 31, 2011, the value of invested collateral was $74,807,447. Investments purchased with cash collateral are presented on the statement of net assets under the caption “Securities Lending Collateral.”
9. Credit and Market Risk
The Fund invests in high yield fixed income securities, which are securities rated lower than BBB- by Standard & Poor’s and Baa3 by Moody’s Investor Services, or similarly rated by another nationally recognized statistical rating organization. Investments in these higher yielding securities are generally accompanied by a greater degree of credit risk than higher rated securities. Additionally, lower rated securities may be more susceptible to adverse economic and competitive industry conditions than investment-grade securities.
45
Notes to financial statements
Delaware High-Yield Opportunities Fund
9. Credit and Market Risk (continued)
The Fund may invest up to 15% of its net assets in illiquid securities, which may include securities with contractual restrictions on resale, securities exempt from registration under Rule 144A of the Securities Act of 1933, as amended, and other securities which may not be readily marketable. The relative illiquidity of these securities may impair the Fund from disposing of them in a timely manner and at a fair price when it is necessary or desirable to do so. While maintaining oversight, the Fund’s Board has delegated to DMC the day-to-day functions of determining whether individual securities are liquid for purposes of the Fund’s limitation on investments in illiquid securities. Securities eligible for resale pursuant to Rule 144A, which are determined to be liquid, are not subject to the Fund’s 15% limit on investments in illiquid securities. Rule 144A and illiquid securities have been identified on the statement of net assets.
10. Contractual Obligations
The Fund enters into contracts in the normal course of business that contain a variety of indemnifications. The Fund’s maximum exposure under these arrangements is unknown. However, the Fund has not had prior claims or losses pursuant to these contracts. Management has reviewed the Fund’s existing contracts and expects the risk of loss to be remote.
11. Subsequent Events
Management has determined that no material events or transactions occurred subsequent to July 31, 2011 that would require recognition or disclosure in the Fund’s financial statements.
12. Tax Information (Unaudited)
The information set forth below is for the Fund’s fiscal year as required by federal income tax laws. Shareholders, however, must report distributions on a calendar year basis for income tax purposes, which may include distributions for portions of two fiscal years of a fund. Accordingly, the information needed by shareholders for income tax purposes will be sent to them in January of each year. Please consult your tax advisor for proper treatment of this information. All designations are based on financial information available as of the date of this annual report and, accordingly are subject to change. For any and all items requiring designation, it is the intention of the Fund to designate the maximum amount permitted under the Internal Revenue Code and the regulations thereunder.
For the fiscal year ended July 31, 2011, the Fund designates distributions paid during the year as follows:
| (A) Ordinary Income Distribution (Tax Basis)* | | 100% |
(A) is based on a percentage of the Fund’s total distributions.
*For the fiscal year ended July 31, 2011, certain interest income paid by the Fund, determined to be Qualified Interest Income may be subject to relief from U.S. withholding for foreign shareholders, as provided by the American Jobs Creation Act of 2004 and as extended by Tax Relief, Unemployment Insurance Reauthorization and Jobs Creation Act of 2010. For the fiscal year ended July 31, 2011, the Fund has designated a maximum distribution of $40,427,527, of Qualified Interest Income.
46
Report of independent
registered public accounting firm
To the Board of Trustees of Delaware Group® Income Funds
and the Shareholders of Delaware High-Yield Opportunities Fund:
In our opinion, the accompanying statement of net assets and the related statements of operations and of changes in net assets and the financial highlights present fairly, in all material respects, the financial position of Delaware High-Yield Opportunities Fund (one of the series constituting Delaware Group Income Funds, hereafter referred to as the “Fund”) at July 31, 2011, the results of its operations for the year then ended and the changes in its net assets and the financial highlights for each of the two years in the period then ended, in conformity with accounting principles generally accepted in the United States of America. These financial statements and financial highlights (hereafter referred to as “financial statements”) are the responsibility of the Fund’s management; our responsibility is to express an opinion on these financial statements based on our audits. We conducted our audits of these financial statements in accordance with the standards of the Public Company Accounting Oversight Board (United States). Those standards require that we plan and perform the audit to obtain reasonable assurance about whether the financial statements are free of material misstatement. An audit includes examining, on a test basis, evidence supporting the amounts and disclosures in the financial statements, assessing the accounting principles used and significant estimates made by management, and evaluating the overall financial statement presentation. We believe that our audits, which included confirmation of securities at July 31, 2011 by correspondence with the custodian, provide a reasonable basis for our opinion. The financial highlights for each of the three years in the period ended July 31, 2009 were audited by other independent accountants whose report dated September 21, 2009 expressed an unqualified opinion on those statements.
PricewaterhouseCoopers LLP
Philadelphia, Pennsylvania
September 28, 2011
47
Other Fund information
(Unaudited)
Delaware High-Yield Opportunities Fund
Change in Independent Registered Public Accounting Firm
Due to independence matters under the Securities and Exchange Commission’s auditor independence rules relating to the January 4, 2010 acquisition of Delaware Investments (including DMC, DDLP and DSC) by Macquarie Group, Ernst & Young LLP (E&Y) has resigned as the independent registered public accounting firm for Delaware Group® Income Funds (the Trust) effective May 20, 2010. At a meeting held on May 20, 2010, the Board of Trustees of the Trust, upon recommendation of the Audit Committee, selected PricewaterhouseCoopers LLP (PwC) to serve as the independent registered public accounting firm for the Trust for the fiscal year ended July 31, 2010. During the fiscal years ended July 31, 2009 and 2008, E&Y’s audit reports on the financial statements of the Trust did not contain any adverse opinion or disclaimer of opinion, nor were they qualified or modified as to uncertainty, audit scope, or accounting principles. In addition, there were no disagreements between the Trust and E&Y on accounting principles, financial statements disclosures or audit scope, which, if not resolved to the satisfaction of E&Y, would have caused them to make reference to the disagreement in their reports. Neither the Trust nor anyone on its behalf has consulted with PwC at any time prior to their selection with respect to the application of accounting principles to a specified transaction, either completed or proposed or the type of audit opinion that might be rendered on the Trust’s financial statements.
48
Board of trustees/directors and officers addendum
Delaware Investments® Family of Funds
A mutual fund is governed by a Board of Trustees/Directors (“Trustees”), which has oversight responsibility for the management of a fund’s business affairs. Trustees establish procedures and oversee and review the performance of the investment manager, the distributor, and others who perform services for the fund. The independent fund trustees, in particular, are advocates
| Name, Address, | | Position(s) | | Length of |
| and Birth Date | | Held with Fund(s) | | Time Served |
| Interested Trustees | | | | |
| | | | | |
| Patrick P. Coyne1 | | Chairman, President, | | Chairman and Trustee |
| 2005 Market Street | | Chief Executive Officer, | | since August 16, 2006 |
| Philadelphia, PA 19103 | | and Trustee | | |
| April 1963 | | | | President and |
| | | | | Chief Executive Officer |
| | | | | since August 1, 2006 |
| | | | | |
| | | | | |
| | | | | |
| | | | | |
| | | | | |
| | | | | |
| | | | | |
| | | | | |
| | | | | |
| | | | | |
| | | | | |
| | | | | |
| | | | | |
| | | | | |
| | | | | |
| | | | | |
| | | | | |
| | | | | |
1 Patrick P. Coyne is considered to be an “Interested Trustee” because he is an executive officer of the Fund’s(s’) investment advisor.
50
for shareholder interests. Each trustee has served in that capacity since he or she was elected to or appointed to the Board of Trustees, and will continue to serve until his or her retirement or the election of a new trustee in his or her place. The following is a list of the Trustees and Officers with certain background and related information.
| | | Number of Portfolios in | | |
| Principal Occupation(s) | | Fund Complex Overseen | | Other Directorships |
| During Past 5 Years | | by Trustee or Officer | | Held by Trustee or Officer |
| |
| |
| Patrick P. Coyne has served in | | 75 | | Director and Audit |
| various executive capacities | | | | Committee Member |
| at different times at | | | | Kaydon Corp. |
| Delaware Investments.2 | | | | |
| | | | | Board of Governors Member |
| | | | | Investment Company |
| | | | | Institute (ICI) |
| | | | | |
| | | | | Finance Committee Member |
| | | | | St. John Vianney Roman |
| | | | | Catholic Church |
| |
| | | | | Board of Trustees |
| | | | | Agnes Irwin School |
| |
| | | | | Member of Investment |
| | | | | Committee |
| | | | | Cradle of Liberty Council, |
| | | | | BSA |
| | | | | (2007–2010) |
| | | | | |
| |
| | | | | |
| | | | | |
| |
2 Delaware Investments is the marketing name for Delaware Management Holdings, Inc. and its subsidiaries, including the Fund’s(s’) investment advisor, principal underwriter, and its transfer agent.
51
Board of trustees/directors and officers addendum
Delaware Investments® Family of Funds
| Name, Address, | | Position(s) | | Length of |
| and Birth Date | | Held with Fund(s) | | Time Served |
| Independent Trustees | | | | |
| |
| Thomas L. Bennett | | Trustee | | Since March 2005 |
| 2005 Market Street | | | | |
| Philadelphia, PA 19103 | | | | |
| October 1947 | | | | |
| |
| |
| |
| |
| |
| |
| |
| |
| |
| |
| |
| John A. Fry | | Trustee | | Since January 2001 |
| 2005 Market Street | | | | |
| Philadelphia, PA 19103 | | | | |
| May 1960 | | | | |
| |
| |
| |
| |
| |
| |
| |
| |
| |
| |
| |
| Anthony D. Knerr | | Trustee | | Since April 1990 |
| 2005 Market Street | | | | |
| Philadelphia, PA 19103 | | | | |
| December 1938 | | | | |
| |
| Lucinda S. Landreth | | Trustee | | Since March 2005 |
| 2005 Market Street | | | | |
| Philadelphia, PA 19103 | | | | |
| June 1947 | | | | |
| |
52
| | | Number of Portfolios in | | |
| Principal Occupation(s) | | Fund Complex Overseen | | Other Directorships |
| During Past 5 Years | | by Trustee or Officer | | Held by Trustee or Officer |
| | | | | |
| |
| Private Investor | | 75 | | Chairman of Investment |
| (March 2004–Present) | | | | Committee |
| | | | | Pennsylvania Academy of |
| Investment Manager | | | | Fine Arts |
| Morgan Stanley & Co. | | | | |
| (January 1984–March 2004) | | | | Investment Committee and |
| | | | | Governance Committee |
| | | | | Member |
| | | | | Pennsylvania Horticultural |
| | | | | Society |
| | | | | |
| | | | | Director |
| | | | | Bryn Mawr Bank Corp. (BMTC) |
| | | | | (2007–2011) |
| |
| President | | 75 | | Board of Governors Member — |
| Drexel University | | | | NASDAQ OMX PHLX LLC |
| (August 2010–Present) | | | | |
| | | | | Director and Audit |
| President | | | | Committee Member |
| Franklin & Marshall College | | | | Community Health Systems |
| (July 2002–July 2010) | | | | |
| | | | | Director — Ecore |
| | | | | International |
| | | | | (2009–2010) |
| | | | | |
| | | | | Director — Allied |
| | | | | Barton Securities Holdings |
| | | | | (2005–2008) |
| |
| Managing Director | | 75 | | None |
| Anthony Knerr & Associates | | | | |
| (Strategic Consulting) | | | | |
| (1990–Present) | | | | |
| |
| Chief Investment Officer | | 75 | | None |
| Assurant, Inc. (Insurance) | | | | |
| (2002–2004) | | | | |
| | | | | |
| |
53
Board of trustees/directors and officers addendum
Delaware Investments® Family of Funds
| Name, Address, | | Position(s) | | Length of |
| and Birth Date | | Held with Fund(s) | | Time Served |
| Independent Trustees (continued) | | | | |
| |
| Ann R. Leven | | Trustee | | Since October 1989 |
| 2005 Market Street | | | | |
| Philadelphia, PA 19103 | | | | |
| November 1940 | | | | |
| |
| |
| |
| |
| |
| |
| Frances A. Sevilla-Sacasa | | Trustee | | Since September 2011 |
| 2005 Market Street | | | | |
| Philadelphia, PA 19103 | | | | |
| January 1956 | | | | |
| |
| |
| |
| |
| |
| |
| |
| |
| | | | | |
| | | | | |
| | | | | |
| | | | | |
| |
| |
| |
| | | | | |
| | | | | |
| | | | | |
| | | | | |
| | | | | |
| | | | | |
| | | | | |
| | | | | |
| | | | | |
| |
54
| | | Number of Portfolios in | | |
| Principal Occupation(s) | | Fund Complex Overseen | | Other Directorships |
| During Past 5 Years | | by Trustee or Officer | | Held by Trustee or Officer |
| | | | | |
| |
| Consultant | | 75 | | Director and Audit |
| ARL Associates | | | | Committee Chair |
| (Financial Planning) | | | | Systemax Inc. |
| (1983–Present) | | | | (2001–2009) |
| | | | | |
| | | | | Director and Audit |
| | | | | Committee Chairperson |
| | | | | Andy Warhol Foundation |
| | | | | (1999–2007) |
| |
| Executive Advisor to Dean | | 75 | | Trust Manager — Camden |
| (since August 2011) and | | | | Property Trust |
| Interim Dean | | | | (since August 2011) |
| (January 2011–July 2011) — | | | | |
| University of Miami School of | | | | Board of Trustees |
| Business Administration | | | | Thunderbird School of |
| | | | | Global Management |
| President — U.S. Trust, | | | | (2007–2011) |
| Bank of America Private | | | | |
| Wealth Management | | | | Board of Trustees |
| (Private Banking) | | | | Carrollton School of the |
| (July 2007–December 2008) | | | | Sacred Heart |
| | | | | (since 2007) |
| President and Director | | | | |
| (November 2005–June 2007) and | | | | Board Member |
| Chief Executive Officer | | | | Foreign Policy Association |
| (April 2007–June 2007) — | | | | (since 2006) |
| U.S. Trust Company | | | | |
| (Private Banking) | | | | Board of Trustees |
| | | | | Georgetown Preparatory School |
| | | | | (2005–2011) |
| | | | | |
| | | | | Board of Trustees |
| | | | | Miami City Ballet |
| | | | | (2000–2011) |
| | | | | |
| | | | | Board of Trustees |
| | | | | St. Thomas University |
| | | | | (2005–2011) |
| |
55
Board of trustees/directors and officers addendum
Delaware Investments® Family of Funds
| Name, Address, | | Position(s) | | Length of |
| and Birth Date | | Held with Fund(s) | | Time Served |
| Independent Trustees (continued) | | | | |
| | | | | |
| Janet L. Yeomans | | Trustee | | Since April 1999 |
| 2005 Market Street | | | | |
| Philadelphia, PA 19103 | | | | |
| July 1948 | | | | |
| |
| |
| |
| |
| J. Richard Zecher | | Trustee | | Since March 2005 |
| 2005 Market Street | | | | |
| Philadelphia, PA 19103 | | | | |
| July 1940 | | | | |
| |
| |
| | | | | |
| | | | | |
| | | | | |
| | | | | |
| | | | | |
| | | | | |
| | | | | |
| | | | | |
| | | | | |
| | | | | |
| | | | | |
| | | | | |
| | | | | |
| | | | | |
| |
56
| | | Number of Portfolios in | | |
| Principal Occupation(s) | | Fund Complex Overseen | | Other Directorships |
| During Past 5 Years | | by Trustee or Officer | | Held by Trustee or Officer |
| | | | | |
| | | | | |
| Vice President and Treasurer | | 75 | | Director and Audit |
| (January 2006–Present) | | | | Committee Member |
| Vice President — Mergers & Acquisitions | | | | Okabena Company |
| (January 2003–January 2006), and | | | | |
| Vice President and Treasurer | | | | Chair — 3M |
| (July 1995–January 2003) | | | | Investment Management |
| 3M Corporation | | | | Company |
| |
| Founder | | 75 | | Director and Audit |
| Investor Analytics | | | | Committee Member |
| (Risk Management) | | | | Investor Analytics |
| (May 1999–Present) | | | | |
| | | | | |
| Founder | | | | Director |
| Sutton Asset Management | | | | Oxigene, Inc. |
| (Hedge Fund) | | | | (2003–2008) |
| (September 1996–Present) | | | | |
| | | | | |
| | | | | |
| | | | | |
| | | | | |
| | | | | |
| | | | | |
| | | | | |
| | | | | |
| | | | | |
| | | | | |
| | | | | |
| |
57
Board of trustees/directors and officers addendum
Delaware Investments® Family of Funds
| Name, Address, | | Position(s) | | Length of |
| and Birth Date | | Held with Fund(s) | | Time Served |
| Officers | | | | |
| | | | | |
| David F. Connor | | Vice President, | | Vice President since |
| 2005 Market Street | | Deputy General | | September 2000 |
| Philadelphia, PA 19103 | | Counsel, and Secretary | | and Secretary since |
| December 1963 | | | | October 2005 |
| |
| |
| Daniel V. Geatens | | Vice President | | Treasurer |
| 2005 Market Street | | and Treasurer | | since October 2007 |
| Philadelphia, PA 19103 | | | | |
| October 1972 | | | | |
| |
| David P. O’Connor | | Senior Vice President, | | Senior Vice President, |
| 2005 Market Street | | General Counsel, | | General Counsel, and |
| Philadelphia, PA 19103 | | and Chief Legal Officer | | Chief Legal Officer |
| February 1966 | | | | since October 2005 |
| |
| Richard Salus | | Senior Vice President | | Chief Financial Officer |
| 2005 Market Street | | and Chief Financial Officer | | since November 2006 |
| Philadelphia, PA 19103 | | | | |
| October 1963 | | | | |
| |
The Statement of Additional Information for the Fund(s) includes additional information about the Trustees and Officers and is available, without charge, upon request by calling 800 523-1918.
58
| | | Number of Portfolios in | | |
| Principal Occupation(s) | | Fund Complex Overseen | | Other Directorships |
| During Past 5 Years | | by Trustee or Officer | | Held by Trustee or Officer |
| |
| |
| David F. Connor has served as | | 75 | | None3 |
| Vice President and Deputy | | | | |
| General Counsel of | | | | |
| Delaware Investments | | | | |
| since 2000. | | | | |
| |
| Daniel V. Geatens has served | | 75 | | None3 |
| in various capacities at | | | | |
| different times at | | | | |
| Delaware Investments. | | | | |
| |
| David P. O’Connor has served in | | 75 | | None3 |
| various executive and legal | | | | |
| capacities at different times | | | | |
| at Delaware Investments. | | | | |
| |
| Richard Salus has served in | | 75 | | None3 |
| various executive capacities | | | | |
| at different times at | | | | |
| Delaware Investments. | | | | |
| |
3 David F. Connor, Daniel V. Geatens, David P. O’Connor, and Richard Salus serve in similar capacities for the six portfolios of the Optimum Fund Trust, which have the same investment advisor, principal underwriter, and transfer agent as the registrant.
59
About the organization
| Board of trustees |
Patrick P. Coyne
Chairman, President, and
Chief Executive Officer
Delaware Investments®
Family of Funds
Philadelphia, PA Thomas L. Bennett
Private Investor
Rosemont, PA John A. Fry
President
Drexel University
Philadelphia, PA | Anthony D. Knerr
Founder and Managing
Director
Anthony Knerr &
Associates
New York, NY Lucinda S. Landreth
Former Chief Investment
Officer
Assurant, Inc.
Philadelphia, PA | Ann R. Leven
Consultant
ARL Associates
New York, NY Frances A. Sevilla-Sacasa
Executive Advisor to Dean, University of Miami School of Business Administration Coral Gables, FL | Janet L. Yeomans
Vice President and
Treasurer
3M Corporation
St. Paul, MN J. Richard Zecher
Founder
Investor Analytics
Scottsdale, AZ |
| | | | |
| Affiliated officers |
David F. Connor
Vice President, Deputy
General Counsel, and
Secretary
Delaware Investments
Family of Funds
Philadelphia, PA | Daniel V. Geatens
Vice President and
Treasurer
Delaware Investments
Family of Funds
Philadelphia, PA | David P. O’Connor
Senior Vice President,
General Counsel,
and Chief Legal Officer
Delaware Investments
Family of Funds
Philadelphia, PA | Richard Salus
Senior Vice President and
Chief Financial Officer
Delaware Investments
Family of Funds
Philadelphia, PA |
| This annual report is for the information of Delaware High-Yield Opportunities Fund shareholders, but it may be used with prospective investors when preceded or accompanied by the Delaware Investments Fund fact sheet for the most recently completed calendar quarter. These documents are available at www.delawareinvestments.com. |
Delaware Investments is the marketing name of Delaware Management Holdings, Inc. and its subsidiaries. The Fund files its complete schedule of portfolio holdings with the Securities and Exchange Commission (SEC) for the first and third quarters of each fiscal year on Form N-Q. The Fund’s Forms N-Q, as well as a description of the policies and procedures that the Fund uses to determine how to vote proxies (if any) relating to portfolio securities are available without charge (i) upon request, by calling 800 523-1918; and (ii) on the SEC’s website at www.sec.gov. In addition, a description of the policies and procedures that the Fund uses to determine how to vote proxies (if any) relating to portfolio securities and the Fund’s Schedule of Investments are available without charge on the Fund’s website at www.delawareinvestments.com. The Fund’s Forms N-Q may be reviewed and copied at the SEC’s Public Reference Room in Washington, D.C.; information on the operation of the Public Reference Room may be obtained by calling 800 SEC-0330. Information (if any) regarding how the Fund voted proxies relating to portfolio securities during the most recently disclosed 12-month period ended June 30 is available without charge (i) through the Funds’ website at www.delawareinvestments.com; and (ii) on the SEC’s website at www.sec.gov. |
60
Item 2. Code of Ethics
The registrant has adopted a code of ethics that applies to the registrant’s principal executive officer, principal financial officer, principal accounting officer or controller, or persons performing similar functions, regardless of whether these individuals are employed by the registrant or a third party. A copy of the registrant’s Code of Business Ethics has been posted on the Delaware Investments Internet Web site at www.delawareinvestments.com. Any amendments to the Code of Business Ethics, and information on any waiver from its provisions granted by the registrant, will also be posted on this Web site within five business days of such amendment or waiver and will remain on the Web site for at least 12 months.
Item 3. Audit Committee Financial Expert
The registrant’s Board of Trustees/Directors has determined that certain members of the registrant’s Audit Committee are audit committee financial experts, as defined below. For purposes of this item, an “audit committee financial expert” is a person who has the following attributes:
a. An understanding of generally accepted accounting principles and financial statements;
b. The ability to assess the general application of such principles in connection with the accounting for estimates, accruals, and reserves;
c. Experience preparing, auditing, analyzing, or evaluating financial statements that present a breadth and level of complexity of accounting issues that are generally comparable to the breadth and complexity of issues that can reasonably be expected to be raised by the registrant’s financial statements, or experience actively supervising one or more persons engaged in such activities;
d. An understanding of internal controls and procedures for financial reporting; and
e. An understanding of audit committee functions.
An “audit committee financial expert” shall have acquired such attributes through:
a. Education and experience as a principal financial officer, principal accounting officer, controller, public accountant, or auditor or experience in one or more positions that involve the performance of similar functions;
b. Experience actively supervising a principal financial officer, principal accounting officer, controller, public accountant, auditor, or person performing similar functions;
c. Experience overseeing or assessing the performance of companies or public accountants with respect to the preparation, auditing, or evaluation of financial statements; or
d. Other relevant experience.
The registrant’s Board of Trustees/Directors has also determined that each member of the registrant’s Audit Committee is independent. In order to be “independent” for purposes of this item, the Audit Committee member may not: (i) other than in his or her capacity as a member of the Board of Trustees/Directors or any committee thereof, accept directly or indirectly any consulting, advisory or other compensatory fee from the issuer; or (ii) be an “interested person” of the registrant as defined in Section 2(a)(19) of the Investment Company Act of 1940.
The names of the audit committee financial experts on the registrant’s Audit Committee are set forth below:
John A. Fry
Janet L. Yeomans
Item 4. Principal Accountant Fees and Services
(a) Audit fees.
The aggregate fees billed for services provided to the registrant by its independent auditors for the audit of the registrant’s annual financial statements and for services normally provided by the independent auditors in connection with statutory and regulatory filings or engagements were $112,200 for the fiscal year ended July 31, 2011.
The aggregate fees billed for services provided to the registrant by its independent auditors for the audit of the registrant’s annual financial statements and for services normally provided by the independent auditors in connection with statutory and regulatory filings or engagements were $114,700 for the fiscal year ended July 31, 2010.
(b) Audit-related fees.
The aggregate fees billed by the registrant’s independent auditors for services relating to the performance of the audit of the registrant’s financial statements and not reported under paragraph (a) of this Item were $0 for the fiscal year ended July 31, 2011.
The aggregate fees billed by the registrant’s independent auditors for services relating to the performance of the audit of the financial statements of the registrant’s investment adviser and other service providers under common control with the adviser and that relate directly to the operations or financial reporting of the registrant were $593,000 for the registrant’s fiscal year ended July 31, 2011. The percentage of these fees relating to services approved by the registrant’s Audit Committee pursuant to the de minimis exception from the pre-approval requirement in Rule 2-01(c)(7)(i)(C) of Regulation S-X was 0%. These audit-related services were as follows: year-end audit procedures, reporting up and subsidiary statutory audits.
The aggregate fees billed by the registrant’s independent auditors for services relating to the performance of the audit of the registrant’s financial statements and not reported under paragraph (a) of this Item were $0 for the fiscal year ended July 31, 2010.
The aggregate fees billed by the registrant’s independent auditors for services relating to the performance of the audit of the financial statements of the registrant’s investment adviser and other service providers under common control with the adviser and that relate directly to the operations or financial reporting of the registrant were $84,000 for the registrant’s fiscal year ended July 31, 2010. The percentage of these fees relating to services approved by the registrant’s Audit Committee pursuant to the de minimis exception from the pre-approval requirement in Rule 2-01(c)(7)(i)(C) of Regulation S-X was 0%. These audit-related services were as follows: audit procedures performed on Delaware Investments for its consolidation into Macquarie’s financial statements as of March 31, 2010.
(c) Tax fees.
The aggregate fees billed by the registrant’s independent auditors for tax-related services provided to the registrant were $0 for the fiscal year ended July 31, 2011.
The aggregate fees billed by the registrant’s independent auditors for tax-related services provided to the registrant’s investment adviser and other service providers under common control with the adviser and that relate directly to the operations or financial reporting of the registrant were $10,000 for the registrant’s fiscal year ended July 31, 2011. The percentage of these fees relating to services approved by the registrant’s Audit Committee pursuant to the de minimis exception from the pre-approval requirement in Rule 2-01(c)(7)(i)(C) of Regulation S-X was 0%. These tax-related services were as follows: state and local tax review.
The aggregate fees billed by the registrant’s independent auditors for tax-related services provided to the registrant were $21,150 for the fiscal year ended July 31, 2010. The percentage of these fees relating to services approved by the registrant’s Audit Committee pursuant to the de minimis exception from the pre-approval requirement in Rule 2-01(c)(7)(i)(C) of Regulation S-X was 0%.
The aggregate fees billed by the registrant’s independent auditors for tax-related services provided to the registrant’s adviser and other service providers under common control with the adviser and that relate directly to the operations or financial reporting of the registrant were $0 for the registrant’s fiscal year ended July 31, 2010.
(d) All other fees.
The aggregate fees billed for all services provided by the independent auditors to the registrant other than those set forth in paragraphs (a), (b) and (c) of this Item were $0 for the fiscal year ended July 31, 2011.
The aggregate fees billed for all services other than those set forth in paragraphs (b) and (c) of this Item provided by the registrant’s independent auditors to the registrant’s adviser and other service providers under common control with the adviser and that relate directly to the operations or financial reporting of the registrant were $25,000 for the registrant’s fiscal year ended July 31, 2011. The percentage of these fees relating to services approved by the registrant’s Audit Committee pursuant to the de minimis exception from the pre-approval requirement in Rule 2-01(c)(7)(i)(C) of Regulation S-X was 0%. These other services were as follows: attest examination of management’s assertion to the controls in place at the transfer agent to be in compliance with Rule 17ad-13(a)(3) of the Securities Exchange Act of 1934.
The aggregate fees billed for all services provided by the independent auditors to the registrant other than those set forth in paragraphs (a), (b) and (c) of this Item were $0 for the fiscal year ended July 31, 2010.
The aggregate fees billed for all services other than those set forth in paragraphs (b) and (c) of this Item provided by the registrant’s independent auditors to the registrant’s adviser and other service providers under common control with the adviser and that relate directly to the operations or financial reporting of the registrant were $0 for the registrant’s fiscal year ended July 31, 2010.
(e) The registrant’s Audit Committee has established pre-approval policies and procedures as permitted by Rule 2-01(c)(7)(i)(B) of Regulation S-X (the “Pre-Approval Policy”) with respect to services provided by the registrant’s independent auditors. Pursuant to the Pre-Approval Policy, the Audit Committee has pre-approved the services set forth in the table below with respect to the registrant up to the specified fee limits. Certain fee limits are based on aggregate fees to the registrant and other registrants within the Delaware Investments Family of Funds.
| Service | Range of Fees |
| Audit Services | |
| Statutory audits or financial audits for new Funds | up to $25,000 per Fund |
| Services associated with SEC registration statements (e.g., Form N-1A, Form N-14, etc.), periodic reports and other documents filed with the SEC or other documents issued in connection with securities offerings (e.g., comfort letters for closed-end Fund offerings, consents), and assistance in responding to SEC comment letters | up to $10,000 per Fund |
| Consultations by Fund management as to the accounting or disclosure treatment of transactions or events and/or the actual or potential impact of final or proposed rules, standards or interpretations by the SEC, FASB, or other regulatory or standard-setting bodies (Note: Under SEC rules, some consultations may be considered “audit-related services” rather than “audit services”) | up to $25,000 in the aggregate |
| Audit-Related Services | |
| Consultations by Fund management as to the accounting or disclosure treatment of transactions or events and /or the actual or potential impact of final or proposed rules, standards or interpretations by the SEC, FASB, or other regulatory or standard-setting bodies (Note: Under SEC rules, some consultations may be considered “audit services” rather than “audit-related services”) | up to $25,000 in the aggregate |
| Tax Services | |
| U.S. federal, state and local and international tax planning and advice (e.g., consulting on statutory, regulatory or administrative developments, evaluation of Funds’ tax compliance function, etc.) | up to $25,000 in the aggregate |
| U.S. federal, state and local tax compliance (e.g., excise distribution reviews, etc.) | up to $5,000 per Fund |
| Review of federal, state, local and international income, franchise and other tax returns | up to $5,000 per Fund |
Under the Pre-Approval Policy, the Audit Committee has also pre-approved the services set forth in the table below with respect to the registrant’s investment adviser and other entities controlling, controlled by or under common control with the investment adviser that provide ongoing services to the registrant (the “Control Affiliates”) up to the specified fee limit. This fee limit is based on aggregate fees to the investment adviser and its Control Affiliates.
| Service | Range of Fees |
| Non-Audit Services | |
| Services associated with periodic reports and other documents filed with the SEC and assistance in responding to SEC comment letters | up to $10,000 in the aggregate |
The Pre-Approval Policy requires the registrant’s independent auditors to report to the Audit Committee at each of its regular meetings regarding all services initiated since the last such report was rendered, including those services authorized by the Pre-Approval Policy.
(f) Not applicable.
(g) The aggregate non-audit fees billed by the registrant’s independent auditors for services rendered to the registrant and to its investment adviser and other service providers under common control with the adviser were $0 and $0 for the registrant’s fiscal years ended July 31, 2011 and July 31, 2010, respectively.
(h) In connection with its selection of the independent auditors, the registrant’s Audit Committee has considered the independent auditors’ provision of non-audit services to the registrant’s investment adviser and other service providers under common control with the adviser that were not required to be pre-approved pursuant to Rule 2-01(c)(7)(ii) of Regulation S-X. The Audit Committee has determined that the independent auditors’ provision of these services is compatible with maintaining the auditors’ independence.
Item 5. Audit Committee of Listed Registrants
Not applicable.
Item 6. Investments
(a) Included as part of report to shareholders filed under Item 1 of this Form N-CSR.
(b) Divestment of securities in accordance with Section 13(c) of the Investment Company Act of 1940.
Not applicable.
Item 7. Disclosure of Proxy Voting Policies and Procedures for Closed-End Management Investment Companies
Not applicable.
Item 8. Portfolio Managers of Closed-End Management Investment Companies
Not applicable.
Item 9. Purchases of Equity Securities by Closed-End Management Investment Company and Affiliated Purchasers
Not applicable.
Item 10. Submission of Matters to a Vote of Security Holders
Not applicable.
Item 11. Controls and Procedures
The registrant’s principal executive officer and principal financial officer have evaluated the registrant’s disclosure controls and procedures within 90 days of the filing of this report and have concluded that they are effective in providing reasonable assurance that the information required to be disclosed by the registrant in its reports or statements filed under the Securities Exchange Act of 1934 is recorded, processed, summarized and reported within the time periods specified in the rules and forms of the Securities and Exchange Commission.
There were no significant changes in the registrant’s internal control over financial reporting that occurred during the second fiscal quarter of the period covered by the report to stockholders included herein (i.e., the registrant’s fourth fiscal quarter) that have materially affected, or are reasonably likely to materially affect, the registrant’s internal control over financial reporting.
Item 12. Exhibits
(a) (1) Code of Ethics
Not applicable.
(2) Certifications of Principal Executive Officer and Principal Financial Officer pursuant to Rule 30a-2 under the Investment Company Act of 1940 are attached hereto as Exhibit 99.CERT.
(3) Written solicitations to purchase securities pursuant to Rule 23c-1 under the Securities Exchange Act of 1934.
Not applicable.
(b) Certifications pursuant to Section 906 of the Sarbanes-Oxley Act of 2002 are furnished herewith as Exhibit 99.906CERT.
SIGNATURES
Pursuant to the requirements of the Securities Exchange Act of 1934 and the Investment Company Act of 1940, the registrant has duly caused this report to be signed on its behalf, by the undersigned, thereunto duly authorized.
Name of Registrant: Delaware Group® Income Funds
| PATRICK P. COYNE |
| By: | Patrick P. Coyne |
| Title: | Chief Executive Officer |
| Date: | September 29, 2011 |
Pursuant to the requirements of the Securities Exchange Act of 1934 and the Investment Company Act of 1940, this report has been signed below by the following persons on behalf of the registrant and in the capacities and on the dates indicated.
| PATRICK P. COYNE |
| By: | Patrick P. Coyne |
| Title: | Chief Executive Officer |
| Date: | September 29, 2011 |
| RICHARD SALUS |
| By: | Richard Salus |
| Title: | Chief Financial Officer |
| Date: | September 29, 2011 |