UNITED STATES SECURITIES AND EXCHANGE COMMISSION
Washington, D.C. 20549
FORM N-CSR
CERTIFIED SHAREHOLDER REPORT OF REGISTERED MANAGEMENT
INVESTMENT COMPANIES
| Investment Company Act file number: | | 811-02071 |
| | |
| Exact name of registrant as specified in charter: | | Delaware Group® Income Funds |
| | |
| Address of principal executive offices: | | 2005 Market Street |
| | Philadelphia, PA 19103 |
| | |
| Name and address of agent for service: | | David F. Connor, Esq. |
| | 2005 Market Street |
| | Philadelphia, PA 19103 |
| | |
| Registrant’s telephone number, including area code: | | (800) 523-1918 |
| | |
| Date of fiscal year end: | | July 31 |
| | |
| Date of reporting period: | | July 31, 2013 |
Item 1. Reports to Stockholders

Annual report Delaware Corporate Bond Fund Delaware Extended Duration Bond Fund July 31, 2013 Fixed income mutual funds |
| Carefully consider the Funds’ investment objectives, risk factors, charges, and expenses before investing. This and other information can be found in the Funds’ prospectuses and, if available, their summary prospectuses, which may be obtained by visiting delawareinvestments.com or calling 800 523-1918. Investors should read the prospectus and, if available, the summary prospectus carefully before investing. |
You can obtain shareholder reports and prospectuses online instead of in the mail.
Visit delawareinvestments.com/edelivery. |
Experience Delaware Investments
Delaware Investments is committed to the pursuit of consistently superior asset management and unparalleled client service. We believe in our investment processes, which seek to deliver consistent results, and in convenient services that help add value for our clients.
If you are interested in learning more about creating an investment plan, contact your financial advisor.
You can learn more about Delaware Investments or obtain a prospectus for Delaware Corporate Bond Fund and Delaware Extended Duration Bond Fund at delawareinvestments.com.
Manage your investments online
- 24-hour access to your account information
- Obtain share prices
- Check your account balance and recent transactions
- Request statements or literature
- Make purchases and redemptions
Delaware Management Holdings, Inc. and its subsidiaries (collectively known by the marketing name of Delaware Investments) are wholly owned subsidiaries of Macquarie Group Limited, a global provider of banking, financial, advisory, investment and funds management services.
Investments in Delaware Corporate Bond Fund and Delaware Extended Duration Bond Fund are not and will not be deposits with or liabilities of Macquarie Bank Limited ABN 46 008 583 542 and its holding companies, including their subsidiaries or related companies (Macquarie Group), and are subject to investment risk, including possible delays in repayment and loss of income and capital invested. No Macquarie Group company guarantees or will guarantee the performance of the Funds, the repayment of capital from the Funds, or any particular rate of return.
| Table of contents | | |
| Portfolio management review | | 1 |
| Performance summaries | | 4 |
| Disclosure of Fund expenses | | 12 |
| Security type/sector allocations | | 14 |
| Statements of net assets | | 16 |
| Statements of assets and liabilities | | 48 |
| Statements of operations | | 50 |
| Statements of changes in net assets | | 52 |
| Financial highlights | | 56 |
| Notes to financial statements | | 76 |
| Report of independent registered | | |
| public accounting firm | | 99 |
| Other Fund information | | 100 |
| Board of trustees/directors and | | |
| officers addendum | | 102 |
| About the organization | | 110 |
Unless otherwise noted, views expressed herein are current as of July 31, 2013, and subject to change.
Funds are not FDIC insured and are not guaranteed. It is possible to lose the principal amount invested.
Mutual fund advisory services provided by Delaware Management Company, a series of Delaware Management Business Trust, which is a registered investment advisor. Delaware Investments, a member of Macquarie Group, refers to Delaware Management Holdings, Inc. and its subsidiaries, including the Funds’ distributor, Delaware Distributors, L.P. Macquarie Group refers to Macquarie Group Limited and its subsidiaries and affiliates worldwide.
© 2013 Delaware Management Holdings, Inc.
All third-party marks cited are the property of their respective owners.
| Portfolio management review | |
| Delaware Corporate Bond Fund and Delaware Extended Duration Bond Fund | August 6, 2013 |
| Performance preview (for the year ended July 31, 2013) |
| Delaware Corporate Bond Fund (Class A shares) | | 1-year return | | +2.02 | % |
| Barclays U.S. Corporate Investment Grade Index (benchmark) | | 1-year return | | -0.66 | % |
Past performance does not guarantee future results.
For complete, annualized performance for Delaware Corporate Bond Fund, please see the table on page 4.
The performance of Class A shares excludes the applicable sales charge and reflects the reinvestment of all distributions.
Index performance returns do not reflect any management fees, transaction costs, or expenses. Indices are unmanaged and one cannot invest directly in an index.
| Delaware Extended Duration Bond Fund (Class A shares) | | 1-year return | | -2.45 | % |
| Barclays Long U.S. Corporate Index (benchmark) | | 1-year return | | -5.54 | % |
Past performance does not guarantee future results.
For complete, annualized performance for Delaware Extended Duration Bond Fund, please see the table on page 8.
The performance of Class A shares excludes the applicable sales charge and reflects the reinvestment of all distributions.
Index performance returns do not reflect any management fees, transaction costs, or expenses. Indices are unmanaged and one cannot invest directly in an index.
The U.S. economy continued its slow but steady recovery during the Funds’ fiscal year ended July 31, 2013. Gradual economic improvements were generally shaped by better employment and housing trends. On the jobs front, payrolls have gradually increased since the depths of the financial crisis in 2009, while jobless claims have trended downward. In June 2013, the U.S. unemployment rate stood at 7.4%, down from 8.2% at the start of the fiscal year (source: Bloomberg). Meanwhile, home prices continued to gather steam, even as mortgage rates ticked up in the latter months of the period. Both improvements were important factors behind consumers’ increased willingness to spend — a generally favorable backdrop for corporate bond issuers, and disproportionately so for those with weaker credit positions.
At the same time, investors remained concerned about two significant economic overhangs. The first involved Europe, which continued to struggle to emerge from its sovereign debt crisis, and where recovery was significantly behind that of the United States. Investor confidence received a boost in the summer of 2012, however, when the European Central Bank (ECB) announced it would act aggressively to provide needed financial support to troubled euro-zone economies. The second notable concern was China, where the economic growth rate continued to slow. This, in turn, put pressure on economic sectors related to raw materials, such as metals and mining, where China’s manufacturing and consumption had driven demand.
Two difficult months for bonds
For roughly the first three quarters of the fiscal year, the corporate bond market saw rising prices, while fixed income yields fell accordingly (bond yields and prices move in opposite directions). By May and June 2013, conditions shifted dramatically, as bonds experienced large price declines accompanied by a correspondingly large increase in yields.
1
Portfolio management review
Delaware Corporate Bond Fund and Delaware Extended Duration Bond Fund
The abrupt market shift was triggered by concern about a change in U.S. Federal Reserve policy — namely, that the U.S. central bank would begin to wind down its program of “quantitative easing.”
The result was a cycle in which interest rates rose as investors sold bonds. That said, we believe the market’s decline was largely based on technical factors. Issuers’ financial strength, in our opinion, remained solid throughout the fiscal year. In the final weeks of the period, as it became clear that no monetary policy move from the Fed was imminent, interest rates stabilized, and the market recovered off its late-June low.
Fund performance
For the fiscal year ended July 31, 2013, Delaware Corporate Bond Fund Class A shares returned +2.02% at net asset value and -2.50% at maximum offer price (both returns reflect all distributions reinvested). In comparison, the Fund’s benchmark, the Barclays U.S. Corporate Investment Grade Index, returned -0.66% during the same period. For complete annualized performance of Delaware Corporate Bond Fund, please see the table on page 4.
During the same period, Delaware Extended Duration Bond Fund Class A shares returned -2.45% at net asset value and -6.87% at maximum offer price (both returns reflect all distributions reinvested). In comparison, the Fund’s benchmark, the Barclays Long U.S. Corporate Index, returned -5.54%. For complete annualized performance of Delaware Extended Duration Bond Fund, please see the table on page 8.
Help among financials, Europe
During the fiscal year, both Funds turned in only modest gains in absolute terms but managed to outpace their respective benchmarks by notable margins. In part, we credit these results to research. Our fundamental “bottom-up” (bond-by-bond) investment process enables us to identify what we view as undervalued issuers with attractive risk-return characteristics, while seeking to avoid credits with what we view as declining fundamentals and unattractive risk-return profiles. Our investment process includes decisions not only about which securities to hold in the portfolios, but about the size of each position. We are willing to maintain meaningful positions in bonds that we believe have the potential to offer particularly good value.
During the fiscal year, one particular area of strength was the financial sector, as many issuers in this group began to enjoy a more favorable market backdrop. Bonds of U.K.-based bank Lloyds TSB and U.S. insurance companies such as American International Group (AIG) and MetLife helped lift both Funds, while those of another U.S. insurance provider, Prudential Financial, also meaningfully contributed to Delaware Extended Duration Bond Fund’s results.
During the period, both Funds benefited from their allocations to certain European issuers whose valuations were tainted by the region but, in our view, offered relatively defensive credit characteristics, such as stable business models and cash flow generation. Examples of such issuers include Spanish telecom provider Telefonica, Italian wireless operator Wind Telecom, and Spanish cable
2
and broadband provider Ono. These and other European debt securities benefited from increased optimism about the ECB’s willingness to provide financial support to euro-zone countries facing particular economic challenges.
Delaware Extended Duration Bond Fund further benefited from its emphasis on high yield and investment grade bonds with intermediate maturities. We believed these securities offered better investment potential than their longer-dated counterparts. Given the Fund’s mandate to keep a sufficient level of interest rate sensitivity, we balanced these shorter-dated securities with long-duration futures as well as interest rate swaps.
The metals and mining sectors provided one notable source of difficulty. In particular, both Funds were hurt by a position in Canadian gold producer Barrick Gold, which significantly underperformed during the fiscal year. We actively managed the Funds’ positions in these holdings, periodically increasing the Funds’ exposure at lower prices while reducing the Funds’ allocations as the securities began to recover.
Overall, derivatives had a negligible effect on Delaware Corporate Bond Fund returns. However, futures have consistently been utilized within Delaware Extended Duration Bond Fund to maintain portfolio duration characteristics in line with the benchmark. Other derivative instruments have had a negligible effect on returns.
3
| Performance summaries | |
| Delaware Corporate Bond Fund | July 31, 2013 |
The performance data quoted represent past performance; past performance does not guarantee future results. Investment return and principal value will fluctuate so your shares, when redeemed, may be worth more or less than their original cost. Please obtain the performance data current for the most recent month end by calling 800 523-1918 or visiting our website at delawareinvestments.com/performance. Current performance may be lower or higher than the performance data quoted.
| Fund and benchmark performance1,2 | | Average annual total returns through July 31, 2013 |
| | 1 year | | 5 years | | 10 years | |
| Class A (Est. Sept. 15, 1998) | | | | | | | | | | |
| Excluding sales charge | | +2.02 | % | | +10.17 | % | | +7.37 | % | |
| Including sales charge | | -2.50 | % | | +9.15 | % | | +6.88 | % | |
| Class B (Est. Sept. 15, 1998) | | | | | | | | | | |
| Excluding sales charge | | +1.26 | % | | +9.40 | % | | +6.72 | % | |
| Including sales charge | | -2.54 | % | | +9.19 | % | | +6.72 | % | |
| Class C (Est. Sept. 15, 1998) | | | | | | | | | | |
| Excluding sales charge | | +1.43 | % | | +9.39 | % | | +6.59 | % | |
| Including sales charge | | +0.48 | % | | +9.39 | % | | +6.59 | % | |
| Class R (Est. June 2, 2003) | | | | | | | | | | |
| Excluding sales charge | | +1.77 | % | | +9.93 | % | | +7.10 | % | |
| Including sales charge | | +1.77 | % | | +9.93 | % | | +7.10 | % | |
| Institutional Class (Est. Sept. 15, 1998) | | | | | | | | | | |
| Excluding sales charge | | +2.28 | % | | +10.49 | % | | +7.64 | % | |
| Including sales charge | | +2.28 | % | | +10.49 | % | | +7.64 | % | |
| Barclays U.S. Corporate | | | | | | | | | | |
| Investment Grade Index | | -0.66 | % | | +7.64 | % | | +5.73 | % | |
1 Returns reflect the reinvestment of all distributions and are presented both with and without the applicable sales charges described below. Returns do not reflect the deduction of taxes the shareholder would pay on Fund distributions or redemptions of Fund shares.
Expense limitations were in effect for certain classes during some or all of the periods shown in the “Fund performance” chart. Expenses for each class are listed on the “Fund expense ratios” table on page 6. Performance would have been lower had expense limitations not been in effect.
Class A shares are sold with a maximum front-end sales charge of 4.50%, and have an annual distribution and service fee of 0.30% of average daily net assets. This fee has been contractually limited to 0.25% of average daily net assets from Nov. 28, 2012, through Nov. 28, 2013. Performance for Class A shares, excluding sales charges, assumes that no front-end sales charge applied.
Class B shares may be purchased only through dividend reinvestment and certain permitted exchanges as described in the prospectus. Please see the prospectus for additional information on Class B shares. Class B shares
4
have a contingent deferred sales charge that declines from 4.00% to zero depending on the period of time the shares are held. They are also subject to an annual distribution and service fee of 1.00% of average daily net assets. Class B shares will automatically convert to Class A shares on a quarterly basis approximately eight years after purchase. Ten-year performance figures for Class B shares reflect conversion to Class A shares after approximately eight years.
Class C shares are sold with a contingent deferred sales charge of 1.00% if redeemed during the first 12 months. They are also subject to an annual distribution and service fee of 1.00% of average daily net assets.
Performance for Class B and C shares, excluding sales charges, assumes either that contingent deferred sales charges did not apply or that the investment was not redeemed.
Class R shares are available only for certain retirement plan products. They are sold without a sales charge and have an annual distribution and service fee of 0.60% of average daily net assets, which has been limited contractually to 0.50% from Nov. 28, 2012, through Nov. 28, 2013.
Institutional Class shares are available without sales or asset-based distribution charges only to certain eligible institutional accounts.
The “Fund performance” table and the “Performance of a $10,000 investment” graph do not reflect the deduction of taxes the shareholder would pay on Fund distributions or redemptions of Fund shares.
Fixed income securities and bond funds can lose value, and investors can lose principal, as interest rates rise. They also may be affected by economic conditions that hinder an issuer’s ability to make interest and principal payments on its debt.
The Fund may also be subject to prepayment risk, the risk that the principal of a fixed income security that is held by the Fund may be prepaid prior to maturity, potentially forcing the Fund to reinvest that money at a lower interest rate.
High yielding, noninvestment grade bonds (junk bonds) involve higher risk than investment grade bonds.
International investments entail risks not ordinarily associated with U.S. investments including fluctuation in currency values, differences in accounting principles, or economic or political instability in other nations.
Investing in emerging markets can be riskier than investing in established foreign markets due to increased volatility and lower trading volume.
The Fund may experience portfolio turnover in excess of 100%, which could result in higher transaction costs and tax liability.
The Fund may invest in derivatives, which may involve additional expenses and are subject to risk, including the risk that an underlying security or securities index moves in the opposite direction from what the portfolio manager anticipated. A derivative transaction depends upon the counterparties’ ability to fulfill their contractual obligations.
Per Standard & Poor’s credit rating agency, bonds rated AA and A are more susceptible to the adverse effects of changes in circumstances and economic conditions than those in the higher-rated AAA category, but the obligor’s capacity to meet its financial commitment on the obligation is still strong. Bonds rated BBB exhibit adequate protection parameters, although adverse economic conditions or changing circumstances are more likely to lead
5
Performance summaries
Delaware Corporate Bond Fund
to a weakened capacity of the obligor to meet its financial commitments. Bonds rated BB, B, and CCC are regarded as having significant speculative characteristics, with BB indicating the least degree of speculation of the three.
2 The Fund’s expense ratios, as described in the most recent prospectus, are disclosed in the following “Fund expense ratios” table. Delaware Management Company has agreed to reimburse certain expenses and/or waive certain fees in order to prevent total annual fund operating expenses (excluding certain fees and expenses) from exceeding 0.69% of the Fund’s average daily net assets from Nov. 28, 2012, through Nov. 28, 2013. Please see the most recent prospectus and any applicable supplement(s) for additional information on these fee waivers and/or reimbursements.
| Fund expense ratios | | Class A | | Class B | | Class C | | Class R | | Institutional Class |
| Total annual operating expenses | | 1.01 | % | | 1.71 | % | | 1.71 | % | | 1.31 | % | | 0.71 | % |
| (without fee waivers) | | | | | | | | | | | | | | | |
| Net expenses | | 0.94 | % | | 1.69 | % | | 1.69 | % | | 1.19 | % | | 0.69 | % |
| (including fee waivers, if any) | | | | | | | | | | | | | | | |
| Type of waiver | | Contractual | | Contractual | | Contractual | | Contractual | | Contractual |
6
Performance of a $10,000 investment1
Average annual total returns from July 31, 2003, through July 31, 2013
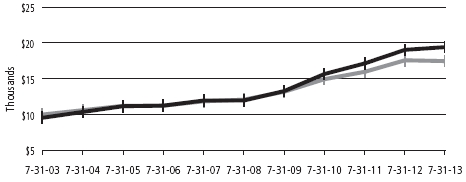
| For period beginning July 31, 2003, through July 31, 2013 | | Starting value | | Ending value | |
| | Delaware Corporate Bond Fund — Class A shares | | | $9,550 | | | $19,414 | |
| | Barclays U.S. Corporate Investment Grade Index | | | $10,000 | | | $17,462 | |
1 The “Performance of a $10,000 investment” graph assumes $10,000 invested in Class A shares of the Fund on July 31, 2003, and includes the effect of a 4.50% front-end sales charge and the reinvestment of all distributions. The graph does not reflect the deduction of taxes the shareholders would pay on Fund distributions or redemptions of Fund shares. Expense limitations were in effect for some or all of the periods shown. Performance would have been lower had expense limitations not been in effect. Expenses are listed in the “Fund expense ratios” table on page 6. Please note additional details on pages 4 through 7.
The chart also assumes $10,000 invested in the Barclays U.S. Corporate Investment Grade Index as of July 31, 2003. The Barclays U.S. Corporate Investment Grade Index is composed of U.S. dollar–denominated, investment grade, SEC-registered corporate bonds issued by industrial, utility, and financial companies. All bonds in the index have at least one year to maturity.
Index performance returns do not reflect any management fees, transaction costs, or expenses. Indices are unmanaged and one cannot invest directly in an index. Past performance is not a guarantee of future results.
Performance of other Fund classes will vary due to different charges and expenses.
| | Nasdaq symbols | | CUSIPs | |
| Class A | | | DGCAX | | | 245908785 | |
| Class B | | | DGCBX | | | 245908777 | |
| Class C | | | DGCCX | | | 245908769 | |
| Class R | | | DGCRX | | | 245908744 | |
| Institutional Class | | | DGCIX | | | 245908751 | |
7
| Performance summaries | |
| Delaware Extended Duration Bond Fund | July 31, 2013 |
The performance data quoted represent past performance; past performance does not guarantee future results. Investment return and principal value will fluctuate so your shares, when redeemed, may be worth more or less than their original cost. Please obtain the performance data current for the most recent month end by calling 800 523-1918 or visiting our website at delawareinvestments.com/performance. Current performance may be lower or higher than the performance data quoted.
| Fund and benchmark performance1,2 | | Average annual total returns through July 31, 2013 |
| | 1 year | | 5 years | | 10 years | | Lifetime |
| Class A (Est. Sept. 15, 1998) | | | | | | | | | | | | |
| Excluding sales charge | | -2.45 | % | | +13.00 | % | | +9.24 | % | | n/a | |
| Including sales charge | | -6.87 | % | | +11.94 | % | | +8.74 | % | | n/a | |
| Class B (Est. Sept. 15, 1998) | | | | | | | | | | | | |
| Excluding sales charge | | -3.19 | % | | +12.17 | % | | +8.57 | % | | n/a | |
| Including sales charge | | -6.70 | % | | +11.98 | % | | +8.57 | % | | n/a | |
| Class C (Est. Sept. 15, 1998) | | | | | | | | | | | | |
| Excluding sales charge | | -3.17 | % | | +12.16 | % | | +8.43 | % | | n/a | |
| Including sales charge | | -4.05 | % | | +12.16 | % | | +8.43 | % | | n/a | |
| Class R (Est. Oct. 1, 2005) | | | | | | | | | | | | |
| Excluding sales charge | | -2.68 | % | | +12.75 | % | | n/a | | +8.55 | % |
| Including sales charge | | -2.68 | % | | +12.75 | % | | n/a | | +8.55 | % |
| Institutional Class (Est. Sept. 15, 1998) | | | | | | | | | | | | |
| Excluding sales charge | | -2.21 | % | | +13.29 | % | | +9.51 | % | | n/a | |
| Including sales charge | | -2.21 | % | | +13.29 | % | | +9.51 | % | | n/a | |
| Barclays Long U.S. Corporate Index | | -5.54 | % | | +9.97 | % | | +7.19 | % | | n/a | |
1 Returns reflect the reinvestment of all distributions and are presented both with and without the applicable sales charges described below. Returns do not reflect the deduction of taxes the shareholder would pay on Fund distributions or redemptions of Fund shares.
Expense limitations were in effect for certain classes during some or all of the periods shown in the “Fund performance” chart. Expenses for each class are listed on the “Fund expense ratios” table on page 10. Performance would have been lower had expense limitations not been in effect.
Class A shares are sold with a maximum front-end sales charge of 4.50%, and have an annual distribution and service fee of 0.30% of average daily net assets. This fee has been contractually limited to 0.25% of average daily net assets from Nov. 28, 2012, through Nov. 28, 2013. Performance for Class A shares, excluding sales charges, assumes that no front-end sales charge applied.
Class B shares may be purchased only through dividend reinvestment and certain permitted exchanges as described in the prospectus. Please see the prospectus for additional information on Class B shares. Class B shares have a contingent deferred sales charge that
8
declines from 4.00% to zero depending on the period of time the shares are held. They are also subject to an annual distribution and service fee of 1.00% of average daily net assets. Class B shares will automatically convert to Class A shares on a quarterly basis approximately eight years after purchase. Ten-year and lifetime performance figures for Class B shares reflect conversion to Class A shares after approximately eight years.
Class C shares are sold with a contingent deferred sales charge of 1.00% if redeemed during the first 12 months. They are also subject to an annual distribution and service fee of 1.00% of average daily net assets.
Performance for Class B and C shares, excluding sales charges, assumes either that contingent deferred sales charges did not apply or that the investment was not redeemed.
Class R shares are available only for certain retirement plan products. They are sold without a sales charge and have an annual distribution and service fee of 0.60% of average daily net assets, which has been limited contractually to 0.50% from Nov. 28, 2012, through Nov. 28, 2013.
Institutional Class shares are available without sales or asset-based distribution charges only to certain eligible institutional accounts.
The “Fund performance” table and the “Performance of a $10,000 investment” graph do not reflect the deduction of taxes the shareholder would pay on Fund distributions or redemptions of Fund shares.
Fixed income securities and bond funds can lose value, and investors can lose principal, as interest rates rise. They also may be affected by economic conditions that hinder an issuer’s ability to make interest and principal payments on its debt.
The Fund may also be subject to prepayment risk, the risk that the principal of a fixed income security that is held by the Fund may be prepaid prior to maturity, potentially forcing the Fund to reinvest that money at a lower interest rate.
High yielding, noninvestment grade bonds (junk bonds) involve higher risk than investment grade bonds.
International investments entail risks not ordinarily associated with U.S. investments including fluctuation in currency values, differences in accounting principles, or economic or political instability in other nations.
Investing in emerging markets can be riskier than investing in established foreign markets due to increased volatility and lower trading volume.
The Fund may experience portfolio turnover in excess of 100%, which could result in higher transaction costs and tax liability.
The Fund may invest in derivatives, which may involve additional expenses and are subject to risk, including the risk that an underlying security or securities index moves in the opposite direction from what the portfolio manager anticipated. A derivative transaction depends upon the counterparties’ ability to fulfill their contractual obligations.
Per Standard & Poor’s credit rating agency, bonds rated AA and A are more susceptible to the adverse effects of changes in circumstances and economic conditions than those in the higher-rated AAA category, but the obligor’s capacity to meet its financial commitment on the obligation is still strong. Bonds rated BBB exhibit adequate protection parameters, although adverse economic conditions or changing circumstances are more likely to lead
9
Performance summaries
Delaware Extended Duration Bond Fund
to a weakened capacity of the obligor to meet its financial commitments. Bonds rated BB, B, and CCC are regarded as having significant speculative characteristics, with BB indicating the least degree of speculation of the three.
2 The Fund’s expense ratios, as described in the most recent prospectus, are disclosed in the following “Fund expense ratios” table. Delaware Management Company has agreed to reimburse certain expenses and/or waive certain fees in order to prevent total annual fund operating expenses (excluding certain fees and expenses) from exceeding 0.70% of the Fund’s average daily net assets from Nov. 28, 2012, through Nov. 28, 2013. Please see the most recent prospectus and any applicable supplement(s) for additional information on these fee waivers and/or reimbursements.
| Fund expense ratios | Class A | | Class B | | Class C | | Class R | | Institutional Class |
| Total annual operating expenses | 1.06% | | 1.76% | | 1.76% | | 1.36% | | 0.76% |
| (without fee waivers) | | | | | | | | | |
| Net expenses | 0.95% | | 1.70% | | 1.70% | | 1.20% | | 0.70% |
| (including fee waivers, if any) | | | | | | | | | |
| Type of waiver | Contractual | | Contractual | | Contractual | | Contractual | | Contractual |
10
Performance of a $10,000 investment1
Average annual total returns from July 31, 2003, through July 31, 2013
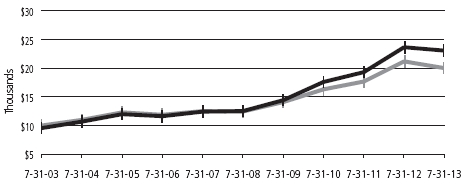
| For period beginning July 31, 2003, through July 31, 2013 | Starting value | | Ending value |
| | Delaware Extended Duration Bond Fund — | | | | |
| | Class A shares | $9,550 | | | $23,077 |
| | Barclays Long U.S. Corporate Index | $10,000 | | | $20,022 |
1 The “Performance of a $10,000 investment” graph assumes $10,000 invested in Class A shares of the Fund on July 31, 2003, and includes the effect of a 4.50% front-end sales charge and the reinvestment of all distributions. The graph does not reflect the deduction of taxes the shareholders would pay on Fund distributions or redemptions of Fund shares. Expense limitations were in effect for some or all of the periods shown. Performance would have been lower had expense limitations not been in effect. Expenses are listed in the “Fund expense ratios” table on page 10. Please note additional details on pages 8 through 11.
The chart also assumes $10,000 invested in the Barclays Long U.S. Corporate Index as of July 31, 2003. The Barclays Long U.S. Corporate Index is composed of U.S. dollar–denominated, investment grade, SEC-registered corporate bonds issued by industrial, utility, and financial companies. All bonds in the index have at least 10 years to maturity.
Index performance returns do not reflect any management fees, transaction costs, or expenses. Indices are unmanaged and one cannot invest directly in an index. Past performance is not a guarantee of future results.
Performance of other Fund classes will vary due to different charges and expenses.
| | Nasdaq symbols | | CUSIPs | |
| Class A | | | DEEAX | | | 245908835 | |
| Class B | | | DEEBX | | | 245908827 | |
| Class C | | | DEECX | | | 245908819 | |
| Class R | | | DEERX | | | 245908728 | |
| Institutional Class | | | DEEIX | | | 245908793 | |
11
Disclosure of Fund expenses
For the six-month period from February 1, 2013 to July 31, 2013 (Unaudited)
As a shareholder of a Fund, you incur two types of costs: (1) transaction costs, including sales charges (loads) on purchase payments, reinvested dividends, or other distributions; redemption fees; and exchange fees; and (2) ongoing costs, including management fees; distribution and/or service (12b-1) fees; and other Fund expenses. These following examples are intended to help you understand your ongoing costs (in dollars) of investing in a Fund and to compare these costs with the ongoing costs of investing in other mutual funds.
The examples are based on an investment of $1,000 invested at the beginning of the period and held for the entire six-month period from Feb. 1, 2013 to July 31, 2013.
Actual expenses
The first section of the tables shown, “Actual Fund return,” provides information about actual account values and actual expenses. You may use the information in this section of the table, together with the amount you invested, to estimate the expenses that you paid over the period. Simply divide your account value by $1,000 (for example, an $8,600 account value divided by $1,000 = 8.6), then multiply the result by the number in the first section under the heading entitled “Expenses Paid During Period” to estimate the expenses you paid on your account during this period.
Hypothetical example for comparison purposes
The second section of the tables shown, “Hypothetical 5% return,” provides information about hypothetical account values and hypothetical expenses based on the Funds’ actual expense ratios and an assumed rate of return of 5% per year before expenses, which is not the Funds’ actual return. The hypothetical account values and expenses may not be used to estimate the actual ending account balance or expenses you paid for the period. You may use this information to compare the ongoing costs of investing in each Fund and other funds. To do so, compare this 5% hypothetical example with the 5% hypothetical examples that appear in the shareholder reports of the other funds.
Please note that the expenses shown in the tables are meant to highlight your ongoing costs only and do not reflect any transactional costs, such as sales charges (loads), redemption fees, or exchange fees. Therefore, the second section of each table is useful in comparing ongoing costs only, and will not help you determine the relative total costs of owning different funds. In addition, if these transactional costs were included, your costs would have been higher. The Funds’ expenses shown in the tables reflect fee waivers in effect. The expenses shown in each table assume reinvestment of all dividends and distributions.
12
Delaware Corporate Bond Fund
Expense analysis of an investment of $1,000
| | Beginning | | Ending | | | | Expenses |
| | Account Value | | Account Value | | Annualized | | Paid During Period |
| | 2/1/13 | | 7/31/13 | | Expense Ratio | | 2/1/13 to 7/31/13* |
| Actual Fund return† |
| Class A | | $ | 1,000.00 | | | $ | 982.80 | | | 0.94% | | $ | 4.62 | |
| Class B | | | 1,000.00 | | | | 979.20 | | | 1.69% | | | 8.29 | |
| Class C | | | 1,000.00 | | | | 980.80 | | | 1.69% | | | 8.30 | |
| Class R | | | 1,000.00 | | | | 981.70 | | | 1.19% | | | 5.85 | |
| Institutional Class | | | 1,000.00 | | | | 984.10 | | | 0.69% | | | 3.39 | |
| Hypothetical 5% return (5% return before expenses) | | | | | | | |
| Class A | | $ | 1,000.00 | | | $ | 1,020.13 | | | 0.94% | | $ | 4.71 | |
| Class B | | | 1,000.00 | | | | 1,016.41 | | | 1.69% | | | 8.45 | |
| Class C | | | 1,000.00 | | | | 1,016.41 | | | 1.69% | | | 8.45 | |
| Class R | | | 1,000.00 | | | | 1,018.89 | | | 1.19% | | | 5.96 | |
| Institutional Class | | | 1,000.00 | | | | 1,021.37 | | | 0.69% | | | 3.46 | |
Delaware Extended Duration Bond Fund
Expense analysis of an investment of $1,000
| | Beginning | | Ending | | | | Expenses |
| | Account Value | | Account Value | | Annualized | | Paid During Period |
| | 2/1/13 | | 7/31/13 | | Expense Ratio | | 2/1/13 to 7/31/13* |
| Actual Fund return† |
| Class A | | $ | 1,000.00 | | | $ | 963.60 | | | 0.95% | | $ | 4.63 | |
| Class B | | | 1,000.00 | | | | 959.90 | | | 1.70% | | | 8.26 | |
| Class C | | | 1,000.00 | | | | 960.00 | | | 1.70% | | | 8.26 | |
| Class R | | | 1,000.00 | | | | 962.50 | | | 1.20% | | | 5.84 | |
| Institutional Class | | | 1,000.00 | | | | 964.70 | | | 0.70% | | | 3.41 | |
| Hypothetical 5% return (5% return before expenses) |
| Class A | | $ | 1,000.00 | | | $ | 1,020.08 | | | 0.95% | | $ | 4.76 | |
| Class B | | | 1,000.00 | | | | 1,016.36 | | | 1.70% | | | 8.50 | |
| Class C | | | 1,000.00 | | | | 1,016.36 | | | 1.70% | | | 8.50 | |
| Class R | | | 1,000.00 | | | | 1,018.84 | | | 1.20% | | | 6.01 | |
| Institutional Class | | | 1,000.00 | | | | 1,021.32 | | | 0.70% | | | 3.51 | |
*“Expenses Paid During Period” are equal to the relevant Fund’s annualized expense ratio, multiplied by the average account value over the period, multiplied by 181/365 (to reflect the one-half year period).
†Because actual returns reflect only the most recent six-month period, the returns shown may differ significantly from fiscal year returns.
13
| Security type/sector allocations |
| Delaware Corporate Bond Fund | | As of July 31, 2013 (Unaudited) |
Sector designations may be different than the sector designations presented in other Fund materials. The sector designations may represent the investment manager’s internal sector classifications, which may result in the sector designations for one fund being different than another fund’s sector designations.
| Security type/sector | Percentage of net assets |
| Convertible Bonds | 2.23 | % |
| Corporate Bonds | 84.40 | % |
| Banking | 10.73 | % |
| Basic Industry | 8.78 | % |
| Brokerage | 1.77 | % |
| Capital Goods | 2.50 | % |
| Communications | 9.19 | % |
| Consumer Cyclical | 7.53 | % |
| Consumer Non-Cyclical | 3.82 | % |
| Electric | 12.82 | % |
| Energy | 4.06 | % |
| Finance Companies | 2.67 | % |
| Insurance | 6.36 | % |
| Natural Gas | 7.16 | % |
| Real Estate Investment Trusts | 2.31 | % |
| Technology | 4.01 | % |
| Transportation | 0.69 | % |
| Municipal Bonds | 5.09 | % |
| Senior Secured Loans | 1.22 | % |
| Common Stock | 0.00 | % |
| Convertible Preferred Stock | 0.59 | % |
| Preferred Stock | 5.37 | % |
| Options Purchased | 0.62 | % |
| Short-Term Investments | 0.11 | % |
| Securities Lending Collateral | 0.03 | % |
| Total Value of Securities | 99.66 | % |
| Obligation to Return Securities Lending Collateral | (0.03 | %) |
| Receivables and Other Assets Net of Other Liabilities | 0.37 | % |
| Total Net Assets | 100.00 | % |
14
| Delaware Extended Duration Bond Fund | As of July 31, 2013 (Unaudited) |
Sector designations may be different than the sector designations presented in other Fund materials. The sector designations may represent the investment manager’s internal sector classifications, which may result in the sector designations for one fund being different than another fund’s sector designations.
| Security type/sector | Percentage of net assets |
| Commercial Mortgage-Backed Security | 0.00 | % |
| Convertible Bonds | 2.37 | % |
| Corporate Bonds | 80.65 | % |
| Banking | 7.90 | % |
| Basic Industry | 6.33 | % |
| Brokerage | 2.29 | % |
| Capital Goods | 3.23 | % |
| Communications | 7.82 | % |
| Consumer Cyclical | 3.44 | % |
| Consumer Non-Cyclical | 8.41 | % |
| Electric | 12.26 | % |
| Energy | 5.28 | % |
| Finance Companies | 3.40 | % |
| Insurance | 7.46 | % |
| Natural Gas | 9.23 | % |
| Real Estate Investment Trusts | 0.65 | % |
| Technology | 1.73 | % |
| Transportation | 1.22 | % |
| Municipal Bonds | 6.72 | % |
| Senior Secured Loans | 1.27 | % |
| Sovereign Bonds | 0.73 | % |
| Convertible Preferred Stock | 0.66 | % |
| Preferred Stock | 5.84 | % |
| Options Purchased | 0.79 | % |
| Short-Term Investments | 0.14 | % |
| Securities Lending Collateral | 0.02 | % |
| Total Value of Securities | 99.19 | % |
| Obligation to Return Securities Lending Collateral | (0.02 | %) |
| Receivables and Other Assets Net of Other Liabilities | 0.83 | % |
| Total Net Assets | 100.00 | % |
15
| Statements of net assets |
| Delaware Corporate Bond Fund | | July 31, 2013 |
| | | Principal amount° | | | Value (U.S. $) |
| Convertible Bonds – 2.23% | | | | | | |
| Φ | ArvinMeritor 4.00% exercise price $26.73, | | | | | | |
| expiration date 2/12/27 | USD | | 3,555,000 | | $ | 3,315,038 |
| # | Clearwire Communications 144A 8.25% | | | | | | |
| exercise price $7.08, expiration date 11/30/40 | | | 7,129,000 | | | 7,931,013 |
| L-3 Communications Holdings 3.00% | | | | | | |
| exercise price $90.24, expiration date 8/1/35 | | | 5,500,000 | | | 5,929,688 |
| Linear Technology 3.00% exercise price $41.46, | | | | | | |
| expiration date 4/30/27 | | | 1,575,000 | | | 1,710,844 |
| Live Nation Entertainment 2.875% | | | | | | |
| exercise price $27.14, expiration date 7/14/27 | | | 2,607,000 | | | 2,646,105 |
| MGM Resorts International 4.25% | | | | | | |
| exercise price $18.58, expiration date 4/10/15 | | | 3,443,000 | | | 4,021,854 |
| # | Owens-Brockway Glass Container 144A 3.00% | | | | | | |
| exercise price $47.47, expiration date 5/28/15 | | | 3,172,000 | | | 3,294,915 |
| PHH 4.00% exercise price $25.80, | | | | | | |
| expiration date 8/27/14 | | | 1,817,000 | | | 1,988,479 |
| Steel Dynamics 5.125% exercise price $17.21, | | | | | | |
| expiration date 6/15/14 | | | 471,000 | | | 511,329 |
| # | WellPoint 144A 2.75% exercise price $75.38, | | | | | | |
| expiration date 10/15/42 | | | 1,195,000 | | | 1,563,209 |
| Total Convertible Bonds (cost $29,938,794) | | | | | | 32,912,474 |
| |
| Corporate Bonds – 84.40% | | | | | | |
| Banking – 10.73% | | | | | | |
| AgriBank 9.125% 7/15/19 | | | 3,492,000 | | | 4,545,201 |
| Bank of America | | | | | | |
| 3.875% 3/22/17 | | | 4,165,000 | | | 4,410,623 |
| 4.10% 7/24/23 | | | 6,250,000 | | | 6,266,025 |
| •5.20% 12/29/49 | | | 8,305,000 | | | 7,516,025 |
| • | Bank of New York Mellon 4.50% 12/31/49 | | | 5,020,000 | | | 4,687,425 |
| * | Barclays Bank 7.625% 11/21/22 | | | 7,700,000 | | | 7,680,750 |
| # | BBVA Banco Continental 144A 3.25% 4/8/18 | | | 3,010,000 | | | 2,942,275 |
| BBVA U.S. Senior 4.664% 10/9/15 | | | 7,400,000 | | | 7,642,579 |
| City National 5.25% 9/15/20 | | | 1,870,000 | | | 2,020,165 |
| • | Deutsche Bank 4.296% 5/24/28 | | | 3,600,000 | | | 3,275,557 |
| • | Fifth Third Bancorp 5.10% 12/31/49 | | | 3,210,000 | | | 3,041,475 |
| • | Fifth Third Capital Trust IV 6.50% 4/15/37 | | | 3,855,000 | | | 3,869,456 |
| * | Goldman Sachs Group 2.90% 7/19/18 | | | 5,000,000 | | | 5,014,605 |
| #• | HBOS Capital Funding 144A 6.071% 6/29/49 | | | 8,900,000 | | | 8,588,500 |
16
| | | Principal amount° | | | Value (U.S. $) |
| Corporate Bonds (continued) | | | | | | |
| Banking (continued) | | | | | | |
| • | JPMorgan Chase | | | | | | |
| 5.15% 12/29/49 | USD | | 4,900,000 | | $ | 4,569,250 |
| 6.00% 12/29/49 | | | 1,515,000 | | | 1,494,169 |
| Morgan Stanley 4.10% 5/22/23 | | | 10,520,000 | | | 9,895,491 |
| • | National City Bank 0.644% 6/7/17 | | | 2,030,000 | | | 1,987,847 |
| PNC Bank 6.875% 4/1/18 | | | 3,051,000 | | | 3,670,341 |
| • | PNC Financial Services Group | | | | | | |
| 4.494% 5/29/49 | | | 3,112,000 | | | 3,115,890 |
| 4.85% 5/29/49 | | | 4,960,000 | | | 4,526,000 |
| Regions Financial 2.00% 5/15/18 | | | 7,660,000 | | | 7,382,402 |
| * | Royal Bank of Scotland Group 6.10% 6/10/23 | | | 1,720,000 | | | 1,652,464 |
| # | Standard Chartered 144A 3.95% 1/11/23 | | | 12,910,000 | | | 12,142,680 |
| SVB Financial Group 5.375% 9/15/20 | | | 3,785,000 | | | 4,142,584 |
| UBS 7.625% 8/17/22 | | | 10,235,000 | | | 11,405,535 |
| *• | USB Capital IX 3.50% 10/29/49 | | | 5,707,000 | | | 5,079,230 |
| #• | USB Realty 144A 1.415% 12/22/49 | | | 400,000 | | | 348,000 |
| • | Wachovia 0.638% 10/15/16 | | | 2,730,000 | | | 2,695,506 |
| Zions Bancorp | | | | | | |
| 4.50% 3/27/17 | | | 2,400,000 | | | 2,547,521 |
| 4.50% 6/13/23 | | | 4,695,000 | | | 4,669,539 |
| 5.50% 11/16/15 | | | 1,823,000 | | | 1,899,045 |
| 7.75% 9/23/14 | | | 3,646,000 | | | 3,903,007 |
| | | | | | | 158,627,162 |
| Basic Industry – 8.78% | | | | | | |
| ArcelorMittal 10.35% 6/1/19 | | | 3,390,000 | | | 4,110,375 |
| # | Barrick Gold 144A | | | | | | |
| 2.50% 5/1/18 | | | 4,000,000 | | | 3,715,920 |
| 4.10% 5/1/23 | | | 4,000,000 | | | 3,408,612 |
| CF Industries | | | | | | |
| 6.875% 5/1/18 | | | 9,165,000 | | | 10,826,229 |
| 7.125% 5/1/20 | | | 4,200,000 | | | 5,007,009 |
| | Clearwater Paper 4.50% 2/1/23 | | | 7,060,000 | | | 6,707,000 |
| Dow Chemical 8.55% 5/15/19 | | | 4,420,000 | | | 5,694,131 |
| # | Freeport-McMoRan Copper & Gold 144A | | | | | | |
| 3.875% 3/15/23 | | | 2,175,000 | | | 1,971,618 |
| Georgia-Pacific 8.00% 1/15/24 | | | 11,345,000 | | | 14,737,053 |
| # | Gerdau Trade 144A 4.75% 4/15/23 | | | 5,520,000 | | | 5,050,800 |
| # | Glencore Funding 144A 2.50% 1/15/19 | | | 9,390,000 | | | 8,626,095 |
17
Statements of net assets
Delaware Corporate Bond Fund
| | | Principal amount° | | | Value (U.S. $) |
| Corporate Bonds (continued) | | | | | | |
| Basic Industry (continued) | | | | | | |
| International Paper | | | | | | |
| 6.00% 11/15/41 | USD | | 5,530,000 | | $ | 6,080,594 |
| 9.375% 5/15/19 | | | 1,151,000 | | | 1,524,099 |
| Lubrizol | | | | | | |
| 5.50% 10/1/14 | | | 2,105,000 | | | 2,227,524 |
| 8.875% 2/1/19 | | | 2,765,000 | | | 3,677,851 |
| LYB International Finance 4.00% 7/15/23 | | | 8,500,000 | | | 8,452,757 |
| Nucor 4.00% 8/1/23 | | | 2,985,000 | | | 2,944,273 |
| Plains Exploration & Production 6.50% 11/15/20 | | | 8,315,000 | | | 8,959,038 |
| Rock Tenn | | | | | | |
| 3.50% 3/1/20 | | | 2,200,000 | | | 2,170,918 |
| 4.00% 3/1/23 | | | 7,775,000 | | | 7,499,602 |
| # | Sappi Papier Holding 144A 6.625% 4/15/21 | | | 7,845,000 | | | 7,629,263 |
| # | Taminco Global Chemical 144A 9.75% 3/31/20 | | | 2,310,000 | | | 2,616,075 |
| * | Teck Resources 3.75% 2/1/23 | | | 6,780,000 | | | 6,146,633 |
| | | | | | | 129,783,469 |
| Brokerage – 1.77% | | | | | | |
| E Trade Financial 6.375% 11/15/19 | | | 3,500,000 | | | 3,736,250 |
| Jefferies Group | | | | | | |
| 5.125% 1/20/23 | | | 1,570,000 | | | 1,591,902 |
| 6.45% 6/8/27 | | | 5,627,000 | | | 5,841,141 |
| 6.50% 1/20/43 | | | 1,575,000 | | | 1,579,089 |
| Lazard Group 6.85% 6/15/17 | | | 8,495,000 | | | 9,508,690 |
| # | Nuveen Investments 144A 9.50% 10/15/20 | | | 3,765,000 | | | 3,830,888 |
| | | | | | | 26,087,960 |
| Capital Goods – 2.50% | | | | | | |
| # | Algeco Scotsman Global Finance 144A | | | | | | |
| 8.50% 10/15/18 | | | 1,775,000 | | | 1,837,125 |
| 10.75% 10/15/19 | | | 8,880,000 | | | 8,302,800 |
| # | Cemex 144A 9.50% 6/15/18 | | | 4,120,000 | | | 4,624,700 |
| # | Cemex Espana Luxembourg 144A 9.25% 5/12/20 | | | 5,095,000 | | | 5,591,763 |
| # | Ingersoll-Rand Global Holding 144A 4.25% 6/15/23 | | | 10,085,000 | | | 10,077,961 |
| # | Sealed Air 144A 5.25% 4/1/23 | | | 1,845,000 | | | 1,798,875 |
| United Rentals North America 10.25% 11/15/19 | | | 935,000 | | | 1,065,900 |
| # | Votorantim Cimentos 144A 7.25% 4/5/41 | | | 3,840,000 | | | 3,648,000 |
| | | | | | | 36,947,124 |
18
| | | | Principal amount° | | Value (U.S. $) |
| Corporate Bonds (continued) | | | | | | | |
| Communications – 9.19% | | | | | | | |
| # | American Tower Trust I 144A | | | | | | | |
| 1.551% 3/15/18 | | USD | | 2,660,000 | | $ | 2,597,509 |
| 3.07% 3/15/23 | | | | 7,550,000 | | | 7,213,345 |
| # | Brasil Telecom 144A 5.75% 2/10/22 | | | | 6,604,000 | | | 6,191,249 |
| #* | Clearwire Communications 144A | | | | | | | |
| 12.00% 12/1/15 | | | | 2,830,000 | | | 3,006,875 |
| # | Crown Castle Towers 144A | | | | | | | |
| 4.883% 8/15/20 | | | | 4,360,000 | | | 4,645,733 |
| CSC Holdings 6.75% 11/15/21 | | | | 2,495,000 | | | 2,744,500 |
| # | Digicel 144A 6.00% 4/15/21 | | | | 3,955,000 | | | 3,885,788 |
| # | Digicel Group 144A 10.50% 4/15/18 | | | | 775,000 | | | 844,750 |
| DISH DBS 5.875% 7/15/22 | | | | 1,700,000 | | | 1,704,250 |
| # | Intelsat Luxembourg 144A | | | | | | | |
| 7.75% 6/1/21 | | | | 5,290,000 | | | 5,587,563 |
| 8.125% 6/1/23 | | | | 2,275,000 | | | 2,454,156 |
| # | Lynx I 144A 5.375% 4/15/21 | | | | 635,000 | | | 646,113 |
| # | MDC Partners 144A 6.75% 4/1/20 | | | | 3,880,000 | | | 3,996,400 |
| #* | Millicom International Cellular 144A | | | | | | | |
| 4.75% 5/22/20 | | | | 2,000,000 | | | 1,945,000 |
| # | Nara Cable Funding 144A 8.875% 12/1/18 | | | | 7,005,000 | | | 7,390,275 |
| Qwest 6.75% 12/1/21 | | | | 3,430,000 | | | 3,844,594 |
| # | SBA Tower Trust 144A 2.24% 4/16/18 | | | | 4,945,000 | | | 4,884,115 |
| # | SES 144A 3.60% 4/4/23 | | | | 9,145,000 | | | 8,697,946 |
| # | Softbank 144A 4.50% 4/15/20 | | | | 4,455,000 | | | 4,311,326 |
| Sprint Capital 6.875% 11/15/28 | | | | 990,000 | | | 915,750 |
| # | Sprint Nextel 144A 7.00% 3/1/20 | | | | 2,540,000 | | | 2,781,300 |
| #* | TBG Global Pte 144A 4.625% 4/3/18 | | | | 2,525,000 | | | 2,493,438 |
| # | Telefonica Chile 144A 3.875% 10/12/22 | | | | 4,320,000 | | | 3,982,889 |
| Telefonica Emisiones 3.192% 4/27/18 | | | | 16,750,000 | | | 16,565,129 |
| Time Warner Cable | | | | | | | |
| 5.85% 5/1/17 | | | | 3,250,000 | | | 3,552,695 |
| 8.25% 4/1/19 | | | | 4,481,000 | | | 5,222,364 |
| # | Univision Communications 144A 8.50% 5/15/21 | | | | 7,740,000 | | | 8,552,700 |
| # | VimpelCom 144A 7.748% 2/2/21 | | | | 2,940,000 | | | 3,145,800 |
| Virgin Media Secured Finance 6.50% 1/15/18 | | | | 8,065,000 | | | 8,448,088 |
| # | Wind Acquisition Finance 144A | | | | | | | |
| 7.25% 2/15/18 | | | | 940,000 | | | 972,900 |
| 11.75% 7/15/17 | | | | 2,445,000 | | | 2,591,700 |
| | | | | | | | 135,816,240 |
19
Statements of net assets
Delaware Corporate Bond Fund
| | | | Principal amount° | | Value (U.S. $) |
| Corporate Bonds (continued) | | | | | | | |
| Consumer Cyclical – 7.53% | | | | | | | |
| ADT 4.125% 6/15/23 | | USD | | 7,215,000 | | $ | 6,214,503 |
| Chrysler Group 8.25% 6/15/21 | | | | 3,475,000 | | | 3,883,313 |
| Corrections Corporation of America 4.625% 5/1/23 | | | | 9,270,000 | | | 9,084,600 |
| # | Daimler Finance North America 144A | | | | | | | |
| 2.25% 7/31/19 | | | | 11,595,000 | | | 11,361,094 |
| Ford Motor Credit | | | | | | | |
| 5.00% 5/15/18 | | | | 4,780,000 | | | 5,194,101 |
| 5.875% 8/2/21 | | | | 7,985,000 | | | 8,868,828 |
| # | Geo Group 144A 5.125% 4/1/23 | | | | 4,050,000 | | | 3,928,500 |
| Historic TW 6.875% 6/15/18 | | | | 5,285,000 | | | 6,405,404 |
| Host Hotels & Resorts | | | | | | | |
| 3.75% 10/15/23 | | | | 5,060,000 | | | 4,705,623 |
| 4.75% 3/1/23 | | | | 3,825,000 | | | 3,862,856 |
| 5.25% 3/15/22 | | | | 4,520,000 | | | 4,716,195 |
| 5.875% 6/15/19 | | | | 2,055,000 | | | 2,213,477 |
| # | Jaguar Land Rover Automotive 144A 5.625% 2/1/23 | | | | 1,595,000 | | | 1,571,075 |
| MGM Resorts International 11.375% 3/1/18 | | | | 1,530,000 | | | 1,943,100 |
| # | Quiksilver 144A 7.875% 8/1/18 | | | | 1,550,000 | | | 1,627,500 |
| # | QVC 144A 4.375% 3/15/23 | | | | 14,980,000 | | | 14,317,690 |
| Ryland Group 8.40% 5/15/17 | | | | 358,000 | | | 417,070 |
| # | SACI Falabella 144A 3.75% 4/30/23 | | | | 3,835,000 | | | 3,521,588 |
| Western Union 2.875% 12/10/17 | | | | 6,425,000 | | | 6,474,318 |
| Wyndham Worldwide 3.90% 3/1/23 | | | | 6,635,000 | | | 6,318,849 |
| # | Wynn Las Vegas 144A 4.25% 5/30/23 | | | | 5,060,000 | | | 4,699,475 |
| | | | | | | | 111,329,159 |
| Consumer Non-Cyclical – 3.82% | | | | | | | |
| # | ARAMARK 144A 5.75% 3/15/20 | | | | 2,755,000 | | | 2,878,975 |
| # | BRF 144A 3.95% 5/22/23 | | | | 3,490,000 | | | 3,010,125 |
| Constellation Brands | | | | | | | |
| 3.75% 5/1/21 | | | | 2,155,000 | | | 2,020,313 |
| 4.25% 5/1/23 | | | | 820,000 | | | 774,900 |
| Energizer Holding 4.70% 5/24/22 | | | | 10,200,000 | | | 10,317,963 |
| # | ESAL 144A 6.25% 2/5/23 | | | | 4,675,000 | | | 4,312,688 |
| Fomento Economico Mexicano 4.375% 5/10/43 | | | | 4,920,000 | | | 4,243,751 |
| HCA Holdings 7.75% 5/15/21 | | | | 1,155,000 | | | 1,258,950 |
| # | Heinz (H.J.) Finance 144A 7.125% 8/1/39 | | | | 2,105,000 | | | 2,204,988 |
| # | Pernod-Ricard 144A 5.75% 4/7/21 | | | | 16,775,000 | | | 18,935,334 |
| # | Want Want China Finance 144A 1.875% 5/14/18 | | | | 6,800,000 | | | 6,472,709 |
| | | | | | | | 56,430,696 |
20
| | | | Principal amount° | | Value (U.S. $) |
| Corporate Bonds (continued) | | | | | | | |
| Electric – 12.82% | | | | | | | |
| AES 7.375% 7/1/21 | | USD | | 5,035,000 | | $ | 5,714,725 |
| Ameren Illinois 9.75% 11/15/18 | | | | 7,971,000 | | | 10,756,554 |
| # | APT Pipelines 144A 3.875% 10/11/22 | | | | 10,325,000 | | | 9,586,732 |
| CenterPoint Energy 5.95% 2/1/17 | | | | 5,155,000 | | | 5,872,236 |
| ComEd Financing III 6.35% 3/15/33 | | | | 7,500,000 | | | 7,463,003 |
| El Paso Electric 3.30% 12/15/22 | | | | 2,830,000 | | | 2,672,610 |
| #• | Electricite de France 144A 5.25% 12/29/49 | | | | 12,400,000 | | | 11,879,236 |
| # | Enel Finance International 144A 6.25% 9/15/17 | | | | 10,785,000 | | | 11,839,017 |
| Entergy Louisiana 3.30% 12/1/22 | | | | 2,780,000 | | | 2,703,970 |
| Exelon Generation 4.25% 6/15/22 | | | | 10,065,000 | | | 10,132,395 |
| Great Plains Energy | | | | | | | |
| 4.85% 6/1/21 | | | | 2,720,000 | | | 2,932,884 |
| 5.292% 6/15/22 | | | | 9,735,000 | | | 10,666,464 |
| • | Integrys Energy Group 6.11% 12/1/66 | | | | 11,239,000 | | | 11,809,805 |
| LG&E & KU Energy | | | | | | | |
| 3.75% 11/15/20 | | | | 2,120,000 | | | 2,170,388 |
| 4.375% 10/1/21 | | | | 3,850,000 | | | 3,985,166 |
| • | National Rural Utilities Cooperative Finance | | | | | | | |
| 4.75% 4/30/43 | | | | 8,455,000 | | | 8,180,212 |
| • | NextEra Energy Capital Holdings | | | | | | | |
| 6.35% 10/1/66 | | | | 5,145,000 | | | 5,354,607 |
| 6.65% 6/15/67 | | | | 6,105,000 | | | 6,446,245 |
| NV Energy 6.25% 11/15/20 | | | | 4,475,000 | | | 5,283,825 |
| Pennsylvania Electric 5.20% 4/1/20 | | | | 16,291,000 | | | 17,802,234 |
| • | PPL Capital Funding 6.70% 3/30/67 | | | | 3,095,000 | | | 3,221,394 |
| • | Puget Sound Energy 6.974% 6/1/67 | | | | 8,395,000 | | | 8,784,243 |
| # | Saudi Electricity Global Sukuk 144A 3.473% 4/8/23 | | | | 9,100,000 | | | 8,667,750 |
| System Energy Resources 4.10% 4/1/23 | | | | 4,610,000 | | | 4,584,977 |
| • | Wisconsin Energy 6.25% 5/15/67 | | | | 10,359,000 | | | 10,912,005 |
| | | | | | | | 189,422,677 |
| Energy – 4.06% | | | | | | | |
| Chesapeake Energy 5.75% 3/15/23 | | | | 2,960,000 | | | 2,989,600 |
| CNOOC Finance 2013 3.00% 5/9/23 | | | | 3,735,000 | | | 3,407,564 |
| Continental Resources 4.50% 4/15/23 | | | | 1,785,000 | | | 1,740,375 |
| # | Gazprom 144A 4.375% 9/19/22 | | | | 4,215,000 | | | 3,920,793 |
| Halliburton 3.50% 8/1/23 | | | | 5,550,000 | | | 5,546,171 |
| Laredo Petroleum 9.50% 2/15/19 | | | | 2,825,000 | | | 3,149,875 |
| Newfield Exploration 5.625% 7/1/24 | | | | 6,150,000 | | | 6,180,749 |
| Noble Holding International 3.95% 3/15/22 | | | | 4,195,000 | | | 4,120,233 |
21
Statements of net assets
Delaware Corporate Bond Fund
| | | | Principal amount° | | Value (U.S. $) |
| Corporate Bonds (continued) | | | | | | | |
| Energy (continued) | | | | | | | |
| # | Pertamina Persero 144A | | | | | | | |
| 4.30% 5/20/23 | | USD | | 1,055,000 | | $ | 952,138 |
| 4.875% 5/3/22 | | | | 5,645,000 | | | 5,376,863 |
| Petrobras Global Finance 3.00% 1/15/19 | | | | 6,305,000 | | | 5,870,415 |
| Petrohawk Energy 7.25% 8/15/18 | | | | 3,045,000 | | | 3,341,888 |
| # | Petroleos Mexicanos 144A 5.50% 6/27/44 | | | | 2,486,000 | | | 2,283,391 |
| # | Sinopec Capital 2013 144A 1.875% 4/24/18 | | | | 815,000 | | | 789,839 |
| Talisman Energy | | | | | | | |
| 3.75% 2/1/21 | | | | 7,340,000 | | | 7,378,938 |
| 5.50% 5/15/42 | | | | 2,955,000 | | | 2,984,742 |
| | | | | | | | 60,033,574 |
| Finance Companies – 2.67% | | | | | | | |
| FTI Consulting 6.75% 10/1/20 | | | | 975,000 | | | 1,042,031 |
| General Electric Capital | | | | | | | |
| 2.10% 12/11/19 | | | | 1,020,000 | | | 999,333 |
| #144A 3.80% 6/18/19 | | | | 3,795,000 | | | 3,974,628 |
| 4.375% 9/16/20 | | | | 500,000 | | | 532,568 |
| 6.00% 8/7/19 | | | | 1,120,000 | | | 1,306,999 |
| •6.25% 12/15/49 | | | | 3,200,000 | | | 3,341,802 |
| •7.125% 12/15/49 | | | | 4,000,000 | | | 4,507,528 |
| #• | ILFC E-Capital Trust I 144A 4.96% 12/21/65 | | | | 5,400,000 | | | 4,643,999 |
| #• | ILFC E-Capital Trust II 144A 6.25% 12/21/65 | | | | 3,065,000 | | | 2,842,788 |
| International Lease Finance 5.875% 4/1/19 | | | | 1,625,000 | | | 1,706,250 |
| # | IPIC GMTN 144A 5.50% 3/1/22 | | | | 3,544,000 | | | 3,836,379 |
| PHH | | | | | | | |
| 7.375% 9/1/19 | | | | 1,250,000 | | | 1,376,563 |
| 9.25% 3/1/16 | | | | 2,810,000 | | | 3,189,350 |
| # | Temasek Financial I 144A 2.375% 1/23/23 | | | | 6,750,000 | | | 6,111,855 |
| | | | | | | | 39,412,073 |
| Insurance – 6.36% | | | | | | | |
| American International Group | | | | | | | |
| 6.40% 12/15/20 | | | | 5,500,000 | | | 6,500,153 |
| •8.175% 5/15/58 | | | | 2,675,000 | | | 3,283,563 |
| 8.25% 8/15/18 | | | | 5,575,000 | | | 6,990,314 |
| • | Chubb 6.375% 3/29/67 | | | | 6,606,000 | | | 7,184,025 |
| # | Highmark 144A | | | | | | | |
| 4.75% 5/15/21 | | | | 1,685,000 | | | 1,598,780 |
| 6.125% 5/15/41 | | | | 920,000 | | | 826,025 |
22
| | | | Principal amount° | | Value (U.S. $) |
| Corporate Bonds (continued) | | | | | | | |
| Insurance (continued) | | | | | | | |
| *• | ING Groep 5.775% 12/29/49 | | USD | | 4,765,000 | | $ | 4,765,000 |
| # | ING US 144A | | | | | | | |
| •5.65% 5/15/53 | | | | 3,000,000 | | | 2,827,500 |
| 5.70% 7/15/43 | | | | 1,200,000 | | | 1,203,468 |
| # | Liberty Mutual Group 144A | | | | | | | |
| 4.25% 6/15/23 | | | | 7,430,000 | | | 7,301,476 |
| 4.95% 5/1/22 | | | | 4,370,000 | | | 4,536,646 |
| •7.00% 3/15/37 | | | | 2,775,000 | | | 2,879,063 |
| MetLife 1.756% 12/15/17 | | | | 1,356,000 | | | 1,344,673 |
| # | MetLife Capital Trust X 144A 9.25% 4/8/38 | | | | 5,780,000 | | | 7,716,300 |
| # | Metropolitan Life Global Funding I 144A | | | | | | | |
| 3.00% 1/10/23 | | | | 2,960,000 | | | 2,826,252 |
| 3.875% 4/11/22 | | | | 3,075,000 | | | 3,144,769 |
| # | Pacific LifeCorp 144A 5.125% 1/30/43 | | | | 7,815,000 | | | 7,378,993 |
| *• | Prudential Financial 5.625% 6/15/43 | | | | 8,000,000 | | | 7,780,000 |
| • | XL Group 6.50% 12/29/49 | | | | 8,032,000 | | | 7,931,599 |
| #• | ZFS Finance USA Trust II 144A 6.45% 12/15/65 | | | | 5,565,000 | | | 5,968,463 |
| | | | | | | | 93,987,062 |
| Natural Gas – 7.16% | | | | | | | |
| #• | DCP Midstream 144A 5.85% 5/21/43 | | | | 10,810,000 | | | 10,377,600 |
| El Paso Pipeline Partners Operating 6.50% 4/1/20 | | | | 8,703,000 | | | 10,175,696 |
| *• | Enbridge Energy Partners 8.05% 10/1/37 | | | | 6,970,000 | | | 7,915,724 |
| Energy Transfer Partners 5.15% 2/1/43 | | | | 4,910,000 | | | 4,592,922 |
| Enterprise Products Operating | | | | | | | |
| •7.034% 1/15/68 | | | | 4,525,000 | | | 5,084,209 |
| 9.75% 1/31/14 | | | | 1,999,000 | | | 2,085,988 |
| Kinder Morgan Energy Partners | | | | | | | |
| 2.65% 2/1/19 | | | | 5,490,000 | | | 5,527,442 |
| 4.15% 2/1/24 | | | | 5,545,000 | | | 5,545,826 |
| 9.00% 2/1/19 | | | | 2,805,000 | | | 3,610,456 |
| # | Korea Gas 144A 2.875% 7/29/18 | | | | 6,425,000 | | | 6,430,313 |
| National Fuel Gas 3.75% 3/1/23 | | | | 11,110,000 | | | 10,788,688 |
| NiSource Finance 4.80% 2/15/44 | | | | 9,870,000 | | | 9,183,917 |
| Sunoco Logistics Partners Operations 3.45% 1/15/23 | | | | 5,850,000 | | | 5,502,750 |
| • | TransCanada Pipelines 6.35% 5/15/67 | | | | 9,152,000 | | | 9,615,036 |
| Williams Partners 7.25% 2/1/17 | | | | 8,087,000 | | | 9,416,867 |
| | | | | | | | 105,853,434 |
23
Statements of net assets
Delaware Corporate Bond Fund
| | | | Principal amount° | | Value (U.S. $) |
| Corporate Bonds (continued) | | | | | | |
| Real Estate Investment Trusts – 2.31% | | | | | | |
| # | Corporate Office Properties 144A | | | | | | |
| 3.60% 5/15/23 | | USD | 4,500,000 | | $ | 4,176,018 |
| DDR | | | | | | |
| 7.50% 4/1/17 | | | 2,500,000 | | | 2,932,423 |
| 7.875% 9/1/20 | | | 1,125,000 | | | 1,389,754 |
| 9.625% 3/15/16 | | | 1,415,000 | | | 1,693,297 |
| Digital Realty Trust | | | | | | |
| 5.25% 3/15/21 | | | 5,535,000 | | | 5,811,296 |
| 5.875% 2/1/20 | | | 1,680,000 | | | 1,832,573 |
| Duke Realty 3.625% 4/15/23 | | | 7,230,000 | | | 6,764,851 |
| Realty Income 4.65% 8/1/23 | | | 4,570,000 | | | 4,689,464 |
| Weingarten Realty Investors 3.50% 4/15/23 | | | 5,150,000 | | | 4,818,731 |
| | | | | | | 34,108,407 |
| Technology – 4.01% | | | | | | |
| #* | Avaya 144A 10.50% 3/1/21 | | | 1,055,000 | | | 814,988 |
| Baidu | | | | | | |
| 3.25% 8/6/18 | | | 5,250,000 | | | 5,274,344 |
| 3.50% 11/28/22 | | | 6,500,000 | | | 5,966,194 |
| Equinix | | | | | | |
| 4.875% 4/1/20 | | | 4,931,000 | | | 4,906,345 |
| 5.375% 4/1/23 | | | 1,577,000 | | | 1,573,058 |
| Fidelity National Information Services | | | | | | |
| 3.50% 4/15/23 | | | 12,655,000 | | | 11,689,410 |
| * | First Data 11.25% 3/31/16 | | | 2,360,000 | | | 2,360,000 |
| GXS Worldwide 9.75% 6/15/15 | | | 1,610,000 | | | 1,657,294 |
| National Semiconductor 6.60% 6/15/17 | | | 6,644,000 | | | 7,823,788 |
| NetApp 3.25% 12/15/22 | | | 2,645,000 | | | 2,444,644 |
| # | NXP Funding 144A 5.75% 3/15/23 | | | 1,955,000 | | | 1,979,438 |
| Oracle 2.375% 1/15/19 | | | 4,310,000 | | | 4,344,889 |
| Total System Services | | | | | | |
| 2.375% 6/1/18 | | | 1,320,000 | | | 1,285,140 |
| 3.75% 6/1/23 | | | 7,670,000 | | | 7,136,874 |
| | | | | | | 59,256,406 |
| Transportation – 0.69% | | | | | | |
| # | ERAC USA Finance 144A 2.80% 11/1/18 | | | 3,000,000 | | | 3,004,962 |
| United Parcel Service 5.125% 4/1/19 | | | 6,225,000 | | | 7,168,019 |
| | | | | | | 10,172,981 |
| Total Corporate Bonds (cost $1,234,654,192) | | | | | | 1,247,268,424 |
24
| | | | Principal amount° | | Value (U.S. $) |
| Municipal Bonds – 5.09% | | | | | | | |
| California (Various Purposes) | | | | | | | |
| 5.00% 4/1/42 | | USD | | 2,330,000 | | $ | 2,364,228 |
| 5.00% 4/1/43 | | | | 6,520,000 | | | 6,624,515 |
| Commonwealth of Pennsylvania 1st Series | | | | | | | |
| 5.00% 4/1/22 | | | | 5,415,000 | | | 6,362,463 |
| 5.00% 4/1/24 | | | | 3,500,000 | | | 4,059,580 |
| Golden State, California Tobacco Securitization | | | | | | | |
| Settlement Revenue (Asset-Backed Senior) | | | | | | | |
| Series A-1 | | | | | | | |
| 5.125% 6/1/47 | | | | 1,950,000 | | | 1,392,475 |
| 5.75% 6/1/47 | | | | 1,255,000 | | | 980,030 |
| Grand Parkway, Texas Transportation Revenue | | | | | | | |
| (Sub Tier Toll) Series B 5.00% 4/1/53 | | | | 2,305,000 | | | 2,239,054 |
| Hawaii Series EE 5.00% 11/1/22 | | | | 2,430,000 | | | 2,858,531 |
| Los Angeles, California Department of Water & | | | | | | | |
| Power Revenue Taxable Build America Bond | | | | | | | |
| 6.574% 7/1/45 | | | | 5,365,000 | | | 6,832,542 |
| Metropolitan Transportation Authority, New York | | | | | | | |
| Revenue Taxable Build America Bond (Dedicated | | | | | | | |
| Tax Fund) Series C-1 6.687% 11/15/40 | | | | 4,500,000 | | | 5,324,355 |
| New Jersey State Turnpike Authority Revenue | | | | | | | |
| Series A 5.00% 1/1/43 | | | | 3,440,000 | | | 3,501,782 |
| New York City Water & Sewer System | | | | | | | |
| (Second Generation) | | | | | | | |
| Series BB 5.00% 6/15/47 | | | | 7,550,000 | | | 7,754,302 |
| Series EE 5.00% 6/15/47 | | | | 2,100,000 | | | 2,159,220 |
| Prince George’s County, Maryland (Consolidated | | | | | | | |
| Public Improvement) Series C | | | | | | | |
| 5.00% 8/1/22 | | | | 5,085,000 | | | 6,085,830 |
| 5.00% 8/1/23 | | | | 3,440,000 | | | 4,133,814 |
| San Francisco Bay Area Toll Authority, California Toll | | | | | | | |
| Bridge Revenue Taxable Build America Bond | | | | | | | |
| Series S3 6.907% 10/1/50 | | | | 3,575,000 | | | 4,465,390 |
| Triborough Bridge & Tunnel Authority, New York | | | | | | | |
| Revenue Taxable Build America Bond | | | | | | | |
| Series A-2 5.45% 11/15/32 | | | | 5,560,000 | | | 6,029,208 |
| Wake County, North Carolina | | | | | | | |
| Series C 5.00% 3/1/22 | | | | 1,755,000 | | | 2,093,592 |
| Total Municipal Bonds (cost $73,714,607) | | | | | | | 75,260,911 |
25
Statements of net assets
Delaware Corporate Bond Fund
| | | | Principal amount° | | Value (U.S. $) |
| «Senior Secured Loans – 1.22% | | | | | | | |
| Burlington Coat Factory Tranche B2 4.25% 2/23/17 | | USD | | 1,488,845 | | $ | 1,500,004 |
| Chrysler Group Tranche B 4.25% 5/24/17 | | | | 1,665,751 | | | 1,695,491 |
| Clear Channel Communications Tranche B | | | | | | | |
| 3.65% 1/29/16 | | | | 8,675,000 | | | 8,152,089 |
| Essar Steel Algoma 8.75% 9/20/14 | | | | 1,796,425 | | | 1,835,348 |
| Immucor 5.00% 8/19/18 | | | | 1,753,941 | | | 1,773,672 |
| Nuveen Investments 2nd Lien 6.50% 2/28/19 | | | | 1,335,000 | | | 1,339,172 |
| Zayo Group Tranche B 1st Lien 4.50% 7/2/19 | | | | 1,721,955 | | | 1,738,907 |
| Total Senior Secured Loans | | | | | | | |
| (cost $17,719,343) | | | | | | | 18,034,683 |
| |
| | | Number of shares | | | |
| Common Stock – 0.00% | | | | | | | |
| Masco | | | | 251 | | | 5,151 |
| † | United Continental Holdings | | | | 40 | | | 1,394 |
| Total Common Stock (cost $1,783) | | | | | | | 6,545 |
| |
| Convertible Preferred Stock – 0.59% | | | | | | | |
| # | Chesapeake Energy 144A 5.75% exercise price | | | | | | | |
| $27.83, expiration date 12/31/49 | | | | 8,100 | | | 8,687,250 |
| Total Convertible Preferred Stock | | | | | | | |
| (cost $8,383,500) | | | | | | | 8,687,250 |
| |
| Preferred Stock – 5.37% | | | | | | | |
| Alabama Power 5.625% | | | | 118,065 | | | 2,911,483 |
| Ally Financial | | | | | | | |
| #144A 7.00% | | | | 4,000 | | | 3,962,500 |
| •8.50% | | | | 80,000 | | | 2,091,200 |
| BB&T | | | | | | | |
| 5.20% | | | | 51,525 | | | 1,270,091 |
| 5.85% | | | | 288,000 | | | 6,563,520 |
| * | City National 5.50% | | | | 168,200 | | | 3,951,018 |
| CoBank 6.125% | | | | 39,500 | | | 3,942,594 |
| Digital Realty Trust 5.875% | | | | 168,000 | | | 3,628,800 |
| * | DTE Energy 5.25% | | | | 305,000 | | | 7,118,700 |
| * | Entergy Arkansas 4.90% | | | | 285,000 | | | 5,873,850 |
| General Electric Capital 4.875% | | | | 252,000 | | | 5,551,560 |
| • | GMAC Capital Trust I 8.25% | | | | 50,000 | | | 1,327,500 |
| JPMorgan Chase 5.50% | | | | 75,000 | | | 1,727,250 |
26
| | | | Number of shares | | Value (U.S. $) |
| Preferred Stock (continued) | | | | | |
| National Retail Properties 5.70% | | 147,525 | | $ | 3,276,530 |
| Public Storage 5.20% | | 330,000 | | | 7,190,699 |
| Qwest 6.125% | | 184,675 | | | 4,162,575 |
| Regency Centers 6.625% | | 22,363 | | | 559,299 |
| Regions Financial 6.375% | | 67,000 | | | 1,650,210 |
| U.S. Bancorp | | | | | |
| *5.15% | | 121,000 | | | 2,822,930 |
| •6.00% | | 45,000 | | | 1,199,250 |
| •6.50% | | 44,000 | | | 1,185,360 |
| Wells Fargo | | | | | |
| 5.125% | | 145,000 | | | 3,198,700 |
| *5.20% | | 190,000 | | | 4,223,700 |
| Total Preferred Stock | | | | | |
| (cost $85,253,756) | | | | | 79,389,319 |
| |
| | | Number of contracts | | | |
| Options Purchased – 0.62% | | | | | |
| Put Swaptions – 0.62% | | | | | |
| Pay a fixed rate 2.47% and receive a floating rate based | | | | | |
| on 3-month LIBOR, expiration date 11/16/15 (BAML) | | 9,300,000 | | | 1,125,506 |
| Pay a fixed rate 3.54% and receive a floating rate based | | | | | |
| on 3-month LIBOR, expiration date 4/3/18 (BAML) | | 8,400,000 | | | 1,541,387 |
| Pay a fixed rate 3.65% and receive a floating rate based | | | | | |
| on 3-month LIBOR, expiration date 11/16/15 (BAML) | | 9,300,000 | | | 832,469 |
| Pay a fixed rate 3.84% and receive a floating rate based | | | | | |
| on 3-month LIBOR, expiration date 7/1/16 (BCLY) | | 15,750,000 | | | 982,639 |
| Pay a fixed rate 4.00% and receive a floating rate based | | | | | |
| on 3-month LIBOR, expiration date 5/23/17 (GSC) | | 19,100,000 | | | 1,340,709 |
| Pay a fixed rate 4.09% and receive a floating rate based | | | | | |
| on 3-month LIBOR, expiration date 2/7/18 (GSC) | | 21,300,000 | | | 2,715,920 |
| Pay a fixed rate 4.34% and receive a floating rate based | | | | | |
| on 3-month LIBOR, expiration date 7/1/16 (BCLY) | | 15,750,000 | | | 703,923 |
| Total Options Purchased | | | | | |
| (premium paid $6,232,308) | | | | | 9,242,553 |
27
Statements of net assets
Delaware Corporate Bond Fund
| | | | Principal amount° | | Value (U.S. $) | |
| Short-Term Investments – 0.11% | | | | | | | | |
| ≠Discount Notes – 0.07% | | | | | | | | |
| Federal Home Loan Bank | | | | | | | | |
| 0.06% 8/14/13 | | USD | | 585,917 | | $ | 585,915 | |
| 0.06% 8/16/13 | | | | 192,453 | | | 192,452 | |
| 0.06% 8/21/13 | | | | 243,611 | | | 243,610 | |
| | | | | | | | 1,021,977 | |
| ≠U.S. Treasury Obligation – 0.04% | | | | | | | | |
| U.S. Treasury Bill 0.045% 9/26/13 | | | | 557,900 | | | 557,876 | |
| | | | | | | | 557,876 | |
| Total Short-Term Investments | | | | | | | | |
| (cost $1,579,817) | | | | | | | 1,579,853 | |
| |
| Total Value of Securities Before Securities | | | | | | | | |
| Lending Collateral – 99.63% | | | | | | | | |
| (cost $1,457,478,100) | | | | | | | 1,472,382,012 | |
| | |
| | | Number of shares | | | | |
| **Securities Lending Collateral – 0.03% | | | | | | | | |
| | Investment Company | | | | | | | | |
| Delaware Investments Collateral Fund No. 1 | | | | 377,699 | | | 377,699 | |
| Total Securities Lending Collateral | | | | | | | | |
| (cost $377,699) | | | | | | | 377,699 | |
| ©Total Value of Securities – 99.66% | | | | | | | | |
| (cost $1,457,855,799) | | | | | | | 1,472,759,711 | |
| **Obligation to Return Securities | | | | | | | | |
| Lending Collateral – (0.03%) | | | | | | | (377,699 | ) |
| Receivables and Other Assets | | | | | | | | |
| Net of Other Liabilities – 0.37% | | | | | | | 5,467,660 | |
| Net Assets Applicable to 248,180,417 | | | | | | | | |
| Shares Outstanding – 100.00% | | | | | | $ | 1,477,849,672 | |
28
| | | | |
| Net Asset Value – Delaware Corporate Bond Fund | | | |
| Class A ($645,584,735 / 108,419,168 Shares) | | $5.95 | |
| Net Asset Value – Delaware Corporate Bond Fund | | | |
| Class B ($2,802,382 / 470,782 Shares) | | $5.95 | |
| Net Asset Value – Delaware Corporate Bond Fund | | | |
| Class C ($273,594,023 / 45,941,699 Shares) | | $5.96 | |
| Net Asset Value – Delaware Corporate Bond Fund | | | |
| Class R ($37,292,387 / 6,257,545 Shares) | | $5.96 | |
| Net Asset Value – Delaware Corporate Bond Fund | | | |
| Institutional Class ($518,576,145 / 87,091,223 Shares) | | $5.95 | |
| Components of Net Assets at July 31, 2013: | | | | |
| Shares of beneficial interest (unlimited authorization – no par) | | $ | 1,454,065,603 | |
| Distributions in excess of net investment income | | | (2,451,578 | ) |
| Accumulated net realized gain on investments | | | 11,278,555 | |
| Net unrealized appreciation of investments and derivatives | | | 14,957,092 | |
| Total net assets | | $ | 1,477,849,672 | |
° | Principal amount shown is stated in the currency in which each security is denominated. |
| Φ | Step coupon bond. Coupon increases or decreases periodically based on a predetermined schedule. Stated rate in effect at July 31, 2013. |
# | Security exempt from registration under Rule 144A of the Securities Act of 1933, as amended. At July 31, 2013, the aggregate value of Rule 144A securities was $445,547,910, which represented 30.15% of the Fund’s net assets. See Note 10 in “Notes to financial statements.” |
| • | Variable rate security. The rate shown is the rate as of July 31, 2013. Interest rates reset periodically. |
* | Fully or partially on loan. |
« | Senior secured loans generally pay interest at rates that are periodically redetermined by reference to a base lending rate plus a premium. These base lending rates are generally: (i) the prime rate offered by one or more United States banks, (ii) the lending rate offered by one or more European banks such as the London Inter-Bank Offered Rate (LIBOR), and (iii) the certificate of deposit rate. Senior secured loans may be subject to restrictions on resale. Stated rate in effect at July 31, 2013. |
† | Non income producing security. |
29
Statements of net assets
Delaware Corporate Bond Fund
| | |
| ≠ | The rate shown is the effective yield at the time of purchase. |
** | See Note 9 in “Notes to financial statements” for additional information on securities lending collateral. |
| © | Includes $364,863 of securities loaned. |
Net Asset Value and Offering Price Per Share –
Delaware Corporate Bond Fund | | | |
| Net asset value Class A (A) | | $ | 5.95 |
| Sales charge (4.50% of offering price) (B) | | | 0.28 |
| Offering price | | $ | 6.23 |
| (A) | | Net asset value per share, as illustrated, is the amount that would be paid upon redemption or repurchase of shares. |
| (B) | | See the current prospectus for purchases of $100,000 or more. |
The following foreign currency exchange contracts and swap contracts were outstanding at July 31, 2013:1
Foreign Currency Exchange Contracts
| Counterparty | | Contracts to
Receive (Deliver) | | In Exchange For | | Settlement Date | | Unrealized
Appreciation
(Depreciation) |
| BAML | | INR | | 215,524,662 | | USD | | (3,574,800 | ) | | 8/23/13 | | | $ | (56,350 | ) | |
| JPMC | | KRW | | 3,385,737,900 | | USD | | (3,013,831 | ) | | 8/23/13 | | | | (5,218 | ) | |
| TD | | THB | | 128,947,811 | | USD | | (4,131,552 | ) | | 8/23/13 | | | | (12,427 | ) | |
| Total | | | | | | | | | | | | | | $ | (73,995 | ) | |
30
| |
Swap Contracts
CDS Contracts2 |
| Counterparty | | Swap
Referenced Obligation | | Notional Value | | Annual
Protection
Payments | | Termination
Date | | Unrealized
Appreciation
(Depreciation) |
| | Protection Purchased: | | | | | | | | | | | | | | |
| BAML | | Cox Communications | | USD | | 6,370,000 | | 1.00% | | 3/20/18 | | | $ | 80,287 | | |
| CME | | CDX.NA.IG.20 | | | | 1,000,000 | | 1.00% | | 6/20/18 | | | | (7,307 | ) | |
| HSBC | | Cox Communications | | | | 6,370,000 | | 1.00% | | 3/20/18 | | | | 80,286 | | |
| ICE | | CDX.NA.IG.20 | | | | 11,290,000 | | 1.00% | | 6/20/18 | | | | (18,333 | ) | |
| ICE | | CDX.NA.IG.20 | | | | 3,720,000 | | 1.00% | | 6/20/18 | | | | 1,688 | | |
| | | | | | | | | | | | | $ | 136,621 | | |
| | Protection Sold: | | | | | | | | | | | | | | |
| ICE | | CDX.NA.IG.20 / Baa | | USD | | 1,000,000 | | 1.00% | | 6/20/18 | | | $ | 7,307 | | |
| Total | | | | | | | | | | | | | $ | 143,928 | | |
The use of foreign currency exchange contracts and swap contracts involves elements of market risk and risks in excess of the amounts disclosed in the financial statements. The foreign currency exchange contracts and notional values presented above represent the Fund’s total exposure in such contracts, whereas only the net unrealized appreciation (depreciation) is reflected in the Fund’s net assets.
| 1 | See Note 8 in “Notes to financial statements.” |
| 2 | A CDS contract is a risk-transfer instrument through which one party (purchaser of protection) transfers to another party (seller of protection) the financial risk of a credit event (as defined in the CDS agreement), as it relates to a particular reference security or basket of securities (such as an index). Periodic payments (receipts) on such contracts are accrued daily and recorded as realized losses (gains) on swap contracts. Upon payment (receipt), such amounts are recorded as unrealized losses (gains) on swap contracts. Upfront payments made or received in connection with CDS contracts are amortized over the expected life of the CDS contracts as unrealized losses (gains) on swap contracts. The change in value of CDS contracts is recorded as unrealized appreciation or depreciation daily. A realized gain or loss is recorded upon a credit event (as defined in the CDS agreement) or the maturity or termination of the agreement. |
31
Statements of net assets
Delaware Corporate Bond Fund
| |
Summary of abbreviations:
BAML — Bank of America Merrill Lynch
BCLY — Barclays Bank
CDS — Credit Default Swap
CDX.NA — Credit Default Swap Index North America
CME — Chicago Mercantile Exchange Inc.
GSC — Goldman Sachs Capital
HSBC — Hong Kong Shanghai Bank
ICE — Intercontinental Exchange, Inc.
IG — Investment Grade
INR — Indian Rupee
JPMC — JPMorgan Chase Bank
KRW — South Korean Won
TD — Toronto Dominion Bank
THB — Thailand Baht
USD — United States Dollar |
See accompanying notes, which are an integral part of the financial statements.
32
| Delaware Extended Duration Bond Fund | July 31, 2013 |
| | | | | Principal amount° | | Value (U.S. $) |
| Commercial Mortgage-Backed Security – 0.00% | | | | | | | |
| Merrill Lynch Mortgage Trust Series 2005-CIP1 A2 | | | | | | | |
| | 4.96% 7/12/38 | | USD | | 11,329 | | $ | 11,430 |
| Total Commercial Mortgage-Backed Security | | | | | | | |
| (cost $11,391) | | | | | | | 11,430 |
| |
| Convertible Bonds – 2.37% | | | | | | | |
| Φ | ArvinMeritor 4.00% exercise price $26.73, | | | | | | | |
| expiration date 2/12/27 | | | | 2,472,000 | | | 2,305,140 |
| # | Clearwire Communications 144A 8.25% | | | | | | | |
| exercise price $7.08, expiration date 11/30/40 | | | | 3,552,000 | | | 3,951,600 |
| * | L-3 Communications Holdings 3.00% | | | | | | | |
| exercise price $90.24, expiration date 8/1/35 | | | | 3,445,000 | | | 3,714,141 |
| Linear Technology 3.00% exercise price $41.46, | | | | | | | |
| expiration date 4/30/27 | | | | 825,000 | | | 896,156 |
| Live Nation Entertainment 2.875% | | | | | | | |
| exercise price $27.14, expiration date 7/14/27 | | | | 1,180,000 | | | 1,197,700 |
| MGM Resorts International 4.25% | | | | | | | |
| exercise price $18.58, expiration date 4/10/15 | | | | 2,043,000 | | | 2,386,479 |
| # | Owens-Brockway Glass Container 144A 3.00% | | | | | | | |
| exercise price $47.47, expiration date 5/28/15 | | | | 806,000 | | | 837,233 |
| PHH 4.00% exercise price $25.80, | | | | | | | |
| expiration date 8/27/14 | | | | 1,183,000 | | | 1,294,646 |
| Steel Dynamics 5.125% exercise price $17.21, | | | | | | | |
| expiration date 6/15/14 | | | | 277,000 | | | 300,718 |
| # | WellPoint 144A 2.75% exercise price $75.38, | | | | | | | |
| expiration date 10/15/42 | | | | 728,000 | | | 952,315 |
| Total Convertible Bonds (cost $15,968,251) | | | | | | | 17,836,128 |
| |
| Corporate Bonds – 80.65% | | | | | | | |
| Banking – 7.90% | | | | | | | |
| AgriBank 9.125% 7/15/19 | | | | 1,210,000 | | | 1,574,941 |
| Bank of America | | | | | | | |
| | 4.10% 7/24/23 | | | | 2,385,000 | | | 2,391,115 |
| • | 5.20% 12/29/49 | | | | 4,145,000 | | | 3,751,225 |
| • | Bank of New York Mellon 4.50% 12/31/49 | | | | 2,565,000 | | | 2,395,069 |
| * | Barclays Bank 7.625% 11/21/22 | | | | 3,800,000 | | | 3,790,500 |
| City National 5.25% 9/15/20 | | | | 1,155,000 | | | 1,247,749 |
| • | Deutsche Bank 4.296% 5/24/28 | | | | 1,800,000 | | | 1,637,779 |
33
Statements of net assets
Delaware Extended Duration Bond Fund
| | | | Principal amount° | | Value (U.S. $) |
| Corporate Bonds (continued) | | | | | | | |
| Banking (continued) | | | | | | | |
| • | Fifth Third Bancorp 5.10% 12/31/49 | | USD | | 1,585,000 | | $ | 1,501,788 |
| • | Fifth Third Capital Trust IV 6.50% 4/15/37 | | | | 1,845,000 | | | 1,851,919 |
| Goldman Sachs Group 6.75% 10/1/37 | | | | 4,500,000 | | | 4,749,174 |
| #• | HBOS Capital Funding 144A 6.071% 6/29/49 | | | | 4,430,000 | | | 4,274,950 |
| • | JPMorgan Chase | | | | | | | |
| 5.15% 12/29/49 | | | | 2,500,000 | | | 2,331,250 |
| 6.00% 12/29/49 | | | | 765,000 | | | 754,481 |
| KeyBank 6.95% 2/1/28 | | | | 2,467,000 | | | 2,939,381 |
| • | PNC Financial Services Group | | | | | | | |
| 4.494% 5/29/49 | | | | 1,615,000 | | | 1,617,019 |
| 4.85% 5/29/49 | | | | 1,315,000 | | | 1,199,938 |
| #• | PNC Preferred Funding Trust II 144A 1.496% 3/31/49 | | | | 3,900,000 | | | 3,432,000 |
| * | Royal Bank of Scotland Group 6.10% 6/10/23 | | | | 875,000 | | | 840,643 |
| # | Standard Chartered 144A 3.95% 1/11/23 | | | | 5,065,000 | | | 4,763,956 |
| SVB Financial Group 5.375% 9/15/20 | | | | 1,705,000 | | | 1,866,078 |
| UBS 7.625% 8/17/22 | | | | 5,930,000 | | | 6,608,189 |
| • | USB Capital IX 3.50% 10/29/49 | | | | 2,990,000 | | | 2,661,100 |
| #• | USB Realty 144A 1.415% 12/22/49 | | | | 400,000 | | | 348,000 |
| Zions Bancorp 5.50% 11/16/15 | | | | 900,000 | | | 937,543 |
| | | | | | | | 59,465,787 |
| Basic Industry – 6.33% | | | | | | | |
| ArcelorMittal 7.50% 10/15/39 | | | | 4,880,000 | | | 4,648,200 |
| # | Barrick Gold 144A | | | | | | | |
| 2.50% 5/1/18 | | | | 260,000 | | | 241,535 |
| 4.10% 5/1/23 | | | | 3,865,000 | | | 3,293,571 |
| Clearwater Paper 4.50% 2/1/23 | | | | 4,125,000 | | | 3,918,750 |
| # | Freeport-McMoRan Copper & Gold 144A | | | | | | | |
| 3.875% 3/15/23 | | | | 3,570,000 | | | 3,236,173 |
| Georgia-Pacific 8.00% 1/15/24 | | | | 5,280,000 | | | 6,858,672 |
| # | Gerdau Trade 144A 4.75% 4/15/23 | | | | 2,845,000 | | | 2,603,175 |
| International Paper 6.00% 11/15/41 | | | | 4,570,000 | | | 5,025,012 |
| Kinross Gold 6.875% 9/1/41 | | | | 2,235,000 | | | 1,986,931 |
| Nucor 5.20% 8/1/43 | | | | 6,995,000 | | | 6,973,979 |
| Plains Exploration & Production 6.50% 11/15/20 | | | | 2,955,000 | | | 3,183,880 |
| Rock Tenn 4.00% 3/1/23 | | | | 1,790,000 | | | 1,726,596 |
| # | Sappi Papier Holding 144A 6.625% 4/15/21 | | | | 4,055,000 | | | 3,943,488 |
| | | | | | | | 47,639,962 |
34
| | | | Principal amount° | | Value (U.S. $) |
| Corporate Bonds (continued) | | | | | | | |
| Brokerage – 2.29% | | | | | | | |
| # | Carlyle Holdings II Finance 144A 5.625% 3/30/43 | | USD | | 5,045,000 | | $ | 4,714,653 |
| E Trade Financial 6.375% 11/15/19 | | | | 1,800,000 | | | 1,921,500 |
| Jefferies Group | | | | | | | |
| 6.45% 6/8/27 | | | | 2,640,000 | | | 2,740,468 |
| 6.50% 1/20/43 | | | | 1,985,000 | | | 1,990,153 |
| Lazard Group 6.85% 6/15/17 | | | | 3,271,000 | | | 3,661,322 |
| # | Nuveen Investments 144A 9.50% 10/15/20 | | | | 2,165,000 | | | 2,202,888 |
| | | | | | | | 17,230,984 |
| Capital Goods – 3.23% | | | | | | | |
| # | Algeco Scotsman Global Finance 144A | | | | | | | |
| 8.50% 10/15/18 | | | | 815,000 | | | 843,525 |
| 10.75% 10/15/19 | | | | 4,865,000 | | | 4,548,775 |
| # | Cemex 144A 9.50% 6/15/18 | | | | 2,350,000 | | | 2,637,875 |
| # | Ingersoll-Rand Global Holding 144A 5.75% 6/15/43 | | | | 8,595,000 | | | 9,025,137 |
| # | Sealed Air 144A 5.25% 4/1/23 | | | | 455,000 | | | 443,625 |
| United Rentals North America 10.25% 11/15/19 | | | | 820,000 | | | 934,800 |
| # | URS 144A 5.50% 4/1/22 | | | | 2,170,000 | | | 2,225,046 |
| # | Votorantim Cimentos 144A 7.25% 4/5/41 | | | | 2,475,000 | | | 2,351,250 |
| Waste Management 7.10% 8/1/26 | | | | 1,025,000 | | | 1,279,407 |
| | | | | | | | 24,289,440 |
| Communications – 7.82% | | | | | | | |
| # | American Tower Trust I 144A 3.07% 3/15/23 | | | | 5,175,000 | | | 4,944,247 |
| # | Brasil Telecom 144A 5.75% 2/10/22 | | | | 2,485,000 | | | 2,329,687 |
| CC Holdings GS V 3.849% 4/15/23 | | | | 2,690,000 | | | 2,539,669 |
| # | Clearwire Communications 144A 12.00% 12/1/15 | | | | 1,490,000 | | | 1,583,125 |
| CSC Holdings 6.75% 11/15/21 | | | | 1,245,000 | | | 1,369,500 |
| Deutsche Telekom International Finance | | | | | | | |
| 8.75% 6/15/30 | | | | 1,335,000 | | | 1,879,704 |
| # | Digicel 144A 6.00% 4/15/21 | | | | 2,110,000 | | | 2,073,075 |
| # | Digicel Group 144A 10.50% 4/15/18 | | | | 235,000 | | | 256,150 |
| DISH DBS | | | | | | | |
| 5.875% 7/15/22 | | | | 600,000 | | | 601,500 |
| 7.875% 9/1/19 | | | | 380,000 | | | 434,150 |
| # | Intelsat Luxembourg 144A | | | | | | | |
| 7.75% 6/1/21 | | | | 2,245,000 | | | 2,371,281 |
| 8.125% 6/1/23 | | | | 1,240,000 | | | 1,337,650 |
| # | Lynx I 144A 5.375% 4/15/21 | | | | 365,000 | | | 371,388 |
| # | MDC Partners 144A 6.75% 4/1/20 | | | | 2,135,000 | | | 2,199,050 |
35
Statements of net assets
Delaware Extended Duration Bond Fund
| | | | Principal amount° | | Value (U.S. $) |
| Corporate Bonds (continued) | | | | | | | |
| Communications (continued) | | | | | | | |
| #* | Millicom International Cellular 144A 4.75% 5/22/20 | | USD | | 1,000,000 | | $ | 972,500 |
| # | Nara Cable Funding 144A 8.875% 12/1/18 | | | | 4,045,000 | | | 4,267,475 |
| Qwest 6.875% 9/15/33 | | | | 3,510,000 | | | 3,483,675 |
| # | SES 144A 5.30% 4/4/43 | | | | 7,070,000 | | | 6,955,367 |
| Sprint Capital 6.875% 11/15/28 | | | | 1,460,000 | | | 1,350,500 |
| # | Sprint Nextel 144A 7.00% 3/1/20 | | | | 960,000 | | | 1,051,200 |
| # | Telefonica Chile 144A 3.875% 10/12/22 | | | | 2,069,000 | | | 1,907,546 |
| Telefonica Emisiones | | | | | | | |
| 4.57% 4/27/23 | | | | 2,440,000 | | | 2,363,755 |
| 5.134% 4/27/20 | | | | 1,000,000 | | | 1,029,923 |
| Time Warner Cable 4.50% 9/15/42 | | | | 3,750,000 | | | 2,903,749 |
| # | Univision Communications 144A 8.50% 5/15/21 | | | | 4,275,000 | | | 4,723,875 |
| # | VimpelCom 144A 7.748% 2/2/21 | | | | 1,455,000 | | | 1,556,850 |
| # | Wind Acquisition Finance 144A | | | | | | | |
| 7.25% 2/15/18 | | | | 530,000 | | | 548,550 |
| 11.75% 7/15/17 | | | | 1,340,000 | | | 1,420,400 |
| | | | | | | | 58,825,541 |
| Consumer Cyclical – 3.44% | | | | | | | |
| Caesars Entertainment Operating 11.25% 6/1/17 | | | | 335,000 | | | 349,028 |
| Chrysler Group 8.25% 6/15/21 | | | | 1,935,000 | | | 2,162,363 |
| Corrections Corporation of America 4.625% 5/1/23 | | | | 4,215,000 | | | 4,130,700 |
| # | Geo Group 144A 5.125% 4/1/23 | | | | 2,015,000 | | | 1,954,550 |
| Host Hotels & Resorts 4.75% 3/1/23 | | | | 1,075,000 | | | 1,085,639 |
| # | Jaguar Land Rover Automotive 144A 5.625% 2/1/23 | | | | 795,000 | | | 783,075 |
| MGM Resorts International 11.375% 3/1/18 | | | | 750,000 | | | 952,500 |
| Quiksilver | | | | | | | |
| *6.875% 4/15/15 | | | | 1,000,000 | | | 1,006,260 |
| #144A 7.875% 8/1/18 | | | | 750,000 | | | 787,500 |
| # | QVC 144A 4.375% 3/15/23 | | | | 8,295,000 | | | 7,928,254 |
| Ryland Group 8.40% 5/15/17 | | | | 495,000 | | | 576,675 |
| # | SACI Falabella 144A 3.75% 4/30/23 | | | | 1,980,000 | | | 1,818,186 |
| # | Wynn Las Vegas 144A 4.25% 5/30/23 | | | | 2,540,000 | | | 2,359,025 |
| | | | | | | | 25,893,755 |
| Consumer Non-Cyclical – 8.41% | | | | | | | |
| # | BRF 144A 3.95% 5/22/23 | | | | 1,830,000 | | | 1,578,375 |
| Celgene 5.70% 10/15/40 | | | | 9,525,000 | | | 9,985,190 |
36
| | | | Principal amount° | | Value (U.S. $) |
| Corporate Bonds (continued) | | | | | | | |
| Consumer Non-Cyclical (continued) | | | | | | | |
| Constellation Brands | | | | | | | |
| 3.75% 5/1/21 | | USD | | 1,110,000 | | $ | 1,040,625 |
| 4.25% 5/1/23 | | | | 410,000 | | | 387,450 |
| Delhaize Group 5.70% 10/1/40 | | | | 1,895,000 | | | 1,828,978 |
| # | ESAL 144A 6.25% 2/5/23 | | | | 3,820,000 | | | 3,523,950 |
| Fomento Economico Mexicano 4.375% 5/10/43 | | | | 2,500,000 | | | 2,156,378 |
| # | Heineken 144A 4.00% 10/1/42 | | | | 4,675,000 | | | 4,019,055 |
| # | Heinz (H.J.) Finance 144A 7.125% 8/1/39 | | | | 1,075,000 | | | 1,126,063 |
| Molson Coors Brewing 5.00% 5/1/42 | | | | 8,000,000 | | | 8,048,320 |
| # | Pernod-Ricard 144A 5.50% 1/15/42 | | | | 8,024,000 | | | 8,440,855 |
| Quest Diagnostics 5.75% 1/30/40 | | | | 4,875,000 | | | 4,803,357 |
| # | SABMiller Holdings 144A 4.95% 1/15/42 | | | | 7,000,000 | | | 7,228,291 |
| # | Zoetis 144A 4.70% 2/1/43 | | | | 9,490,000 | | | 9,067,572 |
| | | | | | | | 63,234,459 |
| Electric – 12.26% | | | | | | | |
| AES | | | | | | | |
| 7.375% 7/1/21 | | | | 2,737,000 | | | 3,106,495 |
| 8.00% 6/1/20 | | | | 325,000 | | | 377,813 |
| Ameren Illinois 9.75% 11/15/18 | | | | 2,180,000 | | | 2,941,825 |
| # | APT Pipelines 144A 3.875% 10/11/22 | | | | 4,770,000 | | | 4,428,931 |
| CMS Energy 4.70% 3/31/43 | | | | 6,605,000 | | | 6,203,005 |
| ComEd Financing III 6.35% 3/15/33 | | | | 4,800,000 | | | 4,776,322 |
| El Paso Electric 3.30% 12/15/22 | | | | 1,695,000 | | | 1,600,733 |
| #• | Electricite de France 144A 5.25% 12/29/49 | | | | 6,135,000 | | | 5,877,348 |
| # | Enel Finance International 144A 6.00% 10/7/39 | | | | 4,800,000 | | | 4,351,306 |
| Exelon Generation 5.60% 6/15/42 | | | | 3,785,000 | | | 3,861,351 |
| • | Integrys Energy Group 6.11% 12/1/66 | | | | 5,565,000 | | | 5,847,635 |
| • | National Rural Utilities Cooperative Finance | | | | | | | |
| 4.75% 4/30/43 | | | | 4,350,000 | | | 4,208,625 |
| • | NextEra Energy Capital Holdings | | | | | | | |
| 6.35% 10/1/66 | | | | 4,591,000 | | | 4,778,037 |
| 6.65% 6/15/67 | | | | 1,045,000 | | | 1,103,411 |
| NV Energy 6.25% 11/15/20 | | | | 2,370,000 | | | 2,798,361 |
| Oncor Electric Delivery 4.55% 12/1/41 | | | | 5,500,000 | | | 5,362,951 |
| # | Perusahaan Listrik Negara 144A 5.25% 10/24/42 | | | | 7,030,000 | | | 5,624,000 |
| • | PPL Capital Funding | | | | | | | |
| 4.70% 6/1/43 | | | | 5,520,000 | | | 5,127,357 |
| 6.70% 3/30/67 | | | | 1,540,000 | | | 1,602,891 |
37
Statements of net assets
Delaware Extended Duration Bond Fund
| | | | Principal amount° | | Value (U.S. $) |
| Corporate Bonds (continued) | | | | | | | |
| Electric (continued) | | | | | | | |
| Puget Sound Energy | | | | | | | |
| 4.434% 11/15/41 | | USD | | 4,870,000 | | $ | 4,757,717 |
| •6.974% 6/1/67 | | | | 2,495,000 | | | 2,610,683 |
| # | Saudi Electricity Global Sukuk 144A 5.06% 4/8/43 | | | | 5,900,000 | | | 5,376,375 |
| • | Wisconsin Energy 6.25% 5/15/67 | | | | 5,245,000 | | | 5,524,999 |
| | | | | | | | 92,248,171 |
| Energy – 5.28% | | | | | | | |
| Chesapeake Energy | | | | | | | |
| 5.375% 6/15/21 | | | | 625,000 | | | 625,000 |
| 5.75% 3/15/23 | | | | 1,010,000 | | | 1,020,100 |
| * | CNOOC Finance 2013 4.25% 5/9/43 | | | | 4,790,000 | | | 4,098,147 |
| # | ENI 144A 5.70% 10/1/40 | | | | 3,450,000 | | | 3,361,483 |
| # | Gazprom 144A 4.375% 9/19/22 | | | | 2,165,000 | | | 2,013,883 |
| Halliburton 4.75% 8/1/43 | | | | 11,625,000 | | | 11,792,168 |
| Laredo Petroleum 9.50% 2/15/19 | | | | 1,910,000 | | | 2,129,650 |
| Newfield Exploration 5.625% 7/1/24 | | | | 2,300,000 | | | 2,311,500 |
| Noble Holding International 5.25% 3/15/42 | | | | 3,800,000 | | | 3,570,100 |
| Petroleos Mexicanos 5.50% 6/27/44 | | | | 2,120,000 | | | 1,947,220 |
| Talisman Energy 5.50% 5/15/42 | | | | 6,785,000 | | | 6,853,291 |
| | | | | | | | 39,722,542 |
| Finance Companies – 3.40% | | | | | | | |
| General Electric Capital | | | | | | | |
| #144A 3.80% 6/18/19 | | | | 2,145,000 | | | 2,246,529 |
| 5.875% 1/14/38 | | | | 3,665,000 | | | 4,032,006 |
| •6.25% 12/15/49 | | | | 4,200,000 | | | 4,386,114 |
| •7.125% 12/15/49 | | | | 2,200,000 | | | 2,479,140 |
| #• | ILFC E-Capital Trust I 144A 4.96% 12/21/65 | | | | 3,750,000 | | | 3,225,000 |
| #• | ILFC E-Capital Trust II 144A 6.25% 12/21/65 | | | | 1,250,000 | | | 1,159,375 |
| International Lease Finance | | | | | | | |
| 5.875% 4/1/19 | | | | 970,000 | | | 1,018,500 |
| 6.25% 5/15/19 | | | | 1,292,000 | | | 1,369,520 |
| # | IPIC GMTN 144A 5.50% 3/1/22 | | | | 2,867,000 | | | 3,103,528 |
| PHH | | | | | | | |
| 7.375% 9/1/19 | | | | 350,000 | | | 385,438 |
| *9.25% 3/1/16 | | | | 1,935,000 | | | 2,196,225 |
| | | | | | | | 25,601,375 |
38
| | | | Principal amount° | | Value (U.S. $) |
| Corporate Bonds (continued) | | | | | | | |
| Insurance – 7.46% | | | | | | | |
| • | American International Group 8.175% 5/15/58 | | USD | | 2,575,000 | | $ | 3,160,813 |
| Berkshire Hathaway Finance 4.30% 5/15/43 | | | | 9,700,000 | | | 9,036,994 |
| • | Chubb 6.375% 3/29/67 | | | | 2,555,000 | | | 2,778,563 |
| # | Highmark 144A 6.125% 5/15/41 | | | | 3,410,000 | | | 3,061,679 |
| *• | ING Groep 5.775% 12/29/49 | | | | 3,200,000 | | | 3,200,000 |
| # | ING US 144A | | | | | | | |
| •5.65% 5/15/53 | | | | 1,400,000 | | | 1,319,500 |
| 5.70% 7/15/43 | | | | 6,540,000 | | | 6,558,900 |
| # | Liberty Mutual Group 144A | | | | | | | |
| 6.50% 5/1/42 | | | | 5,769,000 | | | 6,452,500 |
| •7.00% 3/15/37 | | | | 1,600,000 | | | 1,660,000 |
| # | MetLife Capital Trust IV 144A 7.875% 12/15/37 | | | | 900,000 | | | 1,066,500 |
| # | MetLife Capital Trust X 144A 9.25% 4/8/38 | | | | 2,030,000 | | | 2,710,050 |
| # | Pacific LifeCorp 144A 5.125% 1/30/43 | | | | 4,545,000 | | | 4,291,430 |
| • | Prudential Financial 5.625% 6/15/43 | | | | 4,640,000 | | | 4,512,400 |
| Transatlantic Holdings 8.00% 11/30/39 | | | | 704,000 | | | 895,299 |
| • | XL Group 6.50% 12/29/49 | | | | 3,950,000 | | | 3,900,625 |
| #• | ZFS Finance USA Trust II 144A 6.45% 12/15/65 | | | | 1,395,000 | | | 1,496,138 |
| | | | | | | | 56,101,391 |
| Natural Gas – 9.23% | | | | | | | |
| AGL Capital 4.40% 6/1/43 | | | | 9,000,000 | | | 8,527,283 |
| AmeriGas Finance 6.75% 5/20/20 | | | | 310,000 | | | 330,925 |
| # | Colonial Pipeline 144A 4.20% 4/15/43 | | | | 6,120,000 | | | 5,623,399 |
| #• | DCP Midstream 144A 5.85% 5/21/43 | | | | 5,355,000 | | | 5,140,800 |
| El Paso Pipeline Partners Operating 7.50% 11/15/40 | | | | 3,065,000 | | | 3,846,468 |
| *• | Enbridge Energy Partners 8.05% 10/1/37 | | | | 4,750,000 | | | 5,394,504 |
| Energy Transfer Partners | | | | | | | |
| 5.15% 2/1/43 | | | | 2,555,000 | | | 2,390,003 |
| 9.70% 3/15/19 | | | | 681,000 | | | 886,029 |
| • | Enterprise Products Operating 7.034% 1/15/68 | | | | 2,245,000 | | | 2,522,442 |
| Kinder Morgan Energy Partners 4.15% 2/1/24 | | | | 5,500,000 | | | 5,500,820 |
| NiSource Finance | | | | | | | |
| 4.80% 2/15/44 | | | | 10,010,000 | | | 9,314,184 |
| 5.80% 2/1/42 | | | | 1,810,000 | | | 1,930,276 |
| Piedmont Natural Gas 4.65% 8/1/43 | | | | 6,510,000 | | | 6,636,561 |
| Sunoco Logistics Partners Operations 4.95% 1/15/43 | | | | 7,750,000 | | | 7,282,001 |
| • | TransCanada Pipelines 6.35% 5/15/67 | | | | 3,940,000 | | | 4,139,340 |
| | | | | | | | 69,465,035 |
39
Statements of net assets
Delaware Extended Duration Bond Fund
| | | | Principal amount° | | Value (U.S. $) |
| Corporate Bonds (continued) | | | | | | | |
| Real Estate Investment Trusts – 0.65% | | | | | | | |
| DDR 7.875% 9/1/20 | | USD | | 2,010,000 | | $ | 2,483,027 |
| Digital Realty Trust 5.25% 3/15/21 | | | | 2,270,000 | | | 2,383,314 |
| | | | | | | | 4,866,341 |
| Technology – 1.73% | | | | | | | |
| Apple 3.85% 5/4/43 | | | | 5,070,000 | | | 4,427,179 |
| #* | Avaya 144A 10.50% 3/1/21 | | | | 540,000 | | | 417,150 |
| Baidu 3.50% 11/28/22 | | | | 4,365,000 | | | 4,006,529 |
| Equinix | | | | | | | |
| 4.875% 4/1/20 | | | | 1,518,000 | | | 1,510,410 |
| 5.375% 4/1/23 | | | | 787,000 | | | 785,033 |
| * | First Data 11.25% 3/31/16 | | | | 1,430,000 | | | 1,430,000 |
| GXS Worldwide 9.75% 6/15/15 | | | | 435,000 | | | 447,778 |
| | | | | | | | 13,024,079 |
| Transportation – 1.22% | | | | | | | |
| # | ERAC USA Finance 144A 5.625% 3/15/42 | | | | 8,955,000 | | | 9,167,296 |
| | | | | | | | 9,167,296 |
| Total Corporate Bonds (cost $606,417,657) | | | | | | | 606,776,158 |
| |
| Municipal Bonds – 6.72% | | | | | | | |
| California (Various Purposes) | | | | | | | |
| 5.00% 4/1/42 | | | | 1,150,000 | | | 1,166,894 |
| 5.00% 4/1/43 | | | | 3,210,000 | | | 3,261,456 |
| Chicago, Illinois O’Hare International Airport Revenue | | | | | | | |
| (Build America Bond) Series B 6.395% 1/1/40 | | | | 3,800,000 | | | 4,457,210 |
| Commonwealth of Pennsylvania 1st Series | | | | | | | |
| 5.00% 4/1/22 | | | | 2,695,000 | | | 3,166,544 |
| 5.00% 4/1/24 | | | | 1,740,000 | | | 2,018,191 |
| Golden State, California Tobacco Securitization | | | | | | | |
| Settlement Revenue (Asset-Backed Senior) | | | | | | | |
| Series A-1 | | | | | | | |
| 5.125% 6/1/47 | | | | 975,000 | | | 696,238 |
| 5.75% 6/1/47 | | | | 620,000 | | | 484,158 |
| Grand Parkway, Texas Transportation Revenue | | | | | | | |
| (Sub-Tier Toll) Series B 5.00% 4/1/53 | | | | 1,160,000 | | | 1,126,812 |
| Hawaii Series EE 5.00% 11/1/22 | | | | 1,210,000 | | | 1,423,384 |
| Long Island Power Authority, New York Electric | | | | | | | |
| System Revenue Taxable Build America Bond | | | | | | | |
| 5.85% 5/1/41 | | | | 3,600,000 | | | 3,630,780 |
40
| | | | Principal amount° | | Value (U.S. $) |
| Municipal Bonds (continued) | | | | | | | |
| Los Angeles, California Department of Water & | | | | | | | |
| Power Revenue Taxable Build America Bond | | | | | | | |
| 6.574% 7/1/45 | | USD | | 2,225,000 | | $ | 2,833,627 |
| Metropolitan Transportation Authority, New York | | | | | | | |
| Revenue Taxable Build America Bonds | | | | | | | |
| (Dedicated Tax Fund) Series C-1 6.687% 11/15/40 | | | | 3,000,000 | | | 3,549,570 |
| (Transportation) Series A2 6.089% 11/15/40 | | | | 3,205,000 | | | 3,721,902 |
| New Jersey State Turnpike Authority Revenue | | | | | | | |
| Series A 5.00% 1/1/43 | | | | 1,700,000 | | | 1,730,532 |
| New York City Water & Sewer System | | | | | | | |
| (Second Generation) Series BB 5.00% 6/15/47 | | | | 3,775,000 | | | 3,877,151 |
| Series EE 5.00% 6/15/47 | | | | 1,080,000 | | | 1,110,456 |
| Oregon Department of Transportation Highway | | | | | | | |
| User Tax Revenue Taxable Build America Bond | | | | | | | |
| Series A (Subordinate Lien) | | | | | | | |
| 5.834% 11/15/34 | | | | 1,605,000 | | | 1,873,115 |
| Prince George’s County, Maryland | | | | | | | |
| (Consolidated Public Improvement) Series C | | | | | | | |
| 5.00% 8/1/22 | | | | 2,510,000 | | | 3,004,018 |
| 5.00% 8/1/23 | | | | 1,695,000 | | | 2,036,865 |
| San Francisco Bay Area Toll Authority, | | | | | | | |
| California Toll Bridge Revenue Taxable Build | | | | | | | |
| America Bond Series S3 6.907% 10/1/50 | | | | 1,485,000 | | | 1,854,854 |
| Triborough Bridge & Tunnel Authority, New York | | | | | | | |
| Revenue Taxable Build America Bond | | | | | | | |
| Series A-2 5.45% 11/15/32 | | | | 2,310,000 | | | 2,504,941 |
| Wake County, North Carolina Series C 5.00% 3/1/22 | | | | 870,000 | | | 1,037,849 |
| Total Municipal Bonds (cost $48,454,137) | | | | | | | 50,566,547 |
| |
| «Senior Secured Loans – 1.27% | | | | | | | |
| Burlington Coat Factory Tranche B2 4.25% 2/23/17 | | | | 694,212 | | | 699,415 |
| Chrysler Group Tranche B 4.25% 5/24/17 | | | | 827,888 | | | 842,669 |
| Clear Channel Communications Tranche B | | | | | | | |
| 3.65% 1/29/16 | | | | 4,325,000 | | | 4,064,297 |
| Essar Steel Algoma 8.75% 9/20/14 | | | | 1,061,975 | | | 1,084,985 |
| Immucor 5.00% 8/19/18 | | | | 1,193,859 | | | 1,207,290 |
| Nuveen Investments 2nd Lien 6.50% 2/28/19 | | | | 620,000 | | | 621,938 |
| Zayo Group Tranche B 1st Lien 4.50% 7/2/19 | | | | 992,481 | | | 1,002,251 |
| Total Senior Secured Loans (cost $9,357,250) | | | | | | | 9,522,845 |
41
Statements of net assets
Delaware Extended Duration Bond Fund
| | | | Principal amount° | | Value (U.S. $) |
| ΔSovereign Bonds – 0.73% | | | | | | | |
| Colombia – 0.38% | | | | | | | |
| Republic of Colombia 6.125% 1/18/41 | | USD | | 2,589,000 | | $ | 2,854,372 |
| | | | | | | | 2,854,372 |
| Indonesia – 0.35% | | | | | | | |
| # | Indonesia Government 144A 4.625% 4/15/43 | | | | 3,207,000 | | | 2,653,793 |
| | | | | | | | 2,653,793 |
| Total Sovereign Bonds (cost $6,191,482) | | | | | | | 5,508,165 |
| |
| | | Number of shares | | | |
| Convertible Preferred Stock – 0.66% | | | | | | | |
| # | Chesapeake Energy 144A 5.75% | | | | | | | |
| exercise price $27.83, expiration date 12/31/49 | | | | 4,650 | | | 4,987,125 |
| Total Convertible Preferred Stock (cost $4,812,750) | | | | | | | 4,987,125 |
| |
| Preferred Stock – 5.84% | | | | | | | |
| Alabama Power 5.625% | | | | 16,200 | | | 399,492 |
| Ally Financial | | | | | | | |
| #144A 7.00% | | | | 3,390 | | | 3,358,219 |
| •8.50% | | | | 40,000 | | | 1,045,600 |
| BB&T 5.85% | | | | 174,000 | | | 3,965,460 |
| City National 5.50% | | | | 101,200 | | | 2,377,188 |
| CoBank 6.125% | | | | 21,000 | | | 2,096,063 |
| DTE Energy 5.25% | | | | 175,000 | | | 4,084,500 |
| * | Entergy Arkansas 4.90% | | | | 170,000 | | | 3,503,700 |
| General Electric Capital 4.875% | | | | 148,000 | | | 3,260,440 |
| * | JPMorgan Chase 5.50% | | | | 45,000 | | | 1,036,350 |
| National Retail Properties 5.70% | | | | 101,275 | | | 2,249,318 |
| Public Storage 5.20% | | | | 195,000 | | | 4,249,049 |
| Qwest 6.125% | | | | 93,600 | | | 2,109,744 |
| Regency Centers 6.625% | | | | 87,759 | | | 2,194,853 |
| Regions Financial 6.375% | | | | 41,000 | | | 1,009,830 |
| * | U.S. Bancorp 5.15% | | | | 63,000 | | | 1,469,790 |
| Wells Fargo | | | | | | | |
| 5.125% | | | | 105,000 | | | 2,316,300 |
| *5.20% | | | | 145,000 | | | 3,223,350 |
| Total Preferred Stock (cost $47,644,184) | | | | | | | 43,949,246 |
42
| | | | Number of contracts | | Value (U.S. $) |
| Options Purchased – 0.79% | | | | | | | |
| Put Swaptions – 0.79% | | | | | | | |
| Pay a fixed rate 2.47% and receive a floating rate based | | | | | | | |
| on 3-month LIBOR, expiration date 11/16/15 (BAML) | | | | 5,700,000 | | $ | 689,826 |
| Pay a fixed rate 3.65% and receive a floating rate based | | | | | | | |
| on 3-month LIBOR, expiration date 11/16/15 (BAML) | | | | 5,700,000 | | | 510,222 |
| Pay a fixed rate 4.00% and receive a floating rate based | | | | | | | |
| on 3-month LIBOR, expiration date 5/23/17 (GSC) | | | | 10,900,000 | | | 765,117 |
| Pay a fixed rate 4.01% and receive a floating rate based | | | | | | | |
| on 3-month LIBOR, expiration date 5/17/16 (GSC) | | | | 17,500,000 | | | 1,930,276 |
| Pay a fixed rate 4.09% and receive a floating rate based | | | | | | | |
| on 3-month LIBOR, expiration date 2/7/18 (GSC) | | | | 15,700,000 | | | 2,001,876 |
| Total Options Purchased (premium paid $3,529,995) | | | | | | | 5,897,317 |
| |
| | | Principal amount° | | | |
| Short-Term Investments – 0.14% | | | | | | | |
| ≠Discount Notes – 0.14% | | | | | | | |
| Federal Home Loan Bank | | | | | | | |
| 0.045% 10/18/13 | | USD | | 229,065 | | | 229,055 |
| 0.045% 10/23/13 | | | | 393,076 | | | 393,058 |
| 0.055% 8/12/13 | | | | 248,989 | | | 248,988 |
| 0.06% 8/14/13 | | | | 21,443 | | | 21,443 |
| 0.06% 8/16/13 | | | | 7,043 | | | 7,043 |
| 0.06% 8/21/13 | | | | 8,916 | | | 8,916 |
| 0.08% 8/30/13 | | | | 122,215 | | | 122,214 |
| Total Short-Term Investments (cost $1,030,671) | | | | | | | 1,030,717 |
| |
| Total Value of Securities Before Securities | | | | | | | |
| Lending Collateral – 99.17% | | | | | | | |
| (cost $743,417,768) | | | | | | | 746,085,678 |
| |
| | | Number of shares | | | |
| **Securities Lending Collateral – 0.02% | | | | | | | |
| Investment Company | | | | | | | |
| Delaware Investments Collateral Fund No. 1 | | | | 171,899 | | | 171,899 |
| Total Securities Lending Collateral (cost $171,899) | | | | | | | 171,899 |
43
Statements of net assets
Delaware Extended Duration Bond Fund
| | | | |
| ©Total Value of Securities – 99.19% | | | |
| (cost $743,589,667) | $ | 746,257,577 | |
| **Obligation to Return Securities | | | |
| Lending Collateral – (0.02%) | | (171,899 | ) |
| Receivables and Other Assets | | | |
| Net of Other Liabilities – 0.83% | | 6,264,562 | |
| Net Assets Applicable to 119,840,898 | | | |
| Shares Outstanding – 100.00% | $ | 752,350,240 | |
| |
| Net Asset Value – Delaware Extended Duration Bond Fund | | | |
| Class A ($370,553,208 / 58,992,772 Shares) | | | $6.28 | |
| Net Asset Value – Delaware Extended Duration Bond Fund | | | |
| Class B ($748,955 / 119,493 Shares) | | | $6.27 | |
| Net Asset Value – Delaware Extended Duration Bond Fund | | | |
| Class C ($47,326,287 / 7,536,658 Shares) | | | $6.28 | |
| Net Asset Value – Delaware Extended Duration Bond Fund | | | |
| Class R ($29,423,079 / 4,677,939 Shares) | | | $6.29 | |
| Net Asset Value – Delaware Extended Duration Bond Fund | | | |
| Institutional Class ($304,298,711 / 48,514,036 Shares) | | | $6.27 | |
| |
| Components of Net Assets at July 31, 2013: | | | |
| Shares of beneficial interest (unlimited authorization – no par) | $ | 753,833,254 | |
| Distributions in excess of net investment income | | (2,030,832 | ) |
| Accumulated net realized gain on investments | | 6,762,476 | |
| Net unrealized depreciation of investments and derivatives | | (6,214,658 | ) |
| Total net assets | $ | 752,350,240 | |
| ° | Principal amount shown is stated in the currency in which each security is denominated. |
| Φ | Step coupon bond. Coupon increases or decreases periodically based on a predetermined schedule. Stated rate in effect at July 31, 2013. |
| # | Security exempt from registration under Rule 144A of the Securities Act of 1933, as amended. At July 31, 2013, the aggregate value of Rule 144A securities was $253,087,174, which represented 33.64% of the Fund’s net assets. See Note 10 in “Notes to financial statements.” |
| * | Fully or partially on loan. |
| • | Variable rate security. The rate shown is the rate as of July 31, 2013. Interest rates reset periodically. |
| Δ | Securities have been classified by country of origin. |
44
| |
| « | Senior secured loans generally pay interest at rates that are periodically redetermined by reference to a base lending rate plus a premium. These base lending rates are generally: (i) the prime rate offered by one or more United States banks, (ii) the lending rate offered by one or more European banks such as the London Inter-Bank Offered Rate (LIBOR), and (iii) the certificate of deposit rate. Senior secured loans may be subject to restrictions on resale. Stated rate in effect at July 31, 2013. |
| ≠ | The rate shown is the effective yield at the time of purchase. |
| ** | Note 9 in “Notes to financial statements” for additional information on securities lending collateral. |
| © | Includes $159,181 of securities loaned. |
| Net Asset Value and Offering Price Per Share – | | |
| Delaware Extended Duration Bond Fund | | |
| Net asset value Class A (A) | $ | 6.28 |
| Sales charge (4.50% of offering price) (B) | | 0.30 |
| Offering price | $ | 6.58 |
| (A) | Net asset value per share, as illustrated, is the amount that would be paid upon redemption or repurchase of shares. |
| |
| (B) | See the current prospectus for purchases of $100,000 or more. |
The following foreign currency exchange contracts, futures contracts and swap contracts were outstanding at July 31, 2013:1
Foreign Currency Exchange Contracts
| | | | | | | | | | | Unrealized |
| | Contracts to | | | | | | | | Appreciation |
| Counterparty | | | Receive (Deliver) | | In Exchange For | | Settlement Date | | (Depreciation) |
| BAML | | INR | 107,592,410 | | USD | (1,784,581 | ) | | 8/23/13 | | | $ | (28,131 | ) | |
| JPMC | | KRW | 2,200,227,300 | | USD | (1,958,543 | ) | | 8/23/13 | | | | (3,391 | ) | |
| TD | | THB | 64,372,217 | | USD | (2,062,518 | ) | | 8/23/13 | | | | (6,203 | ) | |
| Total | | | | | | | | | | | | $ | (37,725 | ) | |
45
Statements of net assets
Delaware Extended Duration Bond Fund
| | | | | | | | | | | | | | | |
| Futures Contracts | | | | | | | | | | | | | | |
| | | | | | | | | | | | | | Unrealized |
| | | | Notional Cost | | | | | | | | Appreciation |
| Contracts to Buy (Sell) | | | (Proceeds) | | Notional Value | | Expiration Date | | (Depreciation) |
| (282 | ) | U.S. Treasury 5 yr Notes | | $ | (34,566,235 | ) | | $ | (34,225,547 | ) | | 10/4/13 | | $ | 340,688 | |
| 940 | | U.S. Treasury Long Bond | | | 131,867,036 | | | | 126,018,750 | | | 10/1/13 | | | (5,848,286 | ) |
| 409 | | U.S. Treasury Ultra Term Bond | | | 62,408,714 | | | | 58,998,250 | | | 10/1/13 | | | (3,410,464 | ) |
| Total | | | | $ | 159,709,515 | | | | | | | | | $ | (8,918,062 | ) |
| Swap Contracts | | | | | | | | | | | | | | |
| CDS Contracts2 | | | | | | | | | | | | | | |
| | | | | | | Annual | | | | Unrealized |
| | Swap | | | | | Protection | | Termination | | Appreciation |
| Counterparty | | | Referenced Obligation | | Notional Value | | Payments | | Date | | (Depreciation) |
| | Protection Purchased: | | | | | | | | | | | | | | |
| BAML | | Cox Communications | | USD | 3,630,000 | | 1.00 | % | | 3/20/18 | | | $ | 45,752 | | |
| CME | | CDX.NA.IG.20 | | | 1,000,000 | | 1.00 | % | | 6/20/18 | | | | (7,307 | ) | |
| HSBC | | Cox Communications | | | 3,630,000 | | 1.00 | % | | 3/20/18 | | | | 45,752 | | |
| ICE | | CDX.NA.IG.20 | | | 5,710,000 | | 1.00 | % | | 6/20/18 | | | | (9,272 | ) | |
| ICE | | CDX.NA.IG.20 | | | 1,880,000 | | 1.00 | % | | 6/20/18 | | | | 853 | | |
| | | | | | | | | | | | | $ | 75,778 | | |
| | |
| | Protection Sold: | | | | | | | | | | | | | | |
| ICE | | CDX.NA.IG.20 / Baa | | USD | 1,000,000 | | 1.00 | % | | 6/20/18 | | | $ | 7,307 | | |
| Total | | | | | | | | | | | | | $ | 83,085 | | |
The use of foreign currency exchange contracts, future contracts and swap contracts involves elements of market risk and risks in excess of the amounts disclosed in the financial statements. The foreign currency exchange contracts and notional values presented above represent the Fund’s total exposure in such contracts, whereas only the net unrealized appreciation (depreciation) is reflected in the Fund’s net assets.
1See Note 8 in “Notes to financial statements.”
2A CDS contract is a risk-transfer instrument through which one party (purchaser of protection) transfers to another party (seller of protection) the financial risk of a credit event (as defined in the CDS agreement), as it relates to a particular reference security or basket of securities (such as an index). Periodic payments (receipts) on such contracts are accrued daily and recorded as unrealized losses (gains) on swap contracts. Upon payment (receipt), such amounts are recorded as realized losses (gains) on swap contracts. Upfront payments made or received in connection with CDS contracts are amortized over the expected life of the CDS contracts as unrealized losses (gains) on swap contracts. The change in value of CDS contracts is recorded as unrealized appreciation or depreciation daily. A realized gain or loss is recorded upon a credit event (as defined in the CDS agreement) or the maturity or termination of the agreement.
46
| |
| Summary of abbreviations: |
BAML — Bank of America Merrill Lynch
CDS — Credit Default Swap
CDX.NA — Credit Default Swap Index North America
CME — Chicago Mercantile Exchange Inc.
GSC — Goldman Sachs Capital
HSBC — Hong Kong Shanghai Bank
ICE — Intercontinental Exchange, Inc.
IG — Investment Grade
INR — Indian Rupee
JPMC — JPMorgan Chase Bank
KRW — South Korean Won
TD — Toronto Dominion Bank
THB — Thailand Baht
USD — United States Dollar
yr — Year
See accompanying notes, which are an integral part of the financial statements.
47
Statements of assets and liabilities
July 31, 2013
| | Delaware | | Delaware |
| | Corporate | | Extended |
| | Bond | | Duration Bond |
| | Fund | | Fund |
| Assets: | | | | | | |
| Investments, at value1 | | $ | 1,470,802,159 | | $ | 745,054,961 |
| Short-term investments, at value | | | 1,579,853 | | | 1,030,717 |
| Short-term investments held as collateral for loaned | | | | | | |
| securities, at value | | | 377,699 | | | 171,899 |
| Cash | | | 292,941 | | | — |
| Cash collateral for derivatives | | | 4,412,286 | | | 9,053,205 |
| Receivable for securities sold | | | 34,427,725 | | | 30,133,043 |
| Dividends and interest receivable | | | 17,505,972 | | | 9,062,447 |
| Receivable for fund shares sold | | | 3,927,773 | | | 406,810 |
| Unrealized gain on credit default swap contracts2 | | | 11,981 | | | 11,981 |
| Securities lending income receivable | | | 291 | | | 88 |
| Foreign currencies, at value | | | — | | | 8,136 |
| Variation margin receivable on futures contracts | | | — | | | 385,313 |
| Total assets | | | 1,533,338,680 | | | 795,318,600 |
| |
| Liabilities: | | | | | | |
| Cash overdraft | | | — | | | 5,692,015 |
| Payable for securities purchased | | | 36,727,647 | | | 27,216,059 |
| Payable for fund shares redeemed | | | 10,175,196 | | | 2,986,081 |
| Due to brokers | | | 4,060,000 | | | 4,700,000 |
| Distributions payable | | | 2,121,667 | | | 1,117,009 |
| Due to manager and affiliates | | | 1,065,300 | | | 539,143 |
| Unrealized loss on credit default swap contracts3 | | | 395,617 | | | 219,055 |
| Obligation to return securities lending collateral | | | 377,699 | | | 171,899 |
| Unrealized loss of foreign currency exchange contracts | | | 73,995 | | | 37,725 |
| Annual protection payments on credit default swap contracts | | | 32,375 | | | 17,325 |
| Trustees fees payable | | | 4,519 | | | 2,254 |
| Other accrued expenses | | | 454,993 | | | 269,795 |
| Total liabilities | | | 55,489,008 | | | 42,968,360 |
| |
| Total Net Assets | | $ | 1,477,849,672 | | $ | 752,350,240 |
48
| Delaware | | Delaware |
| Corporate | | Extended |
| Bond | | Duration Bond |
| Fund | | Fund |
| Investments, at cost | $ | 1,455,898,283 | | $ | 742,387,097 |
| Short-term investments, at cost | | 1,579,817 | | | 1,030,671 |
| Short-term investments held as collateral for | | | | | |
| loaned securities, at cost | | 377,699 | | | 171,899 |
| Foreign currencies, at cost | | — | | | 8,577 |
| |
| 1Including securities on loan | | 364,863 | | | 159,181 |
| 2Including upfront payments received | | 4,674 | | | 4,674 |
| 3Including upfront payments paid | | 532,238 | | | 294,833 |
See accompanying notes, which are an integral part of the financial statements.
49
Statements of operations
Year Ended July 31, 2013
| | Delaware | | Delaware |
| | Corporate | | Extended |
| | | Bond | | Duration Bond |
| | Fund | | Fund |
| Investment Income: | | | | | | | |
| Interest | $ | 70,889,768 | | | $ | 43,218,201 | |
| Dividends | | 3,662,862 | | | | 2,181,022 | |
| Securities lending income | | 3,169 | | | | 860 | |
| Foreign tax withheld | | (9,854 | ) | | | (4,292 | ) |
| | | 74,545,945 | | | | 45,395,791 | |
| Expenses: | | | | | | | |
| Management fees | | 7,617,592 | | | | 4,721,180 | |
| Distribution expenses – Class A | | 2,089,172 | | | | 1,259,902 | |
| Distribution expenses – Class B | | 38,545 | | | | 14,323 | |
| Distribution expenses – Class C | | 2,959,200 | | | | 675,638 | |
| Distribution expenses – Class R | | 195,538 | | | | 193,653 | |
| Dividend disbursing and transfer agent fees and expenses | | 2,058,863 | | | | 1,104,741 | |
| Accounting and administration expenses | | 624,368 | | | | 346,938 | |
| Registration fees | | 187,069 | | | | 110,248 | |
| Reports and statements to shareholders | | 180,876 | | | | 99,755 | |
| Legal fees | | 118,748 | | | | 69,268 | |
| Trustees’ fees | | 73,467 | | | | 41,146 | |
| Audit and tax | | 53,710 | | | | 52,268 | |
| Custodian fees | | 50,732 | | | | 40,151 | |
| Consulting fees | | 24,732 | | | | 9,652 | |
| Insurance | | 23,932 | | | | 15,233 | |
| | Dues and services | | 15,131 | | | | 12,548 | |
| Pricing fees | | 12,879 | | | | 12,457 | |
| Trustees’ expenses | | 5,512 | | | | 3,178 | |
| | | 16,330,066 | | | | 8,782,279 | |
| Less fees waived | | (53,586 | ) | | | (373,633 | ) |
| Less waived distribution expenses – Class A | | (348,195 | ) | | | (209,984 | ) |
| Less waived distribution expenses – Class R | | (32,590 | ) | | | (32,275 | ) |
| Less expense paid indirectly | | (1,158 | ) | | | (764 | ) |
| Total operating expenses | | 15,894,537 | | | | 8,165,623 | |
| Net Investment Income | | 58,651,408 | | | | 37,230,168 | |
50
| Delaware | | Delaware |
| Corporate | | Extended |
| Bond | | Duration Bond |
| Fund | | Fund |
| Net Realized and Unrealized Gain (Loss): | | | | | | | |
| Net realized gain (loss) on: | | | | | | | |
| Investments | $ | 45,054,797 | | | $ | 32,976,433 | |
| Foreign currency exchange contracts | | (500,539 | ) | | | (386,953 | ) |
| Foreign currencies | | (997,836 | ) | | | (293,850 | ) |
| Futures contracts | | (1,492,706 | ) | | | (7,355,613 | ) |
| Swap contracts | | (5,877,915 | ) | | | (3,458,454 | ) |
| Net realized gain | | 36,185,801 | | | | 21,481,563 | |
| Net change in unrealized appreciation (depreciation) of: | | | | | | | |
| Investments | | (68,696,393 | ) | | | (61,449,987 | ) |
| �� Foreign currency exchange contracts | | 7,562 | | | | 12,820 | |
| Foreign currencies | | 30,324 | | | | 32,095 | |
| Futures contracts | | 744,025 | | | | (15,021,670 | ) |
| Swap contracts | | 158,574 | | | | 69,219 | |
| Net change in unrealized appreciation (depreciation) | | (67,755,908 | ) | | | (76,357,523 | ) |
| Net Realized and Unrealized Loss | | (31,570,107 | ) | | | (54,875,960 | ) |
| |
| Net Increase (Decrease) in Net Assets Resulting | | | | | | | |
| from Operations | $ | 27,081,301 | | | $ | (17,645,792 | ) |
See accompanying notes, which are an integral part of the financial statements.
51
Statements of changes in net assets
Delaware Corporate Bond Fund
| | Year Ended | |
| | 7/31/13 | | | | 7/31/12 | |
| Increase (Decrease) in Net Assets from Operations: | | | | | | | |
| Net investment income | $ | 58,651,408 | | | $ | 43,679,706 | |
| Net realized gain | | 36,185,801 | | | | 51,295,856 | |
| Net change in unrealized appreciation (depreciation) | | (67,755,908 | ) | | | 25,954,279 | |
| Net increase in net assets resulting from operations | | 27,081,301 | | | | 120,929,841 | |
| |
| Dividends and Distributions to Shareholders from: | | | | | | | |
| Net investment income: | | | | | | | |
| Class A | | (28,288,498 | ) | | | (22,783,611 | ) |
| Class B | | (127,345 | ) | | | (222,547 | ) |
| Class C | | (9,798,813 | ) | | | (7,012,765 | ) |
| Class R | | (1,245,842 | ) | | | (653,541 | ) |
| Institutional Class | | (25,015,345 | ) | | | (19,391,320 | ) |
| |
| Net realized gain: | | | | | | | |
| Class A | | (20,361,021 | ) | | | (9,737,378 | ) |
| Class B | | (131,376 | ) | | | (130,539 | ) |
| Class C | | (8,822,120 | ) | | | (3,416,230 | ) |
| Class R | | (924,113 | ) | | | (327,404 | ) |
| Institutional Class | | (16,995,529 | ) | | | (7,396,501 | ) |
| | | (111,710,002 | ) | | | (71,071,836 | ) |
| |
| Capital Share Transactions: | | | | | | | |
| Proceeds from shares sold: | | | | | | | |
| Class A | | 368,100,763 | | | | 338,262,584 | |
| Class B | | 110,275 | | | | 277,356 | |
| Class C | | 111,931,596 | | | | 123,176,095 | |
| Class R | | 26,685,735 | | | | 18,466,418 | |
| Institutional Class | | 347,608,276 | | | | 314,989,995 | |
| |
| Net asset value of shares issued upon reinvestment | | | | | | | |
| of dividends and distributions: | | | | | | | |
| Class A | | 44,850,645 | | | | 27,446,128 | |
| Class B | | 235,609 | | | | 291,222 | |
| Class C | | 15,633,554 | | | | 8,497,117 | |
| Class R | | 2,092,137 | | | | 939,673 | |
| Institutional Class | | 31,670,273 | | | | 20,864,861 | |
| | 948,918,863 | | | | 853,211,449 | |
52
| Year Ended |
| 7/31/13 | | 7/31/12 |
| Capital Share Transactions (continued): | | | | | | | |
| Cost of shares redeemed: | | | | | | | |
| Class A | $ | (369,539,804 | ) | | $ | (142,998,354 | ) |
| Class B | | (2,118,621 | ) | | | (2,675,205 | ) |
| Class C | | (87,443,381 | ) | | | (28,009,322 | ) |
| Class R | | (12,163,933 | ) | | | (9,386,693 | ) |
| Institutional Class | | (337,275,121 | ) | | | (311,470,376 | ) |
| | | (808,540,860 | ) | | | (494,539,950 | ) |
| Increase in net assets derived | | | | | | | |
| from capital share transactions | | 140,378,003 | | | | 358,671,499 | |
| Net Increase in Net Assets | | 55,749,302 | | | | 408,529,504 | |
| |
| Net Assets: | | | | | | | |
| Beginning of year | | 1,422,100,370 | | | | 1,013,570,866 | |
| End of year | $ | 1,477,849,672 | | | $ | 1,422,100,370 | |
| Undistributed (distributions in excess of) | | | | | | | |
| net investment income | $ | (2,451,578 | ) | | $ | 481,687 | |
See accompanying notes, which are an integral part of the financial statements.
53
Statements of changes in net assets
Delaware Extended Duration Bond Fund
| Year Ended |
| 7/31/13 | | 7/31/12 |
| Increase (Decrease) in Net Assets from Operations: | | | | | | | |
| Net investment income | $ | 37,230,168 | | | $ | 30,192,762 | |
| Net realized gain | | 21,481,563 | | | | 66,582,209 | |
| Net change in unrealized appreciation (depreciation) | | (76,357,523 | ) | | | 40,316,314 | |
| Net increase (decrease) in net assets resulting | | | | | | | |
| from operations | | (17,645,792 | ) | | | 137,091,285 | |
| |
| Dividends and Distributions to Shareholders from: | | | | | | | |
| Net investment income: | | | | | | | |
| Class A | | (17,732,920 | ) | | | (18,674,402 | ) |
| Class B | | (49,310 | ) | | | (83,820 | ) |
| Class C | | (2,340,813 | ) | | | (1,693,707 | ) |
| Class R | | (1,283,402 | ) | | | (707,267 | ) |
| Institutional Class | | (16,696,152 | ) | | | (10,881,982 | ) |
| |
| Net realized gain: | | | | | | | |
| Class A | | (26,584,887 | ) | | | (16,010,715 | ) |
| Class B | | (106,937 | ) | | | (85,710 | ) |
| Class C | | (4,355,789 | ) | | | (1,444,849 | ) |
| Class R | | (2,013,407 | ) | | | (571,733 | ) |
| Institutional Class | | (24,974,715 | ) | | | (7,635,267 | ) |
| | (96,138,332 | ) | | | (57,789,452 | ) |
| |
| Capital Share Transactions: | | | | | | | |
| Proceeds from shares sold: | | | | | | | |
| Class A | | 176,055,497 | | | | 171,059,055 | |
| Class B | | 6,167 | | | | 69,742 | |
| Class C | | 23,149,787 | | | | 36,352,988 | |
| Class R | | 23,714,553 | | | | 11,366,084 | |
| Institutional Class | | 180,099,398 | | | | 239,026,113 | |
| |
| Net asset value of shares issued upon reinvestment | | | | | | | |
| of dividends and distributions: | | | | | | | |
| Class A | | 43,012,945 | | | | 33,163,574 | |
| Class B | | 141,446 | | | | 142,406 | |
| Class C | | 6,018,770 | | | | 2,732,122 | |
| Class R | | 3,275,487 | | | | 1,271,526 | |
| Institutional Class | | 39,771,514 | | | | 16,470,816 | |
| | 495,245,564 | | | | 511,654,426 | |
54
| Year Ended |
| 7/31/13 | | 7/31/12 |
| Capital Share Transactions (continued): | | | | | | | |
| Cost of shares redeemed: | | | | | | | |
| Class A | $ | (197,053,239 | ) | | $ | (196,787,813 | ) |
| Class B | | (1,111,761 | ) | | | (762,272 | ) |
| Class C | | (35,543,957 | ) | | | (6,880,065 | ) |
| Class R | | (13,249,394 | ) | | | (5,300,925 | ) |
| Institutional Class | | (213,661,826 | ) | | | (63,403,613 | ) |
| | | (460,620,177 | ) | | | (273,134,688 | ) |
| Increase in net assets derived | | | | | | | |
| from capital share transactions | | 34,625,387 | | | | 238,519,738 | |
| Net Increase (Decrease) in Net Assets | | (79,158,737 | ) | | | 317,821,571 | |
| |
| Net Assets: | | | | | | | |
| Beginning of year | | 831,508,977 | | | | 513,687,406 | |
| End of year | $ | 752,350,240 | | | $ | 831,508,977 | |
| Undistributed (distributions in excess of) net | | | | | | | |
| investment income | $ | (2,030,832 | ) | | $ | 1,045,441 | |
See accompanying notes, which are an integral part of the financial statements.
55
Financial highlights
Delaware Corporate Bond Fund Class A
Selected data for each share of the Fund outstanding throughout each period were as follows:
| Net asset value, beginning of period |
| |
| Income (loss) from investment operations: |
| Net investment income1 |
| Net realized and unrealized gain (loss) |
| Total from investment operations |
| |
| Less dividends and distributions from: |
| Net investment income |
| Net realized gain |
| Total dividends and distributions |
| |
| Net asset value, end of period |
| |
| Total return2 |
| |
| Ratios and supplemental data: |
| Net assets, end of period (000 omitted) |
| Ratio of expenses to average net assets |
| Ratio of expenses to average net assets prior to fees waived |
| Ratio of net investment income to average net assets |
| Ratio of net investment income to average net assets prior to fees waived |
| Portfolio turnover |
1 The average shares outstanding method has been applied for per share information. |
2 Total investment return is based on the change in net asset value of a share during the period and assumes reinvestment of dividends and distributions at net asset value and does not reflect the impact of a sales charge. Total investment return during all of the periods shown reflects waivers by the distributor and/or manager. Performance would have been lower had the waivers not been in effect. |
See accompanying notes, which are an integral part of the financial statements.
56
| | Year Ended | | |
| | 7/31/13 | | | 7/31/12 | | | 7/31/11 | | | 7/31/10 | | | 7/31/09 | | |
| | $6.260 | | | $6.050 | | | $6.080 | | | $5.460 | | | $5.240 | | |
| | | | |
| | | | |
| | 0.230 | | | 0.246 | | | 0.268 | | | 0.309 | | | 0.314 | | |
| | (0.099 | ) | | 0.384 | | | 0.278 | | | 0.647 | | | 0.216 | | |
| | 0.131 | | | 0.630 | | | 0.546 | | | 0.956 | | | 0.530 | | |
| | | | |
| | | | |
| | (0.252 | ) | | (0.284 | ) | | (0.305 | ) | | (0.336 | ) | | (0.310 | ) | |
| | (0.189 | ) | | (0.136 | ) | | (0.271 | ) | | — | | | — | | |
| | (0.441 | ) | | (0.420 | ) | | (0.576 | ) | | (0.336 | ) | | (0.310 | ) | |
| | | | |
| | $5.950 | | | $6.260 | | | $6.050 | | | $6.080 | | | $5.460 | | |
| | | | |
| | 2.02% | | | 11.04% | | | 9.44% | | | 17.91% | | | 11.04% | | |
| | | | |
| | | | |
| | $645,585 | | | $638,481 | | | $392,313 | | | $409,671 | | | $459,892 | | |
| | 0.93% | | | 0.94% | | | 0.95% | | | 0.94% | | | 0.90% | | |
| | 0.98% | | | 1.01% | | | 1.09% | | | 1.10% | | | 1.11% | | |
| | 3.70% | | | 4.11% | | | 4.45% | | | 5.31% | | | 6.45% | | |
| | 3.65% | | | 4.04% | | | 4.31% | | | 5.15% | | | 6.24% | | |
| | 230% | | | 202% | | | 204% | | | 219% | | | 271% | | |
57
Financial highlights
Delaware Corporate Bond Fund Class B
Selected data for each share of the Fund outstanding throughout each period were as follows:
| Net asset value, beginning of period |
| |
| Income (loss) from investment operations: |
| Net investment income1 |
| Net realized and unrealized gain (loss) |
| Total from investment operations |
| |
| Less dividends and distributions from: |
| Net investment income |
| Net realized gain |
| Total dividends and distributions |
| |
| Net asset value, end of period |
| |
| Total return2 |
| |
| Ratios and supplemental data: |
| Net assets, end of period (000 omitted) |
| Ratio of expenses to average net assets |
| Ratio of expenses to average net assets prior to fees waived |
| Ratio of net investment income to average net assets |
| Ratio of net investment income to average net assets prior to fees waived |
| Portfolio turnover |
1 The average shares outstanding method has been applied for per share information. |
2 Total investment return is based on the change in net asset value of a share during the period and assumes reinvestment of dividends and distributions at net asset value and does not reflect the impact of a sales charge. Total investment return during some of the periods shown reflects a waiver by the manager. Performance would have been lower had the waiver not been in effect. |
See accompanying notes, which are an integral part of the financial statements.
58
| | Year Ended | |
| | 7/31/13 | | 7/31/12 | | 7/31/11 | | 7/31/10 | | 7/31/09 | |
| | $6.260 | | | $6.050 | | | $6.080 | | | $5.460 | | | $5.230 | | |
| | | | |
| | | | |
| | 0.183 | | | 0.200 | | | 0.223 | | | 0.265 | | | 0.278 | | |
| | (0.098 | ) | | 0.385 | | | 0.278 | | | 0.647 | | | 0.225 | | |
| | 0.085 | | | 0.585 | | | 0.501 | | | 0.912 | | | 0.503 | | |
| | | | |
| | | | |
| | (0.206 | ) | | (0.239 | ) | | (0.260 | ) | | (0.292 | ) | | (0.273 | ) | |
| | (0.189 | ) | | (0.136 | ) | | (0.271 | ) | | — | | | — | | |
| | (0.395 | ) | | (0.375 | ) | | (0.531 | ) | | (0.292 | ) | | (0.273 | ) | |
| | | | |
| | $5.950 | | | $6.260 | | | $6.050 | | | $6.080 | | | $5.460 | | |
| | | | |
| | 1.26% | | | 10.22% | | | 8.62% | | | 17.04% | | | 10.43% | | |
| | | | |
| | | | |
| | $2,802 | | | $4,739 | | | $6,705 | | | $9,807 | | | $11,938 | | |
| | 1.68% | | | 1.69% | | | 1.70% | | | 1.69% | | | 1.65% | | |
| | 1.68% | | | 1.71% | | | 1.79% | | | 1.80% | | | 1.81% | | |
| | 2.95% | | | 3.36% | | | 3.70% | | | 4.56% | | | 5.70% | | |
| | 2.95% | | | 3.34% | | | 3.61% | | | 4.45% | | | 5.54% | | |
| | 230% | | | 202% | | | 204% | | | 219% | | | 271% | | |
59
Financial highlights
Delaware Corporate Bond Fund Class C
Selected data for each share of the Fund outstanding throughout each period were as follows:
| Net asset value, beginning of period |
| |
| Income (loss) from investment operations: |
| Net investment income1 |
| Net realized and unrealized gain (loss) |
| Total from investment operations |
| |
| Less dividends and distributions from: |
| Net investment income |
| Net realized gain |
| Total dividends and distributions |
| |
| Net asset value, end of period |
| |
| Total return2 |
| |
| Ratios and supplemental data: |
| Net assets, end of period (000 omitted) |
| Ratio of expenses to average net assets |
| Ratio of expenses to average net assets prior to fees waived |
| Ratio of net investment income to average net assets |
| Ratio of net investment income to average net assets prior to fees waived |
| Portfolio turnover |
1 The average shares outstanding method has been applied for per share information. |
2 Total investment return is based on the change in net asset value of a share during the period and assumes reinvestment of dividends and distributions at net asset value and does not reflect the impact of a sales charge. Total investment return during some of the periods shown reflects a waiver by the manager. Performance would have been lower had the waiver not been in effect. |
See accompanying notes, which are an integral part of the financial statements.
60
| | Year Ended | |
| | 7/31/13 | | 7/31/12 | | 7/31/11 | | 7/31/10 | | 7/31/09 | |
| | $6.260 | | | $6.050 | | | $6.090 | | | $5.470 | | | $5.240 | | |
| | | | |
| | | | |
| | 0.183 | | | 0.202 | | | 0.223 | | | 0.266 | | | 0.278 | | |
| | (0.088 | ) | | 0.383 | | | 0.268 | | | 0.646 | | | 0.225 | | |
| | 0.095 | | | 0.585 | | | 0.491 | | | 0.912 | | | 0.503 | | |
| | | | |
| | | | |
| | | (0.206 | ) | | (0.239 | ) | | (0.260 | ) | | (0.292 | ) | | (0.273 | ) | |
| | (0.189 | ) | | (0.136 | ) | | (0.271 | ) | | — | | | — | | |
| | (0.395 | ) | | (0.375 | ) | | (0.531 | ) | | (0.292 | ) | | (0.273 | ) | |
| | | | |
| | $5.960 | | | $6.260 | | | $6.050 | | | $6.090 | | | $5.470 | | |
| | | | |
| | 1.43% | | | 10.21% | | | 8.44% | | | 17.01% | | | 10.41% | | |
| | | | |
| | | | |
| | $273,594 | | | $249,029 | | | $135,912 | | | $141,328 | | | $121,901 | | |
| | 1.68% | | | 1.69% | | | 1.70% | | | 1.69% | | | 1.65% | | |
| | 1.68% | | | 1.71% | | | 1.79% | | | 1.80% | | | 1.81% | | |
| | 2.95% | | | 3.36% | | | 3.70% | | | 4.56% | | | 5.70% | | |
| | 2.95% | | | 3.34% | | | 3.61% | | | 4.45% | | | 5.54% | | |
| | 230% | | | 202% | | | 204% | | | 219% | | | 271% | | |
61
Financial highlights
Delaware Corporate Bond Fund Class R
Selected data for each share of the Fund outstanding throughout each period were as follows:
| Net asset value, beginning of period |
| |
| Income (loss) from investment operations: |
| Net investment income1 |
| Net realized and unrealized gain (loss) |
| Total from investment operations |
| |
| Less dividends and distributions from: |
| Net investment income |
| Net realized gain |
| Total dividends and distributions |
| |
| Net asset value, end of period |
| |
| Total return2 |
| |
| Ratios and supplemental data: |
| Net assets, end of period (000 omitted) |
| Ratio of expenses to average net assets |
| Ratio of expenses to average net assets prior to fees waived |
| Ratio of net investment income to average net assets |
| Ratio of net investment income to average net assets prior to fees waived |
| Portfolio turnover |
1 The average shares outstanding method has been applied for per share information. |
2 Total investment return is based on the change in net asset value of a share during the period and assumes reinvestment of dividends and distributions at net asset value. Total investment return during all of the periods shown reflects waivers by the distributor and/or manager. Performance would have been lower had the waivers not been in effect. |
See accompanying notes, which are an integral part of the financial statements.
62
| | Year Ended | |
| | 7/31/13 | | 7/31/12 | | 7/31/11 | | 7/31/10 | | 7/31/09 | |
| | $6.270 | | | $6.050 | | | $6.090 | | | $5.470 | | | $5.240 | | |
| | | | |
| | | | |
| | 0.214 | | | 0.231 | | | 0.253 | | | 0.295 | | | 0.302 | | |
| | (0.098 | ) | | 0.394 | | | 0.268 | | | 0.646 | | | 0.226 | | |
| | 0.116 | | | 0.625 | | | 0.521 | | | 0.941 | | | 0.528 | | |
| | | | |
| | | | |
| | (0.237 | ) | | (0.269 | ) | | (0.290 | ) | | (0.321 | ) | | (0.298 | ) | |
| | (0.189 | ) | | (0.136 | ) | | (0.271 | ) | | — | | | — | | |
| | (0.426 | ) | | (0.405 | ) | | (0.561 | ) | | (0.321 | ) | | (0.298 | ) | |
| | | | |
| | $5.960 | | | $6.270 | | | $6.050 | | | $6.090 | | | $5.470 | | |
| | | | |
| | 1.77% | | | 10.94% | | | 8.98% | | | 17.60% | | | 10.97% | | |
| | | | |
| | | | |
| | $37,293 | | | $22,661 | | | $11,981 | | | $10,209 | | | $11,229 | | |
| | 1.18% | | | 1.19% | | | 1.20% | | | 1.19% | | | 1.15% | | |
| | 1.28% | | | 1.31% | | | 1.39% | | | 1.40% | | | 1.41% | | |
| | 3.45% | | | 3.86% | | | 4.20% | | | 5.06% | | | 6.20% | | |
| | 3.35% | | | 3.74% | | | 4.01% | | | 4.85% | | | 5.94% | | |
| | 230% | | | 202% | | | 204% | | | 219% | | | 271% | | |
63
Financial highlights
Delaware Corporate Bond Fund Institutional Class
Selected data for each share of the Fund outstanding throughout each period were as follows:
| Net asset value, beginning of period |
| |
| Income (loss) from investment operations: |
| Net investment income1 |
| Net realized and unrealized gain (loss) |
| Total from investment operations |
| |
| Less dividends and distributions from: |
| Net investment income |
| Net realized gain |
| Total dividends and distributions |
| |
| Net asset value, end of period |
| |
| Total return2 |
| |
| Ratios and supplemental data: |
| Net assets, end of period (000 omitted) |
| Ratio of expenses to average net assets |
| Ratio of expenses to average net assets prior to fees waived |
| Ratio of net investment income to average net assets |
| Ratio of net investment income to average net assets prior to fees waived |
| Portfolio turnover |
1 The average shares outstanding method has been applied for per share information. |
2 Total investment return is based on the change in net asset value of a share during the period and assumes reinvestment of dividends and distributions at net asset value. Total investment return during some of the periods shown reflects a waiver by the manager. Performance would have been lower had the waiver not been in effect. |
See accompanying notes, which are an integral part of the financial statements.
64
| | Year Ended | |
| | 7/31/13 | | 7/31/12 | | 7/31/11 | | 7/31/10 | | 7/31/09 | |
| | $6.260 | | | $6.050 | | | $6.090 | | | $5.470 | | | $5.240 | | |
| | | | |
| | | | |
| | 0.245 | | | 0.261 | | | 0.283 | | | 0.329 | | | 0.327 | | |
| | (0.098 | ) | | 0.384 | | | 0.268 | | | 0.641 | | | 0.225 | | |
| | 0.147 | | | 0.645 | | | 0.551 | | | 0.970 | | | 0.552 | | |
| | | | |
| | | | |
| | (0.268 | ) | | (0.299 | ) | | (0.320 | ) | | (0.350 | ) | | (0.322 | ) | |
| | (0.189 | ) | | (0.136 | ) | | (0.271 | ) | | — | | | — | | |
| | (0.457 | ) | | (0.435 | ) | | (0.591 | ) | | (0.350 | ) | | (0.322 | ) | |
| | | | |
| | $5.950 | | | $6.260 | | | $6.050 | | | $6.090 | | | $5.470 | | |
| | | | |
| | 2.28% | | | 11.32% | | | 9.52% | | | 18.40% | | | 11.53% | | |
| | | | |
| | | | |
| | $518,576 | | | $507,190 | | | $466,660 | | | $357,801 | | | $50,235 | | |
| | 0.68% | | | 0.69% | | | 0.70% | | | 0.69% | | | 0.65% | | |
| | 0.68% | | | 0.71% | | | 0.79% | | | 0.80% | | | 0.81% | | |
| | 3.95% | | | 4.36% | | | 4.70% | | | 5.56% | | | 6.70% | | |
| | 3.95% | | | 4.34% | | | 4.61% | | | 5.45% | | | 6.54% | | |
| | 230% | | | 202% | | | 204% | | | 219% | | | 271% | | |
65
Financial highlights
Delaware Extended Duration Bond Fund Class A
Selected data for each share of the Fund outstanding throughout each period were as follows:
| Net asset value, beginning of period |
| |
| Income (loss) from investment operations: |
| Net investment income1 |
| Net realized and unrealized gain (loss) |
| Total from investment operations |
| |
| Less dividends and distributions from: |
| Net investment income |
| Net realized gain |
| Total dividends and distributions |
| |
| Net asset value, end of period |
| |
| Total return2 |
| |
| Ratios and supplemental data: |
| Net assets, end of period (000 omitted) |
| Ratio of expenses to average net assets |
| Ratio of expenses to average net assets prior to fees waived |
| Ratio of net investment income to average net assets |
| Ratio of net investment income to average net assets prior to fees waived |
| Portfolio turnover |
1 The average shares outstanding method has been applied for per share information. |
2 Total investment return is based on the change in net asset value of a share during the period and assumes reinvestment of dividends and distributions at net asset value and does not reflect the impact of a sales charge. Total investment return during all of the periods shown reflects waivers by the manager and distributor. Performance would have been lower had the waivers not been in effect. |
See accompanying notes, which are an integral part of the financial statements.
66
| | Year Ended | |
| | 7/31/13 | | 7/31/12 | | 7/31/11 | | 7/31/10 | | | 7/31/09 | |
| | $7.150 | | | $6.380 | | | $6.440 | | | $5.600 | | | $5.210 | | |
| | | | | |
| | | | | |
| | 0.280 | | | 0.300 | | | 0.318 | | | 0.348 | | | 0.344 | | |
| | (0.427 | ) | | 1.055 | | | 0.268 | | | 0.850 | | | 0.385 | | |
| | (0.147 | ) | | 1.355 | | | 0.586 | | | 1.198 | | | 0.729 | | |
| | | | | |
| | | | | |
| | (0.287 | ) | | (0.319 | ) | | (0.329 | ) | | (0.358 | ) | | (0.339 | ) | |
| | (0.436 | ) | | (0.266 | ) | | (0.317 | ) | | — | | | — | | |
| | (0.723 | ) | | (0.585 | ) | | (0.646 | ) | | (0.358 | ) | | (0.339 | ) | |
| | | | | |
| | $6.280 | | | $7.150 | | | $6.380 | | | $6.440 | | | $5.600 | | |
| | | | | |
| | (2.45% | ) | | 22.48% | | | 9.74% | | | 22.00% | | | 15.17% | | |
| | | | | |
| | | | | |
| | $370,553 | | | $402,639 | | | $352,060 | | | $275,312 | | | $184,538 | | |
| | 0.95% | | | 0.95% | | | 0.95% | | | 0.94% | | | 0.90% | | |
| | 1.04% | | | 1.06% | | | 1.12% | | | 1.18% | | | 1.29% | | |
| | 4.13% | | | 4.53% | | | 5.07% | | | 5.77% | | | 7.03% | | |
| | 4.04% | | | 4.42% | | | 4.90% | | | 5.53% | | | 6.64% | | |
| | 217% | | | 172% | | | 147% | | | 149% | | | 234% | | |
67
Financial highlights
Delaware Extended Duration Bond Fund Class B
Selected data for each share of the Fund outstanding throughout each period were as follows:
| Net asset value, beginning of period |
| |
| Income (loss) from investment operations: |
| Net investment income1 |
| Net realized and unrealized gain (loss) |
| Total from investment operations |
| |
| Less dividends and distributions from: |
| Net investment income |
| Net realized gain |
| Total dividends and distributions |
| |
| Net asset value, end of period |
| |
| Total return2 |
| |
| Ratios and supplemental data: |
| Net assets, end of period (000 omitted) |
| Ratio of expenses to average net assets |
| Ratio of expenses to average net assets prior to fees waived |
| Ratio of net investment income to average net assets |
| Ratio of net investment income to average net assets prior to fees waived |
| Portfolio turnover |
1 The average shares outstanding method has been applied for per share information. |
2 Total investment return is based on the change in net asset value of a share during the period and assumes reinvestment of dividends and distributions at net asset value and does not reflect the impact of a sales charge. Total investment return during all of the periods shown reflects a waiver by the manager. Performance would have been lower had the waiver not been in effect. |
See accompanying notes, which are an integral part of the financial statements.
68
| | Year Ended | | |
| | 7/31/13 | | | 7/31/12 | | | 7/31/11 | | | 7/31/10 | | | 7/31/09 | | |
| | $7.140 | | | $6.370 | | | $6.430 | | | $5.590 | | | $5.200 | | |
| | | | |
| | | | |
| | 0.230 | | | 0.249 | | | 0.271 | | | 0.301 | | | 0.307 | | |
| | (0.428 | ) | | 1.057 | | | 0.268 | | | 0.852 | | | 0.384 | | |
| | (0.198 | ) | | 1.306 | | | 0.539 | | | 1.153 | | | 0.691 | | |
| | | | |
| | | | |
| | (0.236 | ) | | (0.270 | ) | | (0.282 | ) | | (0.313 | ) | | (0.301 | ) | |
| | (0.436 | ) | | (0.266 | ) | | (0.317 | ) | | — | | | — | | |
| | (0.672 | ) | | (0.536 | ) | | (0.599 | ) | | (0.313 | ) | | (0.301 | ) | |
| | | | |
| | $6.270 | | | $7.140 | | | $6.370 | | | $6.430 | | | $5.590 | | |
| | | | |
| | (3.19% | ) | | 21.61% | | | 8.93% | | | 21.13% | | | 14.33% | | |
| | | | |
| | | | |
| | $749 | | | $1,887 | | | $2,219 | | | $3,464 | | | $3,992 | | |
| | 1.70% | | | 1.70% | | | 1.70% | | | 1.69% | | | 1.65% | | |
| | 1.74% | | | 1.76% | | | 1.82% | | | 1.88% | | | 1.99% | | |
| | 3.38% | | | 3.78% | | | 4.32% | | | 5.02% | | | 6.28% | | |
| | 3.34% | | | 3.72% | | | 4.20% | | | 4.83% | | | 5.94% | | |
| | 217% | | | 172% | | | 147% | | | 149% | | | 234% | | |
69
Financial highlights
Delaware Extended Duration Bond Fund Class C
Selected data for each share of the Fund outstanding throughout each period were as follows:
| Net asset value, beginning of period |
| |
| Income (loss) from investment operations: |
| Net investment income1 |
| Net realized and unrealized gain (loss) |
| Total from investment operations |
| |
| Less dividends and distributions from: |
| Net investment income |
| Net realized gain |
| Total dividends and distributions |
| |
| Net asset value, end of period |
| |
| Total return2 |
| |
| Ratios and supplemental data: |
| Net assets, end of period (000 omitted) |
| Ratio of expenses to average net assets |
| Ratio of expenses to average net assets prior to fees waived |
| Ratio of net investment income to average net assets |
| Ratio of net investment income to average net assets prior to fees waived |
| Portfolio turnover |
1 The average shares outstanding method has been applied for per share information. |
2 Total investment return is based on the change in net asset value of a share during the period and assumes reinvestment of dividends and distributions at net asset value and does not reflect the impact of a sales charge. Total investment return during all of the periods shown reflects a waiver by the manager. Performance would have been lower had the waiver not been in effect. |
See accompanying notes, which are an integral part of the financial statements.
70
| Year Ended |
| | 7/31/13 | | | 7/31/12 | | | 7/31/11 | | | 7/31/10 | | | 7/31/09 | | |
| | $7.150 | | | $6.380 | | | $6.430 | | | $5.600 | | | $5.210 | | |
| | | | |
| | | | |
| | 0.230 | | | 0.251 | | | 0.272 | | | 0.302 | | | 0.307 | | |
| | (0.428 | ) | | 1.055 | | | 0.277 | | | 0.841 | | | 0.385 | | |
| | (0.198 | ) | | 1.306 | | | 0.549 | | | 1.143 | | | 0.692 | | |
| | | | |
| | | | |
| | (0.236 | ) | | (0.270 | ) | | (0.282 | ) | | (0.313 | ) | | (0.302 | ) | |
| | (0.436 | ) | | (0.266 | ) | | (0.317 | ) | | — | | | — | | |
| | (0.672 | ) | | (0.536 | ) | | (0.599 | ) | | (0.313 | ) | | (0.302 | ) | |
| | | | |
| | $6.280 | | | $7.150 | | | $6.380 | | | $6.430 | | | $5.600 | | |
| | | | |
| | (3.17% | ) | | 21.57% | | | 9.09% | | | 20.91% | | | 14.32% | | |
| | | | |
| | | | |
| | $47,326 | | | $62,275 | | | $24,532 | | | $23,115 | | | $19,120 | | |
| | 1.70% | | | 1.70% | | | 1.70% | | | 1.69% | | | 1.65% | | |
| | 1.74% | | | 1.76% | | | 1.82% | | | 1.88% | | | 1.99% | | |
| | 3.38% | | | 3.78% | | | 4.32% | | | 5.02% | | | 6.28% | | |
| | 3.34% | | | 3.72% | | | 4.20% | | | 4.83% | | | 5.94% | | |
| | 217% | | | 172% | | | 147% | | | 149% | | | 234% | | |
71
Financial highlights
Delaware Extended Duration Bond Fund Class R
Selected data for each share of the Fund outstanding throughout each period were as follows:
| Net asset value, beginning of period |
| |
| Income (loss) from investment operations: |
| Net investment income1 |
| Net realized and unrealized gain (loss) |
| Total from investment operations |
| |
| Less dividends and distributions from: |
| Net investment income |
| Net realized gain |
| Total dividends and distributions |
| |
| Net asset value, end of period |
| |
| Total return2 |
| |
| Ratios and supplemental data: |
| Net assets, end of period (000 omitted) |
| Ratio of expenses to average net assets |
| Ratio of expenses to average net assets prior to fees waived |
| Ratio of net investment income to average net assets |
| Ratio of net investment income to average net assets prior to fees waived |
| Portfolio turnover |
1 The average shares outstanding method has been applied for per share information. |
2 Total investment return is based on the change in net asset value of a share during the period and assumes reinvestment of dividends and distributions at net asset value. Total investment return during all of the periods shown reflects waivers by the manager and distributor. Performance would have been lower had the waivers not been in effect. |
See accompanying notes, which are an integral part of the financial statements.
72
| Year Ended |
| | 7/31/13 | | | 7/31/12 | | | 7/31/11 | | | 7/31/10 | | | 7/31/09 | | |
| | $7.160 | | | $6.390 | | | $6.440 | | | $5.600 | | | $5.210 | | |
| | | | |
| | | | |
| | 0.263 | | | 0.284 | | | 0.303 | | | 0.339 | | | 0.332 | | |
| | (0.426 | ) | | 1.055 | | | 0.278 | | | 0.845 | | | 0.385 | | |
| | (0.163 | ) | | 1.339 | | | 0.581 | | | 1.184 | | | 0.717 | | |
| | | | |
| | | | |
| | (0.271 | ) | | (0.303 | ) | | (0.314 | ) | | (0.344 | ) | | (0.327 | ) | |
| | (0.436 | ) | | (0.266 | ) | | (0.317 | ) | | — | | | — | | |
| | (0.707 | ) | | (0.569 | ) | | (0.631 | ) | | (0.344 | ) | | (0.327 | ) | |
| | | | |
| | $6.290 | | | $7.160 | | | $6.390 | | | $6.440 | | | $5.600 | | |
| | | | |
| | (2.68% | ) | | 22.15% | | | 9.63% | | | 21.48% | | | 15.08% | | |
| | | | |
| | | | |
| | $29,423 | | | $20,080 | | | $10,800 | | | $14,131 | | | $665 | | |
| | 1.20% | | | 1.20% | | | 1.20% | | | 1.19% | | | 1.15% | | |
| | 1.34% | | | 1.36% | | | 1.42% | | | 1.48% | | | 1.59% | | |
| | 3.88% | | | 4.28% | | | 4.82% | | | 5.52% | | | 6.78% | | |
| | 3.74% | | | 4.12% | | | 4.60% | | | 5.23% | | | 6.34% | | |
| | 217% | | | 172% | | | 147% | | | 149% | | | 234% | | |
73
Financial highlights
Delaware Extended Duration Bond Fund Institutional Class
Selected data for each share of the Fund outstanding throughout each period were as follows:
| Net asset value, beginning of period |
| |
| Income (loss) from investment operations: |
| Net investment income1 |
| Net realized and unrealized gain (loss) |
| Total from investment operations |
| |
| Less dividends and distributions from: |
| Net investment income |
| Net realized gain |
| Total dividends and distributions |
| |
| Net asset value, end of period |
| |
| Total return2 |
| |
| Ratios and supplemental data: |
| Net assets, end of period (000 omitted) |
| Ratio of expenses to average net assets |
| Ratio of expenses to average net assets prior to fees waived |
| Ratio of net investment income to average net assets |
| Ratio of net investment income to average net assets prior to fees waived |
| Portfolio turnover |
1 The average shares outstanding method has been applied for per share information. |
2 Total investment return is based on the change in net asset value of a share during the period and assumes reinvestment of dividends and distributions at net asset value. Total investment return during all of the periods shown reflects a waiver by the manager. Performance would have been lower had the waiver not been in effect. |
See accompanying notes, which are an integral part of the financial statements.
74
| Year Ended |
| | 7/31/13 | | | 7/31/12 | | | 7/31/11 | | | 7/31/10 | | | 7/31/09 | | |
| | $7.140 | | | $6.370 | | | $6.430 | | | $5.590 | | | $5.200 | | |
| | | | |
| | | | |
| | 0.297 | | | 0.317 | | | 0.332 | | | 0.364 | | | 0.356 | | |
| | (0.427 | ) | | 1.055 | | | 0.269 | | | 0.849 | | | 0.385 | | |
| | (0.130 | ) | | 1.372 | | | 0.601 | | | 1.213 | | | 0.741 | | |
| | | | |
| | | | |
| | (0.304 | ) | | (0.336 | ) | | (0.344 | ) | | (0.373 | ) | | (0.351 | ) | |
| | (0.436 | ) | | (0.266 | ) | | (0.317 | ) | | — | | | — | | |
| | (0.740 | ) | | (0.602 | ) | | (0.661 | ) | | (0.373 | ) | | (0.351 | ) | |
| | | | |
| | $6.270 | | | $7.140 | | | $6.370 | | | $6.430 | | | $5.590 | | |
| | | | |
| | (2.21% | ) | | 22.82% | | | 10.01% | | | 22.33% | | | 15.48% | | |
| | | | |
| | | | |
| | $304,299 | | | $344,628 | | | $124,076 | | | $49,310 | | | $26,223 | | |
| | 0.70% | | | 0.70% | | | 0.70% | | | 0.69% | | | 0.65% | | |
| | 0.74% | | | 0.76% | | | 0.82% | | | 0.88% | | | 0.99% | | |
| | 4.38% | | | 4.78% | | | 5.32% | | | 6.02% | | | 7.28% | | |
| | 4.34% | | | 4.72% | | | 5.20% | | | 5.83% | | | 6.94% | | |
| | 217% | | | 172% | | | 147% | | | 149% | | | 234% | | |
75
| Notes to financial statements |
| Delaware Corporate Bond Fund and Delaware Extended Duration Bond Fund | July 31, 2013 |
Delaware Group® Income Funds (Trust) is organized as a Delaware statutory trust and offers five series: Delaware Core Bond Fund, Delaware Corporate Bond Fund, Delaware Diversified Floating Rate Fund, Delaware Extended Duration Bond Fund and Delaware High-Yield Opportunities Fund. These financial statements and the related notes pertain to Delaware Corporate Bond Fund and Delaware Extended Duration Bond Fund (each, a Fund or collectively, the Funds). The Trust is an open-end investment company. The Funds are considered diversified under the Investment Company Act of 1940, as amended, and offer Class A, Class B, Class C, Class R and Institutional Class shares. Class A shares are sold with a maximum front-end sales charge of 4.50%. Class A share purchases of $1,000,000 or more will incur a contingent deferred sales charge (CDSC) of 1.00% if redeemed during the first year and 0.50% during the second year, provided that Delaware Distributors, L.P. (DDLP) paid a financial advisor a commission on the purchase of those shares. Class B shares may be purchased only through dividend reinvestment and certain permitted exchanges. Prior to June 1, 2007, Class B shares were sold with a CDSC that declined from 4.00% to zero depending upon the period of time the shares were held. Class B shares will automatically convert to Class A shares on a quarterly basis approximately eight years after purchase. Class C shares are sold with a CDSC of 1.00%, if redeemed during the first twelve months. Class R and Institutional Class shares are not subject to a sales charge and are offered for sale exclusively to certain eligible investors.
The investment objective of the Funds is to seek to provide investors with total return.
1. Significant Accounting Policies
The following accounting policies are in accordance with U.S. generally accepted accounting principles (U.S. GAAP) and are consistently followed by the Funds.
Security Valuation — Equity securities, except those traded on the Nasdaq Stock Market, Inc. (Nasdaq), are valued at the last quoted sales price as of the time of the regular close of the New York Stock Exchange (NYSE) on the valuation date. Securities traded on the Nasdaq are valued in accordance with the Nasdaq Official Closing Price, which may not be the last sales price. If on a particular day an equity security does not trade, then the mean between the bid and ask prices will be used, which approximates fair value. Debt securities, credit default swap (CDS) contracts and interest rate swap options contracts (swaptions) are valued based upon valuations provided by an independent pricing service or broker/counterparty and reviewed by management. To the extent current market prices are not available, the pricing service may take into account developments related to the specific security, as well as transactions in comparable securities. U.S. government and agency securities are valued at the mean between the bid and ask prices, which approximates fair value. For asset backed securities, collateralized mortgage obligations, commercial mortgage securities and U.S. government agency mortgage securities, pricing vendors utilize matrix pricing which considers prepayment speed, attributes of the collateral, yield or price of bonds of comparable quality, coupon, maturity and type as well as broker/dealer-supplied prices. Swap prices are derived using daily swap curves and models that incorporate a number of market data factors, such as discounted cash flows, trades and values of the underlying reference instruments. Investment company securities are valued at net asset value per share, as reported
76
by the underlying investment company. Foreign currency exchange contracts and foreign cross currency exchange contracts are valued at the mean between the bid and ask prices, which approximates fair value. Interpolated values are derived when the settlement date of the contract is an interim date for which quotations are not available. Futures contracts are valued at the daily quoted settlement prices. Generally, other securities and assets for which market quotations are not readily available are valued at fair value as determined in good faith under the direction of each Fund’s Board of Trustees (Board). In determining whether market quotations are readily available or fair valuation will be used, various factors will be taken into consideration, such as market closures or suspension of trading in a security.
Federal & Foreign Income Taxes — No provision for federal income taxes has been made as each Fund intends to continue to qualify for federal income tax purposes as a regulated investment company under Subchapter M of the Internal Revenue Code of 1986, as amended, and make the requisite distributions to shareholders. The Funds evaluate tax positions taken or expected to be taken in the course of preparing the Funds’ tax returns to determine whether the tax positions are “more-likely-than-not” of being sustained by the applicable tax authority. Tax positions not deemed to meet the “more-likely-than-not” threshold are recorded as a tax benefit or expense in the current year. Management has analyzed each Fund’s tax positions taken for all open federal income tax years (July 31, 2010 – July 31, 2013) and has concluded that no provision for federal income tax is required in the Funds’ financial statements. In regard to foreign taxes only, each Fund has open tax years in certain foreign countries it invests in that may date back to the inception of each Fund.
Class Accounting — Investment income and common expenses are allocated to the various classes of each Fund on the basis of “settled shares” of each class in relation to the net assets of each Fund. Realized and unrealized gains (loss) on investments are allocated to the various classes of each Fund on the basis of daily net assets of each class. Distribution expenses relating to a specific class are charged directly to that class.
Repurchase Agreements — The Funds may purchase certain U.S. government securities subject to the counterparty’s agreement to repurchase them at an agreed upon date and price. The counterparty will be required on a daily basis to maintain the value of the collateral subject to the agreement at not less than the repurchase price (including accrued interest). The agreements are conditioned upon the collateral being deposited under the Federal Reserve book-entry system with the Funds’ custodian or a third-party sub-custodian. In the event of default or bankruptcy by the other party to the agreement, retention of the collateral may be subject to legal proceedings. At July 31, 2013, the Funds held no investments in repurchase agreements.
Foreign Currency Transactions — Transactions denominated in foreign currencies are recorded at the prevailing exchange rates on the valuation date in accordance with the Funds’ prospectus. The value of all assets and liabilities denominated in foreign currencies is translated daily into U.S. dollars at the exchange rate of such currencies against the U.S. dollar. Transaction gains or losses resulting from changes in exchange rates during the reporting period or upon settlement of the foreign currency transaction are reported in operations for the current period.
77
Notes to financial statements
Delaware Corporate Bond Fund and Delaware Extended Duration Bond Fund
1. Significant Accounting Policies (continued)
The Funds generally bifurcate that portion of realized gains and losses on investments in debt securities which is due to changes in foreign exchange rates from that which is due to changes in market prices of debt securities. That portion of gains (losses) is included in the statements of operations under the caption net realized gain (loss) on foreign currencies. The Funds report certain foreign currency related transactions as components of realized gains (losses) for financial reporting purposes, whereas such components are treated as ordinary income (loss) for federal income tax purposes.
Use of Estimates — The preparation of financial statements in conformity with U.S. GAAP requires management to make estimates and assumptions that affect the fair value of investments, the reported amounts of assets and liabilities and disclosure of contingent assets and liabilities at the date of the financial statements and the reported amounts of revenues and expenses during the reporting period. Actual results could differ from those estimates and the differences could be material.
Other — Expenses directly attributable to a Fund are charged directly to that Fund. Other expenses common to various funds within the Delaware Investments® Family of Funds are generally allocated among such funds on the basis of average net assets. Management fees and some other expenses are paid monthly. Security transactions are recorded on the date the securities are purchased or sold (trade date) for financial reporting purposes. Costs used in calculating realized gains and losses on the sale of investment securities are those of the specific securities sold. Dividend income is recorded on the ex-dividend date and interest income is recorded on the accrual basis. Discounts and premiums on debt securities are amortized to interest income over the lives of the respective securities using the effective interest method. Realized gains (losses) on paydowns of asset- and mortgage-backed securities are classified as interest income. Withholding taxes and reclaims on foreign interest have been recorded in accordance with the Funds’ understanding of the applicable country’s tax rules and rates. Each Fund paid foreign capital gains taxes on certain foreign securities held as components of realized losses for financial reporting purposes, whereas such components are treated as ordinary loss for federal income tax purposes. Each Fund declares dividends daily from net investment income and pays the dividends monthly and declares and pays distributions from net realized gain on investments, if any, annually. Each Fund may distribute more frequently, if necessary for tax purposes. Dividends and distributions, if any, are recorded on the ex-dividend date.
Each Fund may receive earnings credits from its custodian when positive cash balances are maintained, which are used to offset custody fees. There were no earnings credits for the year ended July 31, 2013.
78
Each Fund receives earnings credits from its transfer agent when positive cash balances are maintained, which are used to offset transfer agent fees. If the amount is greater than one dollar, the expense paid under this arrangement is included in dividend disbursing and transfer agent fees and expenses and appears on the statements of operations with the corresponding expense offset shown as “expense paid indirectly.” For the year ended July 31, 2013, each Fund earned the following amounts under this agreement:
| | Delaware
Corporate
Bond Fund | | Delaware
Extended Duration
Bond Fund |
| | | $1,158 | | $764 |
2. | Investment Management, Administration Agreements and Other Transactions with Affiliates |
In accordance with the terms of its respective investment management agreement, each Fund pays Delaware Management Company (DMC), a series of Delaware Management Business Trust and the investment manager, an annual fee which is calculated based on each Fund’s average daily net assets as follows:
| | Delaware
Corporate
Bond Fund | | Delaware
Extended Duration
Bond Fund |
| On the first $500 million | | | 0.500% | | | | 0.550% | |
| On the next $500 million | | | 0.475% | | | | 0.500% | |
| On the next $1.5 billion | | | 0.450% | | | | 0.450% | |
| In excess of $2.5 billion | | | 0.425% | | | | 0.425% | |
DMC has contractually agreed to waive that portion, if any, of its management fee and/or pay/reimburse each Fund to the extent necessary to prevent total annual operating expenses (excluding any 12b-1 fees, taxes, interest, inverse floater program expenses, short sale and dividend interest expenses, brokerage fees, certain insurance costs, and nonroutine expenses or costs including, but not limited to, those relating to reorganizations, litigation, conducting shareholder meetings and liquidations) (collectively, non routine expenses)) from exceeding the following percentages of each Fund’s average daily net assets from Nov. 28, 2012 through Nov. 28, 2013. The contractual waivers did not change from prior fiscal year end. These waivers and reimbursements may only be terminated by agreement of the DMC and the Funds.
| | Delaware
Corporate
Bond Fund | | Delaware
Extended Duration
Bond Fund |
| | | 0.69% | | 0.70% |
79
Notes to financial statements
Delaware Corporate Bond Fund and Delaware Extended Duration Bond Fund
2. | Investment Management, Administration Agreements and Other Transactions with Affiliates (continued) |
Delaware Service Company, Inc. (DSC), an affiliate of DMC, provides fund accounting and financial administration oversight services to the Funds. For these services, the Funds pay DSC fees based on the aggregate daily net assets of the Delaware Investments® Family of Funds at the following annual rate: 0.0050% of the first $30 billion; 0.0045% of the next $10 billion; 0.0040% of the next $10 billion; and 0.0025% of aggregate average daily net assets in excess of $50 billion. The fees payable to DSC under the service agreement described above are allocated among all Funds in the Delaware Investments Family of Funds on a relative net asset value basis. For the year ended July 31, 2013, the Funds were charged for these services as follows:
| | Delaware
Corporate
Bond Fund | | Delaware
Extended Duration
Bond Fund |
| | | $78,089 | | $43,394 |
DSC is also the transfer agent and dividend disbursing agent of the Funds. The Funds pay DSC a monthly asset-based fee for these services. Pursuant to a sub-transfer agency agreement between DSC and BNY Mellon Investment Servicing (US) Inc. (BNYMIS), BNYMIS provides certain sub-transfer agency services to the Funds. Sub-transfer agency fees are passed on to and paid directly by the Funds.
Pursuant to a distribution agreement and distribution plan, each Fund pays DDLP, the distributor and an affiliate of DMC, an annual distribution and service fee of 0.30% of the average daily net assets of the Class A shares, 1.00% of the average daily net assets of the Class B and C shares and 0.60% of the average daily net assets of the Class R shares. Institutional Class shares pay no distribution and service expenses. DDLP has contracted to limit the Class A and Class R shares’ 12b-1 fees for each Fund from Nov. 28, 2012 through Nov. 28, 2013 to no more than 0.25% and 0.50%, respectively, of the classes’ average daily net assets.
At July 31, 2013, each Fund had liabilities payable to affiliates as follows:
| | Delaware
Corporate
Bond Fund | | Delaware
Extended Duration
Bond Fund |
| Investment management fees payable to DMC | | | $ | 560,565 | | | | $ | 353,269 | |
Dividend disbursing, transfer agent and fund accounting
oversight fees and other expenses payable to DSC | | | | 34,882 | | | | | 17,524 | |
| Distribution fees payable to DDLP | | | | 396,832 | | | | | 137,302 | |
| Other expenses payable to DMC and affiliates* | | | | 73,021 | | | | | 31,048 | |
| * | DMC, as part of its administrative services, pays operating expenses on behalf of each Fund and is reimbursed on a periodic basis. Expenses include items such as printing of shareholder reports, legal and tax services, registration fees and trustees’ fees. |
80
As provided in the investment management agreement, each Fund bears the cost of certain legal and tax services, including internal legal and tax services provided to each Fund by DMC and/or its affiliates’ employees. For the year ended July 31, 2013, the Funds were charged for internal legal and tax services provided by DMC and/or its affiliates’ employees as follows:
| | Delaware
Corporate
Bond Fund | | Delaware
Extended Duration
Bond Fund |
| | | $47,784 | | $26,730 |
For the year ended July 31, 2013, DDLP earned commissions on sales of Class A shares for each Fund as follows:
| | Delaware
Corporate
Bond Fund | | Delaware
Extended Duration
Bond Fund |
| | | $218,666 | | $94,902 |
For the year ended July 31, 2013, DDLP received gross CDSC commissions on redemptions of each Fund’s Class A, Class B, and Class C shares, respectively and these commissions were entirely used to offset up-front commissions previously paid by DDLP to broker/dealers on sales of those shares. The amounts received were as follows:
| | Delaware
Corporate
Bond Fund | | Delaware
Extended Duration
Bond Fund |
| Class A | | | $ | 51 | | | | $ | 1 | |
| Class B | | | | 2 | | | | | 400 | |
| Class C | | | | 13,498 | | | | | 15,695 | |
Trustees’ fees include expenses accrued by the Funds for each Trustee’s retainer and meeting fees. Certain officers of DMC, DSC and DDLP are officers and/or Trustees of the Trust. These officers and Trustees are paid no compensation by the Funds.
3. Investments
For the year ended July 31, 2013, the Funds made purchases and sales of investments securities other than short-term investments as follows:
| | Delaware
Corporate
Bond Fund | | Delaware
Extended Duration
Bond Fund |
| Purchases other than U.S. government securities | | $ | 3,478,797,978 | | $ | 1,643,097,539 |
| Purchases of U.S. government securities | | | 243,024,563 | | | 251,334,106 |
| Sales other than U.S. government securities | | | 3,330,890,362 | | | 1,666,345,251 |
| Sales of U.S. government securities | | | 264,138,236 | | | 269,852,622 |
81
Notes to financial statements
Delaware Corporate Bond Fund and Delaware Extended Duration Bond Fund
3. Investments (continued)
At July 31, 2013, the cost of investments and unrealized appreciation (depreciation) for federal income tax purposes for each Fund were as follows:
| | Delaware
Corporate
Bond Fund | | Delaware
Extended Duration
Bond Fund |
| Cost of investments | | $ | 1,467,997,180 | | | | $ | 745,484,757 | | |
| Aggregate unrealized appreciation | | $ | 55,932,613 | | | | $ | 28,183,278 | | |
| Aggregate unrealized depreciation | | | (51,170,082 | ) | | | | (27,410,458 | ) | |
| Net unrealized appreciation | | $ | 4,762,531 | | | | $ | 772,820 | | |
U.S. GAAP defines fair value as the price that each Fund would receive to sell an asset or pay to transfer a liability in an orderly transaction between market participants at the measurement date under current market conditions. A three-level hierarchy for fair value measurements has been established based upon the transparency of inputs to the valuation of an asset or liability. Inputs may be observable or unobservable and refer broadly to the assumptions that market participants would use in pricing the asset or liability. Observable inputs reflect the assumptions market participants would use in pricing the asset or liability based on market data obtained from sources independent of the reporting entity. Unobservable inputs reflect the reporting entity’s own assumptions about the assumptions that market participants would use in pricing the asset or liability developed based on the best information available under the circumstances. Each Fund’s investment in its entirety is assigned a level based upon the observability of the inputs which are significant to the overall valuation. The three-level hierarchy of inputs is summarized below.
Level 1 – | inputs are quoted prices in active markets for identical investments (e.g., equity securities, open-end investment companies, futures contracts, exchange-traded options contracts) |
| |
Level 2 – | other observable inputs (including, but not limited to: quoted prices for similar assets or liabilities in markets that are active, quoted prices for identical or similar assets or liabilities in markets that are not active, inputs other than quoted prices that are observable for the assets or liabilities (such as interest rates, yield curves, volatilities, prepayment speeds, loss severities, credit risks and default rates) or other market-corroborated inputs) (e.g., debt securities, government securities, swap contracts, foreign currency exchange contracts, foreign securities utilizing international fair value pricing, broker-quoted securities, fair valued securities) |
| |
Level 3 – | inputs are significant unobservable inputs (including each Fund’s own assumptions used to determine the fair value of investments) (e.g., broker-quoted securities, fair valued securities) |
Level 3 investments are valued using significant unobservable inputs. Each Fund may also use an income-based valuation approach in which the anticipated future cash flows of the investment are discounted to calculate fair value. Discounts may also be applied due to the nature or duration
82
of any restrictions on the disposition of the investments. Valuations may also be based upon current market prices of securities that are comparable in coupon, rating, maturity and industry. The derived value of a Level 3 investment may not represent the value which is received upon disposition and this could impact the results of operations.
The following tables summarize the valuation of each Fund’s investments by fair value hierarchy levels as of July 31, 2013:
| | Delaware Corporate Bond Fund |
| | Level 1 | | Level 2 | | Total |
| Common Stock | | $ | 6,545 | | | $ | — | | | $ | 6,545 | |
| Corporate Debt | | | — | | | | 1,280,180,898 | | | | 1,280,180,898 | |
| Municipal Bonds | | | — | | | | 75,260,911 | | | | 75,260,911 | |
| Senior Secured Loans | | | — | | | | 18,034,683 | | | | 18,034,683 | |
| Convertible Preferred Stock | | | — | | | | 8,687,250 | | | | 8,687,250 | |
| Preferred Stock1 | | | 71,484,225 | | | | 7,905,094 | | | | 79,389,319 | |
| Options Purchased | | | — | | | | 9,242,553 | | | | 9,242,553 | |
| Short-Term Investments | | | — | | | | 1,579,853 | | | | 1,579,853 | |
| Securities Lending Collateral | | | — | | | | 377,699 | | | | 377,699 | |
| Total | | $ | 71,490,770 | | | $ | 1,401,268,941 | | | $ | 1,472,759,711 | |
| |
| Foreign Currency Exchange Contracts | | $ | — | | | $ | (73,995 | ) | | $ | (73,995 | ) |
| Swap Contracts | | $ | — | | | $ | 143,928 | | | $ | 143,928 | |
| |
| | Delaware Extended Duration Bond Fund |
| | Level 1 | | Level 2 | | Total |
Commercial Mortgage–
Backed Security | | $ | — | | | $ | 11,430 | | | $ | 11,430 | |
| Corporate Debt | | | — | | | | 624,612,286 | | | | 624,612,286 | |
| Foreign Debt | | | — | | | | 5,508,165 | | | | 5,508,165 | |
| Municipal Bonds | | | — | | | | 50,566,547 | | | | 50,566,547 | |
| Senior Secured Loans | | | — | | | | 9,522,845 | | | | 9,522,845 | |
| Convertible Preferred Stock | | | — | | | | 4,987,125 | | | | 4,987,125 | |
| Preferred stock1 | | | 38,494,965 | | | | 5,454,281 | | | | 43,949,246 | |
| Options Purchased | | | — | | | | 5,897,317 | | | | 5,897,317 | |
| Short-Term Investments | | | — | | | | 1,030,717 | | | | 1,030,717 | |
| Securities Lending Collateral | | | — | | | | 171,899 | | | | 171,899 | |
| Total | | $ | 38,494,965 | | | $ | 707,762,612 | | | $ | 746,257,577 | |
| |
| Foreign Currency Exchange Contracts | | $ | — | | | $ | (37,725 | ) | | $ | (37,725 | ) |
| Futures Contracts | | | (8,918,062 | ) | | | — | | | | (8,918,062 | ) |
| Swap Contracts | | | — | | | | 83,085 | | | | 83,085 | |
83
Notes to financial statements
Delaware Corporate Bond Fund and Delaware Extended Duration Bond Fund
3. Investments (continued)
| 1 | Security type is valued across multiple levels. The amounts attributed to Level 1 investments and Level 2 investments represents the following percentages for each Fund; |
| Preferred Stock | | | Delaware
Corporate
Bond Fund | | Delaware
Extended Duration
Bond Fund |
| Level 1 | | | | 90.04% | | | | 87.59% | |
| Level 2 | | | | 9.96% | | | | 12.41% | |
Level 1 investments represent exchange traded investments while Level 2 investments represent matrix priced investments.
During the year ended July 31, 2013, there were no transfers between Level 1 investments, Level 2 investments or Level 3 investments that had a significant impact to the Funds. Each Fund’s policy is to recognize transfers between levels at the beginning of the reporting period.
4. Dividend and Distribution Information
Income and long-term capital gain distributions are determined in accordance with federal income tax regulations, which may differ from U.S. GAAP. Additionally, distributions from net gains on foreign currency transactions and net short-term gains on sales of investment securities are treated as ordinary income for federal income tax purposes. The tax character of dividends and distributions paid during the years ended July 31, 2013 and 2012 was as follows:
| | Delaware
Corporate
Bond Fund | | Delaware
Extended Duration
Bond Fund |
| | Year Ended | | Year Ended |
| | 7/31/13 | | 7/31/12 | | 7/31/13 | | 7/31/12 |
| Ordinary income | | $109,210,840 | | $60,722,281 | | $74,590,626 | | $45,012,113 |
| Long-term capital gains | | 2,499,162 | | 10,349,555 | | 21,547,706 | | 12,777,339 |
| Total | | $111,710,002 | | $71,071,836 | | $96,138,332 | | $57,789,452 |
84
5. Components of Net Assets on a Tax Basis
As of July 31, 2013, the components of net assets on a tax basis were as follows:
| | Delaware
Corporate
Bond Fund | | Delaware
Extended Duration
Bond Fund |
| Shares of beneficial interest | | $ | 1,454,065,603 | | | | $ | 753,833,254 | | |
| Undistributed ordinary income | | | 2,334,734 | | | | | — | | |
| Undistributed long-term capital gains | | | 18,877,256 | | | | | — | | |
| Distributions payable | | | (2,121,667 | ) | | | | (1,117,009 | ) | |
| Qualified late year losses deferrals | | | — | | | | | (1,104,046 | ) | |
| Unrealized appreciation | | | 4,693,746 | | | | | 738,041 | | |
| Net assets | | $ | 1,477,849,672 | | | | $ | 752,350,240 | | |
The differences between book basis and tax basis components of net assets are primarily attributable to tax deferral of losses on wash sales, mark-to-market of futures contracts, mark to-market of foreign currency exchange contracts, distributions payable, tax treatment of CDS contracts, trust preferred securities, market discount and premium on debt instruments and contingent payment debt instruments.
Qualified late year losses represent losses realized on investment transactions from Nov. 1, 2012 through July 31, 2013 that, in accordance with federal income tax regulations, each Fund has elected to defer and treat as having arisen in the following fiscal year.
For financial reporting purposes, capital accounts are adjusted to reflect the tax character of permanent book/tax differences. Reclassifications are primarily due to tax treatment of gain (loss) on foreign currency transactions, dividends and distributions, market discount and premium on debt instruments, paydowns of asset- and mortgage-backed securities, contingent payment debt instruments, CDS contracts, and foreign capital gain taxes. Results of operations and net assets were not affected by these reclassifications. For the year ended July 31, 2013, the Funds recorded the following reclassifications:
| | Delaware
Corporate
Bond Fund | | Delaware
Extended Duration
Bond Fund |
| Undistributed net investment income | | | $ | 2,891,170 | | | | | $ | (2,203,844 | ) | |
| Accumulated net realized gain | | | | (2,891,170 | ) | | | | | 2,203,844 | | |
85
Notes to financial statements
Delaware Corporate Bond Fund and Delaware Extended Duration Bond Fund
6. Capital Shares
Transactions in capital shares were as follows:
| | | | Delaware
Corporate
Bond Fund | | Delaware
Extended Duration
Bond Fund |
| | | Year Ended | | Year Ended |
| | | 7/31/13 | | 7/31/12 | | 7/31/13 | | 7/31/12 |
| Shares sold: | | | | | | | | | | | | |
| Class A | | 59,133,455 | | | 56,363,807 | | | 25,731,964 | | | 25,764,602 | |
| Class B | | 17,504 | | | 46,199 | | | 918 | | | 10,670 | |
| Class C | | 17,901,653 | | | 20,538,654 | | | 3,343,849 | | | 5,482,051 | |
| Class R | | 4,267,906 | | | 3,044,861 | | | 3,407,446 | | | 1,720,698 | |
| Institutional Class | | 55,830,229 | | | 52,569,075 | | | 26,252,535 | | | 35,835,444 | |
| | |
| Shares issued upon reinvestment of dividends and distributions: |
| Class A | | 7,256,322 | | | 4,634,815 | | | 6,372,332 | | | 5,105,149 | |
| Class B | | 38,098 | | | 49,442 | | | 20,950 | | | 22,004 | |
| Class C | | 2,529,697 | | | 1,437,232 | | | 891,494 | | | 420,037 | |
| Class R | | 338,275 | | | 158,943 | | | 485,345 | | | 195,143 | |
| Institutional Class | | 5,123,642 | | | 3,521,504 | | | 5,898,695 | | | 2,531,131 | |
| | | 152,436,781 | | | 142,364,532 | | | 72,405,528 | | | 77,086,929 | |
| | |
| Shares redeemed: | | | | | | | | | | | | |
| Class A | | (59,956,010 | ) | | (23,892,249 | ) | | (29,427,063 | ) | | (29,718,213 | ) |
| Class B | | (342,061 | ) | | (447,490 | ) | | (166,809 | ) | | (116,602 | ) |
| Class C | | (14,261,385 | ) | | (4,677,712 | ) | | (5,411,426 | ) | | (1,034,524 | ) |
| Class R | | (1,965,500 | ) | | (1,566,694 | ) | | (2,020,027 | ) | | (800,885 | ) |
| Institutional Class | | (54,878,973 | ) | | (52,240,323 | ) | | (31,904,929 | ) | | (9,565,269 | ) |
| | | (131,403,929 | ) | | (82,824,468 | ) | | (68,930,254 | ) | | (41,235,493 | ) |
| Net increase | | 21,032,852 | | | 59,540,064 | | | 3,475,274 | | | 35,851,436 | |
For the years ended July 31, 2013 and 2012, the following shares and values were converted from Class B to Class A. The amounts are included in Class B redemptions and Class A subscriptions in the tables above and the statements of changes in net assets.
| | Year Ended
7/31/13 | | Year Ended
7/31/12 |
| | Class B
Shares | | Class A
Shares | | Value | | Class B
Shares | | Class A
Shares | | Value |
| Delaware Corporate Bond Fund | | 63,904 | | 63,987 | | $397,306 | | 164,962 | | 165,284 | | $987,471 |
Delaware Extended Duration
Bond Fund | | 17,579 | | 17,573 | | 116,413 | | 27,450 | | 27,465 | | 177,777 |
86
7. Line of Credit
Each Fund, along with certain other funds in the Delaware Investments® Family of Funds (Participants), was a participant in a $125,000,000 revolving line of credit to be used for temporary or emergency purposes as an additional source of liquidity to fund redemptions of investor shares. Under the agreement, the Participants were charged an annual commitment fee, which was allocated across the Participants on the basis of each Participant’s allocation of the entire facility. The Participants were permitted to borrow up to a maximum of one third of their net assets under the agreement. Each Participant was individually, and not jointly, liable for its particular advances, if any, under the line of credit. The line of credit available under the agreement expired on Nov. 13, 2012.
On Nov. 13, 2012, each Fund, along with the other Participants, entered into an amendment to the agreement for a $125,000,000 revolving line of credit. The line of credit is to be used as described above and operates in substantially the same manner as the original agreement. The line of credit available under the agreement expires on Nov. 12, 2013. The Funds had no amounts outstanding as of July 31, 2013 or at any time during the year then ended.
8. Derivatives
U.S. GAAP requires disclosures that enable investors to understand: 1) how and why an entity uses derivatives; 2) how they are accounted for; and 3) how they affect an entity’s results of operations and financial position.
Foreign Currency Exchange Contracts — Each Fund may enter into foreign currency exchange contracts and foreign cross currency exchange contracts as a way of managing foreign exchange rate risk. Each Fund may enter into these contracts to fix the U.S. dollar value of a security that it has agreed to buy or sell for the period between the date the trade was entered into and the date the security is delivered and paid for. Each Fund may also use these contracts to hedge the U.S. dollar value of securities it already owns that are denominated in foreign currencies. The change in value is recorded as an unrealized gain or loss. When the contract is closed, a realized gain or loss is recorded equal to the difference between the value of the contract at the time it was opened and the value at the time it was closed.
The use of foreign currency exchange contracts and foreign cross currency exchange contracts does not eliminate fluctuations in the underlying prices of the securities, but does establish a rate of exchange that can be achieved in the future. Although foreign currency exchange contracts and foreign cross currency exchange contracts limit the risk of loss due to an unfavorable change in the value of the hedged currency, they also limit any potential gain that might result should the value of the currency change favorably. In addition, each Fund could be exposed to risks if the counterparties to the contracts are unable to meet the terms of their contracts. Each Fund’s maximum risk of loss from counterparty credit risk is the value of its currency exchanged with the counterparty. The risk is generally mitigated by having a netting arrangement between the Funds and the counterparty and by the posting of collateral by the counterparty to the Funds to cover the Funds’ exposure to the counterparty.
87
Notes to financial statements
Delaware Corporate Bond Fund and Delaware Extended Duration Bond Fund
8. Derivatives (continued)
Futures Contracts — A futures contract is an agreement in which the writer (or seller) of the contract agrees to deliver to the buyer an amount of cash or securities equal to a specific dollar amount times the difference between the value of a specific security or index at the close of the last trading day of the contract and the price at which the agreement is made. Each Fund may use futures in the normal course of pursuing its investment objective. Each Fund invests in futures contracts to hedge its existing portfolio securities against fluctuations in fair value caused by changes in prevailing market interest rates. Upon entering into a futures contract, each Fund deposits cash or pledges U.S. government securities to a broker, equal to the minimum “initial margin” requirements of the exchange on which the contract is traded. Subsequent payments are received from the broker or paid to the broker each day, based on the daily fluctuation in the market value of the contract. These receipts or payments are known as “variation margin” and are recorded daily by the Funds as unrealized gains or losses until the contracts are closed. When the contracts are closed, the Funds record a realized gain or loss equal to the difference between the value of the contract at the time it was opened and the value at the time it was closed. Risks of entering into futures contracts include potential imperfect correlation between the futures contracts and the underlying securities and the possibility of an illiquid secondary market for these instruments. When investing in futures, there is reduced counterparty credit risk to a Fund because futures are exchange-traded and the exchange’s clearinghouse, as counterparty to all exchange-traded futures, guarantees against default. At July 31, 2013, Delaware Extended Duration Bond Fund posted to brokers $4,022,500 cash collateral for futures contracts, which is presented as cash collateral for derivatives on the statements of assets and liabilities.
Options Contracts — During the year ended July 31, 2013, each Fund entered into options contracts in the normal course of pursuing its investment objective. The Funds may buy or write options contracts for any number of reasons, including without limitation: to manage the Funds’ exposure to changes in securities prices and foreign currencies; as an efficient means of adjusting the Funds’ overall exposure to certain markets; to protect the value of portfolio securities; and as a cash management tool. The Funds may buy or write call or put options on securities, futures, swaps, swaptions, financial indices, and foreign currencies. When the Funds buy an option, a premium is paid and an asset is recorded and adjusted on a daily basis to reflect the current market value of the option purchased. When the Funds write an option, a premium is received and a liability is recorded and adjusted on a daily basis to reflect the current market value of the option written. Premiums received from writing options that expire unexercised are treated by the Funds on the expiration date as realized gains. The difference between the premium received and the amount paid on effecting a closing purchase transaction, including brokerage commissions, is treated as realized gain or loss. If a call option is exercised, the premium is added to the proceeds from the sale of the underlying security in determining whether the Funds have a realized gain or loss. If a put option is exercised,
88
the premium reduces the cost basis of the securities purchased by each Fund. Each Fund, as writer of an option, bears the market risk of an unfavorable change in the price of the security underlying the written option. When writing options, each Fund is subject to minimal counterparty risk because the counterparty is only obligated to pay premiums and does not bear the market risk of an unfavorable market change. There were no transactions in options written during the year ended July 31, 2013.
Swap Contracts — Each Fund enters into CDS contracts in the normal course of pursuing its investment objective. Each Fund may enter into CDS contracts in order to hedge against a credit event, to enhance total return or to gain exposure to certain securities or markets. The Funds will not be permitted to enter into any swap transactions unless, at the time of entering into such transactions, the unsecured long-term debt of the actual counterparty combined with any credit enhancements, is rated at least BBB- by Standard & Poor’s (S&P) or Baa3 by Moody’s Investors Service (Moody’s) or is determined to be of equivalent quality by the manager.
Credit Default Swaps. A CDS contract is a risk-transfer instrument through which one party (purchaser of protection) transfers to another party (seller of protection) the financial risk of a credit event (as defined in the CDS agreement), as it relates to a particular reference security or basket of securities (such as an index). In exchange for the protection offered by the seller of protection, the purchaser of protection agrees to pay the seller of protection a periodic amount at a stated rate that is applied to the notional amount of the CDS contract. In addition, an upfront payment may be made or received by the Funds in connection with an unwinding or assignment of a CDS contract. Upon the occurrence of a credit event, the seller of protection would pay the par (or other agreed-upon) value of the reference security (or basket of securities) to the counterparty. Credit events generally include, among others, bankruptcy, failure to pay, and obligation default.
During the year ended July 31, 2013, the Funds entered into CDS contracts as a purchaser and seller of protection. Periodic payments (receipts) on such contracts are accrued daily and recorded as unrealized losses (gains) on swap contracts. Upon payment (receipt), such amounts are recorded as realized losses (gains) on swap contracts. Upfront payments made or received in connection with CDS contracts are amortized over the expected life of the CDS contracts as unrealized losses (gains) on swap contracts. The change in value of CDS contracts is recorded as unrealized appreciation or depreciation daily. A realized gain or loss is recorded upon a credit event (as defined in the CDS agreement) or the maturity or termination of the agreement. For trades prior to June 10, 2013, the Funds had posted the following amounts as cash collateral for certain open derivatives, which is presented as cash collateral for derivatives on the statements of assets and liabilities.
| Delaware | | Delaware |
| | Corporate | | Extended Duration |
| Bond Fund | | Bond Fund |
| $60,000 | | $180,000 |
89
Notes to financial statements
Delaware Corporate Bond Fund and Delaware Extended Duration Bond Fund
8. Derivatives (continued)
For trades prior to June 10, 2013, each Fund had received securities and cash collateral in return for certain open derivatives, which is presented as due to brokers on the statements of assets and liabilities as follows:
| | Delaware | | Delaware |
| | Corporate | | Extended Duration |
| | Bond Fund | | Bond Fund |
| Cash | | $ | 4,060,000 | | | $ | 4,700,000 | |
| Securities | | | 5,068,000 | | | | 1,083,000 | |
Initial margin and variation margin are posted to central counterparties for CDS basket trades submitted on or after June 10, 2013, as determined by the applicable central counterparty.
For trades entered on or after June 10, 2013, each Fund posted cash collateral for open swap contracts, which includes initial margin and variation margin, which is presented as cash collateral for derivatives on the statements of assets and liabilities as follows:
| Delaware | | Delaware |
| Corporate | | Extended Duration |
| Bond Fund | | Bond Fund |
| $292,286 | | $150,705 |
As disclosed in the footnotes to the statements of net assets, at July 31, 2013, the notional value of the protection sold for each Fund are listed below, which reflects the maximum potential amount each Fund would have been required to make as a seller of credit protection if a credit event had occurred. In addition to serving as the source of the current value of the securities, the quoted market prices and resulting market values for credit default swap agreements on securities and credit indices serve as an indicator of the current status of the payment/performance risk and represent the likelihood of an expected liability (or profit) for the credit derivative if the swap agreement has been closed/sold as of the period end. Increasing market values, in absolute terms when compared to the notional amount of the swap, represent a deterioration of the reference entity’s credit soundness and a greater likelihood of risk of default or other credit event occurring as defined under the terms of the agreement.
| Delaware | | Delaware |
| Corporate | | Extended Duration |
| Bond Fund | | Bond Fund |
| $1,000,000 | | $1,000,000 |
At July 31, 2013, the net unrealized appreciation of the protection sold for each Fund was as follows:
| Delaware | | Delaware |
| Corporate | | Extended Duration |
| Bond Fund | | Bond Fund |
| $7,307 | | $7,307 |
90
CDS contracts may involve greater risks than if the Funds had invested in the reference obligation directly. CDS contracts are subject to general market risk, liquidity risk, counterparty risk and credit risk. The Funds’ maximum risk of loss from counterparty credit risk, either as the seller of protection or the buyer of protection, is the fair value of the contract. This risk is mitigated by (1) having a netting arrangement between the Funds and the counterparty and by the posting of collateral by the counterparty to the Funds to cover the Funds’ exposure to the counterparty for trades entered prior to June 10, 2013, and (2) trading these instruments through a central counterparty for trades entered on or after June 10, 2013.
Swaps Generally. The value of open swaps may differ from that which would be realized in the event each Fund terminated its position in the agreement. Risks of entering into these contracts include the potential inability of the counterparty to meet the terms of the contracts. This type of risk is generally limited to the amount of favorable movement in the value of the underlying security, instrument or basket of instruments, if any, at the day of default. Risks also arise from potential losses from adverse market movements and such losses could exceed the unrealized amounts shown on the statements of net assets.
Fair values of derivative instruments as of July 31, 2013 was as follows:
| | Delaware Corporate Bond Fund |
| | Asset Derivatives | | Liability Derivatives |
| | Statements of | | | | Statements of | | |
| | Assets and | | | | Assets and | | |
| | Liabilities Location | | Fair Value | | Liabilities Location | | Fair Value |
Forward currency
exchange contracts
(Foreign currency
exchange contracts) | |
Unrealized gain of foreign currency exchange contracts
| | $ | — | |
Unrealized loss of foreign currency exchange contracts
| | $ | (73,995 | ) |
Credit contracts
(Swaps contracts) | |
Unrealized gain on credit default swap contracts
| | | 169,568 | |
Unrealized loss on credit default swap contracts
| | | (25,640 | ) |
| Total | | | | $ | 169,568 | | | | $ | (99,635 | ) |
91
Notes to financial statements
Delaware Corporate Bond Fund and Delaware Extended Duration Bond Fund
8. Derivatives (continued)
| | Delaware Extended Duration Bond Fund |
| | Asset Derivatives | | Liability Derivatives |
| | Statements of | | | | | | Statements of | | | | |
| | Assets and | | | | | | Assets and | | | | |
| | Liabilities Location | | Fair Value | | | Liabilities Location | | Fair Value |
Forward currency
exchange contracts
(Foreign currency
exchange contracts) | |
Unrealized gain of foreign currency exchange contracts
| | $ | — | | |
Unrealized loss of foreign currency exchange contracts | | $ | (37,725 | ) |
Interest rate contracts
(Futures contracts) | |
Variation margin receivable on futures contracts | | | 340,688 | * | |
Variation margin payable on futures contracts | | | (9,258,750 | )* |
Credit contracts
(Swaps contracts) | |
Unrealized gain on credit default swap contracts | | | 99,664 | | |
Unrealized loss on credit default swap contracts | | | (16,579 | ) |
| Total | | | | $ | 440,352 | | | | | $ | (9,313,054 | ) |
*Includes cumulative appreciation (depreciation) of futures contracts from the date the contracts are opened through July 31, 2013. Only current day variation margin is reported on the Delaware Extended Duration Bond Fund’s statements of assets and liabilities.
92
The effect of derivative instruments on the statements of operations for the year ended July 31, 2013 was as follows:
| | Delaware Corporate Bond Fund |
| | | | Realized Gain | | Change in Unrealized |
| | | | (Loss) on | | Appreciation |
| | | | Derivatives | | (Depreciation) |
| | Location of Gain (Loss) on | | Recognized in | | on Derivatives |
| | Derivatives Recognized in Income | | Income | | Recognized in Income |
Forward Currency
exchange contracts
(Foreign currency
exchange contracts) | |
Net realized loss on foreign currency exchange contracts and net change in unrealized appreciation (depreciation) of foreign currency exchange contracts | | $ | (500,539 | ) | | | $ | 7,562 | |
Interest rate contracts
(Futures contracts) | |
Net realized loss on futures contracts and net change in unrealized appreciation (depreciation) of futures contracts | | | (1,492,706 | ) | | | | 744,025 | |
Credit contracts
(Swaps contracts) | |
Net realized loss on swap contracts and net change in unrealized appreciation (depreciation) of swap contracts | | | (5,877,915 | ) | | | | 158,574 | |
| Total | | | | $ | (7,871,160 | ) | | | $ | 910,161 | |
93
Notes to financial statements
Delaware Corporate Bond Fund and Delaware Extended Duration Bond Fund
8. Derivatives (continued)
| | Delaware Extended Duration Bond Fund |
| | | | Realized Gain | | Change in Unrealized |
| | | | (Loss) on | | Appreciation |
| | | | Derivatives | | (Depreciation) |
| | Location of Gain (Loss) on | | Recognized in | | on Derivatives |
| | Derivatives Recognized in Income | | Income | | Recognized in Income |
Forward Currency
exchange contracts
(Foreign currency
exchange contracts) | |
Net realized loss on foreign currency exchange contracts and net change in unrealized appreciation (depreciation) of foreign currency exchange contracts | | $ | (386,953 | ) | | | $ | 12,820 | | |
Interest rate contracts
(Futures contracts) | |
Net realized loss on futures contracts and net change in unrealized appreciation (depreciation) of futures contracts | | | (7,355,613 | ) | | | | (15,021,670 | ) | |
Credit contracts
(Swaps contracts) | |
Net realized loss on swap contracts and net change in unrealized appreciation (depreciation) of swap contracts | | | (3,458,454 | ) | | | | 69,219 | | |
| Total | | | | $ | (11,201,020 | ) | | | $ | (14,939,631 | ) | |
94
Derivatives Generally. The table below summarizes the average balance of derivative holdings by the Funds during the year ended July 31, 2013.
| | Delaware Corporate Bond |
| | Long Derivative | | Short Derivative |
| | Volume | | Volume |
| Foreign currency exchange contracts (average cost) | | USD | | 9,704,416 | | USD | | 3,034,559 |
| Futures contracts (average notional value) | | | | 42,347,927 | | | | 113,137,383 |
| Options contracts (average notional value) | | | | 3,168,841 | | | | — |
| Swap contracts (average notional value)* | | EUR | | 10,653,313 | | | | — |
| | USD | | 27,008,409 | | | | 1,564,385 |
| | Delaware Extended Duration Bond Fund |
| | Long Derivative | | Short Derivative |
| | Volume | | Volume |
| Foreign currency exchange contracts (average cost) | | USD | | 5,434,019 | | USD | | 1,497,342 |
| Futures contracts (average notional value) | | | | 196,027,925 | | | | 28,831,249 |
| Options contracts (average notional value) | | | | 2,011,799 | | | | — |
| Swap contracts (average notional value)* | | EUR | | 6,890,417 | | | | — |
| | USD | | 17,495,520 | | | | 1,066,567 |
*Long represents buying protection and short represents selling protection.
9. Securities Lending
Each Fund, along with other funds in the Delaware Investments® Family of Funds, may lend its securities pursuant to a security lending agreement (Lending Agreement) with The Bank of New York Mellon (BNY Mellon). At the time a security is loaned, the borrower must post collateral equal to the required percentage of the market value of the loaned security, including any accrued interest. The required percentage is: (i) 102% with respect to U.S. securities and foreign securities that are denominated and payable in U.S. dollars; and (ii) 105% with respect to foreign securities. With respect to each loan, if on any business day the aggregate market value of securities collateral plus cash collateral held is less than the aggregate market value of the securities which are the subject of such loan, the borrower will be notified to provide additional collateral by the end of the following business day which, together with the collateral already held, will be not less than the applicable initial collateral requirements for such security loan. If the aggregate market value of securities collateral and cash collateral held with respect to a security loan exceeds the applicable initial collateral requirement, upon the request of the borrower BNY Mellon must return enough collateral to the borrower by the end of the following business day to reduce the value of the remaining collateral to the applicable initial collateral requirement for such security loan. As a result of the foregoing, the value of the collateral held with respect to a loaned security may be temporarily more or less than the value of the security on loan.
Cash collateral received is generally invested in the Delaware Investments Collateral Fund No. 1 (“the Collective Trust”) established by BNY Mellon for the purpose of investment on behalf of funds managed by DMC that participate in BNY Mellon’s securities lending program. The
95
Notes to financial statements
Delaware Corporate Bond Fund and Delaware Extended Duration Bond Fund
9. Securities Lending (continued)
Collective Trust may invest in U.S. government securities and high-quality corporate debt, asset-backed and other money market securities and in repurchase agreements collateralized by such securities, provided that the Collective Trust will generally have a dollar-weighted average portfolio maturity of 60 days or less. The Funds can also accept U.S. government securities and letters of credit (non-cash collateral) in connection with securities loans. In the event of default or bankruptcy by the lending agent, realization and/or retention of the collateral may be subject to legal proceedings. In the event the borrower fails to return loaned securities and the collateral received is insufficient to cover the value of the loaned securities and provided such collateral shortfall is not the result of investment losses, the lending agent has agreed to pay the amount of the shortfall to the Funds or, at the discretion of the lending agent, replace the loaned securities. The Funds continue to record dividends or interest, as applicable, on the securities loaned and are subject to changes in value of the securities loaned that may occur during the term of the loan. The Funds have the right under the Lending Agreement to recover the securities from the borrower on demand. With respect to security loans collateralized by non-cash collateral, the Funds receive loan premiums paid by the borrower. With respect to security loans collateralized by cash collateral, the earnings from the collateral investments are shared among the Funds, the security lending agent and the borrower. The Funds record security lending income net of allocations to the security lending agent and the borrower.
The Collective Trust used for the investment of cash collateral received from borrowers of securities seeks to maintain a net asset value per unit of $1.00, but there can be no assurance that it will always be able to do so. The Funds may incur investment losses as a result of investing securities lending collateral in the Collective Trust or another collateral investment pool. This could occur if an investment in a collateral investment pool defaulted or if it were necessary to liquidate assets in the collateral investment pool to meet returns on outstanding security loans at a time when the collateral investment pool’s net asset value per unit was less than $1.00. Under those circumstances, the Funds may not receive an amount from the collateral investment pool that is equal in amount to the collateral the Funds would be required to return to the borrower of the securities and the Funds would be required to make up for this shortfall.
At July 31, 2013, the values of securities on loan and the values of invested collateral for each Fund are presented below, for which cash collateral was received and invested in accordance with the Lending Agreement. These investments are presented on the statements of net assets under the caption “Securities Lending Collateral.”
| | Delaware | | Delaware |
| | Corporate | | Extended Duration |
| | Bond Fund | | Bond Fund |
| Values of securities on loan | | $ | 364,863 | | $ | 159,181 | |
| Values of invested collateral | | | 377,699 | | | 171,899 | |
96
10. Credit and Market Risk
Some countries in which the Funds may invest require governmental approval for the repatriation of investment income, capital or the proceeds of sales of securities by foreign investors. In addition, if there is deterioration in a country’s balance of payments or for other reasons, a country may impose temporary restrictions on foreign capital remittances abroad.
The securities exchanges of certain foreign markets are substantially smaller, less liquid and more volatile than the major securities markets in the United States. Consequently, acquisition and disposition of securities by the Funds may be inhibited. In addition, a significant portion of the aggregate market value of securities listed on the major securities exchanges in emerging markets is held by a smaller number of investors. This may limit the number of shares available for acquisition or disposition by the Funds.
Each Fund invests in high yield fixed income securities, which are securities rated lower than BBB- by S&P and Baa3 by Moody’s, or similarly rated by another nationally recognized statistical rating organization. Investments in these higher yielding securities are generally accompanied by a greater degree of credit risk than higher rated securities. Additionally, lower rated securities may be more susceptible to adverse economic and competitive industry conditions than investment-grade securities.
Each Fund invests in certain obligations that may have liquidity protection to ensure that the receipt of payments due on the underlying security is timely. Such protection may be provided through guarantees, insurance policies or letters of credit obtained by the issuer or sponsor through third parties, through various means of structuring the transaction or through a combination of such approaches. The Funds will not pay any additional fees for such credit support, although the existence of credit support may increase the price of a security.
Each Fund may invest in fixed income securities whose value is derived from an underlying pool of mortgages or consumer loans. The value of these securities is sensitive to changes in economic conditions, including delinquencies and/or defaults, and may be adversely affected by shifts in the market’s perception of the issuers and changes in interest rates. Investors receive principal and interest payments as the underlying mortgages and consumer loans are paid back. Some of these securities are collateralized mortgage obligations (CMOs). CMOs are debt securities issued by U.S. government agencies or by financial institutions and other mortgage lenders, which are collateralized by a pool of mortgages held under an indenture. Prepayment of mortgages may shorten the stated maturity of the obligations and can result in a loss of premium, if any has been paid. Certain of these securities may be stripped (securities which provide only the principal or interest feature of the underlying security). The yield to maturity on an interest-only CMO is extremely sensitive not only to changes in prevailing interest rates, but also to the rate of principal payments (including prepayments) on the related underlying mortgage assets. A rapid rate of principal payments may have a material adverse effect on the Funds’ yield to maturity. If the underlying mortgage assets experience greater than anticipated prepayments of principal, the Funds may fail to fully recoup its initial investment in these securities even if the securities are rated in the highest rating categories.
97
Notes to financial statements
Delaware Corporate Bond Fund and Delaware Extended Duration Bond Fund
10. Credit and Market Risk (continued)
Each Fund may invest up to 15% of its net assets in illiquid securities, which may include securities with contractual restrictions on resale, securities exempt from registration under Rule 144A of the Securities Act of 1933, as amended, and other securities which may not be readily marketable. The relative illiquidity of these securities may impair the Funds from disposing of them in a timely manner and at a fair price when it is necessary or desirable to do so. While maintaining oversight, the Funds’ Board has delegated to DMC the day-to-day functions of determining whether individual securities are liquid for purposes of the Funds’ limitation on investments in illiquid securities. Securities eligible for resale pursuant to Rule 144A, which are determined to be liquid, are not subject to the Funds’ 15% limit on investments in illiquid securities. As of July 31, 2013, no securities have been determined to be illiquid under the Funds’ Liquidity Procedures. Rule 144A securities have been identified on the statements of net assets.
11. Contractual Obligations
Each Fund enters into contracts in the normal course of business that contain a variety of indemnifications. The Funds’ maximum exposure under these arrangements is unknown. However, each Fund has not had prior claims or losses pursuant to these contracts. Management has reviewed the Funds’ existing contracts and expects the risk of loss to be remote.
12. Subsequent Events
Management has determined that no material events or transactions occurred subsequent to July 31, 2013 that would require recognition or disclosure in the Funds’ financial statements.
98
Report of independent
registered public accounting firm
To the Board of Trustees of Delaware Group® Income Funds and the
Shareholders of Delaware Corporate Bond Fund and Delaware Extended Duration Bond Fund:
In our opinion, the accompanying statements of net assets, statements of assets and liabilities and the related statements of operations and of changes in net assets and the financial highlights present fairly, in all material respects, the financial position of Delaware Corporate Bond Fund and Delaware Extended Duration Bond Fund (two of the series constituting Delaware Group Income Funds, hereinafter referred to as the “Funds”) at July 31, 2013, the results of each of their operations for the year then ended, the changes in each of their net assets for each of the two years in the period then ended and the financial highlights for each of the four years in the period then ended, in conformity with accounting principles generally accepted in the United States of America. These financial statements and financial highlights (hereafter referred to as “financial statements”) are the responsibility of the Funds’ management; our responsibility is to express an opinion on these financial statements based on our audits. We conducted our audits of these financial statements in accordance with the standards of the Public Company Accounting Oversight Board (United States). Those standards require that we plan and perform the audit to obtain reasonable assurance about whether the financial statements are free of material misstatement. An audit includes examining, on a test basis, evidence supporting the amounts and disclosures in the financial statements, assessing the accounting principles used and significant estimates made by management, and evaluating the overall financial statement presentation. We believe that our audits, which included confirmation of securities at July 31, 2013 by correspondence with the custodian and brokers, provide a reasonable basis for our opinion. The financial highlights for the year ended July 31, 2009 were audited by other independent accountants whose report dated September 21, 2009 expressed an unqualified opinion on those statements.
PricewaterhouseCoopers LLP
Philadelphia, Pennsylvania
September 20, 2013
99
Other Fund information
(Unaudited)
Delaware Corporate Bond Fund and Delaware Extended Duration Bond Fund
Tax Information
The information set forth below is for each Fund’s fiscal year as required by federal income tax laws. Shareholders, however, must report distributions on a calendar year basis for income tax purposes, which may include distributions for portions of two fiscal years of the Funds. Accordingly, the information needed by shareholders for income tax purposes will be sent to them in Jan. of each year. Please consult your tax advisor for proper treatment of this information.
All designations are based on financial information available as of the date of this annual report and, accordingly are subject to change. For any and all items requiring designation, it is the intention of the Funds to designate the maximum amount permitted under the Internal Revenue Code and the regulations thereunder.
For the fiscal year ended July 31, 2013, each Fund designates distributions paid during the year as follows:
| | (A) | | (B) | | | | (C) |
| | Long-Term Capital | | Ordinary Income | | Total | | |
| | Gains Distributions | | Distributions* | | Distributions | | Qualifying |
| | (Tax Basis) | | (Tax Basis) | | (Tax Basis) | | Dividends1 |
| Delaware Corporate Bond Fund | | 2.24% | | 97.76% | | 100.00% | | 1.18% |
| Delaware Extended Duration Bond Fund | | 22.41% | | 77.59% | | 100.00% | | 0.93% |
| (A) | and (B) are based on a percentage of each Fund’s total distributions. |
| (C) | is based on a percentage of each Fund’s ordinary income distributions. |
1Qualifying dividends represent dividends which qualify for the corporate dividends received deduction.
*For the fiscal year ended July 31, 2013, certain dividends paid by the Funds may be subject to a maximum tax rate of 15%, as provided for by the Jobs and Growth Tax Relief Reconciliation Act of 2003, as extended by the Tax Relief, Unemployment Insurance Reauthorization and Jobs Creation Act of 2010, and made permanent by the American Taxpayer Relief Act of 2012. The Funds intend to designate the following percentages to be taxed at a maximum rate of 15%. Complete information will be computed and reported in conjunction with your 2013 Form 1099-DIV.
| Delaware | | Delaware |
| Corporate | | Extended Duration |
| Bond Fund | | Bond Fund |
| 1.18% | | 0.55% |
For the fiscal year ended July 31, 2013, certain dividends paid by the Delaware Corporate Bond Fund has been determined to be interest-related dividends and may be subject to relief from U.S. withholding for foreign shareholders, as provided by the American Jobs Creation Act of 2004 and as extended by the Tax Relief, Unemployment Insurance Reauthorization and Jobs Creation Act of 2010. For the fiscal year ended July 31, 2013, the Fund has designated maximum distributions as follows:
| Delaware |
| Corporate |
| Bond Fund |
| Qualified Interest Income | $ | 64,033,823 |
| Qualified Short-Term Capital Gain | | 15,720,716 |
100
Board of trustees/directors and officers addendum
Delaware Investments® Family of Funds
A mutual fund is governed by a Board of Trustees/Directors (“Trustees”), which has oversight responsibility for the management of a fund’s business affairs. Trustees establish procedures and oversee and review the performance of the investment manager, the distributor, and others who perform services for the fund. The independent fund trustees, in particular, are advocates
| Name, Address, | Position(s) | Length of |
| and Birth Date | Held with Fund(s) | Time Served |
| Interested Trustees | | |
| | | |
| Patrick P. Coyne1 | Chairman, President, | Chairman and Trustee |
| 2005 Market Street | Chief Executive Officer, | since August 16, 2006 |
| Philadelphia, PA 19103 | and Trustee | |
| April 1963 | | President and |
| | | Chief Executive Officer |
| | | since August 1, 2006 |
| |
| Independent Trustees | | |
| | | |
| Thomas L. Bennett | Trustee | Since March 2005 |
| 2005 Market Street | | |
| Philadelphia, PA 19103 | | |
| October 1947 | | |
| | | |
| Joseph W. Chow | Trustee | Since January 2013 |
| 2005 Market Street | | |
| Philadelphia, PA 19103 | | |
| January 1953 | | |
| | | |
| |
| John A. Fry | Trustee | Since January 2001 |
| 2005 Market Street | | |
| Philadelphia, PA 19103 | | |
| May 1960 | | |
| |
| |
| |
| |
| Anthony D. Knerr | Trustee | Since April 1990 |
| 2005 Market Street | | |
| Philadelphia, PA 19103 | | |
| December 1938 | | |
| | | |
1 Patrick P. Coyne is considered to be an “Interested Trustee” because he is an executive officer of the Fund’s(s’) investment advisor.
102
for shareholder interests. Each trustee has served in that capacity since he or she was elected to or appointed to the Board of Trustees, and will continue to serve until his or her retirement or the election of a new trustee in his or her place. The following is a list of the Trustees and Officers with certain background and related information.
| Number of Portfolios in | |
| Principal Occupation(s) | Fund Complex Overseen | Other Directorships |
| During Past 5 Years | by Trustee or Officer | Held by Trustee or Officer |
| |
| |
| Patrick P. Coyne has served in | 70 | Director and Audit |
| various executive capacities | | Committee Member |
| at different times at | | Kaydon Corp. |
| Delaware Investments.2 | | |
| | | Board of Governors Member |
| | | Investment Company |
| | | Institute (ICI) |
| | | |
| |
| |
| Private Investor | 70 | Director |
| (March 2004–Present) | | Bryn Mawr Bank Corp. (BMTC) |
| | | (2007–2011) |
| |
| | | |
| Executive Vice President | 70 | Director and Audit Committee |
| (Emerging Economies Strategies, | | Member — Hercules |
| Risk and Corporate Administration) | | Technology Growth |
| State Street Corporation | | Capital, Inc. |
| (July 2004–March 2011) | | |
| | | |
| President | 70 | Director — Hershey Trust |
| Drexel University | | |
| (August 2010–Present) | | Director and Audit |
| | | Committee Member |
| President | | Community Health Systems |
| Franklin & Marshall College | | |
| (July 2002–July 2010) | | |
| | | |
| Managing Director | 70 | None |
| AKA Strategy | | |
| (Strategic Consulting) | | |
| (1990–Present) | | |
| | | |
2 Delaware Investments is the marketing name for Delaware Management Holdings, Inc. and its subsidiaries, including the Fund’s(s’) investment advisor, principal underwriter, and its transfer agent.
103
Board of trustees/directors and officers addendum
Delaware Investments® Family of Funds
| Name, Address, | Position(s) | Length of |
| and Birth Date | Held with Fund(s) | Time Served |
| Independent Trustees (continued) | | |
| | | |
| Lucinda S. Landreth | Trustee | Since March 2005 |
| 2005 Market Street | | |
| Philadelphia, PA 19103 | | |
| June 1947 | | |
| | | |
| Frances A. Sevilla-Sacasa | Trustee | Since September 2011 |
| 2005 Market Street | | |
| Philadelphia, PA 19103 | | |
| January 1956 | | |
| |
| |
| |
| |
| |
| |
| |
| |
| |
| |
| |
| |
| |
| |
| Thomas K. Whitford | Trustee | Since January 2013 |
| 2005 Market Street | | |
| Philadelphia, PA 19103 | | |
| March 1956 | | |
| | | |
| | | |
| | | |
| | | |
| | | |
| | | |
| | | |
104
| Number of Portfolios in | |
| Principal Occupation(s) | Fund Complex Overseen | Other Directorships |
| During Past 5 Years | by Trustee or Officer | Held by Trustee or Officer |
| |
| |
| Private Investor | 70 | None |
| (2004–Present) | | |
| |
| |
| |
| Chief Executive Officer — | 70 | Trust Manager and |
| Banco Itaú Europa | | Audit Committee |
| International | | Member — Camden |
| (April 2012–Present) | | Property Trust |
| |
| Executive Advisor to Dean | | |
| (August 2011–March 2012) | | |
| and Interim Dean | | |
| (January 2011–July 2011) — | | |
| University of Miami School of | | |
| Business Administration | | |
| |
| President — U.S. Trust, | | |
| Bank of America Private | | |
| Wealth Management | | |
| (Private Banking) | | |
| (July 2007–December 2008) | | |
| | | |
| Vice Chairman | 70 | None |
| (2010–April 2013) | | |
| Chief Administrative | | |
| Officer (2008–2010) | | |
| and Executive Vice | | |
| President and Chief | | |
| Administrative Officer | | |
| (2007–2009) — | | |
| PNC Financial | | |
| Services Group | | |
| | |
105
Board of trustees/directors and officers addendum
Delaware Investments® Family of Funds
| Name, Address, | Position(s) | Length of |
| and Birth Date | Held with Fund(s) | Time Served |
| Independent Trustees (continued) | | |
| | | |
| Janet L. Yeomans | Trustee | Since April 1999 |
| 2005 Market Street | | |
| Philadelphia, PA 19103 | | |
| July 1948 | | |
| |
| |
| |
| |
| |
| |
| |
| J. Richard Zecher | Trustee | Since March 2005 |
| 2005 Market Street | | |
| Philadelphia, PA 19103 | | |
| July 1940 | | |
| | | |
| | | |
| | | |
| | | |
| | | |
| | | |
106
| Number of Portfolios in | |
| Principal Occupation(s) | Fund Complex Overseen | Other Directorships |
| During Past 5 Years | by Trustee or Officer | Held by Trustee or Officer |
| |
| |
| Vice President and Treasurer | 70 | Director, Audit |
| (January 2006–July 2012) | | Committee Member and |
| Vice President — Mergers & Acquisitions | | Investment Committee |
| (January 2003–January 2006), and | | Member |
| Vice President and Treasurer | | Okabena Company |
| (July 1995–January 2003) | | |
| 3M Corporation | | Chair — 3M |
| | Investment Management |
| | Company |
| | (2005–2012) |
| | | |
| Founder | 70 | Director and Compensation |
| Investor Analytics | | Committee Member |
| (Risk Management) | | Investor Analytics |
| (May 1999–Present) | | |
| | Director — P/E Investments |
| Founder | | |
| P/E Investments | | |
| (Hedge Fund) | | |
| (September 1996–Present) | | |
| | | |
107
Board of trustees/directors and officers addendum
Delaware Investments® Family of Funds
| Name, Address, | Position(s) | Length of |
| and Birth Date | Held with Fund(s) | Time Served |
| Officers | | |
| | | |
| David F. Connor | Senior Vice President, | Senior Vice President, |
| 2005 Market Street | Deputy General | Deputy General Counsel |
| Philadelphia, PA 19103 | Counsel, and Secretary | since May 2013; |
| December 1963 | | Vice President, Deputy |
| | General Counsel |
| | September 2000– |
| | May 2013; Secretary since |
| | October 2005 |
| | | |
| Daniel V. Geatens | Vice President | Treasurer |
| 2005 Market Street | and Treasurer | since October 2007 |
| Philadelphia, PA 19103 | | |
| October 1972 | | |
| | | |
| David P. O’Connor | Executive Vice President, | Executive Vice President |
| 2005 Market Street | General Counsel | since February 2012; |
| Philadelphia, PA 19103 | and Chief Legal Officer | Senior Vice President |
| February 1966 | | October 2005– |
| | February 2012; |
| | General Counsel and |
| | Chief Legal Officer |
| | since October 2005 |
| | | |
| Richard Salus | Senior Vice President | Chief Financial Officer |
| 2005 Market Street | and Chief Financial Officer | since November 2006 |
| Philadelphia, PA 19103 | | |
| October 1963 | | |
| | | |
The Statement of Additional Information for the Fund(s) includes additional information about the Trustees and Officers and is available, without charge, upon request by calling 800 523-1918.
108
| Number of Portfolios in | |
| Principal Occupation(s) | Fund Complex Overseen | Other Directorships |
| During Past 5 Years | by Trustee or Officer | Held by Trustee or Officer |
| |
| |
| David F. Connor has served as | 70 | None3 |
| Deputy General Counsel of | | |
| Delaware Investments | | |
| since 2000. | | |
| |
| |
| |
| |
| |
| Daniel V. Geatens has served | 70 | None3 |
| in various capacities at | | |
| different times at | | |
| Delaware Investments. | | |
| | | |
| David P. O’Connor has served in | 70 | None3 |
| various executive and legal | | |
| capacities at different times | | |
| at Delaware Investments. | | |
| |
| |
| |
| |
| |
| Richard Salus has served in | 70 | None3 |
| various executive capacities | | |
| at different times at | | |
| Delaware Investments. | | |
| | | |
3 David F. Connor, Daniel V. Geatens, David P. O’Connor, and Richard Salus serve in similar capacities for the six portfolios of the Optimum Fund Trust, which have the same investment advisor, principal underwriter, and transfer agent as the registrant.
109
About the organization
| Board of trustees |
Patrick P. Coyne
Chairman, President, and
Chief Executive Officer
Delaware Investments®
Family of Funds
Philadelphia, PA Thomas L. Bennett
Private Investor
Rosemont, PA | Joseph W. Chow
Former Executive Vice
President
State Street Corporation
Brookline, MA John A. Fry
President
Drexel University
Philadelphia, PA Anthony D. Knerr
Founder and Managing
Director
AKA Strategy
New York, NY | Lucinda S. Landreth
Former Chief Investment
Officer
Assurant, Inc.
Philadelphia, PA Frances A.
Sevilla-Sacasa
Chief Executive Officer
Banco Itaú Europa
International
Miami, FL | Thomas K. Whitford
Former Vice Chairman
PNC Financial Services Group
Pittsburgh, PA Janet L. Yeomans
Former Vice President and
Treasurer
3M Corporation
St. Paul, MN J. Richard Zecher
Founder
Investor Analytics
Scottsdale, AZ |
| | | | |
Affiliated officers |
David F. Connor
Senior Vice President,
Deputy General Counsel,
and Secretary
Delaware Investments
Family of Funds
Philadelphia, PA | Daniel V. Geatens
Vice President and
Treasurer
Delaware Investments
Family of Funds
Philadelphia, PA | David P. O’Connor
Executive Vice President,
General Counsel,
and Chief Legal Officer
Delaware Investments
Family of Funds
Philadelphia, PA | Richard Salus
Senior Vice President and
Chief Financial Officer
Delaware Investments
Family of Funds
Philadelphia, PA |
| | | | |
This annual report is for the information of Delaware Corporate Bond Fund and Delaware Extended Duration Bond Fund shareholders, but it may be used with prospective investors when preceded or accompanied by the Delaware Investments Fund fact sheet for the most recently completed calendar quarter. These documents are available at delawareinvestments.com. |
Delaware Investments is the marketing name of Delaware Management Holdings, Inc. and its subsidiaries. Each Fund files its complete schedule of portfolio holdings with the Securities and Exchange Commission (SEC) for the first and third quarters of each fiscal year on Form N-Q. Each Fund’s Forms N-Q, as well as a description of the policies and procedures that each Fund uses to determine how to vote proxies (if any) relating to portfolio securities are available without charge (i) upon request, by calling 800 523-1918; and (ii) on the SEC’s website at sec.gov. In addition, a description of the policies and procedures that each Fund uses to determine how to vote proxies (if any) relating to portfolio securities and each Fund’s Schedule of Investments are available without charge on each Funds’ website at delawareinvestments.com. Each Fund’s Forms N-Q may be reviewed and copied at the SEC’s Public Reference Room in Washington, D.C.; information on the operation of the Public Reference Room may be obtained by calling 800 SEC-0330. Information (if any) regarding how the Funds voted proxies relating to portfolio securities during the most recently disclosed 12-month period ended June 30 is available without charge (i) through the Funds’ website at delawareinvestments.com; and (ii) on the SEC’s website at sec.gov. |
110
Annual report Delaware High-Yield Opportunities Fund July 31, 2013 Fixed income mutual fund |
Carefully consider the Fund’s investment objectives, risk factors, charges, and expenses before investing. This and other information can be found in the Fund’s prospectus and, if available, its summary prospectus, which may be obtained by visiting delawareinvestments.com or calling 800 523-1918. Investors should read the prospectus and, if available, the summary prospectus carefully before investing. |
You can obtain shareholder reports and prospectuses online instead of in the mail. Visit delawareinvestments.com/edelivery. |
Experience Delaware Investments
Delaware Investments is committed to the pursuit of consistently superior asset management and unparalleled client service. We believe in our investment processes, which seek to deliver consistent results, and in convenient services that help add value for our clients.
If you are interested in learning more about creating an investment plan, contact your financial advisor.
You can learn more about Delaware Investments or obtain a prospectus for Delaware High-Yield Opportunities Fund at delawareinvestments.com.
Manage your investments online
- 24-hour access to your account information
- Obtain share prices
- Check your account balance and recent transactions
- Request statements or literature
- Make purchases and redemptions
Delaware Management Holdings, Inc. and its subsidiaries (collectively known by the marketing name of Delaware Investments) are wholly owned subsidiaries of Macquarie Group Limited, a global provider of banking, financial, advisory, investment and funds management services.
Investments in Delaware High-Yield Opportunities Fund are not and will not be deposits with or liabilities of Macquarie Bank Limited ABN 46 008 583 542 and its holding companies, including their subsidiaries or related companies (Macquarie Group), and are subject to investment risk, including possible delays in repayment and loss of income and capital invested. No Macquarie Group company guarantees or will guarantee the performance of the Fund, the repayment of capital from the Fund, or any particular rate of return.
| Table of contents | | |
| Portfolio management review | | 1 |
| Performance summary | | 4 |
| Disclosure of Fund expenses | | 8 |
| Security type/sector allocation | | 10 |
| Statement of net assets | | 11 |
| Statement of operations | | 25 |
| Statements of changes in net assets | | 26 |
| Financial highlights | | 28 |
| Notes to financial statements | | 38 |
| Report of independent registered | | |
| public accounting firm | | 49 |
| Other Fund information | | 50 |
| Board of trustees/directors and | | |
| officers addendum | | 52 |
| About the organization | | 60 |
Unless otherwise noted, views expressed herein are current as of July 31, 2013, and subject to change.
Funds are not FDIC insured and are not guaranteed. It is possible to lose the principal amount invested.
Mutual fund advisory services provided by Delaware Management Company, a series of Delaware Management Business Trust, which is a registered investment advisor. Delaware Investments, a member of Macquarie Group, refers to Delaware Management Holdings, Inc. and its subsidiaries, including the Fund’s distributor, Delaware Distributors, L.P. Macquarie Group refers to Macquarie Group Limited and its subsidiaries and affiliates worldwide.
© 2013 Delaware Management Holdings, Inc.
All third-party marks cited are the property of their respective owners.
| Portfolio management review | |
| Delaware High-Yield Opportunities Fund | August 6, 2013 |
| Performance preview (for the year ended July 31, 2013) |
| Delaware High-Yield Opportunities Fund (Class A shares) | | 1-year return | | +11.02% |
| BofA Merrill Lynch U.S. High Yield Constrained Index (benchmark) | | 1-year return | | +9.52% |
Past performance does not guarantee future results.
For complete, annualized performance for Delaware High-Yield Opportunities Fund, please see the table on page 4.
The performance of Class A shares excludes the applicable sales charge and reflects the reinvestment of all distributions.
Index performance returns do not reflect any management fees, transaction costs, or expenses. Indices are unmanaged and one cannot invest directly in an index.
Constructive conditions prevailed in the high yield market during the Fund’s fiscal year ended July 31, 2013, as a gradual easing of global risk aversion and extraordinarily accommodative monetary policy emboldened many investors to seek higher income than was available from the government or investment-grade debt markets. The result was benchmark returns in the high single digits with muted volatility (with the notable exception of about a six-week period in May and June, as the market discounted a “tapering” of U.S. Federal Reserve support).
With official interest rates still hovering at close to zero and yields on Treasury and mortgage securities artificially depressed by aggressive central bank purchases, high-yield bonds attracted strong demand, especially given the improved condition of many corporate balance sheets within the sector. In fact, the default rate in high-yield remained significantly below the historical average, not what might have been expected in a global economy still struggling to attain escape velocity four years into a new business cycle.
The strongest gains within the high yield debt market during the Fund’s fiscal year were posted by the lowest-rated groups. For example, CCC-rated bonds (the bottom rung on the high-yield credit ladder) outperformed B-rated bonds, which outperformed BB-rated
High yield bonds benefited from several important factors:- Strong demand for yield from individual and institutional investors
- Historically low default rates and improved corporate balance sheets
- Slow but steady growth in the U.S. economy
|
1
Portfolio management review
Delaware High-Yield Opportunities Fund
bonds (the top credit within the sub-investment grade category). Among sector groups, cyclicals such as basic industries, financials, telecommunications, and energy outperformed higher-quality and “defensive” areas such as utilities, services, and consumer non-cyclicals. Consequently, the outperformance among lower-rated debt also was accompanied by higher volatility.
Despite the sizeable outperformance of lower-rated debt, yield differentials (spreads) between the lower-rated bonds and their higher-rated counterparts did not tighten to the point at which little value could be found in the high yield market. We believe this was in part because spreads had widened so dramatically in the aftermath of the global financial crisis, and the tepid pace of economic activity worldwide also has made the trend toward “normalization” of spreads a more extended process than is typical for this relatively mature stage of a business cycle. When the Fund’s fiscal year began, for instance, the spread between the lowest and highest credit rungs in the sub-investment-grade universe was about 630 basis points (or 6.30 percentage points). As of the end of the fiscal year, that number had tightened to around 475 basis points, still well above the roughly 200 basis points (or less) that marked the tightest spreads prior to the last two recessions.
Fund performance
For the fiscal year ended July 31, 2013, Delaware High-Yield Opportunities Fund returned +11.02% at net asset value and +6.11% at maximum offer price (both figures reflect Class A shares with all distributions reinvested). During the same period, the Fund’s benchmark, the BofA Merrill Lynch U.S. High Yield Constrained Index, returned +9.52%. For complete, annualized performance of Delaware High-Yield Opportunities Fund, please see the table on page 4.
We attribute the Fund’s strong performance to its overweight position in the bottom- and middle-rated tiers (CCC and B) of the high yield asset class. Additionally, given that our outlook for the U.S. economy was little changed over the Fund’s fiscal year, we made relatively few modifications to the portfolio from a structural perspective. As always, we built the portfolio from the “bottom-up,” adding or subtracting positions based on our view of the business fundamentals and credit worthiness at the issuer level. In that regard, we are pleased to report that the Fund did not experience a default among its holdings during the period.
At the margins, the Fund continued to add cyclical exposure, mostly through new issuance, which reached a record level over the first half of 2013. Though a spike in supply is often perceived as a bearish indicator, almost two-thirds of that amount was used to refinance existing debt. There has been little reliance on leverage that usually accompanies the later stages of a credit cycle.
Among individual holdings, the Fund’s top-performing issue was the dollar-denominated bonds of Lloyd’s Bank, which is 40% owned by the British government. The Fund’s position in the Dutch bank ING also contributed to relative performance. As with Lloyd’s Bank, ING rebuilt its balance sheet, discarded businesses that were experiencing credit problems, and seemed well-positioned to potentially benefit if a strong cyclical recovery in the financial sector occurred.
2
Ineos Group, a large U.K.-based chemical company with a global sales reach, also was a strong contributor to relative performance. Management tapped the new-issue market to refinance high-cost debt and bolster its balance sheet, even as the company’s underlying business recovered. American International Group (AIG) was another of the Fund’s financial-sector outperformers. The company continued to benefit from a cyclical recovery, while shedding underperforming business units and repairing its balance sheet.
Among detractors, chip-manufacturer Advanced Micro Devices underperformed due to global weakness in demand for personal computers. The Fund’s position in the telecommunications equipment company Avaya also lagged, reflecting general hesitancy of businesses to invest in capital equipment in the absence of a strong economic recovery. On a more basic level, reduced headcounts in offices worldwide lowered the need for the communications devices that Avaya manufactures and sells. Cost and credit issues caused Essar Steel Algoma bonds to lag the benchmark, despite the company’s operations in an industry that benefited from cyclical strength. Wynn Casinos was a more modest underperformer. Though the company is considered a high-quality name within the sub-investment grade debt market, the bond’s low coupon (4.25%) was an unattractive characteristic in a market that embraced risk and reached for yield.
As the Fund’s fiscal year ended, we continued to maintain overweight positions in the middle- and lower-rating tiers, many of which fall into cyclical and economically sensitive categories. For example, the Fund has 21% of assets invested in CCC-rated debt (versus 16% for the BofA Merrill Lynch U.S. High Yield Constrained Index, the Fund’s benchmark) and 51% of assets in B-rated debt (versus 41% for the benchmark). Note that the Fund did not invest in derivatives during the fiscal year.
These lower-rated positions are designed to help the Fund capitalize if further price appreciation occurs, and to provide a yield premium in a modest — but still positive — U.S. economic growth environment. We also remain overweight in basic industry, energy, certain financial sectors, and technology. Conversely, we are underweight in the highest sub-investment grade rating category (BB) by about 20 percentage points, 21% versus 42% within the benchmark.
3
| Performance summary | |
| Delaware High-Yield Opportunities Fund | July 31, 2013 |
The performance data quoted represent past performance; past performance does not guarantee future results. Investment return and principal value will fluctuate so your shares, when redeemed, may be worth more or less than their original cost. Please obtain the performance data current for the most recent month end by calling 800 523-1918 or visiting our website at delawareinvestments.com/performance. Current performance may be lower or higher than the performance data quoted.
| Fund and benchmark performance1,2 | Average annual total returns through July 31, 2013 |
| | 1 year | | 5 years | | 10 years | |
| Class A (Est. Dec. 30, 1996) | | | | | | | |
| Excluding sales charge | | +11.02% | | +10.55% | | +9.00% | |
| Including sales charge | | +6.11% | | +9.56% | | +8.49% | |
| Class B (Est. Feb. 17, 1998) | | | | | | | |
| Excluding sales charge | | +10.25% | | +9.79% | | +8.37% | |
| Including sales charge | | +6.25% | | +9.58% | | +8.37% | |
| Class C (Est. Feb. 17, 1998) | | | | | | | |
| Excluding sales charge | | +10.23% | | +9.83% | | +8.27% | |
| Including sales charge | | +9.23% | | +9.83% | | +8.27% | |
| Class R (Est. June 2, 2003) | | | | | | | |
| Excluding sales charge | | +11.05% | | +10.37% | | +8.80% | |
| Including sales charge | | +11.05% | | +10.37% | | +8.80% | |
| Institutional Class (Est. Dec. 30, 1996) | | | | | | | |
| Excluding sales charge | | +11.34% | | +10.88% | | +9.33% | |
| Including sales charge | | +11.34% | | +10.88% | | +9.33% | |
| BofA Merrill Lynch U.S. High | | | | | | | |
| Yield Constrained Index | | +9.52% | | +11.47% | | +9.09% | |
1 Returns reflect the reinvestment of all distributions and are presented both with and without the applicable sales charges described below. Returns do not reflect the deduction of taxes the shareholder would pay on Fund distributions or redemptions of Fund shares.
Expense limitations were in effect for certain classes during some or all of the periods shown in the “Fund performance” chart. Expenses for each class are listed on the “Fund expense ratios” table on page 6. Performance would have been lower had expense limitations not been in effect.
Class A shares are sold with a maximum front-end sales charge of 4.50%, and have an annual distribution and service fee of 0.30% of average daily net assets. Furthermore, the Board has adopted a formula for calculating 12b-1 plan fees for the Fund’s Class A shares that went into effect on June 1, 1992. The Fund’s Class A shares are currently subject to a blended 12b-1 fee equal to the sum of: (i) 0.10% of average daily net assets representing shares acquired prior to June 1, 1992, and (ii) 0.30% of average daily net assets representing shares acquired on or after June 1, 1992. All Class A shares currently bear 12b-1 fees at the same
4
rate, the blended rate, based on the formula described above. This method of calculating Class A 12b-1 fees may be discontinued at the sole discretion of the Board. Performance for Class A shares, excluding sales charges, assumes that no front-end sales charge applied.
Class B shares may be purchased only through dividend reinvestment and certain permitted exchanges as described in the prospectus. Please see the prospectus for additional information on Class B shares. Class B shares have a contingent deferred sales charge that declines from 4.00% to zero depending on the period of time the shares are held. They are also subject to an annual distribution and service fee of 1.00% of average daily net assets. Class B shares will automatically convert to Class A shares on a quarterly basis approximately eight years after purchase. Ten-year performance figures for Class B shares reflect conversion to Class A shares after approximately eight years.
Class C shares are sold with a contingent deferred sales charge of 1.00% if redeemed during the first 12 months. They are also subject to an annual distribution and service fee of 1.00% of average daily net assets.
Performance for Class B and C shares, excluding sales charges, assumes either that contingent deferred sales charges did not apply or that the investment was not redeemed.
Class R shares are available only for certain retirement plan products. They are sold without a sales charge and have an annual distribution and service fee of 0.60% of average daily net assets, which has been limited contractually to 0.50% from Nov. 28, 2012, through Nov. 28, 2013.
Institutional Class shares are available without sales or asset-based distribution charges only to certain eligible institutional accounts.
The “Fund performance” table and the “Performance of a $10,000 investment” graph do not reflect the deduction of taxes the shareholder would pay on Fund distributions or redemptions of Fund shares.
Fixed income securities and bond funds can lose value, and investors can lose principal, as interest rates rise. They also may be affected by economic conditions that hinder an issuer’s ability to make interest and principal payments on its debt.
The Fund may also be subject to prepayment risk, the risk that the principal of a fixed income security that is held by the Fund may be prepaid prior to maturity, potentially forcing the Fund to reinvest that money at a lower interest rate.
High yielding, noninvestment grade bonds (junk bonds) involve higher risk than investment grade bonds. The high yield secondary market is particularly susceptible to liquidity problems when institutional investors, such as mutual funds and certain other financial institutions, temporarily stop buying bonds for regulatory, financial, or other reasons. In addition, a less liquid secondary market makes it more difficult for the Fund to obtain precise valuations of the high yield securities in its portfolio.
International investments entail risks not ordinarily associated with U.S. investments including fluctuation in currency values, differences in accounting principles, or economic or political instability in other nations.
5
Performance summary
Delaware High-Yield Opportunities Fund
Investing in emerging markets can be riskier than investing in established foreign markets due to increased volatility and lower trading volume.
Per Standard & Poor’s credit rating agency, bonds rated AA and A are more susceptible to the adverse effects of changes in circumstances and economic conditions than those in the higher-rated AAA category, but the obligor’s capacity to meet its financial commitment on the obligation is still strong. Bonds rated BBB exhibit adequate protection parameters, although adverse economic conditions or changing circumstances are more likely to lead to a weakened capacity of the obligor to meet its financial commitments. Bonds rated BB, B, and CCC are regarded as having significant speculative characteristics, with BB indicating the least degree of speculation of the three.
2 The Fund’s expense ratios, as described in the most recent prospectus, are disclosed in the following “Fund expense ratios” table. Delaware Management Company has agreed to reimburse certain expenses and/or waive certain fees in order to prevent total annual fund operating expenses (excluding certain fees and expenses) from exceeding 0.81% of the Fund’s average daily net assets from Nov. 28, 2012, through Nov. 28, 2013. Please see the most recent prospectus and any applicable supplement(s) for additional information on these fee waivers and/or reimbursements.
| Fund expense ratios | | Class A | | Class B | | Class C | | Class R | | Institutional Class |
| Total annual operating expenses | | 1.18% | | 1.88% | | 1.88% | | 1.48% | | 0.88% |
| (without fee waivers) | | | | | | | | | | |
| Net expenses | | 1.11% | | 1.81% | | 1.81% | | 1.31% | | 0.81% |
| (including fee waivers, if any) | | | | | | | | | | |
| Type of waiver | | Contractual | | Contractual | | Contractual | | Contractual | | Contractual |
6
Performance of a $10,000 investment1
Average annual total returns from July 31, 2003, through July 31, 2013
| For period beginning July 31, 2003, through July 31, 2013 | Starting value | Ending value |
| | BofA Merrill Lynch U.S. High Yield Constrained Index | $10,000 | $23,876 |
| | Delaware High-Yield Opportunities Fund —
Class A shares | $9,550 | $22,574 |
1 The “Performance of a $10,000 investment” graph assumes $10,000 invested in Class A shares of the Fund on July 31, 2003, and includes the effect of a 4.50% front-end sales charge and the reinvestment of all distributions. The graph does not reflect the deduction of taxes the shareholders would pay on Fund distributions or redemptions of Fund shares. Expense limitations were in effect for some or all of the periods shown. Performance would have been lower had expense limitations not been in effect. Expenses are listed in the “Fund expense ratios” table on page 6. Please note additional details on pages 4 through 7.
The chart also assumes $10,000 invested in the BofA Merrill Lynch U.S. High Yield Constrained Index as of July 31, 2003. The BofA Merrill Lynch U.S. High Yield Constrained Index tracks the performance of U.S. dollar–denominated high yield corporate debt publicly issued in the U.S. domestic market, but caps individual issuer exposure at 2% of the benchmark.
Index performance returns do not reflect any management fees, transaction costs, or expenses. Indices are unmanaged and one cannot invest directly in an index. Past performance is not a guarantee of future results.
Performance of other Fund classes will vary due to different charges and expenses.
| | Nasdaq symbols | | CUSIPs | |
| Class A | | | DHOAX | | | 245908876 | |
| Class B | | | DHOBX | | | 245908868 | |
| Class C | | | DHOCX | | | 245908850 | |
| Class R | | | DHIRX | | | 245908736 | |
| Institutional Class | | | DHOIX | | | 245908843 | |
7
Disclosure of Fund expenses
For the six-month period from February 1, 2013 to July 31, 2013 (Unaudited)
As a shareholder of the Fund, you incur two types of costs: (1) transaction costs, including sales charges (loads) on purchase payments, reinvested dividends, or other distributions; redemption fees; and exchange fees; and (2) ongoing costs, including management fees; distribution and/or service (12b-1) fees; and other Fund expenses. This example is intended to help you understand your ongoing costs (in dollars) of investing in the Fund and to compare these costs with the ongoing costs of investing in other mutual funds.
The example is based on an investment of $1,000 invested at the beginning of the period and held for the entire six-month period from Feb. 1, 2013 to July 31, 2013.
Actual expenses
The first section of the table shown, “Actual Fund return,” provides information about actual account values and actual expenses. You may use the information in this section of the table, together with the amount you invested, to estimate the expenses that you paid over the period. Simply divide your account value by $1,000 (for example, an $8,600 account value divided by $1,000 = 8.6), then multiply the result by the number in the first section under the heading entitled “Expenses Paid During Period” to estimate the expenses you paid on your account during this period.
Hypothetical example for comparison purposes
The second section of the table shown, “Hypothetical 5% return,” provides information about hypothetical account values and hypothetical expenses based on the Fund’s actual expense ratio and an assumed rate of return of 5% per year before expenses, which is not the Fund’s actual return. The hypothetical account values and expenses may not be used to estimate the actual ending account balance or expenses you paid for the period. You may use this information to compare the ongoing costs of investing in the Fund and other funds. To do so, compare this 5% hypothetical example with the 5% hypothetical examples that appear in the shareholder reports of the other funds.
Please note that the expenses shown in the table are meant to highlight your ongoing costs only and do not reflect any transactional costs, such as sales charges (loads), redemption fees, or exchange fees. Therefore, the second section of the table is useful in comparing ongoing costs only, and will not help you determine the relative total costs of owning different funds. In addition, if these transactional costs were included, your costs would have been higher. The Fund’s expenses shown in the table reflect fee waivers in effect. The expenses shown in the table assume reinvestment of all dividends and distributions.
8
Delaware High-Yield Opportunities Fund
Expense analysis of an investment of $1,000
| | Beginning | | Ending | | | | Expenses |
| | Account Value | | Account Value | | Annualized | | Paid During Period |
| | 2/1/13 | | 7/31/13 | | Expense Ratio | | 2/1/13 to 7/31/13* |
| Actual Fund return† | | | | | | | | | | | | | | | | | |
| Class A | | | $ | 1,000.00 | | | | $ | 1,025.60 | | | 1.11% | | | $ | 5.57 | |
| Class B | | | | 1,000.00 | | | | | 1,022.00 | | | 1.81% | | | | 9.07 | |
| Class C | | | | 1,000.00 | | | | | 1,022.00 | | | 1.81% | | | | 9.07 | |
| Class R | | | | 1,000.00 | | | | | 1,024.60 | | | 1.31% | | | | 6.58 | |
| Institutional Class | | | | 1,000.00 | | | | | 1,027.10 | | | 0.81% | | | | 4.07 | |
| Hypothetical 5% return (5% return before expenses) | | | | | | | | |
| Class A | | | $ | 1,000.00 | | | | $ | 1,019.29 | | | 1.11% | | | $ | 5.56 | |
| Class B | | | | 1,000.00 | | | | | 1,015.82 | | | 1.81% | | | | 9.05 | |
| Class C | | | | 1,000.00 | | | | | 1,015.82 | | | 1.81% | | | | 9.05 | |
| Class R | | | | 1,000.00 | | | | | 1,018.30 | | | 1.31% | | | | 6.56 | |
| Institutional Class | | | | 1,000.00 | | | | | 1,020.78 | | | 0.81% | | | | 4.06 | |
*“Expenses Paid During Period” are equal to the Fund’s annualized expense ratio, multiplied by the average account value over the period, multiplied by 181/365 (to reflect the one-half year period).
†Because actual returns reflect only the most recent six-month period, the returns shown may differ significantly from fiscal year returns.
9
| Security type/sector allocation | |
| Delaware High-Yield Opportunities Fund | | As of July 31, 2013 (Unaudited) |
Sector designations may be different than the sector designations presented in other Fund materials. The sector designations may represent the investment manager’s internal sector classifications, which may result in the sector designations for one fund being different than another fund’s sector designations.
| Security type/sector | Percentage of net assets |
| Convertible Bonds | 0.59 | % |
| Corporate Bonds | 89.98 | % |
| Automotive | 3.57 | % |
| Banking | 2.42 | % |
| Basic Industry | 11.30 | % |
| Capital Goods | 5.42 | % |
| Consumer Cyclical | 7.01 | % |
| Consumer Non-Cyclical | 3.40 | % |
| Energy | 13.35 | % |
| Financials | 1.84 | % |
| Healthcare | 6.09 | % |
| Insurance | 4.12 | % |
| Media | 8.17 | % |
| Real Estate | 0.17 | % |
| Service | 9.74 | % |
| Technology & Electronics | 4.09 | % |
| Telecommunications | 7.43 | % |
| Utilities | 1.86 | % |
| Senior Secured Loans | 2.27 | % |
| Common Stock | 2.18 | % |
| Convertible Preferred Stock | 0.92 | % |
| Preferred Stock | 1.72 | % |
| Short-Term Investments | 1.61 | % |
| Securities Lending Collateral | 0.15 | % |
| Total Value of Securities | 99.42 | % |
| Obligation to Return Securities Lending Collateral | (0.15 | %) |
| Receivables and Other Assets Net of Other Liabilities | 0.73 | % |
| Total Net Assets | 100.00 | % |
10
| Statement of net assets | |
| Delaware High-Yield Opportunities Fund | July 31, 2013 |
| | | | Principal | | | |
| | | amount (U.S. $) | | Value (U.S. $) |
| Convertible Bonds – 0.59% | | | | | | |
| # | Clearwire Communications 144A 8.25% 12/1/40 | | $ | 2,539,000 | | $ | 2,824,638 |
| Equinix 4.75% 6/15/16 | | | 414,000 | | | 914,940 |
| Total Convertible Bonds (cost $3,783,505) | | | | | | 3,739,578 |
| |
| Corporate Bonds – 89.98% | | | | | | |
| Automotive – 3.57% | | | | | | |
| American Axle & Manufacturing 7.75% 11/15/19 | | | 1,670,000 | | | 1,899,625 |
| ArvinMeritor 10.625% 3/15/18 | | | 635,000 | | | 695,325 |
| # | Chassix 144A 9.25% 8/1/18 | | | 1,655,000 | | | 1,733,613 |
| Chrysler Group 8.25% 6/15/21 | | | 5,309,000 | | | 5,932,807 |
| Dana Holding 5.375% 9/15/21 | | | 1,400,000 | | | 1,410,500 |
| # | International Automotive Components Group 144A | | | | | | |
| 9.125% 6/1/18 | | | 3,603,000 | | | 3,657,045 |
| # | Jaguar Land Rover 144A | | | | | | |
| 5.625% 2/1/23 | | | 1,030,000 | | | 1,014,550 |
| 8.125% 5/15/21 | | | 1,390,000 | | | 1,546,375 |
| # | LKQ 144A 4.75% 5/15/23 | | | 3,315,000 | | | 3,186,544 |
| Meritor 6.75% 6/15/21 | | | 1,555,000 | | | 1,555,000 |
| | | | | | | 22,631,384 |
| Banking – 2.42% | | | | | | |
| • | Bank of America 5.20% 12/29/49 | | | 2,400,000 | | | 2,172,000 |
| * | Barclays Bank 7.625% 11/21/22 | | | 3,065,000 | | | 3,057,338 |
| • | Fifth Third Bancorp 5.10% 12/31/49 | | | 1,500,000 | | | 1,421,250 |
| #• | HBOS Capital Funding 144A 6.071% 6/29/49 | | | 7,045,000 | | | 6,798,424 |
| • | JPMorgan Chase & Co 6.00% 12/29/49 | | | 1,930,000 | | | 1,903,463 |
| | | | | | | 15,352,475 |
| Basic Industry – 11.30% | | | | | | |
| * | AK Steel 7.625% 5/15/20 | | | 1,577,000 | | | 1,348,335 |
| # | APERAM 144A 7.75% 4/1/18 | | | 2,095,000 | | | 1,990,250 |
| ArcelorMittal 6.125% 6/1/18 | | | 6,020,000 | | | 6,343,575 |
| # | Builders FirstSource 144A 7.625% 6/1/21 | | | 3,151,000 | | | 3,190,388 |
| # | Cemex Espana Luxembourg 144A 9.25% 5/12/20 | | | 2,702,000 | | | 2,965,445 |
| # | Essar Steel Algoma 144A 9.375% 3/15/15 | | | 1,773,000 | | | 1,713,161 |
| #* | FMG Resources August 2006 144A | | | | | | |
| 6.875% 2/1/18 | | | 1,308,000 | | | 1,339,065 |
| 6.875% 4/1/22 | | | 4,724,000 | | | 4,694,475 |
11
Statement of net assets
Delaware High-Yield Opportunities Fund
| | | | Principal | | | |
| | | amount (U.S. $) | | Value (U.S. $) |
| Corporate Bonds (continued) | | | | | | |
| Basic Industry (continued) | | | | | | |
| HD Supply 11.50% 7/15/20 | | $ | 2,175,000 | | $ | 2,585,531 |
| Headwaters 7.625% 4/1/19 | | | 2,444,000 | | | 2,648,685 |
| # | Inmet Mining 144A 8.75% 6/1/20 | | | 2,779,000 | | | 2,931,845 |
| # | JMC Steel Group 144A 8.25% 3/15/18 | | | 3,275,000 | | | 3,275,000 |
| # | Kinove German Bondco 144A 9.625% 6/15/18 | | | 2,465,000 | | | 2,748,475 |
| # | LSB Industries 144A 7.75% 8/1/19 | | | 1,490,000 | | | 1,490,000 |
| # | Masonite International 144A 8.25% 4/15/21 | | | 3,451,000 | | | 3,778,845 |
| # | New Gold 144A 6.25% 11/15/22 | | | 3,100,000 | | | 2,960,500 |
| Norcraft Finance 10.50% 12/15/15 | | | 1,600,000 | | | 1,666,000 |
| Nortek 8.50% 4/15/21 | | | 2,420,000 | | | 2,631,750 |
| * | Peabody Energy 6.25% 11/15/21 | | | 1,715,000 | | | 1,689,275 |
| # | Perstorp Holding AB 144A 8.75% 5/15/17 | | | 3,030,000 | | | 3,136,050 |
| Rockwood Specialties Group 4.625% 10/15/20 | | | 1,526,000 | | | 1,556,520 |
| # | Ryerson 144A | | | | | | |
| 9.00% 10/15/17 | | | 1,947,000 | | | 2,032,181 |
| 11.25% 10/15/18 | | | 804,000 | | | 824,100 |
| # | Sappi Papier Holding 144A | | | | | | |
| 6.625% 4/15/21 | | | 200,000 | | | 194,500 |
| 8.375% 6/15/19 | | | 2,825,000 | | | 2,998,031 |
| # | Taminco Global Chemical 144A 9.75% 3/31/20 | | | 2,984,000 | | | 3,379,380 |
| # | TPC Group 144A 8.75% 12/15/20 | | | 3,355,000 | | | 3,539,525 |
| #* | US Coatings Acquisition 144A 7.375% 5/1/21 | | | 1,900,000 | | | 1,976,000 |
| | | | | | | 71,626,887 |
| Capital Goods – 5.42% | | | | | | |
| # | Ardagh Packaging Finance 144A 7.00% 11/15/20 | | | 3,310,000 | | | 3,268,625 |
| Berry Plastics 9.75% 1/15/21 | | | 1,554,000 | | | 1,825,950 |
| # | Boe Intermediate Holding PIK 144A 9.00% 11/1/17 | | | 1,175,000 | | | 1,204,375 |
| # | BOE Merger PIK 144A 9.50% 11/1/17 | | | 3,039,000 | | | 3,221,340 |
| # | Consolidated Container 144A 10.125% 7/15/20 | | | 2,684,000 | | | 2,818,200 |
| # | Crown Americas 144A 4.50% 1/15/23 | | | 295,000 | | | 276,563 |
| Kratos Defense & Security Solutions 10.00% 6/1/17 | | | 2,063,000 | | | 2,238,355 |
| # | Milacron 144A 7.75% 2/15/21 | | | 3,010,000 | | | 3,085,250 |
| Mueller Water Products 7.375% 6/1/17 | | | 1,044,000 | | | 1,076,625 |
| Reynolds Group Issuer | | | | | | |
| 5.75% 10/15/20 | | | 1,275,000 | | | 1,300,500 |
| 8.25% 2/15/21 | | | 1,445,000 | | | 1,475,706 |
| 9.875% 8/15/19 | | | 5,210,000 | | | 5,652,849 |
12
| | | | Principal | | | |
| | | amount (U.S. $) | | Value (U.S. $) |
| Corporate Bonds (continued) | | | | | | |
| Capital Goods (continued) | | | | | | |
| # | Sealed Air 144A 8.375% 9/15/21 | | $ | 1,979,000 | | $ | 2,256,060 |
| # | Silver II Borrower 144A 7.75% 12/15/20 | | | 1,625,000 | | | 1,710,313 |
| # | TransDigm 144A 7.50% 7/15/21 | | | 2,750,000 | | | 2,921,875 |
| | | | | | | 34,332,586 |
| Consumer Cyclical – 7.01% | | | | | | |
| # | BON-TON Department Stores 144A 8.00% 6/15/21 | | | 3,205,000 | | | 3,309,163 |
| Burlington Coat Factory Warehouse | | | | | | |
| 10.00% 2/15/19 | | | 2,950,000 | | | 3,311,375 |
| # | Burlington Holdings PIK 144A 9.00% 2/15/18 | | | 1,570,000 | | | 1,628,875 |
| # | CDR DB Sub 144A 7.75% 10/15/20 | | | 3,815,000 | | | 3,896,069 |
| Dave & Buster’s 11.00% 6/1/18 | | | 2,621,000 | | | 2,922,415 |
| #^ | Dave & Buster’s Entertainment 144A | | | | | | |
| 10.00% 2/15/16 | | | 3,652,000 | | | 2,866,820 |
| Express 8.75% 3/1/18 | | | 1,260,000 | | | 1,357,650 |
| # | Landry’s 144A 9.375% 5/1/20 | | | 3,696,000 | | | 4,019,399 |
| #* | Michaels FinCo Holdings PIK 144A 7.50% 8/1/18 | | | 2,210,000 | | | 2,243,150 |
| Michaels Stores 11.375% 11/1/16 | | | 522,000 | | | 545,495 |
| Pantry 8.375% 8/1/20 | | | 2,886,000 | | | 3,131,310 |
| #* | Party City Holdings 144A 8.875% 8/1/20 | | | 3,248,000 | | | 3,572,800 |
| # | Quiksilver 144A 7.875% 8/1/18 | | | 3,360,000 | | | 3,528,000 |
| #* | Rite Aid 144A 6.75% 6/15/21 | | | 2,675,000 | | | 2,695,063 |
| # | Tempur-Pedic International 144A 6.875% 12/15/20 | | | 2,305,000 | | | 2,454,825 |
| # | Wok Acquisition 144A 10.25% 6/30/20 | | | 2,617,000 | | | 2,944,125 |
| | | | | | | 44,426,534 |
| Consumer Non-Cyclical – 3.40% | | | | | | |
| Alphabet Holding PIK 7.75% 11/1/17 | | | 1,160,000 | | | 1,203,500 |
| B&G Foods 4.625% 6/1/21 | | | 2,135,000 | | | 2,068,281 |
| # | Callebaut (Barry) Services 144A 5.50% 6/15/23 | | | 2,120,000 | | | 2,194,200 |
| Constellation Brands | | | | | | |
| 3.75% 5/1/21 | | | 530,000 | | | 496,875 |
| 4.25% 5/1/23 | | | 2,115,000 | | | 1,998,675 |
| Del Monte 7.625% 2/15/19 | | | 2,340,000 | | | 2,457,000 |
| # | ESAL 144A 6.25% 2/5/23 | | | 910,000 | | | 839,475 |
| # | Heinz (H.J.) Finance 144A 7.125% 8/1/39 | | | 1,410,000 | | | 1,476,975 |
| # | JBS USA 144A 8.25% 2/1/20 | | | 2,363,000 | | | 2,516,595 |
13
Statement of net assets
Delaware High-Yield Opportunities Fund
| | | | Principal | | | |
| | | amount (U.S. $) | | Value (U.S. $) |
| Corporate Bonds (continued) | | | | | | |
| Consumer Non-Cyclical (continued) | | | | | | |
| Smithfield Foods 6.625% 8/15/22 | | $ | 1,020,000 | | $ | 1,081,200 |
| # | Spectrum Brands Escrow 144A | | | | | | |
| | 6.375% 11/15/20 | | | 600,000 | | | 639,000 |
| 6.625% 11/15/22 | | | 2,265,000 | | | 2,429,213 |
| # | Sun Merger Sub 144A 5.25% 8/1/18 | | | 900,000 | | | 904,500 |
| Visant 10.00% 10/1/17 | | | 1,303,000 | | | 1,237,850 |
| | | | | | | 21,543,339 |
| Energy – 13.35% | | | | | | |
| AmeriGas Finance 7.00% 5/20/22 | | | 2,806,000 | | | 3,002,420 |
| Antero Resources Finance 6.00% 12/1/20 | | | 3,430,000 | | | 3,464,299 |
| Approach Resources 7.00% 6/15/21 | | | 1,315,000 | | | 1,334,725 |
| Calumet Specialty Products Partners 9.375% 5/1/19 | | | 5,206,000 | | | 5,713,584 |
| Chaparral Energy | | | | | | |
| 7.625% 11/15/22 | | | 1,465,000 | | | 1,505,288 |
| 8.25% 9/1/21 | | | 1,641,000 | | | 1,743,563 |
| CHC Helicopter 9.375% 6/1/21 | | | 1,475,000 | | | 1,471,313 |
| Chesapeake Energy | | | | | | |
| 5.375% 6/15/21 | | | 655,000 | | | 655,000 |
| 5.75% 3/15/23 | | | 975,000 | | | 984,750 |
| *6.125% 2/15/21 | | | 531,000 | | | 565,515 |
| 6.625% 8/15/20 | | | 2,162,000 | | | 2,356,580 |
| Comstock Resources 7.75% 4/1/19 | | | 3,039,000 | | | 3,145,365 |
| Crosstex Energy | | | | | | |
| 7.125% 6/1/22 | | | 1,603,000 | | | 1,663,113 |
| 8.875% 2/15/18 | | | 1,289,000 | | | 1,379,230 |
| # | Drill Rigs Holdings 144A 6.50% 10/1/17 | | | 3,006,000 | | | 3,073,635 |
| # | Exterran Partners 144A 6.00% 4/1/21 | | | 3,280,000 | | | 3,345,599 |
| Genesis Energy 5.75% 2/15/21 | | | 3,665,000 | | | 3,637,512 |
| Halcon Resources 8.875% 5/15/21 | | | 3,485,000 | | | 3,537,274 |
| # | Hercules Offshore 144A | | | | | | |
| 8.75% 7/15/21 | | | 915,000 | | | 961,894 |
| 10.50% 10/15/17 | | | 4,101,000 | | | 4,377,817 |
| Kodiak Oil & Gas | | | | | | |
| #*144A 5.50% 1/15/21 | | | 1,095,000 | | | 1,104,581 |
| 8.125% 12/1/19 | | | 2,603,000 | | | 2,869,808 |
| Laredo Petroleum | | | | | | |
| 7.375% 5/1/22 | | | 698,000 | | | 739,880 |
| 9.50% 2/15/19 | | | 1,941,000 | | | 2,164,215 |
14
| | | Principal | | | |
| | | | amount (U.S. $) | | Value (U.S. $) |
| Corporate Bonds (continued) | | | | | | |
| Energy (continued) | | | | | | |
| Linn Energy | | | | | | |
| 6.50% 5/15/19 | | $ | 781,000 | | $ | 763,428 |
| 8.625% 4/15/20 | | | 1,563,000 | | | 1,633,335 |
| # | Midstates Petroleum Company 144A 9.25% 6/1/21 | | | 3,180,000 | | | 3,128,325 |
| Northern Oil & Gas 8.00% 6/1/20 | | | 3,010,000 | | | 3,107,825 |
| # | Offshore Group Investment 144A 7.125% 4/1/23 | | | 1,445,000 | | | 1,455,838 |
| # | PDC Energy 144A 7.75% 10/15/22 | | | 3,117,000 | | | 3,319,605 |
| Pioneer Drilling 9.875% 3/15/18 | | | 2,931,000 | | | 3,187,463 |
| Range Resources 5.00% 8/15/22 | | | 2,565,000 | | | 2,603,475 |
| Rosetta Resources 5.625% 5/1/21 | | | 2,025,000 | | | 2,027,531 |
| # | Samson Investment 144A 10.00% 2/15/20 | | | 2,448,000 | | | 2,607,120 |
| SandRidge Energy | | | | | | |
| 7.50% 3/15/21 | | | 1,003,000 | | | 997,985 |
| 8.125% 10/15/22 | | | 3,127,000 | | | 3,189,540 |
| *8.75% 1/15/20 | | | 387,000 | | | 408,285 |
| # | Targa Resources Partners 144A 4.25% 11/15/23 | | | 1,530,000 | | | 1,411,425 |
| | | | | | | 84,638,140 |
| Financials – 1.84% | | | | | | |
| E Trade Financial 6.375% 11/15/19 | | | 3,170,000 | | | 3,383,975 |
| #• | ILFC E-Capital Trust II 144A 6.25% 12/21/65 | | | 3,371,000 | | | 3,126,603 |
| International Lease Finance 4.625% 4/15/21 | | | 1,450,000 | | | 1,392,906 |
| # | Nuveen Investments 144A 9.50% 10/15/20 | | | 3,696,000 | | | 3,760,680 |
| | | | | | | 11,664,164 |
| Healthcare – 6.09% | | | | | | |
| Air Medical Group Holdings 9.25% 11/1/18 | | | 1,983,000 | | | 2,171,385 |
| # | Alere 144A | | | | | | |
| 6.50% 6/15/20 | | | 1,830,000 | | | 1,878,038 |
| 7.25% 7/1/18 | | | 625,000 | | | 681,250 |
| Biomet 6.50% 10/1/20 | | | 2,550,000 | | | 2,629,688 |
| # | CDRT Holding PIK 144A 9.25% 10/1/17 | | | 1,468,000 | | | 1,506,535 |
| Community Health Systems | | | | | | |
| 7.125% 7/15/20 | | | 1,605,000 | | | 1,645,125 |
| 8.00% 11/15/19 | | | 1,234,000 | | | 1,309,583 |
| HCA Holdings 6.25% 2/15/21 | | | 2,156,000 | | | 2,242,240 |
| Immucor 11.125% 8/15/19 | | | 2,245,000 | | | 2,480,725 |
| Kinetic Concepts 10.50% 11/1/18 | | | 2,141,000 | | | 2,365,805 |
| # | MPH Intermediate Holding Company 2 144A PIK | | | | | | |
| 8.375% 8/1/18 | | | 1,510,000 | | | 1,547,750 |
15
Statement of net assets
Delaware High-Yield Opportunities Fund
| | | | Principal | | | |
| | | amount (U.S. $) | | Value (U.S. $) |
| Corporate Bonds (continued) | | | | | | |
| Healthcare (continued) | | | | | | |
| # | Multiplan 144A 9.875% 9/1/18 | | $ | 3,468,000 | | $ | 3,858,149 |
| Radnet Management 10.375% 4/1/18 | | | 1,697,000 | | | 1,813,669 |
| # | Renaissance Acquisition 144A 6.875% 8/15/21 | | | 370,000 | | | 369,075 |
| # | Service Corp International 144A 5.375% 1/15/22 | | | 1,740,000 | | | 1,755,225 |
| # | Sky Growth Acquisition 144A 7.375% 10/15/20 | | | 4,531,000 | | | 4,734,894 |
| # | STHI Holding 144A 8.00% 3/15/18 | | | 1,744,000 | | | 1,892,240 |
| # | Truven Health Analytics 144A 10.625% 6/1/20 | | | 1,133,000 | | | 1,246,300 |
| # | VPI Escrow 144A 6.375% 10/15/20 | | | 1,791,000 | | | 1,858,163 |
| # | VPII Escrow 144A 6.75% 8/15/18 | | | 560,000 | | | 593,600 |
| | | | | | | 38,579,439 |
| Insurance – 4.12% | | | | | | |
| • | American International Group 8.175% 5/15/58 | | | 3,645,000 | | | 4,474,238 |
| # | Hub International 144A 8.125% 10/15/18 | | | 3,402,000 | | | 3,631,635 |
| • | ING Groep 5.775% 12/29/49 | | | 6,567,000 | | | 6,566,999 |
| #• | Liberty Mutual Group 144A 7.00% 3/15/37 | | | 3,139,000 | | | 3,256,713 |
| # | Onex USI Acquisition 144A 7.75% 1/15/21 | | | 3,200,000 | | | 3,232,000 |
| • | XL Group 6.50% 12/29/49 | | | 5,007,000 | | | 4,944,413 |
| | | | | | | 26,105,998 |
| Media – 8.17% | | | | | | |
| AMC Networks 4.75% 12/15/22 | | | 1,695,000 | | | 1,652,625 |
| CCO Holdings 5.25% 9/30/22 | | | 2,861,000 | | | 2,682,188 |
| # | Cequel Communications Escrow 1 144A | | | | | | |
| 6.375% 9/15/20 | | | 2,445,000 | | | 2,536,688 |
| Clear Channel Communications 9.00% 3/1/21 | | | 5,535,000 | | | 5,479,650 |
| Clear Channel Worldwide Holdings 7.625% 3/15/20 | | | 3,696,000 | | | 3,915,130 |
| CSC Holdings 6.75% 11/15/21 | | | 2,155,000 | | | 2,370,500 |
| DISH DBS 5.00% 3/15/23 | | | 4,580,000 | | | 4,316,650 |
| # | Griffey Intermediate 144A 7.00% 10/15/20 | | | 3,155,000 | | | 3,091,900 |
| # | Lynx II 144A 6.375% 4/15/23 | | | 2,345,000 | | | 2,418,281 |
| # | MDC Partners 144A 6.75% 4/1/20 | | | 2,040,000 | | | 2,101,200 |
| # | Midcontinent Communications & Midcontinent Finance | | | | | | |
| 144A 6.25% 8/1/21 | | | 900,000 | | | 909,000 |
| # | Nara Cable Funding 144A 8.875% 12/1/18 | | | 3,300,000 | | | 3,466,575 |
| # | Nexstar Broadcasting 144A 6.875% 11/15/20 | | | 3,150,000 | | | 3,276,000 |
| # | ONO Finance II 144A 10.875% 7/15/19 | | | 1,597,000 | | | 1,668,865 |
| Satelites Mexicanos 9.50% 5/15/17 | | | 1,384,000 | | | 1,536,240 |
16
| | | | Principal | | | |
| | | amount (U.S. $) | | Value (U.S. $) |
| Corporate Bonds (continued) | | | | | | |
| Media (continued) | | | | | | |
| # | Sirius XM Radio 144A 4.625% 5/15/23 | | $ | 1,220,000 | | $ | 1,125,450 |
| # | Univision Communications 144A 8.50% 5/15/21 | | | 6,061,000 | | | 6,697,404 |
| # | UPCB Finance VI 144A 6.875% 1/15/22 | | | 2,409,000 | | | 2,565,585 |
| | | | | | | 51,809,931 |
| Real Estate – 0.17% | | | | | | |
| # | Brookfield Residential Properties 144A 6.125% 7/1/22 | | | 1,035,000 | | | 1,063,463 |
| | | | | | | 1,063,463 |
| Service – 9.74% | | | | | | |
| # | Algeco Scotsman Global Finance 144A | | | | | | |
| *8.50% 10/15/18 | | | 1,450,000 | | | 1,500,750 |
| 10.75% 10/15/19 | | | 4,967,000 | | | 4,644,144 |
| # | Aramark 144A 5.75% 3/15/20 | | | 1,665,000 | | | 1,739,925 |
| # | Avis Budget Car Rental 144A 5.50% 4/1/23 | | | 2,825,000 | | | 2,796,750 |
| # | Beazer Homes USA 144A 7.25% 2/1/23 | | | 865,000 | | | 895,275 |
| Caesars Entertainment Operating 8.50% 2/15/20 | | | 2,748,000 | | | 2,567,663 |
| # | Carlson Wagonlit 144A 6.875% 6/15/19 | | | 2,755,000 | | | 2,868,644 |
| # | DigitalGlobe 144A 5.25% 2/1/21 | | | 2,870,000 | | | 2,726,500 |
| # | Geo Group 144A 5.125% 4/1/23 | | | 2,665,000 | | | 2,585,050 |
| H&E Equipment Services 7.00% 9/1/22 | | | 2,906,000 | | | 3,123,950 |
| M/I Homes 8.625% 11/15/18 | | | 3,454,000 | | | 3,782,129 |
| # | Mattamy Group 144A 6.50% 11/15/20 | | | 3,175,000 | | | 3,159,125 |
| Meritage Homes 7.00% 4/1/22 | | | 490,000 | | | 536,550 |
| MGM Resorts International | | | | | | |
| 6.75% 10/1/20 | | | 2,790,000 | | | 2,974,838 |
| *7.75% 3/15/22 | | | 1,360,000 | | | 1,513,000 |
| 11.375% 3/1/18 | | | 1,385,000 | | | 1,758,950 |
| PHH | | | | | | |
| 7.375% 9/1/19 | | | 1,537,000 | | | 1,692,621 |
| 9.25% 3/1/16 | | | 1,448,000 | | | 1,643,480 |
| Pinnacle Entertainment | | | | | | |
| 7.75% 4/1/22 | | | 1,075,000 | | | 1,131,438 |
| *8.75% 5/15/20 | | | 224,000 | | | 243,600 |
| # | PNK Finance 144A 6.375% 8/1/21 | | | 1,330,000 | | | 1,339,975 |
| Seven Seas Cruises 9.125% 5/15/19 | | | 2,992,000 | | | 3,238,840 |
| Swift Services Holdings 10.00% 11/15/18 | | | 2,983,000 | | | 3,348,417 |
| Toll Brothers Finance 4.375% 4/15/23 | | | 3,500,000 | | | 3,342,500 |
17
Statement of net assets
Delaware High-Yield Opportunities Fund
| | | | Principal | | | |
| | | amount (U.S. $) | | Value (U.S. $) |
| Corporate Bonds (continued) | | | | | | |
| Service (continued) | | | | | | |
| United Rentals North America | | | | | | |
| 6.125% 6/15/23 | | $ | 585,000 | | $ | 610,594 |
| 7.625% 4/15/22 | | | 791,000 | | | 885,920 |
| # | Watco 144A 6.375% 4/1/23 | | | 1,505,000 | | | 1,508,763 |
| # | Woodside Homes 144A 6.75% 12/15/21 | | | 1,430,000 | | | 1,451,450 |
| # | Wynn Las Vegas 144A 4.25% 5/30/23 | | | 2,280,000 | | | 2,117,550 |
| | | | | | | | 61,728,391 |
| Technology & Electronics – 4.09% | | | | | | |
| # | Avaya 144A 10.50% 3/1/21 | | | 451,000 | | | 348,398 |
| CDW 8.50% 4/1/19 | | | 1,681,000 | | | 1,853,303 |
| First Data | | | | | | |
| *11.25% 3/31/16 | | | 2,607,000 | | | 2,607,000 |
| #144A 11.25% 1/15/21 | | | 3,755,000 | | | 3,905,200 |
| #144A 11.75% 8/15/21 | | | 1,460,000 | | | 1,401,600 |
| Infor US 9.375% 4/1/19 | | | 4,042,000 | | | 4,537,144 |
| j2 Global 8.00% 8/1/20 | | | 4,173,000 | | | 4,506,840 |
| # | Seagate HDD Cayman 144A 4.75% 6/1/23 | | | 3,415,000 | | | 3,278,400 |
| # | Viasystems 144A 7.875% 5/1/19 | | | 3,234,000 | | | 3,476,550 |
| | | | | | | 25,914,435 |
| Telecommunications – 7.43% | | | | | | |
| # | Clearwire Communications 144A 12.00% 12/1/15 | | | 1,730,000 | | | 1,838,125 |
| # | Columbus International 144A 11.50% 11/20/14 | | | 2,304,000 | | | 2,499,840 |
| # | Digicel Group 144A 8.25% 9/30/20 | | | 4,495,000 | | | 4,854,599 |
| Equinix | | | | | | |
| 4.875% 4/1/20 | | | 1,067,000 | | | 1,061,665 |
| 5.375% 4/1/23 | | | 2,043,000 | | | 2,037,893 |
| Hughes Satellite Systems 7.625% 6/15/21 | | | 2,524,000 | | | 2,744,850 |
| # | Intelsat Luxembourg 144A | | | | | | |
| 7.75% 6/1/21 | | | 3,610,000 | | | 3,813,063 |
| 8.125% 6/1/23 | | | 4,380,000 | | | 4,724,925 |
| Level 3 Communications | | | | | | |
| 8.875% 6/1/19 | | | 438,000 | | | 474,135 |
| 11.875% 2/1/19 | | | 1,576,000 | | | 1,824,220 |
| Level 3 Financing 7.00% 6/1/20 | | | 2,040,000 | | | 2,126,700 |
| # | MetroPCS Wireless 144A 6.25% 4/1/21 | | | 1,440,000 | | | 1,474,200 |
| Sprint Capital | | | | | | |
| 6.90% 5/1/19 | | | 3,190,000 | | | 3,389,375 |
| 8.75% 3/15/32 | | | 1,611,000 | | | 1,707,660 |
18
| | | | Principal | | | |
| | | amount (U.S. $) | | Value (U.S. $) |
| Corporate Bonds (continued) | | | | | | | |
| Telecommunications (continued) | | | | | | | |
| Sprint Nextel 8.375% 8/15/17 | | | $ | 1,838,000 | | $ | 2,086,130 |
| # | Wind Acquisition Finance 144A | | | | | | | |
| 7.25% 2/15/18 | | | | 2,740,000 | | | 2,827,300 |
| 11.75% 7/15/17 | | | | 1,575,000 | | | 1,669,500 |
| Windstream 7.50% 6/1/22 | | | | 1,653,000 | | | 1,710,855 |
| Zayo Group 10.125% 7/1/20 | | | | 3,666,000 | | | 4,206,735 |
| | | | | | | | 47,071,770 |
| Utilities – 1.86% | | | | | | | |
| AES | | | | | | | |
| 4.875% 5/15/23 | | | | 505,000 | | | 481,013 |
| 7.375% 7/1/21 | | | | 2,923,000 | | | 3,317,605 |
| Elwood Energy 8.159% 7/5/26 | | | | 1,471,401 | | | 1,563,364 |
| * | GenOn Americas Generation 8.50% 10/1/21 | | | | 2,705,000 | | | 2,961,975 |
| GenOn Energy 9.875% 10/15/20 | | | | 3,045,000 | | | 3,440,849 |
| | | | | | | | 11,764,806 |
| Total Corporate Bonds (cost $548,811,143) | | | | | | | 570,253,742 |
| | |
| «Senior Secured Loans – 2.27% | | | | | | | |
| Clear Channel Communications Tranche B 3.65% 1/29/16 | | | | 600,000 | | | 563,833 |
| Equipower Resources Holdings 10.00% 6/21/19 | | | | 1,155,000 | | | 1,162,941 |
| Hostess Brands 6.75% 3/20/20 | | | | 2,395,000 | | | 2,466,850 |
| Panda Temple Power II 7.25% 3/28/19 | | | | 2,610,000 | | | 2,662,199 |
| Rite Aid 5.75% 8/21/20 | | | | 1,586,000 | | | 1,634,968 |
| Smart & Final 10.50% 11/15/20 | | | | 2,390,769 | | | 2,447,550 |
| State Class Tankers II 1st Lien 6.75% 6/22/20 | | | | 2,065,000 | | | 2,085,650 |
| Toys R Us Property Tranche B 6.00% 7/31/19 | | | | 1,400,000 | | | 1,386,000 |
| Total Senior Secured Loans (cost $14,225,524) | | | | | | | 14,409,991 |
| | |
| | | Number of shares | | | |
| Common Stock – 2.18% | | | | | | | |
| AES | | | | 75,598 | | | 940,439 |
| †= | Calpine | | | | 2,490,000 | | | 0 |
| †= | Century Communications | | | | 4,250,000 | | | 0 |
| CenturyLink | | | | 45,028 | | | 1,614,254 |
| Delta Air Lines | | | | 266 | | | 5,647 |
| † | DIRECTV Class A | | | | 19,150 | | | 1,211,621 |
19
Statement of net assets
Delaware High-Yield Opportunities Fund
| | | | Number of shares | | Value (U.S. $) |
| Common Stock (continued) | | | | | | | |
| † | Kodiak Oil & Gas | | | | 167,283 | | $ | 1,624,318 |
| L Brands | | | | 33,502 | | | 1,868,406 |
| NRG Energy | | | | 63,006 | | | 1,689,821 |
| † | Quiksilver | | | | 246,207 | | | 1,556,028 |
| Range Resources | | | | 19,505 | | | 1,542,846 |
| † | United Rentals | | | | 30,298 | | | 1,736,681 |
| Total Common Stock (cost $12,966,347) | | | | | | | 13,790,061 |
| | |
| Convertible Preferred Stock – 0.92% | | | | | | | |
| # | Chesapeake Energy 144A 5.75% exercise price $27.83, | | | | | | | |
| expiration date 12/31/49 | | | | 1,630 | | | 1,748,175 |
| † | Halcon Resources 5.75% exercise price $6.16, | | | | | | | |
| expiration date 12/31/49 | | | | 1,245 | | | 1,277,681 |
| † | Intelsat ZAR 5.75% exercise price $22.05, | | | | | | | |
| expiration date 5/1/16 | | | | 16,100 | | | 950,383 |
| Sandridge Energy 7.00% exercise price $7.76, | | | | | | | |
| expiration date 12/31/49 | | | | 19,400 | | | 1,832,088 |
| Total Convertible Preferred Stock | | | | | | | |
| (cost $5,576,262) | | | | | | | 5,808,327 |
| | |
| Preferred Stock – 1.72% | | | | | | | |
| # | Ally Financial 144A 7.00% | | | | 5,900 | | | 5,844,688 |
| • | GMAC Capital Trust I 8.125% | | | | 73,000 | | | 1,938,150 |
| Regions Financial 6.375% | | | | 126,000 | | | 3,103,380 |
| Total Preferred Stock (cost $9,009,734) | | | | | | | 10,886,218 |
| |
| | | Principal | | | |
| | | amount (U.S. $) | | | |
| Short-Term Investments – 1.61% | | | | | | | |
| Repurchase Agreements – 1.61% | | | | | | | |
| Bank of America 0.03%, dated 7/31/13, to be | | | | | | | |
| repurchased on 8/1/13, repurchase price $4,201,550 | | | | | | | |
| (collateralized by U.S. government obligations | | | | | | | |
| 0.75%-2.375% 2/28/15-10/31/17, market | | | | | | | |
| value $4,285,577) | | | $ | 4,201,546 | | | 4,201,546 |
20
| | | | Principal | | | | |
| | | amount (U.S. $) | | Value (U.S. $) | |
| Short-Term Investments (continued) | | | | | | | | |
| Repurchase Agreements (continued) | | | | | | | | |
| BNP Paribas 0.05%, dated 7/31/13, to be repurchased | | | | | | | | |
| on 8/1/13, repurchase price $6,037,462 | | | | | | | | |
| (collateralized by U.S. government obligations | | | | | | | | |
| 0.25%-4.25% 6/30/14-5/15/23, | | | | | | | | |
| market value $6,167,168) | | | $ | 6,037,454 | | $ | 6,037,454 | |
| Total Short-Term Investments (cost $10,239,000) | | | | | | | 10,239,000 | |
| |
| Total Value of Securities Before Securities Lending | | | | | | | | |
| Collateral – 99.27% (cost $604,611,515) | | | | | | | 629,126,917 | |
| |
| | | Number of shares | | | | |
| **Securities Lending Collateral – 0.15% | | | | | | | | |
| Investment Company | | | | | | | | |
| Delaware Investments Collateral Fund No. 1 | | | | 977,199 | | | 977,199 | |
| Total Securities Lending Collateral | | | | | | | | |
| (cost $977,199) | | | | | | | 977,199 | |
| |
| ©Total Value of Securities – 99.42% | | | | | | | | |
| (cost $605,588,714) | | | | | | | 630,104,116 | |
| **Obligation to Return Securities | | | | | | | | |
| Lending Collateral – (0.15%) | | | | | | | (977,199 | ) |
| zReceivables and Other Assets | | | | | | | | |
| Net of Other Liabilities – 0.73% | | | | | | | 4,636,665 | |
| Net Assets Applicable to 148,298,340 | | | | | | | | |
| Shares Outstanding – 100.00% | | | | | | $ | 633,763,582 | |
| |
| Net Asset Value – Delaware High-Yield Opportunities Fund | | | | | | | | |
| Class A ($328,533,902 / 76,895,473 Shares) | | | | | | | | $4.27 | |
| Net Asset Value – Delaware High-Yield Opportunities Fund | | | | | | | | |
| Class B ($2,867,586 / 671,567 Shares) | | | | | | | | $4.27 | |
| Net Asset Value – Delaware High-Yield Opportunities Fund | | | | | | | | |
| Class C ($85,574,039 / 20,003,290 Shares) | | | | | | | | $4.28 | |
| Net Asset Value – Delaware High-Yield Opportunities Fund | | | | | | | | |
| Class R ($16,505,976 / 3,851,343 Shares) | | | | | | | | $4.29 | |
| Net Asset Value – Delaware High-Yield Opportunities Fund | | | | | | | | |
| Institutional Class ($200,282,079 / 46,876,667 Shares) | | | | | | | | $4.27 | |
21
Statement of net assets
Delaware High-Yield Opportunities Fund
| | | | | |
| Components of Net Assets at July 31, 2013: | | | | |
| Shares of beneficial interest (unlimited authorization – no par) | | $ | 645,414,522 | |
| Undistributed net investment income | | | 717,510 | |
| Accumulated net realized loss on investments | | | (36,883,852 | ) |
| Net unrealized appreciation of investments | | | 24,515,402 | |
| Total net assets | | $ | 633,763,582 | |
| # | Security exempt from registration under Rule 144A of the Securities Act of 1933, as amended. At July 31, 2013, the aggregate value of Rule 144A securities was $304,512,817, which represented 48.05% of the Fund’s net assets. See Note 9 in “Notes to financial statements.” |
| • | Variable rate security. The rate shown is the rate as of July 31, 2013. Interest rates reset periodically. |
| * | Fully or partially on loan. |
| = | Security is being fair valued in accordance with the Fund’s fair valuation policy. At July 31, 2013, the aggregate value of fair valued securities was $0.00, which represented 0.00% of the Fund’s net assets. See Note 1 in “Notes to financial statements.” |
| ^ | Zero coupon security. The rate shown is the yield at the time of purchase. |
| « | Senior Secured Loans generally pay interest at rates which are periodically redetermined by reference to a base lending rate plus a premium. These base lending rates are generally: (i) the prime rate offered by one or more United States banks, (ii) the lending rate offered by one or more European banks such as the London Inter-Bank Offered Rate (LIBOR), and (iii) the certificate of deposit rate. Senior Secured Loans may be subject to restrictions on resale. Stated rate in effect at July 31, 2013. |
| † | Non income producing security. |
| ** | See Note 8 in “Notes to financial statements” for additional information on securities lending collateral. |
| © | Includes $935,849 of securities loaned. |
| z | Of this amount, $12,029,357 represents payable for securities purchased, $1,778,139 represents payable for fund shares redeemed and $1,796 Trustees’ fees payable as of July 31, 2013. |
PIK — Pay-in-kind bond. 100% of the income received was in the form of cash.
22
| | | | |
| Net Asset Value and Offering Price Per Share – | | | |
| Delaware High-Yield Opportunities Fund | | | |
| Net asset value Class A (A) | | $ | 4.27 |
| Sales charge (4.50% of offering price) (B) | | | 0.20 |
| Offering price | | $ | 4.47 |
| (A) | Net asset value per share, as illustrated, is the amount which would be paid upon redemption or repurchase of shares. |
| (B) | See the current prospectus for purchase of $100,000 or more. |
See accompanying notes, which are an integral part of the financial statements.
23
Statement of operations
| Delaware High-Yield Opportunities Fund | Year Ended July 31, 2013 |
| Investment Income: | | | | | | | |
| Interest | | $ | 46,918,328 | | | | |
| Dividends | | | 892,607 | | | | |
| Security lending income | | | 19,072 | | $ | 47,830,007 | |
| |
| Expenses: | | | | | | | |
| Management fees | | | 4,105,861 | | | | |
| Distribution expenses – Class A | | | 991,982 | | | | |
| Distribution expenses – Class B | | | 39,457 | | | | |
| Distribution expenses – Class C | | | 808,620 | | | | |
| Distribution expenses – Class R | | | 97,410 | | | | |
| Dividend disbursing and transfer agent fees and expenses | | | 820,589 | | | | |
| Accounting and administration expenses | | | 249,309 | | | | |
| Registration fees | | | 114,374 | | | | |
| Reports and statements to shareholders | | | 76,870 | | | | |
| Legal fees | | | 47,585 | | | | |
| Audit and tax | | | 40,397 | | | | |
| Trustees’ fees | | | 29,308 | | | | |
| Custodian fees | | | 13,843 | | | | |
| Dues and services | | | 12,221 | | | | |
| Insurance | | | 11,522 | | | | |
| Pricing fees | | | 7,653 | | | | |
| Consulting fees | | | 6,428 | | | | |
| Trustees’ expenses | | | 2,236 | | | 7,475,665 | |
| Less fees waived | | | | | | (330,156 | ) |
| Less waived distribution expenses – Class R | | | | | | (16,235 | ) |
| Less expense paid indirectly | | | | | | (918 | ) |
| Total operating expenses | | | | | | 7,128,356 | |
| Net Investment Income | | | | | | 40,701,651 | |
| |
| Net Realized and Unrealized Gain: | | | | | | | |
| Net realized gain on investments | | | | | | 16,031,890 | |
| Net change in unrealized appreciation (depreciation) | | | | | | | |
| of investments | | | | | | 9,450,884 | |
| Net Realized and Unrealized Gain | | | | | | 25,482,774 | |
| |
| Net Increase in Net Assets Resulting from Operations | | | | | $ | 66,184,425 | |
See accompanying notes, which are an integral part of the financial statements.
25
Statements of changes in net assets
Delaware High-Yield Opportunities Fund
| | Year Ended |
| | 7/31/13 | | 7/31/12 |
| Increase (Decrease) in Net Assets from Operations: | | | | | | | | |
| Net investment income | | $ | 40,701,651 | | | $ | 40,857,687 | |
| Net realized gain (loss) | | | 16,031,890 | | | | (8,301,222 | ) |
| Net change in unrealized appreciation (depreciation) | | | 9,450,884 | | | | 3,127,387 | |
| Net increase in net assets resulting from operations | | | 66,184,425 | | | | 35,683,852 | |
| |
| Dividends and Distributions to Shareholders from: | | | | | | | | |
| Net investment income: | | | | | | | | |
| Class A | | | (22,225,652 | ) | | | (23,235,747 | ) |
| Class B | | | (236,396 | ) | | | (409,230 | ) |
| Class C | | | (4,808,103 | ) | | | (3,860,806 | ) |
| Class R | | | (1,048,483 | ) | | | (1,356,859 | ) |
| Institutional Class | | | (14,414,914 | ) | | | (11,981,767 | ) |
| | | (42,733,548 | ) | | | (40,844,409 | ) |
| |
| Capital Share Transactions: | | | | | | | | |
| Proceeds from shares sold: | | | | | | | | |
| Class A | | | 100,442,940 | | | | 191,895,444 | |
| Class B | | | 53,889 | | | | 77,985 | |
| Class C | | | 33,347,243 | | | | 30,487,339 | |
| Class R | | | 9,929,150 | | | | 8,691,456 | |
| Institutional Class | | | 134,663,231 | | | | 144,535,717 | |
| |
| Net asset value of shares issued upon reinvestment | | | | | | | | |
| of dividends and distributions: | | | | | | | | |
| Class A | | | 18,537,337 | | | | 17,602,223 | |
| Class B | | | 201,053 | | | | 298,037 | |
| Class C | | | 3,715,104 | | | | 2,609,161 | |
| Class R | | | 1,034,141 | | | | 1,356,859 | |
| Institutional Class | | | 12,921,740 | | | | 9,390,876 | |
| | | 314,845,828 | | | | 406,945,097 | |
26
| | Year Ended |
| | 7/31/13 | | 7/31/12 |
| Capital Share Transactions (continued): | | | | | | | | |
| Cost of shares redeemed: | | | | | | | | |
| Class A | | $ | (114,548,745 | ) | | $ | (199,347,677 | ) |
| Class B | | | (2,502,603 | ) | | | (2,730,313 | ) |
| Class C | | | (20,002,599 | ) | | | (19,898,088 | ) |
| Class R | | | (9,639,055 | ) | | | (14,043,834 | ) |
| Institutional Class | | | (140,874,021 | ) | | | (91,614,283 | ) |
| | | | (287,567,023 | ) | | | (327,634,195 | ) |
| Increase in net assets derived from | | | | | | | | |
| capital share transactions | | | 27,278,805 | | | | 79,310,902 | |
| Net Increase in Net Assets | | | 50,729,682 | | | | 74,150,345 | |
| |
| Net Assets: | | | | | | | | |
| Beginning of year | | | 583,033,900 | | | | 508,883,555 | |
| End of year (including undistributed net investment | | | | | | | | |
| income of $717,510 and $708,504, respectively) | | $ | 633,763,582 | | | $ | 583,033,900 | |
See accompanying notes, which are an integral part of the financial statements.
27
Financial highlights
Delaware High-Yield Opportunities Fund Class A
Selected data for each share of the Fund outstanding throughout each period were as follows:
| Net asset value, beginning of period |
| |
| Income (loss) from investment operations: |
| Net investment income |
| Net realized and unrealized gain (loss) |
| Total from investment operations |
| |
| Less dividends and distributions from: |
| Net investment income |
| Total dividends and distributions |
| |
| Net asset value, end of period |
| |
| Total return1 |
| |
| Ratios and supplemental data: |
| Net assets, end of period (000 omitted) |
| Ratio of expenses to average net assets |
| Ratio of expenses to average net assets |
| prior to fees waived |
| Ratio of net investment income to average net assets |
| Ratio of net investment income to average net assets |
| prior to fees waived |
| Portfolio turnover |
1 Total investment return is based on the change in net asset value of a share during the period and assumes reinvestment of dividends and distributions at net asset value and does not reflect the impact of a sales charge. Total investment return during all of the periods shown reflects a waiver by the manager. Performance would have been lower had the waiver not been in effect.
See accompanying notes, which are an integral part of the financial statements.
28
| | Year Ended | |
| | 7/31/13 | | 7/31/12 | | 7/31/11 | | 7/31/10 | | 7/31/09 | |
| | $4.110 | | | $4.200 | | | $3.980 | | | $3.560 | | | $3.880 | | |
| | | |
| | | |
| | 0.271 | | | 0.308 | | | 0.315 | | | 0.356 | | | 0.323 | | |
| | 0.173 | | | (0.090 | ) | | 0.231 | | | 0.412 | | | (0.347 | ) | |
| | 0.444 | | | 0.218 | | | 0.546 | | | 0.768 | | | (0.024 | ) | |
| | | |
| | | |
| | (0.284 | ) | | (0.308 | ) | | (0.326 | ) | | (0.348 | ) | | (0.296 | ) | |
| | (0.284 | ) | | (0.308 | ) | | (0.326 | ) | | (0.348 | ) | | (0.296 | ) | |
| | | | | | | | | | | | | | | | | |
| | $4.270 | | | $4.110 | | | $4.200 | | | $3.980 | | | $3.560 | | |
| | | | | | | | | | | | | | | | | |
| | 11.02% | | | 5.73% | | | 14.11% | | | 22.30% | | | 0.81% | | |
| | | |
| | | |
| | $328,534 | | | $311,859 | | | $306,304 | | | $335,684 | | | $261,286 | | |
| | 1.11% | | | 1.11% | | | 1.11% | | | 1.11% | | | 1.15% | | |
| | | | | | | | | | | | | | | | | |
| | 1.16% | | | 1.18% | | | 1.20% | | | 1.25% | | | 1.37% | | |
| | 6.33% | | | 7.71% | | | 7.60% | | | 9.25% | | | 9.92% | | |
| | | | | | | | | | | | | | | | | |
| | 6.28% | | | 7.64% | | | 7.51% | | | 9.11% | | | 9.70% | | |
| | 88% | | | 61% | | | 115% | | | 141% | | | 89% | | |
29
Financial highlights
Delaware High-Yield Opportunities Fund Class B
Selected data for each share of the Fund outstanding throughout each period were as follows:
| Net asset value, beginning of period |
| |
| Income (loss) from investment operations: |
| Net investment income |
| Net realized and unrealized gain (loss) |
| Total from investment operations |
| |
| Less dividends and distributions from: |
| Net investment income |
| Total dividends and distributions |
| |
| Net asset value, end of period |
| |
| Total return1 |
| |
| Ratios and supplemental data: |
| Net assets, end of period (000 omitted) |
| Ratio of expenses to average net assets |
| Ratio of expenses to average net assets |
| prior to fees waived |
| Ratio of net investment income to average net assets |
| Ratio of net investment income to average net assets |
| prior to fees waived |
| Portfolio turnover |
1 Total investment return is based on the change in net asset value of a share during the period and assumes reinvestment of dividends and distributions at net asset value and does not reflect the impact of a sales charge. Total investment return during all of the periods shown reflects a waiver by the manager. Performance would have been lower had the waiver not been in effect.
See accompanying notes, which are an integral part of the financial statements.
30
| | Year Ended | |
| | 7/31/13 | | 7/31/12 | | 7/31/11 | | 7/31/10 | | 7/31/09 | |
| | $4.110 | | | $4.190 | | | $3.980 | | | $3.560 | | | $3.880 | | |
| | | | |
| | | | |
| | 0.241 | | | 0.280 | | | 0.286 | | | 0.329 | | | 0.300 | | |
| | 0.173 | | | (0.080 | ) | | 0.221 | | | 0.412 | | | (0.347 | ) | |
| | 0.414 | | | 0.200 | | | 0.507 | | | 0.741 | | | (0.047 | ) | |
| | | | | |
| | | | | |
| | (0.254 | ) | | (0.280 | ) | | (0.297 | ) | | (0.321 | ) | | (0.273 | ) | |
| | (0.254 | ) | | (0.280 | ) | | (0.297 | ) | | (0.321 | ) | | (0.273 | ) | |
| | | | | | | | | | | | | | | | | |
| | $4.270 | | | $4.110 | | | $4.190 | | | $3.980 | | | $3.560 | | |
| | | | | | | | | | | | | | | | |
| | 10.25% | | | 5.24% | | | 13.06% | | | 21.46% | | | 0.11% | | |
| | | | |
| | | | |
| | $2,868 | | | $4,924 | | | $7,527 | | | $10,143 | | | $11,966 | | |
| | 1.81% | | | 1.81% | | | 1.81% | | | 1.81% | | | 1.85% | | |
| | | | | | | | | | | | | | | | |
| | 1.86% | | | 1.88% | | | 1.90% | | | 1.95% | | | 2.07% | | |
| | 5.63% | | | 7.01% | | | 6.90% | | | 8.55% | | | 9.22% | | |
| | | | | | | | | | | | | | | | |
| | 5.58% | | | 6.94% | | | 6.81% | | | 8.41% | | | 9.00% | | |
| | 88% | | | 61% | | | 115% | | | 141% | | | 89% | | |
31
Financial highlights
Delaware High-Yield Opportunities Fund Class C
Selected data for each share of the Fund outstanding throughout each period were as follows:
| Net asset value, beginning of period |
| |
| Income (loss) from investment operations: |
| Net investment income |
| Net realized and unrealized gain (loss) |
| Total from investment operations |
| |
| Less dividends and distributions from: |
| Net investment income |
| Total dividends and distributions |
| |
| Net asset value, end of period |
| |
| Total return1 |
| |
| Ratios and supplemental data: |
| Net assets, end of period (000 omitted) |
| Ratio of expenses to average net assets |
| Ratio of expenses to average net assets |
| prior to fees waived |
| Ratio of net investment income to average net assets |
| Ratio of net investment income to average net assets |
| prior to fees waived |
| Portfolio turnover |
1 Total investment return is based on the change in net asset value of a share during the period and assumes reinvestment of dividends and distributions at net asset value and does not reflect the impact of a sales charge. Total investment return during all of the periods shown reflects a waiver by the manager. Performance would have been lower had the waiver not been in effect.
See accompanying notes, which are an integral part of the financial statements.
32
| | Year Ended | |
| | 7/31/13 | | 7/31/12 | | 7/31/11 | | 7/31/10 | | 7/31/09 | |
| | $ 4.120 | | | $ 4.200 | | | $ 3.990 | | | $ 3.560 | | | $ 3.880 | | |
| | | | | |
| | | | |
| | 0.241 | | | 0.280 | | | 0.287 | | | 0.329 | | | 0.300 | | |
| | 0.173 | | | (0.080 | ) | | 0.221 | | | 0.422 | | | (0.347 | ) | |
| | 0.414 | | | 0.200 | | | 0.508 | | | 0.751 | | | (0.047 | ) | |
| | | | |
| | | | |
| | (0.254 | ) | | (0.280 | ) | | (0.298 | ) | | (0.321 | ) | | (0.273 | ) | |
| | (0.254 | ) | | (0.280 | ) | | (0.298 | ) | | (0.321 | ) | | (0.273 | ) | |
| | | | | | | | | | | | | | | | |
| | $4.280 | | | $4.120 | | | $4.200 | | | $3.990 | | | $3.560 | | |
| | | | | | | | | | | | | | | | |
| | 10.23% | | | 5.24% | | | 13.04% | | | 21.75% | | | 0.10% | | |
| | | | |
| | | | |
| | $85,574 | | | $65,771 | | | $53,151 | | | $36,060 | | | $31,415 | | |
| | 1.81% | | | 1.81% | | | 1.81% | | | 1.81% | | | 1.85% | | |
| | | | | | | | | | | | | | | | |
| | 1.86% | | | 1.88% | | | 1.90% | | | 1.95% | | | 2.07% | | |
| | 5.63% | | | 7.01% | | | 6.90% | | | 8.55% | | | 9.22% | | |
| | | | | | | | | | | | | | | | |
| | 5.58% | | | 6.94% | | | 6.81% | | | 8.41% | | | 9.00% | | |
| | 88% | | | 61% | | | 115% | | | 141% | | | 89% | | |
33
Financial highlights
Delaware High-Yield Opportunities Fund Class R
Selected data for each share of the Fund outstanding throughout each period were as follows:
| Net asset value, beginning of period |
| |
| Income (loss) from investment operations: |
| Net investment income |
| Net realized and unrealized gain (loss) |
| Total from investment operations |
| |
| Less dividends and distributions from: |
| Net investment income |
| Total dividends and distributions |
| |
| Net asset value, end of period |
| |
| Total return1 |
| |
| Ratios and supplemental data: |
| Net assets, end of period (000 omitted) |
| Ratio of expenses to average net assets |
| Ratio of expenses to average net assets |
| prior to fees waived |
| Ratio of net investment income to average net assets |
| Ratio of net investment income to average net assets |
| prior to fees waived |
| Portfolio turnover |
1 Total investment return is based on the change in net asset value of a share during the period and assumes reinvestment of dividends and distributions at net asset value. Total investment return during all of the periods shown reflects waivers by the manager and distributor. Performance would have been lower had the waivers not been in effect.
See accompanying notes, which are an integral part of the financial statements.
34
| | Year Ended | |
| | 7/31/13 | | 7/31/12 | | 7/31/11 | | 7/31/10 | | 7/31/09 | |
| | $4.120 | | | $4.210 | | | $3.990 | | | $3.570 | | | $3.890 | | |
| | | | |
| | | | |
| | 0.263 | | | 0.301 | | | 0.308 | | | 0.349 | | | 0.316 | | |
| | 0.183 | | | (0.090 | ) | | 0.231 | | | 0.412 | | | (0.347 | ) | |
| | 0.446 | | | 0.211 | | | 0.539 | | | 0.761 | | | (0.031 | ) | |
| | | | |
| | | | |
| | (0.276 | ) | | (0.301 | ) | | (0.319 | ) | | (0.341 | ) | | (0.289 | ) | |
| | (0.276 | ) | | (0.301 | ) | | (0.319 | ) | | (0.341 | ) | | (0.289 | ) | |
| | | | | | | | | | | | | | | | |
| | $4.290 | | | $4.120 | | | $4.210 | | | $3.990 | | | $3.570 | | |
| | | | | | | | | | | | | | | | |
| | 11.05% | | | 5.51% | | | 13.87% | | | 22.01% | | | 0.62% | | |
| | | | |
| | | | |
| | $16,506 | | | $14,637 | | | $19,046 | | | $14,708 | | | $15,323 | | |
| | 1.31% | | | 1.31% | | | 1.31% | | | 1.31% | | | 1.35% | | |
| | | | | | | | | | | | | | | | |
| | 1.46% | | | 1.48% | | | 1.50% | | | 1.55% | | | 1.67% | | |
| | 6.13% | | | 7.51% | | | 7.40% | | | 9.05% | | | 9.72% | | |
| | | | | | | | | | | | | | | | |
| | 5.98% | | | 7.34% | | | 7.21% | | | 8.81% | | | 9.40% | | |
| | 88% | | | 61% | | | 115% | | | 141% | | | 89% | | |
35
Financial highlights
Delaware High-Yield Opportunities Fund Institutional Class
Selected data for each share of the Fund outstanding throughout each period were as follows:
| Net asset value, beginning of period |
| |
| Income (loss) from investment operations: |
| Net investment income |
| Net realized and unrealized gain (loss) |
| Total from investment operations |
| |
| Less dividends and distributions from: |
| Net investment income |
| Total dividends and distributions |
| |
| Net asset value, end of period |
| |
| Total return1 |
| |
| Ratios and supplemental data: |
| Net assets, end of period (000 omitted) |
| Ratio of expenses to average net assets |
| Ratio of expenses to average net assets |
| prior to fees waived |
| Ratio of net investment income to average net assets |
| Ratio of net investment income to average net assets |
| prior to fees waived |
| Portfolio turnover |
1 Total investment return is based on the change in net asset value of a share during the period and assumes reinvestment of dividends and distributions at net asset value. Total investment return during all of the periods shown reflects a waiver by the manager. Performance would have been lower had the waiver not been in effect.
See accompanying notes, which are an integral part of the financial statements.
36
| | Year Ended | |
| | 7/31/13 | | 7/31/12 | | 7/31/11 | | 7/31/10 | | 7/31/09 | |
| | $4.110 | | | $4.200 | | | $3.980 | | | $3.560 | | | $3.880 | | |
| | | | |
| | | | |
| | 0.284 | | | 0.320 | | | 0.328 | | | 0.367 | | | 0.332 | | |
| | 0.173 | | | (0.090 | ) | | 0.231 | | | 0.412 | | | (0.347 | ) | |
| | 0.457 | | | 0.230 | | | 0.559 | | | 0.779 | | | (0.015 | ) | |
| | | | |
| | | | |
| | (0.297 | ) | | (0.320 | ) | | (0.339 | ) | | (0.359 | ) | | (0.305 | ) | |
| | (0.297 | ) | | (0.320 | ) | | (0.339 | ) | | (0.359 | ) | | (0.305 | ) | |
| | | | | | | | | | | | | | | | |
| | $4.270 | | | $4.110 | | | $4.200 | | | $3.980 | | | $3.560 | | |
| | | | | | | | | | | | | | | | |
| | 11.34% | | | 6.03% | | | 14.45% | | | 22.65% | | | 1.11% | | |
| | | | | |
| | | | | |
| | $200,282 | | | $185,843 | | | $122,855 | | | $59,831 | | | $45,166 | | |
| | 0.81% | | | 0.81% | | | 0.81% | | | 0.81% | | | 0.85% | | |
| | | | | | | | | | | | | | | | |
| | 0.86% | | | 0.88% | | | 0.90% | | | 0.95% | | | 1.07% | | |
| | 6.63% | | | 8.01% | | | 7.90% | | | 9.55% | | | 10.22% | | |
| | | | | | | | | | | | | | | | |
| | 6.58% | | | 7.94% | | | 7.81% | | | 9.41% | | | 10.00% | | |
| | 88% | | | 61% | | | 115% | | | 141% | | | 89% | | |
37
| Notes to financial statements | |
| Delaware High-Yield Opportunities Fund | July 31, 2013 |
Delaware Group® Income Funds (Trust) is organized as a Delaware statutory trust and offers five Series: Delaware Core Bond Fund, Delaware Corporate Bond Fund, Delaware Diversified Floating Rate Fund, Delaware Extended Duration Bond Fund and Delaware High-Yield Opportunities Fund. These financial statements and the related notes pertain to Delaware High-Yield Opportunities Fund (Fund). The Trust is an open-end investment company. The Fund is considered diversified under the Investment Company Act of 1940, as amended, and offers Class A, Class B, Class C, Class R and Institutional Class shares. Class A shares are sold with a maximum front-end sales charge of 4.50%. Class A share purchases of $1,000,000 or more will incur a contingent deferred sales charge (CDSC) of 1.00% if redeemed during the first year and 0.50% during the second year, provided that Delaware Distributors, L.P. (DDLP) paid a financial advisor a commission on the purchase of those shares. Class B shares may be purchased only through dividend reinvestment and certain permitted exchanges. Prior to June 1, 2007, Class B shares were sold with a CDSC that declined from 4.00% to zero depending upon the period of time the shares were held. Class B shares will automatically convert to Class A shares on a quarterly basis approximately eight years after purchase. Class C shares are sold with a CDSC of 1.00%, if redeemed during the first twelve months. Class R and Institutional Class shares are not subject to a sales charge and are offered for sale exclusively to certain eligible investors.
The investment objective of the Fund is to seek total return and, as a secondary objective, high current income.
1. Significant Accounting Policies
The following accounting policies are in accordance with U.S. generally accepted accounting principles (U.S. GAAP) and are consistently followed by the Fund.
Security Valuation — Equity securities, except those traded on the Nasdaq Stock Market, Inc. (Nasdaq), are valued at the last quoted sales price as of the time of the regular close of the New York Stock Exchange (NYSE) on the valuation date. Securities traded on the Nasdaq are valued in accordance with the Nasdaq Official Closing Price, which may not be the last sales price. If on a particular day an equity security does not trade, then the mean between the bid and ask prices will be used, which approximates fair value. Debt securities are valued based upon valuations provided by an independent pricing service or broker and reviewed by management. To the extent current market prices are not available, the pricing service may take into account developments related to the specific security, as well as transactions in comparable securities. U.S. government and agency securities are valued at the mean between the bid and ask prices, which approximates fair value. Valuations for fixed income securities utilize matrix systems, which reflect such factors as security prices, yields, maturities, and ratings, and are supplemented by dealer and exchange quotations. Investment company securities are valued at net asset value per share, as reported by the underlying investment company. Generally, other securities and assets for which market quotations are not readily available are valued at fair value as determined in good faith under the direction of the Fund’s Board of Trustees (Board). In determining whether market quotations are readily available or fair valuation will be used, various factors will be taken into consideration, such as market closures or suspension of trading in a security.
38
Federal Income Taxes — No provision for federal income taxes has been made as the Fund intends to continue to qualify for federal income tax purposes as a regulated investment company under Subchapter M of the Internal Revenue Code of 1986, as amended, and make the requisite distributions to shareholders. The Fund evaluates tax positions taken or expected to be taken in the course of preparing the Fund’s tax returns to determine whether the tax positions are “more-likely-than-not” of being sustained by the applicable tax authority. Tax positions not deemed to meet the “more-likely-than-not” threshold are recorded as a tax benefit or expense in the current year. Management has analyzed the Fund’s tax positions taken for all open federal income tax years (July 31, 2010–July 31, 2013), and has concluded that no provision for federal income tax is required in the Fund’s financial statements.
Class Accounting — Investment income and common expenses are allocated to the various classes of the Fund on the basis of “settled shares” of each class in relation to the net assets of the Fund. Realized and unrealized gain (loss) on investments are allocated to the various classes of the Fund on the basis of daily net assets of each class. Distribution expenses relating to a specific class are charged directly to that class.
Repurchase Agreements — The Fund may purchase certain U.S. government securities subject to the counterparty’s agreement to repurchase them at an agreed upon date and price. The counterparty will be required on a daily basis to maintain the value of the collateral subject to the agreement at not less than the repurchase price (including accrued interest). The agreements are conditioned upon the collateral being deposited under the Federal Reserve book-entry system with the Fund’s custodian or a third-party sub-custodian. In the event of default or bankruptcy by the other party to the agreement, retention of the collateral may be subject to legal proceedings. All open repurchase agreements as of the date of this report were entered into on July 31, 2013.
Use of Estimates — The preparation of financial statements in conformity with U.S. GAAP requires management to make estimates and assumptions that affect the fair value of investments, the reported amounts of assets and liabilities and disclosure of contingent assets and liabilities at the date of the financial statements and the reported amounts of revenues and expenses during the reporting period. Actual results could differ from those estimates and the differences could be material.
Other — Expenses directly attributable to the Fund are charged directly to the Fund. Other expenses common to various funds within the Delaware Investments® Family of Funds are generally allocated among such funds on the basis of average net assets. Management fees and some other expenses are paid monthly. Security transactions are recorded on the date the securities are purchased or sold (trade date) for financial reporting purposes. Costs used in calculating realized gains and losses on the sale of investment securities are those of the specific securities sold. Dividend income is recorded on the ex-dividend date and interest income is recorded on the accrual basis. Discounts and premiums on debt securities are amortized to interest income over the lives of the respective securities using the effective interest method. The Fund declares dividends daily from net investment income and pays the dividends monthly and
39
Notes to financial statements
Delaware High-Yield Opportunities Fund
1. Significant Accounting Policies (continued)
declares and pays distributions from net realized gain on investments, if any, annually. The Fund may distribute more frequently, if necessary for tax purposes. Dividends and distributions, if any, are recorded on the ex-dividend date.
The Fund may receive earnings credits from its custodian when positive cash balances are maintained, which are used to offset custody fees. There were no earnings credits for the year ended July 31, 2013.
The Fund receives earnings credits from its transfer agent when positive cash balances are maintained, which are used to offset transfer agent fees. If the amount earned is greater than one dollar, the expense paid under this arrangement is included in dividend disbursing and transfer agent fees and expenses and appears on the statement of operations with the corresponding expense offset shown as “expense paid indirectly.” For the year ended July 31, 2013, the Fund earned $918 under this agreement.
2. Investment Management, Administration Agreements and Other Transactions with Affiliates
In accordance with the terms of its investment management agreement, the Fund pays Delaware Management Company (DMC), a series of Delaware Management Business Trust and the investment manager, an annual fee which is calculated daily at the rate of 0.65% on the first $500 million of average daily net assets of the Fund, 0.60% on the next $500 million, 0.55% on the next $1.5 billion, and 0.50% on average daily net assets in excess of $2.5 billion.
DMC has contractually agreed to waive that portion, if any, of its management fee and/or pay/reimburse the Fund to the extent necessary to prevent that total annual operating expenses, (excluding any 12b-1 plan expenses, taxes, interest, inverse floater program expenses, short sale and dividend interest expenses, brokerage fees, certain insurance costs, and nonroutine expenses or costs, including, but not limited to, those relating to reorganizations, litigation, conducting shareholder meetings, and liquidations (collectively, nonroutine expenses)), do not exceed 0.81% of the Fund’s average daily net assets from Nov. 28, 2012 through Nov. 28, 2013. This waiver and reimbursement may only be terminated by agreement of DMC and the Fund.
Delaware Service Company, Inc. (DSC), an affiliate of DMC, provides fund accounting and financial administration oversight services to the Fund. For these services, the Fund pays DSC fees based on the aggregate daily net assets of the Delaware Investments® Family of Funds at the following annual rate: 0.0050% of the first $30 billion; 0.0045% of the next $10 billion; 0.0040% of the next $10 billion; and 0.0025% of aggregate average daily net assets in excess of $50 billion. The fees payable to DSC under the service agreement described above are allocated among all Funds in the Delaware Investments Family of Funds on a relative net asset value basis. For the year ended July 31, 2013, the Fund was charged $31,181 for these services.
40
DSC is also the transfer agent and dividend disbursing agent of the Fund. The Fund pays DSC a monthly asset-based fee for these services. Pursuant to a sub-transfer agent agreement between DSC and BNY Mellon Investment Servicing (U.S.) Inc. (BNYMIS), BNYMIS provides certain sub-transfer agency services to the Fund. Sub-transfer agency fees are passed on to and paid directly by the Fund.
Pursuant to a distribution agreement and distribution plan, the Fund pays DDLP, the distributor and an affiliate of DMC, an annual distribution and service fee of 0.30% of the average daily net assets of the Class A shares, 1.00% of the average daily net assets of the Class B and Class C shares and 0.60% of the average daily net assets of the Class R shares. Institutional Class shares pay no distribution and service expenses. DDLP has contracted to limit Class R shares 12b-1 fees from Nov. 28, 2012 through Nov. 28, 2013 to no more than 0.50% of its average daily net assets. The total 12b-1 fees to be paid by Class A shareholders of the Fund will be the sum of: (i) 0.10% of the average daily net assets representing shares that were acquired prior to June 1, 1992 and (ii) 0.30% of the average daily net assets representing shares that were acquired on or after June 1, 1992. All Class A shareholders will bear 12b-1 fees at the same rate, the blended rate based upon the allocation of the rates described above. This method of calculating Class A 12b-1 fees may be discontinued at the sole discretion of the Board.
At July 31, 2013, the Fund had liabilities payable to affiliates as follows:
| Investment management fees payable to DMC | $ | 335,616 |
| Dividend disbursing, transfer agent and fund accounting | | |
| oversight fees and other expenses payable to DSC | | 14,483 |
| Distribution fees payable to DDLP | | 164,026 |
| Other expenses payable to DMC and affiliates* | | 31,107 |
*DMC, as part of its administrative services, pays operating expenses on behalf of the Fund and is reimbursed on a periodic basis. Expenses include items such as printing of shareholder reports, legal and tax services, registration fees and trustees’ fees.
As provided in the investment management agreement, the Fund bears the cost of certain legal and tax services, including internal legal and tax services provided to the Fund by DMC and/or its affiliates’ employees. For the year ended July 31, 2013, the Fund was charged $18,993 for internal legal and tax services provided by DMC and/or its affiliates’ employees.
For the year ended July 31, 2013, DDLP earned $85,104 for commissions on sales of the Fund’s Class A shares. For the year ended July 31, 2013, DDLP received gross CDSC commissions of $170 and $4,926 on redemptions of the Fund’s Class B and Class C shares, respectively, and these commissions were entirely used to offset up-front commissions previously paid by DDLP to broker/dealers on sales of those shares.
Trustees’ fees include expenses accrued by the Fund for each Trustee’s retainer and meeting fees. Certain officers of DMC, DSC, and DDLP are officers and/or Trustees of the Trust. These officers and Trustees are paid no compensation by the Fund.
41
Notes to financial statements
Delaware High-Yield Opportunities Fund
3. Investments
For the year ended July 31, 2013, the Fund made purchases of $577,145,770 and sales of $533,999,713 of investment securities other than short-term investments.
At July 31, 2013, the cost of investments for federal income tax purposes was $606,185,427. At July 31, 2013, net unrealized appreciation was $23,918,689, of which $30,394,767 related to unrealized appreciation of investments and $6,476,078 related to unrealized depreciation of investments.
U.S. GAAP defines fair value as the price that the Fund would receive to sell an asset or pay to transfer a liability in an orderly transaction between market participants at the measurement date under current market conditions. A three-level hierarchy for fair value measurements has been established based upon the transparency of inputs to the valuation of an asset or liability. Inputs may be observable or unobservable and refer broadly to the assumptions that market participants would use in pricing the asset or liability. Observable inputs reflect the assumptions market participants would use in pricing the asset or liability based on market data obtained from sources independent of the reporting entity. Unobservable inputs reflect the reporting entity’s own assumptions about the assumptions that market participants would use in pricing the asset or liability developed based on the best information available under the circumstances. The Fund’s investment in its entirety is assigned a level based upon the observability of the inputs which are significant to the overall valuation. The three-level hierarchy of inputs is summarized below.
| Level 1 – | inputs are quoted prices in active markets for identical investments (e.g., equity securities, open-end investment companies, futures contracts, exchange-traded options contracts) |
| |
| Level 2 – | other observable inputs (including, but not limited to: quoted prices for similar assets or liabilities in markets that are active, quoted prices for identical or similar assets or liabilities in markets that are not active, inputs other than quoted prices that are observable for the assets or liabilities (such as interest rates, yield curves, volatilities, prepayment speeds, loss severities, credit risks and default rates) or other market-corroborated inputs) (e.g., debt securities, government securities, swap contracts, foreign currency exchange contracts, foreign securities utilizing international fair value pricing, broker-quoted securities, fair valued securities) |
| |
| Level 3 – | inputs are significant unobservable inputs (including the Fund’s own assumptions used to determine the fair value of investments) (e.g., broker-quoted securities, fair valued securities) |
Level 3 investments are valued using significant unobservable inputs. The Fund may also use an income-based valuation approach in which the anticipated future cash flows of the investment are discounted to calculate fair value. Discounts may also be applied due to the nature or duration of any restrictions on the disposition of the investments. Valuations may also be based upon current market prices of securities that are comparable in coupon, rating, maturity and industry. The derived value of a Level 3 investment may not represent the value which is received upon disposition and this could impact the results of operations.
42
The following table summarizes the valuation of the Fund’s investments by fair value hierarchy levels as of July 31, 2013:
| Level 1 | | Level 2 | | Level 3 | | Total |
| Common Stock | $ | 13,790,061 | | $ | — | | | $— | | | $ | 13,790,061 |
| Corporate Debt | | — | | | 588,403,311 | | | — | | | | 588,403,311 |
| Short-Term Investments | | — | | | 10,239,000 | | | — | | | | 10,239,000 |
| Securities Lending Collateral | | — | | | 977,199 | | | — | | | | 977,199 |
| Preferred Stock1 | | 5,041,530 | | | 5,844,688 | | | — | | | | 10,886,218 |
| Convertible Preferred Stock2 | | 950,383 | | | 4,857,944 | | | — | | | | 5,808,327 |
| Total | $ | 19,781,974 | | $ | 610,322,142 | | | $— | | | $ | 630,104,116 |
1Security type is valued across multiple levels. The amounts attributed to Level 1 investments and Level 2 investments represent 46.31% and 53.69%, respectively, of the total market value of this security type. Level 1 investments represent exchange traded investments while Level 2 investments represent matrix-priced investments. |
2Security type is valued across multiple levels. The amounts attributed to Level 1 investments and Level 2 investments represent 16.36% and 83.64%, respectively, of the total market value of the security type. Level 1 investments represent exchange traded investments while Level 2 investments represent matrix-priced investments. |
The securities that have been deemed worthless on the statement of net assets are considered to be Level 3 investments in the table.
During the year ended July 31, 2013, there were no transfers between Level 1 investments, Level 2 investments or Level 3 investments that had a significant impact to the Fund. The Fund’s policy is to recognize transfers between levels at the beginning of the reporting period.
A reconciliation of Level 3 investments is presented when the Fund has a significant amount of Level 3 investments at the beginning, interim or end of the period in relation to net assets. Management has determined not to provide additional disclosure on Level 3 inputs under ASU No. 2011-04 since the Level 3 investments are not considered significant to the Fund’s net assets at the end of the period.
4. Dividend and Distribution Information
Income and long-term capital gain distributions are determined in accordance with federal income tax regulations, which may differ from U.S. GAAP. Additionally, distributions from net short-term gains on sales of investment securities are treated as ordinary income for federal income tax purposes. The tax character of dividends and distributions paid during the years ended July 31, 2013 and 2012 was as follows:
| | Year Ended |
| | | 7/31/13 | | 7/31/12 |
| Ordinary income | | $42,733,548 | | $40,844,409 |
43
Notes to financial statements
Delaware High-Yield Opportunities Fund
5. Components of Net Assets on a Tax Basis
As of July 31, 2013, the components of net assets on a tax basis were as follows:
| Shares of beneficial interest | $ | 645,414,522 | |
| Undistributed ordinary income | | 1,841,859 | |
| Capital loss carryforwards | | (36,320,419 | ) |
| Unrealized appreciation | | 23,927,505 | |
| Distributions payable | | (1,099,885 | ) |
| Net assets | $ | 633,763,582 | |
The differences between book basis and tax basis components of net assets are primarily attributable to tax deferral of losses on wash sales, tax treatment of distributions payable, trust preferred securities, and market discount and premium on debt instruments.
For financial reporting purposes, capital accounts are adjusted to reflect the tax character of permanent book/tax differences. Reclassifications are primarily due to tax treatment of market discount and premium on debt instruments and trust preferred securities. Results of operations and net assets were not affected by these reclassifications. For the year ended July 31, 2013, the Fund recorded the following reclassifications:
| Undistributed net investment income | $ | 2,040,903 | |
| Accumulated net realized loss | | (2,040,903 | ) |
For federal income tax purposes, capital loss carryforwards may be carried forward and applied against future capital gains. $9,835,628 was utilized in 2013. Capital loss carryforwards remaining at July 31, 2013, will expire as follows: $36,320,419 expires in 2017. The use of these losses is subject to an annual limitation in accordance with the internal revenue code.
On December 22, 2010, the Regulated Investment Company Modernization Act of 2010 (Act) was enacted, which changed various technical rules governing the tax treatment of regulated investment companies. The changes were generally effective for taxable years beginning after the date of enactment. Under the Act, the Fund is permitted to carry forward capital losses incurred in taxable years beginning after the date of enactment for an unlimited period. However, any losses incurred during those future taxable years will be required to be utilized prior to the losses incurred in pre-enactment taxable years, which carry an expiration date. As a result of this ordering rule, pre-enactment capital loss carryforwards may be more likely to expire unused. Additionally, post-enactment capital loss carryforwards will retain their character as either short-term or long-term capital losses rather than being considered all short-term as permitted under previous regulation.
44
6. Capital Shares
Transactions in capital shares were as follows:
| Year Ended |
| 7/31/13 | | 7/31/12 |
| Shares sold: | | | | | |
| Class A | 23,531,258 | | | 48,524,297 | |
| Class B | 12,796 | | | 19,480 | |
| Class C | 7,829,884 | | | 7,637,786 | |
| Class R | 2,323,708 | | | 2,181,405 | |
| Institutional Class | 31,559,302 | | | 36,571,562 | |
| |
| Shares issued upon reinvestment of dividends and distributions: | | | | | |
| Class A | 4,341,317 | | | 4,429,622 | |
| Class B | 47,237 | | | 75,228 | |
| Class C | 868,111 | | | 655,176 | |
| Class R | 241,574 | | | 343,198 | |
| Institutional Class | 3,024,352 | | | 2,360,501 | |
| | 73,779,539 | | | 102,798,255 | |
| |
| Shares redeemed: | | | | | |
| Class A | (26,810,804 | ) | | (50,135,715 | ) |
| Class B | (586,314 | ) | | (691,949 | ) |
| Class C | (4,667,614 | ) | | (4,970,621 | ) |
| Class R | (2,262,507 | ) | | (3,501,947 | ) |
| Institutional Class | (32,898,698 | ) | | (23,021,203 | ) |
| | (67,225,937 | ) | | (82,321,435 | ) |
| |
| Net increase | 6,553,602 | | | 20,476,820 | |
For the years ended July 31, 2013 and 2012, 164,506 Class B shares were converted to 164,750 Class A shares valued at $704,709 and 322,002 Class B shares were converted to 322,601 Class A shares valued at $1,266,735, respectively. The respective amounts are included in Class B redemptions and Class A subscriptions in the table above and in the statements of changes in net assets.
7. Line of Credit
The Fund, along with certain other funds in the Delaware Investments® Family of Funds (Participants), was a participant in a $125,000,000 revolving line of credit to be used for temporary or emergency purposes as an additional source of liquidity to fund redemptions of investor shares. Under the agreement, the Participants were charged an annual commitment fee, which was allocated across the Participants on the basis of each Participant’s allocation of the entire facility.
45
Notes to financial statements
Delaware High-Yield Opportunities Fund
7. Line of Credit (continued)
The Participants were permitted to borrow up to a maximum of one third of their net assets under the agreement. Each participant was individually, and not jointly, liable for its particular advances, if any, under the line of credit. The line of credit available under the agreement expired on Nov. 13, 2012.
On Nov. 13, 2012, the Fund, along with the other Participants, entered into an amendment to the agreement for a $125,000,000 revolving line of credit. The line of credit is to be used as described above and operates in substantially the same manner as the original agreement. The line of credit available under the agreement expires on Nov. 12, 2013. The Fund had no amounts outstanding as of July 31, 2013, or at any time during the year then ended.
8. Securities Lending
The Fund, along with other funds in the Delaware Investments® Family of Funds, may lend its securities pursuant to a security lending agreement (Lending Agreement) with The Bank of New York Mellon (BNY Mellon). At the time a security is loaned, the borrower must post collateral equal to the required percentage of the market value of the loaned security, including any accrued interest. The required percentage is: (i) 102% with respect to U.S. securities and foreign securities that are denominated and payable in U.S. dollars; and (ii) 105% with respect to foreign securities. With respect to each loan, if on any business day the aggregate market value of securities collateral plus cash collateral held is less than the aggregate market value of the securities which are the subject of such loan, the borrower will be notified to provide additional collateral by the end of the following business day which, together with the collateral already held, will be not less than the applicable initial collateral requirements for such security loan. If the aggregate market value of securities collateral and cash collateral held with respect to a security loan exceeds the applicable initial collateral requirement, upon the request of the borrower BNY Mellon must return enough collateral to the borrower by the end of the following business day to reduce the value of the remaining collateral to the applicable initial collateral requirement for such security loan. As a result of the foregoing, the value of the collateral held with respect to a loaned security may be temporarily more or less than the value of the security on loan.
Cash collateral received is generally invested in the Delaware Investments Collateral Fund No. 1 (Collective Trust) established by BNY Mellon for the purpose of investment on behalf of funds managed by DMC that participate in BNY Mellon’s securities lending program. The Collective Trust may invest in U.S. government securities and high-quality corporate debt, asset-backed and other money market securities and in repurchase agreements collateralized by such securities, provided that the Collective Trust will generally have a dollar-weighted average portfolio maturity of 60 days or less. The Fund can also accept U.S. government securities and letters of credit (non-cash collateral) in connection with securities loans. In the event of default or bankruptcy by the lending agent, realization and/or retention of the collateral may be subject to legal proceedings. In the event the borrower fails to return loaned securities and the collateral received is insufficient to cover the value of the loaned securities and provided such collateral shortfall is not the result of
46
investment losses, the lending agent has agreed to pay the amount of the shortfall to the Fund or, at the discretion of the lending agent, replace the loaned securities. The Fund continues to record dividends or interest, as applicable, on the securities loaned and is subject to changes in value of the securities loaned that may occur during the term of the loan. The Fund has the right under the Lending Agreement to recover the securities from the borrower on demand. With respect to security loans collateralized by non-cash collateral, the Fund receives loan premiums paid by the borrower. With respect to security loans collateralized by cash collateral, the earnings from the collateral investments are shared among the Fund, the security lending agent and the borrower. The Fund records security lending income net of allocations to the security lending agent and the borrower.
The Collective Trust used for the investment of cash collateral received from borrowers of securities seeks to maintain a net asset value per unit of $1.00, but there can be no assurance that it will always be able to do so. The Fund may incur investment losses as a result of investing securities lending collateral in the Collective Trust or another collateral investment pool. This could occur if an investment in a collateral investment pool defaulted or if it were necessary to liquidate assets in the collateral investment pool to meet returns on outstanding security loans at a time when the collateral investment pool net asset value per unit was less than $1.00. Under those circumstances, the Fund may not receive an amount from the collateral investment pool that is equal in amount to the collateral the Fund would be required to return to the borrower of the securities and the Fund would be required to make up for this shortfall.
At July 31, 2013, the value of the securities on loan was $935,849, for which cash collateral was received and invested in accordance with the Lending Agreement. At July 31, 2013, the value of invested collateral was $977,199. These investments are presented on the statement of net assets under the caption “Securities Lending Collateral.”
9. Credit and Market Risk
The Fund invests in high yield fixed income securities, which are securities rated lower than BBB- by Standard & Poor’s and Baa3 by Moody’s Investors Service, or similarly rated by another nationally recognized statistical rating organization. Investments in these higher yielding securities are generally accompanied by a greater degree of credit risk than higher rated securities. Additionally, lower rated securities may be more susceptible to adverse economic and competitive industry conditions than investment-grade securities.
The Fund invests in certain obligations that may have liquidity protection to ensure that the receipt of payments due on the underlying security is timely. Such protection may be provided through guarantees, insurance policies or letters of credit obtained by the issuer or sponsor through third parties, through various means of structuring the transaction or through a combination of such approaches. The Fund will not pay any additional fees for such credit support, although the existence of credit support may increase the price of a security.
47
Notes to financial statements
Delaware High-Yield Opportunities Fund
9. Credit and Market Risk (continued)
The Fund may invest up to 15% of its net assets in illiquid securities, which may include securities with contractual restrictions on resale, securities exempt from registration under Rule 144A of the Securities Act of 1933, as amended, and other securities which may not be readily marketable. The relative illiquidity of these securities may impair the Fund from disposing of them in a timely manner and at a fair price when it is necessary or desirable to do so. While maintaining oversight, the Fund’s Board has delegated to DMC the day-to-day functions of determining whether individual securities are liquid for purposes of the Fund’s limitation on investments in illiquid securities. Securities eligible for resale pursuant to Rule 144A, which are determined to be liquid, are not subject to the Fund’s 15% limit on investments in illiquid securities. As of July 31, 2013, no securities have been determined to be illiquid under the Fund’s Liquidity Procedures. Rule 144A securities have been identified on the statement of net assets.
10. Contractual Obligations
The Fund enters into contracts in the normal course of business that contain a variety of indemnifications. The Fund’s maximum exposure under these arrangements is unknown. However, the Fund has not had prior claims or losses pursuant to these contracts. Management has reviewed the Fund’s existing contracts and expects the risk of loss to be remote.
11. Subsequent Events
Management has determined that no material events or transactions occurred subsequent to July 31, 2013 that would require recognition or disclosure in the Fund’s financial statements.
48
Report of independent
registered public accounting firm
To the Board of Trustees of Delaware Group® Income Funds
and the Shareholders of Delaware High-Yield Opportunities Fund:
In our opinion, the accompanying statement of net assets and the related statements of operations and of changes in net assets and the financial highlights present fairly, in all material respects, the financial position of Delaware High-Yield Opportunities Fund (one of the series constituting Delaware Group Income Funds, hereinafter referred to as the “Fund”) at July 31, 2013, the results of its operations for the year then ended, the changes in its net assets for each of the two years in the period then ended and the financial highlights for each of the four years in the period then ended, in conformity with accounting principles generally accepted in the United States of America. These financial statements and financial highlights (hereafter referred to as “financial statements”) are the responsibility of the Fund’s management; our responsibility is to express an opinion on these financial statements based on our audits. We conducted our audits of these financial statements in accordance with the standards of the Public Company Accounting Oversight Board (United States). Those standards require that we plan and perform the audit to obtain reasonable assurance about whether the financial statements are free of material misstatement. An audit includes examining, on a test basis, evidence supporting the amounts and disclosures in the financial statements, assessing the accounting principles used and significant estimates made by management, and evaluating the overall financial statement presentation. We believe that our audits, which included confirmation of securities at July 31, 2013 by correspondence with the custodian and brokers, provide a reasonable basis for our opinion. The financial highlights for the year ended July 31, 2009 were audited by other independent accountants whose report dated September 21, 2009 expressed an unqualified opinion on those statements.
PricewaterhouseCoopers LLP
Philadelphia, Pennsylvania
September 20, 2013
49
Other Fund information
(Unaudited)
Delaware High-Yield Opportunities Fund
Tax Information
The information set forth below is for the Fund’s fiscal year as required by federal laws. Shareholders, however, must report distributions on a calendar year basis for income tax purposes, which may include distributions for portions of two fiscal years of a fund. Accordingly, the information needed by shareholders for income tax purposes will be sent to them in January of each year. Please consult your tax advisor for proper treatment of this information.
All designations are based on financial information available as of the date of this annual report and, accordingly are subject to change. For any and all items requiring designation, it is the intention of the Fund to designate the maximum amount permitted under the Internal Revenue Code and the regulations thereunder.
For the fiscal year ended July 31, 2013, the Fund designates distributions paid during the year as follows:
| (A) Ordinary Income Distribution (Tax Basis)* | 100 | % |
| (B) Qualifying Dividends1 | 1.71 | % |
| (A) | is based on a percentage of the Fund’s total distributions. |
| (B) | is based on a percentage of the Fund’s ordinary income distributions. |
| 1Qualifying dividends represent dividends which qualify for the corporate dividends received deduction. |
| *For the fiscal year ended July 31, 2013, certain dividends paid by the Fund may be subject to a maximum tax rate of 15%, as provided for by the Jobs and Growth Tax Relief Reconciliation Act of 2003 and as extended by the Tax Relief, Unemployment Insurance Reauthorization and Jobs Creation Act of 2010. The Fund intends to designate up to a maximum amount of 1.71% to be taxed at a maximum rate of 15%. Complete information will be computed and reported in conjunction with your 2013 Form 1099-DIV. |
50
Board of trustees/directors and officers addendum
Delaware Investments® Family of Funds
A mutual fund is governed by a Board of Trustees/Directors (“Trustees”), which has oversight responsibility for the management of a fund’s business affairs. Trustees establish procedures and oversee and review the performance of the investment manager, the distributor, and others who perform services for the fund. The independent fund trustees, in particular, are advocates
| Name, Address, | Position(s) | Length of |
| and Birth Date | Held with Fund(s) | Time Served |
| Interested Trustees | | |
| | | |
| Patrick P. Coyne1 | Chairman, President, | Chairman and Trustee |
| 2005 Market Street | Chief Executive Officer, | since August 16, 2006 |
| Philadelphia, PA 19103 | and Trustee | |
| April 1963 | | President and |
| | | Chief Executive Officer |
| | | since August 1, 2006 |
| | | |
| |
| Independent Trustees | | |
| | | |
| Thomas L. Bennett | Trustee | Since March 2005 |
| 2005 Market Street | | |
| Philadelphia, PA 19103 | | |
| October 1947 | | |
| | | |
| Joseph W. Chow | Trustee | Since January 2013 |
| 2005 Market Street | | |
| Philadelphia, PA 19103 | | |
| January 1953 | | |
| | | |
| |
| John A. Fry | Trustee | Since January 2001 |
| 2005 Market Street | | |
| Philadelphia, PA 19103 | | |
| May 1960 | | |
| |
| |
| |
| |
| Anthony D. Knerr | Trustee | Since April 1990 |
| 2005 Market Street | | |
| Philadelphia, PA 19103 | | |
| December 1938 | | |
| | | |
1 Patrick P. Coyne is considered to be an “Interested Trustee” because he is an executive officer of the Fund’s(s’) investment advisor.
52
for shareholder interests. Each trustee has served in that capacity since he or she was elected to or appointed to the Board of Trustees, and will continue to serve until his or her retirement or the election of a new trustee in his or her place. The following is a list of the Trustees and Officers with certain background and related information.
| Number of Portfolios in | |
| Principal Occupation(s) | Fund Complex Overseen | Other Directorships |
| During Past 5 Years | by Trustee or Officer | Held by Trustee or Officer |
| |
| |
| Patrick P. Coyne has served in | 70 | Director and Audit |
| various executive capacities | | Committee Member |
| at different times at | | Kaydon Corp. |
| Delaware Investments.2 | | |
| | | Board of Governors Member |
| | | Investment Company |
| | | Institute (ICI) |
| |
| |
| |
| Private Investor | 70 | Director |
| (March 2004–Present) | | Bryn Mawr Bank Corp. (BMTC) |
| | | (2007–2011) |
| |
| Executive Vice President | 70 | Director and Audit Committee |
| (Emerging Economies Strategies, | | Member — Hercules |
| Risk and Corporate Administration) | | Technology Growth |
| State Street Corporation | | Capital, Inc. |
| (July 2004–March 2011) | | |
| | | |
| President | 70 | Director — Hershey Trust |
| Drexel University | | |
| (August 2010–Present) | | Director and Audit |
| | | Committee Member |
| President | | Community Health Systems |
| Franklin & Marshall College | | |
| (July 2002–July 2010) | | |
| | | |
| Managing Director | 70 | None |
| AKA Strategy | | |
| (Strategic Consulting) | | |
| (1990–Present) | | |
| | | |
2 Delaware Investments is the marketing name for Delaware Management Holdings, Inc. and its subsidiaries, including the Fund’s(s’) investment advisor, principal underwriter, and its transfer agent.
53
Board of trustees/directors and officers addendum
Delaware Investments® Family of Funds
| Name, Address, | Position(s) | Length of |
| and Birth Date | Held with Fund(s) | Time Served |
| Independent Trustees (continued) | | |
| | | |
| Lucinda S. Landreth | Trustee | Since March 2005 |
| 2005 Market Street | | |
| Philadelphia, PA 19103 | | |
| June 1947 | | |
| | | |
| Frances A. Sevilla-Sacasa | Trustee | Since September 2011 |
| 2005 Market Street | | |
| Philadelphia, PA 19103 | | |
| January 1956 | | |
| |
| |
| |
| |
| |
| |
| |
| |
| |
| |
| |
| |
| |
| |
| Thomas K. Whitford | Trustee | Since January 2013 |
| 2005 Market Street | | |
| Philadelphia, PA 19103 | | |
| March 1956 | | |
| | | |
| | | |
| | | |
| | | |
| | | |
| | | |
| | | |
54
| Number of Portfolios in | |
| Principal Occupation(s) | Fund Complex Overseen | Other Directorships |
| During Past 5 Years | by Trustee or Officer | Held by Trustee or Officer |
| |
| |
| Private Investor | 70 | None |
| (2004–Present) | | |
| |
| |
| |
| Chief Executive Officer — | 70 | Trust Manager and |
| Banco Itaú Europa | | Audit Committee |
| International | | Member — Camden |
| (April 2012–Present) | | Property Trust |
| |
| Executive Advisor to Dean | | |
| (August 2011–March 2012) | | |
| and Interim Dean | | |
| (January 2011–July 2011) — | | |
| University of Miami School of | | |
| Business Administration | | |
| |
| President — U.S. Trust, | | |
| Bank of America Private | | |
| Wealth Management | | |
| (Private Banking) | | |
| (July 2007–December 2008) | | |
| | | |
| Vice Chairman | 70 | None |
| (2010–April 2013) | | |
| Chief Administrative | | |
| Officer (2008–2010) | | |
| and Executive Vice | | |
| President and Chief | | |
| Administrative Officer | | |
| (2007–2009) — | | |
| PNC Financial | | |
| Services Group | | |
| | | |
55
Board of trustees/directors and officers addendum
Delaware Investments® Family of Funds
| Name, Address, | Position(s) | Length of |
| and Birth Date | Held with Fund(s) | Time Served |
| Independent Trustees (continued) | | |
| | | |
| Janet L. Yeomans | Trustee | Since April 1999 |
| 2005 Market Street | | |
| Philadelphia, PA 19103 | | |
| July 1948 | | |
| |
| |
| |
| |
| |
| |
| |
| J. Richard Zecher | Trustee | Since March 2005 |
| 2005 Market Street | | |
| Philadelphia, PA 19103 | | |
| July 1940 | | |
| | | |
| | | |
| | | |
| | | |
| | | |
| | | |
56
| Number of Portfolios in | |
| Principal Occupation(s) | Fund Complex Overseen | Other Directorships |
| During Past 5 Years | by Trustee or Officer | Held by Trustee or Officer |
| |
| |
| Vice President and Treasurer | 70 | Director, Audit |
| (January 2006–July 2012) | | Committee Member and |
| Vice President — Mergers & Acquisitions | | Investment Committee |
| (January 2003–January 2006), and | | Member |
| Vice President and Treasurer | | Okabena Company |
| (July 1995–January 2003) | | |
| 3M Corporation | | Chair — 3M |
| | | Investment Management |
| | | Company |
| | | (2005–2012) |
| | | |
| Founder | 70 | Director and Compensation |
| Investor Analytics | | Committee Member |
| (Risk Management) | | Investor Analytics |
| (May 1999–Present) | | |
| | | Director — P/E Investments |
| Founder | | |
| P/E Investments | | |
| (Hedge Fund) | | |
| (September 1996–Present) | | |
| | | |
57
Board of trustees/directors and officers addendum
Delaware Investments® Family of Funds
| Name, Address, | Position(s) | Length of |
| and Birth Date | Held with Fund(s) | Time Served |
| Officers | | |
| | | |
| David F. Connor | Senior Vice President, | Senior Vice President, |
| 2005 Market Street | Deputy General | Deputy General Counsel |
| Philadelphia, PA 19103 | Counsel, and Secretary | since May 2013; |
| December 1963 | | Vice President, Deputy |
| | General Counsel |
| | September 2000– |
| | May 2013; Secretary since |
| | October 2005 |
| | | |
| Daniel V. Geatens | Vice President | Treasurer |
| 2005 Market Street | and Treasurer | since October 2007 |
| Philadelphia, PA 19103 | | |
| October 1972 | | |
| | | |
| David P. O’Connor | Executive Vice President, | Executive Vice President |
| 2005 Market Street | General Counsel | since February 2012; |
| Philadelphia, PA 19103 | and Chief Legal Officer | Senior Vice President |
| February 1966 | | October 2005– |
| | February 2012; |
| | General Counsel and |
| | Chief Legal Officer |
| | since October 2005 |
| | | |
| Richard Salus | Senior Vice President | Chief Financial Officer |
| 2005 Market Street | and Chief Financial Officer | since November 2006 |
| Philadelphia, PA 19103 | | |
| October 1963 | | |
| | | |
The Statement of Additional Information for the Fund(s) includes additional information about the Trustees and Officers and is available, without charge, upon request by calling 800 523-1918.
58
| Number of Portfolios in | |
| Principal Occupation(s) | Fund Complex Overseen | Other Directorships |
| During Past 5 Years | by Trustee or Officer | Held by Trustee or Officer |
| |
| |
| David F. Connor has served as | 70 | None3 |
| Deputy General Counsel of | | |
| Delaware Investments | | |
| since 2000. | | |
| |
| |
| |
| |
| |
| Daniel V. Geatens has served | 70 | None3 |
| in various capacities at | | |
| different times at | | |
| Delaware Investments. | | |
| | | |
| David P. O’Connor has served in | 70 | None3 |
| various executive and legal | | |
| capacities at different times | | |
| at Delaware Investments. | | |
| |
| |
| |
| |
| |
| Richard Salus has served in | 70 | None3 |
| various executive capacities | | |
| at different times at | | |
| Delaware Investments. | | |
| | | |
3 David F. Connor, Daniel V. Geatens, David P. O’Connor, and Richard Salus serve in similar capacities for the six portfolios of the Optimum Fund Trust, which have the same investment advisor, principal underwriter, and transfer agent as the registrant.
59
About the organization
| Board of trustees | | | |
Patrick P. Coyne
Chairman, President, and
Chief Executive Officer
Delaware Investments®
Family of Funds
Philadelphia, PA
Thomas L. Bennett
Private Investor
Rosemont, PA | Joseph W. Chow
Former Executive Vice
President
State Street Corporation
Brookline, MAJohn A. Fry
President
Drexel University
Philadelphia, PA Anthony D. Knerr
Founder and Managing
Director
AKA Strategy
New York, NY | Lucinda S. Landreth
Former Chief Investment
Officer
Assurant, Inc.
Philadelphia, PAFrances A.
Sevilla-Sacasa
Chief Executive Officer
Banco Itaú Europa
International
Miami, FL | Thomas K. Whitford
Former Vice Chairman
PNC Financial Services Group
Pittsburgh, PAJanet L. Yeomans
Former Vice President and
Treasurer
3M Corporation
St. Paul, MN J. Richard Zecher
Founder
Investor Analytics
Scottsdale, AZ |
| | | | |
| Affiliated officers | | | |
David F. Connor
Senior Vice President,
Deputy General Counsel,
and Secretary
Delaware Investments
Family of Funds
Philadelphia, PA | Daniel V. Geatens
Vice President and
Treasurer
Delaware Investments
Family of Funds
Philadelphia, PA | David P. O’Connor
Executive Vice President,
General Counsel,
and Chief Legal Officer
Delaware Investments
Family of Funds
Philadelphia, PA | Richard Salus
Senior Vice President and
Chief Financial Officer
Delaware Investments
Family of Funds
Philadelphia, PA |
This annual report is for the information of Delaware High-Yield Opportunities Fund shareholders, but it may be used with prospective investors when preceded or accompanied by the Delaware Investments Fund fact sheet for the most recently completed calendar quarter. These documents are available at delawareinvestments.com. |
Delaware Investments is the marketing name of Delaware Management Holdings, Inc. and its subsidiaries. |
The Fund files its complete schedule of portfolio holdings with the Securities and Exchange Commission (SEC) for the first and third quarters of each fiscal year on Form N-Q. The Fund’s Forms N-Q, as well as a description of the policies and procedures that the Fund uses to determine how to vote proxies (if any) relating to portfolio securities are available without charge (i) upon request, by calling 800 523-1918; and (ii) on the SEC’s website at sec.gov. In addition, a description of the policies and procedures that the Fund uses to determine how to vote proxies (if any) relating to portfolio securities and the Fund’s Schedule of Investments are available without charge on the Fund’s website at delawareinvestments.com. The Fund’s Forms N-Q may be reviewed and copied at the SEC’s Public Reference Room in Washington, D.C.; information on the operation of the Public Reference Room may be obtained by calling 800 SEC-0330.
Information (if any) regarding how the Fund voted proxies relating to portfolio securities during the most recently disclosed 12-month period ended June 30 is available without charge (i) through the Fund’s website at delawareinvestments.com; and (ii) on the SEC’s website at sec.gov.
60
Annual report Delaware Core Bond Fund July 31, 2013 Fixed income mutual fund |
Carefully consider the Fund’s investment objectives, risk factors, charges, and expenses before investing. This and other information can be found in the Fund’s prospectus and, if available, its summary prospectus, which may be obtained by visiting delawareinvestments.com or calling 800 523-1918. Investors should read the prospectus and, if available, the summary prospectus carefully before investing. |
You can obtain shareholder reports and prospectuses online instead of in the mail.
Visit delawareinvestments.com/edelivery. |
Experience Delaware Investments
Delaware Investments is committed to the pursuit of consistently superior asset management and unparalleled client service. We believe in our investment processes, which seek to deliver consistent results, and in convenient services that help add value for our clients.
If you are interested in learning more about creating an investment plan, contact your financial advisor.
You can learn more about Delaware Investments or obtain a prospectus for Delaware Core Bond Fund at delawareinvestments.com.
Manage your investments online
- 24-hour access to your account information
- Obtain share prices
- Check your account balance and recent transactions
- Request statements or literature
- Make purchases and redemptions
Delaware Management Holdings, Inc. and its subsidiaries (collectively known by the marketing name of Delaware Investments) are wholly owned subsidiaries of Macquarie Group Limited, a global provider of banking, financial, advisory, investment and funds management services.
Investments in Delaware Core Bond Fund are not and will not be deposits with or liabilities of Macquarie Bank Limited ABN 46 008 583 542 and its holding companies, including their subsidiaries or related companies (Macquarie Group), and are subject to investment risk, including possible delays in repayment and loss of income and capital invested. No Macquarie Group company guarantees or will guarantee the performance of the Fund, the repayment of capital from the Fund, or any particular rate of return.
| Table of contents | |
| Portfolio management review | 1 |
| Performance summary | 4 |
| Disclosure of Fund expenses | 8 |
| Security type/sector allocation | 10 |
| Statement of net assets | 11 |
| Statement of assets and liabilities | 23 |
| Statement of operations | 24 |
| Statements of changes in net assets | 26 |
| Financial highlights | 28 |
| Notes to financial statements | 36 |
| Report of independent registered | |
| public accounting firm | 48 |
| Other Fund information | 49 |
| Board of trustees/directors and | |
| officers addendum | 50 |
| About the organization | 58 |
Unless otherwise noted, views expressed herein are current as of July 31, 2013, and subject to change.
Funds are not FDIC insured and are not guaranteed. It is possible to lose the principal amount invested.
Mutual fund advisory services provided by Delaware Management Company, a series of Delaware Management Business Trust, which is a registered investment advisor. Delaware Investments, a member of Macquarie Group, refers to Delaware Management Holdings, Inc. and its subsidiaries, including the Fund’s distributor, Delaware Distributors, L.P. Macquarie Group refers to Macquarie Group Limited and its subsidiaries and affiliates worldwide.
© 2013 Delaware Management Holdings, Inc.
All third-party marks cited are the property of their respective owners.
Portfolio management review
Delaware Core Bond Fund | August 6, 2013 |
| Performance preview (for the year ended July 31, 2013) | | | |
| Delaware Core Bond Fund (Class A shares) | 1-year return | | -3.42% |
| Barclays U.S. Aggregate Index (benchmark) | 1-year return | | -1.91% |
Past performance does not guarantee future results. For complete, annualized performance for Delaware Core Bond Fund, please see the table on page 4. The performance of Class A shares excludes the applicable sales charge and reflects the reinvestment of all distributions. Index performance returns do not reflect any management fees, transaction costs, or expenses. Indices are unmanaged and one cannot invest directly in an index. |
Throughout most of the Fund’s fiscal year ended July 31, 2013, central bank policy was the dominant factor impacting fixed income markets worldwide. Shortly after the period began, European Central Bank (ECB) President Mario Draghi, reacting to severe stress in peripheral European bond markets, promised to do “whatever it takes” to keep the euro currency alive. Shortly thereafter, U.S. Federal Reserve Chairman Ben Bernanke launched a third round of bond buying, known as quantitative easing or QE3. Bernanke’s pledge was particularly notable in that, for the first time, the Fed publicly linked its policies to explicit levels of employment and inflation. The Bank of England and the Bank of Japan subsequently enacted their own quantitative easing measures that mirrored those of the Fed, especially in regard to forward guidance.
Initially, the resulting tidal wave of central bank liquidity — combined with a further deceleration of global economic growth — pushed bond yields sharply lower. With the Fed buying $85 billion in Treasury and mortgage securities each month — and with investors confident that the liquidity spigot would remain wide open indefinitely — credit spreads tightened and nominal yields declined to levels last visited in the 1950s. Meanwhile,
A flood of central bank liquidity drove fixed income markets worldwide: - Nominal and real yields declined to historic lows until April
- Anticipation of the looming end to QE3 caused a sharp backup in rates in May and June
- Credit spreads tightened, then widened, amid uncertainty regarding Fed policy
|
1
Portfolio management review
Delaware Core Bond Fund
the Fed also maintained its pledge to keep benchmark interest rates at virtually zero until unemployment falls to 6.5%.
As the year progressed, investors also relearned a difficult lesson: what central banks give, they also can take away. Though monetary policy in the euro zone, the United Kingdom, and Japan remained highly expansionary, Chairman Bernanke hinted in mid-May that U.S. policy makers could begin scaling back, or “tapering,” the central bank’s monthly bond purchases by the end of 2013, if not before. Given that the U.S. economy remained mired in slow-growth mode and that the Fed itself forecasted a further deceleration in growth, a large number of shocked investors reacted by exiting the Treasury market. Most Treasury bond yields rose by at least 1% — a particularly dramatic move off of what had been historically low levels — causing double-digit declines among longer-dated securities. Furthermore, in a notable departure from normal cyclical patterns, corporate debt (with the exception of bank loans) did not absorb much of the backup in Treasury rates, causing credit spreads to widen as well. As such, prices of investment grade and high yield corporate bonds also fell sharply during a roughly six-week period amid fears of an imminent withdrawal of Fed liquidity. Those concerns were partially assuaged in July as Fed officials clarified their overall message about tapering.
Overall, the strongest-performing sectors of the fixed income market during the Fund’s fiscal year were those that offered relatively generous income potential (high yield), indirect exposure to the equity market (convertibles), and minimal duration risk (bank loans). Despite the tepid pace of U.S. and global economic growth, corporate fundamentals generally remained solid, emboldening investors to push corporate yields lower, and credit spreads tighter. The 7.2% average yield on sub-investment-grade bonds, for example, plunged to a low of about 5% in the spring and finished the fiscal period at 6.5%. Notably, the default rate in the high yield sector remained below the historical norm, in part because companies have been able to refinance outstanding debt on favorable terms. The relatively weak and uncertain nature of the economic recovery has also made corporate executives hesitant to begin capital projects or take on additional leverage.
Conversely, interest-rate-sensitive areas such as 10- and 30-year Treasurys and mortgage-backed securities mostly lagged throughout the Fund’s fiscal year. Losses were especially severe at the longer-term end of the Treasury yield curve, with the bulk of the rise in long rates (roughly 1.10%) coming during the turbulent May–June period. On a total return basis, investment grade corporates finished the fiscal year roughly flat while mortgage-backed bonds fell 1.7% and Treasury inflation-protected securities declined 5.5%.
Fund performance
For its fiscal year ended July 31, 2013, Delaware Core Bond Fund (Class A shares) returned -3.42% at net asset value and -7.80% at maximum offer price (both returns reflect all distributions reinvested). In comparison, the Fund’s benchmark, the Barclays U.S. Aggregate Index, returned -1.91% during the same period. For complete annualized performance of Delaware Core Bond Fund, please see table on page 4.
2
For most of the fiscal year, we positioned the Fund to have an overweight in agency mortgage-backed securities and a meaningful exposure to intermediate Treasury securities. Our corporate bond exposure was also slightly above the benchmark level and emphasized BBB-rated bonds. This combination of positions was intended to provide both total return and income opportunities from corporate bonds and excellent liquidity, as well as credit-based safety from agency mortgage-backed securities and Treasurys.
Ultimately, the corporate bond position provided strong relative returns, but our focus on liquidity left the Fund exposed to interest rate risk in its intermediate maturity bonds. Price declines during the sharp rise in interest rates in mid-2013 were primarily responsible for the Fund’s underperformance. From an individual corporate bond perspective, our holdings in issues from Telefonica Emisiones, MetLife, and Abbey National Treasury Services contributed to Fund performance during the year while issues from Barrick Gold Corporation, Cox Communications and Time Warner Cable detracted from performance.
During the period, the Fund also invested in interest rate futures and options on interest rate futures. These instruments were used primarily for hedging interest rate risks and to attempt to capitalize on volatility levels. The aggregate positions generally detracted from absolute and relative performance by approximately 0.14%.
3
Performance summary
Delaware Core Bond Fund | | July 31, 2013 |
The performance data quoted represent past performance; past performance does not guarantee future results. Investment return and principal value will fluctuate so your shares, when redeemed, may be worth more or less than their original cost. Please obtain the performance data current for the most recent month end by calling 800 523-1918 or visiting our website at delawareinvestments.com/performance. Current performance may be lower or higher than the performance data quoted.
| Fund and benchmark performance1,2 | | Average annual total returns through July 31, 2013 |
| | 1 year | | 5 years | | 10 years | | Lifetime |
| Class A (Est. March 12, 1996) | | | | | | | | |
| Excluding sales charge | | -3.42% | | +5.48% | | +4.73% | | n/a |
| Including sales charge | | -7.80% | | +4.51% | | +4.25% | | n/a |
| Class C (Est. Sept. 30, 2009) | | | | | | | | |
| Excluding sales charge | | -4.12% | | n/a | | n/a | | +3.36% |
| Including sales charge | | -5.04% | | n/a | | n/a | | +3.36% |
| Class R (Est. Sept. 30, 2009) | | | | | | | | |
| Excluding sales charge | | -3.68% | | n/a | | n/a | | +3.82% |
| Including sales charge | | -3.68% | | n/a | | n/a | | +3.82% |
| Institutional Class (Est. Sept. 30, 2009) | | | | | | | | |
| Excluding sales charge | | -3.13% | | n/a | | n/a | | +4.54% |
| Including sales charge | | -3.13% | | n/a | | n/a | | +4.54% |
| Barclays U.S. Aggregate Index | | -1.91% | | +5.24% | | +4.89% | | n/a |
1 Returns reflect the reinvestment of all distributions and are presented both with and without the applicable sales charges described below. Returns do not reflect the deduction of taxes the shareholder would pay on Fund distributions or redemptions of Fund shares.
Delaware Core Bond Fund is the successor to The Intermediate Fixed Income Portfolio of the Delaware Pooled® Trust pursuant to the reorganization (Reorganization) of The Intermediate Fixed Income Portfolio into the Fund. Prior to the Reorganization, the Fund had no investment operations. Accordingly, for periods before Sept. 30, 2009, the performance information shown above that includes data from that period and on pages 6 and 7 is historical information for The Intermediate Fixed Income Portfolio. The Intermediate Fixed Income Portfolio had the same investment objective and a similar investment strategy as the Fund, and was managed by the same portfolio managers. Because the Fund’s fees and expenses are higher than those of The Intermediate Fixed Income Portfolio, the Fund’s performance would have been lower than that shown for relevant periods in this report.
Expense limitations were in effect for certain classes during some or all of the periods shown in the “Fund performance” chart. Expenses for each class are listed on the “Fund expense ratios” table on page 6. Performance would have been lower had expense limitations not been in effect.
4
Class A shares are sold with a maximum front-end sales charge of 4.50%, and have an annual distribution and service fee of 0.30% of average daily net assets. This fee has been contractually limited to 0.25% of average daily net assets from Nov. 28, 2012, through Nov. 28, 2013. Performance for Class A shares, excluding sales charges, assumes that no front-end sales charge applied.
Class C shares are sold with a contingent deferred sales charge of 1.00% if redeemed during the first 12 months. They are also subject to an annual distribution and service fee of 1.00% of average daily net assets.
Performance for Class C shares, excluding sales charges, assumes either that contingent deferred sales charges did not apply or that the investment was not redeemed.
Class R shares are available only for certain retirement plan products. They are sold without a sales charge and have an annual distribution and service fee of 0.60% of average daily net assets, which has been limited contractually to 0.50% from Nov. 28, 2012, through Nov. 28, 2013.
Institutional Class shares are available without sales or asset-based distribution charges only to certain eligible institutional accounts.
The “Fund performance” table and the “Performance of a $10,000 investment” graph do not reflect the deduction of taxes the shareholder would pay on Fund distributions or redemptions of Fund shares.
Fixed income securities and bond funds can lose value, and investors can lose principal, as interest rates rise. They also may be affected by economic conditions that hinder an issuer’s ability to make interest and principal payments on its debt.
The Fund may also be subject to prepayment risk, the risk that the principal of a fixed income security that is held by the Fund may be prepaid prior to maturity, potentially forcing the Fund to reinvest that money at a lower interest rate.
The Fund may invest in derivatives, which may involve additional expenses and are subject to risk, including the risk that an underlying security or securities index moves in the opposite direction from what the portfolio manager anticipated. A derivative transaction depends upon the counterparties’ ability to fulfill their contractual obligations.
International investments entail risks not ordinarily associated with U.S. investments including fluctuation in currency values, differences in accounting principles, or economic or political instability in other nations.
The Fund may experience portfolio turnover in excess of 100%, which could result in higher transaction costs and tax liability.
Per Standard & Poor’s credit rating agency, bonds rated AA and A are more susceptible to the adverse effects of changes in circumstances and economic conditions than those in the higher-rated AAA category, but the obligor’s capacity to meet its financial commitment on the obligation is still strong. Bonds rated BBB exhibit adequate protection parameters, although adverse economic conditions or changing circumstances are more likely to lead to a weakened capacity of the obligor to meet its financial commitments. Bonds rated BB, B, and CCC are regarded as having significant speculative characteristics, with BB indicating the least degree of speculation of the three.
5
Performance summary
Delaware Core Bond Fund
2 The Fund’s expense ratios, as described in the most recent prospectus, are disclosed in the following “Fund expense ratios” table. Delaware Management Company has agreed to reimburse certain expenses and/or waive certain fees in order to prevent total annual fund operating expenses (excluding certain fees and expenses) from exceeding 0.65% of the Fund’s average daily net assets from Nov. 28, 2012, through Nov. 28, 2013. Please see the most recent prospectus and any applicable supplement(s) for additional information on these fee waivers and/or reimbursements.
| Fund expense ratios | | Class A | | Class C | | Class R | | Institutional Class |
| Total annual operating expenses | | 1.34% | | 2.04% | | 1.64% | | 1.04% |
| (without fee waivers) | | | | | | | | |
| Net expenses | | 0.90% | | 1.65% | | 1.15% | | 0.65% |
| (including fee waivers, if any) | | | | | | | | |
| Type of waiver | | Contractual | | Contractual | | Contractual | | Contractual |
6
Performance of a $10,000 investment1
Average annual total returns from July 31, 2003, through July 31, 2013

| For period beginning July 31, 2003, through July 31, 2013 | Starting value | Ending value |
| | Barclays U.S. Aggregate Index | $10,000 | $16,121 |
| | Delaware Core Bond Fund — Class A shares | $9,550 | $15,155 |
1 The “Performance of a $10,000 investment” graph assumes $10,000 invested in Class A shares of the Fund on July 31, 2003, and includes the effect of a 4.50% front-end sales charge and the reinvestment of all distributions. The graph does not reflect the deduction of taxes the shareholders would pay on Fund distributions or redemptions of Fund shares. Expense limitations were in effect for some or all of the periods shown. Performance would have been lower had expense limitations not been in effect. Expenses are listed in the “Fund expense ratios” table on page 6. Please note additional details on pages 4 through 7.
The chart also assumes $10,000 invested in the Barclays U.S. Aggregate Index as of July 31, 2003. The Barclays U.S. Aggregate Index is a broad composite that tracks the investment grade domestic bond market.
Index performance returns do not reflect any management fees, transaction costs, or expenses. Indices are unmanaged and one cannot invest directly in an index. Past performance is not a guarantee of future results.
Performance of other Fund classes will vary due to different charges and expenses.
| | Nasdaq symbols | | CUSIPs | |
| Class A | | | DPFIX | | | | 245908710 | | |
| Class C | | | DCBCX | | | | 245908694 | | |
| Class R | | | DEBRX | | | | 245908686 | | |
| Institutional Class | | | DCBIX | | | | 245908678 | | |
7
Disclosure of Fund expenses
For the six-month period from February 1, 2013 to July 31, 2013 (Unaudited)
As a shareholder of the Fund, you incur two types of costs: (1) transaction costs, including sales charges (loads) on purchase payments, reinvested dividends, or other distributions; redemption fees; and exchange fees; and (2) ongoing costs, including management fees; distribution and/or service (12b-1) fees; and other Fund expenses. This example is intended to help you understand your ongoing costs (in dollars) of investing in the Fund and to compare these costs with the ongoing costs of investing in other mutual funds.
The example is based on an investment of $1,000 invested at the beginning of the period and held for the entire six-month period from Feb. 1, 2013 to July 31, 2013.
Actual expenses
The first section of the table shown, “Actual Fund return,” provides information about actual account values and actual expenses. You may use the information in this section of the table, together with the amount you invested, to estimate the expenses that you paid over the period. Simply divide your account value by $1,000 (for example, an $8,600 account value divided by $1,000 = 8.6), then multiply the result by the number in the first section under the heading entitled “Expenses Paid During Period” to estimate the expenses you paid on your account during this period.
Hypothetical example for comparison purposes
The second section of the table shown, “Hypothetical 5% return,” provides information about hypothetical account values and hypothetical expenses based on the Fund’s actual expense ratio and an assumed rate of return of 5% per year before expenses, which is not the Fund’s actual return. The hypothetical account values and expenses may not be used to estimate the actual ending account balance or expenses you paid for the period. You may use this information to compare the ongoing costs of investing in the Fund and other funds. To do so, compare this 5% hypothetical example with the 5% hypothetical examples that appear in the shareholder reports of the other funds.
Please note that the expenses shown in the table are meant to highlight your ongoing costs only and do not reflect any transactional costs, such as sales charges (loads), redemption fees, or exchange fees. Therefore, the second section of the table is useful in comparing ongoing costs only, and will not help you determine the relative total costs of owning different funds. In addition, if these transactional costs were included, your costs would have been higher. The Fund’s expenses shown in the table reflect fee waivers in effect. The expenses shown in the table assume reinvestment of all dividends and distributions.
8
Delaware Core Bond Fund
Expense analysis of an investment of $1,000
| Beginning | | Ending | | | | | | | Expenses |
| Account Value | | Account Value | | Annualized | | Paid During Period |
| 2/1/13 | | 7/31/13 | | Expense Ratio | | 2/1/13 to 7/31/13* |
| Actual Fund return† | | | | | | | | | | | | | | | | | | | |
| Class A | | $ | 1,000.00 | | | | $ | 970.60 | | | | 0.90 | % | | | | $ | 4.40 | |
| Class C | | | 1,000.00 | | | | | 967.10 | | | | 1.65 | % | | | | | 8.05 | |
| Class R | | | 1,000.00 | | | | | 968.40 | | | | 1.15 | % | | | | | 5.61 | |
| Institutional Class | | | 1,000.00 | | | | | 972.10 | | | | 0.65 | % | | | | | 3.18 | |
| Hypothetical 5% return (5% return before expenses) | | | | | | | | | | | |
| Class A | | $ | 1,000.00 | | | | $ | 1,020.33 | | | | 0.90 | % | | | | $ | 4.51 | |
| Class C | | | 1,000.00 | | | | | 1,016.61 | | | | 1.65 | % | | | | | 8.25 | |
| Class R | | | 1,000.00 | | | | | 1,019.09 | | | | 1.15 | % | | | | | 5.76 | |
| Institutional Class | | | 1,000.00 | | | | | 1,021.57 | | | | 0.65 | % | | | | | 3.26 | |
| * | “Expenses Paid During Period” are equal to the Fund’s annualized expense ratio, multiplied by the average account value over the period, multiplied by 181/365 (to reflect the one-half year period). |
| | |
| † | Because actual returns reflect only the most recent six-month period, the returns shown may differ significantly from fiscal year returns. |
9
| Security type/sector allocation | |
| Delaware Core Bond Fund | | As of July 31, 2013 (Unaudited) |
Sector designations may be different than the sector designations presented in other Fund materials. The sector designations may represent the investment manager’s internal sector classifications, which may result in the sector designations for one fund being different than another fund’s sector designations.
| Security type/sector | Percentage of net assets |
| Agency Asset-Backed Securities | 0.10 | % |
| Agency Collateralized Mortgage Obligations | 4.07 | % |
| Agency Mortgage-Backed Securities | 31.85 | % |
| Commercial Mortgage-Backed Securities | 1.86 | % |
| Corporate Bonds | 29.49 | % |
| Banking | 6.04 | % |
| Basic Industry | 2.25 | % |
| Brokerage | 0.63 | % |
| Capital Goods | 0.34 | % |
| Communications | 2.96 | % |
| Consumer Cyclical | 1.34 | % |
| Consumer Non-Cyclical | 1.62 | % |
| Electric | 3.31 | % |
| Energy | 2.23 | % |
| Financials | 0.63 | % |
| Insurance | 2.87 | % |
| Natural Gas | 1.78 | % |
| Real Estate | 1.30 | % |
| Technology | 1.86 | % |
| Transportation | 0.33 | % |
| Non-Agency Asset-Backed Securities | 8.15 | % |
| U.S. Treasury Obligations | 21.97 | % |
| Preferred Stock | 0.22 | % |
| Short-Term Investments | 23.48 | % |
| Total Value of Securities | 121.19 | % |
| Liabilities Net of Receivables and Other Assets | (21.19 | %) |
| Total Net Assets | 100.00 | % |
10
| Statement of net assets | |
| Delaware Core Bond Fund | | | July 31, 2013 |
| | | Principal amount (U.S.$) | | Value (U.S.$) |
| Agency Asset-Backed Securities – 0.10% | | | | | |
| • | Fannie Mae Grantor Trust Series 2003-T4 2A5 | | | | | |
| 5.407% 9/26/33 | $ | 11,004 | | $ | 11,248 |
| • | Fannie Mae Whole Loan | | | | | |
| Series 2001-W2 6.473% 10/25/31 | | 5,057 | | | 5,366 |
| Series 2002-W11 AV1 0.53% 11/25/32 | | 878 | | | 832 |
| Total Agency Asset-Backed Securities | | | | | |
| (cost $16,837) | | | | | 17,446 |
| | | | | | | |
| |
| Agency Collateralized Mortgage Obligations – 4.07% | | | | | |
| Fannie Mae REMICs | | | | | |
| Series 2004-49 EB 5.00% 7/25/24 | | 30,225 | | | 33,117 |
| Series 2006-105 ME 5.50% 11/25/36 | | 235,000 | | | 265,616 |
| Series 2010-35 AB 5.00% 11/25/49 | | 42,762 | | | 46,117 |
| Series 2010-116 Z 4.00% 10/25/40 | | 39,193 | | | 40,353 |
| Series 2011-134 PA 4.00% 9/25/40 | | 28,697 | | | 30,002 |
| Series 2012-19 HB 4.00% 1/25/42 | | 58,189 | | | 58,566 |
| Fannie Mae Whole Loan Series 2003-W15 2A7 | | | | | |
| 5.55% 8/25/43 | | 13,994 | | | 15,304 |
| Freddie Mac REMICs | | | | | |
| Series 2326 ZQ 6.50% 6/15/31 | | 25,261 | | | 28,270 |
| Series 3027 DE 5.00% 9/15/25 | | 33,405 | | | 36,410 |
| Series 3656 PM 5.00% 4/15/40 | | 10,000 | | | 10,953 |
| •Series 3800 AF 0.691% 2/15/41 | | 80,520 | | | 81,299 |
| GNMA Series 2010-113 KE 4.50% 9/20/40 | | 50,000 | | | 54,549 |
| • | Vendee Mortgage Trust Series 2000-1 1A | | | | | |
| 6.519% 1/15/30 | | 17,875 | | | 20,604 |
| Total Agency Collateralized Mortgage | | | | | |
| Obligations (cost $714,570) | | | | | 721,160 |
| |
| Agency Mortgage-Backed Securities – 31.85% | | | | | |
| Fannie Mae 4.50% 5/1/41 | | 14,535 | | | 15,232 |
| • | Fannie Mae ARM | | | | | |
| 2.296% 12/1/33 | | 12,636 | | | 13,194 |
| 2.464% 8/1/34 | | 17,949 | | | 18,966 |
| Fannie Mae Relocation 30 yr 5.00% 1/1/34 | | 906 | | | 966 |
| Fannie Mae S.F. 15 yr | | | | | |
| 2.50% 2/1/28 | | 51,988 | | | 52,018 |
| 2.50% 5/1/28 | | 4,917 | | | 4,919 |
| 3.00% 11/1/27 | | 7,364 | | | 7,584 |
11
Statement of net assets
Delaware Core Bond Fund
| | | Principal amount (U.S.$) | | Value (U.S.$) |
| Agency Mortgage-Backed Securities (continued) | | | | | |
| Fannie Mae S.F. 15 yr (continued) | | | | | |
| 3.50% 7/1/26 | $ | 17,588 | | $ | 18,481 |
| 3.50% 10/1/26 | | 15,864 | | | 16,639 |
| 4.00% 11/1/25 | | 195,316 | | | 209,543 |
| Fannie Mae S.F. 15 yr TBA | | | | | |
| 2.50% 9/1/28 | | 1,392,000 | | | 1,387,868 |
| 3.00% 9/1/28 | | 458,000 | | | 469,862 |
| 3.50% 9/1/26 | | 82,000 | | | 85,738 |
| Fannie Mae S.F. 20 yr | | | | | |
| 5.00% 11/1/23 | | 1,381 | | | 1,499 |
| 5.50% 8/1/28 | | 20,723 | | | 22,609 |
| 5.50% 12/1/29 | | 2,647 | | | 2,894 |
| Fannie Mae S.F. 30 yr | | | | | |
| 3.50% 6/1/43 | | 4,979 | | | 5,026 |
| 4.00% 11/1/40 | | 6,706 | | | 6,971 |
| 4.00% 1/1/41 | | 33,585 | | | 34,911 |
| 4.00% 2/1/41 | | 41,583 | | | 43,370 |
| 4.00% 3/1/41 | | 66,731 | | | 69,680 |
| 4.00% 7/1/41 | | 40,186 | | | 41,800 |
| 4.00% 9/1/41 | | 4,845 | | | 5,036 |
| 4.00% 10/1/41 | | 21,698 | | | 22,555 |
| 4.00% 3/1/42 | | 65,619 | | | 68,234 |
| 4.00% 1/1/43 | | 13,825 | | | 14,371 |
| 4.50% 7/1/36 | | 5,146 | | | 5,451 |
| 4.50% 4/1/40 | | 8,132 | | | 8,626 |
| 4.50% 8/1/40 | | 30,921 | | | 32,760 |
| 4.50% 11/1/40 | | 16,413 | | | 17,411 |
| 4.50% 2/1/41 | | 7,598 | | | 8,062 |
| 4.50% 3/1/41 | | 36,181 | | | 38,394 |
| 4.50% 5/1/41 | | 5,654 | | | 6,008 |
| 4.50% 8/1/41 | | 32,362 | | | 34,339 |
| 4.50% 10/1/41 | | 22,146 | | | 23,500 |
| 4.50% 11/1/41 | | 19,005 | | | 20,167 |
| 5.00% 2/1/35 | | 236,407 | | | 255,072 |
| 5.50% 1/1/36 | | 12,735 | | | 13,862 |
| 7.50% 12/1/32 | | 4,535 | | | 4,986 |
| 9.50% 4/1/18 | | 352 | | | 394 |
| Fannie Mae S.F. 30 yr TBA | | | | | |
| 3.00% 9/1/43 | | 1,088,000 | | | 1,051,451 |
| 3.50% 9/1/43 | | 517,000 | | | 519,748 |
| 4.50% 9/1/43 | | 315,000 | | | 332,965 |
12
| | | Principal amount (U.S.$) | | Value (U.S.$) |
| Agency Mortgage-Backed Securities (continued) | | | | | |
| Freddie Mac 4.50% 1/1/41 | $ | 30,932 | | $ | 31,935 |
| • | Freddie Mac ARM | | | | | |
| 2.358% 4/1/33 | | 3,921 | | | 3,940 |
| 2.502% 7/1/36 | | 4,371 | | | 4,659 |
| 2.854% 4/1/34 | | 2,545 | | | 2,701 |
| 4.992% 8/1/38 | | 106,399 | | | 112,350 |
| Freddie Mac Relocation 15 yr 3.50% 10/1/18 | | 1,113 | | | 1,146 |
| Freddie Mac S.F. 15 yr | | | | | |
| 5.00% 4/1/20 | | 5,434 | | | 5,763 |
| 5.50% 7/1/24 | | 35,192 | | | 37,821 |
| Freddie Mac S.F. 30 yr | | | | | |
| 3.00% 11/1/42 | | 15,630 | | | 15,124 |
| 4.00% 10/1/40 | | 18,836 | | | 19,545 |
| 4.00% 11/1/40 | | 13,095 | | | 13,588 |
| 4.00% 12/1/40 | | 4,535 | | | 4,706 |
| 4.00% 2/1/42 | | 8,924 | | | 9,260 |
| 4.50% 10/1/39 | | 22,548 | | | 23,767 |
| 4.50% 11/1/39 | | 38,658 | | | 40,748 |
| 4.50% 3/1/42 | | 74,307 | | | 78,372 |
| 6.00% 8/1/38 | | 82,549 | | | 90,884 |
| 6.00% 10/1/38 | | 121,025 | | | 131,950 |
| GNMA I S.F. 30 yr 7.50% 2/15/32 | | 1,832 | | | 2,190 |
| Total Agency Mortgage-Backed Securities | | | | | |
| (cost $5,617,851) | | | | | 5,643,611 |
| |
| Commercial Mortgage-Backed Securities – 1.86% | | | | | |
| • | Bear Stearns Commercial Mortgage Securities | | | | | |
| Series 2005-PW10 A4 5.405% 12/11/40 | | 25,000 | | | 26,866 |
| t• | Commercial Mortgage Pass Through Certificates | | | | | |
| Series 2005-C6 A5A 5.116% 6/10/44 | | 10,000 | | | 10,680 |
| • | Credit Suisse Mortgage Capital Certificates Series | | | | | |
| 2006-C1 AAB 5.392% 2/15/39 | | 8,993 | | | 9,206 |
| Goldman Sachs Mortgage Securities II | | | | | |
| •Series 2004-GG2 A6 5.396% 8/10/38 | | 20,000 | | | 20,516 |
| Series 2005-GG4 A4A 4.751% 7/10/39 | | 80,000 | | | 83,903 |
| •Series 2006-GG6 A4 5.553% 4/10/38 | | 25,000 | | | 27,200 |
| JPMorgan Chase Commercial Mortgage Securities | | | | | |
| •Series 2005-LDP5 A4 5.20% 12/15/44 | | 15,000 | | | 16,194 |
| Series 2011-C5 A3 4.171% 8/15/46 | | 20,000 | | | 21,036 |
13
Statement of net assets
Delaware Core Bond Fund
| | | Principal amount (U.S.$) | | Value (U.S.$) |
| Commercial Mortgage-Backed Securities (continued) | | | | | |
| • | Morgan Stanley Capital I Series 2007-T27 A4 | | | | | |
| 5.647% 6/11/42 | $ | 45,000 | | $ | 50,868 |
| NCUA Guaranteed Notes Series 2010-C1 A2 | | | | | |
| 2.90% 10/29/20 | | 20,000 | | | 20,770 |
| WF-RBS Commercial Mortgage Trust | | | | | |
| Series 2012-C9 A3 2.87% 11/15/45 | | 20,000 | | | 18,759 |
| Series 2013-C11 A5 3.071% 3/15/45 | | 15,000 | | | 14,248 |
| Series 2013-C14 A5 3.337% 6/15/46 | | 10,000 | | | 9,647 |
| Total Commercial Mortgage-Backed Securities | | | | | |
| (cost $312,977) | | | | | 329,893 |
| |
| Corporate Bonds – 29.49% | | | | | |
| Banking – 6.04% | | | | | |
| # | Bank Nederlandse Gemeenten 144A | | | | | |
| 1.375% 3/19/18 | | 50,000 | | | 49,223 |
| 2.50% 1/23/23 | | 66,000 | | | 61,554 |
| Bank of America | | | | | |
| 3.875% 3/22/17 | | 45,000 | | | 47,654 |
| 4.10% 7/24/23 | | 15,000 | | | 15,038 |
| BB&T | | | | | |
| 5.20% 12/23/15 | | 30,000 | | | 32,778 |
| 5.25% 11/1/19 | | 101,000 | | | 113,433 |
| City National 5.25% 9/15/20 | | 30,000 | | | 32,409 |
| Goldman Sachs Group 2.90% 7/19/18 | | 45,000 | | | 45,131 |
| • | JPMorgan Chase 6.00% 12/29/49 | | 70,000 | | | 69,038 |
| Morgan Stanley 4.10% 5/22/23 | | 65,000 | | | 61,141 |
| Oesterreichische Kontrollbank 1.125% 5/29/18 | | 25,000 | | | 24,439 |
| • | PNC Financial Services Group | | | | | |
| 4.494% 5/29/49 | | 35,000 | | | 35,044 |
| 4.85% 5/29/49 | | 15,000 | | | 13,688 |
| PNC Funding 5.125% 2/8/20 | | 170,000 | | | 190,274 |
| Regions Financial 2.00% 5/15/18 | | 25,000 | | | 24,094 |
| Santander Holdings USA 4.625% 4/19/16 | | 20,000 | | | 21,266 |
| SunTrust Banks 3.60% 4/15/16 | | 20,000 | | | 21,230 |
| SVB Financial Group 5.375% 9/15/20 | | 50,000 | | | 54,724 |
| U.S. Bancorp 3.15% 3/4/15 | | 55,000 | | | 57,155 |
| • | Wachovia 0.638% 10/15/16 | | 20,000 | | | 19,747 |
| Zions Bancorp 7.75% 9/23/14 | | 75,000 | | | 80,287 |
| | | | | | 1,069,347 |
14
| | | Principal amount (U.S.$) | | Value (U.S.$) |
| Corporate Bonds (continued) | | | | | |
| Basic Industry – 2.25% | | | | | |
| # | Barrick Gold 144A | | | | | |
| 2.50% 5/1/18 | $ | 5,000 | | $ | 4,645 |
| 4.10% 5/1/23 | | 25,000 | | | 21,304 |
| CF Industries 6.875% 5/1/18 | | 75,000 | | | 88,593 |
| # | Freeport-McMoRan Copper & Gold 144A | | | | | |
| 3.875% 3/15/23 | | 20,000 | | | 18,130 |
| Georgia-Pacific 8.00% 1/15/24 | | 50,000 | | | 64,950 |
| # | Glencore Funding 144A 2.50% 1/15/19 | | 35,000 | | | 32,153 |
| International Paper | | | | | |
| 6.00% 11/15/41 | | 30,000 | | | 32,987 |
| 9.375% 5/15/19 | | 5,000 | | | 6,621 |
| Lubrizol 5.50% 10/1/14 | | 15,000 | | | 15,873 |
| LYB International Finance 4.00% 7/15/23 | | 55,000 | | | 54,694 |
| Nucor 4.00% 8/1/23 | | 10,000 | | | 9,864 |
| Plains Exploration & Production 6.50% 11/15/20 | | 15,000 | | | 16,162 |
| Rio Tinto Finance USA 2.25% 12/14/18 | | 20,000 | | | 19,547 |
| Teck Resources 3.75% 2/1/23 | | 15,000 | | | 13,599 |
| | | | | | 399,122 |
| Brokerage – 0.63% | | | | | |
| Jefferies Group | | | | | |
| 5.125% 1/20/23 | | 20,000 | | | 20,279 |
| 5.875% 6/8/14 | | 10,000 | | | 10,465 |
| 6.45% 6/8/27 | | 15,000 | | | 15,571 |
| 6.50% 1/20/43 | | 10,000 | | | 10,026 |
| Lazard Group 6.85% 6/15/17 | | 50,000 | | | 55,966 |
| | | | | | 112,307 |
| Capital Goods – 0.34% | | | | | |
| # | Ingersoll-Rand Global Holding 144A | | | | | |
| 4.25% 6/15/23 | | 40,000 | | | 39,972 |
| # | URS144A 4.35% 4/1/17 | | 20,000 | | | 20,468 |
| | | | | | 60,440 |
| Communications – 2.96% | | | | | |
| American Tower 5.90% 11/1/21 | | 35,000 | | | 38,546 |
| # | American Tower Trust I 144A | | | | | |
| 1.551% 3/15/18 | | 10,000 | | | 9,765 |
| 3.07% 3/15/23 | | 30,000 | | | 28,662 |
| CC Holdings GS V 3.849% 4/15/23 | | 10,000 | | | 9,441 |
| # | COX Communications 144A 3.25% 12/15/22 | | 60,000 | | | 54,931 |
15
Statement of net assets
Delaware Core Bond Fund
| | | Principal amount (U.S.$) | | Value (U.S.$) |
| Corporate Bonds (continued) | | | | | |
| Communications (continued) | | | | | |
| # | Crown Castle Towers 144A 4.883% 8/15/20 | $ | 85,000 | | $ | 90,570 |
| Qwest 6.75% 12/1/21 | | 15,000 | | | 16,813 |
| # | SBA Tower Trust 144A 2.24% 4/16/18 | | 25,000 | | | 24,692 |
| # | SES 144A 3.60% 4/4/23 | | 50,000 | | | 47,556 |
| Telefonica Emisiones 6.421% 6/20/16 | | 85,000 | | | 93,716 |
| Time Warner Cable | | | | | |
| 8.25% 2/14/14 | | 5,000 | | | 5,199 |
| 8.25% 4/1/19 | | 45,000 | | | 52,445 |
| # | Vivendi 144A 6.625% 4/4/18 | | 45,000 | | | 51,487 |
| | | | | | 523,823 |
| Consumer Cyclical – 1.34% | | | | | |
| Historic TW 6.875% 6/15/18 | | 85,000 | | | 103,021 |
| Host Hotels & Resorts | | | | | |
| 3.75% 10/15/23 | | 5,000 | | | 4,650 |
| 5.25% 3/15/22 | | 35,000 | | | 36,519 |
| # | QVC 144A 4.375% 3/15/23 | | 50,000 | | | 47,789 |
| Western Union | | | | | |
| 2.875% 12/10/17 | | 5,000 | | | 5,038 |
| 3.65% 8/22/18 | | 25,000 | | | 25,914 |
| Wyndham Worldwide 4.25% 3/1/22 | | 15,000 | | | 14,821 |
| | | | | | 237,752 |
| Consumer Non-Cyclical – 1.62% | | | | | |
| Boston Scientific 6.00% 1/15/20 | | 15,000 | | | 17,129 |
| # | CareFusion 144A 3.30% 3/1/23 | | 40,000 | | | 37,735 |
| Celgene 3.95% 10/15/20 | | 35,000 | | | 36,041 |
| Energizer Holdings 4.70% 5/24/22 | | 50,000 | | | 50,578 |
| Kroger 3.85% 8/1/23 | | 15,000 | | | 14,928 |
| # | Mylan 144A 3.125% 1/15/23 | | 25,000 | | | 22,834 |
| Newell Rubbermaid 2.05% 12/1/17 | | 15,000 | | | 14,812 |
| Yale University 2.90% 10/15/14 | | 10,000 | | | 10,287 |
| Zimmer Holdings 4.625% 11/30/19 | | 75,000 | | | 82,573 |
| | | | | | 286,917 |
| Electric – 3.31% | | | | | |
| CenterPoint Energy 5.95% 2/1/17 | | 20,000 | | | 22,783 |
| Exelon Generation 4.25% 6/15/22 | | 80,000 | | | 80,535 |
| Great Plains Energy | | | | | |
| 4.85% 6/1/21 | | 15,000 | | | 16,174 |
| •5.292% 6/15/22 | | 30,000 | | | 32,870 |
| • | Integrys Energy Group 6.11% 12/1/66 | | 40,000 | | | 42,032 |
16
| | | Principal amount (U.S.$) | | Value (U.S.$) |
| Corporate Bonds (continued) | | | | | |
| Electric (continued) | | | | | |
| LG&E & KU Energy | | | | | |
| 3.75% 11/15/20 | | $55,000 | | $ | 56,307 |
| 4.375% 10/1/21 | | 30,000 | | | 31,053 |
| # | Narragansett Electric 144A 4.17% 12/10/42 | | 20,000 | | | 18,144 |
| • | National Rural Utilities Cooperative Finance | | | | | |
| 4.75% 4/30/43 | | 30,000 | | | 29,025 |
| NextEra Energy Capital Holdings | | | | | |
| 3.625% 6/15/23 | | 10,000 | | | 9,706 |
| •6.35% 10/1/66 | | 55,000 | | | 57,241 |
| Pennsylvania Electric 5.20% 4/1/20 | | 50,000 | | | 54,638 |
| PPL Electric Utilities 3.00% 9/15/21 | | 20,000 | | | 20,045 |
| Southwestern Electric Power 6.45% 1/15/19 | | 45,000 | | | 52,951 |
| • | Wisconsin Energy 6.25% 5/15/67 | | 60,000 | | | 63,203 |
| | | | | | 586,707 |
| Energy – 2.23% | | | | | |
| Halliburton 3.50% 8/1/23 | | 20,000 | | | 19,986 |
| Noble Holding International 5.25% 3/15/42 | | 10,000 | | | 9,395 |
| Petrobras Global Finance 3.00% 1/15/19 | | 25,000 | | | 23,277 |
| Petrobras International Finance 5.375% 1/27/21 | | 40,000 | | | 40,033 |
| # | Petroleos Mexicanos 144A 3.50% 1/30/23 | | 30,000 | | | 27,525 |
| Pride International 6.875% 8/15/20 | | 80,000 | | | 95,875 |
| Statoil ASA 3.95% 5/15/43 | | 15,000 | | | 13,676 |
| Talisman Energy 5.50% 5/15/42 | | 50,000 | | | 50,503 |
| Weatherford International 9.625% 3/1/19 | | 35,000 | | | 44,954 |
| # | Woodside Finance 144A | | | | | |
| 8.125% 3/1/14 | | 30,000 | | | 31,167 |
| 8.75% 3/1/19 | | 30,000 | | | 38,495 |
| | | | | | 394,886 |
| Financials – 0.63% | | | | | |
| General Electric Capital | | | | | |
| 4.375% 9/16/20 | | 50,000 | | | 53,257 |
| 6.00% 8/7/19 | | 50,000 | | | 58,348 |
| | | | | | 111,605 |
| Insurance – 2.87% | | | | | |
| American International Group 6.40% 12/15/20 | | 95,000 | | | 112,275 |
| • | Chubb 6.375% 3/29/67 | | 35,000 | | | 38,063 |
| # | Highmark 144A | | | | | |
| 4.75% 5/15/21 | | 20,000 | | | 18,977 |
| 6.125% 5/15/41 | | 5,000 | | | 4,489 |
17
Statement of net assets
Delaware Core Bond Fund
| | | Principal amount (U.S.$) | | Value (U.S.$) |
| Corporate Bonds (continued) | | | | | |
| Insurance (continued) | | | | | |
| # | ING US 144A | | | | | |
| 2.90% 2/15/18 | $ | 10,000 | | $ | 9,985 |
| 5.50% 7/15/22 | | 25,000 | | | 27,037 |
| # | Liberty Mutual Group 144A | | | | | |
| 4.25% 6/15/23 | | 20,000 | | | 19,654 |
| 4.95% 5/1/22 | | 35,000 | | | 36,335 |
| 6.50% 5/1/42 | | 20,000 | | | 22,370 |
| MetLife 6.817% 8/15/18 | | 110,000 | | | 134,420 |
| Prudential Financial | | | | | |
| •5.625% 6/15/43 | | 40,000 | | | 38,900 |
| 6.00% 12/1/17 | | 40,000 | | | 46,168 |
| | | | | | 508,673 |
| Natural Gas – 1.78% | | | | | |
| Energy Transfer Partners 9.70% 3/15/19 | | 18,000 | | | 23,419 |
| Kinder Morgan Energy Partners | | | | | |
| 4.15% 2/1/24 | | 10,000 | | | 10,001 |
| 9.00% 2/1/19 | | 50,000 | | | 64,358 |
| NiSource Finance | | | | | |
| 3.85% 2/15/23 | | 10,000 | | | 9,829 |
| 4.80% 2/15/44 | | 50,000 | | | 46,524 |
| Plains All American Pipeline 8.75% 5/1/19 | | 45,000 | | | 58,639 |
| Southern Natural Gas 4.40% 6/15/21 | | 20,000 | | | 20,762 |
| Spectra Energy Capital 3.30% 3/15/23 | | 5,000 | | | 4,529 |
| Sunoco Logistics Partners Operations 3.45% 1/15/23 | | 20,000 | | | 18,813 |
| • | TransCanada PipeLines 6.35% 5/15/67 | | 55,000 | | | 57,783 |
| | | | | | 314,657 |
| Real Estate – 1.30% | | | | | |
| # | Corporate Office Properties 144A 3.60% 5/15/23 | | 20,000 | | | 18,560 |
| Digital Realty Trust | | | | | |
| 5.25% 3/15/21 | | 40,000 | | | 41,996 |
| 5.875% 2/1/20 | | 35,000 | | | 38,179 |
| Duke Realty 3.625% 4/15/23 | | 20,000 | | | 18,713 |
| Realty Income 4.65% 8/1/23 | | 20,000 | | | 20,523 |
| Regency Centers | | | | | |
| 4.80% 4/15/21 | | 15,000 | | | 15,922 |
| 5.875% 6/15/17 | | 14,000 | | | 15,637 |
| # | WEA Finance 144A 4.625% 5/10/21 | | 35,000 | | | 37,073 |
| Weingarten Realty Investors 3.50% 4/15/23 | | 25,000 | | | 23,392 |
| | | | | | 229,995 |
18
| | | | Principal amount (U.S.$) | | Value (U.S.$) |
| Corporate Bonds (continued) | | | | | | |
| Technology – 1.86% | | | | | | |
| Agilent Technologies 3.875% 7/15/23 | | $ | 10,000 | | $ | 9,755 |
| EMC 2.65% 6/1/20 | | | 20,000 | | | 19,866 |
| Fidelity National Information Services 3.50% 4/15/23 | | | 30,000 | | | 27,711 |
| Microsoft 2.125% 11/15/22 | | | 30,000 | | | 27,546 |
| National Semiconductor 6.60% 6/15/17 | | | 50,000 | | | 58,878 |
| NetApp | | | | | | |
| 2.00% 12/15/17 | | | 20,000 | | | 19,641 |
| 3.25% 12/15/22 | | | 15,000 | | | 13,864 |
| Oracle 2.375% 1/15/19 | | | 35,000 | | | 35,283 |
| Symantec 4.20% 9/15/20 | | | 20,000 | | | 20,597 |
| Total System Services | | | | | | |
| 2.375% 6/1/18 | | | 5,000 | | | 4,868 |
| | 3.75% 6/1/23 | | | 30,000 | | | 27,915 |
| Xerox 6.35% 5/15/18 | | | 55,000 | | | 63,495 |
| | | | | | | 329,419 |
| Transportation – 0.33% | | | | | | |
| # | ERAC USA Finance 144A 2.80% 11/1/18 | | | 30,000 | | | 30,050 |
| United Parcel Service 5.125% 4/1/19 | | | 25,000 | | | 28,787 |
| | | | | | | 58,837 |
| Total Corporate Bonds (cost $5,102,557) | | | | | | 5,224,487 |
| |
| Non-Agency Asset-Backed Securities – 8.15% | | | | | | |
| • | American Express Credit Account Master Trust | | | | | | |
| Series 2011-1 A 0.361% 4/17/17 | | | 100,000 | | | 100,023 |
| Series 2013-1 A 0.611% 2/16/21 | | | 100,000 | | | 100,000 |
| Bank of America Auto Trust Series 2012-1 A3 | | | | | | |
| 0.78% 6/15/16 | | | 70,000 | | | 70,064 |
| BMW Vehicle Lease Trust Series 2012-1 A3 | | | | | | |
| 0.75% 2/20/15 | | | 90,000 | | | 90,127 |
| • | Capital One Multi-Asset Execution Trust Series | | | | | | |
| 2004-A1 A1 0.401% 12/15/16 | | | 30,000 | | | 29,992 |
| • | Chase Issuance Trust | | | | | | |
| Series 2007-A5 A5 0.231% 3/15/19 | | | 100,000 | | | 98,855 |
| Series 2012-A9 A9 0.341% 10/16/17 | | | 115,000 | | | 114,850 |
| Series 2013-A3 A3 0.471% 4/15/20 | | | 105,000 | | | 104,449 |
| • | Citibank Credit Card Issuance Trust | | | | | | |
| Series 2008-A6 A6 1.392% 5/22/17 | | | 275,000 | | | 280,105 |
| Series 2013-A1 A1 0.291% 4/24/17 | | | 115,000 | | | 114,853 |
| Series 2013-A2 A2 0.471% 5/26/20 | | | 100,000 | | | 99,448 |
19
Statement of net assets
Delaware Core Bond Fund
| | | | Principal amount (U.S.$) | | Value (U.S.$) |
| Non-Agency Asset-Backed Securities (continued) | | | | | | |
| John Deere Owner Trust Series 2011-A A4 | | | | | | |
| 1.96% 4/16/18 | | $ | 35,000 | | $ | 35,368 |
| Mercedes-Benz Auto Lease Trust Series 2013-A A4 | | | | | | |
| 0.72% 12/17/18 | | | 25,000 | | | 24,895 |
| Mid-State Trust Series 11 A1 4.864% 7/15/38 | | | 23,071 | | | 24,643 |
| #• | Volkswagen Credit Auto Master Trust Series | | | | | | |
| 2011-1A Note 144A 0.872% 9/20/16 | | | 120,000 | | | 120,945 |
| World Omni Automobile Lease Securitization Trust | | | | | | |
| Series 2012-A A3 0.93% 11/16/15 | | | 35,000 | | | 35,008 |
| Total Non-Agency Asset-Backed Securities | | | | | | |
| (cost $1,443,740) | | | | | | 1,443,625 |
| |
| U.S. Treasury Obligations – 21.97% | | | | | | |
| U.S. Treasury Bonds | | | | | | |
| 2.75% 11/15/42 | | | 1,045,000 | | | 876,412 |
| 2.875% 5/15/43 | | | 65,000 | | | 55,951 |
| 3.125% 8/31/13 | | | 370,000 | | | 370,947 |
| U.S. Treasury Notes | | | | | | |
| 1.375% 7/31/18 | | | 1,350,000 | | | 1,349,051 |
| 1.75% 5/15/23 | | | 1,338,000 | | | 1,241,099 |
| Total U.S. Treasury Obligations (cost $4,082,879) | | | | | | 3,893,460 |
| |
| | | Number of shares | | | |
| Preferred Stock – 0.22% | | | | | | |
| | Alabama Power 5.625% | | | 825 | | | 20,344 |
| BB&T 5.85% | | | 775 | | | 19,104 |
| Total Preferred Stock (cost $39,464) | | | | | | 39,448 |
| |
| | | Principal amount (U.S.$) | | | |
| Short-Term Investments – 23.48% | | | | | | |
| ≠Discount Notes – 14.86% | | | | | | |
| Fannie Mae 0.060% 9/16/13 | | $ | 617,886 | | | 617,878 |
| Federal Home Loan Bank | | | | | | |
| 0.045% 10/18/13 | | | 363,496 | | | 363,480 |
| 0.045% 10/23/13 | | | 623,759 | | | 623,730 |
| 0.055% 8/12/13 | | | 117,450 | | | 117,449 |
| 0.060% 8/14/13 | | | 489,134 | | | 489,132 |
| 0.060% 8/16/13 | | | 160,663 | | | 160,662 |
20
| | | | Principal amount (U.S.$) | | Value (U.S.$) | |
| Short-Term Investments (continued) | | | | | | | |
| ≠Discount Notes (continued) | | | | | | | |
| Federal Home Loan Bank (continued) | | | | | | | |
| 0.060% 8/21/13 | | $ | 203,371 | | $ | 203,370 | |
| 0.080% 8/30/13 | | | 57,650 | | | 57,649 | |
| | | | | | | 2,633,350 | |
| Repurchase Agreement – 6.10% | | | | | | | |
| Bank of America 0.03%, dated 7/31/13, to | | | | | | | |
| be repurchased on 8/1/13, repurchase price | | | | | | | |
| $443,175 (collateralized by U.S. government | | | | | | | |
| obligations 0.75%-2.375% 2/28/15–10/31/17; | | | | | | | |
| market value $452,039) | | | 443,175 | | | 443,175 | |
| BNP Paribas 0.05%, dated 7/31/13, to be | | | | | | | |
| repurchased on 8/1/13, repurchase price | | | | | | | |
| $636,826 (collateralized by U.S. government | | | | | | | |
| obligations 0.25%-4.25% 6/30/14–5/15/23; | | | | | | | |
| market value $650,507) | | | 636,825 | | | 636,825 | |
| | | | | | | 1,080,000 | |
| ≠U.S. Treasury Obligations – 2.52% | | | | | | | |
| U.S. Treasury Bills | | | | | | | |
| 0.028% 10/24/13 | | | 260,205 | | | 260,190 | |
| 0.049% 9/26/13 | | | 186,000 | | | 185,992 | |
| | | | | | | 446,182 | |
| Total Short-Term Investments (cost $4,159,407) | | | | | | 4,159,532 | |
| | |
| Total Value of Securities – 121.19% | | | | | | | |
| (cost $21,490,282) | | | | | | 21,472,662 | |
| zLiabilities Net of Receivables and | | | | | | | |
| Other Assets – (21.19%) | | | | | | (3,753,682 | ) |
| Net Assets Applicable to 1,716,815 | | | | | | | |
| Shares Outstanding – 100.00% | | | | | $ | 17,718,980 | |
| | |
| Net Asset Value – Delaware Core Bond Fund | | | | | | | |
| Class A ($3,018,207 / 294,380 Shares) | | | | | | $10.25 | |
| Net Asset Value – Delaware Core Bond Fund | | | | | | | |
| Class C ($702,166 / 68,229 Shares) | | | | | | $10.29 | |
| Net Asset Value – Delaware Core Bond Fund | | | | | | | |
| Class R ($2,332 / 227 Shares) | | | | | | $10.27 | |
| Net Asset Value – Delaware Core Bond | | | | | | | |
| Institutional Class ($13,996,275 / 1,353,979 Shares) | | | | | | $10.34 | |
21
Statement of net assets
Delaware Core Bond Fund
| | | | | |
| Components of Net Assets at July 31, 2013: | | | | |
| Shares of beneficial interest (unlimited authorization – no par) | | $ | 18,157,428 | |
| Distributions in excess of net investment income | | | (8,420 | ) |
| Accumulated net realized loss on investments | | | (412,408 | ) |
| Net unrealized depreciation of investments | | | (17,620 | ) |
| Total net assets | | $ | 17,718,980 | |
| • | Variable rate security. The rate shown is the rate as of July 31, 2013. Interest rates reset periodically. |
| t | Pass Through Agreement. Security represents the contractual right to receive a proportionate amount of underlying payments due to the counterparty pursuant to various agreements related to the rescheduling of obligations and the exchange of certain notes. |
| # | Security exempt from registration under Rule 144A of the Securities Act of 1933, as amended. At July 31, 2013, the aggregate value of Rule 144A securities was $1,124,276 which represented 6.35% of the Fund’s net assets. See Note 10 in “Notes to financial statements.” |
| ≠ | The rate shown is the effective yield at the time of purchase. |
| z | Of this amount, $1,276,528 represents receivable for securities sold and $5,075,518 represents payable for securities purchased as of July 31, 2013. |
| Summary of abbreviations: |
| ARM — Adjustable Rate Mortgage |
| GNMA — Government National Mortgage Association |
| NCUA — National Credit Union Administration |
| REMIC — Real Estate Mortgage Investment Conduit |
| S.F. — Single Family |
| TBA — To be announced |
| yr — Year |
| Net Asset Value and Offering Price Per Share – | | | |
| Delaware Core Bond Fund | | | |
| Net asset value Class A (A) | | $ | 10.25 |
| Sales charge (4.50% of offering price) (B) | | | 0.48 |
| Offering price | | $ | 10.73 |
| (A) | Net asset value per share, as illustrated, is the amount that would be paid upon redemption or repurchase of shares. |
| (B) | See the current prospectus for purchase of $100,000 or more. |
See accompanying notes, which are an integral part of the financial statements.
22
| Statement of assets and liabilities |
| Delaware Core Bond Fund | July 31, 2013 |
| Assets: | | | |
| Investments, at value | | $ | 17,313,130 |
| Short-term investments, at value | | | 4,159,532 |
| Due from manager and affiliates | | | 15,296 |
| Cash | | | 668 |
| Receivables for fund shares sold | | | 40 |
| Receivables for securities sold | | | 1,276,528 |
| Interest receivable | | | 92,541 |
| Total assets | | | 22,857,735 |
| |
| Liabilities: | | | |
| Payables for securities purchased | | | 5,075,518 |
| Distributions payable | | | 8,420 |
| Trustees’ fees payable | | | 51 |
| Other accrued expenses | | | 54,766 |
| Total liabilities | | | 5,138,755 |
| |
| Total Net Assets | | $ | 17,718,980 |
| |
| Investments, at cost | | $ | 17,330,875 |
| Short-term investments, at cost | | | 4,159,407 |
See accompanying notes, which are an integral part of the financial statements.
23
| Statement of operations | |
| Delaware Core Bond Fund | Year Ended July 31, 2013 |
| Investment Income: | | | | | | | |
| Interest | | $ | 447,788 | | | | |
| Dividends | | | 5,255 | | $ | 453,043 | |
| |
| Expenses: | | | | | | | |
| Management fees | | | 129,677 | | | | |
| Distribution expenses – Class A | | | 9,518 | | | | |
| Distribution expenses – Class C | | | 11,600 | | | | |
| Distribution expenses – Class R | | | 15 | | | | |
| Registration fees | | | 57,686 | | | | |
| Audit and tax | | | 42,775 | | | | |
| Dividend disbursing and transfer agent fees and expenses | | | 14,189 | | | | |
| Pricing fees | | | 12,065 | | | | |
| Reports and statements to shareholders | | | 11,890 | | | | |
| Accounting and administration expenses | | | 10,063 | | | | |
| Dues and services | | | 8,783 | | | | |
| Custodian fees | | | 4,770 | | | | |
| Legal fees | | | 2,177 | | | | |
| Trustees’ fees | | | 1,214 | | | | |
| Insurance | | | 520 | | | | |
| Consulting fees | | | 285 | | | | |
| Trustees’ expenses | | | 94 | | | 317,321 | |
| Less fees waived | | | | | | (127,356 | ) |
| Less waived distribution expenses – Class A | | | | | | (1,586 | ) |
| Less waived distribution expenses – Class R | | | | | | (3 | ) |
| Less expense paid indirectly | | | | | | (12 | ) |
| Total operating expenses | | | | | | 188,364 | |
| Net Investment Income | | | | | | 264,679 | |
| |
| Net Realized and Unrealized Gain (Loss): | | | | | | | |
| Net realized gain (loss) on: | | | | | | | |
| Investments | | | | | | 24,186 | |
| Futures contracts | | | | | | (42,553 | ) |
| Net realized loss | | | | | | (18,367 | ) |
| Net change in unrealized appreciation (depreciation) of investments | | | | | | (855,399 | ) |
| Net Realized and Unrealized Loss | | | | | | (873,766 | ) |
| |
| Net Decrease in Net Assets Resulting from Operations | | | | | $ | (609,087 | ) |
See accompanying notes, which are an integral part of the financial statements.
24
Statements of changes in net assets
Delaware Core Bond Fund
| | Year Ended |
| | 7/31/13 | | 7/31/12 |
| Increase (Decrease) in Net Assets from Operations: | | | | | | | | |
| Net investment income | | $ | 264,679 | | | $ | 399,594 | |
| Net realized gain (loss) | | | (18,367 | ) | | | 1,603,187 | |
| Net change in unrealized appreciation (depreciation) | | | (855,399 | ) | | | 180,715 | |
| Net increase (decrease) in net assets | | | | | | | | |
| resulting from operations | | | (609,087 | ) | | | 2,183,496 | |
| |
| Dividends and Distributions to Shareholders from: | | | | | | | | |
| Net investment income: | | | | | | | | |
| Class A | | | (50,107 | ) | | | (90,411 | ) |
| Class C | | | (9,892 | ) | | | (11,729 | ) |
| Class R | | | (32 | ) | | | (38 | ) |
| Institutional Class | | | (397,291 | ) | | | (461,665 | ) |
| |
| Net realized gain: | | | | | | | | |
| Class A | | | (105,982 | ) | | | (169,117 | ) |
| Class C | | | (46,744 | ) | | | (39,070 | ) |
| Class R | | | (79 | ) | | | (79 | ) |
| Institutional Class | | | (732,994 | ) | | | (637,452 | ) |
| | | (1,343,121 | ) | | | (1,409,561 | ) |
| |
| Capital Share Transactions: | | | | | | | | |
| Proceeds from shares sold: | | | | | | | | |
| Class A | | | 1,863,974 | | | | 2,392,535 | |
| Class C | | | 754,234 | | | | 1,824,268 | |
| Institutional Class | | | 7,940,608 | | | | 7,615,735 | |
| |
| Net asset value of shares issued upon reinvestment | | | | | | | | |
| of dividends and distributions: | | | | | | | | |
| Class A | | | 153,555 | | | | 255,371 | |
| Class C | | | 48,107 | | | | 37,480 | |
| Class R | | | 111 | | | | 117 | |
| Institutional Class | | | 1,069,642 | | | | 1,026,812 | |
| | | 11,830,231 | | | | 13,152,318 | |
26
| | Year Ended |
| | 7/31/13 | | 7/31/12 |
| Capital Share Transactions (continued): | | | | | | | | |
| Cost of shares redeemed: | | | | | | | | |
| Class A | | $ | (1,756,938 | ) | | $ | (4,066,084 | ) |
| Class C | | | (1,489,083 | ) | | | (741,514 | ) |
| Institutional Class | | | (18,356,165 | ) | | | (5,722,133 | ) |
| | | | (21,602,186 | ) | | | (10,529,731 | ) |
| Increase (decrease) in net assets derived | | | | | | | | |
| from capital share transactions | | | (9,771,955 | ) | | | 2,622,587 | |
| Net Increase (Decrease) in Net Assets | | | (11,724,163 | ) | | | 3,396,522 | |
| |
| Net Assets: | | | | | | | | |
| Beginning of year | | | 29,443,143 | | | | 26,046,621 | |
| End of year (including undistributed (distributions in | | | | | | | | |
| excess of) net investment income of $(8,420) | | | | | | | | |
| and $6,547, respectively) | | $ | 17,718,980 | | | $ | 29,443,143 | |
See accompanying Notes, which are an integral part of the financial statements.
27
Financial highlights
Delaware Core Bond Fund Class A
Selected data for each share of the Fund outstanding throughout each period were as follows:
| |
| Net asset value, beginning of period |
| |
| Income (loss) from investment operations: |
| Net investment income3 |
| Net realized and unrealized gain (loss) |
| Total from investment operations |
| |
| Less dividends and distributions from: |
| Net investment income |
| Net realized gain |
| Total dividends and distributions |
| |
| Net asset value, end of period |
| |
| Total return4 |
| |
| Ratios and supplemental data: |
| Net assets, end of period (000 omitted) |
| Ratio of expenses to average net assets |
| Ratio of expenses to average net assets prior to fees waived |
| Ratio of net investment income to average net assets |
| Ratio of net investment income to average net assets prior to fees waived |
| Portfolio turnover |
1 During the period ended July 31, 2010, the Fund changed its fiscal year end from Oct. to July. Ratios have been annualized and total return and portfolio turnover have not been annualized. |
2 Effective Sept. 30, 2009, the Fund received all of the assets and liabilities of the Delaware Pooled® Trust – The Intermediate Fixed Income Portfolio (the Portfolio). The Class A shares’ financial highlights for the periods prior to Sept. 30, 2009 reflect the performance of the Institutional Class shares of the Portfolio. Fees paid by the Portfolio were less than Class A share fees, and performance would have been lower if Class A fees were paid. |
See accompanying Notes, which are an integral part of the financial statements.
28
| | | | | | | | | | | | 11/1/09 | | | | | | | | |
| | Year Ended | | | to | | | Year Ended | |
| | 7/31/13 | | 7/31/12 | | 7/31/11 | | | 7/31/101 | | | 10/31/092 | | 10/31/082 | |
| | $11.150 | | | $10.890 | | | $10.750 | | | | $10.370 | | | | $9.200 | | | $9.880 | | |
| | | | |
| | | | |
| | 0.091 | | | 0.140 | | | 0.199 | | | | 0.159 | | | | 0.445 | | | 0.460 | | |
| | (0.454 | ) | | 0.707 | | | 0.274 | | | | 0.434 | | | | 1.195 | | | (0.643 | ) | |
| | (0.363 | ) | | 0.847 | | | 0.473 | | | | 0.593 | | | | 1.640 | | | (0.183 | ) | |
| | | | |
| | | | |
| | (0.171 | ) | | (0.205 | ) | | (0.249 | ) | | | (0.213 | ) | | | (0.470 | ) | | (0.497 | ) | |
| | (0.366 | ) | | (0.382 | ) | | (0.084 | ) | | | — | | | | — | | | — | | |
| | (0.537 | ) | | (0.587 | ) | | (0.333 | ) | | | (0.213 | ) | | | (0.470 | ) | | (0.497 | ) | |
| | | | |
| | $10.250 | | | $11.150 | | | $10.890 | | | | $10.750 | | | | $10.370 | | | $9.200 | | |
| | | | |
| | (3.42% | ) | | 8.03% | | | 4.49% | | | | 5.89% | | | | 18.29% | | | (2.07% | ) | |
| | | | |
| | | | |
| | $3,018 | | | $3,021 | | | $4,348 | | | | $4,022 | | | | $6,346 | | | $6,757 | | |
| | 0.90% | | | 0.90% | | | 0.90% | | | | 0.90% | | | | 0.70% | | | 0.39% | | |
| | 1.44% | | | 1.34% | | | 1.46% | | | | 2.25% | | | | 1.60% | | | 1.12% | | |
| | 0.85% | | | 1.27% | | | 1.86% | | | | 2.04% | | | | 4.35% | | | 4.66% | | |
| | 0.31% | | | 0.83% | | | 1.30% | | | | 0.69% | | | | 3.45% | | | 3.93% | | |
| | 537% | | | 517% | | | 503% | | | | 528% | | | | 346% | | | 391% | | |
3 The average shares outstanding method has been applied for per share information. |
4 Total investment return is based on the change in net asset value of a share during the period and assumes reinvestment of dividends and distributions at net asset value and does not reflect the impact of a sales charge. Total investment return during all of the periods shown reflects waivers by the manager and/or distributor. Performance would have been lower had the waivers not been in effect. |
29
Financial highlights
Delaware Core Bond Fund Class C
Selected data for each share of the Fund outstanding throughout each period were as follows:
| Net asset value, beginning of period |
| |
| Income (loss) from investment operations: |
| Net investment income3 |
| Net realized and unrealized gain (loss) |
| Total from investment operations |
| |
| Less dividends and distributions from: |
| Net investment income |
| Net realized gain |
| Total dividends and distributions |
| |
| Net asset value, end of period |
| |
| Total return4 |
| |
| Ratios and supplemental data: |
| Net assets, end of period (000 omitted) |
| Ratio of expenses to average net assets |
| Ratio of expenses to average net assets prior to fees waived |
| Ratio of net investment income to average net assets |
| Ratio of net investment income (loss) to average net assets |
| prior to fees waived |
| Portfolio turnover |
1 During the period ended July 31, 2010, the Fund changed its fiscal year end from Oct. to July. Ratios have been annualized and total return and portfolio turnover have not been annualized. |
2 Date of commencement of operations; ratios have been annualized and total return has not been annualized. |
3 The average shares outstanding method has been applied for per share information. |
See accompanying Notes, which are an integral part of the financial statements.
30
| | | | | | | | | | | | 11/1/09 | | 9/30/092 | |
| | Year Ended | | | to | | to | |
| | 7/31/13 | | 7/31/12 | | 7/31/11 | | | 7/31/101 | | 10/31/09 | |
| | $11.190 | | | $10.930 | | | $10.790 | | | | $10.370 | | | $10.310 | | |
| | | | |
| | | | |
| | 0.010 | | | 0.058 | | | 0.120 | | | | 0.103 | | | 0.030 | | |
| | (0.453 | ) | | 0.707 | | | 0.273 | | | | 0.469 | | | 0.059 | | |
| | (0.443 | ) | | 0.765 | | | 0.393 | | | | 0.572 | | | 0.089 | | |
| | | | |
| | | | |
| | (0.091 | ) | | (0.123 | ) | | (0.169 | ) | | | (0.152 | ) | | (0.029 | ) | |
| | (0.366 | ) | | (0.382 | ) | | (0.084 | ) | | | — | | | — | | |
| | (0.457 | ) | | (0.505 | ) | | (0.253 | ) | | | (0.152 | ) | | (0.029 | ) | |
| | | | |
| | $10.290 | | | $11.190 | | | $10.930 | | | | $10.790 | | | $10.370 | | |
| | | | |
| | (4.12% | ) | | 7.20% | | | 3.70% | | | | 5.67% | | | 0.86% | | |
| | | | |
| | | | |
| | $702 | | | $1,483 | | | $347 | | | | $145 | | | $2 | | |
| | 1.65% | | | 1.65% | | | 1.65% | | | | 1.65% | | | 1.65% | | |
| | 2.14% | | | 2.04% | | | 2.16% | | | | 2.95% | | | 5.32% | | |
| | 0.10% | | | 0.52% | | | 1.11% | | | | 1.29% | | | 3.33% | | |
| | | | |
| | (0.39% | ) | | 0.13% | | | 0.60% | | | | (0.01% | ) | | (0.34% | ) | |
| | 537% | | | 517% | | | 503% | | | | 528% | | | 346% | 5 | |
4 Total investment return is based on the change in net asset value of a share during the period and assumes reinvestment of dividends and distributions at net asset value and does not reflect the impact of a sales charge. Total investment return during all of the periods shown reflects a waiver by the manager. Performance would have been lower had the waiver not been in effect. |
5 Portfolio turnover is representative of the Fund for the entire year. |
31
Financial highlights
Delaware Core Bond Fund Class R
Selected data for each share of the Fund outstanding throughout each period were as follows:
| Net asset value, beginning of period |
| |
| Income (loss) from investment operations: |
| Net investment income3 |
| Net realized and unrealized gain (loss) |
| Total from investment operations |
| |
| Less dividends and distributions from: |
| Net investment income |
| Net realized gain |
| Total dividends and distributions |
| |
| Net asset value, end of period |
| |
| Total return5 |
| |
| Ratios and supplemental data: |
| Net assets, end of period (000 omitted) |
| Ratio of expenses to average net assets |
| Ratio of expenses to average net assets prior to fees waived |
| Ratio of net investment income to average net assets |
| Ratio of net investment income to average net assets |
| prior to fees waived |
| Portfolio turnover |
1 During the period ended July 31, 2010, the Fund changed its fiscal year end from Oct. to July. Ratios have been annualized and total return and portfolio turnover have not been annualized. |
2 Date of commencement of operations; ratios have been annualized and total return has not been annualized. |
3 The average shares outstanding method has been applied for per share information. |
4 Includes adjustments from the period ending July 31, 2010 in the amount of $13 (or $0.063 per share) which impacted total return by -0.59%. The adjustment is to correct a misallocation of distributions among share classes, which had no impact on distribution amounts reported and paid to shareholders. |
See accompanying Notes, which are an integral part of the financial statements.
32
| | | | | | | | | | | | 11/1/09 | | 9/30/092 | |
| | Year Ended | | | to | | to | |
| | 7/31/13 | | 7/31/12 | | 7/31/11 | | | 7/31/101 | | 10/31/09 | |
| | $11.170 | | | $10.920 | | | $10.830 | | | | $10.370 | | | $10.310 | | |
| | | | |
| | | | |
| | 0.064 | | | 0.113 | | | 0.174 | | | | 0.141 | | | 0.035 | | |
| | (0.457 | ) | | 0.700 | | | 0.226 | 4 | | | 0.510 | | | 0.059 | | |
| | (0.393 | ) | | 0.813 | | | 0.400 | 4 | | | 0.651 | | | 0.094 | | |
| | | | |
| | | | |
| | (0.141 | ) | | (0.181 | ) | | (0.226 | ) | | | (0.191 | ) | | (0.034 | ) | |
| | (0.366 | ) | | (0.382 | ) | | (0.084 | ) | | | — | | | — | | |
| | (0.507 | ) | | (0.563 | ) | | (0.310 | ) | | | (0.191 | ) | | (0.034 | ) | |
| | | | |
| | $10.270 | | | $11.170 | | | $10.920 | 4 | | | $10.830 | | | $10.370 | | |
| | | | |
| | (3.68% | ) | | 7.68% | | | 3.76% | 4 | | | 6.44% | | | 0.90% | | |
| | | | |
| | | | |
| | $2 | | | $2 | | | $2 | | | | $2 | | | $2 | | |
| | 1.15% | | | 1.15% | | | 1.15% | | | | 1.15% | | | 1.15% | | |
| | 1.74% | | | 1.64% | | | 1.76% | | | | 2.55% | | | 4.92% | | |
| | 0.60% | | | 1.02% | | | 1.61% | | | | 1.79% | | | 3.83% | | |
| | | | |
| | 0.01% | | | 0.53% | | | 1.00% | | | | 0.39% | | | 0.06% | | |
| | 537% | | | 517% | | | 503% | | | | 528% | | | 346% | 6 | |
5 Total investment return is based on the change in net asset value of a share during the period and assumes reinvestment of dividends and distributions at net asset value. Total investment return during all of the periods shown reflects waivers by the manager and distributor. Performance would have been lower had the waivers not been in effect. |
6 Portfolio turnover is representative of the Fund for the entire year. |
33
Financial highlights
Delaware Core Bond Fund Institutional Class
Selected data for each share of the Fund outstanding throughout each period were as follows:
| Net asset value, beginning of period |
| |
| Income (loss) from investment operations: |
| Net investment income3 |
| Net realized and unrealized gain (loss) |
| Total from investment operations |
| |
| Less dividends and distributions from: |
| Net investment income |
| Net realized gain |
| Total dividends and distributions |
| |
| Net asset value, end of period |
| |
| Total return4 |
| |
| Ratios and supplemental data: |
| Net assets, end of period (000 omitted) |
| Ratio of expenses to average net assets |
| Ratio of expenses to average net assets prior to fees waived |
| Ratio of net investment income to average net assets |
| Ratio of net investment income to average net assets |
| prior to fees waived |
| Portfolio turnover |
1 During the period ended July 31, 2010, the Fund changed its fiscal year end from Oct. to July. Ratios have been annualized and total return and portfolio turnover have not been annualized. |
2 Date of commencement of operations; ratios have been annualized and total return has not been annualized. |
3 The average shares outstanding method has been applied for per share information. |
See accompanying Notes, which are an integral part of the financial statements.
34
| | | | | | | | | | | | 11/1/09 | | 9/30/092 | |
| | Year Ended | | | to | | to | |
| | 7/31/13 | | 7/31/12 | | 7/31/11 | | | 7/31/101 | | 10/31/09 | |
| | $11.240 | | | $10.980 | | | $10.830 | | | | $10.370 | | | $10.310 | | |
| | | | |
| | | | |
| | 0.119 | | | 0.168 | | | 0.227 | | | | 0.181 | | | 0.039 | | |
| | (0.453 | ) | | 0.708 | | | 0.285 | | | | 0.512 | | | 0.060 | | |
| | (0.334 | ) | | 0.876 | | | 0.512 | | | | 0.693 | | | 0.099 | | |
| | | | |
| | | | |
| | (0.200 | ) | | (0.234 | ) | | (0.278 | ) | | | (0.233 | ) | | (0.039 | ) | |
| | (0.366 | ) | | (0.382 | ) | | (0.084 | ) | | | — | | | — | | |
| | (0.566 | ) | | (0.616 | ) | | (0.362 | ) | | | (0.233 | ) | | (0.039 | ) | |
| | | | |
| | $10.340 | | | $11.240 | | | $10.980 | | | | $10.830 | | | $10.370 | | |
| | | | |
| | (3.13% | ) | | 8.25% | | | 4.83% | | | | 6.76% | | | 0.96% | | |
| | | | |
| | | | |
| | $13,997 | | | $24,937 | | | $21,350 | | | | $15,895 | | | $2 | | |
| | 0.65% | | | 0.65% | | | 0.65% | | | | 0.65% | | | 0.65% | | |
| | 1.14% | | | 1.04% | | | 1.16% | | | | 1.95% | | | 4.32% | | |
| | 1.10% | | | 1.52% | | | 2.11% | | | | 2.29% | | | 4.33% | | |
| | | | |
| | 0.61% | | | 1.13% | | | 1.60% | | | | 0.99% | | | 0.66% | | |
| | 537% | | | 517% | | | 503% | | | | 528% | | | 346% | 5 | |
4 Total investment return is based on the change in net asset value of a share during the period and assumes reinvestment of dividends and distributions at net asset value. Total investment return during all of the periods shown reflects a waiver by the manager. Performance would have been lower had the waiver not been in effect. |
5 Portfolio turnover is representative of the Fund for the entire year. |
35
| Notes to financial statements | |
| Delaware Core Bond Fund | July 31, 2013 |
Delaware Group® Income Funds (Trust) is organized as a Delaware statutory trust and offers five Series: Delaware Core Bond Fund, Delaware Corporate Bond Fund, Delaware Diversified Floating Rate Fund, Delaware Extended Duration Bond Fund and Delaware High-Yield Opportunities Fund. These financial statements and the related notes pertain to Delaware Core Bond Fund (Fund). The Trust is an open-end investment company. The Fund is considered diversified under the Investment Company Act of 1940, as amended, and offers Class A, Class C, Class R and Institutional Class shares. Class A shares are sold with a maximum front-end sales charge of 4.50%. Class A share purchases of $1,000,000 or more will incur a contingent deferred sales charge (CDSC) of 1.00% if redeemed during the first year and 0.50% during the second year, provided that Delaware Distributors, L.P. (DDLP) paid a financial advisor a commission on the purchase of those shares. Class C shares are sold with a CDSC of 1.00%, if redeemed during the first twelve months. Class R and Institutional Class shares are not subject to a sales charge and are offered for sale exclusively to certain eligible investors.
The investment objective of the Fund is to seek maximum long-term total return, consistent with reasonable risk.
1. Significant Accounting Policies
The following accounting policies are in accordance with U.S. generally accepted accounting principles (U.S. GAAP) and are consistently followed by the Fund.
Security Valuation — Equity securities, except those traded on the Nasdaq Stock Market, Inc. (Nasdaq), are valued at the last quoted sales price as of the time of the regular close of the New York Stock Exchange (NYSE) on the valuation date. Securities traded on the Nasdaq are valued in accordance with the Nasdaq Official Closing Price, which may not be the last sales price. If on a particular day an equity security does not trade, then the mean between the bid and ask prices will be used, which approximates fair value. Debt securities are valued based upon valuations provided by an independent pricing service or broker and reviewed by management. To the extent current market prices are not available, the pricing service may take into account developments related to the specific security, as well as transactions in comparable securities. U.S. government and agency securities are valued at the mean between the bid and ask prices, which approximates fair value. For asset-backed securities, collateralized mortgage obligations, commercial mortgage securities, and U.S. government agency mortgage securities, pricing vendors utilize matrix pricing which considers prepayment speed, attributes of the collateral, yield or price of bonds of comparable quality, coupon, maturity and type as well as broker/dealer-supplied prices. Futures contracts and options on futures contracts are valued at the daily quoted settlement prices. Generally, other securities and assets for which market quotations are not readily available are valued at fair value as determined in good faith under the direction of the Fund’s Board of Trustees (Board). In determining whether market quotations are readily available or fair valuation will be used, various factors will be taken into consideration, such as market closures or suspension of trading in a security.
36
Federal Income Taxes — No provision for federal income taxes has been made as the Fund intends to continue to qualify for federal income tax purposes as a regulated investment company under Subchapter M of the Internal Revenue Code of 1986, as amended, and make the requisite distributions to shareholders. The Fund evaluates tax positions taken or expected to be taken in the course of preparing the Fund’s tax returns to determine whether the tax positions are “more-likely-than-not” of being sustained by the applicable tax authority. Tax positions not deemed to meet the “more-likely-than-not” threshold are recorded as a tax benefit or expense in the current year. Management has analyzed the Fund’s tax positions taken for all open federal income tax years (July 31, 2010–July 31, 2013), and has concluded that no provision for federal income tax is required in the Fund’s financial statements.
Class Accounting — Investment income and common expenses are allocated to the various classes of the Fund on the basis of “settled shares” of each class in relation to the net assets of the Fund. Realized and unrealized gain (loss) on investments are allocated to the various classes of the Fund on the basis of daily net assets of each class. Distribution expenses relating to a specific class are charged directly to that class.
Repurchase Agreements — The Fund may purchase certain U.S. government securities subject to the counterparty’s agreement to repurchase them at an agreed upon date and price. The counterparty will be required on a daily basis to maintain the value of the collateral subject to the agreement at not less than the repurchase price (including accrued interest). The agreements are conditioned upon the collateral being deposited under the Federal Reserve book-entry system with the Fund’s custodian or a third party sub-custodian. In the event of default or bankruptcy by the other party to the agreement, retention of the collateral may be subject to legal proceedings. All open repurchase agreements as of the date of this report were entered into on July 31, 2013.
To Be Announced Trades — The Fund may contract to purchase securities for a fixed price at a transaction date beyond the customary settlement period (e.g., “when issued,” “delayed delivery,” “forward commitment,” or “TBA transactions”) consistent with the Fund’s ability to manage its investment portfolio and meet redemption requests. These transactions involve a commitment by the Fund to purchase securities for a predetermined price or yield with payment and delivery taking place more than three days in the future, or after a period longer than the customary settlement period for that type of security. No interest will be earned by the Fund on such purchases until the securities are delivered; however, the market value may change prior to delivery.
37
Notes to financial statements
Delaware Core Bond Fund
1. Significant Accounting Policies (continued)
Use of Estimates — The preparation of financial statements in conformity with U.S. GAAP requires management to make estimates and assumptions that affect the fair value of investments, the reported amounts of assets and liabilities and disclosure of contingent assets and liabilities at the date of the financial statements and the reported amounts of revenues and expenses during the reporting period. Actual results could differ from those estimates and the differences could be material.
Other — Expenses directly attributable to the Fund are charged directly to the Fund. Other expenses common to various funds within the Delaware Investments® Family of Funds are generally allocated among such funds on the basis of average net assets. Management fees and some other expenses are paid monthly. Security transactions are recorded on the date the securities are purchased or sold (trade date) for financial reporting purposes. Costs used in calculating realized gains and losses on the sale of investment securities are those of the specific securities sold. Dividend income is recorded on the ex-dividend date and interest income is recorded on the accrual basis. Discounts and premiums on debt securities are amortized to interest income over the lives of the respective securities using the effective interest method. Realized gains (losses) on paydowns of asset- and mortgage-backed securities are classified as interest income. The Fund declares dividends daily from net investment income and pays the dividends monthly and declares and pays distributions from net realized gain on investments, if any, annually. The Fund may distribute more frequently, if necessary for tax purposes. Dividends and distributions, if any, are recorded on the ex-dividend date.
The Fund may receive earnings credits from its custodian when positive cash balances are maintained, which are used to offset custody fees. There were no earnings credits for the year ended July 31, 2013.
The Fund receives earnings credits from its transfer agent when positive cash balances are maintained, which are used to offset transfer agent fees. If the amount earned is greater than one dollar, the expense paid under this arrangement is included in dividend disbursing and transfer agent fees and expenses and appears on the statement of operations with the corresponding expense offset shown as “expense paid indirectly.” For the year ended July 31, 2013, the Fund earned $12 under this agreement.
2. Investment Management, Administration Agreements and Other Transactions with Affiliates
In accordance with the terms of its investment management agreement, the Fund pays Delaware Management Company (DMC), a series of Delaware Management Business Trust and the investment manager, an annual fee which is calculated daily at the rate of 0.50% on the first $500 million of average daily net assets of the Fund, 0.475% on the next $500 million, 0.45% on the next $1.5 billion, and 0.425% on average daily net assets in excess of $2.5 billion.
38
DMC has contractually agreed to waive that portion, if any, of its management fee and reimburse the Fund to the extent necessary to prevent the annual operating expenses, (excluding any 12b-1 plan expenses, taxes, interest, inverse floater program expenses, short sale and dividend interest expenses, brokerage fees, certain insurance costs, and nonroutine expenses or costs including, but not limited to, those relating to reorganizations, litigation, conducting shareholder meetings, and liquidations (collectively, nonroutine expenses)), from exceeding 0.65% of the Fund’s average daily net assets from Nov. 28, 2012 through Nov. 28, 2013. This waiver and reimbursement may only be terminated by agreement of DMC and the Fund.
Delaware Service Company, Inc. (DSC), an affiliate of DMC, provides fund accounting and financial administration oversight services to the Fund. For these services, the Fund pays DSC fees based on the aggregate daily net assets of the Delaware Investments® Family of Funds at the following annual rate: 0.0050% of the first $30 billion; 0.0045% of the next $10 billion; 0.0040% of the next $10 billion; and 0.0025% of aggregate average daily net assets in excess of $50 billion. The fees payable to DSC under the service agreement described above are allocated among all Funds in the Delaware Investments Family of Funds on a relative net asset value basis. For the year ended July 31, 2013, the Fund was charged $1,259 for these services.
DSC is also the transfer agent and dividend disbursing agent of the Fund. The Fund pays DSC a monthly asset-based fee for these services. Pursuant to a sub-transfer agency agreement between DSC and BNY Mellon Investment Servicing (US) Inc. (BNYMIS), BNYMIS provides certain sub-transfer agency services to the Fund. Sub-transfer agency fees are passed on to and paid directly by the Fund.
Pursuant to a distribution agreement and distribution plan, the Fund pays DDLP, the distributor and an affiliate of DMC, an annual distribution and service fee of 0.30% of the average daily net assets of the Class A shares, 1.00% of the average daily net assets of the Class C shares and 0.60% of the average daily net assets of the Class R shares. Institutional Class shares pay no distribution and service expenses. DDLP has contracted to limit the Class A and Class R shares’ 12b-1 fee from Nov. 28, 2012 through Nov. 28, 2013 to no more than 0.25% and 0.50%, respectively, of the classes’ average daily net assets.
At July 31, 2013, the Fund had receivables due from or liabilities payable to affiliates as follows:
| Investment management fees receivable from DMC | $ | 17,093 |
| Dividend disbursing, transfer agent and fund accounting | | |
| oversight fees and other expenses payable to DSC | | 402 |
| Distribution fees payable to DDLP | | 1,265 |
| Other expenses payable to DMC and affiliates* | | 130 |
*DMC, as part of its administrative services, pays operating expenses on behalf of the Fund and is reimbursed on a periodic basis. Expenses include items such as printing of shareholder reports, legal and tax services, registration fees and trustees’ fees.
39
Notes to financial statements
Delaware Core Bond Fund
2. Investment Management, Administration Agreements and Other Transactions with Affiliates (continued)
As provided in the investment management agreement, the Fund bears the cost of certain legal and tax services, including internal legal and tax services provided to the Fund by DMC and/or its affiliates’ employees. For the year ended July 31, 2013, the Fund was charged $776 for internal legal and tax services provided by DMC and/or its affiliates’ employees.
For the year ended July 31, 2013, DDLP earned $2,069 for commissions on sales of the Fund’s Class A shares. For the year ended July 31, 2013, DDLP received gross CDSC commissions of $1,306 on redemptions of Class C shares and these commissions were entirely used to offset up-front commissions previously paid by DDLP to broker/dealers on sales of those shares.
Trustees’ fees include expenses accrued by the Fund for each Trustee’s retainer and meeting fees. Certain officers of DMC, DSC, and DDLP are officers and/or Trustees of the Trust. These officers and Trustees are paid no compensation by the Fund.
3. Investments
For the year ended July 31, 2013, the Fund made purchases of $77,783,732 and sales of $84,090,800 of investment securities other than U.S. government securities and short-term investments. For the year ended July 31, 2013, the Fund made purchases of $54,198,018 and sales of $58,058,053 of long-term U.S. government securities.
At July 31, 2013, the cost of investments for federal income tax purposes was $21,608,596. At July 31, 2013, the net unrealized depreciation was $135,934, of which $324,283 related to unrealized appreciation of investments and $460,217 related to unrealized depreciation of investments.
U.S. GAAP defines fair value as the price that the Fund would receive to sell an asset or pay to transfer a liability in an orderly transaction between market participants at the measurement date under current market conditions. A three-level hierarchy for fair value measurements has been established based upon the transparency of inputs to the valuation of an asset or liability. Inputs may be observable or unobservable and refer broadly to the assumptions that market participants would use in pricing the asset or liability. Observable inputs reflect the assumptions market participants would use in pricing the asset or liability based on market data obtained from sources independent of the reporting entity. Unobservable inputs reflect the reporting entity’ s own assumptions about the assumptions that market participants would use in pricing the asset or liability developed based on the best information available under the circumstances. The Fund’s investment in its entirety is assigned a level based upon the observability of the inputs which are significant to the overall valuation. The three-level hierarchy of inputs is summarized below.
| Level 1 | – | inputs are quoted prices in active markets for identical investments (e.g., equity securities, open-end investment companies, futures contracts, exchange-traded options contracts) |
40
| Level 2 | – | other observable inputs (including, but not limited to: quoted prices for similar assets or liabilities in markets that are active, quoted prices for identical or similar assets or liabilities in markets that are not active, inputs other than quoted prices that are observable for the assets or liabilities (such as interest rates, yield curves, volatilities, prepayment speeds, loss severities, credit risks and default rates) or other market-corroborated inputs) (e.g., debt securities, government securities, swap contracts, foreign currency exchange contracts, foreign securities utilizing international fair value pricing, broker-quoted securities, fair value securities) |
| | | |
| Level 3 | – | inputs are significant unobservable inputs (including the Fund’s own assumptions used to determine the fair value of investments) (e.g., broker-quoted securities, fair valued securities) |
Level 3 investments are valued using significant unobservable inputs. The Fund may also use an income-based valuation approach in which the anticipated future cash flows of the investment are discounted to calculate fair value. Discounts may also be applied due to the nature or duration of any restrictions on the disposition of the investments. Valuations may also be based upon current market prices of securities that are comparable in coupon, rating, maturity and industry. The derived value of a Level 3 investment may not represent the value which is received upon disposition and this could impact the results of operations.
The following table summarizes the valuation of the Fund’s investments by fair value hierarchy levels as of July 31, 2013:
| Level 1 | | Level 2 | | Total |
| Agency, Asset- & | | | | | | | | |
| Mortgage-Backed Securities | $ | — | | $ | 8,155,735 | | $ | 8,155,735 |
| Corporate Debt | | — | | | 5,224,487 | | | 5,224,487 |
| U.S. Treasury Obligations | | — | | | 3,893,460 | | | 3,893,460 |
| Preferred Stock | | 39,448 | | | — | | | 39,448 |
| Short-Term Investments | | — | | | 4,159,532 | | | 4,159,532 |
| Total | $ | 39,448 | | $ | 21,433,214 | | $ | 21,472,662 |
During the year ended July 31, 2013, there were no transfers between Level 1 investments, Level 2 investments, or Level 3 investments that had a significant impact to the Fund. The Fund’s policy is to recognize transfers between levels at the beginning of the reporting period.
41
Notes to financial statements
Delaware Core Bond Fund
4. Dividend and Distribution Information
Income and long-term capital gain distributions are determined in accordance with federal income tax regulations, which may differ from U.S. GAAP. Additionally, distributions from net short-term gains on sales of investment securities are treated as ordinary income for federal income tax purposes. The tax character of dividends and distributions paid during the years ended July 31, 2013 and 2012 was as follows:
| Year Ended |
| 7/31/13 | | 7/31/12 |
| Ordinary income | $ | 1,151,224 | | $ | 1,354,213 |
| Long-term capital gains | | 191,897 | | | 55,348 |
| Total | $ | 1,343,121 | | $ | 1,409,561 |
5. Components of Net Assets on a Tax Basis
As of July 31, 2013, the components of net assets on a tax basis were as follows:
| Shares of beneficial interest | $ | 18,157,428 | |
| Distributions payable | | (8,420 | ) |
| Qualified late-year losses deferrals | | (294,094 | ) |
| Unrealized appreciation (depreciation) | | (135,934 | ) |
| Net assets | $ | 17,718,980 | |
The differences between book basis and tax basis components of net assets are primarily attributable to tax deferral of losses on wash sales, tax treatment of distribution payable and tax treatment of market discount and premium on debt instruments.
Qualified late year losses represent losses realized on investment transactions from Nov. 1, 2012 through July 31, 2013 that, in accordance with federal income tax regulations, the Fund has elected to defer and treat as having arisen in the following fiscal year.
For financial reporting purposes, capital accounts are adjusted to reflect the tax character of permanent book/tax differences. Reclassifications are primarily due to tax treatment of dividends and distributions, market discount and premium on certain debt instruments and paydowns of asset- and mortgage-backed securities. Results of operations and net assets were not affected by these reclassifications. For the year ended July 31, 2013, the Fund recorded the following reclassifications:
| Distributions in excess of net investment income | $ | 177,676 | |
| Accumulated net realized loss | | (177,676 | ) |
42
6. Capital Shares
Transactions in capital shares were as follows:
| Year Ended |
| 7/31/13 | | 7/31/12 |
| Shares Sold: | | | | | |
| Class A | 172,416 | | | 218,268 | |
| Class C | 68,139 | | | 165,321 | |
| Institutional Class | 717,255 | | | 694,459 | |
| |
| Shares issued upon reinvestment of dividends and distributions: | | | | | |
| Class A | 14,294 | | | 23,665 | |
| Class C | 4,457 | | | 3,469 | |
| Class R | 10 | | | 11 | |
| Institutional Class | 98,630 | | | 94,161 | |
| | 1,075,201 | | | 1,199,354 | |
| Shares redeemed: | | | | | |
| Class A | (163,339 | ) | | (370,021 | ) |
| Class C | (136,919 | ) | | (67,983 | ) |
| Institutional Class | (1,681,006 | ) | | (513,869 | ) |
| | (1,981,264 | ) | | (951,873 | ) |
| Net increase (decrease) | (906,063 | ) | | 247,481 | |
7. Line of Credit
The Fund, along with certain other funds in the Delaware Investments® Family of Funds (Participants), was a participant in a $125,000,000 revolving line of credit to be used for temporary or emergency purposes as an additional source of liquidity to fund redemptions of investor shares. Under the agreement, the Participants were charged an annual commitment fee, which was allocated across the Participants on the basis of each Participant’s allocation of the entire facility. The Participants were permitted to borrow up to a maximum of one third of their net assets under the agreement. Each Participant was individually, and not jointly, liable for its particular advances, if any, under the line of credit. The line of credit under the agreement expired on Nov. 13, 2012.
On Nov. 13, 2012, the Fund, along with the other Participants, entered into an amendment to the agreement for a $125,000,000 revolving line of credit. The line of credit is to be used as described above and operates in substantially the same manner as the original agreement. The line of credit available under the agreement expires on Nov. 12, 2013. The Fund had no amounts outstanding as of July 31, 2013, or at any time during the year then ended.
43
Notes to financial statements
Delaware Core Bond Fund
8. Derivatives
U.S. GAAP requires disclosures that enable investors to understand: 1) how and why an entity uses derivatives; 2) how they are accounted for; and 3) how they affect an entity’s results of operations and financial position.
Futures Contracts — A futures contract is an agreement in which the writer (or seller) of the contract agrees to deliver to the buyer an amount of cash or securities equal to a specific dollar amount times the difference between the value of a specific security or index at the close of the last trading day of the contract and the price at which the agreement is made. The Fund may use futures in the normal course of pursuing its investment objective. The Fund invests in futures contracts to hedge its existing portfolio securities against fluctuations in fair value caused by changes in prevailing market interest rates. Upon entering into a futures contract, the Fund deposits cash or pledges U.S. government securities to a broker, equal to the minimum “initial margin” requirements of the exchange on which the contract is traded. Subsequent payments are received from the broker or paid to the broker each day, based on the daily fluctuation in the market value of the contract. These receipts or payments are known as “variation margin” and are recorded daily by the Fund as unrealized gains or losses until the contracts are closed. When the contracts are closed, the Fund records a realized gain or loss equal to the difference between the value of the contract at the time it was opened and the value at the time it was closed. Risks of entering into futures contracts include potential imperfect correlation between the futures contracts and the underlying securities and the possibility of an illiquid secondary market for these instruments. When investing in futures, there is reduced counterparty credit risk to the Fund because futures are exchange-traded and the exchange’s clearinghouse, as counterparty to all exchange-traded futures, guarantees against default.
Options Contracts — During the year ended July 31, 2013, the Fund entered into options contracts in the normal course of pursuing its investment objective. The Fund may buy or write options contracts for any number of reasons, including without limitation: to manage the Fund’s exposure to changes in securities prices and foreign currencies; as an efficient means of adjusting the Fund’s overall exposure to certain markets; to protect the value of portfolio securities; and as a cash management tool. The Fund may buy or write call or put options on securities, financial indices, and foreign currencies. When the Fund buys an option, a premium is paid and an asset is recorded and adjusted on a daily basis to reflect the current market value of the option purchased. When the Fund writes an option, a premium is received and a liability is recorded and adjusted on a daily basis to reflect the current market value of the option written. Premiums received from writing options that expire unexercised are treated by the Fund on the expiration date as realized gains. The difference between the premium received and the amount paid on effecting a closing purchase transaction, including brokerage commissions, is treated as realized gain or loss. If a call option is exercised, the premium is added to the proceeds from the sale of the underlying security in determining whether the Fund has a realized gain or loss. If a put option is exercised, the premium reduces the cost basis of the securities purchased by the Fund. The Fund, as writer of an option, bears the market risk of an unfavorable change in the price of the security underlying the written option. When writing options,
44
the Fund is subject to minimal counterparty risk because the counterparty is only obligated to pay premiums and does not bear the market risk of an unfavorable market change. There were no transactions in options written during the year ended July 31, 2013.
Derivatives Generally. The table below summarizes the average balance of derivative holdings by the Fund during the year ended July 31, 2013.
| Long | | Short |
| Derivative | | Derivative |
| Volume | | Volume |
| Options contracts (average notional value) | | $ | 911 | | | $ | — |
| Futures contracts (average notional value) | | | — | | | | 121,734 |
9. Securities Lending
The Fund, along with other funds in the Delaware Investments® Family of Funds, may lend its securities pursuant to a security lending agreement (Lending Agreement) with The Bank of New York Mellon (BNY Mellon). At the time a security is loaned, the borrower must post collateral equal to the required percentage of the market value of the loaned security, including any accrued interest. The required percentage is: (i) 102% with respect to U.S. securities and foreign securities that are denominated and payable in U.S. dollars; and (ii) 105% with respect to foreign securities. With respect to each loan, if on any business day the aggregate market value of securities collateral plus cash collateral held is less than the aggregate market value of the securities which are the subject of such loan, the borrower will be notified to provide additional collateral by the end of the following business day which, together with the collateral already held, will be not less than the applicable initial collateral requirements for such security loan. If the aggregate market value of securities collateral and cash collateral held with respect to a security loan exceeds the applicable initial collateral requirement, upon request of the borrower BNY Mellon must return enough collateral to the borrower by the end of the following business day to reduce the value of the remaining collateral to the applicable initial collateral requirement for such security loan. As a result of the foregoing, the value of the collateral held with respect to a loaned security may be temporarily more or less than the value of the security on loan.
Cash collateral received is generally invested in the Delaware Investments Collateral Fund No. 1 (Collective Trust) established by BNY Mellon for the purpose of investment on behalf of funds managed by DMC that participate in BNY Mellon’s securities lending program. The Collective Trust may invest in U.S. government securities and high-quality corporate debt, asset-backed and other money market securities and in repurchase agreements collateralized by such securities, provided that the Collective Trust will generally have a dollar-weighted average portfolio maturity of 60 days or less. The Fund can also accept U.S. government securities and letters of credit (non-cash collateral) in connection with securities loans. In the event of default or bankruptcy by the lending agent, realization and/or retention of the collateral may be subject to legal proceedings. In the event the borrower fails to return loaned securities and the collateral received is insufficient to cover the value of the loaned securities and provided such collateral shortfall is not the result of
45
Notes to financial statements
Delaware Core Bond Fund
9. Securities Lending (continued)
investment losses, the lending agent has agreed to pay the amount of the shortfall to the Fund or, at the discretion of the lending agent, replace the loaned securities. The Fund continues to record dividends or interest, as applicable, on the securities loaned and is subject to changes in value of the securities loaned that may occur during the term of the loan. The Fund has the right under the Lending Agreement to recover the securities from the borrower on demand. With respect to security loans collateralized by non-cash collateral, the Fund receives loan premiums paid by the borrower. With respect to security loans collateralized by cash collateral, the earnings from the collateral investments are shared among the Fund, the security lending agent and the borrower. The Fund records security lending income net of allocations to the security lending agent and the borrower.
The Collective Trust used for the investment of cash collateral received from borrowers of securities seeks to maintain a net asset value per unit of $1.00, but there can be no assurance that it will always be able to do so. The Fund may incur investment losses as a result of investing securities lending collateral in the Collective Trust. This could occur if an investment in the Collective Trust defaulted or if it were necessary to liquidate assets in the Collective Trust to meet returns on outstanding security loans at a time when the Collective Trust’s net asset value per unit was less than $1.00. Under those circumstances, the Fund may not receive an amount from the Collective Trust that is equal in amount to the collateral the Fund would be required to return to the borrower of the securities and the Fund would be required to make up for this shortfall. The Fund had no securities out on loan as of July 31, 2013.
10. Credit and Market Risk
The Fund invests in fixed income securities whose value is derived from an underlying pool of mortgages or consumer loans. The value of these securities is sensitive to changes in economic conditions, including delinquencies and/or defaults, and may be adversely affected by shifts in the market’s perception of the issuers and changes in interest rates. Investors receive principal and interest payments as the underlying mortgages and consumer loans are paid back. Some of these securities are collateralized mortgage obligations (CMOs). CMOs are debt securities issued by U.S. government agencies or by financial institutions and other mortgage lenders, which are collateralized by a pool of mortgages held under an indenture. Prepayment of mortgages may shorten the stated maturity of the obligations and can result in a loss of premium, if any has been paid. Certain of these securities may be stripped (securities which provide only the principal or interest feature of the underlying security). The yield to maturity on an interest-only CMO is extremely sensitive not only to changes in prevailing interest rates, but also to the rate of principal payments (including prepayments) on the related underlying mortgage assets. A rapid rate of principal payments may have a material adverse affect on the Fund’s yield to maturity. If the underlying mortgage assets experience greater than anticipated prepayments of principal, the Fund may fail to fully recoup its initial investment in these securities even if the securities are rated in the highest rating categories.
46
The Fund invests a portion of its assets in high yield fixed income securities, which are securities rated lower than BBB- by Standard & Poor’s and Baa3 by Moody’s Investors Service, or similarly rated by another nationally recognized statistical rating organization. Investments in these higher yielding securities are generally accompanied by a greater degree of credit risk than higher rated securities. Additionally, lower rated securities maybe more susceptible to adverse economic and competitive industry conditions than investment grade securities.
The Fund invests in certain obligations that may have liquidity protection to ensure that the receipt of payments due on the underlying security is timely. Such protection may be provided through guarantees, insurance policies, or letters of credit obtained by the issuer or sponsor through third parties, through various means of structuring the transaction, or through a combination of such approaches. The Fund will not pay additional fees for such credit support, although the existence of credit support may increase the price of a security.
The Fund may invest up to 15% of its net assets in illiquid securities, which may include securities with contractual restrictions on resale, securities exempt from registration under Rule 144A of the Securities Act of 1933, as amended, and other securities which may not be readily marketable. The relative illiquidity of these securities may impair the Fund from disposing of them in a timely manner and at a fair price when it is necessary or desirable to do so. While maintaining oversight, the Fund’s Board has delegated to DMC the day-to-day functions of determining whether individual securities are illiquid for purposes of the Fund’s limitation on investments in illiquid securities. Securities eligible for resale pursuant to Rule 144A, which are determined to be liquid, are not subject to the Fund’s 15% limit on investments in illiquid securities. As of July 31, 2013, no securities have been determined to be illiquid under the Fund’s Liquidity Procedures. Rule 144A securities have been identified on the statement of net assets.
11. Contractual Obligations
The Fund enters into contracts in the normal course of business that contain a variety of indemnifications. The Fund’s maximum exposure under these arrangements is unknown. However, the Fund has not had prior claims or losses pursuant to these contracts. Management has reviewed the Fund’s existing contracts and expects the risk of loss to be remote.
12. Subsequent Events
Management has determined that no material events or transactions occurred subsequent to July 31, 2013 that would require recognition or disclosure in the Fund’s financial statements.
47
Report of independent
registered public accounting firm
To the Board of Trustees of Delaware Group® Income Funds
and the Shareholders of Delaware Core Bond Fund:
In our opinion, the accompanying statement of net assets, statement of assets and liabilities and the related statements of operations and of changes in net assets and the financial highlights present fairly, in all material respects, the financial position of Delaware Core Bond Fund (one of the series constituting Delaware Group Income Funds, hereinafter referred to as the “Fund”) at July 31, 2013, the results of its operations for the year then ended, the changes in its net assets for each of the two years in the period then ended and the financial highlights for each of the three years in the period then ended and for the period November 1, 2009 through July 31, 2010, in conformity with accounting principles generally accepted in the United States of America. These financial statements and financial highlights (hereafter referred to as “financial statements”) are the responsibility of the Fund’s management; our responsibility is to express an opinion on these financial statements based on our audits. We conducted our audits of these financial statements in accordance with the standards of the Public Company Accounting Oversight Board (United States). Those standards require that we plan and perform the audit to obtain reasonable assurance about whether the financial statements are free of material misstatement. An audit includes examining, on a test basis, evidence supporting the amounts and disclosures in the financial statements, assessing the accounting principles used and significant estimates made by management, and evaluating the overall financial statement presentation. We believe that our audits, which included confirmation of securities at July 31, 2013 by correspondence with the custodian and broker, provide a reasonable basis for our opinion. The financial highlights for each of the two years in the period ended October 31, 2009 were audited by other independent accountants whose report dated December 22, 2009 expressed an unqualified opinion on those statements.
PricewaterhouseCoopers LLP
Philadelphia, Pennsylvania
September 20, 2013
48
Other Fund information
(Unaudited)
Delaware Core Bond Fund
Tax Information
The information set forth below is for the Fund’s fiscal year as required by federal laws. Shareholders, however, must report distributions on a calendar year basis for income tax purposes, which may include distributions for portions of two fiscal years of a fund. Accordingly, the information needed by shareholders for income tax purposes will be sent to them in January of each year. Please consult your tax advisor for proper treatment of this information.
All designations are based on financial information available as of the date of this annual report and, accordingly are subject to change. For any and all items requiring designation, it is the intention of the Fund to designate the maximum amount permitted under the Internal Revenue Code and the regulations thereunder.
For the fiscal year ended July 31, 2013, the Fund designates distributions paid during the year as follows:
| (A) Long-term Capital Gain Distributions (Tax Basis) | | 14.29 | % |
| (B) Ordinary Income Distribution (Tax Basis)* | | 85.71 | % |
| Total Distributions (Tax Basis) | | 100 | % |
| (C) Qualifying Dividends1 | | 0.43 | % |
| (A) | and (B) are based on a percentage of the Fund’s total distributions. |
| (C) | is based on a percentage of the Fund’s ordinary income distributions. |
1 Qualifying dividends represent dividends which qualify for the corporate dividends received deduction.
*For the fiscal year ended July 31, 2013, certain dividends paid by the Fund may be subject to a maximum tax rate of 15%, as provided for by the Jobs and Growth Tax Relief Reconciliation Act of 2003 and as extended by the Tax Relief, Unemployment Insurance Reauthorization and Jobs Creation Act of 2010. The Fund intends to designate up to a maximum amount of 0.43% to be taxed at a maximum rate of 15%. Complete information will be computed and reported in conjunction with your 2013 Form 1099-DIV.
49
Board of trustees/directors and officers addendum
Delaware Investments® Family of Funds
A mutual fund is governed by a Board of Trustees/Directors (“Trustees”), which has oversight responsibility for the management of a fund’s business affairs. Trustees establish procedures and oversee and review the performance of the investment manager, the distributor, and others who perform services for the fund. The independent fund trustees, in particular, are advocates
| Name, Address, | Position(s) | Length of |
| and Birth Date | Held with Fund(s) | Time Served |
| Interested Trustees | | |
| |
| Patrick P. Coyne1 | Chairman, President, | Chairman and Trustee |
| 2005 Market Street | Chief Executive Officer, | since August 16, 2006 |
| Philadelphia, PA 19103 | and Trustee | |
| April 1963 | | President and |
| | | Chief Executive Officer |
| | | since August 1, 2006 |
| |
| Independent Trustees | | |
| |
| Thomas L. Bennett | Trustee | Since March 2005 |
| 2005 Market Street | | |
| Philadelphia, PA 19103 | | |
| October 1947 | | |
| Joseph W. Chow | Trustee | Since January 2013 |
| 2005 Market Street | | |
| Philadelphia, PA 19103 | | |
| January 1953 | | |
| |
| John A. Fry | Trustee | Since January 2001 |
| 2005 Market Street | | |
| Philadelphia, PA 19103 | | |
| May 1960 | | |
| |
| |
| |
| Anthony D. Knerr | Trustee | Since April 1990 |
| 2005 Market Street | | |
| Philadelphia, PA 19103 | | |
| December 1938 | | |
1 Patrick P. Coyne is considered to be an “Interested Trustee” because he is an executive officer of the Fund’s(s’) investment advisor.
50
for shareholder interests. Each trustee has served in that capacity since he or she was elected to or appointed to the Board of Trustees, and will continue to serve until his or her retirement or the election of a new trustee in his or her place. The following is a list of the Trustees and Officers with certain background and related information.
| Number of Portfolios in | |
| Principal Occupation(s) | Fund Complex Overseen | Other Directorships |
| During Past 5 Years | by Trustee or Officer | Held by Trustee or Officer |
| |
| |
| Patrick P. Coyne has served in | 70 | Director and Audit |
| various executive capacities | | Committee Member |
| at different times at | | Kaydon Corp. |
| Delaware Investments.2 | | |
| | | Board of Governors Member |
| | | Investment Company |
| | | Institute (ICI) |
| |
| |
| |
| Private Investor | 70 | Director |
| (March 2004–Present) | | Bryn Mawr Bank Corp. (BMTC) |
| | | (2007–2011) |
| |
| Executive Vice President | 70 | Director and Audit Committee |
| (Emerging Economies Strategies, | | Member — Hercules |
| Risk and Corporate Administration) | | Technology Growth |
| State Street Corporation | | Capital, Inc. |
| (July 2004–March 2011) | | |
| President | 70 | Director — Hershey Trust |
| Drexel University | | |
| (August 2010–Present) | | Director and Audit |
| | | Committee Member |
| President | | Community Health Systems |
| Franklin & Marshall College | | |
| (July 2002–July 2010) | | |
| Managing Director | 70 | None |
| AKA Strategy | | |
| (Strategic Consulting) | | |
| (1990–Present) | | |
2 Delaware Investments is the marketing name for Delaware Management Holdings, Inc. and its subsidiaries, including the Fund’s(s’) investment advisor, principal underwriter, and its transfer agent.
51
Board of trustees/directors and officers addendum
Delaware Investments® Family of Funds
| Name, Address, | Position(s) | Length of |
| and Birth Date | Held with Fund(s) | Time Served |
| Independent Trustees (continued) | | |
| | | |
| Lucinda S. Landreth | Trustee | Since March 2005 |
| 2005 Market Street | | |
| Philadelphia, PA 19103 | | |
| June 1947 | | |
| Frances A. Sevilla-Sacasa | Trustee | Since September 2011 |
| 2005 Market Street | | |
| Philadelphia, PA 19103 | | |
| January 1956 | | |
| |
| |
| |
| |
| |
| |
| |
| |
| |
| |
| |
| |
| |
| Thomas K. Whitford | Trustee | Since January 2013 |
| 2005 Market Street | | |
| Philadelphia, PA 19103 | | |
| March 1956 | | |
| | | |
| | | |
| | | |
| | | |
| | | |
| | | |
52
| Number of Portfolios in | |
| Principal Occupation(s) | Fund Complex Overseen | Other Directorships |
| During Past 5 Years | by Trustee or Officer | Held by Trustee or Officer |
| |
| |
| Private Investor | 70 | None |
| (2004–Present) | | |
| |
| |
| Chief Executive Officer — | 70 | Trust Manager and |
| Banco Itaú Europa | | Audit Committee |
| International | | Member — Camden |
| (April 2012–Present) | | Property Trust |
| |
| Executive Advisor to Dean | | |
| (August 2011–March 2012) | | |
| and Interim Dean | | |
| (January 2011–July 2011) — | | |
| University of Miami School of | | |
| Business Administration | | |
| |
| President — U.S. Trust, | | |
| Bank of America Private | | |
| Wealth Management | | |
| (Private Banking) | | |
| (July 2007–December 2008) | | |
| Vice Chairman | 70 | None |
| (2010–April 2013) | | |
| Chief Administrative | | |
| Officer (2008–2010) | | |
| and Executive Vice | | |
| President and Chief | | |
| Administrative Officer | | |
| (2007–2009) — | | |
| PNC Financial | | |
| Services Group | | |
53
Board of trustees/directors and officers addendum
Delaware Investments® Family of Funds
| Name, Address, | Position(s) | Length of |
| and Birth Date | Held with Fund(s) | Time Served |
| Independent Trustees (continued) | | |
| | | |
| Janet L. Yeomans | Trustee | Since April 1999 |
| 2005 Market Street | | |
| Philadelphia, PA 19103 | | |
| July 1948 | | |
| |
| |
| |
| |
| |
| |
| J. Richard Zecher | Trustee | Since March 2005 |
| 2005 Market Street | | |
| Philadelphia, PA 19103 | | |
| July 1940 | | |
| | | |
| | | |
| | | |
| | | |
| | | |
54
| Number of Portfolios in | |
| Principal Occupation(s) | Fund Complex Overseen | Other Directorships |
| During Past 5 Years | by Trustee or Officer | Held by Trustee or Officer |
| |
| |
| Vice President and Treasurer | 70 | Director, Audit |
| (January 2006–July 2012) | | Committee Member and |
| Vice President — Mergers & Acquisitions | | Investment Committee |
| (January 2003–January 2006), and | | Member |
| Vice President and Treasurer | | Okabena Company |
| (July 1995–January 2003) | | |
| 3M Corporation | | Chair — 3M |
| | | Investment Management |
| | | Company |
| | | (2005–2012) |
| Founder | 70 | Director and Compensation |
| Investor Analytics | | Committee Member |
| (Risk Management) | | Investor Analytics |
| (May 1999–Present) | | |
| | | Director — P/E Investments |
| Founder | | |
| P/E Investments | | |
| (Hedge Fund) | | |
| (September 1996–Present) | | |
55
Board of trustees/directors and officers addendum
Delaware Investments® Family of Funds
| Name, Address, | Position(s) | Length of |
| and Birth Date | Held with Fund(s) | Time Served |
| Officers | | |
| | | |
| David F. Connor | Senior Vice President, | Senior Vice President, |
| 2005 Market Street | Deputy General | Deputy General Counsel |
| Philadelphia, PA 19103 | Counsel, and Secretary | since May 2013; |
| December 1963 | | Vice President, Deputy |
| | General Counsel |
| | September 2000– |
| | May 2013; Secretary since |
| | October 2005 |
| Daniel V. Geatens | Vice President | Treasurer |
| 2005 Market Street | and Treasurer | since October 2007 |
| Philadelphia, PA 19103 | | |
| October 1972 | | |
| David P. O’Connor | Executive Vice President, | Executive Vice President |
| 2005 Market Street | General Counsel | since February 2012; |
| Philadelphia, PA 19103 | and Chief Legal Officer | Senior Vice President |
| February 1966 | | October 2005– |
| | February 2012; |
| | General Counsel and |
| | Chief Legal Officer |
| | since October 2005 |
| Richard Salus | Senior Vice President | Chief Financial Officer |
| 2005 Market Street | and Chief Financial Officer | since November 2006 |
| Philadelphia, PA 19103 | | |
| October 1963 | | |
The Statement of Additional Information for the Fund(s) includes additional information about the Trustees and Officers and is available, without charge, upon request by calling 800 523-1918.
56
| Number of Portfolios in | |
| Principal Occupation(s) | Fund Complex Overseen | Other Directorships |
| During Past 5 Years | by Trustee or Officer | Held by Trustee or Officer |
| |
| |
| David F. Connor has served as | 70 | None3 |
| Deputy General Counsel of | | |
| Delaware Investments | | |
| since 2000. | | |
| |
| |
| |
| |
| Daniel V. Geatens has served | 70 | None3 |
| in various capacities at | | |
| different times at | | |
| Delaware Investments. | | |
| David P. O’Connor has served in | 70 | None3 |
| various executive and legal | | |
| capacities at different times | | |
| at Delaware Investments. | | |
| |
| |
| |
| |
| Richard Salus has served in | 70 | None3 |
| various executive capacities | | |
| at different times at | | |
| Delaware Investments. | | |
3 David F. Connor, Daniel V. Geatens, David P. O’Connor, and Richard Salus serve in similar capacities for the six portfolios of the Optimum Fund Trust, which have the same investment advisor, principal underwriter, and transfer agent as the registrant.
57
About the organization
| Board of trustees | | | |
Patrick P. Coyne
Chairman, President, and
Chief Executive Officer
Delaware Investments®
Family of Funds
Philadelphia, PA
Thomas L. Bennett
Private Investor
Rosemont, PA | Joseph W. Chow
Former Executive Vice
President
State Street Corporation
Brookline, MAJohn A. Fry
President
Drexel University
Philadelphia, PA Anthony D. Knerr
Founder and Managing
Director
AKA Strategy
New York, NY | Lucinda S. Landreth
Former Chief Investment
Officer
Assurant, Inc.
Philadelphia, PAFrances A.
Sevilla-Sacasa
Chief Executive Officer
Banco Itaú Europa
International
Miami, FL | Thomas K. Whitford
Former Vice Chairman
PNC Financial Services Group
Pittsburgh, PAJanet L. Yeomans
Former Vice President and
Treasurer
3M Corporation
St. Paul, MN J. Richard Zecher
Founder
Investor Analytics
Scottsdale, AZ |
| | | | |
| Affiliated officers | | | |
David F. Connor
Senior Vice President,
Deputy General Counsel,
and Secretary
Delaware Investments
Family of Funds
Philadelphia, PA | Daniel V. Geatens
Vice President and
Treasurer
Delaware Investments
Family of Funds
Philadelphia, PA | David P. O’Connor
Executive Vice President,
General Counsel,
and Chief Legal Officer
Delaware Investments
Family of Funds
Philadelphia, PA | Richard Salus
Senior Vice President and
Chief Financial Officer
Delaware Investments
Family of Funds
Philadelphia, PA |
This annual report is for the information of Delaware Core Bond Fund shareholders, but it may be used with prospective investors when preceded or accompanied by the Delaware Investments Fund fact sheet for the most recently completed calendar quarter. These documents are available at delawareinvestments.com. |
Delaware Investments is the marketing name of Delaware Management Holdings, Inc. and its subsidiaries. |
The Fund files its complete schedule of portfolio holdings with the Securities and Exchange Commission (SEC) for the first and third quarters of each fiscal year on Form N-Q. The Fund’s Forms N-Q, as well as a description of the policies and procedures that the Fund uses to determine how to vote proxies (if any) relating to portfolio securities are available without charge (i) upon request, by calling 800 523-1918; and (ii) on the SEC’s website at sec.gov. In addition, a description of the policies and procedures that the Fund uses to determine how to vote proxies (if any) relating to portfolio securities and the Fund’s Schedule of Investments are available without charge on the Fund’s website at delawareinvestments.com. The Fund’s Forms N-Q may be reviewed and copied at the SEC’s Public Reference Room in Washington, D.C.; information on the operation of the Public Reference Room may be obtained by calling 800 SEC-0330.
Information (if any) regarding how the Fund voted proxies relating to portfolio securities during the most recently disclosed 12-month period ended June 30 is available without charge (i) through the Fund’s website at delawareinvestments.com; and (ii) on the SEC’s website at sec.gov.
58
Annual report Delaware Diversified Floating Rate Fund July 31, 2013 Fixed income mutual fund |
Carefully consider the Fund’s investment objectives, risk factors, charges, and expenses before investing. This and other information can be found in the Fund’s prospectus and, if available, its summary prospectus, which may be obtained by visiting delawareinvestments.com or calling 800 523-1918. Investors should read the prospectus and, if available, the summary prospectus carefully before investing. |
You can obtain shareholder reports and prospectuses online instead of in the mail.
Visit delawareinvestments.com/edelivery. |
Experience Delaware Investments
Delaware Investments is committed to the pursuit of consistently superior asset management and unparalleled client service. We believe in our investment processes, which seek to deliver consistent results, and in convenient services that help add value for our clients.
If you are interested in learning more about creating an investment plan, contact your financial advisor.
You can learn more about Delaware Investments or obtain a prospectus for Delaware Diversified Floating Rate Fund at delawareinvestments.com.
Manage your investments online
- 24-hour access to your account information
- Obtain share prices
- Check your account balance and recent transactions
- Request statements or literature
- Make purchases and redemptions
Delaware Management Holdings, Inc. and its subsidiaries (collectively known by the marketing name of Delaware Investments) are wholly owned subsidiaries of Macquarie Group Limited, a global provider of banking, financial, advisory, investment and funds management services.
Investments in Delaware Diversified Floating Rate Fund are not and will not be deposits with or liabilities of Macquarie Bank Limited ABN 46 008 583 542 and its holding companies, including their subsidiaries or related companies (Macquarie Group), and are subject to investment risk, including possible delays in repayment and loss of income and capital invested. No Macquarie Group company guarantees or will guarantee the performance of the Fund, the repayment of capital from the Fund, or any particular rate of return.
| Table of contents | |
| Portfolio management review | 1 |
| Performance summary | 4 |
| Disclosure of Fund expenses | 8 |
| Security type/sector allocation | 10 |
| Statement of net assets | 12 |
| Statement of operations | 38 |
| Statements of changes in net assets | 40 |
| Financial highlights | 42 |
| Notes to financial statements | 50 |
| Report of independent registered | |
| public accounting firm | 66 |
| Other Fund information | 67 |
| Board of trustees/directors and | |
| officers addendum | 68 |
| About the organization | 76 |
Unless otherwise noted, views expressed herein are current as of July 31, 2013, and subject to change.
Funds are not FDIC insured and are not guaranteed. It is possible to lose the principal amount invested.
Mutual fund advisory services provided by Delaware Management Company, a series of Delaware Management Business Trust, which is a registered investment advisor. Delaware Investments, a member of Macquarie Group, refers to Delaware Management Holdings, Inc. and its subsidiaries, including the Fund’s distributor, Delaware Distributors, L.P. Macquarie Group refers to Macquarie Group Limited and its subsidiaries and affiliates worldwide.
© 2013 Delaware Management Holdings, Inc.
All third-party marks cited are the property of their respective owners.
| Portfolio management review | |
| Delaware Diversified Floating Rate Fund | August 6, 2013 |
| Performance preview (for the year ended July 31, 2013) | | | |
| Delaware Diversified Floating Rate Fund (Class A shares) | | 1-year return | | +2.61 | % |
| BofA Merrill Lynch U.S. Dollar 3-Month LIBOR | | | | | |
| Constant Maturity Index (benchmark) | | 1-year return | | +0.36 | % |
Past performance does not guarantee future results.
For complete, annualized performance for Delaware Diversified Floating Rate Fund, please see the table on page 4.
The performance of Class A shares excludes the applicable sales charge and reflects the reinvestment of all distributions.
Index performance returns do not reflect any management fees, transaction costs, or expenses. Indices are unmanaged and one cannot invest directly in an index.
Markets largely influenced by central bank actions
Globally, economic growth remained tepid but positive during the Fund’s fiscal year ended July 31, 2013. Widespread central bank easing (amid tightening fiscal policy around the globe) made liquidity widely available, pushing bond yields down most of the period and making equities relatively more attractive.
Within this context of fiscal tightening and easy money, economic fundamentals improved to some degree during the fiscal year, as housing continued to recover, energy remained relatively inexpensive, and household balance sheets strengthened. Furthermore, the U.S. Federal Reserve announced plans to buy $45 billion in Treasury securities each month and $40 billion a month in mortgage-backed securities.
Volatility sets in
Late in the fiscal year, bond yields rose and there was heightened volatility across many parts of the global financial markets. The trigger was the Fed’s June 19 statement that reflected a slightly more optimistic view of the economy and little concern for the “transitory factors” keeping inflation below its target. During his press conference, Fed Chairman Ben Bernanke seemed to take a more aggressive tone related to the timing of future tapering of asset purchases, saying that tapering could be announced late in 2013 (perhaps in September) and perhaps completed by mid-2014.
Within the Fund
For the fiscal year ended July 31, 2013, Delaware Diversified Floating Rate Fund (Class A shares) returned +2.61% at net asset value and -0.19% at maximum offer price (both returns reflect all distributions reinvested). During the same period, the BofA Merrill Lynch U.S. Dollar 3-Month LIBOR Constant Maturity Index returned +0.36%. For complete, annualized performance of Delaware Diversified Floating Rate Fund, please see the table on page 4.
We maintained a defensive strategy during the fiscal year, as approximately 70% of the Fund’s securities had credit ratings that were above investment grade. Notes about the Fund’s performance:
- Bank loans were the strongest-performing asset class and a contributor to the Fund’s relative performance during the fiscal year. Investors’ preference for riskier assets appeared to drive the demand for bank loans as relaxed monetary policy emanating from the Fed and the ECB seemed to encourage
1
Portfolio management review
Delaware Diversified Floating Rate Fund
greater risk-taking. Also, as interest rates rose in the latter part of the period and assets were moved out of traditional fixed income, inflows into the bank loan market occurred as investors sought the potential benefits of floating rate assets.
- A small allocation to convertible bonds performed well, as the equity markets generated strong returns during the fiscal year. Generally, the Fund’s holdings were targeted more toward bond-like structures in the convertible space in that they traded more like a fixed rate bond than an equity security. The Fund’s holdings certainly participated in some of the upward price movement of the equity market, though they did not take advantage of equities’ full rise.
- We also continued to find investment grade corporate bonds to be an attractive asset class due to the fundamentals among corporate issuers that we believe are still generally favorable, including the strong balance sheets maintained by many issuers over the last several years. Within the Fund’s investment grade holdings, financials contributed favorably to performance. However, performance within the industrials segment was mixed, as concerns about declining commodity prices weighed on sectors such as metals-and-mining and energy. New Exploration and Barrick Gold Corporation are two examples of holdings that underperformed.
- Higher-quality structured products such as mortgage-backed securities and asset-backed securities had positive results. In general, conservative holdings, primarily AAA-rated, were viewed as a source of liquidity.
- The Fund’s allocation to emerging market securities detracted from relative performance for the fiscal year. We increased the Fund’s exposure to emerging markets early in the period when they provided, in our view, a favorable risk-reward profile. More recently, however, those holdings hindered performance as concerns about a change in monetary policies and slowing growth in emerging market countries resulted in a significant selloff of many emerging market sovereign bonds. We initiated credit hedges late in the period to seek to buffer both the price volatility and reduction in liquidity that occurred among the Fund’s emerging market holdings.
Within a relatively timid economic environment, signs of volatility remain
As we prepare for the latter part of 2013 and early 2014, we do not anticipate making significant changes to the Fund’s portfolio. The Fund is positioned with the expectation of relatively benign economic growth in the developed world. However, we are prepared for several macroeconomic concerns in the second half of 2013 that could increase volatility. These include potential changes to monetary policy (concerning the Fed’s quantitative easing program), along with the upcoming September 2013 debt ceiling negotiations in Congress. We will also continue to monitor the trajectory of economic expansion in China, because its performance is important to the overall
2
psychology of the markets and also in maintaining the health of China’s trading partners, particularly among other emerging market countries.
Also of interest are the upcoming elections in Europe in the fall of 2013, especially the election in Germany, which we believe may serve as a referendum on European regional economic policies. We generally intend to stay nimble, prepared to take action within the Fund should any of these events affect global markets in a way that we believe potentially warrants portfolio adjustments.
A closing word: managing risk through derivatives
For the fiscal year, a notable component of the Fund’s total return was derived from its investments in derivatives. In addition to typical floating-rate securities, the Fund uses derivative instruments as risk management tools, effectively converting the interest payments from a group of fixed-rate securities into floating-rate payments. The derivatives used with this strategy are primarily interest rate swaps, which allow the Fund to seek to take advantage of potential investment opportunities that, in our view, may exist in fixed-rate securities. The Fund’s use of interest rate swaps is generally used to provide the Fund with a measure of diversification into sectors outside the traditional floating-rate markets, and it makes up the majority of the Fund’s derivative exposure. For the fiscal year ended July 31, 2013, interest rate swaps contributed nearly 75 basis points to the Fund’s absolute rate of return (one basis point equals 1/100 of one percentage point).
3
| Performance summary | |
| Delaware Diversified Floating Rate Fund | July 31, 2013 |
The performance data quoted represent past performance; past performance does not guarantee future results. Investment return and principal value will fluctuate so your shares, when redeemed, may be worth more or less than their original cost. Please obtain the performance data current for the most recent month end by calling 800 523-1918 or visiting our website at delawareinvestments.com/performance. Current performance may be lower or higher than the performance data quoted.
| Fund and benchmark performance1,2 | Average annual total returns through July 31, 2013 |
| | 1 year | | 3 years | | Lifetime | |
| Class A (Est. Feb. 26, 2010) | | | | | | | | | | |
| Excluding sales charge | | +2.61 | % | | +2.72 | % | | +2.64 | % | |
| Including sales charge | | -0.19 | % | | +1.77 | % | | +1.81 | % | |
| Class C (Est. Feb. 26, 2010) | | | | | | | | | | |
| Excluding sales charge | | +1.85 | % | | +1.97 | % | | +1.88 | % | |
| Including sales charge | | +0.85 | % | | +1.97 | % | | +1.88 | % | |
| Class R (Est. Feb. 26, 2010) | | | | | | | | | | |
| Excluding sales charge | | +2.36 | % | | +2.46 | % | | +2.37 | % | |
| Including sales charge | | +2.36 | % | | +2.46 | % | | +2.37 | % | |
| Institutional Class (Est. Feb. 26, 2010) | | | | | | | | | | |
| Excluding sales charge | | +2.87 | % | | +2.99 | % | | +2.90 | % | |
| Including sales charge | | +2.87 | % | | +2.99 | % | | +2.90 | % | |
| BofA Merrill Lynch U.S. Dollar 3-Month LIBOR | | | | | | | | |
| Constant Maturity Index (benchmark) | | +0.36 | % | | +0.37 | % | | +0.37 | % | |
1 Returns reflect the reinvestment of all distributions and are presented both with and without the applicable sales charges described below. Returns do not reflect the deduction of taxes the shareholder would pay on Fund distributions or redemptions of Fund shares.
Expense limitations were in effect for certain classes during some or all of the periods shown in the “Fund performance” chart. Expenses for each class are listed on the “Fund expense ratios” table on page 5. Performance would have been lower had expense limitations not been in effect.
Class A shares are sold with a maximum front-end sales charge of 2.75%, and have an annual distribution and service fee of 0.30% of average daily net assets. This fee has been contractually limited to 0.25% of average daily net assets from Nov. 28, 2012, through Nov. 28, 2013. Performance for Class A shares, excluding sales charges, assumes that no front-end sales charge applied.
Class C shares are sold with a contingent deferred sales charge of 1.00% if redeemed during the first 12 months. They are also subject to an annual distribution and service fee of 1.00% of average daily net assets.
Performance for Class C shares, excluding sales charges, assumes either that contingent deferred sales charges did not apply or that the investment was not redeemed.
Class R shares are available only for certain retirement plan products. They are sold without a sales charge and have an annual
4
distribution and service fee of 0.60% of average daily net assets, which has been limited contractually to 0.50% from Nov. 28, 2012, through Nov. 28, 2013.
Institutional Class shares are available without sales or asset-based distribution charges only to certain eligible institutional accounts.
The “Fund performance” table and the “Performance of a $10,000 investment” graph do not reflect the deduction of taxes the shareholder would pay on Fund distributions or redemptions of Fund shares.
Fixed income securities and bond funds can lose value, and investors can lose principal, as interest rates rise. They also may be affected by economic conditions that hinder an issuer’s ability to make interest and principal payments on its debt.
The Fund may also be subject to prepayment risk, the risk that the principal of a fixed income security that is held by the Fund may be prepaid prior to maturity, potentially forcing the Fund to reinvest that money at a lower interest rate.
High yielding, noninvestment grade bonds (junk bonds) involve higher risk than investment grade bonds. The high yield secondary market is particularly susceptible to liquidity problems when institutional investors, such as mutual funds and certain other financial institutions, temporarily stop buying bonds for regulatory, financial, or other reasons. In addition, a less liquid secondary market makes it more difficult for the Fund to obtain precise valuations of the high yield securities in its portfolio.
International investments entail risks not ordinarily associated with U.S. investments including fluctuation in currency values, differences in accounting principles, or economic or political instability in other nations.
Investing in emerging markets can be riskier than investing in established foreign markets due to increased volatility and lower trading volume.
The Fund may invest in derivatives, which may involve additional expenses and are subject to risk, including the risk that an underlying security or securities index moves in the opposite direction from what the portfolio manager anticipated. A derivative transaction depends upon the counterparties’ ability to fulfill their contractual obligations.
Because the Fund may invest in bank loans and other direct indebtedness, it is subject to the risk that the Fund will not receive payment of principal, interest, and other amounts due in connection with these investments, which primarily depend on the financial condition of the borrower and the lending institution.
2 The Fund’s expense ratios, as described in the most recent prospectus, are disclosed in the following “Fund expense ratios” table. Delaware Management Company has agreed to reimburse certain expenses and/or waive certain fees in order to prevent total annual fund operating expenses (excluding certain fees and expenses) from exceeding 0.80% of the Fund’s average daily net assets from Nov. 28, 2012, through Nov. 28, 2013. Please see the most recent prospectus and any applicable supplement(s) for additional information on these fee waivers and/or reimbursements.
| Fund expense ratios | | Class A | | Class C | | Class R | | Institutional Class |
| Total annual operating expenses | | 1.12 | % | | 1.82 | % | | 1.42 | % | | 0.82 | % |
| (without fee waivers) | | | | | | | | | | | | |
| Net expenses | | 1.05 | % | | 1.80 | % | | 1.30 | % | | 0.80 | % |
| (including fee waivers, if any) | | | | | | | | | | | | |
| Type of waiver | | Contractual | | Contractual | | Contractual | | Contractual |
5
Performance summary
Delaware Diversified Floating Rate Fund
Performance of a $10,000 investment1
Average annual total returns from Feb. 26, 2010 (Fund’s inception), through July 31, 2013
| For period beginning Feb. 26, 2010, through July 31, 2013 | Starting value | Ending value |
| | Delaware Diversified Floating Rate Fund —
Class A shares | $9,725 | $10,629 |
| | BofA Merrill Lynch U.S. Dollar 3-Month LIBOR
Constant Maturity Index | $10,000 | $10,126 |
1 The “Performance of a $10,000 investment” graph assumes $10,000 invested in Class A shares of the Fund on Feb. 26, 2010, and includes the effect of a 2.75% front-end sales charge and the reinvestment of all distributions. The graph does not reflect the deduction of taxes the shareholders would pay on Fund distributions or redemptions of Fund shares. Expense limitations were in effect for some or all of the periods shown. Performance would have been lower had expense limitations not been in effect. Expenses are listed in the “Fund expense ratios” table on page 5. Please note additional details on pages 4 through 7.
The chart also assumes $10,000 invested in the BofA Merrill Lynch U.S. Dollar 3-Month LIBOR Constant Maturity Index as of Feb. 26, 2010. The BofA Merrill Lynch U.S. Dollar 3-Month LIBOR Constant Maturity Index represents the London interbank offered rate (LIBOR) with a constant 3-month average maturity. LIBOR, published by the British Bankers’ Association, is a composite of the rates of interest at which banks borrow from one another in the London market, and it is a widely used benchmark for short-term interest rates.
Index performance returns do not reflect any management fees, transaction costs, or expenses. Indices are unmanaged and one cannot invest directly in an index. Past performance is not a guarantee of future results.
6
Performance of other Fund classes will vary due to different charges and expenses.
| | Nasdaq symbols | | CUSIPs | |
| Class A | | | DDFAX | | | 245908660 | |
| Class C | | | DDFCX | | | 245908652 | |
| Class R | | | DDFFX | | | 245908645 | |
| Institutional Class | | | DDFLX | | | 245908637 | |
7
Disclosure of Fund expenses
For the six-month period from February 1, 2013 to July 31, 2013 (Unaudited)
As a shareholder of the Fund, you incur two types of costs: (1) transaction costs, including sales charges (loads) on purchase payments, reinvested dividends, or other distributions; redemption fees; and exchange fees; and (2) ongoing costs, including management fees; distribution and/or service (12b-1) fees; and other Fund expenses. This example is intended to help you understand your ongoing costs (in dollars) of investing in the Fund and to compare these costs with the ongoing costs of investing in other mutual funds.
The example is based on an investment of $1,000 invested at the beginning of the period and held for the entire six-month period from Feb. 1, 2013 to July 31, 2013.
Actual expenses
The first section of the table shown, “Actual Fund return,” provides information about actual account values and actual expenses. You may use the information in this section of the table, together with the amount you invested, to estimate the expenses that you paid over the period. Simply divide your account value by $1,000 (for example, an $8,600 account value divided by $1,000 = 8.6), then multiply the result by the number in the first section under the heading entitled “Expenses Paid During Period” to estimate the expenses you paid on your account during this period.
Hypothetical example for comparison purposes
The second section of the table shown, “Hypothetical 5% return,” provides information about hypothetical account values and hypothetical expenses based on the Fund’s actual expense ratio and an assumed rate of return of 5% per year before expenses, which is not the Fund’s actual return. The hypothetical account values and expenses may not be used to estimate the actual ending account balance or expenses you paid for the period. You may use this information to compare the ongoing costs of investing in the Fund and other funds. To do so, compare this 5% hypothetical example with the 5% hypothetical examples that appear in the shareholder reports of the other funds.
Please note that the expenses shown in the table are meant to highlight your ongoing costs only and do not reflect any transactional costs, such as sales charges (loads), redemption fees, or exchange fees. Therefore, the second section of the table is useful in comparing ongoing costs only, and will not help you determine the relative total costs of owning different funds. In addition, if these transactional costs were included, your costs would have been higher. The Fund’s expenses shown in the table reflect fee waivers in effect. The expenses shown in the table assume reinvestment of all dividends and distributions.
8
Delaware Diversified Floating Rate Fund
Expense analysis of an investment of $1,000
| | Beginning | | Ending | | | | Expenses |
| | Account Value | | Account Value | | Annualized | | Paid During Period |
| | 2/1/13 | | 7/31/13 | | Expense Ratio | | 2/1/13 to 7/31/13* |
| Actual Fund return† | | | | | | | | |
| Class A | | $1,000.00 | | $1,002.40 | | 1.01% | | $5.01 |
| Class C | | 1,000.00 | | 999.80 | | 1.76% | | 8.73 |
| Class R | | 1,000.00 | | 1,002.40 | | 1.26% | | 6.26 |
| Institutional Class | | 1,000.00 | | 1,004.80 | | 0.76% | | 3.78 |
| Hypothetical 5% return (5% return before expenses) |
| Class A | | $1,000.00 | | $1,019.79 | | 1.01% | | $5.06 |
| Class C | | 1,000.00 | | 1,016.07 | | 1.76% | | 8.80 |
| Class R | | 1,000.00 | | 1,018.55 | | 1.26% | | 6.31 |
| Institutional Class | | 1,000.00 | | 1,021.03 | | 0.76% | | 3.81 |
| * | “Expenses Paid During Period” are equal to the Fund’s annualized expense ratio, multiplied by the average account value over the period, multiplied by 181/365 (to reflect the one-half year period). |
| † | Because actual returns reflect only the most recent six-month period, the returns shown may differ significantly from fiscal year returns. |
9
| Security type/sector allocation | |
| Delaware Diversified Floating Rate Fund | As of July 31, 2013 (Unaudited) |
Sector designations may be different than the sector designations presented in other Fund materials. The sector designations may represent the investment manager’s internal sector classifications, which may result in the sector designations for one fund being different than another fund’s sector designations.
| Security type/sector | Percentage of net assets |
| Agency Collateralized Mortgage Obligations | 0.28 | % |
| Agency Mortgage-Backed Securities | 0.01 | % |
| Commercial Mortgage-Backed Securities | 0.06 | % |
| Convertible Bonds | 1.01 | % |
| Corporate Bonds | 55.68 | % |
| Aerospace & Defense | 0.18 | % |
| Auto Manufacturers | 0.87 | % |
| Automobiles & Automotive Parts | 0.07 | % |
| Banking | 12.66 | % |
| Beverages | 3.05 | % |
| Building & Materials | 0.10 | % |
| Chemicals | 0.65 | % |
| Commercial Services | 1.29 | % |
| Computers | 1.63 | % |
| Diversified Financial Services | 5.07 | % |
| Electric | 4.63 | % |
| Electrical Equipment & Components | 0.32 | % |
| Food | 2.50 | % |
| Forest/Paper Products | 0.12 | % |
| Gas | 0.44 | % |
| Healthcare | 1.77 | % |
| Housewares | 0.48 | % |
| Insurance | 2.65 | % |
| Internet | 0.40 | % |
| Iron/Steel | 0.19 | % |
| Leisure | 0.07 | % |
| Lodging | 0.07 | % |
| Media | 1.18 | % |
| Mining | 0.60 | % |
| Miscellaneous Manufacturing | 0.41 | % |
| Oil & Gas | 4.04 | % |
| Packaging & Containers | 0.07 | % |
| Pharmaceuticals | 3.17 | % |
| Pipelines | 1.37 | % |
| Real Estate | 1.18 | % |
10
| Security type/sector | Percentage of net assets |
| Corporate Bonds (continued) | | |
| Retail | 0.55 | % |
| Software | 1.23 | % |
| Telecommunications | 2.42 | % |
| Transportation | 0.25 | % |
| Municipal Bonds | 0.62 | % |
| Non-Agency Asset-Backed Securities | 5.98 | % |
| Regional Bonds | 0.45 | % |
| Senior Secured Loans | 32.59 | % |
| Sovereign Bonds | 0.54 | % |
| Supranational Bank | 0.21 | % |
| U.S. Treasury Obligation | 0.06 | % |
| Convertible Preferred Stock | 0.02 | % |
| Preferred Stock | 0.29 | % |
| Short-Term Investments | 8.43 | % |
| Total Value of Securities | 106.23 | % |
| Liabilities Net of Receivables and Other Assets | (6.23 | %) |
| Total Net Assets | 100.00 | % |
11
| Statement of net assets | |
| Delaware Diversified Floating Rate Fund | July 31, 2013 |
| | | Principal amount° | | Value (U.S. $) |
| Agency Collateralized Mortgage Obligations – 0.28% | | | | | | |
| • | Fannie Mae REMICs | | | | | | |
| Series 2004-36 FA 0.59% 5/25/34 | USD | | 71,805 | | $ | 72,164 |
| Series 2005-66 FD 0.49% 7/25/35 | | | 84,446 | | | 84,498 |
| Series 2005-106 QF 0.70% 12/25/35 | | | 526,035 | | | 531,415 |
| Series 2006-105 FB 0.61% 11/25/36 | | | 77,638 | | | 78,135 |
| Series 2007-109 NF 0.74% 12/25/37 | | | 37,457 | | | 37,861 |
| • | Freddie Mac REMICs | | | | | | |
| Series 3067 FA 0.541% 11/15/35 | | | 158,494 | | | 159,099 |
| Series 3239 EF 0.541% 11/15/36 | | | 144,627 | | | 145,094 |
| Series 3241 FM 0.571% 11/15/36 | | | 16,971 | | | 17,051 |
| Series 3780 LF 0.591% 3/15/29 | | | 25,676 | | | 25,704 |
| Total Agency Collateralized Mortgage Obligations | | | | | | |
| (cost $1,138,831) | | | | | | 1,151,021 |
| |
| Agency Mortgage-Backed Securities – 0.01% | | | | | | |
| • | Freddie Mac ARM 2.382% 2/1/35 | | | 22,687 | | | 23,991 |
| Total Agency Mortgage-Backed Securities | | | | | | |
| (cost $23,963) | | | | | | 23,991 |
| |
| Commercial Mortgage-Backed Securities – 0.06% | | | | | | |
| JPMorgan Chase Commercial Mortgage Securities | | | | | | |
| Series 2011-C5 A3 4.171% 8/15/46 | | | 100,000 | | | 105,179 |
| # | VNO Mortgage Trust | | | | | | |
| Series 2012-6AVE 144A 2.996% 11/15/30 | | | 155,000 | | | 145,780 |
| Total Commercial Mortgage-Backed Securities | | | | | | |
| (cost $273,640) | | | | | | 250,959 |
| |
| Convertible Bonds – 1.01% | | | | | | |
| Φ | ArvinMeritor 4.00% exercise price $26.73, | | | | | | |
| expiration date 2/12/27 | | | 454,000 | | | 423,355 |
| Headwaters 2.50% exercise price $29.48, | | | | | | |
| expiration date 1/29/14 | | | 33,000 | | | 33,144 |
| L-3 Communications Holdings 3.00% | | | | | | |
| exercise price $90.24, expiration date 8/1/35 | | | 310,000 | | | 334,219 |
| Leap Wireless International 4.50% exercise price | | | | | | |
| $93.21, expiration date 7/10/14 | | | 407,000 | | | 416,412 |
12
| | | Principal amount° | | Value (U.S. $) |
| Convertible Bonds (continued) | | | | | | |
| Linear Technology 3.00% exercise price $41.46, | | | | | | |
| expiration date 4/30/27 | USD | | 205,000 | | $ | 222,681 |
| Live Nation Entertainment 2.875% exercise price $27.14, | | | | | | |
| expiration date 7/14/27 | | | 334,000 | | | 339,010 |
| MGM Resorts International 4.25% exercise price $18.58, | | | | | | |
| expiration date 4/10/15 | | | 305,000 | | | 356,278 |
| Mylan 3.75% exercise price $13.32, | | | | | | |
| expiration date 9/15/15 | | | 19,000 | | | 48,581 |
| Nuance Communications 2.75% exercise price $32.30, | | | | | | |
| expiration date 11/1/31 | | | 310,000 | | | 317,363 |
| NuVasive 2.75% exercise price $42.13, | | | | | | |
| expiration date 6/30/17 | | | 200,000 | | | 196,000 |
| PHH 4.00% exercise price $25.80, | | | | | | |
| expiration date 8/27/14 | | | 665,000 | | | 727,759 |
| SanDisk 1.50% exercise price $52.37, | | | | | | |
| expiration date 8/11/17 | | | 289,000 | | | 367,572 |
| Steel Dynamics 5.125% exercise price $17.21, | | | | | | |
| expiration date 6/15/14 | | | 18,000 | | | 19,541 |
| Tibco Software 2.25% exercise price $50.57, | | | | | | |
| expiration date 4/30/32 | | | 340,000 | | | 344,675 |
| # | Vantage Drilling Company 144A 5.50% | | | | | | |
| exercise price $2.39, expiration date 7/15/43 | | | 83,000 | | | 87,358 |
| Total Convertible Bonds (cost $4,036,756) | | | | | | 4,233,948 |
| |
| Corporate Bonds – 55.68% | | | | | | |
| Aerospace & Defense – 0.18% | | | | | | |
| • | United Technologies 0.775% 6/1/15 | | | 750,000 | | | 755,489 |
| | | | | | | 755,489 |
| Auto Manufacturers – 0.87% | | | | | | |
| # | Daimler Finance North America 144A | | | | | | |
| •0.87% 1/9/15 | | | 350,000 | | | 351,276 |
| •1.125% 8/1/18 | | | 710,000 | | | 711,894 |
| •1.472% 9/13/13 | | | 1,290,000 | | | 1,291,360 |
| 2.25% 7/31/19 | | | 900,000 | | | 881,844 |
| #• | Volkswagen International Finance 144A 1.022% 3/21/14 | | | 400,000 | | | 401,821 |
| | | | | | | 3,638,195 |
| Automobiles & Automotive Parts – 0.07% | | | | | | |
| Delphi 6.125% 5/15/21 | | | 265,000 | | | 290,838 |
| | | | | | | 290,838 |
13
Statement of net assets
Delaware Diversified Floating Rate Fund
| | | Principal amount° | | Value (U.S. $) |
| Corporate Bonds (continued) | | | | | | |
| Banking – 12.66% | | | | | | |
| • | Abbey National Treasury Services 1.844% 4/25/14 | USD | | 785,000 | | $ | 792,009 |
| # | Banco do Brasil 144A 3.75% 7/25/18 | EUR | | 420,000 | | | 554,473 |
| # | Banco Santander Mexico 144A 4.125% 11/9/22 | USD | | 300,000 | | | 279,375 |
| Bancolombia 5.125% 9/11/22 | | | 117,000 | | | 109,395 |
| # | Bank Nederlandse Gemeenten 144A | | | | | | |
| •0.436% 7/18/16 | | | 1,862,000 | | | 1,862,214 |
| 2.50% 1/23/23 | | | 326,000 | | | 304,039 |
| • | Bank of America | | | | | | |
| 0.528% 10/14/16 | | | 575,000 | | | 563,202 |
| 1.343% 3/22/18 | | | 2,200,000 | | | 2,197,575 |
| 1.685% 1/30/14 | | | 180,000 | | | 181,017 |
| 5.20% 12/29/49 | | | 385,000 | | | 348,425 |
| • | Bank of Montreal | | | | | | |
| 0.734% 4/29/14 | | | 625,000 | | | 627,225 |
| 0.788% 7/15/16 | | | 3,220,000 | | | 3,227,061 |
| • | Bank of New York Mellon 4.50% 12/31/49 | | | 240,000 | | | 224,100 |
| • | Bank of Nova Scotia | | | | | | |
| 0.673% 3/15/16 | | | 2,200,000 | | | 2,200,320 |
| 0.788% 7/15/16 | | | 1,420,000 | | | 1,422,286 |
| Barclays Bank 7.625% 11/21/22 | | | 400,000 | | | 399,000 |
| • | BB&T 1.133% 6/15/18 | | | 2,086,000 | | | 2,089,463 |
| BBVA U.S. Senior 4.664% 10/9/15 | | | 200,000 | | | 206,556 |
| • | Branch Banking & Trust | | | | | | |
| 0.574% 5/23/17 | | | 750,000 | | | 735,410 |
| 0.592% 9/13/16 | | | 775,000 | | | 764,273 |
| #• | CoBank 144A 0.873% 6/15/22 | | | 75,000 | | | 68,049 |
| • | Deutsche Bank 4.296% 5/24/28 | | | 400,000 | | | 363,951 |
| • | Fifth Third Bancorp | | | | | | |
| 0.683% 2/26/16 | | | 1,130,000 | | | 1,125,243 |
| 5.10% 12/31/49 | | | 315,000 | | | 298,463 |
| • | Fifth Third Capital Trust IV 6.50% 4/15/37 | | | 50,000 | | | 50,188 |
| Goldman Sachs Group | | | | | | |
| •1.465% 4/30/18 | | | 1,410,000 | | | 1,411,647 |
| 2.90% 7/19/18 | | | 75,000 | | | 75,219 |
| #• | HBOS Capital Funding 144A 6.071% 6/29/49 | | | 1,510,000 | | | 1,457,150 |
| # | HSBC Bank 144A | | | | | | |
| •0.915% 5/15/18 | | | 1,400,000 | | | 1,400,983 |
| 4.75% 1/19/21 | | | 1,130,000 | | | 1,228,284 |
14
| | | Principal amount° | | Value (U.S. $) |
| Corporate Bonds (continued) | | | | | | |
| Banking (continued) | | | | | | |
| • | JPMorgan Chase | | | | | | |
| 0.602% 6/13/16 | USD | | 4,080,000 | | $ | 4,013,136 |
| 5.15% 12/29/49 | | | 50,000 | | | 46,625 |
| Morgan Stanley | | | | | | |
| •1.523% 2/25/16 | | | 930,000 | | | 935,733 |
| •1.546% 4/25/18 | | | 1,735,000 | | | 1,725,228 |
| 4.10% 5/22/23 | | | 475,000 | | | 446,802 |
| #• | National Australia Bank 144A 0.989% 4/11/14 | | | 990,000 | | | 994,944 |
| • | National City Bank 0.644% 6/7/17 | | | 500,000 | | | 489,618 |
| #• | Nederlandse Waterschapsbank 144A 0.314% 10/27/14 | | | 600,000 | | | 600,500 |
| PNC Bank 3.80% 7/25/23 | | | 1,180,000 | | | 1,167,597 |
| • | PNC Financial Services Group 4.85% 5/29/49 | | | 260,000 | | | 237,250 |
| • | PNC Funding 0.466% 1/31/14 | | | 685,000 | | | 685,113 |
| Regions Financial | | | | | | |
| 2.00% 5/15/18 | | | 1,860,000 | | | 1,792,593 |
| 5.75% 6/15/15 | | | 140,000 | | | 150,363 |
| • | Royal Bank of Canada | | | | | | |
| 0.644% 3/8/16 | | | 745,000 | | | 746,447 |
| 0.965% 10/30/14 | | | 1,100,000 | | | 1,108,613 |
| Royal Bank of Scotland Group 6.10% 6/10/23 | | | 110,000 | | | 105,681 |
| # | Russian Agricultural Bank 144A 5.10% 7/25/18 | | | 325,000 | | | 326,788 |
| # | Sberbank 144 A 4.95% 2/7/17 | | | 200,000 | | | 210,240 |
| # | Standard Chartered 144A | | | | | | |
| •1.225% 5/12/14 | | | 500,000 | | | 502,995 |
| 3.95% 1/11/23 | | | 205,000 | | | 192,816 |
| State Street 3.10% 5/15/23 | | | 345,000 | | | 323,578 |
| • | SunTrust Bank 0.564% 8/24/15 | | | 985,000 | | | 971,350 |
| • | Svenska Handelsbanken 0.722% 3/21/16 | | | 615,000 | | | 617,015 |
| • | Toronto-Dominion Bank 0.815% 4/30/18 | | | 1,325,000 | | | 1,330,903 |
| • | U.S. Bank 0.548% 10/14/14 | | | 920,000 | | | 922,025 |
| • | USB Capital IX 3.50% 10/29/49 | | | 440,000 | | | 391,600 |
| # | Vnesheconombank 144A | | | | | | |
| 5.375% 2/13/17 | | | 200,000 | | | 213,500 |
| 6.025% 7/5/22 | | | 200,000 | | | 211,000 |
| • | Wells Fargo & Company | | | | | | |
| 0.794% 7/20/16 | | | 1,480,000 | | | 1,482,396 |
| 0.895% 4/23/18 | | | 2,600,000 | | | 2,603,083 |
15
Statement of net assets
Delaware Diversified Floating Rate Fund
| | | Principal amount° | | Value (U.S. $) |
| Corporate Bonds (continued) | | | | | | |
| Banking (continued) | | | | | | |
| Zions Bancorp | | | | | | |
| 4.50% 3/27/17 | USD | | 315,000 | | $ | 334,362 |
| 4.50% 6/13/23 | | | 420,000 | | | 417,722 |
| | | | | | | 52,864,211 |
| Beverages – 3.05% | | | | | | |
| • | Anheuser-Busch InBev Worldwide 0.628% 7/14/14 | | | 350,000 | | | 350,927 |
| • | Coca-Cola Enterprises 0.574% 2/18/14 | | | 550,000 | | | 550,584 |
| Constellation Brands | | | | | | |
| 3.75% 5/1/21 | | | 165,000 | | | 154,688 |
| 4.25% 5/1/23 | | | 110,000 | | | 103,950 |
| # | Heineken 144A 1.40% 10/1/17 | | | 2,520,000 | | | 2,466,277 |
| • | PepsiCo 0.483% 2/26/16 | | | 2,890,000 | | | 2,893,320 |
| # | Pernod-Ricard 144A | | | | | | |
| 2.95% 1/15/17 | | | 2,250,000 | | | 2,307,458 |
| 5.75% 4/7/21 | | | 1,305,000 | | | 1,473,062 |
| # | SABMiller Holdings 144A 1.85% 1/15/15 | | | 2,420,000 | | | 2,455,228 |
| | | | | | | 12,755,494 |
| Building & Materials – 0.10% | | | | | | |
| # | Cemex Espana Luxembourg 144A 9.25% 5/12/20 | | | 175,000 | | | 192,063 |
| # | Cemex SAB 144A 9.50% 6/15/18 | | | 200,000 | | | 224,500 |
| | | | | | | 416,563 |
| Chemicals – 0.65% | | | | | | |
| CF Industries 7.125% 5/1/20 | | | 250,000 | | | 298,036 |
| Dow Chemical 8.55% 5/15/19 | | | 140,000 | | | 180,357 |
| LYB International Finance 4.00% 7/15/23 | | | 1,750,000 | | | 1,740,274 |
| LyondellBasell Industries 5.75% 4/15/24 | | | 270,000 | | | 303,305 |
| # | Uralkali 144A 3.723% 4/30/18 | | | 200,000 | | | 184,946 |
| | | | | | | 2,706,918 |
| Commercial Services – 1.29% | | | | | | |
| ADT | | | | | | |
| 2.25% 7/15/17 | | | 1,600,000 | | | 1,527,109 |
| 4.125% 6/15/23 | | | 105,000 | | | 90,440 |
16
| | | | Principal amount° | | Value (U.S. $) |
| Corporate Bonds (continued) | | | | | | | |
| Commercial Services (continued) | | | | | | | |
| # | ERAC USA Finance 144A | | | | | | | |
| 2.80% 11/1/18 | | USD | | 555,000 | | $ | 555,918 |
| 5.25% 10/1/20 | | | | 120,000 | | | 133,601 |
| # | Glencore Funding 144A 2.50% 1/15/19 | | | | 465,000 | | | 427,171 |
| # | Korea Expressway 144A 1.875% 10/22/17 | | | | 200,000 | | | 194,813 |
| Total System Services 2.375% 6/1/18 | | | | 1,440,000 | | | 1,401,971 |
| # | URS 144A 4.35% 4/1/17 | | | | 220,000 | | | 225,147 |
| Western Union 2.875% 12/10/17 | | | | 845,000 | | | 851,486 |
| | | | | | | | 5,407,656 |
| Computers – 1.63% | | | | | | | |
| • | Apple 0.516% 5/3/18 | | | | 4,200,000 | | | 4,200,983 |
| EMC 2.65% 6/1/20 | | | | 130,000 | | | 129,128 |
| • | Hewlett-Packard 0.673% 5/30/14 | | | | 75,000 | | | 74,862 |
| International Business Machines | | | | | | | |
| 1.25% 2/6/17 | | | | 1,000,000 | | | 995,018 |
| 1.25% 2/8/18 | | | | 500,000 | | | 489,501 |
| NetApp 3.25% 12/15/22 | | | | 645,000 | | | 596,142 |
| • | Xerox 1.672% 9/13/13 | | | | 300,000 | | | 300,266 |
| | | | | | | | 6,785,900 |
| Diversified Financial Services – 5.07% | | | | | | | |
| #• | American Honda Finance 0.648% 5/26/16 | | | | 2,930,000 | | | 2,930,823 |
| # | Banco BTG Pactual 144A 4.00% 1/16/20 | | | | 200,000 | | | 172,000 |
| • | Bear Stearns 3.16% 4/24/14 | | AUD | | 100,000 | | | 89,767 |
| • | Caterpillar Financial Services 0.513% 2/26/16 | | USD | | 820,000 | | | 820,534 |
| # | CDP Financial 144A 4.40% 11/25/19 | | | | 250,000 | | | 275,759 |
| # | Columbus International 144A 11.50% 11/20/14 | | | | 540,000 | | | 585,900 |
| # | Crown Castle Towers 144A 4.883% 8/15/20 | | | | 685,000 | | | 729,891 |
| • | Ford Motor Credit Company 1.516% 5/9/16 | | | | 2,800,000 | | | 2,807,952 |
| General Electric Capital | | | | | | | |
| #144A 3.80% 6/18/19 | | | | 250,000 | | | 261,833 |
| •0.646% 5/5/26 | | | | 965,000 | | | 888,678 |
| •1.273% 3/15/23 | | | | 1,050,000 | | | 1,057,158 |
| 6.00% 8/7/19 | | | | 215,000 | | | 250,897 |
| •7.125% 12/15/49 | | | | 200,000 | | | 225,376 |
| # | Hyundai Capital America 144A 4.00% 6/8/17 | | | | 310,000 | | | 324,042 |
| International Lease Finance 6.25% 5/15/19 | | | | 360,000 | | | 381,600 |
| Jefferies Group 5.125% 1/20/23 | | | | 875,000 | | | 887,206 |
17
Statement of net assets
Delaware Diversified Floating Rate Fund
| | | | Principal amount° | | Value (U.S. $) |
| Corporate Bonds (continued) | | | | | | | |
| Diversified Financial Services (continued) | | | | | | | |
| • | National Rural Utilities Cooperative Finance | | | | | | | |
| 0.523% 5/27/16 | | USD | | 1,750,000 | | $ | 1,750,250 |
| 4.75% 4/30/43 | | | | 310,000 | | | 299,925 |
| • | Paccar Financial | | | | | | | |
| 0.523% 6/5/14 | | | | 670,000 | | | 671,324 |
| 0.536% 2/8/16 | | | | 900,000 | | | 899,890 |
| # | Temasek Financial I 144A 2.375% 1/23/23 | | | | 250,000 | | | 226,365 |
| # | Tenedora Nemak 144A 5.50% 2/28/23 | | | | 400,000 | | | 396,000 |
| • | Toyota Motor Credit | | | | | | | |
| 0.424% 3/10/15 | | | | 315,000 | | | 315,130 |
| 0.435% 1/23/15 | | | | 1,720,000 | | | 1,722,521 |
| 0.564% 5/17/16 | | | | 850,000 | | | 850,354 |
| #• | USB Realty 144A 1.415% 12/22/49 | | | | 300,000 | | | 261,000 |
| #• | ZFS Finance USA Trust II 144A 6.45% 12/15/65 | | | | 1,000,000 | | | 1,072,499 |
| | | | | | | | 21,154,674 |
| Electric – 4.63% | | | | | | | |
| Ameren Illinois 9.75% 11/15/18 | | | | 165,000 | | | 222,661 |
| • | Appalachian Power Company 0.649% 8/16/13 | | | | 3,965,000 | | | 3,965,376 |
| • | Duke Energy Indiana 0.619% 7/11/16 | | | | 2,350,000 | | | 2,350,362 |
| #• | Electricite de France 144A 5.25% 12/29/49 | | | | 515,000 | | | 493,372 |
| # | Eskom Holdings Ltd 144A 6.75% 8/6/23 | | | | 215,000 | | | 213,259 |
| Exelon Generation 4.25% 6/15/22 | | | | 1,500,000 | | | 1,510,044 |
| • | Georgia Power 0.593% 3/15/16 | | | | 2,100,000 | | | 2,101,938 |
| Great Plains Energy | | | | | | | |
| 4.85% 6/1/21 | | | | 730,000 | | | 787,134 |
| 5.292% 6/15/22 | | | | 270,000 | | | 295,834 |
| • | Integrys Energy Group 6.11% 12/1/66 | | | | 410,000 | | | 430,823 |
| LG&E & KU Energy 3.75% 11/15/20 | | | | 350,000 | | | 358,319 |
| National Fuel Gas 3.75% 3/1/23 | | | | 410,000 | | | 398,142 |
| NextEra Energy Capital Holdings | | | | | | | |
| 3.625% 6/15/23 | | | | 180,000 | | | 174,703 |
| •6.35% 10/1/66 | | | | 585,000 | | | 608,833 |
| Nisource Finance Corp 3.85% 2/15/23 | | | | 2,055,000 | | | 2,019,839 |
| • | Northeast Utilities 1.022% 9/20/13 | | | | 400,000 | | | 400,341 |
| • | NSTAR Electric Company 0.514% 5/17/16 | | | | 850,000 | | | 848,945 |
| NV Energy 6.25% 11/15/20 | | | | 390,000 | | | 460,490 |
| Pennsylvania Electric 5.20% 4/1/20 | | | | 625,000 | | | 682,978 |
18
| | | | Principal amount° | | Value (U.S. $) |
| Corporate Bonds (continued) | | | | | | | |
| Electric (continued) | | | | | | | |
| • | PPL Capital Funding 6.70% 3/30/67 | | USD | | 115,000 | | $ | 119,696 |
| SCANA 4.125% 2/1/22 | | | | 305,000 | | | 299,995 |
| • | Southern California Edison 0.723% 9/15/14 | | | | 440,000 | | | 441,940 |
| • | Wisconsin Energy 6.25% 5/15/67 | | | | 155,000 | | | 163,275 |
| | | | | | | | 19,348,299 |
| Electrical Equipment & Components – 0.32% | | | | | | | |
| Agilent Technologies 3.875% 7/15/23 | | | | 255,000 | | | 248,742 |
| Energizer Holding 4.70% 5/24/22 | | | | 215,000 | | | 217,486 |
| National Semiconductor 6.60% 6/15/17 | | | | 310,000 | | | 365,047 |
| # | Samsung Electronics America 144A 1.75% 4/10/17 | | | | 500,000 | | | 495,472 |
| | | | | | | | 1,326,747 |
| Food – 2.50% | | | | | | | |
| # | Aramark 144A 5.75% 3/15/20 | | | | 1,300,000 | | | 1,358,500 |
| # | BFF International 144A 7.25% 1/28/20 | | | | 100,000 | | | 111,000 |
| # | BRF 3.95% 5/22/23 | | | | 300,000 | | | 258,750 |
| # | Brasil Foods 144A 5.875% 6/6/22 | | | | 200,000 | | | 203,500 |
| • | Campbell Soup 0.565% 8/1/14 | | | | 1,030,000 | | | 1,031,575 |
| # | Cosan Luxembourg 144A 5.00% 3/14/23 | | | | 400,000 | | | 376,000 |
| # | ESAL 144A 6.25% 2/5/23 | | | | 400,000 | | | 369,000 |
| • | General Mills | | | | | | | |
| 0.564% 1/29/16 | | | | 770,000 | | | 770,095 |
| 0.624% 5/16/14 | | | | 1,780,000 | | | 1,783,599 |
| • | Kellogg 0.505% 2/13/15 | | | | 3,620,000 | | | 3,623,041 |
| Kroger Company 3.85% 8/1/23 | | | | 365,000 | | | 363,249 |
| # | Want Want China Finance Ltd 1.875% 5/14/18 | | | | 200,000 | | | 190,374 |
| | | | | | | | 10,438,683 |
| Forest/Paper Products – 0.12% | | | | | | | |
| Georgia-Pacific 8.00% 1/15/24 | | | | 400,000 | | | 519,596 |
| | | | | | | | 519,596 |
| Gas – 0.44% | | | | | | | |
| CenterPoint Energy 6.50% 5/1/18 | | | | 150,000 | | | 178,376 |
| # | Korea Gas 144A 2.875% 7/29/18 | | | | 435,000 | | | 435,360 |
| • | Sempra Energy 1.033% 3/15/14 | | | | 1,200,000 | | | 1,203,500 |
| | | | | | | | 1,817,236 |
| Healthcare – 1.77% | | | | | | | |
| • | Baxter International 0.445% 12/11/14 | | | | 3,270,000 | | | 3,272,436 |
| # | CareFusion 144A 3.30% 3/1/23 | | | | 335,000 | | | 316,029 |
| Covidien International Finance 2.95% 6/15/23 | | | | 260,000 | | | 248,183 |
19
Statement of net assets
Delaware Diversified Floating Rate Fund
| | | | Principal amount° | | Value (U.S. $) |
| Corporate Bonds (continued) | | | | | | | |
| Healthcare (continued) | | | | | | | |
| • | Quest Diagnostics 1.123% 3/24/14 | | USD | | 1,115,000 | | $ | 1,118,425 |
| WellPoint 2.375% 2/15/17 | | | | 2,400,000 | | | 2,437,378 |
| | | | | | | | 7,392,451 |
| Housewares – 0.48% | | | | | | | |
| • | Kimberly-Clark 0.394% 5/15/16 | | | | 950,000 | | | 949,609 |
| Newell Rubbermaid 2.05% 12/1/17 | | | | 1,075,000 | | | 1,061,532 |
| | | | | | | | 2,011,141 |
| Insurance – 2.65% | | | | | | | |
| American International Group 8.25% 8/15/18 | | | | 700,000 | | | 877,708 |
| • | Berkshire Hathaway Finance 0.599% 1/10/14 | | | | 820,000 | | | 821,260 |
| • | Chubb 6.375% 3/29/67 | | | | 260,000 | | | 282,750 |
| # | ING US 144A | | | | | | | |
| 2.90% 2/15/18 | | | | 370,000 | | | 369,434 |
| 5.50% 7/15/22 | | | | 185,000 | | | 200,075 |
| •5.65% 5/15/53 | | | | 485,000 | | | 457,113 |
| # | Liberty Mutual Group 144A | | | | | | | |
| 4.25% 6/15/23 | | | | 1,070,000 | | | 1,051,490 |
| 4.95% 5/1/22 | | | | 120,000 | | | 124,576 |
| #• | Metropolitan Life Global Funding I 144A | | | | | | | |
| 0.798% 7/15/16 | | | | 4,350,000 | | | 4,351,940 |
| 3.00% 1/10/23 | | | | 420,000 | | | 401,022 |
| #• | Principal Life Global Funding II 144A 0.643% 5/27/16 | | | | 1,530,000 | | | 1,532,777 |
| • | Prudential Financial 5.625% 6/15/43 | | | | 365,000 | | | 354,963 |
| • | XL Group 6.50% 12/29/49 | | | | 255,000 | | | 251,813 |
| | | | | | | | 11,076,921 |
| Internet – 0.40% | | | | | | | |
| Amazon.com 2.50% 11/29/22 | | | | 755,000 | | | 694,358 |
| Baidu | | | | | | | |
| 3.25% 8/6/18 | | | | 585,000 | | | 587,713 |
| 3.50% 11/28/22 | | | | 200,000 | | | 183,575 |
| # | Tencent Holdings 144A 3.375% 3/5/18 | | | | 200,000 | | | 202,478 |
| | | | | | | | 1,668,124 |
| Iron/Steel – 0.19% | | | | | | | |
| # | Gerdau Trade 144A 4.75% 4/15/23 | | | | 270,000 | | | 247,050 |
| Nucor 4.00% 8/1/23 | | | | 235,000 | | | 231,794 |
| Precision Castparts 1.25% 1/15/18 | | | | 335,000 | | | 325,813 |
| | | | | | | | 804,657 |
20
| | | | Principal amount° | | Value (U.S. $) |
| Corporate Bonds (continued) | | | | | | | |
| Leisure – 0.07% | | | | | | | |
| Carnival 1.20% 2/5/16 | | USD | | 305,000 | | $ | 303,428 |
| | | | | | | | 303,428 |
| Lodging – 0.07% | | | | | | | |
| Wyndham Worldwide 3.90% 3/1/23 | | | | 290,000 | | | 276,182 |
| | | | | | | | 276,182 |
| Media – 1.18% | | | | | | | |
| Historic TW 6.875% 6/15/18 | | | | 400,000 | | | 484,799 |
| # | Myriad International Holdings 144A | | | | | | | |
| 6.00% 7/18/20 | | | | 410,000 | | | 425,375 |
| 6.375% 7/28/17 | | | | 200,000 | | | 217,240 |
| #• | NBCUniversal Enterprise 144A 0.953% 4/15/18 | | | | 2,910,000 | | | 2,938,250 |
| Time Warner Cable | | | | | | | |
| 5.85% 5/1/17 | | | | 360,000 | | | 393,529 |
| 8.25% 4/1/19 | | | | 125,000 | | | 145,681 |
| # | Vivendi 144A | | | | | | | |
| 3.45% 1/12/18 | | | | 55,000 | | | 55,588 |
| 6.625% 4/4/18 | | | | 230,000 | | | 263,156 |
| | | | | | | | 4,923,618 |
| Mining – 0.60% | | | | | | | |
| # | Barrick Gold 144A | | | | | | | |
| 2.50% 5/1/18 | | | | 110,000 | | | 102,188 |
| 4.10% 5/1/23 | | | | 530,000 | | | 451,641 |
| # | Freeport-McMoRan Copper & Gold 144A 3.875% 3/15/23 | | | | 290,000 | | | 262,882 |
| • | Rio Tinto Finance USA 1.113% 6/17/16 | | | | 995,000 | | | 995,987 |
| Teck Resources 3.75% 2/1/23 | | | | 310,000 | | | 281,041 |
| Vale Overseas Ltd 5.625% 9/15/19 | | | | 175,000 | | | 190,742 |
| # | Vedanta Resources 6.00% 1/31/19 | | | | 215,000 | | | 210,700 |
| | | | | | | | 2,495,181 |
| Miscellaneous Manufacturing – 0.41% | | | | | | | |
| # | Ingersoll-Rand Global Holding Company Ltd | | | | | | | |
| 4.25% 6/15/23 | | | | 895,000 | | | 894,376 |
| Tyco Electronics Group 1.60% 2/3/15 | | | | 110,000 | | | 111,167 |
| • | VF 1.024% 8/23/13 | | | | 700,000 | | | 700,297 |
| | | | | | | | 1,705,840 |
| Oil & Gas – 4.04% | | | | | | | |
| Apache | | | | | | | |
| 1.75% 4/15/17 | | | | 765,000 | | | 767,280 |
| 5.625% 1/15/17 | | | | 580,000 | | | 657,587 |
21
Statement of net assets
Delaware Diversified Floating Rate Fund
| | | | Principal amount° | | Value (U.S. $) |
| Corporate Bonds (continued) | | | | | | | |
| Oil & Gas (continued) | | | | | | | |
| • | BP Capital Markets 0.875% 3/11/14 | | USD | | 983,000 | | $ | 986,291 |
| CNOOC Finance 2013 3.00% 5/9/23 | | | | 310,000 | | | 282,823 |
| Continental Resources 4.50% 4/15/23 | | | | 355,000 | | | 346,125 |
| Ecopetrol 7.625% 7/23/19 | | | | 185,000 | | | 221,075 |
| # | Gazprom Neft 144A 4.375% 9/19/22 | | | | 200,000 | | | 186,040 |
| # | Gazprom Oao Via Gaz Capital 144A 4.95% 5/23/16 | | | | 200,000 | | | 210,500 |
| Halliburton Company 3.50% 8/1/23 | | | | 455,000 | | | 454,686 |
| # | Kazmunaygas National Company 9.125% 7/2/18 | | | | 430,000 | | | 525,138 |
| Lukoil International Finance 6.125% 11/9/20 | | | | 200,000 | | | 215,540 |
| Newfield Exploration 5.625% 7/1/24 | | | | 1,095,000 | | | 1,100,475 |
| Noble Holding International 3.05% 3/1/16 | | | | 385,000 | | | 398,317 |
| Ongc Videsh Ltd 2.50% 5/7/18 | | | | 415,000 | | | 394,109 |
| # | Pacific Rubiales Energy 144A 7.25% 12/12/21 | | | | 335,000 | | | 361,800 |
| # | Pertamina Persero 144A | | | | | | | |
| 4.30% 5/20/23 | | | | 200,000 | | | 180,500 |
| 4.875% 5/3/22 | | | | 200,000 | | | 190,500 |
| • | Petrobras Global Finance BV 2.408% 1/15/19 | | | | 2,195,000 | | | 2,162,074 |
| Petrohawk Energy 7.875% 6/1/15 | | | | 450,000 | | | 457,988 |
| # | Petroleos Mexicanos 144A | | | | | | | |
| •2.286% 7/18/18 | | | | 630,000 | | | 647,325 |
| •3.50% 7/18/18 | | | | 45,000 | | | 45,900 |
| 3.50% 1/30/23 | | | | 340,000 | | | 311,950 |
| Plains Exploration & Production Company 6.50% 11/15/20 | | | | 380,000 | | | 409,433 |
| #• | Schlumberger Investment 144A 0.824% 9/12/14 | | | | 1,270,000 | | | 1,276,881 |
| • | Statoil 0.565% 5/15/18 | | | | 2,280,000 | | | 2,287,003 |
| • | Total Capital Canada 0.648% 1/15/16 | | | | 1,796,000 | | | 1,809,016 |
| | | | | | | | 16,886,356 |
| Packaging & Containers – 0.07% | | | | | | | |
| Rock Tenn | | | | | | | |
| 3.50% 3/1/20 | | | | 185,000 | | | 182,554 |
| 4.00% 3/1/23 | | | | 100,000 | | | 96,458 |
| | | | | | | | 279,012 |
| Pharmaceuticals – 3.17% | | | | | | | |
| # | AbbVie 144A | | | | | | | |
| •1.027% 11/6/15 | | | | 790,000 | | | 797,687 |
| 1.20% 11/6/15 | | | | 2,500,000 | | | 2,510,885 |
| • | DENTSPLY International 1.775% 8/15/13 | | | | 650,000 | | | 650,209 |
| • | Merck & Company 0.634% 5/18/18 | | | | 3,895,000 | | | 3,905,115 |
22
| | | | Principal amount° | | Value (U.S. $) |
| Corporate Bonds (continued) | | | | | | | |
| Pharmaceuticals (continued) | | | | | | | |
| # | Mylan 144A 2.60% 6/24/18 | | USD | | 20,000 | | $ | 19,985 |
| • | Pfizer 0.575% 6/15/18 | | | | 3,010,000 | | | 3,016,532 |
| # | Zoetis 144A 1.875% 2/1/18 | | | | 2,370,000 | | | 2,330,634 |
| | | | | | | | 13,231,047 |
| Pipelines – 1.37% | | | | | | | |
| El Paso Pipeline Partners Operating 6.50% 4/1/20 | | | | 120,000 | | | 140,306 |
| • | Enbridge Energy Partners 8.05% 10/1/37 | | | | 511,000 | | | 580,335 |
| Energy Transfer Partners 8.50% 4/15/14 | | | | 145,000 | | | 152,541 |
| • | Enterprise Products Operating 7.034% 1/15/68 | | | | 250,000 | | | 280,896 |
| Kinder Morgan Energy Partners LP | | | | | | | |
| 2.65% 2/1/19 | | | | 545,000 | | | 548,717 |
| 4.15% 2/1/24 | | | | 815,000 | | | 815,121 |
| Spectra Energy Capital 3.30% 3/15/23 | | | | 125,000 | | | 113,228 |
| Sunoco Logistics Partners Operations 3.45% 1/15/23 | | | | 480,000 | | | 451,508 |
| • | Transcanada Pipelines | | | | | | | |
| 0.953% 6/30/16 | | | | 2,500,000 | | | 2,513,285 |
| 6.35% 5/15/67 | | | | 135,000 | | | 141,830 |
| | | | | | | | 5,737,767 |
| Real Estate – 1.18% | | | | | | | |
| Alexandria Real Estate Equities | | | | | | | |
| 3.90% 6/15/23 | | | | 445,000 | | | 428,423 |
| 4.60% 4/1/22 | | | | 80,000 | | | 82,142 |
| # | American Tower Trust I 144A 1.551% 3/15/18 | | | | 1,280,000 | | | 1,249,930 |
| # | Corporate Office Properties 144A 3.60% 5/15/23 | | | | 225,000 | | | 208,801 |
| Digital Realty Trust 5.25% 3/15/21 | | | | 310,000 | | | 325,475 |
| Duke Realty 3.625% 4/15/23 | | | | 180,000 | | | 168,420 |
| Host Hotels & Resorts | | | | | | | |
| 3.75% 10/15/23 | | | | 330,000 | | | 306,888 |
| 4.75% 3/1/23 | | | | 40,000 | | | 40,396 |
| 5.25% 3/15/22 | | | | 245,000 | | | 255,634 |
| National Retail Properties 3.30% 4/15/23 | | | | 265,000 | | | 245,790 |
| Realty Income 4.65% 8/1/23 | | | | 1,305,000 | | | 1,339,113 |
| # | WEA Finance 144A 3.375% 10/3/22 | | | | 85,000 | | | 81,281 |
| Weingarten Realty Investors 3.50% 4/15/23 | | | | 205,000 | | | 191,814 |
| | | | | | | | 4,924,107 |
23
Statement of net assets
Delaware Diversified Floating Rate Fund
| | | | Principal amount° | | Value (U.S. $) |
| Corporate Bonds (continued) | | | | | | | |
| Retail – 0.55% | | | | | | | |
| # | QVC 144A 4.375% 3/15/23 | | USD | | 955,000 | | $ | 912,777 |
| # | SACI Falabella 144A 3.75% 4/30/23 | | | | 200,000 | | | 183,655 |
| • | Walgreen 0.772% 3/13/14 | | | | 1,200,000 | | | 1,202,019 |
| | | | | | | | 2,298,451 |
| Software – 1.23% | | | | | | | |
| Fidelity National Information Services 3.50% 4/15/23 | | | | 295,000 | | | 272,491 |
| Oracle | | | | | | | |
| •0.848% 1/15/19 | | | | 4,430,000 | | | 4,459,583 |
| 2.375% 1/15/19 | | | | 390,000 | | | 393,157 |
| | | | | | | | 5,125,231 |
| Telecommunications – 2.42% | | | | | | | |
| • | AT&T 0.66% 2/12/16 | | | | 2,200,000 | | | 2,207,717 |
| • | British Telecommunications 1.397% 12/20/13 | | | | 300,000 | | | 301,093 |
| CenturyLink 5.80% 3/15/22 | | | | 225,000 | | | 225,563 |
| # | Digicel 144A 6.00% 4/15/21 | | | | 200,000 | | | 196,500 |
| # | Digicel Group 144A 10.50% 4/15/18 | | | | 200,000 | | | 218,000 |
| # | Lynx II 144A 6.375% 4/15/23 | | | | 200,000 | | | 206,250 |
| # | Millicom International Cellular 144A 4.75% 5/22/20 | | | | 400,000 | | | 389,000 |
| # | Qtel International Finance 144A 3.25% 2/21/23 | | | | 200,000 | | | 184,500 |
| # | SBA Tower Trust 144A 2.24% 4/16/18 | | | | 220,000 | | | 217,291 |
| # | SES 144A 3.60% 4/4/23 | | | | 630,000 | | | 599,202 |
| # | TBG Global PTE 4.625% 4/3/18 | | | | 400,000 | | | 395,000 |
| # | Telefonica Chile 144A 3.875% 10/12/22 | | | | 400,000 | | | 368,786 |
| Telefonica Emisiones 3.192% 4/27/18 | | | | 895,000 | | | 885,122 |
| # | Telemar Norte Leste 5.50% 10/23/20 | | | | 205,000 | | | 193,725 |
| Verizon Communications | | | | | | | |
| #•144A 0.474% 3/6/15 | | | | 990,000 | | | 989,154 |
| 2.00% 11/1/16 | | | | 385,000 | | | 394,498 |
| #• | VimpelCom Holdings 144A 4.276% 6/29/14 | | | | 265,000 | | | 266,874 |
| Virgin Media Secured Finance 6.50% 1/15/18 | | | | 550,000 | | | 576,125 |
| • | Vodafone Group 0.659% 2/19/16 | | | | 1,300,000 | | | 1,300,341 |
| | | | | | | | 10,114,741 |
| Transportation – 0.25% | | | | | | | |
| # | DP World Sukuk 144A 6.25% 7/2/17 | | | | 410,000 | | | 449,975 |
| United Parcel Service 5.125% 4/1/19 | | | | 510,000 | | | 587,259 |
| | | | | | | | 1,037,234 |
| Total Corporate Bonds (cost $233,162,456) | | | | | | | 232,517,988 |
24
| | | | Principal amount° | | Value (U.S. $) |
| Municipal Bonds – 0.62% | | | | | | | |
| • | Connecticut State Series A 1.60% 3/1/21 | | USD | | 750,000 | | $ | 761,513 |
| • | Kentucky Higher Education Student Loan Revenue | | | | | | | |
| Series A-1 0.765% 5/1/20 | | | | 15,000 | | | 14,923 |
| • | Missouri Higher Education Loan Authority Student | | | | | | | |
| Revenue Series A-1 1.123% 8/27/29 | | | | 46,063 | | | 46,626 |
| • | New Mexico Educational Assistance Foundation | | | | | | | |
| Series A-3 1.475% 12/1/38 | | | | 120,000 | | | 120,006 |
| • | North Texas Higher Education Authority Student | | | | | | | |
| Loan Revenue | | | | | | | |
| Series A-1 1.374% 4/1/40 | | | | 289,014 | | | 294,127 |
| Series A-2 1.174% 7/1/30 | | | | 75,000 | | | 75,117 |
| • | Oklahoma State Student Loan Authority Revenue | | | | | | | |
| Series 1 1.498% 6/1/40 | | | | 821,912 | | | 825,068 |
| Series A-2A 1.475% 9/1/37 | | | | 95,000 | | | 96,803 |
| State of Georgia 5.00% 2/1/23 | | | | 295,000 | | | 352,973 |
| Total Municipal Bonds (cost $2,565,682) | | | | | | | 2,587,156 |
| |
| Non-Agency Asset-Backed Securities – 5.98% | | | | | | | |
| • | Ally Master Owner Trust | | | | | | | |
| Series 2010-4 A 1.261% 8/15/17 | | | | 100,000 | | | 100,967 |
| #• | Avenue CLO Fund | | | | | | | |
| Series 2007-6A A1 144A 0.493% 7/17/19 | | | | 238,769 | | | 234,834 |
| #• | Avenue CLO II | | | | | | | |
| Series 2005-2A A1L 144A 0.525% 10/30/17 | | | | 1,491,487 | | | 1,481,837 |
| CenterPoint Energy Transition Bond | | | | | | | |
| Series 2012-1 A2 2.161% 10/15/21 | | | | 100,000 | | | 99,554 |
| • | Chase Issuance Trust | | | | | | | |
| Series 2013-A3 A3 0.471% 4/15/20 | | | | 1,000,000 | | | 994,756 |
| #• | Chesapeake Funding | | | | | | | |
| Series 2012-2A A 144A 0.636% 5/7/24 | | | | 1,000,000 | | | 997,831 |
| #• | Citibank Omni Master Trust | | | | | | | |
| Series 2009-A14A A14 144A 2.941% 8/15/18 | | | | 1,000,000 | | | 1,024,936 |
| • | Discover Card Execution Note Trust | | | | | | | |
| Series 2011-A1 A1 0.541% 8/15/16 | | | | 525,000 | | | 525,412 |
| Series 2013-A1 A1 0.491% 8/17/20 | | | | 675,000 | | | 673,402 |
| Series 2013-A3 A3 0.371% 10/15/18 | | | | 1,035,000 | | | 1,031,019 |
| • | Ford Credit Floorplan Master Owner Trust | | | | | | | |
| #Series 2010-3 A2 144A 1.891% 2/15/17 | | | | 400,000 | | | 408,009 |
| Series 2013-3 A2 0.491% 6/15/17 | | | | 1,000,000 | | | 998,564 |
25
Statement of net assets
Delaware Diversified Floating Rate Fund
| | | | Principal amount° | | Value (U.S. $) |
| Non-Agency Asset-Backed Securities (continued) | | | | | | | |
| General Electric Capital Credit Card Master Note Trust | | | | | | | |
| Series 2012-6 A 1.36% 8/17/20 | | USD | | 100,000 | | $ | 98,556 |
| #• | Golden Credit Card Trust 144A | | | | | | | |
| Series 2012-3A A 0.641% 7/17/17 | | | | 765,000 | | | 766,251 |
| Series 2013-1A A 0.441% 2/15/18 | | | | 2,510,000 | | | 2,508,068 |
| #• | Halcyon Structured Asset Management Long Secured/ | | | | | | | |
| Short Unsecured 2007-2 Ltd 0.514% 10/29/21 | | | | 1,510,238 | | | 1,468,344 |
| #• | KKR CLO Trust 1.453% 7/15/25 | | | | 1,395,000 | | | 1,370,588 |
| #• | LCM Series 6A A 0.503% 5/28/19 | | | | 500,000 | | | 483,830 |
| #• | Maps CLO Fund II Ltd 0.506% 7/20/22 | | | | 1,450,000 | | | 1,404,630 |
| #• | Motor Series 2013-1A A1 144A 0.69% 2/25/21 | | | | 983,333 | | | 983,377 |
| #• | Mountain View CLO III | | | | | | | |
| Series 2007-3A A1 144A 0.483% 4/16/21 | | | | 1,486,741 | | | 1,453,586 |
| • | Nissan Master Owner Trust Receivables | | | | | | | |
| Series 2012-A A 0.661% 5/15/17 | | | | 1,000,000 | | | 998,559 |
| Series 2013-A A 0.491% 2/15/18 | | | | 360,000 | | | 358,893 |
| #• | NYLIM Flatiron CLO | | | | | | | |
| Series 2006-1A A 144A 0.495% 8/8/20 | | | | 500,000 | | | 490,190 |
| #• | PFS Financing | | | | | | | |
| Series 2013-AA A 144A 0.741% 2/15/18 | | | | 680,000 | | | 677,340 |
| #• | Telos CLO 144A | | | | | | | |
| 1.219% 7/6/24 | | | | 1,250,000 | | | 1,250,000 |
| 1.569% 7/6/24 | | | | 2,000,000 | | | 1,989,999 |
| #• | Trafigura Securitisation Finance | | | | | | | |
| Series 2012-1A A 144A 2.591% 10/15/15 | | | | 80,000 | | | 80,956 |
| #• | Victoria Falls CLO | | | | | | | |
| Series 2005-1A A2 144A 0.604% 2/17/17 | | | | 22,699 | | | 22,671 |
| Total Non-Agency Asset Backed Securities | | | | | | | |
| (cost $24,987,915) | | | | | | | 24,976,959 |
| |
| ΔRegional Bonds – 0.45% | | | | | | | |
| Australia – 0.03% | | | | | | | |
| New South Wales Treasury 3.75% 11/20/20 | | AUD | | 122,000 | | | 137,679 |
| | | | | | | | 137,679 |
| Canada – 0.42% | | | | | | | |
| Province of British Columbia 2.00% 10/23/22 | | USD | | 1,895,000 | | | 1,726,697 |
| | | | | | | | 1,726,697 |
| Total Regional Bonds (cost $1,907,690) | | | | | | | 1,864,376 |
26
| | | Principal amount° | | Value (U.S. $) |
| «Senior Secured Loans – 32.59% | | | | | | |
| ABC Supply Tranche B 1st Lien 3.50% 4/15/20 | USD | | 465,000 | | $ | 466,287 |
| Air Medical Group Holdings Tranche B1 1st Lien | | | | | | |
| | 6.50% 5/26/18 | | | 179,100 | | | 183,354 |
| Albertsons | | | | | | |
| Tranche B 4.25% 3/21/16 | | | 363,090 | | | 366,835 |
| Tranche B 1st Lien 4.75% 3/21/19 | | | 378,053 | | | 380,888 |
| Alcatel-Lucent USA Tranche C 1st Lien 7.25% 12/4/18 | | | 588,808 | | | 602,609 |
| Allied Security Holdings Tranche 2L 9.00% 1/21/18 | | | 150,000 | | | 151,969 |
| ARAMARK Tranche D 4.00% 9/30/19 | | | 1,250,000 | | | 1,264,258 |
| Arysta Lifescience | | | | | | |
| 1st Lien 4.50% 5/20/20 | | | 300,000 | | | 302,312 |
| 2nd Lien 8.25% 11/22/20 | | | 435,000 | | | 439,752 |
| Avaya | | | | | | |
| Tranche B-3 4.50% 10/27/17 | | | 623,158 | | | 552,416 |
| Tranche B5 8.00% 3/31/18 | | | 173,097 | | | 163,504 |
| Avis Budget Car Rental Tranche B 1st Lien | | | | | | |
| 3.00% 3/15/19 | | | 144,638 | | | 144,909 |
| Bausch & Lomb Tranche B 4.00% 5/17/19 | | | 975,168 | | | 976,387 |
| Biomet Tranche B 3.75% 7/25/17 | | | 767,975 | | | 774,268 |
| BJ’S Wholesale Club 2nd Lien 9.75% 3/29/19 | | | 1,765,000 | | | 1,804,713 |
| Blackboard | | | | | | |
| Tranche B2 6.25% 10/4/18 | | | 1,019,825 | | | 1,033,423 |
| Tranche B2 1st Lien 6.25% 11/8/18 | | | 1,500,000 | | | 1,520,000 |
| Bombardier Recreational 1st Lien 5.00% 1/17/19 | | | 426,171 | | | 427,570 |
| Brickman Group Holdings Tranche B3 1st Lien | | | | | | |
| 3.00% 10/14/16 | | | 429,000 | | | 431,502 |
| Burlington Coat Factory Warehouse Tranche B2 | | | | | | |
| 4.25% 2/23/17 | | | 3,326,044 | | | 3,350,972 |
| Caesars Entertainment Operating Tranche B6 | | | | | | |
| 5.25% 1/28/18 | | | 301,477 | | | 268,099 |
| Calpine Construction Finance Tranche B 3.00% 5/1/20 | | | 1,770,000 | | | 1,760,819 |
| Carestream Health | | | | | | |
| 2nd Lien 9.50% 12/5/19 | | | 520,000 | | | 515,667 |
| Tranche B 5.00% 6/5/19 | | | 1,250,000 | | | 1,259,635 |
| Charter Communications | | | | | | |
| 3.00% 4/10/20 | | | 2,555,000 | | | 2,550,690 |
| Tranche F 3.00% 1/3/21 | | | 2,900,000 | | | 2,893,658 |
| Chrysler Group Tranche B 4.25% 5/24/17 | | | 114,707 | | | 116,755 |
| Clear Channel Communications Tranche B 3.65% 1/29/16 | | | 1,936,998 | | | 1,820,240 |
| Community Health Systems 3.50% 1/25/17 | | | 3,190,000 | | | 3,215,909 |
27
Statement of net assets
Delaware Diversified Floating Rate Fund
| | | Principal amount° | | Value (U.S. $) |
| «Senior Secured Loans (continued) | | | | | | |
| Crown Castle Operating Tranche B 3.25% 1/31/19 | USD | | 1,065,711 | | $ | 1,068,224 |
| CSC Holdings Tranche B 2.50% 4/9/20 | | | 3,080,000 | | | 3,059,145 |
| Davids Bridal Tranche B 5.00% 9/25/19 | | | 144,275 | | | 145,477 |
| DaVita HealthCare Partners Tranche B2 4.00% 8/1/19 | | | 4,527,250 | | | 4,558,777 |
| Delta Air Lines | | | | | | |
| Tranche B 1st Lien 4.25% 4/15/17 | | | 1,156,611 | | | 1,167,888 |
| Tranche B1 1st Lien 4.00% 10/18/18 | | | 500,000 | | | 502,723 |
| Deltek | | | | | | |
| 10.00% 8/28/17 | | | 25,000 | | | 25,250 |
| 1st Lien 5.00% 10/10/18 | | | 144,275 | | | 144,771 |
| Dollar General 1.28% 6/25/18 | | | 720,000 | | | 720,630 |
| | Drillships Financing Holding | | | | | | |
| Tranche B1 6.00% 2/17/21 | | | 1,495,000 | | | 1,515,556 |
| Tranche B2 5.50% 8/17/16 | | | 40,000 | | | 40,400 |
| Dupont Performance Coatings Tranche B | | | | | | |
| 4.75% 2/1/20 | | | 349,125 | | | 352,998 |
| Dynegy Tranche B2 4.00% 4/16/20 | | | 1,854,718 | | | 1,866,773 |
| Edward Cayman Islands II 1st Lien 4.75% 3/5/20 | | | 95,643 | | | 96,330 |
| Emdeon 1st Lien 3.75% 11/2/18 | | | 1,061,113 | | | 1,069,071 |
| Energy Transfer Equity 3.75% 3/26/17 | | | 900,000 | | | 909,125 |
| EP Energy Tranche B3 2nd Lien 3.50% 4/24/18 | | | 855,000 | | | 856,692 |
| Equipower Resources Holdings | | | | | | |
| Tranche B 5.50% 12/21/18 | | | 210,518 | | | 212,228 |
| Tranche C 4.25% 12/21/19 | | | 485,000 | | | 488,638 |
| 2nd Lien 10.00% 5/23/19 | | | 145,000 | | | 145,997 |
| Essar Steel Algoma 8.75% 9/12/14 | | | 175,740 | | | 179,547 |
| First Data 1st Lien 4.00% 4/5/17 | | | 3,341,848 | | | 3,347,514 |
| Flying Fortress 1st Lien 3.50% 6/30/17 | | | 1,833,333 | | | 1,835,625 |
| Gardner Denver 1st Lien 4.25% 7/23/20 | | | 1,360,000 | | | 1,366,800 |
| Generac Power Systems Tranche B 3.50% 5/10/20 | | | 139,644 | | | 139,972 |
| Getty Images Tranche B 4.75% 9/19/19 | | | 527,350 | | | 528,792 |
| GIM Channelview Cogenera 4.25% 4/18/20 | | | 465,000 | | | 468,875 |
| Gray Television 4.75% 10/11/19 | | | 1,354,775 | | | 1,368,747 |
| Great Wolf Resorts 1st Lien 4.50% 7/31/20 | | | 555,000 | | | 552,225 |
| Harbor Freight Tools 4.75% 7/25/19 | | | 265,000 | | | 267,540 |
| Harrah’s Las Vegas Propco 3.50% 2/13/15 | | | 145,000 | | | 134,790 |
| Harrah’s Operating Tranche B 9.50% 10/31/16 | | | 2,947,392 | | | 2,942,889 |
| HCA Tranche B4 2.75% 5/1/18 | | | 2,855,000 | | | 2,868,383 |
28
| | | Principal amount° | | Value (U.S. $) |
| «Senior Secured Loans (continued) | | | | | | |
| HD Supply Tranche B 4.50% 10/12/17 | USD | | 1,492,462 | | $ | 1,509,097 |
| Hologic Tranche B 4.50% 4/29/17 | | | 346,500 | | | 348,611 |
| | Hostess Brands 1st Lien 6.75% 3/12/20 | | | 620,000 | | | 638,600 |
| Houghton International | | | | | | |
| 1st Lien 5.25% 11/20/19 | | | 149,250 | | | 149,996 |
| 2nd Lien 9.50% 11/20/20 | | | 195,000 | | | 198,291 |
| IASIS Healthcare Tranche B 1st Lien 4.50% 5/3/18 | | | 879,090 | | | 887,222 |
| Immucor Tranche B2 5.00% 8/19/18 | | | 2,181,389 | | | 2,205,929 |
| Ineos US Finance Tranche 4.00% 5/4/18 | | | 559,092 | | | 558,992 |
| Infor US Tranche B2 5.25% 4/5/18 | | | 342,279 | | | 346,077 |
| Intelsat Jackson Holdings Tranche B1 4.50% 4/2/18 | | | 2,427,769 | | | 2,449,772 |
| Kik Custom Products | | | | | | |
| 1st Lien 5.50% 5/17/19 | | | 1,270,000 | | | 1,263,254 |
| 2nd Lien 9.50% 11/17/19 | | | 785,000 | | | 784,019 |
| LA Frontera Generation Tranche B 4.50% 9/30/20 | | | 280,000 | | | 282,100 |
| Landry’s Tranche B 4.75% 4/24/18 | | | 844,722 | | | 856,337 |
| Level 3 Financing Tranche B 1st Lien 4.75% 8/1/19 | | | 1,375,000 | | | 1,387,169 |
| LTS Buyer | | | | | | |
| 1st Lien 4.50% 3/15/20 | | | 175,000 | | | 176,420 |
| 2nd Lien 8.00% 3/15/21 | | | 520,000 | | | 527,800 |
| MacDermid 2nd Lien 7.75% 12/6/20 | | | 210,000 | | | 213,150 |
| MGM Resorts International | | | | | | |
| 3.50% 12/20/19 | | | 750,000 | | | 752,341 |
| Tranche B 4.25% 12/13/19 | | | 1,567,125 | | | 1,572,016 |
| Michael Stores Tranche B 1st Lien 3.75% 1/16/20 | | | 997,500 | | | 1,002,844 |
| Mission Broadcasting Tranche B 1st Lien 3.50% 12/3/19 | | | 31,122 | | | 31,550 |
| MultiPlan | | | | | | |
| Tranche B 4.00% 8/18/17 | | | 1,619,314 | | | 1,632,761 |
| Tranche B1 4.00% 8/18/17 | | | 1,125,000 | | | 1,134,342 |
| NEP Broadcasting 2nd Lien 9.50% 7/3/20 | | | 1,449,286 | | | 1,494,576 |
| Nexstar Broadcasting Group Tranche B 4.50% 7/19/19 | | | 73,616 | | | 73,892 |
| NRG Energy Tranche B 2.75% 7/1/18 | | | 1,918,644 | | | 1,919,544 |
| Nuveen Investments 2nd Lien 6.50% 2/28/19 | | | 4,795,000 | | | 4,809,983 |
| NXP Tranche C 4.75% 12/4/20 | | | 104,475 | | | 106,739 |
| Offshore Group Investment 6.25% 10/25/17 | | | 591,938 | | | 596,673 |
| OSI Restaurant Partners Tranche B 1st Lien | | | | | | |
| 3.50% 10/26/19 | | | 394,875 | | | 396,742 |
| Otter Products Tranche B 5.25% 4/29/19 | | | 1,715,000 | | | 1,725,004 |
| Panda Temple Power II Tranche B 1st Lien | | | | | | |
| 7.25% 3/28/19 | | | 1,989,000 | | | 2,028,780 |
29
Statement of net assets
Delaware Diversified Floating Rate Fund
| | | Principal amount° | | Value (U.S. $) |
| «Senior Secured Loans (continued) | | | | | | |
| Penn National Gaming Tranche B 1st Lien | | | | | | |
| 3.75% 7/14/18 | USD | | 690,843 | | $ | 696,217 |
| | PQ Tranche B 4.50% 8/7/17 | | | 492,525 | | | 497,450 |
| PVH Tranche B 3.25% 12/19/19 | | | 507,908 | | | 511,003 |
| Ranpak 2nd Lien 8.50% 4/10/20 | | | 530,000 | | | 545,900 |
| Remy International Tranche B 1st Lien | | | | | | |
| 4.25% 3/5/20 | | | 185,603 | | | 187,227 |
| Reynolds & Reynolds Tranche B 3.75% 4/21/18 | | | 281,758 | | | 282,345 |
| Reynolds Group Holdings 1st Lien 4.75% 9/21/18 | | | 575,650 | | | 583,242 |
| RGIS Services Tranche B 4.25% 10/28/16 | | | 432,809 | | | 432,809 |
| Rite Aid | | | | | | |
| 2nd Lien 4.88% 6/13/21 | | | 750,000 | | | 756,563 |
| 2nd Lien 5.75% 8/3/20 | | | 2,095,000 | | | 2,159,683 |
| RPI Finance Trust Tranche B 3.50% 5/10/18 | | | 1,139,778 | | | 1,148,327 |
| Samson Investment 2nd Lien 6.00% 9/10/18 | | | 2,053,000 | | | 2,079,946 |
| Scientific Games International Tranche 4.25% 5/22/20 | | | 2,240,000 | | | 2,237,200 |
| Seminole Tribe of Florida Tranche B 3.00% 4/11/20 | | | 982,500 | | | 987,208 |
| Sensus USA 2nd Lien 8.50% 4/13/18 | | | 565,000 | | | 552,288 |
| Seven Seas Cruises 1st Lien 4.75% 12/21/18 | | | 922,810 | | | 930,885 |
| Smart & Final | | | | | | |
| 2nd Lien 10.50% 11/8/20 | | | 1,102,051 | | | 1,128,225 |
| Tranche B 1st Lien 4.50% 11/15/19 | | | 2,322,125 | | | 2,328,656 |
| Sophia Tranche B 1st Lien 4.50% 11/29/18 | | | 221,812 | | | 224,214 |
| Sprouts Farmers 4.50% 4/12/20 | | | 1,380,000 | | | 1,383,450 |
| State Class Tankers II 1st Lien 6.75% 6/10/20 | | | 900,000 | | | 909,000 |
| Sungard Data Systems 1st Lien 4.50% 12/4/19 | | | 79,600 | | | 80,728 |
| Supervalu 5.00% 3/21/19 | | | 673,178 | | | 680,583 |
| Surgery Center Holdings | | | | | | |
| 6.00% 3/18/19 | | | 442,775 | | | 445,255 |
| 2nd Lien 9.75% 3/18/20 | | | 180,000 | | | 180,450 |
| Surgical Care Affiliates Tranche B 5.50% 5/26/18 | | | 145,000 | | | 145,408 |
| Swift Transportation Tranche B2 1st Lien | | | | | | |
| 4.00% 12/21/17 | | | 200,742 | | | 202,875 |
| Taminco Global Chemical Tranche B 4.25% 2/15/19 | | | 64,004 | | | 64,724 |
| Topaz Power Holdings 5.25% 2/4/20 | | | 547,250 | | | 552,380 |
| Toys R Us Property Tranche B 6.00% 9/1/16 | | | 600,000 | | | 594,000 |
| Transdigm Tranche C 3.75% 2/7/20 | | | 1,870,000 | | | 1,884,150 |
| Truven Health Analytics Tranche B 4.50% 5/23/19 | | | 306,906 | | | 309,208 |
30
| | | Principal amount° | | Value (U.S. $) |
| «Senior Secured Loans (continued) | | | | | | |
| United Airlines Tranche B 1st Lien 4.00% 3/12/19 | USD | | 379,050 | | $ | 383,077 |
| Univision Communications | | | | | | |
| 1st Lien 4.00% 3/1/20 | | | 1,009,350 | | | 1,007,547 |
| | Tranche C1 1st Lien 4.50% 2/22/20 | | | 372,914 | | | 375,448 |
| Tranche C2 4.50% 2/6/20 | | | 1,172,063 | | | 1,178,865 |
| US Air | | | | | | |
| Tranche B1 1st Lien 4.25% 5/21/19 | | | 1,240,000 | | | 1,242,015 |
| Tranche B2 1st Lien 3.50% 11/21/16 | | | 152,000 | | | 152,808 |
| USI Insurance Services Tranche B 5.25% 12/14/19 | | | 696,500 | | | 703,378 |
| Valeant Pharmaceuticals Tranche B 4.50% 5/30/20 | | | 2,065,000 | | | 2,095,201 |
| Visant 5.25% 12/22/16 | | | 287,691 | | | 282,153 |
| Warner Chilcott | | | | | | |
| Tranche B1 4.25% 3/15/18 | | | 232,875 | | | 233,486 |
| Tranche B1 - New 4.25% 3/15/18 | | | 101,376 | | | 101,642 |
| Tranche B2 4.25% 3/15/18 | | | 14,251 | | | 14,288 |
| Tranche B3 4.25% 3/15/18 | | | 183,510 | | | 183,991 |
| Wide Open West Finance 4.75% 3/27/19 | | | 1,588,174 | | | 1,608,523 |
| Windstream Tranche B3 4.00% 8/23/19 | | | 891,000 | | | 898,611 |
| Yankee Cable Acquisition 5.25% 2/13/20 | | | 284,609 | | | 287,189 |
| Yankee Candle 5.25% 3/2/19 | | | 144,414 | | | 145,858 |
| Zayo Group Tranche B 1st Lien 4.50% 7/2/19 | | | 724,511 | | | 731,643 |
| Total Senior Secured Loans (cost $135,644,218) | | | | | | 136,075,737 |
| |
| Sovereign Bonds – 0.54% | | | | | | |
| Australia – 0.03% | | | | | | |
| Australia Government Inflation-Linked Bond | | | | | | |
| 4.00% 8/20/20 | AUD | | 82,000 | | | 135,886 |
| | | | | | | 135,886 |
| Brazil – 0.15% | | | | | | |
| Brazil Notas do Tesouro Nacional Series B | | | | | | |
| 6.00% 5/15/15 | BRL | | 36,000 | | | 379,789 |
| 6.00% 8/15/20 | | | 250 | | | 273,619 |
| | | | | | | 653,408 |
| Colombia – 0.06% | | | | | | |
| • | Colombia Government International Bond | | | | | | |
| 2.074% 11/16/15 | USD | | 240,000 | | | 238,920 |
| | | | | | | 238,920 |
31
Statement of net assets
Delaware Diversified Floating Rate Fund
| | | Principal amount° | | Value (U.S. $) |
| Sovereign Bonds (continued) | | | | | | |
| Mexico – 0.05% | | | | | | |
| Mexican Bonos 7.75% 5/29/31 | MXN | | 2,258,000 | | $ | 192,900 |
| | | | | | | 192,900 |
| Norway – 0.12% | | | | | | |
| #• | Kommunalbanken 144A 0.454% 2/20/18 | USD | | 500,000 | | | 499,890 |
| | | | | | | 499,890 |
| Sri Lanka – 0.05% | | | | | | |
| # | Sri Lanka Government International Bond 144A | | | | | | |
| 5.875% 7/25/22 | | | 200,000 | | | 194,000 |
| | | | | | | 194,000 |
| Sweden – 0.08% | | | | | | |
| • | Svensk Exportkredit 0.565% 1/23/17 | | | 340,000 | | | 341,253 |
| | | | | | | 341,253 |
| Total Sovereign Bonds (cost $2,442,231) | | | | | | 2,256,257 |
| |
| Supranational Bank – 0.21% | | | | | | |
| #• | International Finance Facility For Immunisation | | | | | | |
| 0.463% 7/5/16 | | | 860,000 | | | 860,319 |
| Total Supranational Banks (cost $860,000) | | | | | | 860,319 |
| |
| U.S. Treasury Obligation – 0.06% | | | | | | |
| U.S. Treasury Note 1.75% 5/15/23 | | | 285,000 | | | 264,360 |
| Total U.S. Treasury Obligation (cost $264,048) | | | | | | 264,360 |
| | | | | |
| | Number of shares | | | |
| Convertible Preferred Stock – 0.02% | | | | | | |
| Intelsat 5.75% exercise price $22.05, | | | | | | |
| expiration date 5/1/16 | | | 1,700 | | | 100,351 |
| Total Convertible Preferred Stock (cost $99,955) | | | | | | 100,351 |
32
| | | Number of shares | | Value (U.S. $) |
| Preferred Stock – 0.29% | | | | | | |
| | CoBank 6.125% | | | 6,350 | | $ | 633,810 |
| National Retail Properties 5.70% | | | 7,525 | | | 167,130 |
| Public Storage 5.20% | | | 3,200 | | | 69,728 |
| Qwest Corp 6.125% | | | 9,000 | | | 202,860 |
| US Bancorp 5.15% | | | 6,000 | | | 139,980 |
| Total Preferred Stock (cost $1,278,125) | | | | | | 1,213,508 |
| |
| | Principal amount° | | | |
| Short-Term Investments – 8.43% | | | | | | |
| ≠Discounted Commercial Paper – 0.12% | | | | | | |
| JP Morgan Chase & Company 0.302% 9/3/13 | USD | | 500,000 | | | 500,067 |
| | | | | | | 500,067 |
| ≠Discount Notes – 2.92% | | | | | | |
| Federal Home Loan Bank | | | | | | |
| 0.045% 10/18/13 | | | 2,550,267 | | | 2,550,158 |
| 0.045% 10/23/13 | | | 4,376,263 | | | 4,376,061 |
| 0.055% 8/12/13 | | | 1,929,167 | | | 1,929,161 |
| 0.06% 8/14/13 | | | 3,342,509 | | | 3,342,496 |
| | | | | | | 12,197,876 |
| Repurchase Agreements – 4.82% | | | | | | |
| Bank of America 0.03%, dated 7/31/13, to be | | | | | | |
| repurchased on 8/1/13, repurchase price | | | | | | |
| $8,254,143 (collateralized by U.S. government | | | | | | |
| obligations 0.75%-2.375% 2/28/15-10/31/17; | | | | | | |
| market value $8,419,219) | | | 8,254,136 | | | 8,254,136 |
| BNP Paribas 0.05%, dated 7/31/13, to be | | | | | | |
| repurchased on 8/1/13, repurchase price | | | | | | |
| $11,860,880 (collateralized by U.S. government | | | | | | |
| obligations 0.25%-4.25% 6/30/14-5/15/23; | | | | | | |
| market value $12,115,694) | | | 11,860,864 | | | 11,860,864 |
| | | | | | | 20,115,000 |
| ≠U.S. Treasury Obligation – 0.57% | | | | | | |
| United States Treasury Bill 0.0275% 10/24/13 | | | 2,390,489 | | | 2,390,351 |
| | | | | | | 2,390,351 |
| Total Short-Term Investments (cost $35,202,735) | | | | | | 35,203,294 |
33
Statement of net assets
Delaware Diversified Floating Rate Fund
| | | | | | |
| Total Value of Securities – 106.23% | | | | |
| (cost $443,888,245) | | $ | 443,580,224 | |
| «Liabilities Net of Receivables | | | | |
| and Other Assets – (6.23%) | | | (26,025,291 | ) |
| Net Assets Applicable to 48,570,688 | | | | |
| Shares Outstanding – 100.00% | | $ | 417,554,933 | |
| |
| Net Asset Value – Delaware Diversified Floating Rate Fund | | | | |
| Class A ($194,794,940 / 22,654,932 Shares) | | | | $8.60 | |
| Net Asset Value – Delaware Diversified Floating Rate Fund | | | | |
| Class C ($83,618,985 / 9,728,296 Shares) | | | | $8.60 | |
| Net Asset Value – Delaware Diversified Floating Rate Fund | | | | |
| Class R ($44,325 / 5,157 Shares) | | | | $8.60 | |
| Net Asset Value – Delaware Diversified Floating Rate Fund | | | | |
| Institutional Class ($139,096,683 / 16,182,303 Shares) | | | | $8.60 | |
| |
| Components of Net Assets at July 31, 2013: | | | | |
| Shares of beneficial interest (unlimited authorization – no par) | | $ | 418,581,747 | |
| Undistributed net investment income | | | 240,741 | |
| Accumulated net realized loss on investments | | | (577,426 | ) |
| Net unrealized depreciation of investments and derivatives | | | (690,129 | ) |
| Total net assets | | $ | 417,554,933 | |
| ° | Principal amount shown is stated in the currency in which each security is denominated. |
| • | Variable rate security. The rate shown is the rate as of July 31, 2013. Interest rates reset periodically. |
| # | Security exempt from registration under Rule 144A of the Securities Act of 1933, as amended. At July 31, 2013, the aggregate value of Rule 144A securities was $89,492,858, which represented 21.43% of the Fund’s net assets. See Note 10 in “Notes to financial statements.” |
| Φ | Step coupon bond. Coupon increases or decreases periodically based on a predetermenied schedule. Stated rate in effect at July 31, 2013. |
| « | Senior Secured Loans generally pay interest at rates which are periodically redetermined by reference to a base lending rate plus a premium. These base lending rates are generally: (i) the prime rate offered by one or more United States banks, (ii) the lending rate offered by one or more European banks such as the London Inter-Bank Offered Rate (LIBOR), and (iii) the certificate of deposit rate. Senior Secured Loans may be subject to restrictions on resale. Stated rate in effect at July 31, 2013. |
34
| | |
| Δ | Securities have been classified by country of origin. |
| ≠ | The rate shown is the effective yield at time of purchase. |
| « | Of this amount, $34,239,744 represents payable for securities purchased, $1,019 represents Trustees’ fees payable and includes $2,259,710 cash collateral for derivatives. |
| Net Asset Value and Offering Price Per Share – | | | |
| Delaware Diversified Floating Rate Fund | | | |
| Net asset value Class A (A) | | $ | 8.60 |
| Sales charge (2.75% of offering price) (B) | | | 0.24 |
| Offering price | | $ | 8.84 |
| (A) | | Net asset value per share, as illustrated, is the amount which would be paid upon redemption or repurchase of shares. |
| (B) | | See the current prospectus for purchase of $100,000 or more. |
The following foreign currency exchange contracts and swap contracts were outstanding at July 31, 2013:1
Foreign Currency Exchange Contracts
| | | | | | | | | | | | | Unrealized |
| | | | | | | | | | | | | Appreciation |
| Counterparty | | | Contracts to Receive (Deliver) | | In Exchange For | | Settlement Date | | (Depreciation) |
| BAML | | | AUD | 471,947 | | | USD | (427,451 | ) | | 8/23/13 | | | $ | (3,883 | ) | |
| BAML | | | EUR | (149,437 | ) | | USD | 195,041 | | | 8/23/13 | | | | (3,748 | ) | |
| HSBC | | | BRL | (1,796,923 | ) | | USD | 787,158 | | | 8/23/13 | | | | 2,659 | | |
| HSBC | | | EUR | 48,310 | | | USD | (63,044 | ) | | 8/23/13 | | | | 1,220 | | |
| JPMC | | | EUR | (195,152 | ) | | USD | 254,617 | | | 8/23/13 | | | | (4,985 | ) | |
| JPMC | | | IDR | 7,104,048,823 | | | USD | (695,112 | ) | | 8/23/13 | | | | (11,412 | ) | |
| MSC | | | AUD | (893,847 | ) | | USD | 808,646 | | | 8/23/13 | | | | 6,425 | | |
| TD | | | GBP | 1,043 | | | USD | (1,573 | ) | | 8/23/13 | | | | 13 | | |
| TD | | | ZAR | 4,081,166 | | | USD | (409,914 | ) | | 8/23/13 | | | | 2,334 | | |
| | | | | | | | | | | | | | $ | (11,377 | ) | |
35
Statement of net assets
Delaware Diversified Floating Rate Fund
| |
| Swap Contracts |
| CDS Contracts2 |
| | | | | | | | | | | Unrealized |
| | | | | | | Annual Protection | | Termination | | Appreciation |
| Counterparty | | Swap Referenced Obligation | | Notional Value | | Payments | | Date | | (Depreciation) |
| | Protection Purchased: | | | | | | | | | | | | | |
| BAML | | CDX.NA.HY.20 | | USD | 470,000 | | 5.00% | | 6/20/18 | | | $ | (13,634 | ) | |
| CITI | | CDX.NA.HY.20 | | | 660,000 | | 5.00% | | 6/20/18 | | | | (8,322 | ) | |
| DB | | CDX.EM.19-V1 | | | 1,940,000 | | 5.00% | | 6/20/18 | | | | (11,127 | ) | |
| JPMC | | CDX.NA.HY.20 | | | 1,675,000 | | 5.00% | | 6/20/18 | | | | (30,567 | ) | |
| JPMC | | CDX.NA.IG.20 | | | 5,000,000 | | 1.00% | | 6/20/18 | | | | (37,419 | ) | |
| JPMC | | ITRAXX Europe | | | | | | | | | | | | | |
| | Crossover S19 V1 | | EUR | 3,660,000 | | 5.00% | | 6/20/18 | | | | (197,499 | ) | |
| | | | | | | | | | | | $ | (298,568 | ) | |
Interest Rate Swap Contracts3
| | | | | Fixed | | Floating | | | | | | | | | | |
| | | | | Interest Rate | | Interest Rate | | | | | | Unrealized |
| Counterparty & | | | | | Received | | Received | | Termination | | Appreciation |
| Referenced Obligation | | Notional Value | | (Paid) | | (Paid) | | Date | | (Depreciation) |
| CME | | | | | | | | | | | | | | | | | | | | | |
| 10yr | | USD | 25,600,000 | | | (2.88%) | | | | 0.269% | | | | 7/11/23 | | | | $ | (259,726 | ) | |
| CME | | | | | | | | | | | | | | | | | | | | | |
| 5yr | | | 24,300,000 | | | (1.677%) | | | | 0.269% | | | | 7/11/18 | | | | | (160,269 | ) | |
| JPMC | | | | | | | | | | | | | | | | | | | | | |
| 7yr | | | 9,500,000 | | | (1.40%) | | | | 0.283% | | | | 3/6/20 | | | | | 413,383 | | |
| LCH | | | | | | | | | | | | | | | | | | | | | |
| 5yr | | | 3,300,000 | | | (1.214%) | | | | 0.274% | | | | 6/10/18 | | | | | 46,777 | | |
| MSC | | | | | | | | | | | | | | | | | | | | | |
| 3yr | | | 17,300,000 | | | (0.488%) | | | | 0.28% | | | | 4/8/16 | | | | | 79,413 | | |
| | | | | | | | | | | | | | | | | | $ | 119,578 | | |
The use of foreign currency exchange contracts and swap contracts involves elements of market risk and risks in excess of the amounts disclosed in the financial statements. The foreign currency exchange contracts and notional values presented above represent the Fund’s total exposure in such contracts, whereas only the net unrealized appreciation (depreciation) is reflected in the Fund’s net assets.
36
| |
1 See Note 8 in “Notes to Financial Statements.” 2 A CDS contract is a risk-transfer instrument through which one party (purchaser of protection) transfers to another party (seller of protection) the financial risk of a credit event (as defined in the CDS agreement), as it relates to a particular reference security or basket of securities (such as an index). Periodic payments (receipts) on such contracts are accrued daily and recorded as unrealized losses (gains) on swap contracts. Upon payment (receipt), such amounts are recorded as realized losses (gains) on swap contracts. Upfront payments made or received in connection with CDS contracts are amortized over the expected life of the CDS contracts as unrealized losses (gains) on swap contracts. The change in value of CDS contracts is recorded as unrealized appreciation or depreciation daily. A realized gain or loss is recorded upon a credit event (as defined in the CDS agreement) or the maturity or termination of the agreement. 3 An interest rate swap agreement is an exchange of interest rates between counterparties. Periodic payments on such contracts are accrued daily and recorded as unrealized appreciation/depreciation on swap contracts. Upon periodic payment (receipt) or termination of the contract, such amounts are recorded as realized gains (losses) on swap contracts. |
Summary of abbreviations:
ARM — Adjustable Rate Mortgage
AUD — Australian Dollar
BAML — Bank of America Merrill Lynch
BRL — Brazilian Real
CDS — Credit Default Swap
CDX.EM — Credit Default Swap Index Emerging Markets
CDX.NA — Credit Default Swap Index North America
CITI — Citigroup Global Markets
CLO — Collateralized Loan Obligation
CME — Chicago Mercantile Exchange Inc.
DB — Deutsche Bank
EUR — European Monetary Unit
GBP — British Pound Sterling
GSC — Goldman Sachs Capital
HSBC — Hong Kong Shanghai Bank
HY — High Yield
IDR — Indonesian Rupiah
IG — Investment Grade
JPMC — JPMorgan Chase Bank
LCH — LCH.Clearnet Limited
MSC — Morgan Stanley Capital
MXN — Mexican Peso
REMIC — Real Estate Mortgage Investment Conduit
TD — Toronto Dominion Bank
USD — United States Dollar
yr — Year
ZAR — South African Rand
See accompanying notes, which are an integral part of the financial statements.
37
| Statement of operations | |
| Delaware Diversified Floating Rate Fund | Year Ended July 31, 2013 |
| Investment Income: | | | | | | | |
| Interest | | $ | 5,754,599 | | | | |
| Dividends | | | 21,316 | | $ | 5,775,915 | |
| |
| Expenses: | | | | | | | |
| Management fees | | | 997,637 | | | | |
| Distribution expenses – Class A | | | 294,326 | | | | |
| Distribution expenses – Class C | | | 416,121 | | | | |
| Distribution expenses – Class R | | | 219 | | | | |
| Dividend disbursing and transfer agent fees and expenses | | | 189,071 | | | | |
| Registration fees | | | 124,912 | | | | |
| Accounting and administration expenses | | | 77,364 | | | | |
| Audit and tax | | | 42,204 | | | | |
| Reports and statements to shareholders | | | 22,577 | | | | |
| Pricing fees | | | 18,369 | | | | |
| Custodian fees | | | 13,430 | | | | |
| Legal fees | | | 12,389 | | | | |
| Dues and services | | | 9,026 | | | | |
| Trustees’ fees | | | 8,483 | | | | |
| Consulting fees | | | 3,011 | | | | |
| Insurance | | | 2,060 | | | | |
| Trustees’ expenses | | | 563 | | | 2,231,762 | |
| Less waived distribution expenses – Class A | | | | | | (49,054 | ) |
| Less waived distribution expenses – Class R | | | | | | (36 | ) |
| Less expense paid indirectly | | | | | | (85 | ) |
| Total operating expenses | | | | | | 2,182,587 | |
| Net Investment Income | | | | | | 3,593,328 | |
38
| Net Realized and Unrealized Gain (Loss) on: | | | | |
| Net realized gain (loss) on: | | | | |
| Investments | | $ | 685,763 | |
| Foreign currencies | | | (233,755 | ) |
| Foreign currency exchange contracts | | | (337,343 | ) |
| Futures | | | 1,416 | |
| Swap contracts | | | 1,437,231 | |
| Net realized gain | | | 1,553,312 | |
| Net change in unrealized appreciation (depreciation) of: | | | | |
| Investments | | | (1,855,438 | ) |
| Foreign currencies | | | 25,443 | |
| Foreign currency exchange contracts | | | (612 | ) |
| Swap contracts | | | (354,258 | ) |
| Net change in unrealized appreciation (depreciation) | | | (2,184,865 | ) |
| Net Realized and Unrealized Loss | | | (631,553 | ) |
| |
| Net Increase in Net Assets Resulting from Operations | | $ | 2,961,775 | |
See accompanying notes, which are an integral part of the financial statements.
39
Statements of changes in net assets
Delaware Diversified Floating Rate Fund
| | Year Ended |
| | 7/31/13 | | 7/31/12 |
| Increase (Decrease) in Net Assets from Operations: | | | | | | | | |
| Net investment income | | $ | 3,593,328 | | | $ | 2,207,907 | |
| Net realized gain (loss) | | | 1,553,312 | | | | (1,661,036 | ) |
| Net change in unrealized appreciation (depreciation) | | | (2,184,865 | ) | | | 1,193,514 | |
| Net increase in net assets resulting from operations | | | 2,961,775 | | | | 1,740,385 | |
| |
| Dividends and Distributions to Shareholders from: | | | | | | | | |
| Net investment income: | | | | | | | | |
| Class A | | | (1,643,562 | ) | | | (1,106,702 | ) |
| Class C | | | (457,494 | ) | | | (409,723 | ) |
| Class R | | | (546 | ) | | | (113 | ) |
| Institutional Class | | | (1,089,449 | ) | | | (851,211 | ) |
| |
| Return of Capital: | | | | | | | | |
| Class A | | | (440,615 | ) | | | — | |
| Class C | | | (122,647 | ) | | | — | |
| Class R | | | (147 | ) | | | — | |
| �� Institutional Class | | | (292,065 | ) | | | — | |
| | | (4,046,525 | ) | | | (2,367,749 | ) |
| |
| Capital Share Transactions: | | | | | | | | |
| Proceeds from shares sold: | | | | | | | | |
| Class A | | | 183,925,093 | | | | 23,434,152 | |
| Class C | | | 67,175,702 | | | | 7,295,036 | |
| Class R | | | 78,949 | | | | 2 | |
| Institutional Class | | | 138,264,710 | | | | 20,310,142 | |
|
| Net asset value of shares issued upon reinvestment | | | | | | | | |
| of dividends and distributions: | | | | | | | | |
| Class A | | | 1,942,197 | | | | 889,834 | |
| Class C | | | 535,851 | | | | 353,972 | |
| Class R | | | 654 | | | | 111 | |
| Institutional Class | | | 1,083,134 | | | | 682,685 | |
| | | 393,006,290 | | | | 52,965,934 | |
40
| | Year Ended |
| | 7/31/13 | | 7/31/12 |
| Capital Share Transactions (continued): | | | | | | | | |
| Cost of shares redeemed: | | | | | | | | |
| Class A | | $ | (39,472,373 | ) | | $ | (30,091,377 | ) |
| Class C | | | (9,438,687 | ) | | | (7,818,971 | ) |
| Class R | | | (40,069 | ) | | | (2 | ) |
| Institutional Class | | | (31,587,070 | ) | | | (22,470,194 | ) |
| | | (80,538,199 | ) | | | (60,380,544 | ) |
| Increase (decrease) in net assets | | | | | | | | |
| derived from capital share transactions | | | 312,468,091 | | | | (7,414,610 | ) |
| Net Increase (Decrease) in Net Assets | | | 311,383,341 | | | | (8,041,974 | ) |
| |
| Net Assets: | | | | | | | | |
| Beginning of year | | | 106,171,592 | | | | 114,213,566 | |
| End of year (including undistributed (distributions in | | | | | | | | |
| excess of) net investment income of $240,741 and | | | | | | | | |
| $(179,774), respectively) | | $ | 417,554,933 | | | $ | 106,171,592 | |
See accompanying notes, which are an integral part of the financial statements.
41
Financial highlights
Delaware Diversified Floating Rate Fund Class A
Selected data for each share of the Fund outstanding throughout each period was as follows:
| Net asset value, beginning of period |
| |
| Income (loss) from investment operations: |
| Net investment income2 |
| Net realized and unrealized gain (loss) |
| Total from investment operations |
| |
| Less dividends and distributions from: |
| Net investment income |
| Return of capital |
| Total dividends and distributions |
| |
| Net asset value, end of period |
| |
| Total return3 |
| |
| Ratios and supplemental data: |
| Net assets, end of period (000 omitted) |
| Ratio of expenses to average net assets |
| Ratio of expenses to average net assets |
| prior to fees waived |
| Ratio of net investment income to average net assets |
| Ratio of net investment income (loss) to average net assets |
| prior to fees waived |
| Portfolio turnover |
1 Date of commencement of operations; ratios have been annualized and total return and portfolio turnover have not been annualized. 2 The average shares outstanding method has been applied for per share information. 3 Total investment return is based on the change in net asset value of a share during the period and assumes reinvestment of dividends and distributions at net asset value and does not reflect the impact of a sales charge. Total investment return during all of the periods reflects waivers by the manager and/or the distributor. Performance would have been lower had the waivers not been in effect. |
See accompanying notes, which are an integral part of the financial statements.
42
| Year Ended | | 2/26/101 to | |
| 7/31/13 | | 7/31/12 | | 7/31/11 | | 7/31/10 | |
| $8.570 | | | $8.590 | | | $8.490 | | | $8.500 | | |
| | |
| | |
| 0.163 | | | 0.193 | | | 0.166 | | | 0.088 | | |
| 0.060 | | | (0.005 | ) | | 0.114 | | | (0.014 | ) | |
| 0.223 | | | 0.188 | | | 0.280 | | | 0.074 | | |
| | |
| | |
| (0.175 | ) | | (0.208 | ) | | (0.180 | ) | | (0.084 | ) | |
| (0.018 | ) | | — | | | — | | | — | | |
| (0.193 | ) | | (0.208 | ) | | (0.180 | ) | | (0.084 | ) | |
| | |
| $8.600 | | | $8.570 | | | $8.590 | | | $8.490 | | |
| | |
| 2.61% | | | 2.24% | | | 3.33% | | | 0.87% | | |
| | |
| | |
| $194,795 | | | $49,009 | | | $55,209 | | | $2,959 | | |
| 1.01% | | | 1.05% | | | 1.05% | | | 1.04% | | |
| | |
| 1.06% | | | 1.12% | | | 1.34% | | | 4.92% | | |
| 1.88% | | | 2.28% | | | 1.92% | | | 2.43% | | |
| | |
| 1.83% | | | 2.21% | | | 1.63% | | | (1.45% | ) | |
| 112% | | | 97% | | | 75% | | | 39% | | |
43
Financial highlights
Delaware Diversified Floating Rate Fund Class C
Selected data for each share of the Fund outstanding throughout each period was as follows:
| Net asset value, beginning of period |
| |
| Income (loss) from investment operations: |
| Net investment income2 |
| Net realized and unrealized gain (loss) |
| Total from investment operations |
| |
| Less dividends and distributions from: |
| Net investment income |
| Return of capital |
| Total dividends and distributions |
| |
| Net asset value, end of period |
| |
| Total return3 |
| |
| Ratios and supplemental data: |
| Net assets, end of period (000 omitted) |
| Ratio of expenses to average net assets |
| Ratio of expenses to average net assets |
| prior to fees waived |
| Ratio of net investment income to average net assets |
| Ratio of net investment income (loss) to average net assets |
| prior to fees waived |
| Portfolio turnover |
1 Date of commencement of operations; ratios have been annualized and total return and portfolio turnover have not been annualized. 2 The average shares outstanding method has been applied for per share information. 3 Total investment return is based on the change in net asset value of a share during the period and assumes reinvestment of dividends and distributions at net asset value and does not reflect the impact of a sales charge. Total investment return during some of the periods reflects a waiver by the manager. Performance would have been lower had the waiver not been in effect. |
See accompanying notes, which are an integral part of the financial statements.
44
| Year Ended | | 2/26/101 to | |
| 7/31/13 | | 7/31/12 | | 7/31/11 | | 7/31/10 | |
| $8.570 | | | $8.590 | | | $8.490 | | | $8.500 | | |
| | |
| | |
| 0.098 | | | 0.130 | | | 0.102 | | | 0.062 | | |
| 0.060 | | | (0.006 | ) | | 0.116 | | | (0.014 | ) | |
| 0.158 | | | 0.124 | | | 0.218 | | | 0.048 | | |
| | |
| | |
| (0.110 | ) | | (0.144 | ) | | (0.118 | ) | | (0.058 | ) | |
| (0.018 | ) | | — | | | — | | | — | | |
| (0.128 | ) | | (0.144 | ) | | (0.118 | ) | | (0.058 | ) | |
| | |
| $8.600 | | | $8.570 | | | $8.590 | | | $8.490 | | |
| | |
| 1.85% | | | 1.47% | | | 2.58% | | | 0.56% | | |
| | |
| | |
| $83,619 | | | $25,495 | | | $25,769 | | | $1,714 | | |
| 1.76% | | | 1.80% | | | 1.80% | | | 1.79% | | |
| | |
| 1.76% | | | 1.82% | | | 2.04% | | | 5.62% | | |
| 1.13% | | | 1.53% | | | 1.17% | | | 1.68% | | |
| | |
| 1.13% | | | 1.51% | | | 0.93% | | | (2.15% | ) | |
| 112% | | | 97% | | | 75% | | | 39% | | |
45
Financial highlights
Delaware Diversified Floating Rate Fund Class R
Selected data for each share of the Fund outstanding throughout each period was as follows:
| Net asset value, beginning of period |
| |
| Income (loss) from investment operations: |
| Net investment income2 |
| Net realized and unrealized gain (loss) |
| Total from investment operations |
| |
| Less dividends and distributions from: |
| Net investment income |
| Return of capital |
| Total dividends and distributions |
| |
| Net asset value, end of period |
| |
| Total return4 |
| |
| Ratios and supplemental data: |
| Net assets, end of period (000 omitted) |
| Ratio of expenses to average net assets |
| Ratio of expenses to average net assets |
| prior to fees waived |
| Ratio of net investment income to average net assets |
| Ratio of net investment income (loss) to average net assets |
| prior to fees waived |
| Portfolio turnover |
1 Date of commencement of operations; ratios have been annualized and total return and portfolio turnover have not been annualized. 2 The average shares outstanding method has been applied for per share information. 3 Includes adjustments from the period ending July 31, 2010 in the amount of $9 (or $0.010 per share) which impacted total return by -0.12%. The adjustment is to correct a mis-allocation of distributions among share classes which had no impact on distribution amounts reported and paid to shareholders. |
See accompanying notes, which are an integral part of the financial statements. 46
| | Year Ended | | 2/26/101 to | |
| | 7/31/13 | | 7/31/12 | | 7/31/11 | | 7/31/10 | |
| | $8.570 | | | $8.590 | | | $8.500 | | | $8.500 | | |
| | |
| | |
| | 0.141 | | | 0.173 | | | 0.145 | | | 0.079 | | |
| | 0.060 | | | (0.011 | ) | | 0.106 | 3 | | (0.004 | ) | |
| | 0.201 | | | 0.162 | | | 0.251 | 3 | | 0.075 | | |
| | |
| | |
| | (0.153 | ) | | (0.182 | ) | | (0.161 | ) | | (0.075 | ) | |
| | (0.018 | ) | | — | | | — | | | — | | |
| | | (0.171 | ) | | (0.182 | ) | | (0.161 | ) | | (0.075 | ) | |
| | |
| | $8.600 | | | $8.570 | | | $8.590 | 3 | | $8.500 | | |
| | |
| | 2.36% | | | 1.93% | | | 2.96% | | | 0.89% | | |
| | |
| | |
| | $44 | | | $5 | | | $5 | | | $5 | | |
| | 1.26% | | | 1.30% | | | 1.30% | | | 1.29% | | |
| | |
| | 1.36% | | | 1.42% | | | 1.64% | | | 5.22% | | |
| | 1.63% | | | 2.03% | | | 1.67% | | | 2.18% | | |
| | |
| | 1.53% | | | 1.91% | | | 1.33% | | | (1.75% | ) | |
| | 112% | | | 97% | | | 75% | | | 39% | | |
4 Total investment return is based on the change in net asset value of a share during the period and assumes reinvestment of dividends and distributions at net asset value. Total investment return during all of the periods reflects a waiver by the manager and/or the distributor. Performance would have been lower had the waivers not been in effect.
47
Financial highlights
Delaware Diversified Floating Rate Fund Institutional Class
Selected data for each share of the Fund outstanding throughout each period was as follows:
| Net asset value, beginning of period |
| |
| Income (loss) from investment operations: |
| Net investment income2 |
| Net realized and unrealized gain (loss) |
| Total from investment operations |
| |
| Less dividends and distributions from: |
| Net investment income |
| Return of capital |
| Total dividends and distributions |
| |
| Net asset value, end of period |
| |
| Total return3 |
| |
| Ratios and supplemental data: |
| Net assets, end of period (000 omitted) |
| Ratio of expenses to average net assets |
| Ratio of expenses to average net assets |
| prior to fees waived |
| Ratio of net investment income to average net assets |
| Ratio of net investment income (loss) to average net assets |
| prior to fees waived |
| Portfolio turnover |
1 Date of commencement of operations; ratios have been annualized and total return and portfolio turnover have not been annualized.
2 The average shares outstanding method has been applied for per share information.
3 Total investment return is based on the change in net asset value of a share during the period and assumes reinvestment of dividends and distributions at net asset value. Total investment return during some of the periods reflects a waiver by the manager. Performance would have been lower had the waiver not been in effect.
See accompanying notes, which are an integral part of the financial statements.
48
| | Year Ended | | 2/26/101 to | |
| | 7/31/13 | | 7/31/12 | | 7/31/11 | | 7/31/10 | |
| | $8.570 | | | $8.590 | | | $8.490 | | | $8.500 | | |
| | |
| | |
| | 0.184 | | | 0.214 | | | 0.187 | | | 0.098 | | |
| | 0.061 | | | (0.005 | ) | | 0.117 | | | (0.016 | ) | |
| | 0.245 | | | 0.209 | | | 0.304 | | | 0.082 | | |
| | |
| | |
| | (0.197 | ) | | (0.229 | ) | | (0.204 | ) | | (0.092 | ) | |
| | (0.018 | ) | | — | | | — | | | — | | |
| | (0.215 | ) | | (0.229 | ) | | (0.204 | ) | | (0.092 | ) | |
| | |
| | $8.600 | | | $8.570 | | | $8.590 | | | $8.490 | | |
| | |
| | 2.87% | | | 2.49% | | | 3.61% | | | 0.97% | | |
| | |
| | |
| | $139,097 | | | $31,663 | | | $33,231 | | | $3,394 | | |
| | 0.76% | | | 0.80% | | | 0.80% | | | 0.79% | | |
| | |
| | 0.76% | | | 0.82% | | | 1.04% | | | 4.62% | | |
| | 2.13% | | | 2.53% | | | 2.17% | | | 2.68% | | |
| | |
| | 2.13% | | | 2.51% | | | 1.93% | | | (1.15% | ) | |
| | 112% | | | 97% | | | 75% | | | 39% | | |
49
Notes to financial statements
| Delaware Diversified Floating Rate Fund | July 31, 2013 |
Delaware Group® Income Funds (Trust) is organized as a Delaware statutory trust and offers five Series: Delaware Core Bond Fund, Delaware Corporate Bond Fund, Delaware Diversified Floating Rate Fund, Delaware Extended Duration Bond Fund and Delaware High-Yield Opportunities Fund. These financial statements and the related notes pertain to Delaware Diversified Floating Rate Fund (Fund). The Trust is an open-end investment company. The Fund is considered diversified under the Investment Company Act of 1940, as amended, and offers Class A, Class C, Class R and Institutional Class shares. Class A shares are sold with a maximum front-end sales charge of 2.75%. Class A share purchases of $1,000,000 or more will incur a contingent deferred sales charge (CDSC) of 0.75% if redeemed during the first year, provided that Delaware Distributors, L.P. (DDLP) paid a financial advisor a commission on the purchase of those shares. Class C shares are sold with a CDSC of 1.00%, if redeemed during the first twelve months. Class R and Institutional Class shares are not subject to a sales charge and are offered for sale exclusively to certain eligible investors.
The investment objective of the Fund is to seek total return.
1. Significant Accounting Policies
The following accounting policies are in accordance with U.S. generally accepted accounting principles (U.S. GAAP) and are consistently followed by the Fund.
Security Valuation — Equity securities, except those traded on the Nasdaq Stock Market, Inc. (Nasdaq), are valued at the last quoted sales price as of the time of the regular close of the New York Stock Exchange (NYSE) on the valuation date. Securities traded on the Nasdaq are valued in accordance with the Nasdaq Official Closing Price, which may not be the last sales price. If on a particular day an equity security does not trade, then the mean between the bid and ask prices will be used, which approximates fair value. Debt securities, credit default swap (CDS) contracts and interest rate swap contracts are valued based upon valuations provided by an independent pricing service or broker/counterparty and reviewed by management. To the extent current market prices are not available, the pricing service may take into account developments related to the specific security, as well as transactions in comparable securities. U.S. government securities are valued at the mean between the bid and ask prices, which approximates fair value. For asset-backed securities, collateralized mortgage obligations, commercial mortgage securities and U.S. government agency mortgage securities, pricing vendors utilize matrix pricing which considers prepayment speed, attributes of the collateral, yield or price of bonds of comparable quality, coupon, maturity and type as well as broker/dealer-supplied prices. Swap prices are derived using daily swap curves and models that incorporate a number of market data factors, such as discounted cash flows, trades and values of the underlying reference instruments. Foreign currency exchange contracts and foreign cross currency exchange contracts are valued at the mean between the bid and ask prices, which approximates fair value. Interpolated values are derived when the settlement date of the contract is an interim date for which quotations are not available. Futures contracts and options on futures contracts are valued at the daily quoted settlement prices. Generally, other securities and assets for which market quotations are not readily available are valued at fair value as determined in good faith under the direction of
50
the Fund’s Board of Trustees (Board). In determining whether market quotations are readily available or fair valuation will be used, various factors will be taken into consideration, such as market closures or suspension of trading in a security.
Federal & Foreign Income Taxes — No provision for federal income taxes has been made as the Fund intends to continue to qualify for federal income tax purposes as a regulated investment company under Subchapter M of the Internal Revenue Code of 1986, as amended, and make the requisite distributions to shareholders. The Fund evaluates tax positions taken or expected to be taken in the course of preparing the Fund’s tax returns to determine whether the tax positions are “more-likely-than-not” of being sustained by the applicable tax authority. Tax positions not deemed to meet the “more-likely-than-not” threshold are recorded as a tax benefit or expense in the current year. Management has analyzed the Fund’s tax positions taken for all open federal income tax years (July 31, 2010-July 31, 2013), and has concluded that no provision for federal income tax is required in the Fund’s financial statements. In regard to foreign taxes only, the Fund has open tax years in certain foreign countries it invests in that may date back to the inception of the Fund.
Class Accounting — Investment income and common expenses are allocated to the various classes of the Fund on the basis of “settled shares” of each class in relation to the net assets of the Fund. Realized and unrealized gain (loss) on investments are allocated to the various classes of the Fund on the basis of daily net assets of each class. Distribution expenses relating to a specific class are charged directly to that class.
Repurchase Agreements — The Fund may purchase certain U.S. government securities subject to the counterparty’s agreement to repurchase them at an agreed upon date and price. The counterparty will be required on a daily basis to maintain the value of the collateral subject to the agreement at not less than the repurchase price (including accrued interest). The agreements are conditioned upon the collateral being deposited under the Federal Reserve book-entry system with the Fund’s custodian or a third-party sub-custodian. In the event of default or bankruptcy by the other party to the agreement, retention of the collateral may be subject to legal proceedings. All open repurchase agreements as of the date of this report were entered into on July 31, 2013.
Foreign Currency Transactions — Transactions denominated in foreign currencies are recorded at the prevailing exchange rates on the valuation date in accordance with the Fund’s prospectus. The value of all assets and liabilities denominated in foreign currencies is translated daily into U.S. dollars at the exchange rate of such currencies against the U.S. dollar. Transaction gains or losses resulting from changes in exchange rates during the reporting period or upon settlement of the foreign currency transaction are reported in operations for the current period. The Fund generally bifurcates that portion of realized gains and losses on investments in debt securities which is due to changes in foreign exchange rates from that which is due to changes in market prices of debt securities. That portion of gains (losses) is included in the statement of operations under the caption net realized gain (loss) on foreign currencies. The Fund reports certain foreign currency related transactions as components of realized gains (losses) for financial reporting purposes, whereas such components are treated as ordinary income (loss) for federal income tax purposes.
51
Notes to financial statements
Delaware Diversified Floating Rate Fund
1. Significant Accounting Policies (continued)
Use of Estimates — The preparation of financial statements in conformity with U.S. GAAP requires management to make estimates and assumptions that affect the fair value of investments, the reported amounts of assets and liabilities and disclosure of contingent assets and liabilities at the date of the financial statements and the reported amounts of revenues and expenses during the reporting period. Actual results could differ from those estimates and the differences could be material.
Other — Expenses directly attributable to the Fund are charged directly to the Fund. Other expenses common to various funds within the Delaware Investments® Family of Funds are generally allocated among such funds on the basis of average net assets. Management fees and some other expenses are paid monthly. Security transactions are recorded on the date the securities are purchased or sold (trade date) for financial reporting purposes. Costs used in calculating realized gains and losses on the sale of investment securities are those of the specific securities sold. Dividend income is recorded on the ex-dividend date and interest income is recorded on the accrual basis. Discounts and premiums on debt securities are amortized to interest income over the lives of the respective securities using the effective interest method. Realized gains (losses) on paydowns of mortgage- and asset-backed securities are classified as interest income. The Fund declares dividends daily from net investment income and pays the dividends monthly and declares and pays distributions from net realized gain on investments, if any, annually. The Fund may distribute more frequently, if necessary for tax purposes. Dividends and distributions, if any, are recorded on the ex-dividend date.
The Fund may receive earnings credits from its custodian when positive cash balances are maintained, which are used to offset custody fees. There were no earnings credits for the year ended July 31, 2013.
The Fund receives earnings credits from its transfer agent when positive cash balances are maintained, which are used to offset transfer agent fees. The expense paid under this arrangement is included in dividend disbursing and transfer agent fees and expenses on the statement of operations with the corresponding expense offset shown as “expense paid indirectly.” For the year ended July 31, 2013, the Fund earned $85 under this agreement.
| 2. | Investment Management, Administration Agreements and Other Transactions with Affiliates |
In accordance with the terms of its investment management agreement, the Fund pays Delaware Management Company (DMC), a series of Delaware Management Business Trust and the investment manager, an annual fee which is calculated daily at the rate of 0.50% on the first $500 million of average daily net assets of the Fund, 0.475% on the next $500 million, 0.45% on the next $1.5 billion, and 0.425% on average daily net assets in excess of $2.5 billion.
DMC has contractually agreed to waive that portion, if any, of its management fee and/or pay/reimburse the Fund to the extent necessary to ensure that total annual operating expenses (excluding any 12b-1 plan expenses, taxes, interest, inverse floater program expenses, short sale
52
and dividend interest expenses, brokerage fees, certain insurance costs, and nonroutine expenses or costs, including, but not limited to, those relating to reorganizations, litigation, conducting shareholder meetings, and liquidations (collectively, nonroutine expenses)), do not exceed 0.80% of average daily net assets of the Fund from Nov. 28, 2012 through Nov. 28, 2013. For purposes of this waiver and reimbursement, nonroutine expenses may also include such additional costs and expenses, as may be agreed upon from time to time by the Fund’s Board and DMC. This expense waiver and reimbursement applies only to expenses paid directly by the Fund and may only be terminated by agreement of DMC and the Fund.
Delaware Service Company, Inc. (DSC), an affiliate of DMC, provides fund accounting and financial administration oversight services to the Fund. For these services, the Fund pays DSC fees based on the aggregate daily net assets of the Delaware Investments® Family of Funds at the following annual rate: 0.0050% of the first $30 billion; 0.0045% of the next $10 billion; 0.0040% of the next $10 billion; and 0.0025% of aggregate average daily net assets in excess of $50 billion. The fees payable to DSC under the service agreement described above are allocated among all Funds in the Delaware Investments® Family of Funds on a relative net asset value basis. For the year ended July 31, 2013, the Fund was charged $9,672 for these services.
DSC is also the transfer agent and dividend disbursing agent of the Fund. The Fund pays DSC a monthly asset-based fee for these services. Pursuant to a sub-transfer agency agreement between DSC and BNY Mellon Investment Servicing (US) Inc. (BNYMIS), BNYMIS provides certain sub-transfer agency services to the Fund. Sub-transfer agency fees are passed on to and paid directly by the Fund.
Pursuant to a distribution agreement and distribution plan, the Fund pays DDLP, the distributor and an affiliate of DMC, an annual distribution and service fee of 0.30% of the average daily net assets of the Class A shares, 1.00% of the average daily net assets of the C shares and 0.60% of the average daily net assets of Class R shares. Institutional Class shares pay no distribution and service expenses. DDLP has contracted to limit the Class A and Class R shares’ 12b-1 fees for the Fund from Nov. 28, 2012 through Nov. 28, 2013 to no more than 0.25% and 0.50%, respectively, of the classes’ average daily net assets, respectively.
At July 31, 2013, the Fund had liabilities payable to affiliates as follows:
| Investment management fees payable to DMC | | $ | 165,485 |
| Dividend disbursing, transfer agent and fund accounting | | | |
| oversight fees and other expenses payable to DSC | | | 8,922 |
| Distribution fees payable to DDLP | | | 105,123 |
| Other expenses payable to DMC and affiliates* | | | 8,249 |
*DMC, as part of its administrative services, pays operating expenses on behalf of the Fund and is reimbursed on a periodic basis. Expenses include items such as printing of shareholder reports, legal and tax services, registration fees and trustees’ fees.
53
Notes to financial statements
Delaware Diversified Floating Rate Fund
| 2. | Investment Management, Administration Agreements and Other Transactions with Affiliates (continued) |
As provided in the investment management agreement, the Fund bears the cost of certain legal and tax services, including internal legal and tax services provided to the Fund by DMC and/or its affiliates’ employees. For the year ended July 31, 2013, the Fund was charged $5,741 for internal legal and tax services provided by DMC and/or its affiliates’ employees.
For the year ended July 31, 2013, DDLP earned $29,672 for commissions on sales of the Fund’s Class A shares. For the year ended July 31, 2013, DDLP received gross CDSC commissions of $104 on redemptions of the Fund’s Class C shares and these commissions were entirely used to offset up-front commissions previously paid by DDLP to broker/dealers on sales of those shares.
Trustees’ fees include expenses accrued by the Fund for each Trustee’s retainer and meeting fees. Certain officers of DMC, DSC and DDLP are officers and/or Trustees of the Trust. These officers and Trustees are paid no compensation by the Fund.
3. Investments
For the year ended July 31, 2013, the Fund made purchases of $485,578,589 and sales of $184,332,599 of investment securities other than U.S. government securities and short-term investments. For the year ended July 31, 2013, the Fund made purchases of $16,543,566 and sales of $16,504,247 of long-term U.S. government securities.
At July 31, 2013, the cost of investments for federal income tax purposes was $444,583,672. At July 31, 2013, net unrealized depreciation was $1,003,448 of which $2,639,170 related to unrealized appreciation of investments and $3,642,618 related to unrealized depreciation of investments.
U.S. GAAP defines fair value as the price that the Fund would receive to sell an asset or pay to transfer a liability in an orderly transaction between market participants at the measurement date under current market conditions. A three-level hierarchy for fair value measurements has been established based upon the transparency of inputs to the valuation of an asset or liability. Inputs may be observable or unobservable and refer broadly to the assumptions that market participants would use in pricing the asset or liability. Observable inputs reflect the assumptions market participants would use in pricing the asset or liability based on market data obtained from sources independent of the reporting entity. Unobservable inputs reflect the reporting entity’s own assumptions about the assumptions that market participants would use in pricing the asset or liability developed based on the best information available under the circumstances. The Fund’s investment in its entirety is assigned a level based upon the observability of the inputs which are significant to the overall valuation. The three-level hierarchy of inputs is summarized below.
| Level 1 – | inputs are quoted prices in active markets for identical investments (e.g., equity securities, open-end investment companies, futures contracts, exchange-traded options contracts) |
| | |
| Level 2 – | other observable inputs (including, but not limited to: quoted prices for similar assets or liabilities in markets that are active, quoted prices for identical or similar assets or liabilities in markets that are not active, inputs other than quoted prices |
54
| that are observable for the assets or liabilities (such as interest rates, yield curves, volatilities, prepayment speeds, loss severities, credit risks and default rates) or other market-corroborated inputs) (e.g., debt securities, government securities, swap contracts, foreign currency exchange contracts, foreign securities utilizing international fair value pricing, broker-quoted securities, fair value securities) |
| | |
| Level 3 – | inputs are significant unobservable inputs (including the Fund’s own assumptions used to determine the fair value of investments) (e.g., broker-quoted securities, fair valued securities) |
Level 3 investments are valued using significant unobservable inputs. The Fund may also use an income-based valuation approach in which the anticipated future cash flows of the investment are discounted to calculate fair value. Discounts may also be applied due to the nature or duration of any restrictions on the disposition of the investments. Valuations may also be based upon current market prices of securities that are comparable in coupon, rating, maturity and industry. The derived value of a Level 3 investment may not represent the value which is received upon disposition and this could impact the results of operations.
The following table summarizes the valuation of the Fund’s investments by fair value hierarchy levels as of July 31, 2013:
| | Level 1 | | Level 2 | | Level 3 | | Total |
| Agency, Asset-Backed & | | | | | | | | | | | | | | |
| Mortgage-Backed Securities | | $ | — | | $ | 26,402,930 | | | $ | — | | $ | 26,402,930 | |
| Corporate Debt | | | — | | | 236,751,936 | | | | — | | | 236,751,936 | |
| Senior Secured Loans1 | | | — | | | 133,255,135 | | | | 2,820,602 | | | 136,075,737 | |
| Foreign Debt | | | — | | | 4,980,952 | | | | — | | | 4,980,952 | |
| Municipal Bonds | | | — | | | 2,587,156 | | | | — | | | 2,587,156 | |
| U.S. Treasury Obligation | | | — | | | 264,360 | | | | — | | | 264,360 | |
| Convertible Preferred Stock | | | 100,351 | | | — | | | | — | | | 100,351 | |
| Preferred Stock2 | | | 579,698 | | | 633,810 | | | | — | | | 1,213,508 | |
| Short-Term Investments | | | — | | | 35,203,294 | | | | — | | | 35,203,294 | |
| Total | | $ | 680,049 | | $ | 440,079,573 | | | $ | 2,820,602 | | $ | 443,580,224 | |
| |
| Foreign Currency | | | | | | | | | | | | | | |
| Exchange Contracts | | $ | — | | $ | (11,377 | ) | | $ | — | | $ | (11,377 | ) |
| Swap Contracts | | $ | — | | $ | (178,990 | ) | | $ | — | | $ | (178,990 | ) |
1Security type is valued across multiple levels. The amounts attributed to Level 2 investments and Level 3 investments represent 97.93% and 2.07% respectively, of the total market value of this security type. Level 2 investments represent investments with observable inputs while Level 3 investments represent investments without observable inputs.
2Security type is valued across multiple levels. The amounts attributed to Level 1 investments and Level 2 investments represent 47.77% and 52.23% respectively, of the total market value of this security type. Level 1 investments represent exchange traded investments while Level 2 investments represent matrix-priced investments.
55
Notes to financial statements
Delaware Diversified Floating Rate Fund
3. Investments (continued)
During the year ended July 31, 2013, there were no transfers between Level 1 investments, Level 2 investments or Level 3 investments that had a significant impact to the Fund. The Fund’s policy is to recognize transfers between levels at the beginning of the reporting period.
A reconciliation of Level 3 investments is presented when the Fund has a significant amount of Level 3 investments at the beginning, interim or end of the period in relation to net assets. Management has determined not to provide additional disclosure on Level 3 inputs under ASU No. 2011-04 since the Level 3 investments are not considered significant to the Fund’s net assets at the end of the period.
4. Dividend and Distribution Information
Income and long-term capital gain distributions are determined in accordance with federal income tax regulations, which may differ from U.S. GAAP. Additionally, distributions from net gains on foreign currency transactions and net short-term gains on sales of investment securities are treated as ordinary income for federal income tax purposes. The tax character of dividends and distributions paid during the years ended July 31, 2013 and 2012 was as follows:
| | Year | | Year |
| | Ended | | Ended |
| | 7/31/13 | | 7/31/12 |
| Ordinary income | | $ | 3,028,266 | | $ | 2,362,895 |
| Long-term capital gains | | | 162,785 | | | — |
| Return of capital | | | 855,474 | | | 4,854 |
| Total | | $ | 4,046,525 | | $ | 2,367,749 |
The Fund paid capital gains on foreign securities. These gains were designated as long-term capital gain distributions.
5. Components of Net Assets on a Tax Basis
As of July 31, 2013, the components of net assets on a tax basis were as follows:
| Shares of beneficial interest | | $ | 418,581,747 | |
| Distribution payable | | | (130,003 | ) |
| Unrealized depreciation | | | (896,811 | ) |
| Net assets | | $ | 417,554,933 | |
The differences between book basis and tax basis components of net assets are primarily attributable to tax deferral of losses on wash sales, tax treatment of distribution payable, mark-to-market of forward foreign currency contracts, tax treatment of CDS and interest rate swap contracts, tax treatment of contingent payment on debt instruments, tax deferral of losses on straddles and tax treatment of market discount and premium on debt instruments.
56
For financial reporting purposes, capital accounts are adjusted to reflect the tax character of permanent book/tax differences. Reclassifications are primarily due to tax treatment of gain (loss) on foreign currency transactions, dividends and distributions, market discount and premium on certain debt instruments, paydowns of mortgage- and asset-backed securities, and tax treatment of CDS and interest rate swap contracts. Results of operations and net assets were not affected by these reclassifications. For the year ended July 31, 2013, the Fund recorded the following reclassifications.
| Undistributed net investment income | $ | 18,238 | |
| Accumulated net realized loss | | 19,313 | |
| Paid-in capital | | (37,551 | ) |
For federal income tax purposes, capital loss carryforwards may be carried forward and applied against future capital gains. $1,470,341 was utilized for the year ended July 31, 2013.
6. Capital Shares
Transactions in capital shares were as follows:
| Year Ended |
| 7/31/13 | | 7/31/12 |
| Shares sold: | | | | | |
| Class A | 21,283,523 | | | 2,753,631 | |
| Class C | 7,783,697 | | | 858,373 | |
| Class R | 9,119 | | | — | * |
| Institutional Class | 16,019,956 | | | 2,398,471 | |
| |
| Shares issued upon reinvestment of dividends and distributions: | | | | | |
| Class A | 224,721 | | | 104,875 | |
| Class C | 62,028 | | | 41,749 | |
| Class R | 76 | | | 13 | |
| Institutional Class | 125,407 | | | 80,596 | |
| | 45,508,527 | | | 6,237,708 | |
| Shares redeemed: | | | | | |
| Class A | (4,572,137 | ) | | (3,563,888 | ) |
| Class C | (1,093,407 | ) | | (923,520 | ) |
| Class R | (4,659 | ) | | — | * |
| Institutional Class | (3,658,687 | ) | | (2,651,478 | ) |
| | (9,328,890 | ) | | (7,138,886 | ) |
| Net increase (decrease) | 36,179,637 | | | (901,178 | ) |
*Share rounds to less than 1.
57
Notes to financial statements
Delaware Diversified Floating Rate Fund
7. Line of Credit
The Fund, along with certain other funds in the Delaware Investments® Family of Funds (Participants), was a participant in a $125,000,000 revolving line of credit to be used for temporary or emergency purposes as an additional source of liquidity to fund redemptions of investor shares. Under the agreement, the Participants were charged an annual commitment fee, which was allocated across the Participants on the basis of each Participant’s allocation of the entire facility. The Participants were permitted to borrow up to a maximum of one third of their net assets under the agreement. Each Participant was individually, and not jointly, liable for its particular advances, if any, under the line of credit. The line of credit under the agreement expired on Nov. 13, 2012.
On Nov. 13, 2012, the Fund, along with the other Participants, entered into an amendment to the agreement for a $125,000,000 revolving line of credit. The line of credit is to be used as described above and operates in substantially the same manner as the original agreement. The line of credit available under the agreement expires on Nov. 12, 2013. The Fund had no amounts outstanding as of July 31, 2013 or at any time during the year then ended.
8. Derivatives
U.S. GAAP requires disclosures that enable investors to understand: 1) how and why an entity uses derivatives; 2) how they are accounted for; and 3) how they affect an entity’s results of operations and financial position.
Foreign Currency Exchange Contracts — The Fund may enter into foreign currency exchange contracts and foreign cross currency exchange contracts as a way of managing foreign exchange rate risk. The Fund may enter into these contracts to fix the U.S. dollar value of a security that it has agreed to buy or sell for the period between the date the trade was entered into and the date the security is delivered and paid for. The Fund may also use these contracts to hedge the U.S. dollar value of securities it already owns that are denominated in foreign currencies. The change in value is recorded as an unrealized gain or loss. When the contract is closed, a realized gain or loss is recorded equal to the difference between the value of the contract at the time it was opened and the value at the time it was closed.
The use of foreign currency exchange contracts and foreign cross currency exchange contracts does not eliminate fluctuations in the underlying prices of the securities, but does establish a rate of exchange that can be achieved in the future. Although foreign currency exchange contracts and foreign cross currency exchange contracts limit the risk of loss due to an unfavorable change in the value of the hedged currency, they also limit any potential gain that might result should the value of the currency change favorably. In addition, the Fund could be exposed to risks if the counterparties to the contracts are unable to meet the terms of their contracts. The Fund’s maximum risk of loss from counterparty credit risk is the value of its currency exchanged with the counterparty. The risk is generally mitigated by having a netting arrangement between the Fund and the counterparty and by the posting of collateral by the counterparty to the Fund to cover the Fund’s exposure to the counterparty.
58
Options Contracts — During the year ended July 31, 2013, the Fund entered into options contracts in the normal course of pursuing its investment objective. The Fund may buy or write options contracts for any number of reasons, including without limitation: to manage the Fund’s exposure to changes in securities prices and foreign currencies; as an efficient means of adjusting the Fund’s overall exposure to certain markets; to protect the value of portfolio securities; and as a cash management tool. The Fund may buy or write call or put options on securities, futures, swaps, “swaptions”, financial indices, and foreign currencies. When the Fund buys an option, a premium is paid and an asset is recorded and adjusted on a daily basis to reflect the current market value of the option purchased. When the Fund writes an option, a premium is received and a liability is recorded and adjusted on a daily basis to reflect the current market value of the option written. Premiums received from writing options that expire unexercised are treated by the Fund on the expiration date as realized gains. The difference between the premium received and the amount paid on effecting a closing purchase transaction, including brokerage commissions, is treated as realized gain or loss. If a call option is exercised, the premium is added to the proceeds from the sale of the underlying security in determining whether the Fund has a realized gain or loss. If a put option is exercised, the premium reduces the cost basis of the securities purchased by the Fund. The Fund, as writer of an option, bears the market risk of an unfavorable change in the price of the security underlying the written option. When writing options, the Fund is subject to minimal counterparty risk because the counterparty is only obligated to pay premiums and does not bear the market risk of an unfavorable market change. There were no transactions in options written during the year ended July 31, 2013.
Swap Contracts — The Fund enters into interest rate swap contracts and CDS contracts in the normal course of pursuing its investment objective. The Fund may use interest rate swaps to adjust the Fund’s sensitivity to interest rates or to hedge against changes in interest rates. The Fund may enter into CDS contracts in order to hedge against a credit event, to enhance total return or to gain exposure to certain securities or markets. The Fund will not be permitted to enter into any swap transactions unless, at the time of entering into such transactions, the unsecured long-term debt of the actual counterparty, combined with any credit enhancements, is rated at least BBB- by Standard & Poor’s (S&P) or Baa3 by Moody’s Investors Service (Moody’s) or is determined to be of equivalent credit quality by the Manager.
Interest Rate Swaps. An interest rate swap contract is an exchange of interest rates between counterparties. In one instance, an interest rate swap involves payments received by the Fund from another party based on a variable or floating interest rate, in return for making payments based on a fixed interest rate. An interest rate swap can also work in reverse with the Fund receiving payments based on a fixed interest rate and making payments based on a variable or floating interest rate. Interest rate swaps may be used to adjust the Fund’s sensitivity to interest rates or to hedge against changes in interest rates. Periodic payments on such contracts are accrued daily and recorded as unrealized appreciation/depreciation on swap contracts. Upon periodic payment/receipt or termination of the contract, such amounts are recorded as realized
59
Notes to financial statements
Delaware Diversified Floating Rate Fund
8. Derivatives (continued)
gains or losses on swap contracts. The Fund’s maximum risk of loss from counterparty credit risk is the discounted net value of the cash flows to be received from/paid to the counterparty over the interest rate swap contract’s remaining life, to the extent that the amount is positive. This risk is mitigated by (1) having a netting arrangement between the Fund and the counterparty and by the posting of collateral by the counterparty to the Fund to cover the Fund’s exposure to the counterparty for trades entered prior to June 10, 2013, and (2) trading these instruments through a central counterparty for trades entered on or after June 10, 2013.
Credit Default Swaps. A CDS contract is a risk-transfer instrument through which one party (purchaser of protection) transfers to another party (seller of protection) the financial risk of a credit event (as defined in the CDS agreement), as it relates to a particular reference security or basket of securities (such as an index). In exchange for the protection offered by the seller of protection, the purchaser of protection agrees to pay the seller of protection a periodic amount at a stated rate that is applied to the notional amount of the CDS contract. In addition, an upfront payment may be made or received by the Fund in connection with an unwinding or assignment of a CDS contract. Upon the occurrence of a credit event, the seller of protection would pay the par (or other agreed-upon) value of the reference security (or basket of securities) to the counterparty. Credit events generally include, among others, bankruptcy, failure to pay, and obligation default.
During the year ended July 31, 2013, the Fund entered into CDS contracts as a purchaser of protection. Periodic payments (receipts) on such contracts are accrued daily and recorded as unrealized losses (gains) on swap contracts. Upon payment (receipt), such amounts are recorded as realized losses (gains) on swap contracts. Upfront payments made or received in connection with CDS contracts are amortized over the expected life of the CDS contracts as unrealized losses (gains) on swap contracts. The change in value of CDS contracts is recorded as unrealized appreciation or depreciation daily. A realized gain or loss is recorded upon a credit event (as defined in the CDS agreement) or the maturity or termination of the agreement. For the year ended July 31, 2013, the Fund did not enter into any contracts as a seller of protection. For trades prior to June 10, 2013, the Fund had posted $20,000 in cash collateral for certain open derivatives. The Fund received $100,000 in securities collateral in return for open swap contracts. Initial margin and variation margin is posted to central counterparties for CDS basket trades submitted on or after June 10, 2013, as determined by the applicable central counterparty. The Fund had posted $2,239,710 as collateral for these derivatives.
60
CDS contracts may involve greater risks than if the Fund had invested in the reference obligation directly. CDS contracts are subject to general market risk, liquidity risk, counterparty risk and credit risk. The Fund’s maximum risk of loss from counterparty credit risk, either as the seller of protection or the buyer of protection, is the fair value of the contract. This risk is mitigated by (1) having a netting arrangement between the Fund and the counterparty and by the posting of collateral by the counterparty to the Fund to cover the Fund’s exposure to the counterparty for trades entered prior to June 10, 2013, and (2) trading these instruments through a central counterparty for trades entered on or after June 10, 2013.
Swaps Generally. The value of open swaps may differ from that which would be realized in the event the Fund terminated its position in the agreement. Risks of entering into these contracts include the potential inability of the counterparty to meet the terms of the contracts. This type of risk is generally limited to the amount of favorable movement in the value of the underlying security, instrument or basket of instruments, if any, at the day of default. Risks also arise from potential losses from adverse market movements and such losses could exceed the unrealized amounts shown on the statement of net assets.
Fair values of derivative instruments as of July 31, 2013 were as follows:
| | Asset Derivatives | | Liability Derivatives |
| | Statement of net | | | | | Statement of net | | | | |
| | assets location | | Fair value | | assets location | | Fair value |
Forward currency exchange contracts
(Foreign currency exchange contracts) | |
Liabilities net of receivables and other assets | | $ | 12,651 | | Liabilities net of receivables and other assets | | $ | (24,028 | ) |
Interest rate contracts
(Interest rate swap contracts) | |
Liabilities net of receivables and other assets | | | 539,573 | | Liabilities net of receivables and other assets | | | (419,995 | ) |
Credit contracts
(CDS contracts) | |
Liabilities net of receivables and other assets | | | — | | Liabilities net of receivables and other assets | | | (298,568 | ) |
| Total | | | | $ | 552,224 | | | | $ | (742,591 | ) |
61
Notes to financial statements
Delaware Diversified Floating Rate Fund
8. Derivatives (continued)
The effect of derivative instruments on the statement of operations for the year ended July 31, 2013 was as follows:
| | | | | | | | Change in unrealized |
| | | | Realized | | appreciation |
| | | | gain (loss) | | (depreciation) on |
| | Location of gain (loss) on | | on derivatives | | derivatives |
| | derivatives recognized in | | recognized in | | recognized in |
| | income | | income | | income |
Forward currency exchange contracts
(Foreign currency exchange contracts) | |
Net realized gain (loss) on foreign currency exchange contracts and net change in unrealized appreciation (depreciation) of foreign currency exchange contracts | | $ | (337,343 | ) | | | $ | (612 | ) |
Interest rate contracts
(Futures contracts and
interest rate swap contracts) | |
Net realized gain (loss) on futures contracts/net realized gain (loss) on swap contracts and net change in unrealized appreciation (depreciation) of futures contracts/net change in unrealized appreciation (depreciation) of swap contracts | | | 2,126,254 | | | | | 194,257 | |
Credit contracts
(CDS contracts) | |
Net realized gain (loss) on swap contracts and net change in unrealized appreciation (depreciation) of swap contracts | | | (687,607 | ) | | | | (548,515 | ) |
| Total | | | | $ | 1,101,304 | | | | $ | (354,870 | ) |
Derivatives Generally. The table below summarizes the average balance of derivative holdings by the Fund during the year ended July 31, 2013.
62
| Long | | Short |
| Derivative | | Derivative |
| Volume | | Volume |
| Foreign currency exchange contracts (average cost) | USD | 2,000,486 | | USD 1,603,546 |
| Futures contracts (average notional value) | | — | | 6,250 |
| Options contracts (average notional value) | | 381 | | — |
| CDS contracts (average notional value)* | | 3,370,960 | | — |
| | EUR | 1,480,456 | | — |
| Interest rate swap contracts (average notional value) | USD | 43,481,905 | | — |
*Long represents buying protection and short represents selling protection
9. Securities Lending
The Fund, along with other funds in the Delaware Investments® Family of Funds, may lend its securities pursuant to a security lending agreement (Lending Agreement) with The Bank of New York Mellon (BNY Mellon). At the time a security is loaned, the borrower must post collateral equal to the required percentage of the market value of the loaned security, including any accrued interest. The required percentage is: (i) 102% with respect to U.S. securities and foreign securities that are denominated and payable in U.S. dollars; and (ii) 105% with respect to foreign securities. With respect to each loan, if on any business day the aggregate market value of securities collateral plus cash collateral held is less than the aggregate market value of the securities which are the subject of such loan, the borrower will be notified to provide additional collateral by the end of the following business day which, together with the collateral already held, will be not less than the applicable initial collateral requirements for such security loan. If the aggregate market value of securities collateral and cash collateral held with respect to a security loan exceeds the applicable initial collateral requirement, upon the request of the borrower BNY Mellon must return enough collateral to the borrower by the end of the following business day to reduce the value of the remaining collateral to the applicable initial collateral requirement for such security loan. As a result of the foregoing, the value of the collateral held with respect to a loaned security may be temporarily more or less than the value of the security on loan.
Cash collateral received is generally invested in the Delaware Investments Collateral Fund No. 1 (the “Collective Trust”) established by BNY Mellon for the purpose of investment on behalf of funds managed by DMC that participate in BNY Mellon’s securities lending program. The Collective Trust may invest in U.S. government securities and high-quality corporate debt, asset-backed and other money market securities and in repurchase agreements collateralized by such securities, provided that the Collective Trust will generally have a dollar-weighted average portfolio maturity of 60 days or less. The Fund can also accept U.S. government securities and
63
Notes to financial statements
Delaware Diversified Floating Rate Fund
9. Securities Lending (continued)
letters of credit (non-cash collateral) in connection with securities loans. In the event of default or bankruptcy by the lending agent, realization and/or retention of the collateral may be subject to legal proceedings. In the event the borrower fails to return loaned securities and the collateral received is insufficient to cover the value of the loaned securities and provided such collateral shortfall is not the result of investment losses, the lending agent has agreed to pay the amount of the shortfall to the Fund or, at the discretion of the lending agent, replace the loaned securities. The Fund continues to record dividends or interest, as applicable, on the securities loaned and is subject to changes in value of the securities loaned that may occur during the term of the loan. The Fund has the right under the Lending Agreement to recover the securities from the borrower on demand. With respect to security loans collateralized by non-cash collateral, the Fund receives loan premiums paid by the borrower. With respect to security loans collateralized by cash collateral, the earnings from the collateral investments are shared among the Fund, the security lending agent and the borrower. The Fund records security lending income net of allocations to the security lending agent and the borrower.
The Collective Trust used for the investment of cash collateral received from borrowers of securities seeks to maintain a net asset value per unit of $1.00, but there can be no assurance that it will always be able to do so. The Fund may incur investment losses as a result of investing securities lending collateral in the Collective Trust. This could occur if an investment in the Collective Trust defaulted or if it were necessary to liquidate assets in the Collective Trust to meet returns on outstanding security loans at a time when the Collective Trust’s net asset value per unit was less than $1.00. Under those circumstances, the Fund may not receive an amount from the Collective Trust that is equal in amount to the collateral the Fund would be required to return to the borrower of the securities and the Fund would be required to make up for this shortfall. The Fund had no securities out on loan as of July 31, 2013.
10. Credit and Market Risk
The Fund invests a portion of its assets in high yield fixed income securities, which are securities rated lower than BBB- by S&P and Baa3 by Moody’s, or similarly rated by another nationally recognized statistical rating organization. Investments in these higher yielding securities are generally accompanied by a greater degree of credit risk than higher rated securities. Additionally, lower rated securities may be more susceptible to adverse economic and competitive industry conditions than investment grade securities.
The Fund invests in fixed income securities whose value is derived from an underlying pool of mortgages or consumer loans. The value of these securities is sensitive to changes in economic conditions, including delinquencies and/or defaults, and may be adversely affected by shifts in the market’s perception of the issuers and changes in interest rates. Investors receive principal and interest payments as the underlying mortgages and consumer loans are paid back. Some of these securities are collateralized mortgage obligations (CMOs). CMOs are debt securities issued by U.S. government agencies or by financial institutions and other mortgage lenders, which are collateralized by a pool of mortgages held under an indenture. Prepayment of mortgages may
64
shorten the stated maturity of the obligations and can result in a loss of premium, if any has been paid. Certain of these securities may be stripped (securities which provide only the principal or interest feature of the underlying security). The yield to maturity on an interest-only CMO is extremely sensitive not only to changes in prevailing interest rates, but also to the rate of principal payments (including prepayments) on the related underlying mortgage assets. A rapid rate of principal payments may have a material adverse affect on the Fund’s yield to maturity. If the underlying mortgage assets experience greater than anticipated prepayments of principal, the Fund may fail to fully recoup its initial investment in these securities even if the securities are rated in the highest rating categories.
The Fund invests in certain obligations that may have liquidity protection to ensure that the receipt of payments due on the underlying security is timely. Such protection may be provided through guarantees, insurance policies or letters of credit obtained by the issuer or sponsor through third parties, through various means of structuring the transaction or through a combination of such approaches. The Fund will not pay any additional fees for such credit support, although the existence of credit support may increase the price of the security.
The Fund may invest up to 15% of its net assets in illiquid securities, which may include securities with contractual restrictions on resale, securities exempt from registration under Rule 144A of the Securities Act of 1933, as amended, and other securities which may not be readily marketable. The relative illiquidity of these securities may impair the Fund from disposing of them in a timely manner and at a fair price when it is necessary or desirable to do so. While maintaining oversight, the Fund’s Board has delegated to DMC the day-to-day functions of determining whether individual securities are illiquid for purposes of the Fund’s limitation on investments in illiquid securities. Securities eligible for resale pursuant to Rule 144A, which are determined to be liquid, are not subject to the Fund’s 15% limit on investments in illiquid securities. As of July 31, 2013, no securities have been determined be illiquid under the Fund’s Liquidity Procedures. Rule 144A securities have been identified on the statement of net assets.
11. Contractual Obligations
The Fund enters into contracts in the normal course of business that contain a variety of indemnifications. The Fund’s maximum exposure under these arrangements is unknown. However, the Fund has not had prior claims or losses pursuant to these contracts. Management has reviewed the Fund’s existing contracts and expects the risk of loss to be remote.
12. Subsequent Events
Management has determined that no material events or transactions occurred subsequent to July 31, 2013 that would require recognition or disclosure in the Fund’s financial statements.
65
Report of independent
registered public accounting firm
To the Board of Trustees Delaware Group® Income Funds
and the Shareholders of Delaware Diversified Floating Rate Fund:
In our opinion, the accompanying statement of net assets and the related statements of operations and of changes in net assets and the financial highlights present fairly, in all material respects, the financial position of Delaware Diversified Floating Rate Fund (one of the series constituting Delaware Group Income Funds, hereinafter referred to as the “Fund”) at July 31, 2013, the results of its operations for the year then ended, the changes in its net assets for each of the two years in the period then ended and the financial highlights for each of the three years in the period then ended and for the period February 26, 2010 (commencement of operations) through July 31, 2010, in conformity with accounting principles generally accepted in the United States of America. These financial statements and financial highlights (hereafter referred to as “financial statements”) are the responsibility of the Fund’s management; our responsibility is to express an opinion on these financial statements based on our audits. We conducted our audits of these financial statements in accordance with the standards of the Public Company Accounting Oversight Board (United States). Those standards require that we plan and perform the audit to obtain reasonable assurance about whether the financial statements are free of material misstatement. An audit includes examining, on a test basis, evidence supporting the amounts and disclosures in the financial statements, assessing the accounting principles used and significant estimates made by management, and evaluating the overall financial statement presentation. We believe that our audits, which included confirmation of securities at July 31, 2013 by correspondence with the custodian and brokers, provide a reasonable basis for our opinion.
PricewaterhouseCoopers LLP
Philadelphia, Pennsylvania
September 20, 2013
66
Other Fund information
(Unaudited)
Delaware Diversified Floating Rate Fund
Tax Information
The information set forth below is for the Fund’s fiscal year as required by federal laws. Shareholders, however, must report distributions on a calendar year basis for income tax purposes, which may include distributions for portions of two fiscal years of a fund. Accordingly, the information needed by shareholders for income tax purposes will be sent to them in January of each year. Please consult your tax advisor for proper treatment of this information.
All designations are based on financial information available as of the date of this annual report and, accordingly are subject to change. For any and all items requiring designation, it is the intention of the Fund to designate the maximum amount permitted under the Internal Revenue Code and the regulations thereunder.
For the fiscal year ended July 31, 2013, the Fund designates distributions paid during the year as follows:
| (A) Long-Term Capital Gain Distributions (Tax Basis) | 4.02 | % |
| (B) Ordinary Income Distribution (Tax Basis) | 74.84 | % |
| (C) Return of Capital (Tax Basis) | 21.14 | % |
| Total Distributions (Tax Basis) | 100 | % |
(A), (B) and (C) are based on a percentage of the Fund’s total distributions.
67
Board of trustees/directors and officers addendum
Delaware Investments® Family of Funds
A mutual fund is governed by a Board of Trustees/Directors (“Trustees”), which has oversight responsibility for the management of a fund’s business affairs. Trustees establish procedures and oversee and review the performance of the investment manager, the distributor, and others who perform services for the fund. The independent fund trustees, in particular, are advocates
| Name, Address, | Position(s) | Length of |
| and Birth Date | Held with Fund(s) | Time Served |
| Interested Trustees | | |
| | | |
| Patrick P. Coyne1 | Chairman, President, | Chairman and Trustee |
| 2005 Market Street | Chief Executive Officer, | since August 16, 2006 |
| Philadelphia, PA 19103 | and Trustee | |
| April 1963 | | President and |
| | | Chief Executive Officer |
| | | since August 1, 2006 |
| | | |
| |
| Independent Trustees | | |
| | | |
| Thomas L. Bennett | Trustee | Since March 2005 |
| 2005 Market Street | | |
| Philadelphia, PA 19103 | | |
| October 1947 | | |
| | | |
| Joseph W. Chow | Trustee | Since January 2013 |
| 2005 Market Street | | |
| Philadelphia, PA 19103 | | |
| January 1953 | | |
| | | |
| |
| John A. Fry | Trustee | Since January 2001 |
| 2005 Market Street | | |
| Philadelphia, PA 19103 | | |
| May 1960 | | |
| |
| |
| |
| |
| Anthony D. Knerr | Trustee | Since April 1990 |
| 2005 Market Street | | |
| Philadelphia, PA 19103 | | |
| December 1938 | | |
| | | |
1 Patrick P. Coyne is considered to be an “Interested Trustee” because he is an executive officer of the Fund’s(s’) investment advisor.
68
for shareholder interests. Each trustee has served in that capacity since he or she was elected to or appointed to the Board of Trustees, and will continue to serve until his or her retirement or the election of a new trustee in his or her place. The following is a list of the Trustees and Officers with certain background and related information.
| Number of Portfolios in | |
| Principal Occupation(s) | Fund Complex Overseen | Other Directorships |
| During Past 5 Years | by Trustee or Officer | Held by Trustee or Officer |
| |
| |
| Patrick P. Coyne has served in | 70 | Director and Audit |
| various executive capacities | | Committee Member |
| at different times at | | Kaydon Corp. |
| Delaware Investments.2 | | |
| | | Board of Governors Member |
| | | Investment Company |
| | | Institute (ICI) |
| | | |
| |
| |
| Private Investor | 70 | Director |
| (March 2004–Present) | | Bryn Mawr Bank Corp. (BMTC) |
| | | (2007–2011) |
| |
| | | |
| Executive Vice President | 70 | Director and Audit Committee |
| (Emerging Economies Strategies, | | Member — Hercules |
| Risk and Corporate Administration) | | Technology Growth |
| State Street Corporation | | Capital, Inc. |
| (July 2004–March 2011) | | |
| | | |
| President | 70 | Director — Hershey Trust |
| Drexel University | | |
| (August 2010–Present) | | Director and Audit |
| | | Committee Member |
| President | | Community Health Systems |
| Franklin & Marshall College | | |
| (July 2002–July 2010) | | |
| | | |
| Managing Director | 70 | None |
| AKA Strategy | | |
| (Strategic Consulting) | | |
| (1990–Present) | | |
| | | |
2 Delaware Investments is the marketing name for Delaware Management Holdings, Inc. and its subsidiaries, including the Fund’s(s’) investment advisor, principal underwriter, and its transfer agent.
69
Board of trustees/directors and officers addendum
Delaware Investments® Family of Funds
| Name, Address, | Position(s) | Length of |
| and Birth Date | Held with Fund(s) | Time Served |
| Independent Trustees (continued) | | |
| | | |
| Lucinda S. Landreth | Trustee | Since March 2005 |
| 2005 Market Street | | |
| Philadelphia, PA 19103 | | |
| June 1947 | | |
| | | |
| Frances A. Sevilla-Sacasa | Trustee | Since September 2011 |
| 2005 Market Street | | |
| Philadelphia, PA 19103 | | |
| January 1956 | | |
| |
| |
| |
| |
| |
| |
| |
| |
| |
| |
| |
| |
| |
| |
| Thomas K. Whitford | Trustee | Since January 2013 |
| 2005 Market Street | | |
| Philadelphia, PA 19103 | | |
| March 1956 | | |
| | | |
| | | |
| | | |
| | | |
| | | |
| | | |
| | | |
70
| Number of Portfolios in | |
| Principal Occupation(s) | Fund Complex Overseen | Other Directorships |
| During Past 5 Years | by Trustee or Officer | Held by Trustee or Officer |
| |
| |
| Private Investor | 70 | None |
| (2004–Present) | | |
| |
| |
| |
| Chief Executive Officer — | 70 | Trust Manager and |
| Banco Itaú Europa | | Audit Committee |
| International | | Member — Camden |
| (April 2012–Present) | | Property Trust |
| |
| Executive Advisor to Dean | | |
| (August 2011–March 2012) | | |
| and Interim Dean | | |
| (January 2011–July 2011) — | | |
| University of Miami School of | | |
| Business Administration | | |
| |
| President — U.S. Trust, | | |
| Bank of America Private | | |
| Wealth Management | | |
| (Private Banking) | | |
| (July 2007–December 2008) | | |
| | | |
| Vice Chairman | 70 | None |
| (2010–April 2013) | | |
| Chief Administrative | | |
| Officer (2008–2010) | | |
| and Executive Vice | | |
| President and Chief | | |
| Administrative Officer | | |
| (2007–2009) — | | |
| PNC Financial | | |
| Services Group | | |
| | |
71
Board of trustees/directors and officers addendum
Delaware Investments® Family of Funds
| Name, Address, | Position(s) | Length of |
| and Birth Date | Held with Fund(s) | Time Served |
| Independent Trustees (continued) | | |
| | | |
| Janet L. Yeomans | Trustee | Since April 1999 |
| 2005 Market Street | | |
| Philadelphia, PA 19103 | | |
| July 1948 | | |
| |
| |
| |
| |
| |
| |
| |
| J. Richard Zecher | Trustee | Since March 2005 |
| 2005 Market Street | | |
| Philadelphia, PA 19103 | | |
| July 1940 | | |
| | | |
| | | |
| | | |
| | | |
| | | |
| | | |
72
| Number of Portfolios in | |
| Principal Occupation(s) | Fund Complex Overseen | Other Directorships |
| During Past 5 Years | by Trustee or Officer | Held by Trustee or Officer |
| |
| |
| Vice President and Treasurer | 70 | Director, Audit |
| (January 2006–July 2012) | | Committee Member and |
| Vice President — Mergers & Acquisitions | | Investment Committee |
| (January 2003–January 2006), and | | Member |
| Vice President and Treasurer | | Okabena Company |
| (July 1995–January 2003) | | |
| 3M Corporation | | Chair — 3M |
| | Investment Management |
| | Company |
| | (2005–2012) |
| | | |
| Founder | 70 | Director and Compensation |
| Investor Analytics | | Committee Member |
| (Risk Management) | | Investor Analytics |
| (May 1999–Present) | | |
| | Director — P/E Investments |
| Founder | | |
| P/E Investments | | |
| (Hedge Fund) | | |
| (September 1996–Present) | | |
| | | |
73
Board of trustees/directors and officers addendum
Delaware Investments® Family of Funds
| Name, Address, | Position(s) | Length of |
| and Birth Date | Held with Fund(s) | Time Served |
| Officers | | |
| | | |
| David F. Connor | Senior Vice President, | Senior Vice President, |
| 2005 Market Street | Deputy General | Deputy General Counsel |
| Philadelphia, PA 19103 | Counsel, and Secretary | since May 2013; |
| December 1963 | | Vice President, Deputy |
| | General Counsel |
| | September 2000– |
| | May 2013; Secretary since |
| | October 2005 |
| | | |
| Daniel V. Geatens | Vice President | Treasurer |
| 2005 Market Street | and Treasurer | since October 2007 |
| Philadelphia, PA 19103 | | |
| October 1972 | | |
| | | |
| David P. O’Connor | Executive Vice President, | Executive Vice President |
| 2005 Market Street | General Counsel | since February 2012; |
| Philadelphia, PA 19103 | and Chief Legal Officer | Senior Vice President |
| February 1966 | | October 2005– |
| | February 2012; |
| | General Counsel and |
| | Chief Legal Officer |
| | since October 2005 |
| | | |
| Richard Salus | Senior Vice President | Chief Financial Officer |
| 2005 Market Street | and Chief Financial Officer | since November 2006 |
| Philadelphia, PA 19103 | | |
| October 1963 | | |
| | | |
The Statement of Additional Information for the Fund(s) includes additional information about the Trustees and Officers and is available, without charge, upon request by calling 800 523-1918.
74
| Number of Portfolios in | |
| Principal Occupation(s) | Fund Complex Overseen | Other Directorships |
| During Past 5 Years | by Trustee or Officer | Held by Trustee or Officer |
| |
| |
| David F. Connor has served as | 70 | None3 |
| Deputy General Counsel of | | |
| Delaware Investments | | |
| since 2000. | | |
| |
| |
| |
| |
| |
| Daniel V. Geatens has served | 70 | None3 |
| in various capacities at | | |
| different times at | | |
| Delaware Investments. | | |
| | | |
| David P. O’Connor has served in | 70 | None3 |
| various executive and legal | | |
| capacities at different times | | |
| at Delaware Investments. | | |
| |
| |
| |
| |
| |
| Richard Salus has served in | 70 | None3 |
| various executive capacities | | |
| at different times at | | |
| Delaware Investments. | | |
| | | |
3 David F. Connor, Daniel V. Geatens, David P. O’Connor, and Richard Salus serve in similar capacities for the six portfolios of the Optimum Fund Trust, which have the same investment advisor, principal underwriter, and transfer agent as the registrant.
75
About the organization
| Board of trustees |
Patrick P. Coyne
Chairman, President, and
Chief Executive Officer
Delaware Investments®
Family of Funds
Philadelphia, PAThomas L. Bennett
Private Investor
Rosemont, PA | Joseph W. Chow
Former Executive Vice
President
State Street Corporation
Brookline, MA
John A. Fry
President
Drexel University
Philadelphia, PA Anthony D. Knerr
Founder and Managing
Director
AKA Strategy
New York, NY | Lucinda S. Landreth
Former Chief Investment
Officer
Assurant, Inc.
Philadelphia, PA
Frances A.
Sevilla-Sacasa
Chief Executive Officer
Banco Itaú Europa
International
Miami, FL | Thomas K. Whitford
Former Vice Chairman
PNC Financial Services Group
Pittsburgh, PA
Janet L. Yeomans
Former Vice President and
Treasurer
3M Corporation
St. Paul, MNJ. Richard Zecher
Founder
Investor Analytics
Scottsdale, AZ |
| | | | |
Affiliated officers |
David F. Connor
Senior Vice President,
Deputy General Counsel,
and Secretary
Delaware Investments
Family of Funds
Philadelphia, PA | Daniel V. Geatens
Vice President and
Treasurer
Delaware Investments
Family of Funds
Philadelphia, PA | David P. O’Connor
Executive Vice President,
General Counsel,
and Chief Legal Officer
Delaware Investments
Family of Funds
Philadelphia, PA | Richard Salus
Senior Vice President and
Chief Financial Officer
Delaware Investments
Family of Funds
Philadelphia, PA |
| | | | |
This annual report is for the information of Delaware Diversified Floating Rate Fund shareholders, but it may be used with prospective investors when preceded or accompanied by the Delaware Investments Fund fact sheet for the most recently completed calendar quarter. These documents are available at delawareinvestments.com. |
Delaware Investments is the marketing name of Delaware Management Holdings, Inc. and its subsidiaries. The Fund files its complete schedule of portfolio holdings with the Securities and Exchange Commission (SEC) for the first and third quarters of each fiscal year on Form N-Q. The Fund’s Forms N-Q, as well as a description of the policies and procedures that the Fund uses to determine how to vote proxies (if any) relating to portfolio securities are available without charge (i) upon request, by calling 800 523-1918; and (ii) on the SEC’s website at sec.gov. In addition, a description of the policies and procedures that the Fund uses to determine how to vote proxies (if any) relating to portfolio securities and the Fund’s Schedule of Investments are available without charge on the Fund’s website at delawareinvestments.com. The Fund’s Forms N-Q may be reviewed and copied at the SEC’s Public Reference Room in Washington, D.C.; information on the operation of the Public Reference Room may be obtained by calling 800 SEC-0330. Information (if any) regarding how the Fund voted proxies relating to portfolio securities during the most recently disclosed 12-month period ended June 30 is available without charge (i) through the Fund’s website at delawareinvestments.com; and (ii) on the SEC’s website at sec.gov. |
76
Item 2. Code of Ethics
The registrant has adopted a code of ethics that applies to the registrant’s principal executive officer, principal financial officer, principal accounting officer or controller, or persons performing similar functions, regardless of whether these individuals are employed by the registrant or a third party. A copy of the registrant’s Code of Business Ethics has been posted on the Delaware Investments Internet Web site at www.delawareinvestments.com. Any amendments to the Code of Business Ethics, and information on any waiver from its provisions granted by the registrant, will also be posted on this Web site within five business days of such amendment or waiver and will remain on the Web site for at least 12 months.
Item 3. Audit Committee Financial Expert
The registrant’s Board of Trustees/Directors has determined that certain members of the registrant’s Audit Committee are audit committee financial experts, as defined below. For purposes of this item, an “audit committee financial expert” is a person who has the following attributes:
a. An understanding of generally accepted accounting principles and financial statements;
b. The ability to assess the general application of such principles in connection with the accounting for estimates, accruals, and reserves;
c. Experience preparing, auditing, analyzing, or evaluating financial statements that present a breadth and level of complexity of accounting issues that are generally comparable to the breadth and complexity of issues that can reasonably be expected to be raised by the registrant’s financial statements, or experience actively supervising one or more persons engaged in such activities;
d. An understanding of internal controls and procedures for financial reporting; and
e. An understanding of audit committee functions.
An “audit committee financial expert” shall have acquired such attributes through:
a. Education and experience as a principal financial officer, principal accounting officer, controller, public accountant, or auditor or experience in one or more positions that involve the performance of similar functions;
b. Experience actively supervising a principal financial officer, principal accounting officer, controller, public accountant, auditor, or person performing similar functions;
c. Experience overseeing or assessing the performance of companies or public accountants with respect to the preparation, auditing, or evaluation of financial statements; or
d. Other relevant experience.
The registrant’s Board of Trustees/Directors has also determined that each member of the registrant’s Audit Committee is independent. In order to be “independent” for purposes of this item, the Audit Committee member may not: (i) other than in his or her capacity as a member of the Board of Trustees/Directors or any committee thereof, accept directly or indirectly any consulting, advisory or other compensatory fee from the issuer; or (ii) be an “interested person” of the registrant as defined in Section 2(a)(19) of the Investment Company Act of 1940.
The names of the audit committee financial experts on the registrant’s Audit Committee are set forth below:
Thomas L. Bennett1
John A. Fry
Frances A. Sevilla-Sacasa
Janet L. Yeomans
Item 4. Principal Accountant Fees and Services
(a) Audit fees.
The aggregate fees billed for services provided to the registrant by its independent auditors for the audit of the registrant’s annual financial statements and for services normally provided by the independent auditors in connection with statutory and regulatory filings or engagements were $163,175 for the fiscal year ended July 31, 2013.
____________________
1 The instructions to Form N-CSR require disclosure on the relevant experience of persons who qualify as audit committee financial experts based on “other relevant experience.” The Board of Trustees/Directors has determined that Mr. Bennett qualifies as an audit committee financial expert by virtue of: his education and Chartered Financial Analyst designation; his experience as a credit analyst, portfolio manager and the manager of other credit analysts and portfolio managers; and his prior service on the audit committees of public companies.
The aggregate fees billed for services provided to the registrant by its independent auditors for the audit of the registrant’s annual financial statements and for services normally provided by the independent auditors in connection with statutory and regulatory filings or engagements were $121,700 for the fiscal year ended July 31, 2012.
(b) Audit-related fees.
The aggregate fees billed by the registrant’s independent auditors for services relating to the performance of the audit of the registrant’s financial statements and not reported under paragraph (a) of this Item were $0 for the fiscal year ended July 31, 2013.
The aggregate fees billed by the registrant’s independent auditors for services relating to the performance of the audit of the financial statements of the registrant’s investment adviser and other service providers under common control with the adviser and that relate directly to the operations or financial reporting of the registrant were $618,000 for the registrant’s fiscal year ended July 31, 2013. The percentage of these fees relating to services approved by the registrant’s Audit Committee pursuant to the de minimis exception from the pre-approval requirement in Rule 2-01(c)(7)(i)(C) of Regulation S-X was 0%. These audit-related services were as follows: year end audit procedures; group reporting and subsidiary statutory audits.
The aggregate fees billed by the registrant’s independent auditors for services relating to the performance of the audit of the registrant’s financial statements and not reported under paragraph (a) of this Item were $0 for the fiscal year ended July 31, 2012.
The aggregate fees billed by the registrant’s independent auditors for services relating to the performance of the audit of the financial statements of the registrant’s investment adviser and other service providers under common control with the adviser and that relate directly to the operations or financial reporting of the registrant were $565,000 for the registrant’s fiscal year ended July 31, 2012. The percentage of these fees relating to services approved by the registrant’s Audit Committee pursuant to the de minimis exception from the pre-approval requirement in Rule 2-01(c)(7)(i)(C) of Regulation S-X was 0%. These audit-related services were as follows: year end audit procedures; reporting up and subsidiary statutory audits.
(c) Tax fees.
The aggregate fees billed by the registrant’s independent auditors for tax-related services provided to the registrant were $24,250 for the fiscal year ended July 31, 2013. The percentage of these fees relating to services approved by the registrant’s Audit Committee pursuant to the de minimis exception from the pre-approval requirement in Rule 2-01(c)(7)(i)(C) of Regulation S-X was 0%. These tax-related services were as follows: review of income tax returns and review of annual excise distribution calculations.
The aggregate fees billed by the registrant’s independent auditors for tax-related services provided to the registrant’s investment adviser and other service providers under common control with the adviser and that relate directly to the operations or financial reporting of the registrant were $0 for the registrant’s fiscal year ended July 31, 2013.
The aggregate fees billed by the registrant’s independent auditors for tax-related services provided to the registrant were $24,050 for the fiscal year ended July 31, 2012. The percentage of these fees relating to services approved by the registrant’s Audit Committee pursuant to the de minimis exception from the pre-approval requirement in Rule 2-01(c)(7)(i)(C) of Regulation S-X was 0%. These tax-related services were as follows: review of income tax returns and review of annual excise distribution calculations.
The aggregate fees billed by the registrant’s independent auditors for tax-related services provided to the registrant’s investment adviser and other service providers under common control with the adviser and that relate directly to the operations or financial reporting of the registrant were $0 for the registrant’s fiscal year ended July 31, 2012.
(d) All other fees.
The aggregate fees billed for all services provided by the independent auditors to the registrant other than those set forth in paragraphs (a), (b) and (c) of this Item were $0 for the fiscal year ended July 31, 2013.
The aggregate fees billed for all services other than those set forth in paragraphs (b) and (c) of this Item provided by the registrant’s independent auditors to the registrant’s adviser and other service providers under common control with the adviser and that relate directly to the operations or financial reporting of the registrant were $0 for the registrant’s fiscal year ended July 31, 2013. The percentage of these fees relating to services approved by the registrant’s Audit Committee pursuant to the de minimis exception from the pre-approval requirement in Rule 2-01(c)(7)(i)(C) of Regulation S-X was 0%.
The aggregate fees billed for all services provided by the independent auditors to the registrant other than those set forth in paragraphs (a), (b) and (c) of this Item were $0 for the fiscal year ended July 31, 2012.
The aggregate fees billed for all services other than those set forth in paragraphs (b) and (c) of this Item provided by the registrant’s independent auditors to the registrant’s adviser and other service providers under common control with the adviser and that relate directly to the operations or financial reporting of the registrant were $0 for the registrant’s fiscal year ended July 31, 2012. The percentage of these fees relating to services approved by the registrant’s Audit Committee pursuant to the de minimis exception from the pre-approval requirement in Rule 2-01(c)(7)(i)(C) of Regulation S-X was 0%.
(e) The registrant’s Audit Committee has established pre-approval policies and procedures as permitted by Rule 2-01(c)(7)(i)(B) of Regulation S-X (the “Pre-Approval Policy”) with respect to services provided by the registrant’s independent auditors. Pursuant to the Pre-Approval Policy, the Audit Committee has pre-approved the services set forth in the table below with respect to the registrant up to the specified fee limits. Certain fee limits are based on aggregate fees to the registrant and other registrants within the Delaware Investments Family of Funds.
| Service | Range of Fees |
| Audit Services | |
| Statutory audits or financial audits for new Funds | up to $40,000 per Fund |
| Services associated with SEC registration statements (e.g., Form N-1A, Form N-14, etc.), periodic reports and other documents filed with the SEC or other documents issued in connection with securities offerings (e.g., comfort letters for closed-end Fund offerings, consents), and assistance in responding to SEC comment letters | up to $10,000 per Fund |
| Consultations by Fund management as to the accounting or disclosure treatment of transactions or events and/or the actual or potential impact of final or proposed rules, standards or interpretations by the SEC, FASB, or other regulatory or standard-setting bodies (Note: Under SEC rules, some consultations may be considered “audit-related services” rather than “audit services”) | up to $25,000 in the aggregate |
| Audit-Related Services | |
| Consultations by Fund management as to the accounting or disclosure treatment of transactions or events and /or the actual or potential impact of final or proposed rules, standards or interpretations by the SEC, FASB, or other regulatory or standard-setting bodies (Note: Under SEC rules, some consultations may be considered “audit services” rather than “audit-related services”) | up to $25,000 in the aggregate |
| Tax Services | |
| U.S. federal, state and local and international tax planning and advice (e.g., consulting on statutory, regulatory or administrative developments, evaluation of Funds’ tax compliance function, etc.) | up to $25,000 in the aggregate |
| U.S. federal, state and local tax compliance (e.g., excise distribution reviews, etc.) | up to $5,000 per Fund |
| Review of federal, state, local and international income, franchise and other tax returns | up to $5,000 per Fund |
Under the Pre-Approval Policy, the Audit Committee has also pre-approved the services set forth in the table below with respect to the registrant’s investment adviser and other entities controlling, controlled by or under common control with the investment adviser that provide ongoing services to the registrant (the “Control Affiliates”) up to the specified fee limit. This fee limit is based on aggregate fees to the investment adviser and its Control Affiliates.
| Service | Range of Fees |
| Non-Audit Services | |
| Services associated with periodic reports and other documents filed with the SEC and assistance in responding to SEC comment letters | up to $10,000 in the aggregate |
The Pre-Approval Policy requires the registrant’s independent auditors to report to the Audit Committee at each of its regular meetings regarding all services initiated since the last such report was rendered, including those services authorized by the Pre-Approval Policy.
(f) Not applicable.
(g) The aggregate non-audit fees billed by the registrant’s independent auditors for services rendered to the registrant and to its investment adviser and other service providers under common control with the adviser were $8,891,311 and $10,092,966 for the registrant’s fiscal years ended July 31, 2013 and July 31, 2012, respectively.
(h) In connection with its selection of the independent auditors, the registrant’s Audit Committee has considered the independent auditors’ provision of non-audit services to the registrant’s investment adviser and other service providers under common control with the adviser that were not required to be pre-approved pursuant to Rule 2-01(c)(7)(ii) of Regulation S-X. The Audit Committee has determined that the independent auditors’ provision of these services is compatible with maintaining the auditors’ independence.
Item 5. Audit Committee of Listed Registrants
Not applicable.
Item 6. Investments
(a) Included as part of report to shareholders filed under Item 1 of this Form N-CSR.
(b) Divestment of securities in accordance with Section 13(c) of the Investment Company Act of 1940.
Not applicable.
Item 7. Disclosure of Proxy Voting Policies and Procedures for Closed-End Management Investment Companies
Not applicable.
Item 8. Portfolio Managers of Closed-End Management Investment Companies
Not applicable.
Item 9. Purchases of Equity Securities by Closed-End Management Investment Company and Affiliated Purchasers
Not applicable.
Item 10. Submission of Matters to a Vote of Security Holders
Not applicable.
Item 11. Controls and Procedures
The registrant’s principal executive officer and principal financial officer have evaluated the registrant’s disclosure controls and procedures within 90 days of the filing of this report and have concluded that they are effective in providing reasonable assurance that the information required to be disclosed by the registrant in its reports or statements filed under the Securities Exchange Act of 1934 is recorded, processed, summarized and reported within the time periods specified in the rules and forms of the Securities and Exchange Commission.
There were no significant changes in the registrant’s internal control over financial reporting that occurred during the second fiscal quarter of the period covered by the report to stockholders included herein (i.e., the registrant’s fourth fiscal quarter) that have materially affected, or are reasonably likely to materially affect, the registrant’s internal control over financial reporting.
Item 12. Exhibits
(a) (1) Code of Ethics
Not applicable.
(2) Certifications of Principal Executive Officer and Principal Financial Officer pursuant to Rule 30a-2 under the Investment Company Act of 1940 are attached hereto as Exhibit 99.CERT.
(3) Written solicitations to purchase securities pursuant to Rule 23c-1 under the Securities Exchange Act of 1934.
Not applicable.
(b) Certifications pursuant to Section 906 of the Sarbanes-Oxley Act of 2002 are furnished herewith as Exhibit 99.906CERT.
SIGNATURES
Pursuant to the requirements of the Securities Exchange Act of 1934 and the Investment Company Act of 1940, the registrant has duly caused this report to be signed on its behalf, by the undersigned, thereunto duly authorized.
Name of Registrant: DELAWARE GROUP® INCOME FUNDS
| /s/ PATRICK P. COYNE |
| By: | Patrick P. Coyne |
| Title: | Chief Executive Officer |
| Date: | October 2, 2013 |
Pursuant to the requirements of the Securities Exchange Act of 1934 and the Investment Company Act of 1940, this report has been signed below by the following persons on behalf of the registrant and in the capacities and on the dates indicated.
| /s/ PATRICK P. COYNE |
| By: | Patrick P. Coyne |
| Title: | Chief Executive Officer |
| Date: | October 2, 2013 |
| |
| /s/ RICHARD SALUS |
| By: | Richard Salus |
| Title: | Chief Financial Officer |
| Date: | October 2, 2013 |