UNITED STATES SECURITIES AND EXCHANGE COMMISSION
Washington, D.C. 20549
FORM N-CSR
CERTIFIED SHAREHOLDER REPORT OF REGISTERED MANAGEMENT
INVESTMENT COMPANIES
| Investment Company Act file number: | | 811-02071 |
| | | |
| Exact name of registrant as specified in charter: | | Delaware Group® Income Funds |
| | | |
| Address of principal executive offices: | | 2005 Market Street |
| | Philadelphia, PA 19103 |
| | | |
| Name and address of agent for service: | | David F. Connor, Esq. |
| | 2005 Market Street |
| | Philadelphia, PA 19103 |
| | |
| Registrant’s telephone number, including area code: | | (800) 523-1918 |
| | |
| Date of fiscal year end: | | July 31 |
| | |
| Date of reporting period: | | July 31, 2015 |
Item 1. Reports to Stockholders

Annual report
Fixed income mutual funds
Delaware Corporate Bond Fund
Delaware Extended Duration Bond Fund
July 31, 2015
Carefully consider the Funds’ investment objectives, risk factors, charges, and expenses before investing. This and other information can be found in the Funds’ prospectus and their summary prospectuses, which may be obtained by visiting delawareinvestments.com or calling 800 523-1918. Investors should read the prospectus and the summary prospectus carefully before investing.
You can obtain shareholder reports and prospectuses online instead of in the mail.
Visit delawareinvestments.com/edelivery.
Experience Delaware Investments
Delaware Investments is committed to the pursuit of consistently superior asset management and unparalleled client service. We believe in our investment processes, which seek to deliver consistent results, and in convenient services that help add value for our clients.
If you are interested in learning more about creating an investment plan, contact your financial advisor.
You can learn more about Delaware Investments or obtain a prospectus for Delaware Corporate Bond Fund and Delaware Extended Duration Bond Fund at delawareinvestments.com.
Manage your investments online
| ● | | 24-hour access to your account information |
| ● | | Check your account balance and recent transactions |
| ● | | Request statements or literature |
| ● | | Make purchases and redemptions |
Delaware Management Holdings, Inc. and its subsidiaries (collectively known by the marketing name of Delaware Investments) are wholly owned subsidiaries of Macquarie Group Limited, a global provider of banking, financial, advisory, investment and funds management services.
Neither Delaware Investments nor its affiliates noted in this document are authorized deposit-taking institutions for the purposes of the Banking Act 1959 (Commonwealth of Australia). The obligations of these entities do not represent deposits or other liabilities of Macquarie Bank Limited (MBL). MBL does not guarantee or otherwise provide assurance in respect of the obligations of these entities, unless noted otherwise.
Table of contents
Unless otherwise noted, views expressed herein are current as of July 31, 2015, and subject to change for events occurring after such date.
Funds are not FDIC insured and are not guaranteed. It is possible to lose the principal amount invested.
Mutual fund advisory services provided by Delaware Management Company, a series of Delaware Management Business Trust, which is a registered investment advisor. Delaware Investments, a member of Macquarie Group, refers to Delaware Management Holdings, Inc. and its subsidiaries, including the Funds’ distributor, Delaware Distributors, L.P. Macquarie Group refers to Macquarie Group Limited and its subsidiaries and affiliates worldwide.
© 2015 Delaware Management Holdings, Inc.
All third-party marks cited are the property of their respective owners.
| | |
| Portfolio management review | | |
| | |
| Delaware Corporate Bond Fund and Delaware Extended Duration Bond Fund | | August 11, 2015 |
| | | | |
Performance preview (for the year ended July 31, 2015) | | | | |
Delaware Corporate Bond Fund (Class A shares) | | 1-year return | | +0.28% |
Barclays U.S. Corporate Investment Grade Index (benchmark) | | 1-year return | | +1.49% |
Past performance does not guarantee future results.
For complete, annualized performance for Delaware Corporate Bond Fund, please see the table on page 4.
The performance of Class A shares excludes the applicable sales charge and reflects the reinvestment of all distributions.
For a description of the index, please see page 6. Index performance returns do not reflect any management fees, transaction costs, or expenses. Indices are unmanaged and one cannot invest directly in an index.
| | | | |
Delaware Extended Duration Bond Fund (Class A shares) | | 1-year return | | +0.53% |
Barclays Long U.S. Corporate Index (benchmark) | | 1-year return | | +0.54% |
Past performance does not guarantee future results.
For complete, annualized performance for Delaware Extended Duration Bond Fund, please see the table on page 7.
The performance of Class A shares excludes the applicable sales charge and reflects the reinvestment of all distributions.
For a description of the index, please see page 9. Index performance returns do not reflect any management fees, transaction costs, or expenses. Indices are unmanaged and one cannot invest directly in an index.
During the Funds’ fiscal year ended July 31, 2015, the bond market was highly volatile. It was difficult to find sources of positive excess returns from investment grade credit. High merger and acquisition volumes resulted in the deterioration of credit quality and a relentless supply of new issues. Additionally, growing concern about global growth led to weakness in commodities.
Yield curve management was particularly difficult. The market appeared to be anticipating economic growth to accelerate, but the U.S. Treasury yield curve was sending bear-market signals. The behavior at the long end of the curve (10- to 30-year Treasurys) was especially unpredictable, which most notably affected Delaware Extended Duration Bond Fund.
Heavy new-issue supply that required price concessions, or wider spreads, drove much of the volatility. That said, July 2015 (the final month of the Funds’ fiscal year) was another record month for new issuance of investment grade bonds. Total supply for 2015 is on target to exceed $1.0 trillion, possibly reaching $1.3 trillion (source: Bloomberg). As a result, risk premiums have increased and
excess returns have been negative for the asset class.
Energy clearly had the most significant effect on the Funds during their fiscal year. In the second half of 2014, the price of oil fell from roughly $100 a barrel into the $40 range. It rallied early in 2015, only to retreat and retest its lows. At the same time, weakness in the Chinese economy triggered a further bout of volatility in the commodities markets. Because China is such a large consumer, the effect was felt not only in oil and natural gas, but also in metals and mining, in general.
On a positive note, the financial sector was a bright spot as the banking system continued to fundamentally improve. New regulations are requiring banks to shore up their balance sheets, and that’s a plus from a bondholder’s perspective.
Fund performance
For the fiscal year ended July 31, 2015, Delaware Corporate Bond Fund Class A shares returned +0.28% at net asset value and -4.29% at maximum offer price (both returns reflect all distributions reinvested). In comparison, the Fund’s benchmark, the Barclays U.S. Corporate
1
Portfolio management review
Delaware Corporate Bond Fund and Delaware Extended Duration Bond Fund
Investment Grade Index, returned +1.49% during the same period. For complete annualized performance of Delaware Corporate Bond Fund, please see the table on page 4.
During the same period, Delaware Extended Duration Bond Fund Class A shares returned +0.53% at net asset value and -3.98% at maximum offer price (both returns reflect all distributions reinvested). In comparison, the Fund’s benchmark, the Barclays Long U.S. Corporate Index, returned +0.54% during the same period. For complete annualized performance of Delaware Extended Duration Bond Fund, please see the table on page 7.
Delaware Corporate Bond Fund
We emphasize fundamental credit analysis to select securities for the Fund’s portfolio. Our focus is security-specific risk and opportunity, which may lead us to multiple holdings in certain sectors.
During the fiscal year, the Fund’s energy holdings suffered when the Organization of the Petroleum Exporting Countries (OPEC) signaled production increases in late November 2014, sending oil prices down sharply. The Fund generally holds 10–20% of its assets in high yield securities. At the time, its high yield allocation included lower-quality energy holdings that require a certain price point per barrel of oil to do well. We made tough decisions and sold those securities at a loss. That detracted from performance in the first half of the fiscal year, but may have spared the Fund further losses had we instead continued to hold those securities in the Fund.
Commodities-related sectors suffered in tandem with energy. The Fund’s performance benefited from underweighting issues in the metals and mining industries.
We also added value via security selection in the banking sector. We identified relative values in the subordinate and preferred hybrid part of the
capital structure – mainly in U.S. banks, but also in some European issues as well.
Finally, higher-quality, longer-duration bonds in the consumer noncyclical sector underperformed in the first half of the fiscal year. We made up ground in the second half by avoiding some event risk, including the Kraft-Heinz merger and unprofitable M&A activity in pharmaceuticals and healthcare.
Turning to specific securities that added value, we purchased Bank of America 6.5% preferred shares as a new issue. In our view, these were cheap from a spread perspective relative to senior bank paper, and they subsequently performed quite well, even in a volatile rate environment.
Additionally, the Fund benefited from good credit selection in the utilities sector, taking advantage of first mortgage bonds issued by weaker holding companies such as Entergy, some of its subsidiaries in Louisiana and Arkansas, and First Energy.
The Fund also benefited from foreign agency securities. These are mostly big, government-sponsored enterprises in Europe, including Électricité de France, a utility company. Telefonica, a Spanish telecommunications operator, also outperformed thanks to successful measures taken to strengthen its balance sheet and cut costs. We sold the position during the fiscal year, seeking to take advantage of better relative value opportunities.
The largest detractors from the Fund’s performance were in the energy sector, as previously mentioned. Specific names included SandRidge Energy, MidStates Petroleum, and Chesapeake Energy. Consequently, we sold these positions during the fiscal year.
Another underperformer was pharmaceutical company Salix, which appeared to us to be a likely takeover target in the healthcare sector. We
2
sold at a loss when we learned about accounting irregularities at the company.
During the fiscal year, the Fund employed three types of derivatives – all used in an attempt to hedge specific risk factors that are a byproduct of our underlying security selection process. We employed U.S. Treasury futures throughout the fiscal year to reduce duration at the overall portfolio level and also to potentially smooth out any yield-curve risk. We also used swaptions, mostly during 2014, to help buffer the Fund in the event of a “bear flattener” or narrowing of interest rate spreads, if the Federal Reserve raised rates. Finally, late in the third quarter of 2014, we used credit default swaps to hedge against weakness in the high yield sector. These derivatives cost the Fund approximately 0.25 percentage points in performance.
Delaware Extended Duration Bond Fund
As with Delaware Corporate Bond Fund, we emphasize fundamental credit analysis to select securities for the Fund’s portfolio. Our focus is security-specific risk and opportunity, which may lead us to multiple holdings in certain sectors.
During the fiscal year, performance for Delaware Extended Duration Bond Fund within the sectors of the investment grade corporate credit market was similar to that of Delaware Corporate Bond Fund. Financials and utilities were the strongest outperformers and energy was the primary detractor from performance.
High yield bonds and high yield convertibles issued by Chesapeake Energy and SandRidge Energy were among the energy issues that underperformed. Another energy company,
California Resources, also underperformed, as did a commodity-crossover play, iron ore company FMG Resources. We sold the SandRidge Energy, California Resources, and FMG Resources positions during the fiscal year.
Strong security selection led us to names including Verizon, Qwest, and Berkshire Hathaway Energy, which were among the Fund’s strongest-performing corporate credits. In addition, some of the Fund’s noncorporate exposure generated strong returns. For example, tactical allocations to Build America municipal bonds contributed to excess returns.
The Fund also contained a small allocation to bank loans, which, thanks to the strong technicals of the bank loan market in 2015, contributed to performance. There was a significant amount of interest in bank loans, primarily due to the volume of collateralized loan applications being issued.
Exposure to foreign credits also benefited the Fund. These included certain quasi-sovereign risks such as State Grid Corporation of China, which we sold due to relative value, and Saudi Electricity Global Sukuk. Traditional emerging market exposure also helped, particularly in the first half of the fiscal year; we began reducing the Fund’s emerging market exposure in the latter half of the fiscal year based on our bottom-up (bond by bond) fundamental analysis.
During the fiscal year, the Fund used derivatives for risk management purposes and no leverage was employed. Specifically, we used U.S. Treasury futures to manage the underlying yield-curve risk. Overall, this contributed to the Fund’s performance.
3
| | |
| Performance summaries | | |
| Delaware Corporate Bond Fund | | July 31, 2015 |
The performance data quoted represent past performance; past performance does not guarantee future results. Investment return and principal value will fluctuate so your shares, when redeemed, may be worth more or less than their original cost. Please obtain the performance data current for the most recent month end by calling 800 523-1918 or visiting our website at delawareinvestments.com/performance. Current performance may be lower or higher than the performance data quoted.
| | | | | | |
| Fund and benchmark performance1,2 | | Average annual total returns through July 31, 2015 |
| | | | | | | | | | | | |
| | | 1 year | | | 5 years | | | 10 years | |
Class A (Est. Sept. 15, 1998) | | | | | | | | | | | | |
Excluding sales charge | | | +0.28 | % | | | +6.13 | % | | | +6.57 | % |
Including sales charge | | | -4.29 | % | | | +5.15 | % | | | +6.08 | % |
Class C (Est. Sept. 15, 1998) | | | | | | | | | | | | |
Excluding sales charge | | | -0.48 | % | | | +5.31 | % | | | +5.77 | % |
Including sales charge | | | -1.43 | % | | | +5.31 | % | | | +5.77 | % |
Class R (Est. June 2, 2003) | | | | | | | | | | | | |
Excluding sales charge | | | +0.03 | % | | | +5.87 | % | | | +6.32 | % |
Including sales charge | | | +0.03 | % | | | +5.87 | % | | | +6.32 | % |
Institutional Class (Est. Sept. 15, 1998) | | | | | | | | | | | | |
Excluding sales charge | | | +0.52 | % | | | +6.36 | % | | | +6.85 | % |
Including sales charge | | | +0.52 | % | | | +6.36 | % | | | +6.85 | % |
Barclays U.S. Corporate Investment Grade Index | | | +1.49 | % | | | +4.84 | % | | | +5.37 | % |
1Returns reflect the reinvestment of all distributions and are presented both with and without the applicable sales charges described below. Returns do not reflect the deduction of taxes the shareholder would pay on Fund distributions or redemptions of Fund shares.
Expense limitations were in effect for certain classes during some or all of the periods shown in the “Fund and benchmark performance” table. Expenses for each class are listed on the “Fund expense ratios” table on page 5. Performance would have been lower had expense limitations not been in effect.
Class A shares are sold with a maximum front-end sales charge of 4.50%, and have an annual distribution and service fee of 0.25% of average daily net assets. Performance for Class A shares,
excluding sales charges, assumes that no front-end sales charge applied.
Class C shares are sold with a contingent deferred sales charge of 1.00% if redeemed during the first 12 months. They are also subject to an annual distribution and service fee of 1.00% of average daily net assets. Performance for Class C shares, excluding sales charges, assumes either that contingent deferred sales charges did not apply or that the investment was not redeemed.
Class R shares are available only for certain retirement plan products. They are sold without a sales charge and have an annual distribution and service fee of 0.50% of average daily net assets.
Institutional Class shares are available without sales or asset-based distribution charges only to certain eligible institutional accounts.
4
Fixed income securities and bond funds can lose value, and investors can lose principal, as interest rates rise. They also may be affected by economic conditions that hinder an issuer’s ability to make interest and principal payments on its debt.
The Fund may also be subject to prepayment risk, the risk that the principal of a fixed income security that is held by the Fund may be prepaid prior to maturity, potentially forcing the Fund to reinvest that money at a lower interest rate.
International investments entail risks not ordinarily associated with U.S. investments including fluctuation in currency values, differences in accounting principles, or economic or political instability in other nations.
Investing in emerging markets can be riskier than investing in established foreign markets due to increased volatility and lower trading volume.
High yielding, noninvestment grade bonds (junk bonds) involve higher risk than investment grade bonds.
The Fund may experience portfolio turnover in excess of 100%, which could result in higher transaction costs and tax liability.
The Fund may invest in derivatives, which may involve additional expenses and are subject to risk, including the risk that an underlying security or securities index moves in the opposite direction from what the portfolio manager anticipated. A derivative transaction depends upon the counterparties’ ability to fulfill their contractual obligations.
2 The Fund’s expense ratios, as described in the most recent prospectus, are disclosed in the following “Fund expense ratios” table. Delaware Management Company has agreed to reimburse certain expenses and/or waive certain fees in order to prevent total annual fund operating expenses (excluding any 12b-1 fees, taxes, interest, short sale and dividend interest expenses, brokerage fees, certain insurance costs, acquired fund fees and expenses, and nonroutine expenses or costs, including, but not limited to, those relating to reorganizations, litigation, conducting shareholder meetings, and liquidations (collectively, nonroutine expenses)) from exceeding 0.69% of the Fund’s average daily net assets during the period from Aug. 1, 2014 through July 31, 2015.* Please see the most recent prospectus and any applicable supplement(s) for additional information on these fee waivers and/or reimbursements.
| | | | | | | | |
Fund expense ratios | | Class A | | Class C | | Class R | | Institutional Class |
Total annual operating expenses | | 0.95% | | 1.70% | | 1.20% | | 0.70% |
(without fee waivers) | | | | | | | | |
Net expenses | | 0.94% | | 1.69% | | 1.19% | | 0.69% |
(including fee waivers, if any) | | | | | | | | |
Type of waiver | | Contractual | | Contractual | | Contractual | | Contractual |
| | | | | | | | | |
*The contractual waiver period is from Nov. 27, 2013, through Nov. 30, 2015.
5
Performance summaries
Delaware Corporate Bond Fund
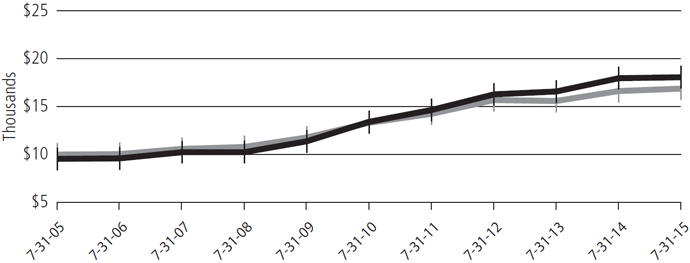
Performance of a $10,000 investment1
Average annual total returns from July 31, 2005, through July 31, 2015
| | | | | | | | | | |
For period beginning July 31, 2005, through July 31, 2015 | | Starting value | | | Ending value | |
 Delaware Corporate Bond Fund — Class A shares Delaware Corporate Bond Fund — Class A shares
| | | $9,550 | | | | $18,046 | |
 Barclays U.S. Corporate Investment Grade Index Barclays U.S. Corporate Investment Grade Index
| | | $10,000 | | | | $16,866 | |
1 The “Performance of a $10,000 investment” graph assumes $10,000 invested in Class A shares of the Fund on July 31, 2005, and includes the effect of a 4.50% front-end sales charge and the reinvestment of all distributions. The graph does not reflect the deduction of taxes the shareholders would pay on Fund distributions or redemptions of Fund shares. Expense limitations were in effect for some or all of the periods shown. Performance would have been lower had expense limitations not been in effect. Expenses are listed in the “Fund expense ratios” table on page 5. Please note additional details on pages 4 through 6.
The graph also assumes $10,000 invested in the Barclays U.S. Corporate Investment Grade Index
as of July 31, 2005. The Barclays U.S. Corporate Investment Grade Index is composed of U.S. dollar-denominated, investment grade, SEC-registered corporate bonds issued by industrial, utility, and financial companies. All bonds in the index have at least one year to maturity.
Index performance returns do not reflect any management fees, transaction costs, or expenses. Indices are unmanaged and one cannot invest directly in an index. Past performance is not a guarantee of future results.
Performance of other Fund classes will vary due to different charges and expenses.
| | | | | | |
| | | Nasdaq symbols | | CUSIPs | | |
Class A | | DGCAX | | 245908785 | | |
Class C | | DGCCX | | 245908769 | | |
Class R | | DGCRX | | 245908744 | | |
Institutional Class | | DGCIX | | 245908751 | | |
6
| | | | |
| Performance summaries | | | | |
| Delaware Extended Duration Bond Fund | | | July 31, 2015 | |
The performance data quoted represent past performance; past performance does not guarantee future results. Investment return and principal value will fluctuate so your shares, when redeemed, may be worth more or less than their original cost. Please obtain the performance data current for the most recent month end by calling 800 523-1918 or visiting our website at delawareinvestments.com/performance. Current performance may be lower or higher than the performance data quoted.
| | | | | | | | | | | | | | | | |
| Fund and benchmark performance1,2 | | Average annual total returns through July 31, 2015 | |
| | | 1 year | | | 5 years | | | 10 years | | | Lifetime | |
Class A (Est. Sept. 15, 1998) | | | | | | | | | | | | | | | | |
Excluding sales charge | | | +0.53 | % | | | +8.38 | % | | | +8.19 | % | | | n/a | |
Including sales charge | | | -3.98 | % | | | +7.40 | % | | | +7.69 | % | | | n/a | |
Class C (Est. Sept. 15, 1998) | | | | | | | | | | | | | | | | |
Excluding sales charge | | | -0.22 | % | | | +7.61 | % | | | +7.40 | % | | | n/a | |
Including sales charge | | | -1.15 | % | | | +7.61 | % | | | +7.40 | % | | | n/a | |
Class R (Est. Oct. 3, 2005) | | | | | | | | | | | | | | | | |
Excluding sales charge | | | +0.29 | % | | | +8.14 | % | | | n/a | | | | +8.13 | % |
Including sales charge | | | +0.29 | % | | | +8.14 | % | | | n/a | | | | +8.13 | % |
Institutional Class (Est. Sept. 15, 1998) | | | | | | | | | | | | | | | | |
Excluding sales charge | | | +0.78 | % | | | +8.65 | % | | | +8.47 | % | | | n/a | |
Including sales charge | | | +0.78 | % | | | +8.65 | % | | | +8.47 | % | | | n/a | |
Barclays Long U.S. Corporate Index | | | +0.54 | % | | | +6.74 | % | | | +6.28 | % | | | n/a | |
1Returns reflect the reinvestment of all distributions and are presented both with and without the applicable sales charges described below. Returns do not reflect the deduction of taxes the shareholder would pay on Fund distributions or redemptions of Fund shares.
Expense limitations were in effect for certain classes during some or all of the periods shown in the “Fund and benchmark performance” table. Expenses for each class are listed on the “Fund expense ratios” table on page 8. Performance would have been lower had expense limitations not been in effect.
Class A shares are sold with a maximum front-end sales charge of 4.50%, and have an annual distribution and service fee of 0.25% of average daily net assets. Performance for Class A shares, excluding sales charges, assumes that no front-end sales charge applied.
Class C shares are sold with a contingent deferred sales charge of 1.00% if redeemed during the first 12 months. They are also subject to an annual distribution and service fee of 1.00% of average daily net assets. Performance for Class C shares, excluding sales charges, assumes either that contingent deferred sales charges did not apply or that the investment was not redeemed.
Class R shares are available only for certain retirement plan products. They are sold without a sales charge and have an annual distribution and service fee of 0.50% of average daily net assets.
Institutional Class shares are available without sales or asset-based distribution charges only to certain eligible institutional accounts.
Fixed income securities and bond funds can lose value, and investors can lose principal, as interest rates rise. They also may be affected by economic
7
Performance summaries
Delaware Extended Duration Bond Fund
conditions that hinder an issuer’s ability to make interest and principal payments on its debt.
The Fund may also be subject to prepayment risk, the risk that the principal of a fixed income security that is held by the Fund may be prepaid prior to maturity, potentially forcing the Fund to reinvest that money at a lower interest rate.
International investments entail risks not ordinarily associated with U.S. investments including fluctuation in currency values, differences in accounting principles, or economic or political instability in other nations.
Investing in emerging markets can be riskier than investing in established foreign markets due to increased volatility and lower trading volume.
High yielding, noninvestment grade bonds (junk bonds) involve higher risk than investment grade bonds.
The Fund may experience portfolio turnover in excess of 100%, which could result in higher transaction costs and tax liability.
The Fund may invest in derivatives, which may involve additional expenses and are subject to risk, including the risk that an underlying security or securities index moves in the opposite direction from what the portfolio manager anticipated. A derivative transaction depends upon the counterparties’ ability to fulfill their contractual obligations.
2 The Fund’s expense ratios, as described in the most recent prospectus, are disclosed in the following “Fund expense ratios” table. Delaware Management Company has agreed to reimburse certain expenses and/or waive certain fees in order to prevent total annual fund operating expenses (excluding any 12b-1 fees, taxes, interest, short sale and dividend interest expenses, brokerage fees, certain insurance costs, acquired fund fees and expenses, and nonroutine expenses or costs, including, but not limited to, those relating to reorganizations, litigation, conducting shareholder meetings, and liquidations (collectively, nonroutine expenses)) from exceeding 0.71% of the Fund’s average daily net assets during the period from Aug. 1, 2014 through July 31, 2015.* Please see the most recent prospectus and any applicable supplement(s) for additional information on these fee waivers and/or reimbursements.
| | | | | | | | |
Fund expense ratios | | Class A | | Class C | | Class R | | Institutional Class |
Total annual operating expenses | | 1.00% | | 1.75% | | 1.25% | | 0.75% |
(without fee waivers) | | | | | | | | |
Net expenses | | 0.96% | | 1.71% | | 1.21% | | 0.71% |
(including fee waivers, if any) | | | | | | | | |
Type of waiver | | Contractual | | Contractual | | Contractual | | Contractual |
|
*The contractual waiver period is from Nov. 27, 2013, through Nov. 30, 2015.
8
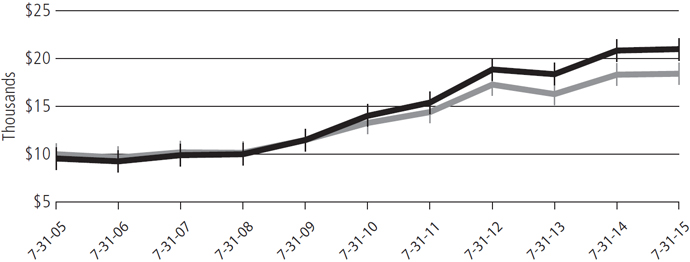
Performance of a $10,000 investment1
Average annual total returns from July 31, 2005, through July 31, 2015
| | | | | | | | | | |
For period beginning July 31, 2005, through July 31, 2015 | | Starting value | | | Ending value | |
Delaware Extended Duration Bond Fund — Class A shares | | | $9,550 | | | | $20,981 | |
Barclays Long U.S. Corporate Index | | | $10,000 | | | | $18,390 | |
1The “Performance of a $10,000 investment” graph assumes $10,000 invested in Class A shares of the Fund on July 31, 2005, and includes the effect of a 4.50% front-end sales charge and the reinvestment of all distributions. The graph does not reflect the deduction of taxes the shareholders would pay on Fund distributions or redemptions of Fund shares. Expense limitations were in effect for some or all of the periods shown. Performance would have been lower had expense limitations not been in effect. Expenses are listed in the “Fund expense ratios” table on page 8. Please note additional details on pages 7 through 9.
The graph also assumes $10,000 invested in the Barclays Long U.S. Corporate Index as of
July 31, 2005. The Barclays Long U.S. Corporate Index is composed of U.S. dollar-denominated, investment grade, SEC-registered corporate bonds issued by industrial, utility, and financial companies. All bonds in the index have at least 10 years to maturity.
Index performance returns do not reflect any management fees, transaction costs, or expenses. Indices are unmanaged and one cannot invest directly in an index. Past performance is not a guarantee of future results.
Performance of other Fund classes will vary due to different charges and expenses.
| | | | | | |
| | | Nasdaq symbols | | CUSIPs | | |
Class A | | DEEAX | | 245908835 | | |
Class C | | DEECX | | 245908819 | | |
Class R | | DEERX | | 245908728 | | |
Institutional Class | | DEEIX | | 245908793 | | |
9
Disclosure of Fund expenses
For the six-month period from February 1, 2015 to July 31, 2015 (Unaudited)
As a shareholder of a Fund, you incur two types of costs: (1) transaction costs, including sales charges (loads) on purchase payments, reinvested dividends, or other distributions; redemption fees; and exchange fees; and (2) ongoing costs, including management fees; distribution and/or service (12b-1) fees; and other Fund expenses. These following examples are intended to help you understand your ongoing costs (in dollars) of investing in a Fund and to compare these costs with the ongoing costs of investing in other mutual funds.
The examples are based on an investment of $1,000 invested at the beginning of the period and held for the entire six-month period from Feb. 1, 2015 to July 31, 2015.
Actual expenses
The first section of the tables shown, “Actual Fund return,” provides information about actual account values and actual expenses. You may use the information in this section of the table, together with the amount you invested, to estimate the expenses that you paid over the period. Simply divide your account value by $1,000 (for example, an $8,600 account value divided by $1,000 = 8.6), then multiply the result by the number in the first section under the heading entitled “Expenses Paid During Period” to estimate the expenses you paid on your account during this period.
Hypothetical example for comparison purposes
The second section of the tables shown, “Hypothetical 5% return,” provides information about hypothetical account values and hypothetical expenses based on the Funds’ actual expense ratios and an assumed rate of return of 5% per year before expenses, which is not the Funds’ actual return. The hypothetical account values and expenses may not be used to estimate the actual ending account balance or expenses you paid for the period. You may use this information to compare the ongoing costs of investing in each Fund and other funds. To do so, compare this 5% hypothetical example with the 5% hypothetical examples that appear in the shareholder reports of the other funds.
Please note that the expenses shown in the tables are meant to highlight your ongoing costs only and do not reflect any transactional costs, such as sales charges (loads), redemption fees, or exchange fees. Therefore, the second section of each table is useful in comparing ongoing costs only, and will not help you determine the relative total costs of owning different funds. In addition, if these transactional costs were included, your costs would have been higher. The Funds’ expenses shown in the tables reflect fee waivers in effect. The expenses shown in each table assume reinvestment of all dividends and distributions.
10
Delaware Corporate Bond Fund
Expense analysis of an investment of $1,000
| | | | | | | | | | | | | | | | | | | | |
| | | Beginning Account Value 2/1/15 | | Ending Account Value 7/31/15 | | Annualized Expense Ratio | | Expenses Paid During Period 2/1/15 to 7/31/15* |
Actual Fund return† | | | | | | | | | | | | | | | | | | | | |
Class A | | | $ | 1,000.00 | | | | | $977.90 | | | | | 0.96 | % | | | | $4.71 | |
Class C | | | | 1,000.00 | | | | | 974.20 | | | | | 1.71 | % | | | | 8.37 | |
Class R | | | | 1,000.00 | | | | | 978.30 | | | | | 1.21 | % | | | | 5.94 | |
Institutional Class | | | | 1,000.00 | | | | | 979.10 | | | | | 0.71 | % | | | | 3.48 | |
Hypothetical 5% return (5% return before expenses) | |
Class A | | | $ | 1,000.00 | | | | | $1,020.03 | | | | | 0.96 | % | | | | $4.81 | |
Class C | | | | 1,000.00 | | | | | 1,016.31 | | | | | 1.71 | % | | | | 8.55 | |
Class R | | | | 1,000.00 | | | | | 1,018.79 | | | | | 1.21 | % | | | | 6.06 | |
Institutional Class | | | | 1,000.00 | | | | | 1,021.27 | | | | | 0.71 | % | | | | 3.56 | |
Delaware Extended Duration Bond Fund
Expense analysis of an investment of $1,000
| | | | | | | | | | | | | | | | | | | | |
| | | Beginning Account Value 2/1/15 | | Ending Account Value 7/31/15 | | Annualized Expense Ratio | | Expenses Paid During Period 2/1/15 to 7/31/15* |
Actual Fund return† | | | | | | | | | | | | | | | | | | | | |
Class A | | | $ | 1,000.00 | | | | | $922.90 | | | | | 1.00 | % | | | | $4.77 | |
Class C | | | | 1,000.00 | | | | | 919.50 | | | | | 1.75 | % | | | | 8.33 | |
Class R | | | | 1,000.00 | | | | | 921.90 | | | | | 1.25 | % | | | | 5.96 | |
Institutional Class | | | | 1,000.00 | | | | | 924.00 | | | | | 0.75 | % | | | | 3.58 | |
Hypothetical 5% return (5% return before expenses) | |
Class A | | | $ | 1,000.00 | | | | $ | 1,019.84 | | | | | 1.00 | % | | | | $5.01 | |
Class C | | | | 1,000.00 | | | | | 1,016.12 | | | | | 1.75 | % | | | | 8.75 | |
Class R | | | | 1,000.00 | | | | | 1,018.60 | | | | | 1.25 | % | | | | 6.26 | |
Institutional Class | | | | 1,000.00 | | | | | 1,021.08 | | | | | 0.75 | % | | | | 3.76 | |
| * | “Expenses Paid During Period” are equal to the relevant Fund’s annualized expense ratio, multiplied by the average account value over the period, multiplied by 181/365 (to reflect the one-half year period). |
| † | Because actual returns reflect only the most recent six-month period, the returns shown may differ significantly from fiscal year returns. |
11
| | | | |
| Security type / sector allocations | | | | |
| Delaware Corporate Bond Fund | | | As of July 31, 2015 (Unaudited) | |
Sector designations may be different than the sector designations presented in other fund materials. The sector designations may represent the investment manager’s internal sector classifications, which may result in the sector designations for one fund being different than another fund’s sector designations.
| | | | | |
| Security type / sector | | Percentage of net assets |
Convertible Bond | | | | 0.31 | % |
Corporate Bonds | | | | 91.63 | % |
Banking | | | | 15.10 | % |
Basic Industry | | | | 6.66 | % |
Brokerage | | | | 0.99 | % |
Capital Goods | | | | 2.10 | % |
Communications | | | | 14.63 | % |
Consumer Cyclical | | | | 6.78 | % |
Consumer Non-Cyclical | | | | 4.97 | % |
Electric | | | | 9.06 | % |
Energy | | | | 13.14 | % |
Finance Companies | | | | 1.77 | % |
Insurance | | | | 4.27 | % |
Natural Gas | | | | 0.44 | % |
Real Estate Investment Trusts | | | | 3.51 | % |
Technology | | | | 6.51 | % |
Transportation | | | | 1.70 | % |
Municipal Bonds | | | | 1.46 | % |
Non-Agency Asset-Backed Security | | | | 0.33 | % |
Senior Secured Loans | | | | 1.11 | % |
U.S. Treasury Obligations | | | | 0.78 | % |
Preferred Stock | | | | 3.44 | % |
Short-Term Investments | | | | 1.47 | % |
Total Value of Securities | | | | 100.53 | % |
Liabilities Net of Receivables and Other Assets | | | | (0.53 | %) |
Total Net Assets | | | | 100.00 | % |
12
| | |
| Delaware Extended Duration Bond Fund | | As of July 31, 2015 (Unaudited) |
Sector designations may be different than the sector designations presented in other fund materials. The sector designations may represent the investment manager’s internal sector classifications, which may result in the sector designations for one fund being different than another fund’s sector designations.
| | | | | |
| Security type / sector | | Percentage of net assets |
Corporate Bonds | | | | 85.55 | % |
Banking | | | | 10.80 | % |
Basic Industry | | | | 7.37 | % |
Brokerage | | | | 1.58 | % |
Capital Goods | | | | 1.82 | % |
Communications | | | | 11.90 | % |
Consumer Cyclical | | | | 5.38 | % |
Consumer Non-Cyclical | | | | 6.73 | % |
Electric | | | | 11.94 | % |
Energy | | | | 8.79 | % |
Finance Companies | | | | 3.87 | % |
Insurance | | | | 6.58 | % |
Natural Gas | | | | 2.42 | % |
Technology | | | | 4.84 | % |
Transportation | | | | 1.53 | % |
Municipal Bonds | | | | 4.67 | % |
Senior Secured Loans | | | | 0.46 | % |
U.S. Treasury Obligation | | | | 1.29 | % |
Preferred Stock | | | | 3.31 | % |
Short-Term Investments | | | | 5.37 | % |
Total Value of Securities | | | | 100.65 | % |
Liabilities Net of Receivables and Other Assets | | | | (0.65 | %) |
Total Net Assets | | | | 100.00 | % |
13
| | |
| Schedules of investments | | |
| Delaware Corporate Bond Fund | | July 31, 2015 |
| | | | | | | | |
| | | Principal amount° | | | Value (U.S. $) | |
| |
Convertible Bond – 0.31% | | | | | | | | |
| |
Abengoa 144A 5.125% exercise price $38.08, expiration date 2/23/17 # | | | 5,000,000 | | | $ | 4,603,125 | |
| | | | | | | | |
Total Convertible Bond (cost $4,897,500) | | | | | | | 4,603,125 | |
| | | | | | | | |
| | |
| | | | | | | | |
| |
Corporate Bonds – 91.63% | | | | | | | | |
| |
Banking – 15.10% | | | | | | | | |
Ally Financial 8.00% 11/1/31 | | | 1,840,000 | | | | 2,205,700 | |
Bank of America | | | | | | | | |
3.875% 8/1/25 | | | 3,285,000 | | | | 3,323,185 | |
3.95% 4/21/25 | | | 10,980,000 | | | | 10,669,661 | |
BBVA Bancomer 144A 7.25% 4/22/20 # | | | 5,835,000 | | | | 6,552,705 | |
Compass Bank 3.875% 4/10/25 | | | 7,970,000 | | | | 7,571,125 | |
Cooperatieve Centrale Raiffeisen-Boerenleenbank 4.375% 8/4/25 | | | 9,370,000 | | | | 9,432,161 | |
Credit Suisse 144A 6.50% 8/8/23 # | | | 6,235,000 | | | | 6,905,263 | |
Credit Suisse Group | | | | | | | | |
144A 6.25% 12/29/49 #● | | | 1,500,000 | | | | 1,464,375 | |
144A 7.50% 12/29/49 #● | | | 3,120,000 | | | | 3,329,040 | |
Credit Suisse Group Funding Guernsey 144A 3.75% 3/26/25 # | | | 4,965,000 | | | | 4,848,193 | |
Fifth Third Bancorp 2.875% 7/27/20 | | | 2,080,000 | | | | 2,088,969 | |
Goldman Sachs Group 5.375% 12/29/49 ● | | | 11,130,000 | | | | 11,077,133 | |
ING Groep | | | | | | | | |
6.00% 12/29/49 ● | | | 1,685,000 | | | | 1,698,691 | |
6.50% 12/29/49 ● | | | 6,345,000 | | | | 6,257,756 | |
JPMorgan Chase | | | | | | | | |
3.90% 7/15/25 | | | 7,635,000 | | | | 7,791,846 | |
4.125% 12/15/26 | | | 4,260,000 | | | | 4,242,977 | |
4.95% 6/1/45 | | | 5,025,000 | | | | 5,043,899 | |
6.75% 1/29/49 ● | | | 4,126,000 | | | | 4,376,139 | |
KeyBank | | | | | | | | |
3.18% 5/22/22 | | | 5,495,000 | | | | 5,555,901 | |
3.30% 6/1/25 | | | 12,065,000 | | | | 11,842,497 | |
Lloyds Banking Group | | | | | | | | |
4.50% 11/4/24 | | | 2,005,000 | | | | 2,028,013 | |
7.50% 4/30/49 ● | | | 4,370,000 | | | | 4,566,650 | |
Morgan Stanley | | | | | | | | |
2.80% 6/16/20 | | | 1,400,000 | | | | 1,408,600 | |
4.00% 7/23/25 | | | 4,280,000 | | | | 4,369,234 | |
4.35% 9/8/26 | | | 13,395,000 | | | | 13,399,648 | |
MUFG Americas Holdings 3.00% 2/10/25 | | | 2,285,000 | | | | 2,176,554 | |
Nordea Bank 144A 6.125% 12/29/49 #● | | | 3,540,000 | | | | 3,535,575 | |
14
| | | | | | | | |
| | | Principal amount° | | | Value (U.S. $) | |
| |
Corporate Bonds (continued) | | | | | | | | |
| |
Banking (continued) | | | | | | | | |
PNC Bank | | | | | | | | |
1.85% 7/20/18 | | | 3,500,000 | | | $ | 3,507,473 | |
2.60% 7/21/20 | | | 3,500,000 | | | | 3,526,376 | |
Popular 7.00% 7/1/19 | | | 4,475,000 | | | | 4,312,781 | |
Regions Bank 2.25% 9/14/18 | | | 11,235,000 | | | | 11,249,920 | |
SVB Financial Group 3.50% 1/29/25 | | | 655,000 | | | | 635,417 | |
Synchrony Financial 4.50% 7/23/25 | | | 8,195,000 | | | | 8,238,884 | |
U.S. Bancorp 3.60% 9/11/24 | | | 6,730,000 | | | | 6,787,131 | |
UBS 7.625% 8/17/22 | | | 7,555,000 | | | | 8,886,516 | |
USB Capital IX 3.50% 10/29/49 ● | | | 3,207,000 | | | | 2,645,775 | |
Wells Fargo | | | | | | | | |
4.30% 7/22/27 | | | 8,525,000 | | | | 8,688,365 | |
5.875% 12/29/49 ● | | | 7,215,000 | | | | 7,395,375 | |
Woori Bank 144A 4.75% 4/30/24 # | | | 6,675,000 | | | | 6,972,264 | |
Zions Bancorporation 4.50% 6/13/23 | | | 4,100,000 | | | | 4,227,781 | |
| | | | | | | | |
| | | | | | | 224,835,548 | |
| | | | | | | | |
Basic Industry – 6.66% | | | | | | | | |
ArcelorMittal | | | | | | | | |
5.125% 6/1/20 | | | 1,000,000 | | | | 1,005,000 | |
10.60% 6/1/19 | | | 3,390,000 | | | | 4,059,525 | |
CF Industries | | | | | | | | |
5.375% 3/15/44 | | | 1,235,000 | | | | 1,208,334 | |
6.875% 5/1/18 | | | 9,165,000 | | | | 10,280,362 | |
7.125% 5/1/20 | | | 4,200,000 | | | | 4,990,058 | |
Chemours | | | | | | | | |
144A 6.625% 5/15/23 # | | | 890,000 | | | | 785,425 | |
144A 7.00% 5/15/25 # | | | 2,517,000 | | | | 2,214,180 | |
Dow Chemical 8.55% 5/15/19 | | | 4,420,000 | | | | 5,379,047 | |
Georgia-Pacific 8.00% 1/15/24 | | | 8,345,000 | | | | 10,808,402 | |
International Paper | | | | | | | | |
3.80% 1/15/26 | | | 4,280,000 | | | | 4,183,704 | |
5.00% 9/15/35 | | | 2,960,000 | | | | 2,919,244 | |
INVISTA Finance 144A 4.25% 10/15/19 # | | | 4,580,000 | | | | 4,511,300 | |
LyondellBasell Industries 4.625% 2/26/55 | | | 11,900,000 | | | | 10,499,501 | |
Methanex 4.25% 12/1/24 | | | 6,945,000 | | | | 6,908,532 | |
Mexichem 144A 5.875% 9/17/44 # | | | 5,605,000 | | | | 5,261,694 | |
NOVA Chemicals 144A 5.00% 5/1/25 # | | | 3,835,000 | | | | 3,806,237 | |
OCP 144A 4.50% 10/22/25 # | | | 4,580,000 | | | | 4,413,975 | |
PPG Industries 2.30% 11/15/19 | | | 3,370,000 | | | | 3,361,353 | |
Rockwood Specialties Group 4.625% 10/15/20 | | | 3,045,000 | | | | 3,176,224 | |
TPC Group 144A 8.75% 12/15/20 # | | | 1,250,000 | | | | 1,128,125 | |
15
Schedules of investments
Delaware Corporate Bond Fund
| | | | | | | | |
| | | Principal amount° | | | Value (U.S. $) | |
| |
Corporate Bonds (continued) | | | | | | | | |
| |
Basic Industry (continued) | | | | | | | | |
Valspar 4.40% 2/1/45 | | | 8,845,000 | | | $ | 8,191,584 | |
| | | | | | | | |
| | | | | | | 99,091,806 | |
| | | | | | | | |
Brokerage – 0.99% | | | | | | | | |
Affiliated Managers Group 3.50% 8/1/25 | | | 4,135,000 | | | | 3,999,777 | |
Jefferies Group | | | | | | | | |
5.125% 1/20/23 | | | 255,000 | | | | 260,539 | |
6.45% 6/8/27 | | | 5,627,000 | | | | 6,198,951 | |
6.50% 1/20/43 | | | 1,575,000 | | | | 1,582,377 | |
Lazard Group | | | | | | | | |
3.75% 2/13/25 | | | 1,075,000 | | | | 1,035,612 | |
6.85% 6/15/17 | | | 1,525,000 | | | | 1,657,808 | |
| | | | | | | | |
| | | | | | | 14,735,064 | |
| | | | | | | | |
Capital Goods – 2.10% | | | | | | | | |
Algeco Scotsman Global Finance 144A 8.50% 10/15/18 # | | | 5,805,000 | | | | 5,446,460 | |
Fortune Brands Home & Security 3.00% 6/15/20 | | | 2,865,000 | | | | 2,876,016 | |
Hexcel 4.70% 8/15/25 | | | 2,300,000 | | | | 2,321,974 | |
L-3 Communications 3.95% 5/28/24 | | | 8,040,000 | | | | 7,793,582 | |
Masco 4.45% 4/1/25 | | | 2,715,000 | | | | 2,728,575 | |
Siemens Financieringsmaatschappij 144A 3.25% 5/27/25 # | | | 5,375,000 | | | | 5,308,775 | |
United Rentals North America | | | | | | | | |
5.50% 7/15/25 | | | 3,855,000 | | | | 3,700,800 | |
5.75% 11/15/24 | | | 1,075,000 | | | | 1,056,187 | |
| | | | | | | | |
| | | | | | | 31,232,369 | |
| | | | | | | | |
Communications – 14.63% | | | | | | | | |
Altice 144A 7.75% 5/15/22 # | | | 3,910,000 | | | | 3,949,100 | |
Altice Financing 144A 6.625% 2/15/23 # | | | 3,945,000 | | | | 4,073,213 | |
American Tower | | | | | | | | |
2.80% 6/1/20 | | | 4,730,000 | | | | 4,690,817 | |
4.00% 6/1/25 | | | 9,130,000 | | | | 8,964,473 | |
AT&T | | | | | | | | |
3.40% 5/15/25 | | | 6,360,000 | | | | 6,087,926 | |
4.50% 5/15/35 | | | 5,390,000 | | | | 5,003,020 | |
4.75% 5/15/46 | | | 13,550,000 | | | | 12,545,986 | |
Bharti Airtel 144A 4.375% 6/10/25 # | | | 7,635,000 | | | | 7,730,201 | |
Bharti Airtel International Netherlands 144A 5.35% 5/20/24 # | | | 2,990,000 | | | | 3,244,210 | |
CBS 4.00% 1/15/26 | | | 10,275,000 | | | | 10,173,277 | |
CCO Holdings 144A 5.375% 5/1/25 # | | | 2,425,000 | | | | 2,394,687 | |
CCO Safari II | | | | | | | | |
144A 3.579% 7/23/20 # | | | 3,190,000 | | | | 3,202,272 | |
144A 4.908% 7/23/25 # | | | 9,825,000 | | | | 9,862,148 | |
16
| | | | | | | | |
| | | Principal amount° | | | Value (U.S. $) | |
| |
Corporate Bonds (continued) | | | | | | | | |
| |
Communications (continued) | | | | | | | | |
Columbus International 144A 7.375% 3/30/21 # | | | 4,785,000 | | | $ | 5,102,006 | |
Crown Castle Towers 144A 3.663% 5/15/25 # | | | 7,035,000 | | | | 6,956,911 | |
Digicel Group 144A 8.25% 9/30/20 # | | | 4,545,000 | | | | 4,510,913 | |
Grupo Televisa 5.00% 5/13/45 | | | 4,770,000 | | | | 4,560,979 | |
GTP Acquisition Partners I 144A 2.35% 6/15/20 # | | | 2,130,000 | | | | 2,118,391 | |
Historic TW 6.875% 6/15/18 | | | 5,285,000 | | | | 6,020,223 | |
iHeartCommunications 9.00% 12/15/19 | | | 2,970,000 | | | | 2,866,050 | |
Intelsat Luxembourg | | | | | | | | |
7.75% 6/1/21 | | | 2,655,000 | | | | 2,120,681 | |
8.125% 6/1/23 | | | 6,025,000 | | | | 4,820,000 | |
Myriad International Holdings 144A 5.50% 7/21/25 # | | | 2,780,000 | | | | 2,830,040 | |
Netflix 144A 5.875% 2/15/25 # | | | 2,625,000 | | | | 2,769,375 | |
Numericable-SFR 144A 6.00% 5/15/22 # | | | 1,270,000 | | | | 1,295,400 | |
Sable International Finance 144A 6.875% 8/1/22 # | | | 3,000,000 | | | | 2,959,320 | |
SBA Tower Trust | | | | | | | | |
144A 2.24% 4/16/18 # | | | 4,945,000 | | | | 4,915,973 | |
144A 2.898% 10/15/19 # | | | 755,000 | | | | 756,123 | |
Scripps Networks Interactive 3.95% 6/15/25 | | | 4,665,000 | | | | 4,593,248 | |
SES 144A 3.60% 4/4/23 # | | | 3,855,000 | | | | 3,926,930 | |
SES GLOBAL Americas Holdings 144A 5.30% 3/25/44 # | | | 7,815,000 | | | | 7,873,753 | |
Sinclair Television Group 144A 5.625% 8/1/24 # | | | 3,070,000 | | | | 3,031,625 | |
Sprint | | | | | | | | |
7.25% 9/15/21 | | | 3,145,000 | | | | 3,015,269 | |
7.625% 2/15/25 | | | 3,355,000 | | | | 3,120,150 | |
Time Warner 3.60% 7/15/25 | | | 9,270,000 | | | | 8,980,396 | |
Time Warner Cable | | | | | | | | |
4.50% 9/15/42 | | | 935,000 | | | | 757,054 | |
5.50% 9/1/41 | | | 6,635,000 | | | | 6,100,179 | |
T-Mobile USA 6.00% 3/1/23 | | | 3,500,000 | | | | 3,657,500 | |
Tribune Media 144A 5.875% 7/15/22 # | | | 1,500,000 | | | | 1,552,500 | |
UPCB Finance IV 144A 5.375% 1/15/25 # | | | 1,600,000 | | | | 1,556,000 | |
Verizon Communications | | | | | | | | |
4.40% 11/1/34 | | | 3,555,000 | | | | 3,343,140 | |
4.862% 8/21/46 | | | 16,155,000 | | | | 15,332,549 | |
Viacom 4.85% 12/15/34 | | | 9,435,000 | | | | 8,714,798 | |
WPP Finance 2010 5.625% 11/15/43 | | | 5,409,000 | | | | 5,793,309 | |
| | | | | | | | |
| | | | | | | 217,872,115 | |
| | | | | | | | |
Consumer Cyclical – 6.78% | | | | | | | | |
Bed Bath & Beyond 4.915% 8/1/34 | | | 11,115,000 | | | | 10,946,997 | |
Cencosud 144A 5.15% 2/12/25 # | | | 6,795,000 | | | | 6,841,906 | |
CVS Health 3.875% 7/20/25 | | | 13,450,000 | | | | 13,709,316 | |
Daimler Finance North America 144A 3.50% 8/3/25 # | | | 7,590,000 | | | | 7,604,960 | |
17
Schedules of investments
Delaware Corporate Bond Fund
| | | | | | | | |
| | | Principal amount° | | | Value (U.S. $) | |
| |
Corporate Bonds (continued) | |
| |
Consumer Cyclical (continued) | | | | | | | | |
Fiat Chrysler Automobiles 5.25% 4/15/23 | | | 4,255,000 | | | $ | 4,302,869 | |
General Motors | | | | | | | | |
5.20% 4/1/45 | | | 1,825,000 | | | | 1,772,548 | |
6.25% 10/2/43 | | | 2,475,000 | | | | 2,711,736 | |
General Motors Financial | | | | | | | | |
3.20% 7/13/20 | | | 1,260,000 | | | | 1,246,920 | |
3.45% 4/10/22 | | | 1,500,000 | | | | 1,447,289 | |
4.00% 1/15/25 | | | 3,695,000 | | | | 3,560,528 | |
4.30% 7/13/25 | | | 2,895,000 | | | | 2,862,703 | |
4.375% 9/25/21 | | | 3,305,000 | | | | 3,392,007 | |
Harman International Industries 4.15% 5/15/25 | | | 8,920,000 | | | | 8,886,122 | |
Kohl’s 4.25% 7/17/25 | | | 5,530,000 | | | | 5,541,325 | |
Midas Intermediate Holdco II 144A 7.875% 10/1/22 # | | | 1,175,000 | | | | 1,180,875 | |
QVC | | | | | | | | |
4.375% 3/15/23 | | | 6,645,000 | | | | 6,541,172 | |
5.45% 8/15/34 | | | 5,205,000 | | | | 4,807,869 | |
Signet UK Finance 4.70% 6/15/24 | | | 3,995,000 | | | | 4,088,843 | |
Starwood Hotels & Resorts Worldwide | | | | | | | | |
3.125% 2/15/23 | | | 3,984,000 | | | | 3,835,070 | |
3.75% 3/15/25 | | | 3,135,000 | | | | 3,056,161 | |
Wynn Las Vegas 144A 5.50% 3/1/25 # | | | 2,685,000 | | | | 2,594,381 | |
| | | | | | | | |
| | | | | | | 100,931,597 | |
| | | | | | | | |
Consumer Non-Cyclical – 4.97% | | | | | | | | |
Actavis Funding | | | | | | | | |
3.45% 3/15/22 | | | 2,185,000 | | | | 2,152,507 | |
3.80% 3/15/25 | | | 4,935,000 | | | | 4,820,538 | |
Baxalta 144A 4.00% 6/23/25 # | | | 4,435,000 | | | | 4,400,549 | |
Campbell Soup 3.30% 3/19/25 | | | 5,670,000 | | | | 5,587,757 | |
Community Health Systems 6.875% 2/1/22 | | | 4,380,000 | | | | 4,697,550 | |
EMD Finance | | | | | | | | |
144A 2.95% 3/19/22 # | | | 2,845,000 | | | | 2,792,069 | |
144A 3.25% 3/19/25 # | | | 3,480,000 | | | | 3,368,696 | |
ExamWorks Group 5.625% 4/15/23 | | | 1,750,000 | | | | 1,802,500 | |
IASIS Healthcare 8.375% 5/15/19 | | | 1,578,000 | | | | 1,647,037 | |
Imperial Tobacco Finance | | | | | | | | |
144A 3.75% 7/21/22 # | | | 4,755,000 | | | | 4,735,224 | |
144A 4.25% 7/21/25 # | | | 2,175,000 | | | | 2,176,690 | |
JB 144A 3.75% 5/13/25 # | | | 8,965,000 | | | | 8,790,362 | |
JBS Investments 144A 7.75% 10/28/20 # | | | 5,285,000 | | | | 5,734,225 | |
JBS USA 144A 5.75% 6/15/25 # | | | 5,575,000 | | | | 5,538,456 | |
Omnicare 5.00% 12/1/24 | | | 3,120,000 | | | | 3,322,800 | |
Perrigo Finance 3.50% 12/15/21 | | | 5,730,000 | | | | 5,722,981 | |
18
| | | | | | | | |
| | | Principal amount° | | | Value (U.S. $) | |
| |
Corporate Bonds (continued) | | | | | | | | |
| |
Consumer Non-Cyclical (continued) | | | | | | | | |
Quintiles Transnational 144A 4.875% 5/15/23 # | | | 1,400,000 | | | $ | 1,423,618 | |
Reynolds American 4.00% 6/12/22 | | | 2,950,000 | | | | 3,033,866 | |
Tenet Healthcare 8.125% 4/1/22 | | | 340,000 | | | | 382,289 | |
Zimmer Biomet Holdings 3.15% 4/1/22 | | | 1,835,000 | | | | 1,788,703 | |
| | | | | | | | |
| | | | | | | 73,918,417 | |
| | | | | | | | |
Electric – 9.06% | | | | | | | | |
AES Gener | | | | | | | | |
144A 5.00% 7/14/25 # | | | 3,070,000 | | | | 3,137,810 | |
144A 8.375% 12/18/73 #● | | | 7,642,000 | | | | 8,387,095 | |
Ameren Illinois 9.75% 11/15/18 | | | 6,971,000 | | | | 8,705,629 | |
Appalachian Power 3.40% 6/1/25 | | | 10,655,000 | | | | 10,594,320 | |
Calpine 5.50% 2/1/24 | | | 3,155,000 | | | | 3,076,125 | |
ComEd Financing III 6.35% 3/15/33 | | | 7,500,000 | | | | 7,861,920 | |
DTE Energy 144A 3.30% 6/15/22 # | | | 4,775,000 | | | | 4,831,101 | |
Dynegy | | | | | | | | |
144A 7.375% 11/1/22 # | | | 3,130,000 | | | | 3,253,635 | |
144A 7.625% 11/1/24 # | | | 2,000,000 | | | | 2,075,000 | |
El Paso Electric 3.30% 12/15/22 | | | 2,830,000 | | | | 2,757,846 | |
Electricite de France 144A 5.25% 1/29/49 #● | | | 7,000,000 | | | | 7,201,250 | |
Enel 144A 8.75% 9/24/73 #● | | | 4,125,000 | | | | 4,851,000 | |
Entergy 4.00% 7/15/22 | | | 3,000,000 | | | | 3,061,683 | |
Entergy Louisiana 3.78% 4/1/25 | | | 7,220,000 | | | | 7,313,333 | |
Exelon 3.95% 6/15/25 | | | 3,880,000 | | | | 3,940,450 | |
Integrys Energy Group 6.11% 12/1/66 ● | | | 7,419,000 | | | | 6,530,664 | |
Korea East-West Power 144A 2.625% 11/27/18 # | | | 6,345,000 | | | | 6,458,874 | |
NV Energy 6.25% 11/15/20 | | | 4,475,000 | | | | 5,200,653 | |
Pennsylvania Electric 5.20% 4/1/20 | | | 16,291,000 | | | | 17,895,566 | |
State Grid Overseas Investment 2014 144A 2.75% 5/7/19 # | | | 8,785,000 | | | | 8,950,457 | |
Trans-Allegheny Interstate Line 144A 3.85% 6/1/25 # | | | 2,000,000 | | | | 2,003,510 | |
WEC Energy Group | | | | | | | | |
2.45% 6/15/20 | | | 2,850,000 | | | | 2,861,029 | |
3.55% 6/15/25 | | | 3,900,000 | | | | 3,913,120 | |
| | | | | | | | |
| | | | | | | 134,862,070 | |
| | | | | | | | |
Energy – 13.14% | | | | | | | | |
Anadarko Petroleum 4.50% 7/15/44 | | | 6,455,000 | | | | 5,895,067 | |
Chesapeake Energy | | | | | | | | |
4.875% 4/15/22 | | | 1,955,000 | | | | 1,583,550 | |
5.75% 3/15/23 | | | 4,570,000 | | | | 3,884,500 | |
CNOOC Finance 2015 Australia 2.625% 5/5/20 | | | 3,400,000 | | | | 3,353,206 | |
CNOOC Finance 2015 USA 3.50% 5/5/25 | | | 4,070,000 | | | | 3,940,574 | |
19
Schedules of investments
Delaware Corporate Bond Fund
| | | | | | | | |
| | | Principal amount° | | | Value (U.S. $) | |
| |
Corporate Bonds (continued) | | | | | | | | |
| |
Energy (continued) | | | | | | | | |
Columbia Pipeline Group | | | | | | | | |
144A 2.45% 6/1/18 # | | | 1,535,000 | | | $ | 1,545,926 | |
144A 3.30% 6/1/20 # | | | 6,630,000 | | | | 6,668,374 | |
144A 4.50% 6/1/25 # | | | 2,165,000 | | | | 2,158,319 | |
Continental Resources 4.50% 4/15/23 | | | 12,135,000 | | | | 11,286,387 | |
Ecopetrol 5.375% 6/26/26 | | | 3,475,000 | | | | 3,375,963 | |
Enbridge Energy Partners 8.05% 10/1/37 ● | | | 6,190,000 | | | | 6,354,035 | |
Energy Transfer Equity 5.50% 6/1/27 | | | 3,475,000 | | | | 3,422,875 | |
Energy Transfer Partners 4.75% 1/15/26 | | | 2,545,000 | | | | 2,492,690 | |
EnLink Midstream Partners 4.15% 6/1/25 | | | 4,620,000 | | | | 4,369,263 | |
Enterprise Products Operating | | | | | | | | |
3.70% 2/15/26 | | | 8,510,000 | | | | 8,257,934 | |
7.034% 1/15/68 ● | | | 9,021,000 | | | | 9,675,023 | |
Exxon Mobil 2.397% 3/6/22 | | | 2,700,000 | | | | 2,659,084 | |
Kinder Morgan 144A 5.00% 2/15/21 # | | | 2,710,000 | | | | 2,835,541 | |
Kinder Morgan Energy Partners 9.00% 2/1/19 | | | 2,805,000 | | | | 3,344,988 | |
Marathon Oil 3.85% 6/1/25 | | | 14,205,000 | | | | 13,809,590 | |
Newfield Exploration 5.625% 7/1/24 | | | 4,150,000 | | | | 4,087,750 | |
Noble Energy 5.05% 11/15/44 | | | 3,540,000 | | | | 3,321,727 | |
Noble Holding International 4.00% 3/16/18 | | | 740,000 | | | | 739,321 | |
Petrobras Global Finance | | | | | | | | |
3.00% 1/15/19 | | | 250,000 | | | | 227,500 | |
4.875% 3/17/20 | | | 5,600,000 | | | | 5,217,016 | |
Petroleos Mexicanos | | | | | | | | |
144A 4.25% 1/15/25 # | | | 1,920,000 | | | | 1,874,880 | |
5.50% 6/27/44 | | | 2,486,000 | | | | 2,311,980 | |
144A 5.50% 6/27/44 # | | | 1,000,000 | | | | 930,000 | |
Petronas Global Sukuk 144A 2.707% 3/18/20 # | | | 5,095,000 | | | | 5,072,388 | |
Regency Energy Partners 5.875% 3/1/22 | | | 13,966,000 | | | | 14,811,669 | |
Shell International Finance 3.25% 5/11/25 | | | 7,655,000 | | | | 7,577,210 | |
Talisman Energy 3.75% 2/1/21 | | | 10,330,000 | | | | 10,147,892 | |
TransCanada PipeLines 3.75% 10/16/23 | | | 3,020,000 | | | | 3,059,737 | |
Valero Energy 4.90% 3/15/45 | | | 2,915,000 | | | | 2,760,391 | |
Weatherford International 4.50% 4/15/22 | | | 8,464,000 | | | | 7,694,013 | |
Western Gas Partners 3.95% 6/1/25 | | | 2,820,000 | | | | 2,702,209 | |
Williams Partners 7.25% 2/1/17 | | | 8,087,000 | | | | 8,703,666 | |
Woodside Finance | | | | | | | | |
144A 3.65% 3/5/25 # | | | 4,215,000 | | | | 4,077,717 | |
144A 8.75% 3/1/19 # | | | 7,800,000 | | | | 9,337,271 | |
| | | | | | | | |
| | | | | | | 195,567,226 | |
| | | | | | | | |
Finance Companies – 1.77% | | | | | | | | |
Aviation Capital Group 144A 6.75% 4/6/21 # | | | 3,415,000 | | | | 3,890,016 | |
20
| | | | | | | | |
| | | Principal amount° | | | Value (U.S. $) | |
| |
Corporate Bonds (continued) | | | | | | | | |
| |
Finance Companies (continued) | | | | | | | | |
Depository Trust & Clearing 144A 4.875% 12/29/49 #● | | | 6,000,000 | | | $ | 6,042,000 | |
General Electric Capital 7.125% 12/29/49 ● | | | 6,300,000 | | | | 7,292,250 | |
Peachtree Corners Funding Trust 144A 3.976% 2/15/25 # | | | 9,115,000 | | | | 9,143,211 | |
| | | | | | | | |
| | | | | | | 26,367,477 | |
| | | | | | | | |
Insurance – 4.27% | | | | | | | | |
American International Group | | | | | | | | |
3.75% 7/10/25 | | | 1,500,000 | | | | 1,502,982 | |
4.125% 2/15/24 | | | 6,565,000 | | | | 6,813,518 | |
Highmark | | | | | | | | |
144A 4.75% 5/15/21 # | | | 1,685,000 | | | | 1,738,088 | |
144A 6.125% 5/15/41 # | | | 920,000 | | | | 927,957 | |
HUB International 144A 7.875% 10/1/21 # | | | 4,540,000 | | | | 4,647,825 | |
MetLife 5.25% 12/29/49 ● | | | 10,550,000 | | | | 10,550,000 | |
MetLife Capital Trust X 144A 9.25% 4/8/38 # | | | 2,160,000 | | | | 3,028,968 | |
Prudential Financial 5.375% 5/15/45 ● | | | 3,370,000 | | | | 3,332,087 | |
TIAA Asset Management Finance | | | | | | | | |
144A 2.95% 11/1/19 # | | | 3,570,000 | | | | 3,610,555 | |
144A 4.125% 11/1/24 # | | | 9,450,000 | | | | 9,643,819 | |
UnitedHealth Group 3.75% 7/15/25 | | | 5,760,000 | | | | 5,877,348 | |
Voya Financial 5.65% 5/15/53 ● | | | 3,040,000 | | | | 3,120,864 | |
XLIT | | | | | | | | |
4.45% 3/31/25 | | | 6,405,000 | | | | 6,385,593 | |
6.50% 10/29/49 ● | | | 2,822,000 | | | | 2,398,700 | |
| | | | | | | | |
| | | | | | | 63,578,304 | |
| | | | | | | | |
Natural Gas – 0.44% | | | | | | | | |
Korea Gas 144A 2.875% 7/29/18 # | | | 6,425,000 | | | | 6,595,558 | |
| | | | | | | | |
| | | | | | | 6,595,558 | |
| | | | | | | | |
Real Estate Investment Trusts – 3.51% | | | | | | | | |
AvalonBay Communities 3.45% 6/1/25 | | | 6,295,000 | | | | 6,269,940 | |
CBL & Associates 4.60% 10/15/24 | | | 4,920,000 | | | | 4,900,236 | |
Corporate Office Properties 5.25% 2/15/24 | | | 5,730,000 | | | | 5,921,113 | |
Education Realty Operating Partnership 4.60% 12/1/24 | | | 4,170,000 | | | | 4,215,169 | |
Host Hotels & Resorts | | | | | | | | |
3.75% 10/15/23 | | | 8,645,000 | | | | 8,537,655 | |
4.75% 3/1/23 | | | 3,825,000 | | | | 4,035,822 | |
Omega Healthcare Investors 4.50% 1/15/25 | | | 12,590,000 | | | | 12,476,677 | |
Ventas Realty 4.125% 1/15/26 | | | 2,690,000 | | | | 2,700,445 | |
WP Carey 4.60% 4/1/24 | | | 3,120,000 | | | | 3,159,402 | |
| | | | | | | | |
| | | | | | | 52,216,459 | |
| | | | | | | | |
Technology – 6.51% | | | | | | | | |
Apple 3.45% 2/9/45 | | | 18,620,000 | | | | 16,006,590 | |
Baidu 2.75% 6/9/19 | | | 5,430,000 | | | | 5,436,396 | |
21
Schedules of investments
Delaware Corporate Bond Fund
| | | | | | | | |
| | | Principal amount° | | | Value (U.S. $) | |
| |
Corporate Bonds (continued) | | | | | | | | |
| |
Technology (continued) | | | | | | | | |
Cisco Systems 3.50% 6/15/25 | | | 1,645,000 | | | $ | 1,673,281 | |
Dun & Bradstreet 4.00% 6/15/20 | | | 3,695,000 | | | | 3,718,216 | |
First Data 11.75% 8/15/21 | | | 3,500,000 | | | | 3,981,250 | |
Flextronics International 144A 4.75% 6/15/25 # | | | 5,110,000 | | | | 5,001,413 | |
Intel 3.70% 7/29/25 | | | 3,150,000 | | | | 3,183,695 | |
Molex Electronic Technologies 144A 3.90% 4/15/25 # | | | 3,860,000 | | | | 3,759,902 | |
Motorola Solutions | | | | | | | | |
3.50% 3/1/23 | | | 2,130,000 | | | | 2,024,211 | |
4.00% 9/1/24 | | | 6,605,000 | | | | 6,467,788 | |
National Semiconductor 6.60% 6/15/17 | | | 6,644,000 | | | | 7,309,696 | |
Oracle | | | | | | | | |
2.50% 5/15/22 | | | 1,640,000 | | | | 1,595,208 | |
2.95% 5/15/25 | | | 4,785,000 | | | | 4,615,597 | |
3.25% 5/15/30 | | | 1,595,000 | | | | 1,482,029 | |
4.125% 5/15/45 | | | 4,045,000 | | | | 3,829,418 | |
QUALCOMM | | | | | | | | |
3.00% 5/20/22 | | | 3,725,000 | | | | 3,625,919 | |
3.45% 5/20/25 | | | 3,465,000 | | | | 3,285,253 | |
Seagate HDD Cayman | | | | | | | | |
4.75% 1/1/25 | | | 8,825,000 | | | | 8,753,862 | |
144A 4.875% 6/1/27 # | | | 5,470,000 | | | | 5,273,578 | |
Tencent Holdings 144A 3.375% 5/2/19 # | | | 5,810,000 | | | | 5,950,765 | |
| | | | | | | | |
| | | | | | | 96,974,067 | |
| | | | | | | | |
Transportation – 1.70% | | | | | | | | |
Air Canada 2015-1 Class A Pass Through Trust 144A 3.60% 3/15/27 #¿ | | | 2,585,000 | | | | 2,507,967 | |
American Airlines 2014-1 Class A Pass Through Trust 3.70% 10/1/26 ¿ | | | 1,965,650 | | | | 1,953,267 | |
American Airlines 2015-1 Class A Pass Through Trust 3.375% 5/1/27 ¿ | | | 3,265,000 | | | | 3,175,213 | |
Avis Budget Car Rental 144A 5.25% 3/15/25 # | | | 3,500,000 | | | | 3,346,875 | |
HPHT Finance 15 144A 2.875% 3/17/20 # | | | 4,665,000 | | | | 4,647,338 | |
Trinity Industries 4.55% 10/1/24 | | | 4,290,000 | | | | 4,203,780 | |
United Airlines 2014-1 Class A Pass Through Trust 4.00% 4/11/26 ¿ | | | 1,560,000 | | | | 1,571,700 | |
United Airlines 2014-2 Class A Pass Through Trust 3.75% 9/3/26 ¿ | | | 3,885,000 | | | | 3,855,863 | |
| | | | | | | | |
| | | | | | | 25,262,003 | |
| | | | | | | | |
Total Corporate Bonds (cost $1,371,781,322) | | | | | | | 1,364,040,080 | |
| | | | | | | | |
22
| | | | | | | | |
| | | Principal amount° | | | Value (U.S. $) | |
| |
Municipal Bonds – 1.46% | | | | | | | | |
| |
California (Various Purpose)
5.00% 4/1/43 | | | 6,520,000 | | | $ | 7,293,207 | |
Chicago, Illinois
(Taxable Build America Bond) Series B 7.75% 1/1/42 | | | 4,490,000 | | | | 4,436,703 | |
Los Angeles, California Department of Water & Power Revenue (Taxable Build America Bond)
Series D 6.574% 7/1/45 | | | 5,365,000 | | | | 7,304,555 | |
Texas Private Activity Bond Surface Transportation Revenue Bond
(Senior Lien NTE Mobility Partners Segment 3) 6.75% 6/30/43 (AMT) | | | 2,200,000 | | | | 2,675,310 | |
| | |
| | | | | | | | |
Total Municipal Bonds (cost $18,919,593) | | | | | | | 21,709,775 | |
| | | | | | | | |
|
| |
Non-Agency Asset-Backed Security – 0.33% | | | | | | | | |
| |
Wendys Funding
Series 2015-1A A2I 144A 3.371% 6/15/45 # | | | 5,000,000 | | | | 4,997,225 | |
| | | | | | | | |
Total Non-Agency Asset-Backed Security (cost $5,000,000) | | | | | | | 4,997,225 | |
| | | | | | | | |
|
| |
Senior Secured Loans – 1.11%« | | | | | | | | |
| |
Air Medical Group Holdings Tranche B 1st Lien 4.50% 4/28/22 | | | 3,500,000 | | | | 3,486,147 | |
Avaya 4.691% 10/26/17 | | | 3,455,000 | | | | 3,433,168 | |
Gardner Denver 4.25% 7/30/20 | | | 2,992,386 | | | | 2,894,200 | |
iHeartCommunications Tranche D 6.94% 1/30/19 | | | 3,620,000 | | | | 3,333,415 | |
Rite Aid 5.75% 8/21/20 | | | 3,299,000 | | | | 3,338,176 | |
| | | | | | | | |
Total Senior Secured Loans (cost $16,740,348) | | | | | | | 16,485,106 | |
| | | | | | | | |
|
| |
U.S. Treasury Obligations – 0.78% | | | | | | | | |
| |
U.S. Treasury Bond
3.00% 5/15/45 | | | 6,080,000 | | | | 6,165,497 | |
U.S. Treasury Note
2.125% 5/15/25 | | | 5,480,000 | | | | 5,442,752 | |
| | | | | | | | |
Total U.S. Treasury Obligations (cost $11,549,085) | | | | | | | 11,608,249 | |
| | | | | | | | |
| | |
| | | Number of shares | | | | |
| |
Preferred Stock – 3.44% | | | | | | | | |
| |
Ally Financial | | | | | | | | |
144A 7.00% # | | | 2,002 | | | | 2,042,854 | |
8.50% ● | | | 33,359 | | | | 868,335 | |
Bank of America | | | | | | | | |
6.10% ● | | | 2,840,000 | | | | 2,830,770 | |
6.50% ● | | | 8,275,000 | | | | 8,554,281 | |
23
Schedules of investments
Delaware Corporate Bond Fund
| | | | | | | | |
| | | Number of shares | | | Value (U.S. $) | |
| |
Preferred Stock (continued) | | | | | | | | |
| |
DTE Energy 5.25% | | | 305,000 | | | $ | 7,365,750 | |
Entergy Arkansas 4.90% | | | 285,000 | | | | 6,973,950 | |
GMAC Capital Trust I 8.125% ● | | | 50,000 | | | | 1,311,500 | |
Morgan Stanley 5.55% ● | | | 8,345,000 | | | | 8,313,706 | |
PNC Preferred Funding Trust II 144A 1.508% #● | | | 8,600,000 | | | | 7,933,500 | |
Qwest 6.125% | | | 184,675 | | | | 4,644,576 | |
USB Realty 144A 1.436% #● | | | 400,000 | | | | 369,000 | |
| | | | | | | | |
Total Preferred Stock (cost $50,766,883) | | | | | | | 51,208,222 | |
| | | | | | | | |
| | |
| | | Principal amount° | | | | |
| |
Short-Term Investments – 1.47% | | | | | | | | |
| |
Discount Notes – 1.47%≠ | | | | | | | | |
Federal Home Loan Bank | | | | | | | | |
0.05% 8/14/15 | | | 856,499 | | | | 856,496 | |
0.065% 9/2/15 | | | 822,496 | | | | 822,468 | |
0.10% 10/23/15 | | | 822,496 | | | | 822,403 | |
Freddie Mac 0.075% 10/1/15 | | | 19,453,382 | | | | 19,451,787 | |
| | | | | | | | |
Total Short-Term Investments (cost $21,952,147) | | | | | | | 21,953,154 | |
| | | | | | | | |
| | |
Total Value of Securities – 100.53% | | | | | | | | |
(cost $1,501,606,878) | | | | | | $ | 1,496,604,936 | |
| | | | | | | | |
| | |
| # | | Security exempt from registration under Rule 144A of the Securities Act of 1933, as amended. At July 31, 2015, the aggregate value of Rule 144A securities was $395,628,375, which represents 26.58% of the Fund’s net assets. See Note 11 in “Notes to financial statements.” |
¿ | | Pass Through Agreement. Security represents the contractual right to receive a proportionate amount of underlying payments due to the counterparty pursuant to various agreements related to the rescheduling of obligations and the exchange of certain notes. |
≠ | | The rate shown is the effective yield at the time of purchase. |
° | | Principal amount shown is stated in U.S. dollars unless noted that the security is denominated in another currency. |
● | | Variable rate security. The rate shown is the rate as of July 31, 2015. Interest rates reset periodically. |
« | | Senior secured loans generally pay interest at rates which are periodically redetermined by reference to a base lending rate plus a premium. These base lending rates are generally: (i) the prime rate offered by one or more U.S. banks, (ii) the lending rate offered by one or more European banks such as the London Interbank Offered Rate (LIBOR), and (iii) the certificate of deposit rate. Senior secured loans may be subject to restrictions on resale. Stated rate in effect at July 31, 2015. |
24
The following futures contracts were outstanding at July 31, 2015:1
Futures Contracts
| | | | | | | | | | | | | | | | |
Contracts to Buy (Sell) | | | | Notional Cost (Proceeds) | | | | Notional Value | | | | Expiration
Date | | | | Unrealized Appreciation (Depreciation) |
(206) U.S. Treasury 10 yr Notes | | | | $(25,764,699) | | | | $(26,252,125) | | | | 9/21/15 | | | | $ (487,426) |
The use of futures contracts involves elements of market risk and risks in excess of the amounts disclosed in the financial statements. The notional values presented above represent the Fund’s total exposure in such contracts, whereas only the net unrealized appreciation (depreciation) is reflected in the Fund’s net assets.
1See Note 8 in “Notes to financial statements.”
Summary of abbreviations:
AMT – Subject to Alternative Minimum Tax
yr – Year
See accompanying notes, which are an integral part of the financial statements.
25
| | |
| Schedules of investments | | |
| Delaware Extended Duration Bond Fund | | July 31, 2015 |
| | | | | | | | |
| | | Principal amount° | | | Value (U.S. $) | |
| |
Corporate Bonds – 85.55% | | | | | | | | |
| |
Banking – 10.80% | | | | | | | | |
Ally Financial 8.00% 11/1/31 | | | 595,000 | | | $ | 713,256 | |
Bank of America 3.95% 4/21/25 | | | 1,575,000 | | | | 1,530,484 | |
BBVA Bancomer 144A 7.25% 4/22/20 # | | | 3,095,000 | | | | 3,475,685 | |
Citigroup 4.65% 7/30/45 | | | 4,570,000 | | | | 4,629,072 | |
Cooperatieve Centrale Raiffeisen-Boerenleenbank 5.25% 8/4/45 | | | 10,035,000 | | | | 10,256,784 | |
Credit Suisse 144A 6.50% 8/8/23 # | | | 3,170,000 | | | | 3,510,775 | |
Credit Suisse Group 144A 7.50% 12/29/49 #● | | | 1,670,000 | | | | 1,781,890 | |
Credit Suisse Group Funding Guernsey 144A 4.875% 5/15/45 # | | | 3,025,000 | | | | 3,004,512 | |
ING Groep 6.50% 12/29/49 ● | | | 2,755,000 | | | | 2,717,119 | |
JPMorgan Chase | | | | | | | | |
4.95% 6/1/45 | | | 6,500,000 | | | | 6,524,447 | |
6.75% 1/29/49 ● | | | 1,555,000 | | | | 1,649,272 | |
KeyBank 6.95% 2/1/28 | | | 2,467,000 | | | | 3,188,704 | |
Lloyds Banking Group 7.50% 4/30/49 ● | | | 1,700,000 | | | | 1,776,500 | |
Morgan Stanley 4.35% 9/8/26 | | | 6,300,000 | | | | 6,302,186 | |
Popular 7.00% 7/1/19 | | | 1,700,000 | | | | 1,638,375 | |
SVB Financial Group 3.50% 1/29/25 | | | 2,440,000 | | | | 2,367,051 | |
UBS 7.625% 8/17/22 | | | 4,020,000 | | | | 4,728,497 | |
USB Capital IX 3.50% 10/29/49 ● | | | 810,000 | | | | 668,250 | |
Wells Fargo | | | | | | | | |
4.30% 7/22/27 | | | 5,690,000 | | | | 5,799,037 | |
5.875% 12/29/49 ● | | | 1,140,000 | | | | 1,168,500 | |
Woori Bank 144A 4.75% 4/30/24 # | | | 2,300,000 | | | | 2,402,428 | |
| | | | | | | | |
| | | | | | | 69,832,824 | |
| | | | | | | | |
Basic Industry – 7.37% | | | | | | | | |
ArcelorMittal 7.75% 10/15/39 | | | 1,630,000 | | | | 1,581,100 | |
CF Industries 5.375% 3/15/44 | | | 7,029,000 | | | | 6,877,230 | |
Georgia-Pacific 8.00% 1/15/24 | | | 3,280,000 | | | | 4,248,240 | |
International Paper | | | | | | | | |
5.00% 9/15/35 | | | 1,445,000 | | | | 1,425,104 | |
5.15% 5/15/46 | | | 6,785,000 | | | | 6,733,386 | |
LyondellBasell Industries 4.625% 2/26/55 | | | 6,020,000 | | | | 5,311,512 | |
Methanex 5.65% 12/1/44 | | | 6,715,000 | | | | 6,596,568 | |
Mexichem 144A 5.875% 9/17/44 # | | | 3,595,000 | | | | 3,374,806 | |
NOVA Chemicals 144A 5.00% 5/1/25 # | | | 1,995,000 | | | | 1,980,037 | |
OCP 144A 4.50% 10/22/25 # | | | 1,440,000 | | | | 1,387,800 | |
Sherwin-Williams 4.55% 8/1/45 | | | 5,330,000 | | | | 5,426,505 | |
TPC Group 144A 8.75% 12/15/20 # | | | 703,000 | | | | 634,458 | |
Valspar 4.40% 2/1/45 | | | 2,250,000 | | | | 2,083,784 | |
| | | | | | | | |
| | | | | | | 47,660,530 | |
| | | | | | | | |
26
| | | | | | | | |
| | | Principal amount° | | | Value (U.S. $) | |
| |
Corporate Bonds (continued) | | | | | | | | |
| |
Brokerage – 1.58% | | | | | | | | |
Jefferies Group | | | | | | | | |
6.45% 6/8/27 | | | 2,640,000 | | | $ | 2,908,340 | |
6.50% 1/20/43 | | | 1,985,000 | | | | 1,994,298 | |
Legg Mason 5.625% 1/15/44 | | | 5,000,000 | | | | 5,308,190 | |
| | | | | | | | |
| | | | | | | 10,210,828 | |
| | | | | | | | |
Capital Goods – 1.82% | | | | | | | | |
Algeco Scotsman Global Finance 144A 8.50% 10/15/18 # | | | 3,065,000 | | | | 2,875,693 | |
Ingersoll-Rand Luxembourg Finance 4.65% 11/1/44 | | | 2,500,000 | | | | 2,400,143 | |
United Rentals North America 5.50% 7/15/25 | | | 710,000 | | | | 681,600 | |
Valmont Industries 5.00% 10/1/44 | | | 6,255,000 | | | | 5,785,812 | |
| | | | | | | | |
| | | | | | | 11,743,248 | |
| | | | | | | | |
Communications – 11.90% | | | | | | | | |
Altice 144A 7.75% 5/15/22 # | | | 2,070,000 | | | | 2,090,700 | |
Altice Financing 144A 6.625% 2/15/23 # | | | 1,040,000 | | | | 1,073,800 | |
AT&T | | | | | | | | |
4.50% 5/15/35 | | | 7,580,000 | | | | 7,035,786 | |
4.75% 5/15/46 | | | 3,740,000 | | | | 3,462,877 | |
Bharti Airtel International Netherlands 144A 5.35% 5/20/24 # | | | 1,575,000 | | | | 1,708,907 | |
CCO Safari II 144A 6.484% 10/23/45 # | | | 4,580,000 | | | | 4,752,813 | |
Columbus International 144A 7.375% 3/30/21 # | | | 2,435,000 | | | | 2,596,319 | |
Deutsche Telekom International Finance 8.75% 6/15/30 | | | 1,335,000 | | | | 1,899,710 | |
Digicel Group 144A 8.25% 9/30/20 # | | | 1,745,000 | | | | 1,731,913 | |
Grupo Televisa 5.00% 5/13/45 | | | 3,785,000 | | | | 3,619,141 | |
Intelsat Luxembourg | | | | | | | | |
7.75% 6/1/21 | | | 525,000 | | | | 419,344 | |
8.125% 6/1/23 | | | 1,240,000 | | | | 992,000 | |
Netflix 144A 5.875% 2/15/25 # | | | 1,370,000 | | | | 1,445,350 | |
Numericable-SFR 144A 6.00% 5/15/22 # | | | 665,000 | | | | 678,300 | |
Qwest 6.875% 9/15/33 | | | 3,510,000 | | | | 3,457,350 | |
SES GLOBAL Americas Holdings 144A 5.30% 3/25/44 # | | | 7,360,000 | | | | 7,415,332 | |
Sinclair Television Group 144A 5.625% 8/1/24 # | | | 1,595,000 | | | | 1,575,063 | |
Sprint | | | | | | | | |
7.25% 9/15/21 | | | 1,650,000 | | | | 1,581,938 | |
7.625% 2/15/25 | | | 1,750,000 | | | | 1,627,500 | |
Time Warner 4.85% 7/15/45 | | | 4,960,000 | | | | 4,890,887 | |
Time Warner Cable | | | | | | | | |
4.50% 9/15/42 | | | 395,000 | | | | 319,825 | |
5.50% 9/1/41 | | | 2,800,000 | | | | 2,574,303 | |
Verizon Communications | | | | | | | | |
4.40% 11/1/34 | | | 1,860,000 | | | | 1,749,153 | |
4.862% 8/21/46 | | | 6,993,000 | | | | 6,636,986 | |
27
Schedules of investments
Delaware Extended Duration Bond Fund
| | | | | | | | |
| | | Principal amount° | | | Value (U.S. $) | |
| |
Corporate Bonds (continued) | | | | | | | | |
| |
Communications (continued) | | | | | | | | |
Viacom 4.85% 12/15/34 | | | 4,940,000 | | | $ | 4,562,915 | |
WPP Finance 2010 5.625% 11/15/43 | | | 6,550,000 | | | | 7,015,378 | |
| | | | | | | | |
| | | | | | | 76,913,590 | |
| | | | | | | | |
Consumer Cyclical – 5.38% | | | | | | | | |
Bed Bath & Beyond 4.915% 8/1/34 | | | 4,670,000 | | | | 4,599,413 | |
Cencosud 144A 5.15% 2/12/25 # | | | 3,455,000 | | | | 3,478,850 | |
CVS Health 5.125% 7/20/45 | | | 7,010,000 | | | | 7,456,151 | |
General Motors | | | | | | | | |
5.20% 4/1/45 | | | 6,155,000 | | | | 5,978,099 | |
6.25% 10/2/43 | | | 1,295,000 | | | | 1,418,868 | |
Midas Intermediate Holdco II 144A 7.875% 10/1/22 # | | | 700,000 | | | | 703,500 | |
QVC 5.45% 8/15/34 | | | 6,040,000 | | | | 5,579,160 | |
Starwood Hotels & Resorts Worldwide 4.50% 10/1/34 | | | 4,610,000 | | | | 4,235,613 | |
Wynn Las Vegas 144A 5.50% 3/1/25 # | | | 1,410,000 | | | | 1,362,413 | |
| | | | | | | | |
| | | | | | | 34,812,067 | |
| | | | | | | | |
Consumer Non-Cyclical – 6.73% | | | | | | | | |
Brown-Forman 4.50% 7/15/45 | | | 4,585,000 | | | | 4,692,812 | |
Celgene | | | | | | | | |
4.625% 5/15/44 | | | 2,000,000 | | | | 1,923,728 | |
5.25% 8/15/43 | | | 4,315,000 | | | | 4,520,882 | |
Hasbro 5.10% 5/15/44 | | | 5,700,000 | | | | 5,720,959 | |
JBS Investments 144A 7.75% 10/28/20 # | | | 2,805,000 | | | | 3,043,425 | |
JBS USA 144A 5.75% 6/15/25 # | | | 1,580,000 | | | | 1,569,643 | |
Omnicare 5.00% 12/1/24 | | | 1,595,000 | | | | 1,698,675 | |
Perrigo 5.30% 11/15/43 | | | 2,245,000 | | | | 2,302,730 | |
Quest Diagnostics 4.70% 3/30/45 | | | 2,015,000 | | | | 1,847,769 | |
Reynolds American 5.85% 8/15/45 | | | 2,920,000 | | | | 3,151,191 | |
S.C. Johnson & Son 144A 4.35% 9/30/44 # | | | 3,050,000 | | | | 3,057,396 | |
Zimmer Biomet Holdings 4.45% 8/15/45 | | | 6,750,000 | | | | 6,336,893 | |
Zoetis 4.70% 2/1/43 | | | 3,800,000 | | | | 3,633,461 | |
| | | | | | | | |
| | | | | | | 43,499,564 | |
| | | | | | | | |
Electric – 11.94% | | | | | | | | |
AES Gener 144A 8.375% 12/18/73 #● | | | 1,877,000 | | | | 2,060,007 | |
American Transmission Systems 144A 5.00% 9/1/44 # | | | 5,110,000 | | | | 5,312,647 | |
Appalachian Power | | | | | | | | |
3.40% 6/1/25 | | | 2,425,000 | | | | 2,411,190 | |
4.40% 5/15/44 | | | 6,950,000 | | | | 6,799,783 | |
Berkshire Hathaway Energy 4.50% 2/1/45 | | | 6,950,000 | | | | 6,976,876 | |
Calpine 5.50% 2/1/24 | | | 1,670,000 | | | | 1,628,250 | |
ComEd Financing III 6.35% 3/15/33 | | | 4,800,000 | | | | 5,031,629 | |
Dynegy | | | | | | | | |
144A 6.75% 11/1/19 # | | | 755,000 | | | | 783,313 | |
28
| | | | | | | | |
| | | Principal amount° | | | Value (U.S. $) | |
| |
Corporate Bonds (continued) | | | | | | | | |
| |
Electric (continued) | | | | | | | | |
Dynegy | | | | | | | | |
144A 7.375% 11/1/22 # | | | 860,000 | | | $ | 893,970 | |
144A 7.625% 11/1/24 # | | | 430,000 | | | | 446,125 | |
El Paso Electric 3.30% 12/15/22 | | | 1,695,000 | | | | 1,651,784 | |
Electricite de France 144A 5.25% 1/29/49 #● | | | 3,635,000 | | | | 3,739,506 | |
Enel 144A 8.75% 9/24/73 #● | | | 1,485,000 | | | | 1,746,360 | |
Enel Finance International 144A 6.00% 10/7/39 # | | | 4,800,000 | | | | 5,540,861 | |
Entergy Arkansas 4.95% 12/15/44 | | | 2,765,000 | | | | 2,780,307 | |
Entergy Louisiana 4.95% 1/15/45 | | | 125,000 | | | | 125,795 | |
Georgia Power 4.30% 3/15/43 | | | 3,000,000 | | | | 2,844,303 | |
Integrys Energy Group 6.11% 12/1/66 ● | | | 4,135,000 | | | | 3,639,883 | |
Oncor Electric Delivery 144A 3.75% 4/1/45 # | | | 5,265,000 | | | | 4,801,675 | |
Puget Sound Energy 4.434% 11/15/41 | | | 4,870,000 | | | | 4,982,414 | |
Saudi Electricity Global Sukuk 2 144A 5.06% 4/8/43 # | | | 2,815,000 | | | | 2,803,036 | |
South Carolina Electric & Gas | | | | | | | | |
4.50% 6/1/64 | | | 5,600,000 | | | | 5,286,383 | |
5.10% 6/1/65 | | | 2,635,000 | | | | 2,735,035 | |
Tampa Electric 4.20% 5/15/45 | | | 2,175,000 | | | | 2,180,483 | |
| | | | | | | | |
| | | | | | | 77,201,615 | |
| | | | | | | | |
Energy – 8.79% | | | | | | | | |
Chesapeake Energy 5.75% 3/15/23 | | | 650,000 | | | | 552,500 | |
CNOOC Finance 2015 USA 3.50% 5/5/25 | | | 4,165,000 | | | | 4,032,553 | |
Continental Resources 4.50% 4/15/23 | | | 4,105,000 | | | | 3,817,933 | |
Enbridge Energy Partners 8.05% 10/1/37 ● | | | 4,350,000 | | | | 4,465,275 | |
Energy Transfer Equity 5.50% 6/1/27 | | | 2,000,000 | | | | 1,970,000 | |
Energy Transfer Partners 4.90% 3/15/35 | | | 4,685,000 | | | | 4,187,134 | |
Eni 144A 5.70% 10/1/40 # | | | 3,450,000 | | | | 3,584,022 | |
EnLink Midstream Partners 5.05% 4/1/45 | | | 1,380,000 | | | | 1,212,195 | |
Enterprise Products Operating | | | | | | | | |
4.90% 5/15/46 | | | 4,440,000 | | | | 4,187,293 | |
7.034% 1/15/68 ● | | | 2,830,000 | | | | 3,035,175 | |
Magellan Midstream Partners 4.20% 3/15/45 | | | 1,585,000 | | | | 1,382,391 | |
Marathon Oil 5.20% 6/1/45 | | | 6,720,000 | | | | 6,421,162 | |
Noble Energy | | | | | | | | |
5.05% 11/15/44 | | | 3,170,000 | | | | 2,974,541 | |
5.25% 11/15/43 | | | 1,465,000 | | | | 1,399,153 | |
Petroleos Mexicanos | | | | | | | | |
144A 5.50% 6/27/44 # | | | 1,405,000 | | | | 1,306,650 | |
6.375% 1/23/45 | | | 1,595,000 | | | | 1,645,561 | |
Talisman Energy 5.50% 5/15/42 | | | 3,500,000 | | | | 3,154,165 | |
Weatherford International 5.95% 4/15/42 | | | 2,590,000 | | | | 2,072,425 | |
29
Schedules of investments
Delaware Extended Duration Bond Fund
| | | | | | | | |
| | | Principal amount° | | | Value (U.S. $) | |
| |
Corporate Bonds (continued) | | | | | | | | |
| |
Energy (continued) | | | | | | | | |
Williams Partners 5.10% 9/15/45 | | | 6,240,000 | | | $ | 5,406,985 | |
| | | | | | | | |
| | | | | | | 56,807,113 | |
| | | | | | | | |
Finance Companies – 3.87% | | | | | | | | |
Blackstone Holdings Finance 144A 5.00% 6/15/44 # | | | 4,180,000 | | | | 4,304,706 | |
Carlyle Holdings II Finance 144A 5.625% 3/30/43 # | | | 5,240,000 | | | | 5,600,543 | |
Depository Trust & Clearing 144A 4.875% 12/29/49 #● | | | 3,000,000 | | | | 3,021,000 | |
General Electric Capital 7.125% 12/29/49 ● | | | 3,900,000 | | | | 4,514,250 | |
KKR Group Finance III 144A 5.125% 6/1/44 # | | | 5,675,000 | | | | 5,590,709 | |
Neuberger Berman Group 144A 4.875% 4/15/45 # | | | 2,140,000 | | | | 1,967,212 | |
| | | | | | | | |
| | | | | | | 24,998,420 | |
| | | | | | | | |
Insurance – 6.58% | | | | | | | | |
Alleghany 4.90% 9/15/44 | | | 3,525,000 | | | | 3,418,742 | |
American International Group 4.80% 7/10/45 | | | 6,105,000 | | | | 6,134,896 | |
Highmark 144A 6.125% 5/15/41 # | | | 3,410,000 | | | | 3,439,493 | |
HUB International 144A 7.875% 10/1/21 # | | | 2,410,000 | | | | 2,467,237 | |
MetLife Capital Trust IV 144A 7.875% 12/15/37 # | | | 900,000 | | | | 1,127,250 | |
MetLife Capital Trust X 144A 9.25% 4/8/38 # | | | 1,100,000 | | | | 1,542,530 | |
Nationwide Mutual Insurance 144A 4.95% 4/22/44 # | | | 3,200,000 | | | | 3,163,562 | |
TIAA Asset Management Finance 144A 4.125% 11/1/24 # | | | 2,400,000 | | | | 2,449,224 | |
Transatlantic Holdings 8.00% 11/30/39 | | | 704,000 | | | | 942,720 | |
Trinity Acquisition 6.125% 8/15/43 | | | 4,570,000 | | | | 4,991,624 | |
UnitedHealth Group 4.75% 7/15/45 | | | 3,045,000 | | | | 3,192,628 | |
Voya Financial 5.65% 5/15/53 ● | | | 1,400,000 | | | | 1,437,240 | |
XLIT | | | | | | | | |
5.50% 3/31/45 | | | 7,245,000 | | | | 6,963,170 | |
6.50% 10/29/49 ● | | | 1,480,000 | | | | 1,258,000 | |
| | | | | | | | |
| | | | | | | 42,528,316 | |
| | | | | | | | |
Natural Gas – 2.42% | | | | | | | | |
Dominion Gas Holdings 4.60% 12/15/44 | | | 9,170,000 | | | | 8,725,548 | |
Laclede Group 4.70% 8/15/44 | | | 6,750,000 | | | | 6,935,463 | |
| | | | | | | | |
| | | | | | | 15,661,011 | |
| | | | | | | | |
Technology – 4.84% | | | | | | | | |
Apple 3.45% 2/9/45 | | | 11,185,000 | | | | 9,615,129 | |
Intel 4.90% 7/29/45 | | | 3,050,000 | | | | 3,140,048 | |
Motorola Solutions 5.50% 9/1/44 | | | 5,065,000 | | | | 4,835,505 | |
Oracle 4.125% 5/15/45 | | | 4,340,000 | | | | 4,108,695 | |
QUALCOMM 4.80% 5/20/45 | | | 5,425,000 | | | | 4,911,752 | |
Seagate HDD Cayman | | | | | | | | |
4.75% 1/1/25 | | | 3,535,000 | | | | 3,506,504 | |
144A 4.875% 6/1/27 # | | | 1,220,000 | | | | 1,176,191 | |
| | | | | | | | |
| | | | | | | 31,293,824 | |
| | | | | | | | |
30
| | | | | | | | |
| | | Principal amount° | | | Value (U.S. $) | |
| |
Corporate Bonds (continued) | | | | | | | | |
| |
Transportation – 1.53% | | | | | | | | |
Kansas City Southern Railway 4.95% 8/15/45 | | | 5,805,000 | | | $ | 5,904,138 | |
Union Pacific 3.875% 2/1/55 | | | 4,455,000 | | | | 3,998,309 | |
| | | | | | | | |
| | | | | | | 9,902,447 | |
| | | | | | | | |
Total Corporate Bonds (cost $563,034,445) | | | | | | | 553,065,397 | |
| | | | | | | | |
| | | | | | | |
| |
Municipal Bonds – 4.67% | | | | | | | | |
| |
California (Various Purpose)
5.00% 4/1/43 | | | 3,210,000 | | | | 3,590,674 | |
Chicago, Illinois
(Taxable Build America Bond) Series B 7.75% 1/1/42 | | | 2,520,000 | | | | 2,490,088 | |
Chicago, Illinois O’Hare International Airport Revenue (Taxable Build America Bond) Series B 6.395% 1/1/40 | | | 3,800,000 | | | | 4,742,438 | |
Long Island Power Authority, New York Electric System Revenue (Taxable Build America Bond)
Series B 5.85% 5/1/41 | | | 3,600,000 | | | | 4,008,744 | |
Los Angeles, California Department of Water & Power Revenue (Taxable Build America Bond)
Series D 6.574% 7/1/45 | | | 2,225,000 | | | | 3,029,382 | |
Metropolitan Transportation Authority, New York Revenue (Taxable Build America Bond) Series A2 6.089% 11/15/40 | | | 3,205,000 | | | | 4,056,857 | |
Oregon Department of Transportation Highway User Tax Revenue (Taxable Build America Bond-Subordinate Lien) Series A 5.834% 11/15/34 | | | 1,605,000 | | | | 2,001,981 | |
Texas Private Activity Bond Surface Transportation Revenue Bond
(Senior Lien NTE Mobility Partners Segment 3) 6.75% 6/30/43 (AMT) | | | 500,000 | | | | 608,025 | |
Texas State Transportation Commission
(Senior Lien Mobility Fund) Series A 5.00% 10/1/44 | | | 5,000,000 | | | | 5,684,350 | |
| | | | | | | | |
Total Municipal Bonds (cost $26,657,133) | | | | | | | 30,212,539 | |
| | | | | | | | |
31
Schedules of investments
Delaware Extended Duration Bond Fund
| | | | | | | | |
| | | Principal amount° | | | Value (U.S. $) | |
| |
Senior Secured Loans – 0.46%« | | | | | | | | |
| |
Quickrete Holdings 7.00% 3/30/21 | | | 1,122,947 | | | $ | 1,132,071 | |
Rite Aid 5.75% 8/21/20 | | | 1,815,000 | | | | 1,836,553 | |
| | | | | | | | |
Total Senior Secured Loans (cost $3,015,933) | | | | | | | 2,968,624 | |
| | | | | | | | |
|
| |
U.S. Treasury Obligation – 1.29% | | | | | | | | |
| |
U.S. Treasury Bond
3.00% 5/15/45 ¥ | | | 8,235,000 | | | | 8,350,801 | |
| | | | | | | | |
Total U.S. Treasury Obligation (cost $8,229,747) | | | | | | | 8,350,801 | |
| | | | | | | | |
| | |
| | | Number of shares | | | | |
| |
Preferred Stock – 3.31% | | | | | | | | |
| |
Ally Financial | | | | | | | | |
144A 7.00% # | | | 1,697 | | | | 1,731,629 | |
8.50% ● | | | 16,680 | | | | 434,180 | |
Bank of America 6.10% ● | | | 1,710,000 | | | | 1,704,443 | |
DTE Energy 5.25% | | | 175,000 | | | | 4,226,250 | |
Entergy Arkansas 4.90% | | | 170,000 | | | | 4,159,900 | |
Morgan Stanley 5.55% ● | | | 2,805,000 | | | | 2,794,481 | |
PNC Preferred Funding Trust II 144A 1.508% #● | | | 3,900,000 | | | | 3,597,750 | |
Qwest 6.125% | | | 93,600 | | | | 2,354,040 | |
USB Realty 144A 1.436% #● | | | 400,000 | | | | 369,000 | |
| | | | | | | | |
Total Preferred Stock (cost $20,605,703) | | | | | | | 21,371,673 | |
| | | | | | | | |
| | |
| | | Principal amount° | | | | |
| |
Short-Term Investments – 5.37% | | | | | | | | |
| |
Discount Notes – 0.53%≠ | | | | | | | | |
Federal Home Loan Bank | | | | | | | | |
0.05% 8/14/15 | | | 2,219,919 | | | | 2,219,912 | |
0.075% 9/18/15 | | | 633,541 | | | | 633,509 | |
0.105% 11/3/15 | | | 587,821 | | | | 587,686 | |
| | | | | | | | |
| | | | | | | 3,441,107 | |
| | | | | | | | |
Repurchase Agreements – 4.84% | | | | | | | | |
Bank of America Merrill Lynch
0.06%, dated 7/31/15, to be repurchased on 8/3/15, repurchase price $4,796,714 (collateralized by U.S. government obligations 0.50%–2.00% 1/31/17–5/31/21;
market value $4,892,624) | | | 4,796,690 | | | | 4,796,690 | |
32
| | | | | | | | |
| | | Principal amount° | | | Value (U.S. $) | |
| |
Short-Term Investments (continued) | | | | | | | | |
| |
Repurchase Agreements (continued) | | | | | | | | |
Bank of Montreal
0.13%, dated 7/31/15, to be repurchased on 8/3/15, repurchase price $7,994,570 (collateralized by U.S. government obligations 1.25%–4.625% 9/30/16–2/15/40;
market value $8,154,374) | | | 7,994,483 | | | $ | 7,994,483 | |
BNP Paribas
0.12%, dated 7/31/15, to be repurchased on 8/3/15, repurchase price $18,476,011 (collateralized by U.S. government obligations 0.00%–7.50% 1/28/16–11/15/44;
market value $18,845,343) | | | 18,475,827 | | | | 18,475,827 | |
| | | | | | | | |
| | | | | | | 31,267,000 | |
| | | | | | | | |
Total Short-Term Investments (cost $34,708,017) | | | | | | | 34,708,107 | |
| | | | | | | | |
| | |
Total Value of Securities – 100.65% | | | | | | | | |
(cost $656,250,978) | | | | | | $ | 650,677,141 | |
| | | | | | | | |
| # | Security exempt from registration under Rule 144A of the Securities Act of 1933, as amended. At July 31, 2015, the aggregate value of Rule 144A securities was $137,278,016, which represents 21.24% of the Fund’s net assets. See Note 11 in “Notes to financial statements.” |
| ≠ | The rate shown is the effective yield at the time of purchase. |
| ° | Principal amount shown is stated in U.S. dollars unless noted that the security is denominated in another currency. |
| ● | Variable rate security. The rate shown is the rate as of July 31, 2015. Interest rates reset periodically. |
| ¥ | Fully or partially pledged as collateral for futures contracts. |
| « | Senior secured loans generally pay interest at rates which are periodically redetermined by reference to a base lending rate plus a premium. These base lending rates are generally: (i) the prime rate offered by one or more U.S. banks, (ii) the lending rate offered by one or more European banks such as the London Interbank Offered Rate (LIBOR), and (iii) the certificate of deposit rate. Senior secured loans may be subject to restrictions on resale. Stated rate in effect at July 31, 2015. |
33
Schedules of investments
Delaware Extended Duration Bond Fund
The following futures contracts and swap contract were outstanding at July 31, 2015:1
Futures Contracts
| | | | | | | | | | | | | | | | | | |
| Contracts to Buy (Sell) | | Notional Cost (Proceeds) | | | Notional
Value | | | Expiration
Date | | Unrealized
Appreciation
(Depreciation) | |
| | 504 | | | U.S. Treasury 10 yr Notes | | | $ 63,711,772 | | | $ | 64,228,500 | | | 9/21/15 | | $ | 516,728 | |
| | 28 | | | U.S. Treasury Long Bond | | | 4,316,454 | | | | 4,366,250 | | | 9/21/15 | | | 49,796 | |
| | 232 | | | U.S. Treasury Ultra Term Bond | | | 36,495,560 | | | | 37,011,250 | | | 9/22/15 | | | 515,690 | |
| | | | | | | | | | | | | | | | | | |
| | | | | | | $ 104,523,786 | | | | | | | | | $ | 1,082,214 | |
| | | | | | | | | | | | | | | | | | |
Swap Contract
CDS Contract2
| | | | | | | | | | | | | | | | |
Counterparty | | Swap Referenced Obligation | | Notional Value | | | Annual
Protection
Payments | | | Termination
Date | | Unrealized
Appreciation
(Depreciation)3 | |
| | Protection Purchased: | | | | | | | | | | | | | | |
| | JPMC - iTraxx Europe Crossover | | | | | | | | | | | | | | |
| ICE | | Series 23 Version 1 | | | EUR 8,000,000 | | | | 5.00% | | | 6/20/20 | | | $ (11,024) | |
The use of futures contracts and swap contracts involves elements of market risk and risks in excess of the amounts disclosed in the financial statements. The notional values presented above represent the Fund’s total exposure in such contracts, whereas only the net unrealized appreciation (depreciation) is reflected in the Fund’s net assets.
1See Note 8 in “Notes to financial statements.”
2A CDS contract is a risk-transfer instrument through which one party (purchaser of protection) transfers to another party (seller of protection) the financial risk of a credit event (as defined in the CDS agreement), as it relates to a particular reference security or basket of securities (such as an index). Periodic payments (receipts) on such contracts are accrued daily and recorded as unrealized losses (gains) on swap contracts. Upon payment (receipt), such amounts are recorded as realized losses (gains) on swap contracts. Upfront payments made or received in connection with CDS contracts are amortized over the expected life of the CDS contracts as unrealized losses (gains) on swap contracts. The change in value of CDS contracts is recorded daily as unrealized appreciation or depreciation. A realized gain or loss is recorded upon a credit event (as defined in the CDS agreement) or the maturity or termination of the agreement.
3Unrealized appreciation (depreciation) does not include periodic interest payments on swap contracts accrued daily in the amount of $(8,549).
Summary of abbreviations:
AMT – Subject to Alternative Minimum Tax
CDS – Credit Default Swap
EUR – European Monetary Unit
ICE – Intercontinental Exchange, Inc.
JPMC – JPMorgan Chase Bank
yr – Year
See accompanying notes, which are an integral part of the financial statements.
34
Statements of assets and liabilities
July 31, 2015
| | | | |
| | | Delaware
Corporate Bond Fund | | Delaware
Extended Duration
Bond Fund |
| | | | | | | | | | |
| | | |
Assets: | | | | | | | | | | |
Investments, at value1 | | $ | 1,474,651,782 | | | | | $ | 615,969,034 | |
Short-term investments, at value2 | | | 21,953,154 | | | | | | 34,708,107 | |
Cash | | | 443,187 | | | | | | 283,082 | |
Cash collateral due from brokers | | | 279,000 | | | | | | 1,161,962 | |
Receivable for securities sold | | | 19,656,125 | | | | | | 3,491,232 | |
Dividends and interest receivable | | | 17,042,668 | | | | | | 8,175,815 | |
Receivable for fund shares sold | | | 2,003,231 | | | | | | 307,512 | |
Variation margin due from broker on futures contracts | | | — | | | | | | 473,375 | |
Unrealized appreciation on credit default swap contracts | | | — | | | | | | 8,087 | |
Other assets3 | | | 438,287 | | | | | | 166,247 | |
| | | | | | | | | | |
Total assets | | | 1,536,467,434 | | | | | | 664,744,453 | |
| | | | | | | | | | |
Liabilities: | | | | | | | | | | |
Payable for securities purchased | | | 40,235,792 | | | | | | 14,582,645 | |
Payable for fund shares redeemed | | | 3,077,919 | | | | | | 817,438 | |
Distributions payable | | | 1,449,019 | | | | | | 675,279 | |
Variation margin due to broker on futures contracts | | | 122,313 | | | | | | — | |
Swap payments payable | | | — | | | | | | 48,796 | |
Other accrued expenses | | | 556,138 | | | | | | 298,806 | |
Investment management fees payable | | | 524,184 | | | | | | 288,654 | |
Distribution fees payable to affiliates | | | 272,976 | | | | | | 90,960 | |
Other affiliates payable | | | 99,471 | | | | | | 48,343 | |
Trustees’ fees and expenses payable | | | 3,557 | | | | | | 1,514 | |
Variation margin due to broker on centrally cleared credit default swap contracts | | | — | | | | | | 19,111 | |
Upfront payments received on credit default swap contracts | | | — | | | | | | 823,304 | |
Other liabilities3 | | | 1,460,956 | | | | | | 554,156 | |
| | | | | | | | | | |
Total liabilities | | | 47,802,325 | | | | | | 18,249,006 | |
| | | | | | | | | | |
Total Net Assets | | $ | 1,488,665,109 | | | | | $ | 646,495,447 | |
| | | | | | | | | | |
Net Assets Consist of: | | | | | | | | | | |
Paid-in capital | | $ | 1,507,221,132 | | | | | $ | 653,111,467 | |
Undistributed (distributions in excess of) net investment income | | | 142,556 | | | | | | (655,706 | ) |
Accumulated net realized loss on investments | | | (13,209,211 | ) | | | | | (1,450,361 | ) |
Net unrealized depreciation of investments | | | (5,001,942 | ) | | | | | (5,573,837 | ) |
Net unrealized appreciation (depreciation) of futures contracts | | | (487,426 | ) | | | | | 1,082,214 | |
Net unrealized appreciation of foreign currencies | | | — | | | | | | 1,243 | |
Net unrealized depreciation of swap contracts | | | — | | | | | | (19,573 | ) |
| | | | | | | | | | |
Total Net Assets | | $ | 1,488,665,109 | | | | | $ | 646,495,447 | |
| | | | | | | | | | |
35
Statements of assets and liabilities
| | | | | | | | |
| | | Delaware Corporate Bond Fund | | | Delaware
Extended Duration
Bond Fund | |
| | |
Net Asset Value | | | | | | | | |
Class A: | | | | | | | | |
Net assets | | $ | 442,509,199 | | | $ | 244,513,801 | |
Shares of beneficial interest outstanding, unlimited authorization, no par | | | 76,124,480 | | | | 38,872,619 | |
Net asset value per share | | $ | 5.81 | | | $ | 6.29 | |
Sales charge | | | 4.50 | % | | | 4.50 | % |
Offering price per share, equal to net asset value per share/(1 – sales charge) | | $ | 6.08 | | | $ | 6.59 | |
| | |
Class C: | | | | | | | | |
Net assets | | $ | 193,745,712 | | | $ | 33,323,749 | |
Shares of beneficial interest outstanding, unlimited authorization, no par | | | 33,324,777 | | | | 5,299,813 | |
Net asset value per share | | $ | 5.81 | | | $ | 6.29 | |
| | |
Class R: | | | | | | | | |
Net assets | | $ | 28,244,763 | | | $ | 26,448,751 | |
Shares of beneficial interest outstanding, unlimited authorization, no par | | | 4,854,523 | | | | 4,199,009 | |
Net asset value per share | | $ | 5.82 | | | $ | 6.30 | |
| | |
Institutional Class: | | | | | | | | |
Net assets | | $ | 824,165,435 | | | $ | 342,209,146 | |
Shares of beneficial interest outstanding, unlimited authorization, no par | | | 141,783,675 | | | | 54,491,845 | |
Net asset value per share | | $ | 5.81 | | | $ | 6.28 | |
| | | | | | | | |
| 1Investments, at cost | | $ | 1,479,654,731 | | | $ | 621,542,961 | |
| 2Short-term investments, at cost | | | 21,952,147 | | | | 34,708,017 | |
| 3See Note 14 in “Notes to financial statements.” | | | | | | | | |
See accompanying notes, which are an integral part of the financial statements.
36
This page intentionally left blank.
Statements of operations
Year ended July 31, 2015
| | | | | | | | | | | | | | |
| | | Delaware
Corporate
Bond Fund | | | | | Delaware
Extended Duration
Bond Fund |
| | | | | |
Investment Income: | | | | | | | | | | | | | | |
Interest | | $ | 56,867,123 | | | | | | | $ | 31,783,714 | | | |
Dividends | | | 1,818,953 | | | | | | | | 1,034,689 | | | |
| | | | | | | | | | | | | | |
| | | 58,686,076 | | | | | | | | 32,818,403 | | | |
| | | | | | | | | | | | | | |
Expenses: | | | | | | | | | | | | | | |
Management fees | | | 6,409,384 | | | | | | | | 3,625,014 | | | |
Distribution expenses – Class A | | | 1,198,467 | | | | | | | | 658,545 | | | |
Distribution expenses – Class B | | | 1,086 | | | | | | | | 479 | | | |
Distribution expenses – Class C | | | 2,039,683 | | | | | | | | 331,074 | | | |
Distribution expenses – Class R | | | 149,151 | | | | | | | | 160,582 | | | |
Dividend disbursing and transfer agent fees and expenses | | | 1,838,571 | | | | | | | | 813,783 | | | |
Accounting and administration expenses | | | 429,836 | | | | | | | | 216,560 | | | |
Reports and statements to shareholders | | | 362,186 | | | | | | | | 181,837 | | | |
Legal fees | | | 126,617 | | | | | | | | 70,372 | | | |
Registration fees | | | 120,930 | | | | | | | | 87,986 | | | |
Custodian fees | | | 68,531 | | | | | | | | 37,800 | | | |
Trustees’ fees and expenses | | | 60,947 | | | | | | | | 31,387 | | | |
Audit and tax fees | | | 44,120 | | | | | | | | 43,561 | | | |
Other | | | 57,314 | | | | | | | | 37,130 | | | |
| | | | | | | | | | | | | | |
| | | 12,906,823 | | | | | | | | 6,296,110 | | | |
Less expenses waived | | | (102,411 | ) | | | | | | | (250,468 | ) | | |
Less waived distribution expenses – Class B | | | (825 | ) | | | | | | | (364 | ) | | |
Less expense paid indirectly | | | (518 | ) | | | | | | | (262 | ) | | |
| | | | | | | | | | | | | | |
Total operating expenses | | | 12,803,069 | | | | | | | | 6,045,016 | | | |
| | | | | | | | | | | | | | |
Net Investment Income | | | 45,883,007 | | | | | | | | 26,773,387 | | | |
| | | | | | | | | | | | | | |
38
| | | | | | | | | | | | | | |
| | | Delaware
Corporate Bond Fund | | | | | Delaware
Extended Duration
Bond Fund |
| | | | | |
Net Realized and Unrealized Gain (Loss): | | | | | | | | | | | | | | |
Net realized gain (loss) on: | | | | | | | | | | | | | | |
Investments1 | | $ | 7,478,234 | | | | | | | $ | 3,412,737 | | | |
Foreign currencies | | | — | | | | | | | | 3,960 | | | |
Foreign currency exchange contracts | | | — | | | | | | | | (6,089 | ) | | |
Futures contracts | | | 904,138 | | | | | | | | 9,083,036 | | | |
Options written | | | 2,521,727 | | | | | | | | 9,523 | | | |
Swap contracts | | | (8,498,046 | ) | | | | | | | (2,474,462 | ) | | |
| | | | | | | | | | | | | | |
Net realized gain | | | 2,406,053 | | | | | | | | 10,028,705 | | | |
| | | | | | | | | | | | | | |
Net change in unrealized appreciation (depreciation) of: | | | | | | | | | | | | | | |
Investments | | | (45,709,785 | ) | | | | | | | (35,590,707 | ) | | |
Foreign currencies | | | 8 | | | | | | | | 1,246 | | | |
Futures contracts | | | (506,236 | ) | | | | | | | 1,117,491 | | | |
Options written | | | (1,107,547 | ) | | | | | | | — | | | |
Swap contracts | | | — | | | | | | | | (19,573 | ) | | |
| | | | | | | | | | | | | | |
Net change in unrealized appreciation (depreciation) | | | (47,323,560 | ) | | | | | | | (34,491,543 | ) | | |
| | | | | | | | | | | | | | |
Net Realized and Unrealized Loss | | | (44,917,507 | ) | | | | | | | (24,462,838 | ) | | |
| | | | | | | | | | | | | | |
Net Increase in Net Assets Resulting from Operations | | $ | 965,500 | | | | | | | $ | 2,310,549 | | | |
| | | | | | | | | | | | | | |
1Includes loss contingencies on General Motors Corporation term loan of $1,022,669 and $387,909 for Delaware Corporate Bond Fund and Delaware Extended Duration Bond Fund, respectively. See Note 14 in “Notes to financial statements.”
See accompanying notes, which are an integral part of the financial statements.
39
Statements of changes in net assets
Delaware Corporate Bond Fund
| | | | | | | | |
| | | Year ended | |
| | | 7/31/15 | | | 7/31/14 | |
| | |
Increase (Decrease) in Net Assets from Operations: | | | | | | | | |
Net investment income | | $ | 45,883,007 | | | $ | 45,936,094 | |
Net realized gain | | | 2,406,053 | | | | 18,764,665 | |
Net change in unrealized appreciation (depreciation) | | | (47,323,560 | ) | | | 26,877,100 | |
| | | | | | | | |
Net increase in net assets resulting from operations | | | 965,500 | | | | 91,577,859 | |
| | | | | | | | |
| | |
Dividends and Distributions to Shareholders from: | | | | | | | | |
Net investment income: | | | | | | | | |
Class A | | | (18,241,037 | ) | | | (22,858,385 | ) |
Class B | | | (4,573 | ) | | | (62,563 | ) |
Class C | | | (6,240,166 | ) | | | (7,984,468 | ) |
Class R | | | (1,060,733 | ) | | | (1,403,686 | ) |
Institutional Class | | | (25,316,843 | ) | | | (18,916,792 | ) |
| | |
Net realized gain: | | | | | | | | |
Class A | | | (4,764,001 | ) | | | (8,808,504 | ) |
Class B | | | — | | | | (32,244 | ) |
Class C | | | (2,047,006 | ) | | | (3,805,314 | ) |
Class R | | | (296,460 | ) | | | (568,510 | ) |
Institutional Class | | | (5,836,204 | ) | | | (6,635,962 | ) |
| | | | | | | | |
| | | (63,807,023 | ) | | | (71,076,428 | ) |
| | | | | | | | |
Capital Share Transactions: | | | | | | | | |
Proceeds from shares sold: | | | | | | | | |
Class A | | | 156,061,190 | | | | 179,994,785 | |
Class B | | | — | | | | 28,605 | |
Class C | | | 27,897,575 | | | | 23,601,516 | |
Class R | | | 9,547,691 | | | | 11,472,250 | |
Institutional Class | | | 591,301,968 | | | | 226,446,161 | |
| | |
Net asset value of shares issued upon reinvestment of dividends and distributions: | | | | | | | | |
Class A | | | 20,959,352 | | | | 29,563,766 | |
Class B | | | 4,099 | | | | 89,040 | |
Class C | | | 7,255,461 | | | | 9,219,895 | |
Class R | | | 1,356,052 | | | | 1,960,083 | |
Institutional Class | | | 23,920,447 | | | | 20,503,966 | |
| | | | | | | | |
| | | 838,303,835 | | | | 502,880,067 | |
| | | | | | | | |
40
| | | | | | | | |
| | | Year ended | |
| | | 7/31/15 | | | 7/31/14 | |
| | |
Capital Share Transactions (continued): | | | | | | | | |
Cost of shares redeemed: | | | | | | | | |
Class A | | $ | (224,361,872 | ) | | $ | (353,225,376 | ) |
Class B | | | (683,656 | ) | | | (2,239,657 | ) |
Class C | | | (42,134,432 | ) | | | (100,452,473 | ) |
Class R | | | (16,483,124 | ) | | | (16,293,718 | ) |
Institutional Class | | | (228,408,781 | ) | | | (303,745,284 | ) |
| | | | | | | | |
| | | (512,071,865 | ) | | | (775,956,508 | ) |
| | | | | | | | |
Increase (decrease) in net assets derived from capital share transactions | | | 326,231,970 | | | | (273,076,441 | ) |
| | | | | | | | |
Net Increase (Decrease) in Net Assets | | | 263,390,447 | | | | (252,575,010 | ) |
Net Assets: | | | | | | | | |
Beginning of year | | | 1,225,274,662 | | | | 1,477,849,672 | |
| | | | | | | | |
End of year | | $ | 1,488,665,109 | | | $ | 1,225,274,662 | |
| | | | | | | | |
Undistributed net investment income | | $ | 142,556 | | | $ | 228,553 | |
| | | | | | | | |
See accompanying notes, which are an integral part of the financial statements.
41
Statements of changes in net assets
Delaware Extended Duration Bond Fund
| | | | | | | | |
| | | Year ended | |
| | | 7/31/15 | | | 7/31/14 | |
| | |
Increase (Decrease) in Net Assets from Operations: | | | | | | | | |
Net investment income | | $ | 26,773,387 | | | $ | 28,650,622 | |
Net realized gain | | | 10,028,705 | | | | 13,584,303 | |
Net change in unrealized appreciation (depreciation) | | | (34,491,543 | ) | | | 36,196,248 | |
| | | | | | | | |
Net increase in net assets resulting from operations | | | 2,310,549 | | | | 78,431,173 | |
| | | | | | | | |
| | |
Dividends and Distributions to Shareholders from: | | | | | | | | |
Net investment income: | | | | | | | | |
Class A | | | (10,577,818 | ) | | | (13,646,408 | ) |
Class B | | | (2,069 | ) | | | (21,311 | ) |
Class C | | | (1,078,659 | ) | | | (1,229,671 | ) |
Class R | | | (1,210,107 | ) | | | (1,315,211 | ) |
Institutional Class | | | (14,774,427 | ) | | | (13,614,295 | ) |
| | |
Net realized gain: | | | | | | | | |
Class A | | | (11,166,547 | ) | | | — | |
Class C | | | (1,380,519 | ) | | | — | |
Class R | | | (1,411,748 | ) | | | — | |
Institutional Class | | | (14,445,938 | ) | | | — | |
| | | | | | | | |
| | | (56,047,832 | ) | | | (29,826,896 | ) |
| | | | | | | | |
Capital Share Transactions: | | | | | | | | |
Proceeds from shares sold: | | | | | | | | |
Class A | | | 117,415,156 | | | | 112,661,489 | |
Class C | | | 11,087,468 | | | | 4,633,885 | |
Class R | | | 15,059,672 | | | | 10,189,292 | |
Institutional Class | | | 171,197,251 | | | | 102,101,509 | |
| | |
Net asset value of shares issued upon reinvestment of dividends and distributions: | | | | | | | | |
Class A | | | 21,185,346 | | | | 13,507,436 | |
Class B | | | 2,221 | | | | 20,992 | |
Class C | | | 2,254,773 | | | | 1,089,726 | |
Class R | | | 2,638,205 | | | | 1,313,203 | |
Institutional Class | | | 27,780,622 | | | | 13,098,040 | |
| | | | | | | | |
| | | 368,620,714 | | | | 258,615,572 | |
| | | | | | | | |
42
| | | | | | | | |
| | | Year ended | |
| | | 7/31/15 | | | 7/31/14 | |
| | |
Capital Share Transactions (continued): | | | | | | | | |
Cost of shares redeemed: | | | | | | | | |
Class A | | $ | (149,490,226 | ) | | $ | (241,289,269 | ) |
Class B | | | (299,879 | ) | | | (498,498 | ) |
Class C | | | (7,374,518 | ) | | | (25,019,563 | ) |
Class R | | | (23,496,184 | ) | | | (8,989,890 | ) |
Institutional Class | | | (136,740,882 | ) | | | (134,759,164 | ) |
| | | | | | | | |
| | | (317,401,689 | ) | | | (410,556,384 | ) |
| | | | | | | | |
Increase (decrease) in net assets derived from capital share transactions | | | 51,219,025 | | | | (151,940,812 | ) |
| | | | | | | | |
Net Decrease in Net Assets | | | (2,518,258 | ) | | | (103,336,535 | ) |
Net Assets: | | | | | | | | |
Beginning of year | | | 649,013,705 | | | | 752,350,240 | |
| | | | | | | | |
End of year | | $ | 646,495,447 | | | $ | 649,013,705 | |
| | | | | | | | |
Distributions in excess of net investment income | | $ | (655,706 | ) | | $ | (812,858 | ) |
| | | | | | | | |
See accompanying notes, which are an integral part of the financial statements.
43
Financial highlights
Delaware Corporate Bond Fund Class A
Selected data for each share of the Fund outstanding throughout each period were as follows:
|
|
Net asset value, beginning of period |
|
Income (loss) from investment operations: |
Net investment income1 |
Net realized and unrealized gain (loss) |
Total from investment operations |
|
Less dividends and distributions from: |
Net investment income |
Net realized gain |
Total dividends and distributions |
|
Net asset value, end of period |
|
Total return2 |
|
Ratios and supplemental data: |
Net assets, end of period (000 omitted) |
Ratio of expenses to average net assets |
Ratio of expenses to average net assets prior to fees waived |
Ratio of net investment income to average net assets |
Ratio of net investment income to average net assets prior to fees waived |
Portfolio turnover |
|
| 1 | The average shares outstanding method has been applied for per share information. |
| 2 | Total investment return is based on the change in net asset value of a share during the period and assumes reinvestment of dividends and distributions at net asset value and does not reflect the impact of a sales charge. Total investment return during all of the periods shown reflects waivers by the manager and/or distributor. Performance would have been lower had the waivers not been in effect. |
See accompanying notes, which are an integral part of the financial statements.
44
| | | | | | | | | | | | | | | | | | | | |
| | | Year ended | |
| | | | |
| | | 7/31/15 | | | 7/31/14 | | | 7/31/13 | | | 7/31/12 | | | 7/31/11 | |
| |
| | $ | 6.080 | | | $ | 5.950 | | | $ | 6.260 | | | $ | 6.050 | | | $ | 6.080 | |
| | | | | |
| | | | | | | | | | | | | | | | | | | | | |
| | | 0.205 | | | | 0.227 | | | | 0.230 | | | | 0.246 | | | | 0.268 | |
| | | (0.187 | ) | | | 0.251 | | | | (0.099 | ) | | | 0.384 | | | | 0.278 | |
| | | | | | | | | | | | | | | | | | | | |
| | | 0.018 | | | | 0.478 | | | | 0.131 | | | | 0.630 | | | | 0.546 | |
| | | | | | | | | | | | | | | | | | | | |
| | | | | |
| | | | | | | | | | | | | | | | | | | | | |
| | | (0.228 | ) | | | (0.252 | ) | | | (0.252 | ) | | | (0.284 | ) | | | (0.305 | ) |
| | | (0.060 | ) | | | (0.096 | ) | | | (0.189 | ) | | | (0.136 | ) | | | (0.271 | ) |
| | | | | | | | | | | | | | | | | | | | |
| | | (0.288 | ) | | | (0.348 | ) | | | (0.441 | ) | | | (0.420 | ) | | | (0.576 | ) |
| | | | | | | | | | | | | | | | | | | | |
| | | | | |
| | $ | 5.810 | | | $ | 6.080 | | | $ | 5.950 | | | $ | 6.260 | | | $ | 6.050 | |
| | | | | | | | | | | | | | | | | | | | |
| | | | | |
| | | 0.28% | | | | 8.33% | | | | 2.02% | | | | 11.04% | | | | 9.44% | |
| | | | | |
| | | | | | | | | | | | | | | | | | | | | |
| | $ | 442,509 | | | $ | 511,351 | | | $ | 645,585 | | | $ | 638,481 | | | $ | 392,313 | |
| | | 0.95% | | | | 0.94% | | | | 0.93% | | | | 0.94% | | | | 0.95% | |
| | | 0.96% | | | | 0.96% | | | | 0.98% | | | | 1.01% | | | | 1.09% | |
| | | 3.43% | | | | 3.81% | | | | 3.70% | | | | 4.11% | | | | 4.45% | |
| | | 3.42% | | | | 3.79% | | | | 3.65% | | | | 4.04% | | | | 4.31% | |
| | | 215% | | | | 215% | | | | 230% | | | | 202% | | | | 204% | |
| |
45
Financial highlights
Delaware Corporate Bond Fund Class C
Selected data for each share of the Fund outstanding throughout each period were as follows:
|
|
Net asset value, beginning of period |
|
Income (loss) from investment operations: |
Net investment income1 |
Net realized and unrealized gain (loss) |
Total from investment operations |
|
Less dividends and distributions from: |
Net investment income |
Net realized gain |
Total dividends and distributions |
|
Net asset value, end of period |
|
Total return2 |
|
Ratios and supplemental data: |
Net assets, end of period (000 omitted) |
Ratio of expenses to average net assets |
Ratio of expenses to average net assets prior to fees waived |
Ratio of net investment income to average net assets |
Ratio of net investment income to average net assets prior to fees waived |
Portfolio turnover |
|
| 1 | The average shares outstanding method has been applied for per share information. |
| 2 | Total investment return is based on the change in net asset value of a share during the period and assumes reinvestment of dividends and distributions at net asset value and does not reflect the impact of a sales charge. Total investment return during some of the periods shown reflects a waiver by the manager. Performance would have been lower had the waiver not been in effect. |
See accompanying notes, which are an integral part of the financial statements.
46
| | | | | | | | | | | | | | | | | | | | |
| | | Year ended | |
| | | | |
| | | 7/31/15 | | | 7/31/14 | | | 7/31/13 | | | 7/31/12 | | | 7/31/11 | |
| |
| | $ | 6.080 | | | $ | 5.960 | | | $ | 6.260 | | | $ | 6.050 | | | $ | 6.090 | |
| | | | | |
| | | | | | | | | | | | | | | | | | | | | |
| | | 0.161 | | | | 0.182 | | | | 0.183 | | | | 0.202 | | | | 0.223 | |
| | | (0.188 | ) | | | 0.241 | | | | (0.088 | ) | | | 0.383 | | | | 0.268 | |
| | | | | | | | | | | | | | | | | | | | |
| | | (0.027 | ) | | | 0.423 | | | | 0.095 | | | | 0.585 | | | | 0.491 | |
| | | | | | | | | | | | | | | | | | | | |
| | | | | |
| | | | | | | | | | | | | | | | | | | | | |
| | | (0.183 | ) | | | (0.207 | ) | | | (0.206 | ) | | | (0.239 | ) | | | (0.260 | ) |
| | | (0.060 | ) | | | (0.096 | ) | | | (0.189 | ) | | | (0.136 | ) | | | (0.271 | ) |
| | | | | | | | | | | | | | | | | | | | |
| | | (0.243 | ) | | | (0.303 | ) | | | (0.395 | ) | | | (0.375 | ) | | | (0.531 | ) |
| | | | | | | | | | | | | | | | | | | | |
| | | | | |
| | $ | 5.810 | | | $ | 6.080 | | | $ | 5.960 | | | $ | 6.260 | | | $ | 6.050 | |
| | | | | | | | | | | | | | | | | | | | |
| | | | | |
| | | (0.48% | ) | | | 7.35% | | | | 1.43% | | | | 10.21% | | | | 8.44% | |
| | | | | |
| | | | | | | | | | | | | | | | | | | | | |
| | $ | 193,746 | | | $ | 209,893 | | | $ | 273,594 | | | $ | 249,029 | | | $ | 135,912 | |
| | | 1.70% | | | | 1.69% | | | | 1.68% | | | | 1.69% | | | | 1.70% | |
| | | 1.71% | | | | 1.70% | | | | 1.68% | | | | 1.71% | | | | 1.79% | |
| | | 2.68% | | | | 3.06% | | | | 2.95% | | | | 3.36% | | | | 3.70% | |
| | | 2.67% | | | | 3.05% | | | | 2.95% | | | | 3.34% | | | | 3.61% | |
| | | 215% | | | | 215% | | | | 230% | | | | 202% | | | | 204% | |
| |
47
Financial highlights
Delaware Corporate Bond Fund Class R
Selected data for each share of the Fund outstanding throughout each period were as follows:
|
|
Net asset value, beginning of period |
|
Income (loss) from investment operations: |
Net investment income1 |
Net realized and unrealized gain (loss) |
Total from investment operations |
|
Less dividends and distributions from: |
Net investment income |
Net realized gain |
Total dividends and distributions |
|
Net asset value, end of period |
|
Total return2 |
|
Ratios and supplemental data: |
Net assets, end of period (000 omitted) |
Ratio of expenses to average net assets |
Ratio of expenses to average net assets prior to fees waived |
Ratio of net investment income to average net assets |
Ratio of net investment income to average net assets prior to fees waived |
Portfolio turnover |
|
| 1 | The average shares outstanding method has been applied for per share information. |
| 2 | Total investment return is based on the change in net asset value of a share during the period and assumes reinvestment of dividends and distributions at net asset value. Total investment return during all of the periods shown reflects waivers by the manager and/or distributor. Performance would have been lower had the waivers not been in effect. |
See accompanying notes, which are an integral part of the financial statements.
48
| | | | | | | | | | | | | | | | | | | | |
| | | Year ended | |
| | | | |
| | | 7/31/15 | | | 7/31/14 | | | 7/31/13 | | | 7/31/12 | | | 7/31/11 | |
| |
| | $ | 6.090 | | | $ | 5.960 | | | $ | 6.270 | | | $ | 6.050 | | | $ | 6.090 | |
| | | | | |
| | | | | | | | | | | | | | | | | | | | | |
| | | 0.191 | | | | 0.212 | | | | 0.214 | | | | 0.231 | | | | 0.253 | |
| | | (0.188 | ) | | | 0.251 | | | | (0.098 | ) | | | 0.394 | | | | 0.268 | |
| | | | | | | | | | | | | | | | | | | | |
| | | 0.003 | | | | 0.463 | | | | 0.116 | | | | 0.625 | | | | 0.521 | |
| | | | | | | | | | | | | | | | | | | | |
| | | | | |
| | | | | | | | | | | | | | | | | | | | | |
| | | (0.213 | ) | | | (0.237 | ) | | | (0.237 | ) | | | (0.269 | ) | | | (0.290 | ) |
| | | (0.060 | ) | | | (0.096 | ) | | | (0.189 | ) | | | (0.136 | ) | | | (0.271 | ) |
| | | | | | | | | | | | | | | | | | | | |
| | | (0.273 | ) | | | (0.333 | ) | | | (0.426 | ) | | | (0.405 | ) | | | (0.561 | ) |
| | | | | | | | | | | | | | | | | | | | |
| | | | | |
| | $ | 5.820 | | | $ | 6.090 | | | $ | 5.960 | | | $ | 6.270 | | | $ | 6.050 | |
| | | | | | | | | | | | | | | | | | | | |
| | | | | |
| | | 0.03% | | | | 8.06% | | | | 1.77% | | | | 10.94% | | | | 8.98% | |
| | | | | |
| | | | | | | | | | | | | | | | | | | | | |
| | $ | 28,245 | | | $ | 35,142 | | | $ | 37,293 | | | $ | 22,661 | | | $ | 11,981 | |
| | | 1.20% | | | | 1.19% | | | | 1.18% | | | | 1.19% | | | | 1.20% | |
| | | 1.21% | | | | 1.22% | | | | 1.28% | | | | 1.31% | | | | 1.39% | |
| | | 3.18% | | | | 3.56% | | | | 3.45% | | | | 3.86% | | | | 4.20% | |
| | | 3.17% | | | | 3.53% | | | | 3.35% | | | | 3.74% | | | | 4.01% | |
| | | 215% | | | | 215% | | | | 230% | | | | 202% | | | | 204% | |
| |
49
Financial highlights
Delaware Corporate Bond Fund Institutional Class
Selected data for each share of the Fund outstanding throughout each period were as follows:
|
|
Net asset value, beginning of period |
|
Income (loss) from investment operations: |
Net investment income1 |
Net realized and unrealized gain (loss) |
Total from investment operations |
|
Less dividends and distributions from: |
Net investment income |
Net realized gain |
Total dividends and distributions |
|
Net asset value, end of period |
|
Total return2 |
|
Ratios and supplemental data: |
Net assets, end of period (000 omitted) |
Ratio of expenses to average net assets |
Ratio of expenses to average net assets prior to fees waived |
Ratio of net investment income to average net assets |
Ratio of net investment income to average net assets prior to fees waived |
Portfolio turnover |
|
|
| 1 | The average shares outstanding method has been applied for per share information. |
| 2 | Total investment return is based on the change in net asset value of a share during the period and assumes reinvestment of dividends and distributions at net asset value. Total investment return during some of the periods shown reflects a waiver by the manager. Performance would have been lower had the waiver not been in effect. |
See accompanying notes, which are an integral part of the financial statements.
50
| | | | | | | | | | | | | | | | | | | | |
| | | Year ended | |
| | | | |
| | | 7/31/15 | | | 7/31/14 | | | 7/31/13 | | | 7/31/12 | | | 7/31/11 | |
| |
| | $ | 6.080 | | | $ | 5.950 | | | $ | 6.260 | | | $ | 6.050 | | | $ | 6.090 | |
| | | | | |
| | | | | | | | | | | | | | | | | | | | |
| | | 0.218 | | | | 0.242 | | | | 0.245 | | | | 0.261 | | | | 0.283 | |
| | | (0.186 | ) | | | 0.251 | | | | (0.098 | ) | | | 0.384 | | | | 0.268 | |
| | | | | | | | | | | | | | | | | | | | |
| | | 0.032 | | | | 0.493 | | | | 0.147 | | | | 0.645 | | | | 0.551 | |
| | | | | | | | | | | | | | | | | | | | |
| | | | | |
| | | | | | | | | | | | | | | | | | | | |
| | | (0.242 | ) | | | (0.267 | ) | | | (0.268 | ) | | | (0.299 | ) | | | (0.320 | ) |
| | | (0.060 | ) | | | (0.096 | ) | | | (0.189 | ) | | | (0.136 | ) | | | (0.271 | ) |
| | | | | | | | | | | | | | | | | | | | |
| | | (0.302 | ) | | | (0.363 | ) | | | (0.457 | ) | | | (0.435 | ) | | | (0.591 | ) |
| | | | | | | | | | | | | | | | | | | | |
| | | | | |
| | $ | 5.810 | | | $ | 6.080 | | | $ | 5.950 | | | $ | 6.260 | | | $ | 6.050 | |
| | | | | | | | | | | | | | | | | | | | |
| | | | | |
| | | 0.52% | | | | 8.60% | | | | 2.28% | | | | 11.32% | | | | 9.52% | |
| | | | | |
| | | | | | | | | | | | | | | | | | | | | |
| | $ | 824,165 | | | $ | 468,205 | | | $ | 518,576 | | | $ | 507,190 | | | $ | 466,660 | |
| | | 0.70% | | | | 0.69% | | | | 0.68% | | | | 0.69% | | | | 0.70% | |
| | | 0.71% | | | | 0.70% | | | | 0.68% | | | | 0.71% | | | | 0.79% | |
| | | 3.68% | | | | 4.06% | | | | 3.95% | | | | 4.36% | | | | 4.70% | |
| | | 3.67% | | | | 4.05% | | | | 3.95% | | | | 4.34% | | | | 4.61% | |
| | | 215% | | | | 215% | | | | 230% | | | | 202% | | | | 204% | |
|
| |
51
Financial highlights
Delaware Extended Duration Bond Fund Class A
Selected data for each share of the Fund outstanding throughout each period were as follows:
|
|
Net asset value, beginning of period |
|
Income (loss) from investment operations: |
Net investment income1 |
Net realized and unrealized gain (loss) |
Total from investment operations |
|
Less dividends and distributions from: |
Net investment income |
Net realized gain |
Total dividends and distributions |
|
Net asset value, end of period |
|
Total return2 |
|
Ratios and supplemental data: |
Net assets, end of period (000 omitted) |
Ratio of expenses to average net assets |
Ratio of expenses to average net assets prior to fees waived |
Ratio of net investment income to average net assets |
Ratio of net investment income to average net assets prior to fees waived |
Portfolio turnover |
|
|
| 1 | The average shares outstanding method has been applied for per share information. |
| 2 | Total investment return is based on the change in net asset value of a share during the period and assumes reinvestment of dividends and distributions at net asset value and does not reflect the impact of a sales charge. Total investment return during all of the periods shown reflects waivers by the manager and/or distributor. Performance would have been lower had the waivers not been in effect. |
See accompanying notes, which are an integral part of the financial statements.
52
| | | | | | | | | | | | | | | | | | | | |
| | | Year ended | |
| | | | |
| | | 7/31/15 | | | 7/31/14 | | | 7/31/13 | | | 7/31/12 | | | 7/31/11 | |
| |
| | $ | 6.810 | | | $ | 6.280 | | | $ | 7.150 | | | $ | 6.380 | | | $ | 6.440 | |
| | | | | |
| | | | | | | | | | | | | | | | | | | | | |
| | | 0.259 | | | | 0.278 | | | | 0.280 | | | | 0.300 | | | | 0.318 | |
| | | (0.216 | ) | | | 0.542 | | | | (0.427 | ) | | | 1.055 | | | | 0.268 | |
| | | | | | | | | | | | | | | | | | | | |
| | | 0.043 | | | | 0.820 | | | | (0.147 | ) | | | 1.355 | | | | 0.586 | |
| | | | | | | | | | | | | | | | | | | | |
| | | | | |
| | | | | | | | | | | | | | | | | | | | | |
| | | (0.268 | ) | | | (0.290 | ) | | | (0.287 | ) | | | (0.319 | ) | | | (0.329 | ) |
| | | (0.295 | ) | | | — | | | | (0.436 | ) | | | (0.266 | ) | | | (0.317 | ) |
| | | | | | | | | | | | | | | | | | | | |
| | | (0.563 | ) | | | (0.290 | ) | | | (0.723 | ) | | | (0.585 | ) | | | (0.646 | ) |
| | | | | | | | | | | | | | | | | | | | |
| | | | | |
| | $ | 6.290 | | | $ | 6.810 | | | $ | 6.280 | | | $ | 7.150 | | | $ | 6.380 | |
| | | | | | | | | | | | | | | | | | | | |
| | | | | |
| | | 0.53% | | | | 13.42% | | | | (2.45% | ) | | | 22.48% | | | | 9.74% | |
| | | | | |
| | | | | | | | | | | | | | | | | | | | | |
| | $ | 244,514 | | | $ | 277,041 | | | $ | 370,553 | | | $ | 402,639 | | | $ | 352,060 | |
| | | 0.98% | | | | 0.96% | | | | 0.95% | | | | 0.95% | | | | 0.95% | |
| | | 1.02% | | | | 1.01% | | | | 1.04% | | | | 1.06% | | | | 1.12% | |
| | | 3.89% | | | | 4.35% | | | | 4.13% | | | | 4.53% | | | | 5.07% | |
| | | 3.85% | | | | 4.30% | | | | 4.04% | | | | 4.42% | | | | 4.90% | |
| | | 185% | | | | 216% | | | | 217% | | | | 172% | | | | 147% | |
|
| |
53
Financial highlights
Delaware Extended Duration Bond Fund Class C
Selected data for each share of the Fund outstanding throughout each period were as follows:
|
|
Net asset value, beginning of period |
|
Income (loss) from investment operations: |
Net investment income1 |
Net realized and unrealized gain (loss) |
Total from investment operations |
|
Less dividends and distributions from: |
Net investment income |
Net realized gain |
Total dividends and distributions |
|
Net asset value, end of period |
|
Total return2 |
|
Ratios and supplemental data: |
Net assets, end of period (000 omitted) |
Ratio of expenses to average net assets |
Ratio of expenses to average net assets prior to fees waived |
Ratio of net investment income to average net assets |
Ratio of net investment income to average net assets prior to fees waived |
Portfolio turnover |
|
|
| 1 | The average shares outstanding method has been applied for per share information. |
| 2 | Total investment return is based on the change in net asset value of a share during the period and assumes reinvestment of dividends and distributions at net asset value and does not reflect the impact of a sales charge. Total investment return during all of the periods shown reflects a waiver by the manager. Performance would have been lower had the waiver not been in effect. |
See accompanying notes, which are an integral part of the financial statements.
54
| | | | | | | | | | | | | | | | | | | | |
| | | Year ended | |
| | | | |
| | | 7/31/15 | | | 7/31/14 | | | 7/31/13 | | | 7/31/12 | | | 7/31/11 | |
| |
| | $ | 6.810 | | | $ | 6.280 | | | $ | 7.150 | | | $ | 6.380 | | | $ | 6.430 | |
| | | | | |
| | | | | | | | | | | | | | | | | | | | | |
| | | 0.208 | | | | 0.230 | | | | 0.230 | | | | 0.251 | | | | 0.272 | |
| | | (0.216 | ) | | | 0.542 | | | | (0.428 | ) | | | 1.055 | | | | 0.277 | |
| | | | | | | | | | | | | | | | | | | | |
| | | (0.008 | ) | | | 0.772 | | | | (0.198 | ) | | | 1.306 | | | | 0.549 | |
| | | | | | | | | | | | | | | | | | | | |
| | | | | |
| | | | | | | | | | | | | | | | | | | | | |
| | | (0.217 | ) | | | (0.242 | ) | | | (0.236 | ) | | | (0.270 | ) | | | (0.282 | ) |
| | | (0.295 | ) | | | — | | | | (0.436 | ) | | | (0.266 | ) | | | (0.317 | ) |
| | | | | | | | | | | | | | | | | | | | |
| | | (0.512 | ) | | | (0.242 | ) | | | (0.672 | ) | | | (0.536 | ) | | | (0.599 | ) |
| | | | | | | | | | | | | | | | | | | | |
| | | | | |
| | $ | 6.290 | | | $ | 6.810 | | | $ | 6.280 | | | $ | 7.150 | | | $ | 6.380 | |
| | | | | | | | | | | | | | | | | | | | |
| | | | | |
| | | (0.22% | ) | | | 12.59% | | | | (3.17% | ) | | | 21.57% | | | | 9.09% | |
| | | | | |
| | | | | | | | | | | | | | | | | | | | | |
| | $ | 33,323 | | | $ | 30,091 | | | $ | 47,326 | | | $ | 62,275 | | | $ | 24,532 | |
| | | 1.73% | | | | 1.71% | | | | 1.70% | | | | 1.70% | | | | 1.70% | |
| | | 1.77% | | | | 1.75% | | | | 1.74% | | | | 1.76% | | | | 1.82% | |
| | | 3.14% | | | | 3.60% | | | | 3.38% | | | | 3.78% | | | | 4.32% | |
| | | 3.10% | | | | 3.56% | | | | 3.34% | | | | 3.72% | | | | 4.20% | |
| | | 185% | | | | 216% | | | | 217% | | | | 172% | | | | 147% | |
|
| |
55
Financial highlights
Delaware Extended Duration Bond Fund Class R
Selected data for each share of the Fund outstanding throughout each period were as follows:
|
|
Net asset value, beginning of period |
|
Income (loss) from investment operations: |
Net investment income1 |
Net realized and unrealized gain (loss) |
Total from investment operations |
|
Less dividends and distributions from: |
Net investment income |
Net realized gain |
Total dividends and distributions |
|
Net asset value, end of period |
|
Total return2 |
|
Ratios and supplemental data: |
Net assets, end of period (000 omitted) |
Ratio of expenses to average net assets |
Ratio of expenses to average net assets prior to fees waived |
Ratio of net investment income to average net assets |
Ratio of net investment income to average net assets prior to fees waived |
Portfolio turnover |
|
|
| 1 | The average shares outstanding method has been applied for per share information. |
| 2 | Total investment return is based on the change in net asset value of a share during the period and assumes reinvestment of dividends and distributions at net asset value. Total investment return during all of the periods shown reflects waivers by the manager and/or distributor. Performance would have been lower had the waivers not been in effect. |
See accompanying notes, which are an integral part of the financial statements.
56
| | | | | | | | | | | | | | | | | | | | |
| | | Year ended | |
| | | | |
| | | 7/31/15 | | | 7/31/14 | | | 7/31/13 | | | 7/31/12 | | | 7/31/11 | |
| |
| | $ | 6.820 | | | $ | 6.290 | | | $ | 7.160 | | | $ | 6.390 | | | $ | 6.440 | |
| | | | | |
| | | | | | | | | | | | | | | | | | | | |
| | | 0.243 | | | | 0.265 | | | | 0.263 | | | | 0.284 | | | | 0.303 | |
| | | (0.217 | ) | | | 0.539 | | | | (0.426 | ) | | | 1.055 | | | | 0.278 | |
| | | | | | | | | | | | | | | | | | | | |
| | | 0.026 | | | | 0.804 | | | | (0.163 | ) | | | 1.339 | | | | 0.581 | |
| | | | | | | | | | | | | | | | | | | | |
| | | | | |
| | | | | | | | | | | | | | | | | | | | |
| | | (0.251 | ) | | | (0.274 | ) | | | (0.271 | ) | | | (0.303 | ) | | | (0.314 | ) |
| | | (0.295 | ) | | | — | | | | (0.436 | ) | | | (0.266 | ) | | | (0.317 | ) |
| | | | | | | | | | | | | | | | | | | | |
| | | (0.546 | ) | | | (0.274 | ) | | | (0.707 | ) | | | (0.569 | ) | | | (0.631 | ) |
| | | | | | | | | | | | | | | | | | | | |
| | | | | |
| | $ | 6.300 | | | $ | 6.820 | | | $ | 6.290 | | | $ | 7.160 | | | $ | 6.390 | |
| | | | | | | | | | | | | | | | | | | | |
| | | | | |
| | | 0.29% | | | | 13.13% | | | | (2.68% | ) | | | 22.15% | | | | 9.63% | |
| | | | | |
| | | | | | | | | | | | | | | | | | | | |
| | $ | 26,449 | | | $ | 34,545 | | | $ | 29,423 | | | $ | 20,080 | | | $ | 10,800 | |
| | | 1.23% | | | | 1.21% | | | | 1.20% | | | | 1.20% | | | | 1.20% | |
| | | 1.27% | | | | 1.27% | | | | 1.34% | | | | 1.36% | | | | 1.42% | |
| | | 3.64% | | | | 4.10% | | | | 3.88% | | | | 4.28% | | | | 4.82% | |
| | | 3.60% | | | | 4.04% | | | | 3.74% | | | | 4.12% | | | | 4.60% | |
| | | 185% | | | | 216% | | | | 217% | | | | 172% | | | | 147% | |
|
| |
57
Financial highlights
Delaware Extended Duration Bond Fund Institutional Class
Selected data for each share of the Fund outstanding throughout each period were as follows:
|
|
Net asset value, beginning of period |
|
Income (loss) from investment operations: |
Net investment income1 |
Net realized and unrealized gain (loss) |
Total from investment operations |
|
Less dividends and distributions from: |
Net investment income |
Net realized gain |
Total dividends and distributions |
|
Net asset value, end of period |
|
Total return2 |
|
Ratios and supplemental data: |
Net assets, end of period (000 omitted) |
Ratio of expenses to average net assets |
Ratio of expenses to average net assets prior to fees waived |
Ratio of net investment income to average net assets |
Ratio of net investment income to average net assets prior to fees waived |
Portfolio turnover |
|
|
| 1 | The average shares outstanding method has been applied for per share information. |
| 2 | Total investment return is based on the change in net asset value of a share during the period and assumes reinvestment of dividends and distributions at net asset value. Total investment return during all of the periods shown reflects a waiver by the manager. Performance would have been lower had the waiver not been in effect. |
See accompanying notes, which are an integral part of the financial statements.
58
| | | | | | | | | | | | | | | | | | | | |
| | | Year ended | |
| | | | |
| | | 7/31/15 | | | 7/31/14 | | | 7/31/13 | | | 7/31/12 | | | 7/31/11 | |
| |
| | $ | 6.800 | | | $ | 6.270 | | | $ | 7.140 | | | $ | 6.370 | | | $ | 6.430 | |
| | | | | |
| | | | | | | | | | | | | | | | | | | | |
| | | 0.274 | | | | 0.295 | | | | 0.297 | | | | 0.317 | | | | 0.332 | |
| | | (0.215 | ) | | | 0.541 | | | | (0.427 | ) | | | 1.055 | | | | 0.269 | |
| | | | | | | | | | | | | | | | | | | | |
| | | 0.059 | | | | 0.836 | | | | (0.130 | ) | | | 1.372 | | | | 0.601 | |
| | | | | | | | | | | | | | | | | | | | |
| | | | | |
| | | | | | | | | | | | | | | | | | | | |
| | | (0.284 | ) | | | (0.306 | ) | | | (0.304 | ) | | | (0.336 | ) | | | (0.344 | ) |
| | | (0.295 | ) | | | — | | | | (0.436 | ) | | | (0.266 | ) | | | (0.317 | ) |
| | | | | | | | | | | | | | | | | | | | |
| | | (0.579 | ) | | | (0.306 | ) | | | (0.740 | ) | | | (0.602 | ) | | | (0.661 | ) |
| | | | | | | | | | | | | | | | | | | | |
| | | | | |
| | $ | 6.280 | | | $ | 6.800 | | | $ | 6.270 | | | $ | 7.140 | | | $ | 6.370 | |
| | | | | | | | | | | | | | | | | | | | |
| | | | | |
| | | 0.78% | | | | 13.72% | | | | (2.21% | ) | | | 22.82% | | | | 10.01% | |
| | | | | |
| | | | | | | | | | | | | | | | | | | | |
| | $ | 342,209 | | | $ | 307,039 | | | $ | 304,299 | | | $ | 344,628 | | | $ | 124,076 | |
| | | 0.73% | | | | 0.71% | | | | 0.70% | | | | 0.70% | | | | 0.70% | |
| | | 0.77% | | | | 0.75% | | | | 0.74% | | | | 0.76% | | | | 0.82% | |
| | | 4.14% | | | | 4.60% | | | | 4.38% | | | | 4.78% | | | | 5.32% | |
| | | 4.10% | | | | 4.56% | | | | 4.34% | | | | 4.72% | | | | 5.20% | |
| | | 185% | | | | 216% | | | | 217% | | | | 172% | | | | 147% | |
|
| |
59
Notes to financial statements
Delaware Corporate Bond Fund and Delaware Extended Duration Bond Fund
July 31, 2015
Delaware Group® Income Funds (Trust) is organized as a Delaware statutory trust and offers four series: Delaware Corporate Bond Fund, Delaware Diversified Floating Rate Fund, Delaware Extended Duration Bond Fund, and Delaware High-Yield Opportunities Fund. These financial statements and the related notes pertain to Delaware Corporate Bond Fund and Delaware Extended Duration Bond Fund (each, a Fund or collectively, the Funds). The Trust is an open-end investment company. The Funds are considered diversified under the Investment Company Act of 1940, as amended, and offer Class A, Class C, Class R, and Institutional Class shares. Class A shares are sold with a maximum front-end sales charge of 4.50%. Class A share purchases of $1,000,000 or more will incur a contingent deferred sales charge (CDSC) of 1.00% if redeemed during the first year and 0.50% during the second year, provided that Delaware Distributors, L.P. (DDLP) paid a financial advisor a commission on the purchase of those shares. Effective Sept. 25, 2014, all remaining shares of Class B were converted to Class A shares. Between June 1, 2007 and Sept. 25, 2014, Class B shares could be purchased only through dividend reinvestment and certain permitted exchanges. Class B shares automatically converted to Class A shares on a quarterly basis approximately eight years after purchase. Class C shares are sold with a CDSC of 1.00%, if redeemed during the first 12 months. Class R and Institutional Class shares are not subject to a sales charge and are offered for sale exclusively to certain eligible investors.
The investment objective of the Funds is to seek to provide investors with total return.
1. Significant Accounting Policies
The following accounting policies are in accordance with U.S. generally accepted accounting principles (U.S. GAAP) and are consistently followed by the Funds.
Security Valuation – Equity securities, except those traded on The Nasdaq Stock Market LLC (Nasdaq), are valued at the last quoted sales price as of the time of the regular close of the New York Stock Exchange on the valuation date. Securities traded on the Nasdaq are valued in accordance with the Nasdaq Official Closing Price, which may not be the last sales price. If, on a particular day, an equity security does not trade, the mean between the bid and ask prices will be used, which approximates fair value. U.S. government and agency securities are valued at the mean between the bid and ask prices, which approximates fair value. Other debt securities, credit default swap (CDS) contracts, and interest rate swap options contracts (swaptions) are valued based upon valuations provided by an independent pricing service or broker/counterparty and reviewed by management. To the extent current market prices are not available, the pricing service may take into account developments related to the specific security, as well as transactions in comparable securities. Valuations for fixed income securities utilize matrix systems, which reflect such factors as security prices, yields, maturities, and ratings, and are supplemented by dealer and exchange quotations. For asset-backed securities, collateralized mortgage obligations, commercial mortgage securities, and U.S. government agency mortgage securities, pricing vendors utilize matrix pricing which considers prepayment speed; attributes of the collateral; yield or price of bonds of comparable quality, coupon, maturity, and type as well as broker/dealer-supplied prices. Swap prices are derived using daily swap curves and models that incorporate a number of market data factors, such as discounted cash flows, trades, and values of the underlying reference instruments. Foreign currency exchange contracts and foreign cross currency exchange contracts are valued at the mean between the bid and ask prices, which approximates fair value. Interpolated values are derived when the settlement date of the contract is an interim date for which quotations are not
60
available. Futures contracts are valued at the daily quoted settlement prices. Generally, other securities and assets for which market quotations are not readily available are valued at fair value as determined in good faith under the direction of each Fund’s Board of Trustees (Board). In determining whether market quotations are readily available or fair valuation will be used, various factors will be taken into consideration, such as market closures or suspension of trading in a security.
Federal Income Taxes – No provision for federal income taxes has been made as each Fund intends to continue to qualify for federal income tax purposes as a regulated investment company under Subchapter M of the Internal Revenue Code of 1986, as amended, and make the requisite distributions to shareholders. The Funds evaluate tax positions taken or expected to be taken in the course of preparing the Funds’ tax returns to determine whether the tax positions are “more-likely-than-not” of being sustained by the applicable tax authority. Tax positions not deemed to meet the “more-likely-than-not” threshold are recorded as a tax benefit or expense in the current year. Management has analyzed each Fund’s tax positions taken for all open federal income tax years (July 31, 2012–July 31, 2015) and has concluded that no provision for federal income tax is required in the Funds’ financial statements.
Class Accounting – Investment income and common expenses are allocated to the various classes of each Fund on the basis of “settled shares” of each class in relation to the net assets of each Fund. Realized and unrealized gain (loss) on investments are allocated to the various classes of each Fund on the basis of daily net assets of each class. Distribution expenses relating to a specific class are charged directly to that class.
Repurchase Agreements – The Funds may purchase certain U.S. government securities subject to the counterparty’s agreement to repurchase them at an agreed upon date and price. The counterparty will be required on a daily basis to maintain the value of the collateral subject to the agreement at not less than the repurchase price (including accrued interest). The agreements are conditioned upon the collateral being deposited under the Federal Reserve book-entry system with the Funds’ custodian or a third-party sub-custodian. In the event of default or bankruptcy by the other party to the agreement, retention of the collateral may be subject to legal proceedings. All open repurchase agreements as of the date of this report were entered into on July 31, 2015.
Foreign Currency Transactions – Transactions denominated in foreign currencies are recorded at the prevailing exchange rates on the valuation date in accordance with the Funds’ prospectus. The value of all assets and liabilities denominated in foreign currencies is translated daily into U.S. dollars at the exchange rate of such currencies against the U.S. dollar. Transaction gains or losses resulting from changes in exchange rates during the reporting period or upon settlement of the foreign currency transaction are reported in operations for the current period. The Funds generally bifurcate that portion of realized gains and losses on investments in debt securities which is due to changes in foreign exchange rates from that which is due to changes in market prices of debt securities. That portion of gains (losses), which is due to changes in foreign exchange rates, is included on the “Statements of operations” under “Net realized gain (loss) on foreign currencies.” The Funds report certain foreign currency related transactions as components of realized gains (losses) for financial reporting purposes, whereas such components are treated as ordinary income (loss) for federal income tax purposes.
61
Notes to financial statements
Delaware Corporate Bond Fund and Delaware Extended Duration Bond Fund
1. Significant Accounting Policies (continued)
Use of Estimates – Each Fund is an investment company, whose financial statements are prepared in conformity with U.S. GAAP. Therefore, each Fund follows the accounting and reporting guidelines for investment companies. The preparation of financial statements in conformity with U.S. GAAP requires management to make estimates and assumptions that affect the fair value of investments, the reported amounts of assets and liabilities and disclosure of contingent assets and liabilities at the date of the financial statements, and the reported amounts of revenues and expenses during the reporting period. Actual results could differ from those estimates and the differences could be material.
Other – Expenses directly attributable to a Fund are charged directly to that Fund. Other expenses common to various funds within the Delaware Investments® Family of Funds are generally allocated among such funds on the basis of average net assets. Management fees and some other expenses are paid monthly. Security transactions are recorded on the date the securities are purchased or sold (trade date) for financial reporting purposes. Costs used in calculating realized gains and losses on the sale of investment securities are those of the specific securities sold. Dividend income is recorded on the ex-dividend date and interest income is recorded on the accrual basis. Discounts and premiums on debt securities are accreted or amortized to interest income, respectively, over the lives of the respective securities using the effective interest method. Each Fund declares dividends daily from net investment income and pays the dividends monthly and declares and pays distributions from net realized gain on investments, if any, annually. Each Fund may distribute more frequently, if necessary for tax purposes. Dividends and distributions, if any, are recorded on the ex-dividend date.
Each Fund may receive earnings credits from its custodian when positive cash balances are maintained, which may be used to offset custody fees. There were no such earnings credits for the year ended July 31, 2015.
Each Fund receives earnings credits from its transfer agent when positive cash balances are maintained, which may be used to offset transfer agent fees. If the amount earned is greater than one dollar, the expense paid under this arrangement is included on the “Statements of operations” under “Dividend disbursing and transfer agent fees and expenses” with the corresponding expense offset shown under “Less expense paid indirectly.” For the year ended July 31, 2015, each Fund earned the following amounts under this agreement:
| | | | |
| | | Delaware Corporate Bond Fund | | Delaware
Extended Duration
Bond Fund |
| | $518 | | $262 |
2. Investment Management, Administration Agreements, and Other Transactions with Affiliates
In accordance with the terms of its respective investment management agreement, each Fund pays Delaware Management Company (DMC), a series of Delaware Management Business Trust and the investment manager, an annual fee which is calculated based on each Fund’s average daily net assets as follows:
62
| | | | | | |
| | | Delaware Corporate Bond Fund | | | Delaware
Extended Duration
Bond Fund |
On the first $500 million | | | 0.5000% | | | 0.5500% |
On the next $500 million | | | 0.4750% | | | 0.5000% |
On the next $1.5 billion | | | 0.4500% | | | 0.4500% |
In excess of $2.5 billion | | | 0.4250% | | | 0.4250% |
DMC has contractually agreed to waive that portion, if any, of its management fee and/or pay/reimburse each Fund to the extent necessary to ensure that total annual operating expenses ((excluding any 12b-1 fees, acquired fund fees and expenses, taxes, interest, short sale and dividend interest expenses, brokerage fees, certain insurance costs, and nonroutine expenses or costs, including, but not limited to, those relating to reorganizations, litigation, conducting shareholder meetings, and liquidations) (collectively, nonroutine expenses)), do not exceed specified percentages of average daily net assets of each Fund from Aug. 1, 2014 through July 31, 2015* as shown below. For purpose of these waivers and reimbursements, nonroutine expenses may also include such additional costs and expenses as may be agreed upon from time to time by the Funds’ Board and DMC. These expense waivers and reimbursements apply only to expenses paid directly by the Funds and may only be terminated by agreement of DMC and the Funds.
| | | | | | |
| | | Delaware Corporate Bond Fund | | | Delaware
Extended Duration
Bond Fund |
Operating expense limitation as a percentage of average daily net assets (per annum) | | | 0.69% | | | 0.71% |
*The contractual waiver period is from Nov. 27, 2013, through Nov. 30, 2015.
Effective Nov. 1, 2014, Delaware Investments Fund Services Company (DIFSC), an affiliate of DMC, provides fund accounting and financial administration oversight services to the Funds. Prior to this time, Delaware Service Company, Inc. (DSC), an affiliate of DMC, provided fund accounting and financial administration oversight services to the Funds under a substantially identical agreement with an identical fee schedule. For these services, DIFSC’s fees are calculated based on the aggregate daily net assets of the Delaware Investments® Family of Funds at the following annual rate: 0.0050% of the first $30 billion; 0.0045% of the next $10 billion; 0.0040% of the next $10 billion; and 0.0025% of aggregate average daily net assets in excess of $50 billion. The fees payable to DIFSC under the service agreement described above are allocated among all funds in the Delaware Investments Family of Funds on a relative net asset value basis. These amounts are included on the “Statements of operations” under “Accounting and administration expenses.” For the year ended July 31, 2015, the Funds were charged for these services as follows:
| | | | |
| | | Delaware Corporate Bond Fund | | Delaware
Extended Duration
Bond Fund |
| | $63,492 | | $31,968 |
63
Notes to financial statements
Delaware Corporate Bond Fund and Delaware Extended Duration Bond Fund
2. Investment Management, Administration Agreements, and Other Transactions with Affiliates (continued)
Effective Nov. 1, 2014, DIFSC also became the transfer agent and dividend disbursing agent of the Funds. Prior to this time, DSC was the transfer agent and dividend disbursing agent of the Funds under a substantially identical agreement with an identical fee schedule. For these services, DIFSC’s fees are calculated based on the aggregate daily net assets of the retail funds within the Delaware Investments® Family of Funds at the following annual rate: 0.025% of the first $20 billion, 0.020% of the next $5 billion; 0.015% of the next $5 billion; and 0.013% of average daily net assets in excess of $30 billion. The fees payable to DIFSC under the service agreement described above are allocated among all retail Funds in the Delaware Investments Family of Funds on a relative net asset value basis. These amounts are included on the “Statements of operations” under “Dividend disbursing and transfer agent fees and expenses.” For the year ended July 31, 2015, each Fund was charged for these services as follows:
| | | | |
| | | Delaware Corporate Bond Fund | | Delaware
Extended Duration
Bond Fund |
| | $279,214 | | $140,661 |
Pursuant to a sub-transfer agency agreement between DIFSC and BNY Mellon Investment Servicing (US) Inc. (BNYMIS), BNYMIS provides certain sub-transfer agency services to the Funds. Sub-transfer agency fees are passed on to and paid by the Funds.
Pursuant to a distribution agreement and distribution plan, each Fund pays DDLP, the distributor and an affiliate of DMC, an annual distribution and service fee of 0.25%,1.00%, and 0.50% of the average daily net assets of the Class A, Class C, and Class R shares, respectively. The Funds’ Class B shares were subject to a 12b-1 fee of 1.00% of the average daily net assets, which was contractually waived to 0.25% of average daily net assets from Aug. 1, 2014 through Sept. 25, 2014. Institutional Class shares pay no distribution and service fees.
As provided in the investment management agreement, each Fund bears a portion of the cost of certain resources shared with DMC, including the cost of internal personnel of DMC and/or its affiliates that provide legal, tax, and regulatory reporting services to the Funds. These amounts are included on the “Statements of operations” under “Legal fees.” For the year ended July 31, 2015, each Fund was charged for internal legal, tax, and regulatory reporting services provided by DMC and/or its affiliates’ employees as follows:
| | | | |
| | | Delaware Corporate Bond Fund | | Delaware
Extended Duration
Bond Fund |
| | $39,646 | | $22,442 |
For the year ended July 31, 2015, DDLP earned commissions on sales of Class A shares for each Fund as follows:
| | | | |
| | | Delaware Corporate Bond Fund | | Delaware
Extended Duration
Bond Fund |
| | $41,982 | | $37,134 |
64
For the year ended July 31, 2015, DDLP received gross CDSC commissions on redemptions of each Fund’s Class A and Class C shares, respectively, and these commissions were entirely used to offset upfront commissions previously paid by DDLP to broker/dealers on sales of those shares. The amounts received were as follows:
| | | | |
| | | Delaware Corporate Bond Fund | | Delaware
Extended Duration
Bond Fund |
Class A | | $ 6 | | $ — |
Class C | | 2,097 | | 2,610 |
Trustees’ fees include expenses accrued by the Funds for each Trustee’s retainer and meeting fees. Certain officers of DMC, DIFSC and DDLP are officers and/or Trustees of the Trust. These officers and Trustees are paid no compensation by the Funds.
3. Investments
For the year ended July 31, 2015, the Funds made purchases and sales of investment securities other than short-term investments as follows:
| | | | | | | | |
| | | Delaware
Corporate
Bond Fund | | | Delaware
Extended Duration
Bond Fund | |
Purchases other than U.S. government securities | | $ | 2,789,273,688 | | | $ | 1,146,351,767 | |
Purchases of U.S. government securities | | | 347,299,871 | | | | 79,531,467 | |
Sales other than U.S. government securities | | | 2,485,622,144 | | | | 1,145,253,019 | |
Sales of U.S. government securities | | | 335,258,586 | | | | 72,608,067 | |
At July 31, 2015, the cost and unrealized appreciation (depreciation) of investments for federal income tax purposes for each Fund were as follows:
| | | | | | | | |
| | | Delaware
Corporate
Bond Fund | | | Delaware
Extended Duration
Bond Fund | |
Cost of Investments | | $ | 1,511,061,302 | | | $ | 657,115,943 | |
| | | | | | | | |
Aggregate unrealized appreciation of investments | | $ | 26,140,025 | | | $ | 16,450,967 | |
Aggregate unrealized depreciation of investments | | | (40,596,391 | ) | | | (22,889,769) | |
| | | | | | | | |
Net unrealized depreciation of investments | | $ | (14,456,366 | ) | | $ | (6,438,802) | |
| | | | | | | | |
U.S. GAAP defines fair value as the price that each Fund would receive to sell an asset or pay to transfer a liability in an orderly transaction between market participants at the measurement date under current market conditions. A three-level hierarchy for fair value measurements has been established based upon the transparency of inputs to the valuation of an asset or liability. Inputs may be observable or unobservable and refer broadly to the assumptions that market participants would use in pricing the asset or liability. Observable inputs reflect the assumptions market participants would use in pricing the asset or liability based on market data obtained from sources independent of the reporting entity. Unobservable inputs reflect the reporting entity’s own assumptions about the assumptions that market participants would use in pricing the asset or liability based on the best information available under the circumstances. Each Fund’s investment in its entirety is assigned a level based upon the observability
65
Notes to financial statements
Delaware Corporate Bond Fund and Delaware Extended Duration Bond Fund
3. Investments (continued)
of the inputs which are significant to the overall valuation. The three-level hierarchy of inputs is summarized below.
| | |
| Level 1 – | | Inputs are quoted prices in active markets for identical investments. (Examples: equity securities, open-end investment companies, futures contracts, exchange-traded options contracts) |
| |
| Level 2 – | | Other observable inputs, including, but not limited to: quoted prices for similar assets or liabilities in markets that are active, quoted prices for identical or similar assets or liabilities in markets that are not active, inputs other than quoted prices that are observable for the assets or liabilities (such as interest rates, yield curves, volatilities, prepayment speeds, loss severities, credit risks, and default rates) or other market-corroborated inputs. (Examples: debt securities, government securities, swap contracts, foreign currency exchange contracts, foreign securities utilizing international fair value pricing, broker-quoted securities, fair valued securities) |
| |
| Level 3 – | | Significant unobservable inputs, including each Fund’s own assumptions used to determine the fair value of investments. (Examples: broker-quoted securities, fair valued securities) |
Level 3 investments are valued using significant unobservable inputs. Each Fund may also use an income-based valuation approach in which the anticipated future cash flows of the investment are discounted to calculate fair value. Discounts may also be applied due to the nature or duration of any restrictions on the disposition of the investments. Valuations may also be based upon current market prices of securities that are comparable in coupon, rating, maturity, and industry. The derived value of a Level 3 investment may not represent the value which is received upon disposition and this could impact the results of operations.
The following tables summarize the valuation of each Fund’s investments by fair value hierarchy levels as of July 31, 2015:
| | | | | | | | | | | | |
| | | Delaware Corporate Bond Fund | |
Securities | | Level 1 | | | Level 2 | | | Total | |
Agency, Asset- & Mortgage-Backed Securities | | $ | — | | | $ | 4,997,225 | | | $ | 4,997,225 | |
Corporate Debt | | | — | | | | 1,368,643,205 | | | | 1,368,643,205 | |
Municipal Bonds | | | — | | | | 21,709,775 | | | | 21,709,775 | |
Senior Secured Loans | | | — | | | | 16,485,106 | | | | 16,485,106 | |
Preferred Stock1 | | | 21,164,111 | | | | 30,044,111 | | | | 51,208,222 | |
U.S. Treasury Obligations | | | — | | | | 11,608,249 | | | | 11,608,249 | |
Short-Term Investments | | | — | | | | 21,953,154 | | | | 21,953,154 | |
| | | | | | | | | | | | |
Total Value of Securities | | $ | 21,164,111 | | | $ | 1,475,440,825 | | | $ | 1,496,604,936 | |
| | | | | | | | | | | | |
| | | |
Futures Contracts | | $ | (487,426 | ) | | $ | — | | | $ | (487,426 | ) |
66
| | | | | | | | | | | | |
| | | Delaware Extended Duration Bond Fund | |
Securities | | Level 1 | | | Level 2 | | | Total | |
Corporate Debt | | $ | — | | | $ | 553,065,397 | | | $ | 553,065,397 | |
Municipal Bonds | | | — | | | | 30,212,539 | | | | 30,212,539 | |
Senior Secured Loans | | | — | | | | 2,968,624 | | | | 2,968,624 | |
Preferred Stock1 | | | 11,174,370 | | | | 10,197,303 | | | | 21,371,673 | |
U.S. Treasury Obligations | | | — | | | | 8,350,801 | | | | 8,350,801 | |
Short-Term Investments | | | — | | | | 34,708,107 | | | | 34,708,107 | |
| | | | | | | | | | | | |
Total Value of Securities | | $ | 11,174,370 | | | $ | 639,502,771 | | | $ | 650,677,141 | |
| | | | | | | | | | | | |
| | | |
Futures Contracts | | $ | 1,082,214 | | | $ | — | | | $ | 1,082,214 | |
Swap Contract | | | — | | | | (11,024 | ) | | | (11,024 | ) |
| 1 | Security type is valued across multiple levels. Level 1 investments represent exchange-traded investments while Level 2 investments represent matrix-priced investments. The amounts attributed to Level 1 investments and Level 2 investments represent the following percentages of the total market value of these security types for each Fund: |
| | | | | | | | | | |
| | | Delaware Corporate Bond Fund |
| | Level 1 | | | Level 2 | | | Total |
Preferred Stock | | | 41.33 | % | | | 58.67 | % | | 100.00% |
| |
| | | Delaware Extended Duration Bond Fund |
| | Level 1 | | | Level 2 | | | Total |
Preferred Stock | | | 52.29 | % | | | 47.71 | % | | 100.00% |
During the year ended July 31, 2015, there were no transfers between Level 1 investments, Level 2 investments, or Level 3 investments that had a significant impact to the Funds. Each Fund’s policy is to recognize transfers between levels at the beginning of the reporting period.
A reconciliation of Level 3 investments is presented when each Fund has a significant amount of Level 3 investments at the beginning, interim, or end of the period in relation to net assets. At July 31, 2015, there were no Level 3 investments.
4. Dividend and Distribution Information
Income and long-term capital gain distributions are determined in accordance with federal income tax regulations, which may differ from U.S. GAAP. Additionally, distributions from net gains on foreign currency transactions and net short-term gains on sales of investment securities are treated as ordinary income for federal income tax purposes. The tax character of dividends and distributions paid during the years ended July 31, 2015 and 2014 was as follows:
67
Notes to financial statements
Delaware Corporate Bond Fund and Delaware Extended Duration Bond Fund
4. Dividend and Distribution Information (continued)
| | | | | | | | |
| | | Delaware Corporate
Bond Fund | |
| | | Year ended | |
| | | 7/31/15 | | | 7/31/14 | |
Ordinary income | | $ | 52,887,174 | | | $ | 52,199,172 | |
Long-term capital gains | | | 10,919,849 | | | | 18,877,256 | |
| | | | | | | | |
Total | | $ | 63,807,023 | | | $ | 71,076,428 | |
| | | | | | | | |
| |
| | | Delaware
Extended Duration
Bond Fund | |
| | | Year ended | |
| | | 7/31/15 | | | 7/31/14 | |
Ordinary income | | $ | 30,338,638 | | | $ | 29,826,896 | |
Long-term capital gains | | | 25,709,194 | | | | — | |
| | | | | | | | |
Total | | $ | 56,047,832 | | | $ | 29,826,896 | |
| | | | | | | | |
5. Components of Net Assets on a Tax Basis
As of July 31, 2015, the components of net assets on a tax basis were as follows:
| | | | | | | | |
| | | Delaware
Corporate
Bond Fund | | | Delaware
Extended Duration
Bond Fund | |
Shares of beneficial interest | | $ | 1,507,221,132 | | | $ | 653,111,467 | |
Undistributed ordinary income | | | 1,737,000 | | | | — | |
Undistributed long-term capital gains | | | — | | | | 884,727 | |
Distributions payable | | | (1,449,019 | ) | | | (675,279) | |
Other temporary differences | | | (1,023,000 | ) | | | (387,909) | |
Qualified late year loss deferrals | | | (3,364,638 | ) | | | — | |
Unrealized depreciation of investments, foreign currencies and derivatives | | | (14,456,366 | ) | | | (6,437,559) | |
| | | | | | | | |
Net assets | | $ | 1,488,665,109 | | | $ | 646,495,447 | |
| | | | | | | | |
The differences between book basis and tax basis components of net assets are primarily attributable to tax deferral of losses on wash sales, tax deferral of straddle losses, mark-to-market of futures contracts, tax treatment of CDS contracts, trust preferred securities, troubled debt, market discount and premium on debt instruments.
Qualified late year capital losses (including currency and specified gain (loss) items) represent losses realized from Nov. 1, 2014 through July 31, 2015, that in accordance with federal income tax regulations, the Funds have elected to defer and treat as having arisen in the following fiscal year.
68
For financial reporting purposes, capital accounts are adjusted to reflect the tax character of permanent book/tax differences. Reclassifications are primarily due to tax treatment of gain (loss) on foreign currency transactions, dividends and distributions, market discount and premium on debt instruments, and CDS contracts. Results of operations and net assets were not affected by these reclassifications. For the year ended July 31, 2015 , the Funds recorded the following reclassifications:
| | | | | | |
| | | Delaware
Corporate
Bond Fund | | | Delaware
Extended Duration
Bond Fund |
Undistributed net investment income | | $ | 4,894,348 | | | $ 1,026,845 |
Accumulated net realized loss | | | (4,894,348 | ) | | (1,026,845) |
6. Capital Shares
Transactions in capital shares were as follows:
| | | | | | | | | | | | | | | | |
| | | Delaware Corporate
Bond Fund | | | Delaware Extended Duration
Bond Fund | |
| | | Year ended | | | Year ended | |
| | | 7/31/15 | | | 7/31/14 | | | 7/31/15 | | | 7/31/14 | |
Shares sold: | | | | | | | | | | | | | | | | |
Class A | | | 26,035,011 | | | | 30,075,938 | | | | 17,488,346 | | | | 17,412,308 | |
Class B | | | — | | | | 4,739 | | | | — | | | | — | |
Class C | | | 4,662,743 | | | | 3,970,810 | | | | 1,660,867 | | | | 705,219 | |
Class R | | | 1,595,091 | | | | 1,928,640 | | | | 2,295,439 | | | | 1,580,375 | |
Institutional Class | | | 99,203,167 | | | | 37,791,594 | | | | 25,635,558 | | | | 15,819,841 | |
|
Shares issued upon reinvestment of dividends and distributions: | |
Class A | | | 3,512,859 | | | | 4,998,351 | | | | 3,227,370 | | | | 2,117,118 | |
Class B | | | 673 | | | | 15,112 | | | | 325 | | | | 3,293 | |
Class C | | | 1,216,121 | | | | 1,558,329 | | | | 344,116 | | | | 170,925 | |
Class R | | | 227,045 | | | | 331,118 | | | | 401,068 | | | | 204,017 | |
Institutional Class | | | 4,014,914 | | | | 3,464,059 | | | | 4,238,471 | | | | 2,045,263 | |
| | | 140,467,624 | | | | 84,138,690 | | | | 55,291,560 | | | | 40,058,359 | |
Shares redeemed: | | | | | | | | | | | | | | | | |
Class A | | | (37,484,235 | ) | | | (59,432,612 | ) | | | (22,527,480 | ) | | | (37,837,815 | ) |
Class B | | | (113,170 | ) | | | (378,136 | ) | | | (44,229 | ) | | | (78,882 | ) |
Class C | | | (7,053,497 | ) | | | (16,971,428 | ) | | | (1,125,630 | ) | | | (3,992,342 | ) |
Class R | | | (2,739,467 | ) | | | (2,745,449 | ) | | | (3,563,558 | ) | | | (1,396,271 | ) |
Institutional Class | | | (38,397,802 | ) | | | (51,383,480 | ) | | | (20,537,978 | ) | | | (21,223,346 | ) |
| | | (85,788,171 | ) | | | (130,911,105 | ) | | | (47,798,875 | ) | | | (64,528,656 | ) |
Net increase (decrease) | | | 54,679,453 | | | | (46,772,415 | ) | | | 7,492,685 | | | | (24,470,297 | ) |
For the years ended July 31, 2015 and 2014, the following shares and values were converted from Class B to Class A. The amounts are included in Class B redemptions and Class A subscriptions in the tables above, and the “Statements of changes in net assets.”
69
Notes to financial statements
Delaware Corporate Bond Fund and Delaware Extended Duration Bond Fund
6. Capital Shares (continued)
| | | | | | | | | | | | | | | | | | | | | | | | |
| | | Class B
Shares | | | Year ended
7/31/15
Class A
Shares | | | Value | | | Class B
Shares | | | Year ended
7/31/14
Class A
Shares | | | Value | |
Delaware Corporate Bond Fund | | | 19,995 | | | | 19,967 | | | | $120,802 | | | | 19,245 | | | | 19,264 | | | | $114,598 | |
Delaware Extended Duration Bond Fund | | | 9,053 | | | | 9,042 | | | | 61,397 | | | | 11,551 | | | | 11,534 | | | | 74,200 | |
Certain shareholders may exchange shares of one class for another class in the same Fund. For the year ended July 31, 2015, the Funds had the following exchange transactions. These exchange transactions are included as subscriptions and redemptions in the tables on the previous page, and the “Statements of changes in net assets.”
| | | | | | | | | | | | | | | | | | | | | | | | | | | | |
| | | Year ended 7/31/15 | |
| | | Exchange Redemptions | | | Exchange Subscriptions | |
| | | Class A
Shares | | | Class C
Shares | | | Institutional
Class
Shares | | | Value | | | Class A
Shares | | | Institutional
Class
Shares | | | Value | |
Delaware Corporate Bond Fund | | | 0.29 | | | | 22,550 | | | | 87,791 | | | $ | 661,383 | | | | 87,791 | | | | 22,581 | | | $ | 661,383 | |
Delaware Extended Duration Bond Fund | | | 2,769 | | | | — | | | | 4,348 | | | | 46,534 | | | | 4,348 | | | | 2,781 | | | | 46,534 | |
| | | | | | | | | | | | | | | | |
| | | Year ended 7/31/14 | |
| | | Exchange Redemptions | | | Exchange Subscriptions | |
| | | Class C
Shares | | | Value | | | Institutional
Class
Shares | | | Value | |
Delaware Corporate Bond Fund | | | 39 | | | | $241 | | | | 39 | | | | $241 | |
7. Line of Credit
Each Fund, along with certain other funds in the Delaware Investments® Family of Funds (Participants), was a participant in a $225,000,000 revolving line of credit intended to be used for temporary or emergency purposes as an additional source of liquidity to fund redemptions of investor shares. Under the agreement, the Participants were charged an annual commitment fee of 0.08%, which was allocated across the Participants on the basis of each Participant’s allocation of the entire facility. The Participants were permitted to borrow up to a maximum of one third of their net assets under the agreement. Each Participant was individually, and not jointly, liable for its particular advances, if any, under the line of credit. The line of credit under the agreement expired on Nov. 10, 2014.
On Nov. 10, 2014, each Fund, along with the other Participants, entered into an amendment to the agreement for a $275,000,000 revolving line of credit. The line of credit is to be used as described above
70
and operates in substantially the same manner as the original agreement. The line of credit available under the agreement expires on Nov. 9, 2015.
The Funds had no amounts outstanding as of July 31, 2015, or at any time during the year then ended.
8. Derivatives
U.S. GAAP requires disclosures that enable investors to understand: (1) how and why an entity uses derivatives; (2) how they are accounted for; and (3) how they affect an entity’s results of operations and financial position.
Foreign Currency Exchange Contracts – Each Fund may enter into foreign currency exchange contracts and foreign cross currency exchange contracts as a way of managing foreign exchange rate risk. Each Fund may enter into these contracts to fix the U.S. dollar value of a security that it has agreed to buy or sell for the period between the date the trade was entered into and the date the security is delivered and paid for. Each Fund may also use these contracts to hedge the U.S. dollar value of securities it already owns that are denominated in foreign currencies. In addition, each Fund may enter into these contracts to facilitate or expedite the settlement of portfolio transactions. The change in value is recorded as an unrealized gain or loss. When the contract is closed, a realized gain or loss is recorded equal to the difference between the value of the contract at the time it was opened and the value at the time it was closed.
The use of foreign currency exchange contracts and foreign cross currency exchange contracts does not eliminate fluctuations in the underlying prices of the securities, but does establish a rate of exchange that can be achieved in the future. Although foreign currency exchange contracts and foreign cross currency exchange contracts limit the risk of loss due to an unfavorable change in the value of the hedged currency, they also limit any potential gain that might result should the value of the currency change favorably. In addition, each Fund could be exposed to risks if the counterparties to the contracts are unable to meet the terms of their contracts. Each Fund’s maximum risk of loss from counterparty credit risk is the value of its currency exchanged with the counterparty. The risk is generally mitigated by having a netting arrangement between each Fund and the counterparty and by the posting of collateral by the counterparty to the Fund to cover the Fund’s exposure to the counterparty. No foreign currency exchange contracts were outstanding at July 31, 2015.
During the year ended July 31, 2015, Delaware Extended Duration Bond Fund used foreign currency exchange contracts to hedge the U.S. dollar value of securities it already owns that are denominated in foreign currencies.
Futures Contracts – A futures contract is an agreement in which the writer (or seller) of the contract agrees to deliver to the buyer an amount of cash or securities equal to a specific dollar amount times the difference between the value of a specific security or index at the close of the last trading day of the contract and the price at which the agreement is made. Each Fund may use futures in the normal course of pursuing its investment objective. Each Fund may invest in futures contracts to hedge its existing portfolio securities against fluctuations in value caused by changes in interest rates or market conditions. Upon entering into a futures contract, each Fund deposits cash or pledges U.S. government securities to a broker, equal to the minimum “initial margin” requirements of the exchange on which the contract is traded. Subsequent payments are received from the broker or paid to the broker each day, based on the
71
Notes to financial statements
Delaware Corporate Bond Fund and Delaware Extended Duration Bond Fund
8. Derivatives (continued)
daily fluctuation in the market value of the contract. These receipts or payments are known as “variation margin” and are recorded daily by the Funds as unrealized gains or losses until the contracts are closed. When the contracts are closed, the Funds record a realized gain or loss equal to the difference between the value of the contract at the time it was opened and the value at the time it was closed. Risks of entering into futures contracts include potential imperfect correlation between the futures contracts and the underlying securities and the possibility of an illiquid secondary market for these instruments. When investing in futures, there is reduced counterparty credit risk to a Fund because futures are exchange-traded and the exchange’s clearinghouse, as counterparty to all exchange-traded futures, guarantees against default. At July 31, 2015, Delaware Corporate Bond Fund posted $279,000 cash as margin for futures contracts, which is presented as “Cash collateral due from brokers” on the “Statements of assets and liabilities.” At July 31, 2015, Delaware Extended Duration Bond Fund posted $1,845,593 securities collateral comprised of U.S. treasury obligations as margin for futures contracts.
During the year ended July 31, 2015, the Funds used futures contracts to hedge the Funds’ existing portfolio securities against fluctuations in value caused by changes in interest rates or market conditions.
Options Contracts – During the year ended July 31, 2015, each Fund entered into options contracts in the normal course of pursuing its investment objective. The Funds may buy or write options contracts for any number of reasons, including without limitation: to manage the Funds’ exposure to changes in securities prices caused by interest rates or market conditions, and foreign currencies; as an efficient means of adjusting the Funds’ overall exposure to certain markets; to protect the value of portfolio securities; and as a cash management tool. The Funds may buy or write call or put options on securities, futures, swaps, swaptions, financial indices, and foreign currencies. When the Funds buy an option, a premium is paid and an asset is recorded and adjusted on a daily basis to reflect the current market value of the option purchased. When the Funds write an option, a premium is received and a liability is recorded and adjusted on a daily basis to reflect the current market value of the option written. Premiums received from writing options that expire unexercised are treated by the Funds on the expiration date as realized gains. The difference between the premium received and the amount paid on effecting a closing purchase transaction, including brokerage commissions, is treated as realized gain or loss. If a call option is exercised, the premium is added to the proceeds from the sale of the underlying security in determining whether the Funds have a realized gain or loss. If a put option is exercised, the premium reduces the cost basis of the securities purchased by each Fund. Each Fund, as writer of an option, bears the market risk of an unfavorable change in the price of the security underlying the written option. When writing options, each Fund is subject to minimal counterparty risk because the counterparty is only obligated to pay premiums and does not bear the market risk of an unfavorable market change.
72
Transactions in options written during the year ended July 31, 2015 for each Fund were as follows:
| | | | | | | | | | |
| | | Delaware Corporate Bond Fund |
Put Options | | Number of
Contracts | | Premiums |
Options outstanding July 31, 2014 | | | | (650,000,000 | ) | | | $ | (2,990,000 | ) |
Options written | | | | (54,000,000 | ) | | | | (491,727 | ) |
Options terminated in closing purchase transactions | | | | 704,000,000 | | | | | 3,481,727 | |
| | | | | | | | | | |
Options outstanding July 31, 2015 | | | | — | | | | $ | — | |
| | | | | | | | | | |
| |
| | | Delaware Extended Duration Bond Fund |
Put Options | | Number of
Contracts | | Premiums |
Options outstanding July 31, 2014 | | | | — | | | | $ | — | |
Options written | | | | (28,500,000) | | | | | (259,523) | |
Options terminated in closing purchase transactions | | | | 28,500,000 | | | | | 259,523 | |
| | | | | | | | | | |
Options outstanding July 31, 2015 | | | | — | | | | $ | — | |
| | | | | | | | | | |
During the year ended July 31, 2015, the Funds used option contracts to seek to manage each Fund’s exposure to changes in securities prices caused by interest rates or market conditions.
Swap Contracts – Each Fund may enter into CDS contracts in the normal course of pursuing its investment objective. Each Fund may enter into CDS contracts in order to hedge against a credit event, to enhance total return or to gain exposure to certain securities or markets. The Funds will not be permitted to enter into any swap transactions unless, at the time of entering into such transactions, the unsecured long-term debt of the actual counterparty, combined with any credit enhancements, is rated at least BBB- by Standard & Poor’s Financial Services LLC. (S&P) or Baa3 by Moody’s Investors Service, Inc. (Moody’s) or is determined to be of equivalent credit quality by DMC.
Credit Default Swaps. A CDS contract is a risk-transfer instrument through which one party (purchaser of protection) transfers to another party (seller of protection) the financial risk of a credit event (as defined in the CDS agreement), as it relates to a particular reference security or basket of securities (such as an index). In exchange for the protection offered by the seller of protection, the purchaser of protection agrees to pay the seller of protection a periodic amount at a stated rate that is applied to the notional amount of the CDS contract. In addition, an upfront payment may be made or received by the Funds in connection with an unwinding or assignment of a CDS contract. Upon the occurrence of a credit event, the seller of protection would pay the par (or other agreed-upon) value of the reference security (or basket of securities) to the counterparty. Credit events generally include, among others, bankruptcy, failure to pay, and obligation default.
73
Notes to financial statements
Delaware Corporate Bond Fund and Delaware Extended Duration Bond Fund
8. Derivatives (continued)
During the year ended July 31, 2015, the Funds entered into CDS contracts as a purchaser of protection. Periodic payments (receipts) on such contracts are accrued daily and recorded as unrealized losses (gains) on swap contracts. Upon payment (receipt), such amounts are recorded as realized losses (gains) on swap contracts. Upfront payments made or received in connection with CDS contracts are amortized over the expected life of the CDS contracts as unrealized losses (gains) on swap contracts. The change in value of CDS contracts is recorded daily as unrealized appreciation or depreciation. A realized gain or loss is recorded upon a credit event (as defined in the CDS agreement) or the maturity or termination of the agreement. Initial margin and variation margin are posted to central counterparties for CDS basket trades, as determined by the applicable central counterparty. During the year ended July 31, 2015, the Funds did not enter into any CDS contracts as a seller of protection. At July 31, 2015, Delaware Extended Duration Bond Fund posted $1,161,962 in cash collateral for centrally cleared swap contracts, which is presented as cash collateral due from brokers on the “Statements of assets and liabilities.”
CDS contracts may involve greater risks than if the Funds had invested in the reference obligation directly. CDS contracts are subject to general market risk, liquidity risk, counterparty risk, and credit risk. The Funds’ maximum risk of loss from counterparty credit risk, either as the seller of protection or the buyer of protection, is the fair value of the contract. This risk is mitigated by (1) for bilateral swap contracts, having a netting arrangement between the Funds and the counterparty and by the posting of collateral by the counterparty to the Funds to cover the Funds’ exposure to the counterparty, and (2) for cleared swaps, trading these instruments through a central counterparty.
During the year ended July 31, 2015, the Funds used CDS contracts to hedge against credit events.
Swaps Generally. The value of open swaps may differ from that which would be realized in the event each Fund terminated its position in the contract on a given day. Risks of entering into these contracts include the potential inability of the counterparty to meet the terms of the contracts. This type of risk is generally limited to the amount of favorable movement in the value of the underlying security, instrument, or basket of instruments, if any, at the day of default. Risks also arise from potential losses from adverse market movements and such losses could exceed the unrealized amounts shown on the “Schedules of investments.”
Fair values of derivative instruments as of July 31, 2015 were as follows:
| | |
| | | Delaware Corporate Bond Fund |
Statements of Assets and Liabilities Location | |
Liability Derivatives
Fair Value
Interest rate
Contracts |
Variation margin due to broker on futures contracts* | | $(487,426) |
74
| | | | | | | | | | | | |
| | | Delaware Extended Duration Bond Fund | |
| | | Asset Derivatives Fair Value | |
Statements of Assets and Liabilities Location | | Interest rate
Contracts | | | Credit Contracts | | | Total | |
Variation margin due from broker on futures contracts* | | | $1,082,214 | | | | $ — | | | | $1,082,214 | |
Unrealized appreciation on credit default swap contracts | | | — | | | | 8,087 | | | | 8,087 | |
Total | | | $1,082,214 | | | | $8,087 | | | | $1,090,301 | |
| | | | | | |
| | | | | Liability Derivatives Fair Value | | |
Statements of Assets and Liabilities Location | | Interest
Contracts | | Credit Contracts | | Total |
Variation margin due to broker on centrally cleared credit default swap contracts | | $— | | $(19,111) | | $(19,111) |
*Includes cumulative appreciation (depreciation) of futures contracts from the date the contracts are opened through July 31, 2015. Only current day variation margin is reported on the Funds’ “Statements of assets and liabilities.”
The effect of derivative instruments on the “Statements of operations” for the year ended July 31, 2015 were as follows:
| | | | | | | | | | | | | | | | |
| | | | | | Delaware Corporate Bond Fund | | | | |
| | | | | | Net Realized Gain (Loss) on: | | | | |
| | | Futures
Contracts | | | Options
Written | | | Swap
Contracts | | | Total | |
Interest rate contracts | | | $904,138 | | | | $2,521,727 | | | | $(7,685,980 | ) | | | $(4,260,115 | ) |
Credit contracts | | | | | | | — | | | | (812,066 | ) | | | (812,066 | ) |
| | | | | | | | | | | | | | | | |
Total | | | $904,138 | | | | $2,521,727 | | | | $(8,498,046 | ) | | | $(5,072,181 | ) |
| | | | | | | | | | | | | | | | |
| | | Delaware Corporate Bond Fund | |
| | | Net Change in Unrealized Appreciation (Depreciation) of: | |
| | | Futures
Contracts | | | Options
Written | | | Swap Contracts | | | Total | |
Interest rate contracts | | | $(506,236 | ) | | | $(1,107,547 | ) | | | $— | | | | $(1,613,783 | ) |
75
Notes to financial statements
Delaware Corporate Bond Fund and Delaware Extended Duration Bond Fund
8. Derivatives (continued)
| | | | | | | | | | | | | | | | | | | | |
| | | | | | Delaware Extended Duration Bond Fund | |
| | | | | | Net Realized Gain (Loss) on: | |
| | | Foreign
Currency
Exchange
Contracts | | | Futures
Contracts | | | Options
Written | | | Swap
Contracts | | | Total | |
Forward currency exchange contracts | | | $(6,089 | ) | | | $ — | | | | $ — | | | | $ — | | | | $ (6,089 | ) |
Interest rate contracts | | | — | | | | 9,083,036 | | | | 9,523 | | | | (2,079,300 | ) | | | 7,013,259 | |
Credit contracts | | | — | | | | — | | | | — | | | | (395,162 | ) | | | (395,162 | ) |
| | | | | | | | | | | | | | | | | | | | |
Total | | | $(6,089 | ) | | | $9,083,036 | | | | $9,523 | | | | $(2,474,462 | ) | | | $6,612,008 | |
| | | | | | | | | | | | | | | | | | | | |
| | | | | | | | | | | | |
| | | Delaware Extended Duration Bond Fund | |
| | | Net Change in Unrealized Appreciation (Depreciation) of: | |
| | | Futures
Contracts | | | Swap
Contracts | | | Total | |
Interest rate contracts | | | $1,117,491 | | | | $ — | | | | $1,117,491 | |
Credit contracts | | | — | | | | (19,573 | ) | | | (19,573 | ) |
| | | | | | | | | | | | |
Total | | | $1,117,491 | | | | $(19,573 | ) | | | $1,097,918 | |
| | | | | | | | | | | | |
Derivatives generally. The table below summarizes the average balance of derivative holdings by the Funds during the year ended July 31, 2015:
| | | | | | | | | | | | |
| | | Long Derivative Volume |
| | | | | | Delaware Corporate Bond Fund | | | | | Delaware Extended Duration Bond Fund |
Futures contracts (average notional value) | | | USD | | | 2,013,896 | | | USD | | | 93,196,460 |
Options contracts (average notional value) | | | | | | 1,861,976 | | | | | | 710,397 |
CDS contracts (average notional value)* | | | EUR | | | — | | | EUR | | | 158,730 |
| | | USD | | | 2,165,635 | | | USD | | | 1,140,079 |
| | | | | | Short Derivative Volume |
| | | | | | Delaware Corporate Bond Fund | | | | | Delaware Extended Duration Bond Fund |
Futures contracts (average notional value) | | | USD | | | 31,367,745 | | | USD | | | 316,515 |
Options contracts (average notional value) | | | | | | 355,984 | | | | | | 34,210 |
*Long represents buying protection and short represents selling protection.
9. Offsetting
In December 2011, the Financial Accounting Standards Board (FASB) issued guidance that expanded disclosure requirements on the offsetting of certain assets and liabilities. The disclosures are required for investments and derivative financial instruments subject to master netting or similar agreements which
76
are eligible for offset on the “Statements of assets and liabilities” and require an entity to disclose both gross and net information about such investments and transactions in the financial statements. In January 2013, the FASB issued guidance that clarified which investments and transactions are subject to the offsetting disclosure requirements. The scope of the disclosure requirements for offsetting is limited to derivative instruments, repurchase agreements and reverse repurchase agreements, and securities borrowing. The guidance is effective for financial statements with fiscal years beginning on or after Jan. 1, 2013, and interim periods within those fiscal years.
In order to better define its contractual rights and to secure rights that will help each Fund mitigate its counterparty risk, each Fund entered into an International Swaps and Derivatives Association, Inc. Master Agreement (ISDA Master Agreement) or a similar agreement with certain of its derivative contract counterparties. An ISDA Master Agreement is a bilateral agreement between the Funds and a counterparty that governs certain over-the-counter (OTC) derivatives and foreign exchange contracts and typically contains, among other things, collateral posting items and netting provisions in the event of a default and/or termination event. Under an ISDA Master Agreement, each Fund may, under certain circumstances, offset with the counterparty certain derivative financial instruments’ payables and/or receivables with collateral held and/or posted and create one single net payment. The provisions of the ISDA Master Agreement typically permit a single net payment in the event of default (close-out), including the bankruptcy or insolvency of the counterparty. However, bankruptcy or insolvency laws of a particular jurisdiction may impose restrictions on or prohibitions against the right of offset in bankruptcy, insolvency or other events.
For financial reporting purposes, each Fund does not offset derivative assets and derivative liabilities that are subject to netting arrangements on the “Statements of assets and liabilities.”
At July 31, 2015, the Funds had the following assets and liabilities subject to offsetting provisions:
Master Repurchase Agreements
| | | | | | | | | | | | | | | | | | | | |
| | | Delaware Extended Duration Bond Fund |
Counterparty | | Repurchase Agreements | |
Fair Value of
Non-Cash
Collateral Received | | Cash Collateral Received | | Net Amount(a) |
Bank of America Merrill Lynch | | | $ | 4,796,690 | | | | $ | (4,796,690 | ) | | | $ | — | | | | $ | — | |
Bank of Montreal | | | | 7,994,483 | | | | | (7,994,483 | ) | | | | — | | | | | — | |
BNP Paribas | | | | 18,475,827 | | | | | (18,475,827 | ) | | | | — | | | | | — | |
| | | | | | | | | | | | | | | | | | | | |
Total | | | $ | 31,267,000 | | | | $ | (31,267,000 | ) | | | $ | — | | | | $ | — | |
| | | | | | | | | | | | | | | | | | | | |
(a)Net amount represents the receivable/(payable) that would be due from/(to) the counterparty in the event of default.
10. Securities Lending
Each Fund, along with other funds in the Delaware Investments® Family of Funds, may lend its securities pursuant to a security lending agreement (Lending Agreement) with The Bank of New York Mellon (BNY Mellon). At the time a security is loaned, the borrower must post collateral equal to the required percentage of the market value of the loaned security, including any accrued interest. The required percentage is: (1) 102% with respect to U.S. securities and foreign securities that are denominated and
77
Notes to financial statements
Delaware Corporate Bond Fund and Delaware Extended Duration Bond Fund
10. Securities Lending (continued)
payable in U.S. dollars; and (2) 105% with respect to foreign securities. With respect to each loan, if on any business day the aggregate market value of securities collateral plus cash collateral held is less than the aggregate market value of the securities which are the subject of such loan, the borrower will be notified to provide additional collateral by the end of the following business day which, together with the collateral already held, will be not less than the applicable initial collateral requirements for such security loan. If the aggregate market value of securities collateral and cash collateral held with respect to a security loan exceeds the applicable initial collateral requirement, upon the request of the borrower, BNY Mellon must return enough collateral to the borrower by the end of the following business day to reduce the value of the remaining collateral to the applicable initial collateral requirement for such security loan. As a result of the foregoing, the value of the collateral held with respect to a loaned security on any particular day may be more or less than the value of the security on loan.
Cash collateral received is generally invested in the Delaware Investments Collateral Fund No. 1 (Collective Trust) established by BNY Mellon for the purpose of investment on behalf of funds managed by DMC that participate in BNY Mellon’s securities lending program. The Collective Trust may invest in U.S. government securities and high-quality corporate debt, asset-backed and other money market securities, and in repurchase agreements collateralized by such securities, provided that the Collective Trust will generally have a dollar-weighted average portfolio maturity of 60 days or less. The Funds can also accept U.S. government securities and letters of credit (non-cash collateral) in connection with securities loans. In the event of default or bankruptcy by the lending agent, realization and/or retention of the collateral may be subject to legal proceedings. In the event the borrower fails to return loaned securities and the collateral received is insufficient to cover the value of the loaned securities and provided such collateral shortfall is not the result of investment losses, the lending agent has agreed to pay the amount of the shortfall to the Funds or, at the discretion of the lending agent, replace the loaned securities. The Funds continue to record dividends or interest, as applicable, on the securities loaned and are subject to changes in value of the securities loaned that may occur during the term of the loan. The Funds have the right under the Lending Agreement to recover the securities from the borrower on demand. With respect to security loans collateralized by non-cash collateral, the Funds receive loan premiums paid by the borrower. With respect to security loans collateralized by cash collateral, the earnings from the collateral investments are shared among the Funds, the security lending agent, and the borrower. The Funds record security lending income net of allocations to the security lending agent and the borrower.
The Collective Trust used for the investment of cash collateral received from borrowers of securities seeks to maintain a net asset value per unit of $1.00, but there can be no assurance that it will always be able to do so. The Funds may incur investment losses as a result of investing securities lending collateral in the Collective Trust. This could occur if an investment in the Collective Trust defaulted or if it were necessary to liquidate assets in the collateral investment pool to meet returns on outstanding security loans at a time when the Collective Trust’s net asset value per unit was less than $1.00. Under those circumstances, the Funds may not receive an amount from the collateral investment pool that is equal in amount to the collateral the Funds would be required to return to the borrower of the securities and the Funds would be required to make up for this shortfall.
During the year ended July 31, 2015, the Funds had no securities on loan.
78
11. Credit and Market Risk
Some countries in which the Funds may invest require governmental approval for the repatriation of investment income, capital, or the proceeds of sales of securities by foreign investors. In addition, if there is deterioration in a country’s balance of payments or for other reasons, a country may impose temporary restrictions on foreign capital remittances abroad.
The securities exchanges of certain foreign markets are substantially smaller, less liquid, and more volatile than the major securities markets in the United States. Consequently, acquisition and disposition of securities by the Funds may be inhibited. In addition, a significant portion of the aggregate market value of securities listed on the major securities exchanges in emerging markets is held by a smaller number of investors. This may limit the number of shares available for acquisition or disposition by the Funds.
Each Fund invests in high yield fixed income securities, which are securities rated lower than BBB- by S&P and lower than Baa3 by Moody’s, or similarly rated by another nationally recognized statistical rating organization. Investments in these higher yielding securities are generally accompanied by a greater degree of credit risk than higher rated securities. Additionally, lower rated securities may be more susceptible to adverse economic and competitive industry conditions than investment grade securities.
Each Fund invests in bank loans and other securities that may subject it to direct indebtedness risk, the risk that the Funds will not receive payment of principal, interest, and other amounts due in connection with these investments and will depend primarily on the financial condition of the borrower. Loans that are fully secured offer the Funds more protection than unsecured loans in the event of nonpayment of scheduled interest or principal, although there is no assurance that the liquidation of collateral from a secured loan would satisfy the corporate borrower’s obligation, or that the collateral can be liquidated. Some loans or claims may be in default at the time of purchase. Certain of the loans and the other direct indebtedness acquired by the Funds may involve revolving credit facilities or other standby financing commitments that obligate the Funds to pay additional cash on a certain date or on demand. These commitments may require each Fund to increase its investment in a company at a time when the Funds might not otherwise decide to do so (including at a time when the company’s financial condition makes it unlikely that such amounts will be repaid). To the extent that each Fund is committed to advance additional funds, it will at all times hold and maintain cash or other high grade debt obligations in an amount sufficient to meet such commitments. As the Funds may be required to rely upon another lending institution to collect and pass on to the Funds amounts payable with respect to the loan and to enforce the Funds’ rights under the loan and other direct indebtedness, an insolvency, bankruptcy, or reorganization of the lending institution may delay or prevent the Funds from receiving such amounts. The highly leveraged nature of many loans may make them especially vulnerable to adverse changes in economic or market conditions. Investments in such loans and other direct indebtedness may involve additional risk to the Funds.
Each Fund may invest in fixed income securities whose value is derived from an underlying pool of mortgages or consumer loans. The value of these securities is sensitive to changes in economic conditions, including delinquencies and/or defaults, and may be adversely affected by shifts in the market’s perception of the issuers and changes in interest rates. Investors receive principal and interest payments as the underlying mortgages and consumer loans are paid back. Some of these securities are
79
Notes to financial statements
Delaware Corporate Bond Fund and Delaware Extended Duration Bond Fund
11. Credit and Market Risk (continued)
collateralized mortgage obligations (CMOs). CMOs are debt securities issued by U.S. government agencies or by financial institutions and other mortgage lenders, which are collateralized by a pool of mortgages held under an indenture. Prepayment of mortgages may shorten the stated maturity of the obligations and can result in a loss of premium, if any has been paid. Certain of these securities may be stripped (securities which provide only the principal or interest feature of the underlying security). The yield to maturity on an interest-only CMO is extremely sensitive not only to changes in prevailing interest rates, but also to the rate of principal payments (including prepayments) on the related underlying mortgage assets. A rapid rate of principal payments may have a material adverse effect on the Funds’ yield to maturity. If the underlying mortgage assets experience greater than anticipated prepayments of principal, the Funds may fail to fully recoup their initial investment in these securities even if the securities are rated in the highest rating categories.
Each Fund invests in certain obligations that may have liquidity protection designed to ensure that the receipt of payments due on the underlying security is timely. Such protection may be provided through guarantees, insurance policies, or letters of credit obtained by the issuer or sponsor through third parties, through various means of structuring the transaction, or through a combination of such approaches. The Funds will not pay any additional fees for such credit support, although the existence of credit support may increase the price of a security.
Each Fund may invest up to 15% of its net assets in illiquid securities, which may include securities with contractual restrictions on resale, securities exempt from registration under Rule 144A promulgated under the Securities Act of 1933, as amended, and other securities which may not be readily marketable. The relative illiquidity of these securities may impair each Fund from disposing of them in a timely manner and at a fair price when it is necessary or desirable to do so. While maintaining oversight, the Funds’ Board has delegated to DMC, the day-to-day functions of determining whether individual securities are liquid for purposes of the Funds’ limitation on investments in illiquid securities. Securities eligible for resale pursuant to Rule 144A, which are determined to be liquid, are not subject to the Funds’ 15% limit on investments in illiquid securities. As of July 31, 2015, no securities held by the Funds have been determined to be illiquid under the Funds’ Liquidity Procedures. Rule 144A securities have been identified on the “Schedules of investments.”
12. Contractual Obligations
Each Fund enters into contracts in the normal course of business that contain a variety of indemnifications. The Funds’ maximum exposure under these arrangements is unknown. However, each Fund has not had prior claims or losses pursuant to these contracts. Management has reviewed the Funds’ existing contracts and expects the risk of loss to be remote.
13. Recent Accounting Pronouncements
In June 2014, the FASB issued guidance to improve the financial reporting of reverse repurchase agreements and other similar transactions. The guidance includes expanded disclosure requirements for entities that enter into reverse repurchase agreements and similar transactions accounted for as secured borrowings. The guidance is effective for financial statements with fiscal years beginning on or after
80
Dec. 15, 2014 and interim periods within those fiscal years. Management has determined that this pronouncement has no impact to each Fund’s financial statements.
In May 2015, the FASB issued Accounting Standards Update (“ASU”) No. 2015-07 regarding “Disclosures for Investments in Certain Entities That Calculate Net Asset Value per Share”. The amendments in this update are effective for the Funds for fiscal years beginning after Dec. 15, 2015, and interim periods within those fiscal years. ASU No. 2015-07 will eliminate the requirement to categorize investments in the fair value hierarchy if their fair value is measured at net asset value (“NAV”) per share (or its equivalent) using the practical expedient in the FASB’s fair value measurement guidance. At this time, management is evaluating the implications of ASU No. 2015-07 and its impact on the financial statement disclosures has not yet been determined.
14. General Motors Corporation Term Loan Litigation
Delaware Corporate Bond Fund and Delaware Extended Duration Bond Fund received notice of a litigation proceeding related to a General Motors Corporation (G.M.) term loan participation previously held by the Funds in 2009. We believe the matter subject to the litigation notice will likely lead to a recovery from the Funds of certain amounts received by the Funds because a U.S. Court of Appeals has ruled that the Funds and similarly situated investors were unsecured creditors rather than secured lender of G.M. as a result of an erroneous UCC filing made by a third party. The Funds received the full principal on the loans in 2009 after the G.M. bankruptcy. However, based upon the court ruling the estate is seeking to recover such amounts arguing that, as unsecured creditors, the Funds should not have received payment in full. Based upon currently available information related to the litigation and the Funds’ potential exposure, the Funds booked a net liability that resulted in a decrease in the Funds’ net asset value to reflect this likely recovery as follows:
| | | | |
| | | Delaware Corporate Bond Fund | | Delaware Extended Duration Bond Fund |
| | $1,022,669 | | $387,909 |
15. Subsequent Events
Management has determined that no material events or transactions occurred subsequent to July 31, 2015 that would require recognition or disclosure in the Funds’ financial statements.
81
Report of independent registered
public accounting firm
To the Board of Trustees of Delaware Group® Income Funds
and the Shareholders of Delaware Corporate Bond Fund and Delaware Extended Duration Bond Fund:
In our opinion, the accompanying statements of assets and liabilities, including the schedules of investments, and the related statements of operations and of changes in net assets and the financial highlights present fairly, in all material respects, the financial position of Delaware Corporate Bond Fund and Delaware Extended Duration Bond Fund (two of the series constituting Delaware Group® Income Funds, hereinafter referred to as the “Funds”) at July 31, 2015, the results of each of their operations for the year then ended, the changes in each of their net assets for each of the two years in the period then ended and the financial highlights for each of the five years in the period then ended, in conformity with accounting principles generally accepted in the United States of America. These financial statements and financial highlights (hereafter referred to as “financial statements”) are the responsibility of the Funds’ management. Our responsibility is to express an opinion on these financial statements based on our audits. We conducted our audits of these financial statements in accordance with the standards of the Public Company Accounting Oversight Board (United States). Those standards require that we plan and perform the audit to obtain reasonable assurance about whether the financial statements are free of material misstatement. An audit includes examining, on a test basis, evidence supporting the amounts and disclosures in the financial statements, assessing the accounting principles used and significant estimates made by management, and evaluating the overall financial statement presentation. We believe that our audits, which included confirmation of securities at July 31, 2015 by correspondence with the custodian and brokers and the application of alternative auditing procedures where confirmations of securities purchased had not been received, provide a reasonable basis for our opinion.
PricewaterhouseCoopers LLP
Philadelphia, Pennsylvania
September 22, 2015
82
Other Fund information (Unaudited)
Delaware Corporate Bond Fund and Delaware Extended Duration Bond Fund
Tax Information
The information set forth below is for each Fund’s fiscal year as required by federal income tax laws. Shareholders, however, must report distributions on a calendar year basis for income tax purposes, which may include distributions for portions of two fiscal years of the Funds. Accordingly, the information needed by shareholders for income tax purposes will be sent to them in January of each year. Please consult your tax advisor for proper treatment of this information.
All disclosures are based on financial information available as of the date of this annual report and, accordingly are subject to change. For any and all items requiring reporting, it is the intention of the Funds to report the maximum amount permitted under the Internal Revenue Code and the regulations thereunder.
For the fiscal year ended July 31, 2015, each Fund reports distributions paid during the year as follows:
| | | | | | | | | | | | | | | | |
| | | (A)
Long-Term
Capital Gains
Distributions
(Tax Basis) | | | (B)
Ordinary Income
Distributions*
(Tax Basis) | | | Total
Distributions
(Tax Basis) | | | (C)
Qualifying
Dividends1 | |
Delaware Corporate Bond Fund | | | 17.11% | | | | 82.89% | | | | 100.00% | | | | 3.88% | |
Delaware Extended Duration Bond Fund | | | 45.87% | | | | 54.13% | | | | 100.00% | | | | 3.65% | |
(A) and (B) are based on a percentage of each Fund’s total distributions.
(C) is based on a percentage of each Fund’s ordinary income distributions
1 Qualifying dividends represent dividends which qualify for the corporate dividends received deduction.
*For the fiscal year ended July 31, 2015, certain dividends paid by the Funds may be subject to a maximum tax rate of 20%. The percentage of dividends paid by the Funds from ordinary income reported as qualified income are reported in the following table. Complete information will be computed and reported in conjunction with your 2015 Form 1099-DIV.
| | | | | | | | |
| | | Delaware
Corporate
Bond Fund | | | Delaware
Extended Duration
Bond Fund | |
| | | 3.90% | | | | 3.65% | |
For the fiscal year ended July 31, 2015, certain interest income paid by Delaware Corporate Bond Fund, determined to be Qualified Interest Income may be subject to relief from U.S. withholding for foreign shareholders, as provided by the American Jobs Creation Act of 2004, and by the Tax Relief Unemployment Insurance Reauthorization and Job Creations Act of 2010, and as extended by the American Taxpayer Relief Act of 2012. Delaware Extended Duration Bond Fund did not have any foreign shareholders for the fiscal year ended July 31, 2015. For the fiscal year ended July 31, 2015, Delaware Corporate Bond Fund has reported maximum distributions of Qualified Interest Income as follows:
| | | | |
Qualified Interest Income | | | $48,225,246 | |
83
Other Fund information (Unaudited)
Delaware Corporate Bond Fund and Delaware Extended Duration Bond Fund
Proxy Results
At Joint Special Meetings of Shareholders of Delaware Group® Income Funds (the “Trust”), on behalf of Delaware Corporate Bond Fund, Delaware Diversified Floating Rate Fund, Delaware Extended Duration Bond Fund, and Delaware High-Yield Opportunities Fund (each, a “Fund” and together, the “Funds”), held on March 31, 2015 and reconvened on April 21, 2015 for the proposal listed in item (ii) below for Delaware High-Yield Opportunities Fund, and reconvened on April 21, 2015 and May 12, 2015 for the proposal listed in item (iii) below for Delaware Extended Duration Bond Fund, the shareholders of the Trust/the Funds voted to: (i) elect a Board of Trustees for the Trust; (ii) approve the implementation of a new “manager of managers” order for Delaware Corporate Bond Fund, Delaware Diversified Floating Rate Fund, and Delaware High-Yield Opportunities Fund; (iii) revise the fundamental investment restriction relating to lending for Delaware Corporate Bond Fund, Delaware Diversified Floating Rate Fund, Delaware Extended Duration Bond Fund, and Delaware High-Yield Opportunities Fund; and (iv)(a) revise provisions of the Trust’s Agreement and Declaration of Trust related to documenting the transfer of shares, (iv)(b) revise provisions of the Trust’s Agreement and Declaration of Trust related to shareholder disclosure of certain information upon board demand, and (iv)(c) revise provisions of the Trust’s By-Laws so that Delaware law will apply to matters related to proxies. At the meeting, the following people were elected to serve as Independent Trustees: Thomas L. Bennett, Ann D. Borowiec, Joseph W. Chow, John A. Fry, Lucinda S. Landreth, Frances A. Sevilla-Sacasa, Thomas K. Whitford, Janet L. Yeomans, and J. Richard Zecher. In addition, Patrick P. Coyne was elected to serve as an Interested Trustee.
The Joint Special Meeting of Shareholders of the Trust was adjourned to April 21, 2015, May 12, 2015, and June 2, 2015 for the proposal to approve the implementation of a new “manager of managers” order for Delaware Extended Duration Bond Fund.
84
The following proposals were submitted for a vote of the shareholders:
1. To elect a Board of Trustees for the Trust.
A quorum of shares outstanding of the Funds of the Trust was present, and the votes passed with a plurality of these Shares.
| | | | | | | | | | | | | | | | | | | | | | | | | | | | | | |
| | | Shares Voted For | | | | | % of Outstanding Shares | | | | | % of Shares Voted | | | | | Shares Withheld | | | | | % of Outstanding Shares | | | % of Shares Voted |
Thomas L. Bennett | | | 274,460,131.048 | | | | | | 53.099% | | | | | | 97.837% | | | | | | 6,068,304.574 | | | | | | 1.174% | | | 2.163% |
Ann D. Borowiec | | | 274,247,892.505 | | | | | | 53.058% | | | | | | 97.761% | | | | | | 6,280,543.117 | | | | | | 1.215% | | | 2.239% |
Joseph W. Chow | | | 274,247,112.243 | | | | | | 53.058% | | | | | | 97.761% | | | | | | 6,281,323.379 | | | | | | 1.215% | | | 2.239% |
Patrick P. Coyne | | | 272,995,227.301 | | | | | | 52.816% | | | | | | 97.315% | | | | | | 7,533,208.321 | | | | | | 1.457% | | | 2.685% |
John A. Fry | | | 274,327,557.829 | | | | | | 53.073% | | | | | | 97.790% | | | | | | 6,200,877.793 | | | | | | 1.200% | | | 2.210% |
Lucinda S. Landreth | | | 274,116,526.233 | | | | | | 53.033% | | | | | | 97.714% | | | | | | 6,411,909.389 | | | | | | 1.240% | | | 2.286% |
Frances A. Sevilla-Sacasa | | | 273,738,907.874 | | | | | | 52.960% | | | | | | 97.580% | | | | | | 6,789,527.748 | | | | | | 1.314% | | | 2.420% |
Thomas K. Whitford | | | 274,402,849.822 | | | | | | 53.088% | | | | | | 97.816% | | | | | | 6,125,585.800 | | | | | | 1.185% | | | 2.184% |
Janet L. Yeomans | | | 274,359,928.558 | | | | | | 53.080% | | | | | | 97.801% | | | | | | 6,168,507.064 | | | | | | 1.193% | | | 2.199% |
J. Richard Zecher | | | 274,345,100.732 | | | | | | 53.077% | | | | | | 97.796% | | | | | | 6,183,334.890 | | | | | | 1.196% | | | 2.204% |
2. To approve the implementation of a new “manager of managers” order.
A quorum of the shares outstanding of the Funds was present, and the votes passed with the required majority of those shares. The results were as follows:
Delaware Corporate Bond Fund
| | | | |
Shares voted for | | | 88,628,645.674 | |
Percentage of outstanding shares | | | 40.420 | % |
Percentage of shares voted | | | 72.039 | % |
Shares voted against | | | 4,729,194.614 | |
Percentage of outstanding shares | | | 2.157 | % |
Percentage of shares voted | | | 3.844 | % |
Shares abstained | | | 2,484,679.320 | |
Percentage of outstanding shares | | | 1.133 | % |
Percentage of shares voted | | | 2.020 | % |
Broker non-votes | | | 27,185,576.000 | |
85
Other Fund information (Unaudited)
Delaware Corporate Bond Fund and Delaware Extended Duration Bond Fund
Proxy Results (continued)
Delaware Diversified Floating Rate Fund
| | | | |
Shares voted for | | | 24,623,335.308 | |
Percentage of outstanding shares | | | 46.422 | % |
Percentage of shares voted | | | 79.387 | % |
Shares voted against | | | 224,821.879 | |
Percentage of outstanding shares | | | 0.424 | % |
Percentage of shares voted | | | 0.725 | % |
Shares abstained | | | 466,098.925 | |
Percentage of outstanding shares | | | 0.879 | % |
Percentage of shares voted | | | 1.503 | % |
Broker non-votes | | | 5,702,757.000 | |
Delaware High-Yield Opportunities Fund
| | | | |
Shares voted for | | | 50,956,520.380 | |
Percentage of outstanding shares | | | 35.757 | % |
Percentage of shares voted | | | 68.269 | % |
Shares voted against | | | 2,497,438.049 | |
Percentage of outstanding shares | | | 1.753 | % |
Percentage of shares voted | | | 3.346 | % |
Shares abstained | | | 3,797,377.889 | |
Percentage of outstanding shares | | | 2.665 | % |
Percentage of shares voted | | | 5.088 | % |
Broker non-votes | | | 17,389,855.901 | |
3. To revise the fundamental investment restriction relating to lending.
A quorum of the shares outstanding of the Funds was present, and the votes passed with the required majority of those shares. The results were as follows:
Delaware Corporate Bond Fund
| | | | |
Shares voted for | | | 88,724,849.272 | |
Percentage of outstanding shares | | | 40.464 | % |
Percentage of shares voted | | | 72.118 | % |
Shares voted against | | | 4,667,992.388 | |
Percentage of outstanding shares | | | 2.129 | % |
Percentage of shares voted | | | 3.794 | % |
Shares abstained | | | 2,449,680.948 | |
Percentage of outstanding shares | | | 1.117 | % |
Percentage of shares voted | | | 1.991 | % |
Broker non-votes | | | 27,185,573.000 | |
86
Delaware Diversified Floating Rate Fund
| | | | |
Shares voted for | | | 24,748,194.728 | |
Percentage of outstanding shares | | | 46.657 | % |
Percentage of shares voted | | | 79.789 | % |
Shares voted against | | | 264,012.275 | |
Percentage of outstanding shares | | | 0.498 | % |
Percentage of shares voted | | | 0.851 | % |
Shares abstained | | | 302,053.109 | |
Percentage of outstanding shares | | | 0.569 | % |
Percentage of shares voted | | | 0.974 | % |
Broker non-votes | | | 5,702,753.000 | |
Delaware Extended Duration Bond Fund
| | | | |
Shares voted for | | | 40,920,152.966 | |
Percentage of outstanding shares | | | 40.093 | % |
Percentage of shares voted | | | 67.973 | % |
Shares voted against | | | 2,038,429.194 | |
Percentage of outstanding shares | | | 1.997 | % |
Percentage of shares voted | | | 3.386 | % |
Shares abstained | | | 1,101,353.914 | |
Percentage of outstanding shares | | | 1.079 | % |
Percentage of shares voted | | | 1.829 | % |
Broker non-votes | | | 16,140,524.001 | |
Delaware High-Yield Opportunities Fund
| | | | |
Shares voted for | | | 48,900,669.110 | |
Percentage of outstanding shares | | | 34.315 | % |
Percentage of shares voted | | | 68.138 | % |
Shares voted against | | | 2,606,390.535 | |
Percentage of outstanding shares | | | 1.829 | % |
Percentage of shares voted | | | 3.632 | % |
Shares abstained | | | 2,208,123.883 | |
Percentage of outstanding shares | | | 1.549 | % |
Percentage of shares voted | | | 3.077 | % |
Broker non-votes | | | 18,051,986.101 | |
87
Other Fund information (Unaudited)
Delaware Corporate Bond Fund and Delaware Extended Duration Bond Fund
Proxy Results (continued)
4. (a) To revise provisions of the Trust’s Agreement and Declaration of Trust related to documenting the transfer of shares.
A quorum of the shares outstanding of the Trust was present, and the votes passed with a majority of those shares. The results were as follows:
Delaware Group® Income Funds
| | | | |
Shares voted for | | | 187,369,259.353 | |
Percentage of outstanding shares | | | 36.250 | % |
Percentage of shares voted | | | 66.792 | % |
Shares voted against | | | 5,528,576.892 | |
Percentage of outstanding shares | | | 1.070 | % |
Percentage of shares voted | | | 1.971 | % |
Shares abstained | | | 18,529,078.175 | |
Percentage of outstanding shares | | | 3.585 | % |
Percentage of shares voted | | | 6.605 | % |
Broker non-votes | | | 69,101,521.202 | |
4. (b) To revise provisions of the Trust’s Agreement and Declaration of Trust related to shareholder disclosure of certain information upon board demand.
A quorum of the shares outstanding of the Trust was present, and the votes passed with a majority of those shares. The results were as follows:
Delaware Group Income Funds
| | | | |
Shares voted for | | | 186,061,931.359 | |
Percentage of outstanding shares | | | 35.997 | % |
Percentage of shares voted | | | 66.326 | % |
Shares voted against | | | 6,171,713.659 | |
Percentage of outstanding shares | | | 1.194 | % |
Percentage of shares voted | | | 2.200 | % |
Shares abstained | | | 19,193,253.402 | |
Percentage of outstanding shares | | | 3.713 | % |
Percentage of shares voted | | | 6.842 | % |
Broker non-votes | | | 69,101,537.202 | |
88
4. (c) To revise provisions of the Trust’s By-Laws so that Delaware law will apply to matters related to proxies.
A quorum of the shares outstanding of the Trust was present, and the votes passed with a majority of those shares. The results were as follows:
Delaware Group® Income Funds
| | | | |
Shares voted for | | | 187,367,907.591 | |
Percentage of outstanding shares | | | 36.250 | % |
Percentage of shares voted | | | 66.791 | % |
Shares voted against | | | 5,940,616.912 | |
Percentage of outstanding shares | | | 1.149 | % |
Percentage of shares voted | | | 2.118 | % |
Shares abstained | | | 18,118,395.917 | |
Percentage of outstanding shares | | | 3.505 | % |
Percentage of shares voted | | | 6.459 | % |
Broker non-votes | | | 69,101,515.202 | |
89
Board of trustees / directors and officers addendum
Delaware Investments® Family of Funds
A mutual fund is governed by a Board of Trustees/Directors (“Trustees”), which has oversight responsibility for the management of a fund’s business affairs. Trustees establish procedures and oversee and review the performance of the investment manager, the distributor, and others who perform services for the fund. The independent fund trustees, in particular, are advocates
| | | | |
Name, Address, and Birth Date | | Position(s) Held with Fund(s) | | Length of Time Served |
Interested Trustee | | | | |
Shawn K. Lytle1 | | President, | | Trustee since |
2005 Market Street | | Chief Executive Officer, | | September 1, 2015 |
Philadelphia, PA 19103 | | and Trustee | | |
February 1970 | | | | President and |
| | | | Chief Executive Officer |
| | | | since August 20, 2015 |
| | | | |
| | | | |
Independent Trustees | | | | |
Thomas L. Bennett | | Chairman and Trustee | | Trustee since |
2005 Market Street | | | | March 2005 |
Philadelphia, PA 19103 | | | | |
October 1947 | | | | Chairman since |
| | | | | March 1, 2015 |
Ann D. Borowiec | | Trustee | | Since March 31, 2015 |
2005 Market Street | | | | |
Philadelphia, PA 19103 | | | | |
November 1958 | | | | |
| | | | |
| | | | |
| | | | |
| | | | | |
Joseph W. Chow | | Trustee | | Since January 2013 |
2005 Market Street | | | | |
Philadelphia, PA 19103 | | | | |
January 1953 | | | | |
| | | | |
| | | | | |
| 1 | Shawn K. Lytle is considered to be an “Interested Trustee” because he is an executive officer of the Fund’s(s’) investment advisor. |
90
for shareholder interests. Each trustee has served in that capacity since he or she was elected to or appointed to the Board of Trustees, and will continue to serve until his or her retirement or the election of a new trustee in his or her place. The following is a list of the Trustees and Officers with certain background and related information.
| | | | |
Principal Occupation(s) During the Past Five Years | | Number of Portfolios in Fund Complex Overseen by Trustee or Officer | | Other Directorships Held by Trustee or Officer |
| | |
| | | | |
Shawn K. Lytle has served as | | 64 | | Trustee — UBS |
President of | | | | Relationship Funds, |
Delaware Investments2 | | | | SMA Relationship |
since June 2015 and was the | | | | Trust, and UBS Funds |
Regional Head of Americas for | | | | (May 2010-April 2015) |
UBS Global Asset | | | | |
Management from | | | | |
2010 through 2015. | | | | |
| | |
| | | | |
Private Investor | | 64 | | Director — |
(March 2004-Present) | | | | Bryn Mawr Bank Corp. (BMTC) |
| | | | (2007-2011) |
| | | | |
| | | | |
| | | | | |
Chief Executive Officer | | 64 | | None |
Private Wealth Management | | | | |
(2011-2013) and | | | | |
Market Manager, | | | | |
New Jersey Private | | | | |
Bank (2005-2011) – | | | | |
J.P. Morgan Chase & Co. | | | | |
Executive Vice President | | 64 | | Director and Audit Committee |
(Emerging Economies | | | | Member — Hercules |
Strategies, Risks, and | | | | Technology Growth |
Corporate Administration) | | | | Capital, Inc. |
State Street Corporation | | | | (2004-2014) |
(July 2004-March 2011) | | | | |
| 2 | Delaware Investments is the marketing name for Delaware Management Holdings, Inc. and its subsidiaries, including the Fund’s(s’) investment advisor, principal underwriter, and its transfer agent. |
91
Board of trustees / directors and officers addendum
Delaware Investments® Family of Funds
| | | | |
Name, Address, and Birth Date | | Position(s) Held with Fund(s) | | Length of Time Served |
Independent Trustees (continued) |
John A. Fry | | Trustee | | Since January 2001 |
2005 Market Street | | | | |
Philadelphia, PA 19103 | | | | |
May 1960 | | | | |
| | | | |
| | | | |
| | | | |
| | | | |
| | | | |
| | | | |
| | | | | |
Lucinda S. Landreth | | Trustee | | Since March 2005 |
2005 Market Street | | | | |
Philadelphia, PA 19103 | | | | |
June 1947 | | | | |
| | | | | |
Frances A. Sevilla-Sacasa | | Trustee | | Since September 2011 |
2005 Market Street | | | | |
Philadelphia, PA 19103 | | | | |
January 1956 | | | | |
| | | | |
| | | | |
| | | | |
| | | | |
| | | | |
| | | | |
| | | | |
| | | | |
| | | | |
| | | | |
| | | | |
| | | | |
| | | | | |
92
| | | | |
Principal Occupation(s) During the Past Five Years | | Number of Portfolios in Fund Complex Overseen by Trustee or Officer | | Other Directorships
Held by Trustee or Officer |
| | |
| | | | |
President — | | 64 | | Director — Hershey Trust |
Drexel University | | | | Company |
(August 2010-Present) | | | | |
| | | | Director, Audit Committee, |
President — | | | | and Governance Committee |
Franklin & Marshall College | | | | Member — Community |
(July 2002-July 2010) | | | | Health Systems |
| | | | |
| | | | Director — Drexel |
| | | | Morgan & Co. |
| | | | | |
Private Investor | | 64 | | None |
(2004-Present) | | | | |
| | | | |
| | | | | |
Chief Executive Officer — | | 64 | | Trust Manager and |
Banco Itaú | | | | Audit Committee |
International | | | | Member — Camden |
(April 2012-Present) | | | | Property Trust |
| | | | |
Executive Advisor to Dean | | | | |
(August 2011-March 2012) and Interim Dean | | | | |
(January 2011-July 2011) — | | | | |
University of Miami School of | | | | |
Business Administration | | | | |
| | | | |
President — U.S. Trust, | | | | |
Bank of America Private | | | | |
Wealth Management | | | | |
(Private Banking) | | | | |
(July 2007-December 2008) | | | | |
| | | | | |
93
Board of trustees / directors and officers addendum
Delaware Investments® Family of Funds
| | | | |
Name, Address, and Birth Date | | Position(s) Held with Fund(s) | | Length of Time Served |
| |
Independent Trustees (continued) | | |
Thomas K. Whitford | | Trustee | | Since January 2013 |
2005 Market Street | | | | |
Philadelphia, PA 19103 | | | | |
March 1956 | | | | |
| | | | |
| | | | |
| | | | |
| | | | |
| | |
| | | | |
| | | | | |
Janet L. Yeomans | | Trustee | | Since April 1999 |
2005 Market Street | | | | |
Philadelphia, PA 19103 | | | | |
July 1948 | | | | |
| | | | |
| | | | |
| | | | |
| | | | |
| | | | |
| | |
| | | | |
| | | | | |
94
| | | | |
Principal Occupation(s) During the Past Five Years | | Number of Portfolios in Fund Complex Overseen by Trustee or Officer | | Other Directorships Held by Trustee or Officer |
| | |
| | | | |
Vice Chairman (2010-April 2013), Chief Administrative Officer (2008-2010), and Executive Vice President and Chief Administrative Officer (2007-2009) — PNC Financial Services Group | | 64 | | Director — HSBC Finance Corporation and HSBC North America Holdings Inc. Director — HSBC Bank |
Vice President and Treasurer (January 2006-July 2012) Vice President — Mergers & Acquisitions (January 2003-January 2006), and Vice President and Treasurer (July 1995-January 2003) 3M Corporation | | 64 | | Director, Audit and Compliance Committee Chair, Investment Committee Member, and Governance Committee Member — Okabena Company Chair — 3M Investment Management Company (2005-2012) |
95
Board of trustees / directors and officers addendum
Delaware Investments® Family of Funds
| | | | |
Name, Address, and Birth Date | | Position(s) Held with Fund(s) | | Length of Time Served |
| | |
Officers | | | | |
David F. Connor | | Senior Vice President, | | Senior Vice President |
2005 Market Street | | General Counsel, | | since May 2013; |
Philadelphia, PA 19103 | | and Secretary | | General Counsel |
December 1963 | | | | since May 2015; |
| | | | Secretary since |
| | | | October 2005 |
| | | | |
| | | | |
| | | | |
| | | | | |
Daniel V. Geatens | | Vice President | | Treasurer since October 2007 |
2005 Market Street | | and Treasurer | | |
Philadelphia, PA 19103 | | | | |
October 1972 | | | | |
| | | | |
| | | | |
| | | | |
| | | | | |
Richard Salus | | Senior Vice President | | Chief Financial Officer |
2005 Market Street | | and Chief Financial Officer | | since November 2006 |
Philadelphia, PA 19103 | | | | |
October 1963 | | | | |
| | | | | |
The Statement of Additional Information for the Fund(s) includes additional information about the Trustees and Officers and is available, without charge, upon request by calling 800 523-1918.
96
| | | | |
Principal Occupation(s) During the Past Five Years | | Number of Portfolios in Fund Complex Overseen by Trustee or Officer | | Other Directorships Held by Trustee or Officer |
| | |
| | | | |
David F. Connor has served as | | 64 | | None3 |
Senior Vice President of the Fund(s) and the investment advisor since 2013, General Counsel of the Fund(s) and the investment advisor since 2015, and Secretary of the Fund(s) and the investment advisor since 2005. | | | | |
Daniel V. Geatens has served | | 64 | | None3 |
as Vice President and | | | | |
Treasurer of the Fund(s) since 2007 and Vice President and Director of Financial | | | | |
Administration of the investment advisor since 2010. | | | | |
Richard Salus has served as | | 64 | | None3 |
Senior Vice President and Chief Financial Officer of the Fund(s) and the investment advisor since 2006. | | | | |
| 3 | David F. Connor, Daniel V. Geatens, and Richard Salus serve in similar capacities for the six portfolios of the Optimum Fund Trust, which have the same investment advisor, principal underwriter, and transfer agent as the registrant. |
97
About the organization
| | | | | | |
Board of trustees |
| Shawn K. Lytle | | Ann D. Borowiec | | John A. Fry | | Frances A. |
| President and | | Former Chief Executive | | President | | Sevilla-Sacasa |
| Chief Executive Officer | | Officer | | Drexel University | | Chief Executive Officer |
| Delaware Investments® | | Private Wealth Management | | Philadelphia, PA | | Banco Itaú |
Family of Funds Philadelphia, PA | | J.P. Morgan Chase & Co. New York, NY | | Lucinda S. Landreth Former Chief Investment | | International Miami, FL |
| Thomas L. Bennett | | Joseph W. Chow | | Officer | | Thomas K. Whitford |
| Chairman of the Board | | Former Executive Vice | | Assurant, Inc. | | Former Vice Chairman |
| Delaware Investments | | President | | New York, NY | | PNC Financial Services Group |
| Family of Funds | | State Street Corporation | | | | Pittsburgh, PA |
| Private Investor | | Brookline, MA | | | | |
| Rosemont, PA | | | | | | Janet L. Yeomans |
| | | | | | Former Vice President and |
| | | | | | Treasurer |
| | | | | | 3M Corporation |
| | | | | | St. Paul, MN |
Affiliated officers |
| David F. Connor | | Daniel V. Geatens | | Richard Salus | | |
| Senior Vice President, | | Vice President and | | Senior Vice President and | | |
| General Counsel, | | Treasurer | | Chief Financial Officer | | |
| and Secretary | | Delaware Investments | | Delaware Investments | | |
| Delaware Investments | | Family of Funds | | Family of Funds | | |
| Family of Funds | | Philadelphia, PA | | Philadelphia, PA | | |
| Philadelphia, PA | | | | | | |
This annual report is for the information of Delaware Corporate Bond Fund and Delaware Extended Duration Bond Fund shareholders, but it may be used with prospective investors when preceded or accompanied by the Delaware Investments Fund fact sheet for the most recently completed calendar quarter. These documents are available at delawareinvestments.com.
Delaware Investments is the marketing name of Delaware Management Holdings, Inc. and its subsidiaries.
Each Fund files its complete schedule of portfolio holdings with the Securities and Exchange Commission (SEC) for the first and third quarters of each fiscal year on Form N-Q. Each Fund’s Forms N-Q, as well as a description of the policies and procedures that the Funds use to determine how to vote proxies (if any) relating to portfolio securities are available without charge (i) upon request, by calling 800 523-1918; and (ii) on the SEC’s website at sec.gov. In addition, a description of the policies and procedures that the Funds use to determine how to vote proxies (if any) relating to portfolio securities and the Schedules of Investments included in the Funds’ most recent Forms N-Q are available without charge on the Funds’ website at delawareinvestments.com. Each Fund’s Forms N-Q may be reviewed and copied at the SEC’s Public Reference Room in Washington, D.C.; information on the operation of the Public Reference Room may be obtained by calling 800 SEC-0330.
Information (if any) regarding how the Funds voted proxies relating to portfolio securities during the most recently disclosed 12-month period ended June 30 is available without charge (i) through the Funds’ website at delawareinvestments.com; and (ii) on the SEC’s website at sec.gov.
98

Annual report
Fixed income mutual fund
Delaware High-Yield Opportunities Fund
July 31, 2015
Carefully consider the Fund’s investment objectives, risk factors, charges, and expenses before investing. This and other information can be found in the Fund’s prospectus and its summary prospectus, which may be obtained by visiting delawareinvestments.com or calling 800 523-1918. Investors should read the prospectus and the summary prospectus carefully before investing.
You can obtain shareholder reports and prospectuses online instead of in the mail.
Visit delawareinvestments.com/edelivery.
Experience Delaware Investments
Delaware Investments is committed to the pursuit of consistently superior asset management and unparalleled client service. We believe in our investment processes, which seek to deliver consistent results, and in convenient services that help add value for our clients.
If you are interested in learning more about creating an investment plan, contact your financial advisor.
You can learn more about Delaware Investments or obtain a prospectus for Delaware High-Yield Opportunities Fund at delawareinvestments.com.
Manage your investments online
| ● | | 24-hour access to your account information |
| ● | | Check your account balance and recent transactions |
| ● | | Request statements or literature |
| ● | | Make purchases and redemptions |
Delaware Management Holdings, Inc. and its subsidiaries (collectively known by the marketing name of Delaware Investments) are wholly owned subsidiaries of Macquarie Group Limited, a global provider of banking, financial, advisory, investment, and funds management services.
Neither Delaware Investments nor its affiliates noted in this document are authorized deposit-taking institutions for the purpose of the Banking Act 1959 (Commonwealth of Australia). The obligations of these entities do not represent deposits or other liabilities of Macquarie Bank Limited (MBL). MBL does not guarantee or otherwise provide assurance in respect of the obligations of these entities, unless noted otherwise.
Unless otherwise noted, views expressed herein are current as of July 31, 2015, and subject to change for events occurring after such date.
Funds are not FDIC insured and are not guaranteed. It is possible to lose the principal amount invested.
Mutual fund advisory services provided by Delaware Management Company, a series of Delaware Management Business Trust, which is a registered investment advisor. Delaware Investments, a member of Macquarie Group, refers to Delaware Management Holdings, Inc. and its subsidiaries, including the Fund’s distributor, Delaware Distributors, L.P. Macquarie Group refers to Macquarie Group Limited and its subsidiaries and affiliates worldwide.
© 2015 Delaware Management Holdings, Inc.
All third-party marks cited are the property of their respective owners.
Portfolio management review
| | |
| Delaware High-Yield Opportunities Fund | | August 11, 2015 |
| | | | | | | | |
| Performance preview (for the fiscal year ended July 31, 2015) | | | | | | |
Delaware High-Yield Opportunities Fund (Class A shares) | | | 1-year return | | | | –3.15% | |
BofA Merrill Lynch U.S. High Yield Constrained Index (benchmark) | | | 1-year return | | | | +0.17% | |
Past performance does not guarantee future results.
For complete, annualized performance for Delaware High-Yield Opportunities Fund, please see the table on page 4.
The performance of Class A shares excludes the applicable sales charge and reflects the reinvestment of all distributions.
For a description of the index, please see page 7.
Index performance returns do not reflect any management fees, transaction costs, or expenses. Indices are unmanaged and one cannot invest directly in an index.
High yield bonds generally treaded water during the Fund’s fiscal period despite stable benchmark interest rates, modest economic growth, and clear signs of recovery in the U.S. labor market. While those factors typically favor high yield securities, a 50% drop in oil prices during the Fund’s fiscal year triggered rising defaults and a subsequent selloff in the energy sector, which accounted for 16% of the $1.5 trillion high yield market as of mid-2014. The result was a sharply bifurcated asset class along mostly cyclical lines: Energy, metals and mining, and basic industry groups underperformed, while more stable, higher-quality sectors like cable, healthcare, and food and beverages beat the benchmark.
Throughout the period, the story in high yield revolved around energy. Though oil prices still hovered near $100 a barrel during the summer of 2014, an economic slowdown in China — combined with geopolitical instability in Europe and an unwillingness among the Organization of Petroleum Exporting Countries (OPEC) members to cut production — caused prices to drop to around $50 a barrel by December. At that level, many energy companies are unprofitable, and those with the highest amounts of leverage are most at risk. So, while defaults within all non-energy sectors of the high yield market were less than 1% during the first half of 2015, the default rate within the energy and metals and mining groups rose to 6.6% over the same period.
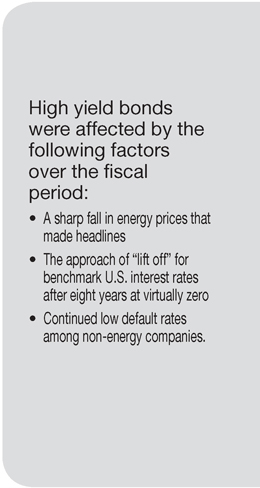
1
Portfolio management review
Delaware High-Yield Opportunities Fund
With the plunge in energy debt prices making for unnerving headlines — and dragging the Fund’s benchmark lower as well — selling pressure spiked in October and December 2014. This increased selling exposed liquidity shortfalls in the high yield market, as financial regulations (Dodd-Frank) have reduced the incentive for dealers to hold as much inventory of certain securities as they did previously. Though bargain hunters eventually stepped in to support bond prices, weakness reappeared late in the Fund’s fiscal year, as another Greece-related crisis in the euro zone compounded unresolved concerns over Chinese economic growth and overcapacity in the energy sector.
Fund performance
For the fiscal year ended July 31, 2015, Delaware High-Yield Opportunities Fund returned –3.15% (Class A shares at net asset value) and –7.58% at maximum offer price (both figures reflect all distributions reinvested). During the same period, the Fund’s benchmark, the BofA Merrill Lynch U.S. High Yield Constrained Index, returned +0.17%. For complete, annualized performance of Delaware High-Yield Opportunities Fund, please see the table on page 4.
As the fiscal year began, the Fund’s weighting in the energy sector was roughly in line with the benchmark. We reduced this within a few months to an underweight position. Still, the Fund’s three weakest-performing individual issues over the fiscal period were from the energy group. Though we sold the Fund’s entire position in the exploration and development company MidStates Petroleum, it nonetheless cost the Fund 0.44 percentage points of relative performance. When an attempted asset sale failed to close, MidStates Petroleum bonds reacted negatively and we exited given concerns about tighter liquidity.
Similarly, holdings in Key Energy Services cost the Fund 0.27 percentage points in return relative to the benchmark before we closed the position.
The company provides materials to energy service companies (drillers) but suffered a steep drop-off in demand as the prices of oil and natural gas plunged. Finally, the Fund’s position in the small exploration company SandRidge Energy underperformed the benchmark by 0.26 percentage points. The company’s business model requires oil prices above $75 a barrel. Any price under that amount stresses its balance sheet. Given prices that were below this price for all of this year, bond prices have dropped (SandRidge reported a $1.4 billion loss during the second quarter of 2015). As with MidStates Petroleum and Key Energy, we have exited the Fund’s position in SandRidge Energy.
On the positive side, the Fund’s holdings in the private packaging and container business BWAY contributed 0.10 percentage points of positive relative performance. Among other factors, investors were attracted to the bond’s 9.125% coupon (roughly two percentage points above the average for high yield bonds during the period) and the company’s lack of exposure to the ailing energy sector. The Fund continued to own BWAY debt as of the end of the fiscal period.
The Fund’s position in the 7% preferred stock of Ally Financial added 0.07 percentage points of relative outperformance over the period. The bank holding company is a spin-off from General Motors, where it was known as GMAC. Ally Financial called half of its 7% preferred during the Fund’s fiscal period and plans to call the rest later this year. One division, Ally Auto, serves 17,000 U.S. auto dealers and four million retail customers. Another division, Ally Bank, was named the “Best Online Bank” by Money magazine for each of the four years through 2014. Finally, the Fund’s position in Landry’s added 0.07 percentage points of relative return. Investors were attracted to Landry’s high coupon and terms, a 9.375% issue that is callable in September 2015. Notably, each outperformer has similar characteristics: above-average coupons, acceptable performance,
2
and operations outside the energy and metals and mining industries.
The Fund had minimal exposure to derivatives, briefly holding futures contracts and credit-default swaps in amounts equal to about 2% of the notional value of assets. Neither position had a material effect (that is, greater than 0.50 percentage points) on total portfolio performance, and there were no derivative positions outstanding as of the end of the Fund’s fiscal year.
Fund holdings reflect our view that the Federal Reserve may likely soon raise short-term interest rates off the zero-to-0.25% floor, where they have languished since the depths of the financial crisis in December 2008. Though high yield bonds generally are considered less interest-rate sensitive than other fixed-income market sectors, the group’s response to rate changes varies. For example, the lower-rated credit tiers often are the least vulnerable to rate hikes, if as now, the
rationale for tightening monetary policy is accelerating economic growth and not accelerating inflation.
Accordingly, we have overweighted CCC-rated credits, maintained a market weighting to BB-rated bonds, and underweighted the B-rated segment. With regard to industry groups, we ended the period with a significant underweight to the energy sector, given the murky (and largely unfavorable) outlook for oil and gas prices. In general, we also are overweight higher-coupon securities in sectors that we consider to be more stable and lower risk than the benchmark. As always, we maintain a broadly diversified approach to investing in the sector, with the average position size among the Fund’s approximately 200 holdings being just 0.50% of the portfolio at the end of the Fund’s fiscal year.
3
| | |
| Performance summary | | |
| Delaware High-Yield Opportunities Fund | | July 31, 2015 |
The performance data quoted represent past performance; past performance does not guarantee future results. Investment return and principal value will fluctuate so your shares, when redeemed, may be worth more or less than their original cost. Please obtain the performance data current for the most recent month end by calling 800 523-1918 or visiting our website at delawareinvestments.com/performance. Current performance may be lower or higher than the performance data quoted.
| | | | | | | | | | | | | | | |
| Fund and benchmark performance1,2 | | Average annual total returns through July 31, 2015 |
| | | |
| | | 1 year | | 5 years | | 10 years |
Class A (Est. Dec. 30, 1996) | | | | | | | | | | | | | | | |
Excluding sales charge | | | | –3.15 | % | | | | +7.10 | % | | | | +6.86 | % |
Including sales charge | | | | –7.58 | % | | | | +6.10 | % | | | | +6.35 | % |
Class C (Est. Feb. 17, 1998) | | | | | | | | | | | | | | | |
Excluding sales charge | | | | –3.85 | % | | | | +6.33 | % | | | | +6.13 | % |
Including sales charge | | | | –4.75 | % | | | | +6.33 | % | | | | +6.13 | % |
Class R (Est. June 2, 2003) | | | | | | | | | | | | | | | |
Excluding sales charge | | | | –3.13 | % | | | | +6.91 | % | | | | +6.66 | % |
Including sales charge | | | | –3.13 | % | | | | +6.91 | % | | | | +6.66 | % |
Institutional Class (Est. Dec. 30, 1996) | | | | | | | | | | | | | | | |
Excluding sales charge | | | | –2.91 | % | | | | +7.39 | % | | | | +7.16 | % |
Including sales charge | | | | –2.91 | % | | | | +7.39 | % | | | | +7.16 | % |
BofA Merrill Lynch U.S. High Yield Constrained Index | | | | +0.17 | % | | | | +7.52 | % | | | | +7.55 | % |
1 Returns reflect the reinvestment of all distributions and are presented both with and without the applicable sales charges described below. Returns do not reflect the deduction of taxes the shareholder would pay on Fund distributions or redemptions of Fund shares.
Expense limitations were in effect for certain classes during some or all of the periods shown in the “Fund and benchmark performance” table. Expenses for each class are listed on the “Fund expense ratios” table on page 6. Performance would have been lower had expense limitations not been in effect.
Class A shares are sold with a maximum front-end sales charge of 4.50%, and have an annual distribution and service fee of 0.25% of average daily net assets. The Board has adopted a formula for calculating 12b-1 plan fees for the Fund’s
Class A shares. The Fund’s Class A shares are currently subject to a blended 12b-1 fee equal to the sum of: (i) 0.10% of average daily net assets representing shares acquired prior to June 1, 1992, and (ii) 0.25% of average daily net assets representing shares acquired on or after June 1, 1992. All Class A shares currently bear 12b-1 fees at the same rate, the blended rate, currently 0.25% of average daily net assets, based on the formula described above. This method of calculating Class A 12b-1 fees may be discontinued at the sole discretion of the Board. Performance for Class A shares, excluding sales charges, assumes that no front-end sales charge applied.
Class C shares are sold with a contingent deferred sales charge of 1.00% if redeemed during the first 12 months. They are also subject to an annual
4
distribution and service fee of 1.00% of average daily net assets. Performance for Class C shares, excluding sales charges, assumes either that contingent deferred sales charges did not apply or that the investment was not redeemed.
Class R shares are available only for certain retirement plan products. They are sold without a sales charge and have an annual distribution and service fee of 0.50% of average daily net assets.
Institutional Class shares are available without sales or asset-based distribution charges only to certain eligible institutional accounts.
Fixed income securities and bond funds can lose value, and investors can lose principal, as interest rates rise. They also may be affected by economic conditions that hinder an issuer’s ability to make interest and principal payments on its debt.
The Fund may also be subject to prepayment risk, the risk that the principal of a fixed income security that is held by the Fund may be prepaid prior to maturity, potentially forcing the Fund to reinvest that money at a lower interest rate.
High yielding, noninvestment grade bonds (junk bonds) involve higher risk than investment grade bonds.
The high yield secondary market is particularly susceptible to liquidity problems when institutional investors, such as mutual funds and certain other financial institutions, temporarily stop buying bonds for regulatory, financial, or other reasons. In addition, a less liquid secondary market makes it more difficult for the Fund to obtain precise valuations of the high yield securities in its portfolio.
International investments entail risks not ordinarily associated with U.S. investments including fluctuation in currency values, differences in accounting principles, or economic or political instability in other nations.
Investing in emerging markets can be riskier than investing in established foreign markets due to increased volatility and lower trading volume.
Per Standard & Poor’s credit rating agency, bonds rated AA and A are more susceptible to the adverse effects of changes in circumstances and economic conditions than those in the higher-rated AAA category, but the obligor’s capacity to meet its financial commitment on the obligation is still strong. Bonds rated BBB exhibit adequate protection parameters, although adverse economic conditions or changing circumstances are more likely to lead to a weakened capacity of the obligor to meet its financial commitments. Bonds rated BB, B, and CCC are regarded as having significant speculative characteristics, with BB indicating the least degree of speculation of the three.
5
Performance summary
Delaware High-Yield Opportunities Fund
2 The Fund’s expense ratios, as described in the most recent prospectus, are disclosed in the following “Fund expense ratios” table. Delaware Management Company has agreed to reimburse certain expenses and/or waive certain fees in order to prevent total fund operating expenses (excluding any 12b-1 plan, taxes, interest, short sale and dividend interest expenses, brokerage fees, certain insurance costs, acquired fund fees and expenses, and nonroutine expenses or costs, including, but not limited to, those relating to reorganizations, litigation, conducting shareholder meetings, and liquidations (collectively, nonroutine expenses)) from exceeding 0.80% of the Fund’s average daily net assets during the period from Nov. 28, 2014 through July 31, 2015.* Please see the most recent prospectus and any applicable supplement(s) for additional information on these fee waivers and/or reimbursements.
| | | | | | | | | | | | | | | | | | | | |
Fund expense ratios | | Class A | | Class C | | Class R | | Institutional Class |
Total annual operating expenses | | | | 1.11% | | | | | 1.86% | | | | | 1.36% | | | | | 0.86% | |
(without fee waivers) | | | | | | | | | | | | | | | | | | | | |
Net expenses | | | | 1.05% | | | | | 1.80% | | | | | 1.30% | | | | | 0.80% | |
(including fee waivers, if any) | | | | | | | | | | | | | | | | | | | | |
Type of waiver | | | | Contractual | | | | | Contractual | | | | | Contractual | | | | | Contractual | |
*For the one-year period prior to Nov. 28, 2014, the contractual waiver was 0.81%.
6
Performance of a $10,000 investment1
Average annual total returns from July 31, 2005, through July 31, 2015
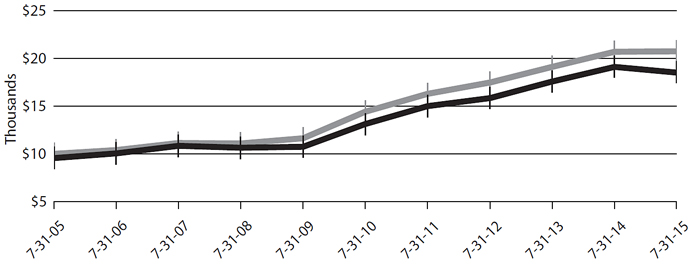
| | | | | | | | | | |
| For period beginning July 31, 2005, through July 31, 2015 | | Starting value | | | Ending value | |

| | BofA Merrill Lynch U.S. High Yield Constrained Index | | | $10,000 | | | | $20,714 | |

| | Delaware High-Yield Opportunities | | | | | | | | |
| | | Fund — Class A shares | | | $9,550 | | | | $18,517 | |
1 The “Performance of a $10,000 investment” graph assumes $10,000 invested in Class A shares of the Fund on July 31, 2005, and includes the effect of a 4.50% front-end sales charge and the reinvestment of all distributions. The graph does not reflect the deduction of taxes the shareholders would pay on Fund distributions or redemptions of Fund shares. Expense limitations were in effect for some or all of the periods shown. Performance would have been lower had expense limitations not been in effect. Expenses are listed in the “Fund expense ratios” table on page 6. Please note additional details on pages 4 through 7.
The graph also assumes $10,000 invested in the BofA Merrill Lynch U.S. High Yield Constrained
Index as of July 31, 2005. The BofA Merrill Lynch U.S. High Yield Constrained Index tracks the performance of U.S. dollar–denominated high yield corporate debt publicly issued in the U.S. domestic market, but caps individual issuer exposure at 2% of the benchmark.
Index performance returns do not reflect any management fees, transaction costs, or expenses. Indices are unmanaged and one cannot invest directly in an index. Past performance is not a guarantee of future results.
Performance of other Fund classes will vary due to different charges and expenses.
| | | | | | |
| | | Nasdaq symbols | | CUSIPs | | |
Class A | | DHOAX | | 245908876 | | |
Class C | | DHOCX | | 245908850 | | |
Class R | | DHIRX | | 245908736 | | |
Institutional Class | | DHOIX | | 245908843 | | |
7
Disclosure of Fund expenses
For the six-month period from February 1, 2015 to July 31, 2015 (Unaudited)
As a shareholder of the Fund, you incur two types of costs: (1) transaction costs, including sales charges (loads) on purchase payments, reinvested dividends, or other distributions; redemption fees; and exchange fees; and (2) ongoing costs, including management fees; distribution and/or service (12b-1) fees; and other Fund expenses. This example is intended to help you understand your ongoing costs (in dollars) of investing in the Fund and to compare these costs with the ongoing costs of investing in other mutual funds.
The example is based on an investment of $1,000 invested at the beginning of the period and held for the entire six-month period from Feb. 1, 2015 to July 31, 2015.
Actual expenses
The first section of the table shown, “Actual Fund return,” provides information about actual account values and actual expenses. You may use the information in this section of the table, together with the amount you invested, to estimate the expenses that you paid over the period. Simply divide your account value by $1,000 (for example, an $8,600 account value divided by $1,000 = 8.6), then multiply the result by the number in the first section under the heading entitled “Expenses Paid During Period” to estimate the expenses you paid on your account during this period.
Hypothetical example for comparison purposes
The second section of the table shown, “Hypothetical 5% return,” provides information about hypothetical account values and hypothetical expenses based on the Fund’s actual expense ratio and an assumed rate of return of 5% per year before expenses, which is not the Fund’s actual return. The hypothetical account values and expenses may not be used to estimate the actual ending account balance or expenses you paid for the period. You may use this information to compare the ongoing costs of investing in the Fund and other funds. To do so, compare this 5% hypothetical example with the 5% hypothetical examples that appear in the shareholder reports of the other funds.
Please note that the expenses shown in the table are meant to highlight your ongoing costs only and do not reflect any transactional costs, such as sales charges (loads), redemption fees, or exchange fees. Therefore, the second section of the table is useful in comparing ongoing costs only, and will not help you determine the relative total costs of owning different funds. In addition, if these transactional costs were included, your costs would have been higher. The Fund’s expenses shown in the table reflect fee waivers in effect. The expenses shown in the table assume reinvestment of all dividends and distributions.
8
Delaware High-Yield Opportunities Fund
Expense analysis of an investment of $1,000
| | | | | | | | | | | | | | | | | | | | |
| | | Beginning
Account Value
2/1/15 | | Ending
Account Value
7/31/15 | | Annualized
Expense Ratio | | Expenses
Paid During Period
2/1/15 to 7/31/15* |
Actual Fund return† | | | | | | | | | | | | | | | | | | | | |
Class A | | | $ | 1,000.00 | | | | $ | 1,011.00 | | | | | 1.08 | % | | | $ | 5.39 | |
Class C | | | | 1,000.00 | | | | | 1,009.80 | | | | | 1.83 | % | | | | 9.12 | |
Class R | | | | 1,000.00 | | | | | 1,012.30 | | | | | 1.33 | % | | | | 6.64 | |
Institutional Class | | | | 1,000.00 | | | | | 1,012.30 | | | | | 0.83 | % | | | | 4.14 | |
Hypothetical 5% return (5% return before expenses) | | | | | | | | | | | |
Class A | | | $ | 1,000.00 | | | | $ | 1,019.44 | | | | | 1.08 | % | | | $ | 5.41 | |
Class C | | | | 1,000.00 | | | | | 1,015.72 | | | | | 1.83 | % | | | | 9.15 | |
Class R | | | | 1,000.00 | | | | | 1,018.20 | | | | | 1.33 | % | | | | 6.66 | |
Institutional Class | | | | 1,000.00 | | | | | 1,020.68 | | | | | 0.83 | % | | | | 4.16 | |
| * | “Expenses Paid During Period” are equal to the Fund’s annualized expense ratio, multiplied by the average account value over the period, multiplied by 181/365 (to reflect the one-half year period). |
| † | Because actual returns reflect only the most recent six-month period, the returns shown may differ significantly from fiscal year returns. |
9
| | |
| Security type / sector allocation |
| Delaware High-Yield Opportunities Fund | | As of July 31, 2015 (Unaudited) |
Sector designations may be different than the sector designations presented in other fund materials. The sector designations may represent the investment manager’s internal sector classifications, which may result in the sector designations for one fund being different than another fund’s sector designations.
| | | | | |
| Security type / sector | | Percentage of net assets |
Convertible Bond | | | | 0.04% | |
Corporate Bonds | | | | 88.71% | |
Automotive | | | | 1.57% | |
Banking | | | | 2.86% | |
Basic Industry | | | | 10.39% | |
Capital Goods | | | | 5.83% | |
Consumer Cyclical | | | | 4.67% | |
Consumer Non-Cyclical | | | | 5.14% | |
Energy | | | | 10.47% | |
Financial Services | | | | 1.51% | |
Healthcare | | | | 5.76% | |
Insurance | | | | 1.54% | |
Media | | | | 11.93% | |
Services | | | | 7.91% | |
Technology & Electronics | | | | 4.02% | |
Telecommunications | | | | 10.60% | |
Utilities | | | | 4.51% | |
Municipal Bond | | | | 0.16% | |
Senior Secured Loans | | | | 5.87% | |
Common Stock | | | | 0.00% | |
Preferred Stock | | | | 1.72% | |
Short-Term Investments | | | | 1.71% | |
Total Value of Securities | | | | 98.21% | |
Receivables and Other Assets Net of Liabilities | | | | 1.79% | |
Total Net Assets | | | | 100.00% | |
10
| | |
| Schedule of investments |
| Delaware High-Yield Opportunities Fund | | July 31, 2015 |
| | | | | | | | |
| | | Principal amount° | | | Value (U.S. $) | |
| |
Convertible Bond – 0.04% | | | | | | | | |
| |
Abengoa 144A 5.125% exercise price $38.08, expiration date 2/23/17 # | | | 200,000 | | | $ | 184,125 | |
| | | | | | | | |
Total Convertible Bond (cost $207,390) | | | | | | | 184,125 | |
| | | | | | | | |
| | | | | | | | |
| |
Corporate Bonds – 88.71% | | | | | | | | |
| |
Automotive – 1.57% | | | | | | | | |
Gates Global 144A 6.00% 7/15/22 # | | | 2,775,000 | | | | 2,476,687 | |
International Automotive Components Group 144A 9.125% 6/1/18 # | | | 2,568,000 | | | | 2,628,990 | |
Meritor 6.75% 6/15/21 | | | 1,360,000 | | | | 1,404,200 | |
Tupy Overseas 144A 6.625% 7/17/24 # | | | 825,000 | | | | 796,125 | |
| | | | | | | | |
| | | | | | | 7,306,002 | |
| | | | | | | | |
Banking – 2.86% | | | | | | | | |
Credit Suisse Group 144A 7.50% 12/29/49 #● | | | 3,010,000 | | | | 3,211,670 | |
ING Groep 6.50% 12/29/49 ● | | | 1,975,000 | | | | 1,947,844 | |
JPMorgan Chase 6.75% 1/29/49 ● | | | 2,340,000 | | | | 2,481,863 | |
Lloyds Banking Group 7.50% 4/30/49 ● | | | 2,660,000 | | | | 2,779,700 | |
Popular 7.00% 7/1/19 | | | 2,988,000 | | | | 2,879,685 | |
| | | | | | | | |
| | | | | | | 13,300,762 | |
| | | | | | | | |
Basic Industry – 10.39% | | | | | | | | |
AK Steel | | | | | | | | |
7.625% 5/15/20 | | | 2,192,000 | | | | 1,572,760 | |
7.625% 10/1/21 | | | 1,040,000 | | | | 738,400 | |
ArcelorMittal | | | | | | | | |
5.125% 6/1/20 | | | 680,000 | | | | 683,400 | |
6.125% 6/1/25 | | | 650,000 | | | | 620,750 | |
6.25% 3/1/21 | | | 790,000 | | | | 800,863 | |
AVINTIV Specialty Materials 144A 6.875% 6/1/19 # | | | 3,485,000 | | | | 3,567,769 | |
Builders FirstSource | | | | | | | | |
144A 7.625% 6/1/21 # | | | 1,936,000 | | | | 2,023,120 | |
144A 10.75% 8/15/23 # | | | 1,500,000 | | | | 1,552,500 | |
Cemex Sab De CV 144A 7.25% 1/15/21 # | | | 3,435,000 | | | | 3,666,863 | |
Chemours | | | | | | | | |
144A 6.625% 5/15/23 # | | | 885,000 | | | | 781,013 | |
144A 7.00% 5/15/25 # | | | 2,085,000 | | | | 1,834,153 | |
CPG Merger Sub 144A 8.00% 10/1/21 # | | | 2,115,000 | | | | 2,167,875 | |
FMG Resources August 2006 Pty 144A 9.75% 3/1/22 # | | | 1,530,000 | | | | 1,411,425 | |
Hexion 10.00% 4/15/20 | | | 1,320,000 | | | | 1,356,300 | |
Kissner Milling 144A 7.25% 6/1/19 # | | | 1,285,000 | | | | 1,283,394 | |
LSB Industries 7.75% 8/1/19 | | | 1,155,000 | | | | 1,221,413 | |
Lundin Mining 144A 7.875% 11/1/22 # | | | 3,010,000 | | | | 3,070,200 | |
NCI Building Systems 144A 8.25% 1/15/23 # | | | 1,445,000 | | | | 1,531,700 | |
New Gold 144A 6.25% 11/15/22 # | | | 1,915,000 | | | | 1,713,925 | |
11
Schedule of investments
Delaware High-Yield Opportunities Fund
| | | | | | | | |
| | | Principal amount° | | | Value (U.S. $) | |
| |
Corporate Bonds (continued) | | | | | | | | |
| |
Basic Industry (continued) | | | | | | | | |
NOVA Chemicals 144A 5.00% 5/1/25 # | | | 930,000 | | | $ | 923,025 | |
Rayonier AM Products 144A 5.50% 6/1/24 # | | | 2,950,000 | | | | 2,514,875 | |
Ryerson | | | | | | | | |
9.00% 10/15/17 | | | 1,817,000 | | | | 1,798,830 | |
11.25% 10/15/18 | | | 712,000 | | | | 704,880 | |
Steel Dynamics 5.50% 10/1/24 | | | 1,830,000 | | | | 1,816,275 | |
Summit Materials 144A 6.125% 7/15/23 # | | | 1,205,000 | | | | 1,201,987 | |
TPC Group 144A 8.75% 12/15/20 # | | | 4,495,000 | | | | 4,056,737 | |
Tronox Finance 144A 7.50% 3/15/22 # | | | 1,670,000 | | | | 1,373,575 | |
Wise Metals Group 144A 8.75% 12/15/18 # | | | 1,325,000 | | | | 1,361,835 | |
Wise Metals Intermediate Holdings 144A 9.75% 6/15/19 # | | | 895,000 | | | | 920,731 | |
| | | | | | | | |
| | | | | | | 48,270,573 | |
| | | | | | | | |
Capital Goods – 5.83% | | | | | | | | |
Accudyne Industries Borrower 144A 7.75% 12/15/20 # | | | 2,225,000 | | | | 2,041,437 | |
Ardagh Packaging Finance 144A 6.00% 6/30/21 # | | | 2,065,000 | | | | 2,067,581 | |
BWAY Holding 144A 9.125% 8/15/21 # | | | 3,545,000 | | | | 3,633,625 | |
DAE Aviation Holdings 144A 10.00% 7/15/23 # | | | 960,000 | | | | 972,000 | |
Gardner Denver 144A 6.875% 8/15/21 # | | | 4,115,000 | | | | 3,672,637 | |
KLX 144A 5.875% 12/1/22 # | | | 2,490,000 | | | | 2,514,900 | |
Milacron 144A 7.75% 2/15/21 # | | | 1,255,000 | | | | 1,302,063 | |
Plastipak Holdings 144A 6.50% 10/1/21 # | | | 2,870,000 | | | | 2,898,700 | |
Reynolds Group Issuer 8.25% 2/15/21 | | | 2,090,000 | | | | 2,178,825 | |
Signode Industrial Group 144A 6.375% 5/1/22 # | | | 2,845,000 | | | | 2,795,213 | |
TransDigm | | | | | | | | |
6.00% 7/15/22 | | | 1,280,000 | | | | 1,283,200 | |
6.50% 7/15/24 | | | 765,000 | | | | 772,650 | |
144A 6.50% 5/15/25 # | | | 975,000 | | | | 979,875 | |
| | | | | | | | |
| | | | | | | 27,112,706 | |
| | | | | | | | |
Consumer Cyclical – 4.67% | | | | | | | | |
American Tire Distributors 144A 10.25% 3/1/22 # | | | 1,295,000 | | | | 1,356,513 | |
Boyd Gaming 6.875% 5/15/23 | | | 2,005,000 | | | | 2,095,225 | |
Chinos Intermediate Holdings A 144A PIK 7.75% 5/1/19 #❄ | | | 1,515,000 | | | | 1,041,563 | |
DBP Holding 144A 7.75% 10/15/20 # | | | 1,989,000 | | | | 1,591,200 | |
Midas Intermediate Holdco II 144A 7.875% 10/1/22 # | | | 1,480,000 | | | | 1,487,400 | |
Neiman Marcus Group 144A PIK 8.75% 10/15/21 #❄ | | | 2,495,000 | | | | 2,688,363 | |
PF Chang’s China Bistro 144A 10.25% 6/30/20 # | | | 1,287,000 | | | | 1,335,263 | |
Rite Aid 144A 6.125% 4/1/23 # | | | 2,870,000 | | | | 2,991,975 | |
RSI Home Products 144A 6.50% 3/15/23 # | | | 2,010,000 | | | | 2,080,350 | |
Sabre GLBL 144A 5.375% 4/15/23 # | | | 1,160,000 | | | | 1,160,000 | |
12
| | | | | | | | |
| | | Principal amount° | | | Value (U.S. $) | |
| |
Corporate Bonds (continued) | | | | | | | | |
| |
Consumer Cyclical (continued) | | | | | | | | |
Univar USA 144A 6.75% 7/15/23 # | | | 1,025,000 | | | $ | 1,032,687 | |
Wynn Las Vegas 144A 5.50% 3/1/25 # | | | 2,960,000 | | | | 2,860,100 | |
| | | | | | | | |
| | | | | | | 21,720,639 | |
| | | | | | | | |
Consumer Non-Cyclical – 5.14% | | | | | | | | |
Avis Budget Car Rental 144A 5.25% 3/15/25 # | | | 3,015,000 | | | | 2,883,094 | |
Cott Beverages | | | | | | | | |
5.375% 7/1/22 | | | 790,000 | | | | 774,200 | |
144A 6.75% 1/1/20 # | | | 2,505,000 | | | | 2,614,594 | |
ExamWorks Group 5.625% 4/15/23 | | | 2,590,000 | | | | 2,667,700 | |
JBS Investments | | | | | | | | |
144A 7.25% 4/3/24 # | | | 715,000 | | | | 736,450 | |
144A 7.75% 10/28/20 # | | | 1,110,000 | | | | 1,204,350 | |
JBS USA 144A 5.75% 6/15/25 # | | | 4,415,000 | | | | 4,386,059 | |
Omnicare 5.00% 12/1/24 | | | 540,000 | | | | 575,100 | |
Prestige Brands 144A 5.375% 12/15/21 # | | | 1,856,000 | | | | 1,883,840 | |
Spectrum Brands 144A 6.125% 12/15/24 # | | | 985,000 | | | | 1,028,320 | |
Sterigenics-Nordion Holdings 144A 6.50% 5/15/23 # | | | 1,750,000 | | | | 1,793,750 | |
SUPERVALU 7.75% 11/15/22 | | | 3,130,000 | | | | 3,325,625 | |
| | | | | | | | |
| | | | | | | 23,873,082 | |
| | | | | | | | |
Energy – 10.47% | | | | | | | | |
Baytex Energy 144A 5.625% 6/1/24 # | | | 2,155,000 | | | | 1,864,075 | |
California Resources | | | | | | | | |
5.50% 9/15/21 | | | 1,825,000 | | | | 1,514,750 | |
6.00% 11/15/24 | | | 1,190,000 | | | | 966,875 | |
Calumet Specialty Products Partners 7.625% 1/15/22 | | | 3,280,000 | | | | 3,339,670 | |
Chaparral Energy | | | | | | | | |
7.625% 11/15/22 | | | 1,865,000 | | | | 1,100,350 | |
8.25% 9/1/21 | | | 1,579,000 | | | | 955,295 | |
Chesapeake Energy | | | | | | | | |
4.875% 4/15/22 | | | 2,080,000 | | | | 1,684,800 | |
5.75% 3/15/23 | | | 1,170,000 | | | | 994,500 | |
Comstock Resources 144A 10.00% 3/15/20 # | | | 2,770,000 | | | | 2,458,375 | |
CSI Compressco 7.25% 8/15/22 | | | 1,950,000 | | | | 1,847,625 | |
Energy Transfer Equity 5.875% 1/15/24 | | | 2,070,000 | | | | 2,116,575 | |
EP Energy 144A 6.375% 6/15/23 # | | | 1,285,000 | | | | 1,206,294 | |
Exterran Partners 6.00% 4/1/21 | | | 1,200,000 | | | | 1,101,000 | |
Genesis Energy | | | | | | | | |
5.75% 2/15/21 | | | 895,000 | | | | 877,100 | |
6.00% 5/15/23 | | | 2,315,000 | | | | 2,216,613 | |
Halcon Resources | | | | | | | | |
144A 8.625% 2/1/20 # | | | 875,000 | | | | 838,906 | |
9.75% 7/15/20 | | | 2,585,000 | | | | 1,408,825 | |
13
Schedule of investments
Delaware High-Yield Opportunities Fund
| | | | | | | | |
| | | Principal amount° | | | Value (U.S. $) | |
| |
Corporate Bonds (continued) | | | | | | | | |
| |
Energy (continued) | | | | | | | | |
Laredo Petroleum 5.625% 1/15/22 | | | 1,770,000 | | | $ | 1,712,475 | |
Linn Energy 6.25% 11/1/19 | | | 1,885,000 | | | | 1,151,018 | |
MarkWest Energy Partners 4.875% 12/1/24 | | | 1,155,000 | | | | 1,131,900 | |
Murphy Oil USA 6.00% 8/15/23 | | | 2,575,000 | | | | 2,684,437 | |
Northern Oil and Gas 8.00% 6/1/20 | | | 1,895,000 | | | | 1,677,075 | |
NuStar Logistics 6.75% 2/1/21 | | | 1,970,000 | | | | 2,101,107 | |
Oasis Petroleum 6.875% 3/15/22 | | | 3,115,000 | | | | 2,881,375 | |
Ocean Rig UDW 144A 7.25% 4/1/19 # | | | 1,295,000 | | | | 828,800 | |
PDC Energy 7.75% 10/15/22 | | | 1,557,000 | | | | 1,613,441 | |
Pioneer Energy Services 6.125% 3/15/22 | | | 3,085,000 | | | | 2,159,500 | |
Rose Rock Midstream 144A 5.625% 11/15/23 # | | | 825,000 | | | | 787,875 | |
Sabine Pass Liquefaction 144A 5.625% 3/1/25 # | | | 1,005,000 | | | | 993,694 | |
Transocean | | | | | | | | |
4.30% 10/15/22 | | | 730,000 | | | | 533,813 | |
6.875% 12/15/21 | | | 830,000 | | | | 704,463 | |
Weatherford International 4.50% 4/15/22 | | | 1,325,000 | | | | 1,204,462 | |
| | | | | | | | |
| | | | | | | 48,657,063 | |
| | | | | | | | |
Financial Services – 1.51% | | | | | | | | |
Communications Sales & Leasing 144A 8.25% 10/15/23 # | | | 1,040,000 | | | | 995,800 | |
Consolidated Energy Finance 144A 6.75% 10/15/19 # | | | 1,552,000 | | | | 1,575,311 | |
Infinity Acquisition 144A 7.25% 8/1/22 # | | | 1,720,000 | | | | 1,629,700 | |
James Hardie International Finance 144A 5.875% 2/15/23 # | | | 2,715,000 | | | | 2,796,450 | |
| | | | | | | | |
| | | | | | | 6,997,261 | |
| | | | | | | | |
Healthcare – 5.76% | | | | | | | | |
21st Century Oncology 144A 11.00% 5/1/23 # | | | 1,035,000 | | | | 972,900 | |
Community Health Systems 6.875% 2/1/22 | | | 3,620,000 | | | | 3,882,450 | |
DaVita HealthCare Partners 5.00% 5/1/25 | | | 465,000 | | | | 460,931 | |
HCA 5.375% 2/1/25 | | | 2,260,000 | | | | 2,316,500 | |
HealthSouth 5.75% 11/1/24 | | | 1,155,000 | | | | 1,170,881 | |
IASIS Healthcare 8.375% 5/15/19 | | | 4,470,000 | | | | 4,665,563 | |
Immucor 11.125% 8/15/19 | | | 3,675,000 | | | | 3,877,125 | |
Kinetic Concepts 12.50% 11/1/19 | | | 1,400,000 | | | | 1,505,000 | |
Mallinckrodt International Finance | | | | | | | | |
4.75% 4/15/23 | | | 250,000 | | | | 242,500 | |
144A 5.50% 4/15/25 # | | | 1,000,000 | | | | 1,011,250 | |
Tenet Healthcare | | | | | | | | |
144A 5.00% 3/1/19 # | | | 1,080,000 | | | | 1,094,850 | |
144A 6.75% 6/15/23 # | | | 480,000 | | | | 502,800 | |
8.125% 4/1/22 | | | 3,025,000 | | | | 3,401,249 | |
Valeant Pharmaceuticals International | | | | | | | | |
144A 5.875% 5/15/23 # | | | 555,000 | | | | 578,532 | |
14
| | | | | | | | |
| | | Principal amount° | | | Value (U.S. $) | |
| |
Corporate Bonds (continued) | | | | | | | | |
| |
Healthcare (continued) | | | | | | | | |
Valeant Pharmaceuticals International | | | | | | | | |
144A 6.125% 4/15/25 # | | | 1,015,000 | | | $ | 1,063,213 | |
| | | | | | | | |
| | | | | | | 26,745,744 | |
| | | | | | | | |
Insurance – 1.54% | | | | | | | | |
HUB International 144A 7.875% 10/1/21 # | | | 2,745,000 | | | | 2,810,194 | |
USI 144A 7.75% 1/15/21 # | | | 2,335,000 | | | | 2,364,187 | |
XLIT 6.50% 10/29/49 ● | | | 2,337,000 | | | | 1,986,450 | |
| | | | | | | | |
| | | | | | | 7,160,831 | |
| | | | | | | | |
Media – 11.93% | | | | | | | | |
Altice | | | | | | | | |
144A 7.625% 2/15/25 # | | | 1,200,000 | | | | 1,179,000 | |
144A 7.75% 5/15/22 # | | | 2,940,000 | | | | 2,969,400 | |
Altice Financing 144A 6.625% 2/15/23 # | | | 2,480,000 | | | | 2,560,600 | |
Altice US Finance 144A 7.75% 7/15/25 # | | | 2,050,000 | | | | 2,019,250 | |
CCO Holdings | | | | | | | | |
144A 5.375% 5/1/25 # | | | 1,005,000 | | | | 992,437 | |
144A 5.875% 5/1/27 # | | | 1,175,000 | | | | 1,166,922 | |
CCO Safari II 144A 4.908% 7/23/25 # | | | 1,180,000 | | | | 1,184,461 | |
Columbus International 144A 7.375% 3/30/21 # | | | 3,515,000 | | | | 3,747,869 | |
CSC Holdings 5.25% 6/1/24 | | | 2,470,000 | | | | 2,294,013 | |
DISH DBS 5.875% 11/15/24 | | | 1,580,000 | | | | 1,536,550 | |
Equinix 5.75% 1/1/25 | | | 1,895,000 | | | | 1,913,950 | |
iHeartCommunications | | | | | | | | |
9.00% 12/15/19 | | | 485,000 | | | | 468,025 | |
9.00% 9/15/22 | | | 7,480,000 | | | | 6,736,675 | |
LIN Television 144A 5.875% 11/15/22 # | | | 2,790,000 | | | | 2,845,800 | |
Nexstar Broadcasting 144A 6.125% 2/15/22 # | | | 695,000 | | | | 714,113 | |
Numericable-SFR 144A 6.00% 5/15/22 # | | | 3,540,000 | | | | 3,610,800 | |
RCN Telecom Services 144A 8.50% 8/15/20 # | | | 2,210,000 | | | | 2,317,737 | |
Sinclair Television Group 144A 5.625% 8/1/24 # | | | 2,455,000 | | | | 2,424,313 | |
Sirius XM Radio 144A 5.375% 4/15/25 # | | | 2,180,000 | | | | 2,180,000 | |
Tribune Media 144A 5.875% 7/15/22 # | | | 1,950,000 | | | | 2,018,250 | |
VTR Finance 144A 6.875% 1/15/24 # | | | 4,905,000 | | | | 5,003,100 | |
WideOpenWest Finance | | | | | | | | |
10.25% 7/15/19 | | | 4,010,000 | | | | 4,261,427 | |
13.375% 10/15/19 | | | 1,205,000 | | | | 1,316,463 | |
| | | | | | | | |
| | | | | | | 55,461,155 | |
| | | | | | | | |
Services – 7.91% | | | | | | | | |
Abengoa Finance 144A 8.875% 11/1/17 # | | | 1,055,000 | | | | 1,012,800 | |
Abengoa Greenfield 144A 6.50% 10/1/19 # | | | 1,625,000 | | | | 1,291,875 | |
AECOM | | | | | | | | |
144A 5.75% 10/15/22 # | | | 1,035,000 | | | | 1,053,113 | |
15
Schedule of investments
Delaware High-Yield Opportunities Fund
| | | | | | | | |
| | | Principal amount° | | | Value (U.S. $) | |
| |
Corporate Bonds (continued) | | | | | | | | |
| |
Services (continued) | | | | | | | | |
AECOM | | | | | | | | |
144A 5.875% 10/15/24 # | | | 1,260,000 | | | $ | 1,282,050 | |
Air Medical Merger Sub 144A 6.375% 5/15/23 # | | | 2,895,000 | | | | 2,721,300 | |
Algeco Scotsman Global Finance | | | | | | | | |
144A 8.50% 10/15/18 # | | | 2,600,000 | | | | 2,439,413 | |
144A 10.75% 10/15/19 # | | | 2,222,000 | | | | 1,548,998 | |
BlueLine Rental Finance 144A 7.00% 2/1/19 # | | | 1,460,000 | | | | 1,460,000 | |
Caesars Growth Properties Holdings 9.375% 5/1/22 | | | 1,750,000 | | | | 1,365,000 | |
ESH Hospitality 144A 5.25% 5/1/25 # | | | 1,430,000 | | | | 1,399,613 | |
GEO Group 5.875% 10/15/24 | | | 1,945,000 | | | | 2,022,800 | |
Mattamy Group 144A 6.50% 11/15/20 # | | | 3,450,000 | | | | 3,363,750 | |
MGM Resorts International 6.00% 3/15/23 | | | 3,150,000 | | | | 3,213,000 | |
Navios South American Logistics 144A 7.25% 5/1/22 # | | | 2,975,000 | | | | 2,807,656 | |
Pinnacle Entertainment 7.75% 4/1/22 | | | 880,000 | | | | 990,000 | |
United Rentals North America | | | | | | | | |
5.50% 7/15/25 | | | 1,605,000 | | | | 1,540,800 | |
5.75% 11/15/24 | | | 2,290,000 | | | | 2,249,925 | |
Vander Intermediate Holding II 144A PIK 9.75% 2/1/19 #❄ | | | 1,035,000 | | | | 949,613 | |
West 144A 5.375% 7/15/22 # | | | 3,045,000 | | | | 2,904,169 | |
XPO Logistics 144A 6.50% 6/15/22 # | | | 1,155,000 | | | | 1,139,119 | |
| | | | | | | | |
| | | | | | | 36,754,994 | |
| | | | | | | | |
Technology & Electronics – 4.02% | | | | | | | | |
Audatex North America 144A 6.125% 11/1/23 # | | | 3,100,000 | | | | 3,041,875 | |
Avaya 144A 7.00% 4/1/19 # | | | 520,000 | | | | 504,400 | |
CommScope 144A 5.50% 6/15/24 # | | | 3,280,000 | | | | 3,222,600 | |
CommScope Technologies Finance 144A 6.00% 6/15/25 # | | | 835,000 | | | | 826,650 | |
Entegris 144A 6.00% 4/1/22 # | | | 2,705,000 | | | | 2,782,769 | |
First Data 11.75% 8/15/21 | | | 1,986,750 | | | | 2,259,928 | |
Infor Software Parent 144A PIK 7.125% 5/1/21 #❄ | | | 3,390,000 | | | | 3,343,387 | |
Italics Merger Sub 144A 7.125% 7/15/23 # | | | 1,030,000 | | | | 1,014,550 | |
Micron Technology | | | | | | | | |
144A 5.25% 1/15/24 # | | | 1,300,000 | | | | 1,251,250 | |
144A 5.625% 1/15/26 # | | | 470,000 | | | | 451,200 | |
| | | | | | | | |
| | | | | | | 18,698,609 | |
| | | | | | | | |
Telecommunications – 10.60% | | | | | | | | |
Blue Coat Holdings 144A 8.375% 6/1/23 # | | | 2,555,000 | | | | 2,625,263 | |
CenturyLink 6.75% 12/1/23 | | | 1,600,000 | | | | 1,610,000 | |
Cogent Communications Finance 144A 5.625% 4/15/21 # | | | 2,325,000 | | | | 2,208,750 | |
Cogent Communications Group 144A 5.375% 3/1/22 # | | | 815,000 | | | | 810,925 | |
Digicel 144A 6.75% 3/1/23 # | | | 1,750,000 | | | | 1,683,500 | |
Digicel Group | | | | | | | | |
144A 7.125% 4/1/22 # | | | 1,465,000 | | | | 1,351,463 | |
16
| | | | | | | | |
| | | Principal amount° | | | Value (U.S. $) | |
| |
Corporate Bonds (continued) | | | | | | | | |
| |
Telecommunications (continued) | | | | | | | | |
Digicel Group | | | | | | | | |
144A 8.25% 9/30/20 # | | | 4,785,000 | | | $ | 4,749,113 | |
Hughes Satellite Systems 7.625% 6/15/21 | | | 1,854,000 | | | | 2,057,940 | |
Intelsat Jackson Holdings 7.25% 4/1/19 | | | 240,000 | | | | 238,800 | |
Intelsat Luxembourg | | | | | | | | |
7.75% 6/1/21 | | | 465,000 | | | | 371,419 | |
8.125% 6/1/23 | | | 7,820,000 | | | | 6,256,000 | |
Level 3 Communications 5.75% 12/1/22 | | | 2,160,000 | | | | 2,181,600 | |
Level 3 Financing 144A 5.375% 5/1/25 # | | | 2,640,000 | | | | 2,574,000 | |
Millicom International Cellular 144A 6.625% 10/15/21 # | | | 710,000 | | | | 741,950 | |
Sable International Finance 144A 6.875% 8/1/22 # | | | 1,550,000 | | | | 1,528,982 | |
Sprint | | | | | | | | |
7.125% 6/15/24 | | | 2,340,000 | | | | 2,146,950 | |
7.25% 9/15/21 | | | 2,080,000 | | | | 1,994,200 | |
7.875% 9/15/23 | | | 1,760,000 | | | | 1,691,800 | |
T-Mobile USA | | | | | | | | |
6.00% 3/1/23 | | | 925,000 | | | | 966,625 | |
6.25% 4/1/21 | | | 1,420,000 | | | | 1,491,000 | |
6.375% 3/1/25 | | | 1,925,000 | | | | 2,023,656 | |
Wind Acquisition Finance | | | | | | | | |
144A 4.75% 7/15/20 # | | | 960,000 | | | | 984,000 | |
144A 7.375% 4/23/21 # | | | 2,420,000 | | | | 2,571,250 | |
Windstream Services | | | | | | | | |
7.50% 6/1/22 | | | 1,103,000 | | | | 911,354 | |
7.75% 10/1/21 | | | 930,000 | | | | 790,500 | |
Zayo Group 144A 6.00% 4/1/23 # | | | 2,680,000 | | | | 2,695,383 | |
| | | | | | | | |
| | | | | | | 49,256,423 | |
| | | | | | | | |
Utilities – 4.51% | | | | | | | | |
Abengoa Yield 144A 7.00% 11/15/19 # | | | 1,570,000 | | | | 1,577,850 | |
AES 5.50% 4/15/25 | | | 2,240,000 | | | | 2,156,000 | |
AES Gener 144A 8.375% 12/18/73 #● | | | 817,000 | | | | 896,657 | |
Calpine | | | | | | | | |
5.375% 1/15/23 | | | 1,990,000 | | | | 1,955,175 | |
5.50% 2/1/24 | | | 1,220,000 | | | | 1,189,500 | |
DPL | | | | | | | | |
6.75% 10/1/19 | | | 1,280,000 | | | | 1,379,200 | |
7.25% 10/15/21 | | | 990,000 | | | | 1,060,537 | |
Dynegy | | | | | | | | |
5.875% 6/1/23 | | | 1,610,000 | | | | 1,549,625 | |
144A 7.375% 11/1/22 # | | | 1,345,000 | | | | 1,398,127 | |
144A 7.625% 11/1/24 # | | | 2,155,000 | | | | 2,235,813 | |
Enel 144A 8.75% 9/24/73 #● | | | 2,793,000 | | | | 3,284,568 | |
17
Schedule of investments
Delaware High-Yield Opportunities Fund
| | | | | | | | |
| | | Principal amount° | | | Value (U.S. $) | |
| |
Corporate Bonds (continued) | | | | | | | | |
| |
Utilities (continued) | | | | | | | | |
GenOn Energy 9.875% 10/15/20 | | | 2,268,000 | | | $ | 2,273,670 | |
| | | | | | | | |
| | | | | | | 20,956,722 | |
| | | | | | | | |
Total Corporate Bonds (cost $427,637,406) | | | | | | | 412,272,566 | |
| | | | | | | | |
| | | | | | | | | |
Municipal Bond – 0.16% | | | | | | | | |
Chicago, Illinois | | | | | | | | |
(Taxable Build America Bond) Series B 7.75% 1/1/42 | | | 765,000 | | | | 755,919 | |
| | | | | | | | |
Total Municipal Bond (cost $747,151) | | | | | | | 755,919 | |
| | | | | | | | |
| | | | | | | | | |
Senior Secured Loans – 5.87%« | | | | | | | | |
21st Century Oncology Tranche B 1st Lien 6.50% 4/28/22 | | | 1,165,000 | | | | 1,122,769 | |
Applied Systems 2nd Lien 7.50% 1/23/22 | | | 2,691,218 | | | | 2,705,234 | |
Atkore International 2nd Lien 7.75% 10/9/21 | | | 1,482,000 | | | | 1,400,490 | |
Avaya 4.691% 10/26/17 | | | 1,139,317 | | | | 1,132,117 | |
BJ’s Wholesale Club 8.50% 3/31/20 | | | 2,815,000 | | | | 2,841,390 | |
CD&R Millennium Holdco (Mauser Holdings) 2nd Lien 8.75% 7/31/22 | | | 2,310,000 | | | | 2,286,900 | |
Colouroz (Flint Group) 2nd Lien 8.25% 9/7/22 | | | 2,575,000 | | | | 2,562,125 | |
Drillship Ocean Ventures (Ocean Rig) Tranche B 1st Lien 5.50% 7/25/21 | | | 744,123 | | | | 614,056 | |
FMG (Fortescue Resources) 1st Lien 3.75% 6/30/19 | | | 835,000 | | | | 686,352 | |
Green Energy Partners (Panda Stonewall) Tranche B 6.50% 11/13/21 | | | 1,715,000 | | | | 1,741,797 | |
iHeartCommunications (Clear Channel Communications) Tranche D 6.94% 1/30/19 | | | 1,695,000 | | | | 1,560,812 | |
Marina District (Borgata) Tranche B 1st Lien 6.50% 8/15/18 | | | 1,719,651 | | | | 1,741,300 | |
Moxie Patriot 6.75% 12/19/20 | | | 1,130,000 | | | | 1,134,237 | |
New HB Acquisition (Hostess Brands) 1st Lien 6.75% 3/20/20 | | | 2,248,125 | | | | 2,304,328 | |
Panda Liberty (Moxie Liberty) Tranche B 7.50% 8/21/20 | | | 1,125,000 | | | | 1,127,813 | |
Rite Aid 5.75% 8/21/20 | | | 1,126,000 | | | | 1,139,371 | |
Solenis International (Ashland Water) 2nd Lien 7.75% 7/31/22 | | | 1,200,000 | | | | 1,166,250 | |
| | | | | | | | |
Total Senior Secured Loans (cost $27,553,170) | | | | | | | 27,267,341 | |
| | | | | | | | |
18
| | | | | | | | |
| | | Number of
Shares | | | Value (U.S. $) | |
| |
Common Stock – 0.00% | | | | | | | | |
| |
Century Communications =† | | | 4,250,000 | | | $ | 0 | |
| | | | | | | | |
Total Common Stock (cost $128,662) | | | | | | | 0 | |
| | | | | | | | |
| | | | | | | | | |
Preferred Stock – 1.72% | | | | | | | | |
Ally Financial 144A 7.00% # | | | 3,253 | | | | 3,319,381 | |
Bank of America 6.50% ● | | | 2,665,000 | | | | 2,754,944 | |
GMAC Capital Trust I 8.125% ● | | | 73,000 | | | | 1,914,790 | |
| | | | | | | | |
Total Preferred Stock (cost $7,705,070) | | | | | | | 7,989,115 | |
| | | | | | | | |
| | |
| | | Principal amount° | | | | |
Short-Term Investments – 1.71% | | | | | | | | |
Repurchase Agreements – 1.71% | | | | | | | | |
Bank of America Merrill Lynch | | | | | | | | |
0.06%, dated 7/31/15, to be repurchased on 8/3/15, repurchase price $1,221,001 (collateralized by U.S. government obligations 0.50%–2.00% 1/31/17–5/31/21; market value $1,245,415) | | | 1,220,995 | | | | 1,220,995 | |
Bank of Montreal | | | | | | | | |
0.13%, dated 7/31/15, to be repurchased on 8/3/15, repurchase price $2,035,014 (collateralized by U.S. government obligations 1.25%–4.625% 9/30/16–2/15/40; market value $2,075,692) | | | 2,034,992 | | | | 2,034,992 | |
BNP Paribas | | | | | | | | |
0.12%, dated 7/31/15, to be repurchased on 8/3/15, repurchase price $4,703,060 (collateralized by U.S. government obligations 0.00%–7.50% 1/28/16–11/15/44; market value $4,797,073) | | | 4,703,013 | | | | 4,703,013 | |
| | | | | | | | |
Total Short-Term Investments (cost $7,959,000) | | | | | | | 7,959,000 | |
| | | | | | | | |
| | |
Total Value of Securities – 98.21%
(cost $471,937,849) | | | | | | | $456,428,066 | |
| | | | | | | | |
| # | Security exempt from registration under Rule 144A of the Securities Act of 1933, as amended. At July 31, 2015, the aggregate value of Rule 144A securities was $247,644,584, which represents 53.29% of the Fund’s net assets. See Note 11 in “Notes to financial statements.” |
| ❄ | 100% of the income received was in the form of cash. |
| = | Security is being fair valued in accordance with the Fund’s fair valuation policy. At July 31, 2015, the aggregate value of fair valued securities was $0, which represents 0.00% of the Fund’s net assets. See Note 1 in “Notes to financial statements.” |
| ° | Principal amount shown is stated in U.S. dollars unless noted that the security is denominated in another currency. |
| † | Non-income-producing security. |
19
Schedule of investments
Delaware High-Yield Opportunities Fund
| ● | Variable rate security. The rate shown is the rate as of July 31, 2015. Interest rates reset periodically. |
| « | Senior secured loans generally pay interest at rates which are periodically redetermined by reference to a base lending rate plus a premium. These base lending rates are generally: (i) the prime rate offered by one or more U.S. banks, (ii) the lending rate offered by one or more European banks such as the London Interbank Offered Rate (LIBOR), and (iii) the certificate of deposit rate. Senior secured loans may be subject to restrictions on resale. Stated rate in effect at July 31, 2015. |
PIK – Payment-in-kind
See accompanying notes, which are an integral part of the financial statements.
20
This page intentionally left blank.
| | |
| Statement of assets and liabilities |
| Delaware High-Yield Opportunities Fund | | July 31, 2015 |
| | | | |
Assets: | | | | |
Investments, at value1 | | | $448,469,066 | |
Short-term investments, at value2 | | | 7,959,000 | |
Cash | | | 239,903 | |
Dividends and interest receivable | | | 8,208,248 | |
Receivable for securities sold | | | 5,907,213 | |
Receivable for fund shares sold | | | 338,890 | |
Other assets3 | | | 786,990 | |
| | | | |
Total assets | | | 471,909,310 | |
| | | | |
Liabilities: | | | | |
Payable for securities purchased | | | 2,251,662 | |
Payable for fund shares redeemed | | | 825,909 | |
Distribution payable | | | 748,033 | |
Other accrued expenses | | | 286,572 | |
Investment management fees payable | | | 270,411 | |
Distribution fees payable to affiliates | | | 114,551 | |
Other affiliates payable | | | 42,468 | |
Trustees’ fees and expenses payable | | | 1,272 | |
Other liabilities3 | | | 2,623,299 | |
| | | | |
Total liabilities | | | 7,164,177 | |
| | | | |
Total Net Assets | | | $464,745,133 | |
| | | | |
| |
Net Assets Consist of: | | | | |
Paid-in capital | | | $514,648,789 | |
Distributions in excess of net investment income | | | (771,685 | ) |
Accumulated net realized loss on investments | | | (33,622,194 | ) |
Net unrealized depreciation of investments | | | (15,509,783 | ) |
Net unrealized appreciation of foriegn currencies | | | 6 | |
| | | | |
Total Net Assets | | | $464,745,133 | |
| | | | |
22
| | | | |
Net Asset Value | | | | |
Class A: | | | | |
Net assets | | $ | 238,290,153 | |
Shares of beneficial interest outstanding, unlimited authorization, no par | | | 60,280,772 | |
Net asset value per share | | $ | 3.95 | |
Sales charge | | | 4.50 | % |
Offering price per share, equal to net asset value per share / (1 – sales charge) | | $ | 4.14 | |
| |
Class C: | | | | |
Net assets | | $ | 66,354,399 | |
Shares of beneficial interest outstanding, unlimited authorization, no par | | | 16,764,442 | |
Net asset value per share | | $ | 3.96 | |
| |
Class R: | | | | |
Net assets | | $ | 13,031,820 | |
Shares of beneficial interest outstanding, unlimited authorization, no par | | | 3,286,243 | |
Net asset value per share | | $ | 3.97 | |
| |
Institutional Class: | | | | |
Net assets | | $ | 147,068,761 | |
Shares of beneficial interest outstanding, unlimited authorization, no par | | | 37,209,992 | |
Net asset value per share | | $ | 3.95 | |
| | | | |
1Investments, at cost | | $ | 463,978,849 | |
2Short-term investments, at cost | | | 7,959,000 | |
3See Note 14 in “Notes to financial statements.” | | | | |
See accompanying notes, which are an integral part of the financial statements.
23
| | |
| Statement of operations |
| Delaware High-Yield Opportunities Fund | | Year ended July 31, 2015 |
| | | | |
Investment Income: | | | | |
Interest | | $ | 39,861,301 | |
Dividends | | | 816,612 | |
| | | | |
| | | 40,677,913 | |
| | | | |
Expenses: | | | | |
Management fees | | | 3,816,036 | |
Distribution expenses — Class A | | | 693,894 | |
Distribution expenses — Class B | | | 2,119 | |
Distribution expenses — Class C | | | 778,745 | |
Distribution expenses — Class R | | | 72,751 | |
Dividend disbursing and transfer agent fees and expenses | | | 779,416 | |
Reports and statements to shareholders | | | 225,118 | |
Accounting and administration expenses | | | 190,966 | |
Registration fees | | | 89,199 | |
Legal fees | | | 62,984 | |
Audit and tax fees | | | 39,303 | |
Custodian fees | | | 31,315 | |
Trustees’ fees and expenses | | | 27,899 | |
Other | | | 38,213 | |
| | | | |
| | | 6,847,958 | |
Less expenses waived | | | (427,041 | ) |
Less waived distribution expenses — Class B | | | (1,609 | ) |
Less expense paid indirectly | | | (331 | ) |
| | | | |
Total operating expenses | | | 6,418,977 | |
| | | | |
Net Investment Income | | | 34,258,936 | |
| | | | |
24
| | | | |
Net Realized and Unrealized Gain (Loss): | | | | |
Net realized gain (loss) on: | | | | |
Investments1 | | $ | (19,378,819 | ) |
Foreign currencies | | | 606 | |
Foreign currency exchange contracts | | | (12 | ) |
Futures contracts | | | (220,643 | ) |
Swap contracts | | | (913,380 | ) |
| | | | |
Net realized loss | | | (20,512,248 | ) |
| | | | |
Net change in unrealized appreciation (depreciation) of: | | | | |
Investments | | | (33,679,095 | ) |
Foreign currencies | | | 6 | |
Futures contracts | | | (159,523 | ) |
| | | | |
Net change in unrealized appreciation (depreciation) | | | (33,838,612 | ) |
| | | | |
Net Realized and Unrealized Loss | | | (54,350,860 | ) |
| | | | |
Net Decrease in Net Assets Resulting from Operations | | $ | (20,091,924 | ) |
| | | | |
1Includes $1,836,309 loss contigencies on General Motors Corporation term loan litigation. See Note 14 in “Notes to financial statements.”
See accompanying notes, which are an integral part of the financial statements.
25
Statements of changes in net assets
Delaware High-Yield Opportunities Fund
| | | | | | | | |
| | | Year ended | |
| | | 7/31/15 | | | 7/31/14 | |
| | |
Increase (Decrease) in Net Assets from Operations: | | | | | | | | |
Net investment income | | $ | 34,258,936 | | | $ | 36,348,507 | |
Net realized gain (loss) | | | (20,512,248 | ) | | | 24,478,312 | |
Net change in unrealized appreciation (depreciation) | | | (33,838,612 | ) | | | (6,186,567 | ) |
| | | | | | | | |
Net increase (decrease) in net assets resulting from operations | | | (20,091,924 | ) | | | 54,640,252 | |
| | | | | | | | |
| | |
Dividends and Distributions to Shareholders from: | | | | | | | | |
Net investment income: | | | | | | | | |
Class A | | | (16,005,474 | ) | | | (19,186,735 | ) |
Class B | | | (11,663 | ) | | | (116,680 | ) |
Class C | | | (3,877,437 | ) | | | (4,447,360 | ) |
Class R | | | (796,438 | ) | | | (940,613 | ) |
Institutional Class | | | (13,398,301 | ) | | | (13,367,446 | ) |
| | |
Net realized gain: | | | | | | | | |
Class A | | | (4,128,685 | ) | | | — | |
Class C | | | (1,125,756 | ) | | | — | |
Class R | | | (200,283 | ) | | | — | |
Institutional Class | | | (3,279,926 | ) | | | — | |
| | | | | | | | |
| | | (42,823,963 | ) | | | (38,058,834 | ) |
| | | | | | | | |
| | |
Capital Share Transactions: | | | | | | | | |
Proceeds from shares sold: | | | | | | | | |
Class A | | | 48,226,707 | | | | 64,495,340 | |
Class B | | | — | | | | 141,341 | |
Class C | | | 5,087,511 | | | | 19,163,904 | |
Class R | | | 4,147,100 | | | | 8,377,323 | |
Institutional Class | | | 72,465,025 | | | | 121,384,209 | |
26
| | | | | | | | |
| | | Year ended | |
| | | 7/31/15 | | | 7/31/14 | |
| | |
Capital Share Transactions (continued): | | | | | | | | |
Net asset value of shares based upon reinvestment of dividends and distributions: | | | | | | | | |
Class A | | $ | 17,820,100 | | | $ | 16,872,329 | |
Class B | | | 10,535 | | | | 101,244 | |
Class C | | | 4,526,942 | | | | 3,902,900 | |
Class R | | | 997,863 | | | | 943,364 | |
Institutional Class | | | 15,999,960 | | | | 12,444,422 | |
| | | | | | | | |
| | | 169,281,743 | | | | 247,826,376 | |
| | | | | | | | |
Cost of shares redeemed: | | | | | | | | |
Class A | | | (125,187,789 | ) | | | (91,212,111 | ) |
Class B | | | (1,327,550 | ) | | | (1,837,699 | ) |
Class C | | | (24,223,790 | ) | | | (21,717,606 | ) |
Class R | | | (7,228,870 | ) | | | (9,678,702 | ) |
Institutional Class | | | (150,755,771 | ) | | | (106,622,211 | ) |
| | | | | | | | |
| | | (308,723,770 | ) | | | (231,068,329 | ) |
| | | | | | | | |
Increase (decrease) in net assets derived from capital share transactions | | | (139,442,027 | ) | | | 16,758,047 | |
| | | | | | | | |
Net Increase (Decrease) in Net Assets | | | (202,357,914 | ) | | | 33,339,465 | |
| | |
Net Assets: | | | | | | | | |
Beginning of year | | | 667,103,047 | | | | 633,763,582 | |
| | | | | | | | |
End of year | | $ | 464,745,133 | | | $ | 667,103,047 | |
| | | | | | | | |
| | |
Distributions in excess of net investment income | | $ | (771,685 | ) | | $ | (47,495 | ) |
| | | | | | | | |
See accompanying notes, which are an integral part of the financial statements.
27
Financial highlights
Delaware High-Yield Opportunities Fund Class A
Selected data for each share of the Fund outstanding throughout each period were as follows:
|
Net asset value, beginning of period |
|
Income (loss) from investment operations: |
Net investment income1 |
Net realized and unrealized gain (loss) |
Total from investment operations |
|
Less dividends and distributions from: |
Net investment income |
Net realized gain |
Total dividends and distributions |
|
Net asset value, end of period |
|
Total return2 |
|
Ratios and supplemental data: |
Net assets, end of period (000 omitted) |
Ratio of expenses to average net assets |
Ratio of expenses to average net assets prior to fees waived |
Ratio of net investment income to average net assets |
Ratio of net investment income to average net assets prior to fees waived |
Portfolio turnover |
| 1 | The average shares outstanding have been applied for per share information. |
| 2 | Total investment return is based on the change in net asset value of a share during the period and assumes reinvestment of dividends and distributions at net asset value and does not reflect the impact of a sales charge. Total investment return during all of the periods shown reflects a waiver by the manager. Performance would have been lower had the waiver not been in effect. |
See accompanying notes, which are an integral part of the financial statements.
28
| | | | | | | | | | | | | | | | | | | | |
| | | | | |
| | | | | | | | | | | | | | | | | | | | |
| | | Year ended | |
| | | | |
| | | 7/31/15 | | | 7/31/14 | | | 7/31/13 | | | 7/31/12 | | | 7/31/11 | |
| |
| | $ | 4.380 | | | $ | 4.270 | | | $ | 4.110 | | | $ | 4.200 | | | $ | 3.980 | |
| | | | | |
| | | | | | | | | | | | | | | | | | | | |
| | | 0.238 | | | | 0.238 | | | | 0.271 | | | | 0.308 | | | | 0.315 | |
| | | (0.373 | ) | | | 0.121 | | | | 0.173 | | | | (0.090 | ) | | | 0.231 | |
| | | | | | | | | | | | | | | | | | | | |
| | | (0.135 | ) | | | 0.359 | | | | 0.444 | | | | 0.218 | | | | 0.546 | |
| | | | | | | | | | | | | | | | | | | | |
| | | | | |
| | | | | | | | | | | | | | | | | | | | |
| | | (0.237 | ) | | | (0.249 | ) | | | (0.284 | ) | | | (0.308 | ) | | | (0.326 | ) |
| | | (0.058 | ) | | | — | | | | — | | | | — | | | | — | |
| | | | | | | | | | | | | | | | | | | | |
| | | (0.295 | ) | | | (0.249 | ) | | | (0.284 | ) | | | (0.308 | ) | | | (0.326 | ) |
| | | | | | | | | | | | | | | | | | | | |
| | | | | |
| | $ | 3.950 | | | $ | 4.380 | | | $ | 4.270 | | | $ | 4.110 | | | $ | 4.200 | |
| | | | | | | | | | | | | | | | | | | | |
| | | | | |
| | | (3.15% | ) | | | 8.59% | | | | 11.02% | | | | 5.73% | | | | 14.11% | |
| | | | | |
| | | | | | | | | | | | | | | | | | | | |
| | $ | 238,290 | | | $ | 327,088 | | | $ | 328,534 | | | $ | 311,859 | | | $ | 306,304 | |
| | | 1.07% | | | | 1.07% | | | | 1.11% | | | | 1.11% | | | | 1.11% | |
| | | 1.14% | | | | 1.12% | | | | 1.16% | | | | 1.18% | | | | 1.20% | |
| | | 5.78% | | | | 5.46% | | | | 6.33% | | | | 7.71% | | | | 7.60% | |
| | | 5.71% | | | | 5.41% | | | | 6.28% | | | | 7.64% | | | | 7.51% | |
| | | 86% | | | | 105% | | | | 88% | | | | 61% | | | | 115% | |
| |
29
Financial highlights
Delaware High-Yield Opportunities Fund Class C
Selected data for each share of the Fund outstanding throughout each period were as follows:
|
Net asset value, beginning of period |
|
Income (loss) from investment operations: |
Net investment income1 |
Net realized and unrealized gain (loss) |
|
Total from investment operations |
|
|
Less dividends and distributions from: |
Net investment income |
Net realized gain |
|
Total dividends and distributions |
|
|
Net asset value, end of period |
|
|
Total return2 |
|
Ratios and supplemental data: |
Net assets, end of period (000 omitted) |
Ratio of expenses to average net assets |
Ratio of expenses to average net assets prior to fees waived |
Ratio of net investment income to average net assets |
Ratio of net investment income to average net assets prior to fees waived |
Portfolio turnover |
| 1 | The average shares outstanding have been applied for per share information. |
| 2 | Total investment return is based on the change in net asset value of a share during the period and assumes reinvestment of dividends and distributions at net asset value and does not reflect the impact of a sales charge. Total investment return during all of the periods shown reflects a waiver by the manager. Performance would have been lower had the waiver not been in effect. |
See accompanying notes, which are an integral part of the financial statements.
30
| | | | | | | | | | | | | | | | | | | | |
| | | Year ended | |
| | | | |
| | | 7/31/15 | | | 7/31/14 | | | 7/31/13 | | | 7/31/12 | | | 7/31/11 | |
| |
| | | | | |
| | $ | 4.390 | | | $ | 4.280 | | | $ | 4.120 | | | $ | 4.200 | | | $ | 3.990 | |
| | | | | |
| | | | | | | | | | | | | | | | | | | | |
| | | 0.207 | | | | 0.206 | | | | 0.241 | | | | 0.280 | | | | 0.287 | |
| | | (0.373 | ) | | | 0.121 | | | | 0.173 | | | | (0.080 | ) | | | 0.221 | |
| | | | | | | | | | | | | | | | | | | | |
| | | (0.166 | ) | | | 0.327 | | | | 0.414 | | | | 0.200 | | | | 0.508 | |
| | | | | | | | | | | | | | | | | | | | |
| | | | | |
| | | | | | | | | | | | | | | | | | | | |
| | | (0.206 | ) | | | (0.217 | ) | | | (0.254 | ) | | | (0.280 | ) | | | (0.298 | ) |
| | | (0.058 | ) | | | — | | | | — | | | | — | | | | — | |
| | | | | | | | | | | | | | | | | | | | |
| | | (0.264 | ) | | | (0.217 | ) | | | (0.254 | ) | | | (0.280 | ) | | | (0.298 | ) |
| | | | | | | | | | | | | | | | | | | | |
| | | | | |
| | $ | 3.960 | | | $ | 4.390 | | | $ | 4.280 | | | $ | 4.120 | | | $ | 4.200 | |
| | | | | | | | | | | | | | | | | | | | |
| | | | | |
| | | (3.85% | ) | | | 7.79% | | | | 10.23% | | | | 5.24% | | | | 13.04% | |
| | | | | |
| | | | | | | | | | | | | | | | | | | | |
| | $ | 66,354 | | | $ | 89,127 | | | $ | 85,574 | | | $ | 65,771 | | | $ | 53,151 | |
| | | 1.82% | | | | 1.81% | | | | 1.81% | | | | 1.81% | | | | 1.81% | |
| | | 1.89% | | | | 1.86% | | | | 1.86% | | | | 1.88% | | | | 1.90% | |
| | | 5.03% | | | | 4.72% | | | | 5.63% | | | | 7.01% | | | | 6.90% | |
| | | 4.96% | | | | 4.67% | | | | 5.58% | | | | 6.94% | | | | 6.81% | |
| | | 86% | | | | 105% | | | | 88% | | | | 61% | | | | 115% | |
| |
31
Financial highlights
Delaware High-Yield Opportunities Fund Class R
Selected data for each share of the Fund outstanding throughout each period were as follows:
|
Net asset value, beginning of period |
|
Income (loss) from investment operations: |
Net investment income1 |
Net realized and unrealized gain (loss) |
|
Total from investment operations |
|
|
Less dividends and distributions from: |
Net investment income |
Net realized gain |
|
Total dividends and distributions |
|
|
Net asset value, end of period |
|
|
Total return2 |
|
Ratios and supplemental data: |
Net assets, end of period (000 omitted) |
Ratio of expenses to average net assets |
Ratio of expenses to average net assets prior to fees waived |
Ratio of net investment income to average net assets |
Ratio of net investment income to average net assets prior to fees waived |
Portfolio turnover |
| 1 | The average shares outstanding have been applied for per share information. |
| 2 | Total investment return is based on the change in net asset value of a share during the period and assumes reinvestment of dividends and distributions at net asset value. Total investment return during all of the periods shown reflects waivers by the manager and/or distributor. Performance would have been lower had the waivers not been in effect. |
See accompanying notes, which are an integral part of the financial statements.
32
| | | | | | | | | | | | | | | | | | | | |
| | | | | | | | | Year ended | | | | | | | |
| | | | |
| | | 7/31/15 | | | 7/31/14 | | | 7/31/13 | | | 7/31/12 | | | 7/31/11 | |
| |
| | | | | |
| | $ | 4.390 | | | $ | 4.290 | | | $ | 4.120 | | | $ | 4.210 | | | $ | 3.990 | |
| | | | | |
| | | | | | | | | | | | | | | | | | | | |
| | | 0.229 | | | | 0.228 | | | | 0.263 | | | | 0.301 | | | | 0.308 | |
| | | (0.363 | ) | | | 0.111 | | | | 0.183 | | | | (0.090 | ) | | | 0.231 | |
| | | | | | | | | | | | | | | | | | | | |
| | | (0.134 | ) | | | 0.339 | | | | 0.446 | | | | 0.211 | | | | 0.539 | |
| | | | | | | | | | | | | | | | | | | | |
| | | | | |
| | | | | | | | | | | | | | | | | | | | |
| | | (0.228 | ) | | | (0.239 | ) | | | (0.276 | ) | | | (0.301 | ) | | | (0.319 | ) |
| | | (0.058 | ) | | | — | | | | — | | | | — | | | | — | |
| | | | | | | | | | | | | | | | | | | | |
| | | (0.286 | ) | | | (0.239 | ) | | | (0.276 | ) | | | (0.301 | ) | | | (0.319 | ) |
| | | | | | | | | | | | | | | | | | | | |
| | | | | |
| | $ | 3.970 | | | $ | 4.390 | | | $ | 4.290 | | | $ | 4.120 | | | $ | 4.210 | |
| | | | | | | | | | | | | | | | | | | | |
| | | | | |
| | | (3.13% | ) | | | 8.08% | | | | 11.05% | | | | 5.51% | | | | 13.87% | |
| | | | | |
| | | | | | | | | | | | | | | | | | | | |
| | $ | 13,032 | | | $ | 16,580 | | | $ | 16,506 | | | $ | 14,637 | | | $ | 19,046 | |
| | | 1.32% | | | | 1.31% | | | | 1.31% | | | | 1.31% | | | | 1.31% | |
| | | 1.39% | | | | 1.38% | | | | 1.46% | | | | 1.48% | | | | 1.50% | |
| | | 5.53% | | | | 5.22% | | | | 6.13% | | | | 7.51% | | | | 7.40% | |
| | | 5.46% | | | | 5.15% | | | | 5.98% | | | | 7.34% | | | | 7.21% | |
| | | 86% | | | | 105% | | | | 88% | | | | 61% | | | | 115% | |
| |
33
Financial highlights
Delaware High-Yield Opportunities Fund Institutional Class
Selected data for each share of the Fund outstanding throughout each period were as follows:
|
| |
Net asset value, beginning of period |
|
Income (loss) from investment operations: |
Net investment income1 |
Net realized and unrealized gain (loss) |
|
Total from investment operations |
|
|
Less dividends and distributions from: |
Net investment income |
Net realized gain |
|
Total dividends and distributions |
|
|
Net asset value, end of period |
|
|
Total return2 |
|
Ratios and supplemental data: |
Net assets, end of period (000 omitted) |
Ratio of expenses to average net assets |
Ratio of expenses to average net assets prior to fees waived |
Ratio of net investment income to average net assets |
Ratio of net investment income to average net assets prior to fees waived |
Portfolio turnover |
|
| 1 | The average shares outstanding have been applied for per share information. |
| 2 | Total investment return is based on the change in net asset value of a share during the period and assumes reinvestment of dividends and distributions at net asset value. Total investment return during all of the periods shown reflects a waiver by the manager. Performance would have been lower had the waiver not been in effect. |
See accompanying notes, which are an integral part of the financial statements.
34
| | | | | | | | | | | | | | | | | | | | |
| | | | | | | | | Year ended | | | | | | | |
| | | | |
| | | 7/31/15 | | | 7/31/14 | | | 7/31/13 | | | 7/31/12 | | | 7/31/11 | |
| |
| | | | | |
| | $ | 4.380 | | | $ | 4.270 | | | $ | 4.110 | | | $ | 4.200 | | | $ | 3.980 | |
| | | | | |
| | | | | | | | | | | | | | | | | | | | |
| | | 0.249 | | | | 0.249 | | | | 0.284 | | | | 0.320 | | | | 0.328 | |
| | | (0.373 | ) | | | 0.121 | | | | 0.173 | | | | (0.090 | ) | | | 0.231 | |
| | | | | | | | | | | | | | | | | | | | |
| | | (0.124 | ) | | | 0.370 | | | | 0.457 | | | | 0.230 | | | | 0.559 | |
| | | | | | | | | | | | | | | | | | | | |
| | | | | |
| | | | | | | | | | | | | | | | | | | | |
| | | (0.248 | ) | | | (0.260 | ) | | | (0.297 | ) | | | (0.320 | ) | | | (0.339 | ) |
| | | (0.058 | ) | | | — | | | | — | | | | — | | | | — | |
| | | | | | | | | | | | | | | | | | | | |
| | | (0.306 | ) | | | (0.260 | ) | | | (0.297 | ) | | | (0.320 | ) | | | (0.339 | ) |
| | | | | | | | | | | | | | | | | | | | |
| | | | | |
| | $ | 3.950 | | | $ | 4.380 | | | $ | 4.270 | | | $ | 4.110 | | | $ | 4.200 | |
| | | | | | | | | | | | | | | | | | | | |
| | | | | |
| | | (2.91% | ) | | | 8.87% | | | | 11.34% | | | | 6.03% | | | | 14.45% | |
| | | | | |
| | | | | | | | | | | | | | | | | | | | |
| | $ | 147,069 | | | $ | 232,971 | | | $ | 200,282 | | | $ | 185,843 | | | $ | 122,855 | |
| | | 0.82% | | | | 0.81% | | | | 0.81% | | | | 0.81% | | | | 0.81% | |
| | | 0.89% | | | | 0.86% | | | | 0.86% | | | | 0.88% | | | | 0.90% | |
| | | 6.03% | | | | 5.72% | | | | 6.63% | | | | 8.01% | | | | 7.90% | |
| | | 5.96% | | | | 5.67% | | | | 6.58% | | | | 7.94% | | | | 7.81% | |
| | | 86% | | | | 105% | | | | 88% | | | | 61% | | | | 115% | |
| |
35
| | |
| Notes to financial statements | | |
| Delaware High-Yield Opportunities Fund | | July 31, 2015 |
Delaware Group® Income Funds (Trust) is organized as a Delaware statutory trust and offers four series: Delaware Corporate Bond Fund, Delaware Diversified Floating Rate Fund, Delaware Extended Duration Bond Fund, and Delaware High-Yield Opportunities Fund. These financial statements and the related notes pertain to Delaware High-Yield Opportunities Fund (Fund). The Trust is an open-end investment company. The Fund is considered diversified under the Investment Company Act of 1940, as amended, and offers Class A, Class C, Class R, and Institutional Class shares. Class A shares are sold with a maximum front-end sales charge of 4.50%. Class A share purchases of $1,000,000 or more will incur a contingent deferred sales charge (CDSC) of 1.00% if redeemed during the first year, and 0.50% during the second year, provided that Delaware Distributors, L.P. (DDLP) paid a financial advisor a commission on the purchase of those shares. Effective Sept. 25, 2014, all remaining shares of Class B were converted to Class A shares. Between June 1, 2007 and Sept. 25, 2014, Class B shares could be purchased only through dividend reinvestment and certain permitted exchanges. Class B shares automatically converted to Class A shares on a quarterly basis approximately eight years after purchase. Class C shares are sold with a CDSC of 1.00%, if redeemed during the first 12 months. Class R and Institutional Class shares are not subject to a sales charge and are offered for sale exclusively to certain eligible investors.
The investment objective of the Fund is to seek total return and, as a secondary objective, high current income.
1. Significant Accounting Policies
The following accounting policies are in accordance with U.S. generally accepted accounting principles (U.S. GAAP) and are consistently followed by the Fund.
Security Valuation — Equity securities, except those traded on The Nasdaq Stock Market LLC (Nasdaq), are valued at the last quoted sales price as of the time of the regular close of the New York Stock Exchange on the valuation date. Securities traded on the Nasdaq are valued in accordance with the Nasdaq Official Closing Price, which may not be the last sales price. If, on a particular day, an equity security does not trade, the mean between the bid and ask prices will be used, which approximates fair value. Debt securities and credit default swap (CDS) contracts are valued based upon valuations provided by an independent pricing service or broker/counterparty and reviewed by management. To the extent current market prices are not available, the pricing service may take into account developments related to the specific security, as well as transactions in comparable securities. U.S. government and agency securities are valued at the mean between the bid and ask prices, which approximates fair value. Valuations for fixed income securities utilize matrix systems, which reflect such factors as security prices, yields, maturities, and ratings, and are supplemented by dealer and exchange quotations. Swap prices are derived using daily swap curves and models that incorporate a number of market data factors, such as discounted cash flows, trades, and values of the underlying reference instruments. Futures contracts are valued at the daily quoted settlement prices. Generally, other securities and assets for which market quotations are not readily available are valued at fair value as determined in good faith under the direction of the Fund’s Board of Trustees (Board). In determining whether market quotations are readily available or fair valuation will be used, various factors will be taken into consideration, such as market closures or suspension of trading in a security.
36
Federal Income Taxes — No provision for federal income taxes has been made as the Fund intends to continue to qualify for federal income tax purposes as a regulated investment company under Subchapter M of the Internal Revenue Code of 1986, as amended, and make the requisite distributions to shareholders. The Fund evaluates tax positions taken or expected to be taken in the course of preparing the Fund’s tax returns to determine whether the tax positions are “more-likely-than-not” of being sustained by the applicable tax authority. Tax positions not deemed to meet the “more-likely-than-not” threshold are recorded as a tax benefit or expense in the current year. Management has analyzed the Fund’s tax positions taken for all open federal income tax years (July 31, 2012–July 31, 2015), and has concluded that no provision for federal income tax is required in the Fund’s financial statements.
Class Accounting — Investment income and common expenses are allocated to the various classes of the Fund on the basis of “settled shares” of each class in relation to the net assets of the Fund. Realized and unrealized gain (loss) on investments are allocated to the various classes of the Fund on the basis of daily net assets of each class. Distribution expenses relating to a specific class are charged directly to that class.
Repurchase Agreements — The Fund may purchase certain U.S. government securities subject to the counterparty’s agreement to repurchase them at an agreed upon date and price. The counterparty will be required on a daily basis to maintain the value of the collateral subject to the agreement at not less than the repurchase price (including accrued interest). The agreements are conditioned upon the collateral being deposited under the Federal Reserve book-entry system with the Fund’s custodian or a third party sub-custodian. In the event of default or bankruptcy by the other party to the agreement, retention of the collateral may be subject to legal proceedings. All open repurchase agreements as of the date of this report were entered into on July 31, 2015.
Foreign Currency Transactions — Transactions denominated in foreign currencies are recorded at the prevailing exchange rates on the valuation date in accordance with the Fund’s prospectus. The value of all assets and liabilities denominated in foreign currencies is translated daily into U.S. dollars at the exchange rate of such currencies against the U.S. dollar. Transaction gains or losses resulting from changes in exchange rates during the reporting period or upon settlement of the foreign currency transaction are reported in operations for the current period. The Fund generally bifurcates that portion of realized gains and losses on investments in debt securities which is due to changes in foreign exchange rates from that which is due to changes in market prices of debt securities. That portion of gains (losses) which are due to changes in foreign exchange rates is included on the “Statement of operations” under “Net realized gain (loss) on foreign currencies.” The Fund reports certain foreign currency related transactions as components of realized gains (losses) for financial reporting purposes, whereas such components are treated as ordinary income (loss) for federal income tax purposes.
Use of Estimates — The Fund is an investment company, whose financial statements are prepared in conformity with U.S. GAAP. Therefore, the Fund follows the accounting and reporting guidelines for investment companies. The preparation of financial statements in conformity with U.S. GAAP requires management to make estimates and assumptions that affect the fair value of investments, the reported amounts of assets and liabilities and disclosure of contingent assets and liabilities at the date of the financial statements, and the reported amounts of revenues and expenses during the reporting period. Actual results could differ from those estimates and the differences could be material.
37
Notes to financial statements
Delaware High-Yield Opportunities Fund
1. Significant Accounting Policies (continued)
Other — Expenses directly attributable to the Fund are charged directly to the Fund. Other expenses common to various funds within the Delaware Investments® Family of Funds are generally allocated among such funds on the basis of average net assets. Management fees and some other expenses are paid monthly. Security transactions are recorded on the date the securities are purchased or sold (trade date) for financial reporting purposes. Costs used in calculating realized gains and losses on the sale of investment securities are those of the specific securities sold. Dividend income is recorded on the ex-dividend date and interest income is recorded on the accrual basis. Discounts and premiums on debt securities are accreted or amortized to interest income, respectively, over the lives of the respective securities using the effective interest method. The Fund declares dividends daily from net investment income and pays the dividends monthly and declares and pays distributions from net realized gain on investments, if any, annually. The Fund may distribute more frequently, if necessary for tax purposes. Dividends and distributions, if any, are recorded on the ex-dividend date.
The Fund may receive earnings credits from its custodian when positive cash balances are maintained, which may be used to offset custody fees. There were no earnings credits for the year ended July 31, 2015.
The Fund receives earnings credits from its transfer agent when positive cash balances are maintained, which may be used to offset transfer agent fees. If the amount earned is greater than one dollar, the expense paid under this arrangement is included on the “Statement of operations” under “Dividend disbursing and transfer agent fees and expenses” and with the corresponding expense offset shown under “Less expense paid indirectly.” For the year ended July 31, 2015, the Fund earned $331 under this agreement.
2. Investment Management, Administration Agreements, and Other Transactions with Affiliates
In accordance with the terms of its investment management agreement, the Fund pays Delaware Management Company (DMC), a series of Delaware Management Business Trust and the investment manager, an annual fee which is calculated daily at the rate of 0.65% on the first $500 million of average daily net assets of the Fund, 0.60% on the next $500 million, 0.55% on the next $1.5 billion, and 0.50% on average daily net assets in excess of $2.5 billion.
DMC has contractually agreed to waive that portion, if any, of its management fee and/or pay/reimburse the Fund to the extent necessary to ensure total annual operating expenses (excluding any 12b-1 fees, acquired fund fees and expenses, taxes, interest, short sale and dividend interest expenses, brokerage fees, certain insurance costs, and nonroutine expenses or costs, including, but not limited to, those relating to reorganizations, litigation, conducting shareholder meetings, and liquidations (collectively, nonroutine expenses)), from exceeding 0.80% of the Fund’s average daily net assets from Nov. 28, 2014 through July 31, 2015.* Prior to Nov. 28, 2014, DMC had contractually agreed to waive 0.81% of average daily net assets of the Fund. These waivers and reimbursements apply only to the expenses paid directly by the Fund and may only be terminated by agreement of DMC and the Fund.
Effective Nov. 1, 2014, Delaware Investments Fund Services Company (DIFSC), an affiliate of DMC, provides fund accounting and financial administration oversight services to the Fund. Prior to this time, Delaware Service Company, Inc. (DSC), an affiliate of DMC, provided fund accounting and financial
38
administration oversight services to the Fund under a substantially identical agreement with an identical fee schedule. For these services, DIFSC’s fees are calculated based on the aggregate daily net assets of the Delaware Investments® Family of Funds at the following annual rate: 0.0050% of the first $30 billion; 0.0045% of the next $10 billion; 0.0040% of the next $10 billion; and 0.0025% of aggregate average daily net assets in excess of $50 billion. The fees payable to DIFSC under the service agreement described above are allocated among all funds in the Delaware Investments Family of Funds on a relative net asset value basis. For the year ended July 31, 2015, the Fund was charged $28,159 for these services. This amount is included on the “Statement of operations” under “Accounting and administration expenses.”
Effective Nov. 1, 2014, DIFSC also became the transfer agent and dividend disbursing agent of the Fund. Prior to this time, DSC was the transfer agent and dividend disbursing agent of the Fund under a substantially identical agreement with an identical fee schedule. For these services, DIFSC’s fees are calculated based on the aggregate daily net assets of the retail funds within the Delaware Investments Family of Funds at the following annual rate: 0.025% of the first $20 billion; 0.020% of the next $5 billion; 0.015% of the next $5 billion; and 0.013% of average daily net assets in excess of $30 billion. The fees payable to DIFSC under the service agreement described above are allocated among all retail Funds in the Delaware Investments Family of Funds on a relative net asset value basis. For the year ended July 31, 2015, the Fund was charged $124,008 for these services. This amount is included on the “Statement of operations” under “Dividend disbursing and transfer agent fees and expenses.” Pursuant to a sub-transfer agency agreement between DIFSC and BNY Mellon Investment Servicing (US) Inc. (BNYMIS), BNYMIS provides certain sub-transfer agency services to the Fund. Sub-transfer agency fees are passed on to and paid by the Fund.
Pursuant to a distribution agreement and distribution plan, the Fund pays DDLP, the distributor and an affiliate of DMC, an annual distribution and service fee of 0.25% of the average daily net assets of the Class A shares, 1.00% of the average daily net assets of the Class C shares and 0.50% of the average daily net assets of the Class R shares. The Fund’s Class B shares were subject to a 12b-1 fee of 1.00% of the average daily net assets, which was contractually waived to 0.25% of the average daily net assets from Aug. 1, 2014 through Sept 25, 2014. The Board has adopted a formula for calculating 12b-1 fees for the Fund’s Class A shares that went into effect on June 1, 1992. The Fund’s Class A shares are currently subject to a blended 12b-1 fees equal to the sum of: (i) 0.10% of the average daily net assets representing shares that were acquired prior to June 1, 1992, and (ii) 0.25% of the average daily net assets representing shares that were acquired on or after June 1, 1992. All Class A shareholders currently bear 12b-1 fees at the same rate, the blended rate based upon the formula described above. This method of calculating Class A 12b-1 fees may be discontinued at the sole discretion of the Board. Institutional Class shares pay no distribution and service fees.
As provided in the investment management agreement, the Fund bears a portion of the cost of certain resources shared with DMC, including the cost of internal personnel of DMC and/or its affiliates that provide legal, tax, and regulatory reporting services to the Fund. For the year ended July 31, 2015, the Fund was charged $16,194 for internal legal, tax, and regulatory services provided by DMC and/or its affiliates’ employees. This amount is included on the “Statement of operations” under “Legal fees.”
39
Notes to financial statements
Delaware High-Yield Opportunities Fund
2. Investment Management, Administration Agreements, and Other Transactions with Affiliates (continued)
For the year ended July 31, 2015, DDLP earned $23,027 for commissions on sales of the Fund’s Class A shares. For the year ended July 31, 2015, DDLP received gross CDSC commissions of $838 on redemptions of the Fund’s Class C shares, and these commissions were entirely used to offset upfront commissions previously paid by DDLP to broker/dealers on sales of those shares.
Trustees’ fees include expenses accrued by the Fund for each Trustee’s retainer and meeting fees. Certain officers of DMC, DIFSC, and DDLP are officers and/or Trustees of the Trust. These officers and Trustees are paid no compensation by the Fund.
* The contractual waiver period is from Nov. 28, 2014, through Nov. 30, 2015.
3. Investments
For the year ended July 31, 2015, the Fund made purchases and sales of investment securities other than short-term investments as follows:
| | | | |
Purchases | | $ | 490,311,877 | |
Sales | | | 627,550,392 | |
At July 31, 2015, the cost and unrealized appreciation (depreciation) of investments for federal income tax purposes for the Fund were as follows:
| | | | |
Cost of investments | | $ | 472,031,234 | |
| | | | |
Aggregate unrealized appreciation of investments | | $ | 5,149,181 | |
Aggregate unrealized depreciation of investments | | | (20,752,349 | ) |
| | | | |
Net unrealized depreciation of investments | | $ | (15,603,168 | ) |
| | | | |
U.S. GAAP defines fair value as the price that the Fund would receive to sell an asset or pay to transfer a liability in an orderly transaction between market participants at the measurement date under current market conditions. A three-level hierarchy for fair value measurements has been established based upon the transparency of inputs to the valuation of an asset or liability. Inputs may be observable or unobservable and refer broadly to the assumptions that market participants would use in pricing the asset or liability. Observable inputs reflect the assumptions market participants would use in pricing the asset or liability based on market data obtained from sources independent of the reporting entity. Unobservable inputs reflect the reporting entity’s own assumptions about the assumptions that market participants would use in pricing the asset or liability based on the best information available under the circumstances. The Fund’s investment in its entirety is assigned a level based upon the observability of the inputs which are significant to the overall valuation. The three-level hierarchy of inputs is summarized below.
| | | | |
| Level 1 | | – | | Inputs are quoted prices in active markets for identical investments. (Examples: equity securities, open-end investment companies, futures contracts, exchange-traded options contracts) |
| | |
| Level 2 | | – | | Other observable inputs, including, but not limited to: quoted prices for similar assets or liabilities in markets that are active, quoted prices for identical or similar assets or liabilities in |
40
| | | | |
| | | | markets that are not active, inputs other than quoted prices that are observable for the assets or liabilities (such as interest rates, yield curves, volatilities, prepayment speeds, loss severities, credit risks, and default rates), or other market-corroborated inputs. (Examples: debt securities, government securities, swap contracts, foreign currency exchange contracts, foreign securities utilizing international fair value pricing, broker-quoted securities, fair valued securities) |
| | |
| Level 3 | | – | | Significant unobservable inputs, including the Fund’s own assumptions used to determine the fair value of investments. (Examples: broker-quoted securities, fair valued securities) |
Level 3 investments are valued using significant unobservable inputs. The Fund may also use an income-based valuation approach in which the anticipated future cash flows of the investment are discounted to calculate fair value. Discounts may also be applied due to the nature or duration of any restrictions on the disposition of the investments. Valuations may also be based upon current market prices of securities that are comparable in coupon, rating, maturity, and industry. The derived value of a Level 3 investment may not represent the value which is received upon disposition and this could impact the results of operations.
The following table summarizes the valuation of the Fund’s investments by fair value hierarchy levels as of July 31, 2015:
| | | | | | | | | | | | | | | | |
Securities | | Level 1 | | | Level 2 | | | Level 3 | | | Total | |
Corporate Debt | | $ | — | | | $ | 412,456,691 | | | $ | — | | | $ | 412,456,691 | |
Senior Secured Loans | | | — | | | | 26,139,528 | | | | 1,127,813 | | | | 27,267,341 | |
Municipal Bond | | | — | | | | 755,919 | | | | — | | | | 755,919 | |
Common Stock | | | — | | | | — | | | | — | | | | — | |
Preferred Stock1 | | | 1,914,790 | | | | 6,074,325 | | | | — | | | | 7,989,115 | |
Short-Term Investments | | | — | | | | 7,959,000 | | | | — | | | | 7,959,000 | |
| | | | | | | | | | | | | | | | |
Total Value of Securities | | $ | 1,914,790 | | | $ | 453,385,463 | | | $ | 1,127,813 | | | $ | 456,428,066 | |
| | | | | | | | | | | | | | | | |
The security that has been deemed worthless on the “Schedule of investments” is considered to be Level 3 investments in the table.
1Security type is valued across multiple levels. Level 1 investments represent exchange-traded investments, and Level 2 investments represent investments with observable input or matrix-priced investments. The amounts attributed to Level 1 investments, and Level 2 investments represent the following percentages of the total market value of these security types:
| | | | | | | | | | | | | | | | | | | | | | |
| | | Level 1 | | | | | Level 2 | | | | | Level 3 | | | | | Total | |
Senior Secured Loans | | | — | | | | | | 95.86 | % | | | | | 4.14 | % | | | | | 100.00 | % |
Preferred Stock | | | 23.97 | % | | | | | 76.03 | % | | | | | — | | | | | | 100.00 | % |
During the year ended July 31, 2015, there were no transfers between Level 1 investments, Level 2 investments, or Level 3 investments that had a significant impact to the Fund. The Fund’s policy is to recognize transfers between levels at the beginning of the reporting period.
A reconciliation of Level 3 investments is presented when the Fund has a significant amount of Level 3 investments at the beginning, interim, or end of the period in relation to net assets. Management
41
Notes to financial statements
Delaware High-Yield Opportunities Fund
3. Investments (continued)
has determined not to provide additional disclosure on Level 3 inputs since the Level 3 investments are not considered significant to the Fund’s net assets at the end of the year.
4. Dividend and Distribution Information
Income and long-term capital gain distributions are determined in accordance with federal income tax regulations, which may differ from U.S. GAAP. Additionally, distributions from net gains on foreign currency transactions and net short-term gains on sales of investment securities are treated as ordinary income for federal income tax purposes. The tax character of dividends and distributions paid during the years ended July 31, 2015 and 2014 was as follows:
| | | | | | | | | | |
| | | Year ended | |
| | | 7/31/15 | | | | | 7/31/14 | |
Ordinary income | | $ | 42,713,627 | | | | | $ | 38,058,834 | |
Long-term capital gains | | | 110,336 | | | | | | — | |
| | | | | | | | | | |
Total | | $ | 42,823,963 | | | | | $ | 38,058,834 | |
| | | | | | | | | | |
5. Components of Net Assets on a Tax Basis
As of July 31, 2015, the components of net assets on a tax basis were as follows:
| | | | |
Shares of beneficial interest | | $ | 514,648,789 | |
Distribution payable | | | (748,033 | ) |
Capital loss carryforwards | | | (12,611,587 | ) |
Qualified late year loss deferrals | | | (19,104,565 | ) |
Other temporary differences | | | (1,836,309 | ) |
Unrealized depreciation of investments and foreign currencies | | | (15,603,162 | ) |
| | | | |
Net assets | | $ | 464,745,133 | |
| | | | |
The differences between book basis and tax basis components of net assets are primarily attributable to tax deferral of losses on wash sales, tax treatment of trust preferred securities, and market discount and premium on debt instruments and troubled debt.
Qualified late year capital losses (including currency and specified gain/loss items) represent losses realized from Nov. 1, 2014 through July 31, 2015, that in accordance with federal income tax regulations, the Fund has elected to defer and treat as having arisen in the following fiscal year.
For financial reporting purposes, capital accounts are adjusted to reflect the tax character of permanent book/tax differences. Reclassifications are primarily due to tax treatment of market discount and premium on debt instruments, redesignation of dividends and distributions, CDS contracts, and gain (loss) on foreign currency transactions. Results of operations and net assets were not affected by these reclassifications. For the year ended July 31, 2015, the Fund recorded the following reclassifications:
| | | | |
Distributions in excess of net investment income | | $ | (893,813 | ) |
Accumulated net realized loss | | | 8,975,566 | |
Paid-in capital | | | (8,081,753 | ) |
42
For federal income tax purposes, capital loss carryforwards may be carried forward and applied against future capital gains. $110,336 was utilized in 2015. All capital loss carryforwards remaining at July 31, 2015 will expire in 2017.
On Dec. 22, 2010, the Regulated Investment Company Modernization Act of 2010 (Act) was enacted, which changed various technical rules governing the tax treatment of regulated investment companies. The changes were generally effective for taxable years beginning after the date of enactment. Under the Act, the Fund is permitted to carry forward capital losses incurred in taxable years beginning after the date of enactment for an unlimited period. However, any losses incurred during those future taxable years will be required to be utilized prior to the losses incurred in pre-enactment taxable years, which carry an expiration date. As a result of this ordering rule, pre-enactment capital loss carryforwards may be more likely to expire unused. Additionally, post-enactment capital loss carryforwards will retain their character as either short-term or long-term capital losses rather than being considered all short-term as permitted under previous regulation. As of July 31, 2015, there were no capital loss carryforwards incurred that will be carried forward under the Act.
6. Capital Shares
Transactions in capital shares were as follows:
| | | | | | | | | | |
| | | Year ended | |
| | | 7/31/15 | | | | | 7/31/14 | |
Shares sold: | | | | | | | | | | |
Class A | | | 11,660,844 | | | | | | 14,869,852 | |
Class B | | | — | | | | | | 33,151 | |
Class C | | | 1,220,719 | | | | | | 4,409,653 | |
Class R | | | 996,496 | | | | | | 1,918,422 | |
Institutional Class | | | 17,318,634 | | | | | | 27,875,764 | |
| | | |
Shares issued upon reinvestment of dividends and distributions: | | | | | | | | | | |
Class A | | | 4,300,182 | | | | | | 3,872,568 | |
Class B | | | 2,400 | | | | | | 23,306 | |
Class C | | | 1,092,070 | | | | | | 894,654 | |
Class R | | | 240,345 | | | | | | 215,954 | |
Institutional Class | | | 3,867,146 | | | | | | 2,855,148 | |
| | | | | | | | | | |
| | | 40,698,836 | | | | | | 56,968,472 | |
| | | | | | | | | | |
| | | |
Shares redeemed: | | | | | | | | | | |
Class A | | | (30,363,748 | ) | | | | | (20,954,399 | ) |
Class B | | | (307,835 | ) | | | | | (422,589 | ) |
Class C | | | (5,872,858 | ) | | | | | (4,983,086 | ) |
Class R | | | (1,724,216 | ) | | | | | (2,212,101 | ) |
Institutional Class | | | (37,177,221 | ) | | | | | (24,406,146 | ) |
| | | | | | | | | | |
| | | (75,445,878 | ) | | | | | (52,978,321 | ) |
| | | | | | | | | | |
Net increase (decrease) | | | (34,747,042 | ) | | | | | 3,990,151 | |
| | | | | | | | | | |
43
Notes to financial statements
Delaware High-Yield Opportunities Fund
6. Capital Shares (continued)
For the years ended July 31, 2015 and 2014, 72,252 Class B shares were converted to 72,109 Class A shares valued at $311,512 and 124,981 Class B shares were converted to 125,186 Class A shares valued at $546,648, respectively. The respective amounts are included in Class B redemptions and Class A subscriptions in the table on the previous page and the “Statements of changes in net assets.”
Certain shareholders of Class A shares may exchange their shares for Institutional Class shares. For the year ended Aug. 1, 2014 to July 31, 2015, 3,409 Class A shares were exchanged to 3,413 Institutional Class shares valued at $13,890. These exchange transactions are included as subscriptions and redemptions in the tables on the previous page and the “Statements of changes in net assets.”
7. Line of Credit
The Fund, along with certain other funds in the Delaware Investments® Family of Funds (Participants), was a participant in a $225,000,000 revolving line of credit intended to be used for temporary or emergency purposes as an additional source of liquidity to fund redemptions of investor shares. Under the agreement, the Participants were charged an annual commitment fee of 0.08%, which was allocated across the Participants on the basis of each Participant’s allocation of the entire facility. The Participants were permitted to borrow up to a maximum of one third of their net assets under the agreement. Each Participant was individually, and not jointly, liable for its particular advances, if any, under the line of credit. The line of credit under the agreement expired on Nov. 10, 2014.
On Nov. 10, 2014, the Fund, along with the other Participants, entered into an amendment to the agreement for a $275,000,000 revolving line of credit. The line of credit is to be used as described above and operates in substantially the same manner as the agreement described above. The line of credit available under the agreement expires on Nov. 9, 2015.
The Fund had no amounts outstanding as of July 31, 2015 or at any time during the year then ended.
8. Derivatives
U.S. GAAP requires disclosures that enable investors to understand: (1) how and why an entity uses derivatives; (2) how they are accounted for; and (3) how they affect an entity’s results of operations and financial position.
Foreign Currency Exchange Contracts – The Fund may enter into foreign currency exchange contracts and foreign cross currency exchange contracts as a way of managing foreign exchange rate risk. The Fund may enter into these contracts to fix the U.S. dollar value of securities that it agreed to buy or sell for the period between the date the trade was entered into and the date the security is delivered and paid for. The Fund may also use these contracts to hedge the U.S. dollar value of securities it already owns that are denominated in foreign currencies. In addition, the Fund may enter into these contracts to facilitate or expedite the settlement of portfolio transactions. The change in value is recorded as an unrealized gain or loss. When the contract is closed, a realized gain or loss is recorded equal to the difference between the value of the contract at the time it was opened and the value at the time it was closed.
44
The use of foreign currency exchange contracts and foreign cross currency exchange contracts does not eliminate fluctuations in the underlying prices of the securities, but does establish a rate of exchange that can be achieved in the future. Although foreign currency exchange contracts and foreign cross currency exchange contracts limit the risk of loss due to an unfavorable change in the value of the hedged currency, they also limit any potential gain that might result should the value of the currency change favorably. In addition, the Fund could be exposed to risks if the counterparties to the contracts are unable to meet the terms of their contracts. The Fund’s maximum risk of loss from counterparty credit risk is the value of its currency exchanged with the counterparty. The risk is generally mitigated by having a netting arrangement between the Fund and the counterparty and by the posting of collateral by the counterparty to the Fund to cover the Fund’s exposure to the counterparty. No foreign currency exchange contracts were outstanding at July 31, 2015.
During the year ended July 31, 2015, the Fund used foreign currency exchange contracts to facilitate or expedite the settlement of portfolio transactions.
Futures Contracts – A futures contract is an agreement in which the writer (or seller) of the contract agrees to deliver to the buyer an amount of cash or securities equal to a specific dollar amount times the difference between the value of a specific security or index at the close of the last trading day of the contract and the price at which the agreement is made. The Fund may use futures in the normal course of pursuing its investment objective. The Fund may invest in futures contracts to hedge its existing portfolio securities against fluctuations in fair value caused by changes in interest rates or market conditions. Upon entering into a futures contract, the Fund deposits cash or pledges U.S. government securities to a broker, equal to the minimum “initial margin” requirements of the exchange on which the contract is traded. Subsequent payments are received from the broker or paid to the broker each day, based on the daily fluctuation in the market value of the contract. These receipts or payments are known as “variation margin” and are recorded daily by the Fund as unrealized gains or losses until the contracts are closed. When the contracts are closed, the Fund records a realized gain or loss equal to the difference between the value of the contract at the time it was opened and the value at the time it was closed. Risks of entering into futures contracts include potential imperfect correlation between the futures contracts and the underlying securities and the possibility of an illiquid secondary market for these instruments. When investing in futures, there is reduced counterparty credit risk to the Fund because futures are exchange-traded and the exchange’s clearinghouse, as counterparty to all exchange-traded futures, guarantees against default. No futures contracts were outstanding at July 31, 2015.
During the year ended July 31, 2015, the Fund used futures contracts to hedge the Fund’s existing portfolio securities against fluctuations in value caused by changes in interest rates or market conditions.
Swap Contracts – The Fund may enter into CDS contracts in the normal course of pursuing its investment objectives. The Fund may enter into CDS contracts in order to hedge against credit events, to enhance total return, or to gain exposure to certain securities or markets. The Fund will not be permitted to enter into any swap transactions unless, at the time of entering into such transactions, the unsecured long-term debt of the actual counterparty, combined with any credit enhancements, is rated at least BBB- by Standard & Poor’s Financial Services LLC (S&P) or Baa3 by Moody’s Investors Service, Inc. (Moody’s) or is determined to be of equivalent credit quality by DMC.
45
Notes to financial statements
Delaware High-Yield Opportunities Fund
8. Derivatives (continued)
Credit Default Swaps. A CDS contract is a risk-transfer instrument through which one party (purchaser of protection) transfers to another party (seller of protection) the financial risk of a credit event (as defined in the CDS agreement), as it relates to a particular reference security or basket of securities (such as an index). In exchange for the protection offered by the seller of protection, the purchaser of protection agrees to pay the seller of protection a periodic amount at a stated rate that is applied to the notional amount of the CDS contract. In addition, an upfront payment may be made or received by the Fund in connection with an unwinding or assignment of a CDS contract. Upon the occurrence of a credit event, the seller of protection would pay the par (or other agreed-upon) value of the referenced security (or basket of securities) to the counterparty. Credit events generally include, among others, bankruptcy, failure to pay, and obligation default.
During the year ended July 31, 2015, the Fund entered into CDS contracts as a purchaser of protection. Periodic payments (receipts) on such contracts are accrued daily and recorded as unrealized losses (gains) on swap contracts. Upon payment (receipt), such amounts are recorded as realized losses (gains) on swap contracts. Upfront payments made or received in connection with CDS contracts are amortized over the expected life of the CDS contracts as unrealized losses (gains) on swap contracts. The change in value of CDS contracts is recorded daily as unrealized appreciation or depreciation. A realized gain or loss is recorded upon a credit event (as defined in the CDS agreement) or the maturity or termination of the agreement. Initial margin and variation margin are posted to central counterparties for CDS basket trades, as determined by the applicable central counterparty. During the year ended July 31, 2015, the Fund did not enter into any CDS contracts as a seller of protection.
CDS contracts may involve greater risks than if the Fund had invested in the referenced obligation directly. CDS contracts are subject to general market risk, liquidity risk, counterparty risk, and credit risk. The Fund’s maximum risk of loss from counterparty credit risk, either as the seller of protection or the buyer of protection, is the fair value of the contract. This risk is mitigated by (1) for bilateral swap contracts, having a netting arrangement between the Fund and the counterparty and by the posting of collateral by the counterparty to the Fund to cover the Fund’s exposure to the counterparty, or (2) for cleared swaps, trading these instruments through a central counterparty.
During the year ended July 31, 2015, the Fund used CDS contracts to hedge against credit events.
No CDS contracts were outstanding at July 31, 2015.
Swaps Generally. The value of open swaps may differ from that which would be realized in the event the Fund terminated its position in the contract on a given day. Risks of entering into these contracts include the potential inability of the counterparty to meet the terms of the contracts. This type of risk is generally limited to the amount of favorable movement in the value of the underlying security, instrument, or basket of instruments, if any, at the day of default. Risks also arise from potential losses from adverse market movements and such losses could exceed the unrealized amounts.
46
The effect of derivative instruments on the “Statement of operations” for the year ended July 31, 2015 was as follows:
| | | | | | | | | | | | | | | | | | | | |
| | | Net Realized Gain (Loss) on: |
| | | Foreign
Currency
Transactions | | Futures
Contracts | | Swap
Contracts | | Total |
| | | | |
Forward currency exchange contracts | | | $ | (12 | ) | | | $ | — | | | | $ | — | | | | $ | (12 | ) |
Interest rate contracts | | | | — | | | | | (220,643 | ) | | | | — | | | | | (220,643 | ) |
Credit contracts | | | | — | | | | | — | | | | | (913,380 | ) | | | | (913,380 | ) |
| | | | | | | | | | | | | | | | | | | | |
Total | | | $ | (12 | ) | | | $ | (220,643 | ) | | | $ | (913,380 | ) | | | $ | (1,134,035 | ) |
| | | | | | | | | | | | | | | | | | | | |
| | | | | |
| | | Net Change in Unrealized Appreciation (Depreciation) of Futures Contracts |
| |
Interest rate contracts | | $(159,523) |
Derivatives Generally. The table below summarizes the average balance of derivative holdings by the Fund during the year ended July 31, 2015.
| | | | | | | | |
| | | Long Derivatives Volume | | | Short Derivative Volume | |
| | |
Futures contracts (average notional value) | | USD | — | | | USD | 7,943,231 | |
CDS contracts (average notional value)* | | | 1,763,135 | | | | — | |
*Long represents buying protection and short represents selling protection.
9. Offsetting
In December 2011, the Financial Accounting Standards Board (FASB) issued guidance that expanded disclosure requirements on the offsetting of certain assets and liabilities. The disclosures are required for investments and derivative financial instruments subject to master netting or similar agreements which are eligible for offset on the “Statement of assets and liabilities” and require an entity to disclose both gross and net information about such investments and transactions in the financial statements. In January 2013, the FASB issued guidance that clarified which investments and transactions are subject to the offsetting disclosure requirements. The scope of the disclosure requirements for offsetting is limited to derivative instruments, repurchase agreements and reverse repurchase agreements, and securities borrowing. The guidance is effective for financial statements with fiscal years beginning on or after Jan. 1, 2013, and interim periods within those fiscal years.
In order to better define its contractual rights and to secure rights that will help the Fund mitigate its counterparty risk, the Fund entered into an International Swaps and Derivatives Association, Inc. Master Agreement (ISDA Master Agreement) or a similar agreement with certain of its derivative contract counterparties. An ISDA Master Agreement is a bilateral agreement between the Fund and a counterparty that governs certain over-the-counter (OTC) derivatives and foreign exchange contracts and typically contains, among other things, collateral posting items and netting provisions in the event of
47
Notes to financial statements
Delaware High-Yield Opportunities Fund
9. Offsetting (continued)
a default and/or termination event. Under an ISDA Master Agreement, the Fund may, under certain circumstances, offset with the counterparty certain derivative financial instruments’ payables and/or receivables with collateral held and/or posted and create one single net payment. The provisions of the ISDA Master Agreement typically permit a single net payment in the event of default (close-out), including the bankruptcy or insolvency of the counterparty. However, bankruptcy or insolvency laws of a particular jurisdiction may impose restrictions on or prohibitions against the right of offset in bankruptcy, insolvency or other events.
For financial reporting purposes, the Fund does not offset derivative assets and derivative liabilities that are subject to netting arrangements on the “Statement of assets and liabilities.”
At July 31, 2015, the Fund had the following assets and liabilities subject to offsetting provisions:
Offsetting of Financial Assets and Liabilities
Master Repurchase Agreements
| | | | | | | | | | | | | | | | | | | | |
Counterparty | | Repurchase Agreements | | Fair Value of Non-Cash Collateral Received | | Cash Collateral Received | | Net Amount(a) |
Bank of America
Merrill Lynch | | | | $1,220,995 | | | | | $(1,220,995 | ) | | | | $— | | | | | $— | |
Bank of Montreal | | | | 2,034,992 | | | | | (2,034,992 | ) | | | | — | | | | | — | |
BNP Paribas | | | | 4,703,013 | | | | | (4,703,013 | ) | | | | — | | | | | — | |
| | | | | | | | | | | | | | | | | | | | |
Total | | | | $7,959,000 | | | | | $(7,959,000 | ) | | | | $— | | | | | $— | |
| | | | | | | | | | | | | | | | | | | | |
(a)Net amount represents the receivable/(payable) that would be due from/(to) the counterparty in the event of default.
10. Securities Lending
The Fund, along with other funds in the Delaware Investments® Family of Funds, may lend its securities pursuant to a security lending agreement (Lending Agreement) with The Bank of New York Mellon (BNY Mellon). At the time a security is loaned, the borrower must post collateral equal to the required percentage of the market value of the loaned security, including any accrued interest. The required percentage is: (1) 102% with respect to U.S. securities and foreign securities that are denominated and payable in U.S. dollars; and (2) 105% with respect to foreign securities. With respect to each loan, if on any business day the aggregate market value of securities collateral plus cash collateral held is less than the aggregate market value of the securities which are the subject of such loan, the borrower will be notified to provide additional collateral by the end of the following business day which, together with the collateral already held, will be not less than the applicable initial collateral requirements for such security loan. If the aggregate market value of securities collateral and cash collateral held with respect to a security loan exceeds the applicable initial collateral requirement, upon request of the borrower, BNY Mellon must return enough collateral to the borrower by the end of the following business day to reduce the value of the remaining collateral to the applicable initial collateral requirement for such security loan. As a result of the foregoing, the value of the collateral held with respect to a loaned security on any particular day may be more or less than the value of the security on loan.
48
Cash collateral received is generally invested in the Delaware Investments Collateral Fund No. 1 (Collective Trust) established by BNY Mellon for the purpose of investment on behalf of funds managed by DMC that participate in BNY Mellon’s securities lending program. The Collective Trust may invest in U.S. government securities, high-quality corporate debt, asset-backed and other money market securities, and in repurchase agreements collateralized by such securities, provided that the Collective Trust will generally have a dollar-weighted average portfolio maturity of 60 days or less. The Fund can also accept U.S. government securities and letters of credit (non-cash collateral) in connection with securities loans. In the event of default or bankruptcy by the lending agent, realization and/or retention of the collateral may be subject to legal proceedings. In the event the borrower fails to return the loaned securities and the collateral received is insufficient to cover the value of the loaned securities and provided such collateral shortfall is not the result of investment losses, the lending agent has agreed to pay the amount of the shortfall to the Fund or, at the discretion of the lending agent, replace the loaned securities. The Fund continues to record dividends or interest, as applicable, on the securities loaned and is subject to changes in value of the securities loaned that may occur during the term of the loan. The Fund has the right under the Lending Agreement to recover the securities from the borrower on demand. With respect to security loans collateralized by non-cash collateral, the Fund receives loan premiums paid by the borrower. With respect to security loans collateralized by cash collateral, the earnings from the collateral investments are shared among the Fund, the security lending agent, and the borrower. The Fund records security lending income net of allocations to the security lending agent, and the borrower.
The Collective Trust used for the investment of cash collateral received from borrowers of securities seeks to maintain a net asset value per unit of $1.00, but there can be no assurance that it will always be able to do so. The Fund may incur investment losses as a result of investing securities lending collateral in the Collective Trust. This could occur if an investment in the Collective Trust defaulted or if it were necessary to liquidate assets in the Collective Trust to meet returns on outstanding security loans at a time when the Collective Trust’s net asset value per unit was less than $1.00. Under those circumstances, the Fund may not receive an amount from the Collective Trust that is equal in amount to the collateral the Fund would be required to return to the borrower of the securities and the Fund would be required to make up for this shortfall.
During the year ended July 31, 2015, the Fund had no securities on loan.
11. Credit and Market Risk
The Fund invests in high yield fixed income securities, which are securities rated lower than BBB-by S&P and Baa3 by Moody’s, or similarly rated by another nationally recognized statistical rating organization. Investments in these higher yielding securities are generally accompanied by a greater degree of credit risk than higher rated securities. Additionally, lower rated securities may be more susceptible to adverse economic and competitive industry conditions than investment grade securities.
The Fund invests in bank loans and other securities that may subject it to direct indebtedness risk, the risk that the Fund will not receive payment of principal, interest, and other amounts due in connection with these investments and will depend primarily on the financial condition of the borrower. Loans that are fully secured offer the Fund more protection than unsecured loans in the event of nonpayment of scheduled interest or principal, although there is no assurance that the liquidation of collateral from a
49
Notes to financial statements
Delaware High-Yield Opportunities Fund
11. Credit and Market Risk (continued)
secured loan would satisfy the corporate borrower’s obligation, or that the collateral can be liquidated. Some loans or claims may be in default at the time of purchase. Certain of the loans and the other direct indebtedness acquired by the Fund may involve revolving credit facilities or other standby financing commitments that obligate the Fund to pay additional cash on a certain date or on demand. These commitments may require the Fund to increase its investment in a company at a time when the Fund might not otherwise decide to do so (including at a time when the company’s financial condition makes it unlikely that such amounts will be repaid). To the extent that the Fund is committed to advance additional funds, it will at all times hold and maintain cash or other high grade debt obligations in an amount sufficient to meet such commitments.
As the Fund may be required to rely upon another lending institution to collect and pass on to the Fund amounts payable with respect to the loan and to enforce the Fund’s rights under the loan and other direct indebtedness, an insolvency, bankruptcy, or reorganization of the lending institution may delay or prevent the Fund from receiving such amounts. The highly leveraged nature of many loans may make them especially vulnerable to adverse changes in economic or market conditions. Investments in such loans and other direct indebtedness may involve additional risk to the Fund.
The Fund invests in certain obligations that may have liquidity protection designed to ensure that the receipt of payments due on the underlying security is timely. Such protection may be provided through guarantees, insurance policies, or letters of credit obtained by the issuer or sponsor through third parties, through various means of structuring the transaction or through a combination of such approaches. The Fund will not pay any additional fees for such credit support, although the existence of credit support may increase the price of a security.
The Fund may invest up to 15% of its net assets in illiquid securities, which may include securities with contractual restrictions on resale, securities exempt from registration under Rule 144A promulgated under the Securities Act of 1933, as amended, and other securities which may not be readily marketable. The relative illiquidity of these securities may impair the Fund from disposing of them in a timely manner and at a fair price when it is necessary or desirable to do so. While maintaining oversight, the Fund’s Board has delegated to DMC, the day-to-day functions of determining whether individual securities are liquid for purposes of the Fund’s limitation on investments in illiquid securities. Securities eligible for resale pursuant to Rule 144A, which are determined to be liquid, are not subject to the Fund’s 15% limit on investments in illiquid securities. As of July 31, 2015, no securities held by the Fund have been determined to be illiquid under the Fund’s Liquidity Procedures. Rule 144A securities have been identified on the “Schedule of investments.”
12. Contractual Obligations
The Fund enters into contracts in the normal course of business that contain a variety of indemnifications. The Fund’s maximum exposure under these arrangements is unknown. However, the Fund has not had prior claims or losses pursuant to these contracts. Management has reviewed the Fund’s existing contracts and expects the risk of loss to be remote.
50
13. Recent Accounting Pronouncements
In June 2014, the FASB issued guidance to improve the financial reporting of reverse repurchase agreements and other similar transactions. The guidance includes expanded disclosure requirements for entities that enter into reverse repurchase agreements and similar transactions accounted for as secured borrowings. The guidance is effective for financial statements with fiscal years beginning on or after Dec. 15, 2014 and interim periods within those fiscal years. Management has determined that this pronouncement has no impact on the Fund’s financial statements.
In May 2015, the FASB issued Accounting Standards Update (“ASU”) No. 2015-07 regarding “Disclosures for Investments in Certain Entities That Calculate Net Asset Value per Share”. The amendments in this update are effective for the Fund for fiscal years beginning after Dec. 15, 2015, and interim periods within those fiscal years. ASU No. 2015-07 will eliminate the requirement to categorize investments in the fair value hierarchy if their fair value is measured at net asset value (“NAV”) per share (or its equivalent) using the practical expedient in the FASB’s fair value measurement guidance. At this time, management is evaluating the implications of ASU No. 2015-07 and its impact on the financial statement disclosures has not yet been determined.
14. General Motors Corporation Term Loan Litigation
Delaware High-Yield Opportunities Fund received notice of a litigation proceeding related to a General Motors Corporation (G.M.) term loan participation previously held by the Fund in 2009. We believe the matter subject to the litigation notice will likely lead to a recovery from the Fund of certain amounts received by the Fund because a U.S. Court of Appeals has ruled that the Fund and similarly situated investors were unsecured creditors rather than secured lenders of G. M. as a result of an erroneous UCC filing made by a third party. The Fund received the full principal on the loans in 2009 after the G.M. bankruptcy. However, based upon the court ruling the estate is seeking to recover such amounts arguing that, as unsecured creditors, the Fund should not have received payment in full. Based upon currently available information related to the litigation and the Fund’s potential exposure, the Fund booked a net liability of $1,836,309 that resulted in a decrease in the Fund’s net asset value to reflect this likely recovery.
15. Subsequent Events
Management has determined that no material events or transactions occurred subsequent to July 31, 2015 that would require recognition or disclosure in the Fund’s financial statements.
51
Report of independent
registered public accounting firm
To the Board of Trustees of Delaware Group® Income Funds
and the Shareholders of Delaware High-Yield Opportunities Fund:
In our opinion, the accompanying statement of assets and liabilities, including the schedule of investments, and the related statements of operations and of changes in net assets and the financial highlights present fairly, in all material respects, the financial position of Delaware High-Yield Opportunities Fund (one of the series constituting Delaware Group® Income Funds, hereinafter referred to as the “Fund”) at July 31, 2015, the results of its operations for the year then ended, the changes in its net assets for each of the two years in the period then ended and the financial highlights for each of the five years in the period then ended, in conformity with accounting principles generally accepted in the United States of America. These financial statements and financial highlights (hereafter referred to as “financial statements”) are the responsibility of the Fund’s management. Our responsibility is to express an opinion on these financial statements based on our audits. We conducted our audits of these financial statements in accordance with the standards of the Public Company Accounting Oversight Board (United States). Those standards require that we plan and perform the audit to obtain reasonable assurance about whether the financial statements are free of material misstatement. An audit includes examining, on a test basis, evidence supporting the amounts and disclosures in the financial statements, assessing the accounting principles used and significant estimates made by management, and evaluating the overall financial statement presentation. We believe that our audits, which included confirmation of securities at July 31, 2015 by correspondence with the custodian and brokers and the application of alternative auditing procedures where confirmations of securities purchased had not been received, provide a reasonable basis for our opinion.
PricewaterhouseCoopers LLP
Philadelphia, Pennsylvania
September 22, 2015
52
Other Fund information
Delaware High-Yield Opportunities Fund
Tax Information
The information set forth below is for the Fund’s fiscal year as required by federal income tax laws. Shareholders, however, must report distributions on a calendar year basis for income tax purposes, which may include distributions for portions of two fiscal years of the Fund. Accordingly, the information needed by shareholders for income tax purposes will be sent to them in January of each year. Please consult your tax advisor for proper treatment of this information.
All disclosures are based on financial information available as of the date of this annual report and, accordingly are subject to change. For any and all items requiring reporting, it is the intention of the Fund to report the maximum amount permitted under the Internal Revenue Code and the regulations thereunder.
For the fiscal year ended July 31, 2015, the Fund reports distributions paid during the year as follows:
| | | | |
(A) Ordinary Income Distribution (Tax Basis)* | | | 99.74% | |
(B) Long-Term Capital Gains Distribution (Tax Basis) | | | 0.26% | |
Total Distributions (Tax Basis) | | | 100.00% | |
(C) Qualifying dividends1 | | | 1.68% | |
(A) and (B) are based on a percentage of the Fund’s total distributions.
(C) is based on a percentage of the Fund’s ordinary income distributions.
1Qualifying dividends represent dividends which qualify for the corporate dividends received deduction.
*For the fiscal year ended July 31, 2015, certain dividends paid by the Fund may be subject to a maximum tax rate of 20%. The percentage of dividends paid by the Fund from ordinary income reported as qualified income is 1.71%. Complete information will be computed and reported in conjunction with your 2015 Form 1099-DIV.
Proxy Results
At Joint Special Meetings of Shareholders of Delaware Group® Income Funds (the “Trust”), on behalf of Delaware Corporate Bond Fund, Delaware Diversified Floating Rate Fund, Delaware Extended Duration Bond Fund, and Delaware High-Yield Opportunities Fund (each, a “Fund” and together, the “Funds”), held on March 31, 2015 and reconvened on April 21, 2015 for the proposal listed in item (ii) below for Delaware High-Yield Opportunities Fund, and reconvened on April 21, 2015 and May 12, 2015 for the proposal listed in item (iii) below for Delaware Extended Duration Bond Fund, the shareholders of the Trust/the Funds voted to: (i) elect a Board of Trustees for the Trust; (ii) approve the implementation of a new “manager of managers” order for Delaware Corporate Bond Fund, Delaware Diversified Floating Rate Fund, and Delaware High-Yield Opportunities Fund; (iii) revise the fundamental investment restriction relating to lending for Delaware Corporate Bond Fund, Delaware Diversified Floating Rate Fund, Delaware Extended Duration Bond Fund, and Delaware High-Yield Opportunities Fund; and (iv)(a) revise provisions of the Trust’s Agreement and Declaration of Trust related to documenting the transfer of shares, (iv)(b) revise provisions of the Trust’s Agreement and Declaration of Trust related to shareholder disclosure of certain information upon board demand, and (iv)(c) revise provisions of the Trust’s By-Laws so that Delaware law will apply to matters related to proxies. At the meeting, the following people were elected to serve as Independent Trustees: Thomas L. Bennett, Ann D. Borowiec, Joseph W. Chow, John A. Fry, Lucinda S. Landreth, Frances A. Sevilla-Sacasa, Thomas K. Whitford,
53
Other Fund information
Delaware High-Yield Opportunities Fund
Proxy Results (continued)
Janet L. Yeomans, and J. Richard Zecher. In addition, Patrick P. Coyne was elected to serve as an Interested Trustee.
The Joint Special Meeting of Shareholders of the Trust was adjourned to April 21, 2015, May 12, 2015, and June 2, 2015 for the proposal to approve the implementation of a new “manager of managers” order for Delaware Extended Duration Bond Fund.
The following proposals were submitted for a vote of the shareholders:
1. To elect a Board of Trustees for the Trust.
A quorum of shares outstanding of the Funds of the Trust was present, and the votes passed with a plurality of these Shares.
| | | | | | | | | | | | | | | | | | | | | | | | |
| | | Shares Voted For | | | % of
Outstanding
Shares | | | % of
Shares
Voted | | | Shares Withheld | | | % of
Outstanding
Shares | | | %of Shares
Voted | |
Thomas L. Bennett | | | 274,460,131.048 | | | | 53.099% | | | | 97.837 | % | | | 6,068,304.574 | | | | 1.174% | | | | 2.163 | % |
Ann D. Borowiec | | | 274,247,892.505 | | | | 53.058% | | | | 97.761 | % | | | 6,280,543.117 | | | | 1.215% | | | | 2.239 | % |
Joseph W. Chow | | | 274,247,112.243 | | | | 53.058% | | | | 97.761 | % | | | 6,281,323.379 | | | | 1.215% | | | | 2.239 | % |
Patrick P. Coyne | | | 272,995,227.301 | | | | 52.816% | | | | 97.315 | % | | | 7,533,208.321 | | | | 1.457% | | | | 2.685 | % |
John A. Fry | | | 274,327,557.829 | | | | 53.073% | | | | 97.790 | % | | | 6,200,877.793 | | | | 1.200% | | | | 2.210 | % |
Lucinda S. Landreth | | | 274,116,526.233 | | | | 53.033% | | | | 97.714 | % | | | 6,411,909.389 | | | | 1.240% | | | | 2.286 | % |
Frances A. Sevilla-Sacasa | | | 273,738,907.874 | | | | 52.960% | | | | 97.580 | % | | | 6,789,527.748 | | | | 1.314% | | | | 2.420 | % |
Thomas K. Whitford | | | 274,402,849.822 | | | | 53.088% | | | | 97.816 | % | | | 6,125,585.800 | | | | 1.185% | | | | 2.184 | % |
Janet L. Yeomans | | | 274,359,928.558 | | | | 53.080% | | | | 97.801 | % | | | 6,168,507.064 | | | | 1.193% | | | | 2.199 | % |
J. Richard Zecher | | | 274,345,100.732 | | | | 53.077% | | | | 97.796 | % | | | 6,183,334.890 | | | | 1.196% | | | | 2.204 | % |
54
2. To approve the implementation of a new “manager of managers” order.
A quorum of the shares outstanding of the Funds was present, and the votes passed with the required majority of those shares. The results were as follows:
| | | | |
| Delaware Corporate Bond Fund | | | | |
| |
Shares voted for | | | 88,628,645.674 | |
Percentage of outstanding shares | | | 40.420 | % |
Percentage of shares voted | | | 72.039 | % |
Shares voted against | | | 4,729,194.614 | |
Percentage of outstanding shares | | | 2.157 | % |
Percentage of shares voted | | | 3.844 | % |
Shares abstained | | | 2,484,679.320 | |
Percentage of outstanding shares | | | 1.133 | % |
Percentage of shares voted | | | 2.020 | % |
Broker non-votes | | | 27,185,576.000 | |
| |
Delaware Diversified Floating Rate Fund | | | | |
| |
Shares voted for | | | 24,623,335.308 | |
Percentage of outstanding shares | | | 46.422 | % |
Percentage of shares voted | | | 79.387 | % |
Shares voted against | | | 224,821.879 | |
Percentage of outstanding shares | | | 0.424 | % |
Percentage of shares voted | | | 0.725 | % |
Shares abstained | | | 466,098.925 | |
Percentage of outstanding shares | | | 0.879 | % |
Percentage of shares voted | | | 1.503 | % |
Broker non-votes | | | 5,702,757.000 | |
| |
Delaware High-Yield Opportunities Fund | | | | |
| |
Shares voted for | | | 50,956,520.380 | |
Percentage of outstanding shares | | | 35.757 | % |
Percentage of shares voted | | | 68.269 | % |
Shares voted against | | | 2,497,438.049 | |
Percentage of outstanding shares | | | 1.753 | % |
Percentage of shares voted | | | 3.346 | % |
Shares abstained | | | 3,797,377.889 | |
Percentage of outstanding shares | | | 2.665 | % |
Percentage of shares voted | | | 5.088 | % |
Broker non-votes | | | 17,389,855.901 | |
55
Other Fund information
Delaware High-Yield Opportunities Fund
Proxy Results (continued)
3. To revise the fundamental investment restriction relating to lending.
A quorum of the shares outstanding of the Funds was present, and the votes passed with the required majority of those shares. The results were as follows:
| | | | |
Delaware Corporate Bond Fund | | | | |
| |
Shares voted for | | | 88,724,849.272 | |
Percentage of outstanding shares | | | 40.464 | % |
Percentage of shares voted | | | 72.118 | % |
Shares voted against | | | 4,667,992.388 | |
Percentage of outstanding shares | | | 2.129 | % |
Percentage of shares voted | | | 3.794 | % |
Shares abstained | | | 2,449,680.948 | |
Percentage of outstanding shares | | | 1.117 | % |
Percentage of shares voted | | | 1.991 | % |
Broker non-votes | | | 27,185,573.000 | |
| |
Delaware Diversified Floating Rate Fund | | | | |
| |
Shares voted for | | | 24,748,194.728 | |
Percentage of outstanding shares | | | 46.657 | % |
Percentage of shares voted | | | 79.789 | % |
Shares voted against | | | 264,012.275 | |
Percentage of outstanding shares | | | 0.498 | % |
Percentage of shares voted | | | 0.851 | % |
Shares abstained | | | 302,053.109 | |
Percentage of outstanding shares | | | 0.569 | % |
Percentage of shares voted | | | 0.974 | % |
Broker non-votes | | | 5,702,753.000 | |
56
| | | | |
Delaware Extended Duration Bond Fund | | | | |
| |
Shares voted for | | | 40,920,152.966 | |
Percentage of outstanding shares | | | 40.093 | % |
Percentage of shares voted | | | 67.973 | % |
Shares voted against | | | 2,038,429.194 | |
Percentage of outstanding shares | | | 1.997 | % |
Percentage of shares voted | | | 3.386 | % |
Shares abstained | | | 1,101,353.914 | |
Percentage of outstanding shares | | | 1.079 | % |
Percentage of shares voted | | | 1.829 | % |
Broker non-votes | | | 16,140,524.001 | |
| |
Delaware High-Yield Opportunities Fund | | | | |
| |
Shares voted for | | | 48,900,669.110 | |
Percentage of outstanding shares | | | 34.315 | % |
Percentage of shares voted | | | 68.138 | % |
Shares voted against | | | 2,606,390.535 | |
Percentage of outstanding shares | | | 1.829 | % |
Percentage of shares voted | | | 3.632 | % |
Shares abstained | | | 2,208,123.883 | |
Percentage of outstanding shares | | | 1.549 | % |
Percentage of shares voted | | | 3.077 | % |
Broker non-votes | | | 18,051,986.101 | |
4. (a) To revise provisions of the Trust’s Agreement and Declaration of Trust related to documenting the transfer of shares.
A quorum of the shares outstanding of the Trust was present, and the votes passed with a majority of those shares. The results were as follows:
| | | | |
Delaware Group® Income Funds | | | | |
| |
Shares voted for | | | 187,369,259.353 | |
Percentage of outstanding shares | | | 36.250 | % |
Percentage of shares voted | | | 66.792 | % |
Shares voted against | | | 5,528,576.892 | |
Percentage of outstanding shares | | | 1.070 | % |
Percentage of shares voted | | | 1.971 | % |
Shares abstained | | | 18,529,078.175 | |
Percentage of outstanding shares | | | 3.585 | % |
Percentage of shares voted | | | 6.605 | % |
Broker non-votes | | | 69,101,521.202 | |
57
Other Fund information
Delaware High-Yield Opportunities Fund
Proxy Results (continued)
4. (b) To revise provisions of the Trust’s Agreement and Declaration of Trust related to shareholder disclosure of certain information upon board demand.
A quorum of the shares outstanding of the Trust was present, and the votes passed with a majority of those shares. The results were as follows:
| | | | |
Delaware Group® Income Funds | | | | |
| |
Shares voted for | | | 186,061,931.359 | |
Percentage of outstanding shares | | | 35.997 | % |
Percentage of shares voted | | | 66.326 | % |
Shares voted against | | | 6,171,713.659 | |
Percentage of outstanding shares | | | 1.194 | % |
Percentage of shares voted | | | 2.200 | % |
Shares abstained | | | 19,193,253.402 | |
Percentage of outstanding shares | | | 3.713 | % |
Percentage of shares voted | | | 6.842 | % |
Broker non-votes | | | 69,101,537.202 | |
4. (c) To revise provisions of the Trust’s By-Laws so that Delaware law will apply to matters related to proxies.
A quorum of the shares outstanding of the Trust was present, and the votes passed with a majority of those shares. The results were as follows:
| | | | |
Delaware Group Income Funds | | | | |
| |
Shares voted for | | | 187,367,907.591 | |
Percentage of outstanding shares | | | 36.250 | % |
Percentage of shares voted | | | 66.791 | % |
Shares voted against | | | 5,940,616.912 | |
Percentage of outstanding shares | | | 1.149 | % |
Percentage of shares voted | | | 2.118 | % |
Shares abstained | | | 18,118,395.917 | |
Percentage of outstanding shares | | | 3.505 | % |
Percentage of shares voted | | | 6.459 | % |
Broker non-votes | | | 69,101,515.202 | |
��
58
This page intentionally left blank.
Board of trustees / directors and officers addendum
Delaware Investments® Family of Funds
A mutual fund is governed by a Board of Trustees/Directors (“Trustees”), which has oversight responsibility for the management of a fund’s business affairs. Trustees establish procedures and oversee and review the performance of the investment manager, the distributor, and others who perform services for the fund. The independent fund trustees, in particular, are advocates
| | | | | | |
| Name, Address, | | Position(s) | | Length of | | |
| and Birth Date | | Held with Fund(s) | | Time Served | | |
Interested Trustee | | | | | | |
Shawn K. Lytle1 | | President, | | Trustee since | | |
2005 Market Street | | Chief Executive Officer, | | September 1, 2015 | | |
Philadelphia, PA 19103 | | and Trustee | | | | |
February 1970 | | | | President and | | |
| | | | Chief Executive Officer | | |
| | | | since August 20, 2015 | | |
Independent Trustees | | | | |
Thomas L. Bennett | | Chairman and Trustee | | Trustee since | | |
2005 Market Street | | | | March 2005 | | |
Philadelphia, PA 19103 | | | | | | |
October 1947 | | | | Chairman since | | |
| | | | | March 1, 2015 | | |
Ann D. Borowiec | | Trustee | | Since March 31, 2015 | | |
2005 Market Street | | | | | | |
Philadelphia, PA 19103 | | | | | | |
November 1958 | | | | | | |
Joseph W. Chow | | Trustee | | Since January 2013 | | |
2005 Market Street | | | | | | |
Philadelphia, PA 19103 | | | | | | |
January 1953 | | | | | | |
| 1 | Shawn K. Lytle is considered to be an “Interested Trustee” because he is an executive officer of the Fund’s(s’) investment advisor. |
60
for shareholder interests. Each trustee has served in that capacity since he or she was elected to or appointed to the Board of Trustees, and will continue to serve until his or her retirement or the election of a new trustee in his or her place. The following is a list of the Trustees and Officers with certain background and related information.
| | | | |
| | | Number of Portfolios in | | |
| Principal Occupation(s) | | Fund Complex Overseen | | Other Directorships |
| During the Past Five Years | | by Trustee or Officer | | Held by Trustee or Officer |
| | | | |
Shawn K. Lytle has served as | | 64 | | Trustee — UBS |
President of | | | | Relationship Funds, |
Delaware Investments2 | | | | SMA Relationship |
since June 2015 and was the | | | | Trust, and UBS Funds |
Regional Head of Americas for | | | | (May 2010–April 2015) |
UBS Global Asset | | | | |
Management from | | | | |
2010 through 2015. | | | | |
| | | | |
Private Investor | | 64 | | Director — |
(March 2004–Present) | | | | Bryn Mawr Bank Corp. (BMTC) |
| | | | | (2007–2011) |
Chief Executive Officer | | 64 | | None |
Private Wealth Management | | | | |
(2011–2013) and | | | | |
Market Manager, | | | | |
New Jersey Private | | | | |
Bank (2005–2011) — | | | | |
J.P. Morgan Chase & Co. | | | | |
Executive Vice President | | 64 | | Director and Audit Committee |
(Emerging Economies | | | | Member — Hercules |
Strategies, Risks, and | | | | Technology Growth |
Corporate Administration) | | | | Capital, Inc. |
State Street Corporation | | | | (2004–2014) |
(July 2004–March 2011) | | | | |
| 2 | Delaware Investments is the marketing name for Delaware Management Holdings, Inc. and its subsidiaries, including the Fund’s(s’) investment advisor, principal underwriter, and its transfer agent. |
61
Board of trustees / directors and officers addendum
Delaware Investments® Family of Funds
| | | | | | |
| Name, Address, | | Position(s) | | Length of | | |
| and Birth Date | | Held with Fund(s) | | Time Served | | |
Independent Trustees (continued) | | |
John A. Fry | | Trustee | | Since January 2001 | | |
2005 Market Street | | | | | | |
Philadelphia, PA 19103 | | | | | | |
May 1960 | | | | | | |
Lucinda S. Landreth | | Trustee | | Since March 2005 | | |
2005 Market Street | | | | | | |
Philadelphia, PA 19103 | | | | | | |
June 1947 | | | | | | |
Frances A. Sevilla-Sacasa | | Trustee | | Since September 2011 | | |
2005 Market Street | | | | | | |
Philadelphia, PA 19103 | | | | | | |
January 1956 | | | | | | |
62
| | | | |
| | | Number of Portfolios in | | |
| Principal Occupation(s) | | Fund Complex Overseen | | Other Directorships |
| During the Past Five Years | | by Trustee or Officer | | Held by Trustee or Officer |
| | | | |
President — | | 64 | | Director — Hershey Trust |
Drexel University | | | | Company |
(August 2010–Present) | | | | |
| | | | Director, Audit Committee, |
President — | | | | and Governance Committee |
Franklin & Marshall College | | | | Member — Community |
(July 2002–July 2010) | | | | Health Systems |
| | | | Director — Drexel |
| | | | | Morgan & Co. |
Private Investor | | 64 | | None |
(2004–Present) | | | | |
Chief Executive Officer — | | 64 | | Trust Manager and |
Banco Itaú | | | | Audit Committee |
International | | | | Member — Camden |
(April 2012–Present) | | | | Property Trust |
Executive Advisor to Dean | | | | |
(August 2011–March 2012) and Interim Dean | | | | |
(January 2011–July 2011) — | | | | |
University of Miami School of | | | | |
Business Administration | | | | |
President — U.S. Trust, | | | | |
Bank of America Private | | | | |
Wealth Management | | | | |
(Private Banking) | | | | |
(July 2007–December 2008) | | | | |
63
Board of trustees / directors and officers addendum
Delaware Investments® Family of Funds
| | | | | | |
| Name, Address, | | Position(s) | | Length of | | |
| and Birth Date | | Held with Fund(s) | | Time Served | | |
Independent Trustees (continued) | | | | |
Thomas K. Whitford | | Trustee | | Since January 2013 | | |
2005 Market Street | | | | | | |
Philadelphia, PA 19103 | | | | | | |
March 1956 | | | | | | |
Janet L. Yeomans | | Trustee | | Since April 1999 | | |
2005 Market Street | | | | | | |
Philadelphia, PA 19103 | | | | | | |
July 1948 | | | | | | |
64
| | | | |
| | | Number of Portfolios in | | |
| Principal Occupation(s) | | Fund Complex Overseen | | Other Directorships |
| During the Past Five Years | | by Trustee or Officer | | Held by Trustee or Officer |
| | | | |
Vice Chairman | | 64 | | Director — HSBC Finance |
(2010–April 2013), | | | | Corporation and HSBC |
Chief Administrative | | | | North America Holdings Inc. |
Officer (2008–2010), and Executive Vice | | | | Director — |
President and Chief | | | | HSBC Bank |
Administrative Officer | | | | |
(2007–2009) — | | | | |
PNC Financial | | | | |
Services Group | | | | |
Vice President and Treasurer | | 64 | | Director, Audit and |
(January 2006–July 2012) | | | | Compliance Committee Chair, |
Vice President — | | | | Investment Committee |
Mergers & Acquisitions | | | | Member, and Governance |
(January 2003–January 2006), | | | | Committee Member — |
and Vice President | | | | Okabena Company |
and Treasurer | | | | |
(July 1995–January 2003) | | | | Chair — 3M |
3M Corporation | | | | Investment Management |
| | | | Company |
| | | | | (2005–2012) |
65
Board of trustees / directors and officers addendum
Delaware Investments® Family of Funds
| | | | | | |
| Name, Address, | | Position(s) | | Length of | | |
| and Birth Date | | Held with Fund(s) | | Time Served | | |
Officers | | | | | | |
David F. Connor | | Senior Vice President, | | Senior Vice President | | |
2005 Market Street | | General Counsel, | | since May 2013; | | |
Philadelphia, PA 19103 | | and Secretary | | General Counsel | | |
December 1963 | | | | since May 2015; | | |
| | | | Secretary since | | |
| | | | | October 2005 | | |
Daniel V. Geatens | | Vice President | | Treasurer since October 2007 | | |
2005 Market Street | | and Treasurer | | | | |
Philadelphia, PA 19103 | | | | | | |
October 1972 | | | | | | |
Richard Salus | | Senior Vice President | | Chief Financial Officer | | |
2005 Market Street | | and Chief Financial Officer | | since November 2006 | | |
Philadelphia, PA 19103 | | | | | | |
October 1963 | | | | | | |
The Statement of Additional Information for the Fund(s) includes additional information about the Trustees and Officers and is available, without charge, upon request by calling 800 523-1918.
66
| | | | |
| | | Number of Portfolios in | | |
| Principal Occupation(s) | | Fund Complex Overseen | | Other Directorships |
| During the Past Five Years | | by Trustee or Officer | | Held by Trustee or Officer |
| | | | |
David F. Connor has served as | | 64 | | None3 |
Senior Vice President of the Fund(s) and the investment advisor since 2013, General Counsel of the Fund(s) and the investment advisor since 2015, and Secretary of the Fund(s) and the investment advisor since 2005. | | | | |
Daniel V. Geatens has served | | 64 | | None3 |
as Vice President and | | | | |
Treasurer of the Fund(s) since 2007 and Vice President and Director of Financial | | | | |
Administration of the investment advisor since 2010. | | | | |
Richard Salus has served as | | 64 | | None3 |
Senior Vice President and Chief Financial Officer of the Fund(s) and the investment advisor since 2006. | | | | |
| 3 | David F. Connor, Daniel V. Geatens, and Richard Salus serve in similar capacities for the six portfolios of the Optimum Fund Trust, which have the same investment advisor, principal underwriter, and transfer agent as the registrant. |
67
About the organization
| | | | | | |
| Board of trustees | | | | | | |
Shawn K. Lytle President and Chief Executive Officer Delaware Investments® Family of Funds Philadelphia, PA Thomas L. Bennett Chairman of the Board Delaware Investments Family of Funds Private Investor Rosemont, PA | | Ann D. Borowiec Former Chief Executive Officer Private Wealth Management J.P. Morgan Chase & Co. New York, NY Joseph W. Chow Former Executive Vice President State Street Corporation Brookline, MA | | John A. Fry President Drexel University Philadelphia, PA Lucinda S. Landreth Former Chief Investment Officer Assurant, Inc. New York, NY | | Frances A. Sevilla-Sacasa Chief Executive Officer Banco Itaú International Miami, FL Thomas K. Whitford Former Vice Chairman PNC Financial Services Group Pittsburgh, PA Janet L. Yeomans Former Vice President and Treasurer 3M Corporation St. Paul, MN |
| | | |
| | | |
| | | |
| | | |
| | | |
| | | |
| | | |
| | | |
| | | |
| | | |
| | | |
| | | |
| | | |
| | | |
| | | |
| | | |
| | | |
Affiliated officers | | | | | | |
| | | |
| David F. Connor | | Daniel V. Geatens | | Richard Salus | | |
| Senior Vice President, | | Vice President and | | Senior Vice President and | | |
| General Counsel, | | Treasurer | | Chief Financial Officer | | |
| and Secretary | | Delaware Investments | | Delaware Investments | | |
| Delaware Investments | | Family of Funds | | Family of Funds | | |
| Family of Funds | | Philadelphia, PA | | Philadelphia, PA | | |
| Philadelphia, PA | | | | | | |
This annual report is for the information of Delaware High-Yield Opportunities Fund shareholders, but it may be used with prospective investors when preceded or accompanied by the Delaware Investments Fund fact sheet for the most recently completed calendar quarter. These documents are available at delawareinvestments.com.
Delaware Investments is the marketing name of Delaware Management Holdings, Inc. and its subsidiaries.
The Fund files its complete schedule of portfolio holdings with the Securities and Exchange Commission (SEC) for the first and third quarters of each fiscal year on Form N-Q. The Fund’s Forms N-Q, as well as a description of the policies and procedures that the Fund uses to determine how to vote proxies (if any) relating to portfolio securities are available without charge (i) upon request, by calling 800 523-1918; and (ii) on the SEC’s website at sec.gov. In addition, a description of the policies and procedures that the Fund uses to determine how to vote proxies (if any) relating to portfolio securities and the Schedule of Investments included in the Fund’s most recent Form N-Q are available without charge on the Fund’s website at delawareinvestments.com. The Fund’s Forms N-Q may be reviewed and copied at the SEC’s Public Reference Room in Washington, D.C.; information on the operation of the Public Reference Room may be obtained by calling 800 SEC-0330.
Information (if any) regarding how the Fund voted proxies relating to portfolio securities during the most recently disclosed 12-month period ended June 30 is available without charge (i) through the Fund’s website at delawareinvestments.com; and (ii) on the SEC’s website at sec.gov.
68
Annual report
Fixed income mutual fund
Delaware Diversified Floating Rate Fund
July 31, 2015
Carefully consider the Fund’s investment objectives, risk factors, charges, and expenses before investing. This and other information can be found in the Fund’s prospectus and its summary prospectus, which may be obtained by visiting delawareinvestments.com or calling 800 523-1918. Investors should read the prospectus and the summary prospectus carefully before investing.
You can obtain shareholder reports and prospectuses online instead of in the mail.
Visit delawareinvestments.com/edelivery.
Experience Delaware Investments
Delaware Investments is committed to the pursuit of consistently superior asset management and unparalleled client service. We believe in our investment processes, which seek to deliver consistent results, and in convenient services that help add value for our clients.
If you are interested in learning more about creating an investment plan, contact your financial advisor.
You can learn more about Delaware Investments or obtain a prospectus for Delaware Diversified Floating Rate Fund at delawareinvestments.com.
Manage your investments online
| ● | | 24-hour access to your account information |
| ● | | Check your account balance and recent transactions |
| ● | | Request statements or literature |
| ● | | Make purchases and redemptions |
Delaware Management Holdings, Inc. and its subsidiaries (collectively known by the marketing name of Delaware Investments) are wholly owned subsidiaries of Macquarie Group Limited, a global provider of banking, financial, advisory, investment and funds management services.
Neither Delaware Investments nor its affiliates noted in this document are authorized deposit-taking institutions for the purposes of the Banking Act 1959 (Commonwealth of Australia). The obligations of these entities do not represent deposits or other liabilities of Macquarie Bank Limited (MBL). MBL does not guarantee or otherwise provide assurance in respect of the obligations of these entities, unless noted otherwise.
Unless otherwise noted, views expressed herein are current as of July 31, 2015, and subject to change for events occurring after such date.
Funds are not FDIC insured and are not guaranteed. It is possible to lose the principal amount invested.
Mutual fund advisory services provided by Delaware Management Company, a series of Delaware Management Business Trust, which is a registered investment advisor. Delaware Investments, a member of Macquarie Group, refers to Delaware Management Holdings, Inc. and its subsidiaries, including the Fund’s distributor, Delaware Distributors, L.P. Macquarie Group refers to Macquarie Group Limited and its subsidiaries and affiliates worldwide.
© 2015 Delaware Management Holdings, Inc.
All third-party marks cited are the property of their respective owners.
| | |
| Portfolio management review | | |
| |
Delaware Diversified Floating Rate Fund | | August 11, 2015 |
| | | | | | |
Performance preview (for the year ended July 31, 2015) | | | | | | |
Delaware Diversified Floating Rate Fund (Class A shares) | | 1-year return | | | -0.35% | |
BofA Merrill Lynch U.S. Dollar 3-Month Deposit Offered Rate | | | | | | |
Constant Maturity Index (benchmark) | | 1-year return | | | +0.24% | |
Past performance does not guarantee future results.
For complete, annualized performance for Delaware Diversified Floating Rate Fund, please see the table on page 3.
The performance of Class A shares excludes the applicable sales charge and reflects the reinvestment of all distributions. For a description of the index, please see page 5.
Index performance returns do not reflect any management fees, transaction costs, or expenses. Indices are unmanaged and one cannot invest directly in an index.
Central bank activity primarily drove global financial markets during the Fund’s fiscal year ended July 31, 2015. Accommodative central bank policies – including quantitative easing and low interest rates – injected global liquidity, which contributed to asset inflation and buoyed capital markets.
In contrast, during the Fund’s fiscal year speculation increased that the U.S. Federal Reserve would start raising interest rates, despite heightened concerns about slowing economic growth domestically and abroad. Despite this speculation, the strength of the U.S. dollar contributed to the view that the Fed may delay its initial rate increase until later in 2015 or 2016.
Within the Fund
For the fiscal year ended July 31, 2015, Delaware Diversified Floating Rate Fund (Class A shares) returned -0.35% at net asset value and -3.05% at maximum offer price (both returns reflect all distributions reinvested). During the same period, the Fund’s benchmark, the BofA Merrill Lynch U.S. Dollar 3-Month Deposit Offered Rate Constant Maturity Index, returned +0.24%. For complete annualized performance of Delaware Diversified Floating Rate Fund, please see the table on page 3.
During a period in which investment grade bonds performed relatively poorly, the Fund’s performance was supported by its allocation to bank loans, particularly lower-quality issues, and the Fund’s allocation to asset-backed securities (ABS) and structured products.
An increase in exposure to collateralized loan obligations (CLOs) enhanced the Fund’s bank loan investments. During the first half of 2015, we increased its bank loan exposure, which contributed to performance. A shift down in quality among bank loans worked well during this period, as the Fund’s holdings benefited from a supply-demand imbalance in the CLO market.
Individual security selection within bank loans added to relative performance, as almost all the Fund’s strongest individual contributors were in the bank loan area. These included iHeartCommunications, a diversified media and entertainment firm; Scientific Games International, a technology-based gaming and lottery products company; and WideOpenWest Finance, a cable and Internet service provider.
The Fund’s holdings in investment grade bonds hampered performance somewhat. Strong technical factors affected the investment grade credit market. An overabundant supply caused risk premiums to widen, holding back performance in the second half of the Fund’s fiscal year. Although rising interest rates generally cause this market segment to tighten, that did not occur
1
| | |
| Portfolio management review | | |
| |
Delaware Diversified Floating Rate Fund | | |
during the fiscal period and it detracted from the Fund’s performance.
Within investment grade corporate credit, industrials underperformed, financials were mixed, and utilities were among the strongest-performing securities in the investment grade credit space. However, utilities made up a relatively small portion of the portfolio, which limited their contribution to the Fund’s performance.
The commodity selloff, and specifically the Fund’s exposure to high yield energy credits, also detracted from performance in the second half of 2014 as oil prices plummeted. Oil and gas drilling services provider Ocean Rig underperformed; however, the Fund maintains exposure because of its secured position in the capital structure, competitive fleet, and strong contract profile. FMG Resources also detracted from performance but we continue to believe the company’s cost-cutting initiatives, combined with financial flexibility, may provide the issuer with much needed flexibility to address current iron ore prices. Drilling firm Vantage Drilling sold off meaningfully during the fiscal period, and the Fund is in the process of exiting the position. We have since reduced the Fund’s exposure to commodities and shifted some assets into the less cyclical pipeline sector.
Toward the end of the Fund’s fiscal year, we began to migrate the Fund’s holdings to a more conservative position in response to an increase in volatility resulting from the Fed’s monetary policy, slowing global growth, and the decline in commodity prices. We took some steps to shorten the Fund’s maturity. We sold some bank loan assets as part of a rebalancing process, redistributing the proceeds largely into investment grade corporate credit and ABS. Additionally we reduced the Fund’s emerging market bond exposure, given the economic challenges faced by many of these countries.
Managing risk through diversification in a challenging environment
A primary way in which the Fund attempts to manage risk is to take a diversified approach to address investors’ concerns about rising interest rates. We look for sources of alpha – or market outperformance – in multiple asset classes, and we attempt to maintain diversification across these asset classes.
An important diversification tactic is to use interest rate swaps, a derivative that is central to how we run the Fund. We use these swaps exclusively to exchange fixed rate-bonds’ cash flows into floating rate. This enables us to expand our opportunity set to include the entire fixed income market rather than being limited to just investments issued as floating-rate securities. In addition to exposing the Fund to a broader and more diverse opportunity set, it also helps us manage liquidity by investing in newly issued securities or “on the run” fixed-rate bonds.
We can also use higher-quality assets, such as ABS and floating-rate notes, given their liquidity and diversification benefits.
Diversification allows us to manage credit risk opportunistically. We can have up to 50% of the Fund’s holdings in below-investment-grade securities. During the fiscal year, the Fund maintained exposure to this segment of the market by investing primarily in bank loans. These companies have been, in part, supported by very low interest rates and accommodative monetary policies. However, we must remain vigilant as the economic cycle matures.
2
| | | | |
| Performance summary | | | | |
| |
Delaware Diversified Floating Rate Fund | | | July 31, 2015 | |
The performance data quoted represent past performance; past performance does not guarantee future results. Investment return and principal value will fluctuate so your shares, when redeemed, may be worth more or less than their original cost. Please obtain the performance data current for the most recent month end by calling 800 523-1918 or visiting our website at delawareinvestments.com/performance. Current performance may be lower or higher than the performance data quoted.
| | | | | | | | | | | | | | | | |
| Fund and benchmark performance1,2 | | Average annual total returns through July 31, 2015 | |
| | | 1 year | | | 3 years | | | 5 years | | | Lifetime | |
Class A (Est. Feb. 26, 2010) | | | | | | | | | | | | | | | | |
Excluding sales charge | | | -0.35% | | | | +1.54% | | | | +2.04% | | | | +2.04% | |
Including sales charge | | | -3.05% | | | | +0.61% | | | | +1.47% | | | | +1.52% | |
Class C (Est. Feb. 26, 2010) | | | | | | | | | | | | | | | | |
Excluding sales charge | | | -1.10% | | | | +0.79% | | | | +1.28% | | | | +1.29% | |
Including sales charge | | | -2.07% | | | | +0.79% | | | | +1.28% | | | | +1.29% | |
Class R (Est. Feb. 26, 2010) | | | | | | | | | | | | | | | | |
Excluding sales charge | | | -0.61% | | | | +1.29% | | | | +1.78% | | | | +1.78% | |
Including sales charge | | | -0.61% | | | | +1.29% | | | | +1.78% | | | | +1.78% | |
Institutional Class (Est. Feb. 26, 2010) | | | | | | | | | | | | | | | | |
Excluding sales charge | | | -0.11% | | | | +1.80% | | | | +2.30% | | | | +2.30% | |
Including sales charge | | | -0.11% | | | | +1.80% | | | | +2.30% | | | | +2.30% | |
BofA Merrill Lynch U.S. Dollar 3-Month | | | | | | | | | | | | | | | | |
Deposit Offered Rate Constant | | | | | | | | | | | | | | | | |
Maturity Index* | | | +0.24% | | | | +0.28% | | | | +0.32% | | | | +0.32% | |
*Benchmark lifetime returns are for Class A share comparison only and are as of the month end after the Fund’s inception date. The benchmark was formerly known as the BofA Merrill Lynch U.S. Dollar 3-Month LIBOR Constant Maturity Index.
1 Returns reflect the reinvestment of all distributions and are presented both with and without the applicable sales charges described below. Returns do not reflect the deduction of taxes the shareholder would pay on Fund distributions or redemptions of Fund shares.
Expense limitations were in effect for certain classes during some or all of the periods shown in the “Fund and benchmark performance” table. Expenses for each class are listed on the “Fund expense ratios” table on page 4. Performance would have been lower had expense limitations not been in effect.
Class A shares are sold with a maximum front-end sales charge of 2.75%, and have an annual distribution and service fee of 0.25% of average daily net assets. Performance for Class A shares, excluding sales charges, assumes that no front-end sales charge applied.
Class C shares are sold with a contingent deferred sales charge of 1.00% if redeemed during the first 12 months. They are also subject to an annual distribution and service fee of 1.00% of average daily net assets. Performance for Class C shares, excluding sales charges, assumes either that contingent deferred sales charges did not apply or that the investment was not redeemed.
3
| | |
| Performance summary | | |
| |
Delaware Diversified Floating Rate Fund | | |
Class R shares are available only for certain retirement plan products. They are sold without a sales charge and have an annual distribution and service fee of 0.50% of average daily net assets.
Institutional Class shares are available without sales or asset-based distribution charges only to certain eligible institutional accounts.
Fixed income securities and bond funds can lose value, and investors can lose principal, as interest rates rise. They also may be affected by economic conditions that hinder an issuer’s ability to make interest and principal payments on its debt.
The Fund may also be subject to prepayment risk, the risk that the principal of a fixed income security that is held by the Fund may be prepaid prior to maturity, potentially forcing the Fund to reinvest that money at a lower interest rate.
High yielding, noninvestment grade bonds (junk bonds) involve higher risk than investment grade bonds.
The high yield secondary market is particularly susceptible to liquidity problems when institutional investors, such as mutual funds and certain other financial institutions, temporarily stop buying bonds for regulatory, financial, or other reasons.
In addition, a less liquid secondary market makes it more difficult for the Fund to obtain precise valuations of the high yield securities in its portfolio.
International investments entail risks not ordinarily associated with U.S. investments including fluctuation in currency values, differences in accounting principles, or economic or political instability in other nations.
Investing in emerging markets can be riskier than investing in established foreign markets due to increased volatility and lower trading volume.
The Fund may invest in derivatives, which may involve additional expenses and are subject to risk, including the risk that an underlying security or securities index moves in the opposite direction from what the portfolio manager anticipated. A derivative transaction depends upon the counterparties’ ability to fulfill their contractual obligations.
Because the Fund may invest in bank loans and other direct indebtedness, it is subject to the risk that the Fund will not receive payment of principal, interest, and other amounts due in connection with these investments, which primarily depend on the financial condition of the borrower and the lending institution.
2 The Fund’s expense ratios, as described in the most recent prospectus, are disclosed in the following “Fund expense ratios” table.
| | | | | | | | |
| Fund expense ratios | | Class A | | Class C | | Class R | | Institutional Class |
| | | | |
Total annual operating expenses | | 0.95% | | 1.70% | | 1.20% | | 0.70% |
(without fee waivers) | | | | | | | | |
Net expenses | | 0.95% | | 1.70% | | 1.20% | | 0.70% |
(including fee waivers, if any) | | | | | | | | |
Type of waiver | | n/a | | n/a | | n/a | | n/a |
4
Performance of a $10,000 investment1
Average annual total returns from Feb. 26, 2010 (Fund’s inception), through July 31, 2015
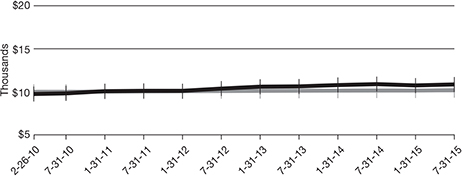
| | | | | | | | | | |
| For period beginning Feb. 26, 2010, through July 31, 2015 | | Starting value | | | Ending value | |

| | Delaware Diversified Floating Rate Fund — | | | | | | | | |
| | Class A shares | | | $9,725 | | | | $10,850 | |

| | BofA Merrill Lynch U.S. Dollar 3-Month | | | | | | | | |
| | | Deposit Offered Rate Constant Maturity Index | | | $10,000 | | | | $10,176 | |
1 The “Performance of a $10,000 investment” graph assumes $10,000 invested in Class A shares of the Fund on Feb. 26, 2010, and includes the effect of a 2.75% front-end sales charge and the reinvestment of all distributions. The graph does not reflect the deduction of taxes the shareholders would pay on Fund distributions or redemptions of Fund shares. Expense limitations were in effect for some or all of the periods shown. Performance would have been lower had expense limitations not been in effect. Expenses are listed in the “Fund expense ratios” table on page 4. Please note additional details on pages 3 through 5.
The graph also assumes $10,000 invested in the BofA Merrill Lynch U.S. Dollar 3-Month Deposit Offered Rate Constant Maturity Index as of Feb. 26, 2010. The BofA Merrill Lynch U.S. Dollar
3-Month Deposit Offered Rate Constant Maturity Index (formerly the BofA Merrill Lynch U.S. Dollar 3-Month LIBOR Constant Maturity Index) represents the London interbank offered rate (LIBOR) with a constant 3-month average maturity. LIBOR, published by the British Bankers’ Association, is a composite of the rates of interest at which banks borrow from one another in the London market, and it is a widely used benchmark for short-term interest rates.
Index performance returns do not reflect any management fees, transaction costs, or expenses. Indices are unmanaged and one cannot invest directly in an index. Past performance is not a guarantee of future results.
Performance of other Fund classes will vary due to different charges and expenses.
| | | | | | | | | | | | | | |
| | | Nasdaq symbols | | CUSIPs | | | | | | | | | |
Class A | | DDFAX | | | 245908660 | | | | | | | | | |
Class C | | DDFCX | | | 245908652 | | | | | | | | | |
Class R | | DDFFX | | | 245908645 | | | | | | | | | |
Institutional Class | | DDFLX | | | 245908637 | | | | | | | | | |
5
Disclosure of Fund expenses
For the six-month period from February 1, 2015 to July 31, 2015 (Unaudited)
As a shareholder of the Fund, you incur two types of costs: (1) transaction costs, including sales charges (loads) on purchase payments, reinvested dividends, or other distributions; redemption fees; and exchange fees; and (2) ongoing costs, including management fees; distribution and/or service (12b-1) fees; and other Fund expenses. This example is intended to help you understand your ongoing costs (in dollars) of investing in the Fund and to compare these costs with the ongoing costs of investing in other mutual funds.
The example is based on an investment of $1,000 invested at the beginning of the period and held for the entire six-month period from Feb. 1, 2015 to July 31, 2015.
Actual expenses
The first section of the table shown, “Actual Fund return,” provides information about actual account values and actual expenses. You may use the information in this section of the table, together with the amount you invested, to estimate the expenses that you paid over the period. Simply divide your account value by $1,000 (for example, an $8,600 account value divided by $1,000 = 8.6), then multiply the result by the number in the first section under the heading entitled “Expenses Paid During Period” to estimate the expenses you paid on your account during this period.
Hypothetical example for comparison purposes
The second section of the table shown, “Hypothetical 5% return,” provides information about hypothetical account values and hypothetical expenses based on the Fund’s actual expense ratio and an assumed rate of return of 5% per year before expenses, which is not the Fund’s actual return. The hypothetical account values and expenses may not be used to estimate the actual ending account balance or expenses you paid for the period. You may use this information to compare the ongoing costs of investing in the Fund and other funds. To do so, compare this 5% hypothetical example with the 5% hypothetical examples that appear in the shareholder reports of the other funds.
Please note that the expenses shown in the table are meant to highlight your ongoing costs only and do not reflect any transactional costs, such as sales charges (loads), redemption fees, or exchange fees. Therefore, the second section of the table is useful in comparing ongoing costs only, and will not help you determine the relative total costs of owning different funds. In addition, if these transactional costs were included, your costs would have been higher. The Fund’s expenses shown in the table reflect fee waivers in effect. The expenses shown in the table assume reinvestment of all dividends and distributions.
6
Delaware Diversified Floating Rate Fund
Expense analysis of an investment of $1,000
| | | | | | | | |
| | | Beginning
Account Value
2/1/15 | | Ending
Account Value
7/31/15 | | Annualized
Expense Ratio | | Expenses
Paid During Period
2/1/15 to 7/31/15* |
| | | | |
Actual Fund return† | | | | | | | | |
Class A | | $1,000.00 | | $1,009.40 | | 0.97% | | $4.83 |
Class C | | 1,000.00 | | 1,005.70 | | 1.72% | | 8.55 |
Class R | | 1,000.00 | | 1,008.20 | | 1.22% | | 6.07 |
Institutional Class | | 1,000.00 | | 1,010.70 | | 0.72% | | 3.59 |
Hypothetical 5% return (5% return before expenses) | | | | | | | | |
Class A | | $1,000.00 | | $1,019.98 | | 0.97% | | $4.86 |
Class C | | 1,000.00 | | 1,016.27 | | 1.72% | | 8.60 |
Class R | | 1,000.00 | | 1,018.74 | | 1.22% | | 6.11 |
Institutional Class | | 1,000.00 | | 1,021.22 | | 0.72% | | 3.61 |
| * | “Expenses Paid During Period” are equal to the Fund’s annualized expense ratio, multiplied by the average account value over the period, multiplied by 181/365 (to reflect the one-half year period). |
| † | Because actual returns reflect only the most recent six-month period, the returns shown may differ significantly from fiscal year returns. |
7
| | |
| Security type / sector allocation | | |
Delaware Diversified Floating Rate Fund | | As of July 31, 2015 (Unaudited) |
Sector designations may be different than the sector designations presented in other fund materials. The sector designations may represent the investment manager’s internal sector classifications, which may result in the sector designations for one fund being different than another fund’s sector designations.
| | |
| Security type / sector | | Percentage of net assets |
Agency Collateralized Mortgage Obligations | | 0.95% |
Agency Mortgage-Backed Security | | 0.01% |
Convertible Bonds | | 1.05% |
Corporate Bonds | | 49.22% |
Banking | | 11.17% |
Basic Industry | | 1.13% |
Capital Goods | | 2.80% |
Communications. | | 5.56% |
Consumer Cyclical | | 4.87% |
Consumer Non-Cyclical | | 2.89% |
Electric | | 2.25% |
Energy | | 6.53% |
Finance Companies. | | 1.62% |
Insurance | | 0.79% |
Natural Gas | | 2.41% |
Real Estate | | 1.12% |
Technology | | 5.37% |
Transportation | | 0.45% |
Utilities | | 0.26% |
Municipal Bonds | | 3.34% |
Non-Agency Asset-Backed Securities | | 8.33% |
Senior Secured Loans | | 32.45% |
Sovereign Bonds | | 0.24% |
Supranational Bank | | 0.14% |
U.S. Treasury Obligations | | 0.08% |
Convertible Preferred Stock | | 0.11% |
Preferred Stock | | 1.37% |
Short-Term Investments | | 0.44% |
Total Value of Securities | | 97.73% |
Receivables and Other Assets Net of Liabilities | | 2.27% |
Total Net Assets | | 100.00% |
8
| | |
| Schedule of investments | | |
Delaware Diversified Floating Rate Fund | | July 31, 2015 |
| | | | | | | | |
| | | Principal amount° | | | Value (U.S. $) | |
| |
Agency Collateralized Mortgage Obligations – 0.95% | | | | | | | | |
| |
Fannie Mae Connecticut Avenue Securities | | | | | | | | |
Series 2015-C03 1M1 1.689% 7/25/25 ● | | | 890,000 | | | $ | 890,962 | |
Series 2015-C03 2M1 1.688% 7/25/25 ● | | | 835,000 | | | | 835,982 | |
Fannie Mae REMICs | | | | | | | | |
Series 2004-36 FA 0.591% 5/25/34 ● | | | 49,026 | | | | 49,365 | |
Series 2005-66 FD 0.491% 7/25/35 ● | | | 58,947 | | | | 59,065 | |
Series 2005-106 QF 0.701% 12/25/35 ● | | | 350,065 | | | | 353,351 | |
Series 2006-105 FB 0.611% 11/25/36 ● | | | 37,635 | | | | 37,917 | |
Series 2007-109 NF 0.741% 12/25/37 ● | | | 26,049 | | | | 26,398 | |
Freddie Mac REMICs | | | | | | | | |
Series 3067 FA 0.537% 11/15/35 ● | | | 97,050 | | | | 97,430 | |
Series 3239 EF 0.537% 11/15/36 ● | | | 78,578 | | | | 78,936 | |
Series 3241 FM 0.567% 11/15/36 ● | | | 7,900 | | | | 7,943 | |
Series 3780 LF 0.587% 3/15/29 ● | | | 11,772 | | | | 11,788 | |
Freddie Mac Structured Agency Credit Risk Debt Notes | | | | | | | | |
Series 2015-DNA1 M1 1.091% 10/25/27 ● | | | 1,241,301 | | | | 1,240,282 | |
| | | | | | | | |
Total Agency Collateralized Mortgage Obligations (cost $3,680,378) | | | | | | | 3,689,419 | |
| | | | | | | | |
|
| |
| |
Agency Mortgage-Backed Security – 0.01% | | | | | | | | |
| |
Freddie Mac ARM | | | | | | | | |
2.489% 2/1/35 ● | | | 15,521 | | | | 16,674 | |
| | | | | | | | |
Total Agency Mortgage-Backed Security (cost $16,394) | | | | | | | 16,674 | |
| | | | | | | | |
|
| |
| |
Convertible Bonds – 1.05% | | | | | | | | |
| |
Abengoa 144A 5.125% exercise price $38.08, expiration date 2/23/17 # | | | 200,000 | | | | 184,125 | |
Alaska Communications Systems Group 6.25% exercise price $10.28, expiration date 4/27/18 | | | 140,000 | | | | 139,737 | |
American Realty Capital Properties 3.75% exercise price $15.15, expiration date 12/14/20 | | | 85,000 | | | | 80,432 | |
Ares Capital 5.75% exercise price $19.13, expiration date 2/1/16 | | | 53,000 | | | | 53,861 | |
BGC Partners 4.50% exercise price $9.84, expiration date 7/13/16 | | | 58,000 | | | | 63,401 | |
Blackstone Mortgage Trust 5.25% exercise price $28.66, expiration date 12/1/18 | | | 316,000 | | | | 339,700 | |
Campus Crest Communities Operating Partnership 144A | | | | | | | | |
4.75% exercise price $12.56, expiration date 10/11/18 # | | | 352,000 | | | | 338,580 | |
Chart Industries 2.00% exercise price $69.03, expiration date 7/30/18 | | | 92,000 | | | | 83,777 | |
Chesapeake Energy | | | | | | | | |
2.25% exercise price $80.28, expiration date 12/14/38 | | | 83,000 | | | | 67,437 | |
2.50% exercise price $47.55, expiration date 5/15/37 | | | 67,000 | | | | 60,467 | |
9
| | |
| Schedule of investments | | |
Delaware Diversified Floating Rate Fund | | |
| | | | | | | | |
| | | Principal amount° | | | Value (U.S. $) | |
| |
Convertible Bonds (continued) | | | | | | | | |
Ciena 144A 3.75% exercise price $20.17, expiration date 10/15/18 # | | | 37,000 | | | $ | 53,003 | |
GAIN Capital Holdings 4.125% exercise price $12.00, expiration date 11/30/18 | | | 232,000 | | | | 223,735 | |
General Cable 4.50% exercise price $34.17, expiration date 11/15/29 f | | | 387,000 | | | | 290,976 | |
Gilead Sciences 1.625% exercise price $22.71, expiration date 4/29/16 | | | 22,000 | | | | 114,345 | |
Helix Energy Solutions Group 3.25% exercise price $25.02, expiration date 3/12/32 | | | 89,000 | | | | 76,540 | |
Jefferies Group 3.875% exercise price $44.83, expiration date 10/31/29 | | | 337,000 | | | | 348,163 | |
Mylan 3.75% exercise price $13.32, expiration date 9/10/15 | | | 13,000 | | | | 56,818 | |
Nuance Communications 2.75% exercise price $32.30, expiration date 11/1/31 | | | 330,000 | | | | 336,806 | |
NuVasive 2.75% exercise price $42.13, expiration date 6/30/17 | | | 107,000 | | | | 150,402 | |
PROS Holdings 144A 2.00% exercise price $33.79, expiration date 11/27/19 # | | | 105,000 | | | | 103,163 | |
Spectrum Pharmaceuticals 2.75% exercise price $10.53, expiration date 12/13/18 | | | 83,000 | | | | 78,643 | |
Spirit Realty Capital 3.75% exercise price $13.10, expiration date 5/13/21 | | | 150,000 | | | | 140,719 | |
SunEdison 144A 3.375% exercise price $38.65, expiration date 5/30/25 # | | | 72,000 | | | | 66,015 | |
Titan Machinery 3.75% exercise price $43.17, expiration date 4/30/19 | | | 24,000 | | | | 19,725 | |
TPG Specialty Lending 4.50% exercise price $25.83, expiration date 12/15/19 | | | 127,000 | | | | 126,683 | |
Vantage Drilling 144A 5.50% exercise price $2.39, expiration date 7/15/43 # | | | 75,000 | | | | 50,063 | |
Vector Group 1.75% exercise price $25.87, expiration date 4/15/20 ● | | | 397,000 | | | | 453,076 | |
| | | | | | | | |
Total Convertible Bonds (cost $4,208,065) | | | | | | | 4,100,392 | |
| | | | | | | | |
|
| |
| |
Corporate Bonds – 49.22% | | | | | | | | |
| |
Banking – 11.17% | | | | | | | | |
Australia & New Zealand Banking Group 144A | | | | | | | | |
0.663% 1/10/17 #● | | | 2,250,000 | | | | 2,253,119 | |
Banco Bilbao Vizcaya Argentaria Colombia 144A | | | | | | | | |
4.875% 4/21/25 # | | | 250,000 | | | | 249,875 | |
Bank of America | | | | | | | | |
0.546% 10/14/16 ● | | | 575,000 | | | | 572,141 | |
10
| | | | | | | | |
| | | Principal amount° | | | Value (U.S. $) | |
| |
Corporate Bonds (continued) | | | | | | | | |
| |
Banking (continued) | | | | | | | | |
Bank of America | | | | | | | | |
0.745% 11/14/16 ● | | | 3,400,000 | | | $ | 3,400,163 | |
3.875% 8/1/25 | | | 255,000 | | | | 257,964 | |
Bank of New York Mellon 0.766% 9/11/19 ● | | | 2,600,000 | | | | 2,589,881 | |
BB&T 1.146% 6/15/18 ● | | | 2,086,000 | | | | 2,100,345 | |
BBVA Bancomer | | | | | | | | |
144A 6.50% 3/10/21 # | | | 395,000 | | | | 438,450 | |
144A 7.25% 4/22/20 # | | | 200,000 | | | | 224,600 | |
Branch Banking & Trust | | | | | | | | |
0.582% 5/23/17 ● | | | 1,405,000 | | | | 1,399,172 | |
0.606% 9/13/16 ● | | | 775,000 | | | | 772,835 | |
CoBank 144A 0.886% 6/15/22 #● | | | 75,000 | | | | 70,858 | |
Compass Bank 3.875% 4/10/25 | | | 400,000 | | | | 379,981 | |
Cooperatieve Centrale Raiffeisen-Boerenleenbank | | | | | | | | |
4.375% 8/4/25 | | | 875,000 | | | | 880,805 | |
Credit Suisse Group 144A 6.25% 12/29/49 #● | | | 230,000 | | | | 224,537 | |
Export-Import Bank of China 144A 2.50% 7/31/19 # | | | 1,005,000 | | | | 1,015,793 | |
Export-Import Bank of Korea 1.036% 1/14/17 ● | | | 2,250,000 | | | | 2,259,250 | |
Fifth Third Bank 0.692% 2/26/16 ● | | | 3,355,000 | | | | 3,355,221 | |
Goldman Sachs Group | | | | | | | | |
1.497% 4/30/18 ● | | | 710,000 | | | | 717,123 | |
5.375% 12/29/49 ● | | | 785,000 | | | | 781,271 | |
HSBC Bank 144A 0.914% 5/15/18 #● | | | 900,000 | | | | 899,623 | |
ING Groep | | | | | | | | |
6.00% 12/29/49 ● | | | 335,000 | | | | 337,722 | |
6.50% 12/29/49 ● | | | 400,000 | | | | 394,500 | |
Itau Unibanco Holding 144A 2.85% 5/26/18 # | | | 300,000 | | | | 296,550 | |
JPMorgan Chase | | | | | | | | |
2.25% 1/23/20 | | | 1,040,000 | | | | 1,027,379 | |
3.90% 7/15/25 | | | 595,000 | | | | 607,223 | |
KeyBank | | | | | | | | |
3.18% 5/22/22 | | | 480,000 | | | | 485,320 | |
3.30% 6/1/25 | | | 730,000 | | | | 716,537 | |
Lloyds Banking Group | | | | | | | | |
4.50% 11/4/24 | | | 200,000 | | | | 202,296 | |
7.50% 4/30/49 ● | | | 430,000 | | | | 449,350 | |
Morgan Stanley | | | | | | | | |
1.435% 1/27/20 ● | | | 3,305,000 | | | | 3,339,878 | |
2.80% 6/16/20 | | | 475,000 | | | | 477,918 | |
4.00% 7/23/25 | | | 330,000 | | | | 336,880 | |
MUFG Americas Holdings | | | | | | | | |
2.25% 2/10/20 | | | 290,000 | | | | 288,370 | |
11
| | |
| Schedule of investments | | |
Delaware Diversified Floating Rate Fund | | |
| | | | | | | | |
| | | Principal amount° | | | Value (U.S. $) | |
| |
Corporate Bonds (continued) | | | | | | | | |
| |
Banking (continued) | | | | | | | | |
MUFG Americas Holdings | | | | | | | | |
3.00% 2/10/25 | | | 635,000 | | | $ | 604,863 | |
Nordea Bank 144A 6.125% 12/29/49 #● | | | 275,000 | | | | 274,656 | |
PNC Bank 1.85% 7/20/18 | | | 265,000 | | | | 265,566 | |
Regions Bank 2.25% 9/14/18 | | | 1,950,000 | | | | 1,952,590 | |
SunTrust Bank 0.572% 8/24/15 ● | | | 985,000 | | | | 984,947 | |
SVB Financial Group 3.50% 1/29/25 | | | 460,000 | | | | 446,247 | |
Toronto-Dominion Bank 0.847% 4/30/18 ● | | | 1,325,000 | | | | 1,326,191 | |
USB Capital IX 3.50% 10/29/49 ● | | | 440,000 | | | | 363,000 | |
Wells Fargo | | | | | | | | |
0.977% 1/30/20 ● | | | 2,000,000 | | | | 1,997,810 | |
4.30% 7/22/27 | | | 505,000 | | | | 514,677 | |
5.875% 12/29/49 ● | | | 185,000 | | | | 189,625 | |
Woori Bank | | | | | | | | |
144A 2.875% 10/2/18 # | | | 200,000 | | | | 204,485 | |
144A 4.75% 4/30/24 # | | | 200,000 | | | | 208,907 | |
Zions Bancorporation 4.50% 6/13/23 | | | 420,000 | | | | 433,090 | |
| | | | | | | | |
| | | | | | | 43,569,584 | |
| | | | | | | | |
Basic Industry – 1.13% | | | | | | | | |
CF Industries 7.125% 5/1/20 | | | 250,000 | | | | 297,027 | |
Dow Chemical 8.55% 5/15/19 | | | 140,000 | | | | 170,377 | |
Georgia-Pacific 8.00% 1/15/24 | | | 400,000 | | | | 518,078 | |
Gerdau Holdings 144A 7.00% 1/20/20 # | | | 370,000 | | | | 391,275 | |
Methanex 4.25% 12/1/24 | | | 545,000 | | | | 542,138 | |
OCP 144A 4.50% 10/22/25 # | | | 725,000 | | | | 698,719 | |
Potash of Saskatchewan 3.00% 4/1/25 | | | 480,000 | | | | 447,916 | |
Rio Tinto Finance USA 1.123% 6/17/16 ● | | | 995,000 | | | | 996,464 | |
Rockwood Specialties Group 4.625% 10/15/20 | | | 340,000 | | | | 354,652 | |
| | | | | | | | |
| | | | | | | 4,416,646 | |
| | | | | | | | |
Capital Goods – 2.80% | | | | | | | | |
Beverage Packaging Holdings Luxembourg II 144A | | | | | | | | |
6.00% 6/15/17 # | | | 600,000 | | | | 599,250 | |
Cemex 144A 5.039% 10/15/18 #● | | | 1,535,000 | | | | 1,629,019 | |
Embraer Netherlands Finance 5.05% 6/15/25 | | | 250,000 | | | | 245,000 | |
Fortune Brands Home & Security 3.00% 6/15/20 | | | 220,000 | | | | 220,846 | |
Masco 4.45% 4/1/25 | | | 250,000 | | | | 251,250 | |
Reynolds Group Issuer 8.25% 2/15/21 | | | 1,405,000 | | | | 1,464,713 | |
Rockwell Collins 0.636% 12/15/16 ● | | | 3,520,000 | | | | 3,519,996 | |
12
| | | | | | | | |
| | | Principal amount° | | | Value (U.S. $) | |
| |
Corporate Bonds (continued) | | | | | | | | |
| |
Capital Goods (continued) | | | | | | | | |
Tyco Electronics Group 0.494% 1/29/16 ● | | | 2,670,000 | | | $ | 2,669,033 | |
Union Andina de Cementos 144A 5.875% 10/30/21 # | | | 295,000 | | | | 302,375 | |
| | | | | | | | |
| | | | | | | 10,901,482 | |
| | | | | | | | |
Communications – 5.56% | | | | | | | | |
AT&T 1.212% 6/30/20 ● | | | 2,950,000 | | | | 2,966,160 | |
Bharti Airtel International Netherlands 144A | | | | | | | | |
5.35% 5/20/24 # | | | 670,000 | | | | 726,963 | |
CBS 4.00% 1/15/26 | | | 535,000 | | | | 529,703 | |
CCO Safari II | | | | | | | | |
144A 3.579% 7/23/20 # | | | 245,000 | | | | 245,942 | |
144A 4.908% 7/23/25 # | | | 760,000 | | | | 762,874 | |
CenturyLink 5.80% 3/15/22 | | | 225,000 | | | | 219,375 | |
Cisco Systems 0.783% 3/1/19 ● | | | 1,875,000 | | | | 1,883,895 | |
Colombia Telecomunicaciones 144A 5.375% 9/27/22 # | | | 200,000 | | | | 199,600 | |
Columbus International 144A 7.375% 3/30/21 # | | | 820,000 | | | | 874,325 | |
Crown Castle Towers 144A 4.883% 8/15/20 # | | | 685,000 | | | | 738,042 | |
Digicel Group 144A 8.25% 9/30/20 # | | | 595,000 | | | | 590,537 | |
GTP Acquisition Partners I 144A 2.35% 6/15/20 # | | | 185,000 | | | | 183,992 | |
Historic TW 6.875% 6/15/18 | | | 400,000 | | | | 455,646 | |
Millicom International Cellular 144A 6.00% 3/15/25 # | | | 290,000 | | | | 287,825 | |
Myriad International Holdings 144A 5.50% 7/21/25 # | | | 200,000 | | | | 203,600 | |
NBCUniversal Enterprise 144A 0.974% 4/15/18 #● | | | 2,910,000 | | | | 2,914,586 | |
SBA Tower Trust | | | | | | | | |
144A 2.24% 4/16/18 # | | | 220,000 | | | | 218,709 | |
144A 2.898% 10/15/19 # | | | 475,000 | | | | 475,707 | |
Scripps Networks Interactive 3.95% 6/15/25 | | | 255,000 | | | | 251,078 | |
Sky 144A 3.75% 9/16/24 # | | | 430,000 | | | | 417,096 | |
Telemar Norte Leste 144A 5.50% 10/23/20 # | | | 205,000 | | | | 177,325 | |
Time Warner 3.60% 7/15/25 | | | 785,000 | | | | 760,476 | |
Verizon Communications | | | | | | | | |
2.00% 11/1/16 | | | 385,000 | | | | 388,513 | |
5.15% 9/15/23 | | | 4,735,000 | | | | 5,220,148 | |
| | | | | | | | |
| | | | | | | 21,692,117 | |
| | | | | | | | |
Consumer Cyclical – 4.87% | | | | | | | | |
Carnival 1.20% 2/5/16 | | | 305,000 | | | | 305,413 | |
CDK Global 4.50% 10/15/24 | | | 540,000 | | | | 539,229 | |
CVS Health 3.875% 7/20/25 | | | 1,190,000 | | | | 1,212,943 | |
Daimler Finance North America | | | | | | | | |
144A 0.64% 8/1/17 #● | | | 3,420,000 | | | | 3,417,637 | |
144A 3.50% 8/3/25 # | | | 585,000 | | | | 586,153 | |
General Motors Financial 3.45% 4/10/22 | | | 2,000,000 | | | | 1,929,718 | |
13
| | |
| Schedule of investments | | |
Delaware Diversified Floating Rate Fund | | |
| | | | | | | | |
| | | Principal amount° | | | Value (U.S. $) | |
| |
Corporate Bonds (continued) | | | | | | | | |
| |
Consumer Cyclical (continued) | | | | | | | | |
Host Hotels & Resorts | | | | | | | | |
3.75% 10/15/23 | | | 1,100,000 | | | $ | 1,086,341 | |
4.75% 3/1/23 | | | 40,000 | | | | 42,205 | |
Hyundai Capital America | | | | | | | | |
144A 2.55% 2/6/19 # | | | 220,000 | | | | 222,062 | |
144A 4.00% 6/8/17 # | | | 310,000 | | | | 322,956 | |
INVISTA Finance 144A 4.25% 10/15/19 # | | | 550,000 | | | | 541,750 | |
Kohl’s 4.25% 7/17/25 | | | 430,000 | | | | 430,881 | |
Lowe’s 0.702% 9/10/19 ● | | | 1,645,000 | | | | 1,647,877 | |
Magna International 3.625% 6/15/24 | | | 625,000 | | | | 614,170 | |
PACCAR Financial 0.879% 12/6/18 ● | | | 2,000,000 | | | | 2,016,052 | |
QVC 4.375% 3/15/23 | | | 545,000 | | | | 536,484 | |
Signet UK Finance 4.70% 6/15/24 | | | 700,000 | | | | 716,443 | |
Starwood Hotels & Resorts Worldwide 3.75% 3/15/25 | | | 635,000 | | | | 619,031 | |
Toyota Motor Credit 2.80% 7/13/22 | | | 425,000 | | | | 425,312 | |
Volkswagen International Finance 144A | | | | | | | | |
0.716% 11/18/16 #● | | | 1,795,000 | | | | 1,798,287 | |
| | | | | | | | |
| | | | | | | 19,010,944 | |
| | | | | | | | |
Consumer Non-Cyclical – 2.89% | | | | | | | | |
Actavis Funding 1.368% 3/12/18 ● | | | 640,000 | | | | 640,872 | |
Baxalta 144A 4.00% 6/23/25 # | | | 340,000 | | | | 337,359 | |
Becton Dickinson 6.375% 8/1/19 | | | 805,000 | | | | 921,686 | |
BRF 144A 3.95% 5/22/23 # | | | 215,000 | | | | 199,950 | |
Campbell Soup 3.30% 3/19/25 | | | 520,000 | | | | 512,457 | |
Cencosud 144A 5.15% 2/12/25 # | | | 385,000 | | | | 387,658 | |
ConAgra Foods 0.662% 7/21/16 ● | | | 1,770,000 | | | | 1,765,246 | |
Constellation Brands 4.25% 5/1/23 | | | 110,000 | | | | 110,275 | |
Imperial Tobacco Finance 144A 3.75% 7/21/22 # | | | 355,000 | | | | 353,524 | |
JB 144A 3.75% 5/13/25 # | | | 300,000 | | | | 294,156 | |
JBS Investments 144A 7.75% 10/28/20 # | | | 560,000 | | | | 607,600 | |
Kroger 0.819% 10/17/16 ● | | | 900,000 | | | | 900,303 | |
Merck 0.636% 5/18/18 ● | | | 945,000 | | | | 948,253 | |
Pfizer 0.586% 6/15/18 ● | | | 1,010,000 | | | | 1,009,555 | |
Reynolds American | | | | | | | | |
3.25% 6/12/20 | | | 455,000 | | | | 462,681 | |
4.00% 6/12/22 | | | 225,000 | | | | 231,396 | |
Siemens Financieringsmaatschappij 144A | | | | | | | | |
0.565% 5/25/18 #● | | | 1,600,000 | | | | 1,596,194 | |
| | | | | | | | |
| | | | | | | 11,279,165 | |
| | | | | | | | |
Electric – 2.25% | | | | | | | | |
AES Gener 144A 5.00% 7/14/25 # | | | 275,000 | | | | 281,074 | |
Ameren Illinois 9.75% 11/15/18 | | | 165,000 | | | | 206,058 | |
14
| | | | | | | | |
| | | Principal amount° | | | Value (U.S. $) | |
| |
Corporate Bonds (continued) | | | | | | | | |
| |
Electric (continued) | | | | | | | | |
CenterPoint Energy 6.50% 5/1/18 | | | 150,000 | | | $ | 167,882 | |
Electricite de France | | | | | | | | |
144A 0.747% 1/20/17 #● | | | 2,460,000 | | | | 2,464,037 | |
144A 5.25% 1/29/49 #● | | | 590,000 | | | | 606,963 | |
Enel 144A 8.75% 9/24/73 #● | | | 460,000 | | | | 540,960 | |
Entergy 4.00% 7/15/22 | | | 500,000 | | | | 510,281 | |
Eskom Holdings 144A 7.125% 2/11/25 # | | | 200,000 | | | | 202,520 | |
Integrys Energy Group 6.11% 12/1/66 ● | | | 410,000 | | | | 360,907 | |
National Rural Utilities Cooperative Finance | | | | | | | | |
4.75% 4/30/43 ● | | | 1,110,000 | | | | 1,108,890 | |
NSTAR Electric 0.516% 5/17/16 ● | | | 850,000 | | | | 848,499 | |
NV Energy 6.25% 11/15/20 | | | 390,000 | | | | 453,241 | |
Pennsylvania Electric 5.20% 4/1/20 | | | 625,000 | | | | 686,559 | |
WEC Energy Group 2.45% 6/15/20 | | | 245,000 | | | | 245,948 | |
Xcel Energy 3.30% 6/1/25 | | | 80,000 | | | | 78,939 | |
| | | | | | | | |
| | | | | | | 8,762,758 | |
| | | | | | | | |
Energy – 6.53% | | | | | | | | |
Canadian Natural Resources 0.657% 3/30/16 ● | | | 3,760,000 | | | | 3,754,240 | |
Chesapeake Energy 3.539% 4/15/19 ● | | | 1,375,000 | | | | 1,161,875 | �� |
Chevron 0.813% 3/3/22 ● | | | 2,200,000 | | | | 2,207,682 | |
CNOOC Finance 2015 Australia 2.625% 5/5/20 | | | 215,000 | | | | 212,041 | |
CNOOC Finance 2015 USA 3.50% 5/5/25 | | | 240,000 | | | | 232,368 | |
Columbia Pipeline Group | | | | | | | | |
144A 2.45% 6/1/18 # | | | 135,000 | | | | 135,961 | |
144A 3.30% 6/1/20 # | | | 185,000 | | | | 186,071 | |
144A 4.50% 6/1/25 # | | | 190,000 | | | | 189,414 | |
ConocoPhillips 1.176% 5/15/22 ● | | | 2,050,000 | | | | 2,061,337 | |
Continental Resources 4.50% 4/15/23 | | | 130,000 | | | | 120,909 | |
Devon Energy 0.826% 12/15/16 ● | | | 2,465,000 | | | | 2,439,150 | |
Ecopetrol 5.375% 6/26/26 | | | 260,000 | | | | 252,590 | |
Energy Transfer Partners 4.75% 1/15/26 | | | 365,000 | | | | 357,498 | |
EnLink Midstream Partners 4.15% 6/1/25 | | | 355,000 | | | | 335,733 | |
Exxon Mobil 2.397% 3/6/22 | | | 250,000 | | | | 246,211 | |
Freeport-McMoran Oil & Gas 6.50% 11/15/20 | | | 248,000 | | | | 241,180 | |
Noble Holding International 4.00% 3/16/18 | | | 380,000 | | | | 379,652 | |
ONGC Videsh 3.25% 7/15/19 | | | 200,000 | | | | 201,602 | |
Petronas Global Sukuk 144A 2.707% 3/18/20 # | | | 320,000 | | | | 318,580 | |
Regency Energy Partners 5.875% 3/1/22 | | | 950,000 | | | | 1,007,524 | |
Shell International Finance 0.729% 5/11/20 ● | | | 2,105,000 | | | | 2,102,529 | |
Statoil | | | | | | | | |
0.564% 5/15/18 ● | | | 2,280,000 | | | | 2,267,159 | |
0.771% 11/8/18 ● | | | 2,640,000 | | | | 2,640,412 | |
15
| | |
| Schedule of investments | | |
Delaware Diversified Floating Rate Fund | | |
| | | | | | | | |
| | | Principal amount° | | | Value (U.S. $) | |
| |
Corporate Bonds (continued) | | | | | | | | |
| |
Energy (continued) | | | | | | | | |
Total Capital International 0.636% 6/19/19 ● | | | 645,000 | | | $ | 643,095 | |
Weatherford International 4.50% 4/15/22 | | | 205,000 | | | | 186,351 | |
Western Gas Partners 3.95% 6/1/25 | | | 245,000 | | | | 234,766 | |
Woodside Finance | | | | | | | | |
144A 3.65% 3/5/25 # | | | 320,000 | | | | 309,578 | |
144A 8.75% 3/1/19 # | | | 540,000 | | | | 646,426 | |
YPF 7.774% 8/15/18 ● | | | 382,353 | | | | 388,088 | |
| | | | | | | | |
| | | | | | | 25,460,022 | |
| | | | | | | | |
Finance Companies – 1.62% | | | | | | | | |
Aviation Capital Group 144A 6.75% 4/6/21 # | | | 430,000 | | | | 489,812 | |
General Electric Capital | | | | | | | | |
0.684% 5/5/26 ● | | | 965,000 | | | | 912,104 | |
0.903% 1/9/20 ● | | | 2,160,000 | | | | 2,165,901 | |
1.286% 3/15/23 ● | | | 1,050,000 | | | | 1,053,359 | |
144A 3.80% 6/18/19 # | | | 250,000 | | | | 264,819 | |
6.00% 8/7/19 | | | 215,000 | | | | 247,078 | |
7.125% 12/29/49 ● | | | 700,000 | | | | 810,250 | |
Peachtree Corners Funding Trust 144A 3.976% 2/15/25 # | | | 375,000 | | | | 376,161 | |
| | | | | | | | |
| | | | | | | 6,319,484 | |
| | | | | | | | |
Insurance – 0.79% | | | | | | | | |
American International Group 3.75% 7/10/25 | | | 330,000 | | | | 330,656 | |
MetLife 5.25% 12/29/49 ● | | | 1,030,000 | | | | 1,030,000 | |
Prudential Financial | | | | | | | | |
5.375% 5/15/45 ● | | | 295,000 | | | | 291,681 | |
5.625% 6/15/43 ● | | | 365,000 | | | | 379,983 | |
UnitedHealth Group 3.75% 7/15/25 | | | 445,000 | | | | 454,066 | |
Voya Financial 5.65% 5/15/53 ● | | | 385,000 | | | | 395,241 | |
XLIT 6.50% 10/29/49 ● | | | 250,000 | | | | 212,500 | |
| | | | | | | | |
| | | | | | | 3,094,127 | |
| | | | | | | | |
Natural Gas – 2.41% | | | | | | | | |
Enbridge | | | | | | | | |
0.734% 6/2/17 ● | | | 1,800,000 | | | | 1,780,299 | |
0.934% 10/1/16 ● | | | 2,700,000 | | | | 2,691,279 | |
Enbridge Energy Partners 8.05% 10/1/37 ● | | | 411,000 | | | | 421,891 | |
Enterprise Products Operating 7.034% 1/15/68 ● | | | 635,000 | | | | 681,037 | |
Laclede Group 1.024% 8/15/17 ● | | | 1,320,000 | | | | 1,318,510 | |
TransCanada PipeLines 0.962% 6/30/16 ● | | | 2,500,000 | | | | 2,503,585 | |
| | | | | | | | |
| | | | | | | 9,396,601 | |
| | | | | | | | |
Real Estate – 1.12% | | | | | | | | |
Alexandria Real Estate Equities 4.60% 4/1/22 | | | 80,000 | | | | 84,941 | |
AvalonBay Communities 3.45% 6/1/25 | | | 635,000 | | | | 632,472 | |
16
| | | | | | | | |
| | | Principal amount° | | | Value (U.S. $) | |
| |
Corporate Bonds (continued) | | | | | | | | |
| |
Real Estate (continued) | | | | | | | | |
CBL & Associates | | | | | | | | |
4.60% 10/15/24 | | | 455,000 | | | $ | 453,172 | |
5.25% 12/1/23 | | | 95,000 | | | | 98,615 | |
Corporate Office Properties | | | | | | | | |
3.60% 5/15/23 | | | 225,000 | | | | 208,362 | |
5.25% 2/15/24 | | | 575,000 | | | | 594,178 | |
DDR 3.625% 2/1/25 | | | 395,000 | | | | 378,795 | |
Education Realty Operating Partnership 4.60% 12/1/24 | | | 465,000 | | | | 470,037 | |
Hospitality Properties Trust 4.50% 3/15/25 | | | 460,000 | | | | 451,856 | |
Omega Healthcare Investors 144A 4.50% 4/1/27 # | | | 390,000 | | | | 376,468 | |
Ventas Realty 4.125% 1/15/26 | | | 205,000 | | | | 205,796 | |
WP Carey 4.60% 4/1/24 | | | 400,000 | | | | 405,052 | |
| | | | | | | | |
| | | | | | | 4,359,744 | |
| | | | | | | | |
Technology – 5.37% | | | | | | | | |
Alibaba Group Holding | | | | | | | | |
144A 0.806% 11/28/17 #● | | | 1,950,000 | | | | 1,941,227 | |
144A 3.125% 11/28/21 # | | | 435,000 | | | | 428,136 | |
Baidu 2.75% 6/9/19 | | | 1,010,000 | | | | 1,011,190 | |
eBay 0.78% 8/1/19 ● | | | 2,635,000 | | | | 2,578,869 | |
Fiserv 3.85% 6/1/25 | | | 160,000 | | | | 160,307 | |
Flextronics International 144A 4.75% 6/15/25 # | | | 440,000 | | | | 430,650 | |
Intel 3.70% 7/29/25 | | | 245,000 | | | | 247,621 | |
International Business Machines 0.881% 11/6/21 ● | | | 4,660,000 | | | | 4,695,533 | |
Molex Electronic Technologies | | | | | | | | |
144A 2.878% 4/15/20 # | | | 455,000 | | | | 449,885 | |
144A 3.90% 4/15/25 # | | | 345,000 | | | | 336,053 | |
Motorola Solutions 4.00% 9/1/24 | | | 705,000 | | | | 690,354 | |
National Semiconductor 6.60% 6/15/17 | | | 310,000 | | | | 341,060 | |
Oracle 0.794% 10/8/19 ● | | | 5,000,000 | | | | 5,033,345 | |
QUALCOMM | | | | | | | | |
3.00% 5/20/22 | | | 325,000 | | | | 316,355 | |
3.45% 5/20/25 | | | 305,000 | | | | 289,178 | |
Samsung Electronics America 144A 1.75% 4/10/17 # | | | 500,000 | | | | 502,741 | |
Seagate HDD Cayman | | | | | | | | |
4.75% 1/1/25 | | | 875,000 | | | | 867,947 | |
144A 4.875% 6/1/27 # | | | 65,000 | | | | 62,666 | |
Tencent Holdings 144A 3.375% 5/2/19 # | | | 565,000 | | | | 578,689 | |
| | | | | | | | |
| | | | | | | 20,961,806 | |
| | | | | | | | |
Transportation – 0.45% | | | | | | | | |
Air Canada 2015-1 Class A Pass Through Trust 144A | | | | | | | | |
3.60% 3/15/27 #¨ | | | 235,000 | | | | 227,997 | |
17
| | |
| Schedule of investments | | |
Delaware Diversified Floating Rate Fund | | |
| | | | | | | | |
| | | Principal amount° | | | Value (U.S. $) | |
| |
Corporate Bonds (continued) | | | | | | | | |
| |
Transportation (continued) | | | | | | | | |
American Airlines 2014-1 Class A Pass Through Trust | | | | | | | | |
3.70% 10/1/26 ¨ | | | 247,526 | | | $ | 245,967 | |
ERAC USA Finance 144A 5.25% 10/1/20 # | | | 120,000 | | | | 133,417 | |
HPHT Finance 15 144A 2.875% 3/17/20 # | | | 290,000 | | | | 288,902 | |
Trinity Industries 4.55% 10/1/24 | | | 540,000 | | | | 529,147 | |
United Airlines 2014-1 Class A Pass Through Trust | | | | | | | | |
4.00% 4/11/26 ¨ | | | 200,000 | | | | 201,500 | |
United Airlines 2014-2 Class A Pass Through Trust | | | | | | | | |
3.75% 9/3/26 ¨ | | | 110,000 | | | | 109,175 | |
| | | | | | | | |
| | | | | | | 1,736,105 | |
| | | | | | | | |
Utilities – 0.26% | | | | | | | | |
State Grid Overseas Investment 2014 144A | | | | | | | | |
2.75% 5/7/19 # | | | 1,005,000 | | | | 1,023,928 | |
| | | | | | | | |
| | | | | | | 1,023,928 | |
| | | | | | | | |
Total Corporate Bonds (cost $192,576,481) | | | | | | | 191,984,513 | |
| | | | | | | | |
|
| |
Municipal Bonds – 3.34% | | | | | | | | |
| |
Maryland State Local Facilities 2nd Loan | | | | | | | | |
Series A 5.00% 8/1/21 | | | 225,000 | | | | 268,958 | |
Mississippi State | | | | | | | | |
Series C 5.00% 10/1/25 | | | 870,000 | | | | 1,074,955 | |
Missouri Higher Education Loan Authority | | | | | | | | |
Series 2010-2 A-1 1.132% 8/27/29 ● | | | 32,207 | | | | 32,491 | |
Missouri State Highway & Transportation Commission | | | | | | | | |
Revenue (First Lien) Series A | | | | | | | | |
5.00% 5/1/26 | | | 805,000 | | | | 1,011,539 | |
New Mexico Educational Assistance | | | | | | | | |
Foundation (Libor Floating) | | | | | | | | |
Series 2010-1 A-3 1.483% 12/1/38 ● | | | 120,000 | | | | 119,699 | |
New York City, New York | | | | | | | | |
Series I 5.00% 8/1/22 | | | 185,000 | | | | 219,823 | |
New York State Thruway Authority Revenue | | | | | | | | |
Series A 5.00% 5/1/19 | | | 260,000 | | | | 295,454 | |
North Texas Higher Education Authority Student Loan | | | | | | | | |
Revenue (Libor Floating) | | | | | | | | |
Series 2010-1 A-2 1.184% 7/1/30 ● | | | 60,000 | | | | 60,097 | |
Series 2011-1 A 1.384% 4/1/40 ● | | | 219,924 | | | | 222,042 | |
Oklahoma Student Loan Authority (Libor-Indexed) | | | | | | | | |
Series 2010-A A-2A 1.483% 9/1/37 ● | | | 95,000 | | | | 94,288 | |
Series 2011-1 A-1 1.433% 6/1/40 ● | | | 562,378 | | | | 569,172 | |
Pennsylvania Turnpike Commission | | | | | | | | |
Series B-1 1.00% 12/1/21 ● | | | 1,150,000 | | | | 1,144,951 | |
18
| | | | | | | | |
| | | Principal amount° | | | Value (U.S. $) | |
| |
Municipal Bonds (continued) | | | | | | | | |
| |
State of California | | | | | | | | |
Series D 0.834% 12/1/28 ● | | | 2,000,000 | | | $ | 2,021,680 | |
University of California | | | | | | | | |
Series AO 5.00% 5/15/25 | | | 645,000 | | | | 792,834 | |
Series Y-1 0.688% 7/1/41 ● | | | 2,000,000 | | | | 1,999,800 | |
Utah Transit Authority | | | | | | | | |
Series A 5.00% 6/15/25 | | | 795,000 | | | | 986,698 | |
Washington State Motor Vehicle Fuel | | | | | | | | |
Series C 5.00% 2/1/25 | | | 1,715,000 | | | | 2,100,326 | |
| | | | | | | | |
Total Municipal Bonds (cost $13,052,434) | | | | | | | 13,014,807 | |
| | | | | | | | |
|
| |
Non-Agency Asset-Backed Securities – 8.33% | | | | | | | | |
| |
American Express Credit Account Master Trust | | | | | | | | |
Series 2014-1 A 0.557% 12/15/21 ● | | | 5,000,000 | | | | 4,998,005 | |
Avenue CLO VI | | | | | | | | |
Series 2007-6A A1 144A 0.514% 7/17/19 #● | | | 23,101 | | | | 22,912 | |
Capital One Multi-Asset Execution Trust | | | | | | | | |
Series 2007-A1 A1 0.237% 11/15/19 ● | | | 2,000,000 | | | | 1,993,212 | |
Chase Issuance Trust | | | | | | | | |
Series 2007-A2 A2 0.237% 4/15/19 ● | | | 1,665,000 | | | | 1,659,284 | |
Series 2013-A6 A6 0.607% 7/15/20 ● | | | 1,625,000 | | | | 1,628,900 | |
Series 2014-A5 A5 0.557% 4/15/21 ● | | | 3,595,000 | | | | 3,592,487 | |
Chesapeake Funding | | | | | | | | |
Series 2012-2A A 144A 0.644% 5/7/24 #● | | | 324,669 | | | | 324,726 | |
Series 2014-1A A 144A 0.608% 3/7/26 #● | | | 177,909 | | | | 177,496 | |
Citibank Credit Card Issuance Trust | | | | | | | | |
Series 2013-A7 A7 0.619% 9/10/20 ● | | | 1,700,000 | | | | 1,705,777 | |
Discover Card Execution Note Trust | | | | | | | | |
Series 2013-A1 A1 0.487% 8/17/20 ● | | | 675,000 | | | | 675,033 | |
Series 2014-A1 A1 0.617% 7/15/21 ● | | | 300,000 | | | | 300,313 | |
Flagship VII CLO | | | | | | | | |
Series 2013-7A A1 144A 1.757% 1/20/26 #● | | | 1,000,000 | | | | 993,100 | |
Ford Credit Floorplan Master Owner Trust A | | | | | | | | |
Series 2014-1 A2 0.587% 2/15/19 ● | | | 2,000,000 | | | | 2,002,882 | |
Golden Credit Card Trust | | | | | | | | |
Series 2015-1A A 144A 0.627% 2/15/20 #● | | | 300,000 | | | | 299,892 | |
Hertz Fleet Lease Funding | | | | | | | | |
Series 2014-1 A 144A 0.589% 4/10/28 #● | | | 216,802 | | | | 216,553 | |
KKR Financial CLO | | | | | | | | |
Series 2013-1A A1 144A 1.439% 7/15/25 #● | | | 1,395,000 | | | | 1,368,355 | |
LCM VI | | | | | | | | |
Series 6A A 144A 0.516% 5/28/19 #● | | | 166,151 | | | | 165,204 | |
19
| | |
| Schedule of investments | | |
Delaware Diversified Floating Rate Fund | | |
| | | | | | | | |
| | | Principal amount° | | | Value (U.S. $) | |
| |
Non-Agency Asset-Backed Securities (continued) | | | | | | | | |
| |
MAPS CLO Fund II | | | | | | | | |
Series 2007-2A A1 144A 0.527% 7/20/22 #● | | | 1,041,327 | | | $ | 1,021,646 | |
Mountain View Funding CLO | | | | | | | | |
Series 2007-3A A1 144A 0.504% 4/16/21 #● | | | 1,061,406 | | | | 1,052,702 | |
NYLIM Flatiron CLO | | | | | | | | |
Series 2006-1A A2A 144A 0.496% 8/8/20 #● | | | 199,589 | | | | 198,491 | |
OCP CLO | | | | | | | | |
Series 2013-4A A1A 144A 1.693% 10/24/25 #● | | | 1,500,000 | | | | 1,491,300 | |
PFS Financing | | | | | | | | |
Series 2013-AA A 144A 0.737% 2/15/18 #● | | | 680,000 | | | | 679,446 | |
Series 2015-AA A 144A 0.807% 4/15/20 #● | | | 500,000 | | | | 495,863 | |
Telos CLO | | | | | | | | |
Series 2013-4A A 144A 1.589% 7/17/24 #● | | | 2,000,000 | | | | 1,979,200 | |
Series 2013-4A X 144A 1.239% 7/17/24 #● | | | 250,000 | | | | 249,925 | |
Trade MAPS 1 | | | | | | | | |
Series 2013-1A A 144A 0.889% 12/10/18 #● | | | 3,200,000 | | | | 3,200,282 | |
| | | | | | | | |
Total Non-Agency Asset-Backed Securities
(cost $32,471,052) | | | | | | | 32,492,986 | |
| | | | | | | | |
|
| |
Senior Secured Loans – 32.45%« | | | | | | | | |
| |
Accudyne Industries (Hamilton Sundstrand Industrial) 1st Lien | | | | | | | | |
4.00% 12/13/19 | | | 1,260,000 | | | | 1,217,160 | |
Air Medical Group Holdings Tranche B 1st Lien | | | | | | | | |
4.50% 4/28/22 | | | 1,075,000 | | | | 1,070,745 | |
Albertson’s Holdings Tranche B4 1st Lien 5.50% 8/25/21 | | | 1,720,688 | | | | 1,729,976 | |
Albertsons Tranche B 1st Lien 5.375% 3/21/19 | | | 359,466 | | | | 361,488 | |
Altice Financing Tranche B 1st Lien 5.25% 2/4/22 | | | 860,000 | | | | 869,496 | |
American Tire Distributors 1st Lien 5.25% 9/26/21 | | | 608,475 | | | | 614,560 | |
Apollo Security Services Borrower 1st Lien 5.00% 7/1/21 | | | 1,755,000 | | | | 1,763,775 | |
Apollo Security Services Borrower 2nd Lien 9.75% 7/1/22 | | | 1,460,000 | | | | 1,449,050 | |
Atkore International 2nd Lien 7.75% 10/9/21 | | | 919,000 | | | | 868,455 | |
Avaya 4.691% 10/26/17 | | | 1,918,995 | | | | 1,906,869 | |
Axalta Coating Systems U.S. Holdings 1st Lien | | | | | | | | |
3.75% 2/1/20 | | | 327,783 | | | | 327,919 | |
BJ’s Wholesale Club | | | | | | | | |
4.50% 9/26/19 | | | 635,080 | | | | 636,963 | |
8.50% 3/31/20 | | | 1,680,000 | | | | 1,695,750 | |
Builders FirstSource Tranche B 1st Lien 6.00% 7/31/22 | | | 1,545,000 | | | | 1,545,000 | |
BWAY Holding Tranche B 1st Lien 5.50% 8/14/20 | | | 1,420,650 | | | | 1,430,639 | |
Cable & Wireless Communications 5.50% 12/31/16 | | | 597,717 | | | | 598,091 | |
Cable & Wireless Communications (Unsecured) | | | | | | | | |
6.50% 3/31/17 | | | 565,000 | | | | 565,353 | |
Caesars Growth Properties Holdings Tranche B 1st Lien | | | | | | | | |
6.25% 5/8/21 | | | 3,070,129 | | | | 2,594,259 | |
20
| | | | | | | | |
| | | Principal amount° | | | Value (U.S. $) | |
| |
Senior Secured Loans« (continued) | | | | | | | | |
| |
Calpine Construction Finance Tranche B 3.00% 5/3/20 | | | 1,872,489 | | | $ | 1,858,835 | |
CCO Safari III Tranche H 1st Lien 3.25% 7/23/21 | | | 174,000 | | | | 174,299 | |
CCO Safari III Tranche I 1st Lien 3.50% 1/23/23 | | | 523,000 | | | | 524,728 | |
CD&R Millennium Holdco 6 (Mauser Holdings) 2nd Lien | | | | | | | | |
8.75% 7/31/22 | | | 245,000 | | | | 242,550 | |
CDS US Intermediate Holdings (Cirque Du Soleil) 1st Lien | | | | | | | | |
6.25% 7/8/22 | | | 820,000 | | | | 826,765 | |
CDS US Intermediate Holdings 2nd Lien 10.50% 6/24/23 | | | 585,000 | | | | 589,387 | |
Charter Communications Operating 3.00% 7/1/20 | | | 508,989 | | | | 508,035 | |
Charter Communications Operating Tranche F | | | | | | | | |
3.00% 1/3/21 | | | 945,089 | | | | 943,580 | |
CityCenter Holdings Tranche B 1st Lien 4.25% 10/16/20 | | | 739,226 | | | | 742,131 | |
CommScope Term Loan B 1st Lien 3.75% 12/29/22 | | | 629,000 | | | | 631,883 | |
Communications Sales & Leasing Tranche B 1st Lien | | | | | | | | |
5.00% 10/24/22 | | | 725,000 | | | | 707,781 | |
Community Health Systems Tranche F 1st Lien | | | | | | | | |
3.534% 12/31/18 | | | 859,460 | | | | 862,415 | |
Community Health Systems Tranche H 1st Lien | | | | | | | | |
4.00% 1/27/21 | | | 230,000 | | | | 231,230 | |
Crown Castles Operating Tranche B2 3.00% 1/31/21 | | | 1,044,468 | | | | 1,042,901 | |
DaVita Healthcare Partners Tranche B 3.50% 6/24/21 | | | 1,420,650 | | | | 1,425,682 | |
DBP Holding Tranche B 5.00% 10/11/19 | | | 575,000 | | | | 555,774 | |
Dealer Computer Services (Reynolds & Reynolds) Tranche B | | | | | | | | |
2.191% 4/21/16 | | | 156,193 | | | | 156,193 | |
Drillship Ocean Ventures (Ocean Rig) Tranche B 1st Lien | | | | | | | | |
5.50% 7/25/21 | | | 1,212,568 | | | | 1,000,621 | |
Drillships Financing Holding Tranche B1 6.00% 3/31/21 | | | 1,013,659 | | | | 792,935 | |
Dynegy Tranche B2 4.00% 4/23/20 | | | 578,943 | | | | 581,054 | |
Emdeon 3.75% 11/2/18 | | | 2,031,969 | | | | 2,031,121 | |
Endo Luxembourg Finance I Sarl 1st Lien | | | | | | | | |
3.50% 6/24/16 @ | | | 235,000 | | | | 235,441 | |
Endo Luxembourg Finance I Sarl Tranche B 1st Lien | | | | | | | | |
3.75% 6/24/22 | | | 585,000 | | | | 588,427 | |
Energy Transfer Equity 3.25% 12/2/19 | | | 175,000 | | | | 174,316 | |
Energy Transfer Equity 1st Lien 4.00% 12/2/19 | | | 720,294 | | | | 721,026 | |
First Data Tranche B 1st Lien | | | | | | | | |
3.687% 3/24/17 | | | 961,000 | | | | 960,925 | |
4.187% 3/24/21 | | | 2,777,625 | | | | 2,790,549 | |
Flint Group 1st Lien 4.50% 9/7/21 | | | 532,315 | | | | 534,560 | |
Flint Group 2nd Lien 8.25% 9/7/22 | | | 250,000 | | | | 248,750 | |
Flint Group Tranche C 1st Lien 4.50% 9/7/21 | | | 87,998 | | | | 88,300 | |
FMG Resources August 2006 Pty 1st Lien 3.75% 6/30/19 | | | 1,562,509 | | | | 1,284,350 | |
Gardner Denver 4.25% 7/30/20 | | | 2,452,746 | | | | 2,372,267 | |
Gates Global 1st Lien 4.25% 7/3/21 | | | 704,675 | | | | 702,858 | |
21
| | |
| Schedule of investments | | |
Delaware Diversified Floating Rate Fund | | |
| | | | | | | | |
| | | Principal amount° | | | Value (U.S. $) | |
| |
Senior Secured Loans« (continued) | | | | | | | | |
| |
Global Cash Access Tranche B 6.25% 12/19/20 | | | 1,579,647 | | | $ | 1,595,938 | |
Green Energy Partners (Panda Stonewall) Tranche B 6.50% 11/13/21 | | | 1,240,000 | | | | 1,259,375 | |
Hanson Building Tranche B 1st Lien 6.50% 3/13/22 | | | 648,375 | | | | 650,806 | |
HD Supply Tranche B 4.00% 6/28/18 | | | 3,484,548 | | | | 3,494,130 | |
Hilton Worldwide Finance 3.50% 10/25/20 | | | 2,006,952 | | | | 2,013,380 | |
Houghton International 9.75% 12/21/20 | | | 195,000 | | | | 195,487 | |
Houghton International 1st Lien 4.25% 12/20/19 | | | 1,126,150 | | | | 1,129,317 | |
Huntsman International Tranche B 1st Lien 3.75% 10/1/21 | | | 2,557,150 | | | | 2,556,084 | |
Hyperion Insurance Group Tranche B 1st Lien 5.50% 4/30/22 | | | 807,975 | | | | 818,075 | |
IASIS Healthcare Tranche B 1st Lien 4.50% 5/3/18 | | | 861,420 | | | | 864,650 | |
IBC Capital (Goodpack) 1st Lien 4.75% 9/15/21 | | | 992,513 | | | | 971,835 | |
iHeartCommunications (Clear Channel Communications) Tranche D
6.94% 1/30/19 | | | 2,865,000 | | | | 2,638,187 | |
iHeartCommunications (Clear Channel Communications) Tranche E 1st Lien 7.69% 7/30/19 | | | 498,032 | | | | 464,664 | |
Immucor 5.00% 8/19/18 | | | 2,137,542 | | | | 2,145,558 | |
Ineos U.S. Finance Tranche B 3.75% 12/15/20 | | | 545,290 | | | | 544,540 | |
Ineos U.S. Finance Tranche B 1st Lien 4.25% 3/31/22 | | | 812,961 | | | | 815,865 | |
Informatica Tranche B 1st Lien 4.50% 6/3/22 | | | 400,000 | | | | 400,792 | |
Intelsat Jackson Holdings 3.75% 6/30/19 | | | 2,850,641 | | | | 2,826,142 | |
KIK Custom Products 1st Lien 5.50% 4/29/19 | | | 1,273,586 | | | | 1,276,650 | |
KIK Custom Products 2nd Lien 9.50% 10/29/19 | | | 235,000 | | | | 236,567 | |
Kinetic Concepts Tranche E1 4.50% 5/4/18 | | | 372,893 | | | | 375,136 | |
Landry’s Tranche B 4.00% 4/24/18 | | | 1,592,714 | | | | 1,600,393 | |
Level 3 Financing 4.00% 1/15/20 | | | 2,365,000 | | | | 2,374,238 | |
LTS Buyer (Lightower Fiber Networks) 1st Lien 4.00% 4/13/20 | | | 171,500 | | | | 171,000 | |
LTS Buyer 2nd Lien 8.00% 4/1/21 | | | 1,488,075 | | | | 1,485,594 | |
Marina District Finance (Borgata) Tranche B 1st Lien 6.50% 8/15/18 | | | 1,126,671 | | | | 1,140,854 | |
MGM Resorts International 3.50% 12/20/19 | | | 2,681,287 | | | | 2,676,538 | |
Moxie Patriot Tranche B1 6.75% 12/19/20 | | | 1,760,000 | | | | 1,766,600 | |
MPH Acquisition (Multiplan) Tranche B 3.75% 3/31/21 | | | 764,541 | | | | 760,718 | |
Murray Energy Tranche B1 1st Lien 7.00% 4/14/17 | | | 400,000 | | | | 388,500 | |
Murray Energy Tranche B2 1st Lien 7.50% 4/16/20 | | | 380,000 | | | | 316,587 | |
NEP/NCP Tranche B 1st Lien 4.25% 1/22/20 | | | 232,068 | | | | 231,053 | |
New Albertsons 1st Lien 4.75% 6/27/21 | | | 372,188 | | | | 373,537 | |
New HB Acquisition (Hostess Brands) 1st Lien 6.75% 3/20/20 | | | 1,042,566 | | | | 1,068,630 | |
NRG Energy Tranche B 2.75% 7/1/18 | | | 399,114 | | | | 398,026 | |
Numericable U.S. 4.50% 5/21/20 | | | 1,798,124 | | | | 1,806,741 | |
Numericable U.S. Tranche B2 1st Lien 4.50% 5/21/20 | | | 1,555,623 | | | | 1,562,105 | |
22
| | | | | | | | |
| | | Principal amount° | | | Value (U.S. $) | |
| |
Senior Secured Loans« (continued) | | | | | | | | |
| |
Offshore Group Investment (Vantage Drilling) Tranche B 1st Lien
5.00% 10/25/17 | | | 3,603 | | | $ | 2,220 | |
Pabst Blue Ribbon 1st Lien 5.75% 11/13/21 | | | 1,038,038 | | | | 1,043,877 | |
Pabst Blue Ribbon 2nd Lien 9.25% 11/13/22 | | | 400,000 | | | | 398,000 | |
Panda Liberty (Moxie Liberty) Tranche B 7.50% 8/21/20 | | | 2,049,000 | | | | 2,054,123 | |
Quickrete Holdings 7.00% 3/30/21 | | | 879,789 | | | | 886,938 | |
Reynolds Group Holdings Tranche B 1st Lien 4.50% 12/1/18 | | | 1,187,596 | | | | 1,195,759 | |
Rite Aid 5.75% 8/21/20 | | | 1,275,000 | | | | 1,290,141 | |
Rite Aid 2nd Lien 4.875% 6/21/21 | | | 750,000 | | | | 752,695 | |
SAM Finance Lux Sarl (Santander Asset Management) Tranche B
4.25% 12/17/20 | | | 620,801 | | | | 624,293 | |
Scientific Games International 6.00% 10/18/20 | | | 2,206,400 | | | | 2,218,198 | |
Scientific Games International Tranche B2 1st Lien 6.00% 10/1/21 | | | 1,054,700 | | | | 1,060,501 | |
Seminole Tribe of Florida Tranche B 3.00% 4/29/20 | | | 842,500 | | | | 843,992 | |
Sensus USA 8.50% 5/9/18 | | | 565,000 | | | | 562,175 | |
SIG Combibloc PurchaseCo Sarl 1st Lien 4.25% 3/13/22 | | | 259,350 | | | | 260,376 | |
Sinclair Television Group Tranche B1 1st Lien 3.50% 7/30/21 | | | 690,000 | | | | 691,078 | |
Smart & Final Stores Tranche B 1st Lien 4.00% 11/15/19 | | | 178,034 | | | | 178,339 | |
Solenis International (Ashland Water) 1st Lien 4.25% 7/31/21 | | | 585,575 | | | | 583,257 | |
Solenis International (Ashland Water) 2nd Lien 7.75% 7/31/22 | | | 475,000 | | | | 461,641 | |
Spectrum Brands 1st Lien 3.75% 6/23/22 | | | 550,345 | | | | 553,440 | |
SS&C Technologies (European Holdings) Tranche B2 1st Lien 4.00% 7/8/22 | | | 79,103 | | | | 79,836 | |
SS&C Technologies Tranche B1 1st Lien 4.00% 6/23/22 | | | 479,892 | | | | 484,341 | |
Standard Aero 1st Lien 5.25% 7/7/22 | | | 585,000 | | | | 586,646 | |
Summit Materials Tranche B 1st Lien 4.25% 7/17/22 | | | 585,000 | | | | 587,925 | |
SUPERVALU 1st Lien 4.50% 3/21/19 | | | 656,438 | | | | 659,923 | |
Surgical Care Affiliates Tranche B 1st Lien 4.25% 3/17/22 | | | 558,600 | | | | 559,298 | |
TransDigm Tranche E 1st Lien 3.50% 5/14/22 | | | 1,832,739 | | | | 1,826,194 | |
Tribune Media Tranche B 1st Lien 3.75% 12/28/20 | | | 585,000 | | | | 586,459 | |
United Continental Tranche B 3.25% 4/1/19 | | | 371,450 | | | | 371,876 | |
Univar Tranche B 1st Lien 4.25% 7/1/22 | | | 187,000 | | | | 187,584 | |
Univision Communications 1st Lien 4.00% 3/1/20 | | | 1,978,417 | | | | 1,978,417 | |
Univision Communications Tranche C4 4.00% 3/1/20 | | | 2,886,510 | | | | 2,888,513 | |
US Airways Tranche B1 3.50% 5/23/19 | | | 438,129 | | | | 438,168 | |
US Airways Tranche B2 3.00% 11/23/16 | | | 148,960 | | | | 149,038 | |
USI 4.25% 12/27/19 | | | 682,592 | | | | 683,587 | |
Valeant Pharmaceuticals International 3.50% 8/5/20 | | | 1,765,060 | | | | 1,769,000 | |
23
| | |
| Schedule of investments | | |
Delaware Diversified Floating Rate Fund | | |
| | | | | | | | |
| | | Principal amount° | | | Value (U.S. $) | |
| |
Senior Secured Loans« (continued) | | | | | | | | |
| |
Valeant Pharmaceuticals International Tranche B-F1 1st
Lien 4.00% 4/2/22 | | | 533,663 | | | $ | 536,785 | |
Varsity Brands Tranche B 1st Lien 5.00% 12/15/21 | | | 980,075 | | | | 986,813 | |
Wide Open West Finance Tranche B 1st Lien
4.50% 4/1/19 | | | 1,763,933 | | | | 1,768,500 | |
| | | | | | | | |
Total Senior Secured Loans (cost $127,351,045) | | | | | | | 126,561,455 | |
| | | | | | | | |
|
| |
Sovereign Bonds – 0.24%D | | | | | | | | |
| |
Colombia – 0.06% | | | | | | | | |
Colombia Government International Bond | | | | | | | | |
2.076% 11/16/15 ● | | | 240,000 | | | | 240,646 | |
| | | | | | | | |
| | | | | | | 240,646 | |
| | | | | | | | |
Kazakhstan – 0.05% | | | | | | | | |
Kazakhstan Government International Bond 144A | | | | | | | | |
5.125% 7/21/25 # | | | 200,000 | | | | 198,424 | |
| | | | | | | | |
| | | | | | | 198,424 | |
| | | | | | | | |
Norway – 0.13% | | | | | | | | |
Kommunalbanken 144A 0.456% 2/20/18 #● | | | 500,000 | | | | 501,910 | |
| | | | | | | | |
| | | | | | | 501,910 | |
| | | | | | | | |
Total Sovereign Bonds (cost $939,127) | | | | | | | 940,980 | |
| | | | | | | | |
|
| |
Supranational Bank – 0.14% | | | | | | | | |
| |
Banco Latinoamericano de Comercio Exterior 144A | | | | | | | | |
3.25% 5/7/20 # | | | 525,000 | | | | 525,263 | |
| | | | | | | | |
Total Supranational Bank (cost $523,178) | | | | | | | 525,263 | |
| | | | | | | | |
|
| |
U.S. Treasury Obligations – 0.08% | | | | | | | | |
| |
U.S. Treasury Note | | | | | | | | |
1.625% 6/30/20 | | | 185,000 | | | | 185,780 | |
2.125% 5/15/25 | | | 140,000 | | | | 139,048 | |
| | | | | | | | |
Total U.S. Treasury Obligations (cost $323,408) | | | | | | | 324,828 | |
| | | | | | | | |
| | |
| | | Number of shares | | | | |
| |
Convertible Preferred Stock – 0.11% | | | | | | | | |
| |
Chesapeake Energy 5.75% exercise price $26.10,
expiration date 12/31/49 | | | 145 | | | | 75,146 | |
Crown Castle International 4.50% exercise price $88.50,
expiration date 11/1/16 | | | 350 | | | | 36,193 | |
Dynegy 5.375% exercise price $38.75, expiration date
11/1/17 @ | | | 450 | | | | 42,305 | |
Intelsat 5.75% exercise price $22.05, expiration date
5/1/16 | | | 2,669 | | | | 72,357 | |
24
| | | | | | | | |
| | | Number of shares | | | Value (U.S. $) | |
| |
Convertible Preferred Stock (continued) | | | | | | | | |
| |
Maiden Holdings 7.25% exercise price $15.30, expiration
date 9/15/16 | | | 3,375 | | | $ | 194,636 | |
| | | | | | | | |
Total Convertible Preferred Stock (cost $565,160) | | | | | | | 420,637 | |
| | | | | | | | |
|
| |
Preferred Stock – 1.37% | | | | | | | | |
| |
Bank of America 6.10% ● | | | 255,000 | | | | 254,171 | |
Integrys Energy Group 6.00% ● | | | 29,900 | | | | 826,137 | |
National Retail Properties 5.70% | | | 7,525 | | | | 185,416 | |
PNC Preferred Funding Trust II 144A 1.508% #● | | | 2,500,000 | | | | 2,306,250 | |
Public Storage 5.20% | | | 3,200 | | | | 76,864 | |
Qwest 6.125% | | | 9,000 | | | | 226,350 | |
USB Realty 144A 1.436% #● | | | 1,600,000 | | | | 1,476,000 | |
| | | | | | | | |
Total Preferred Stock (cost $5,322,875) | | | | | | | 5,351,188 | |
| | | | | | | | |
| | |
| | | Principal amount° | | | | |
| |
Short-Term Investments – 0.44% | | | | | | | | |
| |
Discount Notes – 0.44%≠ | | | | | | | | |
Federal Home Loan Bank | | | | | | | | |
0.05% 8/14/15 | | | 207,900 | | | | 207,900 | |
0.065% 8/5/15 | | | 183,150 | | | | 183,150 | |
0.07% 8/11/15 | | | 301,915 | | | | 301,915 | |
0.075% 9/18/15 | | | 314,925 | | | | 314,909 | |
0.105% 11/3/15 | | | 292,199 | | | | 292,131 | |
Freddie Mac 0.075% 10/1/15 | | | 425,930 | | | | 425,895 | |
| | | | | | | | |
| | | | | | | 1,725,900 | |
| | | | | | | | |
Total Short-Term Investments (cost $1,725,841) | | | | | | | 1,725,900 | |
| | | | | | | | |
| | |
Total Value of Securities – 97.73%
(cost $382,755,438) | | | | | | $ | 381,149,042 | |
| | | | | | | | |
| # | Security exempt from registration under Rule 144A of the Securities Act of 1933, as amended. At July 31, 2015, the aggregate value of Rule 144A securities was $63,197,524, which represents 16.20% of the Fund’s net assets. See Note 12 in “Notes to financial statements.” |
| @ | Illiquid security. At July 31, 2015, the aggregate value of illiquid securities was $277,746, which represents 0.07% of the Fund’s net assets. See Note 12 in “Notes to financial statements.” |
| ¿ | Pass Through Agreement. Security represents the contractual right to receive a proportionate amount of underlying payments due to the counterparty pursuant to various agreements related to the rescheduling of obligations and the exchange of certain notes. |
| ≠ | The rate shown is the effective yield at the time of purchase. |
| ° | Principal amount shown is stated in U.S. dollars unless noted that the security is denominated in another currency. |
25
| | |
| Schedule of investments | | |
Delaware Diversified Floating Rate Fund | | |
| ● | Variable rate security. The rate shown is the rate as of July 31, 2015. Interest rates reset periodically. |
| D | Securities have been classified by country of origin. |
| « | Senior secured loans generally pay interest at rates which are periodically redetermined by reference to a base lending rate plus a premium. These base lending rates are generally: (i) the prime rate offered by one or more U.S. banks, (ii) the lending rate offered by one or more European banks such as the London Interbank Offered Rate (LIBOR), and (iii) the certificate of deposit rate. Senior secured loans may be subject to restrictions on resale. Stated rate in effect at July 31, 2015. |
| f | Step coupon bond. Coupon increases or decreases periodically based on a predetermined schedule. Stated rate in effect at July 31, 2015. |
The following futures contracts and swap contracts were outstanding at July 31, 2015:1
Futures Contracts
| | | | | | | | | | | | | | | | |
Contract to Buy (Sell) | | Notional
Cost
(Proceeds) | | | Notional
Value | | | Expiration
Date | | Unrealized
Appreciation
(Depreciation) | |
(26) | | U.S. Treasury 10 yr Notes | | $ | (3,309,442 | ) | | $ | (3,313,375) | | | 9/21/15 | | $ | (3,933 | ) |
(45) | | USD IRS 5yr | | | (4,551,552 | ) | | | (4,608,984) | | | 9/15/15 | | | (57,432 | ) |
| | | | | | | | | | | | | | | | |
| | | | $ | (7,860,994 | ) | | | | | | | | $ | (61,365 | ) |
| | | | | | | | | | | | | | | | |
Swap Contracts
CDS Contracts2
| | | | | | | | | | | | | | |
Counterparty | | Swap Referenced Obligation | | Notional Value3 | | | Annual
Protection
Payments | | Termination
Date | | Unrealized
Appreciation
(Depreciation)4 | |
| | Protection Purchased: | | | | | | | | | | | | |
CITI | | CDX.EM.23 | | | 1,005,000 | | | 1.00% | | 6/20/20 | | $ | 11,840 | |
HSBC | | CDX.EM.23 | | | 495,000 | | | 1.00% | | 6/20/20 | | | 959 | |
ICE | | JPMC - CDX.NA.HY.24 | | | 3,766,950 | | | 5.00% | | 6/20/20 | | | (17,667 | ) |
ICE | | JPMC - CDX.NA.IG.24 | | | 5,000,000 | | | 1.00% | | 6/20/20 | | | 13,377 | |
| | JPMC - iTraxx Europe Crossover | | | | | | | | | | | | |
ICE | | Series 23 Version 1 | | | EUR 3,700,000 | | | 5.00% | | 6/20/20 | | | 521 | |
| | | | | | | | | | | | | | |
| | | | | | | | | | | | $ | 9,030 | |
| | | | | | | | | | | | | | |
26
Interest Rate Swap Contracts5
| | | | | | | | | | | | | | | | | | | | |
Swap Referenced Obligation & Counterparty | | Notional Value3 | | | Fixed
Interest Rate
Paid | | | Floating
Interest Rate
Received | | | Termination
Date | | | Unrealized
Appreciation
(Depreciation)4 | |
CME - 5 yr | | | | | | | | | | | | | | | | | | | | |
MSC | | | 12,300,000 | | | | 1.677% | | | | 0.286% | | | | 7/11/18 | | | $ | (171,182 | ) |
CME - 7 yr | | | | | | | | | | | | | | | | | | | | |
HSBC | | | 1,000,000 | | | | 2.226% | | | | 0.274% | | | | 5/15/21 | | | | (20,616 | ) |
JPMC | | | 10,000,000 | | | | 2.215% | | | | 0.280% | | | | 5/12/21 | | | | (224,608 | ) |
JPMC | | | 24,500,000 | | | | 2.172% | | | | 0.283% | | | | 6/17/22 | | | | (306,102 | ) |
CME - 10 yr | | | | | | | | | | | | | | | | | | | | |
JPMC | | | 12,745,000 | | | | 2.880% | | | | 0.286% | | | | 7/11/23 | | | | (735,354 | ) |
MSC | | | 8,200,000 | | | | 2.333% | | | | 0.276% | | | | 5/8/25 | | | | (43,951 | ) |
LCH - 5 yr | | | | | | | | | | | | | | | | | | | | |
GSI | | | 3,300,000 | | | | 1.214% | | | | 0.282% | | | | 6/10/18 | | | | (3,373 | ) |
| | | | | | | | | | | | | | | | | | | | |
| | | | | | | | | | | | | | | | | | $ | (1,505,186 | ) |
| | | | | | | | | | | | | | | | | | | | |
The use of future contracts and swap contracts involves elements of market risk and risks in excess of the amounts disclosed in the financial statements. The notional values presented above represent the Fund’s total exposure in such contracts, whereas only the net unrealized appreciation (depreciation) is reflected in the Fund’s net assets.
| 1 | See Note 9 in “Notes to financial statements.” |
| 2 | A CDS contract is a risk-transfer instrument through which one party (purchaser of protection) transfers to another party (seller of protection) the financial risk of a credit event (as defined in the CDS agreement), as it relates to a particular reference security or basket of securities (such as an index). Periodic payments (receipts) on such contracts are accrued daily and recorded as unrealized losses (gains) on swap contracts. Upon payment (receipt), such amounts are recorded as realized losses (gains) on swap contracts. Upfront payments made or received in connection with CDS contracts are amortized over the expected life of the CDS contracts as unrealized losses (gains) on swap contracts. The change in value of CDS contracts is recorded as unrealized appreciation or depreciation daily. A realized gain or loss is recorded upon a credit event (as defined in the CDS agreement) or the maturity or termination of the agreement. |
| 3 | Notional value shown is stated in U.S. dollars unless noted that the swap is denominated in another currency. |
| 4 | Unrealized appreciation (depreciation) does not include periodic interest payments on swap contracts accrued daily in the amount of ($220,360). |
| 5 | An interest rate swap agreement is an exchange of interest rates between counterparties. Periodic payments on such contracts are accrued daily and recorded as unrealized appreciation (depreciation) on swap contracts. Upon periodic payment (receipt) or termination of the contract, such amounts are recorded as realized gains (losses) on swap contracts. |
Summary of abbreviations:
ARM – Adjustable Rate Mortgage
CDS – Credit Default Swap
CDX.EM – Credit Default Swap Index Emerging Markets
CDX.NA.HY – Credit Default Swap Index North America High Yield
CDX.NA.IG – Credit Default Swap Index North America Investment Grade
27
Schedule of investments
Delaware Diversified Floating Rate Fund
Summary of abbreviations:
CITI – Citigroup Global Markets
CLO – Collateralized Loan Obligation
CME – Chicago Mercantile Exchange Inc.
EUR – European Monetary Unit
GSI – Goldman Sachs International
HSBC – Hong Kong Shanghai Bank
ICE – Intercontinental Exchange, Inc.
IRS – Interest Rate Swap
JPMC – JPMorgan Chase Bank
LCH – LCH.Clearnet Limited
MSC – Morgan Stanley Capital
REMIC – Real Estate Mortgage Investment Conduit
USD – U.S. Dollar
yr – Year
See accompanying notes, which are an integral part of the financial statements.
28
| | |
| Statement of assets and liabilities | | |
| Delaware Diversified Floating Rate Fund | | July 31, 2015 |
| | | | |
Assets: | | | | |
Investments, at value1 | | $ | 379,423,142 | |
Short-term investments, at value2 | | | 1,725,900 | |
Cash collateral due from brokers | | | 3,725,668 | |
Receivable for securities sold | | | 15,103,582 | |
Dividends and interest receivable | | | 1,668,690 | |
Receivable for fund shares sold | | | 739,225 | |
Swap payments receivable | | | 26,288 | |
Unrealized appreciation on credit default swap contracts | | | 37,790 | |
Upfront payments paid on credit default swap contracts | | | 127,531 | |
| | | | |
Total assets | | | 402,577,816 | |
| | | | |
Liabilities: | | | | |
Cash overdraft | | | 877,975 | |
Foreign currencies, at value3 | | | 13,513 | |
Payable for securities purchased | | | 7,842,493 | |
Payable for fund shares redeemed | | | 590,478 | |
Swap payments payable | | | 249,993 | |
Distribution payable | | | 239,963 | |
Variation margin due to broker on futures contracts | | | 31,610 | |
Other accrued expenses | | | 214,340 | |
Investment management fees payable | | | 166,794 | |
Distribution fees payable to affiliates | | | 81,301 | |
Other affiliates payable | | | 24,960 | |
Trustees’ fees and expenses payable | | | 935 | |
Unrealized depreciation on interest rate swap contracts | | | 1,221,660 | |
Upfront payments received on credit default swap contracts | | | 687,845 | |
Variation margin due to broker on centrally cleared credit default swap contracts | | | 14,558 | |
Variation margin due to broker on centrally cleared interest rate swap contracts | | | 283,526 | |
Unrealized depreciation on credit default swap contracts | | | 14,202 | |
| | | | |
Total liabilities | | | 12,556,146 | |
| | | | |
Total Net Assets | | $ | 390,021,670 | |
| | | | |
29
| | | | |
Net Assets Consist of: | | | | |
Paid-in capital | | $ | 398,556,231 | |
Distributions in excess of net investment income | | | (755,763 | ) |
Accumulated net realized loss on investments | | | (4,397,930 | ) |
Net unrealized depreciation of investments | | | (1,606,396 | ) |
Net unrealized appreciation of foreign currencies | | | 3,409 | |
Net unrealized deprecation of futures contracts | | | (61,365 | ) |
Net unrealized depreciation of swap contracts | | | (1,716,516 | ) |
| | | | |
Total Net Assets | | $ | 390,021,670 | |
| | | | |
| |
Net Asset Value | | | | |
Class A: | | | | |
Net assets | | $ | 87,398,285 | |
Shares of beneficial interest outstanding, unlimited authorization, no par | | | 10,381,964 | |
Net asset value per share | | $ | 8.42 | |
Sales charge | | | 2.75 | % |
Offering price per share, equal to net asset value per share/(1 – sales charge) | | $ | 8.66 | |
| |
Class C: | | | | |
Net assets | | $ | 72,504,954 | |
Shares of beneficial interest outstanding, unlimited authorization, no par | | | 8,614,892 | |
Net asset value per share | | $ | 8.42 | |
| |
Class R: | | | | |
Net assets | | $ | 569,906 | |
Shares of beneficial interest outstanding, unlimited authorization, no par | | | 67,714 | |
Net asset value per share | | $ | 8.42 | |
| |
Institutional Class: | | | | |
Net assets | | $ | 229,548,525 | |
Shares of beneficial interest outstanding, unlimited authorization, no par | | | 27,274,856 | |
Net asset value per share | | $ | 8.42 | |
| | | | |
| | | | |
| 1Investments, at cost | | $ | 381,029,597 | |
2Short-term investments, at cost | | | 1,725,841 | |
3Foreign currencies overdraft, at cost | | | (13,458 | ) |
See accompanying notes, which are an integral part of the financial statements.
30
| | |
| Statement of operations | | |
Delaware Diversified Floating Rate Fund | | Year ended July 31, 2015 |
| | | | |
Investment Income: | | | | |
Interest | | $ | 13,667,455 | |
Dividends | | | 145,755 | |
| | | | |
| | | 13,813,210 | |
| | | | |
Expenses: | | | | |
Management fees | | | 2,267,444 | |
Distribution expenses – Class A | | | 282,563 | |
Distribution expenses – Class C | | | 859,753 | |
Distribution expenses – Class R | | | 3,618 | |
Dividend disbursing and transfer agent fees and expenses | | | 399,337 | |
Accounting and administration expenses | | | 145,892 | |
Reports and statements to shareholders | | | 145,565 | |
Registration fees | | | 81,061 | |
Legal fees | | | 51,341 | |
Audit and tax fees | | | 47,226 | |
Custodian fees | | | 31,859 | |
Trustees’ fees and expenses | | | 21,303 | |
Other | | | 52,676 | |
| | | | |
| | | 4,389,638 | |
Less expense paid indirectly | | | (68 | ) |
| | | | |
Total operating expenses | | | 4,389,570 | |
| | | | |
Net Investment Income | | | 9,423,640 | |
| | | | |
| |
Net Realized and Unrealized Gain (Loss): | | | | |
Net Realized loss on: | | | | |
Investments | | | (1,108,127 | ) |
Foreign currencies | | | (17,824 | ) |
Foreign currency exchange contracts | | | (2,581 | ) |
Futures contracts | | | (372,650 | ) |
Swap contracts | | | (3,130,807 | ) |
| | | | |
Net realized loss | | | (4,631,989 | ) |
| | | | |
Net change in unrealized appreciation (depreciation) of: | | | | |
Investments | | | (6,191,762 | ) |
Foreign currencies | | | 3,409 | |
Futures contracts | | | (63,297 | ) |
Swap contracts | | | (744,933 | ) |
| | | | |
Net change in unrealized appreciation (depreciation) | | | (6,996,583 | ) |
| | | | |
Net Realized and Unrealized Loss | | | (11,628,572 | ) |
| | | | |
Net Decrease in Net Assets Resulting from Operations | | $ | (2,204,932 | ) |
| | | | |
See accompanying notes, which are an integral part of the financial statements.
31
| | |
| Statements of changes in net assets |
Delaware Diversified Floating Rate Fund | | |
| | | | | | | | |
| | | Year ended | |
| | | 7/31/15 | | | 7/31/14 | |
Increase (Decrease) in Net Assets from Operations: | | | | | | | | |
Net investment income | | | $ 9,423,640 | | | | $ 9,101,889 | |
Net realized loss | | | (4,631,989 | ) | | | (1,688,790 | ) |
Net change in unrealized appreciation (depreciation) | | | (6,996,583 | ) | | | 4,305,844 | |
| | | | | | | | |
Net increase (decrease) in net assets resulting from
operations | | | (2,204,932 | ) | | | 11,718,943 | |
| | | | | | | | |
| | |
Dividends and Distributions to Shareholders from: | | | | | | | | |
Net investment income: | | | | | | | | |
Class A | | | (2,260,196 | ) | | | (3,771,203 | ) |
Class C | | | (1,070,663 | ) | | | (991,928 | ) |
Class R | | | (12,653 | ) | | | (166 | ) |
Institutional Class | | | (5,699,190 | ) | | | (3,215,759 | ) |
| | |
Return of capital: | | | | | | | | |
Class A | | | (114,985 | ) | | | (542,903 | ) |
Class C | | | (95,413 | ) | | | (344,882 | ) |
Class R | | | (750 | ) | | | (2,893 | ) |
Institutional Class | | | (302,081 | ) | | | (919,304 | ) |
| | | | | | | | |
| | | (9,555,931 | ) | | | (9,789,038 | ) |
| | | | | | | | |
| | |
Capital Share Transactions: | | | | | | | | |
Proceeds from shares sold: | | | | | | | | |
Class A | | | 31,511,057 | | | | 130,841,082 | |
Class C | | | 8,236,933 | | | | 52,205,860 | |
Class R | | | 19,790 | | | | 855,063 | |
Institutional Class | | | 121,472,944 | | | | 216,519,940 | |
| | |
Net asset value of shares issued upon reinvestment of
dividends and distributions: | | | | | | | | |
Class A | | | 2,172,416 | | | | 3,974,862 | |
Class C | | | 1,067,196 | | | | 1,220,500 | |
Class R | | | 13,441 | | | | 2,691 | |
Institutional Class | | | 4,159,632 | | | | 2,791,482 | |
| | | | | | | | |
| | | 168,653,409 | | | | 408,411,480 | |
| | | | | | | | |
32
| | | | | | | | |
| | | Year ended | |
| | | 7/31/15 | | | 7/31/14 | |
Capital Share Transactions (continued): | | | | | | | | |
Cost of shares redeemed: | | | | | | | | |
Class A | | | $ (101,926,129) | | | | $ (171,843,344) | |
Class C | | | (35,376,411 | ) | | | (36,704,562 | ) |
Class R | | | (290,065 | ) | | | (56,446 | ) |
Institutional Class | | | (158,222,362 | ) | | | (90,347,875 | ) |
| | | | | | | | |
| | | (295,814,967 | ) | | | (298,952,227 | ) |
| | | | | | | | |
Increase (decrease) in net assets derived from capital share transactions | | | (127,161,558 | ) | | | 109,459,253 | |
| | | | | | | | |
Net Increase (Decrease) in Net Assets | | | (138,922,421 | ) | | | 111,389,158 | |
| | |
Net Assets: | | | | | | | | |
Beginning of year | | | 528,944,091 | | | | 417,554,933 | |
| | | | | | | | |
End of year | | $ | 390,021,670 | | | $ | 528,944,091 | |
| | | | | | | | |
Distributions in excess of net investment income | | $ | (755,763 | ) | | $ | (60,273 | ) |
| | | | | | | | |
See accompanying notes, which are an integral part of the financial statements.
33
| | |
| Financial highlights |
Delaware Diversified Floating Rate Fund Class A | | |
Selected data for each share of the Fund outstanding throughout each period were as follows:
|
Net asset value, beginning of period |
|
Income (loss) from investment operations: |
Net investment income1 |
Net realized and unrealized gain (loss) |
Total from investment operations |
|
Less dividends and distributions from: |
Net investment income |
Return of capital |
Total dividends and distributions |
|
Net asset value, end of period |
|
Total return2 |
|
Ratios and supplemental data: |
Net assets, end of period (000 omitted) |
Ratio of expenses to average net assets |
Ratio of expenses to average net assets
prior to fees waived |
Ratio of net investment income to average net assets |
Ratio of net investment income to average net assets
prior to fees waived |
Portfolio turnover |
| 1 | The average shares outstanding method has been applied for per share information. |
| 2 | Total investment return is based on the change in net asset value of a share during the period and assumes reinvestment of dividends and distributions at net asset value and does not reflect the impact of a sales charge. Total investment return during some of the periods shown reflects waivers by the manager and/or distributor. Performance would have been lower had the waivers not been in effect. |
See accompanying notes, which are an integral part of the financial statements.
34
| | | | | | | | | | | | | | | | | | | | |
| | | Year ended | |
| | 7/31/15 | | | 7/31/14 | | | 7/31/13 | | | 7/31/12 | | | 7/31/11 | |
| | $ | 8.630 | | | $ | 8.600 | | | $ | 8.570 | | | $ | 8.590 | | | $ | 8.490 | |
| | | | | |
| | | 0.177 | | | | 0.163 | | | | 0.163 | | | | 0.193 | | | | 0.166 | |
| | | (0.208 | ) | | | 0.042 | | | | 0.060 | | | | (0.005 | ) | | | 0.114 | |
| | | | | | | | | | | | | | | | | | | | |
| | | (0.031 | ) | | | 0.205 | | | | 0.223 | | | | 0.188 | | | | 0.280 | |
| | | | | | | | | | | | | | | | | | | | |
| | | | | |
| | | (0.168 | ) | | | (0.145 | ) | | | (0.175 | ) | | | (0.208 | ) | | | (0.180 | ) |
| | | (0.011 | ) | | | (0.030 | ) | | | (0.018 | ) | | | — | | | | — | |
| | | | | | | | | | | | | | | | | | | | |
| | | (0.179 | ) | | | (0.175 | ) | | | (0.193 | ) | | | (0.208 | ) | | | (0.180 | ) |
| | | | | | | | | | | | | | | | | | | | |
| | $ | 8.420 | | | $ | 8.630 | | | $ | 8.600 | | | $ | 8.570 | | | $ | 8.590 | |
| | | | | | | | | | | | | | | | | | | | |
| | | (0.35%) | | | | 2.40% | | | | 2.61% | | | | 2.24% | | | | 3.33% | |
| | | | | |
| | $ | 87,398 | | | $ | 158,691 | | | $ | 194,795 | | | $ | 49,009 | | | $ | 55,209 | |
| | | 0.96% | | | | 0.95% | | | | 1.01% | | | | 1.05% | | | | 1.05% | |
| | | 0.96% | | | | 0.96% | | | | 1.06% | | | | 1.12% | | | | 1.34% | |
| | | 2.08% | | | | 1.89% | | | | 1.88% | | | | 2.28% | | | | 1.92% | |
| | | 2.08% | | | | 1.88% | | | | 1.83% | | | | 2.21% | | | | 1.63% | |
| | | 86% | | | | 96% | | | | 112% | | | | 97% | | | | 75% | |
35
Financial highlights
Delaware Diversified Floating Rate Fund Class C
Selected data for each share of the Fund outstanding throughout each period were as follows:
|
Net asset value, beginning of period |
|
Income (loss) from investment operations: |
Net investment income1 |
Net realized and unrealized gain (loss) |
Total from investment operations |
|
Less dividends and distributions from: |
Net investment income |
Return of capital |
Total dividends and distributions |
|
Net asset value, end of period |
|
Total return2 |
|
Ratios and supplemental data: |
Net assets, end of period (000 omitted) |
Ratio of expenses to average net assets |
Ratio of expenses to average net assets prior to fees waived |
Ratio of net investment income to average net assets |
Ratio of net investment income to average net assets prior to fees waived |
Portfolio turnover |
| 1 | The average shares outstanding method has been applied for per share information. |
| 2 | Total investment return is based on the change in net asset value of a share during the period and assumes reinvestment of dividends and distributions at net asset value and does not reflect the impact of a sales charge. Total investment return during some of the periods shown reflects a waiver by the manager. Performance would have been lower had the waiver not been in effect. |
See accompanying notes, which are an integral part of the financial statements.
36
| | | | | | | | | | | | | | | | | | | | |
| | | Year ended | |
| | 7/31/15 | | | 7/31/14 | | | 7/31/13 | | | 7/31/12 | | | 7/31/11 | |
| | $ | 8.630 | | | $ | 8.600 | | | $ | 8.570 | | | $ | 8.590 | | | $ | 8.490 | |
| | | | | |
| | | 0.113 | | | | 0.098 | | | | 0.098 | | | | 0.130 | | | | 0.102 | |
| | | (0.208 | ) | | | 0.042 | | | | 0.060 | | | | (0.006 | ) | | | 0.116 | |
| | | | | | | | | | | | | | | | | | | | |
| | | (0.095 | ) | | | 0.140 | | | | 0.158 | | | | 0.124 | | | | 0.218 | |
| | | | | | | | | | | | | | | | | | | | |
| | | | | |
| | | (0.104 | ) | | | (0.080 | ) | | | (0.110 | ) | | | (0.144 | ) | | | (0.118 | ) |
| | | (0.011 | ) | | | (0.030 | ) | | | (0.018 | ) | | | — | | | | — | |
| | | | | | | | | | | | | | | | | | | | |
| | | (0.115 | ) | | | (0.110 | ) | | | (0.128 | ) | | | (0.144 | ) | | | (0.118 | ) |
| | | | | | | | | | | | | | | | | | | | |
| | | | | |
| | $ | 8.420 | | | $ | 8.630 | | | $ | 8.600 | | | $ | 8.570 | | | $ | 8.590 | |
| | | | | | | | | | | | | | | | | | | | |
| | | (1.10% | ) | | | 1.64% | | | | 1.85% | | | | 1.47% | | | | 2.58% | |
| | | | | |
| | $ | 72,505 | | | $ | 100,779 | | | $ | 83,619 | | | $ | 25,495 | | | $ | 25,769 | |
| | | 1.71% | | | | 1.70% | | | | 1.76% | | | | 1.80% | | | | 1.80% | |
| | | | | |
| | | 1.71% | | | | 1.70% | | | | 1.76% | | | | 1.82% | | | | 2.04% | |
| | | 1.33% | | | | 1.14% | | | | 1.13% | | | | 1.53% | | | | 1.17% | |
| | | | | |
| | | 1.33% | | | | 1.14% | | | | 1.13% | | | | 1.51% | | | | 0.93% | |
| | | 86% | | | | 96% | | | | 112% | | | | 97% | | | | 75% | |
37
Financial highlights
Delaware Diversified Floating Rate Fund Class R
Selected data for each share of the Fund outstanding throughout each period were as follows:
|
Net asset value, beginning of period |
|
Income (loss) from investment operations: |
Net investment income1 |
Net realized and unrealized gain (loss) |
Total from investment operations |
|
Less dividends and distributions from: |
Net investment income |
Return of capital |
Total dividends and distributions |
|
Net asset value, end of period |
|
Total return3 |
|
Ratios and supplemental data: |
Net assets, end of period (000 omitted) |
Ratio of expenses to average net assets |
Ratio of expenses to average net assets prior to fees waived |
Ratio of net investment income to average net assets |
Ratio of net investment income to average net assets prior to fees waived |
Portfolio turnover |
| 1 | The average shares outstanding method has been applied for per share information. |
| 2 | Includes adjustments from the period ending July 31, 2010 in the amount of $9 (or $0.010 per share) which impacted total return by -0.12%. The adjustment is to correct a misallocation of distributions among share classes, which had no impact on distribution amounts reported and paid to shareholders. |
| 3 | Total investment return is based on the change in net asset value of a share during the period and assumes reinvestment of dividends and distributions at net asset value. Total investment return during some of the periods shown reflects waivers by the manager and/or distributor. Performance would have been lower had the waivers not been in effect. |
See accompanying notes, which are an integral part of the financial statements.
38
| | | | | | | | | | | | | | | | | | | | |
| | | Year ended | |
| | 7/31/15 | | | 7/31/14 | | | 7/31/13 | | | 7/31/12 | | | 7/31/11 | |
| | $ | 8.630 | | | $ | 8.600 | | | $ | 8.570 | | | $ | 8.590 | | | $ | 8.500 | |
| | | | | |
| | | 0.156 | | | | 0.142 | | | | 0.141 | | | | 0.173 | | | | 0.145 | |
| | | (0.208 | ) | | | 0.041 | | | | 0.060 | | | | (0.011 | ) | | | 0.106 | 2 |
| | | | | | | | | | | | | | | | | | | | |
| | | (0.052 | ) | | | 0.183 | | | | 0.201 | | | | 0.162 | | | | 0.251 | 2 |
| | | | | | | | | | | | | | | | | | | | |
| | | | | |
| | | (0.147 | ) | | | (0.123 | ) | | | (0.153 | ) | | | (0.182 | ) | | | (0.161 | ) |
| | | (0.011 | ) | | | (0.030 | ) | | | (0.018 | ) | | | — | | | | — | |
| | | | | | | | | | | | | | | | | | | | |
| | | (0.158 | ) | | | (0.153 | ) | | | (0.171 | ) | | | (0.182 | ) | | | (0.161 | ) |
| | | | | | | | | | | | | | | | | | | | |
| | | | | |
| | $ | 8.420 | | | $ | 8.630 | | | $ | 8.600 | | | $ | 8.570 | | | $ | 8.590 | 2 |
| | | | | | | | | | | | | | | | | | | | |
| | | | | |
| | | (0.61%) | | | | 2.15% | | | | 2.36% | | | | 1.93% | | | | 2.96% | |
| | | | | |
| | $ | 570 | | | $ | 845 | | | $ | 44 | | | $ | 5 | | | $ | 5 | |
| | | 1.21% | | | | 1.20% | | | | 1.26% | | | | 1.30% | | | | 1.30% | |
| | | | | |
| | | 1.21% | | | | 1.20% | | | | 1.36% | | | | 1.42% | | | | 1.64% | |
| | | 1.83% | | | | 1.64% | | | | 1.63% | | | | 2.03% | | | | 1.67% | |
| | | | | |
| | | 1.83% | | | | 1.64% | | | | 1.53% | | | | 1.91% | | | | 1.33% | |
| | | 86% | | | | 96% | | | | 112% | | | | 97% | | | | 75% | |
39
Financial highlights
Delaware Diversified Floating Rate Fund Institutional Class
Selected data for each share of the Fund outstanding throughout each period were as follows:
|
Net asset value, beginning of period |
|
Income (loss) from investment operations: |
Net investment income1 |
Net realized and unrealized gain (loss) |
Total from investment operations. |
|
Less dividends and distributions from: |
Net investment income |
Return of capital |
Total dividends and distributions |
|
Net asset value, end of period |
|
Total return2 |
|
Ratios and supplemental data: |
Net assets, end of period (000 omitted) |
Ratio of expenses to average net assets |
Ratio of expenses to average net assets prior to fees waived |
Ratio of net investment income to average net assets |
Ratio of net investment income to average net assets prior to fees waived |
Portfolio turnover |
| 1 | The average shares outstanding method has been applied for per share information. |
| 2 | Total investment return is based on the change in net asset value of a share during the period and assumes reinvestment of dividends and distributions at net asset value. Total investment return during some of the periods shown reflects a waiver by the manager. Performance would have been lower had the waiver not been in effect. |
See accompanying notes, which are an integral part of the financial statements.
40
| | | | | | | | | | | | | | | | | | | | |
| | | Year ended | |
| | 7/31/15 | | | 7/31/14 | | | 7/31/13 | | | 7/31/12 | | | 7/31/11 | |
| | $ | 8.630 | | | $ | 8.600 | | | $ | 8.570 | | | $ | 8.590 | | | $ | 8.490 | |
| | | | | |
| | | 0.198 | | | | 0.184 | | | | 0.184 | | | | 0.214 | | | | 0.187 | |
| | | (0.208 | ) | | | 0.042 | | | | 0.061 | | | | (0.005 | ) | | | 0.117 | |
| | | | | | | | | | | | | | | | | | | | |
| | | (0.010 | ) | | | 0.226 | | | | 0.245 | | | | 0.209 | | | | 0.304 | |
| | | | | | | | | | | | | | | | | | | | |
| | | | | |
| | | (0.189 | ) | | | (0.166 | ) | | | (0.197 | ) | | | (0.229 | ) | | | (0.204 | ) |
| | | (0.011 | ) | | | (0.030 | ) | | | (0.018 | ) | | | — | | | | — | |
| | | | | | | | | | | | | | | | | | | | |
| | | (0.200 | ) | | | (0.196 | ) | | | (0.215 | ) | | | (0.229 | ) | | | (0.204 | ) |
| | | | | | | | | | | | | | | | | | | | |
| | $ | 8.420 | | | $ | 8.630 | | | $ | 8.600 | | | $ | 8.570 | | | $ | 8.590 | |
| | | | | | | | | | | | | | | | | | | | |
| | | (0.11%) | | | | 2.66% | | | | 2.87% | | | | 2.49% | | | | 3.61% | |
| | | | | |
| | $ | 229,549 | | | $ | 268,629 | | | $ | 139,097 | | | $ | 31,663 | | | $ | 33,231 | |
| | | 0.71% | | | | 0.70% | | | | 0.76% | | | | 0.80% | | | | 0.80% | |
| | | 0.71% | | | | 0.70% | | | | 0.76% | | | | 0.82% | | | | 1.04% | |
| | | 2.33% | | | | 2.14% | | | | 2.13% | | | | 2.53% | | | | 2.17% | |
| | | 2.33% | | | | 2.14% | | | | 2.13% | | | | 2.51% | | | | 1.93% | |
| | | 86% | | | | 96% | | | | 112% | | | | 97% | | | | 75% | |
41
Notes to financial statements
| | |
| Delaware Diversified Floating Rate Fund | | July 31, 2015 |
Delaware Group® Income Funds (Trust) is organized as a Delaware statutory trust and offers four series: Delaware Corporate Bond Fund, Delaware Diversified Floating Rate Fund, Delaware Extended Duration Bond Fund, and Delaware High-Yield Opportunities Fund. These financial statements and the related notes pertain to Delaware Diversified Floating Rate Fund (Fund). The Trust is an open-end investment company. The Fund is considered diversified under the Investment Company Act of 1940, as amended, and offers Class A, Class C, Class R, and Institutional Class shares. Class A shares are sold with a maximum front-end sales charge of 2.75%. Class A share purchases of $1,000,000 or more will incur a contingent deferred sales charge (CDSC) of 0.75% if redeemed during the first year, provided that Delaware Distributors, L.P. (DDLP) paid a financial advisor a commission on the purchase of those shares. Class C shares are sold with a CDSC of 1.00%, if redeemed during the first 12 months. Class R and Institutional Class shares are not subject to a sales charge and are offered for sale exclusively to certain eligible investors.
The investment objective of the Fund is to seek total return.
1. Significant Accounting Policies
The following accounting policies are in accordance with U.S. generally accepted accounting principles (U.S. GAAP) and are consistently followed by the Fund.
Security Valuation – Equity securities, except those traded on The Nasdaq Stock Market LLC. (Nasdaq), are valued at the last quoted sales price as of the time of the regular close of the New York Stock Exchange on the valuation date. Securities traded on the Nasdaq are valued in accordance with the Nasdaq Official Closing Price, which may not be the last sales price. If, on a particular day, an equity security does not trade, the mean between the bid and ask prices will be used, which approximates fair value. Debt securities, credit default swap (CDS) contracts, and interest rate swap contracts are valued based upon valuations provided by an independent pricing service or broker/counterparty and reviewed by management. To the extent current market prices are not available, the pricing service may take into account developments related to the specific security, as well as transactions in comparable securities. U.S. government and agency securities are valued at the mean between the bid and ask prices, which approximates fair value. Valuations for fixed income securities utilize matrix systems, which reflect such factors as security prices, yields, maturities, and ratings, and are supplemented by dealer and exchange quotations. For asset-backed securities, collateralized mortgage obligations, commercial mortgage securities, and U.S. government agency mortgage securities, pricing vendors utilize matrix pricing which considers prepayment speed, attributes of the collateral, yield or price of bonds of comparable quality, coupon, maturity, and type as well as broker/dealer-supplied prices. Swap prices are derived using daily swap curves and models that incorporate a number of market data factors, such as discounted cash flows, trades and values of the underlying reference instruments. Foreign currency exchange contracts and foreign cross currency exchange contracts are valued at the mean between the bid and ask prices, which approximates fair value. Interpolated values are derived when the settlement date of the contract is an interim date for which quotations are not available. Futures contracts and options on futures contracts are valued at the daily quoted settlement prices. Generally, other securities and assets for which market quotations are not readily available are valued at fair value as determined in good faith under the direction of the Fund’s Board of Trustees (Board). In determining whether market quotations
42
are readily available or fair valuation will be used, various factors will be taken into consideration, such as market closures or suspension of trading in a security.
Federal and Foreign Income Taxes – No provision for federal income taxes has been made as the Fund intends to continue to qualify for federal income tax purposes as a regulated investment company under Subchapter M of the Internal Revenue Code of 1986, as amended, and make the requisite distributions to shareholders. The Fund evaluates tax positions taken or expected to be taken in the course of preparing the Fund’s tax returns to determine whether the tax positions are “more-likely-than-not” of being sustained by the applicable tax authority. Tax positions not deemed to meet the “more-likely-than-not” threshold are recorded as a tax benefit or expense in the current year. Management has analyzed the Fund’s tax positions taken for all open federal income tax years (July 31, 2012–July 31, 2015) and has concluded that no provision for federal income tax is required in the Fund’s financial statements. In regard to foreign taxes only, the Fund has open tax years in certain foreign countries in which it invests that may date back to the inception of the Fund.
Class Accounting – Investment income and common expenses are allocated to the various classes of the Fund on the basis of “settled shares” of each class in relation to the net assets of the Fund. Realized and unrealized gain (loss) on investments are allocated to the various classes of the Fund on the basis of daily net assets of each class. Distribution expenses relating to a specific class are charged directly to that class.
Repurchase Agreements – The Fund may purchase certain U.S. government securities subject to the counterparty’s agreement to repurchase them at an agreed upon date and price. The counterparty will be required on a daily basis to maintain the value of the collateral subject to the agreement at not less than the repurchase price (including accrued interest). The agreements are conditioned upon the collateral being deposited under the Federal Reserve book-entry system with the Fund’s custodian or a third-party sub-custodian. In the event of default or bankruptcy by the other party to the agreement, retention of the collateral may be subject to legal proceedings. At July 31, 2015 the Fund held no investments in repurchase agreements.
Foreign Currency Transactions – Transactions denominated in foreign currencies are recorded at the prevailing exchange rates on the valuation date in accordance with the Fund’s prospectus. The value of all assets and liabilities denominated in foreign currencies is translated daily into U.S. dollars at the exchange rate of such currencies against the U.S. dollar. Transaction gains or losses resulting from changes in exchange rates during the reporting period or upon settlement of the foreign currency transaction are reported in operations for the current period. The Fund generally bifurcates that portion of realized gains and losses on investments in debt securities which is due to changes in foreign exchange rates from that which is due to changes in market prices of debt securities. That portion of gains (losses) is included on the “Statement of operations” under “Net realized loss on foreign currencies.” The Fund reports certain foreign currency related transactions as components of realized gains (losses) for financial reporting purposes, whereas such components are treated as ordinary income (loss) for federal income tax purposes.
43
Notes to financial statements
Delaware Diversified Floating Rate Fund
1. Significant Accounting Policies (continued)
Use of Estimates – The Fund is an investment company, whose financial statements are prepared in conformity with U.S. GAAP. Therefore, the Fund follows the accounting and reporting guidelines for investment companies. The preparation of financial statements in conformity with U.S. GAAP requires management to make estimates and assumptions that affect the fair value of investments, the reported amounts of assets and liabilities and disclosure of contingent assets and liabilities at the date of the financial statements, and the reported amounts of revenues and expenses during the reporting period. Actual results could differ from those estimates and the differences could be material.
Other – Expenses directly attributable to the Fund are charged directly to the Fund. Other expenses common to various funds within the Delaware Investments® Family of Funds are generally allocated among such funds on the basis of average net assets. Management fees and some other expenses are paid monthly. Security transactions are recorded on the date the securities are purchased or sold (trade date) for financial reporting purposes. Costs used in calculating realized gains and losses on the sale of investment securities are those of the specific securities sold. Dividend income is recorded on the ex-dividend date and interest income is recorded on the accrual basis. Discounts and premiums on debt securities are accreted or amortized to interest income, respectively over the lives of the respective securities using the effective interest method. Realized gains (losses) on paydowns of asset- and mortgage-backed securities are classified as interest income. The Fund declares dividends daily from net investment income and pays the dividends monthly and declares and pays distributions from net realized gain on investments, if any, annually. The Fund may distribute more frequently, if necessary for tax purposes. Dividends and distributions, if any, are recorded on the ex-dividend date.
The Fund may receive earnings credits from its custodian when positive cash balances are maintained, which may be used to offset custody fees. There were no such earnings credits for the year ended July 31, 2015.
The Fund receives earnings credits from its transfer agent when positive cash balances are maintained, which may be used to offset transfer agent fees. If the amount earned is greater than one dollar, the expense paid under this arrangement is included on the “Statement of operations” under “Dividend disbursing and transfer agent fees and expenses” with the corresponding expense offset shown under “Less expense paid indirectly.” For the year ended July 31, 2015, the Fund earned $68 under this agreement.
2. Investment Management, Administration Agreements, and Other Transactions with Affiliates
In accordance with the terms of its investment management agreement, the Fund pays Delaware Management Company (DMC), a series of Delaware Management Business Trust and the investment manager, an annual fee which is calculated daily at the rate of 0.50% on the first $500 million of average daily net assets of the Fund, 0.475% on the next $500 million, 0.45% on the next $1.5 billion, and 0.425% on average daily net assets in excess of $2.5 billion.
Prior to Nov. 28, 2014, DMC had contractually agreed to waive that portion, if any, of its management fee and reimburse the Fund to the extent necessary to ensure that total annual operating expenses (excluding any 12b-1 fees, acquired fund fees and expenses, taxes, interest, short sale dividend and interest expenses, brokerage fees, certain insurance costs, and nonroutine expenses or costs, including,
44
but not limited to, those relating to reorganizations, litigation, conducting shareholder meetings, and liquidations (collectively, nonroutine expenses)), did not exceed 0.80% of the Fund’s average daily net assets. For purposes of this waiver and reimbursement, nonroutine expenses may also include such additional costs and expenses, as may be agreed upon from time to time by the Fund’s Board and DMC. This expense waiver and reimbursement applied only to expenses paid directly by the Fund.
Effective Nov. 1, 2014, Delaware Investments Fund Services Company (DIFSC), an affiliate of DMC, provides fund accounting and financial administration oversight services to the Fund. Prior to this time, Delaware Service Company, Inc. (DSC), an affiliate of DMC, provided fund accounting and financial administrative oversight services to the Fund under a substantially identical agreement with an identical fee schedule. For these services, DIFSC’s fees are calculated based on the aggregate daily net assets of the Delaware Investments® Family of Funds at the following annual rate: 0.0050% of the first $30 billion; 0.0045% of the next $10 billion; 0.0040% of the next $10 billion; and 0.0025% of aggregate average daily net assets in excess of $50 billion. The fees payable to DIFSC under the service agreement described above are allocated among all funds in the Delaware Investments Family of Funds on a relative net asset value basis. For the year ended July 31, 2015, the Fund was charged $21,502 for these services. This amount is included on the “Statement of operations” under “Accounting and administration expenses.”
Effective Nov. 1, 2014, DIFSC also became the transfer agent and dividend disbursing agent of the Fund. Prior to this time, DSC was the transfer agent and dividend disbursing agent of the Fund under a substantially identical agreement with an identical fee schedule. For these services, DIFSC’s fees are calculated based on the aggregate daily net assets of the retail funds within the Delaware Investments Family of Funds at the following annual rate: 0.025% of the first $20 billion; 0.020% of the next $5 billion; 0.015% of the next $5 billion; and 0.013% on average daily net assets in excess of $30 billion. The fees payable to DIFSC under the service agreement described above are allocated among all retail Funds in the Delaware Investments Family of Funds on a relative net asset value basis. This amount is included on the “Statement of operations” under “Dividend disbursing and transfer agent fees and expenses.” For the year ended July 31, 2015, the Fund was charged $94,727 for these services. Pursuant to a sub-transfer agency agreement between DIFSC and BNY Mellon Investment Servicing (US) Inc. (BNYMIS), BNYMIS provides certain sub-transfer agency services to the Fund. Sub-transfer agency fees are passed on to and paid by the Fund.
Pursuant to a distribution agreement and distribution plan, the Fund pays DDLP, the distributor and an affiliate of DMC, an annual distribution and service fee of 0.25% of the average daily net assets of the Class A shares, 1.00% of the average daily net assets of the Class C shares, and 0.50% of the average daily net assets of the Class R shares. Institutional Class shares pay no distribution and service fees.
As provided in the investment management agreement, the Fund bears a portion of the cost of certain resources shared with DMC, including the cost of internal personnel of DMC and/or its affiliates that provide legal, tax, and regulatory reporting services to the Fund. For the year ended July 31, 2015, the Fund was charged $11,807 for internal legal, tax, and regulatory reporting services provided by DMC and/or its affiliates’ employees. This amount is included on the “Statement of operations” under “Legal fees.”
45
Notes to financial statements
Delaware Diversified Floating Rate Fund
2. Investment Management, Administration Agreements, and Other Transactions with Affiliates (continued)
For the year ended July 31, 2015, DDLP earned $7,082 for commissions on sales of the Fund’s Class A shares. For the year ended July 31, 2015, DDLP received gross CDSC commissions of $2 and $2,940 on redemption of the Fund’s Class A, and Class C shares, respectively, and these commissions were entirely used to offset upfront commissions previously paid by DDLP to broker/dealers on sales of those shares.
Trustees’ fees include expenses accrued by the Fund for each Trustee’s retainer and meeting fees. Certain officers of DMC, DIFSC, and DDLP are officers and/or Trustees of the Trust. These officers and Trustees are paid no compensation by the Fund.
3. Investments
For the year ended July 31, 2015, the Fund made purchases and sales of investment securities other than short-term investments as follows:
| | | | |
Purchases other than U.S. government securities | | $ | 359,865,294 | |
Purchases of U.S. government securities | | | 22,767,966 | |
Sales other than U.S. government securities | | | 500,167,514 | |
Sales of U.S. government securities | | | 22,426,126 | |
At July 31, 2015, the cost and unrealized appreciation (depreciation) of investments for federal income tax purposes for the Fund were as follows:
| | | | |
Cost of investments | | $ | 382,823,889 | |
| | | | |
Aggregate unrealized appreciation of investments | | $ | 2,277,918 | |
Aggregate unrealized depreciation of investments | | | (3,952,765 | ) |
| | | | |
Net unrealized depreciation of investments | | $ | (1,674,847 | ) |
| | | | |
46
U.S. GAAP defines fair value as the price that the Fund would receive to sell an asset or pay to transfer a liability in an orderly transaction between market participants at the measurement date under current market conditions. A three-level hierarchy for fair value measurements has been established based upon the transparency of inputs to the valuation of an asset or liability. Inputs may be observable or unobservable and refer broadly to the assumptions that market participants would use in pricing the asset or liability. Observable inputs reflect the assumptions market participants would use in pricing the asset or liability based on market data obtained from sources independent of the reporting entity. Unobservable inputs reflect the reporting entity’s own assumptions about the assumptions that market participants would use in pricing the asset or liability developed based on the best information available under the circumstances. The Fund’s investment in its entirety is assigned a level based upon the observability of the inputs which are significant to the overall valuation. The three-level hierarchy of inputs is summarized below.
| | |
| Level 1 – | | Inputs are quoted prices in active markets for identical investments. (Examples: equity securities, open-end investment companies, futures contracts, exchange-traded options contracts) |
| |
| Level 2 – | | Other observable inputs, including, but not limited to: quoted prices for similar assets or liabilities in markets that are active, quoted prices for identical or similar assets or liabilities in markets that are not active, inputs other than quoted prices that are observable for the assets or liabilities (such as interest rates, yield curves, volatilities, prepayment speeds, loss severities, credit risks and default rates) or other market-corroborated inputs. (Examples: debt securities, government securities, swap contracts, foreign currency exchange contracts, foreign securities utilizing international fair value pricing, broker-quoted securities, fair valued securities) |
| |
| Level 3 – | | Significant unobservable inputs, including the Fund’s own assumptions used to determine the fair value of investments. (Examples: broker-quoted securities, fair valued securities) |
Level 3 investments are valued using significant unobservable inputs. The Fund may also use an income-based valuation approach in which the anticipated future cash flows of the investment are discounted to calculate fair value. Discounts may also be applied due to the nature or duration of any restrictions on the disposition of the investments. Valuations may also be based upon current market prices of securities that are comparable in coupon, rating, maturity, and industry. The derived value of a Level 3 investment may not represent the value which is received upon disposition and this could impact the results of operations.
47
Notes to financial statements
Delaware Diversified Floating Rate Fund
3. Investments (continued)
The following table summarizes the valuation of the Fund’s investments by fair value hierarchy levels as of July 31, 2015:
| | | | | | | | | | | | | | | | |
Securities | | Level 1 | | | Level 2 | | | Level 3 | | | Total | |
Agency, Asset- & Mortgage-Backed Securities | | $ | — | | | $ | 36,199,079 | | | $ | — | | | $ | 36,199,079 | |
Corporate Debt | | | — | | | | 196,084,905 | | | | — | | | | 196,084,905 | |
Municipal Bonds | | | — | | | | 13,014,807 | | | | — | | | | 13,014,807 | |
Senior Secured Loans1 | | | — | | | | 124,507,332 | | | | 2,054,123 | | | | 126,561,455 | |
Foreign Debt | | | — | | | | 1,466,243 | | | | — | | | | 1,466,243 | |
U.S. Treasury Obligations | | | — | | | | 324,828 | | | | — | | | | 324,828 | |
Convertible Preferred Stock | | | 420,637 | | | | — | | | | — | | | | 420,637 | |
Preferred Stock1 | | | 1,314,767 | | | | 4,036,421 | | | | — | | | | 5,351,188 | |
Short-Term Investments | | | — | | | | 1,725,900 | | | | — | | | | 1,725,900 | |
| | | | | | | | | | | | | | | | |
Total Value of Securities | | $ | 1,735,404 | | | $ | 377,359,515 | | | $ | 2,054,123 | | | $ | 381,149,042 | |
| | | | | | | | | | | | | | | | |
| | | | |
Futures Contracts | | $ | (61,365 | ) | | $ | — | | | $ | — | | | $ | (61,365 | ) |
Swap Contracts | | | — | | | | (1,496,156 | ) | | | — | | | | (1,496,156 | ) |
|
1Security type is valued across multiple levels. Level 1 investments represent exchange-traded investments, Level 2 investments represent investments with observable inputs or matrix-priced investments, and Level 3 investments represent investments without observable inputs. The amounts attributed to Level 1 investments, Level 2 investments, and Level 3 investments represent the following percentages of the total market value of this security type: | |
| | | Level 1 | | | Level 2 | | | Level 3 | | | Total | |
Senior Secured Loans | | | — | | | | 98.38% | | | | 1.62% | | | | 100.00% | |
Preferred Stock | | | 24.57% | | | | 75.43% | | | | — | | | | 100.00% | |
During the year ended July 31, 2015, there were no transfers between Level 1 investments, Level 2 investments, or Level 3 investments that had a significant impact to the Fund. The Fund’s policy is to recognize transfers between levels at the beginning of the reporting period.
A reconciliation of Level 3 investments is presented when the Fund has a significant amount of Level 3 investments at the beginning, interim, or end of the period in relation to net assets. Management has determined not to provide additional disclosure on Level 3 inputs since the Level 3 investments are not considered significant to the Fund’s net assets at the end of the period.
48
4. Dividend and Distribution Information
Income and long-term capital gain distributions are determined in accordance with federal income tax regulations, which may differ from U.S. GAAP. Additionally, distributions from net gains on foreign currency transactions and net short-term gains on sales of investment securities are treated as ordinary income for federal income tax purposes. The tax character of dividends and distributions paid during the years ended July 31, 2015 and 2014 was as follows:
| | | | | | | | |
| | | Year ended | |
| | | 7/31/15 | | | 7/31/14 | |
Ordinary income | | | $9,042,702 | | | | $7,979,056 | |
Return of capital | | | 513,229 | | | | 1,809,982 | |
Total | | | $9,555,931 | | | | $9,789,038 | |
5. Components of Net Assets on a Tax Basis
As of July 31, 2015, the components of net assets on a tax basis were as follows:
| | | | |
Shares of beneficial interest | | $ | 398,556,231 | |
Dividends payable | | | (239,963 | ) |
Qualified late year loss deferrals | | | (590,095 | ) |
Other temporary differences | | | (1,811 | ) |
Capital loss carryforwards | | | (4,526,070 | ) |
Unrealized depreciation on investments, foreign currencies, and derivatives | | | (3,176,622 | ) |
| | | | |
Net assets | | $ | 390,021,670 | |
| | | | |
The differences between book basis and tax basis components of net assets are primarily attributable to tax deferral of losses on wash sales, tax treatment of CDS contracts, mark-to-market of futures contracts, tax treatment of contingent payment on debt instruments, tax deferral of losses on straddles and tax treatment of market discount and premium on debt instruments.
Qualified late year ordinary and capital losses (including currency and specified gain/loss items) represent losses realized from Jan. 1, 2015 through July 31, 2015 and Nov. 1, 2014 through July 31, 2015, respectively, that in accordance with federal income tax regulations, the Fund has elected to defer and treat as having arisen in the following fiscal year.
For financial reporting purposes, capital accounts are adjusted to reflect the tax character of permanent book/tax differences. Reclassifications are primarily due to tax treatment of gain (loss) on foreign currency transactions, contingent payment debt instruments, market discount and premium on certain debt instruments, paydowns of mortgage- and asset-backed securities, and tax treatment of CDS contracts. Results of operations and net assets were not affected by these reclassifications. For the year ended July 31, 2015, the Fund recorded the following reclassifications:
| | | | |
Distributions in excess of net investment income | | $ | (1,076,428 | ) |
Accumulated net realized loss | | | 1,076,428 | |
On Dec. 22, 2010, the Regulated Investment Company Modernization Act of 2010 (Act) was enacted, which changed various technical rules governing the tax treatment of regulated investment companies. The changes were generally effective for taxable years beginning after the date of enactment. Under the Act, the Fund is permitted to carry forward capital losses incurred in taxable years beginning after the
49
Notes to financial statements
Delaware Diversified Floating Rate Fund
5. Components of Net Assets on a Tax Basis (continued)
date of enactment for an unlimited period. Additionally, post-enactment capital loss carryforwards will retain their character as either short-term or long-term capital losses rather than being considered all short-term as permitted under previous regulation.
Losses incurred that will be carried forward under the Act are as follows:
| | | | | | | | |
| | | Loss carryforward character | |
| | | Short-term | | | Long-term | |
| | $ | 1,954,538 | | | $ | 2,571,532 | |
6. Capital Shares
Transactions in capital shares were as follows:
| | | | | | | | |
| | | Year ended | |
| | | 7/31/15 | | | 7/31/14 | |
Shares sold: | | | | | | | | |
Class A | | | 3,697,805 | | | | 15,206,757 | |
Class C | | | 967,543 | | | | 6,073,699 | |
Class R | | | 2,319 | | | | 99,113 | |
Institutional Class | | | 14,255,949 | | | | 25,126,646 | |
| | |
Shares issued upon reinvestment of dividends and distributions: | | | | | | | | |
Class A | | | 255,211 | | | | 461,521 | |
Class C | | | 125,474 | | | | 141,692 | |
Class R | | | 1,580 | | | | 312 | |
Institutional Class | | | 489,149 | | | | 324,035 | |
| | | | | | | | |
| | | 19,795,030 | | | | 47,433,775 | |
| | | | | | | | |
| | |
Shares redeemed: | | | | | | | | |
Class A | | | (11,962,584 | ) | | | (19,931,678 | ) |
Class C | | | (4,161,456 | ) | | | (4,260,356 | ) |
Class R | | | (34,196 | ) | | | (6,571 | ) |
Institutional Class | | | (18,612,883 | ) | | | (10,490,343 | ) |
| | | | | | | | |
| | | (34,771,119 | ) | | | (34,688,948 | ) |
| | | | | | | | |
Net increase (decrease) | | | (14,976,089 | ) | | | 12,744,827 | |
| | | | | | | | |
50
Certain shareholders may exchange shares of one class of shares for another class in the same Fund. For the years ended July 31, 2015 and 2014, the Fund had the following exchange transactions. These exchange transactions are included as subscriptions and redemptions in the table on the previous page and the “Statements of changes in net assets.”
| | | | | | | | | | | | | | | | | | | | | | | | |
| | | Exchange Redemptions | | | Exchange Subscriptions | |
Year Ended | | Class A
Shares | | | Class C
Shares | | | Institutional
Class
Shares | | | Class A
Shares | | | Institutional
Class
Shares | | | Value | |
7/31/15 | | | 1,649 | | | | 7,956 | | | | 74,977 | | | | 77,319 | | | | 7,249 | | | $ | 717,181 | |
7/31/14 | | | 83,073 | | | | 63,345 | | | | — | | | | — | | | | 146,452 | | | | 1,265,349 | |
7. Line of Credit
The Fund, along with certain other funds in the Delaware Investments® Family of Funds (Participants), was a participant in a $225,000,000 revolving line of credit intended to be used for temporary or emergency purposes as an additional source of liquidity to fund redemptions of investor shares. Under the agreement, the Participants were charged an annual commitment fee of 0.08%, which was allocated across the Participants on the basis of each Participant’s allocation of the entire facility. The Participants were permitted to borrow up to a maximum of one third of their net assets under the agreement. Each Participant was individually, and not jointly, liable for its particular advances, if any, under the line of credit. The line of credit available under the agreement expired on Nov. 10, 2014.
On Nov. 10, 2014, the Fund, along with the other Participants, entered into an amendment to the agreement for a $275,000,000 revolving line of credit. The line of credit is to be used as described above and operates in substantially the same manner as the original agreement described above. The line of credit available under the agreement expires on Nov. 9, 2015.
The Fund had no amounts outstanding as of July 31, 2015 or at any time during the year then ended.
8. Derivatives
U.S. GAAP requires disclosures that enable investors to understand: (1) how and why an entity uses derivatives; (2) how they are accounted for; and (3) how they affect an entity’s results of operations and financial position.
Futures Contracts – A futures contract is an agreement in which the writer (or seller) of the contract agrees to deliver to the buyer an amount of cash or securities equal to a specific dollar amount times the difference between the value of a specific security or index at the close of the last trading day of the contract and the price at which the agreement is made. The Fund may use futures in the normal course of pursuing its investment objective. The Fund may invest in futures contracts to hedge its existing portfolio securities against fluctuations in fair value caused by changes in interest rates or market conditions. Upon entering into a futures contract, the Fund deposits cash or pledges U.S. government securities to a broker, equal to the minimum “initial margin” requirements of the exchange on which the contract is traded. Subsequent payments are received from the broker or paid to the broker each day, based on the daily fluctuation in the market value of the contract. These receipts or payments are known as “variation margin” and are recorded daily by the Fund as unrealized gains or losses until the
51
Notes to financial statements
Delaware Diversified Floating Rate Fund
8. Derivatives (continued)
contracts are closed. When the contracts are closed, the Fund records a realized gain or loss equal to the difference between the value of the contract at the time it was opened and the value at the time it was closed. Risks of entering into futures contracts include potential imperfect correlation between the futures contracts and the underlying securities and the possibility of an illiquid secondary market for these instruments. When investing in futures, there is reduced counterparty credit risk to the Fund because futures are exchange-traded and the exchange’s clearinghouse, as counterparty to all exchange-traded futures, guarantees against default. At July 31, 2015, the Fund posted $87,000 in cash as margin for open futures contracts, which is included on the “Statement of asset and liabilities” under “Cash collateral due from brokers.”
During the year ended July 31, 2015, the Fund used futures contracts to hedge the Fund’s existing portfolio securities against fluctuations in value caused by changes in interest rates or market conditions.
Swap Contracts – The Fund may enter into interest rate swap contracts and CDS contracts in the normal course of pursuing its investment objective. The Fund may use interest rate swaps to adjust the Fund’s sensitivity to interest rates or to hedge against changes in interest rates. The Fund may enter into CDS contracts in order to hedge against a credit event, to enhance total return or to gain exposure to certain securities or markets. The Fund will not be permitted to enter into any swap transactions unless, at the time of entering into such transactions, the unsecured long-term debt of the actual counterparty, combined with any credit enhancements, is rated at least BBB- by Standard & Poor’s Financial Services LLC (S&P) or Baa3 by Moody’s Investors Service Inc. (Moody’s) or is determined to be of equivalent credit quality by DMC.
Interest Rate Swaps. An interest rate swap contract is an exchange of interest rates between counterparties. In one instance, an interest rate swap involves payments received by the Fund from another party based on a variable or floating interest rate, in return for making payments based on a fixed interest rate. An interest rate swap can also work in reverse with the Fund receiving payments based on a fixed interest rate and making payments based on a variable or floating interest rate. Interest rate swaps may be used to adjust the Fund’s sensitivity to interest rates or to hedge against changes in interest rates. Periodic payments on such contracts are accrued daily and recorded as unrealized appreciation/depreciation on swap contracts. Upon periodic payment/receipt or termination of the contract, such amounts are recorded as realized gains or losses on swap contracts. The Fund’s maximum risk of loss from counterparty credit risk is the discounted net value of the cash flows to be received from/paid to the counterparty over the interest rate swap contract’s remaining life, to the extent that the amount is positive. This risk is mitigated by (1) for bilateral swap contacts, having a netting arrangement between the Fund and the counterparty and by the posting of collateral by the counterparty to the Fund to cover the Fund’s exposure to the counterparty, and (2) for cleared swaps, trading these instruments through a central counterparty.
During the year ended July 31, 2015, the Fund used interest rate swap contracts to manage the Fund’s sensitivity to interest rates or to hedge against changes in interest rates.
Credit Default Swaps. A CDS contract is a risk-transfer instrument through which one party (purchaser of protection) transfers to another party (seller of protection) the financial risk of a credit event (as defined in the CDS agreement), as it relates to a particular reference security or basket of securities (such as an
52
index). In exchange for the protection offered by the seller of protection, the purchaser of protection agrees to pay the seller of protection a periodic amount at a stated rate that is applied to the notional amount of the CDS contract. In addition, an upfront payment may be made or received by the Fund in connection with an unwinding or assignment of a CDS contract. Upon the occurrence of a credit event, the seller of protection would pay the par (or other agreed-upon) value of the reference security (or basket of securities) to the counterparty. Credit events generally include, among others, bankruptcy, failure to pay, and obligation default.
During the year ended July 31, 2015, the Fund entered into CDS contracts as a purchaser of protection. Periodic payments (receipts) on such contracts are accrued daily and recorded as unrealized losses (gains) on swap contracts. Upon payment (receipt), such amounts are recorded as realized losses (gains) on swap contracts. Upfront payments made or received in connection with CDS contracts are amortized over the expected life of the CDS contracts as unrealized losses (gains) on swap contracts. The change in value of CDS contracts is recorded daily as unrealized appreciation or depreciation. A realized gain or loss is recorded upon a credit event (as defined in the CDS agreement) or the maturity or termination of the agreement. For the year ended July 31, 2015, the Fund did not enter into any CDS contracts as a seller of protection. Initial margin and variation margin are posted to central counterparties for CDS basket trades, as determined by the applicable central counterparty. At July 31, 2015, the Fund has posted $3,638,668 in cash as collateral for open cleared swap contracts. These amounts are included on the “Statement of assets and liabilities” under “Cash collateral due from brokers.”
CDS contracts may involve greater risks than if the Fund had invested in the reference obligation directly. CDS contracts are subject to general market risk, liquidity risk, counterparty risk and credit risk. The Fund’s maximum risk of loss from counterparty credit risk, either as the seller of protection or the buyer of protection, is the fair value of the contract. This risk is mitigated by (1) for bilateral swap contacts, having a netting arrangement between the Fund and the counterparty and by the posting of collateral by the counterparty to the Fund to cover the Fund’s exposure to the counterparty, and (2) for cleared swaps, trading these instruments through a central counterparty.
During the year ended July 31, 2015, the Fund used CDS contracts to hedge against credit events.
Swaps Generally. The value of open swaps may differ from that which would be realized in the event the Fund terminated its position in the contract on a given day. Risks of entering into these contracts include the potential inability of the counterparty to meet the terms of the contracts. This type of risk is generally limited to the amount of favorable movement in the value of the underlying security, instrument or basket of instruments, if any, at the day of default. Risks also arise from potential losses from adverse market movements and such losses could exceed the unrealized amounts shown on the “Schedule of investments.”
53
Notes to financial statements
Delaware Diversified Floating Rate Fund
8. Derivatives (continued)
Fair values of derivative instruments as of July 31, 2015 were as follows:
| | | | | | | | | | | | |
| | | Asset Derivatives | | | Liability Derivatives | |
| | | Statement of Assets and | | | | | Statement of Assets and | | | |
| | | Liabilities Location | | Fair Value | | | Liabilities Location | | Fair Value | |
Interest rate contracts
(Futures contracts) | | Variation margin due to broker on futures contracts | | | $ — | | | Variation margin due to broker on futures contracts | | | $ (61,365) | * |
Interest rate contracts
(Swap contracts) | | Unrealized depreciation on interest rate swap contracts | | | — | | | Unrealized depreciation on interest rate swap contracts | | | (1,221,660) | |
Interest rate contracts
(Swap contracts) | | Variation margin due to broker on centrally cleared interest rate swap contracts | | | — | | | Variation margin due to broker on centrally cleared interest rate swap contracts | | | (283,526) | |
Credit contracts
(Swap contracts) | | Unrealized appreciation on credit default swap contracts | | | 37,790 | | | Unrealized depreciation on credit default swap contracts | | | (14,202) | |
Credit contracts
(Swap contracts) | | Variation margin due to broker on centrally cleared credit default swap contracts | | | — | | | Variation margin due to broker on centrally cleared credit default swap contracts | | | (14,558) | |
Total | | | | | $37,790 | | | | | | $(1,595,311) | |
*Includes cumulative appreciation (depreciation) of futures contracts from the date the contracts are opened through July 31, 2015. Only current day variation margin is reported on the Fund’s “Statement of assets and liabilities.”
The effect of derivative instruments in the “Statement of operations” for the year ended July 31, 2015 was as follows:
| | | | | | | | | | | | |
| | | | | | Net Realized Gain (Loss) on: | | | | |
| | | |
| | | Futures Contracts | | | Swaps Contracts | | | Total | |
Interest rate contracts | | | $(372,650) | | | | $(3,098,830) | | | | $(3,471,480) | |
Credit contracts | | | — | | | | (31,977) | | | | (31,977) | |
| | | | | | | | | | | | |
Total | | | $(372,650) | | | | $(3,130,807) | | | | $(3,503,457) | |
| | | | | | | | | | | | |
54
| | | | | | | | | | | | |
| | | Net Change in Unrealized Appreciation (Depreciation) of: | |
| | | |
| | | Futures Contracts | | | Swaps Contracts | | | Total | |
Interest rate contracts | | | $(63,297 | ) | | | $(695,187 | ) | | | $(758,484 | ) |
Credit contracts | | | — | | | | (49,746 | ) | | | (49,746 | ) |
| | | | | | | | | | | | |
Total | | | $(63,297 | ) | | | $(744,933 | ) | | | $(808,230 | ) |
| | | | | | | | | | | | |
Derivatives Generally. The table below summarizes the average balance of derivative holdings by the Fund during the year ended July 31, 2015.
| | | | | | | | |
| | | Long Derivative | | | Short Derivative | |
| | | Volume | | | Volume | |
Futures contracts (average notional value) | | USD | — | | | | USD 11,158,545 | |
CDS contracts (average notional value)* | | USD | 6,047,798 | | | | — | |
| | EUR | 690,079 | | | | — | |
Interest rate swap contracts (average notional value)** | | USD | 86,447,321 | | | | — | |
*Long represents buying protection and short represents selling protection.
**Long represents receiving fixed interest payments and short represents paying fixed interest payments.
9. Offsetting
In December 2011, the Financial Accounting Standards Board (FASB) issued guidance that expanded disclosure requirements on the offsetting of certain assets and liabilities. The disclosures are required for investments and derivative financial instruments subject to master netting or similar agreements which are eligible for offset on the “Statement of assets and liabilities” and requires an entity to disclose both gross and net information about such investments and transactions in the financial statements. In January 2013, the FASB issued guidance that clarified which investments and transactions are subject to the offsetting disclosure requirements. The scope of the disclosure requirements for offsetting is limited to derivative instruments, repurchase agreements and reverse repurchase agreements, and securities borrowing. The guidance is effective for financial statements with fiscal years beginning on or after Jan. 1, 2013, and interim periods within those fiscal years.
In order to better define its contractual rights and to secure rights that will help the Fund mitigate its counterparty risk, the Fund entered into an International Swaps and Derivatives Association, Inc. Master Agreement (ISDA Master Agreement) or a similar agreement with certain of its derivative contract counterparties. An ISDA Master Agreement is a bilateral agreement between the Fund and a counterparty that governs certain over-the-counter (OTC) derivatives and foreign exchange contracts and typically contains, among other things, collateral posting items and netting provisions in the event of a default and/or termination event. Under an ISDA Master Agreement, the Fund may, under certain circumstances, offset with the counterparty certain derivative financial instruments’ payables and/or receivables with collateral held and/or posted and create one single net payment. The provisions of the ISDA Master Agreement typically permit a single net payment in the event of default (close-out) including the bankruptcy or insolvency of the counterparty. However, bankruptcy or insolvency laws of a particular jurisdiction may impose restrictions on or prohibitions against the right of offset in bankruptcy, insolvency or other events.
55
Notes to financial statements
Delaware Diversified Floating Rate Fund
9. Offsetting (continued)
For financial reporting purposes, the Fund does not offset derivative assets and derivative liabilities that are subject to netting arrangements on the “Statement of assets and liabilities.”
At July 31, 2015, the Fund had the following assets and liabilities subject to offsetting provisions:
Offsetting of Financial Assets and Liabilities and Derivative Assets and Liabilities.
| | | | | | | | | | | | | | | | | | | | | | | | |
| | | | | | Gross Value of | | | Gross Value of | | | | |
| Counterparty | | | | | Derivative Asset | | | Derivative Liability | | | Net Position | |
Citigroup Global Markets | | | | | | | $11,840 | | | | $— | | | | $11,840 | |
Hong Kong Shanghai Bank | | | | | | | 959 | | | | — | | | | 959 | |
Total | | | | | | | $12,799 | | | | $— | | | | $12,799 | |
| | | | | | |
| | | | | | Fair Value | | | | | | Fair Value | | | | | | | |
| | | | | | of | | | | | | of | | | | | | | |
| | | | | | Non-Cash | | | Cash | | | Non-Cash | | | Cash | | | | |
| | | | | | Collateral | | | Collateral | | | Collateral | | | Collateral | | | Net | |
Counterparty | | Net Position | | | Received | | | Received | | | Pledged | | | Pledged | | | Amount(a) | |
Citigroup Global Markets | | | $11,840 | | | | $— | | | | $— | | | | $— | | | | $— | | | | $11,840 | |
Hong Kong Shanghai Bank | | | 959 | | | | — | | | | — | | | | — | | | | — | | | | 959 | |
Total | | | $12,799 | | | | $— | | | | $— | | | | $— | | | | $— | | | | $12,799 | |
(a)Net amount represents the receivable/(payable) that would be due from/(to) the counterparty in the event of default.
10. Securities Lending
The Fund, along with other funds in the Delaware Investments® Family of Funds, may lend its securities pursuant to a security lending agreement (Lending Agreement) with The Bank of New York Mellon (BNY Mellon). At the time a security is loaned, the borrower must post collateral equal to the required percentage of the market value of the loaned security, including any accrued interest. The required percentage is: (1) 102% with respect to U.S. securities and foreign securities that are denominated and payable in U.S. dollars; and (2) 105% with respect to foreign securities. With respect to each loan, if on any business day the aggregate market value of securities collateral plus cash collateral held is less than the aggregate market value of the securities which are the subject of such loan, the borrower will be notified to provide additional collateral by the end of the following business day which, together with the collateral already held, will be not less than the applicable initial collateral requirements for such security loan. If the aggregate market value of securities collateral and cash collateral held with respect to a security loan exceeds the applicable initial collateral requirement, upon the request of the borrower, BNY Mellon must return enough collateral to the borrower by the end of the following business day to reduce the value of the remaining collateral to the applicable initial collateral requirement for such security loan. As a result of the foregoing, the value of the collateral held with respect to a loaned security on any particular day may be more or less than the value of the security on loan.
Cash collateral received is generally invested in the Delaware Investments Collateral Fund No. 1 (Collective Trust) established by BNY Mellon for the purpose of investment on behalf of funds managed by DMC that participate in BNY Mellon’s securities lending program. The Collective Trust may invest in U.S. government securities, high-quality corporate debt, asset-backed and other money market securities, and in repurchase agreements collateralized by such securities, provided that the
56
Collective Trust will generally have a dollar-weighted average portfolio maturity of 60 days or less. The Fund can also accept U.S. government securities and letters of credit (non-cash collateral) in connection with securities loans. In the event of default or bankruptcy by the lending agent, realization and/or retention of the collateral may be subject to legal proceedings. In the event the borrower fails to return the loaned securities and the collateral received is insufficient to cover the value of the loaned securities and provided such collateral shortfall is not the result of investment losses, the lending agent has agreed to pay the amount of the shortfall to the Fund or, at the discretion of the lending agent, replace the loaned securities. The Fund continues to record dividends or interest, as applicable, on the securities loaned and is subject to changes in value of the securities loaned that may occur during the term of the loan. The Fund has the right under the Lending Agreement to recover the securities from the borrower on demand. With respect to security loans collateralized by non-cash collateral, the Fund receives loan premiums paid by the borrower. With respect to security loans collateralized by cash collateral, the earnings from the collateral investments are shared among the Fund, the security lending agent, and the borrower. The Fund records security lending income net of allocations to the security lending agent and the borrower.
The Collective Trust used for the investment of cash collateral received from borrowers of securities seeks to maintain a net asset value per unit of $1.00, but there can be no assurance that it will always be able to do so. The Fund may incur investment losses as a result of investing securities lending collateral in the Collective Trust. This could occur if an investment in the Collective Trust defaulted or if it were necessary to liquidate assets in the Collective Trust to meet returns on outstanding security loans at a time when the Collective Trust’s net asset value per unit was less than $1.00. Under those circumstances, the Fund may not receive an amount from the Collective Trust that is equal in amount to the collateral the Fund would be required to return to the borrower of the securities and the Fund would be required to make up for this shortfall.
During the year ended July 31, 2015, the Fund had no securities out on loan.
11. Credit and Market Risk
Some countries in which the Fund may invest require governmental approval for the repatriation of investment income, capital, or the proceeds of sales of securities by foreign investors. In addition, if there is deterioration in a country’s balance of payments or for other reasons, a country may impose temporary restrictions on foreign capital remittances abroad. The securities exchanges of certain foreign markets are substantially smaller, less liquid and more volatile than the major securities markets in the United States. Consequently, acquisition and disposition of securities by the Fund may be inhibited. In addition, a significant portion of the aggregate market value of securities listed on the major securities exchanges in emerging markets is held by a smaller number of investors. This may limit the number of shares available for acquisition or disposition by the Fund.
The Fund invests a portion of its assets in high-yield fixed income securities, which are securities rated lower than BBB- by S&P and lower than Baa3 by Moody’s, or similarly rated by another nationally recognized statistical rating organization. Investments in these higher yielding securities are generally accompanied by a greater degree of credit risk than higher rated securities. Additionally, lower rated securities may be more susceptible to adverse economic and competitive industry conditions than investment grade securities.
57
Notes to financial statements
Delaware Diversified Floating Rate Fund
11. Credit and Market Risk (continued)
The Fund invests in fixed income securities whose value is derived from an underlying pool of mortgages or consumer loans. The value of these securities is sensitive to changes in economic conditions, including delinquencies and/or defaults, and may be adversely affected by shifts in the market’s perception of the issuers and changes in interest rates. Investors receive principal and interest payments as the underlying mortgages and consumer loans are paid back. Some of these securities are collateralized mortgage obligations (CMOs). CMOs are debt securities issued by U.S. government agencies or by financial institutions and other mortgage lenders, which are collateralized by a pool of mortgages held under an indenture. Prepayment of mortgages may shorten the stated maturity of the obligations and can result in a loss of premium, if any has been paid. Certain of these securities may be stripped (securities which provide only the principal or interest feature of the underlying security). The yield to maturity on an interest-only CMO is extremely sensitive not only to changes in prevailing interest rates, but also to the rate of principal payments (including prepayments) on the related underlying mortgage assets. A rapid rate of principal payments may have a material adverse effect on the Fund’s yield to maturity. If the underlying mortgage assets experience greater-than-anticipated prepayments of principal, the Fund may fail to fully recoup its initial investment in these securities even if the securities are rated in the highest ratings categories.
The Fund invests in certain obligations that may have liquidity protection designed to ensure that the receipt of payments due on the underlying security is timely. Such protection may be provided through guarantees, insurance policies or letters of credit obtained by the issuer or sponsor through third parties, through various means of structuring the transaction or through a combination of such approaches. The Fund will not pay any additional fees for such credit support, although the existence of credit support may increase the price of the security.
The Fund invests in bank loans and other securities that may subject it to direct indebtedness risk, the risk that the Fund will not receive payment of principal, interest, and other amounts due in connection with these investments and will depend primarily on the financial condition of the borrower. Loans that are fully secured offer the Fund more protection than unsecured loans in the event of nonpayment of scheduled interest or principal, although there is no assurance that the liquidation of collateral from a secured loan would satisfy the corporate borrower’s obligation, or that the collateral can be liquidated. Some loans or claims may be in default at the time of purchase. Certain of the loans and the other direct indebtedness acquired by the Fund may involve revolving credit facilities or other standby financing commitments that obligate the Fund to pay additional cash on a certain date or on demand. These commitments may require the Fund to increase its investment in a company at a time when the Fund might not otherwise decide to do so (including at a time when the company’s financial condition makes it unlikely that such amounts will be repaid). To the extent that the Fund is committed to advance additional funds, it will at all times hold and maintain cash or other high grade debt obligations in an amount sufficient to meet such commitments. As the Fund may be required to rely upon another lending institution to collect and pass on to the Fund amounts payable with respect to the loan and to enforce the Fund’s rights under the loan and other direct indebtedness, an insolvency, bankruptcy, or reorganization of the lending institution may delay or prevent the Fund from receiving such amounts. The highly leveraged nature of many loans may make them especially vulnerable to adverse changes in
58
economic or market conditions. Investments in such loans and other direct indebtedness may involve additional risk to the Fund.
The Fund may invest up to 15% of its net assets in illiquid securities, which may include securities with contractual restrictions on resale, securities exempt from registration under Rule 144A of the Securities Act of 1933, as amended, and other securities which may not be readily marketable. The relative illiquidity of these securities may impair the Fund from disposing of them in a timely manner and at a fair price when it is necessary or desirable to do so. While maintaining oversight, the Fund’s Board has delegated to DMC the day-to-day functions of determining whether individual securities are illiquid for purposes of the Fund’s limitation on investments in illiquid securities. Securities eligible for resale pursuant to Rule 144A, which are determined to be liquid, are not subject to the Fund’s 15% limit on investments in illiquid securities. Rule 144A and illiquid securities have been identified on the “Schedule of investments.”
12. Contractual Obligations
The Fund enters into contracts in the normal course of business that contain a variety of indemnifications. The Fund’s maximum exposure under these arrangements is unknown. However, the Fund has not had prior claims or losses pursuant to these contracts. Management has reviewed the Fund’s existing contracts and expects the risk of loss to be remote.
13. Recent Accounting Pronouncements
In June 2014, the FASB issued guidance to improve the financial reporting of reverse repurchase agreements and other similar transactions. The guidance includes expanded disclosure requirements for entities that enter into reverse repurchase agreements and similar transactions accounted for as secured borrowings. The guidance is effective for financial statements with fiscal years beginning on or after Dec. 15, 2014 and interim periods within those fiscal years. Management has determined that this pronouncement has no impact on the Fund’s financial statements.
In May 2015, the FASB issued Accounting Standards Update (“ASU”) No. 2015-07 regarding “Disclosures for Investments in Certain Entities That Calculate Net Asset Value per Share”. The amendments in this update are effective for the Fund for fiscal years beginning after Dec. 15, 2015, and interim periods within those fiscal years. ASU No. 2015-07 will eliminate the requirement to categorize investments in the fair value hierarchy if their fair value is measured at net asset value (“NAV”) per share (or its equivalent) using the practical expedient in the FASB’s fair value measurement guidance. At this time, management is evaluating the implications of ASU No. 2015-07 and its impact on the financial statement disclosures has not yet been determined.
14. Subsequent Events
Management has determined that no material events or transactions occurred subsequent to July 31, 2015 that would require recognition or disclosure in the Fund’s financial statements.
59
Report of independent
registered public accounting firm
To the Board of Trustees of Delaware Group® Income Funds
and the Shareholders of Delaware Diversified Floating Rate Fund:
In our opinion, the accompanying statement of assets and liabilities, including the schedule of investments, and the related statements of operations and of changes in net assets and the financial highlights present fairly, in all material respects, the financial position of Delaware Diversified Floating Rate Fund (one of the series constituting Delaware Group® Income Funds, hereinafter referred to as the “Fund”) at July 31, 2015, the results of its operations for the year then ended, the changes in its net assets for each of the two years in the period then ended and the financial highlights for each of the five years in the period then ended, in conformity with accounting principles generally accepted in the United States of America. These financial statements and financial highlights (hereafter referred to as “financial statements”) are the responsibility of the Fund’s management. Our responsibility is to express an opinion on these financial statements based on our audits. We conducted our audits of these financial statements in accordance with the standards of the Public Company Accounting Oversight Board (United States). Those standards require that we plan and perform the audit to obtain reasonable assurance about whether the financial statements are free of material misstatement. An audit includes examining, on a test basis, evidence supporting the amounts and disclosures in the financial statements, assessing the accounting principles used and significant estimates made by management, and evaluating the overall financial statement presentation. We believe that our audits, which included confirmation of securities at July 31, 2015 by correspondence with the custodian and brokers and the application of alternative auditing procedures where confirmations of securities purchased had not been received, provide a reasonable basis for our opinion.
PricewaterhouseCoopers LLP
Philadelphia, Pennsylvania
September 22, 2015
60
Other Fund information (Unaudited)
Delaware Diversified Floating Rate Fund
Tax Information
The information set forth below is for the Fund’s fiscal year as required by federal income tax laws. Shareholders, however, must report distributions on a calendar year basis for income tax purposes, which may include distributions for portions of two fiscal years of the Fund. Accordingly, the information needed by shareholders for income tax purposes will be sent to them in January of each year. Please consult your tax advisor for proper treatment of this information.
All disclosures are based on financial information available as of the date of this annual report and, accordingly are subject to change. For any and all items requiring reporting, it is the intention of the Fund to report the maximum amount permitted under the Internal Revenue Code and the regulations thereunder.
For the fiscal year ended July 31, 2015, the Fund reports distributions paid during the year as follows:
| | | | |
(A) Ordinary Income Distribution (Tax Basis)* | | | 94.63 | % |
(B) Return of Capital (Tax Basis) | | | 5.37 | % |
Total Distributions (Tax Basis) | | | 100.00 | % |
(C) Qualifying dividends1 | | | 0.97 | % |
(A) and (B) are based on a percentage of the Fund’s total distributions.
(C) is based on a percentage of the Fund’s ordinary income distributions.
1 Qualifying dividends represent dividends which qualify for the corporate dividends received deduction.
*For the fiscal year ended July 31, 2015, certain dividends paid by the Fund may be subject to a maximum tax rate of 20%. The percentage of dividends paid by the Fund from ordinary income reported as qualified income is 1.48%. Complete information will be compiled and reported in conjunction with your 2015 Form 1099-DIV.
Proxy Results
At Joint Special Meetings of Shareholders of Delaware Group® Income Funds (the “Trust”), on behalf of Delaware Corporate Bond Fund, Delaware Diversified Floating Rate Fund, Delaware Extended Duration Bond Fund, and Delaware High-Yield Opportunities Fund (each, a “Fund” and together, the “Funds”), held on March 31, 2015 and reconvened on April 21, 2015 for the proposal listed in item (ii) below for Delaware High-Yield Opportunities Fund, and reconvened on April 21, 2015 and May 12, 2015 for the proposal listed in item (iii) below for Delaware Extended Duration Bond Fund, the shareholders of the Trust/the Funds voted to: (i) elect a Board of Trustees for the Trust; (ii) approve the implementation of a new “manager of managers” order for Delaware Corporate Bond Fund, Delaware Diversified Floating Rate Fund, and Delaware High-Yield Opportunities Fund; (iii) revise the fundamental investment restriction relating to lending for Delaware Corporate Bond Fund, Delaware Diversified Floating Rate Fund, Delaware Extended Duration Bond Fund, and Delaware High-Yield Opportunities Fund; and (iv)(a) revise provisions of the Trust’s Agreement and Declaration of Trust related to documenting the transfer of shares, (iv)(b) revise provisions of the Trust’s Agreement and Declaration of Trust related to shareholder disclosure of certain information upon board demand, and (iv)(c) revise provisions of the Trust’s By-Laws so that Delaware law will apply to matters related to proxies. At the meeting, the following people were elected to serve as Independent Trustees: Thomas L. Bennett, Ann D. Borowiec, Joseph W. Chow, John A. Fry, Lucinda S. Landreth, Frances A. Sevilla-Sacasa, Thomas K. Whitford, Janet L. Yeomans, and J. Richard Zecher. In addition, Patrick P. Coyne was elected to serve as an Interested Trustee.
61
The Joint Special Meeting of Shareholders of the Trust was adjourned to April 21, 2015, May 12, 2015, and June 2, 2015 for the proposal to approve the implementation of a new “manager of managers” order for Delaware Extended Duration Bond Fund.
The following proposals were submitted for a vote of the shareholders:
1. To elect a Board of Trustees for the Trust.
A quorum of the shares outstanding of the Funds of the Trust was present, and the votes passed with a plurality of these shares.
| | | | | | | | | | | | | | | | | | | | | | | | |
| | | Shares Voted For | | | % of
Outstanding
Shares | | | % of
Shares
Voted | | | Shares Withheld | | | % of
Outstanding
Shares | | | % of Shares
Voted | |
Thomas L. Bennett | | | 274,460,131.048 | | | | 53.099 | % | | | 97.837 | % | | | 6,068,304.574 | | | | 1.174 | % | | | 2.163 | % |
Ann D. Borowiec | | | 274,247,892.505 | | | | 53.058 | % | | | 97.761 | % | | | 6,280,543.117 | | | | 1.215 | % | | | 2.239 | % |
Joseph W. Chow | | | 274,247,112.243 | | | | 53.058 | % | | | 97.761 | % | | | 6,281,323.379 | | | | 1.215 | % | | | 2.239 | % |
Patrick P. Coyne | | | 272,995,227.301 | | | | 52.816 | % | | | 97.315 | % | | | 7,533,208.321 | | | | 1.457 | % | | | 2.685 | % |
John A. Fry | | | 274,327,557.829 | | | | 53.073 | % | | | 97.790 | % | | | 6,200,877.793 | | | | 1.200 | % | | | 2.210 | % |
Lucinda S. Landreth | | | 274,116,526.233 | | | | 53.033 | % | | | 97.714 | % | | | 6,411,909.389 | | | | 1.240 | % | | | 2.286 | % |
Frances A. Sevilla-Sacasa | | | 273,738,907.874 | | | | 52.960 | % | | | 97.580 | % | | | 6,789,527.748 | | | | 1.314 | % | | | 2.420 | % |
Thomas K. Whitford | | | 274,402,849.822 | | | | 53.088 | % | | | 97.816 | % | | | 6,125,585.800 | | | | 1.185 | % | | | 2.184 | % |
Janet L. Yeomans | | | 274,359,928.558 | | | | 53.080 | % | | | 97.801 | % | | | 6,168,507.064 | | | | 1.193 | % | | | 2.199 | % |
J. Richard Zecher | | | 274,345,100.732 | | | | 53.077 | % | | | 97.796 | % | | | 6,183,334.890 | | | | 1.196 | % | | | 2.204 | % |
2. To approve the implementation of a new “manager of managers” order.
A quorum of the shares outstanding of the Funds was present, and the votes passed with the required majority of those shares. The results were as follows:
Delaware Corporate Bond Fund
| | | | |
Shares voted for | | | 88,628,645.674 | |
Percentage of outstanding shares | | | 40.420 | % |
Percentage of shares voted | | | 72.039 | % |
Shares voted against | | | 4,729,194.614 | |
Percentage of outstanding shares | | | 2.157 | % |
Percentage of shares voted | | | 3.844 | % |
Shares abstained | | | 2,484,679.320 | |
Percentage of outstanding shares | | | 1.133 | % |
Percentage of shares voted | | | 2.020 | % |
Broker non-votes | | | 27,185,576.000 | |
62
Other Fund information (Unaudited)
Delaware Diversified Floating Rate Fund
| | | | |
Proxy Results (continued) | | | | |
Delaware Diversified Floating Rate Fund | | | | |
Shares voted for | | | 24,623,335.308 | |
Percentage of outstanding shares | | | 46.422 | % |
Percentage of shares voted | | | 79.387 | % |
Shares voted against | | | 224,821.879 | |
Percentage of outstanding shares | | | 0.424 | % |
Percentage of shares voted | | | 0.725 | % |
Shares abstained | | | 466,098.925 | |
Percentage of outstanding shares | | | 0.879 | % |
Percentage of shares voted | | | 1.503 | % |
Broker non-votes | | | 5,702,757.000 | |
| |
Delaware High-Yield Opportunities Fund | | | | |
| |
Shares voted for | | | 50,956,520.380 | |
Percentage of outstanding shares | | | 35.757 | % |
Percentage of shares voted | | | 68.269 | % |
Shares voted against | | | 2,497,438.049 | |
Percentage of outstanding shares | | | 1.753 | % |
Percentage of shares voted | | | 3.346 | % |
Shares abstained | | | 3,797,377.889 | |
Percentage of outstanding shares | | | 2.665 | % |
Percentage of shares voted | | | 5.088 | % |
Broker non-votes | | | 17,389,855.901 | |
3. To revise the fundamental investment restriction relating to lending.
A quorum of the shares outstanding of the Funds was present, and the votes passed with the required majority of those shares. The results were as follows:
| | | | |
Delaware Corporate Bond Fund | | | | |
| |
Shares voted for | | | 88,724,849.272 | |
Percentage of outstanding shares | | | 40.464 | % |
Percentage of shares voted | | | 72.118 | % |
Shares voted against | | | 4,667,992.388 | |
Percentage of outstanding shares | | | 2.129 | % |
Percentage of shares voted | | | 3.794 | % |
Shares abstained | | | 2,449,680.948 | |
Percentage of outstanding shares | | | 1.117 | % |
Percentage of shares voted | | | 1.991 | % |
Broker non-votes | | | 27,185,573.000 | |
63
| | | | |
Delaware Diversified Floating Rate Fund | | | | |
| |
Shares voted for | | | 24,748,194.728 | |
Percentage of outstanding shares | | | 46.657 | % |
Percentage of shares voted | | | 79.789 | % |
Shares voted against | | | 264,012.275 | |
Percentage of outstanding shares | | | 0.498 | % |
Percentage of shares voted | | | 0.851 | % |
Shares abstained | | | 302,053.109 | |
Percentage of outstanding shares | | | 0.569 | % |
Percentage of shares voted | | | 0.974 | % |
Broker non-votes | | | 5,702,753.000 | |
| |
Delaware Extended Duration Bond Fund | | | | |
| |
Shares voted for | | | 40,920,152.966 | |
Percentage of outstanding shares | | | 40.093 | % |
Percentage of shares voted | | | 67.973 | % |
Shares voted against | | | 2,038,429.194 | |
Percentage of outstanding shares | | | 1.997 | % |
Percentage of shares voted | | | 3.386 | % |
Shares abstained | | | 1,101,353.914 | |
Percentage of outstanding shares | | | 1.079 | % |
Percentage of shares voted | | | 1.829 | % |
Broker non-votes | | | 16,140,524.001 | |
| |
Delaware High-Yield Opportunities Fund | | | | |
Shares voted for | | | 48,900,669.110 | |
Percentage of outstanding shares | | | 34.315 | % |
Percentage of shares voted | | | 68.138 | % |
Shares voted against | | | 2,606,390.535 | |
Percentage of outstanding shares | | | 1.829 | % |
Percentage of shares voted | | | 3.632 | % |
Shares abstained | | | 2,208,123.883 | |
Percentage of outstanding shares | | | 1.549 | % |
Percentage of shares voted | | | 3.077 | % |
Broker non-votes | | | 18,051,986.101 | |
64
Other Fund information (Unaudited)
Delaware Diversified Floating Rate Fund
Proxy Results (continued)
4. (a) To revise provisions of the Trust’s Agreement and Declaration of Trust related to documenting the transfer of shares.
A quorum of the shares outstanding of the Trust was present, and the votes passed with a majority of those shares. The results were as follows:
Delaware Group® Income Funds
| | | | |
Shares voted for | | | 187,369,259.353 | |
Percentage of outstanding shares | | | 36.250 | % |
Percentage of shares voted | | | 66.792 | % |
Shares voted against | | | 5,528,576.892 | |
Percentage of outstanding shares | | | 1.070 | % |
Percentage of shares voted | | | 1.971 | % |
Shares abstained | | | 18,529,078.175 | |
Percentage of outstanding shares | | | 3.585 | % |
Percentage of shares voted | | | 6.605 | % |
Broker non-votes | | | 69,101,521.202 | |
4. (b) To revise provisions of the Trust’s Agreement and Declaration of Trust related to shareholder disclosure of certain information upon board demand.
A quorum of the shares outstanding of the Trust was present, and the votes passed with a majority of those shares. The results were as follows:
Delaware Group Income Funds
| | | | |
Shares voted for | | | 186,061,931.359 | |
Percentage of outstanding shares | | | 35.997 | % |
Percentage of shares voted | | | 66.326 | % |
Shares voted against | | | 6,171,713.659 | |
Percentage of outstanding shares | | | 1.194 | % |
Percentage of shares voted | | | 2.200 | % |
Shares abstained | | | 19,193,253.402 | |
Percentage of outstanding shares | | | 3.713 | % |
Percentage of shares voted | | | 6.842 | % |
Broker non-votes | | | 69,101,537.202 | |
65
4. (c) To revise provisions of the Trust’s By-Laws so that Delaware law will apply to matters related to proxies.
A quorum of the shares outstanding of the Trust was present, and the votes passed with a majority of those shares. The results were as follows:
Delaware Group® Income Funds
| | | | |
Shares voted for | | | 187,367,907.591 | |
Percentage of outstanding shares | | | 36.250 | % |
Percentage of shares voted | | | 66.791 | % |
Shares voted against | | | 5,940,616.912 | |
Percentage of outstanding shares | | | 1.149 | % |
Percentage of shares voted | | | 2.118 | % |
Shares abstained | | | 18,118,395.917 | |
Percentage of outstanding shares | | | 3.505 | % |
Percentage of shares voted | | | 6.459 | % |
Broker non-votes | | | 69,101,515.202 | |
66
Board of trustees / directors and officers addendum
Delaware Investments® Family of Funds
A mutual fund is governed by a Board of Trustees/Directors (“Trustees”), which has oversight responsibility for the management of a fund’s business affairs. Trustees establish procedures and oversee and review the performance of the investment manager, the distributor, and others who perform services for the fund. The independent fund trustees, in particular, are advocates
| | | | |
| Name, Address, | | Position(s) | | Length of |
| and Birth Date | | Held with Fund(s) | | Time Served |
Interested Trustee | | | | |
| Shawn K. Lytle1 | | President, | | Trustee since |
| 2005 Market Street | | Chief Executive Officer, | | September 1, 2015 |
| Philadelphia, PA 19103 | | and Trustee | | |
| February 1970 | | | | President and |
| | | | Chief Executive Officer |
| | | | since August 20, 2015 |
Independent Trustees | | | | |
| Thomas L. Bennett | | Chairman and Trustee | | Trustee since |
| 2005 Market Street | | | | March 2005 |
| Philadelphia, PA 19103 | | | | |
| October 1947 | | | | Chairman since |
| | | | March 1, 2015 |
|
| Ann D. Borowiec | | Trustee | | Since March 31, 2015 |
| 2005 Market Street | | | | |
| Philadelphia, PA 19103 | | | | |
| November 1958 | | | | |
| | |
| | | | |
|
| Joseph W. Chow | | Trustee | | Since January 2013 |
| 2005 Market Street | | | | |
| Philadelphia, PA 19103 | | | | |
| January 1953 | | | | |
| | |
| | | | |
|
| 1 | Shawn K. Lytle is considered to be an “Interested Trustee” because he is an executive officer of the Fund’s(s’) investment advisor. |
67
for shareholder interests. Each trustee has served in that capacity since he or she was elected to or appointed to the Board of Trustees, and will continue to serve until his or her retirement or the election of a new trustee in his or her place. The following is a list of the Trustees and Officers with certain background and related information.
| | | | |
| | | Number of Portfolios in | | |
| Principal Occupation(s) | | Fund Complex Overseen | | Other Directorships |
| During the Past Five Years | | by Trustee or Officer | | Held by Trustee or Officer |
| | | | |
| Shawn K. Lytle has served as | | 64 | | Trustee — UBS |
| President of | | | | Relationship Funds, |
| Delaware Investments2 | | | | SMA Relationship |
| since June 2015 and was the | | | | Trust, and UBS Funds |
| Regional Head of Americas for | | | | (May 2010–April 2015) |
| UBS Global Asset | | | | |
| Management from | | | | |
| 2010 through 2015. | | | | |
| | | | |
| Private Investor | | 64 | | Director — |
| (March 2004–Present) | | | | Bryn Mawr Bank Corp. (BMTC) |
| | | | (2007–2011) |
| | |
| | | | |
|
| Chief Executive Officer | | 64 | | None |
| Private Wealth Management | | | | |
| (2011–2013) and | | | | |
| Market Manager, | | | | |
| New Jersey Private | | | | |
| Bank (2005–2011) – | | | | |
| J.P. Morgan Chase & Co. | | | | |
|
| Executive Vice President | | 64 | | Director and Audit Committee |
| (Emerging Economies | | | | Member — Hercules |
| Strategies, Risks, and | | | | Technology Growth |
| Corporate Administration) | | | | Capital, Inc. |
| State Street Corporation | | | | (2004–2014) |
| (July 2004–March 2011) | | | | |
|
| 2 | Delaware Investments is the marketing name for Delaware Management Holdings, Inc. and its subsidiaries, including the Fund’s(s’) investment advisor, principal underwriter, and its transfer agent. |
68
Board of trustees / directors and officers addendum
Delaware Investments® Family of Funds
| | | | |
Name, Address, and Birth Date | | Position(s) Held with Fund(s) | | Length of Time Served |
Independent Trustees (continued) | | | | |
| John A. Fry | | Trustee | | Since January 2001 |
| 2005 Market Street | | | | |
| Philadelphia, PA 19103 | | | | |
May 1960 | | | | |
|
| Lucinda S. Landreth | | Trustee | | Since March 2005 |
| 2005 Market Street | | | | |
| Philadelphia, PA 19103 | | | | |
| June 1947 | | | | |
|
| Frances A. Sevilla-Sacasa | | Trustee | | Since September 2011 |
| 2005 Market Street | | | | |
| Philadelphia, PA 19103 | | | | |
January 1956 | | | | |
|
69
| | | | |
Principal Occupation(s) During the Past Five Years | | Number of Portfolios in Fund Complex Overseen by Trustee or Officer | | Other Directorships Held by Trustee or Officer |
| | | | |
| President — | | 64 | | Director — Hershey Trust |
| Drexel University | | | | Company |
| (August 2010–Present) | | | | |
| | | | Director, Audit Committee, |
| President — | | | | and Governance Committee |
| Franklin & Marshall College | | | | Member — Community |
| (July 2002–July 2010) | | | | Health Systems |
| | |
| | | | Director — Drexel |
| | | | Morgan & Co. |
|
| Private Investor | | 64 | | None |
(2004–Present) | | | | |
|
| Chief Executive Officer — | | 64 | | Trust Manager and |
| Banco Itaú | | | | Audit Committee |
| International | | | | Member — Camden |
(April 2012–Present) | | | | Property Trust |
| Executive Advisor to Dean | | | | |
(August 2011–March 2012) and Interim Dean | | | | |
| (January 2011–July 2011) — | | | | |
| University of Miami School of | | | | |
Business Administration | | | | |
| President — U.S. Trust, | | | | |
| Bank of America Private | | | | |
| Wealth Management | | | | |
| (Private Banking) | | | | |
| (July 2007–December 2008) | | | | |
|
70
Board of trustees / directors and officers addendum
Delaware Investments® Family of Funds
| | | | |
Name, Address, and Birth Date | | Position(s) Held with Fund(s) | | Length of Time Served |
Independent Trustees (continued) | | | | |
| Thomas K. Whitford | | Trustee | | Since January 2013 |
| 2005 Market Street | | | | |
| Philadelphia, PA 19103 | | | | |
March 1956 | | | | |
|
| Janet L. Yeomans | | Trustee | | Since April 1999 |
| 2005 Market Street | | | | |
| Philadelphia, PA 19103 | | | | |
July 1948 | | | | |
|
71
| | | | |
Principal Occupation(s) During the Past Five Years | | Number of Portfolios in Fund Complex Overseen by Trustee or Officer | | Other Directorships Held by Trustee or Officer |
| | | | |
| Vice Chairman | | 64 | | Director — HSBC Finance |
| (2010–April 2013), | | | | Corporation and HSBC |
| Chief Administrative | | | | North America Holdings Inc. |
Officer (2008–2010), and Executive Vice | | | | Director — |
| President and Chief | | | | HSBC Bank |
| Administrative Officer | | | | |
| (2007–2009) — | | | | |
| PNC Financial | | | | |
| Services Group | | | | |
|
| Vice President and Treasurer | | 64 | | Director, Audit and |
| (January 2006–July 2012) | | | | Compliance Committee Chair, |
| Vice President — | | | | Investment Committee |
| Mergers & Acquisitions | | | | Member, and Governance |
| (January 2003–January 2006), | | | | Committee Member — |
| and Vice President | | | | Okabena Company |
| and Treasurer | | | | |
| (July 1995–January 2003) | | | | Chair — 3M |
| 3M Corporation | | | | Investment Management |
| | | | Company |
| | | | (2005–2012) |
|
72
Board of trustees / directors and officers addendum
Delaware Investments® Family of Funds
| | | | |
Name, Address, and Birth Date | | Position(s) Held with Fund(s) | | Length of Time Served |
Officers | | | | |
| David F. Connor | | Senior Vice President, | | Senior Vice President |
| 2005 Market Street | | General Counsel, | | since May 2013; |
| Philadelphia, PA 19103 | | and Secretary | | General Counsel |
| December 1963 | | | | since May 2015; |
| | | | Secretary since |
| | | | October 2005 |
|
| Daniel V. Geatens | | Vice President | | Treasurer since October 2007 |
| 2005 Market Street | | and Treasurer | | |
| Philadelphia, PA 19103 | | | | |
October 1972 | | | | |
|
| Richard Salus | | Senior Vice President | | Chief Financial Officer |
| 2005 Market Street | | and Chief Financial Officer | | since November 2006 |
| Philadelphia, PA 19103 | | | | |
October 1963 | | | | |
|
The Statement of Additional Information for the Fund(s) includes additional information about the Trustees and Officers and is available, without charge, upon request by calling 800 523-1918.
73
| | | | |
Principal Occupation(s) During the Past Five Years | | Number of Portfolios in Fund Complex Overseen by Trustee or Officer | | Other Directorships Held by Trustee or Officer |
| | | | |
| David F. Connor has served as | | 64 | | None3 |
Senior Vice President of the Fund(s) and the investment advisor since 2013, General Counsel of the Fund(s) and the investment advisor since 2015, and Secretary of the Fund(s) and the investment advisor since 2005. | | | | |
|
| Daniel V. Geatens has served | | 64 | | None3 |
| as Vice President and | | | | |
Treasurer of the Fund(s) since 2007 and Vice President and Director of Financial | | | | |
Administration of the investment advisor since 2010. | | | | |
|
| Richard Salus has served as | | 64 | | None3 |
Senior Vice President and Chief Financial Officer of the Fund(s) and the investment advisor since 2006. | | | | |
|
| 3 | David F. Connor, Daniel V. Geatens, and Richard Salus serve in similar capacities for the six portfolios of the Optimum Fund Trust, which have the same investment advisor, principal underwriter, and transfer agent as the registrant. |
74
About the organization
Board of trustees
| | | | | | |
Shawn K. Lytle President and Chief Executive Officer Delaware Investments® Family of Funds Philadelphia, PA Thomas L. Bennett Chairman of the Board Delaware Investments Family of Funds Private Investor Rosemont, PA | | Ann D. Borowiec Former Chief Executive Officer Private Wealth Management J.P. Morgan Chase & Co. New York, NY Joseph W. Chow Former Executive Vice President State Street Corporation Brookline, MA | | John A. Fry President Drexel University Philadelphia, PA Lucinda S. Landreth Former Chief Investment Officer Assurant, Inc. New York, NY | | Frances A. Sevilla-Sacasa Chief Executive Officer Banco Itaú International Miami, FL Thomas K. Whitford Former Vice Chairman PNC Financial Services Group Pittsburgh, PA Janet L. Yeomans Former Vice President and Treasurer 3M Corporation St. Paul, MN |
Affiliated officers | | | | | | |
| David F. Connor | | Daniel V. Geatens | | Richard Salus | | |
| Senior Vice President, | | Vice President and | | Senior Vice President and | | |
| General Counsel, | | Treasurer | | Chief Financial Officer | | |
| and Secretary | | Delaware Investments | | Delaware Investments | | |
| Delaware Investments | | Family of Funds | | Family of Funds | | |
| Family of Funds | | Philadelphia, PA | | Philadelphia, PA | | |
| Philadelphia, PA | | | | | | |
This annual report is for the information of Delaware Diversified Floating Rate Fund shareholders, but it may be used with prospective investors when preceded or accompanied by the Delaware Investments Fund fact sheet for the most recently completed calendar quarter. These documents are available at delawareinvestments.com.
Delaware Investments is the marketing name of Delaware Management Holdings, Inc. and its subsidiaries.
The Fund files its complete schedule of portfolio holdings with the Securities and Exchange Commission (SEC) for the first and third quarters of each fiscal year on Form N-Q. The Fund’s Forms N-Q, as well as a description of the policies and procedures that the Fund uses to determine how to vote proxies (if any) relating to portfolio securities are available without charge (i) upon request, by calling 800 523-1918; and (ii) on the SEC’s website at sec.gov. In addition, a description of the policies and procedures that the Fund uses to determine how to vote proxies (if any) relating to portfolio securities and the Schedule of Investments included in the Fund’s most recent Form N-Q are available without charge on the Fund’s website at delawareinvestments.com. The Fund’s Forms N-Q may be reviewed and copied at the SEC’s Public Reference Room in Washington, D.C.; information on the operation of the Public Reference Room may be obtained by calling 800 SEC-0330.
Information (if any) regarding how the Fund voted proxies relating to portfolio securities during the most recently disclosed 12-month period ended June 30 is available without charge (i) through the Fund’s website at delawareinvestments.com; and (ii) on the SEC’s website at sec.gov.
75
Item 2. Code of Ethics
The registrant has adopted a code of ethics that applies to the registrant’s principal executive officer, principal financial officer, principal accounting officer or controller, or persons performing similar functions, regardless of whether these individuals are employed by the registrant or a third party. A copy of the registrant’s Code of Business Ethics has been posted on the Delaware Investments Internet Web site at www.delawareinvestments.com. Any amendments to the Code of Business Ethics, and information on any waiver from its provisions granted by the registrant, will also be posted on this Web site within five business days of such amendment or waiver and will remain on the Web site for at least 12 months.
Item 3. Audit Committee Financial Expert
The registrant’s Board of Trustees/Directors has determined that certain members of the registrant’s Audit Committee are audit committee financial experts, as defined below. For purposes of this item, an “audit committee financial expert” is a person who has the following attributes:
a. An understanding of generally accepted accounting principles and financial statements;
b. The ability to assess the general application of such principles in connection with the accounting for estimates, accruals, and reserves;
c. Experience preparing, auditing, analyzing, or evaluating financial statements that present a breadth and level of complexity of accounting issues that are generally comparable to the breadth and complexity of issues that can reasonably be expected to be raised by the registrant’s financial statements, or experience actively supervising one or more persons engaged in such activities;
d. An understanding of internal controls and procedures for financial reporting; and
e. An understanding of audit committee functions.
An “audit committee financial expert” shall have acquired such attributes through:
a. Education and experience as a principal financial officer, principal accounting officer, controller, public accountant, or auditor or experience in one or more positions that involve the performance of similar functions;
b. Experience actively supervising a principal financial officer, principal accounting officer, controller, public accountant, auditor, or person performing similar functions;
c. Experience overseeing or assessing the performance of companies or public accountants with respect to the preparation, auditing, or evaluation of financial statements; or
d. Other relevant experience.
The registrant’s Board of Trustees/Directors has also determined that each member of the registrant’s Audit Committee is independent. In order to be “independent” for purposes of this item, the Audit Committee member may not: (i) other than in his or her capacity as a member of the Board of Trustees/Directors or any committee thereof, accept directly or indirectly any consulting, advisory or other compensatory fee from the issuer; or (ii) be an “interested person” of the registrant as defined in Section 2(a)(19) of the Investment Company Act of 1940.
The names of the audit committee financial experts on the registrant’s Audit Committee are set forth below:
Ann D. Borowiec
Joseph W. Chow
Lucinda S. Landreth1
Frances A. Sevilla-Sacasa
Item 4. Principal Accountant Fees and Services
(a) Audit fees.
The aggregate fees billed for services provided to the registrant by its independent auditors for the audit of the registrant’s annual financial statements and for services normally provided by the independent auditors in connection with statutory and regulatory filings or engagements were $161,000 for the fiscal year ended July 31, 2015.
The aggregate fees billed for services provided to the registrant by its independent auditors for the audit of the registrant’s annual financial statements and for services normally provided by the independent auditors in connection with statutory and regulatory filings or engagements were $186,020 for the fiscal year ended July 31, 2014.
(b) Audit-related fees.
The aggregate fees billed by the registrant’s independent auditors for services relating to the performance of the audit of the registrant’s financial statements and not reported under paragraph (a) of this Item were $0 for the fiscal year ended July 31, 2015.
The aggregate fees billed by the registrant’s independent auditors for services relating to the performance of the audit of the financial statements of the registrant’s investment adviser and other service providers under common control with the adviser and that relate directly to the operations or financial reporting of the registrant were $612,000 for the registrant’s fiscal year ended July 31, 2015. The percentage of these fees relating to services approved by the registrant’s Audit Committee pursuant to the de minimis exception from the pre-approval requirement in Rule 2-01(c)(7)(i)(C) of Regulation S-X was 0%. These audit-related services were as follows: year end audit procedures; group reporting and subsidiary statutory audits.
The aggregate fees billed by the registrant’s independent auditors for services relating to the performance of the audit of the registrant’s financial statements and not reported under paragraph (a) of this Item were $0 for the fiscal year ended July 31, 2014.
____________________
1 The instructions to Form N-CSR require disclosure on the relevant experience of persons who qualify as audit committee financial experts based on “other relevant experience.” The Board of Trustees/Directors has determined that Ms. Landreth qualifies as an audit committee financial expert by virtue of her experience as a financial analyst, her Chartered Financial Analyst (CFA) designation and her service as an audit committee chairperson for a non-profit organization.
The aggregate fees billed by the registrant’s independent auditors for services relating to the performance of the audit of the financial statements of the registrant’s investment adviser and other service providers under common control with the adviser and that relate directly to the operations or financial reporting of the registrant were $618,000 for the registrant’s fiscal year ended July 31, 2014. The percentage of these fees relating to services approved by the registrant’s Audit Committee pursuant to the de minimis exception from the pre-approval requirement in Rule 2-01(c)(7)(i)(C) of Regulation S-X was 0%. These audit-related services were as follows: year end audit procedures; group reporting and subsidiary statutory audits.
(c) Tax fees.
The aggregate fees billed by the registrant’s independent auditors for tax-related services provided to the registrant were $27,790 for the fiscal year ended July 31, 2015. The percentage of these fees relating to services approved by the registrant’s Audit Committee pursuant to the de minimis exception from the pre-approval requirement in Rule 2-01(c)(7)(i)(C) of Regulation S-X was 0%. These tax-related services were as follows: review of income tax returns and review of annual excise distribution calculations.
The aggregate fees billed by the registrant’s independent auditors for tax-related services provided to the registrant’s investment adviser and other service providers under common control with the adviser and that relate directly to the operations or financial reporting of the registrant were $0 for the registrant’s fiscal year ended July 31, 2015.
The aggregate fees billed by the registrant’s independent auditors for tax-related services provided to the registrant were $25,545 for the fiscal year ended July 31, 2014. The percentage of these fees relating to services approved by the registrant’s Audit Committee pursuant to the de minimis exception from the pre-approval requirement in Rule 2-01(c)(7)(i)(C) of Regulation S-X was 0%. These tax-related services were as follows: review of income tax returns and review of annual excise distribution calculations.
The aggregate fees billed by the registrant’s independent auditors for tax-related services provided to the registrant’s investment adviser and other service providers under common control with the adviser and that relate directly to the operations or financial reporting of the registrant were $0 for the registrant’s fiscal year ended July 31, 2014.
(d) All other fees.
The aggregate fees billed for all services provided by the independent auditors to the registrant other than those set forth in paragraphs (a), (b) and (c) of this Item were $0 for the fiscal year ended July 31, 2015.
The aggregate fees billed for all services other than those set forth in paragraphs (b) and (c) of this Item provided by the registrant’s independent auditors to the registrant’s adviser and other service providers under common control with the adviser and that relate directly to the operations or financial reporting of the registrant were $0 for the registrant’s fiscal year ended July 31, 2015. The percentage of these fees relating to services approved by the registrant’s Audit Committee pursuant to the de minimis exception from the pre-approval requirement in Rule 2-01(c)(7)(i)(C) of Regulation S-X was 0%.
The aggregate fees billed for all services provided by the independent auditors to the registrant other than those set forth in paragraphs (a), (b) and (c) of this Item were $0 for the fiscal year ended July 31, 2014.
The aggregate fees billed for all services other than those set forth in paragraphs (b) and (c) of this Item provided by the registrant’s independent auditors to the registrant’s adviser and other service providers under common control with the adviser and that relate directly to the operations or financial reporting of the registrant were $0 for the registrant’s fiscal year ended July 31, 2014. The percentage of these fees relating to services approved by the registrant’s Audit Committee pursuant to the de minimis exception from the pre-approval requirement in Rule 2-01(c)(7)(i)(C) of Regulation S-X was 0%.
(e) The registrant’s Audit Committee has established pre-approval policies and procedures as permitted by Rule 2-01(c)(7)(i)(B) of Regulation S-X (the “Pre-Approval Policy”) with respect to services provided by the registrant’s independent auditors. Pursuant to the Pre-Approval Policy, the Audit Committee has pre-approved the services set forth in the table below with respect to the registrant up to the specified fee limits. Certain fee limits are based on aggregate fees to the registrant and other registrants within the Delaware Investments Family of Funds.
| Service | Range of Fees |
| Audit Services | |
| Statutory audits or financial audits for new Funds | up to $40,000 per Fund |
| Services associated with SEC registration statements (e.g., Form N-1A, Form N-14, etc.), periodic reports and other documents filed with the SEC or other documents issued in connection with securities offerings (e.g., comfort letters for closed-end Fund offerings, consents), and assistance in responding to SEC comment letters | up to $10,000 per Fund |
| Consultations by Fund management as to the accounting or disclosure treatment of transactions or events and/or the actual or potential impact of final or proposed rules, standards or interpretations by the SEC, FASB, or other regulatory or standard-setting bodies (Note: Under SEC rules, some consultations may be considered “audit-related services” rather than “audit services”) | up to $25,000 in the aggregate |
| Audit-Related Services | |
| Consultations by Fund management as to the accounting or disclosure treatment of transactions or events and/or the actual or potential impact of final or proposed rules, standards or interpretations by the SEC, FASB, or other regulatory or standard-setting bodies (Note: Under SEC rules, some consultations may be considered “audit services” rather than “audit-related services”) | up to $25,000 in the aggregate |
| Tax Services | |
| U.S. federal, state and local and international tax planning and advice (e.g., consulting on statutory, regulatory or administrative developments, evaluation of Funds’ tax compliance function, etc.) | up to $25,000 in the aggregate |
| U.S. federal, state and local tax compliance (e.g., excise distribution reviews, etc.) | up to $5,000 per Fund |
| Review of federal, state, local and international income, franchise and other tax returns | up to $5,000 per Fund |
Under the Pre-Approval Policy, the Audit Committee has also pre-approved the services set forth in the table below with respect to the registrant’s investment adviser and other entities controlling, controlled by or under common control with the investment adviser that provide ongoing services to the registrant (the “Control Affiliates”) up to the specified fee limit. This fee limit is based on aggregate fees to the investment adviser and its Control Affiliates.
| Service | Range of Fees |
| Non-Audit Services | |
| Services associated with periodic reports and other documents filed with the SEC and assistance in responding to SEC comment letters | up to $10,000 in the aggregate |
The Pre-Approval Policy requires the registrant’s independent auditors to report to the Audit Committee at each of its regular meetings regarding all services initiated since the last such report was rendered, including those services authorized by the Pre-Approval Policy.
(f) Not applicable.
(g) The aggregate non-audit fees billed by the registrant’s independent auditors for services rendered to the registrant and to its investment adviser and other service providers under common control with the adviser were $7,530,526 and $8,090,937 for the registrant’s fiscal years ended July 31, 2015 and July 31, 2014, respectively.
(h) In connection with its selection of the independent auditors, the registrant’s Audit Committee has considered the independent auditors’ provision of non-audit services to the registrant’s investment adviser and other service providers under common control with the adviser that were not required to be pre-approved pursuant to Rule 2-01(c)(7)(ii) of Regulation S-X. The Audit Committee has determined that the independent auditors’ provision of these services is compatible with maintaining the auditors’ independence.
Item 5. Audit Committee of Listed Registrants
Not applicable.
Item 6. Investments
(a) Included as part of report to shareholders filed under Item 1 of this Form N-CSR.
(b) Divestment of securities in accordance with Section 13(c) of the Investment Company Act of 1940.
Not applicable.
Item 7. Disclosure of Proxy Voting Policies and Procedures for Closed-End Management Investment Companies
Not applicable.
Item 8. Portfolio Managers of Closed-End Management Investment Companies
Not applicable.
Item 9. Purchases of Equity Securities by Closed-End Management Investment Company and Affiliated Purchasers
Not applicable.
Item 10. Submission of Matters to a Vote of Security Holders
Not applicable.
Item 11. Controls and Procedures
The registrant’s principal executive officer and principal financial officer have evaluated the registrant’s disclosure controls and procedures within 90 days of the filing of this report and have concluded that they are effective in providing reasonable assurance that the information required to be disclosed by the registrant in its reports or statements filed under the Securities Exchange Act of 1934 is recorded, processed, summarized and reported within the time periods specified in the rules and forms of the Securities and Exchange Commission.
There were no significant changes in the registrant’s internal control over financial reporting that occurred during the second fiscal quarter of the period covered by the report to stockholders included herein (i.e., the registrant’s fourth fiscal quarter) that have materially affected, or are reasonably likely to materially affect, the registrant’s internal control over financial reporting.
Item 12. Exhibits
(a) (1) Code of Ethics
Not applicable.
(2) Certifications of Principal Executive Officer and Principal Financial Officer pursuant to Rule 30a-2 under the Investment Company Act of 1940 are attached hereto as Exhibit 99.CERT.
(3) Written solicitations to purchase securities pursuant to Rule 23c-1 under the Securities Exchange Act of 1934.
Not applicable.
(b) Certifications pursuant to Section 906 of the Sarbanes-Oxley Act of 2002 are furnished herewith as Exhibit 99.906CERT.
SIGNATURES
Pursuant to the requirements of the Securities Exchange Act of 1934 and the Investment Company Act of 1940, the registrant has duly caused this report to be signed on its behalf, by the undersigned, thereunto duly authorized.
DELAWARE GROUP® INCOME FUNDS
| /s/ SHAWN LYTLE |
| By: | Shawn Lytle |
| Title: | Chief Executive Officer |
| Date: | October 5, 2015 |
Pursuant to the requirements of the Securities Exchange Act of 1934 and the Investment Company Act of 1940, this report has been signed below by the following persons on behalf of the registrant and in the capacities and on the dates indicated.
| /s/ SHAWN LYTLE |
| By: | Shawn Lytle |
| Title: | Chief Executive Officer |
| Date: | October 5, 2015 |
| |
| |
| /s/ RICHARD SALUS |
| By: | Richard Salus |
| Title: | Chief Financial Officer |
| Date: | October 5, 2015 |