UNITED STATES SECURITIES AND EXCHANGE COMMISSION
Washington, D.C. 20549
FORM N-CSR
CERTIFIED SHAREHOLDER REPORT OF REGISTERED MANAGEMENT
INVESTMENT COMPANIES
| Investment Company Act file number: | | 811-02071 |
| | | |
| Exact name of registrant as specified in charter: | | Delaware Group® Income Funds |
| | | |
| Address of principal executive offices: | | 2005 Market Street |
| | Philadelphia, PA 19103 |
| | | |
| Name and address of agent for service: | | David F. Connor, Esq. |
| | 2005 Market Street |
| | Philadelphia, PA 19103 |
| | | |
| Registrant’s telephone number, including area code: | | (800) 523-1918 |
| | | |
| Date of fiscal year end: | | July 31 |
| | | |
| Date of reporting period: | | July 31, 2017 |
Item 1. Reports to Stockholders
| | |

| | 
Annual report |
Fixed income mutual funds
Delaware Corporate Bond Fund
Delaware Extended Duration Bond Fund
July 31, 2017
Carefully consider the Funds’ investment objectives, risk factors, charges, and expenses before investing. This and other information can be found in the Funds’ prospectus and their summary prospectuses, which may be obtained by visiting delawarefunds.com/literature or calling 800 523-1918. Investors should read the prospectus and the summary prospectus carefully before investing.
You can obtain shareholder reports and prospectuses online instead of in the mail.
Visit delawarefunds.com/edelivery.
Experience Delaware FundsSM by Macquarie
Macquarie Investment Management (MIM) is a global asset manager with offices throughout the United States, Europe, Asia, and Australia. We are active managers who prioritize autonomy and accountability at the investment team level in pursuit of opportunities that matter for our clients. Delaware Funds by Macquarie is one of the longest-standing mutual fund families, with more than 75 years in existence.
If you are interested in learning more about creating an investment plan, contact your financial advisor.
You can learn more about Delaware Funds by Macquarie or obtain a prospectus for Delaware Corporate Bond Fund and Delaware Extended Duration Bond Fund at delawarefunds.com/literature.
Manage your account online
| ● | | Check your account balance and transactions |
| ● | | View statements and tax forms |
| ● | | Make purchases and redemptions |
Visit delawarefunds.com/account-access.
Macquarie Investment Management (MIM) is the marketing name for the registered investment advisers including Macquarie Investment Management Business Trust (MIMBT) (formerly, Delaware Management Business Trust), Macquarie Funds Management Hong Kong Limited, Macquarie Investment Management Austria Kapitalanlage AG, Macquarie Investment Management Global Limited, Macquarie Bank International Limited, Macquarie Investment Management Europe Limited, Macquarie Investment Management Limited, and Macquarie Capital Investment Management, Inc.
The Funds are distributed by Delaware Distributors, L.P., an affiliate of Macquarie Investment Management Business Trust and Macquarie Group Limited. Macquarie Investment Management (MIM), a member of Macquarie Group, refers to the companies comprising the asset management division of Macquarie Group Limited and its subsidiaries and affiliates worldwide.
Other than Macquarie Bank Limited (MBL), none of the entities noted are authorized deposit-taking institutions for the purposes of the Banking Act 1959 (Commonwealth of Australia). The obligations of these entities do not represent deposits or other liabilities of MBL. MBL does not guarantee or otherwise provide assurance in respect of the obligations of these entities, unless noted otherwise. The Funds are governed by US laws and regulations.
Table of contents
Unless otherwise noted, views expressed herein are current as of July 31, 2017, and subject to change for events occurring after such date.
The Funds are not FDIC insured and are not guaranteed. It is possible to lose the principal amount invested.
Advisory services provided by Delaware Management Company, a series of MIMBT, a US registered investment advisor.
All third-party marks cited are the property of their respective owners.
© 2017 Macquarie Management Holdings, Inc. (formerly,
Delaware Management Holdings, Inc.)
| | |
| Portfolio management review | | |
| Delaware Corporate Bond Fund and Delaware Extended Duration Bond Fund | | August 8, 2017 |
| | | | | | | | |
Performance preview (for the year ended July 31, 2017) | | | | | | | | |
Delaware Corporate Bond Fund (Institutional Class shares) | | | 1-year return | | | | +3.09% | |
Delaware Corporate Bond Fund (Class A shares) | | | 1-year return | | | | +2.84% | |
Bloomberg Barclays US Corporate Investment Grade Index (benchmark) | | | 1-year return | | | | +1.55% | |
Past performance does not guarantee future results.
For complete, annualized performance for Delaware Corporate Bond Fund, please see the table on page 5.
Institutional Class shares are available without sales or asset-based distribution charges only to certain eligible accounts.
The performance of Class A shares excludes the applicable sales charge. Both Institutional Class shares and Class A shares reflect the reinvestment of all distributions.
Please see page 8 for a description of the index. Index performance returns do not reflect any management fees, transaction costs, or expenses. Indices are unmanaged and one cannot invest directly in an index.
| | | | | | | | |
Delaware Extended Duration Bond Fund (Institutional Class shares)* | | | 1-year return | | | | +1.36% | |
Delaware Extended Duration Bond Fund (Class A shares) | | | 1-year return | | | | +0.97% | |
Bloomberg Barclays Long US Corporate Index (benchmark) | | | 1-year return | | | | +1.29% | |
Past performance does not guarantee future results.
For complete, annualized performance for Delaware Extended Duration Bond Fund, please see the table on page 10.
Institutional Class shares are available without sales or asset-based distribution charges only to certain eligible accounts.
The performance of Class A shares excludes the applicable sales charge. Both Institutional Class shares and Class A shares reflect the reinvestment of all distributions.
Please see page 13 for a description of the index. Index performance returns do not reflect any management fees, transaction costs, or expenses. Indices are unmanaged and one cannot invest directly in an index.
*Total return for the report period presented in the table differs from the return in “Financial highlights.” The total return presented in the above table is calculated based on the net asset value (NAV) at which shareholder transactions were processed. The total return presented in “Financial highlights” is calculated in the same manner, but also takes into account certain adjustments that are necessary under US generally accepted accounting principles (US GAAP) required in the annual report.
During the Funds’ fiscal year ended July 31, 2017, the key factor driving the US corporate bond market was the strong technical demand for corporate credit. The global search for yield led investors to both the investment grade and high yield sectors of the market.
Surveying international markets, one can see why this is the case. In general, international market rates have been much lower than in the United States, and the supply has been limited. Also, overseas corporate bond markets are not as deep, and present fewer long-duration opportunities. The quantitative easing measures that foreign central banks embarked on over the past 12 months have depressed interest rates in those countries, making US rates and spreads that much more attractive.
Specifically, in the euro zone, the European Central Bank has purchased corporate and sovereign bonds, which has lowered overall
In the second half of the fiscal year,
we saw evidence of improving credit
fundamentals, which supported strong
market returns to that point. We believe
such fundamental performance
combined with a decline in high yield
default rates supplied justification for
corporate credit valuations.
| | |
| Portfolio management review | | |
| Delaware Corporate Bond Fund and Delaware Extended Duration Bond Fund | | |
supply. The Bank of Japan has manipulated the yield curve so that long-term rates stay low. And in the US, despite raising rates, the US Federal Reserve has communicated relatively dovish guidance about the pace of further hikes and the unwinding of its balance sheet.
In the second half of the Funds’ fiscal year, we also saw evidence of improving credit fundamentals, which supported strong market returns to that point. A decline in high yield default rates – back to their long-term averages – supplied justification for price levels. That said, valuations appeared to reflect continued expectations that under the Trump administration, business-friendly tax reforms would be achieved. Clearly those expectations began to diminish due to lack of legislative success in Congress. It’s also possible that some merger and acquisition (M&A) activity was put on hold as companies awaited more clarity on the tax front, as the number of large deals through July in 2017 declined from 2016 levels.
Fund performance
For the fiscal year ended July 31, 2017, Delaware Corporate Bond Fund outperformed its benchmark, the Bloomberg Barclays US Corporate Investment Grade Index. The Fund’s Institutional Class shares returned +3.09%. The Fund’s Class A shares returned +2.84% at net asset value and -1.80% at maximum offer price. These figures reflect all distributions reinvested. During the same period, the Bloomberg Barclays US Corporate Investment Grade Index returned +1.55%. For complete, annualized performance of Delaware Corporate Bond Fund, please see the table on page 5.
During the same period, Delaware Extended Duration Bond Fund Institutional Class shares outperformed its benchmark, returning +1.36% compared to the Bloomberg Barclays Long US Corporate Index return of +1.29%. However, the Fund’s Class A shares underperformed, returning
+0.97% at net asset value and -3.58% at maximum offer price. These figures reflect all distributions reinvested. For complete, annualized performance of Delaware Extended Duration Bond Fund, please see the table on page 10.
Delaware Corporate Bond Fund
During the fiscal year, the corporate bond market was fundamentally strong with tight spreads throughout the credit quality tiers. We saw little opportunity to add value through price appreciation. However, we identified securities with a yield advantage relative to the benchmark. We felt comfortable overweighting BBB-rated and high yield bonds in a relatively benign economic environment that presented few near-term risks through economic growth or central bank activities. The Fund maintained an approximate average weighting of 60% in BBB-rated bonds, compared to 48% in the Bloomberg Barclays US Corporate Investment Grade Index. This resulted in a yield advantage versus the benchmark, which at times reached 1 percentage point.
Security selection from the investment team, supported by thorough fundamental research, drove the majority of the outperformance over the fiscal year. In the banking sector, the Fund benefited from bonds in the subordinated parts of the capital structure of quality companies such as Credit Suisse Group, UBS, and Royal Bank of Scotland. The same strategy paid off in the utility sector, where investments in Emera and Exelon added value. Another source of excess return for the Fund resided in the specialty finance area, particularly in three or four companies involved in aviation and aircraft leasing.
The Fund also benefited from opportunities that arose from M&A activity in the technology sector. For example, Microsoft issued long bonds to finance its acquisition of LinkedIn. This was one of the Fund’s strongest-performing investments during the fiscal year. Similarly, with respect to Dell’s merger with EMC, our analysts’
research directed us to invest only in specific Dell International bonds that were brought to the market, and this security selection aided performance.
As part of our risk management strategy, we sought to avoid the problems in the retail sector as well as the slowing fundamentals associated with the automotive industry. This led us to underweight department stores, automobile manufacturers, and finance companies that offer subprime auto loans; this decision further benefited the Fund’s relative performance during the fiscal year.
In addition, a small out-of-index exposure to high yield securities was additive. It should be noted that, of the Fund’s total 11% exposure on average to high yield, 4% was in the form of hybrid securities of investment grade companies, as we discussed earlier. The Fund’s 3% average allocation to emerging market debt also contributed to relative performance.
Many of the Fund’s underperformers were in the pharmaceutical and healthcare sectors. On the political front, tough talk from then-leading presidential candidate Hillary Clinton indicated that pharmaceutical pricing and profits would come under government pressure. As a result, holdings such as Mylan, Shire, and Teva declined and were among the Fund’s weakest performers.
The Fund’s average 1% allocation to cash over the fiscal period cost the Fund roughly 0.01 percentage points of relative performance. The Fund was also slightly shorter in duration than the benchmark, which we estimate caused a de minimis drag on performance. In an attempt to manage the risk of increasing interest rates, we maintained an underweight allocation to the long end of the yield curve, which in fact outperformed during the period.
During the fiscal year, the Fund held three types of derivatives securities: a single-position credit default swap, a put option on the S&P 500® Index
in March to help protect the Fund’s unrealized gains in its allocation to high yield bonds, and Treasury futures to manage duration exposure. These were small positions, with a net cost to the Fund of 0.02 percentage points. The Fund held no derivatives positions at the conclusion of the fiscal year.
Delaware Extended Duration Bond Fund
The Fund is designed to provide investors with access to the long end of the US investment grade corporate market. The management of the Fund is strategically identical to that of Delaware Corporate Bond Fund; however, the average duration of securities in Delaware Extended Duration Bond Fund was close to 14 years on average over the fiscal year – almost twice the average 7.5-year duration of Delaware Corporate Bond Fund. Because specific companies choose not to issue securities with long maturities, the two Funds’ security selections often differ. For example, Credit Suisse Group, one of the strongest performers for Delaware Corporate Bond Fund, did not issue comparable securities that far out on the yield curve. In Delaware Extended Duration Bond Fund, we replaced that position with allocations to Bank of America, Goldman Sachs Group, and Morgan Stanley, which also generated excess return for the Fund.
In a similar vein, Delaware Extended Duration Bond Fund benefited from an average 1.2% allocation to high yield bonds, which delivered meaningful outperformance, returning 11% for the fiscal year.
Similar to Delaware Corporate Bond Fund, we were comfortable extending the Fund’s BBB-rated exposure to 59% on average over the fiscal year – roughly in line with Delaware Corporate Bond Fund’s allocation and 11 percentage points more than the benchmark’s on average. BBB-rated bonds were the strongest-performing quality bucket among investment grade
| | |
| Portfolio management review | | |
| Delaware Corporate Bond Fund and Delaware Extended Duration Bond Fund | | |
allocations during the fiscal year, and this allocation drove the Fund’s outperformance.
In addition to outperformance in the banking sector, the Fund performed well in the insurance industry, which was not represented in Delaware Corporate Bond Fund. For the Fund’s insurance exposure, we employed the strategy that worked well in the banking sector – using hybrid securities issued by Allstate, Nationwide Mutual Insurance, and XLIT.
Again, akin to Delaware Corporate Bond Fund, we increased exposure to the capital goods sector based on our perception of value on the long end of the credit curve. LafargeHolcim, a global cement company, added value due to an acquisition early in the Fund’s fiscal year that boosted performance. Valmont Industries, a manufacturer of steel structures for infrastructure, got a significant boost from investor optimism over the Trump infrastructure plan. Also, we were able to capitalize on the first new securities issued in quite a while by Siemens, as these securities were priced at a significant discount to peers.
Security selection in the technology and utility sectors was similarly strong. Outperformers included the same names that led the way in Delaware Corporate Bond Fund: Microsoft and Dell International in technology, and Emera and Exelon in utilities. Similarly, the Fund’s average 1% allocation to emerging market bonds mimicked the security selection of Delaware Corporate Bond Fund and added excess return to the Fund.
Our decision to underweight higher-beta (higher-risk) credit, chiefly in the metals-and-mining and energy industries, caused us to miss some significant opportunities that resulted from the notable rebound in commodity prices. Examples
of these, which were not held by the Fund, included gold-oriented issuers; chemical companies such as Dow Chemical; South American iron-ore producer Vale; and another mining company, Southern Copper. In the energy sector, the Fund did not have exposure to names such as Hess, Williams Partners, and Valero. Securities in this part of the capital structure and this maturity bucket were producing returns in the 20% range. The Fund’s lack of exposure here clearly hurt relative performance.
Our security selection in the healthcare sector was another strategy that did not work well for the Fund. As with Delaware Corporate Bond Fund, investments in Mylan, Teva, and Allergan were the main detractors.
In addition, the timing of holdings in the transportation sector caused the Fund to lag benchmark returns over the fiscal year. In particular, the Fund was underweight railroads in the first half of 2017 when credit spreads in the industry tightened with an improvement in rail volumes and subsequently operating results.
Lastly, cash held by the Fund was a drag on performance relative to the benchmark, as was the Fund’s slightly shorter duration than the benchmark over the fiscal year, by no more than a quarter of a year on average.
The Fund had minor derivatives exposure. We used 10-year Treasury futures to help control the duration and cash management on the Fund. We also employed a 10-year Treasury call option to help protect gains leading up to the presidential election. These were small positions that had a negligible effect on Fund performance. As of July 31, 2017, the Fund held no derivatives positions.
| | |
| Performance summaries | | |
| Delaware Corporate Bond Fund | | July 31, 2017 |
The performance quoted represents past performance and does not guarantee future results. Investment return and principal value of an investment will fluctuate so that shares, when redeemed, may be worth more or less than their original cost. Current performance may be lower or higher than the performance quoted. Performance data current to the most recent month end may be obtained by calling 800 523-1918 or visiting delawarefunds.com/performance.
| | | | | | | | |
| Fund and benchmark performance1,2 | | Average annual total returns through July 31, 2017 |
| | | | |
| | | 1 year | | 5 years | | 10 years | | Lifetime |
Class A (Est. Sept. 15, 1998) | | | | | | | | |
Excluding sales charge | | +2.84% | | +3.83% | | +6.75% | | +6.61% |
Including sales charge | | -1.80% | | +2.90% | | +6.26% | | +6.35% |
Class C (Est. Sept. 15, 1998) | | | | | | | | |
Excluding sales charge | | +2.07% | | +3.06% | | +5.95% | | +5.82% |
Including sales charge | | +1.08% | | +3.06% | | +5.95% | | +5.82% |
Class R (Est. June 2, 2003) | | | | | | | | |
Excluding sales charge | | +2.58% | | +3.54% | | +6.48% | | +5.79% |
Including sales charge | | +2.58% | | +3.54% | | +6.48% | | +5.79% |
Institutional Class (Est. Sept. 15, 1998) | | | | | | | | |
Excluding sales charge | | +3.09% | | +4.09% | | +7.01% | | +6.88% |
Including sales charge | | +3.09% | | +4.09% | | +7.01% | | +6.88% |
Bloomberg Barclays US Corporate Investment Grade Index | | +1.55% | | +3.53% | | +5.84% | | +5.65%* |
*The benchmark lifetime return is for Institutional Class share comparison only and is calculated using the last business day in the month of the Fund’s Institutional Class inception date.
1Returns reflect the reinvestment of all distributions and are presented both with and without the applicable sales charges described below. Returns do not reflect the deduction of taxes the shareholder would pay on Fund distributions or redemptions of Fund shares.
Expense limitations were in effect for certain classes during some or all of the periods shown in the “Fund and benchmark performance” table. Expenses for each class are listed on the “Fund expense ratios” table on page 7. Performance would have been lower had expense limitations not been in effect.
Institutional Class shares are available without sales or asset-based distribution charges only to certain eligible accounts.
Class A shares are sold with a maximum front-end sales charge of 4.50%, and have an annual distribution and service fee of 0.25% of average daily net assets. Performance for Class A shares, excluding sales charges, assumes that no front-end sales charge applied.
Class C shares are sold with a contingent deferred sales charge of 1.00% if redeemed during the first 12 months. They are also subject to an annual distribution and service fee of 1.00% of average daily net assets. Performance for Class C shares, excluding sales charges, assumes either that contingent deferred sales charges did not apply or that the investment was not redeemed.
Class R shares are available only for certain retirement plan products. They are sold without a
| | |
| Performance summaries | | |
| Delaware Corporate Bond Fund | | |
sales charge and have an annual distribution and service fee of 0.50% of average daily net assets.
Fixed income securities and bond funds can lose value, and investors can lose principal, as interest rates rise. They also may be affected by economic conditions that hinder an issuer’s ability to make interest and principal payments on its debt.
The Fund may also be subject to prepayment risk, the risk that the principal of a bond that is held by a portfolio will be prepaid prior to maturity, at the time when interest rates are lower than what the bond was paying. A portfolio may then have to reinvest that money at a lower interest rate.
International investments entail risks not ordinarily associated with US investments including fluctuation in currency values, differences in accounting principles, or economic or political instability in other nations.
Investing in emerging markets can be riskier than investing in established foreign markets due to increased volatility and lower trading volume.
High yielding, non-investment-grade bonds (junk bonds) involve higher risk than investment grade bonds.
If and when the Fund invests in forward foreign currency contracts or uses other investments to hedge against currency risks, the Fund will be subject to special risks, including counterparty risk.
The Fund may experience portfolio turnover in excess of 100%, which could result in higher trading costs and tax liability.
The Fund may invest in derivatives, which may involve additional expenses and are subject to risk, including the risk that an underlying security or securities index moves in the opposite direction from what the portfolio manager anticipated. A derivatives transaction depends upon the counterparties’ ability to fulfill their contractual obligations.
This document may mention bond ratings published by nationally recognized statistical rating organizations (NRSROs) Standard & Poor’s, Moody’s Investors Service, and Fitch, Inc. For securities rated by an NRSRO other than S&P, the rating is converted to the equivalent S&P credit rating. Bonds rated AAA are rated as having the highest quality and are generally considered to have the lowest degree of investment risk. Bonds rated AA are considered to be of high quality, but with a slightly higher degree of risk than bonds rated AAA. Bonds rated A are considered to have many favorable investment qualities, though they are somewhat more susceptible to adverse economic conditions. Bonds rated BBB are believed to be of medium-grade quality and generally riskier over the long term. Bonds rated BB, B, and CCC are regarded as having significant speculative characteristics, with BB indicating the least degree of speculation of the three.
2 The Fund’s expense ratios, as described in the most recent prospectus, are disclosed in the following “Fund expense ratios” table. Delaware Management Company has agreed to reimburse certain expenses and/or waive certain fees in order to prevent total annual fund operating expenses (excluding any 12b-1 fees, acquired fund fees and expenses, taxes, interest, short sale and dividend interest expenses, brokerage fees, certain insurance costs, and nonroutine expenses or costs, including, but not limited to, those relating to reorganizations, litigation, conducting shareholder meetings, and liquidations (collectively, nonroutine expenses)) from exceeding 0.69% of the Fund’s average daily net assets during the period from Aug. 1, 2016 through July 31, 2017.* Please see the most recent prospectus and any applicable supplement(s) for additional information on these fee waivers and/or reimbursements.
| | | | | | | | |
| | | | |
Fund expense ratios | | Class A | | Class C | | Class R | | Institutional Class |
Total annual operating expenses (without fee waivers) | | 0.96% | | 1.71% | | 1.21% | | 0.71% |
Net expenses (including fee waivers, if any) | | 0.94% | | 1.69% | | 1.19% | | 0.69% |
Type of waiver | | Contractual | | Contractual | | Contractual | | Contractual |
*The aggregate contractual waiver period covering this report is from Nov. 27, 2015 through Nov. 28, 2017.
| | |
| Performance summaries | | |
| Delaware Corporate Bond Fund | | |
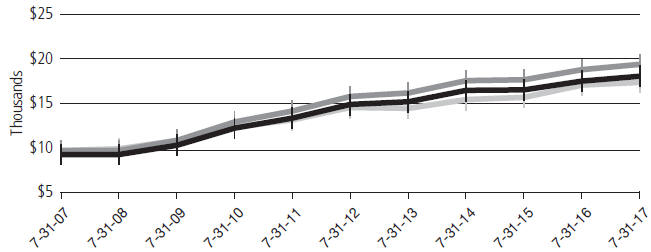
Performance of a $10,000 investment1
Average annual total returns from July 31, 2007, through July 31, 2017
| | | | | | | | | | | | | | |
| For period beginning July 31, 2007, through July 31, 2017 | | Starting value | | | Ending value | |

| | Delaware Corporate Bond Fund — Institutional Class shares | | | $10,000 | | | | $19,695 | |

| | Delaware Corporate Bond Fund — Class A shares | | | $9,550 | | | | $18,346 | |

| | Bloomberg Barclays US Corporate Investment Grade Index | | | $10,000 | | | | $17,639 | |
1 The “Performance of a $10,000 investment” graph assumes $10,000 invested in Institutional Class and Class A shares of the Fund on July 31, 2007, and includes the effect of a 4.50% front-end sales charge (for Class A shares) and the reinvestment of all distributions. The graph does not reflect the deduction of taxes the shareholders would pay on Fund distributions or redemptions of Fund shares. Expense limitations were in effect for some or all of the periods shown. Performance would have been lower had expense limitations not been in effect. Expenses are listed in the “Fund expense ratios” table on page 7. Please note additional details on pages 5 through 9.
The graph also assumes $10,000 invested in the Bloomberg Barclays US Corporate Investment Grade Index as of July 31, 2007. The Bloomberg Barclays US Corporate Investment Grade Index is composed of US dollar-denominated, investment grade, SEC-registered corporate bonds issued by industrial, utility, and financial companies. All bonds have at least one year to maturity.
The S&P 500 Index, mentioned on page 3, measures the performance of 500 mostly large-cap stocks weighted by market value, and is often used to represent performance of the US stock market.
Index performance returns do not reflect any management fees, transaction costs, or expenses. Indices are unmanaged and one cannot invest directly in an index. Past performance is not a guarantee of future results.
Performance of other Fund classes will vary due to different charges and expenses.
| | | | | | |
| | | | |
| | | Nasdaq symbols | | CUSIPs | | |
Class A | | DGCAX | | 245908785 | | |
Class C | | DGCCX | | 245908769 | | |
Class R | | DGCRX | | 245908744 | | |
Institutional Class | | DGCIX | | 245908751 | | |
| | |
| Performance summaries | | |
| Delaware Extended Duration Bond Fund | | July 31, 2017 |
The performance quoted represents past performance and does not guarantee future results. Investment return and principal value of an investment will fluctuate so that shares, when redeemed, may be worth more or less than their original cost. Current performance may be lower or higher than the performance quoted. Performance data current to the most recent month end may be obtained by calling 800 523-1918 or visiting delawarefunds.com/performance.
| | | | | | | | |
| Fund and benchmark performance1,2 | | Average annual total returns through July 31, 2017 |
| | | | |
| | | 1 year | | 5 years | | 10 years | | Lifetime |
Class A (Est. Sept. 15, 1998) | | | | | | | | |
Excluding sales charge | | +0.97% | | +4.72% | | +9.14% | | +8.11% |
Including sales charge | | -3.58% | | +3.75% | | +8.63% | | +7.84% |
Class C (Est. Sept. 15, 1998) | | | | | | | | |
Excluding sales charge | | +0.21% | | +3.91% | | +8.31% | | +7.31% |
Including sales charge | | -0.77% | | +3.91% | | +8.31% | | +7.31% |
Class R (Est. Oct. 3, 2005) | | | | | | | | |
Excluding sales charge | | +0.71% | | +4.46% | | +8.86% | | +7.79% |
Including sales charge | | +0.71% | | +4.46% | | +8.86% | | +7.79% |
Institutional Class (Est. Sept. 15, 1998) | | | | | | | | |
Excluding sales charge | | +1.36%* | | +4.98% | | +9.42% | | +8.38% |
Including sales charge | | +1.36%* | | +4.98% | | +9.42% | | +8.38% |
Class R6 (Est. May 2, 2016) | | | | | | | | |
Excluding sales charge | | +1.29% | | n/a | | n/a | | +6.83% |
Including sales charge | | +1.29% | | n/a | | n/a | | +6.83% |
Bloomberg Barclays Long US Corporate Index | | +1.29% | | +4.57% | | +7.78% | | +6.84%** |
*Total return for the report period presented in the table differs from the return in “Financial highlights.” The total return presented in the above table is calculated based on the net asset value (NAV) at which shareholder transactions were processed. The total return presented in “Financial highlights” is calculated in the same manner, but also takes into account certain adjustments that are necessary under US generally accepted accounting principles (US GAAP) required in the annual report.
**The benchmark lifetime return is for Institutional Class share comparison only and is calculated using the last business day in the month of the Fund’s Institutional Class inception date.
1Returns reflect the reinvestment of all distributions and are presented both with and without the applicable sales charges described below. Returns do not reflect the deduction of taxes the shareholder would pay on Fund distributions or redemptions of Fund shares.
Expense limitations were in effect for certain classes during some or all of the periods shown in the “Fund and benchmark performance” table. Expenses for each class are listed on the “Fund
expense ratios” table on page 12. Performance
would have been lower had expense limitations not been in effect.
Institutional Class shares are available without sales or asset-based distribution charges only to certain eligible accounts.
Class A shares are sold with a maximum front-end sales charge of 4.50%, and have an annual distribution and service fee of 0.25% of average daily net assets. Performance for Class A shares,
excluding sales charges, assumes that no front-end sales charge applied.
Class C shares are sold with a contingent deferred sales charge of 1.00% if redeemed during the first 12 months. They are also subject to an annual distribution and service fee of 1.00% of average daily net assets. Performance for Class C shares, excluding sales charges, assumes either that contingent deferred sales charges did not apply or that the investment was not redeemed.
Class R shares are available only for certain retirement plan products. They are sold without a sales charge and have an annual distribution and service fee of 0.50% of average daily net assets.
Class R6 shares are available without sales or asset-based distribution charges only to certain eligible accounts.
Fixed income securities and bond funds can lose value, and investors can lose principal, as interest rates rise. They also may be affected by economic conditions that hinder an issuer’s ability to make interest and principal payments on its debt.
The Fund may also be subject to prepayment risk, the risk that the principal of a bond that is held by a portfolio will be prepaid prior to maturity, at the time when interest rates are lower than what the bond was paying. A portfolio may then have to reinvest that money at a lower interest rate.
International investments entail risks not ordinarily associated with US investments including fluctuation in currency values, differences in accounting principles, or economic or political instability in other nations.
Investing in emerging markets can be riskier than investing in established foreign markets due to increased volatility and lower trading volume.
High yielding, non-investment-grade bonds (junk bonds) involve higher risk than investment grade bonds.
If and when the Fund invests in forward foreign currency contracts or uses other investments to hedge against currency risks, the Fund will be subject to special risks, including counterparty risk.
The Fund may experience portfolio turnover in excess of 100%, which could result in higher trading costs and tax liability.
The Fund may invest in derivatives, which may involve additional expenses and are subject to risk, including the risk that an underlying security or securities index moves in the opposite direction from what the portfolio manager anticipated. A derivatives transaction depends upon the counterparties’ ability to fulfill their contractual obligations.
This document may mention bond ratings published by nationally recognized statistical rating organizations (NRSROs) Standard & Poor’s, Moody’s Investors Service, and Fitch, Inc. For securities rated by an NRSRO other than S&P, the rating is converted to the equivalent S&P credit rating. Bonds rated AAA are rated as having the highest quality and are generally considered to have the lowest degree of investment risk. Bonds rated AA are considered to be of high quality, but with a slightly higher degree of risk than bonds rated AAA. Bonds rated A are considered to have many favorable investment qualities, though they are somewhat more susceptible to adverse economic conditions. Bonds rated BBB are believed to be of medium-grade quality and generally riskier over the long term. Bonds rated BB, B, and CCC are regarded as having significant speculative characteristics, with BB indicating the least degree of speculation of the three.
| | |
| Performance summaries | | |
| Delaware Extended Duration Bond Fund | | |
2 The Fund’s expense ratios, as described in the most recent prospectus, are disclosed in the following “Fund expense ratios” table. Delaware Management Company has agreed to reimburse certain expenses and/or waive certain fees in order to prevent total annual fund operating expenses (excluding any 12b-1 fees, acquired fund fees and expenses, taxes, interest, short sale and dividend interest expenses, brokerage fees, certain insurance costs, and nonroutine expenses or costs, including, but not limited to, those relating to reorganizations, litigation, conducting shareholder meetings, and liquidations (collectively, nonroutine expenses)) from exceeding 0.71% of the Fund’s average daily net assets for all share classes other than Class R6 from Aug. 1, 2016 through July 31, 2017,* and 0.63% of the Fund’s Class R6 shares’ average daily net assets from Aug. 1, 2016 through July 31, 2017.* Please see the most recent prospectus and any applicable supplement(s) for additional information on these fee waivers and/ or reimbursements.
| | | | | | | | | | | | | | | | | | | | |
Fund expense ratios | | Class A | | | Class C | | | Class R | | | Institutional Class | | | Class R6 | |
Total annual operating expenses (without fee waivers) | | | 1.00% | | | | 1.75% | | | | 1.25% | | | | 0.75% | | | | 0.67% | |
Net expenses (including fee waivers, if any) | | | 0.96% | | | | 1.71% | | | | 1.21% | | | | 0.71% | | | | 0.63% | |
Type of waiver | | | Contractual | | | | Contractual | | | | Contractual | | | | Contractual | | | | Contractual | |
*The aggregate contractual waiver period covering this report is from Nov. 27, 2015 through Nov. 28, 2017. The aggregate contractual waiver period for Class R6 shares is from May 2, 2016 through Nov. 28, 2017.
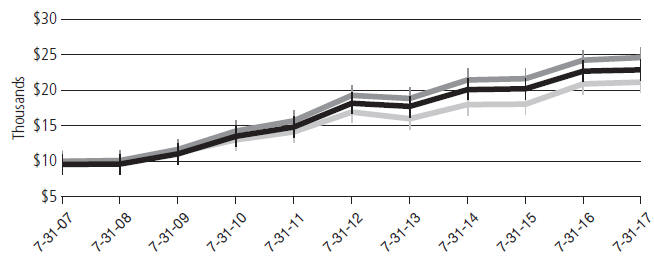
Performance of a $10,000 investment1
Average annual total returns from July 31, 2007, through July 31, 2017
| | | | | | | | | | | | | | |
| For period beginning July 31, 2007, through July 31, 2017 | | Starting value | | | Ending value | |

| | Delaware Extended Duration Bond Fund — Institutional Class shares | | | $10,000 | | | | $24,604 | |

| | Delaware Extended Duration Bond Fund — Class A shares | | | $9,550 | | | | $22,888 | |

| | Bloomberg Barclays Long US Corporate Index | | | $10,000 | | | | $21,155 | |
1The “Performance of a $10,000 investment” graph assumes $10,000 invested in Institutional Class and Class A shares of the Fund on July 31, 2007, and includes the effect of a 4.50% front-end sales charge (for Class A shares) and the reinvestment of all distributions. The graph does not reflect the deduction of taxes the shareholders would pay on Fund distributions or redemptions of Fund shares. Expense limitations were in effect for some or all of the periods shown. Performance would have been lower had expense limitations not been in effect. Expenses are listed in the “Fund expense ratios” table on page 12. Please note additional details on pages 10 through 14.
The graph also assumes $10,000 invested in the Bloomberg Barclays Long US Corporate Index as of July 31, 2007. The Bloomberg Barclays Long US Corporate Index is composed of US dollar-denominated, investment grade, SEC-registered corporate bonds issued by industrial, utility, and financial companies. All bonds in the index have at least 10 years to maturity.
Index performance returns do not reflect any management fees, transaction costs, or expenses. Indices are unmanaged and one cannot invest directly in an index. Past performance is not a guarantee of future results.
Performance of other Fund classes will vary due to different charges and expenses.
| | |
| Performance summaries | | |
| Delaware Extended Duration Bond Fund | | |
| | | | | | |
| | | | |
| | | Nasdaq symbols | | CUSIPs | | |
Class A | | DEEAX | | 245908835 | | |
Class C | | DEECX | | 245908819 | | |
Class R | | DEERX | | 245908728 | | |
Institutional Class | | DEEIX | | 245908793 | | |
Class R6 | | DEZRX | | 245908629 | | |
| | |
| Disclosure of Fund expenses | | |
| For the six-month period from February 1, 2017 to July 31, 2017 (Unaudited) | | |
As a shareholder of a Fund, you incur two types of costs: (1) transaction costs, including sales charges (loads) on purchase payments, reinvested dividends, or other distributions; redemption fees; and exchange fees; and (2) ongoing costs, including management fees; distribution and/or service (12b-1) fees; and other Fund expenses. These following examples are intended to help you understand your ongoing costs (in dollars) of investing in a Fund and to compare these costs with the ongoing costs of investing in other mutual funds.
The examples are based on an investment of $1,000 invested at the beginning of the period and held for the entire six-month period from Feb. 1, 2017 to July 31, 2017.
Actual expenses
The first section of the tables shown, “Actual Fund return,” provides information about actual account values and actual expenses. You may use the information in this section of the table, together with the amount you invested, to estimate the expenses that you paid over the period. Simply divide your account value by $1,000 (for example, an $8,600 account value divided by $1,000 = 8.6), then multiply the result by the number in the first section under the heading entitled “Expenses Paid During Period” to estimate the expenses you paid on your account during this period.
Hypothetical example for comparison purposes
The second section of the tables shown, “Hypothetical 5% return,” provides information about hypothetical account values and hypothetical expenses based on the Funds’ actual expense ratios and an assumed rate of return of 5% per year before expenses, which is not the Funds’ actual return. The hypothetical account values and expenses may not be used to estimate the actual ending account balance or expenses you paid for the period. You may use this information to compare the ongoing costs of investing in each Fund and other funds. To do so, compare this 5% hypothetical example with the 5% hypothetical examples that appear in the shareholder reports of the other funds.
Please note that the expenses shown in the tables are meant to highlight your ongoing costs only and do not reflect any transactional costs, such as sales charges (loads), redemption fees, or exchange fees. Therefore, the second section of each table is useful in comparing ongoing costs only, and will not help you determine the relative total costs of owning different funds. In addition, if these transactional costs were included, your costs would have been higher. The Funds’ expenses shown in the tables reflect fee waivers in effect. The expenses shown in each table assume reinvestment of all dividends and distributions.
| | |
| Disclosure of Fund expenses | | |
| For the six-month period from February 1, 2017 to July 31, 2017 (Unaudited) | | |
Delaware Corporate Bond Fund
Expense analysis of an investment of $1,000
| | | | | | | | | | | | | | | | |
| | | Beginning | | | Ending | | | | | | Expenses | |
| | | | |
| | | Account Value | | | Account Value | | | Annualized | | | Paid During Period | |
| | | | |
| | | 2/1/17 | | | 7/31/17 | | | Expense Ratio | | | 2/1/17 to 7/31/17* | |
| | | | |
Actual Fund return† | | | | | | | | | | | | | | | | |
Class A | | | $1,000.00 | | | | $1,051.50 | | | | 0.94% | | | | $4.78 | |
Class C | | | 1,000.00 | | | | 1,047.60 | | | | 1.69% | | | | 8.58 | |
Class R | | | 1,000.00 | | | | 1,048.30 | | | | 1.19% | | | | 6.04 | |
Institutional Class | | | 1,000.00 | | | | 1,052.80 | | | | 0.69% | | | | 3.51 | |
| | | | |
Hypothetical 5% return (5% return before expenses) | | | | | | | | | | | | | | | | |
Class A | | | $1,000.00 | | | | $1,020.13 | | | | 0.94% | | | | $4.71 | |
Class C | | | 1,000.00 | | | | 1,016.41 | | | | 1.69% | | | | 8.45 | |
Class R | | | 1,000.00 | | | | 1,018.89 | | | | 1.19% | | | | 5.96 | |
Institutional Class | | | 1,000.00 | | | | 1,021.37 | | | | 0.69% | | | | 3.46 | |
Delaware Extended Duration Bond Fund
Expense analysis of an investment of $1,000
| | | | | | | | | | | | | | | | |
| | | Beginning | | | Ending | | | | | | Expenses | |
| | | | |
| | | Account Value | | | Account Value | | | Annualized | | | Paid During Period | |
| | | | |
| | | 2/1/17 | | | 7/31/17 | | | Expense Ratio | | | 2/1/17 to 7/31/17* | |
| | | | |
Actual Fund return† | | | | | | | | | | | | | | | | |
Class A | | | $1,000.00 | | | | $1,072.60 | | | | 0.96% | | | | $4.93 | |
Class C | | | 1,000.00 | | | | 1,068.80 | | | | 1.71% | | | | 8.77 | |
Class R | | | 1,000.00 | | | | 1,071.20 | | | | 1.21% | | | | 6.21 | |
Institutional Class | | | 1,000.00 | | | | 1,074.10 | | | | 0.71% | | | | 3.65 | |
Class R6 | | | 1,000.00 | | | | 1,074.50 | | | | 0.63% | | | | 3.24 | |
|
Hypothetical 5% return (5% return before expenses) | |
Class A | | | $1,000.00 | | | | $1,020.03 | | | | 0.96% | | | | $4.81 | |
Class C | | | 1,000.00 | | | | 1,016.31 | | | | 1.71% | | | | 8.55 | |
Class R | | | 1,000.00 | | | | 1,018.79 | | | | 1.21% | | | | 6.06 | |
Institutional Class | | | 1,000.00 | | | | 1,021.27 | | | | 0.71% | | | | 3.56 | |
Class R6 | | | 1,000.00 | | | | 1,021.67 | | | | 0.63% | | | | 3.16 | |
| * | “Expenses Paid During Period” are equal to the relevant Fund’s annualized expense ratio, multiplied by the average account value over the period, multiplied by 181/365 (to reflect the one-half year period). |
| † | Because actual returns reflect only the most recent six-month period, the returns shown may differ significantly from fiscal year returns. |
| | |
| Security type / sector allocations | | |
| Delaware Corporate Bond Fund | | As of July 31, 2017 (Unaudited) |
Sector designations may be different than the sector designations presented in other Fund materials. The sector designations may represent the investment manager’s internal sector classifications, which may result in the sector designations for one fund being different than another fund’s sector designations.
| | | | |
Security type / sector | | | Percentage of net assets | |
Convertible Bonds | | | 0.63% | |
Corporate Bonds | | | 93.55% | |
Banking | | | 24.13% | |
Basic Industry | | | 5.24% | |
Brokerage | | | 1.82% | |
Capital Goods | | | 3.86% | |
Communications | | | 10.82% | |
Consumer Cyclical | | | 4.25% | |
Consumer Non-Cyclical | | | 6.33% | |
Electric | | | 10.47% | |
Energy | | | 11.07% | |
Finance Companies | | | 3.28% | |
Insurance | | | 2.64% | |
Natural Gas | | | 0.24% | |
Real Estate Investment Trusts | | | 3.43% | |
Technology | | | 3.10% | |
Transportation | | | 2.87% | |
Municipal Bonds | | | 0.95% | |
Loan Agreements | | | 0.36% | |
Convertible Preferred Stock | | | 0.24% | |
Preferred Stock | | | 1.57% | |
Short-Term Investments | | | 3.55% | |
Total Value of Securities | | | 100.85% | |
Liabilities Net of Receivables and Other Assets | | | (0.85%) | |
Total Net Assets | | | 100.00% | |
17
Security type / sector allocations
| | |
| Delaware Extended Duration Bond Fund | | As of July 31, 2017 (Unaudited) |
Sector designations may be different than the sector designations presented in other Fund materials. The sector designations may represent the investment manager’s internal sector classifications, which may result in the sector designations for one fund being different than another fund’s sector designations.
| | | | |
Security type / sector | | | Percentage of net assets | |
Convertible Bond | | | 0.12% | |
Corporate Bonds | | | 90.20% | |
Banking | | | 14.75% | |
Basic Industry | | | 3.24% | |
Brokerage | | | 2.06% | |
Capital Goods | | | 6.94% | |
Communications. | | | 5.63% | |
Consumer Cyclical | | | 3.51% | |
Consumer Non-Cyclical | | | 13.89% | |
Electric | | | 13.14% | |
Energy | | | 11.93% | |
Finance Companies | | | 0.97% | |
Insurance | | | 8.15% | |
Natural Gas | | | 1.30% | |
Technology | | | 3.25% | |
Transportation | | | 1.44% | |
Municipal Bonds | | | 2.94% | |
US Treasury Obligations | | | 1.61% | |
Convertible Preferred Stock | | | 0.26% | |
Preferred Stock | | | 1.67% | |
Short-Term Investments | | | 2.60% | |
Total Value of Securities | | | 99.40% | |
Receivables and Other Assets Net of Liabilities | | | 0.60% | |
Total Net Assets | | | 100.00% | |
18
| | |
| Schedules of investments | | |
| Delaware Corporate Bond Fund | | July 31, 2017 |
| | | | | | | | |
| | | Principal amount° | | | Value (US $) | |
| |
Convertible Bonds – 0.63% | | | | | | | | |
| |
Clearwire Communications 144A 8.25% exercise price $7.08, maturity date 12/1/40 # | | | 5,502,000 | | | $ | 5,646,427 | |
General Cable 4.50% exercise price $31.01, maturity date 11/15/29 f | | | 1,427,000 | | | | 1,262,895 | |
| | | | | | | | |
Total Convertible Bonds (cost $6,724,838) | | | | 6,909,322 | |
| | | | | | | | |
|
| |
Corporate Bonds – 93.55% | | | | | |
| |
Banking – 24.13% | | | | | | | | |
Ally Financial 8.00% 11/1/31 | | | 1,840,000 | | | | 2,293,100 | |
Banco Santander 4.25% 4/11/27 | | | 4,400,000 | | | | 4,616,132 | |
Bank of America | | | | | | | | |
3.593% 7/21/28 ● | | | 4,250,000 | | | | 4,271,037 | |
4.183% 11/25/27 | | | 5,845,000 | | | | 6,049,411 | |
4.443% 1/20/48 ● | | | 6,100,000 | | | | 6,512,055 | |
Bank of New York Mellon | | | | | | | | |
2.661% 5/16/23 ● | | | 1,580,000 | | | | 1,593,234 | |
4.625%y● | | | 5,430,000 | | | | 5,533,170 | |
Barclays | | | | | | | | |
4.337% 1/10/28 | | | 2,285,000 | | | | 2,386,125 | |
4.836% 5/9/28 | | | 3,280,000 | | | | 3,412,538 | |
4.95% 1/10/47 | | | 1,710,000 | | | | 1,883,273 | |
8.25%y● | | | 2,750,000 | | | | 2,929,025 | |
Citizens Bank 2.65% 5/26/22 | | | 5,385,000 | | | | 5,398,403 | |
Compass Bank 3.875% 4/10/25 | | | 7,970,000 | | | | 7,998,971 | |
Credit Suisse Group 144A 4.282% 1/9/28 # | | | 2,145,000 | | | | 2,253,402 | |
Credit Suisse Group Funding Guernsey 4.55% 4/17/26 | | | 11,330,000 | | | | 12,188,769 | |
Fifth Third Bancorp 2.60% 6/15/22 | | | 2,700,000 | | | | 2,701,769 | |
Fifth Third Bank 3.85% 3/15/26 | | | 7,115,000 | | | | 7,380,831 | |
Goldman Sachs Group | | | | | | | | |
3.691% 6/5/28 ● | | | 10,305,000 | | | | 10,381,607 | |
5.15% 5/22/45 | | | 5,130,000 | | | | 5,818,641 | |
6.00% 6/15/20 | | | 835,000 | | | | 922,713 | |
JPMorgan Chase & Co. | | | | | | | | |
3.54% 5/1/28 ● | | | 3,445,000 | | | | 3,479,708 | |
3.882% 7/24/38 ● | | | 5,195,000 | | | | 5,205,826 | |
4.032% 7/24/48 ● | | | 1,730,000 | | | | 1,744,125 | |
4.25% 10/1/27 | | | 3,905,000 | | | | 4,134,196 | |
6.75%y● | | | 4,000,000 | | | | 4,587,000 | |
KeyBank | | | | | | | | |
2.40% 6/9/22 | | | 7,070,000 | | | | 7,065,800 | |
3.40% 5/20/26 | | | 10,610,000 | | | | 10,542,361 | |
Morgan Stanley | | | | | | | | |
2.373% 5/8/24 ● | | | 5,840,000 | | | | 5,882,784 | |
| | |
| Schedules of investments | | |
| Delaware Corporate Bond Fund | | |
| | | | | | | | |
| | | Principal amount° | | | Value (US $) | |
Corporate Bonds (continued) | | | | | | | | |
| |
Banking (continued) | | | | | | | | |
Morgan Stanley | | | | | | | | |
3.591% 7/22/28 ● | | | 1,305,000 | | | $ | 1,310,391 | |
3.95% 4/23/27 | | | 3,565,000 | | | | 3,622,753 | |
4.375% 1/22/47 | | | 7,725,000 | | | | 8,121,432 | |
5.00% 11/24/25 | | | 485,000 | | | | 532,095 | |
PNC Bank 2.45% 7/28/22 | | | 11,595,000 | | | | 11,634,864 | |
PNC Financial Services Group 5.00%y● | | | 4,560,000 | | | | 4,731,000 | |
Popular 7.00% 7/1/19 | | | 4,475,000 | | | | 4,743,500 | |
Royal Bank of Scotland Group | | | | | | | | |
3.875% 9/12/23 | | | 7,560,000 | | | | 7,764,831 | |
8.625%y● | | | 2,470,000 | | | | 2,733,994 | |
Santander UK 144A 5.00% 11/7/23 # | | | 7,595,000 | | | | 8,237,666 | |
Santander UK Group Holdings 3.571% 1/10/23 | | | 2,485,000 | | | | 2,548,159 | |
State Street 2.653% 5/15/23 ● | | | 5,500,000 | | | | 5,549,659 | |
SunTrust Bank 2.45% 8/1/22 | | | 2,765,000 | | | | 2,763,651 | |
SunTrust Banks 5.05%y● | | | 7,040,000 | | | | 7,136,800 | |
SVB Financial Group 3.50% 1/29/25 | | | 655,000 | | | | 654,386 | |
UBS 7.625% 8/17/22 | | | 7,555,000 | | | | 9,009,338 | |
UBS Group Funding Switzerland 144A 4.253% 3/23/28 # | | | 3,680,000 | | | | 3,917,290 | |
US Bancorp 3.15% 4/27/27 | | | 9,290,000 | | | | 9,370,953 | |
USB Capital IX 3.50%y● | | | 3,207,000 | | | | 2,870,265 | |
Wells Fargo & Co. | | | | | | | | |
2.541% 10/31/23 ● | | | 5,715,000 | | | | 5,835,529 | |
2.625% 7/22/22 | | | 2,180,000 | | | | 2,185,633 | |
3.584% 5/22/28 ● | | | 4,315,000 | | | | 4,390,538 | |
4.75% 12/7/46 | | | 2,045,000 | | | | 2,220,371 | |
Wells Fargo Capital X 5.95% 12/15/36 | | | 5,645,000 | | | | 6,415,543 | |
Westpac Banking 4.322% 11/23/31 ● | | | 2,615,000 | | | | 2,701,551 | |
Zions Bancorporation 4.50% 6/13/23 | | | 2,860,000 | | | | 3,064,936 | |
| | | | | | | | |
| | | | | | | 263,233,134 | |
| | | | | | | | |
Basic Industry – 5.24% | | | | | | | | |
Barrick North America Finance 5.75% 5/1/43 | | | 4,220,000 | | | | 5,181,434 | |
BHP Billiton Finance USA 144A 6.25% 10/19/75 #● | | | 9,455,000 | | | | 10,343,770 | |
Dow Chemical 8.55% 5/15/19 | | | 6,930,000 | | | | 7,743,554 | |
Equate Petrochemical 144A 3.00% 3/3/22 # | | | 2,840,000 | | | | 2,836,160 | |
Georgia-Pacific 8.00% 1/15/24 | | | 8,345,000 | | | | 10,822,764 | |
International Paper 4.35% 8/15/48 | | | 3,430,000 | | | | 3,426,501 | |
INVISTA Finance 144A 4.25% 10/15/19 # | | | 4,580,000 | | | | 4,694,500 | |
Mosaic 5.625% 11/15/43 | | | 2,635,000 | | | | 2,720,722 | |
Sherwin-Williams 3.45% 6/1/27 | | | 4,495,000 | | | | 4,589,247 | |
Steel Dynamics 5.00% 12/15/26 | | | 975,000 | | | | 1,031,063 | |
Vale Overseas 6.25% 8/10/26 | | | 2,445,000 | | | | 2,723,730 | |
| | | | | | | | |
| | | Principal amount° | | | Value (US $) | |
Corporate Bonds (continued) | | | | | | | | |
| |
Basic Industry (continued) | | | | | | | | |
Westlake Chemical 5.00% 8/15/46 | | | 990,000 | | | $ | 1,069,350 | |
| | | | | | | | |
| | | | | | | 57,182,795 | |
| | | | | | | | |
Brokerage – 1.82% | | | | | | | | |
Affiliated Managers Group 3.50% 8/1/25 | | | 3,020,000 | | | | 3,014,923 | |
E*TRADE Financial 5.875%y● | | | 4,565,000 | | | | 4,910,114 | |
Jefferies Group | | | | | | | | |
5.125% 1/20/23 | | | 255,000 | | | | 277,573 | |
6.45% 6/8/27 | | | 5,627,000 | | | | 6,509,060 | |
6.50% 1/20/43 | | | 1,575,000 | | | | 1,796,921 | |
Lazard Group | | | | | | | | |
3.625% 3/1/27 | | | 2,260,000 | | | | 2,252,831 | |
3.75% 2/13/25 | | | 1,075,000 | | | | 1,098,379 | |
| | | | | | | | |
| | | | | | | 19,859,801 | |
| | | | | | | | |
Capital Goods – 3.86% | | | | | | | | |
Ardagh Packaging Finance 144A 4.625% 5/15/23 # | | | 2,900,000 | | | | 2,976,125 | |
LafargeHolcim Finance US 144A 3.50% 9/22/26 # | | | 8,095,000 | | | | 8,035,753 | |
Rockwell Collins | | | | | | | | |
3.20% 3/15/24 | | | 2,190,000 | | | | 2,236,905 | |
3.50% 3/15/27 | | | 6,490,000 | | | | 6,673,284 | |
Siemens Financieringsmaatschappij | | | | | | | | |
144A 3.125% 3/16/24 # | | | 7,205,000 | | | | 7,393,317 | |
144A 4.20% 3/16/47 # | | | 3,725,000 | | | | 3,982,610 | |
Standard Industries 144A 5.00% 2/15/27 # | | | 2,585,000 | | | | 2,672,244 | |
Tyco Electronics Group 3.125% 8/15/27 | | | 1,630,000 | | | | 1,616,944 | |
United Technologies | | | | | | | | |
2.80% 5/4/24 | | | 2,895,000 | | | | 2,920,383 | |
3.75% 11/1/46 | | | 3,675,000 | | | | 3,617,597 | |
| | | | | | | | |
| | | | | | | 42,125,162 | |
| | | | | | | | |
Communications – 10.82% | | | | | | | | |
AMC Networks 4.75% 8/1/25 | | | 1,350,000 | | | | 1,365,187 | |
American Tower 4.00% 6/1/25 | | | 9,130,000 | | | | 9,492,708 | |
American Tower Trust I 144A 3.07% 3/15/23 # | | | 3,726,000 | | | | 3,770,103 | |
AT&T | | | | | | | | |
3.90% 8/14/27 | | | 3,265,000 | | | | 3,269,248 | |
4.25% 3/1/27 | | | 5,185,000 | | | | 5,343,314 | |
4.90% 8/14/37 | | | 3,385,000 | | | | 3,380,285 | |
5.15% 2/14/50 | | | 3,875,000 | | | | 3,876,275 | |
CCO Holdings | | | | | | | | |
144A 5.50% 5/1/26 # | | | 2,565,000 | | | | 2,732,541 | |
144A 5.875% 4/1/24 # | | | 335,000 | | | | 360,650 | |
Crown Castle International | | | | | | | | |
3.65% 9/1/27 | | | 2,440,000 | | | | 2,442,106 | |
| | |
| Schedules of investments | | |
| Delaware Corporate Bond Fund | | |
| | | | | | | | |
| | | Principal amount° | | | Value (US $) | |
Corporate Bonds (continued) | | | | | | | | |
| |
Communications (continued) | | | | | | | | |
Crown Castle International | | | | | | | | |
4.00% 3/1/27 | | | 2,195,000 | | | $ | 2,253,510 | |
5.25% 1/15/23 | | | 4,295,000 | | | | 4,803,223 | |
Crown Castle Towers 144A 3.663% 5/15/25 # | | | 7,035,000 | | | | 7,281,225 | |
CSC Holdings 144A 6.625% 10/15/25 # | | | 2,125,000 | | | | 2,357,422 | |
Gray Television 144A 5.875% 7/15/26 # | | | 2,645,000 | | | | 2,744,187 | |
Grupo Televisa 5.00% 5/13/45 | | | 4,770,000 | | | | 4,771,018 | |
GTP Acquisition Partners I 144A 2.35% 6/15/20 # | | | 2,130,000 | | | | 2,110,229 | |
Historic TW 6.875% 6/15/18 | | | 5,285,000 | | | | 5,521,461 | |
Myriad International Holdings 144A 4.85% 7/6/27 # | | | 1,585,000 | | | | 1,638,890 | |
Nielsen Co. Luxembourg 144A 5.00% 2/1/25 # | | | 2,715,000 | | | | 2,810,025 | |
Radiate Holdco 144A 6.625% 2/15/25 # | | | 1,495,000 | | | | 1,500,606 | |
SBA Tower Trust | | | | | | | | |
144A 2.24% 4/10/18 # | | | 4,945,000 | | | | 4,943,423 | |
144A 2.898% 10/8/19 # | | | 3,005,000 | | | | 3,022,153 | |
SFR Group 144A 6.25% 5/15/24 # | | | 2,020,000 | | | | 2,141,200 | |
Sprint 7.125% 6/15/24 | | | 2,780,000 | | | | 3,054,525 | |
Sprint Spectrum 144A 3.36% 9/20/21 # | | | 4,875,000 | | | | 4,954,219 | |
Telefonica Emisiones 5.213% 3/8/47 | | | 2,035,000 | | | | 2,260,930 | |
Time Warner Cable 7.30% 7/1/38 | | | 8,125,000 | | | | 10,399,366 | |
Time Warner Entertainment 8.375% 3/15/23 | | | 4,965,000 | | | | 6,226,964 | |
UPCB Finance IV 144A 5.375% 1/15/25 # | | | 1,600,000 | | | | 1,676,000 | |
Verizon Communications 5.25% 3/16/37 | | | 2,635,000 | | | | 2,818,789 | |
VimpelCom Holdings 144A 4.95% 6/16/24 # | | | 2,665,000 | | | | 2,688,319 | |
| | | | | | | | |
| | | | | | | 118,010,101 | |
| | | | | | | | |
Consumer Cyclical – 4.25% | | | | | | | | |
Alimentation Couche-Tard | | | | | | | | |
144A 2.70% 7/26/22 # | | | 1,835,000 | | | | 1,841,208 | |
144A 3.55% 7/26/27 # | | | 2,670,000 | | | | 2,696,033 | |
Boyd Gaming 6.375% 4/1/26 | | | 2,920,000 | | | | 3,190,100 | |
Coach 4.125% 7/15/27 | | | 8,130,000 | | | | 8,203,186 | |
Dollar General 3.875% 4/15/27 | | | 6,755,000 | | | | 6,993,310 | |
Ford Motor Credit 3.096% 5/4/23 | | | 5,335,000 | | | | 5,299,336 | |
General Motors Financial 5.25% 3/1/26 | | | 8,355,000 | | | | 9,079,437 | |
Lowe’s | | | | | | | | |
3.10% 5/3/27 | | | 2,785,000 | | | | 2,800,067 | |
4.05% 5/3/47 | | | 3,750,000 | | | | 3,845,550 | |
Wyndham Worldwide 4.15% 4/1/24 | | | 2,305,000 | | | | 2,396,822 | |
| | | | | | | | |
| | | | | | | 46,345,049 | |
| | | | | | | | |
Consumer Non-Cyclical – 6.33% | | | | | | | | |
Abbott Laboratories 4.90% 11/30/46 | | | 2,000,000 | | | | 2,219,506 | |
Albertsons 144A 5.75% 3/15/25 # | | | 1,620,000 | | | | 1,474,200 | |
| | | | | | | | |
| | | Principal amount° | | | Value (US $) | |
Corporate Bonds (continued) | | | | | | | | |
| |
Consumer Non-Cyclical (continued) | | | | | | | | |
Anheuser-Busch InBev Finance | | | | | | | | |
3.65% 2/1/26 | | | 3,620,000 | | | $ | 3,750,400 | |
4.90% 2/1/46 | | | 3,500,000 | | | | 3,952,973 | |
Becton Dickinson and Co. | | | | | | | | |
3.363% 6/6/24 | | | 2,840,000 | | | | 2,876,400 | |
3.70% 6/6/27 | | | 4,400,000 | | | | 4,452,844 | |
Biogen 5.20% 9/15/45 | | | 5,595,000 | | | | 6,457,245 | |
Change Healthcare Holdings 144A 5.75% 3/1/25 # | | | 2,615,000 | | | | 2,713,063 | |
HealthSouth 5.75% 11/1/24 | | | 2,405,000 | | | | 2,459,113 | |
Heineken 144A 3.50% 1/29/28 # | | | 6,670,000 | | | | 6,859,475 | |
Kroger 2.65% 10/15/26 | | | 2,350,000 | | | | 2,184,344 | |
Molson Coors Brewing 3.00% 7/15/26 | | | 5,480,000 | | | | 5,344,885 | |
Mylan 3.95% 6/15/26 | | | 4,290,000 | | | | 4,394,770 | |
Shire Acquisitions Investments Ireland 3.20% 9/23/26 | | | 12,710,000 | | | | 12,536,902 | |
Tyson Foods 3.55% 6/2/27 | | | 5,050,000 | | | | 5,176,745 | |
Universal Health Services 144A 4.75% 8/1/22 # | | | 2,170,000 | | | | 2,240,525 | |
| | | | | | | | |
| | | | | | | 69,093,390 | |
| | | | | | | | |
Electric – 10.47% | | | | | | | | |
Ameren 3.65% 2/15/26 | | | 4,455,000 | | | | 4,575,659 | |
Ameren Illinois 9.75% 11/15/18 | | | 6,971,000 | | | | 7,656,912 | |
Appalachian Power 3.30% 6/1/27 | | | 5,355,000 | | | | 5,483,225 | |
Cleveland Electric Illuminating 5.50% 8/15/24 | | | 3,360,000 | | | | 3,862,780 | |
ComEd Financing III 6.35% 3/15/33 | | | 6,500,000 | | | | 7,179,153 | |
DTE Electric 3.75% 8/15/47 | | | 4,050,000 | | | | 4,047,813 | |
DTE Energy 2.85% 10/1/26 | | | 1,955,000 | | | | 1,877,695 | |
Emera 6.75% 6/15/76 ● | | | 5,600,000 | | | | 6,412,000 | |
Emera US Finance 4.75% 6/15/46 | | | 4,405,000 | | | | 4,744,471 | |
Enel 144A 8.75% 9/24/73 #● | | | 4,125,000 | | | | 4,980,937 | |
Enel Finance International 144A 3.625% 5/25/27 # | | | 11,340,000 | | | | 11,472,905 | |
Entergy 4.00% 7/15/22 | | | 1,620,000 | | | | 1,721,791 | |
Entergy Louisiana 3.12% 9/1/27 | | | 5,250,000 | | | | 5,289,968 | |
Exelon 3.497% 6/1/22 | | | 3,565,000 | | | | 3,697,664 | |
Fortis 3.055% 10/4/26 | | | 7,385,000 | | | | 7,187,628 | |
Indiana Michigan Power 3.75% 7/1/47 | | | 1,355,000 | | | | 1,346,419 | |
National Rural Utilities Cooperative Finance 5.25% 4/20/46 ● | | | 3,235,000 | | | | 3,471,449 | |
NextEra Energy Capital Holdings 3.55% 5/1/27 | | | 6,905,000 | | | | 7,132,023 | |
NV Energy 6.25% 11/15/20 | | | 4,475,000 | | | | 5,035,928 | |
Pennsylvania Electric 5.20% 4/1/20 | | | 8,131,000 | | | | 8,631,691 | |
Rochester Gas & Electric 144A 3.10% 6/1/27 # | | | 3,715,000 | | | | 3,737,799 | |
Trans-Allegheny Interstate Line 144A 3.85% 6/1/25 # | | | 1,880,000 | | | | 1,963,807 | |
| | |
| Schedules of investments | | |
| Delaware Corporate Bond Fund | | |
| | | | | | | | |
| | | Principal amount° | | | Value (US $) | |
Corporate Bonds (continued) | | | | | | | | |
| |
Electric (continued) | | | | | | | | |
Union Electric 2.95% 6/15/27 | | | 2,725,000 | | | $ | 2,713,819 | |
| | | | | | | | |
| | | | | | | 114,223,536 | |
| | | | | | | | |
Energy – 11.07% | | | | | | | | |
AmeriGas Partners 5.75% 5/20/27 | | | 1,626,000 | | | | 1,650,390 | |
Anadarko Petroleum 6.60% 3/15/46 | | | 6,610,000 | | | | 8,187,721 | |
Andeavor 144A 4.75% 12/15/23 # | | | 3,735,000 | | | | 4,051,250 | |
Canadian Natural Resources 4.95% 6/1/47 | | | 3,605,000 | | | | 3,780,034 | |
Cheniere Corpus Christi Holdings 144A 5.125% 6/30/27 # | | | 1,345,000 | | | | 1,403,844 | |
Enbridge | | | | | | | | |
3.70% 7/15/27 | | | 2,220,000 | | | | 2,254,981 | |
5.50% 12/1/46 | | | 1,920,000 | | | | 2,221,741 | |
Energy Transfer 6.125% 12/15/45 | | | 11,025,000 | | | | 12,120,918 | |
Kinder Morgan Energy Partners 9.00% 2/1/19 | | | 3,600,000 | | | | 3,960,727 | |
Marathon Oil 4.40% 7/15/27 | | | 6,560,000 | | | | 6,683,315 | |
Marathon Petroleum 6.50% 3/1/41 | | | 1,455,000 | | | | 1,718,585 | |
MPLX 4.875% 12/1/24 | | | 7,875,000 | | | | 8,474,807 | |
Newfield Exploration | | | | | | | | |
5.625% 7/1/24 | | | 1,345,000 | | | | 1,417,294 | |
5.75% 1/30/22 | | | 1,085,000 | | | | 1,151,456 | |
Noble Energy | | | | | | | | |
4.15% 12/15/21 | | | 3,440,000 | | | | 3,641,728 | |
5.05% 11/15/44 | | | 3,425,000 | | | | 3,567,963 | |
5.625% 5/1/21 | | | 1,520,000 | | | | 1,567,979 | |
NuStar Logistics 5.625% 4/28/27 | | | 1,925,000 | | | | 2,045,313 | |
ONEOK | | | | | | | | |
4.95% 7/13/47 | | | 4,760,000 | | | | 4,770,105 | |
7.50% 9/1/23 | | | 4,985,000 | | | | 6,048,301 | |
Petrobras Global Finance 7.25% 3/17/44 | | | 2,560,000 | | | | 2,582,400 | |
Petroleos Mexicanos | | | | | | | | |
144A 6.75% 9/21/47 # | | | 2,180,000 | | | | 2,300,336 | |
6.75% 9/21/47 | | | 945,000 | | | | 997,164 | |
Plains All American Pipeline 3.85% 10/15/23 | | | 5,325,000 | | | | 5,427,474 | |
Sabine Pass Liquefaction | | | | | | | | |
5.625% 3/1/25 | | | 6,540,000 | | | | 7,286,528 | |
5.75% 5/15/24 | | | 4,945,000 | | | | 5,567,205 | |
5.875% 6/30/26 | | | 875,000 | | | | 986,756 | |
Transcanada Trust | | | | | | | | |
5.30% 3/15/77 ● | | | 1,760,000 | | | | 1,824,900 | |
5.875% 8/15/76 ● | | | 2,245,000 | | | | 2,462,092 | |
Woodside Finance | | | | | | | | |
144A 3.65% 3/5/25 # | | | 2,055,000 | | | | 2,059,402 | |
| | | | | | | | |
| | | Principal amount° | | | Value (US $) | |
Corporate Bonds (continued) | | | | | | | | |
| |
Energy (continued) | | | | | | | | |
Woodside Finance | | | | | | | | |
144A 8.75% 3/1/19 # | | | 7,800,000 | | | $ | 8,589,118 | |
| | | | | | | | |
| | | | | | | 120,801,827 | |
| | | | | | | | |
Finance Companies – 3.28% | | | | | | | | |
AerCap Global Aviation Trust 144A 6.50% 6/15/45 #● | | | 6,045,000 | | | | 6,528,600 | |
AerCap Ireland Capital | | | | | | | | |
3.65% 7/21/27 | | | 7,115,000 | | | | 7,065,821 | |
3.95% 2/1/22 | | | 2,795,000 | | | | 2,920,163 | |
Air Lease | | | | | | | | |
3.00% 9/15/23 | | | 4,000,000 | | | | 3,996,632 | |
3.625% 4/1/27 | | | 5,890,000 | | | | 5,920,216 | |
Depository Trust & Clearing 144A 4.875%#y● | | | 6,000,000 | | | | 6,255,000 | |
International Lease Finance 8.625% 1/15/22 | | | 2,500,000 | | | | 3,087,633 | |
| | | | | | | | |
| | | | | | | 35,774,065 | |
| | | | | | | | |
Insurance – 2.64% | | | | | | | | |
Manulife Financial 4.061% 2/24/32 ● | | | 4,330,000 | | | | 4,383,614 | |
MetLife | | | | | | | | |
5.25%y● | | | 4,200,000 | | | | 4,401,348 | |
144A 9.25% 4/8/38 # | | | 2,160,000 | | | | 3,215,700 | |
Nuveen Finance 144A 4.125% 11/1/24 # | | | 6,450,000 | | | | 6,804,473 | |
Progressive 4.125% 4/15/47 | | | 4,230,000 | | | | 4,464,325 | |
Prudential Financial 5.375% 5/15/45 ● | | | 3,370,000 | | | | 3,660,898 | |
XLIT 3.761%y● | | | 2,042,000 | | | | 1,919,480 | |
| | | | | | | | |
| | | | | | | 28,849,838 | |
| | | | | | | | |
Natural Gas – 0.24% | | | | | | | | |
Boston Gas 144A 3.15% 8/1/27 # | | | 2,595,000 | | | | 2,592,561 | |
| | | | | | | | |
| | | | | | | 2,592,561 | |
| | | | | | | | |
Real Estate Investment Trusts – 3.43% | | | | | | | | |
Corporate Office Properties 5.25% 2/15/24 | | | 5,730,000 | | | | 6,162,529 | |
CyrusOne 144A 5.00% 3/15/24 # | | | 1,850,000 | | | | 1,928,625 | |
Education Realty Operating Partnership 4.60% 12/1/24 | | | 4,170,000 | | | | 4,275,309 | |
ESH Hospitality 144A 5.25% 5/1/25 # | | | 3,070,000 | | | | 3,215,825 | |
Host Hotels & Resorts 3.75% 10/15/23 | | | 8,645,000 | | | | 8,888,599 | |
LifeStorage 3.50% 7/1/26 | | | 2,745,000 | | | | 2,630,094 | |
Physicians Realty 4.30% 3/15/27 | | | 1,590,000 | | | | 1,625,094 | |
Regency Centers 3.60% 2/1/27 | | | 3,355,000 | | | | 3,353,165 | |
Trust F/1401 144A 5.25% 1/30/26 # | | | 2,030,000 | | | | 2,134,038 | |
WP Carey 4.60% 4/1/24 | | | 3,120,000 | | | | 3,269,095 | |
| | | | | | | | |
| | | | | | | 37,482,373 | |
| | | | | | | | |
Technology – 3.10% | | | | | | | | |
Apple 3.20% 5/11/27 | | | 7,085,000 | | | | 7,197,942 | |
| | |
| Schedules of investments | | |
| Delaware Corporate Bond Fund | | |
| | | | | | | | |
| | | Principal amount° | | | Value (US $) | |
Corporate Bonds (continued) | | | | | | | | |
| |
Technology (continued) | | | | | | | | |
CDK Global | | | | | | | | |
144A 4.875% 6/1/27 # | | | 2,165,000 | | | $ | 2,229,950 | |
5.00% 10/15/24 | | | 3,160,000 | | | | 3,357,500 | |
Dell International | | | | | | | | |
144A 6.02% 6/15/26 # | | | 2,430,000 | | | | 2,718,079 | |
144A 8.10% 7/15/36 # | | | 2,180,000 | | | | 2,758,783 | |
Microsoft | | | | | | | | |
3.70% 8/8/46 | | | 1,090,000 | | | | 1,081,352 | |
4.25% 2/6/47 | | | 6,740,000 | | | | 7,302,183 | |
MSCI 144A 4.75% 8/1/26 # | | | 2,830,000 | | | | 2,943,200 | |
NXP | | | | | | | | |
144A 4.125% 6/1/21 # | | | 1,200,000 | | | | 1,261,500 | |
144A 4.625% 6/1/23 # | | | 2,765,000 | | | | 2,993,610 | |
| | | | | | | | |
| | | | | | | 33,844,099 | |
| | | | | | | | |
Transportation – 2.87% | | | | | | | | |
Air Canada 2015-1 Class A Pass Through Trust 144A | | | | | | | | |
3.60% 3/15/27 #¨ | | | 2,419,868 | | | | 2,465,240 | |
American Airlines 2014-1 Class A Pass Through Trust | | | | | | | | |
3.70% 10/1/26 ¨ | | | 1,737,106 | | | | 1,787,576 | |
American Airlines 2015-1 Class A Pass Through Trust | | | | | | | | |
3.375% 5/1/27 ¨ | | | 2,951,315 | | | | 2,980,828 | |
American Airlines 2015-2 Class AA Pass Through Trust | | | | | | | | |
3.60% 9/22/27 ¨ | | | 1,348,018 | | | | 1,388,998 | |
American Airlines 2016-1 Class AA Pass Through Trust | | | | | | | | |
3.575% 1/15/28 ¨ | | | 613,778 | | | | 629,889 | |
DAE Funding | | | | | | | | |
144A 4.50% 8/1/22 # | | | 540,000 | | | | 550,800 | |
144A 5.00% 8/1/24 # | | | 540,000 | | | | 552,825 | |
Penske Truck Leasing | | | | | | | | |
144A 3.30% 4/1/21 # | | | 4,400,000 | | | | 4,544,646 | |
144A 3.40% 11/15/26 # | | | 2,905,000 | | | | 2,890,870 | |
144A 4.20% 4/1/27 # | | | 2,555,000 | | | | 2,678,164 | |
TTX 144A 4.20% 7/1/46 # | | | 5,365,000 | | | | 5,420,056 | |
United Airlines 2014-1 Class A Pass Through Trust | | | | | | | | |
4.00% 4/11/26 ¨ | | | 1,384,872 | | | | 1,460,624 | |
United Airlines 2014-2 Class A Pass Through Trust | | | | | | | | |
3.75% 9/3/26 ¨ | | | 3,550,062 | | | | 3,665,439 | |
United Airlines 2016-1 Class AA Pass Through Trust | | | | | | | | |
3.10% 7/7/28 ¨ | | | 275,000 | | | | 276,546 | |
| | | | | | | | |
| | | | | | | 31,292,501 | |
| | | | | | | | |
| Total Corporate Bonds (cost $990,678,663) | | | | | | | 1,020,710,232 | |
| | | | | | | | |
| | | | | | | | |
| | | Principal amount° | | | Value (US $) | |
Municipal Bonds – 0.95% | | | | | | | | |
| |
Buckeye, Ohio Tobacco Settlement Financing Authority | | | | | | | | |
(Asset-Backed Senior Turbo) Series A-2 5.875% 6/1/47 | | | 2,195,000 | | | $ | 2,078,994 | |
Commonwealth of Massachusetts | | | | | | | | |
Series C 5.00% 10/1/25 | | | 330,000 | | | | 409,929 | |
Los Angeles, California Department of Water & Power | | | | | | | | |
Revenue (Taxable Build America Bond) | | | | | | | | |
Series D 6.574% 7/1/45 | | | 5,365,000 | | | | 7,875,230 | |
| | | | | | | | |
Total Municipal Bonds (cost $7,895,151) | | | | | | | 10,364,153 | |
| | | | | | | | |
|
| |
Loan Agreements – 0.36%« | | | | | | | | |
| |
Gardner Denver 1st Lien 4.546% 7/30/20 | | | 1,763,867 | | | | 1,775,112 | |
KIK Custom Products Tranche B 1st Lien 5.793% 8/26/22 | | | 2,132,197 | | | | 2,156,184 | |
| | | | | | | | |
Total Loan Agreements (cost $3,823,141) | | | | | | | 3,931,296 | |
| | | | | | | | |
| | | Number of shares | | | | |
Convertible Preferred Stock – 0.24% | | | | | | | | |
| |
El Paso Energy Capital Trust I 4.75% exercise price $50.00, maturity date 3/31/28 | | | 52,027 | | | | 2,583,661 | |
| | | | | | | | |
Total Convertible Preferred Stock (cost $2,601,096) | | | | | | | 2,583,661 | |
| | | | | | | | |
|
| |
Preferred Stock – 1.57% | | | | | | | | |
| |
Bank of America 6.50% ● | | | 2,610,000 | | | | 2,949,300 | |
DTE Energy 5.25% | | | 105,000 | | | | 2,689,050 | |
General Electric 5.00% ● | | | 9,227,000 | | | | 9,739,468 | |
GMAC Capital Trust I 6.967% ● | | | 50,000 | | | | 1,327,500 | |
USB Realty 144A 2.451% #● | | | 400,000 | | | | 356,000 | |
| | | | | | | | |
Total Preferred Stock (cost $15,766,357) | | | | | | | 17,061,318 | |
| | | | | | | | |
| | | Principal amount° | | | | |
Short-Term Investments – 3.55% | | | | | | | | |
| |
Repurchase Agreements – 3.55% | | | | | | | | |
Bank of America Merrill Lynch | | | | | | | | |
0.97%, dated 7/31/17, to be repurchased on 8/1/17, repurchase price $7,093,905 (collateralized by US government obligations 0.125% 4/15/18; market value $7,235,594) | | | 7,093,714 | | | | 7,093,714 | |
Bank of Montreal | | | | | | | | |
0.90%, dated 7/31/17, to be repurchased on 8/1/17, repurchase price $17,734,729 (collateralized by US government obligations 0.00%–4.375% 1/11/18–8/15/40; market value $18,088,972) | | | 17,734,286 | | | | 17,734,286 | |
| | |
| Schedules of investments | | |
| Delaware Corporate Bond Fund | | |
| | | | | | | | |
| | | Principal amount° | | | Value (US $) | |
Short-Term Investments (continued) | | | | | | | | |
| |
Repurchase Agreements (continued) | | | | | | | | |
BNP Paribas | | | | | | | | |
1.04%, dated 7/31/17, to be repurchased on 8/1/17, repurchase price $13,940,403 (collateralized by US government obligations 0.00%–2.50% 10/12/17–8/15/46; market value $14,218,800) | | | 13,940,000 | | | $ | 13,940,000 | |
| | | | | | | | |
Total Short-Term Investments (cost $38,768,000) | | | | | | | 38,768,000 | |
| | | | | | | | |
Total Value of Securities – 100.85%
(cost $1,066,257,246) | | | | | | $ | 1,100,327,982 | |
| | | | | | | | |
| # | Security exempt from registration under Rule 144A of the Securities Act of 1933, as amended. At July 31, 2017, the aggregate value of Rule 144A securities was $235,142,903, which represents 21.55% of the Fund’s net assets. See Note 11 in “Notes to financial statements.” |
| ¨ | Pass Through Agreement. Security represents the contractual right to receive a proportionate amount of underlying payments due to the counterparty pursuant to various agreements related to the rescheduling of obligations and the exchange of certain notes. |
| « | Loan agreements generally pay interest at rates which are periodically reset by reference to a base lending rate plus a premium. These base lending rates are generally: (i) the prime rate offered by one or more US banks, (ii) the lending rate offered by one or more European banks such as the London Interbank Offered Rate (LIBOR), and (iii) the certificate of deposit rate. Loan agreements may be subject to restrictions on resale. Stated rate in effect at July 31, 2017. |
| ° | Principal amount shown is stated in US dollars unless noted that the security is denominated in another currency. |
| y | No contractual maturity date. |
| ● | Variable rate security. Each rate shown is as of July 31, 2017. Interest rates reset periodically. |
| f | Step coupon bond. Coupon increases or decreases periodically based on a predetermined schedule. Stated rate in effect at July 31, 2017. |
See accompanying notes, which are an integral part of the financial statements.
| | |
| Schedules of investments | | |
Delaware Extended Duration Bond Fund | | July 31, 2017 |
| | | | | | | | |
| | | Principal amount° | | | Value (US $) | |
Convertible Bond – 0.12% | | | | | | | | |
General Cable 4.50% exercise price $31.01, maturity date 11/15/29 f | | | 873,000 | | | $ | 772,605 | |
| | | | | | | | |
Total Convertible Bond (cost $688,181) | | | | | | | 772,605 | |
| | | | | | | | |
| | | | | | | | |
Corporate Bonds – 90.20% | | | | | | | | |
Banking – 14.75% | | | | | | | | |
Ally Financial 8.00% 11/1/31 | | | 595,000 | | | | 741,519 | |
Banco Santander 4.25% 4/11/27 | | | 2,600,000 | | | | 2,727,715 | |
Bank of America
| | | | | | | | |
3.593% 7/21/28 ● | | | 1,755,000 | | | | 1,763,687 | |
4.183% 11/25/27 | | | 110,000 | | | | 113,847 | |
4.443% 1/20/48 ● | | | 9,315,000 | | | | 9,944,228 | |
Bank of New York Mellon 4.625%y● | | | 3,275,000 | | | | 3,337,225 | |
Barclays 4.95% 1/10/47 | | | 6,585,000 | | | | 7,252,251 | |
Credit Suisse Group | | | | | | | | |
144A 4.282% 1/9/28 # | | | 2,225,000 | | | | 2,337,445 | |
144A 6.25%#y● | | | 1,147,000 | | | | 1,233,453 | |
Credit Suisse Group Funding Guernsey 4.875% 5/15/45 | | | 5,285,000 | | | | 5,892,844 | |
Fifth Third Bank 3.85% 3/15/26 | | | 5,000,000 | | | | 5,186,810 | |
Goldman Sachs Group 5.15% 5/22/45 | | | 7,765,000 | | | | 8,807,358 | |
JPMorgan Chase & Co. | | | | | | | | |
3.882% 7/24/38 ● | | | 3,180,000 | | | | 3,186,627 | |
4.032% 7/24/48 ● | | | 8,295,000 | | | | 8,362,729 | |
6.75%y● | | | 1,500,000 | | | | 1,720,125 | |
KeyBank 6.95% 2/1/28 | | | 2,467,000 | | | | 3,130,877 | |
Morgan Stanley | | | | | | | | |
3.95% 4/23/27 | | | 1,450,000 | | | | 1,473,490 | |
4.375% 1/22/47 | | | 8,700,000 | | | | 9,146,467 | |
PNC Financial Services Group 5.00%y● | | | 2,705,000 | | | | 2,806,437 | |
UBS 7.625% 8/17/22 | | | 4,020,000 | | | | 4,793,850 | |
US Bancorp 5.125%y● | | | 2,805,000 | | | | 2,994,337 | |
USB Capital IX 3.50%y● | | | 810,000 | | | | 724,950 | |
Wells Fargo & Co. 4.75% 12/7/46 | | | 5,710,000 | | | | 6,199,667 | |
Wells Fargo Capital X 5.95% 12/15/36 | | | 3,245,000 | | | | 3,687,943 | |
| | | | | | | | |
| | | | | | | 97,565,881 | |
| | | | | | | | |
Basic Industry – 3.24% | | | | | | | | |
Barrick North America Finance 5.75% 5/1/43 | | | 6,045,000 | | | | 7,422,220 | |
BHP Billiton Finance USA 144A 6.25% 10/19/75 #● | | | 1,248,000 | | | | 1,365,312 | |
Georgia-Pacific 8.00% 1/15/24 | | | 3,280,000 | | | | 4,253,884 | |
International Paper 4.40% 8/15/47 | | | 4,766,000 | | | | 4,819,722 | |
Mosaic 5.625% 11/15/43 | | | 1,615,000 | | | | 1,667,539 | |
29
Schedules of investments
Delaware Extended Duration Bond Fund
| | | | | | | | |
| | | Principal amount° | | | Value (US $) | |
Corporate Bonds (continued) | | | | | | | | |
Basic Industry (continued) | | | | | | | | |
Sherwin-Williams 4.50% 6/1/47 | | | 1,185,000 | | | $ | 1,257,530 | |
Westlake Chemical 5.00% 8/15/46 | | | 605,000 | | | | 653,492 | |
| | | | | | | | |
| | | | | | | 21,439,699 | |
| | | | | | | | |
Brokerage – 2.06% | | | | | | | | |
Jefferies Group | | | | | | | | |
6.45% 6/8/27 | | | 2,640,000 | | | | 3,053,833 | |
6.50% 1/20/43 | | | 1,985,000 | | | | 2,264,690 | |
Lazard Group | | | | | | | | |
3.625% 3/1/27 | | | 2,265,000 | | | | 2,257,815 | |
3.75% 2/13/25 | | | 655,000 | | | | 669,245 | |
Legg Mason 5.625% 1/15/44 | | | 5,000,000 | | | | 5,388,145 | |
| | | | | | | | |
| | | | | | | 13,633,728 | |
| | | | | | | | |
Capital Goods – 6.94% | | | | | | | | |
Airbus 144A 3.95% 4/10/47 # | | | 8,310,000 | | | | 8,622,697 | |
LafargeHolcim Finance US 144A 4.75% 9/22/46 # | | | 5,105,000 | | | | 5,356,697 | |
Rockwell Collins 4.35% 4/15/47 | | | 8,115,000 | | | | 8,569,643 | |
Siemens Financieringsmaatschappij 144A | | | | | | | | |
4.20% 3/16/47 # | | | 9,655,000 | | | | 10,322,711 | |
United Technologies 3.75% 11/1/46 | | | 6,900,000 | | | | 6,792,222 | |
Valmont Industries 5.00% 10/1/44 | | | 6,255,000 | | | | 6,237,924 | |
| | | | | | | | |
| | | | | | | 45,901,894 | |
| | | | | | | | |
Communications – 5.63% | | | | | | | | |
American Tower 4.40% 2/15/26 | | | 7,125,000 | | | | 7,574,894 | |
AT&T | | | | | | | | |
4.90% 8/14/37 | | | 2,795,000 | | | | 2,791,107 | |
5.15% 2/14/50 | | | 110,000 | | | | 110,036 | |
5.30% 8/14/58 | | | 5,785,000 | | | | 5,780,129 | |
Deutsche Telekom International Finance 8.75% 6/15/30 | | | 1,335,000 | | | | 1,989,756 | |
Grupo Televisa 5.00% 5/13/45 | | | 3,785,000 | | | | 3,785,808 | |
Myriad International Holdings 144A 4.85% 7/6/27 # | | | 975,000 | | | | 1,008,150 | |
Telefonica Emisiones 5.213% 3/8/47 | | | 1,240,000 | | | | 1,377,667 | |
Time Warner Cable 7.30% 7/1/38 | | | 6,680,000 | | | | 8,549,879 | |
Verizon Communications 5.25% 3/16/37 | | | 3,980,000 | | | | 4,257,601 | |
| | | | | | | | |
| | | | | | | 37,225,027 | |
| | | | | | | | |
Consumer Cyclical – 3.51% | | | | | | | | |
Alimentation Couche-Tard 144A 4.50% 7/26/47 # | | | 2,180,000 | | | | 2,238,437 | |
Ford Motor 5.291% 12/8/46 | | | 1,785,000 | | | | 1,849,976 | |
General Motors 6.75% 4/1/46 | | | 2,805,000 | | | | 3,369,296 | |
Lowe’s 4.05% 5/3/47 | | | 6,775,000 | | | | 6,947,627 | |
Marriott International 4.50% 10/1/34 | | | 4,610,000 | | | | 4,866,224 | |
Mastercard 3.80% 11/21/46 | | | 3,845,000 | | | | 3,934,973 | |
| | | | | | | | |
| | | | | | | 23,206,533 | |
| | | | | | | | |
30
| | | | | | | | |
| | | Principal amount° | | | Value (US $) | |
Corporate Bonds (continued) | | | | | | | | |
Consumer Non-Cyclical – 13.89% | | | | | | | | |
Abbott Laboratories 4.90% 11/30/46 | | | 6,190,000 | | | $ | 6,869,371 | |
Altria Group 3.875% 9/16/46 | | | 5,540,000 | | | | 5,330,876 | |
Anheuser-Busch InBev Finance 4.90% 2/1/46 | | | 8,910,000 | | | | 10,063,141 | |
Baxalta 5.25% 6/23/45 | | | 4,130,000 | | | | 4,811,776 | |
Becton Dickinson and Co. 4.669% 6/6/47 | | | 3,005,000 | | | | 3,153,083 | |
Biogen 5.20% 9/15/45 | | | 6,845,000 | | | | 7,899,883 | |
Celgene | | | | | | | | |
4.625% 5/15/44 | | | 2,000,000 | | | | 2,164,816 | |
5.25% 8/15/43 | | | 4,315,000 | | | | 4,998,431 | |
Eli Lilly & Co. 3.95% 5/15/47 | | | 9,375,000 | | | | 9,831,084 | |
Heineken 144A 4.35% 3/29/47 # | | | 5,335,000 | | | | 5,567,003 | |
Kellogg 4.50% 4/1/46 | | | 2,865,000 | | | | 2,979,672 | |
Kroger 4.45% 2/1/47 | | | 5,325,000 | | | | 5,175,101 | |
Molson Coors Brewing 4.20% 7/15/46 | | | 3,165,000 | | | | 3,118,437 | |
Mylan 5.25% 6/15/46 | | | 4,970,000 | | | | 5,439,764 | |
Pernod Ricard 144A 5.50% 1/15/42 # | | | 5,605,000 | | | | 6,674,569 | |
Tyson Foods 4.55% 6/2/47 | | | 7,270,000 | | | | 7,746,650 | |
| | | | | | | | |
| | | | | | | 91,823,657 | |
| | | | | | | | |
Electric – 13.14% | | | | | | | | |
American Transmission Systems 144A 5.00% 9/1/44 # | | | 5,110,000 | | | | 5,806,892 | |
Appalachian Power 4.40% 5/15/44 | | | 6,950,000 | | | | 7,436,813 | |
Berkshire Hathaway Energy 4.50% 2/1/45 | | | 6,950,000 | | | | 7,675,469 | |
Black Hills 4.20% 9/15/46 | | | 4,850,000 | | | | 4,771,231 | |
ComEd Financing III 6.35% 3/15/33 | | | 4,400,000 | | | | 4,859,734 | |
DTE Electric 3.75% 8/15/47 | | | 3,675,000 | | | | 3,673,015 | |
Duke Energy 3.75% 9/1/46 | | | 3,420,000 | | | | 3,339,110 | |
Duke Energy Ohio 3.70% 6/15/46 | | | 1,000,000 | | | | 990,835 | |
Emera 6.75% 6/15/76 ● | | | 3,445,000 | | | | 3,944,525 | |
Emera US Finance 4.75% 6/15/46 | | | 3,760,000 | | | | 4,049,764 | |
Enel Finance International 144A 4.75% 5/25/47 # | | | 8,605,000 | | | | 9,223,037 | |
Entergy Arkansas 4.95% 12/15/44 | | | 2,765,000 | | | | 2,857,769 | |
Entergy Louisiana 4.95% 1/15/45 | | | 125,000 | | | | 128,528 | |
Fortis 3.055% 10/4/26 | | | 6,875,000 | | | | 6,691,259 | |
Indiana Michigan Power 3.75% 7/1/47 | | | 2,445,000 | | | | 2,429,516 | |
Indianapolis Power & Light 144A 4.05% 5/1/46 # | | | 2,760,000 | | | | 2,722,111 | |
Kansas City Power & Light 4.20% 6/15/47 | | | 7,635,000 | | | | 7,868,623 | |
National Rural Utilities Cooperative Finance | | | | | | | | |
5.25% 4/20/46 ● | | | 935,000 | | | | 1,003,340 | |
Puget Sound Energy 4.434% 11/15/41 | | | 4,870,000 | | | | 5,224,935 | |
Tampa Electric 4.20% 5/15/45 | | | 2,175,000 | | | | 2,203,932 | |
| | | | | | | | |
| | | | | | | 86,900,438 | |
| | | | | | | | |
31
Schedules of investments
Delaware Extended Duration Bond Fund
| | | | | | | | |
| | | Principal amount° | | | Value (US $) | |
Corporate Bonds (continued) | | | | | | | | |
Energy – 11.93% | | | | | | | | |
Anadarko Petroleum 6.60% 3/15/46 | | | 4,555,000 | | | $ | 5,642,219 | |
BP Capital Markets 3.723% 11/28/28 | | | 4,785,000 | | | | 4,980,659 | |
Canadian Natural Resources 4.95% 6/1/47 | | | 1,985,000 | | | | 2,081,378 | |
Enbridge 5.50% 12/1/46 | | | 6,680,000 | | | | 7,729,809 | |
Energy Transfer 6.125% 12/15/45 | | | 7,530,000 | | | | 8,278,505 | |
Eni 144A 5.70% 10/1/40 # | | | 3,450,000 | | | | 3,603,687 | |
EnLink Midstream Partners | | | | | | | | |
5.45% 6/1/47 | | | 3,170,000 | | | | 3,221,874 | |
5.60% 4/1/44 | | | 1,185,000 | | | | 1,211,520 | |
Kinder Morgan 5.05% 2/15/46 | | | 8,235,000 | | | | 8,294,844 | |
Marathon Oil | | | | | | | | |
4.40% 7/15/27 | | | 3,195,000 | | | | 3,255,060 | |
5.20% 6/1/45 | | | 915,000 | | | | 914,042 | |
Marathon Petroleum 6.50% 3/1/41 | | | 905,000 | | | | 1,068,948 | |
Newfield Exploration 5.625% 7/1/24 | | | 1,275,000 | | | | 1,343,531 | |
Noble Energy 5.05% 11/15/44 | | | 5,200,000 | | | | 5,417,053 | |
ONEOK 4.95% 7/13/47 | | | 3,680,000 | | | | 3,687,813 | |
Petrobras Global Finance 7.25% 3/17/44 | | | 1,595,000 | | | | 1,608,956 | |
Petroleos Mexicanos 6.75% 9/21/47 | | | 1,595,000 | | | | 1,683,044 | |
Sabine Pass Liquefaction | | | | | | | | |
5.625% 3/1/25 | | | 1,710,000 | | | | 1,905,193 | |
5.75% 5/15/24 | | | 945,000 | | | | 1,063,905 | |
5.875% 6/30/26 | | | 2,835,000 | | | | 3,197,089 | |
Shell International Finance 4.00% 5/10/46 | | | 5,920,000 | | | | 6,003,117 | |
Transcanada Trust | | | | | | | | |
5.30% 3/15/77 ● | | | 1,120,000 | | | | 1,161,300 | |
5.875% 8/15/76 ● | | | 1,400,000 | | | | 1,535,380 | |
| | | | | | | | |
| | | | | | | 78,888,926 | |
| | | | | | | | |
Finance Companies – 0.97% | | | | | | | | |
AerCap Global Aviation Trust 144A 6.50% 6/15/45 #● | | | 3,020,000 | | | | 3,261,600 | |
Depository Trust & Clearing 144A 4.875%#y● | | | 3,000,000 | | | | 3,127,500 | |
| | | | | | | | |
| | | | | | | 6,389,100 | |
| | | | | | | | |
Insurance – 8.15% | | | | | | | | |
Alleghany 4.90% 9/15/44 | | | 3,525,000 | | | | 3,728,382 | |
Allstate 4.20% 12/15/46 | | | 9,115,000 | | | | 9,680,814 | |
Berkshire Hathaway Finance 4.30% 5/15/43 | | | 1,800,000 | | | | 1,944,400 | |
Brighthouse Financial 144A 4.70% 6/22/47 # | | | 6,335,000 | | | | 6,285,391 | |
Manulife Financial 4.061% 2/24/32 ● | | | 2,705,000 | | | | 2,738,493 | |
MetLife 4.60% 5/13/46 | | | 5,475,000 | | | | 6,079,862 | |
Nationwide Mutual Insurance 144A 4.95% 4/22/44 # | | | 3,200,000 | | | | 3,578,650 | |
Progressive 4.125% 4/15/47 | | | 7,115,000 | | | | 7,509,143 | |
Travelers 4.00% 5/30/47 | | | 5,955,000 | | | | 6,144,571 | |
32
| | | | | | | | |
| | | Principal amount° | | | Value (US $) | |
Corporate Bonds (continued) | | | | | | | | |
Insurance (continued) | | | | | | | | |
XLIT | | | | | | | | |
3.761%y● | | | 1,260,000 | | | $ | 1,184,400 | |
5.50% 3/31/45 | | | 4,590,000 | | | | 5,013,547 | |
| | | | | | | | |
| | | | | | | 53,887,653 | |
| | | | | | | | |
Natural Gas – 1.30% | | | | | | | | |
Piedmont Natural Gas 3.64% 11/1/46 | | | 6,300,000 | | | | 5,865,873 | |
Southwest Gas 3.80% 9/29/46 | | | 2,850,000 | | | | 2,735,786 | |
| | | | | | | | |
| | | | | | | 8,601,659 | |
| | | | | | | | |
Technology – 3.25% | | | | | | | | |
Apple | | | | | | | | |
3.45% 2/9/45 | | | 1,705,000 | | | | 1,608,749 | |
4.25% 2/9/47 | | | 2,445,000 | | | | 2,613,123 | |
4.65% 2/23/46 | | | 3,890,000 | | | | 4,376,059 | |
Applied Materials 4.35% 4/1/47 | | | 1,920,000 | | | | 2,071,680 | |
Dell International 144A 8.10% 7/15/36 # | | | 1,880,000 | | | | 2,379,134 | |
Microsoft | | | | | | | | |
3.70% 8/8/46 | | | 685,000 | | | | 679,565 | |
4.25% 2/6/47 | | | 7,155,000 | | | | 7,751,799 | |
| | | | | | | | |
| | | | | | | 21,480,109 | |
| | | | | | | | |
Transportation – 1.44% | | | | | | | | |
Penske Truck Leasing 144A 3.40% 11/15/26 # | | | 6,440,000 | | | | 6,408,676 | |
TTX 144A 4.20% 7/1/46 # | | | 3,070,000 | | | | 3,101,504 | |
| | | | | | | | |
| | | | | | | 9,510,180 | |
| | | | | | | | |
Total Corporate Bonds (cost $570,543,382) | | | | | | | 596,454,484 | |
| | | | | | | | |
| | | | | | | | |
Municipal Bonds – 2.94% | | | | | | | | |
Chicago, Illinois O’Hare International Airport Revenue | | | | | | | | |
(Taxable Build America Bond) Series B 6.395% 1/1/40 | | | 3,800,000 | | | | 5,100,208 | |
Commonwealth of Massachusetts | | | | | | | | |
Series C 5.00% 10/1/25 | | | 200,000 | | | | 248,442 | |
Long Island, New York Power Authority Electric System Revenue | | | | | | | | |
(Taxable Build America Bond) Series B 5.85% 5/1/41 | | | 3,600,000 | | | | 4,366,512 | |
Los Angeles, California Department of Water & Power Revenue | | | | | | | | |
(Taxable Build America Bond) Series D 6.574% 7/1/45 | | | 2,225,000 | | | | 3,266,055 | |
Metropolitan Transportation Authority, New York Revenue | | | | | | | | |
(Taxable Build America Bond) Series A2 6.089% 11/15/40 | | | 3,205,000 | | | | 4,198,486 | |
33
Schedules of investments
Delaware Extended Duration Bond Fund
| | | | | | | | |
| | | Principal amount° | | | Value (US $) | |
Municipal Bonds (continued) | | | | | | | | |
Oregon Department of Transportation Highway User Tax Revenue | | | | | | | | |
(Taxable Build America Bond-Subordinate Lien) Series A | | | 1,605,000 | | | $ | 2,055,363 | |
5.834% 11/15/34 | | | | | | | | |
Texas Water Development Board | | | | | | | | |
Series A 5.00% 10/15/45 | | | 200,000 | | | | 231,812 | |
| | | | | | | | |
| | | | | | | | |
Total Municipal Bonds (cost $14,940,876) | | | | | | | 19,466,878 | |
| | | | | | | | |
| | | | | | | | |
US Treasury Obligations – 1.61% | | | | | | | | |
US Treasury Bond | | | 5,990,000 | | | | 6,120,798 | |
3.00% 5/15/47 | | | | | | | | |
US Treasury Notes | | | 1,440,000 | | | | 1,434,656 | |
1.75% 6/30/22 | | | | | | | | |
2.375% 5/15/27 | | | 3,080,000 | | | | 3,103,460 | |
| | | | | | | | |
Total US Treasury Obligations (cost $10,630,211) | | | | | | | 10,658,914 | |
| | | | | | | | |
| | |
| | | Number of shares | | | | |
Convertible Preferred Stock – 0.26% | | | | | | | | |
El Paso Energy Capital Trust I 4.75% exercise price | | | | | | | | |
$50.00, maturity date 3/31/28 | | | 34,000 | | | | 1,688,440 | |
| | | | | | | | |
Total Convertible Preferred Stock (cost $1,687,760) | | | | | | | 1,688,440 | |
| | | | | | | | |
| | | | | | | | |
Preferred Stock – 1.67% | | | | | | | | |
Bank of America 6.50% ● | | | 1,500,000 | | | | 1,695,000 | |
DTE Energy 5.25% | | | 60,000 | | | | 1,536,600 | |
General Electric 5.00% ● | | | 4,814,000 | | | | 5,081,370 | |
Morgan Stanley 5.55% ● | | | 2,280,000 | | | | 2,391,150 | |
USB Realty 144A 2.451% #● | | | 400,000 | | | | 356,000 | |
| | | | | | | | |
Total Preferred Stock (cost $10,557,965) | | | | | | | 11,060,120 | |
| | | | | | | | |
| | |
| | | Principal amount° | | | | |
Short-Term Investments – 2.60% | | | | | | | | |
Repurchase Agreements – 2.04% | | | | | | | | |
Bank of America Merrill Lynch | | | | | | | | |
0.97%, dated 7/31/17, to be repurchased on 8/1/17, repurchase price $2,464,605 (collateralized by US government obligations 0.125% 4/15/18; market value $2,513,831) | | | 2,464,539 | | | | 2,464,539 | |
Bank of Montreal | | | | | | | | |
0.90%, dated 7/31/17, to be repurchased on 8/1/17, repurchase price $6,161,501 (collateralized by US government obligations 0.00%–4.375% 1/11/18–8/15/40; market value $6,284,574) | | | 6,161,347 | | | | 6,161,347 | |
34
| | | | | | | | |
| | | Principal amount° | | | Value (US $) | |
Short-Term Investments (continued) | | | | | | | | |
Repurchase Agreements (continued) | | | | | | | | |
BNP Paribas
1.04%, dated 7/31/17, to be repurchased on 8/1/17, repurchase price $4,843,254 (collateralized by US government obligations 0.00%–2.50% 10/12/17–8/15/46; market value $4,939,977) | | | 4,843,114 | | | $ | 4,843,114 | |
| | | | | | | | |
| | | | | | | 13,469,000 | |
| | | | | | | | |
US Treasury Obligation – 0.56%≠ | | | | | | | | |
US Treasury Bill 0.92% 8/3/17 | | | 3,688,186 | | | | 3,687,995 | |
| | | | | | | | |
| | | | | | | 3,687,995 | |
| | | | | | | | |
Total Short-Term Investments (cost $17,156,998) | | | | | | | 17,156,995 | |
| | | | | | | | |
| | |
Total Value of Securities – 99.40%
(cost $626,205,373) | | | | | | $ | 657,258,436 | |
| | | | | | | | |
| # | Security exempt from registration under Rule 144A of the Securities Act of 1933, as amended. At July 31, 2017, the aggregate value of Rule 144A securities was $94,580,656, which represents 14.30% of the Fund’s net assets. See Note 11 in “Notes to financial statements.” |
| ≠ | The rate shown is the effective yield at the time of purchase. |
| ° | Principal amount shown is stated in US dollars unless noted that the security is denominated in another currency. |
| y | No contractual maturity date. |
| ● | Variable rate security. Each rate shown is as of July 31, 2017. Interest rates reset periodically. |
| f | Step coupon bond. Coupon increases or decreases periodically based on a predetermined schedule. Stated rate in effect at July 31, 2017. |
See accompanying notes, which are an integral part of the financial statements.
35
Statements of assets and liabilities
July 31, 2017
| | | | | | | | | | |
| | | Delaware
Corporate Bond Fund | | Delaware
Extended Duration
Bond Fund |
| | |
Assets: | | | | | | | | | | |
Investments, at value1 | | | | $1,061,559,982 | | | | | $640,101,441 | |
Short-term investments, at value2 | | | | 38,768,000 | | | | | 17,156,995 | |
Cash | | | | 195,098 | | | | | — | |
Receivable for securities sold | | | | 22,288,280 | | | | | 27,767,998 | |
Dividends and interest receivable | | | | 10,914,360 | | | | | 6,712,369 | |
Receivable for fund shares sold | | | | 1,094,930 | | | | | 831,257 | |
Other assets3 | | | | 438,287 | | | | | 166,247 | |
| | | | | | | | | | |
Total assets | | | | 1,135,258,937 | | | | | 692,736,307 | |
| | | | | | | | | | |
Liabilities: | | | | | | | | | | |
Cash overdraft | | | | — | | | | | 7,028 | |
Payable for securities purchased | | | | 39,078,732 | | | | | 29,286,775 | |
Payable for fund shares redeemed | | | | 1,752,136 | | | | | 474,730 | |
Contingent liabilities3 | | | | 1,460,956 | | | | | 554,156 | |
Distribution payable | | | | 893,042 | | | | | 563,481 | |
Investment management fees payable to affiliates | | | | 433,972 | | | | | 260,470 | |
Other accrued expenses | | | | 332,569 | | | | | 195,627 | |
Distribution fees payable to affiliates | | | | 176,140 | | | | | 73,926 | |
Audit and tax fee payable | | | | 47,938 | | | | | 47,938 | |
Dividend disbursing and transfer agent fees and expenses payable to affiliates | | | | 18,123 | | | | | 11,081 | |
Accounting and administration expenses payable to affiliates | | | | 4,217 | | | | | 2,579 | |
Trustees’ fees and expenses payable | | | | 2,621 | | | | | 1,610 | |
Reports and statements to shareholders expenses payable to affiliates | | | | 1,203 | | | | | 576 | |
Legal fees payable to affiliates | | | | 952 | | | | | 737 | |
| | | | | | | | | | |
Total liabilities | | | | 44,202,601 | | | | | 31,480,714 | |
| | | | | | | | | | |
Total Net Assets | | | | $1,091,056,336 | | | | | $661,255,593 | |
| | | | | | | | | | |
Net Assets Consist of: | | | | | | | | | | |
Paid-in capital | | | | $1,103,158,078 | | | | | $637,923,578 | |
Distributions in excess of net investment income | | | | (136,718 | ) | | | | (595,199 | ) |
Accumulated net realized loss | | | | (46,035,760 | ) | | | | (7,125,849 | ) |
Net unrealized appreciation of investments | | | | 34,070,736 | | | | | 31,053,063 | |
| | | | | | | | | | |
Total Net Assets | | | | $1,091,056,336 | | | | | $661,255,593 | |
| | | | | | | | | | |
36
| | | | | | | | |
| | | Delaware
Corporate Bond Fund | | | Delaware
Extended Duration
Bond Fund | |
| | |
Net Asset Value | | | | | | | | |
Class A: | | | | | | | | |
Net assets | | $ | 248,143,369 | | | $ | 196,753,604 | |
Shares of beneficial interest outstanding, unlimited authorization, no par | | | 42,071,224 | | | | 29,731,862 | |
Net asset value per share | | $ | 5.90 | | | $ | 6.62 | |
Sales charge | | | 4.50 | % | | | 4.50 | % |
Offering price per share, equal to net asset value per share/(1 – sales charge) | | $ | 6.18 | | | $ | 6.93 | |
| | |
Class C: | | | | | | | | |
Net assets | | $ | 131,520,416 | | | $ | 28,264,570 | |
Shares of beneficial interest outstanding, unlimited authorization, no par | | | 22,296,635 | | | | 4,272,951 | |
Net asset value per share | | $ | 5.90 | | | $ | 6.61 | |
| | |
Class R: | | | | | | | | |
Net assets | | $ | 24,207,036 | | | $ | 19,294,264 | |
Shares of beneficial interest outstanding, unlimited authorization, no par | | | 4,100,864 | | | | 2,911,375 | |
Net asset value per share | | $ | 5.90 | | | $ | 6.63 | |
| | |
Institutional Class: | | | | | | | | |
Net assets | | $ | 687,185,515 | | | $ | 393,714,546 | |
Shares of beneficial interest outstanding, unlimited authorization, no par | | | 116,508,950 | | | | 59,591,043 | |
Net asset value per share | | $ | 5.90 | | | $ | 6.61 | |
| | |
Class R6: | | | | | | | | |
Net assets | | $ | — | | | $ | 23,228,609 | |
Shares of beneficial interest outstanding, unlimited authorization, no par | | | — | | | | 3,513,118 | |
Net asset value per share | | $ | — | | | $ | 6.61 | |
1 Investments, at cost | | $ | 1,027,489,246 | | | $ | 609,048,375 | |
2 Short-term investments, at cost | | | 38,768,000 | | | | 17,156,998 | |
3 See Note 13 in “Notes to financial statements.” | | | | | | | | |
See accompanying notes, which are an integral part of the financial statements.
37
Statements of operations
Year ended July 31, 2017
| | | | | | | | | | |
| | | Delaware
Corporate
Bond Fund | | Delaware
Extended Duration
Bond Fund |
| | |
Investment Income: | | | | | | | | | | |
Interest | | | $ | 44,050,436 | | | | | $28,537,235 | |
Dividends | | | | 261,274 | | | | | 78,750 | |
| | | | | | | | | | |
| | | | 44,311,710 | | | | | 28,615,985 | |
| | | | | | | | | | |
| | |
Expenses: | | | | | | | | | | |
Management fees | | | | 5,203,092 | | | | | 3,529,368 | |
Distribution expenses – Class A | | | | 732,525 | | | | | 546,823 | |
Distribution expenses – Class C | | | | 1,546,226 | | | | | 304,942 | |
Distribution expenses – Class R | | | | 130,087 | | | | | 107,756 | |
Dividend disbursing and transfer agent fees and expenses | | | | 1,392,620 | | | | | 751,927 | |
Accounting and administration expenses | | | | 323,992 | | | | | 198,839 | |
Legal fees | | | | 123,940 | | | | | 72,174 | |
Registration fees | | | | 118,418 | | | | | 144,147 | |
Reports and statements to shareholders expenses | | | | 92,697 | | | | | 60,599 | |
Trustees’ fees and expenses | | | | 52,205 | | | | | 31,920 | |
Audit and tax fees | | | | 48,946 | | | | | 48,492 | |
Custodian fees | | | | 45,122 | | | | | 30,487 | |
Other | | | | 50,440 | | | | | 36,612 | |
| | | | | | | | | | |
| | | | 9,860,310 | | | | | 5,864,086 | |
Less expenses waived | | | | (46,202 | ) | | | | (256,055 | ) |
Less expense paid indirectly | | | | (1,606 | ) | | | | (767 | ) |
| | | | | | | | | | |
Total operating expenses | | | | 9,812,502 | | | | | 5,607,264 | |
| | | | | | | | | | |
Net Investment Income | | | | 34,499,208 | | | | | 23,008,721 | |
| | | | | | | | | | |
38
| | | | | | | | |
| | | Delaware
Corporate Bond Fund | | | Delaware
Extended Duration
Bond Fund | |
| | |
Net Realized and Unrealized Gain (Loss): | | | | | | | | |
Net realized gain (loss) on: | | | | | | | | |
Investments | | $ | 6,684,422 | | | $ | 1,835,440 | |
Foreign currencies | | | 5,832 | | | | 1,328 | |
Futures contracts | | | 268,698 | | | | (21,474 | ) |
Options purchased | | | (344,448 | ) | | | (68,765 | ) |
Swap contracts | | | (270,411 | ) | | | — | |
| | | | | | | | |
Net realized gain | | | 6,344,093 | | | | 1,746,529 | |
| | | | | | | | |
Net change in unrealized appreciation (depreciation) of: | | | | | | | | |
Investments | | | (12,876,738 | ) | | | (19,071,573 | ) |
Futures contracts | | | — | | | | 124,090 | |
Swap contracts | | | 116,763 | | | | — | |
| | | | | | | | |
Net change in unrealized appreciation (depreciation) | | | (12,759,975 | ) | | | (18,947,483 | ) |
| | | | | | | | |
Net Realized and Unrealized Loss | | | (6,415,882 | ) | | | (17,200,954 | ) |
| | | | | | | | |
Net Increase in Net Assets Resulting from Operations | | $ | 28,083,326 | | | $ | 5,807,767 | |
| | | | | | | | |
See accompanying notes, which are an integral part of the financial statements.
39
Statements of changes in net assets
Delaware Corporate Bond Fund
| | | | | | | | |
| | | Year ended | |
| | | 7/31/17 | | | 7/31/16 | |
Increase (Decrease) in Net Assets from Operations: | | | | | | | | |
Net investment income | | $ | 34,499,208 | | | $ | 40,889,501 | |
Net realized gain (loss) | | | 6,344,093 | | | | (32,945,380 | ) |
Net change in unrealized appreciation (depreciation) | | | (12,759,975 | ) | | | 52,320,079 | |
| | | | | | | | |
Net increase in net assets resulting from operations | | | 28,083,326 | | | | 60,264,200 | |
| | | | | | | | |
| | |
Dividends and Distributions to Shareholders from: | | | | | | | | |
Net investment income: | | | | | | | | |
Class A | | | (10,158,299 | ) | | | (13,714,939 | ) |
Class C | | | (4,215,326 | ) | | | (4,947,954 | ) |
Class R | | | (837,999 | ) | | | (905,876 | ) |
Institutional Class | | | (22,364,628 | ) | | | (24,527,878 | ) |
| | |
Net realized gain: | | | | | | | | |
Class A | | | — | | | | (72,919 | ) |
Class C | | | — | | | | (32,194 | ) |
Class R | | | — | | | | (4,867 | ) |
Institutional Class | | | — | | | | (110,366 | ) |
| | | | | | | | |
| | | (37,576,252 | ) | | | (44,316,993 | ) |
| | | | | | | | |
Capital Share Transactions: | | | | | | | | |
Proceeds from shares sold: | | | | | | | | |
Class A | | | 48,124,502 | | | | 74,940,063 | |
Class C | | | 10,666,333 | | | | 17,081,334 | |
Class R | | | 6,075,370 | | | | 10,126,554 | |
Institutional Class | | | 385,354,541 | | | | 238,689,064 | |
| | |
Net asset value of shares issued upon reinvestment of dividends and distributions: | | | | | | | | |
Class A | | | 9,231,037 | | | | 12,266,547 | |
Class C | | | 3,640,108 | | | | 4,326,651 | |
Class R | | | 837,999 | | | | 910,743 | |
Institutional Class | | | 15,641,975 | | | | 17,812,496 | |
| | | | | | | | |
| | | 479,571,865 | | | | 376,153,452 | |
| | | | | | | | |
40
| | | | | | | | |
| | | Year ended | |
| | | 7/31/17 | | | 7/31/16 | |
(continued) | | | | | | | | |
Capital Share Transactions (continued): | | | | | | | | |
Cost of shares redeemed: | | | | | | | | |
Class A | | $ | (156,641,819 | ) | | $ | (181,824,347 | ) |
Class C | | | (53,930,592 | ) | | | (45,196,503 | ) |
Class R | | | (11,600,664 | ) | | | (10,714,795 | ) |
Institutional Class | | | (295,181,692 | ) | | | (504,697,959 | ) |
| | | | | | | | |
| | | (517,354,767 | ) | | | (742,433,604 | ) |
| | | | | | | | |
Decrease in net assets derived from capital share transactions | | | (37,782,902 | ) | | | (366,280,152 | ) |
| | | | | | | | |
Net Decrease in Net Assets | | | (47,275,828 | ) | | | (350,332,945 | ) |
Net Assets: | | | | | | | | |
Beginning of year | | | 1,138,332,164 | | | | 1,488,665,109 | |
| | | | | | | | |
End of year | | $ | 1,091,056,336 | | | $ | 1,138,332,164 | |
| | | | | | | | |
Undistributed (distributions in excess of) net investment income | | $ | (136,718 | ) | | $ | 20,790 | |
| | | | | | | | |
See accompanying notes, which are an integral part of the financial statements.
41
Statements of changes in net assets
| | |
| Delaware Extended Duration Bond Fund | | |
| | | | | | | | |
| | | Year ended | |
| | | 7/31/17 | | | 7/31/16 | |
Increase (Decrease) in Net Assets from Operations: | | | | | | | | |
Net investment income | | $ | 23,008,721 | | | $ | 22,665,763 | |
Net realized gain (loss) | | | 1,746,529 | | | | (5,614,639 | ) |
Net change in unrealized appreciation (depreciation) | | | (18,947,483 | ) | | | 54,510,499 | |
| | | | | | | | |
Net increase in net assets resulting from operations | | | 5,807,767 | | | | 71,561,623 | |
| | | | | | | | |
| | |
Dividends and Distributions to Shareholders from: | | | | | | | | |
Net investment income: | | | | | | | | |
Class A | | | (7,659,320 | ) | | | (8,060,146 | ) |
Class C | | | (839,177 | ) | | | (904,833 | ) |
Class R | | | (698,302 | ) | | | (836,690 | ) |
Institutional Class | | | (13,975,153 | ) | | | (12,962,354 | ) |
Class R6 | | | (506,083 | ) | | | (7,913 | ) |
| | |
Net realized gain: | | | | | | | | |
Class A | | | — | | | | (349,440 | ) |
Class C | | | — | | | | (52,034 | ) |
Class R | | | — | | | | (39,832 | ) |
Institutional Class | | | — | | | | (530,078 | ) |
| | |
Return of capital: | | | | | | | | |
Class A | | | — | | | | (99,043 | ) |
Class C | | | — | | | | (13,876 | ) |
Class R | | | — | | | | (10,648 | ) |
Institutional Class | | | — | | | | (153,033 | ) |
Class R6 | | | — | | | | (3,526 | ) |
| | | | | | | | |
| | | (23,678,035 | ) | | | (24,023,446 | ) |
| | | | | | | | |
42
| | | | | | | | |
| | | Year ended | |
| | | 7/31/17 | | | 7/31/16 | |
Capital Share Transactions: | | | | | | | | |
Proceeds from shares sold: | | | | | | | | |
Class A | | $ | 55,230,518 | | | $ | 66,062,847 | |
Class C | | | 5,369,433 | | | | 5,838,907 | |
Class R | | | 6,719,692 | | | | 5,881,821 | |
Institutional Class | | | 176,836,364 | | | | 104,015,687 | |
Class R6 | | | 15,013,019 | | | | 8,480,805 | |
| | |
Net asset value of shares issued upon reinvestment of dividends and distributions: | | | | | | | | |
Class A | | | 7,438,369 | | | | 8,220,984 | |
Class C | | | 770,483 | | | | 889,878 | |
Class R | | | 698,302 | | | | 887,170 | |
Institutional Class | | | 13,186,863 | | | | 13,105,599 | |
Class R6 | | | 491,813 | | | | 4,071 | |
| | | | | | | | |
| | | 281,754,856 | | | | 213,387,769 | |
| | | | | | | | |
Cost of shares redeemed: | | | | | | | | |
Class A | | | (99,257,045 | ) | | | (94,248,471 | ) |
Class C | | | (10,611,548 | ) | | | (8,621,363 | ) |
Class R | | | (13,234,769 | ) | | | (9,120,791 | ) |
Institutional Class | | | (159,780,608 | ) | | | (113,840,914 | ) |
Class R6 | | | (1,307,180 | ) | | | (27,699 | ) |
| | | | | | | | |
| | | (284,191,150 | ) | | | (225,859,238 | ) |
| | | | | | | | |
Decrease in net assets derived from capital share transactions | | | (2,436,294 | ) | | | (12,471,469 | ) |
| | | | | | | | |
Net Increase (Decrease) in Net Assets | | | (20,306,562 | ) | | | 35,066,708 | |
Net Assets: | | | | | | | | |
Beginning of year | | | 681,562,155 | | | | 646,495,447 | |
| | | | | | | | |
End of year | | $ | 661,255,593 | | | $ | 681,562,155 | |
| | | | | | | | |
Distributions in excess of net investment income | | $ | (595,199 | ) | | $ | (596,526 | ) |
| | | | | | | | |
See accompanying notes, which are an integral part of the financial statements.
43
Financial highlights
Delaware Corporate Bond Fund Class A
Selected data for each share of the Fund outstanding throughout each period were as follows:
|
| |
|
| |
|
Net asset value, beginning of period |
|
Income (loss) from investment operations: |
Net investment income1 |
Net realized and unrealized gain (loss) |
|
Total from investment operations. |
|
|
Less dividends and distributions from: |
Net investment income |
Net realized gain |
|
Total dividends and distributions |
|
|
Net asset value, end of period |
|
|
Total return3 |
|
Ratios and supplemental data: |
Net assets, end of period (000 omitted) |
Ratio of expenses to average net assets |
Ratio of expenses to average net assets prior to fees waived |
Ratio of net investment income to average net assets |
Ratio of net investment income to average net assets prior to fees waived |
Portfolio turnover |
|
|
| 1 | The average shares outstanding method has been applied for per share information. |
| 2 | For the year ended July 31, 2016, net realized gain distributions of $72,919 were made by the Fund’s Class A, which calculated to a de minimis amount of $(0.001) per share. |
| 3 | Total investment return is based on the change in net asset value of a share during the period and assumes reinvestment of dividends and distributions at net asset value and does not reflect the impact of a sales charge. Total investment return during some of the periods shown reflects waivers by the manager and/or distributor. Performance would have been lower had the waivers not been in effect. |
See accompanying notes, which are an integral part of the financial statements.
| | | | | | | | | | | | | | | | | | | | | | | | | | | | |
| | | | | | | | | | | | | Year ended | | | | | | | | | | | |
| |
| | | 7/31/17 | | | | | 7/31/16 | | | | | 7/31/15 | | | | | 7/31/14 | | | | | 7/31/13 | |
| |
| | $ | 5.94 | | | | | $ | 5.81 | | | | | $ | 6.08 | | | | | $ | 5.95 | | | | | $ | 6.26 | |
| | | | | | | | | |
| | | | | | | | | | | | | | | | | | | | | | | | | | | | |
| | | 0.19 | | | | | | 0.19 | | | | | | 0.21 | | | | | | 0.23 | | | | | | 0.23 | |
| | | (0.03 | ) | | | | | 0.14 | | | | | | (0.19 | ) | | | | | 0.25 | | | | | | (0.10 | ) |
| | | | | | | | | | | | | | | | | | | | | | | | | | | | |
| | | 0.16 | | | | | | 0.33 | | | | | | 0.02 | | | | | | 0.48 | | | | | | 0.13 | |
| | | | | | | | | | | | | | | | | | | | | | | | | | | | |
| | | | | | | | | |
| | | | | | | | | | | | | | | | | | | | | | | | | | | | |
| | | (0.20 | ) | | | | | (0.20 | ) | | | | | (0.23 | ) | | | | | (0.25 | ) | | | | | (0.25 | ) |
| | | — | | | | | | — | 2 | | | | | (0.06 | ) | | | | | (0.10 | ) | | | | | (0.19 | ) |
| | | | | | | | | | | | | | | | | | | | | | | | | | | | |
| | | (0.20 | ) | | | | | (0.20 | ) | | | | | (0.29 | ) | | | | | (0.35 | ) | | | | | (0.44 | ) |
| | | | | | | | | | | | | | | | | | | | | | | | | | | | |
| | | | | | | | | |
| | $ | 5.90 | | | | | $ | 5.94 | | | | | $ | 5.81 | | | | | $ | 6.08 | | | | | $ | 5.95 | |
| | | | | | | | | | | | | | | | | | | | | | | | | | | | |
| | | | | | | | | |
| | | 2.84% | | | | | | 5.91% | | | | | | 0.28% | | | | | | 8.33% | | | | | | 2.02% | |
| | | | | | | | | |
| | | | | | | | | | | | | | | | | | | | | | | | | | | | |
| | | $248,143 | | | | | $ | 352,477 | | | | | | $442,509 | | | | | $ | 511,351 | | | | | $ | 645,585 | |
| | | 0.94% | | | | | | 0.94% | | | | | | 0.95% | | | | | | 0.94% | | | | | | 0.93% | |
| | | 0.94% | | | | | | 0.96% | | | | | | 0.96% | | | | | | 0.96% | | | | | | 0.98% | |
| | | 3.19% | | | | | | 3.28% | | | | | | 3.43% | | | | | | 3.81% | | | | | | 3.70% | |
| | | 3.19% | | | | | | 3.26% | | | | | | 3.42% | | | | | | 3.79% | | | | | | 3.65% | |
| | | 168% | | | | | | 217% | | | | | | 215% | | | | | | 215% | | | | | | 230% | |
| | | | | | | | | | | | | | | | | | | | | | | | | | | | | |
| |
Financial highlights
Delaware Corporate Bond Fund Class C
Selected data for each share of the Fund outstanding throughout each period were as follows:
|
| |
|
| |
|
Net asset value, beginning of period |
|
Income (loss) from investment operations: |
Net investment income1 |
Net realized and unrealized gain (loss) |
|
Total from investment operations. |
|
|
Less dividends and distributions from: |
Net investment income |
Net realized gain |
|
Total dividends and distributions |
|
|
Net asset value, end of period |
|
|
Total return3 |
|
Ratios and supplemental data: |
Net assets, end of period (000 omitted) |
Ratio of expenses to average net assets |
Ratio of expenses to average net assets prior to fees waived |
Ratio of net investment income to average net assets |
Ratio of net investment income to average net assets prior to fees waived |
Portfolio turnover |
|
|
| 1 | The average shares outstanding method has been applied for per share information. |
| 2 | For the year ended July 31, 2016, net realized gain distributions of $32,194 were made by the Fund’s Class C, which calculated to a de minimis amount of $(0.001) per share. |
| 3 | Total investment return is based on the change in net asset value of a share during the period and assumes reinvestment of dividends and distributions at net asset value and does not reflect the impact of a sales charge. Total investment return during some of the periods shown reflects a waiver by the manager. Performance would have been lower had the waiver not been in effect. |
See accompanying notes, which are an integral part of the financial statements.
| | | | | | | | | | | | | | | | | | | | | | | | | | | | | | | | |
| | | Year ended | | | | | | | | | | | |
| |
| | | 7/31/17 | | | | | | | | 7/31/16 | | | | | 7/31/15 | | | | | 7/31/14 | | | | | 7/31/13 | |
| |
| | $ | 5.94 | | | | | | | | | $ | 5.81 | | | | | $ | 6.08 | | | | | $ | 5.96 | | | | | $ | 6.26 | |
| | | | | | | | | | |
| | | | | | | | | | | | | | | | | | | | | | | | | | | | | | | | |
| | | 0.14 | | | | | | | | | | 0.15 | | | | | | 0.16 | | | | | | 0.18 | | | | | | 0.18 | |
| | | (0.02 | ) | | | | | | | | | 0.14 | | | | | | (0.19 | ) | | | | | 0.25 | | | | | | (0.08 | ) |
| | | | | | | | | | | | | | | | | | | | | | | | | | | | | | | | |
| | | 0.12 | | | | | | | | | | 0.29 | | | | | | (0.03 | ) | | | | | 0.43 | | | | | | 0.10 | |
| | | | | | | | | | | | | | | | | | | | | | | | | | | | | | | | |
| | | | | | | | | | |
| | | | | | | | | | | | | | | | | | | | | | | | | | | | | | | | |
| | | (0.16 | ) | | | | | | | | | (0.16 | ) | | | | | (0.18 | ) | | | | | (0.21 | ) | | | | | (0.21 | ) |
| | | — | | | | | | | | | | — | 2 | | | | | (0.06 | ) | | | | | (0.10 | ) | | | | | (0.19 | ) |
| | | | | | | | | | | | | | | | | | | | | | | | | | | | | | | | |
| | | (0.16 | ) | | | | | | | | | (0.16 | ) | | | | | (0.24 | ) | | | | | (0.31 | ) | | | | | (0.40 | ) |
| | | | | | | | | | | | | | | | | | | | | | | | | | | | | | | | |
| | | | | | | | | | |
| | $ | 5.90 | | | | | | | | | $ | 5.94 | | | | | $ | 5.81 | | | | | $ | 6.08 | | | | | $ | 5.96 | |
| | | | | | | | | | | | | | | | | | | | | | | | | | | | | | | | |
| | | | | | | | | | |
| | | 2.07% | | | | | | | | | | 5.12% | | | | | | (0.48%) | | | | | | 7.35% | | | | | | 1.43% | |
| | | | | | | | | | |
| | | | | | | | | | | | | | | | | | | | | | | | | | | | | | | | |
| | $ | 131,520 | | | | | | | | | $ | 173,057 | | | | | $ | 193,746 | | | | | $ | 209,893 | | | | | $ | 273,594 | |
| | | 1.69% | | | | | | | | | | 1.69% | | | | | | 1.70% | | | | | | 1.69% | | | | | | 1.68% | |
| | | 1.69% | | | | | | | | | | 1.71% | | | | | | 1.71% | | | | | | 1.70% | | | | | | 1.68% | |
| | | 2.44% | | | | | | | | | | 2.53% | | | | | | 2.68% | | | | | | 3.06% | | | | | | 2.95% | |
| | | 2.44% | | | | | | | | | | 2.51% | | | | | | 2.67% | | | | | | 3.05% | | | | | | 2.95% | |
| | | 168% | | | | | | | | | | 217% | | | | | | 215% | | | | | | 215% | | | | | | 230% | |
| | | | | | | | | | | | | | | | | | | | | | | | | | | | | | | | |
| |
Financial highlights
Delaware Corporate Bond Fund Class R
Selected data for each share of the Fund outstanding throughout each period were as follows:
|
| |
|
| |
|
Net asset value, beginning of period |
|
Income (loss) from investment operations: |
Net investment income1 |
Net realized and unrealized gain (loss) |
|
Total from investment operations. |
|
|
Less dividends and distributions from: |
Net investment income |
Net realized gain |
|
Total dividends and distributions |
|
|
Net asset value, end of period |
|
|
Total return3 |
|
Ratios and supplemental data: |
Net assets, end of period (000 omitted) |
Ratio of expenses to average net assets |
Ratio of expenses to average net assets prior to fees waived |
Ratio of net investment income to average net assets |
Ratio of net investment income to average net assets prior to fees waived |
Portfolio turnover |
| |
|
| 1 | The average shares outstanding method has been applied for per share information. |
| 2 | For the year ended July 31, 2016, net realized gain distributions of $4,867 were made by the Fund’s Class R, which calculated to a de minimis amount of $(0.001) per share. |
| 3 | Total investment return is based on the change in net asset value of a share during the period and assumes reinvestment of dividends and distributions at net asset value. Total investment return during some of the periods shown reflects waivers by the manager and/or distributor. Performance would have been lower had the waivers not been in effect. |
See accompanying notes, which are an integral part of the financial statements.
| | | | | | | | | | | | | | | | | | | | | | | | | | | | |
| Year ended | |
| |
| | | 7/31/17 | | | | | 7/31/16 | | | | | 7/31/15 | | | | | 7/31/14 | | | | | 7/31/13 | |
| |
| | $ | 5.94 | | | | | $ | 5.82 | | | | | $ | 6.09 | | | | | $ | 5.96 | | | | | $ | 6.27 | |
| | | | | | | | | |
| | | | | | | | | | | | | | | | | | | | | | | | | | | | |
| | | 0.17 | | | | | | 0.17 | | | | | | 0.19 | | | | | | 0.21 | | | | | | 0.21 | |
| | | (0.02 | ) | | | | | 0.14 | | | | | | (0.19 | ) | | | | | 0.26 | | | | | | (0.09 | ) |
| | | | | | | | | | | | | | | | | | | | | | | | | | | | |
| | | 0.15 | | | | | | 0.31 | | | | | | — | | | | | | 0.47 | | | | | | 0.12 | |
| | | | | | | | | | | | | | | | | | | | | | | | | | | | |
| | | | | | | | | |
| | | | | | | | | | | | | | | | | | | | | | | | | | | | |
| | | (0.19 | ) | | | | | (0.19 | ) | | | | | (0.21 | ) | | | | | (0.24 | ) | | | | | (0.24 | ) |
| | | — | | | | | | — | 2 | | | | | (0.06 | ) | | | | | (0.10 | ) | | | | | (0.19 | ) |
| | | | | | | | | | | | | | | | | | | | | | | | | | | | |
| | | (0.19 | ) | | | | | (0.19 | ) | | | | | (0.27 | ) | | | | | (0.34 | ) | | | | | (0.43 | ) |
| | | | | | | | | | | | | | | | | | | | | | | | | | | | |
| | | | | | | | | |
| | $ | 5.90 | | | | | $ | 5.94 | | | | | $ | 5.82 | | | | | $ | 6.09 | | | | | $ | 5.96 | |
| | | | | | | | | | | | | | | | | | | | | | | | | | | | |
| | | | | | | | | |
| | | 2.58% | | | | | | 5.47% | | | | | | 0.03% | | | | | | 8.06% | | | | | | 1.77% | |
| | | | | | | | | |
| | | | | | | | | | | | | | | | | | | | | | | | | | | | |
| | $ | 24,207 | | | | | $ | 29,149 | | | | | $ | 28,245 | | | | | $ | 35,142 | | | | | $ | 37,293 | |
| | | 1.19% | | | | | | 1.19% | | | | | | 1.20% | | | | | | 1.19% | | | | | | 1.18% | |
| | | 1.19% | | | | | | 1.21% | | | | | | 1.21% | | | | | | 1.22% | | | | | | 1.28% | |
| | | 2.94% | | | | | | 3.03% | | | | | | 3.18% | | | | | | 3.56% | | | | | | 3.45% | |
| | | 2.94% | | | | | | 3.01% | | | | | | 3.17% | | | | | | 3.53% | | | | | | 3.35% | |
| | | 168% | | | | | | 217% | | | | | | 215% | | | | | | 215% | | | | | | 230% | |
| | | | | | | | | | | | | | | | | | | | | | | | | | | | |
|
| |
Financial highlights
Delaware Corporate Bond Fund Institutional Class
Selected data for each share of the Fund outstanding throughout each period were as follows:
|
| |
|
| |
|
Net asset value, beginning of period |
|
Income (loss) from investment operations: |
Net investment income1 |
Net realized and unrealized gain (loss) |
|
Total from investment operations. |
|
|
Less dividends and distributions from: |
Net investment income |
Net realized gain |
|
Total dividends and distributions |
|
|
Net asset value, end of period |
|
|
Total return3 |
|
Ratios and supplemental data: |
Net assets, end of period (000 omitted) |
Ratio of expenses to average net assets |
Ratio of expenses to average net assets prior to fees waived |
Ratio of net investment income to average net assets |
Ratio of net investment income to average net assets prior to fees waived |
Portfolio turnover |
|
|
| 1 | The average shares outstanding method has been applied for per share information. |
| 2 | For the year ended July 31, 2016, net realized gain distributions of $110,366 were made by the Fund’s Institutional Class, which calculated to a de minimis amount of $(0.001) per share. |
| 3 | Total investment return is based on the change in net asset value of a share during the period and assumes reinvestment of dividends and distributions at net asset value. Total investment return during some of the periods shown reflects a waiver by the manager. Performance would have been lower had the waiver not been in effect. |
See accompanying notes, which are an integral part of the financial statements.
| | | | | | | | | | | | | | | | | | | | | | | | | | | | |
| Year ended | |
| |
| | | 7/31/17 | | | | | 7/31/16 | | | | | 7/31/15 | | | | | 7/31/14 | | | | | 7/31/13 | |
| |
| | $ | 5.94 | | | | | $ | 5.81 | | | | | $ | 6.08 | | | | | $ | 5.95 | | | | | $ | 6.26 | |
| | | | | | | | | |
| | | | | | | | | | | | | | | | | | | | | | | | | | | | |
| | | 0.20 | | | | | | 0.20 | | | | | | 0.22 | | | | | | 0.24 | | | | | | 0.25 | |
| | | (0.02 | ) | | | | | 0.15 | | | | | | (0.19 | ) | | | | | 0.26 | | | | | | (0.10 | ) |
| | | | | | | | | | | | | | | | | | | | | | | | | | | | |
| | | 0.18 | | | | | | 0.35 | | | | | | 0.03 | | | | | | 0.50 | | | | | | 0.15 | |
| | | | | | | | | | | | | | | | | | | | | | | | | | | | |
| | | | | | | | | |
| | | | | | | | | | | | | | | | | | | | | | | | | | | | |
| | | (0.22 | ) | | | | | (0.22 | ) | | | | | (0.24 | ) | | | | | (0.27 | ) | | | | | (0.27 | ) |
| | | — | | | | | | — | 2 | | | | | (0.06 | ) | | | | | (0.10 | ) | | | | | (0.19 | ) |
| | | | | | | | | | | | | | | | | | | | | | | | | | | | |
| | | (0.22 | ) | | | | | (0.22 | ) | | | | | (0.30 | ) | | | | | (0.37 | ) | | | | | (0.46 | ) |
| | | | | | | | | | | | | | | | | | | | | | | | | | | | |
| | | | | | | | | |
| | $ | 5.90 | | | | | $ | 5.94 | | | | | $ | 5.81 | | | | | $ | 6.08 | | | | | $ | 5.95 | |
| | | | | | | | | | | | | | | | | | | | | | | | | | | | |
| | | | | | | | | |
| | | 3.09% | | | | | | 6.18% | | | | | | 0.52% | | | | | | 8.60% | | | | | | 2.28% | |
| | | | | | | | | |
| | | | | | | | | | | | | | | | | | | | | | | | | | | | |
| | $ | 687,186 | | | | | $ | 583,649 | | | | | $ | 824,165 | | | | | $ | 468,205 | | | | | $ | 518,576 | |
| | | 0.69% | | | | | | 0.69% | | | | | | 0.70% | | | | | | 0.69% | | | | | | 0.68% | |
| | | 0.69% | | | | | | 0.71% | | | | | | 0.71% | | | | | | 0.70% | | | | | | 0.68% | |
| | | 3.44% | | | | | | 3.53% | | | | | | 3.68% | | | | | | 4.06% | | | | | | 3.95% | |
| | | 3.44% | | | | | | 3.51% | | | | | | 3.67% | | | | | | 4.05% | | | | | | 3.95% | |
| | | 168% | | | | | | 217% | | | | | | 215% | | | | | | 215% | | | | | | 230% | |
| | | | | | | | | | | | | | | | | | | | | | | | | | | | |
|
| |
Financial highlights
Delaware Extended Duration Bond Fund Class A
Selected data for each share of the Fund outstanding throughout each period were as follows:
|
| |
| |
|
Net asset value, beginning of period |
|
Income (loss) from investment operations: |
Net investment income1 |
Net realized and unrealized gain (loss) |
|
Total from investment operations. |
|
|
Less dividends and distributions from: |
Net investment income |
Net realized gain |
Return of capital |
|
Total dividends and distributions |
|
|
Net asset value, end of period |
|
|
Total return3 |
|
Ratios and supplemental data: |
Net assets, end of period (000 omitted) |
Ratio of expenses to average net assets |
Ratio of expenses to average net assets prior to fees waived |
Ratio of net investment income to average net assets |
Ratio of net investment income to average net assets prior to fees waived |
Portfolio turnover |
|
|
| 1 | The average shares outstanding method has been applied for per share information. |
| 2 | For the year ended July 31, 2016, return of capital distributions of $99,043 were made by the Fund’s Class A, which calculated to a de minimis amount of $(0.003) per share. |
| 3 | Total investment return is based on the change in net asset value of a share during the period and assumes reinvestment of dividends and distributions at net asset value and does not reflect the impact of a sales charge. Total investment return during all of the periods shown reflects waivers by the manager and/or distributor. Performance would have been lower had the waivers not been in effect. |
See accompanying notes, which are an integral part of the financial statements.
| | | | | | | | | | | | | | | | | | | | | | | | | | | | |
| Year ended | |
| |
| | | 7/31/17 | | | | | 7/31/16 | | | | | 7/31/15 | | | | | 7/31/14 | | | | | 7/31/13 | |
| |
| | $ | 6.79 | | | | | $ | 6.29 | | | | | $ | 6.81 | | | | | $ | 6.28 | | | | | $ | 7.15 | |
| | | | | | | | | |
| | | | | | | | | | | | | | | | | | | | | | | | | | | | |
| | | 0.22 | | | | | | 0.23 | | | | | | 0.26 | | | | | | 0.28 | | | | | | 0.28 | |
| | | (0.16 | ) | | | | | 0.51 | | | | | | (0.21 | ) | | | | | 0.54 | | | | | | (0.42 | ) |
| | | | | | | | | | | | | | | | | | | | | | | | | | | | |
| | | 0.06 | | | | | | 0.74 | | | | | | 0.05 | | | | | | 0.82 | | | | | | (0.14 | ) |
| | | | | | | | | | | | | | | | | | | | | | | | | | | | |
| | | | | | | | | |
| | | | | | | | | | | | | | | | | | | | | | | | | | | | |
| | | (0.23 | ) | | | | | (0.23 | ) | | | | | (0.27 | ) | | | | | (0.29 | ) | | | | | (0.29 | ) |
| | | — | | | | | | (0.01 | ) | | | | | (0.30 | ) | | | | | — | | | | | | (0.44 | ) |
| | | — | | | | | | — | 2 | | | | | — | | | | | | — | | | | | | — | |
| | | | | | | | | | | | | | | | | | | | | | | | | | | | |
| | | (0.23 | ) | | | | | (0.24 | ) | | | | | (0.57 | ) | | | | | (0.29 | ) | | | | | (0.73 | ) |
| | | | | | | | | | | | | | | | | | | | | | | | | | | | |
| | | | | | | | | |
| | $ | 6.62 | | | | | $ | 6.79 | | | | | $ | 6.29 | | | | | $ | 6.81 | | | | | $ | 6.28 | |
| | | | | | | | | | | | | | | | | | | | | | | | | | | | |
| | | | | | | | | |
| | | 0.97% | | | | | | 12.14% | | | | | | 0.53% | | | | | | 13.42% | | | | | | (2.45%) | |
| | | | | | | | | |
| | | | | | | | | | | | | | | | | | | | | | | | | | | | |
| | $ | 196,754 | | | | | $ | 241,190 | | | | | $ | 244,514 | | | | | $ | 277,041 | | | | | $ | 370,553 | |
| | | 0.96% | | | | | | 0.96% | | | | | | 0.98% | | | | | | 0.96% | | | | | | 0.95% | |
| | | 1.00% | | | | | | 1.00% | | | | | | 1.02% | | | | | | 1.01% | | | | | | 1.04% | |
| | | 3.40% | | | | | | 3.60% | | | | | | 3.89% | | | | | | 4.35% | | | | | | 4.13% | |
| | | 3.36% | | | | | | 3.56% | | | | | | 3.85% | | | | | | 4.30% | | | | | | 4.04% | |
| | | 187% | | | | | | 219% | | | | | | 185% | | | | | | 216% | | | | | | 217% | |
| | | | | | | | | | | | | | | | | | | | | | | | | | | | |
| |
Financial highlights
Delaware Extended Duration Bond Fund Class C
Selected data for each share of the Fund outstanding throughout each period were as follows:
|
| |
|
| |
|
Net asset value, beginning of period |
|
Income (loss) from investment operations: |
Net investment income1 |
Net realized and unrealized gain (loss) |
|
Total from investment operations. |
|
|
Less dividends and distributions from: |
Net investment income |
Net realized gain |
Return of capital |
|
Total dividends and distributions |
|
|
Net asset value, end of period |
|
|
Total return3 |
|
Ratios and supplemental data: |
Net assets, end of period (000 omitted) |
Ratio of expenses to average net assets |
Ratio of expenses to average net assets prior to fees waived |
Ratio of net investment income to average net assets |
Ratio of net investment income to average net assets prior to fees waived |
Portfolio turnover |
|
|
| 1 | The average shares outstanding method has been applied for per share information. |
| 2 | For the year ended July 31, 2016, return of capital distributions of $13,876 were made by the Fund’s Class C, which calculated to a de minimis amount of $(0.003) per share. |
| 3 | Total investment return is based on the change in net asset value of a share during the period and assumes reinvestment of dividends and distributions at net asset value and does not reflect the impact of a sales charge. Total investment return during all of the periods shown reflects a waiver by the manager. Performance would have been lower had the waiver not been in effect. |
See accompanying notes, which are an integral part of the financial statements.
| | | | | | | | | | | | | | | | | | | | | | | | | | | | |
| | | | | | | | | | | | | Year ended | | | | | | | | | | | |
| |
| | | 7/31/17 | | | | | 7/31/16 | | | | | 7/31/15 | | | | | 7/31/14 | | | | | 7/31/13 | |
| |
| | $ | 6.78 | | | | | $ | 6.29 | | | | | $ | 6.81 | | | | | $ | 6.28 | | | | | $ | 7.15 | |
| | | | | | | | | |
| | | | | | | | | | | | | | | | | | | | | | | | | | | | |
| | | 0.17 | | | | | | 0.18 | | | | | | 0.21 | | | | | | 0.23 | | | | | | 0.23 | |
| | | (0.16 | ) | | | | | 0.50 | | | | | | (0.21 | ) | | | | | 0.54 | | | | | | (0.42 | ) |
| | | | | | | | | | | | | | | | | | | | | | | | | | | | |
| | | 0.01 | | | | | | 0.68 | | | | | | — | | | | | | 0.77 | | | | | | (0.19 | ) |
| | | | | | | | | | | | | | | | | | | | | | | | | | | | |
| | | | | | | | | |
| | | | | | | | | | | | | | | | | | | | | | | | | | | | |
| | | (0.18 | ) | | | | | (0.18 | ) | | | | | (0.22 | ) | | | | | (0.24 | ) | | | | | (0.24 | ) |
| | | — | | | | | | (0.01 | ) | | | | | (0.30 | ) | | | | | — | | | | | | (0.44 | ) |
| | | — | | | | | | — | 2 | | | | | — | | | | | | — | | | | | | — | |
| | | | | | | | | | | | | | | | | | | | | | | | | | | | |
| | | (0.18 | ) | | | | | (0.19 | ) | | | | | (0.52 | ) | | | | | (0.24 | ) | | | | | (0.68 | ) |
| | | | | | | | | | | | | | | | | | | | | | | | | | | | |
| | | | | | | | | |
| | $ | 6.61 | | | | | $ | 6.78 | | | | | $ | 6.29 | | | | | $ | 6.81 | | | | | $ | 6.28 | |
| | | | | | | | | | | | | | | | | | | | | | | | | | | | |
| | | | | | | | | |
| | | 0.21% | | | | | | 11.14% | | | | | | (0.22%) | | | | | | 12.59% | | | | | | (3.17%) | |
| | | | | | | | | |
| | | | | | | | | | | | | | | | | | | | | | | | | | | | |
| | $ | 28,265 | | | | | $ | 33,777 | | | | | $ | 33,323 | | | | | $ | 30,091 | | | | | $ | 47,326 | |
| | | 1.71% | | | | | | 1.71% | | | | | | 1.73% | | | | | | 1.71% | | | | | | 1.70% | |
| | | 1.75% | | | | | | 1.75% | | | | | | 1.77% | | | | | | 1.75% | | | | | | 1.74% | |
| | | 2.65% | | | | | | 2.85% | | | | | | 3.14% | | | | | | 3.60% | | | | | | 3.38% | |
| | | 2.61% | | | | | | 2.81% | | | | | | 3.10% | | | | | | 3.56% | | | | | | 3.34% | |
| | | 187% | | | | | | 219% | | | | | | 185% | | | | | | 216% | | | | | | 217% | |
| | | | | | | | | | | | | | | | | | | | | | | | | | | | |
| |
Financial highlights
Delaware Extended Duration Bond Fund Class R
Selected data for each share of the Fund outstanding throughout each period were as follows:
|
| |
|
| |
|
Net asset value, beginning of period |
|
Income (loss) from investment operations: |
Net investment income1 |
Net realized and unrealized gain (loss) |
|
Total from investment operations. |
|
|
Less dividends and distributions from: |
Net investment income |
Net realized gain |
Return of capital |
|
Total dividends and distributions |
|
|
Net asset value, end of period |
|
|
Total return3 |
|
Ratios and supplemental data: |
Net assets, end of period (000 omitted) |
Ratio of expenses to average net assets |
Ratio of expenses to average net assets prior to fees waived |
Ratio of net investment income to average net assets |
Ratio of net investment income to average net assets prior to fees waived |
Portfolio turnover |
|
|
| 1 | The average shares outstanding method has been applied for per share information. |
| 2 | For the year ended July 31, 2016, return of capital distributions of $10,648 were made by the Fund’s Class R, which calculated to a de minimis amount of $(0.003) per share. |
| 3 | Total investment return is based on the change in net asset value of a share during the period and assumes reinvestment of dividends and distributions at net asset value. Total investment return during all of the periods shown reflects waivers by the manager and/or distributor. Performance would have been lower had the waivers not been in effect. |
See accompanying notes, which are an integral part of the financial statements.
| | | | | | | | | | | | | | | | | | | | | | | | | | | | |
| | | | | | | | | | | | | Year ended | | | | | | | | | | | |
| |
| | | 7/31/17 | | | | | 7/31/16 | | | | | 7/31/15 | | | | | 7/31/14 | | | | | 7/31/13 | |
| |
| | $ | 6.80 | | | | | $ | 6.30 | | | | | $ | 6.82 | | | | | $ | 6.29 | | | | | $ | 7.16 | |
| | | | | | | | | |
| | | | | | | | | | | | | | | | | | | | | | | | | | | | |
| | | 0.20 | | | | | | 0.21 | | | | | | 0.24 | | | | | | 0.27 | | | | | | 0.26 | |
| | | (0.16 | ) | | | | | 0.51 | | | | | | (0.22 | ) | | | | | 0.53 | | | | | | (0.42 | ) |
| | | | | | | | | | | | | | | | | | | | | | | | | | | | |
| | | 0.04 | | | | | | 0.72 | | | | | | 0.02 | | | | | | 0.80 | | | | | | (0.16 | ) |
| | | | | | | | | | | | | | | | | | | | | | | | | | | | |
| | | | | | | | | |
| | | | | | | | | | | | | | | | | | | | | | | | | | | | |
| | | (0.21 | ) | | | | | (0.21 | ) | | | | | (0.25 | ) | | | | | (0.27 | ) | | | | | (0.27 | ) |
| | | — | | | | | | (0.01 | ) | | | | | (0.29 | ) | | | | | — | | | | | | (0.44 | ) |
| | | — | | | | | | — | 2 | | | | | — | | | | | | — | | | | | | — | |
| | | | | | | | | | | | | | | | | | | | | | | | | | | | |
| | | (0.21 | ) | | | | | (0.22 | ) | | | | | (0.54 | ) | | | | | (0.27 | ) | | | | | (0.71 | ) |
| | | | | | | | | | | | | | | | | | | | | | | | | | | | |
| | | | | | | | | |
| | $ | 6.63 | | | | | $ | 6.80 | | | | | $ | 6.30 | | | | | $ | 6.82 | | | | | $ | 6.29 | |
| | | | | | | | | | | | | | | | | | | | | | | | | | | | |
| | | | | | | | | |
| | | 0.71% | | | | | | 11.84% | | | | | | 0.29% | | | | | | 13.13% | | | | | | (2.68%) | |
| | | | | | | | | |
| | | | | | | | | | | | | | | | | | | | | | | | | | | | |
| | $ | 19,294 | | | | | $ | 25,965 | | | | | $ | 26,449 | | | | | $ | 34,545 | | | | | $ | 29,423 | |
| | | 1.21% | | | | | | 1.21% | | | | | | 1.23% | | | | | | 1.21% | | | | | | 1.20% | |
| | | 1.25% | | | | | | 1.25% | | | | | | 1.27% | | | | | | 1.27% | | | | | | 1.34% | |
| | | 3.15% | | | | | | 3.35% | | | | | | 3.64% | | | | | | 4.10% | | | | | | 3.88% | |
| | | 3.11% | | | | | | 3.31% | | | | | | 3.60% | | | | | | 4.04% | | | | | | 3.74% | |
| | | 187% | | | | | | 219% | | | | | | 185% | | | | | | 216% | | | | | | 217% | |
| | | | | | | | | | | | | | | | | | | | | | | | | | | | |
| |
Financial highlights
Delaware Extended Duration Bond Fund Institutional Class
Selected data for each share of the Fund outstanding throughout each period were as follows:
|
| |
|
| |
|
Net asset value, beginning of period |
|
Income (loss) from investment operations: |
Net investment income1 |
Net realized and unrealized gain (loss) |
|
Total from investment operations. |
|
|
Less dividends and distributions from: |
Net investment income |
Net realized gain |
Return of capital |
|
Total dividends and distributions |
|
|
Net asset value, end of period |
|
|
Total return3 |
|
Ratios and supplemental data: |
Net assets, end of period (000 omitted) |
Ratio of expenses to average net assets |
Ratio of expenses to average net assets prior to fees waived |
Ratio of net investment income to average net assets |
Ratio of net investment income to average net assets prior to fees waived |
Portfolio turnover |
|
|
| 1 | The average shares outstanding method has been applied for per share information. |
| 2 | For the year ended July 31, 2016, return of capital distributions of $153,033 were made by the Fund’s Institutional Class, which calculated to a de minimis amount of $(0.003) per share. |
| 3 | Total investment return is based on the change in net asset value of a share during the period and assumes reinvestment of dividends and distributions at net asset value. Total investment return during all of the periods shown reflects a waiver by the manager. Performance would have been lower had the waiver not been in effect. |
See accompanying notes, which are an integral part of the financial statements.
| | | | | | | | | | | | | | | | | | | | | | | | | | | | |
| | | | | | | | | | | | | Year ended | | | | | | | | | | | |
| |
| | | 7/31/17 | | | | | 7/31/16 | | | | | 7/31/15 | | | | | 7/31/14 | | | | | 7/31/13 | |
| |
| | $ | 6.78 | | | | | $ | 6.28 | | | | | $ | 6.80 | | | | | $ | 6.27 | | | | | $ | 7.14 | |
| | | | | | | | | |
| | | | | | | | | | | | | | | | | | | | | | | | | | | | |
| | | 0.24 | | | | | | 0.24 | | | | | | 0.27 | | | | | | 0.30 | | | | | | 0.30 | |
| | | (0.17 | ) | | | | | 0.51 | | | | | | (0.21 | ) | | | | | 0.54 | | | | | | (0.43 | ) |
| | | | | | | | | | | | | | | | | | | | | | | | | | | | |
| | | 0.07 | | | | | | 0.75 | | | | | | 0.06 | | | | | | 0.84 | | | | | | (0.13 | ) |
| | | | | | | | | | | | | | | | | | | | | | | | | | | | |
| | | | | | | | | |
| | | | | | | | | | | | | | | | | | | | | | | | | | | | |
| | | (0.24 | ) | | | | | (0.24 | ) | | | | | (0.28 | ) | | | | | (0.31 | ) | | | | | (0.30 | ) |
| | | — | | | | | | (0.01 | ) | | | | | (0.30 | ) | | | | | — | | | | | | (0.44 | ) |
| | | — | | | | | | — | 2 | | | | | — | | | | | | — | | | | | | — | |
| | | | | | | | | | | | | | | | | | | | | | | | | | | | |
| | | (0.24 | ) | | | | | (0.25 | ) | | | | | (0.58 | ) | | | | | (0.31 | ) | | | | | (0.74 | ) |
| | | | | | | | | | | | | | | | | | | | | | | | | | | | |
| | | | | | | | | |
| | $ | 6.61 | | | | | $ | 6.78 | | | | | $ | 6.28 | | | | | $ | 6.80 | | | | | $ | 6.27 | |
| | | | | | | | | | | | | | | | | | | | | | | | | | | | |
| | | | | | | | | |
| | | 1.21% | | | | | | 12.26% | | | | | | 0.78% | | | | | | 13.72% | | | | | | (2.21%) | |
| | | | | | | | | |
| | | | | | | | | | | | | | | | | | | | | | | | | | | | |
| | $ | 393,714 | | | | | $ | 372,052 | | | | | $ | 342,209 | | | | | $ | 307,039 | | | | | $ | 304,299 | |
| | | 0.71% | | | | | | 0.71% | | | | | | 0.73% | | | | | | 0.71% | | | | | | 0.70% | |
| | | 0.75% | | | | | | 0.75% | | | | | | 0.77% | | | | | | 0.75% | | | | | | 0.74% | |
| | | 3.65% | | | | | | 3.85% | | | | | | 4.14% | | | | | | 4.60% | | | | | | 4.38% | |
| | | 3.61% | | | | | | 3.81% | | | | | | 4.10% | | | | | | 4.56% | | | | | | 4.34% | |
| | | 187% | | | | | | 219% | | | | | | 185% | | | | | | 216% | | | | | | 217% | |
| | | | | | | | | | | | | | | | | | | | | | | | | | | | |
| |
Financial highlights
Delaware Extended Duration Bond Fund Class R6
Selected data for each share of the Fund outstanding throughout each period were as follows:
| | | | | | | | |
| | |
| | | | | | | | |
| | |
| | | | | | 5/2/161 | |
| | | Year ended | | | to | |
| | | 7/31/17 | | | 7/31/16 | |
| |
Net asset value, beginning of period | | $ | 6.78 | | | $ | 6.38 | |
| | |
Income (loss) from investment operations: | | | | | | | | |
Net investment income2 | | | 0.24 | | | | 0.23 | |
Net realized and unrealized gain (loss) | | | (0.16 | ) | | | 0.23 | |
| | | | | | | | |
Total from investment operations | | | 0.08 | | | | 0.46 | |
| | | | | | | | |
| | |
Less dividends and distributions from: | | | | | | | | |
Net investment income | | | (0.25 | ) | | | (0.06 | ) |
Return of capital | | | — | | | | — | 3 |
| | | | | | | | |
Total dividends and distributions | | | (0.25 | ) | | | (0.06 | ) |
| | | | | | | | |
| | |
Net asset value, end of period | | $ | 6.61 | | | $ | 6.78 | |
| | | | | | | | |
| | |
Total return4 | | | 1.29% | | | | 7.20% | |
| | |
Ratios and supplemental data: | | | | | | | | |
Net assets, end of period (000 omitted) | | $ | 23,229 | | | $ | 8,578 | |
Ratio of expenses to average net assets | | | 0.63% | | | | 0.63% | |
Ratio of expenses to average net assets prior to fees waived | | | 0.67% | | | | 0.65% | |
Ratio of net investment income to average net assets | | | 3.73% | | | | 3.40% | |
Ratio of net investment income to average net assets prior to fees waived | | | 3.69% | | | | 3.38% | |
Portfolio turnover | | | 187% | | | | 219% | 5 |
| | | | | | | | |
| |
| 1 | Date of commencement of operations; ratios have been annualized and total return has not been annualized. |
| 2 | The average shares outstanding method has been applied for per share information. |
| 3 | For the year ended July 31, 2016, return of capital distributions of $3,526 were made by the Fund’s Class R6, which calculated to a de minimis amount of $(0.003) per share. |
| 4 | Total investment return is based on the change in net asset value of a share during the period and assumes reinvestment of dividends and distributions at net asset value. Total investment return during the periods shown reflects a waiver by the manager. Performance would have been lower had the waivers not been in effect. |
| 5 | Portfolio turnover is representative of the Fund for the year ended July 31, 2016. |
See accompanying notes, which are an integral part of the financial statements.
| | |
| Notes to financial statements | | |
Delaware Corporate Bond Fund and Delaware Extended Duration Bond Fund July 31, 2017 | | |
Delaware Group® Income Funds (Trust) is organized as a Delaware statutory trust and offers four series: Delaware Corporate Bond Fund, Delaware Floating Rate Fund (formerly, Delaware Diversified Floating Rate Fund), Delaware Extended Duration Bond Fund, and Delaware High-Yield Opportunities Fund. These financial statements and the related notes pertain to Delaware Corporate Bond Fund and Delaware Extended Duration Bond Fund (each, a Fund or collectively, the Funds). The Trust is an open-end investment company. The Funds are considered diversified under the Investment Company Act of 1940, as amended (1940 Act), and offer Class A, Class C, Class R, and Institutional Class shares. Delaware Extended Duration Bond Fund also offers Class R6 shares. Class A shares are sold with a maximum front-end sales charge of 4.50%. Class A share purchases of $1,000,000 or more will incur a contingent deferred sales charge (CDSC) instead of a front-end sales charge of 1.00%, if redeemed during the first year and 0.50% during the second year, provided that Delaware Distributors, L.P. (DDLP) paid a financial advisor a commission on the purchase of those shares. Class C shares are sold with a CDSC of 1.00%, if redeemed during the first 12 months. Class R, Institutional Class, and Class R6 shares are not subject to a sales charge and are offered for sale exclusively to certain eligible investors. In addition, Class R6 shares do not pay any service fees, sub-accounting fees, and/or sub-transfer agency fees.
The investment objective of the Funds is to seek to provide investors with total return.
1. Significant Accounting Policies
The following accounting policies are in accordance with US generally accepted accounting principles (US GAAP) and are consistently followed by the Funds.
Security Valuation – Equity securities, except those traded on the Nasdaq Stock Market LLC (Nasdaq), are valued at the last quoted sales price as of the time of the regular close of the New York Stock Exchange on the valuation date. Equity securities traded on the Nasdaq are valued in accordance with the Nasdaq Official Closing Price, which may not be the last sales price. If, on a particular day, an equity security does not trade, the mean between the bid and ask prices will be used, which approximates fair value. US government and agency securities are valued at the mean between the bid and ask prices, which approximates fair value. Other debt securities and credit default swap (CDS) contracts are valued based upon valuations provided by an independent pricing service or broker/counterparty and reviewed by management. To the extent current market prices are not available, the pricing service may take into account developments related to the specific security, as well as transactions in comparable securities. Valuations for fixed income securities utilize matrix systems, which reflect such factors as security prices, yields, maturities, and ratings, and are supplemented by dealer and exchange quotations. Swap prices are derived using daily swap curves and models that incorporate a number of market data factors, such as discounted cash flows, trades, and values of the underlying reference instruments. Futures contracts and options on futures contracts are valued at the daily quoted settlement prices. Generally, other securities and assets for which market quotations are not readily available are valued at fair value as determined in good faith under the direction of the Trust’s Board of Trustees (Board). In determining whether market quotations are readily available or fair valuation will be used, various factors will be taken into consideration, such as market closures or suspension of trading in a security.
| | |
| Notes to financial statements | | |
| Delaware Corporate Bond Fund and Delaware Extended Duration Bond Fund | | |
1. Significant Accounting Policies (continued)
Federal Income Taxes – No provision for federal income taxes has been made as each Fund intends to continue to qualify for federal income tax purposes as a regulated investment company under Subchapter M of the Internal Revenue Code of 1986, as amended, and make the requisite distributions to shareholders. The Funds evaluate tax positions taken or expected to be taken in the course of preparing the Funds’ tax returns to determine whether the tax positions are “more-likely-than-not” of being sustained by the applicable tax authority. Tax positions not deemed to meet the “more-likely-than-not” threshold are recorded as a tax benefit or expense in the current year. Management has analyzed each Fund’s tax positions taken or to be taken on the Funds’ federal income tax returns through the year ended July 31, 2017 and for all open tax years (years ended July 31, 2014–July 31, 2016), and has concluded that no provision for federal income tax is required in the Funds’ financial statements. If applicable, each Fund recognizes interest accrued on unrecognized tax benefits in interest expense and penalties in other expenses on the “Statements of operations.”
Class Accounting – Investment income and common expenses are allocated to the various classes of each Fund on the basis of “settled shares” of each class in relation to the net assets of each Fund. Realized and unrealized gain (loss) on investments are allocated to the various classes of each Fund on the basis of daily net assets of each class. Distribution expenses relating to a specific class are charged directly to that class. Class R6 shares will not be allocated any expenses related to service fees, sub-accounting fees, and/or sub-transfer agency fees paid to brokers, dealers, or other financial intermediaries.
Repurchase Agreements – The Funds may purchase certain US government securities subject to the counterparty’s agreement to repurchase them at an agreed upon date and price. The counterparty will be required on a daily basis to maintain the value of the collateral subject to the agreement at not less than the repurchase price (including accrued interest). The agreements are conditioned upon the collateral being deposited under the Federal Reserve book-entry system with the Funds’ custodian or a third-party sub-custodian. In the event of default or bankruptcy by the other party to the agreement, retention of the collateral may be subject to legal proceedings. All open repurchase agreements as of the date of this report were entered into on July 31, 2017, and matured on the next business day.
Foreign Currency Transactions – Transactions denominated in foreign currencies are recorded at the prevailing exchange rates on the valuation date in accordance with the Funds’ prospectus. The value of all assets and liabilities denominated in foreign currencies is translated daily into US dollars at the exchange rate of such currencies against the US dollar. Transaction gains or losses resulting from changes in exchange rates during the reporting period or upon settlement of the foreign currency transaction are reported in operations for the current period. The Funds generally bifurcate that portion of realized gains and losses on investments in debt securities which is due to changes in foreign exchange rates from that which is due to changes in market prices of debt securities. That portion of gains (losses), which is due to changes in foreign exchange rates, is included on the “Statements of operations” under “Net realized gain (loss) on foreign currencies.” The Funds report certain foreign currency related transactions as components of realized gains (losses) for financial reporting purposes, whereas such components are treated as ordinary income (loss) for federal income tax purposes.
Use of Estimates — Each Fund is an investment company, whose financial statements are prepared in conformity with US GAAP. Therefore, each Fund follows the accounting and reporting guidelines for investment companies. The preparation of financial statements in conformity with US GAAP requires management to make estimates and assumptions that affect the fair value of investments, the reported amounts of assets and liabilities and disclosure of contingent assets and liabilities at the date of the financial statements, and the reported amounts of revenues and expenses during the reporting period. Actual results could differ from those estimates and the differences could be material.
Other — Expenses directly attributable to a Fund are charged directly to that Fund. Other expenses common to various funds within the Delaware FundsSM by Macquarie (Delaware Funds) are generally allocated among such funds on the basis of average net assets. Management fees and certain other expenses are paid monthly. Security transactions are recorded on the date the securities are purchased or sold (trade date) for financial reporting purposes. Costs used in calculating realized gains and losses on the sale of investment securities are those of the specific securities sold. Dividend income is recorded on the ex-dividend date and interest income is recorded on the accrual basis. Discounts and premiums on debt securities are accreted or amortized to interest income, respectively, over the lives of the respective securities using the effective interest method. Each Fund declares dividends daily from net investment income and pays the dividends monthly and declares and pays distributions from net realized gain on investments, if any, annually. Each Fund may distribute more frequently, if necessary for tax purposes. Dividends and distributions, if any, are recorded on the ex-dividend date.
Each Fund may receive earnings credits from its custodian when positive cash balances are maintained, which may be used to offset custody fees. There were no such earnings credits for the year ended July 31, 2017.
Each Fund receives earnings credits from its transfer agent when positive cash balances are maintained, which may be used to offset transfer agent fees. If the amount earned is greater than $1, the expense paid under this arrangement is included on the “Statements of operations” under “Dividend disbursing and transfer agent fees and expenses” with the corresponding expense offset shown under “Less expense paid indirectly.” For the year ended July 31, 2017, each Fund earned the following amounts under this agreement:
| | | | |
| | | Delaware
Corporate
Bond Fund | | Delaware
Extended Duration
Bond Fund |
| | $1,606 | | $767 |
| | |
| Notes to financial statements | | |
| Delaware Corporate Bond Fund and Delaware Extended Duration Bond Fund | | |
2. Investment Management, Administration Agreements, and Other Transactions with Affiliates
In accordance with the terms of its respective investment management agreement, each Fund pays Delaware Management Company (DMC), a series of Macquarie Investment Management Business Trust (formerly, Delaware Management Business Trust) and the investment manager, an annual fee which is calculated daily and paid monthly based on each Fund’s average daily net assets as follows:
| | | | | | | | | | |
| | | Delaware
Corporate
Bond Fund | | Delaware
Extended Duration
Bond Fund |
| | |
On the first $500 million | | | | 0.5000% | | | | | 0.5500% | |
On the next $500 million | | | | 0.4750% | | | | | 0.5000% | |
On the next $1.5 billion | | | | 0.4500% | | | | | 0.4500% | |
In excess of $2.5 billion | | | | 0.4250% | | | | | 0.4250% | |
DMC has contractually agreed to waive that portion, if any, of its management fee and/or pay/reimburse each Fund to the extent necessary to ensure that total annual operating expenses (excluding any distribution and service (12b-1) fees, acquired fund fees and expenses, taxes, interest, short sale and dividend interest expenses, brokerage fees, certain insurance costs, and nonroutine expenses or costs, including, but not limited to, those relating to reorganizations, litigation, conducting shareholder meetings, and liquidations), do not exceed specified percentages of average daily net assets of each Fund from Aug. 1, 2016 through July 31, 2017* as shown below. For purposes of these waivers and reimbursements, nonroutine expenses may also include such additional costs and expenses as may be agreed upon from time to time by the Board and DMC. These expense waivers and reimbursements apply only to expenses paid directly by the Funds and may only be terminated by agreement of DMC and the Funds.
| | | | | | | | | | | | | | | |
| | | Delaware
Corporate
Bond Fund | | Delaware
Extended Duration
Bond Fund
(Class A, Class C, Class R,
and Institutional Class shares) | | Delaware
Extended Duration
Bond Fund
(Class R6 shares) |
Operating expense limitation as a percentage of average daily net assets (per annum) | | | | 0.69% | | | | | 0.71% | | | | | 0.63% | |
Delaware Investments Fund Services Company (DIFSC), an affiliate of DMC, provides fund accounting and financial administration oversight services to the Funds. For these services, DIFSC’s fees are calculated daily and paid monthly based on the aggregate daily net assets of the Delaware Funds at the following annual rate: 0.0050% of the first $30 billion; 0.0045% of the next $10 billion; 0.0040% of the next $10 billion; and 0.0025% of aggregate average daily net assets in excess of $50 billion. The fees payable to DIFSC under the service agreement described above are allocated among all funds in the Delaware Funds on a relative net asset value (NAV) basis. These amounts are included on the “Statements of operations” under “Accounting and administration expenses.”
For the year ended July 31, 2017, the Funds were charged for these services as follows:
| | | | | | | | | | |
| | | Delaware
Corporate
Bond Fund | | Delaware
Extended Duration
Bond Fund |
| | | $ | 50,011 | | | | $ | 30,568 | |
DIFSC is also the transfer agent and dividend disbursing agent of the Funds. For these services, DIFSC’s fees are calculated daily and paid monthly based on the aggregate daily net assets of the retail funds within the Delaware Funds at the following annual rate: 0.025% of the first $20 billion; 0.020% of the next $5 billion; 0.015% of the next $5 billion; and 0.013% of average daily net assets in excess of $30 billion. The fees payable to DIFSC under the service agreement described above are allocated among all retail funds in the Delaware Funds on a relative NAV basis. These amounts are included on the “Statements of operations” under “Dividend disbursing and transfer agent fees and expenses.” For the year ended July 31, 2017, each Fund was charged for these services as follows:
| | | | | | | | | | |
| | | Delaware
Corporate
Bond Fund | | Delaware
Extended Duration
Bond Fund |
| | | $ | 214,842 | | | | $ | 131,317 | |
Pursuant to a sub-transfer agency agreement between DIFSC and BNY Mellon Investment Servicing (US) Inc. (BNYMIS), BNYMIS provides certain sub-transfer agency services to the Funds. Sub-transfer agency fees are paid by the Funds and are also included on the “Statements of operations” under “Dividend disbursing and transfer agent fees and expenses.”
Pursuant to a distribution agreement and distribution plan, each Fund pays DDLP, the distributor and an affiliate of DMC, an annual 12b-1 fee of 0.25%, 1.00%, and 0.50% of the average daily net assets of the Class A, Class C, and Class R shares, respectively. Institutional Class and Class R6 shares pay no 12b-1 fees.
As provided in the investment management agreement, each Fund bears a portion of the cost of certain resources shared with DMC, including the cost of internal personnel of DMC and/or its affiliates that provide legal, tax, and regulatory reporting services to the Funds. These amounts are included on the “Statements of operations” under “Legal fees.” For the year ended July 31, 2017, each Fund was charged for internal legal, tax, and regulatory reporting services provided by DMC and/or its affiliates’ employees as follows:
| | | | | | | | | | |
| | | Delaware
Corporate
Bond Fund | | Delaware
Extended Duration
Bond Fund |
| | | $ | 21,747 | | | | $ | 13,447 | |
For the year ended July 31, 2017, DDLP earned commissions on sales of Class A shares for each Fund as follows:
| | | | | | | | | | |
| | | Delaware
Corporate
Bond Fund | | Delaware
Extended Duration
Bond Fund |
| | | $ | 11,084 | | | | $ | 30,129 | |
| | |
| Notes to financial statements | | |
| Delaware Corporate Bond Fund and Delaware Extended Duration Bond Fund | | |
2. Investment Management, Administration Agreements, and Other Transactions with Affiliates (continued)
For the year ended July 31, 2017, DDLP received gross CDSC commissions on redemptions of each Fund’s Class A and Class C shares, respectively, and these commissions were entirely used to offset upfront commissions previously paid by DDLP to broker/dealers on sales of those shares. The amounts received were as follows:
| | | | | | | | | | |
| | | Delaware
Corporate
Bond Fund | | Delaware
Extended Duration
Bond Fund |
Class A | | | $ | 324 | | | | $ | 22 | |
Class C | | | | 5,832 | | | | | 12,093 | |
Trustees’ fees include expenses accrued by the Funds for each Trustee’s retainer and meeting fees. Certain officers of DMC, DIFSC, and DDLP are officers and/or Trustees of the Trust. These officers and Trustees are paid no compensation by the Funds.
Cross trades for the year ended July 31, 2017, were executed by the Funds pursuant to procedures adopted by the Board designed to ensure compliance with Rule 17a-7 under the 1940 Act. Cross trading is the buying or selling of portfolio securities between funds of investment companies, or between a fund of an investment company and another entity, that are or could be considered affiliates by virtue of having a common investment advisor (or affiliated investment advisors), common directors/trustees and/or common officers. At its regularly scheduled meetings, the Board reviews such transactions for compliance with the procedures adopted by the Board. Pursuant to these procedures, for the year ended July 31, 2017, the Funds engaged in securities purchases and sales, which resulted in the following net realized gains.
| | | | | | | | |
| | | Delaware
Corporate
Bond Fund | | | Delaware
Extended Duration
Bond Fund | |
Purchases | | $ | — | | | $ | 1,804,098 | |
Sales | | | 20,832,148 | | | | 25,616,312 | |
Net realized gain | | | 786 | | | | 923 | |
*The aggregate contractual waiver period covering this report is from Nov. 27, 2015 through Nov. 28, 2017. The aggregate contractual waiver period for Delaware Extended Duration Bond Fund’s Class R6 shares is from May 2, 2016 through Nov. 28, 2017.
3. Investments
For the year ended July 31, 2017, the Funds made purchases and sales of investment securities other than short-term investments as follows:
| | | | | | | | | | |
| | | Delaware
Corporate
Bond Fund | | Delaware
Extended Duration
Bond Fund |
Purchases other than US government securities | | | | $1,657,063,054 | | | | | $786,877,373 | |
Purchases of US government securities | | | | 123,517,358 | | | | | 415,698,111 | |
Sales other than US government securities | | | | 1,712,298,537 | | | | | 805,293,389 | |
Sales of US government securities | | | | 125,902,227 | | | | | 408,691,527 | |
At July 31, 2017, the cost and unrealized appreciation (depreciation) of investments for federal income tax purposes for each Fund were as follows:
| | | | | | | | | | |
| | | Delaware
Corporate
Bond Fund | | Delaware
Extended Duration
Bond Fund |
Cost of investments | | | | $1,073,310,835 | | | | | $627,149,429 | |
Aggregate unrealized appreciation of investments | | | | $ 39,960,705 | | | | | $ 32,595,964 | |
Aggregate unrealized depreciation of investments | | | | (12,943,558 | ) | | | | (2,486,957 | ) |
Net unrealized appreciation of investments | | | | $ 27,017,147 | | | | | $ 30,109,007 | |
US GAAP defines fair value as the price that each Fund would receive to sell an asset or pay to transfer a liability in an orderly transaction between market participants at the measurement date under current market conditions. A three-level hierarchy for fair value measurements has been established based upon the transparency of inputs to the valuation of an asset or liability. Inputs may be observable or unobservable and refer broadly to the assumptions that market participants would use in pricing the asset or liability. Observable inputs reflect the assumptions market participants would use in pricing the asset or liability based on market data obtained from sources independent of the reporting entity. Unobservable inputs reflect the reporting entity’s own assumptions about the assumptions that market participants would use in pricing the asset or liability based on the best information available under the circumstances. Each Fund’s investment in its entirety is assigned a level based upon the observability of the inputs which are significant to the overall valuation. The three-level hierarchy of inputs is summarized below and on the next page.
| | |
Level 1 – | | Inputs are quoted prices in active markets for identical investments. (Examples: equity securities, open-end investment companies, futures contracts, exchange-traded options contracts) |
| |
Level 2 – | | Other observable inputs, including, but not limited to: quoted prices for similar assets or liabilities in markets that are active, quoted prices for identical or similar assets or liabilities in markets that are not active, inputs other than quoted prices that are observable for the assets or liabilities (such as interest rates, yield curves, volatilities, prepayment speeds, loss severities, credit risks, and default rates) or other market-corroborated inputs. (Examples: debt securities, government securities, swap contracts, foreign currency exchange contracts, foreign securities utilizing international fair value pricing, broker-quoted securities, fair valued securities) |
| | |
| Notes to financial statements | | |
| Delaware Corporate Bond Fund and Delaware Extended Duration Bond Fund | | |
3. Investments (continued)
| | |
Level 3 – | | Significant unobservable inputs, including each Fund’s own assumptions used to determine the fair value of investments. (Examples: broker-quoted securities, fair valued securities) |
Level 3 investments are valued using significant unobservable inputs. Each Fund may also use an income-based valuation approach in which the anticipated future cash flows of the investment are discounted to calculate fair value. Discounts may also be applied due to the nature or duration of any restrictions on the disposition of the investments. Valuations may also be based upon current market prices of securities that are comparable in coupon, rating, maturity, and industry. The derived value of a Level 3 investment may not represent the value which is received upon disposition and this could impact the results of operations.
The following tables summarize the valuation of each Fund’s investments by fair value hierarchy levels as of July 31, 2017:
| | | | | | | | | | | | |
| | | Delaware Corporate Bond Fund | |
| | | |
Securities | | Level 1 | | | Level 2 | | | Total | |
| | | |
Assets: | | | | | | | | | | | | |
Corporate Debt | | | $ — | | | | $1,027,619,554 | | | | $1,027,619,554 | |
Municipal Bonds | | | — | | | | 10,364,153 | | | | 10,364,153 | |
Loan Agreements | | | — | | | | 3,931,296 | | | | 3,931,296 | |
Convertible Preferred Stock | | | 2,583,661 | | | | — | | | | 2,583,661 | |
Preferred Stock1 | | | 4,016,550 | | | | 13,044,768 | | | | 17,061,318 | |
Short-Term Investments | | | — | | | | 38,768,000 | | | | 38,768,000 | |
| | | | | | | | | | | | |
Total Value of Securities | | | $6,600,211 | | | | $1,093,727,771 | | | | $1,100,327,982 | |
| | | | | | | | | | | | |
| |
| | | Delaware Extended Duration Bond Fund | |
| | | |
Securities | | Level 1 | | | Level 2 | | | Total | |
| | | |
Assets: | | | | | | | | | | | | |
Corporate Debt | | | $ — | | | | $597,227,089 | | | | $597,227,089 | |
Municipal Bonds | | | — | | | | 19,466,878 | | | | 19,466,878 | |
Convertible Preferred Stock | | | 1,688,440 | | | | — | | | | 1,688,440 | |
Preferred Stock1 | | | 1,536,600 | | | | 9,523,520 | | | | 11,060,120 | |
US Treasury Obligations | | | — | | | | 10,658,914 | | | | 10,658,914 | |
Short-Term Investments | | | — | | | | 17,156,995 | | | | 17,156,995 | |
| | | | | | | | | | | | |
Total Value of Securities | | | $3,225,040 | | | | $654,033,396 | | | | $657,258,436 | |
| | | | | | | | | | | | |
| 1 | Security type is valued across multiple levels. Level 1 investments represent exchange-traded investments while Level 2 investments represent investments with observable inputs or matrix-priced investments. The amounts attributed to Level 1 investments and Level 2 investments represent the following percentages of the total market value of these security types for each Fund: |
| | | | | | | | | | | | |
| | | Delaware Corporate Bond Fund | |
| | | |
| | | Level 1 | | | Level 2 | | | Total | |
Preferred Stock | | | 23.54 | % | | | 76.46 | % | | | 100.00% | |
| |
| | | Delaware Extended Duration Bond Fund | |
| | | |
| | | Level 1 | | | Level 2 | | | Total | |
Preferred Stock | | | 13.89 | % | | | 86.11 | % | | | 100.00% | |
During the year ended July 31, 2017, there were no transfers between Level 1 investments, Level 2 investments, or Level 3 investments that had a significant impact to the Funds. Each Fund’s policy is to recognize transfers between levels based on fair value at the beginning of the reporting period.
A reconciliation of Level 3 investments is presented when each Fund has a significant amount of Level 3 investments at the beginning, interim, or end of the period in relation to net assets. During the year ended July 31, 2017, there were no Level 3 investments.
4. Dividend and Distribution Information
Income and long-term capital gain distributions are determined in accordance with federal income tax regulations, which may differ from US GAAP. Additionally, distributions from net gains on foreign currency transactions and net short-term gains on sales of investment securities are treated as ordinary income for federal income tax purposes. The tax character of dividends and distributions paid during the years ended July 31, 2017 and 2016 were as follows:
| | | | | | | | |
| | | Delaware Corporate
Bond Fund | |
| | | Year ended | |
| | | 7/31/17 | | | 7/31/16 | |
Ordinary income | | $ | 37,576,252 | | | $ | 44,316,993 | |
| |
| | | Delaware
Extended Duration
Bond Fund | |
| | | Year ended | |
| | | 7/31/17 | | | 7/31/16 | |
Ordinary income | | $ | 23,678,035 | | | $ | 22,858,593 | |
Long-term capital gains | | | — | | | | 884,727 | |
Return of capital | | | — | | | | 280,126 | |
| | | | | | | | |
Total | | $ | 23,678,035 | | | $ | 24,023,446 | |
| | | | | | | | |
| | |
| Notes to financial statements | | |
| Delaware Corporate Bond Fund and Delaware Extended Duration Bond Fund | | |
5. Components of Net Assets on a Tax Basis
As of July 31, 2017, the components of net assets on a tax basis were as follows:
| | | | | | | | |
| | | Delaware
Corporate
Bond Fund | | | Delaware
Extended Duration
Bond Fund | |
Shares of beneficial interest | | $ | 1,103,158,078 | | | $ | 637,923,578 | |
Undistributed ordinary income | | | 819,211 | | | | 4,098 | |
Distributions payable | | | (893,042 | ) | | | (563,481 | ) |
Troubled debt litigation | | | (1,022,669 | ) | | | (387,909 | ) |
Capital loss carryforwards | | | (38,022,389 | ) | | | — | |
Qualified late year loss deferrals | | | — | | | | (5,829,700 | ) |
Unrealized appreciation of investments | | | 27,017,147 | | | | 30,109,007 | |
| | | | | | | | |
Net assets | | $ | 1,091,056,336 | | | $ | 661,255,593 | |
| | | | | | | | |
The differences between book basis and tax basis components of net assets are primarily attributable to tax deferral of losses on wash sales, tax deferral of straddle losses, tax treatment of contingent payment on debt instruments, trust preferred securities, and market discount and premium on debt instruments.
Qualified late year capital losses represent losses realized from Nov. 1, 2016 through July 31, 2017, that in accordance with federal income tax regulations, the Funds have elected to defer and treat as having arisen in the following fiscal year.
For financial reporting purposes, capital accounts are adjusted to reflect the tax character of permanent book/tax differences. Reclassifications are primarily due to tax treatment of gain (loss) on foreign currency transactions, market discount and premium on debt instruments, and CDS contracts. Results of operations and net assets were not affected by these reclassifications. For the year ended July 31, 2017, the Funds recorded the following reclassifications:
| | | | | | | | | | |
| | | Delaware
Corporate
Bond Fund | | Delaware
Extended Duration
Bond Fund |
Distributions in excess of net investment income | | | $ | 2,919,536 | | | | $ | 670,641 | |
Accumulated net realized loss | | | | (2,919,536 | ) | | | | (670,641 | ) |
Under the Regulated Investment Company Modernization Act of 2010 (Act), net capital losses recognized for tax years beginning after Dec. 22, 2010 may be carried forward indefinitely, and their character is retained as short-term and/or long-term losses. At July 31, 2017, there were no capital loss carryforwards for Delaware Extended Duration Bond Fund. Capital loss carryforwards available to offset future realized capital gains for Delaware Corporate Bond Fund are as follows:
| | | | | | | | | | | | | | | |
| | | Loss carryforward character |
| | | Short-term | | Long-term | | Total |
Delaware Corporate Bond Fund | | | $ | 21,494,403 | | | | $ | 16,527,986 | | | | $ | 38,022,389 | |
In 2017, the Funds utilized capital loss carryforwards as follows:
| | | | | |
| | | Capital loss carryforward utilized |
Delaware Corporate Bond Fund | | | $ | 3,102,718 | |
Delaware Extended Duration Bond Fund | | | | 7,602,962 | |
6. Capital Shares
Transactions in capital shares were as follows:
| | | | | | | | | | | | | | | | |
| | | Delaware Corporate
Bond Fund | | | Delaware Extended Duration
Bond Fund | |
| | |
| | | Year ended | | | Year ended | |
| | | | |
| | | 7/31/17 | | | 7/31/16 | | | 7/31/17 | | | 7/31/16 | |
Shares sold: | | | | | | | | | | | | | | | | |
Class A | | | 8,259,302 | | | | 13,130,903 | | | | 8,574,015 | | | | 10,458,177 | |
Class C | | | 1,825,755 | | | | 3,003,061 | | | | 826,546 | | | | 916,079 | |
Class R | | | 1,045,392 | | | | 1,773,012 | | | | 1,032,357 | | | | 928,514 | |
Institutional Class | | | 66,706,427 | | | | 41,839,997 | | | | 27,488,461 | | | | 16,558,897 | |
Class R6 | | | — | | | | — | | | | 2,375,578 | | | | 1,268,678 | |
| | |
Shares issued upon reinvestment of dividends and distributions: | | | | | | | | | |
Class A | | | 1,589,304 | | | | 2,149,957 | | | | 1,151,746 | | | | 1,310,984 | |
Class C | | | 626,896 | | | | 758,010 | | | | 119,329 | | | | 142,135 | |
Class R | | | 144,411 | | | | 159,585 | | | | 108,429 | | | | 142,443 | |
Institutional Class | | | 2,692,439 | | | | 3,121,204 | | | | 2,043,476 | | | | 2,092,804 | |
Class R6 | | | — | | | | — | | | | 75,789 | | | | 606 | |
| | | | | | | | | | | | | | | | |
| | | 82,889,926 | | | | 65,935,729 | | | | 43,795,726 | | | | 33,819,317 | |
| | | | | | | | | | | | | | | | |
Shares redeemed: | | | | | | | | | | | | | | | | |
Class A | | | (27,160,676 | ) | | | (32,022,046 | ) | | | (15,534,820 | ) | | | (15,100,859 | ) |
Class C | | | (9,308,688 | ) | | | (7,933,176 | ) | | | (1,652,344 | ) | | | (1,378,607 | ) |
Class R | | | (1,995,642 | ) | | | (1,880,417 | ) | | | (2,050,279 | ) | | | (1,449,098 | ) |
Institutional Class | | | (51,225,033 | ) | | | (88,409,759 | ) | | | (24,855,706 | ) | | | (18,228,734 | ) |
Class R6 | | | — | | | | — | | | | (203,411 | ) | | | (4,122 | ) |
| | | | | | | | | | | | | | | | |
| | | (89,690,039 | ) | | | (130,245,398 | ) | | | (44,296,560 | ) | | | (36,161,420 | ) |
| | | | | | | | | | | | | | | | |
Net decrease | | | (6,800,113 | ) | | | (64,309,669 | ) | | | (500,834 | ) | | | (2,342,103 | ) |
| | | | | | | | | | | | | | | | |
Certain shareholders may exchange shares of one class for shares of another class in the same Fund. For the years ended July 31, 2017 and 2016, the Funds had the following exchange transactions. These exchange transactions are included as subscriptions and redemptions in the tables above, and in the “Statements of changes in net assets.”
| | |
| Notes to financial statements | | |
| Delaware Corporate Bond Fund and Delaware Extended Duration Bond Fund | | |
6. Capital Shares (continued)
| | | | | | | | | | | | | | | | | | | | |
| | | Year ended | |
| | | 7/31/17 | |
| | | Exchange Redemptions | | | Exchange Subscriptions | | | | |
| | | | | |
| | | | | | | | | | | | Institutional | | | | |
| | | Class A | | | Class C | | | Class A | | | Class | | | | |
| | | Shares | | | Shares | | | Shares | | | Shares | | | Value | |
Delaware Corporate Bond Fund | | | 8,605,558 | | | | 81,107 | | | | 2,488 | | | | 8,701,608 | | | $ | 49,977,081 | |
Delaware Extended Duration Bond Fund | | | 2,797,433 | | | | 1,709 | | | | 355 | | | | 2,808,998 | | | | 17,728,307 | |
| | | | | | | | | | | | | | | | | | | | | | | | |
| | | Year ended 7/31/16 | |
| | | Exchange Redemptions | | | Exchange Subscriptions | | | | |
| | | | | | |
| | | Class A
Shares | | | Class C
Shares | | | Institutional
Class
Shares | | | Class A
Shares | | | Institutional
Class
Shares | | | Value | |
Delaware Corporate Bond Fund | | | 2,576,461 | | | | 16,485 | | | | — | | | | 3,327 | | | | 2,594,863 | | | $ | 15,070,249 | |
Delaware Extended Duration Bond Fund | | | 19,810 | | | | — | | | | 2,721 | | | | 2,718 | | | | 19,879 | | | | 146,180 | |
7. Line of Credit
Each Fund, along with certain other funds in the Delaware Funds (Participants), was a participant in a $155,000,000 revolving line of credit to be used for temporary or emergency purposes as an additional source of liquidity to fund redemptions of investor shares. Under the agreement, the Participants were charged an annual commitment fee of 0.10%, which was allocated across the Participants on the basis of relative net assets of each Participant’s allocation of the entire facility. The Participants were permitted to borrow up to a maximum of one-third of their net assets under the agreement. Each Participant is individually, and not jointly, liable for its particular advances, if any, under the line of credit. The line of credit available under the agreement expired on Nov. 7, 2016.
On Nov. 7, 2016, each Fund, along with the other Participants, entered into an amendment to the agreement for a $155,000,000 revolving line of credit. The line of credit is to be used as described above and operates in substantially the same manner as the original agreement, with the exception of the annual commitment fee. Under the amendment to the agreement, the Participants are charged an annual commitment fee of 0.15%, which is allocated across the Participants on the basis of relative net assets of each Participant’s allocation of the entire facility. The line of credit available under the agreement expires on Nov. 6, 2017.
The Funds had no amounts outstanding as of July 31, 2017, or at any time during the year then ended.
8. Derivatives
US GAAP requires disclosures that enable investors to understand: (1) how and why an entity uses derivatives; (2) how they are accounted for; and (3) how they affect an entity’s results of operations and financial position.
Futures Contracts – A futures contract is an agreement in which the writer (or seller) of the contract agrees to deliver to the buyer an amount of cash or securities equal to a specific dollar amount times the difference between the value of a specific security or index at the close of the last trading day of the contract and the price at which the agreement is made. Each Fund may use futures in the normal course of pursuing its investment objective. Each Fund may invest in futures contracts to hedge its existing portfolio securities against fluctuations in fair value caused by changes in interest rates or market conditions. Upon entering into a futures contract, each Fund deposits cash or pledges US government securities to a broker, equal to the minimum “initial margin” requirements of the exchange on which the contract is traded. Subsequent payments are received from the broker or paid to the broker each day, based on the daily fluctuation in the market value of the contract. These receipts or payments are known as “variation margin” and are recorded daily by the Funds as unrealized gains or losses until the contracts are closed. When the contracts are closed, the Funds record a realized gain or loss equal to the difference between the value of the contract at the time it was opened and the value at the time it was closed. Risks of entering into futures contracts include potential imperfect correlation between the futures contracts and the underlying securities and the possibility of an illiquid secondary market for these instruments. When investing in futures, there is reduced counterparty credit risk to the Funds because futures are exchange-traded and the exchange’s clearinghouse, as counterparty to all exchange-traded futures, guarantees against default. No futures contracts were outstanding at July 31, 2017.
During the year ended July 31, 2017, the Funds used futures contracts to hedge the Funds’ existing portfolio securities against fluctuations in value caused by changes in interest rates or market conditions.
Options Contracts – Each Fund may enter into options contracts in the normal course of pursuing its investment objective. The Funds may buy or write options contracts for any number of reasons, including without limitation: to manage the Funds’ exposure to changes in securities prices caused by interest rates or market conditions, and foreign currencies; as an efficient means of adjusting the Funds’ overall exposure to certain markets; to protect the value of portfolio securities; and as a cash management tool. The Funds may buy or write call or put options on securities, futures, swaps, financial indices, and foreign currencies. When the Funds buy an option, a premium is paid and an asset is recorded and adjusted on a daily basis to reflect the current market value of the option purchased. When the Funds write an option, a premium is received and a liability is recorded and adjusted on a daily basis to reflect the current market value of the option written. Premiums received from writing options that expire unexercised are treated by the Funds on the expiration date as realized gains. The difference between the premium received and the amount paid on effecting a closing purchase transaction, including brokerage commissions, is treated as realized gain or loss. If a call option is exercised, the premium is added to the proceeds from the sale of the underlying security in determining whether the Funds have a realized gain or loss. If a put option is exercised, the premium reduces the cost basis of the securities
| | |
| Notes to financial statements | | |
| Delaware Corporate Bond Fund and Delaware Extended Duration Bond Fund | | |
8. Derivatives (continued)
purchased by each Fund. Each Fund, as writer of an option, bears the market risk of an unfavorable change in the price of the security underlying the written option. When writing options, each Fund is subject to minimal counterparty risk because the counterparty is only obligated to pay premiums and does not bear the market risk of an unfavorable market change. There were no transactions in options written during the year ended July 31, 2017. No options contracts were outstanding at July 31, 2017.
During the year ended July 31, 2017, the Funds used options purchased contracts to manage the Funds’ exposure to changes in securities prices caused by interest rates or market conditions.
Swap Contracts – Each Fund may enter into CDS contracts in the normal course of pursuing its investment objective. Each Fund may enter into CDS contracts in order to hedge against a credit event, to enhance total return or to gain exposure to certain securities or markets. The Funds will not be permitted to enter into any swap transactions unless, at the time of entering into such transactions, the unsecured long-term debt of the actual counterparty, combined with any credit enhancements, is rated at least BBB- by Standard & Poor’s Financial Services LLC (S&P) or Baa3 by Moody’s Investors Service, Inc. (Moody’s) or is determined to be of equivalent credit quality by DMC.
Credit Default Swaps. A CDS contract is a risk-transfer instrument through which one party (purchaser of protection) transfers to another party (seller of protection) the financial risk of a credit event (as defined in the CDS agreement), as it relates to a particular reference security or basket of securities (such as an index). In exchange for the protection offered by the seller of protection, the purchaser of protection agrees to pay the seller of protection a periodic amount at a stated rate that is applied to the notional amount of the CDS contract. In addition, an upfront payment may be made or received by the Funds in connection with an unwinding or assignment of a CDS contract. Upon the occurrence of a credit event, the seller of protection would pay the par (or other agreed-upon) value of the reference security (or basket of securities) to the counterparty. Credit events generally include, among others, bankruptcy, failure to pay, and obligation default.
During the year ended July 31, 2017, Delaware Corporate Bond Fund entered into CDS contracts as a purchaser of protection. Periodic payments (receipts) on such contracts are accrued daily and recorded as unrealized losses (gains) on swap contracts. Upon payment (receipt), such amounts are recorded as realized losses (gains) on swap contracts. Upfront payments made or received in connection with CDS contracts are amortized over the expected life of the CDS contracts as unrealized losses (gains) on swap contracts. The change in value of CDS contracts is recorded daily as unrealized appreciation or depreciation. A realized gain or loss is recorded upon a credit event (as defined in the CDS agreement) or the maturity or termination of the agreement. Initial margin and variation margin are posted to central counterparties for CDS basket trades, as determined by the applicable central counterparty. During the year ended July 31, 2017, the Funds did not enter into any CDS contracts as a seller of protection.
CDS contracts may involve greater risks than if the Funds had invested in the reference obligation directly. CDS contracts are subject to general market risk, liquidity risk, counterparty risk, and credit risk. The Funds’ maximum risk of loss from counterparty credit risk, either as the seller of protection or the buyer of protection, is the fair value of the contract. This risk is mitigated by (1) for bilateral swap contracts, having a netting arrangement between the Funds and the counterparty and by the posting of
collateral by the counterparty to the Funds to cover the Funds’ exposure to the counterparty, and (2) for cleared swaps, trading these instruments through a central counterparty.
During the year ended July 31, 2017, Delaware Corporate Bond Fund used CDS contracts to hedge against credit events.
Swaps Generally. The value of open swaps may differ from that which would be realized in the event each Fund terminated its position in the contract on a given day. Risks of entering into these contracts include the potential inability of the counterparty to meet the terms of the contracts. This type of risk is generally limited to the amount of favorable movement in the value of the underlying security, instrument, or basket of instruments, if any, at the day of default. Risks also arise from potential losses from adverse market movements and such losses could exceed the unrealized amounts. No swap contracts were outstanding at July 31, 2017.
The effect of derivative instruments on the “Statements of operations” for the year ended July 31, 2017 was as follows:
| | | | | | | | | | | | | | | | |
| |
| | | Delaware Corporate Bond Fund | |
| |
| | | Net Realized Gain (Loss) on: | |
| | | | |
| | | Futures | | | Options | | | Swap | | | | |
| | | Contracts | | | Purchased | | | Contracts | | | Total | |
Interest rate contracts | | | $268,698 | | | | $(344,448 | ) | | | $ — | | | | $ (75,750 | ) |
Credit contracts | | | — | | | | — | | | | (270,411 | ) | | | (270,411 | ) |
| | | | | | | | | | | | | | | | |
Total | | | $268,698 | | | | $(344,448 | ) | | | $(270,411 | ) | | | $(346,161 | ) |
| | | | | | | | | | | | | | | | |
| | | | | |
| | | Net Change in
Unrealized Appreciation
(Depreciation) of: |
| |
| | | Swap |
| | | Contracts |
Credit contracts | | | $ | 116,763 | |
| | | | | | | | | | | | |
| | | Delaware Extended Duration Bond Fund | |
| |
| | | Net Realized Gain (Loss) on: | |
| | | |
| | | Futures | | | Options | | | | |
| | | Contracts | | | Purchased | | | Total | |
Interest rate contracts | | | $(21,474 | ) | | | $(68,765 | ) | | | $(90,239 | ) |
| | | | | |
| | | Net Change in |
| | | Unrealized Appreciation |
| | | (Depreciation) of: |
| |
| | | Futures |
| | | Contracts |
Interest rate contracts | | | | $124,090 | |
| | |
| Notes to financial statements | | |
| Delaware Corporate Bond Fund and Delaware Extended Duration Bond Fund | | |
8. Derivatives (continued)
Derivatives Generally. The tables below summarize the average balance of derivative holdings by the Funds during the year ended July 31, 2017:
| | | | | | | | |
| | | Long Derivative Volume | |
| | | Delaware
Corporate
Bond Fund | | | Delaware
Extended Duration
Bond Fund | |
Futures contracts (average notional value) | | | $1,209,145 | | | | $3,656,912 | |
Options contracts (average notional value) | | | 15,289 | | | | 177 | |
CDS contracts (average notional value)* | | | 2,669,048 | | | | — | |
| |
| | | Short Derivative Volume | |
| | |
| | | Delaware
Corporate
Bond Fund | | | Delaware
Extended Duration
Bond Fund | |
Futures contracts (average notional value) | | | $932,982 | | | | $1,766,527 | |
*Long represents buying protection and short represents selling protection. | | | | | |
9. Offsetting
Each Fund entered into an International Swaps and Derivatives Association, Inc. Master Agreement (ISDA Master Agreement) or a similar agreement with certain of its derivative contract counterparties in order to better define its contractual rights and to secure rights that will help each Fund mitigate its counterparty risk. An ISDA Master Agreement is a bilateral agreement between the Funds and a counterparty that governs certain over-the-counter (OTC) derivatives and foreign exchange contracts and typically contains, among other things, collateral posting items and netting provisions in the event of a default and/or termination event. Under an ISDA Master Agreement, each Fund may, under certain circumstances, offset with the counterparty certain derivative financial instruments’ payables and/or receivables with collateral held and/or posted and create one single net payment. The provisions of the ISDA Master Agreement typically permit a single net payment in the event of default (close-out), including the bankruptcy or insolvency of the counterparty. However, bankruptcy or insolvency, laws of a particular jurisdiction may impose restrictions on or prohibitions against the right of offset in bankruptcy, insolvency, or other events.
For financial reporting purposes, each Fund does not offset derivative assets and derivative liabilities that are subject to netting arrangements on the “Statements of assets and liabilities.”
At July 31, 2017, the Funds had the following assets and liabilities subject to offsetting provisions:
Master Repurchase Agreements
| | | | | | | | | | | | | | | | | | | | | | | | | |
| | | Delaware Corporate Bond Fund | | |
| | | | | |
| | | | | Fair Value of | | | | | | |
| | | | | Non-Cash | | Cash Collateral | | Net Collateral | | |
Counterparty | | Repurchase Agreements | | Collateral Received(a) | | Received | | Received | | Net Exposure(b) |
Bank of America Merrill Lynch | | | | $ 7,093,714 | | | | | $ (7,093,714 | ) | | | | $— | | | | | $ (7,093,714 | ) | | | | $— | |
Bank of Montreal | | | | 17,734,286 | | | | | (17,734,286 | ) | | | | — | | | | | (17,734,286 | ) | | | | — | |
BNP Paribas | | | | 13,940,000 | | | | | (13,940,000 | ) | | | | — | | | | | (13,940,000 | ) | | | | — | |
| | | | | | | | | | | | | | | | | | | | | | | | | |
Total | | | | $38,768,000 | | | | | $(38,768,000 | ) | | | | $— | | | | | $(38,768,000 | ) | | | | $— | |
| | | | | | | | | | | | | | | | | | | | | | | | | |
| | |
| | | Delaware Extended Duration Bond Fund | | |
| | | | | |
| | | | | Fair Value of | | | | | | |
| | | | | Non-Cash | | Cash Collateral | | Net Collateral | | |
Counterparty | | Repurchase Agreements | | Collateral Received(a) | | Received | | Received | | Net Exposure(b) |
Bank of America Merrill Lynch | | | | $ 2,464,539 | | | | | $ (2,464,539 | ) | | | | $— | | | | | $ (2,464,539 | ) | | | | $— | |
Bank of Montreal | | | | 6,161,347 | | | | | (6,161,347 | ) | | | | — | | | | | (6,161,347 | ) | | | | — | |
BNP Paribas | | | | 4,843,114 | | | | | (4,843,114 | ) | | | | — | | | | | (4,843,114 | ) | | | | — | |
| | | | | | | | | | | | | | | | | | | | | | | | | |
Total | | | | $13,469,000 | | | | | $(13,469,000 | ) | | | | $— | | | | | $(13,469,000 | ) | | | | $— | |
| | | | | | | | | | | | | | | | | | | | | | | | | |
(a) The value of the related collateral received exceeded the value of the repurchase agreements as of July 31, 2017.
(b) Net exposure represents the receivable (payable) that would be due from (to) the counterparty in the event of default.
10. Securities Lending
Each Fund, along with other funds in the Delaware Funds, may lend its securities pursuant to a security lending agreement (Lending Agreement) with The Bank of New York Mellon (BNY Mellon). At the time a security is loaned, the borrower must post collateral equal to the required percentage of the market value of the loaned security, including any accrued interest. The required percentage is: (1) 102% with respect to US securities and foreign securities that are denominated and payable in US dollars; and (2) 105% with respect to foreign securities. With respect to each loan, if on any business day the aggregate market value of securities collateral plus cash collateral held is less than the aggregate market value of the securities that are the subject of such loan, the borrower will be notified to provide additional collateral by the end of the following business day, which, together with the collateral already held, will be not less than the applicable initial collateral requirements for such security loan. If the aggregate market value of securities collateral and cash collateral held with respect to a security loan exceeds the applicable initial collateral requirement, upon the request of the borrower, BNY Mellon must return enough collateral to the borrower by the end of the following business day to reduce the value of the remaining collateral to the applicable initial collateral requirement for such security loan. As a result of the foregoing, the value of the collateral held with respect to a loaned security on any particular day may be more or less than the value of the security on loan.
Cash collateral received by each fund of the Trust is generally invested in a series of individual separate accounts, each corresponding to a fund. The investment guidelines permit each separate account to
| | |
| Notes to financial statements | | |
| Delaware Corporate Bond Fund and Delaware Extended Duration Bond Fund | | |
10. Securities Lending (continued)
hold certain securities that would be considered eligible securities for a money market fund. Cash collateral received is generally invested in government securities; certain obligations issued by government sponsored enterprises; repurchase agreements collateralized by US Treasury securities; obligations issued by the central government of any Organization for Economic Cooperation and Development (OECD) country or its agencies, instrumentalities, or establishments; obligations of supranational organizations; commercial paper, notes, bonds, and other debt obligations; certificates of deposit, time deposits, and other bank obligations; and asset-backed securities. A Fund can also accept US government securities and letters of credit (non-cash collateral) in connection with securities loans.
In the event of default or bankruptcy by the lending agent, realization and/or retention of the collateral may be subject to legal proceedings. In the event the borrower fails to return loaned securities and the collateral received is insufficient to cover the value of the loaned securities and provided such collateral shortfall is not the result of investment losses, the lending agent has agreed to pay the amount of the shortfall to the Funds or, at the discretion of the lending agent, replace the loaned securities. The Funds continue to record dividends or interest, as applicable, on the securities loaned and are subject to changes in value of the securities loaned that may occur during the term of the loan. The Funds have the right under the Lending Agreement to recover the securities from the borrower on demand. With respect to security loans collateralized by non-cash collateral, the Funds receive loan premiums paid by the borrower. With respect to security loans collateralized by cash collateral, the earnings from the collateral investments are shared among the Funds, the security lending agent, and the borrower. The Funds record security lending income net of allocations to the security lending agent and the borrower.
Each Fund may incur investment losses as a result of investing securities lending collateral. This could occur if an investment in the collateral investment account defaulted or became impaired. Under those circumstances, the value of a Fund’s cash collateral account may be less than the amount a Fund would be required to return to the borrowers of the securities and that Fund would be required to make up for this shortfall.
During the year ended July 31, 2017, the Funds had no securities on loan.
11. Credit and Market Risk
Some countries in which the Funds may invest require governmental approval for the repatriation of investment income, capital, or the proceeds of sales of securities by foreign investors. In addition, if there is deterioration in a country’s balance of payments or for other reasons, a country may impose temporary restrictions on foreign capital remittances abroad.
The securities exchanges of certain foreign markets are substantially smaller, less liquid, and more volatile than the major securities markets in the United States. Consequently, acquisition and disposition of securities by the Funds may be inhibited. In addition, a significant portion of the aggregate market value of securities listed on the major securities exchanges in emerging markets is held by a smaller number of investors. This may limit the number of shares available for acquisition or disposition by the Funds.
Each Fund invests in high yield, fixed income securities, which are securities rated lower than BBB- by S&P and lower than Baa3 by Moody’s, or similarly rated by another nationally recognized statistical rating organization. Investments in these higher yielding securities are generally accompanied by a greater degree of credit risk than higher-rated securities. Additionally, lower-rated securities may be more susceptible to adverse economic and competitive industry conditions than investment grade securities.
Each Fund invests in bank loans and other securities that may subject it to direct indebtedness risk, the risk that the Funds will not receive payment of principal, interest, and other amounts due in connection with these investments and will depend primarily on the financial condition of the borrower. Loans that are fully secured offer the Funds more protection than unsecured loans in the event of nonpayment of scheduled interest or principal, although there is no assurance that the liquidation of collateral from a secured loan would satisfy the corporate borrower’s obligation, or that the collateral can be liquidated. Some loans or claims may be in default at the time of purchase. Certain of the loans and the other direct indebtedness acquired by the Funds may involve revolving credit facilities or other standby financing commitments that obligate the Funds to pay additional cash on a certain date or on demand. These commitments may require each Fund to increase its investment in a company at a time when the Funds might not otherwise decide to do so (including at a time when the company’s financial condition makes it unlikely that such amounts will be repaid). To the extent that each Fund is committed to advance additional funds, it will at all times hold and maintain cash or other high-grade debt obligations in an amount sufficient to meet such commitments. When a loan agreement is purchased, the Funds may pay an assignment fee. On an ongoing basis, the Funds may receive a commitment fee based on the undrawn portion of the underlying line of credit portion of a loan agreement. Prepayment penalty fees are received upon the prepayment of a loan agreement by the borrower. Prepayment penalty, facility, commitment, consent, and amendment fees are recorded to income as earned or paid.
As the Funds may be required to rely upon another lending institution to collect and pass on to the Funds amounts payable with respect to the loan and to enforce the Funds’ rights under the loan and other direct indebtedness, an insolvency, bankruptcy, or reorganization of the lending institution may delay or prevent the Funds from receiving such amounts. The highly leveraged nature of many loans may make them especially vulnerable to adverse changes in economic or market conditions. Investments in such loans and other direct indebtedness may involve additional risk to the Funds.
Each Fund invests in certain obligations that may have liquidity protection designed to ensure that the receipt of payments due on the underlying security is timely. Such protection may be provided through guarantees, insurance policies, or letters of credit obtained by the issuer or sponsor through third parties, through various means of structuring the transaction, or through a combination of such approaches. The Funds will not pay any additional fees for such credit support, although the existence of credit support may increase the price of a security.
Each Fund may invest up to 15% of its net assets in illiquid securities, which may include securities with contractual restrictions on resale, securities exempt from registration under Rule 144A, promulgated under the Securities Act of 1933, as amended, and other securities which may not be readily marketable. The relative illiquidity of these securities may impair each Fund from disposing of them in a timely manner and at a fair price when it is necessary or desirable to do so. While maintaining oversight, the
| | |
| Notes to financial statements | | |
| Delaware Corporate Bond Fund and Delaware Extended Duration Bond Fund | | |
11. Credit and Market Risk (continued)
Board has delegated to DMC, the day-to-day functions of determining whether individual securities are liquid for purposes of the Funds’ limitation on investments in illiquid securities. Securities eligible for resale pursuant to Rule 144A, which are determined to be liquid, are not subject to the Funds’ 15% limit on investments in illiquid securities. Rule 144A securities have been identified on the “Schedules of investments.”
12. Contractual Obligations
Each Fund enters into contracts in the normal course of business that contain a variety of indemnifications. The Funds’ maximum exposure under these arrangements is unknown. However, each Fund has not had prior claims or losses pursuant to these contracts. Management has reviewed the Funds’ existing contracts and expects the risk of loss to be remote.
13. General Motors Corporation Term Loan Litigation
Delaware Corporate Bond Fund and Delaware Extended Duration Bond Fund received notice of a litigation proceeding related to a General Motors Corporation (G.M.) term loan participation previously held by the Funds in 2009. We believe the matter subject to the litigation notice will likely lead to a recovery from the Funds of certain amounts received by the Funds because a US Court of Appeals has ruled that the Funds and similarly situated investors were unsecured creditors rather than secured lenders of G.M. as a result of an erroneous Uniform Commercial Code filing made by a third party. The Funds received the full principal on the loans in 2009 after the G.M. bankruptcy. However, based upon the court ruling the estate is seeking to recover such amounts arguing that, as unsecured creditors, the Funds should not have received payment in full. Based upon currently available information related to the litigation and the Funds’ potential exposure, the Funds recorded a contingent liability and an asset based on the expected recoveries to unsecured creditors as of July 31, 2017 that resulted in a decrease in the Funds’ NAVs to reflect this likely recovery as follows:
| | | | | | | | | | |
| | | Delaware
Corporate
Bond Fund | | Delaware
Extended Duration
Bond Fund |
Asset | | | $ | 438,287 | | | | $ | 166,247 | |
Liability | | | | 1,460,956 | | | | | 554,156 | |
14. Recent Accounting Pronouncements
In October 2016, the Securities and Exchange Commission released its Final Rule on Investment Company Reporting Modernization (the “Rule”). The Rule contains amendments to Regulation S-X which impact financial statements presentation, particularly the presentation of derivative investments. Although it is still evaluating the impact of the Rule, management believes that many of the Regulation S-X amendments are materially consistent with the Funds’ current financial statements presentation and expects that the Funds will comply with the Rule’s Regulation S-X amendments by the Aug. 1, 2017 compliance date.
15. Subsequent Events
From Sept. 1, 2017, DIFSC’s fees are calculated daily and paid monthly based on the aggregate daily net assets of the Delaware Funds at the following annual rate: 0.00475% of the first $35 billion; 0.0040% of the next $10 billion; and 0.0025% of aggregate average daily net assets in excess of $45 billion (the “Total Fee”). Each Fund in the Delaware Funds pays a minimum of $4,000, which, in aggregate, is subtracted from the Total Fee. Each Fund in the Delaware Funds then pays its relative portion of the remainder of the Total Fee on a relative NAV basis.
Management has determined that no other material events or transactions occurred subsequent to July 31, 2017 that would require recognition or disclosure in the Funds’ financial statements.
Report of independent registered
public accounting firm
To the Board of Trustees of Delaware Group® Income Funds and Shareholders of Delaware Corporate Bond Fund and Delaware Extended Duration Bond Fund:
In our opinion, the accompanying statements of assets and liabilities, including the schedules of investments, and the related statements of operations and of changes in net assets and the financial highlights present fairly, in all material respects, the financial position of the Delaware Corporate Bond Fund and Delaware Extended Duration Bond Fund (two of the series constituting Delaware Group® Income Funds, hereafter referred to as the “Funds”) as of July 31, 2017, the results of each of their operations for the year then ended, the changes in each of their net assets for each of the two years in the period then ended and the financial highlights for each of the periods indicated, in conformity with accounting principles generally accepted in the United States of America. These financial statements and financial highlights (hereafter referred to as “financial statements”) are the responsibility of the Funds’ management. Our responsibility is to express an opinion on these financial statements based on our audits. We conducted our audits of these financial statements in accordance with the standards of the Public Company Accounting Oversight Board (United States). Those standards require that we plan and perform the audit to obtain reasonable assurance about whether the financial statements are free of material misstatement. An audit includes examining, on a test basis, evidence supporting the amounts and disclosures in the financial statements, assessing the accounting principles used and significant estimates made by management, and evaluating the overall financial statement presentation. We believe that our audits, which included confirmation of securities as of July 31, 2017 by correspondence with the custodian and brokers, provide a reasonable basis for our opinion.
PricewaterhouseCoopers LLP
Philadelphia, Pennsylvania
September 18, 2017
82
Other Fund information (Unaudited)
Delaware Corporate Bond Fund and Delaware Extended Duration Bond Fund
Tax Information
The information set forth below is for each Fund’s fiscal year as required by federal income tax laws. Shareholders, however, must report distributions on a calendar year basis for income tax purposes, which may include distributions for portions of two fiscal years of the Funds. Accordingly, the information needed by shareholders for income tax purposes will be sent to them in January of each year. Please consult your tax advisor for proper treatment of this information.
All disclosures are based on financial information available as of the date of this annual report and, accordingly are subject to change. For any and all items requiring reporting, it is the intention of the Funds to report the maximum amount permitted under the Internal Revenue Code and the regulations thereunder.
For the fiscal year ended July 31, 2017, each Fund reports distributions paid during the year as follows:
| | | | | |
| | | (A)
Ordinary Income
Distributions
(Tax Basis) |
Delaware Corporate Bond Fund | | | | 100.00 | % |
Delaware Extended Duration Bond Fund | | | | 100.00 | % |
(A) is based on a percentage of each Fund’s total distributions.
For the fiscal year ended July 31, 2017, certain interest income paid by Delaware Corporate Bond Fund determined to be Qualified Interest Income and Short-Term Capital Gains may be subject to relief from US withholding for foreign shareholders, as provided by the American Jobs Creation Act of 2004, and by the Tax Relief Unemployment Insurance Reauthorization and Job Creations Act of 2010, and as extended by the American Taxpayer Relief Act of 2012. Delaware Extended Duration Bond Fund did not have any foreign shareholders for the fiscal year ended July 31, 2017. For the fiscal year ended July 31, 2017, Delaware Corporate Bond Fund has reported maximum distributions of Qualified Interest Income as follows:
| | | | |
Qualified Interest Income | | $ | 27,988,461 | |
| | |
| Board of trustees / directors and officers addendum | | |
| Delaware FundsSM by Macquarie | | |
A mutual fund is governed by a Board of Trustees/Directors (“Trustees”), which has oversight responsibility for the management of a fund’s business affairs. Trustees establish procedures and oversee and review the performance of the investment manager, the distributor, and others who perform services for the fund. The independent fund trustees, in particular, are advocates
| | | | |
Name, Address, and Birth Date | | Position(s) Held with Fund(s) | | Length of Time Served |
Interested Trustee | | |
Shawn K. Lytle1, 2 | | President, | | Trustee since |
2005 Market Street | | Chief Executive Officer, | | September 2015 |
Philadelphia, PA 19103 | | and Trustee | | |
February 1970 | | | | President and |
| | | | Chief Executive Officer |
| | | | since August 2015 |
| | | | |
| | | | |
Independent Trustees | | |
Thomas L. Bennett | | Chairman and Trustee | | Trustee since |
2005 Market Street | | | | March 2005 |
Philadelphia, PA 19103 | | | | |
October 1947 | | | | Chairman since |
| | | | | March 2015 |
Ann D. Borowiec | | Trustee | | Since March 2015 |
2005 Market Street | | | | |
Philadelphia, PA 19103 | | | | |
November 1958 | | | | |
| | | | |
| | | | |
| | | | |
| | | | | |
Joseph W. Chow | | Trustee | | Since January 2013 |
2005 Market Street | | | | |
Philadelphia, PA 19103 | | | | |
January 1953 | | | | |
| | | | |
| | | | | |
| 1 | Shawn K.Lytle is considered to be an “Interested Trustee” because he is an executive officer of the Fund’s(s’) investment advisor. |
| 2 | Shawn K. Lytle, David F. Connor, Daniel V. Geatens, and Richard Salus serve in similar capacities for the six portfolios of the Optimum Fund Trust, which have the same investment advisor, principal underwriter, and transfer agent as the registrant. |
for shareholder interests. Each trustee has served in that capacity since he or she was elected to or appointed to the Board of Trustees, and will continue to serve until his or her retirement or the election of a new trustee in his or her place. The following is a list of the Trustees and Officers with certain background and related information.
| | | | |
Principal Occupation(s)
During the Past Five Years | | Number of Portfolios in Fund Complex Overseen by Trustee or Officer | | Other Directorships
Held by Trustee or Officer |
| | | | |
Shawn K. Lytle has served as | | 62 | | Trustee — UBS |
President of | | | | Relationship Funds, |
Macquarie Investment | | | | SMA Relationship |
Management3 | | | | Trust, and UBS Funds |
since June 2015 and was the | | | | (May 2010–April 2015) |
Regional Head of Americas for | | | | |
UBS Global Asset | | | | |
Management from 2010 through 2015. | | | | |
| | | | |
Private Investor | | 62 | | None |
(March 2004–Present) | | | | |
| | | | |
| | | | |
| | | | |
| | | | | |
Chief Executive Officer, | | 62 | | Director — |
Private Wealth Management | | | | Banco Santander International |
(2011–2013) and | | | | |
Market Manager, | | | | Director — |
New Jersey Private | | | | Santander Bank, N.A. |
Bank (2005–2011) — | | | | |
J.P. Morgan Chase & Co. | | | | |
Executive Vice President | | 62 | | Director and Audit Committee |
(Emerging Economies | | | | Member — Hercules |
Strategies, Risks, and | | | | Technology Growth |
Corporate Administration) | | | | Capital, Inc. |
State Street Corporation | | | | (2004–2014) |
(July 2004–March 2011) | | | | |
| 3 | Macquarie Investment Management (formerly known as Delaware Investments) is the marketing name for Macquarie Management Holdings, Inc. (formerly known as Delaware Management Holdings, Inc.) and its subsidiaries, including the Fund’s(s’) investment advisor, principal underwriter, and its transfer agent. |
| | |
| Board of trustees / directors and officers addendum | | |
| Delaware FundsSM by Macquarie | | |
| | | | |
Name, Address, and Birth Date | | Position(s) Held with Fund(s) | | Length of Time Served |
Independent Trustees (continued) | | |
John A. Fry | | Trustee | | Since January 2001 |
2005 Market Street | | | | |
Philadelphia, PA 19103 | | | | |
May 1960 | | | | |
| | | | |
| | | | |
| | | | |
| | | | |
| | | | |
| | | | |
| | | | |
| | | | | |
| | |
Lucinda S. Landreth | | Trustee | | Since March 2005 |
2005 Market Street | | | | |
Philadelphia, PA 19103 | | | | |
June 1947 | | | | |
Frances A. Sevilla-Sacasa | | Trustee | | Since September 2011 |
2005 Market Street | | | | |
Philadelphia, PA 19103 | | | | |
January 1956 | | | | |
| | | | |
| | | | |
| | | | |
| | | | |
| | | | |
| | | | |
| | | | |
| | | | |
| | | | |
| | | | |
| | | | |
| | | | |
| | | | | |
| | | | |
Principal Occupation(s) During the Past Five Years | | Number of Portfolios in Fund Complex Overseen by Trustee or Officer | | Other Directorships
Held by Trustee or Officer |
| | |
President — | | 62 | | Director, Audit Committee, |
Drexel University | | | | and Governance Committee |
(August 2010–Present) | | | | Member — Community |
| | | | Health Systems |
President — | | | | |
Franklin & Marshall College | | | | Director — Drexel |
(July 2002–July 2010) | | | | Morgan & Co. |
| | | | |
| | | | Director, Audit Committee |
| | | | Member — vTv |
| | | | Therapeutics LLC |
| | | | |
| | | | Director — FS Credit Real |
| | | | | Estate Income Trust, Inc. |
Private Investor | | 62 | | None |
(2004–Present) | | | | |
| | | | |
| | | | |
| | | | | |
Chief Executive Officer — | | 62 | | Trust Manager and |
Banco Itaú | | | | Audit Committee |
International | | | | Member — Camden |
(April 2012–December 2016) | | | | Property Trust |
| | |
Executive Advisor to Dean | | | | |
(August 2011–March 2012) and Interim Dean | | | | |
(January 2011–July 2011) — | | | | |
University of Miami School of | | | | |
Business Administration | | | | |
| | |
President — U.S. Trust, | | | | |
Bank of America Private | | | | |
Wealth Management | | | | |
(Private Banking) | | | | |
(July 2007–December 2008) | | | | |
| | |
| Board of trustees / directors and officers addendum | | |
| Delaware FundsSM by Macquarie | | |
| | | | |
Name, Address, and Birth Date | | Position(s) Held with Fund(s) | | Length of Time Served |
Independent Trustees (continued) | | |
Thomas K. Whitford | | Trustee | | Since January 2013 |
2005 Market Street | | | | |
Philadelphia, PA 19103 | | | | |
March 1956 | | | | |
| | |
| | | | | |
Janet L. Yeomans | | Trustee | | Since April 1999 |
2005 Market Street | | | | |
Philadelphia, PA 19103 | | | | |
July 1948 | | | | |
| | |
| | | | |
Officers | | |
David F. Connor | | Senior Vice President, | | Senior Vice President |
2005 Market Street | | General Counsel, | | since May 2013; |
Philadelphia, PA 19103 | | and Secretary | | General Counsel |
December 1963 | | | | since May 2015; |
| | | | Secretary since |
| | | | October 2005 |
Daniel V. Geatens | | Vice President | | Treasurer since October 2007 |
2005 Market Street | | and Treasurer | | |
Philadelphia, PA 19103 | | | | |
October 1972 | | | | |
| | |
| | | | | |
Richard Salus | | Senior Vice President | | Chief Financial Officer |
2005 Market Street | | and Chief Financial Officer | | since November 2006 |
Philadelphia, PA 19103 | | | | |
October 1963 | | | | |
| | |
| | | | | |
The Statement of Additional Information for the Fund(s) includes additional information about the Trustees and Officers and is available, without charge, upon request by calling 800 523-1918.
| | | | |
Principal Occupation(s) During the Past Five Years | | Number of Portfolios in Fund Complex Overseen by Trustee or Officer | | Other Directorships Held by Trustee or Officer |
| | | | |
Vice Chairman | | 62 | | Director — HSBC Finance |
(2010–April 2013) — | | | | Corporation and HSBC |
PNC Financial | | | | North America Holdings Inc. |
Services Group | | | | |
| | | | Director — |
| | | | | HSBC USA Inc. |
Vice President and Treasurer | | 62 | | Director, Personnel and |
(January 2006–July 2012), | | | | Compensation Committee |
Vice President — | | | | Chair, and Member of |
Mergers & Acquisitions | | | | Nominating, Investments, and |
(January 2003–January 2006), | | | | Audit Committees — |
and Vice President | | | | Okabena Company |
and Treasurer | | | | (2009–2014) |
(July 1995–January 2003) — 3M Company | | | | |
| | | | |
David F. Connor has served | | 62 | | None2 |
in various capacities at different times at | | | | |
Macquarie Investment | | | | |
Management. | | | | |
| | | | |
| | | | | |
Daniel V. Geatens has served | | 62 | | None2 |
in various capacities at different times at | | | | |
Macquarie Investment | | | | |
Management. | | | | |
| | | | | |
Richard Salus has served | | 62 | | None2 |
in various executive capacities at different times at | | | | |
Macquarie Investment | | | | |
Management. | | | | |
| | | | | |
About the organization
| | | | | | |
Board of trustees | | | | | | |
| Shawn K. Lytle | | Ann D. Borowiec | | John A. Fry | | Frances A. |
President and Chief Executive Officer Delaware FundsSM by Macquarie Philadelphia, PA Thomas L. Bennett Chairman of the Board Delaware Funds by Macquarie Private Investor Rosemont, PA | | Former Chief Executive Officer Private Wealth Management J.P. Morgan Chase & Co. New York, NY Joseph W. Chow Former Executive Vice President State Street Corporation Boston, MA | | President Drexel University Philadelphia, PA Lucinda S. Landreth Former Chief Investment Officer Assurant, Inc. New York, NY | | Sevilla-Sacasa Former Chief Executive Officer Banco Itaú International Miami, FL Thomas K. Whitford Former Vice Chairman PNC Financial Services Group Pittsburgh, PA Janet L. Yeomans Former Vice President and Treasurer 3M Company St. Paul, MN |
| | | | |
| | | |
| Affiliated officers | | | | | |
| | | |
| David F. Connor | | Daniel V. Geatens | | Richard Salus | | |
| Senior Vice President, | | Vice President and | | Senior Vice President and | | |
| General Counsel, | | Treasurer | | Chief Financial Officer | | |
| and Secretary | | Delaware Funds | | Delaware Funds | | |
| Delaware Funds | | by Macquarie | | by Macquarie | | |
| by Macquarie | | Philadelphia, PA | | Philadelphia, PA | | |
| Philadelphia, PA | | | | | | |
This annual report is for the information of Delaware Corporate Bond Fund and Delaware Extended Duration Bond Fund shareholders, but it may be used with prospective investors when preceded or accompanied by the Delaware Fund fact sheet for the most recently completed calendar quarter. These documents are available at delawarefunds.com/literature.
Each Fund files its complete schedule of portfolio holdings with the Securities and Exchange Commission (SEC) for the first and third quarters of each fiscal year on Form N-Q. Each Fund’s Forms N-Q, as well as a description of the policies and procedures that each Fund uses to determine how to vote proxies (if any) relating to portfolio securities are available without charge (i) upon request, by calling 800 523-1918; and (ii) on the SEC’s website at sec.gov. In addition, a description of the policies and procedures that the Funds use to determine how to vote proxies (if any) relating to portfolio securities and the Schedules of Investments included in the Funds’ most recent Forms N-Q are available without charge on the Funds’ website at delawarefunds.com/literature. Each Fund’s Forms N-Q may be reviewed and copied at the SEC’s Public Reference Room in Washington, D.C.; information on the operation of the Public Reference Room may be obtained by calling 800 SEC-0330.
Information (if any) regarding how the Funds voted proxies relating to portfolio securities during the most recently disclosed 12-month period ended June 30 is available without charge (i) through the Funds’ website at delawarefunds.com/proxy; and (ii) on the SEC’s website at sec.gov.
90
| | |

| | 
Annual report |
Fixed income mutual fund
Delaware High-Yield Opportunities Fund
July 31, 2017
Carefully consider the Fund’s investment objectives, risk factors, charges, and expenses before investing. This and other information can be found in the Fund’s prospectus and its summary prospectus, which may be obtained by visiting delawarefunds.com/literature or calling 800 523-1918. Investors should read the prospectus and the summary prospectus carefully before investing.
You can obtain shareholder reports and prospectuses online instead of in the mail.
Visit delawarefunds.com/edelivery.
Experience Delaware FundsSM by Macquarie
Macquarie Investment Management (MIM) is a global asset manager with offices throughout the United States, Europe, Asia, and Australia. We are active managers who prioritize autonomy and accountability at the investment team level in pursuit of opportunities that matter for our clients. Delaware Funds by Macquarie is one of the longest-standing mutual fund families, with more than 75 years in existence.
If you are interested in learning more about creating an investment plan, contact your financial advisor.
You can learn more about Delaware Funds by Macquarie or obtain a prospectus for Delaware High-Yield Opportunities Fund at delawarefunds.com/literature.
Manage your account online
| ● | | Check your account balance and transactions |
| ● | | View statements and tax forms |
| ● | | Make purchases and redemptions |
Visit delawarefunds.com/account-access.
Macquarie Investment Management (MIM) is the marketing name for the registered investment advisers including Macquarie Investment Management Business Trust (MIMBT) (formerly, Delaware Management Business Trust), Macquarie Funds Management Hong Kong Limited, Macquarie Investment Management Austria Kapitalanlage AG, Macquarie Investment Management Global Limited, Macquarie Bank International Limited, Macquarie Investment Management Europe Limited, Macquarie Investment Management Limited, and Macquarie Capital Investment Management, Inc.
The Funds are distributed by Delaware Distributors, L.P., an affiliate of Macquarie Investment Management Business Trust and Macquarie Group Limited. Macquarie Investment Management (MIM), a member of Macquarie Group, refers to the companies comprising the asset management division of Macquarie Group Limited and its subsidiaries and affiliates worldwide.
Other than Macquarie Bank Limited (MBL), none of the entities noted are authorized deposit-taking institutions for the purposes of the Banking Act 1959 (Commonwealth of Australia). The obligations of these entities do not represent deposits or other liabilities of MBL. MBL does not guarantee or otherwise provide assurance in respect of the obligations of these entities, unless noted otherwise. The Fund is governed by US laws and regulations.
Table of contents
Unless otherwise noted, views expressed herein are current as of July 31, 2017, and subject to change for events occurring after such date.
The Fund is not FDIC insured and is not guaranteed. It is possible to lose the principal amount invested.
Advisory services provided by Delaware Management Company, a series of MIMBT, a US registered investment advisor.
All third-party marks cited are the property of their respective owners.
© 2017 Macquarie Management Holdings, Inc. (formerly, Delaware Management Holdings, Inc.)
| | |
| Portfolio management review | | |
| Delaware High-Yield Opportunities Fund | | August 8, 2017 |
| | | | | | |
Performance preview (for the year ended July 31, 2017) | | | | | | |
Delaware High-Yield Opportunities Fund (Institutional Class shares) | | 1-year return | | | +10.08 | % |
Delaware High-Yield Opportunities Fund (Class A shares) | | 1-year return | | | +9.83 | % |
BofA Merrill Lynch US High Yield Constrained Index (benchmark) | | 1-year return | | | +11.24 | % |
Past performance does not guarantee future results.
For complete, annualized performance for Delaware High-Yield Opportunities Fund, please see the table on page 4. Institutional Class shares are available without sales or asset-based distribution charges only to certain eligible accounts. The performance of Class A shares excludes the applicable sales charge. Both Institutional Class shares and Class A shares reflect the reinvestment of all distributions.
Please see page 7 for a description of the index. Index performance returns do not reflect any management fees, transaction costs, or expenses. Indices are unmanaged and one cannot invest directly in an index.
High yield bonds posted strong returns during the Fund’s fiscal year ended July 31, 2017, as slow-but-steady economic growth and continued low benchmark interest rates provided investors with the confidence and incentive to move down the credit spectrum in search of yield. Notably, a portion of the demand for high yield debt originated from nontraditional buyers in Europe and Asia, where rates remained lower and economic growth was even more modest. Overall, high yield credit spreads tightened from 569 basis points at the start of the Fund’s fiscal year to 361 basis points as the period ended (source: Bloomberg). (One basis point is a hundredth of a percentage point.)
Spreads tightened in January and February 2017, which seemed to indicate an optimistic outlook on corporate earnings and the potential for pro-growth fiscal policies. However, in March, spreads widened as a result of increased supply and weakness in energy prices that destabilized a key sector of the high yield market. Nonetheless, this period of spread widening was offset by the US presidential election results, which many investors believed enhanced the odds for a major boost in infrastructure spending. Though expectations for a robust round of fiscal stimulus that would include corporate tax cuts were subsequently scaled back, business-friendly policies in Congress and the White House appeared likely to provide much-needed
The following factors
affected high yield
bonds during the
fiscal year:
| | ● | | Steady economic growth and low US interest rates |
| | ● | | Expectations for aggressive fiscal stimulus under the Trump administration |
| | ● | | Relatively healthy corporate credit profiles that encouraged risk taking |
| | |
| Portfolio management review | | |
| Delaware High-Yield Opportunities Fund | | |
support to a high yield market that had become expensive – although not appearing to approach price inflation – by historical standards.
Sectors that typically benefit from faster economic growth, lower taxes, and targeted federal spending outperformed during the fiscal year. These included areas related to infrastructure spending such as basic industry, building, capital goods, commodities, construction, metals & mining, and paper & packaging. Buyers were not indiscriminate, however, as weaker businesses were weeded out and replaced by sturdier names. Meanwhile, healthcare underperformed as a result of uncertainty about the fate of the Affordable Care Act, whatever legislation might replace it, and headlines about high prescription drug prices. Retail also lagged, reflecting the ongoing move from brick-and-mortar stores to online shopping. Similarly, traditional wireline providers struggled amid the shift to wireless communications.
Fund performance
For the fiscal year ended July 31, 2017, Delaware High-Yield Opportunities Fund underperformed its benchmark, the BofA Merrill Lynch US High Yield Constrained Index. The Fund’s Institutional Class shares returned +10.08%. The Fund’s Class A shares returned +9.83% at net asset value and +4.78% at maximum offer price (these figures reflect all distributions reinvested). During the same period, the benchmark returned +11.24%. For complete, annualized performance of Delaware High-Yield Opportunities Fund, please see the table on page 4.
The Fund’s strongest sector contributors during the fiscal year were basic industry and capital goods; the largest detractors were energy and financials. On the individual securities level, our bottom-up (bond by bond) approach to portfolio construction identified several issues that offered nearly the same yield as similar bonds ranking lower on the credit spectrum. A series of incremental moves into those positions
improved the Fund’s credit profile without sacrificing income.
Among individual holdings, Scientific Games International contributed significantly to the Fund’s relative performance. In conducting our due diligence, we became convinced that the company, which provides a wide array of interactive technology products to the global lottery and regulated gaming industries, was committed to deleveraging its balance sheet and improving the pace of its sales growth. Scientific Games International was the Fund’s strongest performer over the fiscal year, and while maintaining a position in the security, we have sold off a portion of the position in order to take some profits.
Prime Security Services Borrower added to the Fund’s performance during the fiscal year. The California-based company provides armed and unarmed security services to homes, businesses, events, individuals, and airports. In the past, we have found various aspects of the security business appealing, particularly its potential to generate recurrent free cash flow. In the case of Prime Security Services Borrower, management indicated a willingness to pull back on capital spending plans and use the savings to pay down debt. As the fiscal year ended, the Fund continued to hold the bonds in anticipation of additional deleveraging that could result in a credit upgrade. The Fund’s position in unsecured, longer-dated Sprint bonds also contributed to relative outperformance on the basis of stronger-than-expected earnings and ongoing rumors about merger and acquisition activity. Though the company’s management is actively attempting to partner with another communications business – either through an acquisition or as an acquisition target itself – we prefer to view Sprint as a stand-alone company that could remain independent indefinitely. The Fund continues to hold Sprint debt as we monitor the company’s
attempt to find an alternative to its stalled merger negotiations with T-Mobile US.
Consumer products company Revlon detracted from the Fund’s relative performance. Management reported poor operating results and compounded the earnings undershoot by failing to provide investors with clear guidance for subsequent quarters. Revlon also was slow to establish an outlet for selling its products on Amazon, an oversight that exacerbated the general softness playing out in the retail sector. Given the lack of clarity, in our view, regarding the company’s prospects, we exited the position in the Fund during the fiscal year.
Albertsons also detracted from performance, although total returns on the bonds were still positive. The company took on additional leverage to finance a number of acquisitions, thereby stressing its balance sheet. Investors were also unnerved by Amazon’s acquisition of Whole Foods, a high-profile corporate marriage that could draw customers away from traditional brick-and-mortar grocery stores, including the roughly 2,400 stores Albertsons owns and operates. We believe concerns about online food shopping are overblown, however, and the Fund retained a position in Albertsons.
Finally, the Fund’s position in consumer products company L Brands detracted from returns. With brands including Victoria’s Secret and Bath & Body Works, we believe the company remains vulnerable to the ongoing slump in mall traffic. We liquidated the Fund’s position in L Brands and deployed the assets elsewhere, following a series of managerial decisions that we did not think would bode well for the company’s prospects.
Despite a mild slip late in the Fund’s fiscal year, high yield fundamentals remained solid and should remain well supported. Given the current level of valuations, however, we are likely to continue to tilt the Fund’s portfolio toward what we view as higher-quality names. Specifically, we remain open to building larger positions when we view a management team as committed to using free cash flow to deleverage its balance sheet. More broadly, we are inclined to view episodes of spread widening as buying opportunities within a generally favorable macroeconomic backdrop for high yield bonds. We believe that elevated valuations within the high yield market should play to our strength as bottom-up bond pickers and our emphasis on uncovering relative value through meticulous credit analysis.
| | |
| Performance summary | | |
| Delaware High-Yield Opportunities Fund | | July 31, 2017 |
The performance quoted represents past performance and does not guarantee future results. Investment return and principal value of an investment will fluctuate so that shares, when redeemed, may be worth more or less than their original cost. Current performance may be lower or higher than the performance quoted. Performance data current to the most recent month end may be obtained by calling 800 523-1918 or visiting delawarefunds.com/performance.
| | | | | | | | |
| Fund and benchmark performance1,2 | | Average annual total returns through July 31, 2017 |
| | | 1 year | | 5 years | | 10 years | | Lifetime |
Class A (Est. Dec. 30, 1996) | | | | | | | | |
Excluding sales charge | | +9.83% | | +5.19% | | +6.53% | | +6.77% |
Including sales charge | | +4.78% | | +4.24% | | +6.04% | | +6.54% |
Class C (Est. Feb. 17, 1998) | | | | . | | | | |
Excluding sales charge | | +9.29% | | +4.42% | | +5.79% | | +5.30% |
Including sales charge | | +8.29% | | +4.42% | | +5.79% | | +5.30% |
Class R (Est. June 2, 2003) | | | | | | | | |
Excluding sales charge | | +9.54% | | +4.94% | | +6.29% | | +7.27% |
Including sales charge | | +9.54% | | +4.94% | | +6.29% | | +7.27% |
Institutional Class (Est. Dec. 30, 1996) | | | | | | | | |
Excluding sales charge | | +10.08% | | +5.46% | | +6.82% | | +7.07% |
Including sales charge | | +10.08% | | +5.46% | | +6.82% | | +7.07% |
BofA Merrill Lynch US High Yield | | | | | | | | |
Constrained Index | | +11.24% | | +6.76% | | +8.10% | | +7.12%* |
* The benchmark lifetime return is for Institutional Class share comparison only and is calculated using the last business day in the month of the Fund’s Institutional Class inception date.
1 Returns reflect the reinvestment of all distributions and are presented both with and without the applicable sales charges described below. Returns do not reflect the deduction of taxes the shareholder would pay on Fund distributions or redemptions of Fund shares.
Expense limitations were in effect for certain classes during some or all of the periods shown in the “Fund and benchmark performance” table. Expenses for each class are listed on the “Fund expense ratios” table on page 6. Performance would have been lower had expense limitations not been in effect.
Institutional Class shares are available without sales or asset-based distribution charges only to certain eligible accounts.
Class A shares are sold with a maximum front-end sales charge of 4.50%, and have an annual distribution and service fee of 0.25% of average daily net assets. The Board has adopted a formula for calculating 12b-1 plan fees for the Fund’s Class A shares. The Fund’s Class A shares are currently subject to a blended 12b-1 fee equal to the sum of: (i) 0.10% of average daily net assets representing shares acquired prior to June 1, 1992, and (ii) 0.25% of average daily net assets representing shares acquired on or after June 1, 1992. All Class A shares currently bear 12b-1 fees at the same rate, the blended rate, currently 0.25% of average daily net assets, based on the formula described above. This method of calculating Class A 12b-1 fees may be discontinued at the sole discretion of the Board.
Performance for Class A shares, excluding sales charges, assumes that no front-end sales charge applied.
Class C shares are sold with a contingent deferred sales charge of 1.00% if redeemed during the first 12 months. They are also subject to an annual distribution and service fee of 1.00% of average daily net assets. Performance for Class C shares, excluding sales charges, assumes either that contingent deferred sales charges did not apply or that the investment was not redeemed.
Class R shares are available only for certain retirement plan products. They are sold without a sales charge and have an annual distribution and service fee of 0.50% of average daily net assets.
Fixed income securities and bond funds can lose value, and investors can lose principal, as interest rates rise. They also may be affected by economic conditions that hinder an issuer’s ability to make interest and principal payments on its debt.
The Fund may also be subject to prepayment risk, the risk that the principal of a bond that is held by a portfolio will be prepaid prior to maturity, at the time when interest rates are lower than what the bond was paying. A portfolio may then have to reinvest that money at a lower interest rate.
High yielding, non-investment-grade bonds (junk bonds) involve higher risk than investment grade bonds. The high yield secondary market is particularly susceptible to liquidity problems when institutional investors, such as mutual funds and certain other financial institutions, temporarily stop buying bonds for regulatory, financial, or other reasons. In addition, a less liquid secondary market makes it more difficult for the Fund to obtain precise valuations of the high yield securities in its portfolio.
The Fund may invest in derivatives, which may involve additional expenses and are subject to risk, including the risk that an underlying security or securities index moves in the opposite direction from what the portfolio manager anticipated. A derivatives transaction depends upon the counterparties’ ability to fulfill their contractual obligations.
The Fund may experience portfolio turnover in excess of 100%, which could result in higher trading costs and tax liability.
International investments entail risks not ordinarily associated with US investments including fluctuation in currency values, differences in accounting principles, or economic or political instability in other nations. Investing in emerging markets can be riskier than investing in established foreign markets due to increased volatility and lower trading volume.
This document may mention bond ratings published by nationally recognized statistical rating organizations (NRSROs) Standard & Poor’s, Moody’s Investors Service, and Fitch, Inc. For securities rated by an NRSRO other than S&P, the rating is converted to the equivalent S&P credit rating. Bonds rated AAA are rated as having the highest quality and are generally considered to have the lowest degree of investment risk. Bonds rated AA are considered to be of high quality, but with a slightly higher degree of risk than bonds rated AAA. Bonds rated A are considered to have many favorable investment qualities, though they are somewhat more susceptible to adverse economic conditions. Bonds rated BBB are believed to be of medium-grade quality and generally riskier over the long term. Bonds rated BB, B, and CCC are regarded as having significant speculative characteristics, with BB indicating the least degree of speculation of the three.
| | |
| Performance summary | | |
| Delaware High-Yield Opportunities Fund | | |
2 The Fund’s expense ratios, as described in the most recent prospectus, are disclosed in the following “Fund expense ratios” table. Delaware Management Company has agreed to reimburse certain expenses and/or waive certain fees in order to prevent total annual fund operating expenses (excluding any 12b-1 fees, acquired fund fees and expenses, taxes, interest, short sale and dividend interest expenses, brokerage fees, certain insurance costs, and nonroutine expenses or costs, including, but not limited to, those relating to reorganizations, litigation, conducting shareholder meetings, and liquidations (collectively, nonroutine expenses)) from exceeding 0.80% of the Fund’s average daily net assets during the period from Aug.1, 2016 through July 31, 2017.* Please see the most recent prospectus and any applicable supplement(s) for additional information on these fee waivers and/or reimbursements.
| | | | | | | | |
| Fund expense ratios | | Class A | | Class C | | Class R | | Institutional Class |
Total annual operating expenses | | 1.14% | | 1.89% | | 1.39% | | 0.89% |
(without fee waivers) | | | | | | | | |
Net expenses | | 1.05% | | 1.80% | | 1.30% | | 0.80% |
(including fee waivers, if any) | | | | | | | | |
Type of waiver | | Contractual | | Contractual | | Contractual | | Contractual |
*The aggregate contractual waiver period covering this report is from Nov. 27, 2015, through Nov. 28, 2017.
Performance of a $10,000 investment1
Average annual total returns from July 31, 2007, through July 31, 2017
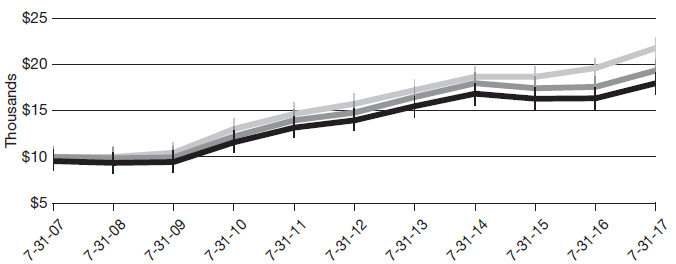
| | | | | | | | | | |
| For period beginning July 31, 2007, through July 31, 2017 | | Starting value | | | Ending value | |

| | BofA Merrill Lynch US High Yield Constrained Index | | | $10,000 | | | | $21,781 | |

| | Delaware High-Yield Opportunities | | | | | | | | |
| | Fund — Institutional Class shares | | | $10,000 | | | | $19,345 | |

| | Delaware High-Yield Opportunities | | | | | | | | |
| | | Fund — Class A shares | | | $9,550 | | | | $17,975 | |
1 The “Performance of a $10,000 investment” graph assumes $10,000 invested in Institutional Class and Class A shares of the Fund on July 31, 2007, and includes the effect of a 4.50% front-end sales charge (for Class A shares) and the reinvestment of all distributions. The graph does not reflect the deduction of taxes the shareholders would pay on Fund distributions or redemptions of Fund shares. Expense limitations were in effect for some or all of the periods shown. Performance would have been lower had expense limitations not been in effect. Expenses are listed in the “Fund expense ratios” table on page 6. Please note additional details on pages 4 through 8.
The graph also assumes $10,000 invested in the BofA Merrill Lynch US High Yield Constrained Index as of July 31, 2007. The BofA Merrill Lynch US High Yield Constrained Index tracks the performance of US dollar-denominated high yield
corporate debt publicly issued in the US domestic market, but caps individual issuer exposure at 2% of the benchmark. Qualifying securities must have, among other things, a below-investment-grade rating (based on an average of Moody’s, Standard & Poor’s, and Fitch), an investment grade issuing country (based on an average of Moody’s, Standard & Poor’s, and Fitch foreign currency long-term sovereign debt ratings), and maturities of one year or more.
Index performance returns do not reflect any management fees, transaction costs, or expenses. Indices are unmanaged and one cannot invest directly in an index. Past performance is not a guarantee of future results.
Performance of other Fund classes will vary due to different charges and expenses.
| | |
| Performance summary | | |
| Delaware High-Yield Opportunities Fund | | |
| | | | | | |
| | | Nasdaq symbols | | CUSIPs | | |
Class A | | DHOAX | | 245908876 | | |
Class C | | DHOCX | | 245908850 | | |
Class R | | DHIRX | | 245908736 | | |
Institutional Class | | DHOIX | | 245908843 | | |
This page intentionally left blank.
| | |
| Disclosure of Fund expenses | | |
| For the six-month period from February 1, 2017 to July 31, 2017 (Unaudited) | | |
As a shareholder of the Fund, you incur two types of costs: (1) transaction costs, including sales charges (loads) on purchase payments, reinvested dividends, or other distributions; redemption fees; and exchange fees; and (2) ongoing costs, including management fees; distribution and/or service (12b-1) fees; and other Fund expenses. This example is intended to help you understand your ongoing costs (in dollars) of investing in the Fund and to compare these costs with the ongoing costs of investing in other mutual funds.
The example is based on an investment of $1,000 invested at the beginning of the period and held for the entire six-month period from Feb. 1, 2017 to July 31, 2017.
Actual expenses
The first section of the table shown, “Actual Fund return,” provides information about actual account values and actual expenses. You may use the information in this section of the table, together with the amount you invested, to estimate the expenses that you paid over the period. Simply divide your account value by $1,000 (for example, an $8,600 account value divided by $1,000 = 8.6), then multiply the result by the number in the first section under the heading entitled “Expenses Paid During Period” to estimate the expenses you paid on your account during this period.
Hypothetical example for comparison purposes
The second section of the table shown, “Hypothetical 5% return,” provides information about hypothetical account values and hypothetical expenses based on the Fund’s actual expense ratio and an assumed rate of return of 5% per year before expenses, which is not the Fund’s actual return. The hypothetical account values and expenses may not be used to estimate the actual ending account balance or expenses you paid for the period. You may use this information to compare the ongoing costs of investing in the Fund and other funds. To do so, compare this 5% hypothetical example with the 5% hypothetical examples that appear in the shareholder reports of the other funds.
Please note that the expenses shown in the table are meant to highlight your ongoing costs only and do not reflect any transactional costs, such as sales charges (loads), redemption fees, or exchange fees. Therefore, the second section of the table is useful in comparing ongoing costs only, and will not help you determine the relative total costs of owning different funds. In addition, if these transactional costs were included, your costs would have been higher. The Fund’s expenses shown in the table reflect fee waivers in effect. The expenses shown in the table assume reinvestment of all dividends and distributions.
Delaware High-Yield Opportunities Fund
Expense analysis of an investment of $1,000
| | | | | | | | | | | | | | | | | | | | |
| | | Beginning
Account Value
2/1/17 | | Ending
Account Value
7/31/17 | | Annualized
Expense Ratio | | Expenses
Paid During Period
2/1/17 to 7/31/17* |
| | | | |
Actual Fund return† | | | | | | | | | | | | | | | | | |
Class A | | | | $1,000.00 | | | | | $1,045.60 | | | 1.05% | | | | $5.33 | |
Class C | | | | 1,000.00 | | | | | 1,044.50 | | | 1.80% | | | | 9.12 | |
Class R | | | | 1,000.00 | | | | | 1,044.30 | | | 1.30% | | | | 6.59 | |
Institutional Class | | | | 1,000.00 | | | | | 1,046.90 | | | 0.80% | | | | 4.06 | |
| | |
Hypothetical 5% return (5% return before expenses) | | | | | | | | |
Class A | | | | $1,000.00 | | | | | $1,019.59 | | | 1.05% | | | | $5.26 | |
Class C | | | | 1,000.00 | | | | | 1,015.87 | | | 1.80% | | | | 9.00 | |
Class R | | | | 1,000.00 | | | | | 1,018.35 | | | 1.30% | | | | 6.51 | |
Institutional Class | | | | 1,000.00 | | | | | 1,020.83 | | | 0.80% | | | | 4.01 | |
* “Expenses Paid During Period” are equal to the Fund’s annualized expense ratio, multiplied by the average account value over the period, multiplied by 181/365 (to reflect the one-half year period).
† Because actual returns reflect only the most recent six-month period, the returns shown may differ significantly from fiscal year returns.
| | |
| Security type / sector allocation | | |
| Delaware High-Yield Opportunities Fund | | As of July 31, 2017 (Unaudited) |
Sector designations may be different than the sector designations presented in other Fund materials. The sector designations may represent the investment manager’s internal sector classifications.
| | | | | |
| Security type / sector | | Percentage of net assets |
Convertible Bond | | | | 0.17% | |
Corporate Bonds | | | | 92.86% | |
Automotive | | | | 0.46% | |
Banking | | | | 3.39% | |
Basic Industry | | | | 14.64% | |
Capital Goods | | | | 3.19% | |
Consumer Cyclical | | | | 8.04% | |
Consumer Non-Cyclical | | | | 3.72% | |
Energy | | | | 14.27% | |
Financial Services | | | | 1.68% | |
Healthcare | | | | 9.62% | |
Insurance | | | | 2.14% | |
Media | | | | 10.72% | |
Services | | | | 6.41% | |
Technology & Electronics | | | | 4.03% | |
Telecommunications | | | | 6.44% | |
Transportation | | | | 1.02% | |
Utilities | | | | 3.09% | |
Loan Agreements | | | | 2.58% | |
Municipal Bond | | | | 0.29% | |
Common Stock | | | | 0.00% | |
Preferred Stock | | | | 1.37% | |
Short-Term Investments | | | | 3.22% | |
Total Value of Securities | | | | 100.49% | |
Liabilities Net of Receivables and Other Assets | | | | (0.49%) | |
Total Net Assets | | | | 100.00% | |
| | |
| Schedule of investments | | |
| Delaware High-Yield Opportunities Fund | | July 31, 2017 |
| | | | | | | | |
| | | Principal amount° | | | Value (US $) | |
Convertible Bond – 0.17% | | | | | | | | |
General Cable 4.50% exercise price $31.01, maturity date 11/15/29 f | | | 560,000 | | | $ | 495,600 | |
| | | | | | | | |
Total Convertible Bond (cost $441,445) | | | | | | | 495,600 | |
| | | | | | | | |
|
| |
Corporate Bonds – 92.86% | | | | | | | | |
Automotive – 0.46% | | | | | | | | |
American Tire Distributors 144A 10.25% 3/1/22 # | | | 1,255,000 | | | | 1,314,613 | |
| | | | | | | | |
| | | | | | | 1,314,613 | |
| | | | | | | | |
Banking – 3.39% | | | | | | | | |
Ally Financial 5.75% 11/20/25 | | | 2,120,000 | | | | 2,276,350 | |
Credit Suisse Group 144A 6.25% #y● | | | 1,380,000 | | | | 1,484,014 | |
Lloyds Banking Group 7.50% y● | | | 655,000 | | | | 730,325 | |
Popular 7.00% 7/1/19 | | | 2,238,000 | | | | 2,372,280 | |
Royal Bank of Scotland Group 8.625% y● | | | 1,070,000 | | | | 1,184,361 | |
UBS Group 6.875% y● | | | 1,425,000 | | | | 1,565,426 | |
| | | | | | | | |
| | | | | | | 9,612,756 | |
| | | | | | | | |
Basic Industry – 14.64% | | | | | | | | |
Allegheny Technologies 7.875% 8/15/23 | | | 949,000 | | | | 1,001,195 | |
BMC East 144A 5.50% 10/1/24 # | | | 1,015,000 | | | | 1,070,825 | |
Boise Cascade 144A 5.625% 9/1/24 # | | | 1,705,000 | | | | 1,781,725 | |
Builders FirstSource | | | | | | | | |
144A 5.625% 9/1/24 # | | | 855,000 | | | | 900,956 | |
144A 10.75% 8/15/23 # | | | 1,340,000 | | | | 1,547,700 | |
Cemex 144A 7.75% 4/16/26 # | | | 1,780,000 | | | | 2,047,000 | |
Cemex Finance 144A 6.00% 4/1/24 # | | | 895,000 | | | | 952,056 | |
Chemours | | | | | | | | |
5.375% 5/15/27 | | | 810,000 | | | | 855,563 | |
7.00% 5/15/25 | | | 600,000 | | | | 672,000 | |
Cliffs Natural Resources 144A 5.75% 3/1/25 # | | | 1,120,000 | | | | 1,097,600 | |
Coeur Mining 144A 5.875% 6/1/24 # | | | 995,000 | | | | 986,294 | |
FMG Resources 144A 5.125% 5/15/24 # | | | 1,295,000 | | | | 1,351,656 | |
Freeport-McMoRan 6.875% 2/15/23 | | | 2,660,000 | | | | 2,906,050 | |
Hexion 144A 10.375% 2/1/22 # | | | 835,000 | | | | 849,613 | |
Hudbay Minerals | | | | | | | | |
144A 7.25% 1/15/23 # | | | 165,000 | | | | 179,644 | |
144A 7.625% 1/15/25 # | | | 1,290,000 | | | | 1,422,225 | |
Joseph T Ryerson & Son 144A 11.00% 5/15/22 # | | | 1,305,000 | | | | 1,494,225 | |
Koppers 144A 6.00% 2/15/25 # | | | 1,585,000 | | | | 1,691,987 | |
Kraton Polymers | | | | | | | | |
144A 7.00% 4/15/25 # | | | 1,100,000 | | | | 1,188,000 | |
144A 10.50% 4/15/23 # | | | 615,000 | | | | 718,013 | |
NCI Building Systems 144A 8.25% 1/15/23 # | | | 1,465,000 | | | | 1,589,525 | |
| | |
| Schedule of investments | | |
| Delaware High-Yield Opportunities Fund | | |
| | | | | | | | |
| | | Principal amount° | | | Value (US $) | |
Corporate Bonds (continued) | | | | | | | | |
Basic Industry (continued) | | | | | | | | |
New Gold | | | | | | | | |
144A 6.25% 11/15/22 # | | | 615,000 | | | $ | 639,600 | |
144A 6.375% 5/15/25 # | | | 1,060,000 | | | | 1,102,400 | |
NOVA Chemicals 144A 5.25% 6/1/27 # | | | 1,450,000 | | | | 1,457,250 | |
Novelis 144A 6.25% 8/15/24 # | | | 1,700,000 | | | | 1,823,250 | |
Olin 5.125% 9/15/27 | | | 1,510,000 | | | | 1,588,807 | |
Steel Dynamics 5.00% 12/15/26 | | | 1,630,000 | | | | 1,723,725 | |
Summit Materials | | | | | | | | |
144A 5.125% 6/1/25 # | | | 770,000 | | | | 793,100 | |
6.125% 7/15/23 | | | 1,910,000 | | | | 2,010,275 | |
8.50% 4/15/22 | | | 315,000 | | | | 355,950 | |
US Concrete 6.375% 6/1/24 | | | 1,585,000 | | | | 1,699,913 | |
Zekelman Industries 144A 9.875% 6/15/23 # | | | 1,750,000 | | | | 1,986,250 | |
| | | | | | | | |
| | | | | | | 41,484,372 | |
| | | | | | | | |
Capital Goods – 3.19% | | | | | | | | |
Ardagh Packaging Finance 144A 6.00% 2/15/25 # | | | 1,365,000 | | | | 1,461,396 | |
BWAY Holding | | | | | | | | |
144A 5.50% 4/15/24 # | | | 1,370,000 | | | | 1,440,213 | |
144A 7.25% 4/15/25 # | | | 1,090,000 | | | | 1,139,050 | |
Flex Acquisition 144A 6.875% 1/15/25 # | | | 1,370,000 | | | | 1,441,069 | |
General Cable 5.75% 10/1/22 | | | 520,000 | | | | 535,600 | |
StandardAero Aviation Holdings 144A 10.00% 7/15/23 # | | | 1,365,000 | | | | 1,518,563 | |
TransDigm 6.375% 6/15/26 | | | 1,435,000 | | | | 1,503,163 | |
| | | | | | | | |
| | | | | | | 9,039,054 | |
| | | | | | | | |
Consumer Cyclical – 8.04% | | | | | | | | |
AMC Entertainment Holdings 6.125% 5/15/27 | | | 1,420,000 | | | | 1,464,233 | |
Boyd Gaming 6.375% 4/1/26 | | | 1,980,000 | | | | 2,163,150 | |
ESH Hospitality 144A 5.25% 5/1/25 # | | | 2,290,000 | | | | 2,398,775 | |
JC Penney 8.125% 10/1/19 | | | 523,000 | | | | 572,031 | |
Landry’s 144A 6.75% 10/15/24 # | | | 1,275,000 | | | | 1,310,445 | |
Lithia Motors 144A 5.25% 8/1/25 # | | | 705,000 | | | | 727,913 | |
Live Nation Entertainment 144A 4.875% 11/1/24 # | | | 1,020,000 | | | | 1,048,050 | |
M/I Homes 144A 5.625% 8/1/25 # | | | 1,200,000 | | | | 1,200,000 | |
MGM Resorts International 4.625% 9/1/26 | | | 1,365,000 | | | | 1,387,932 | |
Mohegan Gaming & Entertainment 144A | | | | | | | | |
7.875% 10/15/24 # | | | 2,040,000 | | | | 2,162,400 | |
Penn National Gaming 144A 5.625% 1/15/27 # | | | 1,555,000 | | | | 1,605,537 | |
Penske Automotive Group 5.50% 5/15/26 | | | 2,095,000 | | | | 2,105,475 | |
PetSmart 144A 5.875% 6/1/25 # | | | 1,285,000 | | | | 1,240,828 | |
Rite Aid 144A 6.125% 4/1/23 # | | | 900,000 | | | | 895,500 | |
Scientific Games International 10.00% 12/1/22 | | | 2,230,000 | | | | 2,494,813 | |
| | | | | | | | |
| | | | | | | 22,777,082 | |
| | | | | | | | |
| | | | | | | | |
| | | Principal amount° | | | Value (US $) | |
Corporate Bonds (continued) | | | | | | | | |
Consumer Non-Cyclical – 3.72% | | | | | | | | |
Albertsons 144A 6.625% 6/15/24 # | | | 2,135,000 | | | $ | 2,012,237 | |
Cott Holdings 144A 5.50% 4/1/25 # | | | 1,500,000 | | | | 1,580,625 | |
Dean Foods 144A 6.50% 3/15/23 # | | | 1,285,000 | | | | 1,334,794 | |
JBS USA LUX 144A 5.75% 6/15/25 # | | | 1,665,000 | | | | 1,656,675 | |
Kronos Acquisition Holdings 144A 9.00% 8/15/23 # | | | 1,485,000 | | | | 1,496,137 | |
Post Holdings | | | | | | | | |
144A 5.00% 8/15/26 # | | | 795,000 | | | | 817,856 | |
144A 5.75% 3/1/27 # | | | 753,000 | | | | 801,945 | |
Tempur Sealy International 5.50% 6/15/26 | | | 810,000 | | | | 836,325 | |
| | | | | | | | |
| | | | | | | 10,536,594 | |
| | | | | | | | |
Energy – 14.27% | | | | | | | | |
Alta Mesa Holdings 144A 7.875% 12/15/24 # | | | 1,600,000 | | | | 1,688,000 | |
AmeriGas Partners 5.875% 8/20/26 | | | 1,465,000 | | | | 1,508,950 | |
Andeavor Logistics Finance 5.25% 1/15/25 | | | 1,500,000 | | | | 1,610,625 | |
Antero Resources | | | | | | | | |
5.00% 3/1/25 | | | 530,000 | | | | 524,700 | |
5.625% 6/1/23 | | | 342,000 | | | | 352,260 | |
Cheniere Corpus Christi Holdings | | | | | | | | |
144A 5.125% 6/30/27 # | | | 480,000 | | | | 501,000 | |
5.875% 3/31/25 | | | 715,000 | | | | 777,563 | |
7.00% 6/30/24 | | | 830,000 | | | | 949,313 | |
Chesapeake Energy | | | | | | | | |
144A 8.00% 12/15/22 # | | | 432,000 | | | | 459,540 | |
144A 8.00% 1/15/25 # | | | 460,000 | | | | 462,875 | |
Crestwood Midstream Partners 5.75% 4/1/25 | | | 1,405,000 | | | | 1,415,537 | |
Genesis Energy | | | | | | | | |
6.00% 5/15/23 | | | 855,000 | | | | 850,725 | |
6.75% 8/1/22 | | | 1,090,000 | | | | 1,111,800 | |
Gulfport Energy 6.625% 5/1/23 | | | 1,550,000 | | | | 1,573,250 | |
Halcon Resources 144A 6.75% 2/15/25 # | | | 1,520,000 | | | | 1,561,800 | |
Hilcorp Energy I | | | | | | | | |
144A 5.00% 12/1/24 # | | | 700,000 | | | | 668,150 | |
144A 5.75% 10/1/25 # | | | 740,000 | | | | 725,200 | |
Laredo Petroleum 6.25% 3/15/23 | | | 1,650,000 | | | | 1,709,813 | |
Murphy Oil 6.875% 8/15/24 | | | 2,220,000 | | | | 2,364,300 | |
Murphy Oil USA 5.625% 5/1/27 | | | 1,475,000 | | | | 1,557,969 | |
Newfield Exploration 5.375% 1/1/26 | | | 1,435,000 | | | | 1,503,163 | |
NGPL PipeCo | | | | | | | | |
144A 4.375% 8/15/22 # | | | 200,000 | | | | 206,250 | |
144A 4.875% 8/15/27 # | | | 250,000 | | | | 258,125 | |
NuStar Logistics 5.625% 4/28/27 | | | 1,583,000 | | | | 1,681,937 | |
| | |
| Schedule of investments | | |
| Delaware High-Yield Opportunities Fund | | |
| | | | | | | | |
| | | Principal amount° | | | Value (US $) | |
Corporate Bonds (continued) | | | | | | | | |
Energy (continued) | | | | | | | | |
Oasis Petroleum | | | | | | | | |
6.50% 11/1/21 | | | 370,000 | | | $ | 367,225 | |
6.875% 3/15/22 | | | 1,380,000 | | | | 1,373,100 | |
Precision Drilling | | | | | | | | |
6.50% 12/15/21 | | | 955,000 | | | | 943,063 | |
6.625% 11/15/20 | | | 660,690 | | | | 657,387 | |
7.75% 12/15/23 | | | 506,000 | | | | 511,060 | |
QEP Resources 6.875% 3/1/21 | | | 2,095,000 | | | | 2,204,987 | |
Southwestern Energy | | | | | | | | |
4.10% 3/15/22 | | | 740,000 | | | | 693,750 | |
6.70% 1/23/25 | | | 1,465,000 | | | | 1,449,896 | |
Summit Midstream Holdings 5.75% 4/15/25 | | | 990,000 | | | | 1,007,325 | |
Targa Resources Partners 144A 5.375% 2/1/27 # | | | 1,420,000 | | | | 1,480,350 | |
Transocean 144A 9.00% 7/15/23 # | | | 1,375,000 | | | | 1,443,750 | |
Transocean Proteus 144A 6.25% 12/1/24 # | | | 703,000 | | | | 739,907 | |
WildHorse Resource Development 144A 6.875% 2/1/25 # | | | 1,580,000 | | | | 1,552,350 | |
| | | | | | | | |
| | | | | | | 40,446,995 | |
| | | | | | | | |
Financial Services – 1.68% | | | | | | | | |
AerCap Global Aviation Trust 144A 6.50% 6/15/45 #● | | | 1,630,000 | | | | 1,760,400 | |
E*TRADE Financial 5.875% y● | | | 1,595,000 | | | | 1,715,582 | |
NFP 144A 6.875% 7/15/25 # | | | 1,270,000 | | | | 1,295,241 | |
| | | | | | | | |
| | | | | | | 4,771,223 | |
| | | | | | | | |
Healthcare – 9.62% | | | | | | | | |
Air Medical Group Holdings 144A 6.375% 5/15/23 # | | | 2,058,000 | | | | 1,985,970 | |
Change Healthcare Holdings 144A 5.75% 3/1/25 # | | | 1,580,000 | | | | 1,639,250 | |
CHS 6.25% 3/31/23 | | | 1,390,000 | | | | 1,428,225 | |
DaVita 5.00% 5/1/25 | | | 1,945,000 | | | | 1,978,649 | |
HCA | | | | | | | | |
5.375% 2/1/25 | | | 2,375,000 | | | | 2,533,218 | |
5.875% 2/15/26 | | | 1,020,000 | | | | 1,114,350 | |
7.58% 9/15/25 | | | 690,000 | | | | 799,537 | |
HealthSouth | | | | | | | | |
5.75% 11/1/24 | | | 835,000 | | | | 853,787 | |
5.75% 9/15/25 | | | 1,895,000 | | | | 1,961,325 | |
Hill-Rom Holdings | | | | | | | | |
144A 5.00% 2/15/25 # | | | 590,000 | | | | 609,175 | |
144A 5.75% 9/1/23 # | | | 1,105,000 | | | | 1,171,300 | |
inVentiv Group Holdings 144A 7.50% 10/1/24 # | | | 900,000 | | | | 990,000 | |
Mallinckrodt International Finance | | | | | | | | |
144A 5.50% 4/15/25 # | | | 285,000 | | | | 265,050 | |
144A 5.625% 10/15/23 # | | | 1,030,000 | | | | 991,375 | |
MPH Acquisition Holdings 144A 7.125% 6/1/24 # | | | 2,200,000 | | | | 2,387,000 | |
| | | | | | | | |
| | | Principal amount° | | | Value (US $) | |
Corporate Bonds (continued) | | | | | | | | |
Healthcare (continued) | | | | | | | | |
Surgery Center Holdings | | | | | | | | |
144A 6.75% 7/1/25 # | | | 730,000 | | | $ | 751,900 | |
144A 8.875% 4/15/21 # | | | 730,000 | | | | 793,875 | |
Tenet Healthcare | | | | | | | | |
144A 5.125% 5/1/25 # | | | 1,200,000 | | | | 1,210,500 | |
144A 7.00% 8/1/25 # | | | 695,000 | | | | 687,402 | |
8.00% 8/1/20 | | | 2,040,000 | | | | 2,075,700 | |
8.125% 4/1/22 | | | 970,000 | | | | 1,045,175 | |
| | | | | | | | |
| | | | | | | 27,272,763 | |
| | | | | | | | |
Insurance – 2.14% | | | | | | | | |
AssuredPartners 144A 7.00% 8/15/25 # | | | 1,255,000 | | | | 1,267,550 | |
HUB International 144A 7.875% 10/1/21 # | | | 2,545,000 | | | | 2,669,069 | |
USIS Merger Sub 144A 6.875% 5/1/25 # | | | 2,050,000 | | | | 2,126,875 | |
| | | | | | | | |
| | | | | | | 6,063,494 | |
| | | | | | | | |
Media – 10.72% | | | | | | | | |
Altice Luxembourg 144A 7.75% 5/15/22 # | | | 2,220,000 | | | | 2,361,525 | |
CCO Holdings | | | | | | | | |
144A 5.50% 5/1/26 # | | | 25,000 | | | | 26,633 | |
144A 5.75% 2/15/26 # | | | 1,095,000 | | | | 1,179,863 | |
144A 5.875% 5/1/27 # | | | 1,480,000 | | | | 1,595,617 | |
Cequel Communications Holdings I 144A 7.75% 7/15/25 # | | | 725,000 | | | | 812,906 | |
CSC Holdings 144A 10.875% 10/15/25 # | | | 2,970,000 | | | | 3,712,500 | |
DISH DBS 7.75% 7/1/26 | | | 1,491,000 | | | | 1,789,200 | |
Gray Television 144A 5.875% 7/15/26 # | | | 2,320,000 | | | | 2,407,000 | |
Lamar Media 5.75% 2/1/26 | | | 990,000 | | | | 1,079,100 | |
Nexstar Broadcasting 144A 5.625% 8/1/24 # | | | 1,390,000 | | | | 1,440,387 | |
Nielsen Co Luxembourg 144A 5.00% 2/1/25 # | | | 805,000 | | | | 833,175 | |
Radiate Holdco 144A 6.625% 2/15/25 # | | | 1,450,000 | | | | 1,455,437 | |
SFR Group 144A 7.375% 5/1/26 # | | | 2,210,000 | | | | 2,400,613 | |
Sinclair Television Group 144A 5.125% 2/15/27 # | | | 1,465,000 | | | | 1,457,675 | |
Sirius XM Radio 144A 5.375% 4/15/25 # | | | 1,600,000 | | | | 1,684,000 | |
Tribune Media 5.875% 7/15/22 | | | 1,260,000 | | | | 1,327,725 | |
Virgin Media Secured Finance 144A 5.25% 1/15/26 # | | | 1,795,000 | | | | 1,873,531 | |
VTR Finance 144A 6.875% 1/15/24 # | | | 2,745,000 | | | | 2,933,719 | |
| | | | | | | | |
| | | | | | | 30,370,606 | |
| | | | | | | | |
Services – 6.41% | | | | | | | | |
Advanced Disposal Services 144A 5.625% 11/15/24 # | | | 1,665,000 | | | | 1,731,600 | |
Avis Budget Car Rental 144A 6.375% 4/1/24 # | | | 1,095,000 | | | | 1,129,903 | |
Cardtronics 144A 5.50% 5/1/25 # | | | 1,165,000 | | | | 1,202,863 | |
Covanta Holding 5.875% 7/1/25 | | | 1,320,000 | | | | 1,287,000 | |
GEO Group | | | | | | | | |
5.875% 10/15/24 | | | 590,000 | | | | 615,813 | |
| | |
| Schedule of investments | | |
| Delaware High-Yield Opportunities Fund | | |
| | | | | | | | |
| | | Principal amount° | | | Value (US $) | |
Corporate Bonds (continued) | | | | | | | | |
Services (continued) | | | | | | | | |
GEO Group | | | | | | | | |
6.00% 4/15/26 | | | 1,215,000 | | | $ | 1,271,060 | |
Herc Rentals | | | | | | | | |
144A 7.50% 6/1/22 # | | | 419,000 | | | | 455,663 | |
144A 7.75% 6/1/24 # | | | 922,000 | | | | 1,004,980 | |
Iron Mountain US Holdings 144A 5.375% 6/1/26 # | | | 1,635,000 | | | | 1,745,363 | |
KAR Auction Services 144A 5.125% 6/1/25 # | | | 690,000 | | | | 721,050 | |
Prime Security Services Borrower 144A 9.25% 5/15/23 # | | | 3,340,000 | | | | 3,736,625 | |
Team Health Holdings 144A 6.375% 2/1/25 # | | | 1,165,000 | | | | 1,144,613 | |
United Rentals North America 5.50% 5/15/27 | | | 1,990,000 | | | | 2,104,425 | |
| | | | | | | | |
| | | | | | | 18,150,958 | |
| | | | | | | | |
Technology & Electronics – 4.03% | | | | | | | | |
CDK Global 5.00% 10/15/24 | | | 1,515,000 | | | | 1,609,687 | |
CDW Finance 5.00% 9/1/25 | | | 760,000 | | | | 797,529 | |
CommScope Technologies | | | | | | | | |
144A 5.00% 3/15/27 # | | | 1,290,000 | | | | 1,296,450 | |
144A 6.00% 6/15/25 # | | | 100,000 | | | | 108,000 | |
Entegris 144A 6.00% 4/1/22 # | | | 1,480,000 | | | | 1,551,617 | |
Genesys Telecommunications Laboratories | | | | | | | | |
144A 10.00% 11/30/24 # | | | 790,000 | | | | 898,625 | |
Infor US 6.50% 5/15/22 | | | 1,435,000 | | | | 1,501,369 | |
Sensata Technologies UK Financing 144A | | | | | | | | |
6.25% 2/15/26 # | | | 1,545,000 | | | | 1,691,775 | |
Solera 144A 10.50% 3/1/24 # | | | 1,000,000 | | | | 1,155,000 | |
Symantec 144A 5.00% 4/15/25 # | | | 765,000 | | | | 803,250 | |
| | | | | | | | |
| | | | | | | 11,413,302 | |
| | | | | | | | |
Telecommunications – 6.44% | | | | | | | | |
CenturyLink | | | | | | | | |
6.75% 12/1/23 | | | 1,740,000 | | | | 1,853,100 | |
7.50% 4/1/24 | | | 305,000 | | | | 332,068 | |
Cincinnati Bell 144A 7.00% 7/15/24 # | | | 2,120,000 | | | | 2,151,800 | |
CyrusOne 144A 5.375% 3/15/27 # | | | 1,335,000 | | | | 1,413,431 | |
Level 3 Financing 5.375% 5/1/25 | | | 1,305,000 | | | | 1,389,825 | |
Sprint | | | | | | | | |
7.125% 6/15/24 | | | 2,290,000 | | | | 2,516,137 | |
7.875% 9/15/23 | | | 640,000 | | | | 728,000 | |
Telecom Italia 144A 5.303% 5/30/24 # | | | 795,000 | | | | 875,494 | |
T-Mobile USA | | | | | | | | |
6.375% 3/1/25 | | | 1,145,000 | | | | 1,235,169 | |
6.50% 1/15/26 | | | 100,000 | | | | 111,500 | |
Uniti Group 144A 7.125% 12/15/24 # | | | 2,220,000 | | | | 2,175,600 | |
Wind Acquisition Finance 144A 7.375% 4/23/21 # | | | 1,105,000 | | | | 1,151,106 | |
| | | | | | | | |
| | | Principal amount° | | | Value (US $) | |
Corporate Bonds (continued) | | | | | | | | |
Telecommunications (continued) | | | | | | | | |
Zayo Group 6.375% 5/15/25 | | | 2,120,000 | | | $ | 2,305,500 | |
| | | | | | | | |
| | | | | | | 18,238,730 | |
| | | | | | | | |
Transportation –1.02% | | | | | | | | |
DAE Funding | | | | | | | | |
144A 4.50% 8/1/22 # | | | 525,000 | | | | 535,500 | |
144A 5.00% 8/1/24 # | | | 480,000 | | | | 491,400 | |
XPO Logistics 144A 6.125% 9/1/23 # | | | 1,790,000 | | | | 1,868,313 | |
| | | | | | | | |
| | | | | | | 2,895,213 | |
| | | | | | | | |
Utilities – 3.09% | | | | | | | | |
AES | | | | | | | | |
5.50% 4/15/25 | | | 1,405,000 | | | | 1,478,763 | |
6.00% 5/15/26 | | | 285,000 | | | | 307,444 | |
Calpine 5.75% 1/15/25 | | | 750,000 | | | | 701,250 | |
Dynegy | | | | | | | | |
6.75% 11/1/19 | | | 705,000 | | | | 732,759 | |
7.375% 11/1/22 | | | 755,000 | | | | 767,269 | |
144A 8.00% 1/15/25 # | | | 1,910,000 | | | | 1,900,450 | |
Emera 6.75% 6/15/76 ● | | | 1,335,000 | | | | 1,528,575 | |
Enel 144A 8.75% 9/24/73 #● | | | 1,108,000 | | | | 1,337,910 | |
| | | | | | | | |
| | | | | | | 8,754,420 | |
| | | | | | | | |
Total Corporate Bonds (cost $252,692,552) | | | | | | | 263,142,175 | |
| | | | | | | | |
|
| |
Loan Agreements – 2.58%« | | | | | | | | |
Accudyne Industries Borrower 1st Lien 4.234% 12/13/19 | | | 143,604 | | | | 143,402 | |
Applied Systems 2nd Lien 7.796% 1/23/22 | | | 2,143,009 | | | | 2,170,242 | |
BJ’s Wholesale Club 2nd Lien 8.71% 1/27/25 | | | 212,000 | | | | 207,495 | |
CH Hold 2nd Lien 8.476% 2/1/25 | | | 380,000 | | | | 390,925 | |
Colorado Buyer 2nd Lien 8.42% 5/1/25 | | | 735,000 | | | | 742,350 | |
Kronos 2nd Lien 9.561% 11/1/24 | | | 1,405,000 | | | | 1,457,395 | |
Russell Investments US Institutional Holdco Tranche B 1st Lien 6.972% 6/1/23 | | | 1,420,093 | | | | 1,436,956 | |
Summit Midstream Partners Holdings Tranche B 1st Lien 7.234% 5/21/22 | | | 735,000 | | | | 748,781 | |
| | | | | | | | |
Total Loan Agreements (cost $6,935,629) | | | | | | | 7,297,546 | |
| | | | | | | | |
|
| |
Municipal Bond – 0.29% | | | | | | | | |
Buckeye, Ohio Tobacco Settlement Financing Authority
(Asset-Backed Senior Turbo) Series A-2 5.875% 6/1/47 | | | 865,000 | | | | 819,284 | |
| | | | | | | | |
Total Municipal Bond (cost $832,625) | | | | | | | 819,284 | |
| | | | | | | | |
| | |
| Schedule of investments | | |
| Delaware High-Yield Opportunities Fund | | |
| | | | | | | | |
| | | Number of shares | | | Value (US $) | |
Common Stock – 0.00% | | | | | | | | |
Century Communications =† | | | 4,250,000 | | | $ | 0 | |
| | | | | | | | |
Total Common Stock (cost $128,662) | | | | | | | 0 | |
| | | | | | | | |
|
| |
Preferred Stock – 1.37% | | | | | | | | |
Bank of America 6.50%● | | | 1,725,000 | | | | 1,949,250 | |
GMAC Capital Trust I 6.967%● | | | 73,000 | | | | 1,938,150 | |
| | | | | | | | |
Total Preferred Stock (cost $3,646,500) | | | | | | | 3,887,400 | |
| | | | | | | | |
| | |
| | | Principal amount° | | | | |
Short-Term Investments – 3.22% | | | | | | | | |
Repurchase Agreements – 3.22% | | | | | | | | |
Bank of America Merrill Lynch | | | | | | | | |
0.97%, dated 7/31/17, to be repurchased on 8/1/17, repurchase price $1,670,823 (collateralized by US government obligations 0.125% 4/15/18; market value $1,704,194) | | | 1,670,778 | | | | 1,670,778 | |
Bank of Montreal | | | | | | | | |
0.90%, dated 7/31/17, to be repurchased on 8/1/17, repurchase price $4,177,048 (collateralized by US government obligations 0.00%–4.375% 1/11/18–8/15/40; market value $4,260,483) | | | 4,176,944 | | | | 4,176,944 | |
BNP Paribas | | | | | | | | |
1.04%, dated 7/31/17, to be repurchased on 8/1/17, repurchase price $3,283,373 (collateralized by US government obligations 0.00%–2.50% 10/12/17–8/15/46; market value $3,348,944) | | | 3,283,278 | | | | 3,283,278 | |
| | | | | | | | |
Total Short-Term Investments (cost $9,131,000) | | | | | | | 9,131,000 | |
| | | | | | | | |
Total Value of Securities – 100.49%
(cost $273,808,413) | | | | | | $ | 284,773,005 | |
| | | | | | | | |
| # | Security exempt from registration under Rule 144A of the Securities Act of 1933, as amended. At July 31, 2017, the aggregate value of Rule 144A securities was $155,561,720, which represents 54.90% of the Fund’s net assets. See Note 10 in “Notes to financial statements.” |
| = | Security is being fair valued in accordance with the Fund’s fair valuation policy. At July 31, 2017, the aggregate value of fair valued securities was $0, which represents 0.00% of the Fund’s net assets. See Note 1 in “Notes to financial statements.” |
| « | Loan agreements generally pay interest at rates which are periodically reset by reference to a base lending rate plus a premium. These base lending rates are generally: (i) the prime rate offered by one or more US banks, (ii) the lending rate offered by one or more European banks such as the London Interbank Offered Rate (LIBOR), and (iii) the certificate of deposit rate. Loan agreements may be subject to restrictions on resale. Stated rate in effect at July 31, 2017. |
| ° | Principal amount shown is stated in US dollars unless noted that the security is denominated in another currency. |
| y | No contractual maturity date. |
| † | Non-income producing security. |
| ● | Variable rate security. Each rate shown is as of July 31, 2017. Interest rates reset periodically. |
| f | Step coupon bond. Coupon increases or decreases periodically based on a predetermined schedule. Stated rate in effect at July 31, 2017. |
See accompanying notes, which are an integral part of the financial statements.
| | |
| Statement of assets and liabilities | | |
| Delaware High-Yield Opportunities Fund | | July 31, 2017 |
| | | | |
Assets: | | | | |
Investments, at value1 | | $ | 275,642,005 | |
Short-term investments, at value2 | | | 9,131,000 | |
Cash | | | 49,617 | |
Interest receivable | | | 4,409,346 | |
Receivable for securities sold | | | 3,086,010 | |
Receivable for fund shares sold | | | 57,865 | |
Other assets3 | | | 786,990 | |
| | | | |
Total assets | | | 293,162,833 | |
| | | | |
| |
Liabilities: | | | | |
Payable for securities purchased | | | 4,668,213 | |
Payable for fund shares redeemed | | | 1,715,586 | |
Distribution payable | | | 355,514 | |
Investment management fees payable to affiliates | | | 161,169 | |
Other accrued expenses | | | 144,273 | |
Distribution fees payable to affiliates | | | 69,912 | |
Audit and tax fees payable | | | 43,158 | |
Dividend disbursing and transfer agent fees and expenses payable to affiliates | | | 4,792 | |
Accounting and administration expenses payable to affiliates | | | 1,115 | |
Trustees’ fees and expenses payable | | | 699 | |
Legal fees payable to affiliates | | | 302 | |
Reports and statements to shareholders expenses payable to affiliates | | | 248 | |
Contingent liabilities3 | | | 2,623,299 | |
| | | | |
Total liabilities | | | 9,788,280 | |
| | | | |
Total Net Assets | | $ | 283,374,553 | |
| | | | |
| |
Net Assets Consist of: | | | | |
Paid-in capital | | $ | 335,999,552 | |
Distributions in excess of net investment income | | | (397,130 | ) |
Accumulated net realized loss on investments | | | (63,192,461 | ) |
Net unrealized appreciation of investments | | | 10,964,592 | |
| | | | |
Total Net Assets | | $ | 283,374,553 | |
| | | | |
| | | | |
Net Asset Value | | | | |
Class A: | | | | |
Net assets | | $ | 156,156,741 | |
Shares of beneficial interest outstanding, unlimited authorization, no par | | | 40,130,165 | |
Net asset value per share | | $ | 3.89 | |
Sales charge | | | 4.50 | % |
Offering price per share, equal to net asset value per share / (1 – sales charge) | | $ | 4.07 | |
| |
Class C: | | | | |
Net assets | | $ | 39,523,077 | |
Shares of beneficial interest outstanding, unlimited authorization, no par | | | 10,144,046 | |
Net asset value per share | | $ | 3.90 | |
| |
Class R: | | | | |
Net assets | | $ | 7,528,667 | |
Shares of beneficial interest outstanding, unlimited authorization, no par | | | 1,928,635 | |
Net asset value per share | | $ | 3.90 | |
| |
Institutional Class: | | | | |
Net assets | | $ | 80,166,068 | |
Shares of beneficial interest outstanding, unlimited authorization, no par | | | 20,609,730 | |
Net asset value per share | | $ | 3.89 | |
| |
| | | | |
1Investments, at cost | | $ | 264,677,413 | |
2Short-term investments, at cost | | | 9,131,000 | |
3See Note 12 in “Notes to financial statements.” | | | | |
See accompanying notes, which are an integral part of the financial statements.
| | |
| Statement of operations | | |
| Delaware High-Yield Opportunities Fund | | Year ended July 31, 2017 |
| | | | |
Investment Income: | | | | |
Interest | | $ | 19,808,439 | |
Dividends | | | 173,233 | |
| | | | |
| | | 19,981,672 | |
| | | | |
Expenses: | | | | |
Management fees | | | 2,008,738 | |
Distribution expenses – Class A | | | 409,226 | |
Distribution expenses – Class C | | | 432,399 | |
Distribution expenses – Class R | | | 40,213 | |
Dividend disbursing and transfer agent fees and expenses | | | 401,096 | |
Accounting and administration expenses | | | 95,119 | |
Reports and statements to shareholders expenses | | | 70,919 | |
Registration fees | | | 67,861 | |
Audit and tax fees | | | 44,902 | |
Legal fees | | | 40,067 | |
Trustees’ fees and expenses | | | 15,136 | |
Custodian fees | | | 15,124 | |
Other | | | 28,636 | |
| | | | |
| | | 3,669,436 | |
Less expenses waived | | | (312,479 | ) |
Less expense paid indirectly | | | (799 | ) |
| | | | |
Total operating expenses | | | 3,356,158 | |
| | | | |
Net Investment Income | | | 16,625,514 | |
| | | | |
| |
Net Realized and Unrealized Gain: | | | | |
Net realized gain on investments | | | 8,192,411 | |
Net change in unrealized appreciation (depreciation) of investments | | | 4,318,800 | |
| | | | |
Net Realized and Unrealized Gain | | | 12,511,211 | |
| | | | |
Net Increase in Net Assets Resulting from Operations | | $ | 29,136,725 | |
| | | | |
See accompanying notes, which are an integral part of the financial statements.
This page intentionally left blank.
| | |
| Statements of changes in net assets | | |
| Delaware High-Yield Opportunities Fund | | |
| | | | | | | | |
| | | Year ended | |
| | | 7/31/17 | | | 7/31/16 | |
Increase (Decrease) in Net Assets from Operations: | | | | | | | | |
Net investment income | | $ | 16,625,514 | | | $ | 22,008,316 | |
Net realized gain (loss) | | | 8,192,411 | | | | (50,513,603 | ) |
Net change in unrealized appreciation (depreciation) | | | 4,318,800 | | | | 22,155,569 | |
| | | | | | | | |
Net increase (decrease) in net assets resulting from operations | | | 29,136,725 | | | | (6,349,718 | ) |
| | | | | | | | |
| | |
Dividends and Distributions to Shareholders from: | | | | | | | | |
Net investment income: | | | | | | | | |
Class A | | | (8,940,567 | ) | | | (11,219,277 | ) |
Class C | | | (2,024,354 | ) | | | (2,657,517 | ) |
Class R | | | (415,375 | ) | | | (548,084 | ) |
Institutional Class | | | (5,291,835 | ) | | | (7,022,928 | ) |
| | |
Return of capital: | | | | | | | | |
Class A | | | (47,292 | ) | | | (150,785 | ) |
Class C | | | (11,955 | ) | | | (40,584 | ) |
Class R | | | (2,273 | ) | | | (7,580 | ) |
Institutional Class | | | (24,288 | ) | | | (89,798 | ) |
| | | | | | | | |
| | | (16,757,939 | ) | | | (21,736,553 | ) |
| | | | | | | | |
Capital Share Transactions: | | | | | | | | |
Proceeds from shares sold: | | | | | | | | |
Class A | | | 12,646,158 | | | | 11,038,316 | |
Class C | | | 2,276,491 | | | | 4,297,791 | |
Class R | | | 2,023,107 | | | | 2,431,583 | |
Institutional Class | | | 21,802,118 | | | | 24,823,227 | |
| | | | | | | | |
| | | Year ended | |
| | | 7/31/17 | | | 7/31/16 | |
Capital Share Transactions (continued): | | | | | | | | |
Net asset value of shares issued upon reinvestment of dividends and distributions: | | | | | | | | |
Class A | | $ | 7,699,549 | | | $ | 9,902,692 | |
Class C | | | 1,870,393 | | | | 2,457,184 | |
Class R | | | 417,419 | | | | 550,479 | |
Institutional Class | | | 5,130,121 | | | | 6,872,798 | |
| | | | | | | | |
| | | 53,865,356 | | | | 62,374,070 | |
| | | | | | | | |
Cost of shares redeemed: | | | | | | | | |
Class A | | | (44,653,216 | ) | | | (71,228,482 | ) |
Class C | | | (13,199,138 | ) | | | (22,321,850 | ) |
Class R | | | (4,002,981 | ) | | | (6,471,729 | ) |
Institutional Class | | | (53,926,122 | ) | | | (66,099,003 | ) |
| | | | | | | | |
| | | (115,781,457 | ) | | | (166,121,064 | ) |
| | | | | | | | |
Decrease in net assets derived from capital share transactions | | | (61,916,101 | ) | | | (103,746,994 | ) |
| | | | | | | | |
Net Decrease in Net Assets | | | (49,537,315 | ) | | | (131,833,265 | ) |
| | |
Net Assets: | | | | | | | | |
Beginning of year | | | 332,911,868 | | | | 464,745,133 | |
| | | | | | | | |
End of year | | $ | 283,374,553 | | | $ | 332,911,868 | |
| | | | | | | | |
| | |
Distributions in excess of net investment income | | $ | (397,130 | ) | | $ | (482,938 | ) |
| | | | | | | | |
See accompanying notes, which are an integral part of the financial statements.
Financial highlights
Delaware High-Yield Opportunities Fund Class A
Selected data for each share of the Fund outstanding throughout each period were as follows:
|
| |
|
| |
|
Net asset value, beginning of period |
|
Income (loss) from investment operations: |
Net investment income1 |
Net realized and unrealized gain (loss) |
|
Total from investment operations |
|
|
Less dividends and distributions from: |
Net investment income |
Return of capital |
Net realized gain |
|
Total dividends and distributions |
|
|
Net asset value, end of period |
|
|
Total return4 |
|
Ratios and supplemental data: |
Net assets, end of period (000 omitted) |
Ratio of expenses to average net assets |
Ratio of expenses to average net assets prior to fees waived |
Ratio of net investment income to average net assets |
Ratio of net investment income to average net assets prior to fees waived |
Portfolio turnover |
|
|
| 1 | The average shares outstanding have been applied for per share information. |
| 2 | For the year ended July 31, 2017, return of capital distributions of $47,292 were made by the Fund’s Class A, which calculated to a de minimis amount of $(0.001) per share. |
| 3 | For the year ended July 31, 2016, return of capital distributions of $150,785 were made by the Fund’s Class A, which calculated to a de minimis amount of $(0.003) per share. |
| 4 | Total investment return is based on the change in net asset value of a share during the period and assumes reinvestment of dividends and distributions at net asset value and does not reflect the impact of a sales charge. Total investment return during all of the periods shown reflects a waiver by the manager. Performance would have been lower had the waiver not been in effect. |
See accompanying notes, which are an integral part of the financial statements.
| | | | | | | | | | | | | | | | | | | | | | | | | | | | |
| Year ended | |
| |
| | | 7/31/17 | | | | | 7/31/16 | | | | | 7/31/15 | | | | | 7/31/14 | | | | | 7/31/13 | |
| |
| | $ | 3.74 | | | | | $ | 3.95 | | | | | $ | 4.38 | | | | | $ | 4.27 | | | | | $ | 4.11 | |
| | | | | | | | | |
| | | | | | | | | | | | | | | | | | | | | | | | | | | | |
| | | 0.21 | | | | | | 0.22 | | | | | | 0.24 | | | | | | 0.24 | | | | | | 0.27 | |
| | | 0.15 | | | | | | (0.22 | ) | | | | | (0.37 | ) | | | | | 0.12 | | | | | | 0.17 | |
| | | | | | | | | | | | | | | | | | | | | | | | | | | | |
| | | 0.36 | | | | | | — | | | | | | (0.13 | ) | | | | | 0.36 | | | | | | 0.44 | |
| | | | | | | | | | | | | | | | | | | | | | | | | | | | |
| | | | | | | | | |
| | | | | | | | | | | | | | | | | | | | | | | | | | | | |
| | | (0.21 | ) | | | | | (0.21 | ) | | | | | (0.24 | ) | | | | | (0.25 | ) | | | | | (0.28 | ) |
| | | — | 2 | | | | | — | 3 | | | | | — | | | | | | — | | | | | | — | |
| | | — | | | | | | — | | | | | | (0.06 | ) | | | | | — | | | | | | — | |
| | | | | | | | | | | | | | | | | | | | | | | | | | | | |
| | | (0.21 | ) | | | | | (0.21 | ) | | | | | (0.30 | ) | | | | | (0.25 | ) | | | | | (0.28 | ) |
| | | | | | | | | | | | | | | | | | | | | | | | | | | | |
| | | | | | | | | |
| | $ | 3.89 | | | | | $ | 3.74 | | | | | $ | 3.95 | | | | | $ | 4.38 | | | | | $ | 4.27 | |
| | | | | | | | | | | | | | | | | | | | | | | | | | | | |
| | | | | | | | | |
| | | 9.83% | | | | | | 0.41% | | | | | | (3.15% | ) | | | | | 8.59% | | | | | | 11.02% | |
| | | | | | | | | |
| | | | | | | | | | | | | | | | | | | | | | | | | | | | |
| | $ | 156,157 | | | | | $ | 173,815 | | | | | $ | 238,290 | | | | | $ | 327,088 | | | | | $ | 328,534 | |
| | | 1.05% | | | | | | 1.06% | | | | | | 1.07% | | | | | | 1.07% | | | | | | 1.11% | |
| | | 1.15% | | | | | | 1.15% | | | | | | 1.14% | | | | | | 1.12% | | | | | | 1.16% | |
| | | 5.42% | | | | | | 5.98% | | | | | | 5.78% | | | | | | 5.46% | | | | | | 6.33% | |
| | | 5.32% | | | | | | 5.89% | | | | | | 5.71% | | | | | | 5.41% | | | | | | 6.28% | |
| | | 90% | | | | | | 109% | | | | | | 86% | | | | | | 105% | | | | | | 88% | |
| | | | | | | | | | | | | | | | | | | | | | | | | | | | |
| |
Financial highlights
Delaware High-Yield Opportunities Fund Class C
Selected data for each share of the Fund outstanding throughout each period were as follows:
|
Net asset value, beginning of period |
|
Income (loss) from investment operations: |
Net investment income1 |
Net realized and unrealized gain (loss) |
|
Total from investment operations |
|
|
Less dividends and distributions from: |
Net investment income |
Return of capital |
Net realized gain |
|
Total dividends and distributions |
|
|
Net asset value, end of period |
|
|
Total return4 |
|
Ratios and supplemental data: |
Net assets, end of period (000 omitted) |
Ratio of expenses to average net assets |
Ratio of expenses to average net assets prior to fees waived |
Ratio of net investment income to average net assets |
Ratio of net investment income to average net assets prior to fees waived |
Portfolio turnover |
|
|
| 1 | The average shares outstanding have been applied for per share information. |
| 2 | For the year ended July 31, 2017, return of capital distributions of $11,955 were made by the Fund’s Class C, which calculated to a de minimis amount of $(0.001) per share. |
| 3 | For the year ended July 31, 2016, return of capital distributions of $40,584 were made by the Fund’s Class C, which calculated to a de minimis amount of $(0.003) per share. |
| 4 | Total investment return is based on the change in net asset value of a share during the period and assumes reinvestment of dividends and distributions at net asset value and does not reflect the impact of a sales charge. Total investment return during all of the periods shown reflects a waiver by the manager. Performance would have been lower had the waiver not been in effect. |
See accompanying notes, which are an integral part of the financial statements.
| | | | | | | | | | | | | | | | | | | | | | | | | | | | |
| Year ended | |
| |
| | | 7/31/17 | | | | | 7/31/16 | | | | | 7/31/15 | | | | | 7/31/14 | | | | | 7/31/13 | |
| |
| | $ | 3.74 | | | | | $ | 3.96 | | | | | $ | 4.39 | | | | | $ | 4.28 | | | | | $ | 4.12 | |
| | | | | | | | | |
| | | | | | | | | | | | | | | | | | | | | | | | | | | | |
| | | 0.18 | | | | | | 0.19 | | | | | | 0.21 | | | | | | 0.21 | | | | | | 0.24 | |
| | | 0.16 | | | | | | (0.23 | ) | | | | | (0.37 | ) | | | | | 0.12 | | | | | | 0.17 | |
| | | | | | | | | | | | | | | | | | | | | | | | | | | | |
| | | 0.34 | | | | | | (0.04 | ) | | | | | (0.16 | ) | | | | | 0.33 | | | | | | 0.41 | |
| | | | | | | | | | | | | | | | | | | | | | | | | | | | |
| | | | | | | | | |
| | | | | | | | | | | | | | | | | | | | | | | | | | | | |
| | | (0.18 | ) | | | | | (0.18 | ) | | | | | (0.21 | ) | | | | | (0.22 | ) | | | | | (0.25 | ) |
| | | — | 2 | | | | | — | 3 | | | | | — | | | | | | — | | | | | | — | |
| | | — | | | | | | — | | | | | | (0.06 | ) | | | | | — | | | | | | — | |
| | | | | | | | | | | | | | | | | | | | | | | | | | | | |
| | | (0.18 | ) | | | | | (0.18 | ) | | | | | (0.27 | ) | | | | | (0.22 | ) | | | | | (0.25 | ) |
| | | | | | | | | | | | | | | | | | | | | | | | | | | | |
| | | | | | | | | |
| | $ | 3.90 | | | | | $ | 3.74 | | | | | $ | 3.96 | | | | | $ | 4.39 | | | | | $ | 4.28 | |
| | | | | | | | | | | | | | | | | | | | | | | | | | | | |
| | | | | | | | | |
| | | 9.29% | | | | | | (0.59% | ) | | | | | (3.85% | ) | | | | | 7.79% | | | | | | 10.23% | |
| | | | | | | | | |
| | | | | | | | | | | | | | | | | | | | | | | | | | | | |
| | $ | 39,523 | | | | | $ | 46,842 | | | | | $ | 66,354 | | | | | $ | 89,127 | | | | | $ | 85,574 | |
| | | 1.80% | | | | | | 1.81% | | | | | | 1.82% | | | | | | 1.81% | | | | | | 1.81% | |
| | | 1.90% | | | | | | 1.90% | | | | | | 1.89% | | | | | | 1.86% | | | | | | 1.86% | |
| | | 4.67% | | | | | | 5.23% | | | | | | 5.03% | | | | | | 4.72% | | | | | | 5.63% | |
| | | 4.57% | | | | | | 5.14% | | | | | | 4.96% | | | | | | 4.67% | | | | | | 5.58% | |
| | | 90% | | | | | | 109% | | | | | | 86% | | | | | | 105% | | | | | | 88% | |
| | | | | | | | | | | | | | | | | | | | | | | | | | | | |
| |
Financial highlights
Delaware High-Yield Opportunities Fund Class R
Selected data for each share of the Fund outstanding throughout each period were as follows:
|
| |
|
| |
|
Net asset value, beginning of period |
|
Income (loss) from investment operations: |
Net investment income1 |
Net realized and unrealized gain (loss) |
|
Total from investment operations |
|
|
Less dividends and distributions from: |
Net investment income |
Return of capital |
Net realized gain |
|
Total dividends and distributions |
|
|
Net asset value, end of period |
|
|
Total return4 |
|
Ratios and supplemental data: |
Net assets, end of period (000 omitted) |
Ratio of expenses to average net assets |
Ratio of expenses to average net assets prior to fees waived |
Ratio of net investment income to average net assets |
Ratio of net investment income to average net assets prior to fees waived |
Portfolio turnover |
|
|
| 1 | The average shares outstanding have been applied for per share information. |
| 2 | For the year ended July 31, 2017, return of capital distributions of $2,273 were made by the Fund’s Class R, which calculated to a de minimis amount of $(0.001) per share. |
| 3 | For the year ended July 31, 2016, return of capital distributions of $7,580 were made by the Fund’s Class R, which calculated to a de minimis amount of $(0.003) per share. |
| 4 | Total investment return is based on the change in net asset value of a share during the period and assumes reinvestment of dividends and distributions at net asset value. Total investment return during all of the periods shown reflects waivers by the manager and/or distributor. Performance would have been lower had the waivers not been in effect. |
See accompanying notes, which are an integral part of the financial statements.
| | | | | | | | | | | | | | | | | | | | | | | | | | | | |
| Year ended | |
| |
| | | 7/31/17 | | | | | 7/31/16 | | | | | 7/31/15 | | | | | 7/31/14 | | | | | 7/31/13 | |
| |
| | $ | 3.75 | | | | | $ | 3.97 | | | | | $ | 4.39 | | | | | $ | 4.29 | | | | | $ | 4.12 | |
| | | | | | | | | |
| | | | | | | | | | | | | | | | | | | | | | | | | | | | |
| | | 0.20 | | | | | | 0.21 | | | | | | 0.23 | | | | | | 0.23 | | | | | | 0.26 | |
| | | 0.15 | | | | | | (0.23 | ) | | | | | (0.36 | ) | | | | | 0.11 | | | | | | 0.19 | |
| | | | | | | | | | | | | | | | | | | | | | | | | | | | |
| | | 0.35 | | | | | | (0.02 | ) | | | | | (0.13 | ) | | | | | 0.34 | | | | | | 0.45 | |
| | | | | | | | | | | | | | | | | | | | | | | | | | | | |
| | | | | | | | | |
| | | | | | | | | | | | | | | | | | | | | | | | | | | | |
| | | (0.20 | ) | | | | | (0.20 | ) | | | | | (0.23 | ) | | | | | (0.24 | ) | | | | | (0.28) | |
| | | —2 | | | | | | —3 | | | | | | — | | | | | | — | | | | | | — | |
| | | — | | | | | | — | | | | | | (0.06 | ) | | | | | — | | | | | | — | |
| | | | | | | | | | | | | | | | | | | | | | | | | | | | |
| | | (0.20 | ) | | | | | (0.20 | ) | | | | | (0.29 | ) | | | | | (0.24 | ) | | | | | (0.28 | ) |
| | | | | | | | | | | | | | | | | | | | | | | | | | | | |
| | | | | | | | | |
| | $ | 3.90 | | | | | $ | 3.75 | | | | | $ | 3.97 | | | | | $ | 4.39 | | | | | $ | 4.29 | |
| | | | | | | | | | | | | | | | | | | | | | | | | | | | |
| | | | | | | | | |
| | | 9.54% | | | | | | (0.09% | ) | | | | | (3.13% | ) | | | | | 8.08% | | | | | | 11.05% | |
| | | | | | | | | |
| | | | | | | | | | | | | | | | | | | | | | | | | | | | |
| | $ | 7,529 | | | | | $ | 8,766 | | | | | $ | 13,032 | | | | | $ | 16,580 | | | | | $ | 16,506 | |
| | | 1.30% | | | | | | 1.31% | | | | | | 1.32% | | | | | | 1.31% | | | | | | 1.31% | |
| | | 1.40% | | | | | | 1.40% | | | | | | 1.39% | | | | | | 1.38% | | | | | | 1.46% | |
| | | 5.17% | | | | | | 5.73% | | | | | | 5.53% | | | | | | 5.22% | | | | | | 6.13% | |
| | | 5.07% | | | | | | 5.64% | | | | | | 5.46% | | | | | | 5.15% | | | | | | 5.98% | |
| | | 90% | | | | | | 109% | | | | | | 86% | | | | | | 105% | | | | | | 88% | |
| | | | | | | | | | | | | | | | | | | | | | | | | | | | |
| |
Financial highlights
Delaware High-Yield Opportunities Fund Institutional Class
Selected data for each share of the Fund outstanding throughout each period were as follows:
|
| |
|
| |
|
Net asset value, beginning of period |
|
Income (loss) from investment operations: |
Net investment income1 |
Net realized and unrealized gain (loss) |
|
Total from investment operations. |
|
|
Less dividends and distributions from: |
Net investment income |
Return of capital |
Net realized gain |
|
Total dividends and distributions |
|
|
Net asset value, end of period |
|
|
Total return4 |
|
Ratios and supplemental data: |
Net assets, end of period (000 omitted) |
Ratio of expenses to average net assets |
Ratio of expenses to average net assets prior to fees waived |
Ratio of net investment income to average net assets |
Ratio of net investment income to average net assets prior to fees waived |
Portfolio turnover |
|
|
| 1 | The average shares outstanding have been applied for per share information. |
| 2 | For the year ended July 31, 2017, return of capital distributions of $24,288 were made by the Fund’s Institutional Class, which calculated to a de minimis amount of $(0.001) per share. |
| 3 | For the year ended July 31, 2016, return of capital distributions of $89,798 were made by the Fund’s Institutional Class, which calculated to a de minimis amount of $(0.003) per share. |
| 4 | Total investment return is based on the change in net asset value of a share during the period and assumes reinvestment of dividends and distributions at net asset value. Total investment return during all of the periods shown reflects a waiver by the manager. Performance would have been lower had the waiver not been in effect. |
See accompanying notes, which are an integral part of the financial statements.
| | | | | | | | | | | | | | | | | | | | | | | | | | | | |
| Year ended | |
| |
| | | 7/31/17 | | | | | 7/31/16 | | | | | 7/31/15 | | | | | 7/31/14 | | | | | 7/31/13 | |
| |
| | $ | 3.74 | | | | | $ | 3.95 | | | | | $ | 4.38 | | | | | $ | 4.27 | | | | | $ | 4.11 | |
| | | | | | | | | |
| | | | | | | | | | | | | | | | | | | | | | | | | | | | |
| | | 0.22 | | | | | | 0.23 | | | | | | 0.25 | | | | | | 0.25 | | | | | | 0.28 | |
| | | 0.15 | | | | | | (0.22 | ) | | | | | (0.37 | ) | | | | | 0.12 | | | | | | 0.18 | |
| | | | | | | | | | | | | | | | | | | | | | | | | | | | |
| | | 0.37 | | | | | | 0.01 | | | | | | (0.12 | ) | | | | | 0.37 | | | | | | 0.46 | |
| | | | | | | | | | | | | | | | | | | | | | | | | | | | |
| | | | | | | | | |
| | | | | | | | | | | | | | | | | | | | | | | | | | | | |
| | | (0.22 | ) | | | | | (0.22 | ) | | | | | (0.25 | ) | | | | | (0.26 | ) | | | | | (0.30 | ) |
| | | —2 | | | | | | —3 | | | | | | — | | | | | | — | | | | | | — | |
| | | — | | | | | | — | | | | | | (0.06) | | | | | | — | | | | | | — | |
| | | | | | | | | | | | | | | | | | | | | | | | | | | | |
| | | (0.22 | ) | | | | | (0.22 | ) | | | | | (0.31 | ) | | | | | (0.26 | ) | | | | | (0.30 | ) |
| | | | | | | | | | | | | | | | | | | | | | | | | | | | |
| | | | | | | | | |
| | $ | 3.89 | | | | | $ | 3.74 | | | | | $ | 3.95 | | | | | $ | 4.38 | | | | | $ | 4.27 | |
| | | | | | | | | | | | | | | | | | | | | | | | | | | | |
| | | | | | | | | |
| | | 10.08% | | | | | | 0.66% | | | | | | (2.91% | ) | | | | | 8.87% | | | | | | 11.34% | |
| | | | | | | | | |
| | | | | | | | | | | | | | | | | | | | | | | | | | | | |
| | $ | 80,166 | | | | | $ | 103,489 | | | | | $ | 147,069 | | | | | $ | 232,971 | | | | | $ | 200,282 | |
| | | 0.80% | | | | | | 0.81% | | | | | | 0.82% | | | | | | 0.81% | | | | | | 0.81% | |
| | | 0.90% | | | | | | 0.90% | | | | | | 0.89% | | | | | | 0.86% | | | | | | 0.86% | |
| | | 5.67% | | | | | | 6.23% | | | | | | 6.03% | | | | | | 5.72% | | | | | | 6.63% | |
| | | 5.57% | | | | | | 6.14% | | | | | | 5.96% | | | | | | 5.67% | | | | | | 6.58% | |
| | | 90% | | | | | | 109% | | | | | | 86% | | | | | | 105% | | | | | | 88% | |
| | | | | | | | | | | | | | | | | | | | | | | | | | | | |
| |
| | |
| Notes to financial statements | | |
| Delaware High-Yield Opportunities Fund | | July 31, 2017 |
Delaware Group® Income Funds (Trust) is organized as a Delaware statutory trust and offers four series: Delaware Corporate Bond Fund, Delaware Floating Rate Fund (formerly, Delaware Diversified Floating Rate Fund), Delaware Extended Duration Bond Fund, and Delaware High-Yield Opportunities Fund. These financial statements and the related notes pertain to Delaware High-Yield Opportunities Fund (Fund). The Trust is an open-end investment company. The Fund is considered diversified under the Investment Company Act of 1940, as amended (1940 Act), and offers Class A, Class C, Class R, and Institutional Class shares. Class A shares are sold with a maximum front-end sales charge of 4.50%. Class A share purchases of $1,000,000 or more will incur a contingent deferred sales charge (CDSC) of 1.00% if redeemed during the first year, and 0.50% during the second year, provided that Delaware Distributors, L.P. (DDLP) paid a financial advisor a commission on the purchase of those shares. Class C shares are sold with a CDSC of 1.00%, if redeemed during the first 12 months. Class R and Institutional Class shares are not subject to a sales charge and are offered for sale exclusively to certain eligible investors.
The investment objective of the Fund is to seek total return and, as a secondary objective, high current income.
1. Significant Accounting Policies
The following accounting policies are in accordance with US generally accepted accounting principles (US GAAP) and are consistently followed by the Fund.
Security Valuation – Equity securities, except those traded on the Nasdaq Stock Market LLC (Nasdaq), are valued at the last quoted sales price as of the time of the regular close of the New York Stock Exchange on the valuation date. Equity securities traded on the Nasdaq are valued in accordance with the Nasdaq Official Closing Price, which may not be the last sales price. If, on a particular day, an equity security does not trade, the mean between the bid and ask prices will be used, which approximates fair value. US government and agency securities are valued at the mean between the bid and ask prices, which approximates fair value. Other debt securities are valued based upon valuations provided by an independent pricing service or broker and reviewed by management. To the extent current market prices are not available, the pricing service may take into account developments related to the specific security, as well as transactions in comparable securities. Valuations for fixed income securities utilize matrix systems, which reflect such factors as security prices, yields, maturities, and ratings, and are supplemented by dealer and exchange quotations. Generally, other securities and assets for which market quotations are not readily available are valued at fair value as determined in good faith under the direction of the Trust’s Board of Trustees (Board). In determining whether market quotations are readily available or fair valuation will be used, various factors will be taken into consideration, such as market closures or suspension of trading in a security.
Federal Income Taxes – No provision for federal income taxes has been made as the Fund intends to continue to qualify for federal income tax purposes as a regulated investment company under Subchapter M of the Internal Revenue Code of 1986, as amended, and make the requisite distributions to shareholders. The Fund evaluates tax positions taken or expected to be taken in the course of preparing the Fund’s tax returns to determine whether the tax positions are “more-likely-than-not” of being sustained by the applicable tax authority. Tax positions not deemed to meet the “more-likely-than-not” threshold are recorded as a tax benefit or expense in the current year. Management has analyzed
the Fund’s tax positions taken or to be taken on the Fund’s federal income tax returns through the year ended July 31, 2017 and for all open tax years ended July 31, 2014–July 31, 2016, and has concluded that no provision for federal income tax is required in the Fund’s financial statements. If applicable, the Fund recognizes interest accrued on unrecognized tax benefits in interest expense and penalties in other expense on the “Statement of Operations.” During the year ended July 31, 2017, the Fund did not incur any interest or tax penalties.
Class Accounting – Investment income and common expenses are allocated to the various classes of the Fund on the basis of “settled shares” of each class in relation to the net assets of the Fund. Realized and unrealized gain (loss) on investments are allocated to the various classes of the Fund on the basis of daily net assets of each class. Distribution expenses relating to a specific class are charged directly to that class.
Repurchase Agreements – The Fund may purchase certain US government securities subject to the counterparty’s agreement to repurchase them at an agreed upon date and price. The counterparty will be required on a daily basis to maintain the value of the collateral subject to the agreement at not less than the repurchase price (including accrued interest). The agreements are conditioned upon the collateral being deposited under the Federal Reserve book-entry system with the Fund’s custodian or a third party sub-custodian. In the event of default or bankruptcy by the other party to the agreement, retention of the collateral may be subject to legal proceedings. All open repurchase agreements as of the date of this report were entered into on July 31, 2017 and matured on the next business day.
Use of Estimates – The Fund is an investment company, whose financial statements are prepared in conformity with US GAAP. Therefore, the Fund follows the accounting and reporting guidelines for investment companies. The preparation of financial statements in conformity with US GAAP requires management to make estimates and assumptions that affect the fair value of investments, the reported amounts of assets and liabilities and disclosure of contingent assets and liabilities at the date of the financial statements, and the reported amounts of revenues and expenses during the reporting period. Actual results could differ from those estimates and the differences could be material.
Other – Expenses directly attributable to the Fund are charged directly to the Fund. Other expenses common to various funds within the Delaware FundsSM by Macquarie (Delaware Funds) are generally allocated among such funds on the basis of average net assets. Management fees and certain other expenses are paid monthly. Security transactions are recorded on the date the securities are purchased or sold (trade date) for financial reporting purposes. Costs used in calculating realized gains and losses on the sale of investment securities are those of the specific securities sold. Dividend income is recorded on the ex-dividend date and interest income is recorded on the accrual basis. Discounts and premiums on debt securities are accreted or amortized to interest income, respectively, over the lives of the respective securities using the effective interest method. The Fund declares dividends daily from net investment income and pays the dividends monthly and declares and pays distributions from net realized gain on investments, if any, annually. The Fund may distribute more frequently, if necessary for tax purposes. Dividends and distributions, if any, are recorded on the ex-dividend date.
The Fund may receive earnings credits from its custodian when positive cash balances are maintained, which may be used to offset custody fees. There were no such earnings credits for the year ended July 31, 2017.
| | |
| Notes to financial statements | | |
| Delaware High-Yield Opportunities Fund | | |
1. Significant Accounting Policies (continued)
The Fund receives earnings credits from its transfer agent when positive cash balances are maintained, which may be used to offset transfer agent fees. If the amount earned is greater than $1, the expense paid under this arrangement is included on the “Statement of operations” under “Dividend disbursing and transfer agent fees and expenses” with the corresponding expense offset shown under “Less expense paid indirectly.” For the year ended July 31, 2017, the Fund earned $799 under this agreement.
2. Investment Management, Administration Agreements, and Other Transactions with Affiliates
In accordance with the terms of its investment management agreement, the Fund pays Delaware Management Company (DMC), a series of Macquarie Investment Management Business Trust (formerly, Delaware Management Business Trust) and the investment manager, an annual fee which is calculated daily and paid monthly at the rate of 0.65% on the first $500 million of average daily net assets of the Fund, 0.60% on the next $500 million, 0.55% on the next $1.5 billion, and 0.50% on average daily net assets in excess of $2.5 billion.
DMC has contractually agreed to waive all or a portion, if any, of its investment advisory fee and/or pay/reimburse the Fund to the extent necessary to ensure total annual operating expenses (excluding any distribution and service (12b-1) fees, acquired fund fees and expenses, taxes, interest, short sale and dividend interest expenses, brokerage fees, certain insurance costs, and nonroutine expenses or costs, including, but not limited to, those relating to reorganizations, litigation, conducting shareholder meetings, and liquidations), from exceeding 0.80% of the Fund’s average daily net assets from Aug. 1, 2016 through July 31, 2017.* These waivers and reimbursements may only be terminated by agreement of DMC and the Fund.
Delaware Investments Fund Services Company (DIFSC), an affiliate of DMC, provides fund accounting and financial administration oversight services to the Fund. For these services, DIFSC’s fees are calculated daily and paid monthly based on the aggregate daily net assets of the Delaware Funds at the following annual rate: 0.0050% of the first $30 billion; 0.0045% of the next $10 billion; 0.0040% of the next $10 billion; and 0.0025% of aggregate average daily net assets in excess of $50 billion. The fees payable to DIFSC under the service agreement described above are allocated among all funds in the Delaware Funds on a relative net asset value (NAV) basis. For the year ended July 31, 2017, the Fund was charged $14,409 for these services. This amount is included on the “Statement of operations” under “Accounting and administration expenses.”
DIFSC is also the transfer agent and dividend disbursing agent of the Fund. For these services, DIFSC’s fees are calculated daily and paid monthly based on the aggregate daily net assets of the retail funds within the Delaware Funds at the following annual rate: 0.025% of the first $20 billion; 0.020% of the next $5 billion; 0.015% of the next $5 billion; and 0.013% on average daily net assets in excess of $30 billion. The fees payable to DIFSC under the service agreement described above are allocated among all retail funds in the Delaware Funds on a relative NAV basis. This amount is included on the “Statement of operations” under “Dividend disbursing and transfer agent fees and expenses.” For the year ended July 31, 2017, the Fund was charged $61,898 for these services. Pursuant to a sub-transfer agency agreement between DIFSC and BNY Mellon Investment Servicing (US) Inc. (BNYMIS), BNYMIS provides
certain sub-transfer agency services to the Fund. Sub-transfer agency fees are paid by the Fund and are also included on the “Statement of operations” under “Dividend disbursing and transfer agent fees and expenses.”
Pursuant to a distribution agreement and distribution plan, the Fund pays DDLP, the distributor and an affiliate of DMC, annual 12b-1 fee of 0.25% of the average daily net assets of the Class A shares, 1.00% of the average daily net assets of the Class C shares, and 0.50% of the average daily net assets of the Class R shares. The Board has adopted a formula for calculating 12b-1 fees for the Fund’s Class A shares that went into effect on June 1, 1992. The Fund’s Class A shares are currently subject to a blended 12b-1 fee equal to the sum of: (i) 0.10% of the average daily net assets representing shares that were acquired prior to June 1, 1992, and (ii) 0.25% of the average daily net assets representing shares that were acquired on or after June 1, 1992. All Class A shareholders currently bear 12b-1 fees at the same rate, the blended rate, currently 0.25% of average daily net assets, based on the formula described above. This method of calculating Class A 12b-1 fees may be discontinued at the sole discretion of the Board. Institutional Class shares pay no 12b-1 fees.
As provided in the investment management agreement, the Fund bears a portion of the cost of certain resources shared with DMC, including the cost of internal personnel of DMC and/or its affiliates that provide legal, tax, and regulatory reporting services to the Fund. For the year ended July 31, 2017, the Fund was charged $6,369 for internal legal, tax, and regulatory services provided by DMC and/or its affiliates’ employees. This amount is included on the “Statement of operations” under “Legal fees.”
For the year ended July 31, 2017, DDLP earned $12,514 for commissions on sales of the Fund’s Class A shares. For the year ended July 31, 2017, DDLP received gross CDSC commissions of $145 and $816 on redemptions of the Fund’s Class A and Class C shares, respectively, and these commissions were entirely used to offset upfront commissions previously paid by DDLP to broker/dealers on sales of those shares.
Trustees’ fees include expenses accrued by the Fund for each Trustee’s retainer and meeting fees. Certain officers of DMC, DIFSC, and DDLP are officers and/or Trustees of the Trust. These officers and Trustees are paid no compensation by the Fund.
Cross trades for the year ended July 31, 2017, were executed by the Fund pursuant to procedures adopted by the Board designed to ensure compliance with Rule 17a-7 under the 1940 Act. Cross trading is the buying or selling of portfolio securities between funds of investment companies, or between a fund of an investment company and another entity, that are or could be considered affiliates by virtue of having a common investment advisor (or affiliated investment advisors), common directors/trustees and/or common officers. At its regularly scheduled meetings, the Board reviews such transactions for compliance with the procedures adopted by the Board. Pursuant to these procedures, for the year ended July 31, 2017, the Fund engaged in securities purchases of $440,980, and securities sales of $9,308,597, which resulted in net realized gains of $398,370.
* The aggregate contractual waiver period covering this report is from Nov. 27, 2015 through Nov. 28, 2017.
| | |
| Notes to financial statements | | |
| Delaware High-Yield Opportunities Fund | | |
3. Investments
For the year ended July 31, 2017, the Fund made purchases and sales of investment securities other than short-term investments as follows:
| | | | |
Purchases | | $ | 268,741,215 | |
Sales | | | 331,751,916 | |
At July 31, 2017, the cost and unrealized appreciation (depreciation) of investments for federal income tax purposes for the Fund were as follows:
| | | | |
Cost of investments | | $ | 273,818,018 | |
| | | | |
Aggregate unrealized appreciation of investments | | $ | 11,755,344 | |
Aggregate unrealized depreciation of investments | | | (800,357 | ) |
| | | | |
Net unrealized appreciation of investments | | $ | 10,954,987 | |
| | | | |
US GAAP defines fair value as the price that the Fund would receive to sell an asset or pay to transfer a liability in an orderly transaction between market participants at the measurement date under current market conditions. A three-level hierarchy for fair value measurements has been established based upon the transparency of inputs to the valuation of an asset or liability. Inputs may be observable or unobservable and refer broadly to the assumptions that market participants would use in pricing the asset or liability. Observable inputs reflect the assumptions market participants would use in pricing the asset or liability based on market data obtained from sources independent of the reporting entity. Unobservable inputs reflect the reporting entity’s own assumptions about the assumptions that market participants would use in pricing the asset or liability based on the best information available under the circumstances. The Fund’s investment in its entirety is assigned a level based upon the observability of the inputs which are significant to the overall valuation. The three-level hierarchy of inputs is summarized below.
| | |
| Level 1 – | | Inputs are quoted prices in active markets for identical investments. (Examples: equity securities, open-end investment companies, futures contracts, exchange-traded options contracts) |
| |
| Level 2 – | | Other observable inputs, including, but not limited to: quoted prices for similar assets or liabilities in markets that are active, quoted prices for identical or similar assets or liabilities in markets that are not active, inputs other than quoted prices that are observable for the assets or liabilities (such as interest rates, yield curves, volatilities, prepayment speeds, loss severities, credit risks, and default rates), or other market-corroborated inputs. (Examples: debt securities, government securities, swap contracts, foreign currency exchange contracts, foreign securities utilizing international fair value pricing, broker-quoted securities, fair valued securities) |
| |
| Level 3 – | | Significant unobservable inputs, including the Fund’s own assumptions used to determine the fair value of investments. (Examples: broker-quoted securities, fair valued securities) |
Level 3 investments are valued using significant unobservable inputs. The Fund may also use an income-based valuation approach in which the anticipated future cash flows of the investment are discounted to calculate fair value. Discounts may also be applied due to the nature or duration of any restrictions on the disposition of the investments. Valuations may also be based upon current market prices of securities that are comparable in coupon, rating, maturity, and industry. The derived value of a
Level 3 investment may not represent the value which is received upon disposition and this could impact the results of operations.
The following table summarizes the valuation of the Fund’s investments by fair value hierarchy levels as of July 31, 2017:
| | | | | | | | | | | | | | | | |
Securities | | Level 1 | | | Level 2 | | | Level 3 | | | Total | |
Assets: | | | | | | | | | | | | | | | | |
Corporate Debt | | $ | — | | | $ | 263,637,775 | | | $ | — | | | $ | 263,637,775 | |
Loan Agreements | | | — | | | | 7,297,546 | | | | — | | | | 7,297,546 | |
Municipal Bond | | | — | | | | 819,284 | | | | — | | | | 819,284 | |
Common Stock | | | — | | | | — | | | | — | | | | — | |
Preferred Stock1 | | | 1,938,150 | | | | 1,949,250 | | | | — | | | | 3,887,400 | |
Short-Term Investments | | | — | | | | 9,131,000 | | | | — | | | | 9,131,000 | |
| | | | | | | | | | | | | | | | |
Total Value of Securities | | $ | 1,938,150 | | | $ | 282,834,855 | | | $ | — | | | $ | 284,773,005 | |
| | | | | | | | | | | | | | | | |
The security that has been valued at zero on the “Schedule of investments” is considered to be a Level 3 investment in the table.
1Security type is valued across multiple levels. Level 1 investments represent exchange-traded investments and Level 2 investments represent investments with observable input or matrix-priced investments. The amounts attributed to Level 1 investments and Level 2 investments represent the following percentages of the total market value of this security type:
| | | | | | | | | | | | |
| | | Level 1 | | | Level 2 | | | Total | |
Preferred Stock | | | 49.86 | % | | | 50.14 | % | | | 100.00 | % |
During the year ended July 31, 2017, there were no transfers between Level 1 investments, Level 2 investments, or Level 3 investments that had a significant impact to the Fund. The Fund’s policy is to recognize transfers between levels based on fair value at the beginning of the reporting period.
A reconciliation of Level 3 investments is presented when the Fund has a significant amount of Level 3 investments at the beginning, interim, or end of the period in relation to net assets. Management has determined not to provide a reconciliation of Level 3 investments as the Level 3 investments were not considered significant to the Fund’s net assets at the beginning, interim, or end of the year. Management has determined not to provide additional disclosure on Level 3 inputs since the Level 3 investments are not considered significant to the Fund’s net assets at the end of the year.
| | |
| Notes to financial statements | | |
| Delaware High-Yield Opportunities Fund | | |
4. Dividend and Distribution Information
Income and long-term capital gain distributions are determined in accordance with federal income tax regulations, which may differ from US GAAP. Additionally, distributions from net short-term gains on sales of investment securities are treated as ordinary income for federal income tax purposes. The tax character of dividends and distributions paid during the years ended July 31, 2017 and 2016 were as follows:
| | | | | | | | | | | | |
| | | Year ended | |
| | | 7/31/17 | | | | | | 7/31/16 | |
Ordinary income | | $ | 16,672,131 | | | | | | | $ | 21,447,806 | |
Return of Capital | | | 85,808 | | | | | | | | 288,747 | |
| | | | | | | | | | | | |
Total | | $ | 16,757,939 | | | | | | | $ | 21,736,553 | |
| | | | | | | | | | | | |
5. Components of Net Assets on a Tax Basis
As of July 31, 2017, the components of net assets on a tax basis were as follows:
| | | | |
Shares of beneficial interest | | $ | 335,999,552 | |
Distributions payable | | | (355,514 | ) |
Troubled debt litigation | | | (1,836,309 | ) |
Capital loss carryforwards | | | (61,388,163 | ) |
Unrealized appreciation of investments | | | 10,954,987 | |
| | | | |
Net assets | | $ | 283,374,553 | |
| | | | |
The differences between book basis and tax basis components of net assets are primarily attributable to tax deferral of losses on wash sales, tax treatment of trust preferred securities, contingent payment debt instruments, and market discount and premium on debt instruments.
For financial reporting purposes, capital accounts are adjusted to reflect the tax character of permanent book/tax differences. Reclassifications are primarily due to tax treatment of market discount and premium on debt instruments. Results of operations and net assets were not affected by these reclassifications. For the year ended July 31, 2017, the Fund recorded the following reclassifications:
| | | | |
Distributions in excess of net investment income | | $ | 132,425 | |
Accumulated net realized loss | | | 12,479,162 | |
Paid-in capital | | | (12,611,587 | ) |
For federal income tax purposes, capital loss carryforwards may be carried forward and applied against future capital gains. At July 31, 2017, the Fund utilized $8,185,472 of capital loss carryforwards. At July 31, 2017, $12,611,587 capital loss carryforwards expired.
Under the Regulated Investment Company Modernization Act of 2010 (Act), net capital losses recognized for tax years beginning after Dec. 22, 2010 may be carried forward indefinitely, and their character is retained as short-term and/or long-term losses. Previously, net capital losses were carried forward for eight years and treated as short-term losses. As a transition rule, the Act requires that post-enactment net capital losses be used before pre-enactment net capital losses. At July 31, 2017, capital loss carryforwards available to offset future realized capital gains were as follows:
| | | | | | | | | | |
| | | Post-enactment capital loss character | |
| | | Short-term | | | | | Long-term | |
| | $ | 25,801,803 | | | | | $ | 35,586,360 | |
6. Capital Shares
Transactions in capital shares were as follows:
| | | | | | | | | | | | |
| | | Year ended | |
| | | 7/31/17 | | | | | | 7/31/16 | |
Shares sold: | | | | | | | | | | | | |
Class A | | | 3,328,777 | | | | | | | | 3,019,815 | |
Class C | | | 597,583 | | | | | | | | 1,192,571 | |
Class R | | | 529,252 | | | | | | | | 667,983 | |
Institutional Class | | | 5,737,888 | | | | | | | | 6,793,889 | |
| | | |
Shares issued upon reinvestment of dividends and distributions: | | | | | | | | | | | | |
Class A | | | 2,022,251 | | | | | | | | 2,710,084 | |
Class C | | | 490,990 | | | | | | | | 671,195 | |
Class R | | | 109,325 | | | | | | | | 149,986 | |
Institutional Class | | | 1,348,702 | | | | | | | | 1,880,382 | |
| | | | | | | | | | | | |
| | | 14,164,768 | | | | | | | | 17,085,905 | |
| | | | | | | | | | | | |
| | | |
Shares redeemed: | | | | | | | | | | | | |
Class A | | | (11,732,143 | ) | | | | | | | (19,499,391 | ) |
Class C | | | (3,463,053 | ) | | | | | | | (6,109,682 | ) |
Class R | | | (1,048,257 | ) | | | | | | | (1,765,897 | ) |
Institutional Class | | | (14,176,045 | ) | | | | | | | (18,185,078 | ) |
| | | | | | | | | | | | |
| | | (30,419,498 | ) | | | | | | | (45,560,048 | ) |
| | | | | | | | | | | | |
Net decrease | | | (16,254,730 | ) | | | | | | | (28,474,143 | ) |
| | | | | | | | | | | | |
| | |
| Notes to financial statements | | |
| Delaware High-Yield Opportunities Fund | | |
6. Capital Shares (continued)
Certain shareholders may exchange shares of one class for shares of another class in the same Fund. For the years ended July 31, 2017 and 2016, the Fund had the following exchange transactions. These exchange transactions are included as subscriptions and redemptions in the table on the previous page and the “Statements of changes in net assets.”
| | | | | | | | | | | | | | | | | | | | | | | | | | | | | | | | | | | |
| | | Exchange Redemptions | | | | Exchange
Subscriptions | | | | |
| | | | | | | |
| | | | | | | | | | | Institutional | | | | |
| | | Class A | | | | Class C | | | | Class | | | | |
Year ended | | Shares | | | | Shares | | | | Shares | | | | Value |
7/31/17 | | | | 632,393 | | | | | | | | | | 13,132 | | | | | | | | | | 647,689 | | | | | | | | | $ | 2,476,527 | |
7/31/16 | | | | 108,834 | | | | | | | | | | 21,495 | | | | | | | | | | 130,773 | | | | | | | | | | 476,062 | |
7. Line of Credit
The Fund, along with certain other funds in the Delaware Funds (Participants), was a participant in a $155,000,000 revolving line of credit intended to be used for temporary or emergency purposes as an additional source of liquidity to fund redemptions of investor shares. Under the agreement, the Participants were charged an annual commitment fee of 0.10%, which was allocated across the Participants on the basis of relative net assets of each Participant’s allocation of the entire facility. The Participants were permitted to borrow up to a maximum of one third of their net assets under the agreement. Each Participant was individually, and not jointly, liable for its particular advances, if any, under the line of credit. The line of credit under the agreement expired on Nov. 7, 2016.
On Nov. 7, 2016, the Fund, along with the other Participants, entered into an amendment to the agreement for a $155,000,000 revolving line of credit. The line of credit is to be used as described above and operates in substantially the same manner as the original agreement, with the exception of the annual commitment fee. Under the amendment to the agreement, the Participants are charged an annual commitment fee of 0.15%, which is allocated across the Participants on the basis of relative net assets of each Participant’s allocation of the entire facility. The line of credit available under the agreement expires on Nov. 6, 2017.
The Fund had no amounts outstanding as of July 31, 2017, or at any time during the year then ended.
8. Offsetting
The Fund entered into an International Swaps and Derivatives Association, Inc. Master Agreement (ISDA Master Agreement) or a similar agreement with certain of its derivative contract counterparties in order to better define its contractual rights and to secure rights that will help the Fund mitigate its counterparty risk. An ISDA Master Agreement is a bilateral agreement between the Fund and a counterparty that governs over-the-counter (OTC) derivatives and foreign exchange contracts and typically contains, among other things, collateral posting items and netting provisions in the event of a default and/or termination event. Under an ISDA Master Agreement, the Fund may, under certain circumstances, offset with the counterparty certain derivative financial instruments’ payables and/or receivables with collateral held and/or posted and create one single net payment. The provisions of the ISDA Master Agreement typically permit a single net payment in the event of default (close-out), including the bankruptcy or
insolvency of the counterparty. However, bankruptcy or insolvency laws of a particular jurisdiction may impose restrictions on or prohibitions against the right of offset in bankruptcy, insolvency, or other events.
For financial reporting purposes, the Fund does not offset derivative assets and derivative liabilities that are subject to netting arrangements on the “Statement of assets and liabilities.”
At July 31, 2017, the Fund had the following assets and liabilities subject to offsetting provisions:
Master Repurchase Agreements
| | | | | | | | | | | | | | | | | | | | | | | | | |
| | | | | Fair Value of | | Cash | | Net | | |
| | | Repurchase | | Non-Cash | | Collateral | | Collateral | | |
Counterparty | | Agreements | | Collateral Received(a) | | Received | | Received | | Net Exposure(b) |
Bank of America | | | | | | | | | | | | | | | | | | | | | | | | | |
Merrill Lynch | | | | $1,670,778 | | | | | $(1,670,778 | ) | | | | $— | | | | | $(1,670,778 | ) | | | | $— | |
Bank of Montreal | | | | 4,176,944 | | | | | (4,176,944 | ) | | | | — | | | | | (4,176,944 | ) | | | | — | |
BNP Paribas | | | | 3,283,278 | | | | | (3,283,278 | ) | | | | — | | | | | (3,283,278 | ) | | | | — | |
| | | | | | | | | | | | | | | | | | | | | | | | | |
Total | | | | $9,131,000 | | | | | $(9,131,000 | ) | | | | $— | | | | | $(9,131,000 | ) | | | | $— | |
| | | | | | | | | | | | | | | | | | | | | | | | | |
(a)The value of the related collateral received exceeded the value of the repurchase agreements as of July 31, 2017.
(b)Net exposure represents the receivable (payable) that would be due from (to) the counterparty in the event of default.
9. Securities Lending
The Fund, along with other funds in the Delaware Funds, may lend its securities pursuant to a security lending agreement (Lending Agreement) with The Bank of New York Mellon (BNY Mellon). At the time a security is loaned, the borrower must post collateral equal to the required percentage of the market value of the loaned security, including any accrued interest. The required percentage is: (1) 102% with respect to US securities and foreign securities that are denominated and payable in US dollars; and (2) 105% with respect to foreign securities. With respect to each loan, if on any business day the aggregate market value of securities collateral plus cash collateral held is less than the aggregate market value of the securities that are the subject of such loan, the borrower will be notified to provide additional collateral by the end of the following business day, which, together with the collateral already held, will be not less than the applicable initial collateral requirements for such security loan. If the aggregate market value of securities collateral and cash collateral held with respect to a security loan exceeds the applicable initial collateral requirement, upon the request of the borrower, BNY Mellon must return enough collateral to the borrower by the end of the following business day to reduce the value of the remaining collateral to the applicable initial collateral requirement for such security loan. As a result of the foregoing, the value of the collateral held with respect to a loaned security on any particular day may be more or less than the value of the security on loan.
Cash collateral received by each fund of the Trust is generally invested in a series of individual separate accounts, each corresponding to a fund. The investment guidelines permit each separate account to hold certain securities that would be considered eligible securities for a money market fund. Cash collateral received is generally invested in government securities; certain obligations issued by government sponsored enterprises; repurchase agreements collateralized by US Treasury securities; obligations issued by the central government of any Organization for Economic Cooperation and
| | |
| Notes to financial statements | | |
| Delaware High-Yield Opportunities Fund | | |
9. Securities Lending (continued)
Development (OECD) country or its agencies, instrumentalities, or establishments; obligations of supranational organizations; commercial paper, notes, bonds, and other debt obligations; certificates of deposit, time deposits, and other bank obligations; and asset-backed securities. A Fund can also accept US government securities and letters of credit (non-cash collateral) in connection with securities loans.
In the event of default or bankruptcy by the lending agent, realization and/or retention of the collateral may be subject to legal proceedings. In the event the borrower fails to return loaned securities and the collateral received is insufficient to cover the value of the loaned securities and provided such collateral shortfall is not the result of investment losses, the lending agent has agreed to pay the amount of the shortfall to the Fund or, at the discretion of the lending agent, replace the loaned securities. The Fund continues to record dividends or interest, as applicable, on the securities loaned and is subject to changes in value of the securities loaned that may occur during the term of the loan. The Fund has the right under the Lending Agreement to recover the securities from the borrower on demand. With respect to security loans collateralized by non-cash collateral, the Fund receives loan premiums paid by the borrower. With respect to security loans collateralized by cash collateral, the earnings from the collateral investments are shared among the Fund, the security lending agent, and the borrower. The Fund records security lending income net of allocations to the security lending agent and the borrower.
The Fund may incur investment losses as a result of investing securities lending collateral. This could occur if an investment in the collateral investment account defaulted or became impaired. Under those circumstances, the value of a Fund’s cash collateral account may be less than the amount the Fund would be required to return to the borrowers of the securities and the Fund would be required to make up for this shortfall.
During the year ended July 31, 2017, the Fund had no securities out on loan.
10. Credit and Market Risk
The Fund invests in high yield fixed income securities, which are securities rated lower than BBB-by Standard & Poor’s Financial Services LLC and Baa3 by Moody’s Investors Service Inc., or similarly rated by another nationally recognized statistical rating organization. Investments in these higher yielding securities are generally accompanied by a greater degree of credit risk than higher rated securities. Additionally, lower rated securities may be more susceptible to adverse economic and competitive industry conditions than investment grade securities.
The Fund invests in bank loans and other securities that may subject it to direct indebtedness risk, the risk that the Fund will not receive payment of principal, interest, and other amounts due in connection with these investments and will depend primarily on the financial condition of the borrower. Loans that are fully secured offer the Fund more protection than unsecured loans in the event of nonpayment of scheduled interest or principal, although there is no assurance that the liquidation of collateral from a secured loan would satisfy the corporate borrower’s obligation, or that the collateral can be liquidated. Some loans or claims may be in default at the time of purchase. Certain of the loans and the other direct indebtedness acquired by the Fund may involve revolving credit facilities or other standby financing commitments that obligate the Fund to pay additional cash on a certain date or on demand. These commitments may require the Fund to increase its investment in a company at a time when the Fund
might not otherwise decide to do so (including at a time when the company’s financial condition makes it unlikely that such amounts will be repaid). To the extent that the Fund is committed to advance additional funds, it will at all times hold and maintain cash or other high grade debt obligations in an amount sufficient to meet such commitments.
As the Fund may be required to rely upon another lending institution to collect and pass on to the Fund amounts payable with respect to the loan and to enforce the Fund’s rights under the loan and other direct indebtedness, an insolvency, bankruptcy, or reorganization of the lending institution may delay or prevent the Fund from receiving such amounts. The highly leveraged nature of many loans may make them especially vulnerable to adverse changes in economic or market conditions. Investments in such loans and other direct indebtedness may involve additional risk to the Fund.
The Fund invests in certain obligations that may have liquidity protection designed to ensure that the receipt of payments due on the underlying security is timely. Such protection may be provided through guarantees, insurance policies, or letters of credit obtained by the issuer or sponsor through third parties, through various means of structuring the transaction or through a combination of such approaches. The Fund will not pay any additional fees for such credit support, although the existence of credit support may increase the price of the security.
The Fund may invest up to 15% of its net assets in illiquid securities, which may include securities with contractual restrictions on resale, securities exempt from registration under Rule 144A promulgated under the Securities Act of 1933, as amended, and other securities which may not be readily marketable. The relative illiquidity of these securities may impair the Fund from disposing of them in a timely manner and at a fair price when it is necessary or desirable to do so. While maintaining oversight, the Board has delegated to DMC, the day-to-day functions of determining whether individual securities are liquid for purposes of the Fund’s limitation on investments in illiquid securities. Securities eligible for resale pursuant to Rule 144A, which are determined to be liquid, are not subject to the Fund’s 15% limit on investments in illiquid securities. Rule 144A securities have been identified on the “Schedule of investments.”
11. Contractual Obligations
The Fund enters into contracts in the normal course of business that contain a variety of indemnifications. The Fund’s maximum exposure under these arrangements is unknown. However, the Fund has not had prior claims or losses pursuant to these contracts. Management has reviewed the Fund’s existing contracts and expects the risk of loss to be remote.
12. General Motors Term Loan Litigation
The Fund received notice of a litigation proceeding related to a General Motors Corporation (G.M.) term loan participation previously held by the Fund in 2009. We believe the matter subject to the litigation notice will likely lead to a recovery from the Fund of certain amounts received by the Fund because a US Court of Appeals has ruled that the Fund and similarly situated investors were unsecured creditors rather than secured lenders of G.M. as a result of an erroneous Uniform Commercial Code filing made by a third party. The Fund received the full principal on the loans in 2009 after the G.M. bankruptcy. However, based upon the court ruling the estate is seeking to recover such amounts arguing that, as unsecured creditors, the Fund should not have received payment in full. Based upon currently available information
| | |
| Notes to financial statements | | |
| Delaware High-Yield Opportunities Fund | | |
12. General Motors Term Loan Litigation (continued)
related to the litigation and the Fund’s potential exposure, the Fund recorded a contingent liability of $2,623,299 and an asset of $786,990 based on the expected recoveries to unsecured creditors as of July 31, 2017 that resulted in a net decrease in the Fund’s NAV to reflect this likely recovery.
13. Recent Accounting Pronouncements
In October 2016, the Securities and Exchange Commission released its Final Rule on Investment Company Reporting Modernization (the “Rule”). The Rule contains amendments to Regulation S-X which impact financial statement presentation, particularly the presentation of derivative investments. Although it is still evaluating the impact of the Rule, management believes that many of the Regulation S-X amendments are materially consistent with the Fund’s current financial statement presentation and expects that the Fund will comply with the Rule’s Regulation S-X amendments by the Aug. 1, 2017 compliance date.
14. Subsequent Events
From Sept. 1, 2017, DIFSC’s fees are calculated daily and paid monthly based on the aggregate daily net assets of the Delaware Funds at the following annual rate: 0.00475% of the first $35 billion; 0.0040% of the next $10 billion; and 0.0025% of aggregate average daily net assets in excess of $45 billion (the “Total Fee”). Each Fund in the Delaware Funds pays a minimum of $4,000, which, in aggregate, is subtracted from the Total Fee. Each Fund in Delaware Funds then pays its relative portion of the remainder of the Total Fee on a relative NAV basis.
Management has determined that no other material events or transactions occurred subsequent to July 31, 2017 that would require recognition or disclosure in the Fund’s financial statements.
Report of independent
registered public accounting firm
To the Board of Trustees of Delaware Group® Income Funds
and the Shareholders of Delaware High-Yield Opportunities Fund:
In our opinion, the accompanying statement of assets and liabilities, including the schedule of investments, and the related statements of operations and of changes in net assets and the financial highlights present fairly, in all material respects, the financial position of the Delaware High-Yield Opportunities Fund (one of the series constituting Delaware Group® Income Fund, hereafter referred to as the “Fund”) as of July 31, 2017, the results of its operations for the year then ended, the changes in its net assets for each of the two years in the period then ended and the financial highlights for each of the five years in the period then ended, in conformity with accounting principles generally accepted in the United States of America. These financial statements and financial highlights (hereafter referred to as “financial statements”) are the responsibility of the Fund’s management. Our responsibility is to express an opinion on these financial statements based on our audits. We conducted our audits of these financial statements in accordance with the standards of the Public Company Accounting Oversight Board (United States). Those standards require that we plan and perform the audit to obtain reasonable assurance about whether the financial statements are free of material misstatement. An audit includes examining, on a test basis, evidence supporting the amounts and disclosures in the financial statements, assessing the accounting principles used and significant estimates made by management, and evaluating the overall financial statement presentation. We believe that our audits, which included confirmation of securities as of July 31, 2017 by correspondence with the custodian and brokers, provide a reasonable basis for our opinion.
PricewaterhouseCoopers LLP
Philadelphia, Pennsylvania
September 18, 2017
Other Fund information (Unaudited)
Delaware High-Yield Opportunities Fund
Tax Information
The information set forth below is for the Fund’s fiscal year as required by federal income tax laws. Shareholders, however, must report distributions on a calendar year basis for income tax purposes, which may include distributions for portions of two fiscal years of the Fund. Accordingly, the information needed by shareholders for income tax purposes will be sent to them in January of each year. Please consult your tax advisor for proper treatment of this information.
All disclosures are based on financial information available as of the date of this annual report and, accordingly are subject to change. For any and all items requiring reporting, it is the intention of the Fund to report the maximum amount permitted under the Internal Revenue Code and the regulations thereunder.
For the fiscal year ended July 31, 2017, the Fund reports distributions paid during the year as follows:
| | | | |
(A) Ordinary Income Distribution (Tax Basis) | | | 99.49 | % |
(B) Return of Capital (Tax Basis) | | | 0.51 | % |
Total Distributions (Tax Basis) | | | 100.00 | % |
(A) and (B) are based on a percentage of the Fund’s total distributions.
For the fiscal year ended July 31, 2017, certain interest income paid by the Fund, determined to be Qualified Interest Income may be subject to relief from US withholding for foreign shareholders, as provided by the American Jobs Creation Act of 2004; the Tax Relief Unemployment Insurance Reauthorization, and Job Creations Act of 2010; and as extended by the American Taxpayer Relief Act of 2012. For the fiscal year ended July 31, 2017, the Fund has reported maximum distributions of Qualified Interest Income of $13,788,451.
This page intentionally left blank.
| | |
| Board of trustees / directors and officers addendum | | |
| Delaware FundsSM by Macquarie | | |
A mutual fund is governed by a Board of Trustees/Directors (“Trustees”), which has oversight responsibility for the management of a fund’s business affairs. Trustees establish procedures and oversee and review the performance of the investment manager, the distributor, and others who perform services for the fund. The independent fund trustees, in particular, are advocates
| | | | |
Name, Address, and Birth Date | | Position(s) Held with Fund(s) | | Length of Time Served |
Interested Trustee | | |
Shawn K. Lytle1, 2 | | President, | | Trustee since |
2005 Market Street | | Chief Executive Officer, | | September 2015 |
Philadelphia, PA 19103 | | and Trustee | | |
February 1970 | | | | President and |
| | | | Chief Executive Officer |
| | | | since August 2015 |
| | | | |
| | | | |
Independent Trustees | | |
Thomas L. Bennett | | Chairman and Trustee | | Trustee since |
2005 Market Street | | | | March 2005 |
Philadelphia, PA 19103 | | | | |
October 1947 | | | | Chairman since |
| | | | | March 2015 |
Ann D. Borowiec | | Trustee | | Since March 2015 |
2005 Market Street | | | | |
Philadelphia, PA 19103 | | | | |
November 1958 | | | | |
| | | | |
| | | | |
| | | | |
| | | | | |
Joseph W. Chow | | Trustee | | Since January 2013 |
2005 Market Street | | | | |
Philadelphia, PA 19103 | | | | |
January 1953 | | | | |
| | | | |
| | | | | |
| 1 | Shawn K. Lytle is considered to be an “Interested Trustee” because he is an executive officer of the Fund’s(s’) investment advisor. |
| 2 | Shawn K. Lytle, David F. Connor, Daniel V. Geatens, and Richard Salus serve in similar capacities for the six portfolios of the Optimum Fund Trust, which have the same investment advisor, principal underwriter, and transfer agent as the registrant. |
for shareholder interests. Each trustee has served in that capacity since he or she was elected to or appointed to the Board of Trustees, and will continue to serve until his or her retirement or the election of a new trustee in his or her place. The following is a list of the Trustees and Officers with certain background and related information.
| | | | |
Principal Occupation(s)
During the Past Five Years | | Number of Portfolios in Fund Complex Overseen by Trustee or Officer | | Other Directorships
Held by Trustee or Officer |
| | | | |
Shawn K. Lytle has served as | | 62 | | Trustee — UBS |
President of | | | | Relationship Funds, |
Macquarie Investment | | | | SMA Relationship |
Management3 | | | | Trust, and UBS Funds |
since June 2015 and was the | | | | (May 2010–April 2015) |
Regional Head of Americas for | | | | |
UBS Global Asset | | | | |
Management from 2010 through 2015. | | | | |
| | | | |
Private Investor | | 62 | | None |
(March 2004–Present) | | | | |
| | | | |
| | | | |
| | | | |
| | | | | |
Chief Executive Officer, | | 62 | | Director — |
Private Wealth Management | | | | Banco Santander International |
(2011–2013) and | | | | |
Market Manager, | | | | Director — |
New Jersey Private | | | | Santander Bank, N.A. |
Bank (2005–2011) — | | | | |
J.P. Morgan Chase & Co. | | | | |
Executive Vice President | | 62 | | Director and Audit Committee |
(Emerging Economies | | | | Member — Hercules |
Strategies, Risks, and | | | | Technology Growth |
Corporate Administration) | | | | Capital, Inc. |
State Street Corporation | | | | (2004–2014) |
(July 2004–March 2011) | | | | |
| 3 | Macquarie Investment Management (formerly known as Delaware Investments) is the marketing name for Macquarie Management Holdings, Inc. (formerly known as Delaware Management Holdings, Inc.) and its subsidiaries, including the Fund’s(s’) investment advisor, principal underwriter, and its transfer agent. |
| | |
| Board of trustees / directors and officers addendum | | |
| Delaware FundsSM by Macquarie | | |
| | | | |
Name, Address, and Birth Date | | Position(s) Held with Fund(s) | | Length of Time Served |
Independent Trustees (continued) | | |
John A. Fry | | Trustee | | Since January 2001 |
2005 Market Street | | | | |
Philadelphia, PA 19103 | | | | |
May 1960 | | | | |
| | | | |
| | | | |
| | | | |
| | | | |
| | | | |
| | | | |
| | | | |
| | | | | |
| | |
Lucinda S. Landreth | | Trustee | | Since March 2005 |
2005 Market Street | | | | |
Philadelphia, PA 19103 | | | | |
June 1947 | | | | |
Frances A. Sevilla-Sacasa | | Trustee | | Since September 2011 |
2005 Market Street | | | | |
Philadelphia, PA 19103 | | | | |
January 1956 | | | | |
| | | | |
| | | | |
| | | | |
| | | | |
| | | | |
| | | | |
| | | | |
| | | | |
| | | | |
| | | | |
| | | | |
| | | | |
| | | | | |
| | | | |
Principal Occupation(s) During the Past Five Years | | Number of Portfolios in Fund Complex Overseen by Trustee or Officer | | Other Directorships
Held by Trustee or Officer |
| | |
President — | | 62 | | Director, Audit Committee, |
Drexel University | | | | and Governance Committee |
(August 2010–Present) | | | | Member — Community |
| | | | Health Systems |
President — | | | | |
Franklin & Marshall College | | | | Director — Drexel |
(July 2002–July 2010) | | | | Morgan & Co. |
| | | | |
| | | | Director, Audit Committee |
| | | | Member — vTv |
| | | | Therapeutics LLC |
| | | | |
| | | | Director — FS Credit Real |
| | | | | Estate Income Trust, Inc. |
Private Investor | | 62 | | None |
(2004–Present) | | | | |
| | | | |
| | | | |
| | | | | |
Chief Executive Officer — | | 62 | | Trust Manager and |
Banco Itaú | | | | Audit Committee |
International | | | | Member —Camden |
(April 2012–December 2016) | | | | Property Trust |
| | |
Executive Advisor to Dean | | | | |
(August 2011–March 2012) and Interim Dean | | | | |
(January 2011–July 2011) — | | | | |
University of Miami School of | | | | |
Business Administration | | | | |
| | |
President — U.S. Trust, | | | | |
Bank of America Private | | | | |
Wealth Management | | | | |
(Private Banking) | | | | |
(July 2007–December 2008) | | | | |
| | |
| Board of trustees / directors and officers addendum | | |
| Delaware FundsSM by Macquarie | | |
| | | | |
Name, Address, and Birth Date | | Position(s) Held with Fund(s) | | Length of Time Served |
Independent Trustees (continued) | | |
Thomas K. Whitford | | Trustee | | Since January 2013 |
2005 Market Street | | | | |
Philadelphia, PA 19103 | | | | |
March 1956 | | | | |
| | |
| | | | | |
Janet L. Yeomans | | Trustee | | Since April 1999 |
2005 Market Street | | | | |
Philadelphia, PA 19103 | | | | |
July 1948 | | | | |
| | |
| | | | |
Officers | | |
David F. Connor | | Senior Vice President, | | Senior Vice President |
2005 Market Street | | General Counsel, | | since May 2013; |
Philadelphia, PA 19103 | | and Secretary | | General Counsel |
December 1963 | | | | since May 2015; |
| | | | Secretary since |
| | | | October 2005 |
Daniel V. Geatens | | Vice President | | Treasurer since October 2007 |
2005 Market Street | | and Treasurer | | |
Philadelphia, PA 19103 | | | | |
October 1972 | | | | |
| | |
| | | | | |
Richard Salus | | Senior Vice President | | Chief Financial Officer |
2005 Market Street | | and Chief Financial Officer | | since November 2006 |
Philadelphia, PA 19103 | | | | |
October 1963 | | | | |
| | |
| | | | | |
The Statement of Additional Information for the Fund(s) includes additional information about the Trustees and Officers and is available, without charge, upon request by calling 800 523-1918.
| | | | |
Principal Occupation(s) During the Past Five Years | | Number of Portfolios in Fund Complex Overseen by Trustee or Officer | | Other Directorships Held by Trustee or Officer |
| | | | |
Vice Chairman | | 62 | | Director — HSBC Finance |
(2010–April 2013) — | | | | Corporation and HSBC |
PNC Financial | | | | North America Holdings Inc. |
Services Group | | | | |
| | | | Director — |
| | | | HSBC USA Inc. |
| | | | | |
Vice President and Treasurer | | 62 | | Director, Personnel and |
(January 2006–July 2012), | | | | Compensation Committee |
Vice President — | | | | Chair, and Member of |
Mergers & Acquisitions | | | | Nominating, Investments, and |
(January 2003–January 2006), | | | | Audit Committees — |
and Vice President | | | | Okabena Company |
and Treasurer | | | | (2009–2014) |
(July 1995–January 2003) — 3M Company | | | | |
| | | | |
David F. Connor has served | | 62 | | None2 |
in various capacities at different times at | | | | |
Macquarie Investment | | | | |
Management. | | | | |
| | | | |
| | | | | |
Daniel V. Geatens has served | | 62 | | None2 |
in various capacities at different times at | | | | |
Macquarie Investment | | | | |
Management. | | | | |
| | | | | |
Richard Salus has served | | 62 | | None2 |
in various executive capacities at different times at | | | | |
Macquarie Investment | | | | |
Management. | | | | |
| | | | | |
About the organization
| | | | | | |
| Board of trustees | | | | | | |
| Shawn K. Lytle | | Ann D. Borowiec | | John A. Fry | | Frances A. |
President and Chief Executive Officer Delaware FundsSM by Macquarie Philadelphia, PA Thomas L. Bennett Chairman of the Board Delaware Funds by Macquarie Private Investor Rosemont, PA | | Formtter Chief Executive Officer Private Wealth Management J.P. Morgan Chase & Co. New York, NY Joseph W. Chow Former Executive Vice President State Street Corporation Boston, MA | | President Drexel University Philadelphia, PA Lucinda S. Landreth Former Chief Investment Officer Assurant, Inc. New York, NY | | Sevilla-Sacasa Former Chief Executive Officer Banco Itaú International Miami, FL Thomas K. Whitford Former Vice Chairman PNC Financial Services Group Pittsburgh, PA Janet L. Yeomans Former Vice President and Treasurer 3M Company St. Paul, MN |
| | | | |
| | | |
| Affiliated officers | | | | | |
| | | |
| David F. Connor | | Daniel V. Geatens | | Richard Salus | | |
| Senior Vice President, | | Vice President and | | Senior Vice President and | | |
| General Counsel, | | Treasurer | | Chief Financial Officer | | |
| and Secretary | | Delaware Funds | | Delaware Funds | | |
| Delaware Funds | | by Macquarie | | by Macquarie | | |
| by Macquarie | | Philadelphia, PA | | Philadelphia, PA | | |
| Philadelphia, PA | | | | | | |
This annual report is for the information of Delaware High-Yield Opportunities Fund shareholders, but it may be used with prospective investors when preceded or accompanied by the Delaware Fund fact sheet for the most recently completed calendar quarter. These documents are available at delawarefunds.com/literature.
The Fund files its complete schedule of portfolio holdings with the Securities and Exchange Commission (SEC) for the first and third quarters of each fiscal year on Form N-Q. The Fund’s Forms N-Q, as well as a description of the policies and procedures that the Fund uses to determine how to vote proxies (if any) relating to portfolio securities are available without charge (i) upon request, by calling 800 523-1918; and (ii) on the SEC’s website at sec.gov. In addition, a description of the policies and procedures that the Fund uses to determine how to vote proxies (if any) relating to portfolio securities and the Schedule of Investments included in the Fund’s most recent Form N-Q are available without charge on the Fund’s website at delawarefunds.com/literature. The Fund’s Forms N-Q may be reviewed and copied at the SEC’s Public Reference Room in Washington, D.C.; information on the operation of the Public Reference Room may be obtained by calling 800 SEC-0330.
Information (if any) regarding how the Fund voted proxies relating to portfolio securities during the most recently disclosed 12-month period ended June 30 is available without charge (i) through the Fund’s website at delawarefunds.com/proxy; and (ii) on the SEC’s website at sec.gov.
58
| | |

| | 
Annual report |
Fixed income mutual fund
Delaware Floating Rate Fund
(formerly, Delaware Diversified Floating Rate Fund)
July 31, 2017
Carefully consider the Fund’s investment objectives, risk factors, charges, and expenses before investing. This and other information can be found in the Fund’s prospectus and its summary prospectus, which may be obtained by visiting delawarefunds.com/literature or calling 800 523-1918. Investors should read the prospectus and the summary prospectus carefully before investing.
You can obtain shareholder reports and prospectuses online instead of in the mail.
Visit delawarefunds.com/edelivery.
Experience Delaware FundsSM by Macquarie
Macquarie Investment Management (MIM) is a global asset manager with offices throughout the United States, Europe, Asia, and Australia. We are active managers who prioritize autonomy and accountability at the investment team level in pursuit of opportunities that matter for our clients. Delaware Funds by Macquarie is one of the longest-standing mutual fund families, with more than 75 years in existence.
If you are interested in learning more about creating an investment plan, contact your financial advisor.
You can learn more about Delaware Funds by Macquarie or obtain a prospectus for Delaware Floating Rate Fund at delawarefunds.com/literature.
Manage your account online
| ● | | Check your account balance and transactions |
| ● | | View statements and tax forms |
| ● | | Make purchases and redemptions |
Visit delawarefunds.com/account-access.
Macquarie Investment Management (MIM) is the marketing name for the registered investment advisers including Macquarie Investment Management Business Trust (MIMBT) (formerly, Delaware Management Business Trust), Macquarie Funds Management Hong Kong Limited, Macquarie Investment Management Austria Kapitalanlage AG, Macquarie Investment Management Global Limited, Macquarie Bank International Limited, Macquarie Investment Management Europe Limited, Macquarie Investment Management Limited, and Macquarie Capital Investment Management, Inc.
The Funds are distributed by Delaware Distributors, L.P., an affiliate of Macquarie Investment Management Business Trust and Macquarie Group Limited. Macquarie Investment Management (MIM), a member of Macquarie Group, refers to the companies comprising the asset management division of Macquarie Group Limited and its subsidiaries and affiliates worldwide.
Other than Macquarie Bank Limited (MBL), none of the entities noted are authorized deposit-taking institutions for the purposes of the Banking Act 1959 (Commonwealth of Australia). The obligations of these entities do not represent deposits or other liabilities of MBL. MBL does not guarantee or otherwise provide assurance in respect of the obligations of these entities, unless noted otherwise. The Fund is governed by US laws and regulations.
Table of contents
Unless otherwise noted, views expressed herein are current as of July 31, 2017, and subject to change for events occurring after such date.
The Fund is not FDIC insured and is not guaranteed. It is possible to lose the principal amount invested.
Advisory services provided by Delaware Management Company, a series of MIMBT, a US registered investment advisor.
All third-party marks cited are the property of their respective owners.
©2017 Macquarie Management Holdings, Inc. (formerly, Delaware Management Holdings, Inc.)
| | |
| Portfolio management review | | |
| Delaware Floating Rate Fund | | August 8, 2017 |
| | | | | | | | |
Performance preview (for the year ended July 31, 2017) | | | | | | | | |
Delaware Floating Rate Fund (Institutional Class shares) | | | 1-year return �� | | | | +4.08 | % |
Delaware Floating Rate Fund (Class A shares) | | | 1-year return | | | | +3.82 | % |
S&P/LSTA Leveraged Loan Index (current benchmark) | | | 1-year return | | | | +6.64 | % |
BofA Merrill Lynch US Dollar 3-Month Deposit Offered Rate Constant Maturity Index (former benchmark) | | | 1-year return | | | | +0.92 | % |
Past performance does not guarantee future results.
For complete, annualized performance for Delaware Floating Rate Fund, please see the table on page 4.
Institutional Class shares are available without sales or asset-based distribution charges only to certain eligible accounts. The performance of Class A shares excludes the applicable sales charge. Both Institutional Class shares and Class A shares reflect the reinvestment of all distributions.
Please see page 7 for a description of the index. Index performance returns do not reflect any management fees, transaction costs, or expenses. Indices are unmanaged and one cannot invest directly in an index.
Effective Jan. 31, 2017, the investment strategies for Delaware Diversified Floating Rate Fund changed and the Fund was repositioned as a bank loan focused fund. In connection with the repositioning, the Fund’s name changed to Delaware Floating Rate Fund and the benchmark changed to the S&P/LSTA Leveraged Loan Index. These changes may result in a higher portfolio turnover in the near future. Please see the Fund’s prospectus for more information.
Investment markets were positive overall for the Fund’s fiscal year ended July 31, 2017. The fundamental backdrop was largely strong and supportive of credit, including below-investment-grade companies. In general, companies generated stable, low single-digit revenue growth, enjoying relatively stable operating profit margins with historically strong credit metrics. The economic backdrop supported allocations to bank loans as well as positioning in B- and BB-rated firms.
Fund performance
For the fiscal year ended July 31, 2017, Delaware Floating Rate Fund Institutional Class shares returned +4.08%. The Fund’s Class A shares returned +3.82% at net asset value and +1.02% at maximum offer price. These figures reflect all distributions reinvested. During the same period, the Fund’s benchmark, the S&P/LSTA Leveraged Loan Index, returned +6.64%. The Fund’s former benchmark, the BofA Merrill Lynch US Dollar 3-Month Deposit Offered Rate Constant Maturity
The Fund is managed with
a bottom-up (loan by loan,
bond by bond) investment
process based on
fundamentals. Its
positioning and
performance are driven by
the underlying
fundamentals of the
companies in which the
Fund invests.
| | |
| Portfolio management review | | |
| Delaware Floating Rate Fund | | |
Index, returned +0.92%. For complete, annualized performance of Delaware Floating Rate Fund, please see the table on page 4.
As noted on the previous page, the Fund was repositioned during the fiscal year to provide shareholders and prospective shareholders access to an income-oriented solution with the opportunity for greater potential returns. The investment team has extensive experience managing bank loan focused portfolios, which should make the transition process efficient.
While the Fund’s total 12-month return lagged its new benchmark, the S&P/LSTA Leveraged Loan Index, it outpaced the benchmark during the six-month period ending July 31, 2017, that followed the Fund’s transition to a bank loan focused fund.
The Fund’s full-year results versus the Fund’s current benchmark were hampered by the first six months of the fiscal year, when it was managed as a broadly diversified and more defensive portfolio. At that time, only one-third of the portfolio’s assets had been invested in bank loans compared to more than 80% invested as of the end of the fiscal year. Under the previous strategy, the remaining asset classes were more investment grade in nature, resulting in a lower-risk, lower-income investment profile. The current strategy is meant to compete with the rest of the bank loan fund universe, with a higher-risk, higher-income, higher-return profile than the previous strategy. At the end of the fiscal year, 85% of the Fund’s assets were invested in bank loans, with the remaining 15% allocated to high-quality, high yield corporate bonds and AAA-rated floating-rate collateralized loan obligation notes.
The Fund is managed with a bottom-up (loan by loan, bond by bond) investment process based on fundamentals. Its positioning and performance are driven by the underlying fundamentals of the companies in which the Fund invests. For the last
three quarters, we have seen relatively strong and improving performance within these companies.
Contributing significantly to the Fund’s performance were its allocations to higher-quality, high yield bonds and to investment grade securities, both of which outperformed the S&P/LSTA Leveraged Loan Index. The Fund also had positive sector positioning and security selection in each of these asset classes, with both the banking and materials sectors contributing to results. Positive performance within banking was spread among several banks, including Lloyds Banking Group, which added to the Fund’s returns. These banks generally reported solid earnings during the period, with high-quality and improving loan portfolios. Within building materials, Builders FirstSource was a significant contributor to the Fund’s performance. The company benefited from revenue and earnings growth that was driven by strong new residential construction.
Some individual loans detracted from the Fund’s performance, including a loan to consumer products firm Revlon, which reported disappointing first-quarter financials and provided poor guidance on its quarterly earnings call. The company experienced weakness in its US mass retail channel, which contributed to large revenue and earnings declines. That led to the loan trading off and the Fund’s subsequent sale of its position in Revlon during the fiscal year. Also hurting performance was the Fund’s exposure to building-products company Forterra Finance, which likewise sold off after reporting weak first-quarter results. According to the company’s management, poor weather in California and high prices for raw materials contributed to weaker-than-expected earnings. We reduced the Fund’s exposure to Forterra Finance and are continuing to monitor the company’s prospects closely.
In our view, the fundamental backdrop for bank loans remains positive, with a default rate of just 1.5% over the past 12 months, which is below the
historical average of 3.2% (source: Leveraged Commentary & Data (LCD), an offering of S&P Global Market Intelligence). The main concern for us within bank loans and fixed income assets more broadly is their fairly rich valuations and historically tight spreads.
We have positioned the Fund more conservatively than it would be if we viewed valuations as more attractive, particularly because of the offsetting factors of strong overall fundamentals for bank loans and high yield bonds in contrast to rich valuations.
We believe the fundamental backdrop supports an allocation to lower-rated loans and high yield bonds. However, from a valuation standpoint, we don’t believe corresponding yields are sufficient to chase returns in the lower-rated parts of the fixed income market. Our focus is on higher-quality, high yield bonds, including senior secured bonds — with similar credit risk to the senior secured loans in the portfolio — as well as some shorter-duration high yield bonds.
A note on derivatives
Before the Fund’s strategy changed, we used interest rate swaps to hedge interest rate exposure among longer-dated, fixed-rate investment grade bonds. This is no longer needed as the new strategy invests more than 90% in floating-rate assets and the high-yield bond exposure tends to be fairly short duration, potentially limiting any interest rate risk. During the fiscal year, derivatives did not have a material effect on the Fund’s performance (that is, it accounted for less than 0.50 percentage points of performance at the portfolio level).
| | |
| Performance summary | | |
| Delaware Floating Rate Fund | | July 31, 2017 |
The performance quoted represents past performance and does not guarantee future results. Investment return and principal value of an investment will fluctuate so that shares, when redeemed, may be worth more or less than their original cost. Current performance may be lower or higher than the performance quoted. Performance data current to the most recent month end may be obtained by calling 800 523-1918 or visiting delawarefunds.com/performance.
| | | | | | | | |
| Fund and benchmark performance1,2 | | Average annual total returns through July 31, 2017 |
| | | | |
| | | 1 year | | 3 years | | 5 years | | Lifetime |
Class A (Est. Feb. 26, 2010) | | | | | | | | |
Excluding sales charge | | +3.82% | | +1.23% | | +1.74% | | +2.04% |
Including sales charge | | +1.02% | | +0.31% | | +1.18% | | +1.66% |
Class C (Est. Feb. 26, 2010) | | | | | | | | |
Excluding sales charge | | +3.06% | | +0.48% | | +0.99% | | +1.28% |
Including sales charge | | +2.06% | | +0.48% | | +0.99% | | +1.28% |
Class R (Est. Feb. 26, 2010) | | | | | | | �� | |
Excluding sales charge | | +3.57% | | +0.98% | | +1.49% | | +1.78% |
Including sales charge | | +3.57% | | +0.98% | | +1.49% | | +1.78% |
Institutional Class (Est. Feb. 26, 2010) | | | | | | | | |
Excluding sales charge | | +4.08% | | +1.49% | | +1.99% | | +2.29% |
Including sales charge | | +4.08% | | +1.49% | | +1.99% | | +2.29% |
S&P/LSTA Leveraged Loan Index | | +6.64% | | +3.60% | | +4.48% | | +5.03%* |
BofA Merrill Lynch US Dollar 3-Month Deposit | | | | | | | | |
Offered Rate Constant Maturity Index | | +0.92% | | +0.53% | | +0.44% | | +0.42%* |
*The benchmark lifetime return is for Class A share comparison only and is calculated using the last business day in the
month of the Fund’s Class A inception date.
1 Returns reflect the reinvestment of all distributions and are presented both with and without the applicable sales charges described below. Returns do not reflect the deduction of taxes the shareholder would pay on Fund distributions or redemptions of Fund shares.
Expense limitations were in effect for certain classes during some or all of the periods shown in the “Fund and benchmark performance” table. Expenses for each class are listed on the “Fund expense ratios” table on page 6. Performance would have been lower had expense limitations not been in effect.
Institutional Class shares are available without sales or asset-based distribution charges only to certain eligible accounts.
Class A shares are sold with a maximum front-end sales charge of 2.75%, and have an annual distribution and service fee of 0.25% of average daily net assets. Performance for Class A shares, excluding sales charges, assumes that no front-end sales charge applied.
Class C shares are sold with a contingent deferred sales charge of 1.00% if redeemed during the first 12 months. They are also subject to an annual distribution and service fee of 1.00% of average daily net assets. Performance for Class C shares, excluding sales charges, assumes either that
contingent deferred sales charges did not apply or that the investment was not redeemed.
Class R shares are available only for certain retirement plan products. They are sold without a sales charge and have an annual distribution and service fee of 0.50% of average daily net assets.
Fixed income securities and bond funds can lose value, and investors can lose principal, as interest rates rise. They also may be affected by economic conditions that hinder an issuer’s ability to make interest and principal payments on its debt.
The Fund may also be subject to prepayment risk, the risk that the principal of a bond that is held by a portfolio will be prepaid prior to maturity, at the time when interest rates are lower than what the bond was paying. A portfolio may then have to reinvest that money at a lower interest rate.
High yielding, non-investment-grade bonds (junk bonds) involve higher risk than investment grade bonds. The high yield secondary market is particularly susceptible to liquidity problems when institutional investors, such as mutual funds and certain other financial institutions, temporarily stop buying bonds for regulatory, financial, or other reasons. In addition, a less liquid secondary market makes it more difficult for the Fund to obtain precise valuations of the high yield securities in its portfolio.
International investments entail risks not ordinarily associated with US investments including fluctuation in currency values, differences in accounting principles, or economic or political instability in other nations. Investing in emerging markets can be riskier than investing in established foreign markets due to increased volatility and lower trading volume.
The Fund may invest in derivatives, which may involve additional expenses and are subject to risk, including the risk that an underlying security or securities index moves in the opposite direction from what the portfolio manager anticipated. A derivatives transaction depends upon the
counterparties’ ability to fulfill their contractual obligations.
Investments in mortgage-backed securities (MBS) may involve risks. MBS represent an ownership interest in a pool of mortgage loans. The individual mortgage loans are packaged or “pooled” together for sale to investors. These mortgage loans may have either fixed or adjustable interest rates.
Investments in collateralized loan obligations (CLOs) may involve risks. CLOs are securities backed by a pool of debt, often low-rated corporate loans. Investors receive scheduled debt payments from the underlying loans but assume most of the risk in the event that borrowers default.
Because the Fund may invest in bank loans and other direct indebtedness, it is subject to the risk that the Fund will not receive payment of principal, interest, and other amounts due in connection with these investments, which primarily depend on the financial condition of the borrower and the lending institution.
This document may mention bond ratings published by nationally recognized statistical rating organizations (NRSROs) Standard & Poor’s, Moody’s Investors Service, and Fitch, Inc. For securities rated by an NRSRO other than S&P, the rating is converted to the equivalent S&P credit rating. Bonds rated AAA are rated as having the highest quality and are generally considered to have the lowest degree of investment risk. Bonds rated AA are considered to be of high quality, but with a slightly higher degree of risk than bonds rated AAA. Bonds rated A are considered to have many favorable investment qualities, though they are somewhat more susceptible to adverse economic conditions. Bonds rated BBB are believed to be of medium-grade quality and generally riskier over the long term. Bonds rated BB, B, and CCC are regarded as having significant speculative characteristics, with BB indicating the least degree of speculation of the three.
| | |
| Performance summary | | |
| Delaware Floating Rate Fund | | |
2 The Fund’s expense ratios, as described in the most recent prospectus, are disclosed in the following “Fund expense ratios” table.
| | | | | | | | |
| | | | |
| Fund expense ratios | | Class A | | Class C | | Class R | | Institutional Class |
Total annual operating expenses (without fee waivers) | | 0.97% | | 1.72% | | 1.22% | | 0.72% |
Net expenses (including fee waivers, if any) | | 0.97% | | 1.72% | | 1.22% | | 0.72% |
| Type of waiver | | n/a | | n/a | | n/a | | n/a |
Performance of a $10,000 investment1
Average annual total returns from Feb. 26, 2010 (Fund’s inception) through July 31, 2017
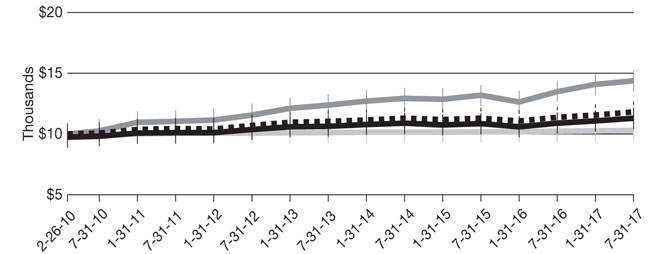
| | | | | | | | | | | | | | |
| For period beginning Feb. 26, 2010, through July 31, 2017 | | Starting value | | | Ending value | |

| | S&P/LSTA Leveraged Loan Index | | $ | 10,000 | | | $ | 14,391 | |

| | Delaware Floating Rate Fund — Institutional Class shares | | $ | 10,000 | | | $ | 11,835 | |

| | Delaware Floating Rate Fund — Class A shares | | $ | 9,725 | | | $ | 11,297 | |

| | BofA Merrill Lynch US Dollar 3-Month Deposit Offered Rate Constant Maturity Index | | $ | 10,000 | | | $ | 10,314 | |
1 The “Performance of a $10,000 investment” graph assumes $10,000 invested in Institutional Class and Class A shares of the Fund on Feb. 26, 2010, and includes the effect of a 2.75% front-end sales charge (for Class A shares) and the reinvestment of all distributions. The graph does not reflect the deduction of taxes the shareholders would pay on Fund distributions or redemptions of Fund shares. Expense limitations were in effect for some or all of the periods shown. Performance would have been lower had expense limitations not been in effect. Expenses are listed in the “Fund expense ratios” table on page 6. Please note additional details on pages 4 through 8.
The graph also assumes $10,000 invested in the S&P/LSTA Leveraged Loan Index and the BofA Merrill Lynch US Dollar 3-Month Deposit Offered Rate Constant Maturity Index as of Feb. 26, 2010.
The S&P/LSTA Leveraged Loan Index is a broad index designed to reflect the market-value weighted performance of the US dollar-denominated institutional leveraged loans.
The BofA Merrill Lynch US Dollar 3-Month Deposit Offered Rate Constant Maturity Index represents the London interbank offered rate (LIBOR) with a constant 3-month average maturity. LIBOR, published by the British Bankers’ Association, is a composite of the rates of interest at which banks borrow from one another in the London market, and it is a widely used benchmark for short-term interest rates.
Index performance returns do not reflect any management fees, transaction costs, or expenses. Indices are unmanaged and one cannot invest directly in an index. Past performance is not a guarantee of future results.
| | |
| Performance summary | | |
| Delaware Floating Rate Fund | | |
Performance of other Fund classes will vary due to different charges and expenses.
| | | | | | |
| | | | |
| | | Nasdaq symbols | | CUSIPs | | |
Class A | | DDFAX | | 245908660 | | |
Class C | | DDFCX | | 245908652 | | |
Class R | | DDFFX | | 245908645 | | |
Institutional Class | | DDFLX | | 245908637 | | |
This page intentionally left blank.
| | |
| Disclosure of Fund expenses | | |
| For the six-month period from February 1, 2017 to July 31, 2017 (Unaudited) | | |
As a shareholder of the Fund, you incur two types of costs: (1) transaction costs, including sales charges (loads) on purchase payments, reinvested dividends, or other distributions; redemption fees; and exchange fees; and (2) ongoing costs, including management fees; distribution and/or service (12b-1) fees; and other Fund expenses. This example is intended to help you understand your ongoing costs (in dollars) of investing in the Fund and to compare these costs with the ongoing costs of investing in other mutual funds.
The example is based on an investment of $1,000 invested at the beginning of the period and held for the entire six-month period from Feb. 1, 2017 to July 31, 2017.
Actual expenses
The first section of the table shown, “Actual Fund return,” provides information about actual account values and actual expenses. You may use the information in this section of the table, together with the amount you invested, to estimate the expenses that you paid over the period. Simply divide your account value by $1,000 (for example, an $8,600 account value divided by $1,000 = 8.6), then multiply the result by the number in the first section under the heading entitled “Expenses Paid During Period” to estimate the expenses you paid on your account during this period.
Hypothetical example for comparison purposes
The second section of the table shown, “Hypothetical 5% return,” provides information about hypothetical account values and hypothetical expenses based on the Fund’s actual expense ratio and an assumed rate of return of 5% per year before expenses, which is not the Fund’s actual return. The hypothetical account values and expenses may not be used to estimate the actual ending account balance or expenses you paid for the period. You may use this information to compare the ongoing costs of investing in the Fund and other funds. To do so, compare this 5% hypothetical example with the 5% hypothetical examples that appear in the shareholder reports of the other funds.
Please note that the expenses shown in the table are meant to highlight your ongoing costs only and do not reflect any transactional costs, such as sales charges (loads), redemption fees, or exchange fees. Therefore, the second section of the table is useful in comparing ongoing costs only, and will not help you determine the relative total costs of owning different funds. In addition, if these transactional costs were included, your costs would have been higher. The Fund’s expenses shown in the table reflect fee waivers in effect. The expenses shown in the table assume reinvestment of all dividends and distributions.
Delaware Floating Rate Fund
Expense analysis of an investment of $1,000
| | | | | | | | | | | | | | | | |
| | | Beginning | | | Ending | | | | | | Expenses | |
| | | | |
| | | Account Value | | | Account Value | | | Annualized | | | Paid During Period | |
| | | | |
| | | 2/1/17 | | | 7/31/17 | | | Expense Ratio | | | 2/1/17 to 7/31/17* | |
| | | | |
Actual Fund return† | | | | | | | | | | | | | | | | |
Class A | | | $1,000.00 | | | | $1,019.10 | | | | 0.98% | | | | $4.91 | |
Class C | | | 1,000.00 | | | | 1,016.50 | | | | 1.73% | | | | 8.65 | |
Class R | | | 1,000.00 | | | | 1,019.00 | | | | 1.23% | | | | 6.16 | |
Institutional Class | | | 1,000.00 | | | | 1,021.50 | | | | 0.73% | | | | 3.66 | |
| | | | |
Hypothetical 5% return (5% return before expenses) | | | | | | | | | | | | | | | | |
Class A | | | $1,000.00 | | | | $1,019.93 | | | | 0.98% | | | | $4.91 | |
Class C | | | 1,000.00 | | | | 1,016.22 | | | | 1.73% | | | | 8.65 | |
Class R | | | 1,000.00 | | | | 1,018.70 | | | | 1.23% | | | | 6.16 | |
Institutional Class | | | 1,000.00 | | | | 1,021.17 | | | | 0.73% | | | | 3.66 | |
| * | “Expenses Paid During Period” are equal to the Fund’s annualized expense ratio, multiplied by the average account value over the period, multiplied by 181/365 (to reflect the one-half year period). |
| † | Because actual returns reflect only the most recent six-month period, the returns shown may differ significantly from fiscal year returns. |
11
Security type / sector allocation
| | |
| Delaware Floating Rate Fund | | As of July 31, 2017 (Unaudited) |
Sector designations may be different than the sector designations presented in other fund materials. The sector designations may represent the investment manager’s internal sector classifications.
| | | | |
Security type / sector | | | Percentage of net assets | |
Collateralized Debt Obligations | | | 5.71% | |
Corporate Bonds | | | 7.83% | |
Banking | | | 0.50% | |
Basic Industry | | | 0.60% | |
Capital Goods | | | 0.83% | |
Communications | | | 1.85% | |
Consumer Cyclical | | | 0.11% | |
Consumer Non-Cyclical | | | 2.63% | |
Electric | | | 0.21% | |
Energy | | | 0.40% | |
Finance Companies | | | 0.21% | |
Natural Gas | | | 0.30% | |
Technology & Electronics | | | 0.19% | |
Loan Agreements | | | 83.10% | |
US Treasury Obligation | | | 0.07% | |
Preferred Stock | | | 0.14% | |
Short-Term Investments | | | 9.41% | |
Total Value of Securities | | | 106.26% | |
Liabilities Net of Receivables and Other Assets | | | (6.26%) | |
Total Net Assets | | | 100.00% | |
12
| | |
| Schedule of investments | | |
| Delaware Floating Rate Fund | | July 31, 2017 |
| | | | | | | | |
| | | Principal amount° | | | Value (US $) | |
Collateralized Debt Obligations – 5.71% | | | | | | | | |
| |
AMMC CLO 16 | | | | | | | | |
Series 2015-16A AR 144A 2.564% 4/14/29 #● | | | 1,000,000 | | | $ | 999,493 | |
AMMC CLO XIII | | | | | | | | |
Series 2013-13A A1LR 144A 2.573% 7/24/29 #● | | | 1,500,000 | | | | 1,500,000 | |
Cedar Funding IV CLO | | | | | | | | |
Series 2014-4A AR 144A 2.386% 7/23/30 #● | | | 1,000,000 | | | | 999,496 | |
CIFC Funding | | | | | | | | |
Series 2017-3A A1 144A 2.532% 7/20/30 #● | | | 3,000,000 | | | | 2,998,500 | |
Grippen Park CLO | | | | | | | | |
Series 2017-1A A 144A 2.506% 1/20/30 #● | | | 1,000,000 | | | | 999,451 | |
JFIN CLO | | | | | | | | |
Series 2015-2A AX 144A 2.754% 10/19/26 #● | | | 401,250 | | | | 401,764 | |
KKR Financial CLO | | | | | | | | |
Series 2013-1A A1R 144A 2.594% 4/15/29 #● | | | 1,000,000 | | | | 999,494 | |
Oaktree CLO | | | | | | | | |
Series 2014-1A A1R 144A 2.472% 5/13/29 #● | | | 1,000,000 | | | | 999,496 | |
Shackleton CLO | | | | | | | | |
Series 2015-8A A1 144A 2.817% 10/20/27 #● | | | 410,000 | | | | 410,066 | |
Telos CLO | | | | | | | | |
Series 2013-4A A 144A 2.604% 7/17/24 #● | | | 2,000,000 | | | | 2,000,990 | |
Venture XXI CLO | | | | | | | | |
Series 2015-21A A 144A 2.794% 7/15/27 #● | | | 685,000 | | | | 684,947 | |
Venture XXVIII CLO | | | | | | | | |
Series 2017-28A A2 144A 2.716% 7/20/30 #● | | | 3,000,000 | | | | 2,968,974 | |
| | | | | | | | |
Total Collateralized Debt Obligations (cost $15,943,630) | | | | | | | 15,962,671 | |
| | | | | | | | |
|
| |
Corporate Bonds – 7.83% | | | | | | | | |
| |
Banking – 0.50% | | | | | | | | |
Credit Suisse Group 144A 6.25%#y● | | | 300,000 | | | | 322,612 | |
Popular 7.00% 7/1/19 | | | 700,000 | | | | 742,000 | |
UBS Group 6.875%y● | | | 300,000 | | | | 329,563 | |
| | | | | | | | |
| | | | | | | 1,394,175 | |
| | | | | | | | |
Basic Industry – 0.60% | | | | | | | | |
Freeport-McMoRan 6.875% 2/15/23 | | | 500,000 | | | | 546,250 | |
Hudbay Minerals 144A 7.25% 1/15/23 # | | | 500,000 | | | | 544,375 | |
Joseph T Ryerson & Son 144A 11.00% 5/15/22 # | | | 500,000 | | | | 572,500 | |
| | | | | | | | |
| | | | | | | 1,663,125 | |
| | | | | | | | |
Capital Goods – 0.83% | | | | | | | | |
Boise Cascade 144A 5.625% 9/1/24 # | | | 300,000 | | | | 313,500 | |
Builders FirstSource 144A 5.625% 9/1/24 # | | | 750,000 | | | | 790,313 | |
Cemex 144A 7.75% 4/16/26 # | | | 300,000 | | | | 345,000 | |
XPO Logistics 144A 6.125% 9/1/23 # | | | 500,000 | | | | 521,875 | |
Zekelman Industries 144A 9.875% 6/15/23 # | | | 300,000 | | | | 340,500 | |
| | | | | | | | |
| | | | | | | 2,311,188 | |
| | | | | | | | |
Schedule of investments
Delaware Floating Rate Fund
| | | | | | | | |
| | | Principal amount° | | | Value (US $) | |
Corporate Bonds (continued) | | | | | | | | |
| |
Communications – 1.85% | | | | | | | | |
Altice Luxembourg 144A 7.75% 5/15/22 # | | | 500,000 | | | $ | 531,875 | |
CCO Holdings 144A 5.875% 5/1/27 # | | | 500,000 | | | | 539,060 | |
Gray Television 144A 5.875% 7/15/26 # | | | 500,000 | | | | 518,750 | |
Nexstar Broadcasting 144A 5.625% 8/1/24 # | | | 500,000 | | | | 518,125 | |
SFR Group 144A 7.375% 5/1/26 # | | | 500,000 | | | | 543,125 | |
Sirius XM Radio 144A 5.375% 4/15/25 # | | | 500,000 | | | | 526,250 | |
Sprint 7.875% 9/15/23 | | | 1,000,000 | | | | 1,137,500 | |
VTR Finance 144A 6.875% 1/15/24 # | | | 500,000 | | | | 534,375 | |
Zayo Group 144A 5.75% 1/15/27 # | | | 300,000 | | | | 318,750 | |
| | | | | | | | |
| | | | | | | 5,167,810 | |
| | | | | | | | |
Consumer Cyclical – 0.11% | | | | | | | | |
Penn National Gaming 144A 5.625% 1/15/27 # | | | 300,000 | | | | 309,750 | |
| | | | | | | | |
| | | | | | | 309,750 | |
| | | | | | | | |
Consumer Non-Cyclical – 2.63% | | | | | | | | |
Albertsons 144A 6.625% 6/15/24 # | | | 450,000 | | | | 424,125 | |
Community Health Systems 5.125% 8/1/21 | | | 750,000 | | | | 757,500 | |
DaVita | | | | | | | | |
5.00% 5/1/25 | | | 500,000 | | | | 508,650 | |
5.125% 7/15/24 | | | 500,000 | | | | 515,000 | |
HCA 5.00% 3/15/24 | | | 1,000,000 | | | | 1,064,000 | |
MPH Acquisition Holdings 144A 7.125% 6/1/24 # | | | 500,000 | | | | 542,500 | |
Prime Security Services Borrower 144A 9.25% 5/15/23 # | | | 750,000 | | | | 839,063 | |
Surgery Center Holdings 144A 8.875% 4/15/21 # | | | 500,000 | | | | 543,750 | |
Tenet Healthcare | | | | | | | | |
8.00% 8/1/20 | | | 750,000 | | | | 763,125 | |
8.125% 4/1/22 | | | 1,000,000 | | | | 1,077,500 | |
United Rentals North America 5.50% 5/15/27 | | | 300,000 | | | | 317,250 | |
| | | | | | | | |
| | | | | | | 7,352,463 | |
| | | | | | | | |
Electric – 0.21% | | | | | | | | |
Calpine 144A 5.875% 1/15/24 # | | | 250,000 | | | | 258,750 | |
Enel 144A 8.75% 9/24/73 #● | | | 260,000 | | | | 313,950 | |
| | | | | | | | |
| | | | | | | 572,700 | |
| | | | | | | | |
Energy – 0.40% | | | | | | | | |
Laredo Petroleum 5.625% 1/15/22 | | | 500,000 | | | | 508,125 | |
Oasis Petroleum 6.50% 11/1/21 | | | 350,000 | | | | 347,375 | |
Precision Drilling 6.625% 11/15/20 | | | 275,039 | | | | 273,663 | |
| | | | | | | | |
| | | | | | | 1,129,163 | |
| | | | | | | | |
Finance Companies – 0.21% | | | | | | | | |
Ally Financial 5.75% 11/20/25 | | | 550,000 | | | | 590,563 | |
| | | | | | | | |
| | | | | | | 590,563 | |
| | | | | | | | |
Natural Gas – 0.30% | | | | | | | | |
Cheniere Corpus Christi Holdings 7.00% 6/30/24 | | | 300,000 | | | | 343,125 | |
14
| | | | | | | | |
| | | Principal amount° | | | Value (US $) | |
Corporate Bonds (continued) | | | | | | | | |
| |
Natural Gas (continued) | | | | | | | | |
Genesis Energy 5.75% 2/15/21 | | | 500,000 | | | $ | 507,500 | |
| | | | | | | | |
| | | | | | | 850,625 | |
| | | | | | | | |
Technology & Electronics – 0.19% | | | | | | | | |
Infor US 6.50% 5/15/22 | | | 500,000 | | | | 523,125 | |
| | | | | | | | |
| | | | | | | 523,125 | |
| | | | | | | | |
Total Corporate Bonds (cost $21,677,689) | | | | | | | 21,864,687 | |
| | | | | | | | |
|
| |
Loan Agreements – 83.10%« | | | | | | | | |
| |
Accudyne Industries Borrower 1st Lien 4.234% 12/13/19 | | | 443,606 | | | | 442,982 | |
AES Tranche B 1st Lien 3.192% 5/19/22 | | | 1,995,000 | | | | 1,994,585 | |
Air Medical Group Holdings Tranche B 1st Lien 4.484% 4/28/22 | | | 1,651,090 | | | | 1,619,444 | |
Air Medical Group Holdings Tranche B1 1st Lien 5.228% 4/28/22 | | | 457,632 | | | | 454,963 | |
Albertson’s Tranche B 1st Lien 3.984% 8/25/21 | | | 1,268,275 | | | | 1,268,451 | |
Alpha 3 Tranche B1 1st Lien 4.296% 1/31/24 | | | 2,490,000 | | | | 2,510,490 | |
Altice US Finance I Tranche B 1st Lien 3.483% 7/28/25 | | | 3,500,000 | | | | 3,497,813 | |
Amaya Holdings 2nd Lien 8.00% 8/1/22 | | | 500,000 | | | | 506,407 | |
Amaya Holdings Tranche B 1st Lien 4.796% 8/1/21 | | | 2,493,639 | | | | 2,508,184 | |
American Airlines Tranche B 1st Lien 3.726% 12/14/23 | | | 1,333,659 | | | | 1,340,049 | |
American Tire Distributors 1st Lien 5.484% 9/1/21 | | | 1,496,173 | | | | 1,506,460 | |
Applied Systems 2nd Lien 7.796% 1/23/22 | | | 2,701,170 | | | | 2,735,496 | |
ASP AMC Merger Sub 1st Lien 4.796% 4/13/24 | | | 570,319 | | | | 568,299 | |
ATI Holdings Acquisition 1st Lien 5.801% 5/10/23 | | | 613,800 | | | | 620,833 | |
BCP Raptor 1st Lien 5.507% 6/8/24 | | | 2,000,000 | | | | 1,992,500 | |
BJ’s Wholesale Club Tranche B 1st Lien 4.968% 2/3/24 | | | 763,756 | | | | 749,436 | |
BJ’s Wholesale Club 2nd Lien 8.71% 1/27/25 | | | 536,000 | | | | 524,610 | |
Blue Ribbon 1st Lien 5.299% 11/13/21 | | | 1,720,341 | | | | 1,695,969 | |
Boyd Gaming Tranche B 1st Lien 3.694% 9/15/23 | | | 2,973,138 | | | | 2,989,448 | |
Builders FirstSource 1st Lien 4.296% 2/29/24 | | | 2,918,092 | | | | 2,929,642 | |
BWAY Tranche B 1st Lien 4.474% 4/3/24 | | | 2,500,000 | | | | 2,511,197 | |
Caesars Entertainment Operating Tranche B 1st Lien 2.50% 4/4/24 | | | 2,000,000 | | | | 2,008,750 | |
Calpine Construction Finance Tranche B1 1st Lien 3.49% 5/3/20 | | | 243,101 | | | | 243,633 | |
Calpine Tranche B 1st Lien 4.05% 1/15/23 | | | 1,374,075 | | | | 1,380,372 | |
CD&R Waterworks Merger Sub Tranche B 1st Lien 4.00% 8/1/24 | | | 2,500,000 | | | | 2,521,095 | |
CenturyLink Tranche B 1st Lien 2.75% 1/31/25 | | | 2,250,000 | | | | 2,222,755 | |
CH Hold 2nd Lien 8.476% 2/1/25 | | | 1,620,000 | | | | 1,666,575 | |
Change Healthcare Holdings Tranche B 1st Lien 3.984% 3/1/24 | | | 2,992,500 | | | | 3,011,619 | |
| | |
| Schedule of investments | | |
| Delaware Floating Rate Fund | | |
| | | | | | | | |
| | | Principal amount° | | | Value (US $) | |
Loan Agreements« (continued) | | | | | | | | |
| |
Charter Communications Operating Tranche E 1st Lien 3.24% 7/1/20 | | | 1,295 | | | $ | 1,303 | |
Chesapeake Energy 1st Lien 8.686% 8/23/21 | | | 2,090,000 | | | | 2,253,935 | |
CityCenter Holdings Tranche B 1st Lien 3.732% 4/18/24 | | | 750,000 | | | | 753,750 | |
Colorado Buyer 2nd Lien 8.42% 5/1/25 | | | 1,000,000 | | | | 1,010,000 | |
Community Health Systems Tranche G 1st Lien 3.952% 12/31/19 | | | 1,823,553 | | | | 1,826,545 | |
Community Health Systems Tranche H 1st Lien 4.054% 1/27/21 | | | 80,704 | | | | 80,776 | |
Constellis Holdings 1st Lien 6.296% 4/21/24 | | | 1,105,000 | | | | 1,097,633 | |
Constellis Holdings 2nd Lien 10.296% 4/21/25 | | | 295,000 | | | | 292,695 | |
CPI International 1st Lien 4.50% 7/26/24 | | | 500,000 | | | | 502,500 | |
CSC Holdings Tranche B 1st Lien 3.476% 7/17/25 | | | 2,701,884 | | | | 2,701,884 | |
DaVita Tranche B 1st Lien 3.984% 6/24/21 | | | 1,391,950 | | | | 1,406,119 | |
Diamond 1st Lien 3.00% 7/25/24 | | | 2,000,000 | | | | 2,002,500 | |
Digicel International Finance Tranche B 1st Lien 4.94% 5/10/24 | | | 3,000,000 | | | | 3,032,814 | |
Dynegy Finance IV Tranche C 1st Lien 4.484% 2/7/24 | | | 1,780,538 | | | | 1,789,723 | |
Eldorado Resorts Tranche B 1st Lien 3.563% 4/17/24 | | | 1,995,000 | | | | 1,994,585 | |
Energy Future Intermediate Holding 1st Lien 4.00% 6/28/18 | | | 3,000,000 | | | | 3,026,874 | |
Energy Transfer Equity 1st Lien 3.974% 2/2/24 | | | 1,500,000 | | | | 1,507,344 | |
Envision Healthcare Tranche C 1st Lien 4.30% 12/1/23 | | | 498,747 | | | | 502,363 | |
ESH Hospitality Tranche B 1st Lien 3.734% 8/30/23 | | | 1,785,291 | | | | 1,796,449 | |
ExamWorks Group Tranche B1 1st Lien 4.484% 7/27/23 | | | 1,076,876 | | | | 1,085,794 | |
First Data 1st Lien | | | | | | | | |
3.477% 7/10/22 | | | 2,799,651 | | | | 2,809,100 | |
3.727% 4/26/24 | | | 1,200,087 | | | | 1,206,914 | |
First Eagle Holdings Tranche B 1st Lien 4.796% 12/1/22 | | | 2,000,000 | | | | 2,028,126 | |
Flex Acquisition Tranche B 1st Lien 4.549% 12/29/23 | | | 1,256,850 | | | | 1,266,905 | |
Flying Fortress Holdings Tranche B 1st Lien 3.546% 10/30/22 | | | 775,000 | | | | 779,118 | |
Forterra Finance Tranche B 1st Lien 4.234% 10/25/23 | | | 1,494,461 | | | | 1,437,173 | |
Frontier Communications Tranche B 1st Lien 4.98% 6/1/24 | | | 2,145,000 | | | | 2,067,780 | |
Gardner Denver 4.546% 7/30/20 | | | 2,429,013 | | | | 2,444,498 | |
Gates Global Tranche B 1st Lien 4.546% 3/31/24 | | | 1,966,258 | | | | 1,980,268 | |
Genesys Telecommunications Laboratories Tranche B 1st
Lien | | | | | | | | |
5.061% 12/1/23 | | | 1,000,000 | | | | 985,263 | |
5.158% 12/1/23 | | | 930,325 | | | | 936,140 | |
Genoa a QoL Healthcare 1st Lien 4.984% 10/28/23 | | | 992,500 | | | | 1,001,433 | |
Hayward Acquisition Tranche B 1st Lien 3.50% 7/18/24 | | | 3,000,000 | | | | 3,019,689 | |
HCA Tranche B9 1st Lien 3.234% 3/18/23 | | | 1,194,984 | | | | 1,202,701 | |
| | | | | | | | |
| | | Principal amount° | | | Value (US $) | |
Loan Agreements« (continued) | | | | | | | | |
| |
Hilton Worldwide Finance Tranche B2 1st Lien 3.232% 10/25/23 | | | 1,246,875 | | | $ | 1,253,733 | |
Houghton International 4.546% 12/20/19 | | | 1,103,049 | | | | 1,109,943 | |
Hoya Midco Tranche B 1st Lien 5.296% 6/27/24 | | | 2,000,000 | | | | 2,012,500 | |
HUB International Tranche B 1st Lien 4.422% 10/2/20 | | | 2,427,576 | | | | 2,448,635 | |
Hyperion Insurance Group Tranche B 1st Lien 5.25% 4/29/22 | | | 1,727,486 | | | | 1,749,511 | |
IASIS Healthcare Tranche B3 1st Lien 5.25% 2/17/21 | | | 1,946,660 | | | | 1,961,990 | |
INC Research Holdings Tranche B 1st Lien 2.25% 6/26/24 | | | 1,500,000 | | | | 1,509,845 | |
INEOS US Finance Tranche B 1st Lien 4.007% 3/31/22 | | | 2,992,481 | | | | 3,009,547 | |
inVentiv Group Holdings Tranche B 1st Lien 4.952% 11/30/23 | | | 2,338,250 | | | | 2,346,184 | |
JBS USA LUX Tranche B 1st Lien 3.804% 10/30/22 | | | 1,418,688 | | | | 1,408,047 | |
JC Penney Tranche B 1st Lien 5.45% 6/23/23 | | | 1,367,174 | | | | 1,356,065 | |
KIK Custom Products Tranche B 1st Lien 5.793% 8/26/22 | | | 2,248,517 | | | | 2,273,813 | |
Kingpin Intermediate Holdings Tranche B 1st Lien 5.48% 6/29/24 | | | 1,500,000 | | | | 1,519,669 | |
Kingpin Intermediate Holdings Tranche B 2nd Lien 9.98% 6/29/25 | | | 750,000 | | | | 763,350 | |
Kloeckner Pentaplast of America Tranche B 1st Lien 5.546% 6/29/22 | | | 1,500,000 | | | | 1,501,875 | |
Kraton Polymers Tranche B 1st Lien 5.234% 1/6/22 | | | 1,925,516 | | | | 1,946,635 | |
Kronos 2nd Lien 9.561% 11/1/24 | | | 1,030,000 | | | | 1,068,411 | |
Kronos Tranche B 1st Lien 4.56% 11/1/23 | | | 1,482,550 | | | | 1,499,991 | |
Landry’s 1st Lien 3.968% 10/4/23 | | | 2,130,440 | | | | 2,134,435 | |
Las Vegas Sands 1st Lien 3.23% 3/29/24 | | | 2,492,481 | | | | 2,505,723 | |
Level 3 Financing Tranche B 1st Lien 3.479% 2/22/24 | | | 2,500,000 | | | | 2,513,283 | |
Mallinckrodt International Finance Tranche B 1st Lien 4.046% 9/24/24 | | | 997,500 | | | | 1,002,626 | |
MGM Growth Properties Operating Partnership Tranche B 1st Lien 3.484% 5/1/23 | | | 1,243,044 | | | | 1,249,517 | |
Mohegan Gaming & Entertainment Tranche B 1st Lien 5.234% 10/13/23 | | | 2,233,251 | | | | 2,258,933 | |
MPH Acquisition Holdings Tranche B 1st Lien 4.296% 6/7/23 | | | 2,920,552 | | | | 2,935,458 | |
NFP Tranche B 1st Lien 4.811% 1/8/24 | | | 1,000,000 | | | | 1,008,021 | |
On Semiconductor Tranche B 1st Lien 3.476% 3/31/23 | | | 1,159,165 | | | | 1,164,816 | |
Panda Hummel Tranche B1 1st Lien 7.234% 10/27/22 | | | 295,000 | | | | 281,725 | |
Panda Stonewall Tranche B 6.796% 11/13/21 | | | 568,000 | | | | 533,920 | |
Penn National Gaming Tranche B 1st Lien 3.796% 1/19/24 | | | 249,375 | | | | 250,911 | |
PetSmart Tranche B 4.23% 3/10/22 | | | 1,496,173 | | | | 1,422,385 | |
PQ 1st Lien 5.561% 11/4/22 | | | 1,443,447 | | | | 1,456,603 | |
Prestige Brands Tranche B 1st Lien 3.984% 1/26/24 | | | 684,961 | | | | 689,671 | |
| | |
| Schedule of investments | | |
| Delaware Floating Rate Fund | | |
| | | | | | | | |
| | | Principal amount° | | | Value (US $) | |
Loan Agreements« (continued) | | | | | | | | |
| |
Radiate Holdco 1st Lien 4.234% 2/1/24 | | | 1,236,900 | | | $ | 1,222,985 | |
Rite Aid Tranche 1 5.99% 8/21/20 | | | 1,500,000 | | | | 1,507,313 | |
RPI Finance Trust Tranche B6 1st Lien 3.296% 3/27/23 | | | 1,400,000 | | | | 1,408,203 | |
Russell Investments US Institutional Holdco Tranche B 1st
Lien 6.972% 6/1/23 | | | 2,992,443 | | | | 3,027,978 | |
Sable International Finance 1st Lien 3.50% 1/31/25 | | | 1,500,000 | | | | 1,503,594 | |
Sable International Finance Tranche B3 1st Lien 4.734% 1/31/25 | | | 3,000,000 | | | | 3,007,188 | |
SAM Finance Tranche B 1st Lien 4.50% 12/17/20 | | | 981,717 | | | | 989,256 | |
Scientific Games International Tranche B3 1st Lien 5.233% 10/1/21 | | | 1,072,401 | | | | 1,078,337 | |
Scientific Games International Tranche B4 1st Lien 4.811% 8/14/24 | | | 1,500,000 | | | | 1,492,500 | |
SFR Group Tranche B 1st Lien 3.944% 6/22/25 | | | 1,970,063 | | | | 1,970,063 | |
SFR Group Tranche B10 1st Lien 4.561% 1/31/25 | | | 888,288 | | | | 893,443 | |
Sinclair Television Group Tranche B2 1st Lien 3.49% 1/3/24 | | | 597,000 | | | | 598,614 | |
Sprint Communications Tranche B 1st Lien 3.75% 2/2/24 | | | 4,567,300 | | | | 4,586,807 | |
StandardAero Aviation Holdings 1st Lien | | | | | | | | |
4.75% 7/7/22 | | | 500,000 | | | | 504,375 | |
4.98% 7/7/22 | | | 2,070,955 | | | | 2,089,076 | |
Summit Materials Tranche B1 1st Lien 3.984% 7/17/22 | | | 573,300 | | | | 579,391 | |
Summit Midstream Partners Holdings Tranche B 1st Lien 7.234% 5/21/22 | | | 1,750,000 | | | | 1,782,813 | |
Surgery Center Holdings 1st Lien 4.25% 6/20/24 | | | 2,000,000 | | | | 2,021,250 | |
Team Health Holdings Tranche B 1st Lien 3.984% 2/6/24 | | | 3,241,875 | | | | 3,239,849 | |
Telenet Financing USD Tranche A1 1st Lien 3.976% 6/30/25 | | | 1,015,000 | | | | 1,021,616 | |
Telenet Financing USD Tranche A12 1st Lien 3.909% 6/30/25 | | | 2,900,000 | | | | 2,916,313 | |
TKC Holdings 1st Lien 5.484% 2/1/23 | | | 3,491,250 | | | | 3,513,070 | |
TransDigm Tranche D 1st Lien 4.226% 6/4/21 | | | 721,282 | | | | 724,963 | |
TransDigm Tranche E 1st Lien 4.296% 5/14/22 | | | 194,372 | | | | 195,327 | |
TransDigm Tranche F 1st Lien 4.234% 6/9/23 | | | 1,671,102 | | | | 1,682,069 | |
Tribune Media Tranche B 1st Lien 4.234% 12/27/20 | | | 501,849 | | | | 504,672 | |
Tribune Media Tranche C 1st Lien 4.234% 1/27/24 | | | 498,750 | | | | 501,555 | |
Tronox Pigments Holland Tranche B 1st Lien 4.796% 3/19/20 | | | 2,123,938 | | | | 2,141,709 | |
Uniti Group 1st Lien 4.234% 10/24/22 | | | 1,700,577 | | | | 1,703,226 | |
Unitymedia Finance Tranche B 1st Lien 2.25% 9/30/25 | | | 3,500,000 | | | | 3,497,186 | |
Univar USA Tranche B 1st Lien 3.984% 7/1/22 | | | 2,014,539 | | | | 2,028,389 | |
Univision Communications Tranche C 1st Lien 3.984% 3/15/24 | | | 3,709,240 | | | | 3,698,421 | |
| | | | | | | | |
| | | Principal amount° | | | Value (US $) | |
Loan Agreements« (continued) | | | | | | | | |
| |
UPC Financing Partnership Tranche AP 1st Lien 3.976% 4/15/25 | | | 2,250,000 | | | $ | 2,264,344 | |
USI Tranche B 1st Lien 4.18% 5/16/24 | | | 3,500,000 | | | | 3,495,261 | |
USIC Holdings Tranche SR 4.923% 12/9/23 | | | 2,937,744 | | | | 2,968,957 | |
Valeant Pharmaceuticals International Tranche B-F1 5.98% 4/1/22 | | | 680,000 | | | | 693,559 | |
VC GB Holdings 2nd Lien 9.226% 2/28/25 | | | 1,085,000 | | | | 1,072,794 | |
Virgin Media Bristol Tranche I 1st Lien 3.976% 1/31/25 | | | 820,000 | | | | 824,954 | |
Western Digital 1st Lien 3.983% 4/29/23 | | | 2,482,513 | | | | 2,504,815 | |
WideOpenWest Finance Tranche B 1st Lien 4.476% 8/19/23 | | | 1,181,079 | | | | 1,183,110 | |
Windstream Services 1st Lien 4.48% 2/8/24 | | | 1,783,351 | | | | 1,736,538 | |
Windstream Services Tranche B6 1st Lien 5.23% 3/30/21 | | | 665,814 | | | | 661,652 | |
WP Deluxe Merger Sub 1st Lien 4.25% 7/25/24 | | | 2,000,000 | | | | 2,010,000 | |
WP Deluxe Merger Sub 2nd Lien 8.25% 7/25/25 | | | 1,500,000 | | | | 1,503,750 | |
Zayo Group Tranche B2 1st Lien 3.50% 1/19/24 | | | 178,741 | | | | 179,537 | |
Zekelman Industries Tranche B 1st Lien 4.789% 6/14/21 | | | 1,453,781 | | | | 1,467,410 | |
| | | | | | | | |
Total Loan Agreements (cost $230,652,099) | | | | | | | 232,198,754 | |
| | | | | | | | |
|
| |
US Treasury Obligation – 0.07% | | | | | | | | |
| |
US Treasury Note | | | | | | | | |
1.75% 6/30/22 | | | 205,000 | | | | 204,239 | |
| | | | | | | | |
Total US Treasury Obligation (cost $204,231) | | | | | | | 204,239 | |
| | | | | | | | |
| | |
| | | Number of shares | | | | |
Preferred Stock – 0.14% | | | | | | | | |
| |
Integrys Holdings 6.00% ● | | | 14,900 | | | | 393,919 | |
| | | | | | | | |
Total Preferred Stock (cost $372,500) | | | | | | | 393,919 | |
| | | | | | | | |
| | |
| | | Principal amount° | | | | |
Short-Term Investments – 9.41% | | | | | | | | |
| |
Repurchase Agreements – 9.41% | | | | | | | | |
Bank of America Merrill Lynch | | | | | | | | |
0.97%, dated 7/31/17, to be repurchased on 8/1/17, repurchase price $4,813,382 (collateralized by US government obligations 0.125% 4/15/18; market value $4,909,520) | | | 4,813,252 | | | | 4,813,252 | |
Bank of Montreal | | | | | | | | |
0.90%, dated 7/31/17, to be repurchased on 8/1/17, repurchase price $12,033,431 (collateralized by US government obligations 0.00%-4.375% 1/11/18-8/15/40; market value $12,273,793) | | | 12,033,130 | | | | 12,033,130 | |
| | |
| Schedule of investments | | |
| Delaware Floating Rate Fund | | |
| | | | | | | | |
| | | Principal amount° | | | Value (US $) | |
Short-Term Investments (continued) | | | | | | | | |
| |
Repurchase Agreements (continued) | | | | | | | | |
BNP Paribas | | | | | | | | |
1.04%, dated 7/31/17, to be repurchased on 8/1/17, repurchase price $9,458,891 (collateralized by US government obligations 0.00%-2.50% 10/12/17-8/15/46; market value $9,647,790) | | | 9,458,618 | | | $ | 9,458,618 | |
| | | | | | | | |
Total Short-Term Investments (cost $26,305,000) | | | | | | | 26,305,000 | |
| | | | | | | | |
| | |
Total Value of Securities – 106.26% (cost $295,155,149) | | | | | | $ | 296,929,270 | |
| | | | | | | | |
| # | Security exempt from registration under Rule 144A of the Securities Act of 1933, as amended. At July 31, 2017, the aggregate value of Rule 144A securities was $26,975,544, which represents 9.65% of the Fund’s net assets. See Note 11 in “Notes to financial statements.” |
| « | Loan agreements generally pay interest at rates which are periodically reset by reference to a base lending rate plus a premium. These base lending rates are generally: (i) the prime rate offered by one or more US banks, (ii) the lending rate offered by one or more European banks such as the London Interbank Offered Rate (LIBOR), and (iii) the certificate of deposit rate. Loan agreements may be subject to restrictions on resale. Stated rate in effect at July 31, 2017. |
| ° | Principal amount shown is stated in US dollars unless noted that the security is denominated in another currency. |
| y | No contractual maturity date. |
| ● | Variable rate security. Each rate shown is as of July 31, 2017. Interest rates reset periodically. |
CLO – Collateralized Loan Obligation
See accompanying notes, which are an integral part of the financial statements.
This page intentionally left blank.
| | |
| Statement of assets and liabilities | | |
| Delaware Floating Rate Fund | | July 31, 2017 |
| | | | |
Assets: | | | | |
Investments, at value1 | | $ | 270,624,270 | |
Short-term investments, at value2 | | | 26,305,000 | |
Cash | | | 1,468,674 | |
Receivable for securities sold | | | 21,583,184 | |
Receivable for fund shares sold | | | 2,996,779 | |
Dividends and interest receivable | | | 977,604 | |
Swap payments receivable | | | 707 | |
| | | | |
Total assets | | | 323,956,218 | |
| | | | |
Liabilities: | | | | |
Payable for securities purchased | | | 43,654,063 | |
Payable for fund shares redeemed | | | 367,188 | |
Distribution payable | | | 164,368 | |
Investment management fees payable to affiliates | | | 117,806 | |
Other accrued expenses | | | 116,266 | |
Audit and tax fees payable | | | 50,625 | |
Distribution fees payable | | | 44,137 | |
Dividend disbursing and transfer agent fees and expenses payable to affiliates | | | 4,670 | |
Accounting and administration expenses payable to affiliates | | | 1,086 | |
Trustees’ fees and expenses payable | | | 680 | |
Legal fees payable to affiliates | | | 302 | |
Reports and statements to shareholders payable to affiliates | | | 244 | |
| | | | |
Total liabilities | | | 44,521,435 | |
| | | | |
Total Net Assets | | $ | 279,434,783 | |
| | | | |
| |
Net Assets Consist of: | | | | |
Paid-in capital | | $ | 290,466,918 | |
Distributions in excess of net investment income | | | (331,986 | ) |
Accumulated net realized loss on investments | | | (12,474,270 | ) |
Net unrealized appreciation of investments | | | 1,774,121 | |
| | | | |
Total Net Assets | | $ | 279,434,783 | |
| | | | |
| | | | |
Net Asset Value | | | | |
Class A: | | | | |
Net assets | | $ | 49,486,320 | |
Shares of beneficial interest outstanding, unlimited authorization, no par | | | 5,898,684 | |
Net asset value per share | | $ | 8.39 | |
Sales charge | | | 2.75 | % |
Offering price per share, equal to net asset value per share/(1 – sales charge) | | $ | 8.63 | |
| |
Class C: | | | | |
Net assets | | $ | 38,778,471 | |
Shares of beneficial interest outstanding, unlimited authorization, no par | | | 4,623,854 | |
Net asset value per share | | $ | 8.39 | |
| |
Class R: | | | | |
Net assets | | $ | 472,018 | |
Shares of beneficial interest outstanding, unlimited authorization, no par | | | 56,293 | |
Net asset value per share | | $ | 8.39 | |
| |
Institutional Class: | | | | |
Net assets | | $ | 190,697,974 | |
Shares of beneficial interest outstanding, unlimited authorization, no par | | | 22,736,857 | |
Net asset value per share | | $ | 8.39 | |
| |
1Investments, at cost | | $ | 268,850,149 | |
2Short-term investments, at cost | | | 26,305,000 | |
See accompanying notes, which are an integral part of the financial statements.
| | |
| Statement of operations | | |
| Delaware Floating Rate Fund | | Year ended July 31, 2017 |
| | | | |
Investment Income: | | | | |
Interest | | $ | 9,731,947 | |
Dividends | | | 23,975 | |
Foreign tax withheld | | | (45 | ) |
| | | | |
| | | 9,755,877 | |
| | | | |
Expenses: | | | | |
Management fees | | | 1,441,451 | |
Distribution expenses – Class A | | | 136,037 | |
Distribution expenses – Class C | | | 455,740 | |
Distribution expenses – Class R | | | 2,491 | |
Dividend disbursing and transfer agent fees and expenses | | | 263,667 | |
Accounting and administration expenses | | | 88,677 | |
Registration fees | | | 66,531 | |
Audit and tax fees | | | 53,558 | |
Reports and statements to shareholders | | | 49,955 | |
Legal fees | | | 47,553 | |
Custodian fees | | | 16,692 | |
Trustees’ fees and expenses | | | 14,046 | |
Other | | | 42,513 | |
| | | | |
| | | 2,678,911 | |
Less expense paid indirectly | | | (241 | ) |
| | | | |
Total operating expenses | | | 2,678,670 | |
| | | | |
Net Investment Income | | | 7,077,207 | |
| | | | |
| |
Net Realized and Unrealized Gain (Loss): | | | | |
Net realized gain on: | | | | |
Investments | | | 2,398,245 | |
Swap contracts | | | 1,070,988 | |
| | | | |
Net realized gain | | | 3,469,233 | |
| | | | |
Net change in unrealized appreciation (depreciation) of: | | | | |
Investments | | | (190,375 | ) |
Swap contracts | | | 548,091 | |
| | | | |
Net change in unrealized appreciation (depreciation) | | | 357,716 | |
| | | | |
Net Realized and Unrealized Gain | | | 3,826,949 | |
| | | | |
Net Increase in Net Assets Resulting from Operations | | $ | 10,904,156 | |
| | | | |
See accompanying notes, which are an integral part of the financial statements.
This page intentionally left blank.
| | |
| Statements of changes in net assets | | |
| Delaware Floating Rate Fund | | |
| | | | | | | | |
| | | Year ended | |
| | | 7/31/17 | | | 7/31/16 | |
Increase (Decrease) in Net Assets from Operations: | | | | | | | | |
Net investment income | | $ | 7,077,207 | | | $ | 7,305,425 | |
Net realized gain (loss) | | | 3,469,233 | | | | (13,226,320 | ) |
Net change in unrealized appreciation (depreciation) | | | 357,716 | | | | 4,797,273 | |
| | | | | | | | |
Net increase (decrease) in net assets resulting from
operations | | | 10,904,156 | | | | (1,123,622 | ) |
| | | | | | | | |
| | |
Dividends and Distributions to Shareholders from: | | | | | | | | |
Net investment income: | | | | | | | | |
Class A | | | (1,265,466 | ) | | | (1,115,437 | ) |
Class C | | | (724,300 | ) | | | (490,673 | ) |
Class R | | | (10,466 | ) | | | (6,519 | ) |
Institutional Class | | | (4,852,945 | ) | | | (3,812,302 | ) |
| | |
Return of capital: | | | | | | | | |
Class A | | | (104,095 | ) | | | (203,324 | ) |
Class C | | | (81,598 | ) | | | (180,280 | ) |
Class R | | | (993 | ) | | | (1,731 | ) |
Institutional Class | | | (401,242 | ) | | | (651,222 | ) |
| | | | | | | | |
| | | (7,441,105 | ) | | | (6,461,488 | ) |
| | | | | | | | |
Capital Share Transactions: | | | | | | | | |
Proceeds from shares sold: | | | | | | | | |
Class A | | | 22,149,182 | | | | 10,978,370 | |
Class C | | | 6,736,031 | | | | 3,925,377 | |
Class R | | | 14,269 | | | | 34,265 | |
Institutional Class | | | 105,587,334 | | | | 133,445,745 | |
| | |
Net asset value of shares issued upon reinvestment of dividends and distributions: | | | | | | | | |
Class A | | | 1,263,920 | | | | 1,222,620 | |
Class C | | | 724,772 | | | | 624,878 | |
Class R | | | 11,387 | | | | 8,250 | |
Institutional Class | | | 4,461,716 | | | | 3,297,673 | |
| | | | | | | | |
| | | 140,948,611 | | | | 153,537,178 | |
| | | | | | | | |
| | | | | | | | |
| | | Year ended | |
| | | 7/31/17 | | | 7/31/16 | |
Capital Share Transactions (continued): | | | | | | | | |
Cost of shares redeemed: | | | | | | | | |
Class A | | $ | (32,570,869 | ) | | $ | (40,123,305 | ) |
Class C | | | (20,634,438 | ) | | | (24,433,394 | ) |
Class R | | | (53,055 | ) | | | (109,897 | ) |
Institutional Class | | | (107,271,533 | ) | | | (175,754,126 | ) |
| | | | | | | | |
| | | (160,529,895 | ) | | | (240,420,722 | ) |
| | | | | | | | |
Decrease in net assets derived from capital share transactions | | | (19,581,284 | ) | | | (86,883,544 | ) |
| | | | | | | | |
Net Decrease in Net Assets | | | (16,118,233 | ) | | | (94,468,654 | ) |
| | |
Net Assets: | | | | | | | | |
Beginning of year | | | 295,553,016 | | | | 390,021,670 | |
| | | | | | | | |
End of year | | $ | 279,434,783 | | | $ | 295,553,016 | |
| | | | | | | | |
Distributions in excess of net investment income | | $ | (331,986 | ) | | $ | (714,968 | ) |
| | | | | | | | |
See accompanying notes, which are an integral part of the financial statements.
Financial highlights
Delaware Floating Rate Fund Class A
Selected data for each share of the Fund outstanding throughout each period were as follows:
|
| |
|
| |
|
Net asset value, beginning of period |
|
Income (loss) from investment operations: |
Net investment income1 |
Net realized and unrealized gain (loss) |
|
Total from investment operations |
|
|
Less dividends and distributions from: |
Net investment income |
Return of capital |
|
Total dividends and distributions |
|
|
Net asset value, end of period |
|
|
Total return2 |
|
Ratios and supplemental data: |
Net assets, end of period (000 omitted) |
Ratio of expenses to average net assets |
Ratio of expenses to average net assets prior to fees waived |
Ratio of net investment income to average net assets |
Ratio of net investment income to average net assets prior to fees waived |
Portfolio turnover |
|
|
| 1 | The average shares outstanding method has been applied for per share information. |
| 2 | Total investment return is based on the change in net asset value of a share during the period and assumes reinvestment of dividends and distributions at net asset value and does not reflect the impact of a sales charge. Total investment return during some of the periods shown reflects a waiver by the manager and/or distributor. Performance would have been lower had the waiver not been in effect. |
See accompanying notes, which are an integral part of the financial statements.
| | | | | | | | | | | | | | | | | | | | | | | | | | | | |
| Year ended | |
| |
| | | 7/31/17 | | | | | 7/31/16 | | | | | 7/31/15 | | | | | 7/31/14 | | | | | 7/31/13 | |
| |
| | $ | 8.29 | | | | | $ | 8.42 | | | | | $ | 8.63 | | | | | $ | 8.60 | | | | | $ | 8.57 | |
| | | | | | | | | |
| | | | | | | | | | | | | | | | | | | | | | | | | | | | |
| | | 0.20 | | | | | | 0.17 | | | | | | 0.18 | | | | | | 0.17 | | | | | | 0.16 | |
| | | 0.11 | | | | | | (0.15 | ) | | | | | (0.21 | ) | | | | | 0.04 | | | | | | 0.06 | |
| | | | | | | | | | | | | | | | | | | | | | | | | | | | |
| | | 0.31 | | | | | | 0.02 | | | | | | (0.03 | ) | | | | | 0.21 | | | | | | 0.22 | |
| | | | | | | | | | | | | | | | | | | | | | | | | | | | |
| | | | | | | | | |
| | | | | | | | | | | | | | | | | | | | | | | | | | | | |
| | | (0.19 | ) | | | | | (0.12 | ) | | | | | (0.17 | ) | | | | | (0.15 | ) | | | | | (0.17 | ) |
| | | (0.02 | ) | | | | | (0.03 | ) | | | | | (0.01 | ) | | | | | (0.03 | ) | | | | | (0.02 | ) |
| | | | | | | | | | | | | | | | | | | | | | | | | | | | |
| | | (0.21 | ) | | | | | (0.15 | ) | | | | | (0.18 | ) | | | | | (0.18 | ) | | | | | (0.19 | ) |
| | | | | | | | | | | | | | | | | | | | | | | | | | | | |
| | | | | | | | | |
| | $ | 8.39 | | | | | $ | 8.29 | | | | | $ | 8.42 | | | | | $ | 8.63 | | | | | $ | 8.60 | |
| | | | | | | | | | | | | | | | | | | | | | | | | | | | |
| | | | | | | | | |
| | | 3.82% | | | | | | 0.29% | | | | | | (0.35% | ) | | | | | 2.40% | | | | | | 2.61% | |
| | | | | | | | | |
| | | | | | | | | | | | | | | | | | | | | | | | | | | | |
| | $ | 49,486 | | | | | $ | 57,985 | | | | | $ | 87,398 | | | | | $ | 158,691 | | | | | $ | 194,795 | |
| | | 0.97% | | | | | | 0.96% | | | | | | 0.96% | | | | | | 0.95% | | | | | | 1.01% | |
| | | 0.97% | | | | | | 0.96% | | | | | | 0.96% | | | | | | 0.96% | | | | | | 1.06% | |
| | | 2.41% | | | | | | 2.09% | | | | | | 2.08% | | | | | | 1.89% | | | | | | 1.88% | |
| | | 2.41% | | | | | | 2.09% | | | | | | 2.08% | | | | | | 1.88% | | | | | | 1.83% | |
| | | 173% | | | | | | 90% | | | | | | 86% | | | | | | 96% | | | | | | 112% | |
| | | | | | | | | | | | | | | | | | | | | | | | | | | | | |
| |
Financial highlights
Delaware Floating Rate Fund Class C
Selected data for each share of the Fund outstanding throughout each period were as follows:
|
| |
|
| |
|
Net asset value, beginning of period |
|
Income (loss) from investment operations: |
Net investment income1 |
Net realized and unrealized gain (loss) |
|
Total from investment operations |
|
|
Less dividends and distributions from: |
Net investment income |
Return of capital |
|
Total dividends and distributions |
|
|
Net asset value, end of period |
|
|
Total return2 |
|
Ratios and supplemental data: |
Net assets, end of period (000 omitted) |
Ratio of expenses to average net assets |
Ratio of net investment income to average net assets |
Portfolio turnover |
|
|
| 1 | The average shares outstanding method has been applied for per share information. |
| 2 | Total investment return is based on the change in net asset value of a share during the period and assumes reinvestment of dividends and distributions at net asset value and does not reflect the impact of a sales charge. |
See accompanying notes, which are an integral part of the financial statements.
| | | | | | | | | | | | | | | | | | | | | | | | | | | | |
| Year ended | |
| |
| | | 7/31/17 | | | | | 7/31/16 | | | | | 7/31/15 | | | | | 7/31/14 | | | | | 7/31/13 | |
| |
| | $ | 8.29 | | | | | $ | 8.42 | | | | | $ | 8.63 | | | | | $ | 8.60 | | | | | $ | 8.57 | |
| | | | | | | | | |
| | | | | | | | | | | | | | | | | | | | | | | | | | | | |
| | | 0.14 | | | | | | 0.11 | | | | | | 0.11 | | | | | | 0.10 | | | | | | 0.10 | |
| | | 0.11 | | | | | | (0.15 | ) | | | | | (0.21 | ) | | | | | 0.04 | | | | | | 0.06 | |
| | | | | | | | | | | | | | | | | | | | | | | | | | | | |
| | | 0.25 | | | | | | (0.04 | ) | | | | | (0.10 | ) | | | | | 0.14 | | | | | | 0.16 | |
| | | | | | | | | | | | | | | | | | | | | | | | | | | | |
| | | | | | | | | |
| | | | | | | | | | | | | | | | | | | | | | | | | | | | |
| | | (0.13 | ) | | | | | (0.06 | ) | | | | | (0.10 | ) | | | | | (0.08 | ) | | | | | (0.11 | ) |
| | | (0.02 | ) | | | | | (0.03 | ) | | | | | (0.01 | ) | | | | | (0.03 | ) | | | | | (0.02 | ) |
| | | | | | | | | | | | | | | | | | | | | | | | | | | | |
| | | (0.15 | ) | | | | | (0.09 | ) | | | | | (0.11 | ) | | | | | (0.11 | ) | | | | | (0.13 | ) |
| | | | | | | | | | | | | | | | | | | | | | | | | | | | |
| | | | | | | | | |
| | $ | 8.39 | | | | | $ | 8.29 | | | | | $ | 8.42 | | | | | $ | 8.63 | | | | | $ | 8.60 | |
| | | | | | | | | | | | | | | | | | | | | | | | | | | | |
| | | | | | | | | |
| | | 3.06% | | | | | | (0.46% | ) | | | | | (1.10% | ) | | | | | 1.64% | | | | | | 1.85% | |
| | | | | | | | | |
| | | | | | | | | | | | | | | | | | | | | | | | | | | | |
| | $ | 38,778 | | | | | $ | 51,400 | | | | | $ | 72,505 | | | | | $ | 100,779 | | | | | $ | 83,619 | |
| | | 1.72% | | | | | | 1.71% | | | | | | 1.71% | | | | | | 1.70% | | | | | | 1.76% | |
| | | 1.66% | | | | | | 1.34% | | | | | | 1.33% | | | | | | 1.14% | | | | | | 1.13% | |
| | | 173% | | | | | | 90% | | | | | | 86% | | | | | | 96% | | | | | | 112% | |
| | | | | | | | | | | | | | | | | | | | | | | | | | | | | |
| |
Financial highlights
Delaware Floating Rate Fund Class R
Selected data for each share of the Fund outstanding throughout each period were as follows:
|
| |
|
| |
|
Net asset value, beginning of period |
|
Income (loss) from investment operations: |
Net investment income1 |
Net realized and unrealized gain (loss) |
|
Total from investment operations |
|
|
Less dividends and distributions from: |
Net investment income |
Return of capital |
|
Total dividends and distributions |
|
|
Net asset value, end of period |
|
|
Total return2 |
|
Ratios and supplemental data: |
Net assets, end of period (000 omitted) |
Ratio of expenses to average net assets |
Ratio of expenses to average net assets prior to fees waived |
Ratio of net investment income to average net assets |
Ratio of net investment income to average net assets prior to fees waived |
Portfolio turnover |
|
|
| 1 | The average shares outstanding method has been applied for per share information. |
| 2 | Total investment return is based on the change in net asset value of a share during the period and assumes reinvestment of dividends and distributions at net asset value. Total investment return during some of the periods shown reflects waivers by the manager and/or distributor. Performance would have been lower had the waivers not been in effect. |
See accompanying notes, which are an integral part of the financial statements.
| | | | | | | | | | | | | | | | | | | | | | | | | | | | |
| Year ended | |
| |
| | | 7/31/17 | | | | | 7/31/16 | | | | | 7/31/15 | | | | | 7/31/14 | | | | | 7/31/13 | |
| |
| | $ | 8.29 | | | | | $ | 8.42 | | | | | $ | 8.63 | | | | | $ | 8.60 | | | | | $ | 8.57 | |
| | | | | | | | | |
| | | | | | | | | | | | | | | | | | | | | | | | | | | | |
| | | 0.18 | | | | | | 0.15 | | | | | | 0.16 | | | | | | 0.14 | | | | | | 0.14 | |
| | | 0.11 | | | | | | (0.15 | ) | | | | | (0.21 | ) | | | | | 0.04 | | | | | | 0.06 | |
| | | | | | | | | | | | | | | | | | | | | | | | | | | | |
| | | 0.29 | | | | | | — | | | | | | (0.05 | ) | | | | | 0.18 | | | | | | 0.20 | |
| | | | | | | | | | | | | | | | | | | | | | | | | | | | |
| | | | | | | | | |
| | | | | | | | | | | | | | | | | | | | | | | | | | | | |
| | | (0.17 | ) | | | | | (0.10 | ) | | | | | (0.15 | ) | | | | | (0.12 | ) | | | | | (0.15 | ) |
| | | (0.02 | ) | | | | | (0.03 | ) | | | | | (0.01 | ) | | | | | (0.03 | ) | | | | | (0.02 | ) |
| | | | | | | | | | | | | | | | | | | | | | | | | | | | |
| | | (0.19 | ) | | | | | (0.13 | ) | | | | | (0.16 | ) | | | | | (0.15 | ) | | | | | (0.17 | ) |
| | | | | | | | | | | | | | | | | | | | | | | | | | | | |
| | | | | | | | | |
| | $ | 8.39 | | | | | $ | 8.29 | | | | | $ | 8.42 | | | | | $ | 8.63 | | | | | $ | 8.60 | |
| | | | | | | | | | | | | | | | | | | | | | | | | | | | |
| | | | | | | | | |
| | | 3.57% | | | | | | 0.03% | | | | | | (0.61% | ) | | | | | 2.15% | | | | | | 2.36% | |
| | | | | | | | | |
| | | | | | | | | | | | | | | | | | | | | | | | | | | | |
| | $ | 472 | | | | | $ | 494 | | | | | $ | 570 | | | | | $ | 845 | | | | | $ | 44 | |
| | | 1.22% | | | | | | 1.21% | | | | | | 1.21% | | | | | | 1.20% | | | | | | 1.26% | |
| | | 1.22% | | | | | | 1.21% | | | | | | 1.21% | | | | | | 1.20% | | | | | | 1.36% | |
| | | 2.16% | | | | | | 1.84% | | | | | | 1.83% | | | | | | 1.64% | | | | | | 1.63% | |
| | | 2.16% | | | | | | 1.84% | | | | | | 1.83% | | | | | | 1.64% | | | | | | 1.53% | |
| | | 173% | | | | | | 90% | | | | | | 86% | | | | | | 96% | | | | | | 112% | |
| | | | | | | | | | | | | | | | | | | | | | | | | | | | | |
| |
Financial highlights
Delaware Floating Rate Fund Institutional Class
Selected data for each share of the Fund outstanding throughout each period were as follows:
|
| |
|
| |
|
Net asset value, beginning of period |
|
Income (loss) from investment operations: |
Net investment income1 |
Net realized and unrealized gain (loss) |
|
Total from investment operations |
|
|
Less dividends and distributions from: |
Net investment income |
Return of capital |
|
Total dividends and distributions |
|
|
Net asset value, end of period |
|
|
Total return2 |
|
Ratios and supplemental data: |
Net assets, end of period (000 omitted) |
Ratio of expenses to average net assets |
Ratio of net investment income to average net assets |
Portfolio turnover |
|
|
| 1 | The average shares outstanding method has been applied for per share information. |
| 2 | Total investment return is based on the change in net asset value of a share during the period and assumes reinvestment of dividends and distributions at net asset value. |
See accompanying notes, which are an integral part of the financial statements.
| | | | | | | | | | | | | | | | | | | | | | | | | | | | |
| Year ended | |
| |
| | | 7/31/17 | | | | | 7/31/16 | | | | | 7/31/15 | | | | | 7/31/14 | | | | | 7/31/13 | |
| |
| | $ | 8.29 | | | | | $ | 8.42 | | | | | $ | 8.63 | | | | | $ | 8.60 | | | | | $ | 8.57 | |
| | | | | | | | | |
| | | | | | | | | | | | | | | | | | | | | | | | | | | | |
| | | 0.22 | | | | | | 0.19 | | | | | | 0.20 | | | | | | 0.19 | | | | | | 0.19 | |
| | | 0.11 | | | | | | (0.15 | ) | | | | | (0.21 | ) | | | | | 0.04 | | | | | | 0.06 | |
| | | | | | | | | | | | | | | | | | | | | | | | | | | | |
| | | 0.33 | | | | | | 0.04 | | | | | | (0.01 | ) | | | | | 0.23 | | | | | | 0.25 | |
| | | | | | | | | | | | | | | | | | | | | | | | | | | | |
| | | | | | | | | |
| | | | | | | | | | | | | | | | | | | | | | | | | | | | |
| | | (0.21 | ) | | | | | (0.14 | ) | | | | | (0.19 | ) | | | | | (0.17 | ) | | | | | (0.20 | ) |
| | | (0.02 | ) | | | | | (0.03 | ) | | | | | (0.01 | ) | | | | | (0.03 | ) | | | | | (0.02 | ) |
| | | | | | | | | | | | | | | | | | | | | | | | | | | | |
| | | (0.23 | ) | | | | | (0.17 | ) | | | | | (0.20 | ) | | | | | (0.20 | ) | | | | | (0.22 | ) |
| | | | | | | | | | | | | | | | | | | | | | | | | | | | |
| | | | | | | | | |
| | $ | 8.39 | | | | | $ | 8.29 | | | | | $ | 8.42 | | | | | $ | 8.63 | | | | | $ | 8.60 | |
| | | | | | | | | | | | | | | | | | | | | | | | | | | | |
| | | | | | | | | |
| | | 4.08% | | | | | | 0.54% | | | | | | (0.11%) | | | | | | 2.66% | | | | | | 2.87% | |
| | | | | | | | | |
| | | | | | | | | | | | | | | | | | | | | | | | | | | | |
| | $ | 190,698 | | | | | $ | 185,674 | | | | | $ | 229,549 | | | | | $ | 268,629 | | | | | $ | 139,097 | |
| | | 0.72% | | | | | | 0.71% | | | | | | 0.71% | | | | | | 0.70% | | | | | | 0.76% | |
| | | 2.66% | | | | | | 2.34% | | | | | | 2.33% | | | | | | 2.14% | | | | | | 2.13% | |
| | | 173% | | | | | | 90% | | | | | | 86% | | | | | | 96% | | | | | | 112% | |
| | | | | | | | | | | | | | | | | | | | | | | | | | | | | |
| |
| | |
| Notes to financial statements | | |
| Delaware Floating Rate Fund | | July 31, 2017 |
Delaware Group® Income Funds (Trust) is organized as a Delaware statutory trust and offers four series: Delaware Corporate Bond Fund, Delaware Floating Rate Fund (formerly, Delaware Diversified Floating Rate Fund), Delaware Extended Duration Bond Fund, and Delaware High-Yield Opportunities Fund. These financial statements and the related notes pertain to Delaware Floating Rate Fund (Fund). The Trust is an open-end investment company. The Fund is considered diversified under the Investment Company Act of 1940, as amended (1940 Act), and offers Class A, Class C, Class R, and Institutional Class shares. Class A shares are sold with a maximum front-end sales charge of 2.75%. Class A share purchases of $1,000,000 or more will incur a limited contingent deferred sales charge (CDSC) of 0.75% if redeemed during the first year, provided that Delaware Distributors, L.P. (DDLP) paid a financial advisor a commission on the purchase of those shares. Class C shares are sold with a CDSC of 1.00%, if redeemed during the first 12 months. Class R and Institutional Class shares are not subject to a sales charge and are offered for sale exclusively to certain eligible investors.
The investment objective of the Fund is to seek high current income and, secondarily, long-term total return.
1. Significant Accounting Policies
The following accounting policies are in accordance with US generally accepted accounting principles (US GAAP) and are consistently followed by the Fund.
Security Valuation – Equity securities, except those traded on the Nasdaq Stock Market LLC (Nasdaq), are valued at the last quoted sales price as of the time of the regular close of the New York Stock Exchange on the valuation date. Equity securities traded on the Nasdaq are valued in accordance with the Nasdaq Official Closing Price, which may not be the last sales price. If, on a particular day, an equity security does not trade, the mean between the bid and ask prices will be used, which approximates fair value. Debt securities and interest rate swap contracts are valued based upon valuations provided by an independent pricing service or broker/counterparty and reviewed by management. To the extent current market prices are not available, the pricing service may take into account developments related to the specific security, as well as transactions in comparable securities. US government and agency securities are valued at the mean between the bid and ask prices, which approximates fair value. Valuations for fixed income securities utilize matrix systems, which reflect such factors as security prices, yields, maturities, and ratings, and are supplemented by dealer and exchange quotations. For asset-backed securities, collateralized mortgage obligations, commercial mortgage securities, and US government agency mortgage securities, pricing vendors utilize matrix pricing which considers prepayment speed; attributes of the collateral; yield or price of bonds of comparable quality, coupon, maturity, and type as well as broker/dealer-supplied prices. Swap prices are derived using daily swap curves and models that incorporate a number of market data factors, such as discounted cash flows, trades, and values of the underlying reference instruments. Interpolated values are derived when the settlement date of the contract is an interim date for which quotations are not available. Futures contracts and options on futures contracts are valued at the daily quoted settlement prices. Generally, other securities and assets for which market quotations are not readily available are valued at fair value as determined in good faith under the direction of the Trust’s Board of Trustees (Board). In determining whether market quotations are readily available or fair valuation will be used, various factors will be taken into consideration, such as market closures or suspension of trading in a security.
Federal and Foreign Income Taxes – No provision for federal income taxes has been made as the Fund intends to continue to qualify for federal income tax purposes as a regulated investment company under Subchapter M of the Internal Revenue Code of 1986, as amended, and make the requisite distributions to shareholders. The Fund evaluates tax positions taken or expected to be taken in the course of preparing the Fund’s tax returns to determine whether the tax positions are “more-likely-than-not” of being sustained by the applicable tax authority. Tax positions not deemed to meet the “more-likely-than-not” threshold are recorded as a tax benefit or expense in the current year.
Management has analyzed the Fund’s tax positions taken or to be taken on the Fund’s federal income tax returns through the year ended July 31, 2017 and for all open tax years (years ended July 31, 2014–July 31, 2016), and has concluded that no provision for federal income tax is required in the Fund’s financial statements. In regard to foreign taxes only, the Fund has open tax years in certain foreign countries in which it invests that may date back to the inception of the Fund. If applicable, the Fund recognizes interest accrued on unrecognized tax benefits in interest expense and penalties in other expenses on the “Statement of operations.” During the year ended July 31, 2017, the Fund did not incur any interest or tax penalties.
Class Accounting – Investment income and common expenses are allocated to the various classes of the Fund on the basis of “settled shares” of each class in relation to the net assets of the Fund. Realized and unrealized gain (loss) on investments are allocated to the various classes of the Fund on the basis of daily net assets of each class. Distribution expenses relating to a specific class are charged directly to that class.
Repurchase Agreements – The Fund may purchase certain US government securities subject to the counterparty’s agreement to repurchase them at an agreed upon date and price. The counterparty will be required on a daily basis to maintain the value of the collateral subject to the agreement at not less than the repurchase price (including accrued interest). The agreements are conditioned upon the collateral being deposited under the Federal Reserve book-entry system with the Fund’s custodian or a third-party sub-custodian. In the event of default or bankruptcy by the other party to the agreement, retention of the collateral may be subject to legal proceedings. All open repurchase agreements as of the date of this report were entered into on July 31, 2017 and matured on the next business day.
Use of Estimates – The Fund is an investment company, whose financial statements are prepared in conformity with US GAAP. Therefore, the Fund follows the accounting and reporting guidelines for investment companies. The preparation of financial statements in conformity with US GAAP requires management to make estimates and assumptions that affect the fair value of investments, the reported amounts of assets and liabilities and disclosure of contingent assets and liabilities at the date of the financial statements, and the reported amounts of revenues and expenses during the reporting period. Actual results could differ from those estimates and the differences could be material.
Other – Expenses directly attributable to the Fund are charged directly to the Fund. Other expenses common to various funds within the Delaware FundsSM by Macquarie (Delaware Funds) are generally allocated among such funds on the basis of average net assets. Management fees and certain other expenses are paid monthly. Security transactions are recorded on the date the securities are purchased or sold (trade date) for financial reporting purposes. Costs used in calculating realized gains and losses on the sale of investment securities are those of the specific securities sold. Dividend income is recorded
| | |
| Notes to financial statements | | |
| Delaware Floating Rate Fund | | |
1. Significant Accounting Policies (continued)
on the ex-dividend date and interest income is recorded on the accrual basis. Discounts and premiums on debt securities are accreted or amortized to interest income, respectively, over the lives of the respective securities using the effective interest method. Realized gains (losses) on paydowns of asset-and mortgage-backed securities are classified as interest income. The Fund declares dividends daily from net investment income and pays the dividends monthly and declares and pays distributions from net realized gain on investments, if any, annually. The Fund may distribute more frequently, if necessary for tax purposes. Dividends and distributions, if any, are recorded on the ex-dividend date.
The Fund may receive earnings credits from its custodian when positive cash balances are maintained, which may be used to offset custody fees. There were no such earnings credits for the year ended July 31, 2017.
The Fund receives earnings credits from its transfer agent when positive cash balances are maintained, which may be used to offset transfer agent fees. If the amount earned is greater than $1, the expense paid under this arrangement is included on the “Statement of operations” under “Dividend disbursing and transfer agent fees and expenses” with the corresponding expense offset shown under “Less expense paid indirectly.” For the year ended July 31, 2017, the Fund earned $241 under this agreement.
2. Investment Management, Administration Agreements, and Other Transactions with Affiliates
In accordance with the terms of its investment management agreement, the Fund pays Delaware Management Company (DMC), a series of Macquarie Investment Management Business Trust (formerly, Delaware Management Business Trust) and the investment manager, an annual fee which is calculated daily and paid monthly at the rate of 0.50% on the first $500 million of average daily net assets of the Fund, 0.475% on the next $500 million, 0.45% on the next $1.5 billion, and 0.425% on average daily net assets in excess of $2.5 billion.
Delaware Investments Fund Services Company (DIFSC), an affiliate of DMC, provides fund accounting and financial administration oversight services to the Fund. For these services, DIFSC’s fees are calculated daily and paid monthly based on the aggregate daily net assets of the Delaware Funds at the following annual rate: 0.0050% of the first $30 billion; 0.0045% of the next $10 billion; 0.0040% of the next $10 billion; and 0.0025% of aggregate average daily net assets in excess of $50 billion. The fees payable to DIFSC under the service agreement described above are allocated among all funds in the Delaware Funds on a relative net asset value basis. For the year ended July 31, 2017, the Fund was charged $13,438 for these services. This amount is included on the “Statement of operations” under “Accounting and administration expenses.”
DIFSC is also the transfer agent and dividend disbursing agent of the Fund. For these services, DIFSC’s fees are calculated based on the aggregate daily net assets of the retail funds within the Delaware Funds at the following annual rate: 0.025% of the first $20 billion; 0.020% of the next $5 billion; 0.015% of the next $5 billion; and 0.013% on average daily net assets in excess of $30 billion. The fees payable to DIFSC under the service agreement described above are allocated among all retail funds in the Delaware Funds on a relative net asset value basis. This amount is included on the “Statement of operations” under “Dividend disbursing and transfer agent fees and expenses.” For the year ended July 31, 2017, the Fund was charged $57,724 for these services. Pursuant to a sub-transfer agency
agreement between DIFSC and BNY Mellon Investment Servicing (US) Inc. (BNYMIS), BNYMIS provides certain sub-transfer agency services to the Fund. Sub-transfer agency fees are paid by the Fund and are also included on the “Statement of operations” under “Dividend disbursing and transfer agent fees and expenses.”
Pursuant to a distribution agreement and distribution plan, the Fund pays DDLP, the distributor and an affiliate of DMC, annual distribution and service (12b-1) fees of 0.25%, 1.00%, and 0.50% of the average daily net assets of the Class A, Class C, and Class R shares, respectively. The fees are calculated daily and paid monthly. Institutional Class shares pay no 12b-1 fees.
As provided in the investment management agreement, the Fund bears a portion of the cost of resources shared with DMC, including the cost of internal personnel of DMC and/or its affiliates that provide legal, tax, and regulatory reporting services to the Fund. For the year ended July 31, 2017, the Fund was charged $17,962 for internal legal, tax, and regulatory reporting services provided by DMC and/or its affiliates’ employees. This amount is included on the “Statement of operations” under “Legal fees.”
For the year ended July 31, 2017, DDLP earned $1,460 for commissions on sales of the Fund’s Class A shares. For the year ended July 31, 2017, DDLP received gross CDSC commissions of $4,399 on redemption of the Fund’s Class C shares, and these commissions were entirely used to offset upfront commissions previously paid by DDLP to broker/dealers on sales of those shares.
Trustees’ fees include expenses accrued by the Fund for each Trustee’s retainer and meeting fees. Certain officers of DMC, DIFSC, and DDLP are officers and/or Trustees of the Trust. These officers and Trustees are paid no compensation by the Fund.
Cross trades for the year ended July 31, 2017, were executed by the Fund pursuant to procedures adopted by the Board designed to ensure compliance with Rule 17a-7 under the 1940 Act. Cross trading is the buying or selling of portfolio securities between funds of investment companies, or between a fund of an investment company and another entity, that are or could be considered affiliates by virtue of having a common investment advisor (or affiliated investment advisors), common directors/trustees and/or common officers. At its regularly scheduled meetings, the Board reviews such transactions for compliance with the procedures adopted by the Board. Pursuant to these procedures, for the year ended July 31, 2017, the Fund engaged in securities purchases of $552,479 and securities sales of $22,772,528, which resulted in net realized losses of $1,306.
| | |
| Notes to financial statements | | |
| Delaware Floating Rate Fund | | |
3. Investments
For the year ended July 31, 2017, the Fund made purchases and sales of investment securities other than short-term investments as follows:
| | | | |
Purchases other than US government securities | | $ | 480,285,880 | |
Purchases of US government securities | | | 10,096,193 | |
Sales other than US government securities | | | 495,146,492 | |
Sales of US government securities | | | 15,164,538 | |
At July 31, 2017, the cost and unrealized appreciation (depreciation) of investments for federal income tax purposes for the Fund were as follows:
| | | | |
Cost of investments | | $ | 295,174,437 | |
| | | | |
Aggregate unrealized appreciation of investments | | $ | 2,287,595 | |
Aggregate unrealized depreciation of investments | | | (532,762 | ) |
| | | | |
Net unrealized appreciation of investments | | $ | 1,754,833 | |
| | | | |
US GAAP defines fair value as the price that the Fund would receive to sell an asset or pay to transfer a liability in an orderly transaction between market participants at the measurement date under current market conditions. A three-level hierarchy for fair value measurements has been established based upon the transparency of inputs to the valuation of an asset or liability. Inputs may be observable or unobservable and refer broadly to the assumptions that market participants would use in pricing the asset or liability. Observable inputs reflect the assumptions market participants would use in pricing the asset or liability based on market data obtained from sources independent of the reporting entity. Unobservable inputs reflect the reporting entity’s own assumptions about the assumptions that market participants would use in pricing the asset or liability based on the best information available under the circumstances. The Fund’s investment in its entirety is assigned a level based upon the observability of the inputs which are significant to the overall valuation. The three-level hierarchy of inputs is summarized below and on the next page.
| | |
| Level 1 – | | Inputs are quoted prices in active markets for identical investments. (Examples: equity securities, open-end investment companies, futures contracts, exchange-traded options contracts) |
| |
| Level 2 – | | Other observable inputs, including, but not limited to: quoted prices for similar assets or liabilities in markets that are active, quoted prices for identical or similar assets or liabilities in markets that are not active, inputs other than quoted prices that are observable for the assets or liabilities (such as interest rates, yield curves, volatilities, prepayment speeds, loss severities, credit risks and default rates) or other market-corroborated inputs. (Examples: debt securities, government securities, swap contracts, foreign currency exchange contracts, foreign securities utilizing international fair value pricing, broker-quoted securities, fair valued securities) |
| |
| Level 3 – | | Significant unobservable inputs, including the Fund’s own assumptions used to determine the fair value of investments. (Examples: broker-quoted securities, fair valued securities) |
Level 3 investments are valued using significant unobservable inputs. The Fund may also use an income-based valuation approach in which the anticipated future cash flows of the investment are
discounted to calculate fair value. Discounts may also be applied due to the nature or duration of any restrictions on the disposition of the investments. Valuations may also be based upon current market prices of securities that are comparable in coupon, rating, maturity, and industry. The derived value of a Level 3 investment may not represent the value which is received upon disposition and this could impact the results of operations.
The following table summarizes the valuation of the Fund’s investments by fair value hierarchy levels as of July 31, 2017:
| | | | | | | | | | | | |
Securities | | Level 2 | | | Level 3 | | | Total | |
Assets: | | | | | | | | | |
Corporate Debt | | $ | 37,827,358 | | | $ | — | | | $ | 37,827,358 | |
Loan Agreements | | | 227,078,290 | | | | 5,120,464 | | | | 232,198,754 | |
US Treasury Obligations | | | 204,239 | | | | — | | | | 204,239 | |
Preferred Stock | | | 393,919 | | | | — | | | | 393,919 | |
Short-Term Investments | | | 26,305,000 | | | | — | | | | 26,305,000 | |
| | | | | | | | | | | | |
Total Value of Securities | | $ | 291,808,806 | | | $ | 5,120,464 | | | $ | 296,929,270 | |
| | | | | | | | | | | | |
During the year ended July 31, 2017, there were no transfers between Level 1 investments, Level 2 investments, or Level 3 investments that had a significant impact to the Fund. The Fund’s policy is to recognize transfers between levels based on fair value at the beginning of the reporting period.
A reconciliation of Level 3 investments is presented when the Fund has a significant amount of Level 3 investments at the beginning, interim, or end of the period in relation to net assets.
The Fund’s investments that are categorized as Level 3 were valued utilizing third party pricing information without adjustment. Such valuations are based on unobservable inputs. A significant change in third party information inputs could result in significantly lower or higher value of such Level 3 investments. The following is a reconciliation of investments in which significant unobservable inputs (Level 3) were used in determining fair value:
| | | | |
| | | Loan Agreement | |
Balance as of 7/31/16 | | $ | — | |
Net realized gain (loss) | | | 2,075 | |
Net change in unrealized appreciation (depreciation) | | | 20,779 | |
Purchases | | | 4,957,500 | |
Sales | | | (410,850 | ) |
Transfers into Level 3 | | | 550,960 | |
| | | | |
Balance as of 7/31/17 | | $ | 5,120,464 | |
| | | | |
Net change in unrealized appreciation (depreciation) from investments still held at the end of the period | | $ | 20,779 | |
| | | | |
| | |
| Notes to financial statements | | |
| Delaware Floating Rate Fund | | |
4. Dividend and Distribution Information
Income and long-term capital gain distributions are determined in accordance with federal income tax regulations, which may differ from US GAAP. Additionally, distributions from net gains on foreign currency transactions and net short-term gains on sales of investment securities are treated as ordinary income for federal income tax purposes. The tax character of dividends and distributions paid during the years ended July 31, 2017 and 2016 was as follows:
| | | | | | | | |
| | | Year ended | |
| | | 7/31/17 | | | 7/31/16 | |
Ordinary income | | $ | 6,853,177 | | | $ | 5,424,931 | |
Return of capital | | | 587,928 | | | | 1,036,557 | |
| | | | | | | | |
Total | | $ | 7,441,105 | | | $ | 6,461,488 | |
| | | | | | | | |
5. Components of Net Assets on a Tax Basis
As of July 31, 2017, the components of net assets on a tax basis were as follows:
| | | | |
Shares of beneficial interest | | $ | 290,466,918 | |
Dividends payable | | | (164,368 | ) |
Qualified late year loss deferrals | | | (167,618 | ) |
Capital loss carryforwards | | | (12,454,982 | ) |
Unrealized appreciation on investments | | | 1,754,833 | |
| | | | |
Net assets | | $ | 279,434,783 | |
| | | | |
The differences between book basis and tax basis components of net assets are primarily attributable to tax deferral of losses on wash sales, tax deferral of losses on straddles, and tax treatment of market discount and premium on debt instruments.
Qualified late year currency and specified losses represent losses realized from Nov. 1, 2016 through July 31, 2017, that in accordance with federal income tax regulations, the Fund has elected to defer and treat as having arisen in the following fiscal year.
For financial reporting purposes, capital accounts are adjusted to reflect the tax character of permanent book/tax differences. Reclassifications are primarily due to tax treatment of gain (loss) on foreign currency transactions, contingent payment debt instruments, market discount and premium on certain debt instruments, paydowns of mortgage- and asset-backed securities, deemed dividends, and tax treatment of CDS contracts. Results of operations and net assets were not affected by these reclassifications. For the year ended July 31, 2017, the Fund recorded the following reclassifications:
| | | | |
Distributions in excess of net investment income | | $ | 158,952 | |
Accumulated net realized loss | | | (158,952 | ) |
For federal income tax purposes, capital loss carryforwards may be carried forward and applied against future capital gains. At July 31, 2017, the Fund utilized $3,062,154 of capital loss carryforwards.
Under the Regulated Investment Company Modernization Act of 2010 (Act), net capital losses recognized for tax years beginning after Dec. 22, 2010 may be carried forward indefinitely, and their character is retained as short-term and/or long-term losses.
The Fund has capital loss carryforwards available to offset future realized capital gains as follows:
| | | | | | | | |
| | | Loss carryforward character | |
| | | Short-term | | | Long-term | |
| | $ | 3,872,508 | | | $ | 8,582,474 | |
6. Capital Shares
Transactions in capital shares were as follows:
| | | | | | | | |
| | | Year ended | |
| | | 7/31/17 | | | 7/31/16 | |
Shares sold: | | | | | �� | | | |
Class A | | | 2,653,577 | | | | 1,326,626 | |
Class C | | | 806,527 | | | | 473,458 | |
Class R | | | 1,709 | | | | 4,132 | |
Institutional Class | | | 12,647,356 | | | | 16,148,745 | |
| | |
Shares issued upon reinvestment of dividends and distributions: | | | | | | | | |
Class A | | | 151,307 | | | | 148,041 | |
Class C | | | 86,765 | | | | 75,642 | |
Class R | | | 1,364 | | | | 1,012 | |
Institutional Class | | | 534,094 | | | | 399,646 | |
| | | | | | | | |
| | | 16,882,699 | | | | 18,577,302 | |
| | | | | | | | |
| | |
Shares redeemed: | | | | | | | | |
Class A | | | (3,901,263 | ) | | | (4,861,568 | ) |
Class C | | | (2,471,707 | ) | | | (2,961,723 | ) |
Class R | | | (6,335 | ) | | | (13,303 | ) |
Institutional Class | | | (12,848,840 | ) | | | (21,419,000 | ) |
| | | | | | | | |
| | | (19,228,145 | ) | | | (29,255,594 | ) |
| | | | | | | | |
Net decrease | | | (2,345,446 | ) | | | (10,678,292 | ) |
| | | | | | | | |
| | |
| Notes to financial statements | | |
| Delaware Floating Rate Fund | | |
6. Capital Shares (continued)
Certain shareholders may exchange shares of one class for shares of another class in the same Fund. For the years ended July 31, 2017 and 2016, the Fund had the following exchange transactions. These exchange transactions are included as subscriptions and redemptions in the table on the previous page and the “Statements of changes in net assets.”
| | | | | | | | |
| | | | | | | Exchange | | |
| | | Exchange Redemptions | | Subscriptions | | |
| | | | | | | Institutional | | |
| | | Class A | | Class C | | Class | | |
| | | Shares | | Shares | | Shares | | Value |
Year ended 7/31/17 | | 1,044,335 | | — | | 1,045,944 | | $8,743,152 |
Year ended 7/31/16 | | 24,148 | | 1,642 | | 25,838 | | $213,398 |
7. Line of Credit
The Fund, along with certain other funds in the Delaware Funds (Participants), was a participant in a $155,000,000 revolving line of credit intended to be used for temporary or emergency purposes as an additional source of liquidity to fund redemptions of investor shares. Under the agreement, the Participants were charged an annual commitment fee of 0.10%, which was allocated across the Participants on the basis of relative net assets of each Participant’s allocation of the entire facility. The Participants were permitted to borrow up to a maximum of one-third of their net assets under the agreement. Each Participant was individually, and not jointly, liable for its particular advances, if any, under the line of credit. The line of credit available under the agreement expired on Nov. 7, 2016.
On Nov. 7, 2016, the Fund, along with the other Participants, entered into an amendment to the agreement for a $155,000,000 revolving line of credit. The line of credit is to be used as described above and operates in substantially the same manner as the original agreement, with the exception of the annual commitment fee. Under the amendment to the agreement, the Participants are charged an annual commitment fee of 0.15%, which is allocated across the Participants on the basis of relative net assets of each Participant’s allocation of the entire facility. The line of credit available under the agreement expires on Nov. 6, 2017.
The Fund had no amounts outstanding as of July 31, 2017 or at any time during the year then ended.
8. Derivatives
US GAAP requires disclosures that enable investors to understand: (1) how and why an entity uses derivatives; (2) how they are accounted for; and (3) how they affect an entity’s results of operations and financial position.
Swap Contracts – The Fund may enter into interest rate swap contracts in the normal course of pursuing its investment objective. The Fund may use interest rate swaps to adjust the Fund’s sensitivity to interest rates or to hedge against changes in interest rates. The Fund will not be permitted to enter into any swap transactions unless, at the time of entering into such transactions, the unsecured long-term debt of the actual counterparty, combined with any credit enhancements, is rated at least BBB- by
Standard & Poor’s Financial Services LLC (S&P) or Baa3 by Moody’s Investors Service Inc. (Moody’s) or is determined to be of equivalent credit quality by DMC.
Interest Rate Swaps. An interest rate swap contract is an exchange of interest rates between counterparties. In one instance, an interest rate swap involves payments received by the Fund from another party based on a variable or floating interest rate, in return for making payments based on a fixed interest rate. An interest rate swap can also work in reverse with the Fund receiving payments based on a fixed interest rate and making payments based on a variable or floating interest rate. Interest rate swaps may be used to adjust the Fund’s sensitivity to interest rates or to hedge against changes in interest rates. Periodic payments on such contracts are accrued daily and recorded as unrealized appreciation/(depreciation) on swap contracts. Upon periodic payment/(receipt) or termination of the contract, such amounts are recorded as realized gains or losses on swap contracts. The Fund’s maximum risk of loss from counterparty credit risk is the discounted net value of the cash flows to be received from/paid to the counterparty over the interest rate swap contract’s remaining life, to the extent that the amount is positive. This risk is mitigated by (1) for bilateral swap contracts, having a netting arrangement between the Fund and the counterparty and by the posting of collateral by the counterparty to the Fund to cover the Fund’s exposure to the counterparty, and (2) for cleared swaps, trading these instruments through a central counterparty. No interest rate swap contracts were outstanding at July 31, 2017. See the “Statement of Operations” on page 24 for the realized and unrealized gain or loss on swap contracts.
During the year ended July 31, 2017, the Fund used interest rate swap contracts to manage the Fund’s sensitivity to interest rates or to hedge against changes in interest rates.
Swaps Generally. The value of open swaps may differ from that which would be realized in the event the Fund terminated its position in the contract on a given day. Risks of entering into these contracts include the potential inability of the counterparty to meet the terms of the contracts. This type of risk is generally limited to the amount of favorable movement in the value of the underlying security, instrument or basket of instruments, if any, at the day of default. Risks also arise from potential losses from adverse market movements and such losses could exceed the unrealized amounts shown on the “Schedule of investments.”
| | | | | | | | | | |
| | | Long Derivatives | | | | | Short Derivatives | |
| | | Volume | | | | | Volume | |
Interest rate swap contracts (average notional value)* | | USD | | | — | | | | USD35,474,544 | |
* Long represents receiving fixed interest payments and short represents paying fixed interest payments.
9. Offsetting
The Fund entered into an International Swaps and Derivatives Association, Inc. Master Agreement (ISDA Master Agreement) or a similar agreement with certain of its derivative contract counterparties in order to better define its contractual rights and to secure rights that will help the Fund mitigate its counterparty risk. An ISDA Master Agreement is a bilateral agreement between the Fund and a counterparty that governs over-the-counter (OTC) derivatives and foreign exchange contracts and typically contains, among other things, collateral posting items and provisions in the event of a default and/or termination event. Under an ISDA Master Agreement, the Fund may, under certain circumstances, offset with the
| | |
| Notes to financial statements | | |
| Delaware Floating Rate Fund | | |
9. Offsetting (continued)
counterparty certain derivative financial instruments’ payables and/or receivables with collateral held and/or posted and create one single net payment. The provisions of the ISDA Master Agreement typically permit a single net payment in the event of default (close-out) including the bankruptcy or insolvency of the counterparty. However, bankruptcy or insolvency laws of a particular jurisdiction may impose restrictions on or prohibitions against the right of offset in bankruptcy, insolvency, or other events.
For financial reporting purposes, the Fund does not offset derivative assets and derivative liabilities that are subject to netting arrangements on the “Statement of assets and liabilities.”
At July 31, 2017, the Fund had the following assets and liabilities subject to offsetting provisions:
Master Repurchase Agreements
| | | | | | | | | | | | | | | | | | | | |
| | | | | | Fair Value of | | | | | | | | | | |
| | | | | | Non-Cash | | | Cash Collateral | | | Net Collateral | | | | |
Counterparty | | Repurchase Agreements | | | Collateral Received(a) | | | Received | | | Received | | | Net Exposure(b) | |
Bank of America Merrill Lynch | | $ | 4,813,252 | | | $ | (4,813,252 | ) | | $ | — | | | $ | (4,813,252 | ) | | $ | — | |
Bank of Montreal | | | 12,033,130 | | | | (12,033,130 | ) | | | — | | | | (12,033,130 | ) | | | — | |
BNP Paribas | | | 9,458,618 | | | | (9,458,618 | ) | | | — | | | | (9,458,618 | ) | | | — | |
| | | | | | | | | | | | | | | | | | | | |
Total | | $ | 26,305,000 | | | $ | (26,305,000 | ) | | $ | — | | | $ | (26,305,000 | ) | | $ | — | |
| | | | | | | | | | | | | | | | | | | | |
(a) The value of the related collateral received exceeded the value of the repurchase agreements as of July 31, 2017.
(b) Net exposure represents the receivable (payable) that would be due from (to) the counterparty in the event of default.
10. Securities Lending
The Fund, along with other funds in the Delaware Funds, may lend its securities pursuant to a security lending agreement (Lending Agreement) with The Bank of New York Mellon (BNY Mellon). At the time a security is loaned, the borrower must post collateral equal to the required percentage of the market value of the loaned security, including any accrued interest. The required percentage is: (1) 102% with respect to US securities and foreign securities that are denominated and payable in US dollars; and (2) 105% with respect to foreign securities. With respect to each loan, if on any business day the aggregate market value of securities collateral plus cash collateral held is less than the aggregate market value of the securities that are the subject of such loan, the borrower will be notified to provide additional collateral by the end of the following business day, which, together with the collateral already held, will be not less than the applicable initial collateral requirements for such security loan. If the aggregate market value of securities collateral and cash collateral held with respect to a security loan exceeds the applicable initial collateral requirement, upon the request of the borrower, BNY Mellon must return enough collateral to the borrower by the end of the following business day to reduce the value of the remaining collateral to the applicable initial collateral requirement for such security loan. As a result of the foregoing, the value of the collateral held with respect to a loaned security on any particular day may be more or less than the value of the security on loan.
Cash collateral received by each fund of the Trust is generally invested in a series of individual separate accounts, each corresponding to a fund. The investment guidelines permit each separate account to hold certain securities that would be considered eligible securities for a money market fund. Cash collateral received is generally invested in government securities; certain obligations issued by government sponsored enterprises; repurchase agreements collateralized by US Treasury securities; obligations issued by the central government of any Organization for Economic Cooperation and Development (OECD) country or its agencies, instrumentalities, or establishments; obligations of supranational organizations; commercial paper, notes, bonds, and other debt obligations; certificates of deposit, time deposits, and other bank obligations; and asset-backed securities. A Fund can also accept US government securities and letters of credit (non-cash collateral) in connection with securities loans.
In the event of default or bankruptcy by the lending agent, realization and/or retention of the collateral may be subject to legal proceedings. In the event the borrower fails to return loaned securities and the collateral received is insufficient to cover the value of the loaned securities and provided such collateral shortfall is not the result of investment losses, the lending agent has agreed to pay the amount of the shortfall to the Fund or, at the discretion of the lending agent, replace the loaned securities. The Fund continues to record dividends or interest, as applicable, on the securities loaned and is subject to changes in value of the securities loaned that may occur during the term of the loan. The Fund has the right under the Lending Agreement to recover the securities from the borrower on demand. With respect to security loans collateralized by non-cash collateral, the Fund receives loan premiums paid by the borrower. With respect to security loans collateralized by cash collateral, the earnings from the collateral investments are shared among the Fund, the security lending agent, and the borrower. The Fund records security lending income net of allocations to the security lending agent and the borrower.
The Fund may incur investment losses as a result of investing securities lending collateral. This could occur if an investment in the collateral investment account defaulted or became impaired. Under those circumstances, the value of a Fund’s cash collateral account may be less than the amount the Fund would be required to return to the borrowers of the securities and the Fund would be required to make up for this shortfall.
During the year ended July 31, 2017, the Fund had no securities out on loan.
11. Credit and Market Risk
Some countries in which the Fund may invest require governmental approval for the repatriation of investment income, capital, or the proceeds of sales of securities by foreign investors. In addition, if there is deterioration in a country’s balance of payments or for other reasons, a country may impose temporary restrictions on foreign capital remittances abroad.
The securities exchanges of certain foreign markets are substantially smaller, less liquid and more volatile than the major securities markets in the US. Consequently, acquisition and disposition of securities by the Fund may be inhibited. In addition, a significant portion of the aggregate market value of equity securities listed on the major securities exchanges in emerging markets is held by a smaller number of investors. This may limit the number of shares available for acquisition or disposition by the Fund.
| | |
| Notes to financial statements | | |
| Delaware Floating Rate Fund | | |
11. Credit and Market Risk (continued)
The Fund invests a portion of its assets in high yield fixed income securities, which are securities rated lower than BBB- by S&P and Baa3 by Moody’s, or similarly rated by another nationally recognized statistical rating organization. Investments in these higher yielding securities are generally accompanied by a greater degree of credit risk than higher rated securities. Additionally, lower rated securities may be more susceptible to adverse economic and competitive industry conditions than investment grade securities.
The Fund invests in fixed income securities whose value is derived from an underlying pool of mortgages or consumer loans. The value of these securities is sensitive to changes in economic conditions, including delinquencies and/or defaults, and may be adversely affected by shifts in the market’s perception of the issuers and changes in interest rates. Investors receive principal and interest payments as the underlying mortgages and consumer loans are paid back. Some of these securities are collateralized mortgage obligations (CMOs). CMOs are debt securities issued by US government agencies or by financial institutions and other mortgage lenders, which are collateralized by a pool of mortgages held under an indenture. Prepayment of mortgages may shorten the stated maturity of the obligations and can result in a loss of premium, if any has been paid. Certain of these securities may be stripped (securities which provide only the principal or interest feature of the underlying security). The yield to maturity on an interest-only CMO is extremely sensitive not only to changes in prevailing interest rates, but also to the rate of principal payments (including prepayments) on the related underlying mortgage assets. A rapid rate of principal payments may have a material adverse effect on the Fund’s yield to maturity. If the underlying mortgage assets experience greater-than-anticipated prepayments of principal, the Fund may fail to fully recoup its initial investment in these securities even if the securities are rated in the highest rating categories.
The Fund invests in certain obligations that may have liquidity protection designed to ensure that the receipt of payments due on the underlying security is timely. Such protection may be provided through guarantees, insurance policies or letters of credit obtained by the issuer or sponsor through third parties, through various means of structuring the transaction or through a combination of such approaches. The Fund will not pay any additional fees for such credit support, although the existence of credit support may increase the price of the security.
The Fund invests in bank loans and other securities that may subject it to direct indebtedness risk, the risk that the Fund will not receive payment of principal, interest, and other amounts due in connection with these investments and will depend primarily on the financial condition of the borrower. Loans that are fully secured offer the Fund more protection than unsecured loans in the event of nonpayment of scheduled interest or principal, although there is no assurance that the liquidation of collateral from a secured loan would satisfy the corporate borrower’s obligation, or that the collateral can be liquidated. Some loans or claims may be in default at the time of purchase. Certain of the loans and the other direct indebtedness acquired by the Fund may involve revolving credit facilities or other standby financing commitments that obligate the Fund to pay additional cash on a certain date or on demand. These commitments may require the Fund to increase its investment in a company at a time when the Fund might not otherwise decide to do so (including at a time when the company’s financial condition makes it unlikely that such amounts will be repaid). To the extent that the Fund is committed to advance additional funds, it will at all times hold and maintain cash or other high-grade debt obligations in an
amount sufficient to meet such commitments. When a loan agreement is purchased the Fund may pay an assignment fee. On an ongoing basis, the Fund may receive a commitment fee based on the undrawn portion of the underlying line of credit portion of a loan agreement. Prepayment penalty fees are received upon the prepayment of a loan agreement by the borrower. Prepayment penalty, facility, commitment, consent, and amendment fees are recorded to income as earned or paid.
As the Fund may be required to rely upon another lending institution to collect and pass on to the Fund amounts payable with respect to the loan and to enforce the Fund’s rights under the loan and other direct indebtedness, an insolvency, bankruptcy, or reorganization of the lending institution may delay or prevent the Fund from receiving such amounts. The highly leveraged nature of many loans may make them especially vulnerable to adverse changes in economic or market conditions. Investments in such loans and other direct indebtedness may involve additional risk to the Fund.
The Fund may invest up to 15% of its net assets in illiquid securities, which may include securities with contractual restrictions on resale, securities exempt from registration under Rule 144A, promulgated under the Securities Act of 1933, as amended, and other securities which may not be readily marketable. The relative illiquidity of these securities may impair the Fund from disposing of them in a timely manner and at a fair price when it is necessary or desirable to do so. While maintaining oversight, the Fund’s Board has delegated to DMC the day-to-day functions of determining whether individual securities are liquid for purposes of the Fund’s limitation on investments in illiquid securities. Securities eligible for resale pursuant to Rule 144A, which are determined to be liquid, are not subject to the Fund’s 15% limit on investments in illiquid securities. Rule 144A securities have been identified on the “Schedule of investments.”
12. Contractual Obligations
The Fund enters into contracts in the normal course of business that contain a variety of indemnifications. The Fund’s maximum exposure under these arrangements is unknown. However, the Fund has not had prior claims or losses pursuant to these contracts. Management has reviewed the Fund’s existing contracts and expects the risk of loss to be remote.
13. Recent Accounting Pronouncements
In October 2016, the Securities and Exchange Commission released its Final Rule on Investment Company Reporting Modernization (the “Rule”). The Rule contains amendments to Regulation S-X which impact financial statement presentation, particularly the presentation of derivative investments. Although it is still evaluating the impact of the Rule, management believes that many of the Regulation S-X amendments are materially consistent with the Fund’s current financial statement presentation and expects that the Fund will comply with the Rule’s Regulation S-X amendments by the Aug. 1, 2017 compliance date.
14. Fund Repositioning
Effective Jan. 31, 2017, the investment strategies for Delaware Diversified Floating Rate Fund changed and the Fund was repositioned as a bank loan focused fund. In connection with the repositioning, the Fund’s name changed to Delaware Floating Rate Fund.
| | |
| Notes to financial statements | | |
| Delaware Floating Rate Fund | | |
15. Subsequent Events
From Sept. 1, 2017, DIFSC’s fees are calculated daily and paid monthly based on the aggregate daily net assets of the Delaware Funds at the following annual rate: 0.00475% of the first $35 billion; 0.0040% of the next $10 billion; and 0.0025% of aggregate average daily net assets in excess of $45 billion (the “Total Fee”). Each Fund in the Delaware Funds pays a minimum of $4,000, which, in aggregate, is subtracted from the Total Fee. Each Fund in the Delaware Funds then pays its relative portion of the remainder of the Total Fee on a relative NAV basis.
Management has determined that no other material events or transactions occurred subsequent to July 31, 2017 that would require recognition or disclosure in the Fund’s financial statements.
Report of independent
registered public accounting firm
To the Board of Trustees of Delaware Group® Income Funds
and Shareholders of Delaware Floating Rate Fund:
In our opinion, the accompanying statement of assets and liabilities, including the schedule of investments, and the related statements of operations and of changes in net assets and the financial highlights present fairly, in all material respects, the financial position of the Delaware Floating Rate Fund (formerly, Delaware Diversified Floating Rate Fund) (one of the series constituting Delaware Group® Income Funds, hereafter referred to as the “Fund”) as of July 31, 2017, the results of its operations for the year then ended, the changes in its net assets for each of the two years in the period then ended and the financial highlights for each of the five years in the period then ended, in conformity with accounting principles generally accepted in the United States of America. These financial statements and financial highlights (hereafter referred to as “financial statements”) are the responsibility of the Fund’s management. Our responsibility is to express an opinion on these financial statements based on our audits. We conducted our audits of these financial statements in accordance with the standards of the Public Company Accounting Oversight Board (United States). Those standards require that we plan and perform the audit to obtain reasonable assurance about whether the financial statements are free of material misstatement. An audit includes examining, on a test basis, evidence supporting the amounts and disclosures in the financial statements, assessing the accounting principles used and significant estimates made by management, and evaluating the overall financial statement presentation. We believe that our audits, which included confirmation of securities as of July 31, 2017 by correspondence with the custodian and brokers, provide a reasonable basis for our opinion.
PricewaterhouseCoopers LLP
Philadelphia, Pennsylvania
September 18, 2017
Other Fund information (Unaudited)
Delaware Floating Rate Fund
Tax Information
The information set forth below is for the Fund’s fiscal year as required by federal income tax laws. Shareholders, however, must report distributions on a calendar year basis for income tax purposes, which may include distributions for portions of two fiscal years of the Fund. Accordingly, the information needed by shareholders for income tax purposes will be sent to them in January of each year. Please consult your tax advisor for proper treatment of this information.
All disclosures are based on financial information available as of the date of this annual report and, accordingly are subject to change. For any and all items requiring reporting, it is the intention of the Fund to report the maximum amount permitted under the Internal Revenue Code and the regulations thereunder.
For the fiscal year ended July 31, 2017, the Fund reports distributions paid during the year as follows:
| | | | |
(A) Ordinary Income Distribution (Tax Basis) | | | 92.10 | % |
(B) Return of Capital (Tax Basis) | | | 7.90 | % |
Total Distributions (Tax Basis) | | | 100.00 | % |
(A) and (B) are based on a percentage of the Fund’s total distributions.
This page intentionally left blank.
| | |
| Board of trustees / directors and officers addendum | | |
| Delaware FundsSM by Macquarie | | |
A mutual fund is governed by a Board of Trustees/Directors (“Trustees”), which has oversight responsibility for the management of a fund’s business affairs. Trustees establish procedures and oversee and review the performance of the investment manager, the distributor, and others who perform services for the fund. The independent fund trustees, in particular, are advocates
| | | | |
Name, Address, and Birth Date | | Position(s) Held with Fund(s) | | Length of Time Served |
Interested Trustee | | |
Shawn K. Lytle1, 2 | | President, | | Trustee since |
2005 Market Street | | Chief Executive Officer, | | September 2015 |
Philadelphia, PA 19103 | | and Trustee | | |
February 1970 | | | | President and |
| | | | Chief Executive Officer |
| | | | since August 2015 |
| | | | |
Independent Trustees | | |
Thomas L. Bennett | | Chairman and Trustee | | Trustee since |
2005 Market Street | | | | March 2005 |
Philadelphia, PA 19103 | | | | |
October 1947 | | | | Chairman since |
| | | | | March 2015 |
Ann D. Borowiec | | Trustee | | Since March 2015 |
2005 Market Street | | | | |
Philadelphia, PA 19103 | | | | |
November 1958 | | | | |
| | | | |
| | | | |
| | | | |
| | | | | |
Joseph W. Chow | | Trustee | | Since January 2013 |
2005 Market Street | | | | |
Philadelphia, PA 19103 | | | | |
January 1953 | | | | |
| | | | |
| | | | | |
| 1 | Shawn K. Lytle is considered to be an “Interested Trustee” because he is an executive officer of the Fund’s(s’) investment advisor. |
| 2 | Shawn K. Lytle, David F. Connor, Daniel V. Geatens, and Richard Salus serve in similar capacities for the six portfolios of the Optimum Fund Trust, which have the same investment advisor, principal underwriter, and transfer agent as the registrant. |
for shareholder interests. Each trustee has served in that capacity since he or she was elected to or appointed to the Board of Trustees, and will continue to serve until his or her retirement or the election of a new trustee in his or her place. The following is a list of the Trustees and Officers with certain background and related information.
| | | | |
Principal Occupation(s)
During the Past Five Years | | Number of Portfolios in Fund Complex Overseen by Trustee or Officer | | Other Directorships
Held by Trustee or Officer |
| | | | |
Shawn K. Lytle has served as | | 62 | | Trustee — UBS |
President of | | | | Relationship Funds, |
Macquarie Investment | | | | SMA Relationship |
Management3 | | | | Trust, and UBS Funds |
since June 2015 and was the | | | | (May 2010–April 2015) |
Regional Head of Americas for | | | | |
UBS Global Asset | | | | |
Management from 2010 through 2015. | | | | |
| | | | |
Private Investor | | 62 | | None |
(March 2004–Present) | | | | |
| | | | |
| | | | |
| | | | |
| | | | | |
Chief Executive Officer, | | 62 | | Director — |
Private Wealth Management | | | | Banco Santander International |
(2011–2013) and | | | | |
Market Manager, | | | | Director — |
New Jersey Private | | | | Santander Bank, N.A. |
Bank (2005–2011) — | | | | |
J.P. Morgan Chase & Co. | | | | |
Executive Vice President | | 62 | | Director and Audit Committee |
(Emerging Economies | | | | Member — Hercules |
Strategies, Risks, and | | | | Technology Growth |
Corporate Administration) | | | | Capital, Inc. |
State Street Corporation | | | | (2004–2014) |
(July 2004–March 2011) | | | | |
| 3 | Macquarie Investment Management (formerly known as Delaware Investments) is the marketing name for Macquarie Management Holdings, Inc. (formerly known as Delaware Management Holdings, Inc.) and its subsidiaries, including the Fund’s(s’) investment advisor, principal underwriter, and its transfer agent. |
| | |
| Board of trustees / directors and officers addendum | | |
| Delaware FundsSM by Macquarie | | |
| | | | |
Name, Address, and Birth Date | | Position(s) Held with Fund(s) | | Length of Time Served |
Independent Trustees (continued) | | |
John A. Fry | | Trustee | | Since January 2001 |
2005 Market Street | | | | |
Philadelphia, PA 19103 | | | | |
May 1960 | | | | |
| | | | |
| | | | |
| | | | |
| | | | |
| | | | |
| | | | |
| | | | |
| | | | | |
| | |
Lucinda S. Landreth | | Trustee | | Since March 2005 |
2005 Market Street | | | | |
Philadelphia, PA 19103 | | | | |
June 1947 | | | | |
Frances A. Sevilla-Sacasa | | Trustee | | Since September 2011 |
2005 Market Street | | | | |
Philadelphia, PA 19103 | | | | |
January 1956 | | | | |
| | | | |
| | | | |
| | | | |
| | | | |
| | | | |
| | | | |
| | | | |
| | | | |
| | | | |
| | | | |
| | | | |
| | | | |
| | | | | |
| | | | |
Principal Occupation(s) During the Past Five Years | | Number of Portfolios in Fund Complex Overseen by Trustee or Officer | | Other Directorships
Held by Trustee or Officer |
| | |
President — | | 62 | | Director, Audit Committee, |
Drexel University | | | | and Governance Committee |
(August 2010–Present) | | | | Member — Community |
| | | | Health Systems |
President — | | | | |
Franklin & Marshall College | | | | Director — Drexel |
(July 2002–July 2010) | | | | Morgan & Co. |
| | | | |
| | | | Director, Audit Committee |
| | | | Member — vTv |
| | | | Therapeutics LLC |
| | | | |
| | | | Director — FS Credit Real |
| | | | | Estate Income Trust, Inc. |
Private Investor | | 62 | | None |
(2004–Present) | | | | |
| | | | |
| | | | |
| | | | | |
Chief Executive Officer — | | 62 | | Trust Manager and |
Banco Itaú | | | | Audit Committee |
International | | | | Member — Camden |
(April 2012–December 2016) | | | | Property Trust |
| | |
Executive Advisor to Dean | | | | |
(August 2011–March 2012) and Interim Dean | | | | |
(January 2011–July 2011) — | | | | |
University of Miami School of | | | | |
Business Administration | | | | |
| | |
President — U.S. Trust, | | | | |
Bank of America Private | | | | |
Wealth Management | | | | |
(Private Banking) | | | | |
(July 2007–December 2008) | | | | |
| | |
| Board of trustees / directors and officers addendum | | |
| Delaware FundsSM by Macquarie | | |
| | | | |
Name, Address, and Birth Date | | Position(s) Held with Fund(s) | | Length of Time Served |
Independent Trustees (continued) | | |
Thomas K. Whitford | | Trustee | | Since January 2013 |
2005 Market Street | | | | |
Philadelphia, PA 19103 | | | | |
March 1956 | | | | |
| | |
| | | | | |
Janet L. Yeomans | | Trustee | | Since April 1999 |
2005 Market Street | | | | |
Philadelphia, PA 19103 | | | | |
July 1948 | | | | |
| | |
| | | | |
Officers | | |
David F. Connor | | Senior Vice President, | | Senior Vice President |
2005 Market Street | | General Counsel, | | since May 2013; |
Philadelphia, PA 19103 | | and Secretary | | General Counsel |
December 1963 | | | | since May 2015; |
| | | | Secretary since |
| | | | October 2005 |
Daniel V. Geatens | | Vice President | | Treasurer since October 2007 |
2005 Market Street | | and Treasurer | | |
Philadelphia, PA 19103 | | | | |
October 1972 | | | | |
| | |
| | | | | |
Richard Salus | | Senior Vice President | | Chief Financial Officer |
2005 Market Street | | and Chief Financial Officer | | since November 2006 |
Philadelphia, PA 19103 | | | | |
October 1963 | | | | |
| | |
| | | | | |
The Statement of Additional Information for the Fund(s) includes additional information about the Trustees and Officers and is available, without charge, upon request by calling 800 523-1918.
| | | | |
Principal Occupation(s) During the Past Five Years | | Number of Portfolios in Fund Complex Overseen by Trustee or Officer | | Other Directorships Held by Trustee or Officer |
| | | | |
Vice Chairman | | 62 | | Director — HSBC Finance |
(2010–April 2013) — | | | | Corporation and HSBC |
PNC Financial | | | | North America Holdings Inc. |
Services Group | | | | |
| | | | Director — |
| | | | | HSBC USA Inc. |
Vice President and Treasurer | | 62 | | Director, Personnel and |
(January 2006–July 2012), | | | | Compensation Committee |
Vice President — | | | | Chair, and Member of |
Mergers & Acquisitions | | | | Nominating, Investments, and |
(January 2003–January 2006), | | | | Audit Committees — |
and Vice President | | | | Okabena Company |
and Treasurer | | | | (2009–2014) |
(July 1995–January 2003) — 3M Company | | | | |
| | | | |
David F. Connor has served | | 62 | | None2 |
in various capacities at different times at | | | | |
Macquarie Investment | | | | |
Management. | | | | |
| | | | |
| | | | | |
Daniel V. Geatens has served | | 62 | | None2 |
in various capacities at different times at | | | | |
Macquarie Investment | | | | |
Management. | | | | |
Richard Salus has served | | 62 | | None2 |
in various executive capacities at different times at | | | | |
Macquarie Investment | | | | |
Management. | | | | |
| | | | | |
About the organization
| | | | | | |
| Board of trustees | | | | | | |
| Shawn K. Lytle | | Ann D. Borowiec | | John A. Fry | | Frances A. |
President and Chief Executive Officer Delaware FundsSM by Macquarie Philadelphia, PA Thomas L. Bennett Chairman of the Board Delaware Funds by Macquarie Private Investor Rosemont, PA | | Former Chief Executive Officer Private Wealth Management J.P. Morgan Chase & Co. New York, NY Joseph W. Chow Former Executive Vice President State Street Corporation Boston, MA | | President Drexel University Philadelphia, PA Lucinda S. Landreth Former Chief Investment Officer Assurant, Inc. New York, NY | | Sevilla-Sacasa Former Chief Executive Officer Banco Itaú International Miami, FL Thomas K. Whitford Former Vice Chairman PNC Financial Services Group Pittsburgh, PA Janet L. Yeomans Former Vice President and Treasurer 3M Company St. Paul, MN |
| | | | |
| | | |
| Affiliated officers | | | | | |
| | | |
| David F. Connor | | Daniel V. Geatens | | Richard Salus | | |
| Senior Vice President, | | Vice President and | | Senior Vice President and | | |
| General Counsel, | | Treasurer | | Chief Financial Officer | | |
| and Secretary | | Delaware Funds | | Delaware Funds | | |
| Delaware Funds | | by Macquarie | | by Macquarie | | |
| by Macquarie | | Philadelphia, PA | | Philadelphia, PA | | |
| Philadelphia, PA | | | | | | |
This annual report is for the information of Delaware Floating Rate Fund shareholders, but it may be used with prospective investors when preceded or accompanied by the Delaware Fund fact sheet for the most recently completed calendar quarter. These documents are available at delawarefunds.com/literature.
The Fund files its complete schedule of portfolio holdings with the Securities and Exchange Commission (SEC) for the first and third quarters of each fiscal year on Form N-Q. The Fund’s Forms N-Q, as well as a description of the policies and procedures that the Fund uses to determine how to vote proxies (if any) relating to portfolio securities are available without charge (i) upon request, by calling 800 523-1918; and (ii) on the SEC’s website at sec.gov. In addition, a description of the policies and procedures that the Fund uses to determine how to vote proxies (if any) relating to portfolio securities and the Schedule of Investments included in the Fund’s most recent Form N-Q are available without charge on the Fund’s website at delawarefunds.com/literature. The Fund’s Forms N-Q may be reviewed and copied at the SEC’s Public Reference Room in Washington, D.C.; information on the operation of the Public Reference Room may be obtained by calling 800 SEC-0330.
Information (if any) regarding how the Fund voted proxies relating to portfolio securities during the most recently disclosed 12-month period ended June 30 is available without charge (i) through the Fund’s website at delawarefunds.com/proxy; and (ii) on the SEC’s website at sec.gov.
60
Item 2. Code of Ethics
The registrant has adopted a code of ethics that applies to the registrant’s principal executive officer, principal financial officer, principal accounting officer or controller, or persons performing similar functions, regardless of whether these individuals are employed by the registrant or a third party. A copy of the registrant’s Code of Business Ethics has been posted on the Delaware FundsSM by Macquarie Internet Web site at www.delawarefunds.com. Any amendments to the Code of Business Ethics, and information on any waiver from its provisions granted by the registrant, will also be posted on this Web site within five business days of such amendment or waiver and will remain on the Web site for at least 12 months.
Item 3. Audit Committee Financial Expert
The registrant’s Board of Trustees/Directors has determined that certain members of the registrant’s Audit Committee are audit committee financial experts, as defined below. For purposes of this item, an “audit committee financial expert” is a person who has the following attributes:
a. An understanding of generally accepted accounting principles and financial statements;
b. The ability to assess the general application of such principles in connection with the accounting for estimates, accruals, and reserves;
c. Experience preparing, auditing, analyzing, or evaluating financial statements that present a breadth and level of complexity of accounting issues that are generally comparable to the breadth and complexity of issues that can reasonably be expected to be raised by the registrant’s financial statements, or experience actively supervising one or more persons engaged in such activities;
d. An understanding of internal controls and procedures for financial reporting; and
e. An understanding of audit committee functions.
An “audit committee financial expert” shall have acquired such attributes through:
a. Education and experience as a principal financial officer, principal accounting officer, controller, public accountant, or auditor or experience in one or more positions that involve the performance of similar functions;
b. Experience actively supervising a principal financial officer, principal accounting officer, controller, public accountant, auditor, or person performing similar functions;
c. Experience overseeing or assessing the performance of companies or public accountants with respect to the preparation, auditing, or evaluation of financial statements; or
d. Other relevant experience.
The registrant’s Board of Trustees/Directors has also determined that each member of the registrant’s Audit Committee is independent. In order to be “independent” for purposes of this item, the Audit Committee member may not: (i) other than in his or her capacity as a member of the Board of Trustees/Directors or any committee thereof, accept directly or indirectly any consulting, advisory or other compensatory fee from the issuer; or (ii) be an “interested person” of the registrant as defined in Section 2(a)(19) of the Investment Company Act of 1940.
The names of the audit committee financial experts on the registrant’s Audit Committee are set forth below:
Joseph W. Chow
John A. Fry
Lucinda S. Landreth
Thomas K. Whitford
Item 4. Principal Accountant Fees and Services
(a) Audit fees.
The aggregate fees billed for services provided to the registrant by its independent auditors for the audit of the registrant’s annual financial statements and for services normally provided by the independent auditors in connection with statutory and regulatory filings or engagements were $167,427 for the fiscal year ended July 31, 2017.
The aggregate fees billed for services provided to the registrant by its independent auditors for the audit of the registrant’s annual financial statements and for services normally provided by the independent auditors in connection with statutory and regulatory filings or engagements were $167,427 for the fiscal year ended July 31, 2016.
(b) Audit-related fees.
The aggregate fees billed by the registrant’s independent auditors for services relating to the performance of the audit of the registrant’s financial statements and not reported under paragraph (a) of this Item were $0 for the fiscal year ended July 31, 2017.
The aggregate fees billed by the registrant’s independent auditors for services relating to the performance of the audit of the financial statements of the registrant’s investment adviser and other service providers under common control with the adviser and that relate directly to the operations or financial reporting of the registrant were $640,000 for the registrant’s fiscal year ended July 31, 2017. The percentage of these fees relating to services approved by the registrant’s Audit Committee pursuant to the de minimis exception from the pre-approval requirement in Rule 2-01(c)(7)(i)(C) of Regulation S-X was 0%. These audit-related services were as follows: year end audit procedures; group reporting and subsidiary statutory audits.
The aggregate fees billed by the registrant’s independent auditors for services relating to the performance of the audit of the registrant’s financial statements and not reported under paragraph (a) of this Item were $0 for the fiscal year ended July 31, 2016.
The aggregate fees billed by the registrant’s independent auditors for services relating to the performance of the audit of the financial statements of the registrant’s investment adviser and other service providers under common control with the adviser and that relate directly to the operations or financial reporting of the registrant were $667,000 for the registrant’s fiscal year ended July 31, 2016. The percentage of these fees relating to services approved by the registrant’s Audit Committee pursuant to the de minimis exception from the pre-approval requirement in Rule 2-01(c)(7)(i)(C) of Regulation S-X was 0%. These audit-related services were as follows: year end audit procedures; group reporting and subsidiary statutory audits.
(c) Tax fees.
The aggregate fees billed by the registrant’s independent auditors for tax-related services provided to the registrant were $22,928 for the fiscal year ended July 31, 2017. The percentage of these fees relating to services approved by the registrant’s Audit Committee pursuant to the de minimis exception from the pre-approval requirement in Rule 2-01(c)(7)(i)(C) of Regulation S-X was 0%. These tax-related services were as follows: review of income tax returns and review of annual excise distribution calculations.
The aggregate fees billed by the registrant’s independent auditors for tax-related services provided to the registrant’s investment adviser and other service providers under common control with the adviser and that relate directly to the operations or financial reporting of the registrant were $0 for the registrant’s fiscal year ended July 31, 2017.
The aggregate fees billed by the registrant’s independent auditors for tax-related services provided to the registrant were $22,232 for the fiscal year ended July 31, 2016. The percentage of these fees relating to services approved by the registrant’s Audit Committee pursuant to the de minimis exception from the pre-approval requirement in Rule 2-01(c)(7)(i)(C) of Regulation S-X was 0%. These tax-related services were as follows: review of income tax returns and review of annual excise distribution calculations.
The aggregate fees billed by the registrant’s independent auditors for tax-related services provided to the registrant’s investment adviser and other service providers under common control with the adviser and that relate directly to the operations or financial reporting of the registrant were $0 for the registrant’s fiscal year ended July 31, 2016.
(d) All other fees.
The aggregate fees billed for all services provided by the independent auditors to the registrant other than those set forth in paragraphs (a), (b) and (c) of this Item were $0 for the fiscal year ended July 31, 2017.
The aggregate fees billed for all services other than those set forth in paragraphs (b) and (c) of this Item provided by the registrant’s independent auditors to the registrant’s adviser and other service providers under common control with the adviser and that relate directly to the operations or financial reporting of the registrant were $0 for the registrant’s fiscal year ended July 31, 2017. The percentage of these fees relating to services approved by the registrant’s Audit Committee pursuant to the de minimis exception from the pre-approval requirement in Rule 2-01(c)(7)(i)(C) of Regulation S-X was 0%.
The aggregate fees billed for all services provided by the independent auditors to the registrant other than those set forth in paragraphs (a), (b) and (c) of this Item were $0 for the fiscal year ended July 31, 2016.
The aggregate fees billed for all services other than those set forth in paragraphs (b) and (c) of this Item provided by the registrant’s independent auditors to the registrant’s adviser and other service providers under common control with the adviser and that relate directly to the operations or financial reporting of the registrant were $0 for the registrant’s fiscal year ended July 31, 2016. The percentage of these fees relating to services approved by the registrant’s Audit Committee pursuant to the de minimis exception from the pre-approval requirement in Rule 2-01(c)(7)(i)(C) of Regulation S-X was 0%.
(e) The registrant’s Audit Committee has established pre-approval policies and procedures as permitted by Rule 2-01(c)(7)(i)(B) of Regulation S-X (the “Pre-Approval Policy”) with respect to services provided by the registrant’s independent auditors. Pursuant to the Pre-Approval Policy, the Audit Committee has pre-approved the services set forth in the table below with respect to the registrant up to the specified fee limits. Certain fee limits are based on aggregate fees to the registrant and other registrants within the Delaware Investments Family of Funds.
| Service | Range of Fees |
| Audit Services | |
| Statutory audits or financial audits for new Funds | up to $40,000 per Fund |
| Services associated with SEC registration statements (e.g., Form N-1A, Form N-14, etc.), periodic reports and other documents filed with the SEC or other documents issued in connection with securities offerings (e.g., comfort letters for closed-end Fund offerings, consents), and assistance in responding to SEC comment letters | up to $10,000 per Fund |
| Consultations by Fund management as to the accounting or disclosure treatment of transactions or events and/or the actual or potential impact of final or proposed rules, standards or interpretations by the SEC, FASB, or other regulatory or standard-setting bodies (Note: Under SEC rules, some consultations may be considered “audit-related services” rather than “audit services”) | up to $25,000 in the aggregate |
| Audit-Related Services | |
| Consultations by Fund management as to the accounting or disclosure treatment of transactions or events and /or the actual or potential impact of final or proposed rules, standards or interpretations by the SEC, FASB, or other regulatory or standard-setting bodies (Note: Under SEC rules, some consultations may be considered “audit services” rather than “audit-related services”) | up to $25,000 in the aggregate |
| Tax Services | |
| U.S. federal, state and local and international tax planning and advice (e.g., consulting on statutory, regulatory or administrative developments, evaluation of Funds’ tax compliance function, etc.) | up to $25,000 in the aggregate |
| U.S. federal, state and local tax compliance (e.g., excise distribution reviews, etc.) | up to $5,000 per Fund |
| Review of federal, state, local and international income, franchise and other tax returns | up to $5,000 per Fund |
Under the Pre-Approval Policy, the Audit Committee has also pre-approved the services set forth in the table below with respect to the registrant’s investment adviser and other entities controlling, controlled by or under common control with the investment adviser that provide ongoing services to the registrant (the “Control Affiliates”) up to the specified fee limit. This fee limit is based on aggregate fees to the investment adviser and its Control Affiliates.
| Service | Range of Fees |
| Non-Audit Services | |
| Services associated with periodic reports and other documents filed with the SEC and assistance in responding to SEC comment letters | up to $10,000 in the aggregate |
The Pre-Approval Policy requires the registrant’s independent auditors to report to the Audit Committee at each of its regular meetings regarding all services initiated since the last such report was rendered, including those services authorized by the Pre-Approval Policy.
(f) Not applicable.
(g) The aggregate non-audit fees billed by the registrant’s independent auditors for services rendered to the registrant and to its investment adviser and other service providers under common control with the adviser were $11,180,000 and $10,036,000 for the registrant’s fiscal years ended July 31, 2017 and July 31, 2016, respectively.
(h) In connection with its selection of the independent auditors, the registrant’s Audit Committee has considered the independent auditors’ provision of non-audit services to the registrant’s investment adviser and other service providers under common control with the adviser that were not required to be pre-approved pursuant to Rule 2-01(c)(7)(ii) of Regulation S-X. The Audit Committee has determined that the independent auditors’ provision of these services is compatible with maintaining the auditors’ independence.
Item 5. Audit Committee of Listed Registrants
Not applicable.
Item 6. Investments
(a) Included as part of report to shareholders filed under Item 1 of this Form N-CSR.
(b) Divestment of securities in accordance with Section 13(c) of the Investment Company Act of 1940.
Not applicable.
Item 7. Disclosure of Proxy Voting Policies and Procedures for Closed-End Management Investment Companies
Not applicable.
Item 8. Portfolio Managers of Closed-End Management Investment Companies
Not applicable.
Item 9. Purchases of Equity Securities by Closed-End Management Investment Company and Affiliated Purchasers
Not applicable.
Item 10. Submission of Matters to a Vote of Security Holders
Not applicable.
Item 11. Controls and Procedures
The registrant’s principal executive officer and principal financial officer have evaluated the registrant’s disclosure controls and procedures within 90 days of the filing of this report and have concluded that they are effective in providing reasonable assurance that the information required to be disclosed by the registrant in its reports or statements filed under the Securities Exchange Act of 1934 is recorded, processed, summarized and reported within the time periods specified in the rules and forms of the Securities and Exchange Commission.
There were no significant changes in the registrant’s internal control over financial reporting that occurred during the second fiscal quarter of the period covered by the report to stockholders included herein (i.e., the registrant’s fourth fiscal quarter) that have materially affected, or are reasonably likely to materially affect, the registrant’s internal control over financial reporting.
Item 12. Exhibits
(a) (1) Code of Ethics
Not applicable.
(2) Certifications of Principal Executive Officer and Principal Financial Officer pursuant to Rule 30a-2 under the Investment Company Act of 1940 are attached hereto as Exhibit 99.CERT.
(3) Written solicitations to purchase securities pursuant to Rule 23c-1 under the Securities Exchange Act of 1934.
Not applicable.
(b) Certifications pursuant to Section 906 of the Sarbanes-Oxley Act of 2002 are furnished herewith as Exhibit 99.906CERT.
SIGNATURES
Pursuant to the requirements of the Securities Exchange Act of 1934 and the Investment Company Act of 1940, the registrant has duly caused this report to be signed on its behalf, by the undersigned, thereunto duly authorized.
DELAWARE GROUP® INCOME FUNDS
| SHAWN K. LYTLE |
| By: | Shawn K. Lytle |
| Title: | President and Chief Executive Officer |
| Date: | October 4, 2017 |
Pursuant to the requirements of the Securities Exchange Act of 1934 and the Investment Company Act of 1940, this report has been signed below by the following persons on behalf of the registrant and in the capacities and on the dates indicated.
| SHAWN K. LYTLE |
| By: | Shawn K. Lytle |
| Title: | President and Chief Executive Officer |
| Date: | October 4, 2017 |
| |
| |
| RICHARD SALUS |
| By: | Richard Salus |
| Title: | Chief Financial Officer |
| Date: | October 4, 2017 |