UNITED STATES SECURITIES AND EXCHANGE COMMISSION
Washington, D.C. 20549
FORM N-CSR
CERTIFIED SHAREHOLDER REPORT OF REGISTERED MANAGEMENT
INVESTMENT COMPANIES
| Investment Company Act file number: | | 811-02071 |
| | |
| Exact name of registrant as specified in charter: | | Delaware Group® Income Funds |
| | |
| Address of principal executive offices: | | 2005 Market Street |
| | Philadelphia, PA 19103 |
| | |
| Name and address of agent for service: | | David F. Connor, Esq. |
| | 2005 Market Street |
| | Philadelphia, PA 19103 |
| | |
| Registrant’s telephone number, including area code: | | (800) 523-1918 |
| | |
| Date of fiscal year end: | | July 31 |
| | |
| Date of reporting period: | | July 31, 2014 |
Item 1. Reports to Stockholders

Annual report
Fixed income mutual funds
Delaware Corporate Bond Fund
Delaware Extended Duration Bond Fund
July 31, 2014
Carefully consider the Funds’ investment objectives, risk factors, charges, and expenses before investing. This and other information can be found in the Funds’ prospectus and their summary prospectuses, which may be obtained by visiting delawareinvestments.com or calling 800 523-1918. Investors should read the prospectus and the summary prospectus carefully before investing.
You can obtain shareholder reports and prospectuses online instead of in the mail.
Visit delawareinvestments.com/edelivery.
Experience Delaware Investments
Delaware Investments is committed to the pursuit of consistently superior asset management and unparalleled client service. We believe in our investment processes, which seek to deliver consistent results, and in convenient services that help add value for our clients.
If you are interested in learning more about creating an investment plan, contact your financial advisor.
You can learn more about Delaware Investments or obtain a prospectus for Delaware Corporate Bond Fund and Delaware Extended Duration Bond Fund at delawareinvestments.com.
Manage your investments online
| — | | 24-hour access to your account information |
| — | | Check your account balance and recent transactions |
| — | | Request statements or literature |
| — | | Make purchases and redemptions |
Delaware Management Holdings, Inc. and its subsidiaries (collectively known by the marketing name of Delaware Investments) are wholly owned subsidiaries of Macquarie Group Limited, a global provider of banking, financial, advisory, investment and funds management services.
Investments in Delaware Corporate Bond Fund and Delaware Extended Duration Bond Fund are not and will not be deposits with or liabilities of Macquarie Bank Limited ABN 46 008 583 542 and its holding companies, including their subsidiaries or related companies (Macquarie Group), and are subject to investment risk, including possible delays in repayment and loss of income and capital invested. No Macquarie Group company guarantees or will guarantee the performance of the Funds, the repayment of capital from the Funds, or any particular rate of return.
Table of contents
Unless otherwise noted, views expressed herein are current as of July 31, 2014, and subject to change.
Funds are not FDIC insured and are not guaranteed. It is possible to lose the principal amount invested.
Mutual fund advisory services provided by Delaware Management Company, a series of Delaware Management Business Trust, which is a registered investment advisor. Delaware Investments, a member of Macquarie Group, refers to Delaware Management Holdings, Inc. and its subsidiaries, including the Fund’s distributor, Delaware Distributors, L.P. Macquarie Group refers to Macquarie Group Limited and its subsidiaries and affiliates worldwide.
© 2014 Delaware Management Holdings, Inc.
All third-party marks cited are the property of their respective owners.
Portfolio management review
| | |
| Delaware Corporate Bond Fund and Delaware Extended Duration Bond Fund | | August 12, 2014 |
| | | | | | | | |
Performance preview (for the year ended July 31, 2014) | | | | | | | | |
Delaware Corporate Bond Fund (Class A shares) | | | 1-year return | | | | +8.33% | |
Barclays U.S. Corporate Investment Grade Index (benchmark) | | | 1-year return | | | | +6.78% | |
Past performance does not guarantee future results.
For complete, annualized performance for Delaware Corporate Bond Fund, please see the table on page 4.
The performance of Class A shares excludes the applicable sales charge and reflects the reinvestment of all distributions. Index performance returns do not reflect any management fees, transaction costs, or expenses. Indices are unmanaged and one cannot invest directly in an index.
| | | | | | | | |
Delaware Extended Duration Bond Fund (Class A shares) | | | 1-year return | | | | +13.42% | |
Barclays Long U.S. Corporate Index (benchmark) | | | 1-year return | | | | +12.33% | |
Past performance does not guarantee future results.
For complete, annualized performance for Delaware Extended Duration Bond Fund, please see the table on page 8. The performance of Class A shares excludes the applicable sales charge and reflects the reinvestment of all distributions. Index performance returns do not reflect any management fees, transaction costs, or expenses. Indices are unmanaged and one cannot invest directly in an index.
In spite of a rough beginning, the Funds’ fiscal year was a rewarding one for corporate bond investors. Then-U.S. Federal Reserve Chair Ben Bernanke’s comments about tapering, delivered in May 2013, roiled worldwide financial markets for months afterwards, but even by the Funds’ fiscal year start on Aug. 1, prices in the bond markets had not completely shaken out. Some credits didn’t fully reach bottom until as late as September 2013.
During the final three months of 2013, it was evident to us that corporate America had high levels of balance sheet cash and some companies were starting to put their cash to work. The Funds’ fiscal year was a time of growth in capital expenditures and a significant pick up in mergers and acquisitions (M&A) — to the tune of approximately $1 trillion (source: Bloomberg). Companies also started to focus again on dividends and share buybacks. Some companies had cash trapped in overseas subsidiaries, and as a result, the corporate bond market became a financing source for these shareholder rewards.
However, economic growth usually seems to raise the specter of rising rates, which are a headwind for bond prices. As it turned out, 10-year U.S.
Treasurys rallied then sold off, while corporate bond spreads rallied in the fourth quarter of 2013. The weak gross domestic product surprise in the first quarter of 2014 — generally attributed to adverse weather — quelled inflation fears and fueled a bond market rally through the remainder of the Funds’ fiscal year. Even significant geopolitical events such as the conflicts in Ukraine and Gaza did not deter investors in U.S. Treasurys or corporate bonds. In fact, corporate spreads continued to tighten, as the investment grade corporate bond market benefited by assuming quasi-safe-haven status.
A broad-based rally
We characterize the rally over the last six months of the Funds’ fiscal year as one driven by macroeconomic influences more than security-specific factors. The three biggest drivers of market performance were supply and demand, interest rates, and tightening of yield spreads between corporate and government bonds.
Because of the size and breadth of the corporate bond market, retail fund flows usually do not play much of a role. As noted earlier, M&A activity accounted for a small net increase in supply. In
1
Portfolio management review
Delaware Corporate Bond Fund and Delaware Extended Duration Bond Fund
many cases, companies with strong balance sheets funded acquisitions with a mixture of equity and debt, resulting in a slight increase in leverage. In both Funds, we worked hard to avoid “event risk,” where companies use leverage excessively, in our view. While supply of investment grade bonds was up year over year, this was more than offset by an increase in demand.
During the period, two sources of demand far outweighed the increased supply from new issues: First, many pension funds and insurance companies, seeking to immunize their liabilities through liability-driven investment (LDI) strategies, sought investment grade bonds either as a replacement for equity in their portfolios or as an asset against new business liabilities. Second, the Fed’s quantitative-easing program made it difficult to accommodate the market’s demand for U.S. Treasury bonds and mortgage-backed securities (MBS). Many investors that might have owned U.S. Treasury or mortgage-backed bonds were instead investing in corporate bonds.
At the end of 2013, it appeared investors generally believed that interest rates would continue to grind higher in 2014. This did not occur. Rates rallied, supporting higher prices. The investment grade market is very sensitive to interest rates. With a duration (which determines how a bond’s price is affected by interest rate changes) of about seven years, which is longer than normal, the investment grade corporate bond market is quite sensitive to rates, which benefited the market during 2014.
The change in spreads of corporate bonds tells a similar story. The spread is the additional return investors demand for accepting the liquidity risk and downgrade risk that come with owning corporate bonds relative to Treasurys. At the beginning of calendar year 2014, the spread was about 115 basis points (one basis point equals one one-hundredth of a percentage point). By July 31, that spread had declined to approximately 100 basis points. During this time frame, the major buyers of Treasurys were the Fed, foreign
governments, and U.S. money-center banks. As noted above, this “flight to quality” extended to investment grade corporates, boosting prices and tightening spreads.
Fund performance
For the fiscal year ended July 31, 2014, Delaware Corporate Bond Fund Class A shares returned +8.33% at net asset value and +3.46% at maximum offer price (both returns reflect all distributions reinvested). In comparison, the Fund’s benchmark, the Barclays U.S. Corporate Investment Grade Index, returned +6.78% during the same period. For complete annualized performance of Delaware Corporate Bond Fund, please see the table on page 4.
During the same period, Delaware Extended Duration Bond Fund Class A shares returned +13.42% at net asset value and +8.25% at maximum offer price (both returns reflect all distributions reinvested). In comparison, the Fund’s benchmark, the Barclays Long U.S. Corporate Index, returned +12.33% during the same period. For complete annualized performance of Delaware Extended Duration Bond Fund, please see the table on page 8.
How we added value
In each Fund, we managed interest rate risk by positioning the Fund’s duration slightly short of its benchmark’s duration. At the same time, each Fund took on more credit risk than its benchmark, by underweighting A-rated bonds and overweighting BBB-rated bonds. In Delaware Extended Duration Bond Fund, we added a small allocation to high yield securities, and in Delaware Corporate Bond Fund, we maintained a healthy exposure to high yield, at about 20% of the Fund’s portfolio. The high yield bond exposure was accretive to Delaware Corporate Bond Fund, but the small high yield exposure in Delaware Extended Duration Bond Fund marginally underperformed relative to the strong
2
performance of long-duration investment grade corporate bonds.
The strongest-performing sectors for Delaware Corporate Bond Fund were financials, energy, consumer cyclicals, and telecommunications. One of the Fund’s leading performers was Nuveen Investments, an asset manager that was taken over by a competitor. The Fund also benefited from our management of its exposure to Verizon Communications credits — both before and after the company completed the largest bond issue in history.
The Fund’s underperforming sectors were transportation and natural gas. The Fund booked losses in credits during the problematic third quarter of 2013, including in its position in MetLife. We moved quickly to redeploy the proceeds in other credits that we believed would offer better relative value. These positions were included in the Fund’s portfolio in time to benefit from the rally in the fourth quarter of 2013.
Delaware Extended Duration Bond Fund’s strongest-performing sectors were nonbank financials, electronics, state-owned entities, and energy. Again, Verizon’s long-dated paper was a top performer, along with Enel, an Italian utility, and SES, a global satellite operator based in Luxembourg. Credits such as Public Storage and Con Edison underperformed, chiefly because we sold them in the third quarter of 2013.
We employed interest rate derivatives as a risk management tool in both Funds over the course of the fiscal year. We made several trades in corporate credit default swaps (CDS). These were limited to: one trade of the investment grade credit derivatives index (CDX); one buy protection trade of a cable company; and one pair trade in the banking sector — a long/short pair with equal notional value. The positions were not held at the end of the fiscal year, and they did not have a material effect on the performance of either Fund.
3
Performance summaries
| | |
| Delaware Corporate Bond Fund | | July 31, 2014 |
The performance data quoted represent past performance; past performance does not guarantee future results. Investment return and principal value will fluctuate so your shares, when redeemed, may be worth more or less than their original cost. Please obtain the performance data current for the most recent month end by calling 800 523-1918 or visiting our website at delawareinvestments.com/performance. Current performance may be lower or higher than the performance data quoted.
| | | | | | |
| Fund and benchmark performance1,2 | | Average annual total returns through July 31, 2014 |
| | | 1 year | | 5 years | | 10 years |
Class A (Est. Sept. 15, 1998) | | | | | | |
Excluding sales charge | | +8.33% | | +9.63% | | +7.34% |
Including sales charge | | +3.46% | | +8.61% | | +6.84% |
Class B (Est. Sept. 15, 1998) | | | | | | |
Excluding sales charge | | +8.05% | | +8.92% | | +6.70% |
Including sales charge | | +4.05% | | +8.71% | | +6.70% |
Class C (Est. Sept. 15, 1998) | | | | | | |
Excluding sales charge | | +7.35% | | +8.77% | | +6.54% |
Including sales charge | | +6.35% | | +8.77% | | +6.54% |
Class R (Est. June 2, 2003) | | | | | | |
Excluding sales charge | | +8.06% | | +9.35% | | +7.07% |
Including sales charge | | +8.06% | | +9.35% | | +7.07% |
Institutional Class (Est. Sept. 15, 1998) | | | | | | |
Excluding sales charge | | +8.60% | | +9.90% | | +7.60% |
Including sales charge | | +8.60% | | +9.90% | | +7.60% |
Barclays U.S. Corporate | | | | | | |
Investment Grade Index | | +6.78% | | +7.17% | | +5.80% |
1Returns reflect the reinvestment of all distributions and are presented both with and without the applicable sales charges described below. Returns do not reflect the deduction of taxes the shareholder would pay on Fund distributions or redemptions of Fund shares.
Expense limitations were in effect for certain classes during some or all of the periods shown in the “Fund and benchmark performance” table. Expenses for each class are listed on the “Fund expense ratios” table on page 6. Performance would have been lower had expense limitations not been in effect.
Class A shares are sold with a maximum front-end sales charge of 4.50%, and have an annual distribution and service fee of 0.25% of average daily net assets. Prior to Oct. 1, 2013, the Fund paid an annual distribution and service fee of 0.30% of average daily net assets. This fee was contractually limited to 0.25% of average daily net assets from Nov. 28, 2012 through Oct. 1, 2013. Performance for Class A shares, excluding sales charges, assumes that no front-end sales charge applied.
All remaining Class B shares were converted to Class A shares on Sept. 25, 2014. Prior to
4
Sept. 25, 2014, Class B shares were available for purchase only through dividend reinvestment and certain permitted exchanges as was described in the prospectus. Class B shares had a contingent deferred sales charge that declined from 4.00% to zero depending on the period of time the shares were held. They were also subject to an annual distribution and service fee of 1.00% of average daily net assets. This fee was contractually limited to 0.25% of average daily net assets from Nov. 27, 2013 through July 31, 2014.* Prior to Nov. 27, 2013, there was no waiver. Please see Note 14 in “Notes to financial statements” for more information. Ten-year performance figures for Class B shares reflect conversion to Class A shares after approximately eight years.
Class C shares are sold with a contingent deferred sales charge of 1.00% if redeemed during the first 12 months. They are also subject to an annual distribution and service fee of 1.00% of average daily net assets.
Performance for Class B and C shares, excluding sales charges, assumes either that contingent deferred sales charges did not apply or that the investment was not redeemed.
Class R shares are available only for certain retirement plan products. They are sold without a sales charge and have an annual distribution and service fee of 0.50% of average daily net assets. Prior to Oct. 1, 2013, the Fund paid an annual distribution and service fee of 0.60% of average daily net assets. This fee was contractually limited to 0.50% of average daily net assets from Nov. 28, 2012 through Oct. 1, 2013.
Institutional Class shares are available without sales or asset-based distribution charges only to certain eligible institutional accounts.
*The contractual waiver period is from Nov. 27, 2013 through Nov. 27, 2014.
The “Fund and benchmark performance” table and the “Performance of a $10,000 investment” graph do not reflect the deduction of taxes the shareholder would pay on Fund distributions or redemptions of Fund shares.
Fixed income securities and bond funds can lose value, and investors can lose principal, as interest rates rise. They also may be affected by economic conditions that hinder an issuer’s ability to make interest and principal payments on its debt.
The Fund may also be subject to prepayment risk, the risk that the principal of a fixed income security that is held by the Fund may be prepaid prior to maturity, potentially forcing the Fund to reinvest that money at a lower interest rate.
High yielding, noninvestment grade bonds (junk bonds) involve higher risk than investment grade bonds.
International investments entail risks not ordinarily associated with U.S. investments including fluctuation in currency values, differences in accounting principles, or economic or political instability in other nations.
Investing in emerging markets can be riskier than investing in established foreign markets due to increased volatility and lower trading volume.
The Fund may experience portfolio turnover in excess of 100%, which could result in higher transaction costs and tax liability.
The Fund may invest in derivatives, which may involve additional expenses and are subject to risk, including the risk that an underlying security or securities index moves in the opposite direction from what the portfolio manager anticipated. A derivative transaction depends upon the counterparties’ ability to fulfill their contractual obligations.
Per Standard & Poor’s credit rating agency, bonds rated AA and A are more susceptible to the adverse effects of changes in circumstances and
5
Performance summaries
Delaware Corporate Bond Fund
economic conditions than those in the higher-rated AAA category, but the obligor’s capacity to meet its financial commitment on the obligation is still strong. Bonds rated BBB exhibit adequate protection parameters, although adverse economic conditions or changing circumstances
are more likely to lead to a weakened capacity of the obligor to meet its financial commitments. Bonds rated BB, B, and CCC are regarded as having significant speculative characteristics, with BB indicating the least degree of speculation of the three.
2 The Fund’s expense ratios, as described in the most recent prospectus, are disclosed in the following “Fund expense ratios” table. Delaware Management Company has agreed to reimburse certain expenses and/or waive certain fees in order to prevent total annual fund operating expenses (excluding any 12b-1 plan, taxes, interest, inverse floater program expenses, short sale and dividend interest expenses, brokerage fees, certain insurance costs, acquired fund fees and expenses, and nonroutine expenses or costs, including, but not limited to, those relating to reorganizations, litigation, conducting shareholder meetings, and liquidations (collectively, nonroutine expenses)) from exceeding 0.69% of the Fund’s average daily net assets during the period from Aug. 1, 2013, through July, 31, 2014.** Please see the most recent prospectus and any applicable supplement(s) for additional information on these fee waivers and/or reimbursements.
| | | | | | | | | | |
| Fund expense ratios | | Class A | | Class B† | | Class C | | Class R | | Institutional Class |
Total annual operating expenses | | 0.93% | | 1.68% | | 1.68% | | 1.18% | | 0.68% |
(without fee waivers) | | | | | | | | | | |
Net expenses | | 0.93% | | 0.93% | | 1.68% | | 1.18% | | 0.68% |
(including fee waivers, if any) | | | | | | | | | | |
Type of Waiver | | Contractual | | Contractual | | Contractual | | Contractual | | Contractual |
**The contractual waiver period is from Nov. 28, 2012 through Nov. 28, 2014.
†See Note 14 in “Notes to financial statements.”
6
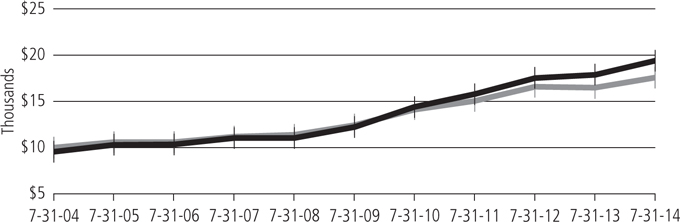
Performance of a $10,000 investment1
Average annual total returns from July 31, 2004, through July 31, 2014
| | | | | | | | |
| For period beginning July 31, 2004, through July 31, 2014 | | Starting value | | | Ending value | |
 Delaware Corporate Bond Fund — Class A shares Delaware Corporate Bond Fund — Class A shares
| | | $9,550 | | | | $19,381 | |
 Barclays U.S. Corporate Investment Grade Index Barclays U.S. Corporate Investment Grade Index
| | | $10,000 | | | | $17,577 | |
1 The “Performance of a $10,000 investment” graph assumes $10,000 invested in Class A shares of the Fund on July 31, 2004, and includes the effect of a 4.50% front-end sales charge and the reinvestment of all distributions. The graph does not reflect the deduction of taxes the shareholders would pay on Fund distributions or redemptions of Fund shares. Expense limitations were in effect for some or all of the periods shown. Performance would have been lower had expense limitations not been in effect. Expenses are listed in the “Fund expense ratios” table on page 6. Please note additional details on pages 4 through 7.
The graph also assumes $10,000 invested in the Barclays U.S. Corporate Investment Grade Index as of July 31, 2004. The Barclays U.S. Corporate Investment Grade Index is composed of U.S. dollar–denominated, investment grade, SEC-registered corporate bonds issued by industrial, utility, and financial companies. All bonds in the index have at least one year to maturity.
Index performance returns do not reflect any management fees, transaction costs, or expenses. Indices are unmanaged and one cannot invest directly in an index. Past performance is not a guarantee of future results.
Performance of other Fund classes will vary due to different charges and expenses.
| | | | | | | | |
| | | Nasdaq symbols | | | | CUSIPs | | |
Class A | | DGCAX | | | | 245908785 | | |
Class B | | DGCBX | | | | 245908777 | | |
Class C | | DGCCX | | | | 245908769 | | |
Class R | | DGCRX | | | | 245908744 | | |
Institutional Class | | DGCIX | | | | 245908751 | | |
7
| | | | |
| Performance summaries | | | | |
| Delaware Extended Duration Bond Fund | | | July 31, 2014 | |
The performance data quoted represent past performance; past performance does not guarantee future results. Investment return and principal value will fluctuate so your shares, when redeemed, may be worth more or less than their original cost. Please obtain the performance data current for the most recent month end by calling 800 523-1918 or visiting our website at delawareinvestments.com/performance. Current performance may be lower or higher than the performance data quoted.
| | | | | | | | | | | | | | | | |
| Fund and benchmark performance1,2 | | Average annual total returns through July 31, 2014 | |
| | | 1 year | | | 5 years | | | 10 years | | | Lifetime | |
Class A (Est. Sept. 15, 1998) | | | | | | | | | | | | | | | | |
Excluding sales charge | | | +13.42 | % | | | +12.65 | % | | | +9.38 | % | | | n/a | |
Including sales charge | | | +8.25 | % | | | +11.63 | % | | | +8.88 | % | | | n/a | |
Class B (Est. Sept. 15, 1998) | | | | | | | | | | | | | | | | |
Excluding sales charge | | | +13.21 | % | | | +11.95 | % | | | +8.74 | % | | | n/a | |
Including sales charge | | | +9.21 | % | | | +11.76 | % | | | +8.74 | % | | | n/a | |
Class C (Est. Sept. 15, 1998) | | | | | | | | | | | | | | | | |
Excluding sales charge | | | +12.59 | % | | | +11.82 | % | | | +8.59 | % | | | n/a | |
Including sales charge | | | +11.59 | % | | | +11.82 | % | | | +8.59 | % | | | n/a | |
Class R (Est. Oct. 3, 2005) | | | | | | | | | | | | | | | | |
Excluding sales charge | | | +13.13 | % | | | +12.36 | % | | | n/a | | | | +9.05 | % |
Including sales charge | | | +13.13 | % | | | +12.36 | % | | | n/a | | | | +9.05 | % |
Institutional Class (Est. Sept. 15, 1998) | | | | | | | | | | | | | | | | |
Excluding sales charge | | | +13.72 | % | | | +12.95 | % | | | +9.66 | % | | | n/a | |
Including sales charge | | | +13.72 | % | | | +12.95 | % | | | +9.66 | % | | | n/a | |
Barclays Long U.S. Corporate Index | | | +12.33 | % | | | +9.79 | % | | | +7.43 | % | | | n/a | |
1Returns reflect the reinvestment of all distributions and are presented both with and without the applicable sales charges described below. Returns do not reflect the deduction of taxes the shareholder would pay on Fund distributions or redemptions of Fund shares.
Expense limitations were in effect for certain classes during some or all of the periods shown in the “Fund and benchmark performance” table. Expenses for each class are listed on the “Fund expense ratios” table on page 10. Performance would have been lower had expense limitations not been in effect.
Class A shares are sold with a maximum front-end sales charge of 4.50%, and have an annual distribution and service fee of 0.25% of average daily net assets. Prior to Oct. 1, 2013, the Fund paid an annual distribution and service fee of 0.30% of average daily net assets. This fee was contractually limited to 0.25% from Nov. 27, 2012 through Oct. 1, 2013. Performance for Class A shares, excluding sales charges, assumes that no front-end sales charge applied.
All remaining Class B shares were converted to Class A shares on Sept. 25, 2014. Prior to Sept. 25, 2014, Class B shares were available for purchase only through dividend reinvestment and
8
certain permitted exchanges as was described in the prospectus. Class B shares had a contingent deferred sales charge that declined from 4.00% to zero depending on the period of time the shares were held. They were also subject to an annual distribution and service fee of 1.00% of average daily net assets. This fee was contractually limited to 0.25% of average daily net assets from Oct. 1, 2013 through July 31, 2014.* Prior to Oct. 1, 2013, there was no waiver. Please see Note 14 in “Notes to financial statements” for more information. Ten-year performance figures for Class B shares reflect conversion to Class A shares after approximately eight years.
Class C shares are sold with a contingent deferred sales charge of 1.00% if redeemed during the first 12 months. They are also subject to an annual distribution and service fee of 1.00% of average daily net assets.
Performance for Class B and C shares, excluding sales charges, assumes either that contingent deferred sales charges did not apply or that the investment was not redeemed.
Class R shares are available only for certain retirement plan products. They are sold without a sales charge and have an annual distribution and service fee of 0.50% of average daily net assets. Prior to Oct. 1, 2013, the Fund paid an annual distribution and service fee of 0.60% of average daily net assets. This fee was contractually limited to 0.50% from Nov. 27, 2012 through Oct. 1, 2013.
Institutional Class shares are available without sales or asset-based distribution charges only to certain eligible institutional accounts.
The “Fund and benchmark performance” table and the “Performance of a $10,000 investment” graph do not reflect the deduction of taxes the
| * | The contractual waiver period is from Oct . 1, 2013 through Nov. 28, 2014. |
shareholder would pay on Fund distributions or redemptions of Fund shares.
Fixed income securities and bond funds can lose value, and investors can lose principal, as interest rates rise. They also may be affected by economic conditions that hinder an issuer’s ability to make interest and principal payments on its debt.
The Fund may also be subject to prepayment risk, the risk that the principal of a fixed income security that is held by the Fund may be prepaid prior to maturity, potentially forcing the Fund to reinvest that money at a lower interest rate.
High yielding, noninvestment grade bonds (junk bonds) involve higher risk than investment grade bonds.
International investments entail risks not ordinarily associated with U.S. investments including fluctuation in currency values, differences in accounting principles, or economic or political instability in other nations.
Investing in emerging markets can be riskier than investing in established foreign markets due to increased volatility and lower trading volume.
The Fund may experience portfolio turnover in excess of 100%, which could result in higher transaction costs and tax liability.
The Fund may invest in derivatives, which may involve additional expenses and are subject to risk, including the risk that an underlying security or securities index moves in the opposite direction from what the portfolio manager anticipated. A derivative transaction depends upon the counterparties’ ability to fulfill their contractual obligations.
Per Standard & Poor’s credit rating agency, bonds rated AA and A are more susceptible to the adverse effects of changes in circumstances and economic conditions than those in the higher-rated AAA category, but the obligor’s capacity to meet its financial commitment on the obligation is still strong. Bonds rated BBB exhibit adequate
9
Performance summaries
Delaware Extended Duration Bond Fund
protection parameters, although adverse economic conditions or changing circumstances are more likely to lead to a weakened capacity of the obligor to meet its financial commitments.
Bonds rated BB, B, and CCC are regarded as having significant speculative characteristics, with BB indicating the least degree of speculation of the three.
2 The Fund’s expense ratios, as described in the most recent prospectus, are disclosed in the following “Fund expense ratios” table. Delaware Management Company has agreed to reimburse certain expenses and/or waive certain fees in order to prevent total annual fund operating expenses (excluding any 12b-1 plan, taxes, interest, inverse floater program expenses, short sale and dividend interest expenses, brokerage fees, certain insurance costs, acquired fund fees and expenses, and nonroutine expenses or costs, including, but not limited to, those relating to reorganizations, litigation, conducting shareholder meetings, and liquidations (collectively, nonroutine expenses)) from exceeding 0.71% of the Fund’s average daily net assets from Aug. 1, 2013 through July 31, 2014.** Please see the most recent prospectus and any applicable supplement(s) for additional information on these fee waivers and/or reimbursements.
| | | | | | | | | | | | | | | | | | | | | | | | | |
| Fund expense ratios | | Class A | | Class B† | | Class C | | Class R | | Institutional Class |
Total annual operating expenses | | 0.99% | | 1.74% | | 1.74% | | 1.24% | | 0.74% |
(without fee waivers) | | | | | | | | | | |
Net expenses | | 0.96% | | 0.96% | | 1.71% | | 1.21% | | 0.71% |
(including fee waivers, if any) | | | | | | | | | | |
Type of waiver | | Contractual | | Contractual | | Contractual | | Contractual | | Contractual |
| | | | | | | | | | | | | | | | |
**The contractual waiver period is from Nov. 28, 2012 through Nov. 28, 2014. Prior to Nov. 28, 2013, the contractual waiver was 0.70%.
†See Note 14 in “Notes to financial statements.”
10
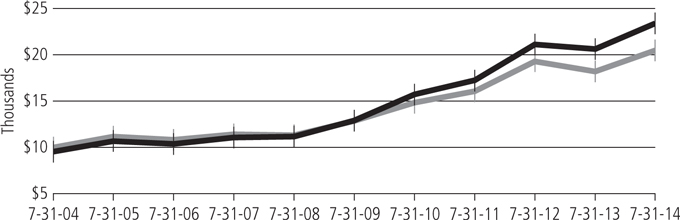
Performance of a $10,000 investment1
Average annual total returns from July 31, 2004, through July 31, 2014
| | | | | | | | |
| For period beginning July 31, 2004, through July 31, 2014 | | Starting value | | | Ending value | |
Delaware Extended Duration Bond Fund — Class A shares | | | $9,550 | | | | $23,417 | |
Barclays Long U.S. Corporate Index | | | $10,000 | | | | $20,473 | |
1The “Performance of a $10,000 investment” graph assumes $10,000 invested in Class A shares of the Fund on July 31, 2004, and includes the effect of a 4.50% front-end sales charge and the reinvestment of all distributions. The graph does not reflect the deduction of taxes the shareholders would pay on Fund distributions or redemptions of Fund shares. Expense limitations were in effect for some or all of the periods shown. Performance would have been lower had expense limitations not been in effect. Expenses are listed in the “Fund expense ratios” table on page 10. Please note additional details on pages 8 through 11.
The graph also assumes $10,000 invested in the Barclays Long U.S. Corporate Index as of July 31, 2004. The Barclays Long U.S. Corporate Index is composed of U.S. dollar–denominated, investment grade, SEC-registered corporate bonds issued by industrial, utility, and financial companies. All bonds in the index have at least 10 years to maturity.
Index performance returns do not reflect any management fees, transaction costs, or expenses. Indices are unmanaged and one cannot invest directly in an index. Past performance is not a guarantee of future results.
Performance of other Fund classes will vary due to different charges and expenses.
| | | | | | | | |
| | | | | |
| | Nasdaq symbols | | | | CUSIPs | | |
Class A | | DEEAX | | | | 245908835 | | |
Class B | | DEEBX | | | | 245908827 | | |
Class C | | DEECX | | | | 245908819 | | |
Class R | | DEERX | | | | 245908728 | | |
Institutional Class | | DEEIX | | | | 245908793 | | |
11
Disclosure of Fund expenses
For the six-month period from February 1, 2014 to July 31, 2014 (Unaudited)
As a shareholder of a Fund, you incur two types of costs: (1) transaction costs, including sales charges (loads) on purchase payments, reinvested dividends, or other distributions; redemption fees; and exchange fees; and (2) ongoing costs, including management fees; distribution and/or service (12b-1) fees; and other Fund expenses. These following examples are intended to help you understand your ongoing costs (in dollars) of investing in a Fund and to compare these costs with the ongoing costs of investing in other mutual funds.
The examples are based on an investment of $1,000 invested at the beginning of the period and held for the entire six-month period from Feb. 1, 2014 to July 31, 2014.
Actual expenses
The first section of the tables shown, “Actual Fund return,” provides information about actual account values and actual expenses. You may use the information in this section of the table, together with the amount you invested, to estimate the expenses that you paid over the period. Simply divide your account value by $1,000 (for example, an $8,600 account value divided by $1,000 = 8.6), then multiply the result by the number in the first section under the heading entitled “Expenses Paid During Period” to estimate the expenses you paid on your account during this period.
Hypothetical example for comparison purposes
The second section of the tables shown, “Hypothetical 5% return,” provides information about hypothetical account values and hypothetical expenses based on the Funds’ actual expense ratios and an assumed rate of return of 5% per year before expenses, which is not the Funds’ actual return. The hypothetical account values and expenses may not be used to estimate the actual ending account balance or expenses you paid for the period. You may use this information to compare the ongoing costs of investing in each Fund and other funds. To do so, compare this 5% hypothetical example with the 5% hypothetical examples that appear in the shareholder reports of the other funds.
Please note that the expenses shown in the tables are meant to highlight your ongoing costs only and do not reflect any transactional costs, such as sales charges (loads), redemption fees, or exchange fees. Therefore, the second section of each table is useful in comparing ongoing costs only, and will not help you determine the relative total costs of owning different funds. In addition, if these transactional costs were included, your costs would have been higher. The Funds’ expenses shown in the tables reflect fee waivers in effect. The expenses shown in each table assume reinvestment of all dividends and distributions.
12
Delaware Corporate Bond Fund
Expense analysis of an investment of $1,000
| | | | | | | | |
| | | Beginning
Account Value
2/1/14 | | Ending
Account Value
7/31/14 | | Annualized
Expense Ratio | | Expenses
Paid During Period
2/1/14 to 7/31/14* |
Actual Fund return† | | | | | | | | |
Class A | | $1,000.00 | | $1,049.60 | | 0.94% | | $4.78 |
Class B** | | 1,000.00 | | 1,051.30 | | 0.94% | | 4.78 |
Class C | | 1,000.00 | | 1,045.70 | | 1.69% | | 8.57 |
Class R | | 1,000.00 | | 1,050.00 | | 1.19% | | 6.05 |
Institutional Class | | 1,000.00 | | 1,050.80 | | 0.69% | | 3.51 |
Hypothetical 5% return (5% return before expenses) | | | | |
Class A | | $1,000.00 | | $1,020.13 | | 0.94% | | $4.71 |
Class B** | | 1,000.00 | | 1,020.13 | | 0.94% | | 4.71 |
Class C | | 1,000.00 | | 1,016.41 | | 1.69% | | 8.45 |
Class R | | 1,000.00 | | 1,018.89 | | 1.19% | | 5.96 |
Institutional Class | | 1,000.00 | | 1,021.37 | | 0.69% | | 3.46 |
Delaware Extended Duration Bond Fund
Expense analysis of an investment of $1,000
| | | | | | | | |
| | | Beginning
Account Value
2/1/14 | | Ending
Account Value
7/31/14 | | Annualized
Expense Ratio | | Expenses
Paid During Period
2/1/14 to 7/31/14* |
Actual Fund return† | | | | | | | | |
Class A | | $1,000.00 | | $1,085.00 | | 0.96% | | $4.96 |
Class B** | | 1,000.00 | | 1,086.90 | | 0.96% | | 4.97 |
Class C | | 1,000.00 | | 1,082.70 | | 1.71% | | 8.83 |
Class R | | 1,000.00 | | 1,085.30 | | 1.21% | | 6.26 |
Institutional Class | | 1,000.00 | | 1,086.50 | | 0.71% | | 3.67 |
Hypothetical 5% return (5% return before expenses) | | | | |
Class A | | $1,000.00 | | $1,020.03 | | 0.96% | | $4.81 |
Class B** | | 1,000.00 | | 1,020.03 | | 0.96% | | 4.81 |
Class C | | 1,000.00 | | 1,016.31 | | 1.71% | | 8.55 |
Class R | | 1,000.00 | | 1,018.79 | | 1.21% | | 6.06 |
Institutional Class | | 1,000.00 | | 1,021.27 | | 0.71% | | 3.56 |
| * | “Expenses Paid During Period” are equal to the relevant Fund’s annualized expense ratio, multiplied by the average account value over the period, multiplied by 181/365 (to reflect the one-half year period). |
| ** | See Note 14 in “Notes to financial statements.” |
| † | Because actual returns reflect only the most recent six-month period, the returns shown may differ significantly from fiscal year returns. |
13
Security type / sector allocations
| | | | |
Delaware Corporate Bond Fund | | | As of July 31, 2014 (Unaudited) | |
Sector designations may be different than the sector designations presented in other fund materials. The sector designations may represent the investment manager’s internal sector classifications, which may result in the sector designations for one fund being different than another fund’s sector designations.
| | | | |
| Security type / sector | | Percentage of net assets | |
Collateralized Debt Obligations | | | 3.50% | |
Convertible Bonds | | | 0.48% | |
Corporate Bonds | | | 84.92% | |
Banking | | | 14.89% | |
Basic Industry | | | 7.25% | |
Brokerage | | | 2.15% | |
Capital Goods | | | 1.66% | |
Communications. | | | 11.40% | |
Consumer Cyclical | | | 6.01% | |
Consumer Non-Cyclical | | | 2.39% | |
Electric | | | 11.49% | |
Energy | | | 6.80% | |
Finance Companies. | | | 1.97% | |
Insurance | | | 4.15% | |
Natural Gas | | | 6.76% | |
Real Estate Investment Trusts | | | 2.54% | |
Technology | | | 5.02% | |
Transportation | | | 0.44% | |
Municipal Bonds | | | 1.41% | |
Senior Secured Loans | | | 2.58% | |
U.S. Treasury Obligations | | | 0.02% | |
Convertible Preferred Stock | | | 2.42% | |
Preferred Stock | | | 2.74% | |
Options Purchased | | | 0.63% | |
Short-Term Investments | | | 1.45% | |
Total Value of Securities | | | 100.15% | |
Options Written | | | (0.15%) | |
Receivables and Other Assets Net of Liabilities | | | 0.00% | |
Total Net Assets | | | 100.00% | |
14
Security type / sector allocations
| | | | |
Delaware Extended Duration Bond Fund | | | As of July 31, 2014 (Unaudited) | |
Sector designations may be different than the sector designations presented in other fund materials. The sector designations may represent the investment manager’s internal sector classifications, which may result in the sector designations for one fund being different than another fund’s sector designations.
| | | | |
| Security type / sector | | Percentage of net assets | |
Collateralized Debt Obligations | | | 2.37% | |
Convertible Bonds | | | 0.34% | |
Corporate Bonds | | | 82.62% | |
Banking | | | 9.60% | |
Basic Industry | | | 6.90% | |
Brokerage | | | 1.65% | |
Capital Goods | | | 2.42% | |
Communications. | | | 13.64% | |
Consumer Cyclical | | | 2.75% | |
Consumer Non-Cyclical | | | 4.93% | |
Electric | | | 14.85% | |
Energy | | | 4.83% | |
Finance Companies. | | | 2.69% | |
Insurance | | | 6.37% | |
Natural Gas | | | 7.19% | |
Technology | | | 3.56% | |
Transportation | | | 1.24% | |
Municipal Bonds | | | 3.39% | |
Senior Secured Loans | | | 3.41% | |
U.S. Treasury Obligation | | | 0.21% | |
Convertible Preferred Stock | | | 2.33% | |
Preferred Stock | | | 3.07% | |
Options Purchased | | | 0.30% | |
Short-Term Investments | | | 1.34% | |
Total Value of Securities | | | 99.38% | |
Receivables and Other Assets Net of Liabilities | | | 0.62% | |
Total Net Assets | | | 100.00% | |
15
Schedules of investments
| | | | |
Delaware Corporate Bond Fund | | | July 31, 2014 | |
| | | | | | | | |
| | | Principal amount° | | | Value (U.S. $) | |
| |
Collateralized Debt Obligations – 3.50% | | | | | | | | |
| |
Benefit Street Partners CLO | | | | | | | | |
Series 2014-IVA A2A 144A 2.23% 7/20/26 #— | | | 7,500,000 | | | $ | 7,387,500 | |
Canyon Capital CLO | | | | | | | | |
Series 2014-1A A2 144A 1.975% 4/30/25 #— | | | 10,000,000 | | | | 9,741,000 | |
Mountain Hawk III CLO | | | | | | | | |
Series 2014-3A B 144A 2.334% 4/18/25 #— | | | 3,250,000 | | | | 3,233,750 | |
Neuberger Berman CLO | | | | | | | | |
Series 2012-12AR BR 144A 2.334% 7/25/23 #— | | | 10,000,000 | | | | 10,000,000 | |
Series 2014-17A B XVII 144A 2.331% 8/4/25 #— | | | 5,000,000 | | | | 5,000,000 | |
Seneca Park CLO | | | | | | | | |
Series 2014-1A B1 144A 2.174% 7/17/26 #— | | | 7,500,000 | | | | 7,455,000 | |
| | | | | | | | |
Total Collateralized Debt Obligations (cost $42,678,598) | | | | | | | 42,817,250 | |
| | | | | | | | |
|
| |
Convertible Bonds – 0.48% | | | | | | | | |
| |
Owens-Brockway Glass Container 144A 3.00% exercise price $47.47, expiration date 5/28/15 # | | | 3,172,000 | | | | 3,245,353 | |
Salix Pharmaceuticals 1.50% exercise price $65.81,expiration date 3/15/19 | | | 1,266,000 | | | | 2,622,203 | |
| | | | | | | | |
Total Convertible Bonds (cost $4,831,595) | | | | | | | 5,867,556 | |
| | | | | | | | |
|
| |
Corporate Bonds – 84.92% | | | | | | | | |
| |
Banking – 14.89% | | | | | | | | |
Bank of America 4.00% 4/1/24 | | | 6,915,000 | | | | 7,025,059 | |
Barclays Bank 7.625% 11/21/22 | | | 7,700,000 | | | | 8,705,813 | |
BBVA Bancomer 144A 7.25% 4/22/20 # | | | 5,835,000 | | | | 6,717,252 | |
Capital One 2.95% 7/23/21 | | | 3,515,000 | | | | 3,481,319 | |
Citigroup 4.00% 8/5/24 | | | 5,885,000 | | | | 5,793,930 | |
Credit Suisse 144A 6.50% 8/8/23 # | | | 6,235,000 | | | | 6,905,263 | |
Credit Suisse Group | | | | | | | | |
144A 6.25% 12/29/49 #— | | | 1,500,000 | | | | 1,506,600 | |
144A 7.50% 12/31/49 #— | | | 3,120,000 | | | | 3,432,000 | |
Export-Import Bank of China
144A 2.50% 7/31/19 # | | | 4,400,000 | | | | 4,367,792 | |
144A 3.625% 7/31/24 # | | | 4,580,000 | | | | 4,540,159 | |
Goldman Sachs Group 3.85% 7/8/24 | | | 2,245,000 | | | | 2,237,423 | |
HBOS 144A 6.75% 5/21/18 # | | | 4,540,000 | | | | 5,197,515 | |
ING Bank 144A 5.80% 9/25/23 # | | | 8,470,000 | | | | 9,468,096 | |
JPMorgan Chase 6.75% 8/29/49 — | | | 8,866,000 | | | | 9,508,785 | |
Lloyds Banking Group 7.50% 4/30/49 — | | | 7,070,000 | | | | 7,441,175 | |
Morgan Stanley 5.00% 11/24/25 | | | 11,470,000 | | | | 12,233,959 | |
Oversea-Chinese Banking 144A 4.00% 10/15/24 #— | | | 4,420,000 | | | | 4,479,847 | |
PNC Financial Services Group 3.90% 4/29/24 | | | 2,060,000 | | | | 2,086,265 | |
PNC Preferred Funding Trust II 144A 1.453% 3/29/49 #— | | | 7,100,000 | | | | 7,011,250 | |
16
| | | | | | | | |
| | | Principal amount° | | | Value (U.S. $) | |
| |
Corporate Bonds (continued) | | | | | | | | |
| |
Banking (continued) | | | | | | | | |
Popular 7.00% 7/1/19 | | | 2,345,000 | | | $ | 2,369,623 | |
Rabobank 4.625% 12/1/23 | | | 6,475,000 | | | | 6,786,473 | |
Royal Bank of Scotland Group 5.125% 5/28/24 | | | 4,900,000 | | | | 4,908,614 | |
Santander UK 144A 5.00% 11/7/23 # | | | 12,415,000 | | | | 13,354,170 | |
SVB Financial Group 5.375% 9/15/20 | | | 3,785,000 | | | | 4,258,583 | |
UBS 7.625% 8/17/22 | | | 7,555,000 | | | | 8,996,396 | |
USB Capital IX 3.50% 10/29/49 — | | | 3,207,000 | | | | 2,766,038 | |
USB Realty 144A 1.381% 12/22/49 #— | | | 400,000 | | | | 370,000 | |
Wells Fargo 5.90% 12/29/49 — | | | 8,260,000 | | | | 8,648,220 | |
Woori Bank 144A 4.75% 4/30/24 # | | | 6,675,000 | | | | 6,760,734 | |
Zions Bancorp | | | | | | | | |
4.50% 3/27/17 | | | 2,400,000 | | | | 2,548,690 | |
4.50% 6/13/23 | | | 4,695,000 | | | | 4,839,752 | |
7.75% 9/23/14 | | | 3,646,000 | | | | 3,682,300 | |
| | | | | | | | |
| | | | | | | 182,429,095 | |
| | | | | | | | |
Basic Industry – 7.25% | | | | | | | | |
ArcelorMittal 10.35% 6/1/19 | | | 3,390,000 | | | | 4,237,500 | |
CF Industries | | | | | | | | |
5.15% 3/15/34 | | | 1,700,000 | | | | 1,809,167 | |
6.875% 5/1/18 | | | 9,165,000 | | | | 10,690,221 | |
7.125% 5/1/20 | | | 4,200,000 | | | | 5,107,733 | |
Dow Chemical 8.55% 5/15/19 | | | 4,420,000 | | | | 5,634,921 | |
FMG Resources August 2006 144A 6.875% 4/1/22 # | | | 5,360,000 | | | | 5,721,800 | |
Georgia-Pacific 8.00% 1/15/24 | | | 8,345,000 | | | | 11,229,816 | |
International Paper 3.65% 6/15/24 | | | 6,185,000 | | | | 6,118,555 | |
Lubrizol 8.875% 2/1/19 | | | 2,765,000 | | | | 3,522,168 | |
Monsanto 4.40% 7/15/44 | | | 12,090,000 | | | | 12,115,316 | |
Mosaic 5.625% 11/15/43 | | | 7,995,000 | | | | 9,023,013 | |
Sappi Papier Holding 144A 6.625% 4/15/21 # | | | 6,110,000 | | | | 6,491,875 | |
TPC Group 144A 8.75% 12/15/20 # | | | 3,270,000 | | | | 3,588,825 | |
Yamana Gold 144A 4.95% 7/15/24 # | | | 3,505,000 | | | | 3,512,655 | |
| | | | | | | | |
| | | | | | | 88,803,565 | |
| | | | | | | | |
Brokerage – 2.15% | | | | | | | | |
Jefferies Group | | | | | | | | |
5.125% 1/20/23 | | | 1,570,000 | | | | 1,678,109 | |
6.45% 6/8/27 | | | 5,627,000 | | | | 6,365,825 | |
6.50% 1/20/43 | | | 1,575,000 | | | | 1,781,123 | |
Lazard Group | | | | | | | | |
4.25% 11/14/20 | | | 2,340,000 | | | | 2,447,188 | |
6.85% 6/15/17 | | | 8,495,000 | | | | 9,652,911 | |
Nuveen Investments 144A 9.50% 10/15/20 # | | | 3,765,000 | | | | 4,414,463 | |
| | | | | | | | |
| | | | | | | 26,339,619 | |
| | | | | | | | |
17
Schedules of investments
Delaware Corporate Bond Fund
| | | | | | | | |
| | | Principal amount° | | | Value (U.S. $) | |
| |
Corporate Bonds (continued) | | | | | | | | |
| |
Capital Goods – 1.66% | | | | | | | | |
Algeco Scotsman Global Finance 144A 10.75% 10/15/19 # | | | 10,305,000 | | | $ | 10,305,000 | |
Cemex 144A 9.50% 6/15/18 # | | | 4,120,000 | | | | 4,614,400 | |
Cemex Finance 144A 6.00% 4/1/24 # | | | 1,375,000 | | | | 1,378,437 | |
Votorantim Cimentos 144A 7.25% 4/5/41 # | | | 3,840,000 | | | | 4,017,600 | |
| | | | | | | | |
| | | | | | | 20,315,437 | |
| | | | | | | | |
Communications – 11.40% | | | | | | | | |
Altice 144A 7.75% 5/15/22 # | | | 1,635,000 | | | | 1,675,875 | |
AT&T 4.80% 6/15/44 | | | 9,125,000 | | | | 9,281,804 | |
Bharti Airtel International Netherlands 144A
5.35% 5/20/24 # | | | 5,855,000 | | | | 6,159,928 | |
Clear Channel Communications PIK 14.00% 2/1/21 | | | 2,405,000 | | | | 2,405,000 | |
Crown Castle Towers 144A 4.883% 8/15/20 # | | | 3,500,000 | | | | 3,876,950 | |
DIRECTV Holdings | | | | | | | | |
4.45% 4/1/24 | | | 6,000,000 | | | | 6,297,078 | |
5.15% 3/15/42 | | | 310,000 | | | | 321,069 | |
DISH DBS 5.875% 7/15/22 | | | 1,315,000 | | | | 1,377,463 | |
ENTEL Chile 144A 4.875% 10/30/24 # | | | 5,550,000 | | | | 5,583,894 | |
Grupo Televisa 5.00% 5/13/45 | | | 6,870,000 | | | | 6,875,221 | |
Historic TW 6.875% 6/15/18 | | | 5,285,000 | | | | 6,241,574 | |
Intelsat Luxembourg | | | | | | | | |
7.75% 6/1/21 | | | 5,290,000 | | | | 5,428,863 | |
8.125% 6/1/23 | | | 2,275,000 | | | | 2,374,531 | |
Numericable Group 144A 6.25% 5/15/24 # | | | 1,175,000 | | | | 1,182,344 | |
SBA Tower Trust 144A 2.24% 4/16/18 # | | | 4,945,000 | | | | 4,899,993 | |
SES 144A 3.60% 4/4/23 # | | | 8,955,000 | | | | 9,022,351 | |
SES Global Americas Holdings 144A 5.30% 3/25/44 # | | | 7,815,000 | | | | 8,304,289 | |
Sinclair Television Group 144A 5.625% 8/1/24 # | | | 3,070,000 | | | | 3,043,137 | |
Sprint 144A 7.25% 9/15/21 # | | | 6,895,000 | | | | 7,369,031 | |
Telefonica Emisiones 4.57% 4/27/23 | | | 11,245,000 | | | | 11,898,728 | |
Time Warner 4.65% 6/1/44 | | | 5,225,000 | | | | 5,103,446 | |
Time Warner Cable 8.25% 4/1/19 | | | 5,121,000 | | | | 6,438,946 | |
Verizon Communications | | | | | | | | |
5.15% 9/15/23 | | | 14,110,000 | | | | 15,643,926 | |
6.40% 9/15/33 | | | 2,300,000 | | | | 2,860,496 | |
6.55% 9/15/43 | | | 1,075,000 | | | | 1,354,974 | |
Viacom 5.25% 4/1/44 | | | 4,390,000 | | | | 4,621,779 | |
| | | | | | | | |
| | | | | | | 139,642,690 | |
| | | | | | | | |
Consumer Cyclical – 6.01% | | | | | | | | |
Bed Bath & Beyond | | | | | | | | |
4.915% 8/1/34 | | | 4,105,000 | | | | 4,150,073 | |
5.165% 8/1/44 | | | 3,475,000 | | | | 3,473,735 | |
eBay 3.45% 8/1/24 | | | 6,505,000 | | | | 6,444,686 | |
18
| | | | | | | | |
| | | Principal amount° | | | Value (U.S. $) | |
| |
Corporate Bonds (continued) | | | | | | | | |
| |
Consumer Cyclical (continued) | | | | | | | | |
General Motors 6.25% 10/2/43 | | | 4,300,000 | | | $ | 4,891,250 | |
Host Hotels & Resorts | | | | | | | | |
3.75% 10/15/23 | | | 9,670,000 | | | | 9,568,707 | |
4.75% 3/1/23 | | | 3,825,000 | | | | 4,062,314 | |
5.875% 6/15/19 | | | 2,055,000 | | | | 2,195,893 | |
International Game Technology 5.35% 10/15/23 | | | 6,340,000 | | | | 6,576,539 | |
QVC 4.375% 3/15/23 | | | 6,645,000 | | | | 6,689,316 | |
Signet UK Finance 4.70% 6/15/24 | | | 3,995,000 | | | | 4,063,694 | |
Target | | | | | | | | |
2.30% 6/26/19 | | | 2,445,000 | | | | 2,457,208 | |
3.50% 7/1/24 | | | 2,845,000 | | | | 2,861,279 | |
TRW Automotive 144A 4.45% 12/1/23 # | | | 8,846,000 | | | | 9,022,920 | |
Tupy Overseas 144A 6.625% 7/17/24 # | | | 1,455,000 | | | | 1,498,650 | |
Volkswagen Group of America Finance 144A | | | | | | | | |
2.125% 5/23/19 # | | | 5,700,000 | | | | 5,667,271 | |
| | | | | | | | |
| | | | | | | 73,623,535 | |
| | | | | | | | |
Consumer Non-Cyclical – 2.39% | | | | | | | | |
Actavis Funding 144A 3.85% 6/15/24 # | | | 10,910,000 | | | | 10,908,756 | |
BRF 144A 4.75% 5/22/24 # | | | 3,365,000 | | | | 3,305,103 | |
Forest Laboratories 144A 4.375% 2/1/19 # | | | 845,000 | | | | 907,107 | |
JBS Investments 144A 7.75% 10/28/20 # | | | 5,285,000 | | | | 5,694,587 | |
Kimberly-Clark de Mexico 144A 3.80% 4/8/24 # | | | 5,820,000 | | | | 5,913,353 | |
Perrigo 144A 5.30% 11/15/43 # | | | 2,350,000 | | | | 2,521,719 | |
| | | | | | | | |
| | | | | | | 29,250,625 | |
| | | | | | | | |
Electric – 11.49% | | | | | | | | |
AES Gener 144A 8.375% 12/18/73 #— | | | 3,482,000 | | | | 3,920,732 | |
Ameren Illinois 9.75% 11/15/18 | | | 6,971,000 | | | | 9,110,902 | |
Cleveland Electric Illuminating 5.50% 8/15/24 | | | 2,025,000 | | | | 2,341,627 | |
ComEd Financing III 6.35% 3/15/33 | | | 7,500,000 | | | | 7,743,750 | |
El Paso Electric 3.30% 12/15/22 | | | 2,830,000 | | | | 2,733,104 | |
Electricite de France | | | | | | | | |
144A 4.60% 1/27/20 # | | | 1,905,000 | | | | 2,111,527 | |
144A 5.25% 12/29/49 #— | | | 12,090,000 | | | | 12,315,237 | |
Enel 144A 8.75% 9/24/73 #— | | | 4,125,000 | | | | 4,888,125 | |
Enel Finance International 144A 5.125% 10/7/19 # | | | 5,155,000 | | | | 5,772,579 | |
Entergy Louisiana 3.78% 4/1/25 | | | 7,220,000 | | | | 7,292,171 | |
Integrys Energy Group 6.11% 12/1/66 — | | | 8,599,000 | | | | 8,777,412 | |
ITC Holdings 3.65% 6/15/24 | | | 2,920,000 | | | | 2,910,034 | |
Korea East-West Power 144A 2.625% 11/27/18 # | | | 6,345,000 | | | | 6,401,464 | |
NextEra Energy Capital Holdings | | | | | | | | |
2.40% 9/15/19 | | | 4,900,000 | | | | 4,918,434 | |
3.625% 6/15/23 | | | 3,600,000 | | | | 3,625,434 | |
19
Schedules of investments
Delaware Corporate Bond Fund
| | | | | | | | |
| | | Principal amount° | | | Value (U.S. $) | |
| |
Corporate Bonds (continued) | | | | | | | | |
| |
Electric (continued) | | | | | | | | |
NV Energy 6.25% 11/15/20 | | | 4,475,000 | | | $ | 5,306,513 | |
Pennsylvania Electric 5.20% 4/1/20 | | | 16,291,000 | | | | 17,923,521 | |
Saudi Electricity Global Sukuk | | | | | | | | |
144A 4.00% 4/8/24 # | | | 3,494,000 | | | | 3,568,247 | |
144A 5.50% 4/8/44 # | | | 3,494,000 | | | | 3,668,700 | |
State Grid Overseas Investment 2014 | | | | | | | | |
144A 2.75% 5/7/19 # | | | 4,680,000 | | | | 4,701,126 | |
144A 4.125% 5/7/24 # | | | 6,535,000 | | | | 6,770,606 | |
Transelec 144A 4.25% 1/14/25 # | | | 3,345,000 | | | | 3,325,455 | |
Wisconsin Energy 6.25% 5/15/67 — | | | 10,359,000 | | | | 10,678,088 | |
| | | | | | | | |
| | | | | | | 140,804,788 | |
| | | | | | | | |
Energy – 6.80% | | | | | | | | |
Anadarko Petroleum | | | | | | | | |
3.45% 7/15/24 | | | 1,085,000 | | | | 1,076,753 | |
4.50% 7/15/44 | | | 3,540,000 | | | | 3,529,999 | |
Cimarex Energy 4.375% 6/1/24 | | | 3,990,000 | | | | 4,084,763 | |
CNOOC Nexen Finance 2014 4.25% 4/30/24 | | | 8,885,000 | | | | 9,111,976 | |
Continental Resources 4.50% 4/15/23 | | | 9,630,000 | | | | 10,277,136 | |
Ecopetrol 5.875% 5/28/45 | | | 3,315,000 | | | | 3,480,750 | |
Gazprom Neft 144A 4.375% 9/19/22 #@ | | | 3,945,000 | | | | 3,412,425 | |
Newfield Exploration 5.625% 7/1/24 | | | 6,150,000 | | | | 6,672,750 | |
Odebrecht Offshore Drilling Finance 144A | | | | | | | | |
6.625% 10/1/22 # | | | 5,542,785 | | | | 5,854,566 | |
Petrobras Global Finance | | | | | | | | |
4.875% 3/17/20 | | | 4,370,000 | | | | 4,463,081 | |
6.25% 3/17/24 | | | 4,370,000 | | | | 4,623,853 | |
Petroleos Mexicanos | | | | | | | | |
5.50% 6/27/44 | | | 2,486,000 | | | | 2,578,728 | |
144A 6.375% 1/23/45 # | | | 1,410,000 | | | | 1,625,025 | |
PTT Exploration & Production 144A 4.875% 12/29/49 #— | | | 5,845,000 | | | | 5,923,907 | |
Talisman Energy | | | | | | | | |
3.75% 2/1/21 | | | 7,340,000 | | | | 7,609,268 | |
5.50% 5/15/42 | | | 2,490,000 | | | | 2,704,446 | |
Woodside Finance 144A 8.75% 3/1/19 # | | | 5,000,000 | | | | 6,309,600 | |
| | | | | | | | |
| | | | | | | 83,339,026 | |
| | | | | | | | |
Finance Companies – 1.97% | | | | | | | | |
Blackstone Holdings Finance 144A 5.00% 6/15/44 # | | | 4,615,000 | | | | 4,852,566 | |
FS Investment 4.00% 7/15/19 | | | 6,290,000 | | | | 6,307,637 | |
GECC/LJ VP Holdings 144A 3.80% 6/18/19 # | | | 3,795,000 | | | | 4,053,652 | |
General Electric Capital 7.125% 12/29/49 — | | | 7,600,000 | | | | 8,905,710 | |
| | | | | | | | |
| | | | | | | 24,119,565 | |
| | | | | | | | |
20
| | | | | | | | |
| | | Principal amount° | | | Value (U.S. $) | |
Corporate Bonds (continued) | | | | | | | | |
Insurance – 4.15% | | | | | | | | |
Allstate 5.75% 8/15/53 — | | | 5,810,000 | | | $ | 6,260,275 | |
American International Group | | | | | | | | |
2.30% 7/16/19 | | | 3,200,000 | | | | 3,183,424 | |
8.175% 5/15/58 — | | | 4,755,000 | | | | 6,591,619 | |
8.25% 8/15/18 | | | 5,575,000 | | | | 6,865,412 | |
Five Corners Funding Trust 144A 4.419% 11/15/23 # | | | 9,200,000 | | | | 9,655,234 | |
Highmark | | | | | | | | |
144A 4.75% 5/15/21 # | | | 1,685,000 | | | | 1,713,596 | |
144A 6.125% 5/15/41 # | | | 920,000 | | | | 913,665 | |
Hockey Merger Sub 2 144A 7.875% 10/1/21 # | | | 4,540,000 | | | | 4,676,200 | |
ING U.S. 5.65% 5/15/53 — | | | 3,040,000 | | | | 3,108,400 | |
XL Group 6.50% 12/29/49 — | | | 8,032,000 | | | | 7,891,440 | |
| | | | | | | | |
| | | | | | | 50,859,265 | |
| | | | | | | | |
Natural Gas – 6.76% | | | | | | | | |
El Paso Pipeline Partners Operating 4.30% 5/1/24 | | | 6,655,000 | | | | 6,687,876 | |
Enbridge Energy Partners 8.05% 10/1/37 — | | | 6,190,000 | | | | 7,010,175 | |
Energy Transfer Partners | | | | | | | | |
5.15% 2/1/43 | | | 5,605,000 | | | | 5,648,971 | |
5.95% 10/1/43 | | | 6,790,000 | | | | 7,574,360 | |
EnLink Midstream Partners 4.40% 4/1/24 | | | 8,660,000 | | | | 9,070,337 | |
Enterprise Products Operating 7.034% 1/15/68 — | | | 4,525,000 | | | | 5,156,839 | |
EQT Midstream Partners 4.00% 8/1/24 | | | 8,055,000 | | | | 7,975,795 | |
GNL Quintero 144A 4.634% 7/31/29 # | | | 2,100,000 | | | | 2,123,325 | |
Kinder Morgan Energy Partners 9.00% 2/1/19 | | | 2,805,000 | | | | 3,564,838 | |
Korea Gas 144A 2.875% 7/29/18 # | | | 6,425,000 | | | | 6,591,607 | |
TransCanada Pipelines 6.35% 5/15/67 — | | | 8,512,000 | | | | 8,890,784 | |
Williams 4.55% 6/24/24 | | | 3,375,000 | | | | 3,369,256 | |
Williams Partners 7.25% 2/1/17 | | | 8,087,000 | | | | 9,187,034 | |
| | | | | | | | |
| | | | | | | 82,851,197 | |
| | | | | | | | |
Real Estate Investment Trusts – 2.54% | | | | | | | | |
Alexandria Real Estate Equities | | | | | | | | |
3.90% 6/15/23 | | | 1,085,000 | | | | 1,078,448 | |
4.50% 7/30/29 | | | 2,210,000 | | | | 2,231,130 | |
CBL & Associates 5.25% 12/1/23 | | | 3,400,000 | | | | 3,632,302 | |
Corporate Office Properties 5.25% 2/15/24 | | | 5,730,000 | | | | 6,129,003 | |
DDR | | | | | | | | |
7.50% 4/1/17 | | | 2,500,000 | | | | 2,867,310 | |
9.625% 3/15/16 | | | 1,415,000 | | | | 1,607,475 | |
Digital Realty Trust 5.875% 2/1/20 | | | 1,680,000 | | | | 1,870,448 | |
Healthcare Trust of America Holdings 3.375% 7/15/21 | | | 2,085,000 | | | | 2,074,815 | |
Trust F/1401 144A 5.25% 12/15/24 # | | | 6,105,000 | | | | 6,402,619 | |
21
Schedules of investments
Delaware Corporate Bond Fund
| | | | | | | | |
| | | Principal amount° | | | Value (U.S. $) | |
Corporate Bonds (continued) | | | | | | | | |
Real Estate Investment Trusts (continued) | | | | | | | | |
WP Carey 4.60% 4/1/24 | | | 3,120,000 | | | $ | 3,220,720 | |
| | | | | | | | |
| | | | | | | 31,114,270 | |
| | | | | | | | |
Technology – 5.02% | | | | | | | | |
Apple 3.45% 5/6/24 | | | 6,250,000 | | | | 6,300,881 | |
Baidu | | | | | | | | |
2.75% 6/9/19 | | | 2,900,000 | | | | 2,902,419 | |
3.25% 8/6/18 | | | 8,650,000 | | | | 8,923,478 | |
Broadcom | | | | | | | | |
3.50% 8/1/24 | | | 1,640,000 | | | | 1,630,957 | |
4.50% 8/1/34 | | | 3,470,000 | | | | 3,527,810 | |
CDW 6.00% 8/15/22 | | | 1,865,000 | | | | 1,865,000 | |
First Data 11.75% 8/15/21 | | | 3,291,250 | | | | 3,858,991 | |
First Data Holdings 144A PIK 14.50% 9/24/19 # | | | 310,061 | | | | 351,919 | |
National Semiconductor 6.60% 6/15/17 | | | 6,644,000 | | | | 7,638,261 | |
NetApp 3.25% 12/15/22 | | | 2,645,000 | | | | 2,552,406 | |
Oracle | | | | | | | | |
3.40% 7/8/24 | | | 7,910,000 | | | | 7,892,661 | |
4.50% 7/8/44 | | | 2,870,000 | | | | 2,899,443 | |
Seagate HDD Cayman 144A 4.75% 1/1/25 # | | | 7,090,000 | | | | 7,019,100 | |
Tencent Holdings 144A 3.375% 5/2/19 # | | | 4,085,000 | | | | 4,153,064 | |
| | | | | | | | |
| | | | | | | 61,516,390 | |
| | | | | | | | |
| | |
Transportation – 0.44% | | | | | | | | |
United Airlines 2014-1 Class A Pass Through Trust | | | | | | | | |
4.00% 4/11/26 ¿ | | | 1,560,000 | | | | 1,581,450 | |
United Airlines 2014-2 Class A Pass Through Trust | | | | | | | | |
3.75% 9/3/26 ¿ | | | 3,885,000 | | | | 3,883,912 | |
| | | | | | | | |
| | | | | | | 5,465,362 | |
| | | | | | | | |
Total Corporate Bonds (cost $1,002,789,517) | | | | | | | 1,040,474,429 | |
| | | | | | | | |
| | |
| | | | | | | | | |
Municipal Bonds – 1.41% | | | | | | | | |
California (Various Purposes) | | | | | | | | |
5.00% 4/1/43 | | | 6,520,000 | | | | 7,166,067 | |
Los Angeles, California Department of Water & Power Revenue (Taxable Build America Bond) | | | | | | | | |
6.574% 7/1/45 | | | 5,365,000 | | | | 7,540,507 | |
Texas Private Activity Bond Surface Transportation Senior Lien Revenue Bond | | | | | | | | |
(Senior Lien Note Mobility) 6.75% 6/30/43 (AMT) | | | 2,200,000 | | | | 2,620,838 | |
| | | | | | | | |
Total Municipal Bonds (cost $14,563,057) | | | | | | | 17,327,412 | |
| | | | | | | | |
22
| | | | | | | | |
| | | Principal amount° | | | Value (U.S. $) | |
Senior Secured Loans – 2.58%« | | | | | | | | |
BJ’s Wholesale Club 2nd Lien 8.50% 3/31/20 | | | 2,225,000 | | | $ | 2,260,462 | |
Caesars Growth Partners Tranche B 1st Lien | | | | | | | | |
6.25% 5/8/21 | | | 2,925,000 | | | | 2,918,603 | |
Clear Channel Communications Tranche B 3.65% 1/29/16 | | | 8,675,000 | | | | 8,611,005 | |
Drillships Financing Holding Tranche B1 6.00% 2/17/21 | | | 1,910,352 | | | | 1,929,455 | |
Houghton International 2nd Lien 9.50% 11/20/20 | | | 3,185,000 | | | | 3,248,700 | |
Nuveen Investments 2nd Lien 6.50% 2/28/19 | | | 6,835,000 | | | | 6,854,938 | |
Rite Aid 2nd Lien 5.75% 8/3/20 | | | 3,299,000 | | | | 3,368,279 | |
Samson Investment 2nd Lien 5.00% 9/25/18 | | | 2,470,000 | | | | 2,467,355 | |
| | | | | | | | |
Total Senior Secured Loans (cost $30,883,847) | | | | | | | 31,658,797 | |
| | | | | | | | |
| | |
| | | | | | | | | |
U.S. Treasury Obligations – 0.02% | | | | | | | | |
U.S. Treasury Bond | | | | | | | | |
3.375% 5/15/44 | | | 260,000 | | | | 263,169 | |
U.S. Treasury Note | | | | | | | | |
1.625% 6/30/19 | | | 30,000 | | | | 29,818 | |
| | | | | | | | |
Total U.S. Treasury Obligations (cost $292,656) | | | | | | | 292,987 | |
| | | | | | | | |
| | |
| | | Number of
shares | | | | |
Convertible Preferred Stock – 2.42% | | | | | | | | |
Chesapeake Energy 144A 5.75% exercise price $26.14,
expiration date 12/31/49 # | | | 8,155 | | | | 9,582,125 | |
Dominion Resources 6.375% exercise price $87.20, expiration date 7/1/17 | | | 117,600 | | | | 5,962,320 | |
Exelon 6.50% exercise price $43.75, expiration date 6/1/17 | | | 139,625 | | | | 6,855,587 | |
SandRidge Energy 7.00% exercise price $7.76, expiration date 12/31/49 | | | 70,500 | | | | 7,191,000 | |
| | | | | | | | |
Total Convertible Preferred Stock (cost $28,727,120) | | | | | | | 29,591,032 | |
| | | | | | | | |
| | |
| | | | | | | | | |
Preferred Stock – 2.74% | | | | | | | | |
Alabama Power 5.625% | | | 118,065 | | | | 2,897,315 | |
Ally Financial | | | | | | | | |
144A 7.00% # | | | 4,000 | | | | 4,000,000 | |
8.50% — | | | 80,000 | | | | 2,170,400 | |
DTE Energy 5.25% | | | 305,000 | | | | 7,216,300 | |
Entergy Arkansas 4.90% | | | 285,000 | | | | 6,535,050 | |
GMAC Capital Trust I 8.125% — | | | 50,000 | | | | 1,359,000 | |
Qwest 6.125% | | | 184,675 | | | | 4,339,863 | |
Regency Centers 6.625% | | | 22,363 | | | | 579,202 | |
Regions Financial | | | | | | | | |
6.375% — | | | 111,200 | | | | 2,830,040 | |
23
Schedules of investments
Delaware Corporate Bond Fund
| | | | | | | | |
| | | Number of
shares | | | Value (U.S. $) | |
Preferred Stock (continued) | | | | | | | | |
Regions Financial | | | | | | | | |
6.375% | | | 67,000 | | | $ | 1,659,590 | |
| | | | | | | | |
Total Preferred Stock (cost $33,238,756) | | | | | | | 33,586,760 | |
| | | | | | | | |
| | |
| | | Number of
contracts | | | | |
Options Purchased – 0.63% | | | | | | | | |
Put Swaptions – 0.63% | | | | | | | | |
Pay a fixed rate 1.06% and receive a floating rate based on 3-month LIBOR, expiration date 1/28/16 (GSC) | | | 600,000,000 | | | | 5,009,256 | |
Pay a fixed rate 2.10% and receive a floating rate based on 3-month LIBOR, expiration date 1/28/16 (GSC) | | | 50,000,000 | | | | 402,769 | |
Pay a fixed rate 2.47% and receive a floating rate based on 3-month LIBOR, expiration date 11/16/15 (BAML) | | | 9,300,000 | | | | 644,846 | |
Pay a fixed rate 2.97% and receive a floating rate based on 3-month LIBOR, expiration date 11/16/15 (BAML) | | | 9,300,000 | | | | 373,750 | |
Pay a fixed rate 3.84% and receive a floating rate based on 3-month LIBOR, expiration date 7/1/16 (BCLY) | | | 15,750,000 | | | | 366,284 | |
Pay a fixed rate 4.00% and receive a floating rate based on 3-month LIBOR, expiration date 5/23/17 (GSC) | | | 19,100,000 | | | | 614,660 | |
Pay a fixed rate 4.34% and receive a floating rate based on 3-month LIBOR, expiration date 7/1/16 (BCLY) | | | 15,750,000 | | | | 208,232 | |
Pay a fixed rate 4.78% and receive a floating rate based on 3-month LIBOR, expiration date 9/16/16 (GSC) | | | 13,050,000 | | | | 129,219 | |
| | | | | | | | |
Total Options Purchased (premium paid $10,652,318) | | | | | | | 7,749,016 | |
| | | | | | | | |
| | |
| | | Principal amount° | | | | |
Short-Term Investments – 1.45% | | | | | | | | |
Discount Notes – 0.34%≠ | | | | | | | | |
Federal Home Loan Bank | | | | | | | | |
0.05% 8/14/14 | | | 396,905 | | | | 396,902 | |
0.05% 8/15/14 | | | 449,196 | | | | 449,193 | |
0.06% 8/18/14 | | | 1,897,648 | | | | 1,897,631 | |
0.075% 11/19/14 | | | 1,420,067 | | | | 1,419,763 | |
| | | | | | | | |
| | | | | | | 4,163,489 | |
| | | | | | | | |
Repurchase Agreements – 1.11% | | | | | | | | |
Bank of America Merrill Lynch
0.04%, dated 7/31/14, to be repurchased on 8/1/14, repurchase price $4,234,540 (collateralized by U.S. government obligations 0.00%–0.375% 6/25/15–2/15/24; market value $4,319,227) | | | 4,234,535 | | | | 4,234,535 | |
24
| | | | | | | | |
| | | Principal amount° | | | Value (U.S. $ ) | |
Short-Term Investments (continued) | | | | | | | | |
Repurchase Agreements (continued) | | | | | | | | |
Bank of Montreal
0.07%, dated 7/31/14, to be repurchased on 8/1/14, repurchase price $1,411,514 (collateralized by U.S. government obligations 0.00%–4.375% 8/21/14–11/15/43; market value $1,439,742) | | | 1,411,511 | | | $ | 1,411,511 | |
BNP Paribas
0.07%, dated 7/31/14, to be repurchased on 8/1/14, repurchase price $7,921,969 (collateralized by U.S. government obligations 0.00%–2.75% 8/7/14–11/15/23; market value $8,080,393) | | | 7,921,954 | | | | 7,921,954 | |
| | | | | | | | |
| | | | | | | 13,568,000 | |
| | | | | | | | |
Total Short-Term Investments (cost $17,731,421) | | | | | | | 17,731,489 | |
| | | | | | | | |
| | |
Total Value of Securities – 100.15% | | | | | | | | |
(cost $1,186,388,885) | | | | | | $ | 1,227,096,728 | |
| | | | | | | | |
| | |
| | | Number of
contracts | | | | |
Options Written – (0.15%) | | | | | | | | |
Put Swaptions – (0.15%) | | | | | | | | |
Pay a fixed rate 3.07% and receive a floating rate based on 3-month LIBOR, expiration date 1/28/16 (GSC) | | | (600,000,000 | ) | | | (1,742,508 | ) |
Pay a fixed rate 3.10% and receive a floating rate based on 3-month LIBOR, expiration date 1/28/16 (GSC) | | | (50,000,000 | ) | | | (139,945 | ) |
| | | | | | | | |
Total Options Written (premium received $2,990,000) | | | | | | $ | (1,882,453 | ) |
| | | | | | | | |
| # | Security exempt from registration under Rule 144A of the Securities Act of 1933, as amended. At July 31, 2014, the aggregate value of Rule 144A securities was $407,433,587, which represents 33.25% of the Fund’s net assets. See Note 11 in “Notes to financial statements.” |
| @ | Illiquid security. At July 31, 2014, the aggregate value of illiquid securities was $3,412,425, which represents 0.28% of the Fund’s net assets. See Note 11 in “Notes to financial statements.” |
| ¿ | Pass Through Agreement. Security represents the contractual right to receive a proportionate amount of underlying payments due to the counterparty pursuant to various agreements related to the rescheduling of obligations and the exchange of certain notes. |
| 100% of the income received was in the form of both cash and par. |
| 100% of the income received was in the form of additional par. |
| ≠ | The rate shown is the effective yield at the time of purchase. |
| ° | Principal amount shown is stated in U.S. dollars unless noted that the security is denominated in another currency. |
25
Schedules of investments
Delaware Corporate Bond Fund
| — | Variable rate security. The rate shown is the rate as of July 31, 2014. Interest rates reset periodically. |
| « | Senior secured loans generally pay interest at rates which are periodically redetermined by reference to a base lending rate plus a premium. These base lending rates are generally: (i) the prime rate offered by one or more United States banks, (ii) the lending rate offered by one or more European banks such as the London Inter-Bank Offered Rate (LIBOR), and (iii) the certificate of deposit rate. Senior secured loans may be subject to restrictions on resale. Stated rate in effect at July 31, 2014. |
The following futures contracts were outstanding at July 31, 2014:1
Futures Contracts
| | | | | | | | | | | | | | |
Contracts to Buy (Sell) | | Notional
Cost
(Proceeds) | | | Notional
Value | | | Expiration
Date | | Unrealized
Appreciation
(Depreciation) | |
(57) U.S. Treasury 2 yr Notes | | $ | (12,530,933 | ) | | $ | (12,507,047 | ) | | 10/6/14 | | $ | 23,886 | |
(57) U.S. Treasury 5 yr Notes | | | (6,817,580 | ) | | | (6,773,649 | ) | | 10/6/14 | | | 43,931 | |
99 U.S. Treasury Long Bonds | | | 13,652,226 | | | | 13,603,219 | | | 9/22/14 | | | (49,007 | ) |
| | | | | | | | | | | | | | |
| | $ | (5,696,287 | ) | | | | | | | | $ | 18,810 | |
| | | | | | | | | | | | | | |
The use of futures contracts involves elements of market risk and risks in excess of the amounts disclosed in the financial statements. The notional values presented above represent the Fund’s total exposure in such contracts, whereas only the net unrealized appreciation (depreciation) is reflected in the Fund’s net assets.
1See Note 8 in “Notes to financial statements.”
Summary of abbreviations:
AMT – Subject to Alternative Minimum Tax
BAML – Bank of America Merrill Lynch
BCLY – Barclays Bank
CLO – Collateralized Loan Obligation
GSC – Goldman Sachs Capital
PIK – Pay-in-kind
See accompanying notes, which are an integral part of the financial statements.
26
| | | | |
| Schedules of investments | | | | |
| Delaware Extended Duration Bond Fund | | | July 31, 2014 | |
| | | | | | | | |
| | | Principal amount° | | | Value (U.S. $) | |
Collateralized Debt Obligations – 2.37% | | | | | | | | |
Benefit Street Partners CLO | | | | | | | | |
Series 2014-IVA A2A 144A 2.23% 7/20/26 #— | | | 2,500,000 | | | $ | 2,462,500 | |
Canyon Capital CLO | | | | | | | | |
Series 2014-1A A2 144A 1.975% 4/30/25 #— | | | 2,000,000 | | | | 1,948,200 | |
Mountain Hawk III CLO | | | | | | | | |
Series 2014-3A B 144A 2.334% 4/18/25 #— | | | 2,000,000 | | | | 1,990,000 | |
Neuberger Berman CLO | | | | | | | | |
Series 2012-12AR BR 144A 2.334% 7/25/23 #— | | | 5,000,000 | | | | 5,000,000 | |
Series 2014-17A B XVII 144A 2.331% 8/4/25 #— | | | 1,500,000 | | | | 1,500,000 | |
Seneca Park CLO | | | | | | | | |
Series 2014-1A B1 144A 2.174% 7/17/26 #— | | | 2,500,000 | | | | 2,485,000 | |
| | | | | | | | |
Total Collateralized Debt Obligations (cost $15,354,532) | | | | | | | 15,385,700 | |
| | | | | | | | |
| | | | | | | | |
Convertible Bonds – 0.34% | | | | | | | | |
Owens-Brockway Glass Container 144A 3.00% exercise
price $47.47, expiration date 5/28/15 # | | | 806,000 | | | | 824,639 | |
Salix Pharmaceuticals 1.50% exercise price $65.81,
expiration date 3/15/19 | | | 654,000 | | | | 1,354,597 | |
| | | | | | | | |
Total Convertible Bonds (cost $1,702,455) | | | | | | | 2,179,236 | |
| | | | | | | | |
| | | | | | | | |
Corporate Bonds – 82.62% | | | | | | | | |
Banking – 9.60% | | | | | | | | |
Barclays Bank 7.625% 11/21/22 | | | 3,800,000 | | | | 4,296,375 | |
BBVA Bancomer 144A 7.25% 4/22/20 # | | | 3,095,000 | | | | 3,562,964 | |
Citigroup 4.00% 8/5/24 | | | 2,595,000 | | | | 2,554,842 | |
Credit Suisse 144A 6.50% 8/8/23 # | | | 3,170,000 | | | | 3,510,775 | |
Credit Suisse Group 144A 7.50% 12/31/49 #— | | | 1,670,000 | | | | 1,837,000 | |
Goldman Sachs Group 4.80% 7/8/44 | | | 5,400,000 | | | | 5,402,338 | |
JPMorgan Chase 6.75% 8/29/49 — | | | 4,650,000 | | | | 4,987,125 | |
KeyBank 6.95% 2/1/28 | | | 2,467,000 | | | | 3,127,648 | |
Lloyds Banking Group 7.50% 4/30/49 — | | | 1,925,000 | | | | 2,026,063 | |
Morgan Stanley 5.00% 11/24/25 | | | 3,110,000 | | | | 3,317,141 | |
PNC Preferred Funding Trust II 144A 1.453% 3/29/49 #— | | | 3,900,000 | | | | 3,851,250 | |
Rabobank 5.75% 12/1/43 | | | 6,310,000 | | | | 7,250,815 | |
Royal Bank of Scotland Group 5.125% 5/28/24 | | | 3,865,000 | | | | 3,871,795 | |
UBS 7.625% 8/17/22 | | | 4,020,000 | | | | 4,786,964 | |
USB Capital IX 3.50% 10/29/49 — | | | 810,000 | | | | 698,625 | |
USB Realty 144A 1.381% 12/22/49 #— | | | 400,000 | | | | 370,000 | |
Wells Fargo 5.90% 12/29/49 — | | | 4,290,000 | | | | 4,491,630 | |
Woori Bank 144A 4.75% 4/30/24 # | | | 2,300,000 | | | | 2,329,541 | |
| | | | | | | | |
| | | | | | | 62,272,891 | |
| | | | | | | | |
Basic Industry – 6.90% | | | | | | | | |
ArcelorMittal 7.50% 10/15/39 | | | 4,880,000 | | | | 5,105,700 | |
27
| | |
| Schedules of investments | | |
| Delaware Extended Duration Bond Fund | | |
| | | | | | | | |
| | | Principal amount° | | | Value (U.S. $) | |
Corporate Bonds (continued) | | | | | | | | |
Basic Industry (continued) | | | | | | | | |
CF Industries 5.15% 3/15/34 | | | 6,010,000 | | | $ | 6,395,938 | |
CODELCO 144A 5.625% 10/18/43 # | | | 3,580,000 | | | | 3,975,150 | |
FMG Resources August 2006 144A 6.875% 4/1/22 # | | | 2,990,000 | | | | 3,191,825 | |
Georgia-Pacific 8.00% 1/15/24 | | | 3,280,000 | | | | 4,413,876 | |
International Paper 6.00% 11/15/41 | | | 1,570,000 | | | | 1,834,495 | |
Monsanto 4.40% 7/15/44 | | | 8,905,000 | | | | 8,923,647 | |
Mosaic 5.625% 11/15/43 | | | 4,180,000 | | | | 4,717,473 | |
Sappi Papier Holding 144A 6.625% 4/15/21 # | | | 4,055,000 | | | | 4,308,437 | |
TPC Group 144A 8.75% 12/15/20 # | | | 1,730,000 | | | | 1,898,675 | |
| | | | | | | | |
| | | | | | | 44,765,216 | |
| | | | | | | | |
Brokerage – 1.65% | | | | | | | | |
Jefferies Group | | | | | | | | |
6.45% 6/8/27 | | | 2,640,000 | | | | 2,986,632 | |
6.50% 1/20/43 | | | 1,985,000 | | | | 2,244,781 | |
Legg Mason 5.625% 1/15/44 | | | 5,000,000 | | | | 5,497,715 | |
| | | | | | | | |
| | | | | | | 10,729,128 | |
| | | | | | | | |
Capital Goods – 2.42% | | | | | | | | |
Algeco Scotsman Global Finance 144A 10.75% 10/15/19 # | | | 5,440,000 | | | | 5,440,000 | |
Cemex 144A 7.25% 1/15/21 # | | | 3,900,000 | | | | 4,143,750 | |
URS 5.00% 4/1/22 | | | 2,170,000 | | | | 2,208,800 | |
Votorantim Cimentos 144A 7.25% 4/5/41 # | | | 2,475,000 | | | | 2,589,469 | |
Waste Management 7.10% 8/1/26 | | | 1,025,000 | | | | 1,345,847 | |
| | | | | | | | |
| | | | | | | 15,727,866 | |
| | | | | | | | |
Communications – 13.64% | | | | | | | | |
Altice 144A 7.75% 5/15/22 # | | | 865,000 | | | | 886,625 | |
AT&T 4.80% 6/15/44 | | | 6,000,000 | | | | 6,103,104 | |
Bharti Airtel International Netherlands 144A | | | | | | | | |
5.35% 5/20/24 # | | | 3,060,000 | | | | 3,219,365 | |
Clear Channel Communications PIK 14. 00% 2/1/21 | | | 1,255,000 | | | | 1,255,000 | |
Deutsche Telekom International Finance 8.75% 6/15/30 | | | 1,335,000 | | | | 1,964,069 | |
DIRECTV Holdings | | | | | | | | |
4.45% 4/1/24 | | | 70,000 | | | | 73,466 | |
5.15% 3/15/42 | | | 5,560,000 | | | | 5,758,520 | |
Grupo Televisa 5.00% 5/13/45 | | | 3,785,000 | | | | 3,787,877 | |
Intelsat Luxembourg | | | | | | | | |
7.75% 6/1/21 | | | 2,245,000 | | | | 2,303,931 | |
8.125% 6/1/23 | | | 1,240,000 | | | | 1,294,250 | |
Numericable Group 144A 6.25% 5/15/24 # | | | 625,000 | | | | 628,906 | |
Qwest 6.875% 9/15/33 | | | 3,510,000 | | | | 3,558,276 | |
SES Global Americas Holdings 144A 5.30% 3/25/44 # | | | 7,775,000 | | | | 8,261,785 | |
Sinclair Television Group 144A 5.625% 8/1/24 # | | | 1,595,000 | | | | 1,581,044 | |
Sprint 144A 7.25% 9/15/21 # | | | 2,810,000 | | | | 3,003,187 | |
28
| | | | | | | | |
| | | Principal amount° | | | Value (U.S. $) | |
Corporate Bonds (continued) | | | | | | | | |
Communications (continued) | | | | | | | | |
Telefonica Emisiones 7.045% 6/20/36 | | | 5,585,000 | | | $ | 7,113,436 | |
Time Warner 4.65% 6/1/44 | | | 6,115,000 | | | | 5,972,741 | |
Time Warner Cable 4.50% 9/15/42 | | | 3,730,000 | | | | 3,638,540 | |
Verizon Communications | | | | | | | | |
6.40% 9/15/33 | | | 4,275,000 | | | | 5,316,792 | |
6.55% 9/15/43 | | | 9,320,000 | | | | 11,747,310 | |
Viacom 5.25% 4/1/44 | | | 3,700,000 | | | | 3,895,349 | |
WPP Finance 2010 5.625% 11/15/43 | | | 6,550,000 | | | | 7,157,126 | |
| | | | | | | | |
| | | | | | | 88,520,699 | |
| | | | | | | | |
Consumer Cyclical – 2.75% | | | | | | | | |
Alfa 144A 6.875% 3/25/44 # | | | 2,800,000 | | | | 3,045,000 | |
Bed Bath & Beyond | | | | | | | | |
4.915% 8/1/34 | | | 2,030,000 | | | | 2,052,289 | |
5.165% 8/1/44 | | | 3,950,000 | | | | 3,948,562 | |
General Motors 6.25% 10/2/43 | | | 4,200,000 | | | | 4,777,500 | |
QVC 5.95% 3/15/43 | | | 3,000,000 | | | | 3,230,997 | |
Tupy Overseas 144A 6.625% 7/17/24 # | | | 760,000 | | | | 782,800 | |
| | | | | | | | |
| | | | | | | 17,837,148 | |
| | | | | | | | |
Consumer Non-Cyclical – 4.93% | | | | | | | | |
Actavis Funding 144A 4.85% 6/15/44 # | | | 7,000,000 | | | | 6,991,943 | |
BRF 144A 4.75% 5/22/24 # | | | 1,860,000 | | | | 1,826,892 | |
Celgene | | | | | | | | |
4.625% 5/15/44 | | | 2,000,000 | | | | 1,999,216 | |
5.25% 8/15/43 | | | 2,565,000 | | | | 2,812,235 | |
Gilead Sciences 4.80% 4/1/44 | | | 3,020,000 | | | | 3,229,020 | |
Hasbro 5.10% 5/15/44 | | | 7,500,000 | | | | 7,794,525 | |
JBS Investments 144A 7.75% 10/28/20 # | | | 2,805,000 | | | | 3,022,387 | |
Perrigo 144A 5.30% 11/15/43 # | | | 4,015,000 | | | | 4,308,384 | |
| | | | | | | | |
| | | | | | | 31,984,602 | |
| | | | | | | | |
Electric – 14.85% | | | | | | | | |
AES Gener 144A 8.375% 12/18/73 #— | | | 1,877,000 | | | | 2,113,502 | |
Ameren Illinois 4.30% 7/1/44 | | | 5,760,000 | | | | 5,811,189 | |
ComEd Financing III 6.35% 3/15/33 | | | 4,800,000 | | | | 4,956,000 | |
El Paso Electric 3.30% 12/15/22 | | | 1,695,000 | | | | 1,636,965 | |
Electricite de France 144A 5.25% 12/29/49 #— | | | 7,350,000 | | | | 7,486,931 | |
Enel 144A 8.75% 9/24/73 #— | | | 1,485,000 | | | | 1,759,725 | |
Enel Finance International 144A 6.00% 10/7/39 # | | | 4,800,000 | | | | 5,492,424 | |
Exelon Generation 5.60% 6/15/42 | | | 2,685,000 | | | | 2,922,623 | |
Integrys Energy Group 6.11% 12/1/66 — | | | 4,660,000 | | | | 4,756,686 | |
Kansas Gas & Electric 144A 4.30% 7/15/44 # | | | 4,365,000 | | | | 4,418,598 | |
Monongahela Power 144A 5.40% 12/15/43 # | | | 8,390,000 | | | | 9,723,658 | |
Oglethorpe Power 4.55% 6/1/44 | | | 2,600,000 | | | | 2,635,261 | |
29
| | |
| Schedules of investments | | |
| Delaware Extended Duration Bond Fund | | |
| | | | | | | | |
| | | Principal amount° | | | Value (U.S. $) | |
Corporate Bonds (continued) | | | | | | | | |
Electric (continued) | | | | | | | | |
Oncor Electric Delivery 4.55% 12/1/41 | | | 5,500,000 | | | $ | 5,878,757 | |
Puget Sound Energy 4.434% 11/15/41 | | | 4,870,000 | | | | 5,113,096 | |
Saudi Electricity Global Sukuk 144A 5.06% 4/8/43 # | | | 5,900,000 | | | | 5,874,158 | |
South Carolina Electric & Gas 4.50% 6/1/64 | | | 12,600,000 | | | | 12,732,502 | |
State Grid Overseas Investment 2014 144A
4.125% 5/7/24 # | | | 5,755,000 | | | | 5,962,485 | |
Transelec 144A 4.25% 1/14/25 # | | | 1,730,000 | | | | 1,719,892 | |
Wisconsin Energy 6.25% 5/15/67 — | | | 5,245,000 | | | | 5,406,562 | |
| | | | | | | | |
| | | | | | | 96,401,014 | |
| | | | | | | | |
Energy – 4.83% | | | | | | | | |
Anadarko Petroleum 4.50% 7/15/44 | | | 5,300,000 | | | | 5,285,027 | |
CNOOC Nexen Finance 2014 4.25% 4/30/24 | | | 4,625,000 | | | | 4,743,150 | |
Ecopetrol 5.875% 5/28/45 | | | 1,745,000 | | | | 1,832,250 | |
ENI 144A 5.70% 10/1/40 # | | | 3,450,000 | | | | 3,922,419 | |
Gazprom Neft 144A 4.375% 9/19/22 #@ | | | 2,080,000 | | | | 1,799,200 | |
Odebrecht Offshore Drilling Finance 144A | | | | | | | | |
6.625% 10/1/22 # | | | 2,862,866 | | | | 3,023,902 | |
Petroleos Mexicanos 144A 6.375% 1/23/45 # | | | 3,140,000 | | | | 3,618,850 | |
Talisman Energy 5.50% 5/15/42 | | | 6,545,000 | | | | 7,108,675 | |
| | | | | | | | |
| | | | | | | 31,333,473 | |
| | | | | | | | |
Finance Companies – 2.69% | | | | | | | | |
Blackstone Holdings Finance 144A 5.00% 6/15/44 # | | | 2,430,000 | | | | 2,555,089 | |
Carlyle Holdings II Finance 144A 5.625% 3/30/43 # | | | 3,790,000 | | | | 4,317,678 | |
General Electric Capital 7.125% 12/29/49 — | | | 4,000,000 | | | | 4,687,216 | |
KKR Group Finance III 144A 5.125% 6/1/44 # | | | 5,685,000 | | | | 5,903,270 | |
| | | | | | | | |
| | | | | | | 17,463,253 | |
| | | | | | | | |
Insurance – 6.37% | | | | | | | | |
Allstate 5.75% 8/15/53 — | | | 2,960,000 | | | | 3,189,400 | |
American International Group | | | | | | | | |
4.50% 7/16/44 | | | 6,550,000 | | | | 6,499,722 | |
8.175% 5/15/58 — | | | 2,910,000 | | | | 4,033,987 | |
Highmark 144A 6.125% 5/15/41 # | | | 3,410,000 | | | | 3,386,519 | |
Hockey Merger Sub 2 144A 7.875% 10/1/21 # | | | 2,410,000 | | | | 2,482,300 | |
ING U.S. 5.65% 5/15/53 — | | | 1,400,000 | | | | 1,431,500 | |
Liberty Mutual Group 144A 4.85% 8/1/44 # | | | 5,985,000 | | | | 5,971,653 | |
MetLife Capital Trust IV 144A 7.875% 12/15/37 # | | | 900,000 | | | | 1,143,000 | |
Nationwide Mutual Insurance 144A 4.95% 4/22/44 # | | | 3,200,000 | | | | 3,252,973 | |
Transatlantic Holdings 8.00% 11/30/39 | | | 704,000 | | | | 982,562 | |
Trinity Acquisition 6.125% 8/15/43 | | | 4,570,000 | | | | 5,076,585 | |
XL Group 6.50% 12/29/49 — | | | 3,950,000 | | | | 3,880,875 | |
| | | | | | | | |
| | | | | | | 41,331,076 | |
| | | | | | | | |
30
| | | | | | | | |
| | | Principal amount° | | | Value (U.S. $) | |
Corporate Bonds (continued) | | | | | | | | |
Natural Gas – 7.19% | | | | | | | | |
El Paso Pipeline Partners Operating 7.50% 11/15/40 | | | 3,065,000 | | | $ | 3,997,790 | |
Enable Midstream Partners 144A 5.00% 5/15/44 # | | | 5,675,000 | | | | 5,703,630 | |
Enbridge Energy Partners 8.05% 10/1/37 — | | | 4,350,000 | | | | 4,926,375 | |
Energy Transfer Partners | | | | | | | | |
5.15% 2/1/43 | | | 705,000 | | | | 710,531 | |
5.95% 10/1/43 | | | 6,665,000 | | | | 7,434,921 | |
EnLink Midstream Partners 5.60% 4/1/44 | | | 7,175,000 | | | | 7,970,987 | |
Enterprise Products Operating 7.034% 1/15/68 — | | | 2,830,000 | | | | 3,225,161 | |
EQT Midstream Partners 4.00% 8/1/24 | | | 4,240,000 | | | | 4,198,308 | |
GNL Quintero 144A 4.634% 7/31/29 # | | | 1,100,000 | | | | 1,112,218 | |
Kinder Morgan Energy Partners 5.50% 3/1/44 | | | 3,520,000 | | | | 3,649,205 | |
TransCanada Pipelines 6.35% 5/15/67 — | | | 3,600,000 | | | | 3,760,200 | |
| | | | | | | | |
| | | | | | | 46,689,326 | |
| | | | | | | | |
Technology – 3.56% | | | | | | | | |
Apple 3.85% 5/4/43 | | | 4,500,000 | | | | 4,155,552 | |
Broadcom | | | | | | | | |
3.50% 8/1/24 | | | 865,000 | | | | 860,230 | |
4.50% 8/1/34 | | | 1,830,000 | | | | 1,860,488 | |
CDW 6.00% 8/15/22 | | | 990,000 | | | | 990,000 | |
First Data 11.75% 8/15/21 | | | 1,893,750 | | | | 2,220,422 | |
First Data Holdings 144A PIK 14.50% 9/24/19 # | | | 162,428 | | | | 184,356 | |
Oracle 4.50% 7/8/44 | | | 8,860,000 | | | | 8,950,895 | |
Seagate HDD Cayman 144A 4.75% 1/1/25 # | | | 3,910,000 | | | | 3,870,900 | |
| | | | | | | | |
| | | | | | | 23,092,843 | |
| | | | | | | | |
Transportation – 1.24% | | | | | | | | |
ERAC USA Finance 144A 5.625% 3/15/42 # | | | 7,085,000 | | | | 8,073,719 | |
| | | | | | | | |
| | | | | | | 8,073,719 | |
| | | | | | | | |
Total Corporate Bonds (cost $510,205,642) | | | | | | | 536,222,254 | |
| | | | | | | | |
| | | | | | | | |
Municipal Bonds – 3.39% | | | | | | | | |
California (Various Purposes) | | | | | | | | |
5.00% 4/1/43 | | | 3,210,000 | | | | 3,528,079 | |
Chicago, Illinois O’Hare International Airport Revenue | | | | | | | | |
(Build America Bond) Series B 6.395% 1/1/40 | | | 3,800,000 | | | | 4,803,162 | |
Long Island Power Authority, New York Electric System
Revenue (Taxable Build America Bond)
5.85% 5/1/41 | | | 3,600,000 | | | | 3,818,520 | |
Los Angeles, California Department of Water & Power
Revenue (Taxable Build America Bond)
6.574% 7/1/45 | | | 2,225,000 | | | | 3,127,237 | |
31
| | |
| Schedules of investments | | |
| Delaware Extended Duration Bond Fund | | |
| | | | | | | | |
| | | Principal amount° | | | Value (U.S. $) | |
Municipal Bonds (continued) | | | | | | | | |
Metropolitan Transportation Authority, New York Revenue
(Taxable Build America Bond-Transportation) Series A2
6.089% 11/15/40 | | | 3,205,000 | | | $ | 4,109,611 | |
Oregon Department of Transportation Highway User Tax
Revenue (Taxable Build America Bond-Subordinate Lien)
Series A 5.834% 11/15/34 | | | 1,605,000 | | | | 2,010,006 | |
Texas Private Activity Bond Surface Transportation Senior
Lien Revenue Bond
(Senior Lien Note Mobility) 6.75% 6/30/43 (AMT) | | | 500,000 | | | | 595,645 | |
| | | | | | | | |
Total Municipal Bonds (cost $18,412,773) | | | | | | | 21,992,260 | |
| | | | | | | | |
| | | | | | | | |
Senior Secured Loans – 3.41%« | | | | | | | | |
Avago Technologies Tranche B 1st Lien 3.75% 4/16/21 | | | 850,000 | | | | 849,334 | |
BJ’s Wholesale Club 2nd Lien 8.50% 3/31/20 | | | 1,205,000 | | | | 1,224,205 | |
Burlington Coat Factory Warehouse Tranche B2
4.25% 2/23/17 | | | 661,944 | | | | 664,012 | |
Caesars Growth Partners Tranche B 1st Lien
6.25% 5/8/21 | | | 1,525,000 | | | | 1,521,665 | |
Clear Channel Communications Tranche B 3.65% 1/29/16 | | | 4,325,000 | | | | 4,293,094 | |
Drillships Financing Holding Tranche B1 6.00% 2/17/21 | | | 1,059,648 | | | | 1,070,245 | |
Houghton International 2nd Lien 9.50% 11/20/20 | | | 1,745,000 | | | | 1,779,900 | |
Hudson’s Bay Tranche B 1st Lien 4.75% 10/7/20 | | | 985,125 | | | | 994,360 | |
Immucor Tranche B2 5.00% 8/19/18 | | | 506,660 | | | | 509,510 | |
Nuveen Investments 2nd Lien 6.50% 2/28/19 | | | 3,750,000 | | | | 3,760,939 | |
Quickrete 2nd Lien 7.00% 3/19/21 | | | 1,270,000 | | | | 1,298,575 | |
Rite Aid 2nd Lien 5.75% 8/3/20 | | | 1,815,000 | | | | 1,853,115 | |
Samson Investment 2nd Lien 5.00% 9/25/18 | | | 1,355,000 | | | | 1,353,549 | |
Zayo Group Tranche B 1st Lien 4.00% 7/2/19 | | | 982,464 | | | | 979,164 | |
| | | | | | | | |
Total Senior Secured Loans (cost $21,751,391) | | | | | | | 22,151,667 | |
| | | | | | | | |
| | | | | | | | |
U.S. Treasury Obligation – 0.21% | | | | | | | | |
U.S. Treasury Bond
3.375% 5/15/44 | | | 1,350,000 | | | | 1,366,454 | |
| | | | | | | | |
Total U.S. Treasury Obligation (cost $1,364,027) | | | | | | | 1,366,454 | |
| | | | | | | | |
| | |
| | | Number of shares | | | | |
Convertible Preferred Stock – 2.33% | | | | | | | | |
Chesapeake Energy 144A 5.75% exercise price $26.14, expiration date 12/31/49 # | | | 4,342 | | | | 5,101,850 | |
Dominion Resources 6.375% exercise price $87.20, expiration date 7/1/17 | | | 61,100 | | | | 3,097,770 | |
32
| | | | | | | | |
| | | Number of shares | | | Value (U.S. $) | |
Convertible Preferred Stock (continued) | | | | | | | | |
Exelon 6.50% exercise price $43.75, expiration date 6/1/17 | | | 67,000 | | | $ | 3,289,700 | |
SandRidge Energy 7.00% exercise price $7.76, expiration date 12/31/49 | | | 35,700 | | | | 3,641,400 | |
| | | | | | | | |
Total Convertible Preferred Stock (cost $14,619,648) | | | | | | | 15,130,720 | |
| | | | | | | | |
| | | | | | | | |
Preferred Stock – 3.07% | | | | | | | | |
Alabama Power 5.625% | | | 16,200 | | | | 397,548 | |
Ally Financial | | | | | | | | |
144A 7.00% # | | | 3,390 | | | | 3,390,000 | |
8.50% — | | | 40,000 | | | | 1,085,200 | |
DTE Energy 5.25% | | | 175,000 | | | | 4,140,500 | |
Entergy Arkansas 4.90% | | | 170,000 | | | | 3,898,100 | |
Qwest 6.125% | | | 93,600 | | | | 2,199,600 | |
Regency Centers 6.625% | | | 87,759 | | | | 2,272,958 | |
Regions Financial | | | | | | | | |
6.375% — | | | 58,500 | | | | 1,488,825 | |
6.375% | | | 41,000 | | | | 1,015,570 | |
| | | | | | | | |
Total Preferred Stock (cost $19,843,759) | | | | | | | 19,888,301 | |
| | | | | | | | |
| | |
| | | Number of
contracts | | | | |
Options Purchased – 0.30% | | | | | | | | |
Put Swaptions – 0.30% | | | | | | | | |
Pay a fixed rate 4.00% and receive a floating rate based
on 3-month LIBOR, expiration date 5/23/17 (GSC) | | | 10,900,000 | | | | 350,774 | |
Pay a fixed rate 4.01% and receive a floating rate based
on 3-month LIBOR, expiration date 5/17/16 (GSC) | | | 12,500,000 | | | | 486,587 | |
Pay a fixed rate 4.09% and receive a floating rate based
on 3-month LIBOR, expiration date 2/7/18 (GSC) | | | 15,700,000 | | | | 1,045,341 | |
Pay a fixed rate 4.78% and receive a floating rate based
on 3-month LIBOR, expiration date 9/16/16 (GSC) | | | 6,950,000 | | | | 68,818 | |
| | | | | | | | |
Total Options Purchased (premium paid $2,997,050) | | | | | | | 1,951,520 | |
| | | | | | | | |
| | |
| | | Principal amount° | | | | |
Short-Term Investments – 1.34% | | | | | | | | |
Discount Notes – 0.35%≠ | | | | | | | | |
Federal Home Loan Bank | | | | | | | | |
0.05% 8/14/14 | | | 1,142,750 | | | | 1,142,742 | |
0.06% 8/18/14 | | | 1,137,951 | | | | 1,137,941 | |
| | | | | | | | |
| | | | | | | 2,280,683 | |
| | | | | | | | |
33
| | |
| Schedules of investments | | |
| Delaware Extended Duration Bond Fund | | |
| | | | | | | | |
| | | Principal amount° | | | Value (U.S. $) | |
Short-Term Investments (continued) | | | | | | | | |
Repurchase Agreements – 0.99% | | | | | | | | |
Bank of America Merrill Lynch
0.04%, dated 7/31/14, to be repurchased on 8/1/14,
repurchase price $2,005,227 (collateralized by U.S.
government obligations 0.00%–0.375%
6/25/15–2/15/24; market value $2,045,330) | | | 2,005,225 | | | $ | 2,005,225 | |
Bank of Montreal
0.07%, dated 7/31/14, to be repurchased on 8/1/14,
repurchase price $668,409 (collateralized by U.S.
government obligations 0.00%–4.375%
8/21/14–11/15/43; market value $681,776) | | | 668,408 | | | | 668,408 | |
BNP Paribas
0.07%, dated 7/31/14, to be repurchased on 8/1/14,
repurchase price $3,751,374 (collateralized by U.S.
government obligations 0.00%–2.75%
8/7/14–11/15/23; market value $3,826,395) | | | 3,751,367 | | | | 3,751,367 | |
| | | | | | | | |
| | | | | | | 6,425,000 | |
| | | | | | | | |
Total Short-Term Investments (cost $8,705,648) | | | | | | | 8,705,683 | |
| | | | | | | | |
| | |
Total Value of Securities – 99.38%
(cost $614,956,925) | | | | | | $ | 644,973,795 | |
| | | | | | | | |
| # | Security exempt from registration under Rule 144A of the Securities Act of 1933, as amended. At July 31, 2014, the aggregate value of Rule 144A securities was $208,142,392, which represents 32.07% of the Fund’s net assets. See Note 11 in “Notes to financial statements.” |
| @ | Illiquid security. At July 31, 2014, the aggregate value of illiquid securities was $1,799,200, which represents 0.28% of the Fund’s net assets. See Note 11 in “Notes to financial statements.” |
| 100% of the income received was in the form of both cash and par. |
| 100% of the income received was in the form of additional par. |
| ≠ | The rate shown is the effective yield at the time of purchase. |
| ° | Principal amount shown is stated in U.S. dollars unless noted that the security is denominated in another currency. |
| — | Variable rate security. The rate shown is the rate as of July 31, 2014. Interest rates reset periodically. |
| « | Senior secured loans generally pay interest at rates which are periodically redetermined by reference to a base lending rate plus a premium. These base lending rates are generally: (i) the prime rate offered by one or more United States banks, (ii) the lending rate offered by one or more European banks such as the London Inter-Bank Offered Rate (LIBOR), and (iii) the certificate of deposit rate. Senior secured loans may be subject to restrictions on resale. Stated rate in effect at July 31, 2014. |
34
The following futures contracts were outstanding at July 31, 2014:1
Futures Contracts
| | | | | | | | | | | | | | | | | | |
Contracts to Buy (Sell) | | Notional
Cost
(Proceeds) | | | Notional
Value | | | Expiration
Date | | | Unrealized
Appreciation
(Depreciation) | |
287 | | U.S. Treasury 10 yr Notes | | $ | 35,866,844 | | | $ | 35,762,890 | | | | 9/22/14 | | | $ | (103,954 | ) |
495 | | U.S. Treasury Ultra Term Bond | | | 74,598,979 | | | | 74,667,656 | | | | 9/22/14 | | | | 68,677 | |
| | | | | | | | | | | | | | | | | | |
| | | | $ | 110,465,823 | | | | | | | | | | | $ | (35,277 | ) |
| | | | | | | | | | | | | | | | | | |
The use of futures contracts involves elements of market risk and risks in excess of the amounts disclosed in the financial statements. The notional values presented above represent the Fund’s total exposure in such contracts, whereas only the net unrealized appreciation (depreciation) is reflected in the Fund’s net assets.
1See Note 8 in “Notes to financial statements.”
Summary of abbreviations:
AMT – Subject to Alternative Minimum Tax
CLO – Collateralized Loan Obligation
GSC – Goldman Sachs Capital
PIK – Pay-in-kind
See accompanying notes, which are an integral part of the financial statements.
35
Statements of assets and liabilities
July 31, 2014
| | | | | | | | |
| | | Delaware
Corporate
Bond Fund | | | Delaware
Extended Duration
Bond Fund | |
Assets: | | | | | | | | |
Investments, at value1 | | $ | 1,209,365,239 | | | $ | 636,268,112 | |
Short-term investments, at value2 | | | 17,731,489 | | | | 8,705,683 | |
Cash | | | 6,496,897 | | | | 1,876,285 | |
Cash collateral due from brokers | | | 183,000 | | | | 1,809,000 | |
Receivables for securities sold | | | 22,938,295 | | | | 6,438,361 | |
Dividends and interest receivable | | | 13,592,091 | | | | 7,234,964 | |
Receivables for fund shares sold | | | 2,428,536 | | | | 4,665,916 | |
Variation margin due from broker on futures contracts | | | — | | | | 17,484 | |
| | | | | | | | |
Total assets | | | 1,272,735,547 | | | | 667,015,805 | |
| | | | | | | | |
Liabilities: | | | | | | | | |
Options written, at value3 | | | 1,882,453 | | | | — | |
Payables for securities purchased | | | 36,808,290 | | | | 12,984,314 | |
Cash collateral due to brokers | | | 3,960,000 | | | | 1,850,000 | |
Payables for fund shares redeemed | | | 2,062,697 | | | | 1,643,097 | |
Income distributions payable | | | 1,420,970 | | | | 840,213 | |
Variation margin due to broker on futures contracts | | | 17,297 | | | | — | |
Investment management fees payable | | | 499,256 | | | | 286,184 | |
Other accrued expenses | | | 462,988 | | | | 279,159 | |
Distribution fees payable to affiliates | | | 306,728 | | | | 98,340 | |
Other affiliates payable | | | 37,314 | | | | 19,290 | |
Trustees’ fees and expenses payable | | | 2,892 | | | | 1,503 | |
| | | | | | | | |
Total liabilities | | | 47,460,885 | | | | 18,002,100 | |
| | | | | | | | |
Total Net Assets | | $ | 1,225,274,662 | | | $ | 649,013,705 | |
| | | | | | | | |
| | |
Net Assets Consist of: | | | | | | | | |
Paid-in capital | | $ | 1,180,989,162 | | | $ | 601,892,442 | |
Undistributed (distributions in excess of) net investment income | | | 228,553 | | | | (812,858 | ) |
Accumulated net realized gain on investments | | | 2,222,755 | | | | 17,952,531 | |
Net unrealized appreciation of investments, foreign currencies, and derivatives | | | 41,834,192 | | | | 29,981,590 | |
| | | | | | | | |
Total Net Assets | | $ | 1,225,274,662 | | | $ | 649,013,705 | |
| | | | | | | | |
36
| | | | | | | | |
| | | Delaware
Corporate
Bond Fund | | | Delaware
Extended Duration
Bond Fund | |
Net Asset Value | | | | | | | | |
Class A: | | | | | | | | |
Net assets | | $ | 511,350,831 | | | $ | 277,041,299 | |
Shares of beneficial interest outstanding, unlimited authorization, no par | | | 84,060,845 | | | | 40,684,383 | |
Net asset value per share | | $ | 6.08 | | | $ | 6.81 | |
Sales charge | | | 4.50 | % | | | 4.50 | % |
Offering price per share, equal to net asset value per share/(1 – sales charge) | | $ | 6.37 | | | $ | 7.13 | |
| | |
Class B: | | | | | | | | |
Net assets | | $ | 684,168 | | | $ | 298,369 | |
Shares of beneficial interest outstanding, unlimited authorization, no par | | | 112,497 | | | | 43,904 | |
Net asset value per share | | $ | 6.08 | | | $ | 6.80 | |
| | |
Class C: | | | | | | | | |
Net assets | | $ | 209,892,426 | | | $ | 30,090,580 | |
Shares of beneficial interest outstanding, unlimited authorization, no par | | | 34,499,410 | | | | 4,420,460 | |
Net asset value per share | | $ | 6.08 | | | $ | 6.81 | |
| | |
Class R: | | | | | | | | |
Net assets | | $ | 35,141,840 | | | $ | 34,544,541 | |
Shares of beneficial interest outstanding, unlimited authorization, no par | | | 5,771,854 | | | | 5,066,060 | |
Net asset value per share | | $ | 6.09 | | | $ | 6.82 | |
| | |
Institutional Class: | | | | | | | | |
Net assets | | $ | 468,205,397 | | | $ | 307,038,916 | |
Shares of beneficial interest outstanding, unlimited authorization, no par | | | 76,963,396 | | | | 45,155,794 | |
Net asset value per share | | $ | 6.08 | | | $ | 6.80 | |
| | | | | | | | |
1 Investments, at cost | | $ | 1,168,657,464 | | | $ | 606,251,277 | |
2 Short-term investments, at cost | | | 17,731,421 | | | | 8,705,648 | |
3 Options written, premium received | | | (2,990,000 | ) | | | — | |
See accompanying notes, which are an integral part of the financial statements.
37
Statements of operations
Year ended July 31, 2014
| | | | | | | | |
| | | Delaware
Corporate
Bond Fund | | | Delaware
Extended Duration
Bond Fund | |
Investment Income: | | | | | | | | |
Interest | | $ | 55,063,437 | | | $ | 32,756,911 | |
Dividends | | | 3,155,377 | | | | 1,720,513 | |
Securities lending income | | | 452 | | | | 339 | |
| | | | | | | | |
| | | 58,219,266 | | | | 34,477,763 | |
| | | | | | | | |
Expenses: | | | | | | | | |
Management fees | | | 5,891,755 | | | | 3,497,077 | |
Distribution expenses — Class A | | | 1,398,994 | | | | 781,190 | |
Distribution expenses — Class B | | | 15,803 | | | | 4,808 | |
Distribution expenses — Class C | | | 2,281,845 | | | | 322,338 | |
Distribution expenses — Class R | | | 182,713 | | | | 159,593 | |
Dividend disbursing and transfer agent fees and expenses | | | 1,685,912 | | | | 788,789 | |
Accounting and administration expenses | | | 439,712 | | | | 233,019 | |
Reports and statements to shareholders | | | 147,616 | | | | 58,078 | |
Registration fees | | | 118,008 | | | | 87,916 | |
Legal fees | | | 97,258 | | | | 49,487 | |
Trustees’ fees and expenses | | | 62,287 | | | | 32,933 | |
Custodian fees | | | 52,838 | | | | 33,652 | |
Audit and tax | | | 43,355 | | | | 43,031 | |
Other | | | 52,305 | | | | 40,866 | |
| | | | | | | | |
| | | 12,470,401 | | | | 6,132,777 | |
Less expenses waived | | | (123,762 | ) | | | (268,418 | ) |
Less waived distribution expenses — Class A | | | (50,414 | ) | | | (29,322 | ) |
Less waived distribution expenses — Class B | | | (6,241 | ) | | | (2,741 | ) |
Less waived distribution expenses — Class R | | | (6,152 | ) | | | (4,726 | ) |
Less expense paid indirectly | | | (660 | ) | | | (429 | ) |
| | | | | | | | |
Total operating expenses | | | 12,283,172 | | | | 5,827,141 | |
| | | | | | | | |
Net Investment Income | | | 45,936,094 | | | | 28,650,622 | |
| | | | | | | | |
38
| | | | | | | | |
| | | Delaware
Corporate
Bond Fund | | | Delaware
Extended Duration
Bond Fund | |
Net Realized and Unrealized Gain (Loss): | | | | | | | | |
Net realized gain (loss) on: | | | | | | | | |
Investments | | $ | 15,267,441 | | | $ | 12,963,926 | |
Foreign currencies | | | 130 | | | | (849 | ) |
Foreign currency exchange contracts | | | (273,922 | ) | | | (134,122 | ) |
Futures contracts | | | 1,690,775 | | | | (505,801 | ) |
Swap contracts | | | 2,080,241 | | | | 1,261,149 | |
| | | | | | | | |
Net realized gain | | | 18,764,665 | | | | 13,584,303 | |
| | | | | | | | |
Net change in unrealized appreciation (depreciation) of: | | | | | | | | |
Investments | | | 25,803,931 | | | | 27,348,960 | |
Foreign currencies | | | — | | | | 441 | |
Foreign currency exchange contracts | | | 73,995 | | | | 37,725 | |
Futures contracts | | | 18,810 | | | | 8,882,785 | |
Options written | | | 1,107,547 | | | | — | |
Swap contracts | | | (127,183 | ) | | | (73,663 | ) |
| | | | | | | | |
Net change in unrealized appreciation (depreciation) | | | 26,877,100 | | | | 36,196,248 | |
| | | | | | | | |
Net Realized and Unrealized Gain | | | 45,641,765 | | | | 49,780,551 | |
| | | | | | | | |
Net Increase in Net Assets Resulting from Operations | | $ | 91,577,859 | | | $ | 78,431,173 | |
| | | | | | | | |
See accompanying notes, which are an integral part of the financial statements.
39
Statements of changes in net assets
Delaware Corporate Bond Fund
| | | | | | | | |
| | | Year ended | |
| | | 7/31/14 | | | 7/31/13 | |
Increase (Decrease) in Net Assets from Operations: | | | | | | | | |
Net investment income | | $ | 45,936,094 | | | $ | 58,651,408 | |
Net realized gain | | | 18,764,665 | | | | 36,185,801 | |
Net change in unrealized appreciation (depreciation) | | | 26,877,100 | | | | (67,755,908 | ) |
| | | | | | | | |
Net increase in net assets resulting from operations | | | 91,577,859 | | | | 27,081,301 | |
| | | | | | | | |
| | |
Dividends and Distributions to Shareholders from: | | | | | | | | |
Net investment income: | | | | | | | | |
Class A | | | (22,858,385 | ) | | | (28,288,498 | ) |
Class B | | | (62,563 | ) | | | (127,345 | ) |
Class C | | | (7,984,468 | ) | | | (9,798,813 | ) |
Class R | | | (1,403,686 | ) | | | (1,245,842 | ) |
Institutional Class | | | (18,916,792 | ) | | | (25,015,345 | ) |
| | |
Net realized gain: | | | | | | | | |
Class A | | | (8,808,504 | ) | | | (20,361,021 | ) |
Class B | | | (32,244 | ) | | | (131,376 | ) |
Class C | | | (3,805,314 | ) | | | (8,822,120 | ) |
Class R | | | (568,510 | ) | | | (924,113 | ) |
Institutional Class | | | (6,635,962 | ) | | | (16,995,529 | ) |
| | | | | | | | |
| | | (71,076,428 | ) | | | (111,710,002 | ) |
| | | | | | | | |
| | |
Capital Share Transactions: | | | | | | | | |
Proceeds from shares sold: | | | | | | | | |
Class A | | | 179,994,785 | | | | 368,100,763 | |
Class B | | | 28,605 | | | | 110,275 | |
Class C | | | 23,601,516 | | | | 111,931,596 | |
Class R | | | 11,472,250 | | | | 26,685,735 | |
Institutional Class | | | 226,446,161 | | | | 347,608,276 | |
| | |
Net asset value of shares issued upon reinvestment of dividends and distributions: | | | | | | | | |
Class A | | | 29,563,766 | | | | 44,850,645 | |
Class B | | | 89,040 | | | | 235,609 | |
Class C | | | 9,219,895 | | | | 15,633,554 | |
Class R | | | 1,960,083 | | | | 2,092,137 | |
Institutional Class | | | 20,503,966 | | | | 31,670,273 | |
| | | | | | | | |
| | | 502,880,067 | | | | 948,918,863 | |
| | | | | | | | |
40
| | | | | | | | |
| | | Year ended | |
| | | 7/31/14 | | | 7/31/13 | |
Capital Share Transactions (continued): | | | | | | | | |
Cost of shares redeemed: | | | | | | | | |
Class A | | $ | (353,225,376 | ) | | $ | (369,539,804 | ) |
Class B | | | (2,239,657 | ) | | | (2,118,621 | ) |
Class C | | | (100,452,473 | ) | | | (87,443,381 | ) |
Class R | | | (16,293,718 | ) | | | (12,163,933 | ) |
Institutional Class | | | (303,745,284 | ) | | | (337,275,121 | ) |
| | | | | | | | |
| | | (775,956,508 | ) | | | (808,540,860 | ) |
| | | | | | | | |
Increase (decrease) in net assets derived from capital share transactions | | | (273,076,441 | ) | | | 140,378,003 | |
| | | | | | | | |
Net Increase (Decrease) in Net Assets | | | (252,575,010 | ) | | | 55,749,302 | |
Net Assets: | | | | | | | | |
Beginning of year | | | 1,477,849,672 | | | | 1,422,100,370 | |
| | | | | | | | |
End of year | | $ | 1,225,274,662 | | | $ | 1,477,849,672 | |
| | | | | | | | |
Undistributed (distributions in excess of) net investment income | | $ | 228,553 | | | $ | (2,451,578 | ) |
| | | | | | | | |
See accompanying notes, which are an integral part of the financial statements.
41
Statements of changes in net assets
Delaware Extended Duration Bond Fund
| | | | | | | | |
| | | Year ended | |
| | | 7/31/14 | | | 7/31/13 | |
Increase (Decrease) in Net Assets from Operations: | | | | | | | | |
Net investment income | | $ | 28,650,622 | | | $ | 37,230,168 | |
Net realized gain | | | 13,584,303 | | | | 21,481,563 | |
Net change in unrealized appreciation (depreciation) | | | 36,196,248 | | | | (76,357,523 | ) |
| | | | | | | | |
Net increase (decrease) in net assets resulting from operations | | | 78,431,173 | | | | (17,645,792 | ) |
| | | | | | | | |
| | |
Dividends and Distributions to Shareholders from: | | | | | | | | |
Net investment income: | | | | | | | | |
Class A | | | (13,646,408 | ) | | | (17,732,920 | ) |
Class B | | | (21,311 | ) | | | (49,310 | ) |
Class C | | | (1,229,671 | ) | | | (2,340,813 | ) |
Class R | | | (1,315,211 | ) | | | (1,283,402 | ) |
Institutional Class | | | (13,614,295 | ) | | | (16,696,152 | ) |
| | |
Net realized gain: | | | | | | | | |
Class A | | | — | | | | (26,584,887 | ) |
Class B | | | — | | | | (106,937 | ) |
Class C | | | — | | | | (4,355,789 | ) |
Class R | | | — | | | | (2,013,407 | ) |
Institutional Class | | | — | | | | (24,974,715 | ) |
| | | | | | | | |
| | | (29,826,896 | ) | | | (96,138,332 | ) |
| | | | | | | | |
| | |
Capital Share Transactions: | | | | | | | | |
Proceeds from shares sold: | | | | | | | | |
Class A | | | 112,661,489 | | | | 176,055,497 | |
Class B | | | — | | | | 6,167 | |
Class C | | | 4,633,885 | | | | 23,149,787 | |
Class R | | | 10,189,292 | | | | 23,714,553 | |
Institutional Class | | | 102,101,509 | | | | 180,099,398 | |
| | |
Net asset value of shares issued upon reinvestment of dividends and distributions: | | | | | | | | |
Class A | | | 13,507,436 | | | | 43,012,945 | |
Class B | | | 20,992 | | | | 141,446 | |
Class C | | | 1,089,726 | | | | 6,018,770 | |
Class R | | | 1,313,203 | | | | 3,275,487 | |
Institutional Class | | | 13,098,040 | | | | 39,771,514 | |
| | | | | | | | |
| | | 258,615,572 | | | | 495,245,564 | |
| | | | | | | | |
42
| | | | | | | | |
| | | Year ended | |
| | | 7/31/14 | | | 7/31/13 | |
| | |
Capital Share Transactions (continued): | | | | | | | | |
Cost of shares redeemed: | | | | | | | | |
Class A | | $ | (241,289,269 | ) | | $ | (197,053,239 | ) |
Class B | | | (498,498 | ) | | | (1,111,761 | ) |
Class C | | | (25,019,563 | ) | | | (35,543,957 | ) |
Class R | | | (8,989,890 | ) | | | (13,249,394 | ) |
Institutional Class | | | (134,759,164 | ) | | | (213,661,826 | ) |
| | | | | | | | |
| | | (410,556,384 | ) | | | (460,620,177 | ) |
| | | | | | | | |
Increase (decrease) in net assets derived from capital share transactions | | | (151,940,812 | ) | | | 34,625,387 | |
| | | | | | | | |
Net Decrease in Net Assets | | | (103,336,535 | ) | | | (79,158,737 | ) |
Net Assets: | | | | | | | | |
Beginning of year | | | 752,350,240 | | | | 831,508,977 | |
| | | | | | | | |
End of year | | $ | 649,013,705 | | | $ | 752,350,240 | |
| | | | | | | | |
Distributions in excess of net investment income | | $ | (812,858 | ) | | $ | (2,030,832 | ) |
| | | | | | | | |
See accompanying notes, which are an integral part of the financial statements.
43
Financial highlights
Delaware Corporate Bond Fund Class A
Selected data for each share of the Fund outstanding throughout each period were as follows:
|
Net asset value, beginning of period |
|
Income (loss) from investment operations: |
Net investment income1 |
Net realized and unrealized gain (loss) |
Total from investment operations |
|
Less dividends and distributions from: |
Net investment income |
Net realized gain |
Total dividends and distributions |
|
Net asset value, end of period |
|
Total return2 |
|
Ratios and supplemental data: |
Net assets, end of period (000 omitted) |
Ratio of expenses to average net assets |
Ratio of expenses to average net assets prior to fees waived |
Ratio of net investment income to average net assets |
Ratio of net investment income to average net assets prior to fees waived |
Portfolio turnover |
| 1 | The average shares outstanding method has been applied for per share information. |
| 2 | Total investment return is based on the change in net asset value of a share during the period and assumes reinvestment of dividends and distributions at net asset value and does not reflect the impact of a sales charge. Total investment return during all of the periods shown reflects waivers by the manager and/or distributor. Performance would have been lower had the waivers not been in effect. |
See accompanying notes, which are an integral part of the financial statements.
44
| | | | | | | | | | | | | | | | | | | | |
| | | Year ended | |
| | | | |
| | | 7/31/14 | | | 7/31/13 | | | 7/31/12 | | | 7/31/11 | | | 7/31/10 | |
| | $ | 5.950 | | | $ | 6.260 | | | $ | 6.050 | | | $ | 6.080 | | | $ | 5.460 | |
| | | | | |
| | | | | | | | | | | | | | | | | | | | |
| | | 0.227 | | | | 0.230 | | | | 0.246 | | | | 0.268 | | | | 0.309 | |
| | | 0.251 | | | | (0.099 | ) | | | 0.384 | | | | 0.278 | | | | 0.647 | |
| | | | | | | | | | | | | | | | | | | | |
| | | 0.478 | | | | 0.131 | | | | 0.630 | | | | 0.546 | | | | 0.956 | |
| | | | | | | | | | | | | | | | | | | | |
| | | | | |
| | | | | | | | | | | | | | | | | | | | |
| | | (0.252 | ) | | | (0.252 | ) | | | (0.284 | ) | | | (0.305 | ) | | | (0.336 | ) |
| | | (0.096 | ) | | | (0.189 | ) | | | (0.136 | ) | | | (0.271 | ) | | | — | |
| | | | | | | | | | | | | | | | | | | | |
| | | (0.348 | ) | | | (0.441 | ) | | | (0.420 | ) | | | (0.576 | ) | | | (0.336 | ) |
| | | | | | | | | | | | | | | | | | | | |
| | | | | |
| | $ | 6.080 | | | $ | 5.950 | | | $ | 6.260 | | | $ | 6.050 | | | $ | 6.080 | |
| | | | | | | | | | | | | | | | | | | | |
| | | | | |
| | | 8.33% | | | | 2.02% | | | | 11.04% | | | | 9.44% | | | | 17.91% | |
| | | | | |
| | | | | | | | | | | | | | | | | | | | |
| | $ | 511,351 | | | $ | 645,585 | | | $ | 638,481 | | | $ | 392,313 | | | $ | 409,671 | |
| | | 0.94% | | | | 0.93% | | | | 0.94% | | | | 0.95% | | | | 0.94% | |
| | | | | |
| | | 0.96% | | | | 0.98% | | | | 1.01% | | | | 1.09% | | | | 1.10% | |
| | | 3.81% | | | | 3.70% | | | | 4.11% | | | | 4.45% | | | | 5.31% | |
| | | | | |
| | | 3.79% | | | | 3.65% | | | | 4.04% | | | | 4.31% | | | | 5.15% | |
| | | 215% | | | | 230% | | | | 202% | | | | 204% | | | | 219% | |
45
Financial highlights
Delaware Corporate Bond Fund Class B
Selected data for each share of the Fund outstanding throughout each period were as follows:
|
Net asset value, beginning of period |
|
Income (loss) from investment operations: |
Net investment income1 |
Net realized and unrealized gain (loss) |
Total from investment operations |
|
Less dividends and distributions from: |
Net investment income |
Net realized gain |
Total dividends and distributions |
|
Net asset value, end of period |
|
Total return2 |
|
Ratios and supplemental data: |
Net assets, end of period (000 omitted) |
Ratio of expenses to average net assets |
Ratio of expenses to average net assets prior to fees waived |
Ratio of net investment income to average net assets |
Ratio of net investment income to average net assets prior to fees waived |
Portfolio turnover |
| 1 | The average shares outstanding method has been applied for per share information. |
| 2 | Total investment return is based on the change in net asset value of a share during the period and assumes reinvestment of dividends and distributions at net asset value and does not reflect the impact of a sales charge. Total investment return during some of the periods shown reflects waivers by the manager and/or distributor. Performance would have been lower had the waivers not been in effect. |
See accompanying notes, which are an integral part of the financial statements.
46
| | | | | | | | | | | | | | | | | | | | |
| | | | | | Year ended | | | | | | | |
| | | | |
| | | 7/31/14 | | | 7/31/13 | | | 7/31/12 | | | 7/31/11 | | | 7/31/10 | |
| | $ | 5.950 | | | $ | 6.260 | | | $ | 6.050 | | | $ | 6.080 | | | $ | 5.460 | |
| | | | | |
| | | | | | | | | | | | | | | | | | | | |
| | | 0.205 | | | | 0.183 | | | | 0.200 | | | | 0.223 | | | | 0.265 | |
| | | 0.257 | | | | (0.098 | ) | | | 0.385 | | | | 0.278 | | | | 0.647 | |
| | | | | | | | | | | | | | | | | | | | |
| | | 0.462 | | | | 0.085 | | | | 0.585 | | | | 0.501 | | | | 0.912 | |
| | | | | | | | | | | | | | | | | | | | |
| | | | | |
| | | | | | | | | | | | | | | | | | | | |
| | | (0.236 | ) | | | (0.206 | ) | | | (0.239 | ) | | | (0.260 | ) | | | (0.292 | ) |
| | | (0.096 | ) | | | (0.189 | ) | | | (0.136 | ) | | | (0.271 | ) | | | — | |
| | | | | | | | | | | | | | | | | | | | |
| | | (0.332 | ) | | | (0.395 | ) | | | (0.375 | ) | | | (0.531 | ) | | | (0.292 | ) |
| | | | | | | | | | | | | | | | | | | | |
| | | | | |
| | $ | 6.080 | | | $ | 5.950 | | | $ | 6.260 | | | $ | 6.050 | | | $ | 6.080 | |
| | | | | | | | | | | | | | | | | | | | |
| | | | | |
| | | 8.05% | | | | 1.26% | | | | 10.22% | | | | 8.62% | | | | 17.04% | |
| | | | | |
| | | | | | | | | | | | | | | | | | | | |
| | $ | 684 | | | $ | 2,802 | | | $ | 4,739 | | | $ | 6,705 | | | $ | 9,807 | |
| | | 1.29% | | | | 1.68% | | | | 1.69% | | | | 1.70% | | | | 1.69% | |
| | | | | |
| | | 1.70% | | | | 1.68% | | | | 1.71% | | | | 1.79% | | | | 1.80% | |
| | | 3.46% | | | | 2.95% | | | | 3.36% | | | | 3.70% | | | | 4.56% | |
| | | | | |
| | | 3.05% | | | | 2.95% | | | | 3.34% | | | | 3.61% | | | | 4.45% | |
| | | 215% | | | | 230% | | | | 202% | | | | 204% | | | | 219% | |
47
Financial highlights
Delaware Corporate Bond Fund Class C
Selected data for each share of the Fund outstanding throughout each period were as follows:
|
Net asset value, beginning of period |
|
Income (loss) from investment operations: |
Net investment income1 |
Net realized and unrealized gain (loss) |
Total from investment operations |
|
Less dividends and distributions from: |
Net investment income |
Net realized gain |
Total dividends and distributions |
|
Net asset value, end of period |
|
Total return2 |
|
Ratios and supplemental data: |
Net assets, end of period (000 omitted) |
Ratio of expenses to average net assets |
Ratio of expenses to average net assets prior to fees waived |
Ratio of net investment income to average net assets |
Ratio of net investment income to average net assets prior to fees waived |
Portfolio turnover |
| 1 | The average shares outstanding method has been applied for per share information. |
| 2 | Total investment return is based on the change in net asset value of a share during the period and assumes reinvestment of dividends and distributions at net asset value and does not reflect the impact of a sales charge. Total investment return during some of the periods shown reflects a waiver by the manager. Performance would have been lower had the waiver not been in effect. |
See accompanying notes, which are an integral part of the financial statements.
48
| | | | | | | | | | | | | | | | | | | | |
| | | Year ended | |
| | | | |
| | | 7/31/14 | | | 7/31/13 | | | 7/31/12 | | | 7/31/11 | | | 7/31/10 | |
| | | $5.960 | | | $ | 6.260 | | | $ | 6.050 | | | $ | 6.090 | | | $ | 5.470 | |
| | | | | |
| | | | | | | | | | | | | | | | | | | | |
| | | 0.182 | | | | 0.183 | | | | 0.202 | | | | 0.223 | | | | 0.266 | |
| | | 0.241 | | | | (0.088 | ) | | | 0.383 | | | | 0.268 | | | | 0.646 | |
| | | | | | | | | | | | | | | | | | | | |
| | | 0.423 | | | | 0.095 | | | | 0.585 | | | | 0.491 | | | | 0.912 | |
| | | | | | | | | | | | | | | | | | | | |
| | | | | |
| | | | | | | | | | | | | | | | | | | | |
| | | (0.207) | | | | (0.206 | ) | | | (0.239 | ) | | | (0.260 | ) | | | (0.292 | ) |
| | | (0.096) | | | | (0.189 | ) | | | (0.136 | ) | | | (0.271 | ) | | | — | |
| | | | | | | | | | | | | | | | | | | | |
| | | (0.303) | | | | (0.395 | ) | | | (0.375 | ) | | | (0.531 | ) | | | (0.292 | ) |
| | | | | | | | | | | | | | | | | | | | |
| | | | | |
| | | $6.080 | | | $ | 5.960 | | | $ | 6.260 | | | $ | 6.050 | | | $ | 6.090 | |
| | | | | | | | | | | | | | | | | | | | |
| | | | | |
| | | 7.35% | | | | 1.43% | | | | 10.21% | | | | 8.44% | | | | 17.01% | |
| | | | | |
| | | | | | | | | | | | | | | | | | | | |
| | | $209,893 | | | $ | 273,594 | | | $ | 249,029 | | | $ | 135,912 | | | $ | 141,328 | |
| | | 1.69% | | | | 1.68% | | | | 1.69% | | | | 1.70% | | | | 1.69% | |
| | | | | |
| | | 1.70% | | | | 1.68% | | | | 1.71% | | | | 1.79% | | | | 1.80% | |
| | | 3.06% | | | | 2.95% | | | | 3.36% | | | | 3.70% | | | | 4.56% | |
| | | | | |
| | | 3.05% | | | | 2.95% | | | | 3.34% | | | | 3.61% | | | | 4.45% | |
| | | 215% | | | | 230% | | | | 202% | | | | 204% | | | | 219% | |
49
Financial highlights
Delaware Corporate Bond Fund Class R
Selected data for each share of the Fund outstanding throughout each period were as follows:
|
Net asset value, beginning of period |
|
Income (loss) from investment operations: |
Net investment income1 |
Net realized and unrealized gain (loss) |
Total from investment operations |
|
Less dividends and distributions from: |
Net investment income |
Net realized gain |
Total dividends and distributions |
|
Net asset value, end of period |
|
Total return2 |
|
Ratios and supplemental data: |
Net assets, end of period (000 omitted) |
Ratio of expenses to average net assets |
Ratio of expenses to average net assets prior to fees waived |
Ratio of net investment income to average net assets |
Ratio of net investment income to average net assets prior to fees waived |
Portfolio turnover |
| 1 | The average shares outstanding method has been applied for per share information. |
| 2 | Total investment return is based on the change in net asset value of a share during the period and assumes reinvestment of dividends and distributions at net asset value. Total investment return during all of the periods shown reflects waivers by the manager and/or distributor. Performance would have been lower had the waivers not been in effect. |
See accompanying notes, which are an integral part of the financial statements.
50
| | | | | | | | | | | | | | | | | | | | |
| | | Year ended | |
| | | | |
| | | 7/31/14 | | | 7/31/13 | | | 7/31/12 | | | 7/31/11 | | | 7/31/10 | |
| | $ | 5.960 | | | $ | 6.270 | | | $ | 6.050 | | | $ | 6.090 | | | $ | 5.470 | |
| | | | | |
| | | | | | | | | | | | | | | | | | | | |
| | | 0.212 | | | | 0.214 | | | | 0.231 | | | | 0.253 | | | | 0.295 | |
| | | 0.251 | | | | (0.098 | ) | | | 0.394 | | | | 0.268 | | | | 0.646 | |
| | | | | | | | | | | | | | | | | | | | |
| | | 0.463 | | | | 0.116 | | | | 0.625 | | | | 0.521 | | | | 0.941 | |
| | | | | | | | | | | | | | | | | | | | |
| | | | | |
| | | | | | | | | | | | | | | | | | | | |
| | | (0.237 | ) | | | (0.237 | ) | | | (0.269 | ) | | | (0.290 | ) | | | (0.321 | ) |
| | | (0.096 | ) | | | (0.189 | ) | | | (0.136 | ) | | | (0.271 | ) | | | — | |
| | | | | | | | | | | | | | | | | | | | |
| | | (0.333 | ) | | | (0.426 | ) | | | (0.405 | ) | | | (0.561 | ) | | | (0.321 | ) |
| | | | | | | | | | | | | | | | | | | | |
| | | | | |
| | $ | 6.090 | | | $ | 5.960 | | | $ | 6.270 | | | $ | 6.050 | | | $ | 6.090 | |
| | | | | | | | | | | | | | | | | | | | |
| | | | | |
| | | | | | | | | | | | | | | | | | | | |
| | | 8.06% | | | | 1.77% | | | | 10.94% | | | | 8.98% | | | | 17.60% | |
| | | | | |
| | $ | 35,142 | | | $ | 37,293 | | | $ | 22,661 | | | $ | 11,981 | | | $ | 10,209 | |
| | | 1.19% | | | | 1.18% | | | | 1.19% | | | | 1.20% | | | | 1.19% | |
| | | | | |
| | | 1.22% | | | | 1.28% | | | | 1.31% | | | | 1.39% | | | | 1.40% | |
| | | 3.56% | | | | 3.45% | | | | 3.86% | | | | 4.20% | | | | 5.06% | |
| | | | | |
| | | 3.53% | | | | 3.35% | | | | 3.74% | | | | 4.01% | | | | 4.85% | |
| | | 215% | | | | 230% | | | | 202% | | | | 204% | | | | 219% | |
51
Financial highlights
Delaware Corporate Bond Fund Institutional Class
Selected data for each share of the Fund outstanding throughout each period were as follows:
|
Net asset value, beginning of period |
|
Income (loss) from investment operations: |
Net investment income1 |
Net realized and unrealized gain (loss) |
Total from investment operations |
|
Less dividends and distributions from: |
Net investment income |
Net realized gain |
Total dividends and distributions |
|
Net asset value, end of period |
|
Total return2 |
|
Ratios and supplemental data: |
Net assets, end of period (000 omitted) |
Ratio of expenses to average net assets |
Ratio of expenses to average net assets prior to fees waived |
Ratio of net investment income to average net assets |
Ratio of net investment income to average net assets prior to fees waived |
Portfolio turnover |
| 1 | The average shares outstanding method has been applied for per share information. |
| 2 | Total investment return is based on the change in net asset value of a share during the period and assumes reinvestment of dividends and distributions at net asset value. Total investment return during some of the periods shown reflects a waiver by the manager. Performance would have been lower had the waiver not been in effect. |
See accompanying notes, which are an integral part of the financial statements.
52
| | | | | | | | | | | | | | | | | | | | |
| | | | | | Year ended | | | | | | | |
| | | | |
| | | 7/31/14 | | | 7/31/13 | | | 7/31/12 | | | 7/31/11 | | | 7/31/10 | |
| | $ | 5.950 | | | $ | 6.260 | | | $ | 6.050 | | | $ | 6.090 | | | $ | 5.470 | |
| | | | | |
| | | | | | | | | | | | | | | | | | | | |
| | | 0.242 | | | | 0.245 | | | | 0.261 | | | | 0.283 | | | | 0.329 | |
| | | 0.251 | | | | (0.098 | ) | | | 0.384 | | | | 0.268 | | | | 0.641 | |
| | | | | | | | | | | | | | | | | | | | |
| | | 0.493 | | | | 0.147 | | | | 0.645 | | | | 0.551 | | | | 0.970 | |
| | | | | | | | | | | | | | | | | | | | |
| | | | | |
| | | | | | | | | | | | | | | | | | | | |
| | | (0.267 | ) | | | (0.268 | ) | | | (0.299 | ) | | | (0.320 | ) | | | (0.350 | ) |
| | | (0.096 | ) | | | (0.189 | ) | | | (0.136 | ) | | | (0.271 | ) | | | — | |
| | | | | | | | | | | | | | | | | | | | |
| | | (0.363 | ) | | | (0.457 | ) | | | (0.435 | ) | | | (0.591 | ) | | | (0.350 | ) |
| | | | | | | | | | | | | | | | | | | | |
| | | | | |
| | $ | 6.080 | | | $ | 5.950 | | | $ | 6.260 | | | $ | 6.050 | | | $ | 6.090 | |
| | | | | | | | | | | | | | | | | | | | |
| | | | | |
| | | 8.60% | | | | 2.28% | | | | 11.32% | | | | 9.52% | | | | 18.40% | |
| | | | | |
| | | | | | | | | | | | | | | | | | | | |
| | $ | 468,205 | | | $ | 518,576 | | | $ | 507,190 | | | $ | 466,660 | | | $ | 357,801 | |
| | | 0.69% | | | | 0.68% | | | | 0.69% | | | | 0.70% | | | | 0.69% | |
| | | | | |
| | | 0.70% | | | | 0.68% | | | | 0.71% | | | | 0.79% | | | | 0.80% | |
| | | 4.06% | | | | 3.95% | | | | 4.36% | | | | 4.70% | | | | 5.56% | |
| | | | | |
| | | 4.05% | | | | 3.95% | | | | 4.34% | | | | 4.61% | | | | 5.45% | |
| | | 215% | | | | 230% | | | | 202% | | | | 204% | | | | 219% | |
53
Financial highlights
Delaware Extended Duration Bond Fund Class A
Selected data for each share of the Fund outstanding throughout each period were as follows:
|
Net asset value, beginning of period |
|
Income (loss) from investment operations: |
Net investment income1 |
Net realized and unrealized gain (loss) |
Total from investment operations |
|
Less dividends and distributions from: |
Net investment income |
Net realized gain |
Total dividends and distributions |
|
Net asset value, end of period |
|
Total return2 |
|
Ratios and supplemental data: |
Net assets, end of period (000 omitted) |
Ratio of expenses to average net assets |
Ratio of expenses to average net assets prior to fees waived |
Ratio of net investment income to average net assets |
Ratio of net investment income to average net assets prior to fees waived |
Portfolio turnover |
| 1 | The average shares outstanding method has been applied for per share information. |
| 2 | Total investment return is based on the change in net asset value of a share during the period and assumes reinvestment of dividends and distributions at net asset value and does not reflect the impact of a sales charge. Total investment return during all of the periods shown reflects waivers by the manager and distributor. Performance would have been lower had the waivers not been in effect. |
See accompanying notes, which are an integral part of the financial statements.
54
| | | | | | | | | | | | | | | | | | | | |
| | | | | | Year ended | | | | | | | |
| | | | |
| | | 7/31/14 | | | 7/31/13 | | | 7/31/12 | | | 7/31/11 | | | 7/31/10 | |
| | $ | 6.280 | | | $ | 7.150 | | | $ | 6.380 | | | $ | 6.440 | | | $ | 5.600 | |
| | | | | |
| | | | | | | | | | | | | | | | | | | | |
| | | 0.278 | | | | 0.280 | | | | 0.300 | | | | 0.318 | | | | 0.348 | |
| | | 0.542 | | | | (0.427 | ) | | | 1.055 | | | | 0.268 | | | | 0.850 | |
| | | | | | | | | | | | | | | | | | | | |
| | | 0.820 | | | | (0.147 | ) | | | 1.355 | | | | 0.586 | | | | 1.198 | |
| | | | | | | | | | | | | | | | | | | | |
| | | | | |
| | | | | | | | | | | | | | | | | | | | |
| | | (0.290 | ) | | | (0.287 | ) | | | (0.319 | ) | | | (0.329 | ) | | | (0.358 | ) |
| | | — | | | | (0.436 | ) | | | (0.266 | ) | | | (0.317 | ) | | | — | |
| | | | | | | | | | | | | | | | | | | | |
| | | (0.290 | ) | | | (0.723 | ) | | | (0.585 | ) | | | (0.646 | ) | | | (0.358 | ) |
| | | | | | | | | | | | | | | | | | | | |
| | | | | |
| | $ | 6.810 | | | $ | 6.280 | | | $ | 7.150 | | | $ | 6.380 | | | $ | 6.440 | |
| | | | | | | | | | | | | | | | | | | | |
| | | | | |
| | | 13.42% | | | | (2.45% | ) | | | 22.48% | | | | 9.74% | | | | 22.00% | |
| | | | | |
| | | | | | | | | | | | | | | | | | | | |
| | $ | 277,041 | | | $ | 370,553 | | | $ | 402,639 | | | $ | 352,060 | | | $ | 275,312 | |
| | | 0.96% | | | | 0.95% | | | | 0.95% | | | | 0.95% | | | | 0.94% | |
| | | | | |
| | | 1.01% | | | | 1.04% | | | | 1.06% | | | | 1.12% | | | | 1.18% | |
| | | 4.35% | | | | 4.13% | | | | 4.53% | | | | 5.07% | | | | 5.77% | |
| | | | | |
| | | 4.30% | | | | 4.04% | | | | 4.42% | | | | 4.90% | | | | 5.53% | |
| | | 216% | | | | 217% | | | | 172% | | | | 147% | | | | 149% | |
55
Financial highlights
Delaware Extended Duration Bond Fund Class B
Selected data for each share of the Fund outstanding throughout each period were as follows:
|
Net asset value, beginning of period |
|
Income (loss) from investment operations: |
Net investment income1 |
Net realized and unrealized gain (loss) |
Total from investment operations |
|
Less dividends and distributions from: |
Net investment income |
Net realized gain |
Total dividends and distributions |
|
Net asset value, end of period |
|
Total return2 |
|
Ratios and supplemental data: |
Net assets, end of period (000 omitted) |
Ratio of expenses to average net assets |
Ratio of expenses to average net assets prior to fees waived |
Ratio of net investment income to average net assets |
Ratio of net investment income to average net assets prior to fees waived |
Portfolio turnover |
| 1 | The average shares outstanding method has been applied for per share information. |
| 2 | Total investment return is based on the change in net asset value of a share during the period and assumes reinvestment of dividends and distributions at net asset value and does not reflect the impact of a sales charge. Total investment return during all of the periods shown reflects waivers by the manager and/or distributor. Performance would have been lower had the waivers not been in effect. |
See accompanying notes, which are an integral part of the financial statements.
56
| | | | | | | | | | | | | | | | | | | | |
| | | | | | Year ended | | | | | | | |
| | | | |
| | | 7/31/14 | | | 7/31/13 | | | 7/31/12 | | | 7/31/11 | | | 7/31/10 | |
| | $ | 6.270 | | | $ | 7.140 | | | $ | 6.370 | | | $ | 6.430 | | | $ | 5.590 | |
| | | | | |
| | | | | | | | | | | | | | | | | | | | |
| | | 0.265 | | | | 0.230 | | | | 0.249 | | | | 0.271 | | | | 0.301 | |
| | | 0.542 | | | | (0.428 | ) | | | 1.057 | | | | 0.268 | | | | 0.852 | |
| | | | | | | | | | | | | | | | | | | | |
| | | 0.807 | | | | (0.198 | ) | | | 1.306 | | | | 0.539 | | | | 1.153 | |
| | | | | | | | | | | | | | | | | | | | |
| | | | | |
| | | | | | | | | | | | | | | | | | | | |
| | | (0.277 | ) | | | (0.236 | ) | | | (0.270 | ) | | | (0.282 | ) | | | (0.313 | ) |
| | | — | | | | (0.436 | ) | | | (0.266 | ) | | | (0.317 | ) | | | — | |
| | | | | | | | | | | | | | | | | | | | |
| | | (0.277 | ) | | | (0.672 | ) | | | (0.536 | ) | | | (0.599 | ) | | | (0.313 | ) |
| | | | | | | | | | | | | | | | | | | | |
| | | | | |
| | $ | 6.800 | | | $ | 6.270 | | | $ | 7.140 | | | $ | 6.370 | | | $ | 6.430 | |
| | | | | | | | | | | | | | | | | | | | |
| | | | | |
| | | 13.21% | | | | (3.19% | ) | | | 21.61% | | | | 8.93% | | | | 21.13% | |
| | | | | |
| | | | | | | | | | | | | | | | | | | | |
| | $ | 298 | | | $ | 749 | | | $ | 1,887 | | | $ | 2,219 | | | $ | 3,464 | |
| | | 1.14% | | | | 1.70% | | | | 1.70% | | | | 1.70% | | | | 1.69% | |
| | | | | |
| | | 1.75% | | | | 1.74% | | | | 1.76% | | | | 1.82% | | | | 1.88% | |
| | | 4.17% | | | | 3.38% | | | | 3.78% | | | | 4.32% | | | | 5.02% | |
| | | | | |
| | | 3.56% | | | | 3.34% | | | | 3.72% | | | | 4.20% | | | | 4.83% | |
| | | 216% | | | | 217% | | | | 172% | | | | 147% | | | | 149% | |
57
Financial highlights
Delaware Extended Duration Bond Fund Class C
Selected data for each share of the Fund outstanding throughout each period were as follows:
|
Net asset value, beginning of period |
|
Income (loss) from investment operations: |
Net investment income1 |
Net realized and unrealized gain (loss) |
Total from investment operations |
|
Less dividends and distributions from: |
Net investment income |
Net realized gain |
Total dividends and distributions |
|
Net asset value, end of period |
|
Total return2 |
|
Ratios and supplemental data: |
Net assets, end of period (000 omitted) |
Ratio of expenses to average net assets |
Ratio of expenses to average net assets prior to fees waived |
Ratio of net investment income to average net assets |
Ratio of net investment income to average net assets prior to fees waived |
Portfolio turnover |
| 1 | The average shares outstanding method has been applied for per share information. |
| 2 | Total investment return is based on the change in net asset value of a share during the period and assumes reinvestment of dividends and distributions at net asset value and does not reflect the impact of a sales charge. Total investment return during all of the periods shown reflects a waiver by the manager. Performance would have been lower had the waiver not been in effect. |
See accompanying notes, which are an integral part of the financial statements.
58
| | | | | | | | | | | | | | | | | | | | |
| | | | | | Year ended | | | | | | | |
| | | | |
| | | 7/31/14 | | | 7/31/13 | | | 7/31/12 | | | 7/31/11 | | | 7/31/10 | |
| | | $6.280 | | | $ | 7.150 | | | $ | 6.380 | | | $ | 6.430 | | | $ | 5.600 | |
| | | | | |
| | | 0.230 | | | | 0.230 | | | | 0.251 | | | | 0.272 | | | | 0.302 | |
| | | 0.542 | | | | (0.428 | ) | | | 1.055 | | | | 0.277 | | | | 0.841 | |
| | | | | | | | | | | | | | | | | | | | |
| | | 0.772 | | | | (0.198 | ) | | | 1.306 | | | | 0.549 | | | | 1.143 | |
| | | | | | | | | | | | | | | | | | | | |
| | | | | |
| | | (0.242) | | | | (0.236 | ) | | | (0.270 | ) | | | (0.282 | ) | | | (0.313 | ) |
| | | — | | | | (0.436 | ) | | | (0.266 | ) | | | (0.317 | ) | | | — | |
| | | | | | | | | | | | | | | | | | | | |
| | | (0.242) | | | | (0.672 | ) | | | (0.536 | ) | | | (0.599 | ) | | | (0.313 | ) |
| | | | | | | | | | | | | | | | | | | | |
| | | | | |
| | | $6.810 | | | $ | 6.280 | | | $ | 7.150 | | | $ | 6.380 | | | $ | 6.430 | |
| | | | | | | | | | | | | | | | | | | | |
| | | | | |
| | | 12.59% | | | | (3.17% | ) | | | 21.57% | | | | 9.09% | | | | 20.91% | |
| | | | | |
| | | $30,091 | | | $ | 47,326 | | | $ | 62,275 | | | $ | 24,532 | | | $ | 23,115 | |
| | | 1.71% | | | | 1.70% | | | | 1.70% | | | | 1.70% | | | | 1.69% | |
| | | | | |
| | | 1.75% | | | | 1.74% | | | | 1.76% | | | | 1.82% | | | | 1.88% | |
| | | 3.60% | | | | 3.38% | | | | 3.78% | | | | 4.32% | | | | 5.02% | |
| | | | | |
| | | 3.56% | | | | 3.34% | | | | 3.72% | | | | 4.20% | | | | 4.83% | |
| | | 216% | | | | 217% | | | | 172% | | | | 147% | | | | 149% | |
59
Financial highlights
Delaware Extended Duration Bond Fund Class R
Selected data for each share of the Fund outstanding throughout each period were as follows:
|
Net asset value, beginning of period |
|
Income (loss) from investment operations: |
Net investment income1 |
Net realized and unrealized gain (loss) |
Total from investment operations |
|
Less dividends and distributions from: |
Net investment income |
Net realized gain |
Total dividends and distributions |
|
Net asset value, end of period |
|
Total return2 |
|
Ratios and supplemental data: |
Net assets, end of period (000 omitted) |
Ratio of expenses to average net assets |
Ratio of expenses to average net assets prior to fees waived |
Ratio of net investment income to average net assets |
Ratio of net investment income to average net assets prior to fees waived |
Portfolio turnover |
| 1 | The average shares outstanding method has been applied for per share information. |
| 2 | Total investment return is based on the change in net asset value of a share during the period and assumes reinvestment of dividends and distributions at net asset value. Total investment return during all of the periods shown reflects waivers by the manager and distributor. Performance would have been lower had the waivers not been in effect. |
See accompanying notes, which are an integral part of the financial statements.
60
| | | | | | | | | | | | | | | | | | | | |
| | | | | | Year ended | | | | | | | |
| | | | |
| | | 7/31/14 | | | 7/31/13 | | | 7/31/12 | | | 7/31/11 | | | 7/31/10 | |
| | | $6.290 | | | $ | 7.160 | | | $ | 6.390 | | | $ | 6.440 | | | $ | 5.600 | |
| | | | | |
| | | 0.265 | | | | 0.263 | | | | 0.284 | | | | 0.303 | | | | 0.339 | |
| | | 0.539 | | | | (0.426 | ) | | | 1.055 | | | | 0.278 | | | | 0.845 | |
| | | | | | | | | | | | | | | | | | | | |
| | | 0.804 | | | | (0.163 | ) | | | 1.339 | | | | 0.581 | | | | 1.184 | |
| | | | | | | | | | | | | | | | | | | | |
| | | | | |
| | | (0.274) | | | | (0.271 | ) | | | (0.303 | ) | | | (0.314 | ) | | | (0.344 | ) |
| | | — | | | | (0.436 | ) | | | (0.266 | ) | | | (0.317 | ) | | | — | |
| | | | | | | | | | | | | | | | | | | | |
| | | (0.274) | | | | (0.707 | ) | | | (0.569 | ) | | | (0.631 | ) | | | (0.344 | ) |
| | | | | | | | | | | | | | | | | | | | |
| | | | | |
| | | $6.820 | | | $ | 6.290 | | | $ | 7.160 | | | $ | 6.390 | | | $ | 6.440 | |
| | | | | | | | | | | | | | | | | | | | |
| | | | | |
| | | 13.13% | | | | (2.68% | ) | | | 22.15% | | | | 9.63% | | | | 21.48% | |
| | | | | |
| | | $34,545 | | | $ | 29,423 | | | $ | 20,080 | | | $ | 10,800 | | | $ | 14,131 | |
| | | 1.21% | | | | 1.20% | | | | 1.20% | | | | 1.20% | | | | 1.19% | |
| | | | | |
| | | 1.27% | | | | 1.34% | | | | 1.36% | | | | 1.42% | | | | 1.48% | |
| | | 4.10% | | | | 3.88% | | | | 4.28% | | | | 4.82% | | | | 5.52% | |
| | | | | |
| | | 4.04% | | | | 3.74% | | | | 4.12% | | | | 4.60% | | | | 5.23% | |
| | | 216% | | | | 217% | | | | 172% | | | | 147% | | | | 149% | |
61
Financial highlights
Delaware Extended Duration Bond Fund Institutional Class
Selected data for each share of the Fund outstanding throughout each period were as follows:
|
Net asset value, beginning of period |
|
Income (loss) from investment operations: |
Net investment income1 |
Net realized and unrealized gain (loss) |
Total from investment operations |
|
Less dividends and distributions from: |
Net investment income |
Net realized gain |
Total dividends and distributions |
|
Net asset value, end of period |
|
Total return2 |
|
Ratios and supplemental data: |
Net assets, end of period (000 omitted) |
Ratio of expenses to average net assets |
Ratio of expenses to average net assets prior to fees waived |
Ratio of net investment income to average net assets |
Ratio of net investment income to average net assets prior to fees waived |
Portfolio turnover |
| 1 | The average shares outstanding method has been applied for per share information. |
| 2 | Total investment return is based on the change in net asset value of a share during the period and assumes reinvestment of dividends and distributions at net asset value. Total investment return during all of the periods shown reflects a waiver by the manager. Performance would have been lower had the waiver not been in effect. |
See accompanying notes, which are an integral part of the financial statements.
62
| | | | | | | | | | | | | | | | | | | | |
| | | | | | Year ended | | | | | | | |
| | | | |
| | | 7/31/14 | | | 7/31/13 | | | 7/31/12 | | | 7/31/11 | | | 7/31/10 | |
| | | $6.270 | | | $ | 7.140 | | | $ | 6.370 | | | $ | 6.430 | | | $ | 5.590 | |
| | | | | |
| | | 0.295 | | | | 0.297 | | | | 0.317 | | | | 0.332 | | | | 0.364 | |
| | | 0.541 | | | | (0.427 | ) | | | 1.055 | | | | 0.269 | | | | 0.849 | |
| | | | | | | | | | | | | | | | | | | | |
| | | 0.836 | | | | (0.130 | ) | | | 1.372 | | | | 0.601 | | | | 1.213 | |
| | | | | | | | | | | | | | | | | | | | |
| | | | | |
| | | (0.306) | | | | (0.304 | ) | | | (0.336 | ) | | | (0.344 | ) | | | (0.373 | ) |
| | | — | | | | (0.436 | ) | | | (0.266 | ) | | | (0.317 | ) | | | — | |
| | | | | | | | | | | | | | | | | | | | |
| | | (0.306) | | | | (0.740 | ) | | | (0.602 | ) | | | (0.661 | ) | | | (0.373 | ) |
| | | | | | | | | | | | | | | | | | | | |
| | | | | |
| | | $6.800 | | | $ | 6.270 | | | $ | 7.140 | | | $ | 6.370 | | | $ | 6.430 | |
| | | | | | | | | | | | | | | | | | | | |
| | | | | |
| | | 13.72% | | | | (2.21% | ) | | | 22.82% | | | | 10.01% | | | | 22.33% | |
| | | | | |
| | | $307,039 | | | $ | 304,299 | | | $ | 344,628 | | | $ | 124,076 | | | $ | 49,310 | |
| | | 0.71% | | | | 0.70% | | | | 0.70% | | | | 0.70% | | | | 0.69% | |
| | | | | |
| | | 0.75% | | | | 0.74% | | | | 0.76% | | | | 0.82% | | | | 0.88% | |
| | | 4.60% | | | | 4.38% | | | | 4.78% | | | | 5.32% | | | | 6.02% | |
| | | | | |
| | | 4.56% | | | | 4.34% | | | | 4.72% | | | | 5.20% | | | | 5.83% | |
| | | 216% | | | | 217% | | | | 172% | | | | 147% | | | | 149% | |
63
Notes to financial statements
Delaware Corporate Bond Fund and Delaware Extended Duration Bond Fund
July 31, 2014
Delaware Group® Income Funds (Trust) is organized as a Delaware statutory trust and offers five series: Delaware Core Bond Fund, Delaware Corporate Bond Fund, Delaware Diversified Floating Rate Fund, Delaware Extended Duration Bond Fund, and Delaware High-Yield Opportunities Fund. These financial statements and the related notes pertain to Delaware Corporate Bond Fund and Delaware Extended Duration Bond Fund (each, a Fund or collectively, the Funds). The Trust is an open-end investment company. The Funds are considered diversified under the Investment Company Act of 1940, as amended, and offer Class A, Class B,* Class C, Class R, and Institutional Class shares. Class A shares are sold with a maximum front-end sales charge of 4.50%. Class A share purchases of $1,000,000 or more will incur a contingent deferred sales charge (CDSC) of 1.00% if redeemed during the first year and 0.50% during the second year, provided that Delaware Distributors, L.P. (DDLP) paid a financial advisor a commission on the purchase of those shares. Class B shares may be purchased only through dividend reinvestment and certain permitted exchanges. Prior to June 1, 2007, Class B shares were sold with a CDSC that declined from 4.00% to zero depending upon the period of time the shares were held. Class B shares will automatically convert to Class A shares on a quarterly basis approximately eight years after purchase.* Class C shares are sold with a CDSC of 1.00%, if redeemed during the first 12 months. Class R and Institutional Class shares are not subject to a sales charge and are offered for sale exclusively to certain eligible investors.
The investment objective of the Funds is to seek to provide investors with total return.
*See Note 14.
1. Significant Accounting Policies
The following accounting policies are in accordance with U.S. generally accepted accounting principles (U.S. GAAP) and are consistently followed by the Funds.
Security Valuation – Equity securities, except those traded on the Nasdaq Stock Market, Inc. (Nasdaq), are valued at the last quoted sales price as of the time of the regular close of the New York Stock Exchange on the valuation date. Securities traded on the Nasdaq are valued in accordance with the Nasdaq Official Closing Price, which may not be the last sales price. If, on a particular day, an equity security does not trade, then the mean between the bid and ask prices will be used, which approximates fair value. Investment company securities are valued at net asset value per share, as reported by the underlying investment company. U.S. government and agency securities are valued at the mean between the bid and ask prices, which approximates fair value. Other debt securities, credit default swap (CDS) contracts, and interest rate swap options contracts (swaptions) are valued based upon valuations provided by an independent pricing service or broker/counterparty and reviewed by management. To the extent current market prices are not available, the pricing service may take into account developments related to the specific security, as well as transactions in comparable securities. Valuations for fixed income securities utilize matrix systems, which reflect such factors as security prices, yields, maturities, and ratings, and are supplemented by dealer and exchange quotations. For asset-backed securities, collateralized mortgage obligations, commercial mortgage securities, and U.S. government agency mortgage securities, pricing vendors utilize matrix pricing which considers prepayment speed; attributes of the collateral; yield or price of bonds of comparable quality, coupon, maturity and type as well as broker/dealer-supplied prices. Swap prices are derived using daily swap curves and models that
64
incorporate a number of market data factors, such as discounted cash flows, trades and values of the underlying reference instruments. Foreign currency exchange contracts and foreign cross currency exchange contracts are valued at the mean between the bid and ask prices, which approximates fair value. Interpolated values are derived when the settlement date of the contract is an interim date for which quotations are not available. Futures contracts are valued at the daily quoted settlement prices. Generally, other securities and assets for which market quotations are not readily available are valued at fair value as determined in good faith under the direction of each Fund’s Board of Trustees (Board). In determining whether market quotations are readily available or fair valuation will be used, various factors will be taken into consideration, such as market closures or suspension of trading in a security.
Federal Income Taxes – No provision for federal income taxes has been made as each Fund intends to continue to qualify for federal income tax purposes as a regulated investment company under Subchapter M of the Internal Revenue Code of 1986, as amended, and make the requisite distributions to shareholders. The Funds evaluate tax positions taken or expected to be taken in the course of preparing the Funds’ tax returns to determine whether the tax positions are “more-likely-than-not” of being sustained by the applicable tax authority. Tax positions not deemed to meet the “more-likely-than-not” threshold are recorded as a tax benefit or expense in the current year. Management has analyzed each Fund’s tax positions taken for all open federal income tax years (July 31, 2011 – July 31, 2014) and has concluded that no provision for federal income tax is required in the Funds’ financial statements.
Class Accounting – Investment income and common expenses are allocated to the various classes of each Fund on the basis of “settled shares” of each class in relation to the net assets of each Fund. Realized and unrealized gains (losses) on investments are allocated to the various classes of each Fund on the basis of daily net assets of each class. Distribution expenses relating to a specific class are charged directly to that class.
Repurchase Agreements – The Funds may purchase certain U.S. government securities subject to the counterparty’s agreement to repurchase them at an agreed upon date and price. The counterparty will be required on a daily basis to maintain the value of the collateral subject to the agreement at not less than the repurchase price (including accrued interest). The agreements are conditioned upon the collateral being deposited under the Federal Reserve book-entry system with the Funds’ custodian or a third-party sub-custodian. In the event of default or bankruptcy by the other party to the agreement, retention of the collateral may be subject to legal proceedings. All open repurchase agreements as of the date of this report were entered into on July 31, 2014.
Foreign Currency Transactions – Transactions denominated in foreign currencies are recorded at the prevailing exchange rates on the valuation date in accordance with the Funds’ prospectus. The value of all assets and liabilities denominated in foreign currencies is translated daily into U.S. dollars at the exchange rate of such currencies against the U.S. dollar. Transaction gains or losses resulting from changes in exchange rates during the reporting period or upon settlement of the foreign currency transaction are reported in operations for the current period. The Funds generally bifurcate that portion of realized gains and losses on investments in debt securities which is due to changes in foreign exchange rates from that which is due to changes in market prices of debt securities. That portion of gains (losses) is included on the “Statements of operations” under “Net realized gain (loss) on foreign currencies.” The
65
Notes to financial statements
Delaware Corporate Bond Fund and Delaware Extended Duration Bond Fund
1. Significant Accounting Policies (continued)
Funds report certain foreign currency-related transactions as components of realized gains (losses) for financial reporting purposes, whereas such components are treated as ordinary income (loss) for federal income tax purposes.
Use of Estimates – The preparation of financial statements in conformity with U.S. GAAP requires management to make estimates and assumptions that affect the fair value of investments, the reported amounts of assets and liabilities and disclosure of contingent assets and liabilities at the date of the financial statements, and the reported amounts of revenues and expenses during the reporting period. Actual results could differ from those estimates and the differences could be material.
Other – Expenses directly attributable to a Fund are charged directly to that Fund. Other expenses common to various funds within the Delaware Investments® Family of Funds are generally allocated among such funds on the basis of average net assets. Management fees and some other expenses are paid monthly. Security transactions are recorded on the date the securities are purchased or sold (trade date) for financial reporting purposes. Costs used in calculating realized gains and losses on the sale of investment securities are those of the specific securities sold. Dividend income is recorded on the ex-dividend date and interest income is recorded on the accrual basis. Discounts and premiums on debt securities are amortized to interest income over the lives of the respective securities using the effective interest method. Realized gains (losses) on paydowns of asset- and mortgage-backed securities are classified as interest income. Each Fund declares dividends daily from net investment income and pays the dividends monthly and declares and pays distributions from net realized gain on investments, if any, annually. Each Fund may distribute more frequently, if necessary for tax purposes. Dividends and distributions, if any, are recorded on the ex-dividend date.
Each Fund may receive earnings credits from its custodian when positive cash balances are maintained, which may be used to offset custody fees. There were no earnings credits for the year ended July 31, 2014.
Each Fund receives earnings credits from its transfer agent when positive cash balances are maintained, which may be used to offset transfer agent fees. If the amount earned is greater than one dollar, the expense paid under this arrangement is included on the “Statements of operations” under “Dividend disbursing and transfer agent fees and expenses” with the corresponding expense offset shown as “Less expense paid indirectly.” For the year ended July 31, 2014, each Fund earned the following amounts under this agreement:
| | | | |
| | | Delaware
Corporate
Bond Fund | | Delaware
Extended Duration
Bond Fund |
| | $660 | | $429 |
66
2. Investment Management, Administration Agreements and Other Transactions with Affiliates
In accordance with the terms of its respective investment management agreement, each Fund pays Delaware Management Company (DMC), a series of Delaware Management Business Trust and the investment manager, an annual fee which is calculated based on each Fund’s average daily net assets as follows:
| | | | | | |
| | | Delaware
Corporate
Bond Fund | | | Delaware
Extended Duration
Bond Fund |
| | |
On the first $500 million | | | 0.5000% | | | 0.5500% |
On the next $500 million | | | 0.4750% | | | 0.5000% |
On the next $1.5 billion | | | 0.4500% | | | 0.4500% |
In excess of $2.5 billion | | | 0.4250% | | | 0.4250% |
DMC has contractually agreed to waive that portion, if any, of its management fee and reimburse each Fund to the extent necessary to prevent total annual operating expenses (excluding any 12b-1 fees, acquired fund fees and expenses, taxes, interest, inverse floater program expenses, short sale and dividend interest expenses, brokerage fees, certain insurance costs, and nonroutine expenses or costs including, but not limited to, those relating to reorganizations, litigation, conducting shareholder meetings and liquidations) (collectively, nonroutine expenses)) from exceeding the following percentages of each Fund’s average daily net assets from Aug. 1, 2013 through July 31, 2014.* These waivers and reimbursements may only be terminated by agreement of the DMC and the Funds.
| | | | | | |
| | | Delaware
Corporate
Bond Fund | | | Delaware
Extended Duration
Bond Fund |
| | |
Operating expense limitation | | | 0.69% | | | 0.71% |
Delaware Service Company, Inc. (DSC), an affiliate of DMC, provides fund accounting and financial administration oversight services to the Funds. For these services, the Funds pay DSC fees based on the aggregate daily net assets of the Delaware Investments® Family of Funds at the following annual rate: 0.0050% of the first $30 billion; 0.0045% of the next $10 billion; 0.0040% of the next $10 billion; and 0.0025% of aggregate average daily net assets in excess of $50 billion. The fees payable to DSC under the service agreement described above are allocated among all Funds in the Delaware Investments Family of Funds on a relative net asset value basis. For the year ended July 31, 2014, the Funds were charged for these services as follows:
| | | | | | |
| | | Delaware
Corporate
Bond Fund | | | Delaware
Extended Duration
Bond Fund |
| | |
| | $ | 59,094 | | | $31,304 |
*The contractual waiver period is from Nov. 28, 2012, through Nov. 28, 2014. Prior to Nov. 28, 2013, the contractual waiver for Delaware Extended Duration Bond Fund was 0.70%.
67
Notes to financial statements
Delaware Corporate Bond Fund and Delaware Extended Duration Bond Fund
2. Investment Management, Administration Agreements and Other Transactions with Affiliates (continued)
DSC is also the transfer agent and dividend disbursing agent of the Funds. For these services, the Funds pay DSC fees based on the aggregate daily net assets of the retail funds within the Delaware Investments® Family of Funds at the following annual rate: 0.025% of the first $20 billion, 0.020% of the next $5 billion; 0.015% of the next $5 billion; and 0.013% on average daily net assets in excess of $30 billion. These amounts are included on the “Statements of operations” under “Dividend and disbursing and transfer agent fees and expenses.” For the year ended July 31, 2014, the amount charged by DSC for each Fund was as follows:
| | | | | | |
| | | Delaware
Corporate
Bond Fund | | | Delaware
Extended Duration
Bond Fund |
| | |
| | $ | 268,781 | | | $142,384 |
Pursuant to a sub-transfer agency agreement between DSC and BNY Mellon Investment Servicing (US) Inc. (BNYMIS), BNYMIS provides certain sub-transfer agency services to the Funds. Sub-transfer agency fees are passed on to and paid directly by the Funds.
Pursuant to a distribution agreement and distribution plan, each Fund pays DDLP, the distributor and an affiliate of DMC, an annual distribution and service fee of 1.00% of the average daily net assets of the Class B and Class C shares. Effective Oct. 1, 2013, each Fund pays DDLP an annual distribution and service fee of 0.25% and 0.50% of the average daily net assets of the Class A and Class R shares, respectively. Prior to Oct. 1, 2013, each Fund paid an annual distribution and service fee of 0.30% and 0.60% of the average daily net assets of the Class A and Class R shares, respectively. For the period from Aug. 1, 2013 to Oct. 1, 2013, the distribution and service fees for each Fund’s Class A and Class R shares were contractually limited to 0.25% and 0.50%, respectively, of the classes’ average daily net assets. DDLP has contractually agreed to waive each Fund’s Class B shares’ 12b-1 fees to 0.25% of average daily net assets from Nov. 27, 2013 through July 31, 2014* for Delaware Corporate Bond Fund, and Oct. 1, 2013 through July 31, 2014* for Delaware Extended Duration Bond Fund. Prior to the above effective dates, there was no waiver for Class B. These waivers and reimbursements may only be terminated by agreement of DDLP and the Funds. Institutional Class shares pay no distribution and service fees.
As provided in the investment management agreement, each Fund bears a portion of the cost of certain resources shared with DMC, including the cost of internal personnel of DMC and/or its affiliates that provide legal, tax and regulatory reporting services to the Funds. For the year ended July 31, 2014, each Fund was charged for internal legal, tax and regulatory reporting services provided by DMC and/or its affiliates’ employees as follows:
| | | | | | |
| | | Delaware
Corporate
Bond Fund | | | Delaware
Extended Duration
Bond Fund |
| | |
| | $ | 35,579 | | | $18,852 |
*The contractual waiver period is from Nov. 27, 2013, through Nov. 28, 2014 for Delaware Corporate Bond Fund, and Oct. 1, 2013 through Nov. 28, 2014 for Delaware Extended Duration Bond Fund.
68
For the year ended July 31, 2014, DDLP earned commissions on sales of Class A shares for each Fund as follows:
| | | | | | |
| | | Delaware
Corporate
Bond Fund | | | Delaware
Extended Duration
Bond Fund |
| | |
| | | $33,677 | | | $19,897 |
For the year ended July 31, 2014, DDLP received gross CDSC commissions on redemptions of each Fund’s Class A and Class C shares, respectively, and these commissions were entirely used to offset upfront commissions previously paid by DDLP to broker/dealers on sales of those shares. The amounts received were as follows:
| | | | |
| | | Delaware
Corporate
Bond Fund | | Delaware
Extended Duration
Bond Fund |
| | |
Class A | | $4,841 | | $ — |
Class C | | 6,640 | | 4,787 |
Trustees’ fees include expenses accrued by the Funds for each Trustee’s retainer and meeting fees. Certain officers of DMC, DSC and DDLP are officers and/or Trustees of the Trust. These officers and Trustees are paid no compensation by the Funds.
3. Investments
For the year ended July 31, 2014, the Funds made purchases and sales of investment securities other than short-term investments as follows:
| | | | | | | | |
| | | Delaware
Corporate
Bond Fund | | | Delaware
Extended Duration
Bond Fund | |
| | |
Purchases other than U.S. government securities | | $ | 2,376,749,087 | | | $ | 1,183,738,005 | |
Purchases of U.S. government securities | | | 234,597,628 | | | | 193,061,558 | |
Sales other than U.S. government securities | | | 2,678,536,092 | | | | 1,334,366,032 | |
Sales of U.S. government securities | | | 235,340,694 | | | | 192,537,016 | |
At July 31, 2014, the cost of investments and unrealized appreciation (depreciation) for federal income tax purposes for each Fund were as follows:
| | | | | | | | |
| | | Delaware
Corporate
Bond Fund | | | Delaware
Extended Duration
Bond Fund | |
| | |
Cost of Investments | | $ | 1,193,119,619 | | | $ | 615,293,261 | |
| | | | | | | | |
Aggregate unrealized appreciation | | $ | 48,396,676 | | | $ | 32,702,266 | |
Aggregate unrealized depreciation | | | (14,419,567) | | | | (3,021,732) | |
| | | | | | | | |
Net unrealized appreciation | | $ | 33,977,109 | | | $ | 29,680,534 | |
| | | | | | | | |
69
Notes to financial statements
Delaware Corporate Bond Fund and Delaware Extended Duration Bond Fund
3. Investments (continued)
U.S. GAAP defines fair value as the price that each Fund would receive to sell an asset or pay to transfer a liability in an orderly transaction between market participants at the measurement date under current market conditions. A three-level hierarchy for fair value measurements has been established based upon the transparency of inputs to the valuation of an asset or liability. Inputs may be observable or unobservable and refer broadly to the assumptions that market participants would use in pricing the asset or liability. Observable inputs reflect the assumptions market participants would use in pricing the asset or liability based on market data obtained from sources independent of the reporting entity. Unobservable inputs reflect the reporting entity’s own assumptions about the assumptions that market participants would use in pricing the asset or liability developed based on the best information available under the circumstances. Each Fund’s investment in its entirety is assigned a level based upon the observability of the inputs which are significant to the overall valuation. The three-level hierarchy of inputs is summarized below.
| | | | |
| Level 1 | | – | | Inputs are quoted prices in active markets for identical investments. (Examples: equity securities, open-end investment companies, futures contracts, exchange-tradedoptions contracts) |
| | |
| Level 2 | | – | | Other observable inputs, including, but not limited to: quoted prices for identical or similar assets or liabilities in markets that are active, quoted prices for identical or similar assets or liabilities in markets that are not active, inputs other than quoted prices that are observable for the assets or liabilities (such as interest rates, yield curves, volatilities, prepayment speeds, loss severities, credit risks and default rates) or other market-corroborated inputs. (Examples: debt securities, government securities, swap contracts, foreign currency exchange contracts, foreign securities utilizing international fair value pricing, broker-quoted securities, fair valued securities) |
| | |
| Level 3 | | – | | Significant unobservable inputs, including each Fund’s own assumptions used to determine the fair value of investments. (Examples: broker-quoted securities, fair valued securities) |
Level 3 investments are valued using significant unobservable inputs. Each Fund may also use an income-based valuation approach in which the anticipated future cash flows of the investment are discounted to calculate fair value. Discounts may also be applied due to the nature or duration of any restrictions on the disposition of the investments. Valuations may also be based upon current market prices of securities that are comparable in coupon, rating, maturity, and industry. The derived value of a Level 3 investment may not represent the value which is received upon disposition and this could impact the results of operations.
70
The following tables summarize the valuation of each Fund’s investments by fair value hierarchy levels as of July 31, 2014:
| | | | | | | | | | | | |
| | | Delaware Corporate Bond Fund | |
| | | Level 1 | | | Level 2 | | | Total | |
Agency, Asset- & Mortgage-Backed Securities | | $ | — | | | $ | 42,817,250 | | | $ | 42,817,250 | |
Corporate Debt | | | — | | | | 1,046,341,985 | | | | 1,046,341,985 | |
Municipal Bonds | | | — | | | | 17,327,412 | | | | 17,327,412 | |
Senior Secured Loans | | | — | | | | 31,658,797 | | | | 31,658,797 | |
Convertible Preferred Stock1 | | | 12,817,907 | | | | 16,773,125 | | | | 29,591,032 | |
Preferred Stock1 | | | 29,586,760 | | | | 4,000,000 | | | | 33,586,760 | |
U.S. Treasury Obligations | | | — | | | | 292,987 | | | | 292,987 | |
Options Purchased | | | — | | | | 7,749,016 | | | | 7,749,016 | |
Short-Term Investments | | | — | | | | 17,731,489 | | | | 17,731,489 | |
| | | | | | | | | | | | |
Total | | $ | 42,404,667 | | | $ | 1,184,692,061 | | | $ | 1,227,096,728 | |
| | | | | | | | | | | | |
Futures Contracts | | $ | 18,810 | | | $ | — | | | $ | 18,810 | |
Options Written | | | — | | | | (1,882,453 | ) | | | (1,882,453 | ) |
| |
| | | Delaware Extended Duration Bond Fund | |
| | | Level 1 | | | Level 2 | | | Total | |
Agency, Asset- & Mortgage-Backed Securities | | $ | — | | | $ | 15,385,700 | | | $ | 15,385,700 | |
Corporate Debt | | | — | | | | 538,401,490 | | | | 538,401,490 | |
Municipal Bonds | | | — | | | | 21,992,260 | | | | 21,992,260 | |
Senior Secured Loans | | | — | | | | 22,151,667 | | | | 22,151,667 | |
Convertible Preferred Stock1 | | | 6,387,470 | | | | 8,743,250 | | | | 15,130,720 | |
Preferred Stock1 | | | 16,498,301 | | | | 3,390,000 | | | | 19,888,301 | |
U.S. Treasury Obligations | | | — | | | | 1,366,454 | | | | 1,366,454 | |
Options Purchased | | | — | | | | 1,951,520 | | | | 1,951,520 | |
Short-Term Investments | | | — | | | | 8,705,683 | | | | 8,705,683 | |
| | | | | | | | | | | | |
Total | | $ | 22,885,771 | | | $ | 622,088,024 | | | $ | 644,973,795 | |
| | | | | | | | | | | | |
Futures Contracts | | $ | (35,277 | ) | | $ | — | | | $ | (35,277 | ) |
| 1 | Security type is valued across multiple levels. Level 1 investments represent exchange-traded investments while Level 2 investments represent matrix-priced investments. The amounts attributed to Level 1 investments , and Level 2 investments represent the following percentages of the total market value of these security types for each Fund: |
71
Notes to financial statements
Delaware Corporate Bond Fund and Delaware Extended Duration Bond Fund
3. Investments (continued)
| | | | | | | | | | | | |
| | | Delaware Corporate Bond Fund | |
| | | Level 1 | | | Level 2 | | | Total | |
Convertible Preferred Stock | | | 43.32 | % | | | 56.68 | % | | | 100.00 | % |
Preferred Stock | | | 88.09 | % | | | 11.91 | % | | | 100.00 | % |
| |
| | | Delaware Extended Duration Bond Fund | |
| | | Level 1 | | | Level 2 | | | Total | |
Convertible Preferred Stock | | | 42.22 | % | | | 57.78 | % | | | 100.00 | % |
Preferred Stock | | | 82.95 | % | | | 17.05 | % | | | 100.00 | % |
During the year ended July 31, 2014, there were no transfers between Level 1 investments, Level 2 investments, or Level 3 investments that had a significant impact to the Funds. Each Fund’s policy is to recognize transfers between levels at the beginning of the reporting period.
A reconciliation of Level 3 investments is presented when each Fund has a significant amount of Level 3 investments at the beginning, interim, or end of the period in relation to net assets. At July 31, 2014, there were no Level 3 investments.
4. Dividend and Distribution Information
Income and long-term capital gain distributions are determined in accordance with federal income tax regulations, which may differ from U.S. GAAP. Additionally, distributions from net gains on foreign currency transactions and net short-term gains on sales of investment securities are treated as ordinary income for federal income tax purposes. The tax character of dividends and distributions paid during the years ended July 31, 2014 and 2013 were as follows:
| | | | | | | | |
| | | Delaware Corporate
Bond Fund | |
| | | Year ended | |
| | | 7/31/14 | | | 7/31/13 | |
Ordinary income | | $ | 52,199,172 | | | $ | 109,210,840 | |
Long-term capital gains | | | 18,877,256 | | | | 2,499,162 | |
| | | | | | | | |
Total | | $ | 71,076,428 | | | $ | 111,710,002 | |
| | | | | | | | |
| |
| | | Duration
Extended Delaware
Bond Fund | |
| | | Year ended | |
| | | 7/31/14 | | | 7/31/13 | |
Ordinary income | | | $29,826,896 | | | | $74,590,626 | |
Long-term capital gains | | | — | | | | 21,547,706 | |
| | | | | | | | |
Total | | | $29,826,896 | | | | $96,138,332 | |
| | | | | | | | |
72
5. Components of Net Assets on a Tax Basis
As of July 31, 2014, the components of net assets on a tax basis were as follows:
| | | | | | | | |
| | | Delaware
Corporate
Bond Fund | | | Delaware
Extended Duration
Bond Fund | |
Shares of beneficial interest | | $ | 1,180,989,162 | | | $ | 601,892,442 | |
Undistributed ordinary income | | | 1,657,175 | | | | 27,355 | |
Undistributed long-term capital gains | | | 8,964,978 | | | | 18,253,590 | |
Distributions payable | | | (1,420,970 | ) | | | (840,213 | ) |
Other temporary differences | | | (331 | ) | | | — | |
Unrealized appreciation | | | 35,084,648 | | | | 29,680,531 | |
| | | | | | | | |
Net assets | | $ | 1,225,274,662 | | | $ | 649,013,705 | |
| | | | | | | | |
The differences between book basis and tax basis components of net assets are primarily attributable to tax deferral of losses on wash sales, tax deferral of straddle losses, mark-to-market of futures contracts, distributions payable, trust preferred securities, market discount and premium on debt instruments .
For financial reporting purposes, capital accounts are adjusted to reflect the tax character of permanent book/tax differences. Reclassifications are primarily due to tax treatment of gain (loss) on foreign currency transactions, dividends and distributions, market discount and premium on debt instruments, paydowns of asset- and mortgage-backed securities, contingent payment debt instruments, and CDS contracts. Results of operations and net assets were not affected by these reclassifications. For the year ended July 31, 2014 , the Funds recorded the following reclassifications:
| | | | | | | | |
| | | Delaware
Corporate
Bond Fund | | | Delaware
Extended Duration
Bond Fund | |
Undistributed net investment income | | $ | 7,969,931 | | | $ | 2,394,248 | |
Accumulated net realized gain | | | (7,969,931 | ) | | | (2,394,248 | ) |
73
Notes to financial statements
Delaware Corporate Bond Fund and Delaware Extended Duration Bond Fund
6. Capital Shares
Transactions in capital shares were as follows:
| | | | | | | | | | | | | | | | |
| | | Delaware Corporate
Bond Fund | | | Delaware Extended Duration
Bond Fund | |
| | |
| | | Year ended | | | Year ended | |
| | | 7/31/14 | | | 7/31/13 | | | 7/31/14 | | | 7/31/13 | |
Shares sold: | | | | | | | | | | | | | | | | |
Class A | | | 30,075,938 | | | | 59,133,455 | | | | 17,412,308 | | | | 25,731,964 | |
Class B | | | 4,739 | | | | 17,504 | | | | — | | | | 918 | |
Class C | | | 3,970,810 | | | | 17,901,653 | | | | 705,219 | | | | 3,343,849 | |
Class R | | | 1,928,640 | | | | 4,267,906 | | | | 1,580,375 | | | | 3,407,446 | |
Institutional Class | | | 37,791,594 | | | | 55,830,229 | | | | 15,819,841 | | | | 26,252,535 | |
| |
Shares issued upon reinvestment of dividends and distributions: | | | | | |
Class A | | | 4,998,351 | | | | 7,256,322 | | | | 2,117,118 | | | | 6,372,332 | |
Class B | | | 15,112 | | | | 38,098 | | | | 3,293 | | | | 20,950 | |
Class C | | | 1,558,329 | | | | 2,529,697 | | | | 170,925 | | | | 891,494 | |
Class R | | | 331,118 | | | | 338,275 | | | | 204,017 | | | | 485,345 | |
Institutional Class | | | 3,464,059 | | | | 5,123,642 | | | | 2,045,263 | | | | 5,898,695 | |
| | | | | | | | | | | | | | | | |
| | | 84,138,690 | | | | 152,436,781 | | | | 40,058,359 | | | | 72,405,528 | |
| | | | | | | | | | | | | | | | |
| | | | |
Shares redeemed: | | | | | | | | | | | | | | | | |
Class A | | | (59,432,612 | ) | | | (59,956,010 | ) | | | (37,837,815 | ) | | | (29,427,063 | ) |
Class B | | | (378,136 | ) | | | (342,061 | ) | | | (78,882 | ) | | | (166,809 | ) |
Class C | | | (16,971,428 | ) | | | (14,261,385 | ) | | | (3,992,342 | ) | | | (5,411,426 | ) |
Class R | | | (2,745,449 | ) | | | (1,965,500 | ) | | | (1,396,271 | ) | | | (2,020,027 | ) |
Institutional Class | | | (51,383,480 | ) | | | (54,878,973 | ) | | | (21,223,346 | ) | | | (31,904,929 | ) |
| | | | | | | | | | | | | | | | |
| | | (130,911,105 | ) | | | (131,403,929 | ) | | | (64,528,656 | ) | | | (68,930,254 | ) |
| | | | | | | | | | | | | | | | |
Net increase (decrease) | | | (46,772,415 | ) | | | 21,032,852 | | | | (24,470,297 | ) | | | 3,475,274 | |
| | | | | | | | | | | | | | | | |
For the years ended July 31, 2014 and 2013, the following shares and values were converted from Class B to Class A. The amounts are included in Class B redemptions and Class A subscriptions in the tables above, and the “Statements of changes in net assets.”
| | | | | | | | | | | | | | | | | | | | | | | | |
| | | | | | Year ended
7/31/14 | | | | | | | | | Year ended
7/31/13 | | | | |
| | | Class B
Shares | | | Class A
Shares | | | Value | | | Class B
Shares | | | Class A
Shares | | | Value | |
Delaware Corporate Bond Fund | | | 19,245 | | | | 19,264 | | | $ | 114,598 | | | | 63,904 | | | | 63,987 | | | $ | 397,306 | |
Delaware Extended Duration Bond Fund | | | 11,551 | | | | 11,534 | | | | 74,200 | | | | 17,579 | | | | 17,573 | | | | 116,413 | |
Certain shareholders of Class C may exchange their share for Institutional class shares. The following shares and values were exchanged from Class A to Institutional Class. These exchange transactions are
74
included as subscriptions and redemptions in the tables on the previous page, and the “Statements of changes in net assets.”
| | | | | | | | | | | | |
| | | | | | Year ended
7/31/14 | | | | |
| | | Class C
Shares | | | Institutional Class
Shares | | | Value | |
Delaware Corporate Bond Fund | | | 39 | | | | 39 | | | $ | 241 | |
7. Line of Credit
Each Fund, along with certain other funds in the Delaware Investments® Family of Funds (Participants), was a participant in a $125,000,000 revolving line of credit to be used for temporary or emergency purposes as an additional source of liquidity to fund redemptions of investor shares. Under the agreement, the Participants were charged an annual commitment fee of 0.08%, which was allocated across the Participants on the basis of each Participant’s allocation of the entire facility. The Participants were permitted to borrow up to a maximum of one third of their net assets under the agreement. Each Participant was individually, and not jointly, liable for its particular advances, if any, under the line of credit. The line of credit under the agreement expired on Nov. 12, 2013.
On Nov. 12, 2013, each Fund, along with the other Participants, entered into an amendment to the agreement for a $225,000,000 revolving line of credit. The line of credit is to be used as described above and operates in substantially the same manner as the original agreement. The line of credit available under the agreement expires on Nov. 10, 2014.
The Funds had no amounts outstanding as of July 31, 2014 or at any time during the year then ended.
8. Derivatives
U.S. GAAP requires disclosures that enable investors to understand: (1) how and why an entity uses derivatives; (2) how they are accounted for; and (3) how they affect an entity’s results of operations and financial position.
Foreign Currency Exchange Contracts — Each Fund may enter into foreign currency exchange contracts and foreign cross currency exchange contracts as a way of managing foreign exchange rate risk. Each Fund may enter into these contracts to fix the U.S. dollar value of a security that it has agreed to buy or sell for the period between the date the trade was entered into and the date the security is delivered and paid for. Each Fund may also use these contracts to hedge the U.S. dollar value of securities it already owns that are denominated in foreign currencies. In addition, each Fund may enter into these contracts to facilitate or expedite the settlement of portfolio transactions. The change in value is recorded as an unrealized gain or loss. When the contract is closed, a realized gain or loss is recorded equal to the difference between the value of the contract at the time it was opened and the value at the time it was closed.
The use of foreign currency exchange contracts and foreign cross currency exchange contracts does not eliminate fluctuations in the underlying prices of the securities, but does establish a rate of exchange that
75
Notes to financial statements
Delaware Corporate Bond Fund and Delaware Extended Duration Bond Fund
8. Derivatives (continued)
can be achieved in the future. Although foreign currency exchange contracts and foreign cross currency exchange contracts limit the risk of loss due to an unfavorable change in the value of the hedged currency, they also limit any potential gain that might result should the value of the currency change favorably. In addition, each Fund could be exposed to risks if the counterparties to the contracts are unable to meet the terms of their contracts. Each Fund’s maximum risk of loss from counterparty credit risk is the value of its currency exchanged with the counterparty. The risk is generally mitigated by having a netting arrangement between the Funds and the counterparty and by the posting of collateral by the counterparty to the Funds to cover the Funds’ exposure to the counterparty. No foreign currency exchange contracts were outstanding at July 31, 2014.
During the year ended July 31, 2014, each Fund used foreign currency exchange contracts to hedge the U.S. dollar value of securities it already owns that are denominated in foreign currencies.
Futures Contracts — A futures contract is an agreement in which the writer (or seller) of the contract agrees to deliver to the buyer an amount of cash or securities equal to a specific dollar amount times the difference between the value of a specific security or index at the close of the last trading day of the contract and the price at which the agreement is made. Each Fund may use futures in the normal course of pursuing its investment objective. Each Fund may invest in futures contracts to hedge its existing portfolio securities against fluctuations in value caused by changes in interest rates or market conditions. Upon entering into a futures contract, each Fund deposits cash or pledges U.S. government securities to a broker, equal to the minimum “initial margin” requirements of the exchange on which the contract is traded. Subsequent payments are received from the broker or paid to the broker each day, based on the daily fluctuation in the market value of the contract. These receipts or payments are known as “variation margin” and are recorded daily by the Funds as unrealized gains or losses until the contracts are closed. When the contracts are closed, the Funds record a realized gain or loss equal to the difference between the value of the contract at the time it was opened and the value at the time it was closed. Risks of entering into futures contracts include potential imperfect correlation between the futures contracts and the underlying securities and the possibility of an illiquid secondary market for these instruments. When investing in futures, there is reduced counterparty credit risk to a Fund because futures are exchange-traded and the exchange’s clearinghouse, as counterparty to all exchange-traded futures, guarantees against default. At July 31, 2014, the Funds posted cash collateral for futures contracts, which is presented as “Cash collateral due from brokers” on the “Statements of assets and liabilities” as follows:
| | | | | | | | |
| | | Delaware
Corporate
Bond Fund | | | Delaware
Extended Duration
Bond Fund | |
| | $ | 183,000 | | | | $1,809,000 | |
During the year ended July 31, 2014, the Funds used futures contracts to hedge the Funds’ existing portfolio securities against fluctuations in value caused by changes in interest rates or market conditions.
Options Contracts — During the year ended July 31, 2014, each Fund entered into options contracts in the normal course of pursuing its investment objective. The Funds may buy or write options contracts for any number of reasons, including without limitation: to manage the Funds’ exposure to changes in securities prices caused by interest rates or market conditions, and foreign currencies; as an efficient
76
means of adjusting the Funds’ overall exposure to certain markets; to protect the value of portfolio securities; and as a cash management tool. The Funds may buy or write call or put options on securities, futures, swaps, swaptions, financial indices, and foreign currencies. When the Funds buy an option, a premium is paid and an asset is recorded and adjusted on a daily basis to reflect the current market value of the option purchased. When the Funds write an option, a premium is received and a liability is recorded and adjusted on a daily basis to reflect the current market value of the option written. Premiums received from writing options that expire unexercised are treated by the Funds on the expiration date as realized gains. The difference between the premium received and the amount paid on effecting a closing purchase transaction, including brokerage commissions, is treated as realized gain or loss. If a call option is exercised, the premium is added to the proceeds from the sale of the underlying security in determining whether the Funds have a realized gain or loss. If a put option is exercised, the premium reduces the cost basis of the securities purchased by each Fund. Each Fund, as writer of an option, bears the market risk of an unfavorable change in the price of the security underlying the written option. When writing options, each Fund is subject to minimal counterparty risk because the counterparty is only obligated to pay premiums and does not bear the market risk of an unfavorable market change. There were no transactions in options written during the year ended July 31, 2014 for Delaware Extended Duration Bond Fund.
Transactions in options written during the year ended July 31, 2014 for Delaware Corporate Bond Fund were as follows:
| | | | | | | | |
Put Options | | Number of
Contracts | | | Premiums | |
Options outstanding July 31, 2013 | | | — | | | $ | — | |
Options written | | | (650,000,000 | ) | | | (2,990,000 | ) |
Options terminated in closing sales transactions | | | — | | | | — | |
| | | | | | | | |
Options outstanding July 31, 2014 | | | (650,000,000 | ) | | $ | (2,990,000 | ) |
| | | | | | | | |
Each Fund received cash and securities collateral for open option contracts as follows:
| | | | | | | | |
| | | Delaware
Corporate
Bond Fund | | | Delaware
Extended Duration
Bond Fund | |
Cash | | $ | 3,960,000 | | | | $1,850,000 | |
Securities | | | 1,463,000 | | | | — | |
Securities collateral received comprised of U.S. treasury obligations, and cash collateral received is presented on the “Statements of assets and liabilities” as “Cash collateral due to brokers.”
During the year ended July 31, 2014, the Funds used option contracts to manage each Fund’s exposure to changes in securities prices caused by interest rates or market conditions.
Swap Contracts — Each Fund may enter into CDS contracts in the normal course of pursuing its investment objective. Each Fund may enter into CDS contracts in order to hedge against a credit event, to enhance total return or to gain exposure to certain securities or markets. The Funds will not be permitted to enter into any swap transactions unless, at the time of entering into such transactions, the unsecured long-term debt of the actual counterparty combined with any credit enhancements, is rated at
77
Notes to financial statements
Delaware Corporate Bond Fund and Delaware Extended Duration Bond Fund
8. Derivatives (continued)
least BBB- by Standard & Poor’s Financial Services LLC (S&P) or Baa3 by Moody’s Investors Service Inc. (Moody’s) or is determined to be of equivalent credit quality by DMC.
Credit Default Swaps. A CDS contract is a risk-transfer instrument through which one party (purchaser of protection) transfers to another party (seller of protection) the financial risk of a credit event (as defined in the CDS agreement), as it relates to a particular reference security or basket of securities (such as an index). In exchange for the protection offered by the seller of protection, the purchaser of protection agrees to pay the seller of protection a periodic amount at a stated rate that is applied to the notional amount of the CDS contract. In addition, an upfront payment may be made or received by the Funds in connection with an unwinding or assignment of a CDS contract. Upon the occurrence of a credit event, the seller of protection would pay the par (or other agreed-upon) value of the reference security (or basket of securities) to the counterparty. Credit events generally include, among others, bankruptcy, failure to pay, and obligation default.
During the year ended July 31, 2014, the Funds entered into CDS contracts as a purchaser and seller of protection, as a hedge against credit events. Periodic payments (receipts) on such contracts are accrued daily and recorded as unrealized losses (gains) on swap contracts. Upon payment (receipt), such amounts are recorded as realized losses (gains) on swap contracts. Upfront payments made or received in connection with CDS contracts are amortized over the expected life of the CDS contracts as unrealized losses (gains) on swap contracts. The change in value of CDS contracts is recorded daily as unrealized appreciation or depreciation. A realized gain or loss is recorded upon a credit event (as defined in the CDS agreement) or the maturity or termination of the agreement.
CDS contracts may involve greater risks than if the Funds had invested in the reference obligation directly. CDS contracts are subject to general market risk, liquidity risk, counterparty risk and credit risk. The Funds’ maximum risk of loss from counterparty credit risk, either as the seller of protection or the buyer of protection, is the fair value of the contract. This risk is mitigated by (1) for bilateral swap contracts, having a netting arrangement between the Funds and the counterparty and by the posting of collateral by the counterparty to the Funds to cover the Funds’ exposure to the counterparty, and (2) for cleared swap contracts, trading these instruments through a central counterparty.
Swaps Generally. The value of open swaps may differ from that which would be realized in the event each Fund terminated its position in the contract on a given day. Risks of entering into these contracts include the potential inability of the counterparty to meet the terms of the contracts. This type of risk is generally limited to the amount of favorable movement in the value of the underlying security, instrument or basket of instruments, if any, at the day of default. Risks also arise from potential losses from adverse market movements and such losses could exceed the unrealized amounts. No swap contracts were outstanding at July 31, 2014.
During the year ended July 31, 2014, the Funds used CDS contracts to enhance total return.
78
Fair values of derivative instruments as of July 31, 2014 were as follows:
| | | | | | | | | | | | |
| | | Delaware Corporate Bond Fund | |
| | | Asset Derivatives | | | Liability Derivatives | |
| | | Statements of
Assets and Liabilities Location | | Fair Value | | | Statements of
Assets and Liabilities Location | | Fair Value | |
Interest rate contracts
(Futures contracts) | | Variation
margin due
from broker
on futures
contracts* | | $ | 67,817 | | | Variation
margin due
from broker
on futures
contracts* | | $ | (49,007 | ) |
Interest rate contracts
(Options written) | | Options
written, at
value | | | — | | | Options
written, at
value | | | (1,882,453 | ) |
| | | | | | | | | | | | |
Total | | | | $ | 67,817 | | | | | $ | (1,931,460 | ) |
| | | | | | | | | | | | |
| |
| | | Delaware Extended Duration Bond Fund | |
| | | Asset Derivatives | | | Liability Derivatives | |
| | | Statements of Assets and Liabilities Location | | Fair Value | | | Statements of Assets and Liabilities Location | | Fair Value | |
Interest rate contracts
(Futures contracts) | | Variation
margin due
to broker
on futures
contracts* | | $ | 68,677 | | | Variation
margin due
to broker
on futures
contracts* | | $ | (103,954 | ) |
| * | Includes cumulative appreciation (depreciation) of futures contracts from the date the contracts are opened through July 31, 2014. Only current day variation margin is reported on the Funds’ “Statements of assets and liabilities.” |
79
Notes to financial statements
Delaware Corporate Bond Fund and Delaware Extended Duration Bond Fund
8. Derivatives (continued)
The effect of derivative instruments on the “Statements of operations” for the year ended July 31, 2014 were as follows:
| | | | | | | | | | | | | | | | |
| | | Delaware Corporate Bond Fund | |
| |
| | | Net Realized Gain (Loss) on: | |
| | | Foreign
Currency
Exchange
Contracts | | | Futures
Contracts | | | Swap
Contracts | | | Total | |
Forward currency exchange contracts | | $ | (273,922 | ) | | $ | — | | | $ | — | | | $ | (273,922 | ) |
Interest rate contracts | | | — | | | | 1,690,775 | | | | 1,643,860 | | | | 3,334,635 | |
Credit contracts | | | — | | | | | | | | 436,381 | | | | 436,381 | |
| | | | | | | | | | | | | | | | |
Total | | $ | (273,922 | ) | | $ | 1,690,775 | | | $ | 2,080,241 | | | $ | 3,497,094 | |
| | | | | | | | | | | | | | | | |
| | | | | | | | | | | | | | | | | | | | |
| | | Delaware Corporate Bond Fund | |
| |
| | | Net Change in Unrealized Appreciation (Depreciation) of: | |
| | | | | |
| | | Foreign
Currency
Exchange
Contracts | | | Futures
Contracts | | | Options
Written | | | Swap
Contracts | | | Total | |
Forward currency exchange contracts | | $ | 73,995 | | | $ | — | | | $ | — | | | $ | — | | | $ | 73,995 | |
Interest rate contracts | | | — | | | | 18,810 | | | | 1,107,547 | | | | — | | | | 1,126,357 | |
Credit contracts | | | — | | | | — | | | | — | | | | (127,183 | ) | | | (127,183 | ) |
| | | | | | | | | | | | | | | | | | | | |
Total | | $ | 73,995 | | | $ | 18,810 | | | $ | 1,107,547 | | | $ | (127,183 | ) | | $ | 1,073,169 | |
| | | | | | | | | | | | | | | | | | | | |
| | | | | | | | | | | | | | | | |
| | | Delaware Extended Duration Bond Fund | |
| |
| | | Net Realized Gain (Loss) on: | |
| | | | |
| | | Foreign
Currency
Exchange
Contracts | | | Futures
Contracts | | | Swap Contracts | | | Total | |
Forward currency exchange contracts | | $ | (134,122 | ) | | $ | — | | | $ | — | | | $ | (134,122 | ) |
Interest rate contracts | | | — | | | | (505,801 | ) | | | 1,010,205 | | | | 504,404 | |
Credit contracts | | | — | | | | — | | | | 250,944 | | | | 250,944 | |
| | | | | | | | | | | | | | | | |
Total | | $ | (134,122 | ) | | $ | (505,801 | ) | | $ | 1,261,149 | | | $ | 621,226 | |
| | | | | | | | | | | | | | | | |
80
| | | | | | | | | | | | | | | | |
| | | Delaware Extended Duration Bond Fund | |
| |
| | | Net Change in Unrealized Appreciation (Depreciation) of: | |
| | | | |
| | | Foreign
Currency
Exchange
Contracts | | | Futures
Contracts | | | Swap
Contracts | | | Total | |
Forward currency exchange contracts | | $ | 37,725 | | | $ | — | | | $ | — | | | $ | 37,725 | |
Interest rate contracts | | | — | | | | 8,882,785 | | | | — | | | | 8,882,785 | |
Credit contracts | | | — | | | | — | | | | (73,663 | ) | | | (73,663 | ) |
| | | | | | | | | | | | | | | | |
Total | | $ | 37,725 | | | $ | 8,882,785 | | | $ | (73,663 | ) | | $ | 8,846,847 | |
| | | | | | | | | | | | | | | | |
Derivatives Generally. The table below summarizes the average balance of derivative holdings by the Funds during the year ended July 31, 2014.
| | | | | | | | |
| | | Long Derivative Volume | |
| | |
| | | Delaware Corporate Bond Fund | | | Delaware Extended Duration Bond Fund | |
Foreign currency exchange contracts (average cost) | | USD | 607,154 | | | USD | 330,027 | |
Futures contracts (average notional value) | | | 45,435,830 | | | | 113,927,382 | |
Options contracts (average notional value) | | | 8,905,109 | | | | 4,249,569 | |
Swap contracts (average notional value)* | | | 3,339,664 | | | | 1,764,684 | |
| |
| | | Short Derivative Volume | |
| | |
| | | Delaware
Corporate Bond Fund | | | Delaware Extended Duration Bond Fund | |
Futures contracts (average notional value) | | USD | 11,638,725 | | | USD | 169,632 | |
Options contracts (average notional value) | | | 1,226,493 | | | | — | |
Swap contracts (average notional value)* | | | 193,083 | | | | 117,589 | |
*Long represents buying protection and short represents selling protection.
9. Offsetting
In December 2011, the Financial Accounting Standards Board (FASB) issued guidance that expands current disclosure requirements on the offsetting of certain assets and liabilities. The new disclosures are required for investments and derivative financial instruments subject to master netting or similar agreements which are eligible for offset in the “Statements of assets and liabilities” and will require an entity to disclose both gross and net information about such investments and transactions in the financial statements. In January 2013, the FASB issued guidance that clarifies which investments and transactions are subject to the offsetting disclosure requirements. The scope of the disclosure requirements for offsetting is limited to derivative instruments, repurchase agreements, reverse repurchase agreements, and securities borrowing. The guidance is effective for financial statements with
81
Notes to financial statements
Delaware Corporate Bond Fund and Delaware Extended Duration Bond Fund
9. Offsetting (continued)
fiscal years beginning on or after Jan. 1, 2013, and interim periods within those fiscal years. The Funds adopted the disclosure provisions on offsetting during the current reporting period.
In order to better define its contractual rights and to secure rights that will help each Fund mitigate its counterparty risk, the Funds entered into an International Swaps and Derivatives Association, Inc. Master Agreement (ISDA Master Agreement) or a similar agreement with their derivative contract counterparties. An ISDA Master Agreement is a bilateral agreement between the Funds and a counterparty that governs over-the-counter (OTC) derivatives and foreign exchange contracts and typically contains, among other things, collateral posting items and netting provisions in the event of a default and/or termination event. Under an ISDA Master Agreement, each Fund may, under certain circumstances, offset with the counterparty certain derivative financial instruments’ payables and/or receivables with collateral held and/or posted and create one single net payment. The provisions of the ISDA Master Agreement typically permit a single net payment in the event of default (close-out) netting including the bankruptcy or insolvency of the counterparty. However, bankruptcy or insolvency laws of a particular jurisdiction may impose restrictions on or prohibitions against the right of offset in bankruptcy, insolvency, or other events.
For financial reporting purposes, each Fund does not offset derivative assets and derivative liabilities that are subject to netting arrangements in the “Statements of assets and liabilities.”
At July 31, 2014, the Funds had the following assets and liabilities subject to offsetting provisions:
Offsetting of Financial Assets and Liabilities and Derivative Assets and Liabilities
| | | | | | |
| | | Delaware Corporate Bond Fund |
| | | |
Counterparty | | Gross Value of
Derivative Asset | | Gross Value of
Derivative Liability | | Net Position |
Goldman Sachs Capital | | $1,107,547 | | $— | | $1,107,547 |
| | | | | | | | | | | | | | | | | | | | | | | | |
Counterparty | | Net Position | | | Fair Value
of
Non-Cash
Collateral
Received | | | Cash
Collateral
Received | | | Fair Value
of
Non-Cash
Collateral
Pledged | | | Cash
Collateral
Pledged | | | Net
Amount(a) | |
Goldman Sachs Capital | | $ | 1,107,547 | | | | $— | | | $ | (1,107,547 | ) | | | $— | | | | $— | | | | $— | |
82
Master Repurchase Agreements
| | | | | | | | | | | | | | | | | | | | |
| | | Delaware Corporate Bond Fund |
Counterparty | | Repurchase Agreements | | Fair Value of
Non-Cash
Collateral Received | | Cash Collateral
Received | | Net Amount(a) |
Bank of America Merrill Lynch | | | $ | 4,234,535 | | | | $ | (4,234,535 | ) | | | $ | — | | | | $ | — | |
Bank of Montreal | | | | 1,411,511 | | | | | (1,411,511 | ) | | | | — | | | | | — | |
BNP Paribas | | | | 7,921,954 | | | | | (7,921,954 | ) | | | | — | | | | | — | |
| | | | | | | | | | | | | | | | | | | | |
Total | | | $ | 13,568,000 | | | | $ | (13,568,000 | ) | | | $ | — | | | | $ | — | |
| | | | | | | | | | | | | | | | | | | | |
| |
| | | Delaware Extended Duration Bond Fund |
Counterparty | | Repurchase Agreements | | Fair Value of
Non-Cash
Collateral Received | | Cash Collateral
Received | | Net Amount(a) |
Bank of America Merrill Lynch | | | $ | 2,005,225 | | | | $ | (2,005,225 | ) | | | $ | — | | | | $ | — | |
Bank of Montreal | | | | 668,408 | | | | | (668,408 | ) | | | | — | | | | | — | |
BNP Paribas | | | | 3,751,367 | | | | | (3,751,367 | ) | | | | — | | | | | — | |
| | | | | | | | | | | | | | | | | | | | |
Total | | | $ | 6,425,000 | | | | $ | (6,425,000 | ) | | | $ | — | | | | $ | — | |
| | | | | | | | | | | | | | | | | | | | |
(a)Net represents the receivable/(payable) that would be due from/(to) the counterparty in the event of default.
10. Securities Lending
Each Fund, along with other funds in the Delaware Investments® Family of Funds, may lend its securities pursuant to a security lending agreement (Lending Agreement) with The Bank of New York Mellon (BNY Mellon). At the time a security is loaned, the borrower must post collateral equal to the required percentage of the market value of the loaned security, including any accrued interest. The required percentage is: (1) 102% with respect to U.S. securities and foreign securities that are denominated and payable in U.S. dollars; and (2) 105% with respect to foreign securities. With respect to each loan, if on any business day the aggregate market value of securities collateral plus cash collateral held is less than the aggregate market value of the securities which are the subject of such loan, the borrower will be notified to provide additional collateral by the end of the following business day which, together with the collateral already held, will be not less than the applicable initial collateral requirements for such security loan. If the aggregate market value of securities collateral and cash collateral held with respect to a security loan exceeds the applicable initial collateral requirement, upon the request of the borrower, BNY Mellon must return enough collateral to the borrower by the end of the following business day to reduce the value of the remaining collateral to the applicable initial collateral requirement for such security loan. As a result of the foregoing, the value of the collateral held with respect to a loaned security on any particular day, may be more or less than the value of the security on loan.
Cash collateral received is generally invested in the Delaware Investments Collateral Fund No. 1 (Collective Trust) established by BNY Mellon for the purpose of investment on behalf of funds managed by DMC that participate in BNY Mellon’s securities lending program. The Collective Trust may invest in U.S. government securities and high-quality corporate debt, asset-backed and other money market
83
Notes to financial statements
Delaware Corporate Bond Fund and Delaware Extended Duration Bond Fund
10. Securities Lending (continued)
securities, and in repurchase agreements collateralized by such securities, provided that the Collective Trust will generally have a dollar-weighted average portfolio maturity of 60 days or less. The Funds can also accept U.S. government securities and letters of credit (non-cash collateral) in connection with securities loans. In the event of default or bankruptcy by the lending agent, realization and/or retention of the collateral may be subject to legal proceedings. In the event the borrower fails to return the loaned securities and the collateral received is insufficient to cover the value of the loaned securities and provided such collateral shortfall is not the result of investment losses, the lending agent has agreed to pay the amount of the shortfall to the Funds or, at the discretion of the lending agent, replace the loaned securities. The Funds continue to record dividends or interest, as applicable, on the securities loaned and are subject to changes in value of the securities loaned that may occur during the term of the loan. The Funds have the right under the Lending Agreement to recover the securities from the borrower on demand. With respect to security loans collateralized by non-cash collateral, the Funds receive loan premiums paid by the borrower. With respect to security loans collateralized by cash collateral, the earnings from the collateral investments are shared among the Funds, the security lending agents and the borrower. The Funds record security lending income net of allocations to the security lending agents and the borrower.
The Collective Trust used for the investment of cash collateral received from borrowers of securities seeks to maintain a net asset value per unit of $1.00, but there can be no assurance that it will always be able to do so. The Funds may incur investment losses as a result of investing securities lending collateral in the Collective Trust. This could occur if an investment in a Collective Trust defaulted or if it were necessary to liquidate assets in the Collective Trust to meet returns on outstanding security loans at a time when the Collective Trust’s net asset value per unit was less than $1.00. Under those circumstances, the Funds may not receive an amount from the Collective Trust that is equal in amount to the collateral the Funds would be required to return to the borrower of the securities and the Funds would be required to make up for this shortfall.
At July 31, 2014, the Funds had no securities on loan.
11. Credit and Market Risk
Some countries in which the Funds may invest require governmental approval for the repatriation of investment income, capital, or the proceeds of sales of securities by foreign investors. In addition, if there is deterioration in a country’s balance of payments or for other reasons, a country may impose temporary restrictions on foreign capital remittances abroad.
The securities exchanges of certain foreign markets are substantially smaller, less liquid and more volatile than the major securities markets in the United States. Consequently, acquisition and disposition of securities by the Funds may be inhibited. In addition, a significant portion of the aggregate market value of securities listed on the major securities exchanges in emerging markets is held by a smaller number of investors. This may limit the number of shares available for acquisition or disposition by the Funds.
Each Fund invests in high yield fixed income securities, which are securities rated lower than BBB- by S&P and lower than Baa3 by Moody’s, or similarly rated by another nationally recognized statistical
84
rating organization. Investments in these higher yielding securities are generally accompanied by a greater degree of credit risk than higher rated securities. Additionally, lower rated securities may be more susceptible to adverse economic and competitive industry conditions than investment grade securities.
Each Fund may invest in fixed income securities whose value is derived from an underlying pool of mortgages or consumer loans. The value of these securities is sensitive to changes in economic conditions, including delinquencies and/or defaults, and may be adversely affected by shifts in the market’s perception of the issuers and changes in interest rates. Investors receive principal and interest payments as the underlying mortgages and consumer loans are paid back. Some of these securities are collateralized mortgage obligations (CMOs). CMOs are debt securities issued by U.S. government agencies or by financial institutions and other mortgage lenders, which are collateralized by a pool of mortgages held under an indenture. Prepayment of mortgages may shorten the stated maturity of the obligations and can result in a loss of premium, if any has been paid. Certain of these securities may be stripped (securities which provide only the principal or interest feature of the underlying security). The yield to maturity on an interest-only CMO is extremely sensitive not only to changes in prevailing interest rates, but also to the rate of principal payments (including prepayments) on the related underlying mortgage assets. A rapid rate of principal payments may have a material adverse effect on the Funds’ yield to maturity. If the underlying mortgage assets experience greater-than-anticipated prepayments of principal, the Funds may fail to fully recoup their initial investment in these securities even if the securities are rated in the highest rating categories.
Each Fund invests in certain obligations that may have liquidity protection designed to ensure that the receipt of payments due on the underlying security is timely. Such protection may be provided through guarantees, insurance policies or letters of credit obtained by the issuer or sponsor through third parties, through various means of structuring the transaction or through a combination of such approaches. The Funds will not pay any additional fees for such credit support, although the existence of credit support may increase the price of a security.
Each Fund may invest up to 15% of its net assets in illiquid securities, which may include securities with contractual restrictions on resale, securities exempt from registration under Rule 144A of the Securities Act of 1933, as amended, and other securities which may not be readily marketable. The relative illiquidity of these securities may impair the Funds from disposing of them in a timely manner and at a fair price when it is necessary or desirable to do so. While maintaining oversight, the Funds’ Board has delegated to DMC, the day-to-day functions of determining whether individual securities are liquid for purposes of the Funds’ limitation on investments in illiquid securities. Securities eligible for resale pursuant to Rule 144A, which are determined to be liquid, are not subject to the Funds’ 15% limit on investments in illiquid securities. Rule 144A and illiquid securities have been identified on the “Schedules of investments.”
12. Contractual Obligations
Each Fund enters into contracts in the normal course of business that contain a variety of indemnifications. The Funds’ maximum exposure under these arrangements is unknown. However, each Fund has not had prior claims or losses pursuant to these contracts. Management has reviewed the Funds’ existing contracts and expects the risk of loss to be remote.
85
Notes to financial statements
Delaware Corporate Bond Fund and Delaware Extended Duration Bond Fund
13. Recent Accounting Pronouncements
In June 2014, the Financial Accounting Standards Board issued guidance to improve the financial reporting of reverse repurchase agreements and other similar transactions. The guidance includes expanded disclosure requirements for entities that enter into reverse repurchase agreements and similar transactions accounted for as secured borrowings. The guidance is effective for financial statements with fiscal years beginning on or after Dec. 15, 2014 and interim periods within those fiscal years. Management is evaluating the impact, if any, of this guidance on the Funds’ financial statement disclosures.
14. Subsequent Events
Effective Sept. 25, 2014, all remaining shares of Class B were converted to Class A shares.
Management has determined that no other material events or transactions occurred subsequent to July 31, 2014 that would require recognition or disclosure in the Funds’ financial statements.
86
Report of independent registered
public accounting firm
To the Board of Trustees of Delaware Group® Income Funds
and the Shareholders of Delaware Corporate Bond Fund and Delaware Extended Duration Bond Fund:
In our opinion, the accompanying statements of assets and liabilities, including the schedules of investments, and the related statements of operations and of changes in net assets and the financial highlights present fairly, in all material respects, the financial position of Delaware Corporate Bond Fund and Delaware Extended Duration Bond Fund (two of the series constituting Delaware Group Income Funds, hereinafter referred to as the “Funds”) at July 31, 2014, the results of each of their operations for the year then ended, the changes in each of their net assets for each of the two years in the period then ended and the financial highlights for each of the five years in the period then ended, in conformity with accounting principles generally accepted in the United States of America. These financial statements and financial highlights (hereafter referred to as “financial statements”) are the responsibility of the Funds’ management. Our responsibility is to express an opinion on these financial statements based on our audits. We conducted our audits of these financial statements in accordance with the standards of the Public Company Accounting Oversight Board (United States). Those standards require that we plan and perform the audit to obtain reasonable assurance about whether the financial statements are free of material misstatement. An audit includes examining, on a test basis, evidence supporting the amounts and disclosures in the financial statements, assessing the accounting principles used and significant estimates made by management, and evaluating the overall financial statement presentation. We believe that our audits, which included confirmation of securities at July 31, 2014 by correspondence with the custodian and brokers, and the application of alternative auditing procedures where confirmations of security purchases had not been received, provide a reasonable basis for our opinion.
PricewaterhouseCoopers LLP
Philadelphia, Pennsylvania
September 19, 2014
87
Other Fund information (Unaudited)
Delaware Corporate Bond Fund and Delaware Extended Duration Bond Fund
Tax Information
The information set forth below is for each Fund’s fiscal year as required by federal income tax laws. Shareholders, however, must report distributions on a calendar year basis for income tax purposes, which may include distributions for portions of two fiscal years of the Funds. Accordingly, the information needed by shareholders for income tax purposes will be sent to them in January of each year. Please consult your tax advisor for proper treatment of this information.
All disclosures are based on financial information available as of the date of this annual report and, accordingly are subject to change. For any and all items requiring reporting, it is the intention of the Funds to report the maximum amount permitted under the Internal Revenue Code and the regulations thereunder.
For the fiscal year ended July 31, 2014, each Fund reports distributions paid during the year as follows:
| | | | | | | | |
| | | (A)
Long-Term
Capital Gains
Distributions
(Tax Basis) | | (B)
Ordinary Income
Distributions*
(Tax Basis) | | Total
Distributions
(Tax Basis) | | (C)
Qualifying
Dividends1 |
Delaware Corporate Bond Fund | | 26.56% | | 73.44% | | 100.00% | | 5.50% |
Delaware Extended Duration Bond Fund | | 0.00% | | 100.00% | | 100.00% | | 6.02% |
(A) and (B) are based on a percentage of each Fund’s total distributions.
(C) is based on a percentage of each Fund’s ordinary income distributions
1 Qualifying dividends represent dividends which qualify for the corporate dividends received deduction.
| * | For the fiscal year ended July 31, 2014, certain dividends paid by the Funds may be subject to a maximum tax rate of 15%, as provided by the Jobs and Growth Tax Relief Reconciliation Act of 2003, as extended by the Tax Relief, Unemployment Insurance Reauthorization and Jobs Creation Act of 2010, and made permanent by the American Taxpayer Relief Act of 2012. The Funds intend to report the following percentages to be taxed at a maximum rate of 15%. Complete information will be computed and reported in conjunction with your 2014 Form 1099-DIV. |
| | | | |
| | | Delaware
Corporate
Bond Fund | | Delaware
Extended Duration
Bond Fund |
| | 6.14% | | 6.02% |
For the fiscal year ended July 31, 2014, certain dividends paid by Delaware Corporate Bond Fund have been determined to be interest-related dividends and may be subject to relief from U.S. withholding for foreign shareholders, as provided by the American Jobs Creation Act of 2004 and as extended by the Tax Relief, Unemployment Insurance Reauthorization and Jobs Creation Act of 2010. Delaware Extended Duration Bond Fund did not have any foreign shareholders for the fiscal year ended July 31, 2014. For the fiscal year ended July 31, 2014, Delaware Corporate Bond Fund has reported maximum distributions as follows:
| | | | |
Qualified Interest Income | | $ | 48,365,046 | |
88
This page intentionally left blank.
Board of trustees / directors and officers addendum
Delaware Investments® Family of Funds
A mutual fund is governed by a Board of Trustees / Directors (“Trustees”), which has oversight responsibility for the management of a fund’s business affairs. Trustees establish procedures and oversee and review the performance of the investment manager, the distributor, and others who perform services for the fund. The independent fund trustees, in particular, are advocates
| | | | |
| Name, Address, | | Position(s) | | Length of |
| and Birth Date | | Held with Fund(s) | | Time Served |
| Interested Trustees | | | | |
| Patrick P. Coyne1 | | Chairman, President, | | Chairman and Trustee |
| 2005 Market Street | | Chief Executive Officer, | | since August 16, 2006 |
| Philadelphia, PA 19103 | | and Trustee | | |
| April 1963 | | | | President and |
| | | | Chief Executive Officer |
| | | | since August 1, 2006 |
| | | | |
| | | | |
| Independent Trustees | | | | |
| Thomas L. Bennett | | Trustee | | Since March 2005 |
| 2005 Market Street | | | | |
| Philadelphia, PA 19103 | | | | |
October 1947 | | | | |
| Joseph W. Chow | | Trustee | | Since January 2013 |
| 2005 Market Street | | | | |
| Philadelphia, PA 19103 | | | | |
| January 1953 | | | | |
| | | | |
| | | | |
| | | | | |
| John A. Fry | | Trustee | | Since January 2001 |
| 2005 Market Street | | | | |
| Philadelphia, PA 19103 | | | | |
| May 1960 | | | | |
| | | | |
| | | | |
| | | | | |
| 1 | Patrick P. Coyne is considered to be an “Interested Trustee“ because he is an executive officer of the Fund’s(s’) investment advisor. |
90
for shareholder interests. Each trustee has served in that capacity since he or she was elected to or appointed to the Board of Trustees, and will continue to serve until his or her retirement or the election of a new trustee in his or her place. The following is a list of the Trustees and Officers with certain background and related information.
| | | | |
| | Number of Portfolios in | | |
| Principal Occupation(s) | | Fund Complex Overseen | | Other Directorships |
| During Past 5 Years | | by Trustee or Officer | | Held by Trustee or Officer |
| | | | |
| Patrick P. Coyne has served in | | 70 | | Board of Governors Member |
| various executive capacities | | | | Investment Company |
| at different times at | | | | Institute (ICI) |
| Delaware Investments.2 | | | | |
| | | | Director and Audit |
| | | | Committee Member |
| | | | Kaydon Corp. |
| | | | (2007–2013) |
| | | | |
| Private Investor | | 70 | | Director |
| (March 2004–Present) | | | | Bryn Mawr Bank Corp. (BMTC) |
| | | | (2007–2011) |
| | | | |
| | | | | |
| Executive Vice President | | 70 | | Director and Audit Committee |
| (Emerging Economies | | | | Member — Hercules |
| Strategies, Risk and | | | | Technology Growth |
| Corporate Administration) | | | | Capital, Inc. |
| State Street Corporation | | | | |
(July 2004–March 2011) | | | | |
| President | | 70 | | Director — Hershey Trust |
| Drexel University | | | | |
| (August 2010–Present) | | | | Director and Audit |
| | | | Committee Member |
| President | | | | Community Health Systems |
| Franklin & Marshall College | | | | |
(July 2002–July 2010) | | | | |
| 2 | Delaware Investments is the marketing name for Delaware Management Holdings, Inc. and its subsidiaries, including the Fund’s(s’) investment advisor, principal underwriter, and its transfer agent. |
91
Board of trustees / directors and officers addendum
Delaware Investments® Family of Funds
| | | | |
| Name, Address, | | Position(s) | | Length of |
| and Birth Date | | Held with Fund(s) | | Time Served |
| Independent Trustees (continued) | | | | |
| Lucinda S. Landreth | | Trustee | | Since March 2005 |
| 2005 Market Street | | | | |
| Philadelphia, PA 19103 | | | | |
June 1947 | | | | |
| Frances A. Sevilla-Sacasa | | Trustee | | Since September 2011 |
| 2005 Market Street | | | | |
| Philadelphia, PA 19103 | | | | |
| January 1956 | | | | |
| | | | |
| | | | |
| | | | |
| | | | |
| | | | |
| | | | | |
| Thomas K. Whitford | | Trustee | | Since January 2013 |
| 2005 Market Street | | | | |
| Philadelphia, PA 19103 | | | | |
| March 1956 | | | | |
| | | | |
| | | | |
| | | | |
| | | | |
| | | | |
| | | | | |
92
| | | | |
| | Number of Portfolios in | | |
| Principal Occupation(s) | | Fund Complex Overseen | | Other Directorships |
| During Past 5 Years | | by Trustee or Officer | | Held by Trustee or Officer |
| | | | |
| Private Investor | | 70 | | None |
| (2004–Present) | | | | |
| | | | |
| | | | | |
| Chief Executive Officer — | | 70 | | Trust Manager and |
| Banco Itaú | | | | Audit Committee |
| International | | | | Member — Camden |
| (April 2012–Present) | | | | Property Trust |
| | | | |
| Executive Advisor to Dean | | | | |
(August 2011–March 2012) and Interim Dean | | | | |
| (January 2011–July 2011) — | | | | |
| University of Miami School of | | | | |
| Business Administration | | | | |
| | | | |
| President — U.S. Trust, | | | | |
| Bank of America Private | | | | |
| Wealth Management | | | | |
| (Private Banking) | | | | |
(July 2007–December 2008) | | | | |
| Vice Chairman | | 70 | | Director — HSBC Finance |
| (2010–April 2013) | | | | Corporation and HSBC |
| Chief Administrative | | | | North America Holdings Inc. |
Officer (2008–2010) and Executive Vice | | | | |
| President and Chief | | | | |
| Administrative Officer | | | | |
| (2007–2009) — | | | | |
| PNC Financial | | | | |
| Services Group | | | | |
93
Board of trustees / directors and officers addendum
Delaware Investments® Family of Funds
| | | | |
| Name, Address, | | Position(s) | | Length of |
| and Birth Date | | Held with Fund(s) | | Time Served |
| Independent Trustees (continued) | | | | |
| Janet L. Yeomans | | Trustee | | Since April 1999 |
| 2005 Market Street | | | | |
| Philadelphia, PA 19103 | | | | |
| July 1948 | | | | |
| | | | |
| | | | |
| | | | |
| | | | |
| | | | | |
| J. Richard Zecher | | Trustee | | Since March 2005 |
| 2005 Market Street | | | | |
| Philadelphia, PA 19103 | | | | |
| July 1940 | | | | |
| | | | |
| | | | |
| | | | |
| | | | |
| | | | | |
94
| | | | |
| | Number of Portfolios in | | |
| Principal Occupation(s) | | Fund Complex Overseen | | Other Directorships |
| During Past 5 Years | | by Trustee or Officer | | Held by Trustee or Officer |
| | | | |
| Vice President and Treasurer | | 70 | | Director, Audit |
| (January 2006–July 2012) | | | | Committee Chair, Investment |
| Vice President — | | | | Committee Member, |
| Mergers & Acquisitions | | | | and Governance |
| (January 2003–January 2006), | | | | Committee Member |
| and Vice President | | | | Okabena Company |
| and Treasurer | | | | |
| (July 1995–January 2003) | | | | Chair — 3M |
| 3M Corporation | | | | Investment Management |
| | | | Company |
| | | | | (2005–2012) |
| Founder | | 70 | | Director and Compensation |
| Investor Analytics | | | | Committee Member |
| (Risk Management) | | | | Investor Analytics |
| (May 1999–Present) | | | | |
| | | | Director — P/E Investments |
| Founder | | | | |
| P/E Investments | | | | |
| (Hedge Fund) | | | | |
(September 1996–Present) | | | | |
95
Board of trustees / directors and officers addendum
Delaware Investments® Family of Funds
| | | | |
| Name, Address, | | Position(s) | | Length of |
| and Birth Date | | Held with Fund(s) | | Time Served |
| Officers | | | | |
| David F. Connor | | Senior Vice President, | | Senior Vice President, |
| 2005 Market Street | | Deputy General | | Deputy General Counsel |
| Philadelphia, PA 19103 | | Counsel, and Secretary | | since May 2013; |
| December 1963 | | | | Vice President, Deputy |
| | | | General Counsel |
| | | | September 2000 – |
| | | | May 2013; Secretary since |
| | | | | October 2005 |
| Daniel V. Geatens | | Vice President | | Treasurer since October 2007 |
| 2005 Market Street | | and Treasurer | | |
| Philadelphia, PA 19103 | | | | |
October 1972 | | | | |
| David P. O’Connor | | Executive Vice President, | | Executive Vice President |
| 2005 Market Street | | General Counsel | | since February 2012; |
| Philadelphia, PA 19103 | | and Chief Legal Officer | | Senior Vice President |
| February 1966 | | | | October 2005 – |
| | | | February 2012; |
| | | | General Counsel and |
| | | | Chief Legal Officer |
| | | | | since October 2005 |
| Richard Salus | | Senior Vice President | | Chief Financial Officer |
| 2005 Market Street | | and Chief Financial Officer | | since November 2006 |
| Philadelphia, PA 19103 | | | | |
October 1963 | | | | |
The Statement of Additional Information for the Fund(s) includes additional information about the Trustees and Officers and is available, without charge, upon request by calling 800 523-1918.
96
| | | | |
| | Number of Portfolios in | | |
| Principal Occupation(s) | | Fund Complex Overseen | | Other Directorships |
| During Past 5 Years | | by Trustee or Officer | | Held by Trustee or Officer |
| | | | |
| David F. Connor has served as | | 70 | | None3 |
| Deputy General Counsel of | | | | |
Delaware Investments since 2000. | | | | |
| Daniel V. Geatens has served | | 70 | | None3 |
in various capacities at different times at | | | | |
Delaware Investments. | | | | |
| David P. O’Connor has served | | 70 | | None3 |
in various executive and legal capacities at different times at Delaware Investments. | | | | |
| Richard Salus has served in | | 70 | | None3 |
various executive capacities at different times at | | | | |
Delaware Investments. | | | | |
| 3 | David F. Connor, Daniel V. Geatens, David P. O’Connor, and Richard Salus serve in similar capacities for the six portfolios of the Optimum Fund Trust, which have the same investment advisor, principal underwriter, and transfer agent as the registrant. |
97
About the organization
| | | | | | |
| Board of trustees | | | | | | |
Patrick P. Coyne | | Joseph W. Chow | | Lucinda S. Landreth | | Thomas K. Whitford |
Chairman, President, and | | Former Executive Vice | | Former Chief Investment | | Former Vice Chairman |
Chief Executive Officer | | President | | Officer | | PNC Financial Services Group |
Delaware Investments ® | | State Street Corporation | | Assurant, Inc. | | Pittsburgh, PA |
Family of Funds | | Brookline, MA | | Philadelphia, PA | | |
Philadelphia, PA | | | | | | Janet L. Yeomans |
| | John A. Fry | | Frances A. | | Former Vice President |
| Thomas L. Bennett | | President | | Sevilla-Sacasa | | and Treasurer |
Private Investor | | Drexel University | | Chief Executive Officer | | 3M Corporation |
Rosemont, PA | | Philadelphia, PA | | Banco Itaú | | St. Paul, MN |
| | | | International | | |
| | | | Miami, FL | | J. Richard Zecher |
| | | | | | Founder |
| | | | | | Investor Analytics |
| | | | | | Scottsdale, AZ |
| Affiliated officers | | | | | | |
| | | |
David F. Connor | | Daniel V. Geatens | | David P. O’Connor | | Richard Salus |
Senior Vice President, | | Vice President and | | Executive Vice President, | | Senior Vice President and |
Deputy General Counsel, | | Treasurer | | General Counsel, | | Chief Financial Officer |
and Secretary | | Delaware Investments | | and Chief Legal Officer | | Delaware Investments |
Delaware Investments | | Family of Funds | | Delaware Investments | | Family of Funds |
Family of Funds | | Philadelphia, PA | | Family of Funds | | Philadelphia, PA |
Philadelphia, PA | | | | Philadelphia, PA | | |
This annual report is for the information of Delaware Corporate Bond Fund and Delaware Extended Duration Bond Fund shareholders, but it may be used with prospective investors when preceded or accompanied by the Delaware Investments Fund fact sheet for the most recently completed calendar quarter. These documents are available at delawareinvestments.com.
Delaware Investments is the marketing name of Delaware Management Holdings, Inc. and its subsidiaries.
Each Fund files its complete schedule of portfolio holdings with the Securities and Exchange Commission (SEC) for the first and third quarters of each fiscal year on Form N-Q. Each Fund’s Forms N-Q, as well as a description of the policies and procedures that each Fund uses to determine how to vote proxies (if any) relating to portfolio securities are available without charge (i) upon request, by calling 800 523-1918; and (ii) on the SEC’s website at sec.gov. In addition, a description of the policies and procedures that each Fund uses to determine how to vote proxies (if any) relating to portfolio securities and each Fund’s Schedule of Investments are available without charge on the Funds’ website at delawareinvestments.com. Each Fund’s Forms N-Q may be reviewed and copied at the SEC’s Public Reference Room in Washington, D.C.; information on the operation of the Public Reference Room may be obtained by calling 800 SEC-0330.
Information (if any) regarding how the Funds voted proxies relating to portfolio securities during the most recently disclosed 12-month period ended June 30 is available without charge (i) through the Funds’ website at delawareinvestments.com; and (ii) on the SEC’s website at sec.gov.
98

Annual report
Fixed income mutual fund
Delaware High-Yield Opportunities Fund
July 31, 2014
Carefully consider the Fund’s investment objectives, risk factors, charges, and expenses before investing. This and other information can be found in the Fund’s prospectus and its summary prospectus, which may be obtained by visiting delawareinvestments.com or calling 800 523-1918. Investors should read the prospectus and the summary prospectus carefully before investing.
You can obtain shareholder reports and prospectuses online instead of in the mail.
Visit delawareinvestments.com/edelivery.
Experience Delaware Investments
Delaware Investments is committed to the pursuit of consistently superior asset management and unparalleled client service. We believe in our investment processes, which seek to deliver consistent results, and in convenient services that help add value for our clients.
If you are interested in learning more about creating an investment plan, contact your financial advisor.
You can learn more about Delaware Investments or obtain a prospectus for Delaware High-Yield Opportunities Fund at delawareinvestments.com.
Manage your investments online
| — | | 24-hour access to your account information |
| — | | Check your account balance and recent transactions |
| — | | Request statements or literature |
| — | | Make purchases and redemptions |
Delaware Management Holdings, Inc. and its subsidiaries (collectively known by the marketing name of Delaware Investments) are wholly owned subsidiaries of Macquarie Group Limited, a global provider of banking, financial, advisory, investment, and funds management services.
Investments in Delaware High-Yield Opportunities Fund are not and will not be deposits with or liabilities of Macquarie Bank Limited ABN 46008583542 and its holding companies, including their subsidiaries or related companies (Macquarie Group), and are subject to investment risk, including possible delays in repayment and loss of income and capital invested. No Macquarie Group company guarantees or will guarantee the performance of the Fund, the repayment of capital from the Fund, or any particular rate of return.
Unless otherwise noted, views expressed herein are current as of July 31, 2014, and subject to change.
Funds are not FDIC insured and are not guaranteed. It is possible to lose the principal amount invested.
Mutual fund advisory services provided by Delaware Management Company, a series of Delaware Management Business Trust, which is a registered investment advisor. Delaware Investments, a member of Macquarie Group, refers to Delaware Management Holdings, Inc. and its subsidiaries, including the Fund’s distributor, Delaware Distributors, L.P. Macquarie Group refers to Macquarie Group Limited and its subsidiaries and affiliates worldwide.
© 2014 Delaware Management Holdings, Inc.
All third-party marks cited are the property of their respective owners.
Portfolio management review
| | |
Delaware High-Yield Opportunities Fund | | August 12, 2014 |
| | | | |
| Performance preview (for the year ended July 31, 2014) | | | | |
Delaware High-Yield Opportunities Fund (Class A shares) | | 1-year return | | +8.59% |
BofA Merrill Lynch U.S. High Yield Constrained Index (benchmark) | | 1-year return | | +8.28% |
Past performance does not guarantee future results.
For complete, annualized performance for Delaware High-Yield Opportunities Fund, please see the table on page 4. The performance of Class A shares excludes the applicable sales charge and reflects the reinvestment of all distributions. Index performance returns do not reflect any management fees, transaction costs, or expenses. Indices are unmanaged and one cannot invest directly in an index.
| | | | |
High yield bonds generated solid returns over the Fund’s fiscal year ended July 31, 2014, as investors aggressively sought income in an unusually low-interest-rate world. With the U.S. Federal Reserve holding benchmark interest rates at virtually zero since December 2008 – accompanied by a pledge to keep them there until at least mid-2015 – longer-term bond yields declined amid an almost insatiable demand for yield. The sub-investment-grade sector of the U.S. bond market also was supported by favorable credit metrics that kept default rates well below the historical average, and by ample access to bank and capital market credit. That access enabled issuers to refinance outstanding or maturing bonds at interest rates that hovered near 60-year lows. High yield bond prices received a further boost from an unexpected decline in intermediate- and longer-term interest rates. As calendar 2014 began, the 10-year U.S. Treasury note yielded about 3%, a number that was widely expected to inch higher as the economy gained traction. However, weak first-quarter economic numbers (attributed mostly to a harsh winter) and an outbreak of geopolitical hostilities in Ukraine and the Middle East pushed yields in the opposite direction over the last half of the Fund’s fiscal year. Meanwhile, the steady rise in corporate profitability underwrote a bull market in equities that supported high yield valuations. | | | | The high yield sector benefited from several key factors: — Strong demand for yield from individual and institutional investors — Exceptionally stable and accommodative monetary policy — Historically low default rates and strengthening corporate balance sheets. |
1
Portfolio management review
Delaware High-Yield Opportunities Fund
The Fund’s fiscal year also was characterized by a relatively small – but still significant – variation in performance by credit tier and industry sector. Lower-quality bonds outperformed during the second half of 2013, while in recent months relative strength shifted toward the higher-quality credit tier, in response to concerns about valuations amid a poor first-quarter gross domestic product report. Overall, however, CCC-rated issues outperformed during the fiscal year, followed by BB- and B-rated debt. Among industry groups, financial services companies (primarily banking and insurance) and utilities led the way during the fiscal period – with the latter a prime beneficiary of falling interest rates in 2014. Among lagging sectors, cyclical groups underperformed due to a lack of confidence in the economic recovery, while healthcare was hurt by the group’s mostly higher quality credit profile.
Fund performance
For its fiscal year ended July 31, 2014, Delaware High-Yield Opportunities Fund returned +8.59% at net asset value and +3.74% at maximum offer price (both figures reflect Class A shares with all distributions reinvested). During the same period, the Fund’s benchmark, the BofA Merrill Lynch U.S. High Yield Constrained Index, returned +8.28%. For complete, annualized performance of Delaware High-Yield Opportunities Fund, please see the table on page 4.
We attribute the Fund’s strong nominal and relative performance to its continued overweight allocation to CCC-rated debt, the bottom end of the sub-investment-grade credit spectrum. This strategy reflected our view that taking credit risk was preferable to taking interest rate risk. Within the CCC category, however, we generally preferred the higher-rated issues, which we viewed as offering attractive value. Meanwhile, the Fund’s underweight to BB-rated bonds modestly detracted from relative performance, especially late in the fiscal year. The Fund’s below-
benchmark allocation to BB-rated issues – a credit sector generally viewed as the most vulnerable to rising interest rates – reflected our view that there soon might be a bias toward tighter monetary policy.
Meanwhile, the Fund’s sector weightings remained stable, although we did increase exposure to bank loans, from near zero to about 10%. The bank loan sector traded with yields similar to those within the BB-rated space despite occupying the highest-rated piece of the capital structure. As such, we viewed the group as offering good value, in addition to providing a degree of protection against rising rates because of its floating-rate component.
Among individual issues, the Fund’s strongest-performing position was Algeco Scotsman, a global company that provides modular space solutions to businesses through the leasing of construction trailers, modular classrooms, and other temporary workplace facilities. Algeco Scotsman carried a 10.75% coupon and was positioned to benefit from low borrowing costs and the preference of global managements to lease, rather than own, when possible. The Fund’s position in investment management firm Nuveen Investments also contributed to relative performance, in part because its 9.5% coupon attracted buyers looking for extra yield, and also because it agreed to be acquired by TIAA-CREF, the large teachers’ pension fund. Another of the Fund’s holdings in the banking sector, U.K.-based Barclays, also posted strong relative performance. Like other major financial services companies, Barclays has been rebuilding capital, growing earnings, and lowering credit losses.
Conversely, the Fund’s position in Getty Images underperformed, mostly due to earnings that failed to meet consensus expectations. The company, which owns a large commercial photo archive, suffered from weakness in the publishing industry, particularly magazines and newspapers. We were attracted to the company’s asset value, but the
2
consistent earnings misses compelled us to exit the position. The Fund’s holdings in trendy apparel retailer Quiksilver underperformed on the basis of repeated earnings disappointments as well. As the fiscal year ended, we continued to maintain the position. The Fund’s allocation to David’s Bridal also lagged the benchmark. The company rents wedding dresses, prom gowns, and other formal wear. Despite its having what we believe is a sound business model, the company has often seen its earnings fall short of expectations. We attribute this to less-than-ideal store locations, inventory problems, and a less-than-robust economy.
The Fund’s derivative exposure was limited to Treasury futures, which we employed to attempt to protect against rising interest rates in the 1–5 year portion of the yield curve. That hedge, which represented a little more than 4% of Fund assets as of July 31, 2014, was put in place early in the Fund’s fiscal year and had a negligible effect on portfolio performance. The Fund’s Treasury futures position was still outstanding as the fiscal year ended, reflecting our view that when interest rates finally begin to climb, the short end of the yield curve – historically the most sensitive to Fed policy – should be affected the most.
Positioning
We have positioned the Fund to potentially benefit from acceleration in economic growth, a trend that typically favors credit-sensitive parts of the market. As such, the Fund ended the fiscal year overweight in CCC-rated and B-rated bonds, and was correspondingly underweight in BB-rated issues. However, within the CCC sector, the Fund’s holdings had a significantly below-benchmark yield, reflecting a better relative credit profile, while the Fund’s BB issues yielded more than the benchmark. That positioning reflects an effort to take prudent credit risk while keeping interest rate risk in line with the Fund’s benchmark
duration of 4.2 years. With regard to sectors, the Fund is overweight insurance, technology, energy, and utilities, and underweight healthcare and services, including airlines, hotels, gaming, and leasing. The Fund is positioned to avoid large duration or sector bets; our objective is to generate outperformance through top-down (macro-economic) and bottom-up (bond-by-bond) credit selection.
3
Performance summary
| | |
Delaware High-Yield Opportunities Fund | | July 31, 2014 |
The performance data quoted represent past performance; past performance does not guarantee future results. Investment return and principal value will fluctuate so your shares, when redeemed, may be worth more or less than their original cost. Please obtain the performance data current for the most recent month end by calling 800 523-1918 or visiting our website at delawareinvestments.com/performance. Current performance may be lower or higher than the performance data quoted.
| | | | | | | | | | | | |
Fund and benchmark performance1,2 | | | Average annual total returns through July 31, 2014 | |
| | | | 1 year | | | | 5 years | | | | 10 years | |
Class A (Est. Dec. 30, 1996) | | | | | | | | | | | | |
Excluding sales charge | | | +8.59% | | | | +12.21% | | | | +8.38% | |
Including sales charge | | | +3.74% | | | | +11.17% | | | | +7.88% | |
Class B (Est. Feb. 17, 1998) | | | | | | | | | | | | |
Excluding sales charge | | | +8.25% | | | | +11.52% | | | | +7.78% | |
Including sales charge | | | +4.25% | | | | +11.32% | | | | +7.78% | |
Class C (Est. Feb. 17, 1998) | | | | | | | | | | | | |
Excluding sales charge | | | +7.79% | | | | +11.47% | | | | +7.65% | |
Including sales charge | | | +6.79% | | | | +11.47% | | | | +7.65% | |
Class R (Est. June 2, 2003) | | | | | | | | | | | | |
Excluding sales charge | | | +8.08% | | | | +11.96% | | | | +8.17% | |
Including sales charge | | | +8.08% | | | | +11.96% | | | | +8.17% | |
Institutional Class (Est. Dec. 30, 1996) | | | | | | | | | | | | |
Excluding sales charge | | | +8.87% | | | | +12.53% | | | | +8.70% | |
Including sales charge | | | +8.87% | | | | +12.53% | | | | +8.70% | |
BofA Merrill Lynch U.S. High Yield | | | | | | | | | | | | |
Constrained Index | | | +8.28% | | | | +12.25% | | | | +8.62% | |
1 Returns reflect the reinvestment of all distributions and are presented both with and without the applicable sales charges described below. Returns do not reflect the deduction of taxes the shareholder would pay on Fund distributions or redemptions of Fund shares.
Expense limitations were in effect for certain classes during some or all of the periods shown in the “Fund and benchmark performance” table. Expenses for each class are listed on the “Fund expense ratios” table on page 6. Performance would have been lower had expense limitations not been in effect.
Class A shares are sold with a maximum front-end sales charge of 4.50%, and have an annual distribution and service fee of 0.25% of average daily net assets. The Board has adopted a formula for calculating 12b-1 plan fees for the Fund’s Class A shares. The Fund’s Class A shares are currently subject to a blended 12b-1 fee equal to the sum of: (i) 0.10% of average daily net assets representing shares acquired prior to June 1, 1992, and (ii) 0.25% of average daily net assets representing shares acquired on or after June 1, 1992. All Class A shares currently bear 12b-1 fees at the same rate, the blended rate, currently 0.25% of average daily net assets, based
4
on the formula described above. This method of calculating Class A 12b-1 fees may be discontinued at the sole discretion of the Board. Performance for Class A shares, excluding sales charges, assumes that no front-end sales charge applied. Prior to Oct. 1, 2013, Class A shares had an annual distribution and service fee of 0.30% of average daily net assets. This fee was contractually limited to 0.25% from Nov. 28, 2012 until Oct. 1, 2013. Prior to Oct. 1, 2013, the Fund’s Class A shares were subject to a blended 12b-1 fee equal to the sum of: (i) 0.10% of average daily net assets representing shares acquired prior to June 1, 1992, and (ii) 0.30% (which had been limited to 0.25%) of average daily net assets representing shares acquired on or after June 1, 1992.
All remaining Class B shares were converted to Class A shares on Sept. 25, 2014. Prior to Sept. 25, 2014, Class B shares were available for purchase only through dividend reinvestment and certain permitted exchanges as was described in the prospectus. Class B shares had a contingent deferred sales charge that declined from 4.00% to zero depending on the period of time the shares were held. They were also subject to an annual distribution and service fee of 1.00% of average daily net assets. This fee was contractually limited to 0.25% of average daily net assets from Jan. 2, 2014 through July 31, 2014.* Prior to Jan. 2, 2014, there was no waiver. Please see Note 14 in “Notes to financial statements” for more information. Ten-year performance figures for Class B shares reflect conversion to Class A shares after approximately eight years.
Class C shares are sold with a contingent deferred sales charge of 1.00% if redeemed during the first 12 months. They are also subject to an annual
*The contractual waiver period is from Jan. 2, 2014 through Nov. 27, 2015.
distribution and service fee of 1.00% of average daily net assets.
Performance for Class B and C shares, excluding sales charges, assumes either that contingent deferred sales charges did not apply or that the investment was not redeemed.
Class R shares are available only for certain retirement plan products. They are sold without a sales charge and have an annual distribution and service fee of 0.50% of average daily net assets. Prior to Oct. 1, 2013, the Fund paid an annual distribution and service fee of 0.60% of average daily net assets. This fee was contractually limited to 0.50% of average daily net assets from Nov. 28, 2012 through Oct. 1, 2013.
Institutional Class shares are available without sales or asset-based distribution charges only to certain eligible institutional accounts.
The “Fund and benchmark performance” table and the “Performance of a $10,000 investment” graph on page 7 do not reflect the deduction of taxes the shareholder would pay on Fund distributions or redemptions of Fund shares.
Fixed income securities and bond funds can lose value, and investors can lose principal, as interest rates rise. They also may be affected by economic conditions that hinder an issuer’s ability to make interest and principal payments on its debt.
The Fund may also be subject to prepayment risk, the risk that the principal of a fixed income security that is held by the Fund may be prepaid prior to maturity, potentially forcing the Fund to reinvest that money at a lower interest rate.
High yielding, noninvestment grade bonds (junk bonds) involve higher risk than investment grade bonds. The high yield secondary market is particularly susceptible to liquidity problems when institutional investors, such as mutual funds and certain other financial institutions, temporarily stop buying bonds for regulatory, financial, or other reasons. In addition, a less liquid secondary market makes it more difficult for the Fund to
5
Performance summary
Delaware High-Yield Opportunities Fund
obtain precise valuations of the high yield securities in its portfolio.
International investments entail risks not ordinarily associated with U.S. investments including fluctuation in currency values, differences in accounting principles, or economic or political instability in other nations.
Investing in emerging markets can be riskier than investing in established foreign markets due to increased volatility and lower trading volume.
Per Standard & Poor’s credit rating agency, bonds rated AA and A are more susceptible to the adverse effects of changes in circumstances and
economic conditions than those in the higher-rated AAA category, but the obligor’s capacity to meet its financial commitment on the obligation is still strong. Bonds rated BBB exhibit adequate protection parameters, although adverse economic conditions or changing circumstances are more likely to lead to a weakened capacity of the obligor to meet its financial commitments. Bonds rated BB, B, and CCC are regarded as having significant speculative characteristics, with BB indicating the least degree of speculation of the three.
2 The Fund’s expense ratios, as described in the most recent prospectus, are disclosed in the following “Fund expense ratios” table. Delaware Management Company has agreed to reimburse certain expenses and/or waive certain fees in order to prevent total fund operating expenses (excluding any 12b-1 plan, taxes, interest, inverse floater program expenses, short sale and dividend interest expenses, brokerage fees, certain insurance costs, acquired fund fees and expenses, and nonroutine expenses or costs, including, but not limited to, those relating to reorganizations, litigation, conducting shareholder meetings, and liquidations (collectively, nonroutine expenses)) from exceeding 0.81% of the Fund’s average daily net assets during the period from Aug. 1, 2013, through July 31, 2014.** Please see the most recent prospectus and any applicable supplement(s) for additional information on these fee waivers and/or reimbursements.
| | | | | | | | | | |
Fund expense ratios | | Class A | | Class B† | | Class C | | Class R | | Institutional Class |
Total annual operating expenses | | 1.11% | | 1.86% | | 1.86% | | 1.36% | | 0.86% |
(without fee waivers) | | | | | | | | | | |
Net expenses | | 1.06% | | 1.06% | | 1.81% | | 1.31% | | 0.81% |
(including fee waivers, if any) | | | | | | | | | | |
Type of waiver | | Contractual | | Contractual | | Contractual | | Contractual | | Contractual |
**The contractual waiver period is from Nov. 28, 2012 through Nov. 28, 2014.
†See Note 14 in “Notes to financial statements.”
6
Performance of a $10,000 investment1
Average annual total returns from July 31, 2004, through July 31, 2014
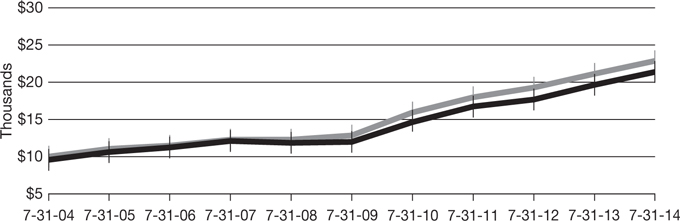
| | | | | | | | | | |
| | | For period beginning July 31, 2004, through July 31, 2014 | | | Starting value | | | | Ending value | |

| | BofA Merrill Lynch U.S. High Yield Constrained Index | | | $10,000 | | | | $22,857 | |

| | Delaware High-Yield Opportunities | | | | | | | | |
| | | Fund — Class A shares | | | $9,550 | | | | $21,352 | |
1 The “Performance of a $10,000 investment” graph assumes $10,000 invested in Class A shares of the Fund on July 31, 2004, and includes the effect of a 4.50% front-end sales charge and the reinvestment of all distributions. The graph does not reflect the deduction of taxes the shareholders would pay on Fund distributions or redemptions of Fund shares. Expense limitations were in effect for some or all of the periods shown. Performance would have been lower had expense limitations not been in effect. Expenses are listed in the “Fund expense ratios” table on page 6. Please note additional details on pages 4 through 7.
The graph also assumes $10,000 invested in the BofA Merrill Lynch U.S. High Yield Constrained Index as of July 31, 2004. The BofA Merrill Lynch U.S. High Yield Constrained Index tracks the performance of U.S. dollar–denominated high yield corporate debt publicly issued in the U.S. domestic market, but caps individual issuer exposure at 2% of the benchmark.
Index performance returns do not reflect any management fees, transaction costs, or expenses. Indices are unmanaged and one cannot invest directly in an index. Past performance is not a guarantee of future results.
Performance of other Fund classes will vary due to different charges and expenses.
| | | | | | |
| | | Nasdaq symbols | | CUSIPs | | |
Class A | | DHOAX | | 245908876 | | |
Class B | | DHOBX | | 245908868 | | |
Class C | | DHOCX | | 245908850 | | |
Class R | | DHIRX | | 245908736 | | |
Institutional Class | | DHOIX | | 245908843 | | |
7
Disclosure of Fund expenses
For the six-month period from February 1, 2014 to July 31, 2014 (Unaudited)
As a shareholder of the Fund, you incur two types of costs: (1) transaction costs, including sales charges (loads) on purchase payments, reinvested dividends, or other distributions; redemption fees; and exchange fees; and (2) ongoing costs, including management fees; distribution and/or service (12b-1) fees; and other Fund expenses. This example is intended to help you understand your ongoing costs (in dollars) of investing in the Fund and to compare these costs with the ongoing costs of investing in other mutual funds.
The example is based on an investment of $1,000 invested at the beginning of the period and held for the entire six-month period from Feb. 1, 2014 to July 31, 2014.
Actual expenses
The first section of the table shown, “Actual Fund return,” provides information about actual account values and actual expenses. You may use the information in this section of the table, together with the amount you invested, to estimate the expenses that you paid over the period. Simply divide your account value by $1,000 (for example, an $8,600 account value divided by $1,000 = 8.6), then multiply the result by the number in the first section under the heading entitled “Expenses Paid During Period” to estimate the expenses you paid on your account during this period.
Hypothetical example for comparison purposes
The second section of the table shown, “Hypothetical 5% return,” provides information about hypothetical account values and hypothetical expenses based on the Fund’s actual expense ratio and an assumed rate of return of 5% per year before expenses, which is not the Fund’s actual return. The hypothetical account values and expenses may not be used to estimate the actual ending account balance or expenses you paid for the period. You may use this information to compare the ongoing costs of investing in the Fund and other funds. To do so, compare this 5% hypothetical example with the 5% hypothetical examples that appear in the shareholder reports of the other funds.
Please note that the expenses shown in the table are meant to highlight your ongoing costs only and do not reflect any transactional costs, such as sales charges (loads), redemption fees, or exchange fees. Therefore, the second section of the table is useful in comparing ongoing costs only, and will not help you determine the relative total costs of owning different funds. In addition, if these transactional costs were included, your costs would have been higher. The Fund’s expenses shown in the table reflect fee waivers in effect. The expenses shown in the table assume reinvestment of all dividends and distributions.
8
Delaware High-Yield Opportunities Fund
Expense analysis of an investment of $1,000
| | | | | | | | |
| | | Beginning Account Value
2/1/14 | | Ending
Account Value
7/31/14 | | Annualized
Expense Ratio | | Expenses
Paid During Period 2/1/14 to 7/31/14* |
Actual Fund return† |
Class A | | $1,000.00 | | $1,036.50 | | 1.06% | | $5.35 |
Class B** | | 1,000.00 | | 1,036.50 | | 1.06% | | 5.35 |
Class C | | 1,000.00 | | 1,032.60 | | 1.81% | | 9.12 |
Class R | | 1,000.00 | | 1,032.80 | | 1.31% | | 6.60 |
Institutional Class | | 1,000.00 | | 1,037.80 | | 0.81% | | 4.09 |
Hypothetical 5% return (5% return before expenses) |
Class A | | $1,000.00 | | $1,019.54 | | 1.06% | | $5.31 |
Class B** | | 1,000.00 | | 1,019.54 | | 1.06% | | 5.31 |
Class C | | 1,000.00 | | 1,015.82 | | 1.81% | | 9.05 |
Class R | | 1,000.00 | | 1,018.30 | | 1.31% | | 6.56 |
Institutional Class | | 1,000.00 | | 1,020.78 | | 0.81% | | 4.06 |
*“Expenses Paid During Period” are equal to the Fund’s annualized expense ratio, multiplied by the average account value over the period, multiplied by 181/365 (to reflect the one-half year period).
**See Note 14 in “Notes to financial statements.”
†Because actual returns reflect only the most recent six-month period, the returns shown may differ significantly from fiscal year returns.
9
Security type / sector allocation
| | |
| Delaware High-Yield Opportunities Fund | | As of July 31, 2014 (Unaudited) |
Sector designations may be different than the sector designations presented in other fund materials. The sector designations may represent the investment manager’s internal sector classifications, which may result in the sector designations for one fund being different than another fund’s sector designations.
| | |
Security type / sector | | Percentage of net assets |
Convertible Bonds | | 0.35% |
Corporate Bonds | | 81.68% |
Automotive | | 2.50% |
Banking | | 3.19% |
Basic Industry | | 9.46% |
Capital Goods | | 5.55% |
Consumer Cyclical | | 4.00% |
Consumer Non-Cyclical | | 2.30% |
Energy | | 14.97% |
Financials | | 0.86% |
Healthcare | | 6.34% |
Insurance | | 2.46% |
Media | | 7.63% |
Services | | 6.66% |
Technology & Electronics | | 5.91% |
Telecommunications | | 7.40% |
Utilities | | 2.45% |
Senior Secured Loans | | 9.33% |
Common Stock | | 1.20% |
Convertible Preferred Stock | | 1.12% |
Preferred Stock | | 1.77% |
Short-Term Investments | | 4.69% |
Total Value of Securities | | 100.14% |
Liabilities Net of Receivables and Other Assets | | (0.14%) |
Total Net Assets | | 100.00% |
10
Schedule of investments
| | |
| Delaware High-Yield Opportunities Fund | | July 31, 2014 |
| | | | | | | | |
| | | Principal amount° | | | Value (U.S. $) | |
Convertible Bonds – 0.35% | | | | | | | | |
Equinix 4.75% exercise price $84.32,
expiration date 6/13/16 | | | 314,000 | | | $ | 815,223 | |
Salix Pharmaceuticals 1.50% exercise price $65.81,
expiration date 3/15/19 | | | 747,000 | | | | 1,547,224 | |
| | | | | | | | |
Total Convertible Bonds (cost $1,751,544) | | | | | | | 2,362,447 | |
| | | | | | | | |
| | | | | | | | |
Corporate Bonds – 81.68% | | | | | | | | |
Automotive – 2.50% | | | | | | | | |
American Axle & Manufacturing 7.75% 11/15/19 | | | 1,650,000 | | | | 1,881,000 | |
Chassix 144A 9.25% 8/1/18 # | | | 1,635,000 | | | | 1,745,363 | |
General Motors 6.25% 10/2/43 | | | 1,875,000 | | | | 2,132,813 | |
General Motors Financial 6.75% 6/1/18 | | | 2,885,000 | | | | 3,267,263 | |
International Automotive Components Group 144A
9.125% 6/1/18 # | | | 3,598,000 | | | | 3,840,865 | |
Meritor | | | | | | | | |
6.25% 2/15/24 | | | 1,035,000 | | | | 1,068,637 | |
6.75% 6/15/21 | | | 1,800,000 | | | | 1,917,000 | |
Tupy Overseas 144A 6.625% 7/17/24 # | | | 785,000 | | | | 808,550 | |
| | | | | | | | |
| | | | | | | 16,661,491 | |
| | | | | | | | |
Banking – 3.19% | | | | | | | | |
Barclays Bank 7.625% 11/21/22 | | | 3,065,000 | | | | 3,465,366 | |
Credit Suisse Group | | | | | | | | |
144A 6.25% 12/29/49 #— | | | 1,995,000 | | | | 2,003,778 | |
144A 7.50% 12/31/49 #— | | | 3,010,000 | | | | 3,311,000 | |
JPMorgan Chase 6.75% 8/29/49 — | | | 3,415,000 | | | | 3,662,587 | |
Lloyds Banking Group 7.50% 4/30/49 — | | | 5,385,000 | | | | 5,667,713 | |
Popular 7.00% 7/1/19 | | | 3,125,000 | | | | 3,157,813 | |
| | | | | | | | |
| | | | | | | 21,268,257 | |
| | | | | | | | |
Basic Industry – 9.46% | | | | | | | | |
AK Steel 7.625% 5/15/20 | | | 3,352,000 | | | | 3,444,180 | |
ArcelorMittal 6.125% 6/1/18 | | | 3,080,000 | | | | 3,295,600 | |
Arch Coal 144A 8.00% 1/15/19 # | | | 2,869,000 | | | | 2,775,757 | |
Builders FirstSource 144A 7.625% 6/1/21 # | | | 3,151,000 | | | | 3,300,673 | |
Cemex 144A 7.25% 1/15/21 # | | | 1,820,000 | | | | 1,933,750 | |
Cemex Finance 144A 6.00% 4/1/24 # | | | 2,015,000 | | | | 2,020,037 | |
CPG Merger Sub 144A 8.00% 10/1/21 # | | | 2,970,000 | | | | 3,081,375 | |
Essar Steel Minnesota 144A 11.50% 5/15/20 # | | | 905,000 | | | | 933,281 | |
First Quantum Minerals | | | | | | | | |
144A 6.75% 2/15/20 # | | | 1,580,000 | | | | 1,619,500 | |
144A 7.00% 2/15/21 # | | | 1,580,000 | | | | 1,635,300 | |
144A 7.25% 5/15/22 # | | | 1,600,000 | | | | 1,650,000 | |
FMG Resources August 2006 144A 6.875% 4/1/22 # | | | 3,314,000 | | | | 3,537,695 | |
Hardwoods Acquisition 144A 7.50% 8/1/21 # | | | 2,045,000 | | | | 2,085,900 | |
11
Schedule of investments
Delaware High-Yield Opportunities Fund
| | | | | | | | |
| | | Principal amount° | | | Value (U.S. $) | |
Corporate Bonds (continued) | | | | | | | | |
Basic Industry (continued) | | | | | | | | |
HD Supply 11.50% 7/15/20 | | | 2,815,000 | | | $ | 3,286,513 | |
INEOS Group Holdings 144A 5.875% 2/15/19 # | | | 2,895,000 | | | | 2,931,187 | |
JMC Steel Group 144A 8.25% 3/15/18 # | | | 2,435,000 | | | | 2,419,781 | |
Kissner Milling 144A 7.25% 6/1/19 # | | | 2,560,000 | | | | 2,624,000 | |
LSB Industries 7.75% 8/1/19 | | | 2,340,000 | | | | 2,521,350 | |
New Gold 144A 6.25% 11/15/22 # | | | 3,060,000 | | | | 3,235,950 | |
Nortek 8.50% 4/15/21 | | | 2,115,000 | | | | 2,305,350 | |
Polymer Group 144A 6.875% 6/1/19 # | | | 1,990,000 | | | | 2,012,387 | |
Ryerson | | | | | | | | |
9.00% 10/15/17 | | | 1,927,000 | | | | 2,045,029 | |
11.25% 10/15/18 | | | 794,000 | | | | 881,340 | |
Sappi Papier Holding 144A 6.625% 4/15/21 # | | | 1,410,000 | | | | 1,498,125 | |
TPC Group 144A 8.75% 12/15/20 # | | | 3,315,000 | | | | 3,638,213 | |
Wise Metals Group 144A 8.75% 12/15/18 # | | | 1,345,000 | | | | 1,449,237 | |
Wise Metals Intermediate Holdings 144A 9.75% 6/15/19 # | | | 905,000 | | | | 926,494 | |
| | | | | | | | |
| | | | | | | 63,088,004 | |
| | | | | | | | |
Capital Goods – 5.55% | | | | | | | | |
Accudyne Industries 144A 7.75% 12/15/20 # | | | 2,140,000 | | | | 2,252,350 | |
Ardagh Packaging Finance 144A 6.00% 6/30/21 # | | | 2,625,000 | | | | 2,513,437 | |
B/E Aerospace 5.25% 4/1/22 | | | 1,510,000 | | | | 1,644,013 | |
BOE Intermediate Holding 144A PIK 9.00% 11/1/17 #v | | | 1,828,457 | | | | 1,915,309 | |
Consolidated Container 144A 10.125% 7/15/20 # | | | 2,654,000 | | | | 2,667,270 | |
Gardner Denver 144A 6.875% 8/15/21 # | | | 1,505,000 | | | | 1,523,813 | |
Gates Global 144A 6.00% 7/15/22 # | | | 5,075,000 | | | | 4,973,500 | |
Milacron 144A 7.75% 2/15/21 # | | | 2,970,000 | | | | 3,215,025 | |
Plastipak Holdings 144A 6.50% 10/1/21 # | | | 2,340,000 | | | | 2,451,150 | |
Reynolds Group Issuer 8.25% 2/15/21 | | | 4,190,000 | | | | 4,462,350 | |
Signode Industrial Group 144A 6.375% 5/1/22 # | | | 2,885,000 | | | | 2,848,937 | |
TransDigm | | | | | | | | |
144A 6.00% 7/15/22 # | | | 3,575,000 | | | | 3,597,344 | |
144A 6.50% 7/15/24 # | | | 2,960,000 | | | | 2,993,300 | |
| | | | | | | | |
| | | | | | | 37,057,798 | |
| | | | | | | | |
Consumer Cyclical – 4.00% | | | | | | | | |
BI-LO 144A 8.625% 9/15/18 # | | | 2,085,000 | | | | 2,121,487 | |
Dave & Buster’s Entertainment 144A 10.00% 2/15/16 #^ | | | 1,382,000 | | | | 1,198,070 | |
DBP Holding 144A 7.75% 10/15/20 # | | | 2,019,000 | | | | 1,837,290 | |
Landry’s 144A 9.375% 5/1/20 # | | | 3,646,000 | | | | 3,974,140 | |
Men’s Wearhouse 144A 7.00% 7/1/22 # | | | 1,880,000 | | | | 1,964,600 | |
Michaels Stores 144A 5.875% 12/15/20 # | | | 2,405,000 | | | | 2,370,127 | |
Pantry 8.375% 8/1/20 | | | 2,846,000 | | | | 3,052,335 | |
Party City Holdings 8.875% 8/1/20 | | | 3,208,000 | | | | 3,472,660 | |
PF Chang’s China Bistro 144A 10.25% 6/30/20 # | | | 2,107,000 | | | | 2,149,140 | |
12
| | | | | | | | |
| | | Principal amount° | | | Value (U.S. $) | |
Corporate Bonds (continued) | | | | | | | | |
Consumer Cyclical (continued) | | | | | | | | |
Rite Aid 6.75% 6/15/21 | | | 3,190,000 | | | $ | 3,333,550 | |
Roundy’s Supermarkets 144A 10.25% 12/15/20 # | | | 1,140,000 | | | | 1,197,000 | |
| | | | | | | | |
| | | | | | | 26,670,399 | |
| | | | | | | | |
Consumer Non-Cyclical – 2.30% | | | | | | | | |
Crestview DS Merger Sub II 144A 10.00% 9/1/21 # | | | 2,015,000 | | | | 2,274,431 | |
Darling Ingredients 144A 5.375% 1/15/22 # | | | 1,140,000 | | | | 1,175,625 | |
JBS Investments 144A 7.75% 10/28/20 # | | | 3,270,000 | | | | 3,523,425 | |
Post Holdings | | | | | | | | |
144A 6.00% 12/15/22 # | | | 2,650,000 | | | | 2,626,813 | |
144A 6.75% 12/1/21 # | | | 605,000 | | | | 629,956 | |
Prestige Brands 144A 5.375% 12/15/21 # | | | 2,106,000 | | | | 2,116,530 | |
Spectrum Brands | | | | | | | | |
6.375% 11/15/20 | | | 590,000 | | | | 623,925 | |
6.625% 11/15/22 | | | 2,235,000 | | | | 2,380,275 | |
| | | | | | | | |
| | | | | | | 15,350,980 | |
| | | | | | | | |
Energy – 14.97% | | | | | | | | |
Athlon Holdings 144A 6.00% 5/1/22 # | | | 2,750,000 | | | | 2,763,750 | |
Baytex Energy | | | | | | | | |
144A 5.125% 6/1/21 # | | | 620,000 | | | | 617,675 | |
144A 5.625% 6/1/24 # | | | 2,880,000 | | | | 2,847,600 | |
Calumet Specialty Products Partners 7.625% 1/15/22 | | | 4,575,000 | | | | 4,883,813 | |
Chaparral Energy | | | | | | | | |
7.625% 11/15/22 | | | 1,445,000 | | | | 1,520,863 | |
8.25% 9/1/21 | | | 1,621,000 | | | | 1,742,575 | |
CHC Helicopter 9.375% 6/1/21 | | | 3,968,000 | | | | 4,186,240 | |
Chesapeake Energy 4.875% 4/15/22 | | | 3,835,000 | | | | 3,844,587 | |
Compressco Partners 144A 7.25% 8/15/22 # | | | 1,490,000 | | | | 1,475,100 | |
Energy Transfer Equity 144A 5.875% 1/15/24 # | | | 1,420,000 | | | | 1,455,500 | |
Energy XXI Gulf Coast 144A 6.875% 3/15/24 # | | | 3,125,000 | | | | 3,117,187 | |
Exterran Partners 6.00% 4/1/21 | | | 3,280,000 | | | | 3,296,400 | |
FTS International 144A 6.25% 5/1/22 # | | | 3,310,000 | | | | 3,384,475 | |
Genesis Energy 5.75% 2/15/21 | | | 3,525,000 | | | | 3,577,875 | |
Halcon Resources | | | | | | | | |
8.875% 5/15/21 | | | 1,395,000 | | | | 1,454,287 | |
9.75% 7/15/20 | | | 3,300,000 | | | | 3,547,500 | |
Hercules Offshore | | | | | | | | |
144A 6.75% 4/1/22 # | | | 2,905,000 | | | | 2,618,131 | |
144A 7.50% 10/1/21 # | | | 1,490,000 | | | | 1,419,225 | |
144A 8.75% 7/15/21 # | | | 905,000 | | | | 925,363 | |
Key Energy Services 6.75% 3/1/21 | | | 2,101,000 | | | | 2,153,525 | |
Laredo Petroleum | | | | | | | | |
5.625% 1/15/22 | | | 1,430,000 | | | | 1,462,175 | |
13
Schedule of investments
Delaware High-Yield Opportunities Fund
| | | | | | | | |
| | | Principal amount° | | | Value (U.S. $) | |
Corporate Bonds (continued) | | | | | | | | |
Energy (continued) | | | | | | | | |
Laredo Petroleum | | | | | | | | |
7.375% 5/1/22 | | | 688,000 | | | $ | 753,360 | |
Midstates Petroleum 9.25% 6/1/21 | | | 4,275,000 | | | | 4,435,313 | |
Murphy Oil USA 6.00% 8/15/23 | | | 2,915,000 | | | | 3,082,613 | |
Northern Blizzard Resources 144A 7.25% 2/1/22 # | | | 3,060,000 | | | | 3,235,950 | |
Northern Oil & Gas 8.00% 6/1/20 | | | 3,010,000 | | | | 3,190,600 | |
NuStar Logistics 6.75% 2/1/21 | | | 2,000,000 | | | | 2,240,000 | |
Oasis Petroleum 144A 6.875% 3/15/22 # | | | 3,150,000 | | | | 3,425,625 | |
Ocean Rig UDW 144A 7.25% 4/1/19 # | | | 3,770,000 | | | | 3,647,475 | |
Offshore Group Investment 7.125% 4/1/23 | | | 1,445,000 | | | | 1,434,163 | |
PDC Energy 7.75% 10/15/22 | | | 2,927,000 | | | | 3,263,605 | |
Pioneer Energy Services 144A 6.125% 3/15/22 # | | | 3,165,000 | | | | 3,267,863 | |
Regency Energy Partners 5.875% 3/1/22 | | | 3,090,000 | | | | 3,244,500 | |
Samson Investment 144A 10.75% 2/15/20 # | | | 3,323,000 | | | | 3,381,153 | |
SandRidge Energy 8.125% 10/15/22 | | | 3,957,000 | | | | 4,233,990 | |
Seventy Seven Energy 144A 6.50% 7/15/22 # | | | 1,740,000 | | | | 1,757,400 | |
Triangle USA Petroleum 144A 6.75% 7/15/22 # | | | 2,945,000 | | | | 2,956,044 | |
| | | | | | | | |
| | | | | | | 99,843,500 | |
| | | | | | | | |
Financials – 0.86% | | | | | | | | |
Cogent Communications Finance 144A 5.625% 4/15/21 # | | | 3,020,000 | | | | 2,967,150 | |
Nuveen Investments 144A 9.50% 10/15/20 # | | | 2,371,000 | | | | 2,779,997 | |
| | | | | | | | |
| | | | | | | 5,747,147 | |
| | | | | | | | |
Healthcare – 6.34% | | | | | | | | |
Amsurg 144A 5.625% 7/15/22 # | | | 1,700,000 | | | | 1,717,000 | |
Community Health Systems | | | | | | | | |
144A 6.875% 2/1/22 # | | | 3,485,000 | | | | 3,580,837 | |
7.125% 7/15/20 | | | 820,000 | | | | 876,375 | |
8.00% 11/15/19 | | | 184,000 | | | | 197,837 | |
Crimson Merger Sub 144A 6.625% 5/15/22 # | | | 3,010,000 | | | | 2,878,313 | |
DaVita HealthCare Partners 5.125% 7/15/24 | | | 5,170,000 | | | | 5,102,144 | |
Immucor 11.125% 8/15/19 | | | 2,215,000 | | | | 2,447,575 | |
Kinetic Concepts | | | | | | | | |
10.50% 11/1/18 | | | 2,111,000 | | | | 2,343,210 | |
12.50% 11/1/19 | | | 1,420,000 | | | | 1,595,796 | |
Mallinckrodt International Finance 4.75% 4/15/23 | | | 1,705,000 | | | | 1,581,387 | |
MPH Acquisition Holdings 144A 6.625% 4/1/22 # | | | 1,510,000 | | | | 1,551,525 | |
Par Pharmaceutical 7.375% 10/15/20 | | | 6,121,000 | | | | 6,564,773 | |
Salix Pharmaceuticals 144A 6.00% 1/15/21 # | | | 3,705,000 | | | | 3,880,987 | |
Tenet Healthcare | | | | | | | | |
144A 5.00% 3/1/19 # | | | 2,145,000 | | | | 2,118,187 | |
6.00% 10/1/20 | | | 1,455,000 | | | | 1,524,113 | |
8.125% 4/1/22 | | | 1,845,000 | | | | 2,066,400 | |
14
| | | | | | | | |
| | | Principal amount° | | | Value (U.S. $) | |
Corporate Bonds (continued) | | | | | | | | |
Healthcare (continued) | | | | | | | | |
Valeant Pharmaceuticals International | | | | | | | | |
144A 5.625% 12/1/21 # | | | 790,000 | | | $ | 788,025 | |
144A 6.375% 10/15/20 # | | | 1,411,000 | | | | 1,462,149 | |
| | | | | | | | |
| | | | | | | 42,276,633 | |
| | | | | | | | |
Insurance – 2.46% | | | | | | | | |
American International Group 8.175% 5/15/58 — | | | 2,770,000 | | | | 3,839,913 | |
Hockey Merger Sub 2 144A 7.875% 10/1/21 # | | | 3,520,000 | | | | 3,625,600 | |
Hub Holdings 144A PIK 8.125% 7/15/19 # | | | 900,000 | | | | 893,250 | |
Onex USI Acquisition 144A 7.75% 1/15/21 # | | | 3,160,000 | | | | 3,152,100 | |
XL Group 6.50% 12/29/49 — | | | 5,007,000 | | | | 4,919,377 | |
| | | | | | | | |
| | | | | | | 16,430,240 | |
| | | | | | | | |
Media – 7.63% | | | | | | | | |
Altice 144A 7.75% 5/15/22 # | | | 3,435,000 | | | | 3,520,875 | |
CCO Holdings 5.25% 9/30/22 | | | 3,801,000 | | | | 3,739,234 | |
Cequel Communications Holdings I 144A
6.375% 9/15/20 # | | | 2,415,000 | | | | 2,499,525 | |
Clear Channel Communications PIK 14.00% 2/1/21 v | | | 3,050,000 | | | | 3,050,000 | |
Columbus International 144A 7.375% 3/30/21 # | | | 4,715,000 | | | | 4,992,006 | |
CSC Holdings 144A 5.25% 6/1/24 # | | | 3,820,000 | | | | 3,667,200 | |
DISH DBS 5.00% 3/15/23 | | | 3,775,000 | | | | 3,708,937 | |
Gray Television 7.50% 10/1/20 | | | 2,925,000 | | | | 3,074,906 | |
MDC Partners 144A 6.75% 4/1/20 # | | | 3,340,000 | | | | 3,490,300 | |
Mediacom Broadband 144A 5.50% 4/15/21 # | | | 930,000 | | | | 942,787 | |
Numericable Group | | | | | | | | |
144A 6.00% 5/15/22 # | | | 3,435,000 | | | | 3,456,469 | |
144A 6.25% 5/15/24 # | | | 485,000 | | | | 488,031 | |
RCN Telecom Services 144A 8.50% 8/15/20 # | | | 1,610,000 | | | | 1,722,700 | |
Sinclair Television Group 144A 5.625% 8/1/24 # | | | 2,220,000 | | | | 2,200,575 | |
Virgin Media Finance 144A 6.375% 4/15/23 # | | | 4,905,000 | | | | 5,174,775 | |
VTR Finance 144A 6.875% 1/15/24 # | | | 4,975,000 | | | | 5,167,781 | |
| | | | | | | | |
| | | | | | | 50,896,101 | |
| | | | | | | | |
Services – 6.66% | | | | | | | | |
Algeco Scotsman Global Finance 144A 10.75% 10/15/19 # | | | 6,257,000 | | | | 6,257,000 | |
Avis Budget Car Rental 5.50% 4/1/23 | | | 2,543,000 | | | | 2,555,715 | |
BlueLine Rental Finance 144A 7.00% 2/1/19 # | | | 1,760,000 | | | | 1,834,800 | |
Caesars Growth Properties Holdings 144A
9.375% 5/1/22 # | | | 3,420,000 | | | | 3,452,063 | |
Covanta Holding 5.875% 3/1/24 | | | 3,350,000 | | | | 3,417,000 | |
Mattamy Group 144A 6.50% 11/15/20 # | | | 3,910,000 | | | | 3,988,200 | |
MGM Resorts International | | | | | | | | |
6.75% 10/1/20 | | | 1,010,000 | | | | 1,095,850 | |
7.75% 3/15/22 | | | 1,340,000 | | | | 1,544,350 | |
15
Schedule of investments
Delaware High-Yield Opportunities Fund
| | | | | | | | |
| | | Principal amount° | | | Value (U.S. $) | |
Corporate Bonds (continued) | | | | | | | | |
Services (continued) | | | | | | | | |
Navios South American Logistics 144A 7.25% 5/1/22 # | | | 3,015,000 | | | $ | 3,082,837 | |
Pinnacle Entertainment | | | | | | | | |
6.375% 8/1/21 | | | 1,330,000 | | | | 1,376,550 | |
7.75% 4/1/22 | | | 1,065,000 | | | | 1,146,206 | |
8.75% 5/15/20 | | | 224,000 | | | | 240,240 | |
Stena 144A 7.00% 2/1/24 # | | | 4,425,000 | | | | 4,679,437 | |
United Rentals North America 5.75% 11/15/24 | | | 4,535,000 | | | | 4,648,375 | |
Vander Intermediate Holding II 144A PIK 9.75% 2/1/19 # | | | 1,150,000 | | | | 1,210,375 | |
Watco 144A 6.375% 4/1/23 # | | | 1,505,000 | | | | 1,535,100 | |
West 144A 5.375% 7/15/22 # | | | 2,410,000 | | | | 2,343,725 | |
| | | | | | | | |
| | | | | | | 44,407,823 | |
| | | | | | | | |
Technology & Electronics – 5.91% | | | | | | | | |
Advanced Micro Devices 144A 6.75% 3/1/19 # | | | 1,255,000 | | | | 1,289,513 | |
BMC Software Finance 144A 8.125% 7/15/21 # | | | 1,690,000 | | | | 1,690,000 | |
CDW 6.00% 8/15/22 | | | 1,020,000 | | | | 1,020,000 | |
CommScope 144A 5.50% 6/15/24 # | | | 3,320,000 | | | | 3,320,000 | |
Entegris 144A 6.00% 4/1/22 # | | | 3,320,000 | | | | 3,444,500 | |
First Data | | | | | | | | |
11.25% 1/15/21 | | | 2,409,000 | | | | 2,734,215 | |
11.75% 8/15/21 | | | 4,526,750 | | | | 5,307,614 | |
First Data Holdings 144A PIK 14.50% 9/24/19 #v | | | 176,819 | | | | 200,690 | |
Infinity Acquisition 144A 7.25% 8/1/22 # | | | 3,675,000 | | | | 3,693,375 | |
Infor Software Parent 144A PIK 7.125% 5/1/21 # | | | 4,130,000 | | | | 4,109,350 | |
j2 Global 8.00% 8/1/20 | | | 4,173,000 | | | | 4,527,705 | |
Micron Technology 144A 5.50% 2/1/25 # | | | 2,675,000 | | | | 2,668,313 | |
NCR | | | | | | | | |
5.875% 12/15/21 | | | 855,000 | | | | 889,200 | |
6.375% 12/15/23 | | | 2,665,000 | | | | 2,838,225 | |
Viasystems 144A 7.875% 5/1/19 # | | | 1,654,000 | | | | 1,728,430 | |
| | | | | | | | |
| | | | | | | 39,461,130 | |
| | | | | | | | |
Telecommunications – 7.40% | | | | | | | | |
CenturyLink 6.75% 12/1/23 | | | 1,865,000 | | | | 2,030,519 | |
Digicel Group | | | | | | | | |
144A 7.125% 4/1/22 # | | | 1,465,000 | | | | 1,490,637 | |
144A 8.25% 9/30/20 # | | | 4,900,000 | | | | 5,304,250 | |
Hughes Satellite Systems 7.625% 6/15/21 | | | 2,494,000 | | | | 2,830,690 | |
Intelsat Luxembourg | | | | | | | | |
7.75% 6/1/21 | | | 2,620,000 | | | | 2,688,775 | |
8.125% 6/1/23 | | | 7,180,000 | | | | 7,494,125 | |
Level 3 Escrow II 144A 5.375% 8/15/22 # | | | 3,345,000 | | | | 3,290,644 | |
Sprint | | | | | | | | |
144A 7.125% 6/15/24 # | | | 3,760,000 | | | | 3,849,300 | |
16
| | | | | | | | |
| | | Principal amount° | | | Value (U.S. $) | |
Corporate Bonds (continued) | | | | | | | | |
Telecommunications (continued) | | | | | | | | |
Sprint | | | | | | | | |
144A 7.25% 9/15/21 # | | | 1,665,000 | | | $ | 1,779,469 | |
144A 7.875% 9/15/23 # | | | 2,040,000 | | | | 2,187,900 | |
Sprint Capital 6.90% 5/1/19 | | | 2,055,000 | | | | 2,209,125 | |
T-Mobile USA | | | | | | | | |
6.125% 1/15/22 | | | 935,000 | | | | 965,387 | |
6.25% 4/1/21 | | | 1,440,000 | | | | 1,510,200 | |
6.50% 1/15/24 | | | 565,000 | | | | 590,425 | |
6.731% 4/28/22 | | | 845,000 | | | | 888,306 | |
Wind Acquisition Finance | | | | | | | | |
144A 4.75% 7/15/20 # | | | 1,515,000 | | | | 1,484,700 | |
144A 7.375% 4/23/21 # | | | 2,900,000 | | | | 3,030,500 | |
Windstream | | | | | | | | |
7.50% 6/1/22 | | | 1,633,000 | | | | 1,765,681 | |
7.75% 10/1/21 | | | 1,820,000 | | | | 1,972,425 | |
Zayo Group 10.125% 7/1/20 | | | 1,791,000 | | | | 2,039,501 | |
| | | | | | | | |
| | | | | | | 49,402,559 | |
| | | | | | | | |
Utilities – 2.45% | | | | | | | | |
AES Gener 144A 8.375% 12/18/73 #— | | | 1,936,000 | | | | 2,179,936 | |
Calpine | | | | | | | | |
5.375% 1/15/23 | | | 2,745,000 | | | | 2,693,531 | |
5.75% 1/15/25 | | | 1,110,000 | | | | 1,086,413 | |
144A 5.875% 1/15/24 # | | | 1,650,000 | | | | 1,728,375 | |
Elwood Energy 8.159% 7/5/26 | | | 1,405,170 | | | | 1,580,816 | |
Enel 144A 8.75% 9/24/73 #— | | | 3,443,000 | | | | 4,079,955 | |
NRG Energy 144A 6.25% 5/1/24 # | | | 2,960,000 | | | | 2,974,800 | |
| | | | | | | | |
| | | | | | | 16,323,826 | |
| | | | | | | | |
Total Corporate Bonds (cost $531,008,118) | | | | | | | 544,885,888 | |
| | | | | | | | |
| | | | | | | | |
Senior Secured Loans – 9.33%« | | | | | | | | |
Akorn Tranche B 4.50% 11/13/20 | | | 2,910,000 | | | | 2,920,913 | |
Applied Systems 2nd Lien 7.50% 1/15/22 | | | 3,210,349 | | | | 3,261,516 | |
Ashland Water 2nd Lien 7.75% 7/2/22 | | | 1,200,000 | | | | 1,199,000 | |
Atkore International 2nd Lien 7.75% 9/27/21 | | | 1,700,000 | | | | 1,697,875 | |
Avast Software 1st Lien 5.00% 3/18/20 | | | 1,698,500 | | | | 1,702,038 | |
Avaya Tranche B-3 4.50% 10/27/17 | | | 1,051,912 | | | | 1,020,026 | |
Avaya Tranche B6 6.50% 3/31/18 | | | 1,051,912 | | | | 1,047,310 | |
Azure Midstream Tranche B 6.50% 10/21/18 | | | 702,266 | | | | 706,655 | |
BJ’s Wholesale Club 2nd Lien 8.50% 3/31/20 | | | 3,525,000 | | | | 3,581,181 | |
Borgata Tranche B 1st Lien 6.75% 8/15/18 | | | 3,104,400 | | | | 3,138,548 | |
Caesars Growth Partners Tranche B 1st Lien
6.25% 5/8/21 | | | 1,720,000 | | | | 1,716,238 | |
17
Schedule of investments
Delaware High-Yield Opportunities Fund
| | | | | | | | |
| | | Principal amount° | | | Value (U.S. $) | |
| Senior Secured Loans« (continued) | | | | | | | | |
Citycenter Holdings Tranche B 5.00% 10/9/20 | | | 2,827,813 | | | $ | 2,838,418 | |
Clear Channel Communications Tranche D 6.75% 1/30/19 | | | 5,265,000 | | | | 5,182,187 | |
Flint Group Tranche 2nd Lien 8.25% 5/2/22 | | | 3,470,000 | | | | 3,497,472 | |
Gentiva Health Services Tranche B 6.50% 10/10/19 | | | 2,412,875 | | | | 2,418,516 | |
Hostess Brands 1st Lien 6.75% 3/12/20 | | | 3,261,825 | | | | 3,371,912 | |
LTS Buyer 2nd Lien 8.00% 3/15/21 | | | 471,213 | | | | 477,495 | |
Mauser Holdings 2nd Lien 8.25% 6/30/22 | | | 3,510,000 | | | | 3,516,581 | |
Moxie Liberty Tranche B 7.50% 8/21/20 | | | 1,695,000 | | | | 1,750,087 | |
Moxie Patriot (Panda Power Fund) Tranche B1
6.75% 12/18/20 | | | 1,675,000 | | | | 1,729,437 | |
Nuveen Investments 2nd Lien 6.50% 2/28/19 | | | 1,620,000 | | | | 1,624,726 | |
Otterbox Tranche B 5.75% 5/30/20 | | | 2,560,000 | | | | 2,540,800 | |
Panda Temple Power II Tranche B 1st Lien 7.25% 3/28/19 | | | 1,835,000 | | | | 1,894,637 | |
Polymer Group Tranche B 5.25% 12/13/19 | | | 2,711,375 | | | | 2,717,307 | |
Rite Aid 2nd Lien 5.75% 8/3/20 | | | 1,586,000 | | | | 1,619,306 | |
Samson Investment 2nd Lien 5.00% 9/25/18 | | | 3,430,000 | | | | 3,426,326 | |
Vantage Drilling Tranche B 1st Lien 5.75% 3/28/19 | | | 1,646,662 | | | | 1,642,203 | |
| | | | | | | | |
Total Senior Secured Loans (cost $61,836,316) | | | | | | | 62,238,710 | |
| | | | | | | | |
| | |
| | | Number of Shares | | | | |
Common Stock – 1.20% | | | | | | | | |
Akorn † | | | 18,115 | | | | 614,642 | |
Century Communications =† | | | 4,250,000 | | | | 0 | |
DIRECTV Class A † | | | 23,140 | | | | 1,991,197 | |
General Motors | | | 38,079 | | | | 1,287,832 | |
Hanesbrands | | | 9,500 | | | | 928,245 | |
Kodiak Oil & Gas † | | | 78,908 | | | | 1,226,230 | |
Las Vegas Sands | | | 8,255 | | | | 609,632 | |
Range Resources | | | 9,730 | | | | 735,491 | |
Valeant Pharmaceuticals International † | | | 4,897 | | | | 574,859 | |
| | | | | | | | |
Total Common Stock (cost $6,327,807) | | | | | | | 7,968,128 | |
| | | | | | | | |
| | | | | | | | |
Convertible Preferred Stock – 1.12% | | | | | | | | |
Chesapeake Energy 144A 5.75% exercise price $26.14,
expiration date 12/31/49 # | | | 1,564 | | | | 1,837,700 | |
Dominion Resources 6.375% exercise price $87.20,
expiration date 7/1/17 | | | 38,850 | | | | 1,969,695 | |
Exelon 6.50% exercise price $43.75,
expiration date 6/1/17 | | | 40,000 | | | | 1,964,000 | |
Intelsat 5.75% exercise price $22.05,
expiration date 5/1/16 | | | 13,750 | | | | 677,188 | |
18
| | | | | | | | |
| | |
| | | Number of
Shares | | | Value (U.S. $) | |
Convertible Preferred Stock (continued) | | | | | | | | |
SandRidge Energy 7.00% exercise price $7.76,
expiration date 12/31/49 | | | 10,200 | | | $ | 1,040,400 | |
| | | | | | | | |
Total Convertible Preferred Stock (cost $7,568,487) | | | | | | | 7,488,983 | |
| | | | | | | | |
| | | | | | | | |
Preferred Stock – 1.77% | | | | | | | | |
Ally Financial 144A 7.00% # | | | 6,700 | | | | 6,700,000 | |
GMAC Capital Trust I 8.125% — | | | 73,000 | | | | 1,984,140 | |
Regions Financial 6.375% | | | 126,000 | | | | 3,121,020 | |
| | | | | | | | |
Total Preferred Stock (cost $10,087,732) | | | | | | | 11,805,160 | |
| | | | | | | | |
| | |
| | | Principal amount | ° | | | | |
Short-Term Investments – 4.69% | | | | | | | | |
Repurchase Agreements – 4.69% | | | | | | | | |
Bank of America Merrill Lynch
0.04%, dated 7/31/14, to be repurchased on 8/1/14,
repurchase price $9,754,921 (collateralized by U.S.
government obligations 0.00%–0.375%
6/25/15–2/15/24; market value $9,950,011) | | | 9,754,910 | | | | 9,754,910 | |
Bank of Montreal
0.07%, dated 7/31/14, to be repurchased on 8/1/14,
repurchase price $3,251,643 (collateralized by U.S.
government obligations 0.00%–4.375%
8/21/14–11/15/43; market value $3,316,670) | | | 3,251,637 | | | | 3,251,637 | |
BNP Paribas
0.07%, dated 7/31/14, to be repurchased on 8/1/14,
repurchase price $18,249,489 (collateralized by U.S.
government obligations 0.00%–2.75%
8/7/14–11/15/23; market value $18,614,443) | | | 18,249,453 | | | | 18,249,453 | |
| | | | | | | | |
Total Short-Term Investments (cost $31,256,000) | | | | | | | 31,256,000 | |
| | | | | | | | |
| | |
Total Value of Securities – 100.14%
(cost $649,836,004) | | | | | | $ | 668,005,316 | |
| | | | | | | | |
| # | Security exempt from registration under Rule 144A of the Securities Act of 1933, as amended. At July 31, 2014, the aggregate value of Rule 144A securities was $320,587,801, which represented 48.06% of the Fund’s net assets. See Note 11 in “Notes to financial statements.” |
| v | 100% of the income received was in the form of additional par. |
| = | Security is being fair valued in accordance with the Fund’s fair valuation policy. At July 31, 2014, the aggregate value of fair valued securities was $0, which represents 0.00% of the Fund’s net assets. See Note 1 in “Notes to financial statements.” |
| ° | Principal amount shown is stated in U.S. dollars unless noted that the security is denominated in another currency. |
19
Schedule of investments
Delaware High-Yield Opportunities Fund
| † | Non income producing security. |
| — | Variable rate security. The rate shown is the rate as of July 31, 2014. Interest rates reset periodically. |
| ^ | Zero coupon security. The rate shown is the yield at the time of purchase. |
| « | Senior secured loans generally pay interest at rates which are periodically redetermined by reference to a base lending rate plus a premium. These base lending rates are generally: (i) the prime rate offered by one or more United States banks, (ii) the lending rate offered by one or more European banks such as the London Inter-Bank Offered Rate (LIBOR), and (iii) the certificate of deposit rate. Senior secured loans may be subject to restrictions on resale. Stated rate in effect at July 31, 2014. |
The following futures contracts were outstanding at July 31, 2014:1
Futures Contracts
| | | | | | | | | | | | |
Contracts to Buy (Sell) | | Notional
Cost
(Proceeds) | | | Notional
Value | | Expiration
Date | | Unrealized
Appreciation
(Depreciation) | |
(127) U.S. Treasury 5 yr Notes | | $ | (15,222,773 | ) | | $(15,092,164) | | 10/6/14 | | $ | 130,609 | |
(69) U.S. Treasury 2 yr Notes | | | (15,169,023 | ) | | (15,140,109) | | 10/6/14 | | | 28,914 | |
| | | | | | | | | | | | |
| | $ | (30,391,796 | ) | | | | | | $ | 159,523 | |
| | | | | | | | | | | | |
The use of futures contracts involves elements of market risk and risks in excess of the amounts disclosed in the financial statements. The notional values presented above represent the Fund’s total exposure in such contracts, whereas only the net unrealized appreciation (depreciation) is reflected in the Fund’s net assets.
1See Note 8 in “Notes to financial statements.”
PIK – Pay in kind bond.
See accompanying notes, which are an integral part of the financial statements.
20
This page intentionally left blank.
Statement of assets and liabilities
| | |
| Delaware High-Yield Opportunities Fund | | July 31, 2014 |
| | | | |
Assets: | | | | |
Investments, at value1 | | $ | 636,749,316 | |
Short-term investments, at value2 | | | 31,256,000 | |
Cash | | | 3,408,418 | |
Cash collateral due from brokers | | | 147,000 | |
Dividends and interest receivable | | | 10,392,435 | |
Receivables for securities sold | | | 9,647,127 | |
Receivables for fund shares sold | | | 763,287 | |
| | | | |
Total assets | | | 692,363,583 | |
| | | | |
Liabilities: | | | | |
Payable for securities purchased | | | 21,628,197 | |
Payable for fund shares redeemed | | | 1,825,245 | |
Distribution payable | | | 983,474 | |
Variation margin due to brokers on futures contracts | | | 11,516 | |
Investment management fees payable | | | 347,346 | |
Other accrued expenses | | | 286,467 | |
Distribution fees payable to affiliates | | | 155,213 | |
Other affiliates payable | | | 21,463 | |
Trustees’ fees and expenses payable | | | 1,615 | |
| | | | |
Total liabilities | | | 25,260,536 | |
| | | | |
Total Net Assets | | $ | 667,103,047 | |
| | | | |
| |
Net Assets Consist of: | | | | |
Paid-in capital | | $ | 662,172,569 | |
Distributions in excess of net investment income | | | (47,495 | ) |
Accumulated net realized loss on investments | | | (13,350,862 | ) |
Net unrealized appreciation of investments | | | 18,328,835 | |
| | | | |
Total Net Assets | | $ | 667,103,047 | |
| | | | |
22
| | | | |
Net Asset Value | | | | |
Class A: | | | | |
Net assets | | $ | 327,087,787 | |
Shares of beneficial interest outstanding, unlimited authorization, no par | | | 74,683,494 | |
Net asset value per share | | $ | 4.38 | |
Sales charge | | | 4.50 | % |
Offering price per share, equal to net asset value per share / (1 – sales charge) | | $ | 4.59 | |
| |
Class B: | | | | |
Net assets | | $ | 1,336,661 | |
Shares of beneficial interest outstanding, unlimited authorization, no par | | | 305,435 | |
Net asset value per share | | $ | 4.38 | |
| |
Class C: | | | | |
Net assets | | $ | 89,127,332 | |
Shares of beneficial interest outstanding, unlimited authorization, no par | | | 20,324,511 | |
Net asset value per share | | $ | 4.39 | |
| |
Class R: | | | | |
Net assets | | $ | 16,579,808 | |
Shares of beneficial interest outstanding, unlimited authorization, no par | | | 3,773,618 | |
Net asset value per share | | $ | 4.39 | |
| |
Institutional Class: | | | | |
Net assets | | $ | 232,971,459 | |
Shares of beneficial interest outstanding, unlimited authorization, no par | | | 53,201,433 | |
Net asset value per share | | $ | 4.38 | |
| |
1 Investments, at cost | | $ | 618,580,004 | |
2 Short-term investments, at cost | | | 31,256,000 | |
See accompanying notes, which are an integral part of the financial statements.
23
Statement of operations
| | |
| Delaware High-Yield Opportunities Fund | | Year ended July 31, 2014 |
| | | | |
Investment Income: | | | | |
Interest | | $ | 42,761,155 | |
Dividends | | | 845,329 | |
Securities lending income | | | 1,312 | |
| | | | |
| | | 43,607,796 | |
| | | | |
Expenses: | | | | |
Management fees | | | 4,256,395 | |
Distribution expenses – Class A | | | 857,944 | |
Distribution expenses – Class B | | | 21,517 | |
Distribution expenses – Class C | | | 892,708 | |
Distribution expenses – Class R | | | 88,301 | |
Dividend disbursing and transfer agent fees and expenses | | | 865,123 | |
Accounting and administration expenses | | | 238,366 | |
Registration fees | | | 100,042 | |
Reports and statements to shareholders | | | 95,431 | |
Legal fees | | | 50,309 | |
Audit and tax | | | 38,859 | |
Trustees’ fees and expenses | | | 33,211 | |
Custodian fees | | | 26,510 | |
Other | | | 38,352 | |
| | | | |
| | | 7,603,068 | |
Less expenses waived or absorbed | | | (332,533 | ) |
Less waived distribution expenses – Class B | | | (7,968 | ) |
Less waived distribution expenses – Class R | | | (2,748 | ) |
Less expense paid indirectly | | | (530 | ) |
| | | | |
Total operating expenses | | | 7,259,289 | |
| | | | |
Net Investment Income | | | 36,348,507 | |
| | | | |
| |
Net Realized and Unrealized Gain (Loss): | | | | |
Net realized gain (loss) on: | | | | |
Investments | | | 24,771,249 | |
Foreign currencies | | | (69 | ) |
Futures contracts | | | (292,868 | ) |
| | | | |
Net realized gain | | | 24,478,312 | |
| | | | |
Net change in unrealized appreciation (depreciation) of: | | | | |
Investments | | | (6,346,090 | ) |
Futures contracts | | | 159,523 | |
| | | | |
Net change in unrealized appreciation (depreciation) | | | (6,186,567 | ) |
| | | | |
Net Realized and Unrealized Gain | | | 18,291,745 | |
| | | | |
Net Increase in Net Assets Resulting from Operations | | $ | 54,640,252 | |
| | | | |
See accompanying notes, which are an integral part of the financial statements.
24
This page intentionally left blank.
Statements of changes in net assets
Delaware High-Yield Opportunities Fund
| | | | | | | | |
| | | Year ended | |
| | | 7/31/14 | | | 7/31/13 | |
| | |
Increase (Decrease) in Net Assets from Operations: | | | | | | | | |
Net investment income | | $ | 36,348,507 | | | $ | 40,701,651 | |
Net realized gain | | | 24,478,312 | | | | 16,031,890 | |
Net change in unrealized appreciation (depreciation) | | | (6,186,567 | ) | | | 9,450,884 | |
| | | | | | | | |
Net increase in net assets resulting from operations | | | 54,640,252 | | | | 66,184,425 | |
| | | | | | | | |
| | |
Dividends and Distributions to Shareholders from: | | | | | | | | |
Net investment income: | | | | | | | | |
Class A | | | (19,186,735 | ) | | | (22,225,652 | ) |
Class B | | | (116,680 | ) | | | (236,396 | ) |
Class C | | | (4,447,360 | ) | | | (4,808,103 | ) |
Class R | | | (940,613 | ) | | | (1,048,483 | ) |
Institutional Class | | | (13,367,446 | ) | | | (14,414,914 | ) |
| | | | | | | | |
| | | (38,058,834 | ) | | | (42,733,548 | ) |
| | | | | | | | |
| | |
Capital Share Transactions: | | | | | | | | |
Proceeds from shares sold: | | | | | | | | |
Class A | | | 64,495,340 | | | | 100,442,940 | |
Class B | | | 141,341 | | | | 53,889 | |
Class C | | | 19,163,904 | | | | 33,347,243 | |
Class R | | | 8,377,323 | | | | 9,929,150 | |
Institutional Class | | | 121,384,209 | | | | 134,663,231 | |
| | |
Net asset value of shares based upon reinvestment of dividends and distributions: | | | | | | | | |
Class A | | | 16,872,329 | | | | 18,537,337 | |
Class B | | | 101,244 | | | | 201,053 | |
Class C | | | 3,902,900 | | | | 3,715,104 | |
Class R | | | 943,364 | | | | 1,034,141 | |
Institutional Class | | | 12,444,422 | | | | 12,921,740 | |
| | | | | | | | |
| | | 247,826,376 | | | | 314,845,828 | |
| | | | | | | | |
26
| | | | | | | | |
| | | Year ended | |
| | | 7/31/14 | | | 7/31/13 | |
| | |
Capital Share Transactions (continued): | | | | | | | | |
Cost of shares redeemed: | | | | | | | | |
Class A | | $ | (91,212,111 | ) | | $ | (114,548,745 | ) |
Class B | | | (1,837,699 | ) | | | (2,502,603 | ) |
Class C | | | (21,717,606 | ) | | | (20,002,599 | ) |
Class R | | | (9,678,702 | ) | | | (9,639,055 | ) |
Institutional Class | | | (106,622,211 | ) | | | (140,874,021 | ) |
| | | | | | | | |
| | | (231,068,329 | ) | | | (287,567,023 | ) |
| | | | | | | | |
Increase in net assets derived from capital share transactions | | | 16,758,047 | | | | 27,278,805 | |
| | | | | | | | |
Net Increase in Net Assets | | | 33,339,465 | | | | 50,729,682 | |
| | |
Net Assets: | | | | | | | | |
Beginning of year | | | 633,763,582 | | | | 583,033,900 | |
| | | | | | | | |
End of year | | $ | 667,103,047 | | | $ | 633,763,582 | |
| | | | | | | | |
Undistributed (distributions in excess of) net investment income | | $ | (47,495 | ) | | $ | 717,510 | |
| | | | | | | | |
See accompanying notes, which are an integral part of the financial statements.
27
Financial highlights
Delaware High-Yield Opportunities Fund Class A
Selected data for each share of the Fund outstanding throughout each period were as follows:
|
Net asset value, beginning of period |
|
Income (loss) from investment operations: |
Net investment income |
Net realized and unrealized gain (loss) |
Total from investment operations. |
|
Less dividends and distributions from: |
Net investment income |
Total dividends and distributions |
|
Net asset value, end of period |
|
Total return1 |
|
Ratios and supplemental data: |
Net assets, end of period (000 omitted) |
Ratio of expenses to average net assets |
Ratio of expenses to average net assets prior to fees waived |
Ratio of net investment income to average net assets |
Ratio of net investment income to average net assets prior to fees waived |
Portfolio turnover |
| 1 | Total investment return is based on the change in net asset value of a share during the period and assumes reinvestment of dividends and distributions at net asset value and does not reflect the impact of a sales charge. Total investment return during all of the periods shown reflects a waiver by the manager. Performance would have been lower had the waiver not been in effect. |
See accompanying notes, which are an integral part of the financial statements.
28
| | | | | | | | | | | | | | | | | | | | |
| | | Year ended | |
| | | 7/31/14 | | | 7/31/13 | | | 7/31/12 | | | 7/31/11 | | | 7/31/10 | |
| |
| | $ | 4.270 | | | $ | 4.110 | | | $ | 4.200 | | | $ | 3.980 | | | $ | 3.560 | |
| | | | | |
| | | 0.238 | | | | 0.271 | | | | 0.308 | | | | 0.315 | | | | 0.356 | |
| | | 0.121 | | | | 0.173 | | | | (0.090 | ) | | | 0.231 | | | | 0.412 | |
| | | | | | | | | | | | | | | | | | | | |
| | | 0.359 | | | | 0.444 | | | | 0.218 | | | | 0.546 | | | | 0.768 | |
| | | | | | | | | | | | | | | | | | | | |
| | | | | |
| | | (0.249 | ) | | | (0.284 | ) | | | (0.308 | ) | | | (0.326 | ) | | | (0.348 | ) |
| | | | | | | | | | | | | | | | | | | | |
| | | (0.249 | ) | | | (0.284 | ) | | | (0.308 | ) | | | (0.326 | ) | | | (0.348 | ) |
| | | | | | | | | | | | | | | | | | | | |
| | | | | |
| | $ | 4.380 | | | $ | 4.270 | | | $ | 4.110 | | | $ | 4.200 | | | $ | 3.980 | |
| | | | | | | | | | | | | | | | | | | | |
| | | | | |
| | | 8.59% | | | | 11.02% | | | | 5.73% | | | | 14.11% | | | | 22.30% | |
| | | | | |
| | $ | 327,088 | | | $ | 328,534 | | | $ | 311,859 | | | $ | 306,304 | | | $ | 335,684 | |
| | | 1.07% | | | | 1.11% | | | | 1.11% | | | | 1.11% | | | | 1.11% | |
| | | | | |
| | | 1.12% | | | | 1.16% | | | | 1.18% | | | | 1.20% | | | | 1.25% | |
| | | 5.46% | | | | 6.33% | | | | 7.71% | | | | 7.60% | | | | 9.25% | |
| | | | | |
| | | 5.41% | | | | 6.28% | | | | 7.64% | | | | 7.51% | | | | 9.11% | |
| | | 105% | | | | 88% | | | | 61% | | | | 115% | | | | 141% | |
|
| |
29
Financial highlights
Delaware High-Yield Opportunities Fund Class B
Selected data for each share of the Fund outstanding throughout each period were as follows:
|
Net asset value, beginning of period |
|
Income (loss) from investment operations: |
Net investment income |
Net realized and unrealized gain (loss) |
Total from investment operations. |
|
Less dividends and distributions from: |
Net investment income |
Total dividends and distributions |
|
Net asset value, end of period |
|
Total return1 |
|
Ratios and supplemental data: |
Net assets, end of period (000 omitted) |
Ratio of expenses to average net assets |
Ratio of expenses to average net assets prior to fees waived |
Ratio of net investment income to average net assets |
Ratio of net investment income to average net assets prior to fees waived |
Portfolio turnover |
| 1 | Total investment return is based on the change in net asset value of a share during the period and assumes reinvestment of dividends and distributions at net asset value and does not reflect the impact of a sales charge. Total investment return during all of the periods shown reflects waivers by the manager and/or the distributor. Performance would have been lower had the waivers not been in effect. |
See accompanying notes, which are an integral part of the financial statements.
30
| | | | | | | | | | | | | | | | | | | | |
| | | Year ended | |
| | | 7/31/14 | | | 7/31/13 | | | 7/31/12 | | | 7/31/11 | | | 7/31/10 | |
| |
| | $ | 4.270 | | | $ | 4.110 | | | $ | 4.190 | | | $ | 3.980 | | | $ | 3.560 | |
| | | | | |
| | | 0.221 | | | | 0.241 | | | | 0.280 | | | | 0.286 | | | | 0.329 | |
| | | 0.124 | | | | 0.173 | | | | (0.080 | ) | | | 0.221 | | | | 0.412 | |
| | | | | | | | | | | | | | | | | | | | |
| | | 0.345 | | | | 0.414 | | | | 0.200 | | | | 0.507 | | | | 0.741 | |
| | | | | | | | | | | | | | | | | | | | |
| | | | | |
| | | (0.235 | ) | | | (0.254 | ) | | | (0.280 | ) | | | (0.297 | ) | | | (0.321 | ) |
| | | | | | | | | | | | | | | | | | | | |
| | | (0.235 | ) | | | (0.254 | ) | | | (0.280 | ) | | | (0.297 | ) | | | (0.321 | ) |
| | | | | | | | | | | | | | | | | | | | |
| | | | | |
| | $ | 4.380 | | | $ | 4.270 | | | $ | 4.110 | | | $ | 4.190 | | | $ | 3.980 | |
| | | | | | | | | | | | | | | | | | | | |
| | | | | |
| | | 8.25% | | | | 10.25% | | | | 5.24% | | | | 13.06% | | | | 21.46% | |
| | | | | |
| | $ | 1,337 | | | $ | 2,868 | | | $ | 4,924 | | | $ | 7,527 | | | $ | 10,143 | |
| | | 1.44% | | | | 1.81% | | | | 1.81% | | | | 1.81% | | | | 1.81% | |
| | | | | |
| | | 1.86% | | | | 1.86% | | | | 1.88% | | | | 1.90% | | | | 1.95% | |
| | | 5.09% | | | | 5.63% | | | | 7.01% | | | | 6.90% | | | | 8.55% | |
| | | | | |
| | | 4.67% | | | | 5.58% | | | | 6.94% | | | | 6.81% | | | | 8.41% | |
| | | 105% | | | | 88% | | | | 61% | | | | 115% | | | | 141% | |
|
| |
31
Financial highlights
Delaware High-Yield Opportunities Fund Class C
Selected data for each share of the Fund outstanding throughout each period were as follows:
|
Net asset value, beginning of period |
|
Income (loss) from investment operations: |
Net investment income |
Net realized and unrealized gain (loss) |
Total from investment operations. |
|
Less dividends and distributions from: |
Net investment income |
Total dividends and distributions |
|
Net asset value, end of period |
|
Total return1 |
|
Ratios and supplemental data: |
Net assets, end of period (000 omitted) |
Ratio of expenses to average net assets |
Ratio of expenses to average net assets prior to fees waived |
Ratio of net investment income to average net assets |
Ratio of net investment income to average net assets prior to fees waived |
Portfolio turnover |
| 1 | Total investment return is based on the change in net asset value of a share during the period and assumes reinvestment of dividends and distributions at net asset value and does not reflect the impact of a sales charge. Total investment return during all of the periods shown reflects a waiver by the manager. Performance would have been lower had the waiver not been in effect. |
See accompanying notes, which are an integral part of the financial statements.
32
| | | | | | | | | | | | | | | | | | | | |
| | | Year ended | |
| | | 7/31/14 | | | 7/31/13 | | | 7/31/12 | | | 7/31/11 | | | 7/31/10 | |
| |
| | $ | 4.280 | | | $ | 4.120 | | | $ | 4.200 | | | $ | 3.990 | | | $ | 3.560 | |
| | | | | |
| | | 0.206 | | | | 0.241 | | | | 0.280 | | | | 0.287 | | | | 0.329 | |
| | | 0.121 | | | | 0.173 | | | | (0.080 | ) | | | 0.221 | | | | 0.422 | |
| | | | | | | | | | | | | | | | | | | | |
| | | 0.327 | | | | 0.414 | | | | 0.200 | | | | 0.508 | | | | 0.751 | |
| | | | | | | | | | | | | | | | | | | | |
| | | | | |
| | | (0.217 | ) | | | (0.254 | ) | | | (0.280 | ) | | | (0.298 | ) | | | (0.321 | ) |
| | | | | | | | | | | | | | | | | | | | |
| | | (0.217 | ) | | | (0.254 | ) | | | (0.280 | ) | | | (0.298 | ) | | | (0.321 | ) |
| | | | | | | | | | | | | | | | | | | | |
| | | | | |
| | $ | 4.390 | | | $ | 4.280 | | | $ | 4.120 | | | $ | 4.200 | | | $ | 3.990 | |
| | | | | | | | | | | | | | | | | | | | |
| | | | | |
| | | 7.79% | | | | 10.23% | | | | 5.24% | | | | 13.04% | | | | 21.75% | |
| | | | | |
| | $ | 89,127 | | | $ | 85,574 | | | $ | 65,771 | | | $ | 53,151 | | | $ | 36,060 | |
| | | 1.81% | | | | 1.81% | | | | 1.81% | | | | 1.81% | | | | 1.81% | |
| | | | | |
| | | 1.86% | | | | 1.86% | | | | 1.88% | | | | 1.90% | | | | 1.95% | |
| | | 4.72% | | | | 5.63% | | | | 7.01% | | | | 6.90% | | | | 8.55% | |
| | | | | |
| | | 4.67% | | | | 5.58% | | | | 6.94% | | | | 6.81% | | | | 8.41% | |
| | | 105% | | | | 88% | | | | 61% | | | | 115% | | | | 141% | |
|
| |
33
Financial highlights
Delaware High-Yield Opportunities Fund Class R
Selected data for each share of the Fund outstanding throughout each period were as follows:
|
Net asset value, beginning of period |
|
Income (loss) from investment operations: |
Net investment income |
Net realized and unrealized gain (loss) |
Total from investment operations |
|
Less dividends and distributions from: |
Net investment income |
Total dividends and distributions |
|
Net asset value, end of period |
|
Total return1 |
|
Ratios and supplemental data: |
Net assets, end of period (000 omitted) |
Ratio of expenses to average net assets |
Ratio of expenses to average net assets prior to fees waived |
Ratio of net investment income to average net assets |
Ratio of net investment income to average net assets prior to fees waived |
Portfolio turnover |
| 1 | Total investment return is based on the change in net asset value of a share during the period and assumes reinvestment of dividends and distributions at net asset value. Total investment return during all of the periods shown reflects waivers by the manager and distributor. Performance would have been lower had the waivers not been in effect. |
See accompanying notes, which are an integral part of the financial statements.
34
| | | | | | | | | | | | | | | | | | | | |
| | | Year ended | |
| | | 7/31/14 | | | 7/31/13 | | | 7/31/12 | | | 7/31/11 | | | 7/31/10 | |
| | $ | 4.290 | | | $ | 4.120 | | | $ | 4.210 | | | $ | 3.990 | | | $ | 3.570 | |
| | | | | |
| | | 0.228 | | | | 0.263 | | | | 0.301 | | | | 0.308 | | | | 0.349 | |
| | | 0.111 | | | | 0.183 | | | | (0.090 | ) | | | 0.231 | | | | 0.412 | |
| | | | | | | | | | | | | | | | | | | | |
| | | 0.339 | | | | 0.446 | | | | 0.211 | | | | 0.539 | | | | 0.761 | |
| | | | | | | | | | | | | | | | | | | | |
| | | | | |
| | | (0.239 | ) | | | (0.276 | ) | | | (0.301 | ) | | | (0.319 | ) | | | (0.341 | ) |
| | | | | | | | | | | | | | | | | | | | |
| | | (0.239 | ) | | | (0.276 | ) | | | (0.301 | ) | | | (0.319 | ) | | | (0.341 | ) |
| | | | | | | | | | | | | | | | | | | | |
| | | | | |
| | $ | 4.390 | | | $ | 4.290 | | | $ | 4.120 | | | $ | 4.210 | | | $ | 3.990 | |
| | | | | | | | | | | | | | | | | | | | |
| | | | | |
| | | 8.08% | | | | 11.05% | | | | 5.51% | | | | 13.87% | | | | 22.01% | |
| | | | | |
| | $ | 16,580 | | | $ | 16,506 | | | $ | 14,637 | | | $ | 19,046 | | | $ | 14,708 | |
| | | 1.31% | | | | 1.31% | | | | 1.31% | | | | 1.31% | | | | 1.31% | |
| | | | | |
| | | 1.38% | | | | 1.46% | | | | 1.48% | | | | 1.50% | | | | 1.55% | |
| | | 5.22% | | | | 6.13% | | | | 7.51% | | | | 7.40% | | | | 9.05% | |
| | | | | |
| | | 5.15% | | | | 5.98% | | | | 7.34% | | | | 7.21% | | | | 8.81% | |
| | | 105% | | | | 88% | | | | 61% | | | | 115% | | | | 141% | |
35
Financial highlights
Delaware High-Yield Opportunities Fund Institutional Class
Selected data for each share of the Fund outstanding throughout each period were as follows:
|
Net asset value, beginning of period |
|
Income (loss) from investment operations: |
Net investment income |
Net realized and unrealized gain (loss) |
Total from investment operations |
|
Less dividends and distributions from: |
Net investment income |
Total dividends and distributions |
|
Net asset value, end of period |
|
Total return1 |
|
Ratios and supplemental data: |
Net assets, end of period (000 omitted) |
Ratio of expenses to average net assets |
Ratio of expenses to average net assets prior to fees waived |
Ratio of net investment income to average net assets |
Ratio of net investment income to average net assets prior to fees waived |
Portfolio turnover |
| 1 | Total investment return is based on the change in net asset value of a share during the period and assumes reinvestment of dividends and distributions at net asset value. Total investment return during all of the periods shown reflects a waiver by the manager. Performance would have been lower had the waiver not been in effect. |
See accompanying notes, which are an integral part of the financial statements.
36
| | | | | | | | | | | | | | | | | | | | |
| | | Year ended | |
| | | 7/31/14 | | | 7/31/13 | | | 7/31/12 | | | 7/31/11 | | | 7/31/10 | |
| | $ | 4.270 | | | $ | 4.110 | | | $ | 4.200 | | | $ | 3.980 | | | $ | 3.560 | |
| | | | | |
| | | 0.249 | | | | 0.284 | | | | 0.320 | | | | 0.328 | | | | 0.367 | |
| | | 0.121 | | | | 0.173 | | | | (0.090 | ) | | | 0.231 | | | | 0.412 | |
| | | | | | | | | | | | | | | | | | | | |
| | | 0.370 | | | | 0.457 | | | | 0.230 | | | | 0.559 | | | | 0.779 | |
| | | | | | | | | | | | | | | | | | | | |
| | | | | |
| | | (0.260 | ) | | | (0.297 | ) | | | (0.320 | ) | | | (0.339 | ) | | | (0.359 | ) |
| | | | | | | | | | | | | | | | | | | | |
| | | (0.260 | ) | | | (0.297 | ) | | | (0.320 | ) | | | (0.339 | ) | | | (0.359 | ) |
| | | | | | | | | | | | | | | | | | | | |
| | | | | |
| | $ | 4.380 | | | $ | 4.270 | | | $ | 4.110 | | | $ | 4.200 | | | $ | 3.980 | |
| | | | | | | | | | | | | | | | | | | | |
| | | | | |
| | | 8.87% | | | | 11.34% | | | | 6.03% | | | | 14.45% | | | | 22.65% | |
| | | | | |
| | $ | 232,971 | | | $ | 200,282 | | | $ | 185,843 | | | $ | 122,855 | | | $ | 59,831 | |
| | | 0.81% | | | | 0.81% | | | | 0.81% | | | | 0.81% | | | | 0.81% | |
| | | | | |
| | | 0.86% | | | | 0.86% | | | | 0.88% | | | | 0.90% | | | | 0.95% | |
| | | 5.72% | | | | 6.63% | | | | 8.01% | | | | 7.90% | | | | 9.55% | |
| | | | | |
| | | 5.67% | | | | 6.58% | | | | 7.94% | | | | 7.81% | | | | 9.41% | |
| | | 105% | | | | 88% | | | | 61% | | | | 115% | | | | 141% | |
37
Notes to financial statements
| | |
| Delaware High-Yield Opportunities Fund | | July 31, 2014 |
Delaware Group® Income Funds (Trust) is organized as a Delaware statutory trust and offers five series: Delaware Core Bond Fund, Delaware Corporate Bond Fund, Delaware Diversified Floating Rate Fund, Delaware Extended Duration Bond Fund, and Delaware High-Yield Opportunities Fund. These financial statements and the related notes pertain to Delaware High-Yield Opportunities Fund (Fund). The Trust is an open-end investment company. The Fund is considered diversified under the Investment Company Act of 1940, as amended, and offers Class A, Class B,* Class C, Class R, and Institutional Class shares. Class A shares are sold with a maximum front-end sales charge of 4.50%. Class A share purchases of $1,000,000 or more will incur a contingent deferred sales charge (CDSC) of 1.00% if redeemed during the first year and 0.50% during the second year, provided that Delaware Distributors, L.P. (DDLP) paid a financial advisor a commission on the purchase of those shares. Class B shares may be purchased only through dividend reinvestment and certain permitted exchanges. Prior to June 1, 2007, Class B shares were sold with a CDSC that declined from 4.00% to zero depending upon the period of time the shares were held. Class B shares will automatically convert to Class A shares on a quarterly basis approximately eight years after purchase.* Class C shares are sold with a CDSC of 1.00%, if redeemed during the first 12 months. Class R and Institutional Class shares are not subject to a sales charge and are offered for sale exclusively to certain eligible investors.
The investment objective of the Fund is to seek total return and, as a secondary objective, high current income.
*See Note 14.
1. Significant Accounting Policies
The following accounting policies are in accordance with U.S. generally accepted accounting principles (U.S. GAAP) and are consistently followed by the Fund.
Security Valuation – Equity securities, except those traded on the Nasdaq Stock Market, Inc. (Nasdaq), are valued at the last quoted sales price as of the time of the regular close of the New York Stock Exchange on the valuation date. Securities traded on the Nasdaq are valued in accordance with the Nasdaq Official Closing Price, which may not be the last sales price. If, on a particular day, an equity security does not trade, then the mean between the bid and ask prices will be used, which approximates fair value. Debt securities are valued based upon valuations provided by an independent pricing service or broker and reviewed by management. To the extent current market prices are not available, the pricing service may take into account developments related to the specific security, as well as transactions in comparable securities. U.S. government and agency securities are valued at the mean between the bid and ask prices, which approximates fair value. Valuations for fixed income securities utilize matrix systems, which reflect such factors as security prices, yields, maturities, and ratings, and are supplemented by dealer and exchange quotations. Investment company securities are valued at net asset value per share, as reported by the underlying investment company. Generally, other securities and assets for which market quotations are not readily available are valued at fair value as determined in good faith under the direction of the Fund’s Board of Trustees (Board). In determining whether market quotations are readily available or fair valuation will be used, various factors will be taken into consideration, such as market closures or suspension of trading in a security.
38
Federal Income Taxes – No provision for federal income taxes has been made as the Fund intends to continue to qualify for federal income tax purposes as a regulated investment company under Subchapter M of the Internal Revenue Code of 1986, as amended, and make the requisite distributions to shareholders. The Fund evaluates tax positions taken or expected to be taken in the course of preparing the Fund’s tax returns to determine whether the tax positions are “more-likely-than-not” of being sustained by the applicable tax authority. Tax positions not deemed to meet the “more-likely-than-not” threshold are recorded as a tax benefit or expense in the current year. Management has analyzed the Fund’s tax positions taken for all open federal income tax years (July 31, 2011–July 31, 2014), and has concluded that no provision for federal income tax is required in the Fund’s financial statements.
Class Accounting – Investment income and common expenses are allocated to the various classes of the Fund on the basis of “settled shares” of each class in relation to the net assets of the Fund. Realized and unrealized gain (loss) on investments are allocated to the various classes of the Fund on the basis of daily net assets of each class. Distribution expenses relating to a specific class are charged directly to that class.
Repurchase Agreements – The Fund may purchase certain U.S. government securities subject to the counterparty’s agreement to repurchase them at an agreed upon date and price. The counterparty will be required on a daily basis to maintain the value of the collateral subject to the agreement at not less than the repurchase price (including accrued interest). The agreements are conditioned upon the collateral being deposited under the Federal Reserve book-entry system with the Fund’s custodian or a third-party sub-custodian. In the event of default or bankruptcy by the other party to the agreement, retention of the collateral may be subject to legal proceedings. All open repurchase agreements as of the date of this report were entered into on July 31, 2014.
Foreign Currency Transactions – Transactions denominated in foreign currencies are recorded at the prevailing exchange rates on the valuation date in accordance with the Fund’s prospectus. The value of all assets and liabilities denominated in foreign currencies is translated daily into U.S. dollars at the exchange rate of such currencies against the U.S. dollar. Transaction gains or losses resulting from changes in exchange rates during the reporting period or upon settlement of the foreign currency transaction are reported in operations for the current period. The Fund generally bifurcates that portion of realized gains and losses on investments in debt securities which is due to changes in foreign exchange rates from that which is due to changes in market prices of debt securities. That portion of gains (losses) is included on the “Statement of operations” under “Net realized gain (loss) on foreign currencies.” For foreign equity securities, these changes are included under “Net realized and unrealized gain or loss on investments.” The Fund reports certain foreign currency related transactions as components of realized gains (losses) for financial reporting purposes, whereas such components are treated as ordinary income (loss) for federal income tax purposes.
Use of Estimates – The preparation of financial statements in conformity with U.S. GAAP requires management to make estimates and assumptions that affect the fair value of investments, the reported amounts of assets and liabilities and disclosure of contingent assets and liabilities at the date of the financial statements, and the reported amounts of revenues and expenses during the reporting period. Actual results could differ from those estimates and the differences could be material.
39
Notes to financial statements
Delaware High-Yield Opportunities Fund
1. Significant Accounting Policies (continued)
Other — Expenses directly attributable to the Fund are charged directly to the Fund. Other expenses common to various funds within the Delaware Investments® Family of Funds are generally allocated among such funds on the basis of average net assets. Management fees and some other expenses are paid monthly. Security transactions are recorded on the date the securities are purchased or sold (trade date) for financial reporting purposes. Costs used in calculating realized gains and losses on the sale of investment securities are those of the specific securities sold. Dividend income is recorded on the ex-dividend date and interest income is recorded on the accrual basis. Discounts and premiums on debt securities are amortized and accreted to interest income over the lives of the respective securities using the effective interest method. The Fund declares dividends daily from net investment income and pays the dividends monthly and declares and pays distributions from net realized gain on investments, if any, annually. The Fund may distribute more frequently, if necessary for tax purposes. Dividends and distributions, if any, are recorded on the ex-dividend date.
The Fund may receive earnings credits from its custodian when positive cash balances are maintained, which may be used to offset custody fees. There were no earnings credits for the year ended July 31, 2014.
The Fund receives earnings credits from its transfer agent when positive cash balances are maintained, which may be used to offset transfer agent fees. If the amount earned is greater than one dollar, the expense paid under this arrangement is included on the “Statement of operations” under “Dividend disbursing and transfer agent fees and expenses” and with the corresponding expense offset shown under “Less expense paid indirectly.” For the year ended July 31, 2014, the Fund earned $530 under this agreement.
2. Investment Management, Administration Agreements and Other Transactions with Affiliates
In accordance with the terms of its investment management agreement, the Fund pays Delaware Management Company (DMC), a series of Delaware Management Business Trust and the investment manager, an annual fee which is calculated daily at the rate of 0.65% on the first $500 million of average daily net assets of the Fund, 0.60% on the next $500 million, 0.55% on the next $1.5 billion, and 0.50% on average daily net assets in excess of $2.5 billion.
DMC has contractually agreed to waive that portion, if any, of its management fee and/or pay/reimburse the Fund to the extent necessary to ensure that total annual operating expenses, (excluding any 12b-1 plan expenses, taxes, interest, inverse floater program expenses, short sale and dividend interest expenses, brokerage fees, certain insurance costs, and nonroutine expenses or costs, including, but not limited to, those relating to reorganizations, litigation, conducting shareholder meetings, and liquidations (collectively, nonroutine expenses)), do not exceed 0.81% of average daily net assets of the Fund from Aug. 1, 2013 through July 31, 2014.** This waiver and reimbursement may only be terminated by agreement of DMC and the Fund.
Delaware Service Company, Inc. (DSC), an affiliate of DMC, provides fund accounting and financial administration oversight services to the Fund. For these services, the Fund pays DSC fees based on the aggregate daily net assets of the Delaware Investments® Family of Funds at the following annual rate: 0.0050% of the first $30 billion; 0.0045% of the next $10 billion; 0.0040% of the next $10 billion; and
40
0.0025% of aggregate average daily net assets in excess of $50 billion. The fees payable to DSC under the service agreement described above are allocated among all Funds in the Delaware Investments Family of Funds on a relative net asset value basis. For the year ended July 31, 2014, the Fund was charged $32,179 for these services.
DSC is also the transfer agent and dividend disbursing agent of the Fund. For these services, the Fund pays DSC fees based on the aggregate daily net assets of the retail funds within the Delaware Investments® Family of Funds at the following annual rate: 0.025% of the first $20 billion; 0.020% of the next $5 billion; 0.015% of the next $5 billion; and 0.013% on average daily net assets in excess of $30 billion. This amount is included on the “Statement of operations” under “Dividend disbursing and transfer agent fees and expenses.” For the year ended July 31, 2014, the amount charged by DSC was $146,316. Pursuant to a sub-transfer agency agreement between DSC and BNY Mellon Investment Servicing (US) Inc. (BNYMIS), BNYMIS provides certain sub-transfer agency services to the Fund. Sub-transfer agency fees are passed on to and paid directly by the Fund.
Pursuant to a distribution agreement and distribution plan, the Fund pays DDLP, the distributor and an affiliate of DMC, an annual distribution and service fee of 0.25% of the average daily net assets of the Class A shares, 1.00% of the average daily net assets of the Class B and Class C shares and 0.50% of the average daily net assets of the Class R shares. Institutional Class shares pay no distribution and service expenses. DDLP has contracted to limit Class B shares 12b-1 fees from Jan. 2, 2014 through July 31, 2014*** to no more than 0.25% of its average daily net assets. Prior to Jan. 2, 2014, there was no waiver. The total 12b-1 fees to be paid by Class A shareholders of the Fund will be the sum of: (i) 0.10% of the average daily net assets representing shares that were acquired prior to June 1, 1992 and (ii) 0.25% of the average daily net assets representing shares that were acquired on or after June 1, 1992. All Class A shareholders will bear 12b-1 fees at the same rate, the blended rate based upon the allocation of the rates described above. This method of calculating Class A 12b-1 fees may be discontinued at the sole discretion of the Board.
As provided in the investment management agreement, the Fund bears a portion of the cost of certain resources shared with DMC, including the cost of internal personnel of DMC and/or its affiliates that provide legal, tax, and regulatory reporting services to the Fund. For the year ended July 31, 2014, the Fund was charged $19,129 for internal legal, tax, and regulatory services provided by DMC and/or its affiliates’ employees.
For the year ended July 31, 2014, DDLP earned $40,093 for commissions on sales of the Fund’s Class A shares. For the year ended July 31, 2014, DDLP received gross CDSC commissions of $3,925 on redemptions of the Fund’s Class C shares, and these commissions were entirely used to offset upfront commissions previously paid by DDLP to broker/dealers on sales of those shares.
Trustees’ fees include expenses accrued by the Fund for each Trustee’s retainer and meeting fees. Certain officers of DMC, DSC, and DDLP are officers and/or Trustees of the Trust. These officers and Trustees are paid no compensation by the Fund.
** The contractual waiver period is Nov. 28, 2012 through Nov. 28, 2014.
*** The contractual waiver period is Jan. 2, 2014 through Nov. 27, 2015.
41
Notes to financial statements
Delaware High-Yield Opportunities Fund
3. Investments
For the year ended July 31, 2014, the Fund made purchases and sales of investment securities other than short-term investments as follows:
| | | | |
Purchases | | $ | 664,056,394 | |
Sales | | | 664,125,858 | |
At July 31, 2014, the cost of investments and unrealized appreciation (depreciation) for federal income tax purposes for the Fund were as follows:
| | | | |
Cost of investments | | $ | 650,329,072 | |
| | | | |
Aggregate unrealized appreciation | | $ | 21,712,839 | |
Aggregate unrealized depreciation | | | (4,036,595 | ) |
| | | | |
Net unrealized appreciation | | $ | 17,676,244 | |
| | | | |
U.S. GAAP defines fair value as the price that the Fund would receive to sell an asset or pay to transfer a liability in an orderly transaction between market participants at the measurement date under current market conditions. A three-level hierarchy for fair value measurements has been established based upon the transparency of inputs to the valuation of an asset or liability. Inputs may be observable or unobservable and refer broadly to the assumptions that market participants would use in pricing the asset or liability. Observable inputs reflect the assumptions market participants would use in pricing the asset or liability based on market data obtained from sources independent of the reporting entity. Unobservable inputs reflect the reporting entity’s own assumptions about the assumptions that market participants would use in pricing the asset or liability developed based on the best information available under the circumstances. The Fund’s investment in its entirety is assigned a level based upon the observability of the inputs which are significant to the overall valuation. The three-level hierarchy of inputs is summarized below.
| Level 1 – | Inputs are quoted prices in active markets for identical investments. (Examples: equity securities, open-end investment companies, futures contracts, exchange-traded options contracts) |
| Level 2 – | Other observable inputs, including, but not limited to: quoted prices for similar assets or liabilities in markets that are active, quoted prices for identical or similar assets or liabilities in markets that are not active, inputs other than quoted prices that are observable for the assets or liabilities (such as interest rates, yield curves, volatilities, prepayment speeds, loss severities, credit risks, and default rates) or other market-corroborated inputs. (Examples: debt securities, government securities, swap contracts, foreign currency exchange contracts, foreign securities utilizing international fair value pricing, broker-quoted securities, fair valued securities) |
| Level 3 – | Significant unobservable inputs, including the Fund’s own assumptions used to determine the fair value of investments. (Examples: broker-quoted securities, fair valued securities) |
Level 3 investments are valued using significant unobservable inputs. The Fund may also use an income-based valuation approach in which the anticipated future cash flows of the investment are discounted to calculate fair value. Discounts may also be applied due to the nature or duration of any restrictions on the disposition of the investments. Valuations may also be based upon current market prices of
42
securities that are comparable in coupon, rating, maturity, and industry. The derived value of a Level 3 investment may not represent the value which is received upon disposition and this could impact the results of operations.
The following table summarizes the valuation of the Fund’s investments by fair value hierarchy levels as of July 31, 2014:
| | | | | | | | | | | | | | | | |
| | | Level 1 | | | Level 2 | | | Level 3 | | | Total | |
Corporate Debt | | $ | — | | | $ | 547,248,335 | | | $ | — | | | $ | 547,248,335 | |
Senior Secured Loans | | | — | | | | 62,238,710 | | | | — | | | | 62,238,710 | |
Common Stock | | | 7,968,128 | | | | — | | | | — | | | | 7,968,128 | |
Convertible Preferred Stock1 | | | 4,610,883 | | | | 2,878,100 | | | | — | | | | 7,488,983 | |
Preferred Stock1 | | | 5,105,160 | | | | 6,700,000 | | | | — | | | | 11,805,160 | |
Short-Term Investments | | | — | | | | 31,256,000 | | | | — | | | | 31,256,000 | |
| | | | | | | | | | | | | | | | |
| | | | |
Total | | $ | 17,684,171 | | | $ | 650,321,145 | | | $ | — | | | $ | 668,005,316 | |
| | | | | | | | | | | | | | | | |
Futures Contracts | | | 159,523 | | | | — | | | | — | | | | 159,523 | |
| | | | | | | | | | | | | | | | |
| 1 | Security type is valued across multiple levels . The amount attributed to Level 1 investments and Level 2 investments represents the following percentages of the total market value of this security type for the Fund. Level 1 investments represent exchange-traded investments while Level 2 investments represent investments with observable inputs. |
| | | | | | | | | | | | |
| | | Level 1 | | | Level 2 | | | Total | |
Convertible Preferred Stock | | | 61.57 | % | | | 38.43 | % | | | 100.00 | % |
Preferred Stock | | | 43.25 | % | | | 56.75 | % | | | 100.00 | % |
The securities that have been deemed worthless on the schedule of investments are considered to be Level 3 investments in the table.
During the year ended July 31, 2014, there were no transfers between Level 1 investments,
Level 2 investments, or Level 3 investments that had a significant impact to the Fund. The Fund’s policy is to recognize transfers between levels at the beginning of the reporting period.
A reconciliation of Level 3 investments is presented when the Fund has a significant amount of Level 3 investments at the beginning, interim, or end of the period in relation to net assets. Management has determined not to provide additional disclosure on Level 3 inputs under ASU No. 2011-04 since the Level 3 investments are not considered significant to the Fund’s net assets at the end of the period.
43
Notes to financial statements
Delaware High-Yield Opportunities Fund
4. Dividend and Distribution Information
Income and long-term capital gain distributions are determined in accordance with federal income tax regulations, which may differ from U.S. GAAP. Additionally, distributions from net short-term gains on sales of investment securities are treated as ordinary income for federal income tax purposes. The tax character of dividends and distributions paid during the years ended July 31, 2014 and 2013 was as follows:
| | | | | | | | |
| | | Year ended | |
| | | 7/31/14 | | | 7/31/13 | |
Ordinary income | | $ | 38,058,834 | | | $ | 42,733,548 | |
5. Components of Net Assets on a Tax Basis
As of July 31, 2014, the components of net assets on a tax basis were as follows:
| | | | |
Shares of beneficial interest | | $ | 662,172,569 | |
Undistributed ordinary income | | | 959,631 | |
Distributions payable | | | (983,474 | ) |
Capital loss carryforwards | | | (12,721,923 | ) |
Unrealized appreciation | | | 17,676,244 | |
| | | | |
Net assets | | $ | 667,103,047 | |
| | | | |
The differences between book basis and tax basis components of net assets are primarily attributable to tax deferral of losses on wash sales, mark-to-market of futures contracts, tax treatment of trust preferred securities, and market discount and premium on debt instruments.
For financial reporting purposes, capital accounts are adjusted to reflect the tax character of permanent book/tax differences. Reclassifications are primarily due to tax treatment of market discount and premium on debt instruments and gain (loss) on foreign currency transactions. Results of operations and net assets were not affected by these reclassifications. For the year ended July 31, 2014, the Fund recorded the following reclassifications:
| | | | |
Undistributed net investment income | | $ | 945,322 | |
Accumulated net realized loss | | | (945,322 | ) |
For federal income tax purposes, capital loss carryforwards may be carried forward and applied against future capital gains. $23,598,496 was utilized in 2014. Capital loss carryforwards remaining at July 31, 2014, will expire as follows: $12,721,923 expires in 2017. The use of these losses is subject to an annual limitation in accordance with the internal revenue code.
On Dec. 22, 2010, the Regulated Investment Company Modernization Act of 2010 (Act) was enacted, which changed various technical rules governing the tax treatment of regulated investment companies. The changes were generally effective for taxable years beginning after the date of enactment. Under the Act, the Fund is permitted to carry forward capital losses incurred in taxable years beginning after the date of enactment for an unlimited period. However, any losses incurred during those future taxable years will be required to be utilized prior to the losses incurred in pre-enactment taxable years, which carry an expiration date. As a result of this ordering rule, pre-enactment capital loss carryforwards may be more likely to expire unused. Additionally, post-enactment capital loss carryforwards will retain their
44
character as either short-term or long-term capital losses rather than being considered all short-term as permitted under previous regulation.
6. Capital Shares
Transactions in capital shares were as follows:
| | | | | | | | |
| | | Year ended | |
| | | 7/31/14 | | | 7/31/13 | |
Shares sold: | | | | | | | | |
Class A | | | 14,869,852 | | | | 23,531,258 | |
Class B | | | 33,151 | | | | 12,796 | |
Class C | | | 4,409,653 | | | | 7,829,884 | |
Class R | | | 1,918,422 | | | | 2,323,708 | |
Institutional Class | | | 27,875,764 | | | | 31,559,302 | |
| | |
Shares issued upon reinvestment of dividends and distributions: | | | | | | | | |
Class A | | | 3,872,568 | | | | 4,341,317 | |
Class B | | | 23,306 | | | | 47,237 | |
Class C | | | 894,654 | | | | 868,111 | |
Class R | | | 215,954 | | | | 241,574 | |
Institutional Class | | | 2,855,148 | | | | 3,024,352 | |
| | | | | | | | |
| | | 56,968,472 | | | | 73,779,539 | |
| | | | | | | | |
| | |
Shares redeemed: | | | | | | | | |
Class A | | | (20,954,399 | ) | | | (26,810,804 | ) |
Class B | | | (422,589 | ) | | | (586,314 | ) |
Class C | | | (4,983,086 | ) | | | (4,667,614 | ) |
Class R | | | (2,212,101 | ) | | | (2,262,507 | ) |
Institutional Class | | | (24,406,146 | ) | | | (32,898,698 | ) |
| | | | | | | | |
| | | (52,978,321 | ) | | | (67,225,937 | ) |
| | | | | | | | |
Net increase | | | 3,990,151 | | | | 6,553,602 | |
| | | | | | | | |
For the years ended July 31, 2014 and 2013, 124,981 Class B shares were converted to 125,186 Class A shares valued at $546,648 and 164,506 Class B shares were converted to 164,750 Class A shares valued at $704,709, respectively. The respective amounts are included in Class B redemptions and Class A subscriptions in the table above and in the “Statements of changes in net assets.”
7. Line of Credit
The Fund, along with certain other funds in the Delaware Investments® Family of Funds (Participants), was a participant in a $125,000,000 revolving line of credit to be used for temporary or emergency purposes as an additional source of liquidity to fund redemptions of investor shares. Under the agreement, the Participants were charged an annual commitment fee of 0.08%, which was allocated across the Participants on the basis of each Participant’s allocation of the entire facility. The Participants
45
Notes to financial statements
Delaware High-Yield Opportunities Fund
7. Line of Credit (continued)
were permitted to borrow up to a maximum of one third of their net assets under the agreement. Each participant was individually, and not jointly, liable for its particular advances, if any, under the line of credit. The line of credit under the agreement expired on Nov. 12, 2013.
On Nov. 12, 2013, the Fund, along with the other Participants, entered into an amendment to the agreement for a $225,000,000 revolving line of credit. The line of credit is to be used as described above and operates in substantially the same manner as the original agreement. The line of credit available under the agreement will expire on Nov. 10, 2014.
The Fund had no amounts outstanding as of July 31, 2014, or at any time during the year then ended.
8. Derivatives
U.S. GAAP requires disclosures that enable investors to understand: (1) how and why an entity uses derivatives; (2) how they are accounted for; and (3) how they affect an entity’s results of operations and financial position.
Futures Contracts – A futures contract is an agreement in which the writer (or seller) of the contract agrees to deliver to the buyer an amount of cash or securities equal to a specific dollar amount times the difference between the value of a specific security or index at the close of the last trading day of the contract and the price at which the agreement is made. The Fund may use futures in the normal course of pursuing its investment objective. The Fund may invest in futures contracts to hedge its existing portfolio securities against fluctuations in fair value caused by changes in interest rates or market conditions. Upon entering into a futures contract, the Fund deposits cash or pledges U.S. government securities to a broker, equal to the minimum “initial margin” requirements of the exchange on which the contract is traded. Subsequent payments are received from the broker or paid to the broker each day, based on the daily fluctuation in the market value of the contract. These receipts or payments are known as “variation margin” and are recorded daily by the Fund as unrealized gains or losses until the contracts are closed. When the contracts are closed, the Fund records a realized gain or loss equal to the difference between the value of the contract at the time it was opened and the value at the time it was closed. Risks of entering into futures contracts include potential imperfect correlation between the futures contracts and the underlying securities and the possibility of an illiquid secondary market for these instruments. When investing in futures, there is reduced counterparty credit risk to the Fund because futures are exchange-traded and the exchange’s clearinghouse, as counterparty to all exchange-traded futures, guarantees against default. The Fund posted $147,000 cash collateral for open futures contracts, which is presented under “Cash collateral due from brokers” on the “Statement of assets and liabilities.”
During the year ended July 31, 2014, the Fund used futures contracts to hedge the Fund’s existing portfolio securities against fluctuations in value caused by changes in interest rates or market conditions.
46
Fair values of derivative instruments as of July 31, 2014 were as follows:
| | | | | | | | |
| | | Asset Derivatives | | Liability Derivatives |
| | | Statement of
Assets and
Liabilities Location | | Fair Value | | Statement of
Assets and
Liabilities Location | | Fair Value |
Interest rate contracts (Futures contracts) | | Variation margin
receivable on
futures contracts* | | $159,523 | | Variation margin
payable on
futures contracts | | $— |
*Includes cumulative appreciation or depreciation of futures contracts from the date the contracts are opened through July 31, 2014. Only current day variation margin is reported on the Fund’s “Statement of assets and liabilities.”
The effect of derivative instruments on the “Statement of operations” for the year ended July 31, 2014 was as follows:
| | | | |
| | | Net Realized Loss on: |
| | | Financial | | |
| | | Futures | | |
| | | Contracts | | Total |
Interest rate contracts | | $(292,868) | | $(292,868) |
| | | Net Change in Unrealized Appreciation of: |
| | | Financial | | |
| | | Futures | | |
| | | Contracts | | Total |
Interest rate contracts | | $159,523 | | $159,523 |
Derivatives Generally. The table below summarizes the average balance of derivative holdings by the Fund during the year ended July 31, 2014.
| | | | | | | | | | |
| | | Long Derivative | | | Short Derivative |
| | | Volume | | | Volume |
Futures contracts (average notional value) | | | USD | | | | — | | | USD10,184,727 |
9. Offsetting
In December 2011, the Financial Accounting Standards Board (FASB) issued guidance that expands current disclosure requirements on the offsetting of certain assets and liabilities. The new disclosures are required for investments and derivative financial instruments subject to master netting or similar agreements which are eligible for offset on the “Statement of assets and liabilities” and require an entity to disclose both gross and net information about such investments and transactions in the financial statements. In January 2013, the FASB issued guidance that clarifies which investments and transactions are subject to the offsetting disclosure requirements. The scope of the disclosure requirements for offsetting is limited to derivative instruments, repurchase agreements and reverse repurchase agreements, and securities borrowing. The guidance is effective for financial statements with fiscal years beginning on or after Jan. 1, 2013, and interim periods within those fiscal years. The Fund adopted the disclosure provisions on offsetting during the current reporting period.
47
Notes to financial statements
Delaware High-Yield Opportunities Fund
9. Offsetting (continued)
In order to better define its contractual rights and to secure rights that will help the Fund mitigate its counterparty risk, the Fund entered into an International Swaps and Derivatives Association, Inc. Master Agreement (ISDA Master Agreement) or a similar agreement with their derivative contract counterparties. An ISDA Master Agreement is a bilateral agreement between the Series and a counterparty that governs over-the-counter (OTC) derivatives and foreign exchange contracts and typically contains, among other things, collateral posting items and netting provisions in the event of a default and/or termination event. Under an ISDA Master Agreement, the Fund may, under certain circumstances, offset with the counterparty certain derivative financial instrument’s payables and/or receivables with collateral held and/or posted and create one single net payment. The provisions of the ISDA Master Agreement typically permit a single net payment in the event of default (close-out) including the bankruptcy or insolvency of the counterparty. However, bankruptcy or insolvency laws of a particular jurisdiction may impose restrictions on or prohibitions against the right of offset in bankruptcy, insolvency or other events.
For financial reporting purposes, the Fund does not offset derivative assets and derivative liabilities that are subject to netting arrangements in the “Statement of assets and liabilities.”
At July 31, 2014, the Fund had the following assets and liabilities subject to offsetting provisions:
Offsetting of Financial Assets and Liabilities and Derivatives Assets and Liabilities
Master Repurchase Agreements
| | | | | | | | | | | | | | | | |
| | | | | | Fair Value of | | | | | | | |
| | | Repurchase | | | Non-Cash | | | Cash Collateral | | | | |
Counterparty | | Agreements | | | Collateral Received | | | Received | | | Net Amount(a) | |
Bank of America Merrill Lynch | | $ | 9,754,910 | | | $ | (9,754,910 | ) | | $ | — | | | $ | — | |
Bank of Montreal | | | 3,251,637 | | | | (3,251,637 | ) | | | — | | | | — | |
BNP Paribas | | | 18,249,453 | | | | (18,249,453 | ) | | | — | | | | — | |
| | | | | | | | | | | | | | | | |
Total | | $ | 31,256,000 | | | $ | (31,256,000 | ) | | $ | — | | | $ | — | |
| | | | | | | | | | | | | | | | |
(a) Net amount represents the receivable/(payable) that would be due from/(to) the counterparty in an event of default.
10. Securities Lending
The Fund, along with other funds in the Delaware Investments® Family of Funds, may lend its securities pursuant to a security lending agreement (Lending Agreement) with The Bank of New York Mellon (BNY Mellon). At the time a security is loaned, the borrower must post collateral equal to the required percentage of the market value of the loaned security, including any accrued interest. The required percentage is: (1) 102% with respect to U.S. securities and foreign securities that are denominated and payable in U.S. dollars; and (2) 105% with respect to foreign securities. With respect to each loan, if on any business day the aggregate market value of securities collateral plus cash collateral held is less than the aggregate market value of the securities which are the subject of such loan, the borrower will be notified to provide additional collateral by the end of the following business day which, together with the
48
collateral already held, will be not less than the applicable initial collateral requirements for such security loan. If the aggregate market value of securities collateral and cash collateral held with respect to a security loan exceeds the applicable initial collateral requirement, upon request of the borrower, BNY Mellon must return enough collateral to the borrower by the end of the following business day to reduce the value of the remaining collateral to the applicable initial collateral requirement for such security loan. As a result of the foregoing, the value of the collateral held with respect to a loaned security on any particular day may be more or less than the value of the security on loan.
Cash collateral received is generally invested in the Delaware Investments® Collateral Fund No. 1 (Collective Trust) established by BNY Mellon for the purpose of investment on behalf of funds managed by DMC that participate in BNY Mellon’s securities lending program. The Collective Trust may invest in U.S. government securities and high-quality corporate debt, asset-backed and other money market securities, and in repurchase agreements collateralized by such securities, provided that the Collective Trust will generally have a dollar-weighted average portfolio maturity of 60 days or less. The Fund can also accept U.S. government securities and letters of credit (non-cash collateral) in connection with securities loans. In the event of default or bankruptcy by the lending agent, realization and/or retention of the collateral may be subject to legal proceedings. In the event the borrower fails to return loaned securities and the collateral received is insufficient to cover the value of the loaned securities and provided such collateral shortfall is not the result of investment losses, the lending agent has agreed to pay the amount of the shortfall to the Fund or, at the discretion of the lending agent, replace the loaned securities. The Fund continues to record dividends or interest, as applicable, on the securities loaned and is subject to changes in value of the securities loaned that may occur during the term of the loan. The Fund has the right under the Lending Agreement to recover the securities from the borrower on demand. With respect to security loans collateralized by non-cash collateral, the Fund receives loan premiums paid by the borrower. With respect to security loans collateralized by cash collateral, the earnings from the collateral investments are shared among the Fund, the security lending agent, and the borrower. The Fund records security lending income net of allocations to the security lending agent and the borrower.
The Collective Trust used for the investment of cash collateral received from borrowers of securities seeks to maintain a net asset value per unit of $1.00, but there can be no assurance that it will always be able to do so. The Fund may incur investment losses as a result of investing securities lending collateral in the Collective Trust. This could occur if an investment in the Collective Trust defaulted or if it were necessary to liquidate assets in the Collective Trust to meet returns on outstanding security loans at a time when the Collective Trust’s net asset value per unit was less than $1.00. Under those circumstances, the Fund may not receive an amount from the Collective Trust that is equal in amount to the collateral the Fund would be required to return to the borrower of the securities and the Fund would be required to make up for this shortfall.
At July 31, 2014, the Fund had no securities on loan.
11. Credit and Market Risk
The Fund invests in high yield fixed income securities, which are securities rated lower than BBB- by Standard & Poor’s and Baa3 by Moody’s Investors Service, or similarly rated by another nationally
49
Notes to financial statements
Delaware High-Yield Opportunities Fund
11. Credit and Market Risk (continued)
recognized statistical rating organization. Investments in these higher yielding securities are generally accompanied by a greater degree of credit risk than higher rated securities. Additionally, lower rated securities may be more susceptible to adverse economic and competitive industry conditions than investment-grade securities.
The Fund invests in certain obligations that may have liquidity protection designed to ensure that the receipt of payments due on the underlying security is timely. Such protection may be provided through guarantees, insurance policies, or letters of credit obtained by the issuer or sponsor through third parties, through various means of structuring the transaction, or through a combination of such approaches. The Fund will not pay any additional fees for such credit support, although the existence of credit support may increase the price of a security.
The Fund may invest up to 15% of its net assets in illiquid securities, which may include securities with contractual restrictions on resale, securities exempt from registration under Rule 144A of the Securities Act of 1933, as amended, and other securities which may not be readily marketable. The relative illiquidity of these securities may impair the Fund from disposing of them in a timely manner and at a fair price when it is necessary or desirable to do so. While maintaining oversight, the Fund’s Board has delegated to DMC the day-to-day functions of determining whether individual securities are liquid for purposes of the Fund’s limitation on investments in illiquid securities. Securities eligible for resale pursuant to Rule 144A, which are determined to be liquid, are not subject to the Fund’s 15% limit on investments in illiquid securities. As of July 31, 2014, no securities held by the Fund have been determined to be illiquid under the Fund’s Liquidity Procedures. Rule 144A securities have been identified on the Schedule of investments.
12. Contractual Obligations
The Fund enters into contracts in the normal course of business that contain a variety of indemnifications. The Fund’s maximum exposure under these arrangements is unknown. However, the Fund has not had prior claims or losses pursuant to these contracts. Management has reviewed the Fund’s existing contracts and expects the risk of loss to be remote.
50
13. Recent Accounting Pronouncements
In June 2014, the Financial Accounting Standards Board issued guidance to improve the financial reporting of reverse repurchase agreements and other similar transactions. The guidance includes expanded disclosure requirements for entities that enter into reverse repurchase agreements and similar transactions accounted for as secured borrowings. The guidance is effective for financial statements with fiscal years beginning on or after Dec. 15, 2014 and interim periods within those fiscal years. Management is evaluating the impact, if any, of this guidance on the Fund’s financial statement disclosures.
14. Subsequent Events
Effective Sept. 25, 2014, all remaining shares of Class B were converted to Class A shares.
Management has determined that no other material events or transactions occurred subsequent to July 31, 2014 that would require recognition or disclosure in the Fund’s financial statements.
51
Report of independent
registered public accounting firm
To the Board of Trustees of Delaware Group® Income Funds
and the Shareholders of Delaware High-Yield Opportunities Fund:
In our opinion, the accompanying statement of assets and liabilities, including the schedule of investments, and the related statements of operations and of changes in net assets and the financial highlights present fairly, in all material respects, the financial position of Delaware High-Yield Opportunities Fund (one of the series constituting Delaware Group® Income Funds, hereinafter referred to as the “Fund”) at July 31, 2014, the results of its operations for the year then ended, the changes in its net assets for each of the two years in the period then ended and the financial highlights for each of the five years in the period then ended, in conformity with accounting principles generally accepted in the United States of America. These financial statements and financial highlights (hereafter referred to as “financial statements”) are the responsibility of the Fund’s management. Our responsibility is to express an opinion on these financial statements based on our audit. We conducted our audit of these financial statements in accordance with the standards of the Public Company Accounting Oversight Board (United States). Those standards require that we plan and perform the audit to obtain reasonable assurance about whether the financial statements are free of material misstatement. An audit includes examining, on a test basis, evidence supporting the amounts and disclosures in the financial statements, assessing the accounting principles used and significant estimates made by management, and evaluating the overall financial statement presentation. We believe that our audit, which included confirmation of securities at July 31, 2014 by correspondence with the custodian and brokers, and the application of alternative auditing procedures where confirmations of security purchases had not been received, provides a reasonable basis for our opinion.
PricewaterhouseCoopers LLP
Philadelphia, Pennsylvania
September 19, 2014
52
Other Fund information (Unaudited)
Delaware High-Yield Opportunities Fund
Tax Information
The information set forth below is for the Fund’s fiscal year as required by federal income tax laws. Shareholders, however, must report distributions on a calendar year basis for income tax purposes, which may include distributions for portions of two fiscal years of the Fund. Accordingly, the information needed by shareholders for income tax purposes will be sent to them in January of each year. Please consult your tax advisor for proper treatment of this information.
All disclosures are based on financial information available as of the date of this annual report and, accordingly are subject to change. For any and all items requiring reporting, it is the intention of the Fund to report the maximum amount permitted under the Internal Revenue Code and the regulations thereunder.
For the fiscal year ended July 31, 2014, the Fund reports distributions paid during the year as follows:
| | | | |
(A) Ordinary Income Distribution (Tax Basis)* | | | 100.00 | % |
(B) Qualifying dividends1 | | | 2.42 | % |
(A) is based on a percentage of the Fund’s total distributions.
(B) is based on a percentage of the Fund’s ordinary income distributions
1 Qualifying dividends represent dividends which qualify for the corporate dividends received deduction.
*For the fiscal year ended July 31, 2014, certain dividends paid by the Fund may be subject to a maximum tax rate of 15%, as provided by the Jobs and Growth Tax Relief Reconciliation Act of 2003, as extended by the Tax Relief, Unemployment Insurance Reauthorization and Jobs Creation Act of 2010, and made permanent by the American Taxpayer Relief Act of 2012. The Fund intends to report up to a maximum amount of 2.56% to be taxed at a maximum rate of 15%. Complete information will be computed and reported in conjunction with your 2014 Form 1099-DIV.
For the fiscal year ended July 31, 2014, certain dividends paid by the Fund has been determined to be interest-related dividends and may be subject to relief from U.S. withholding for foreign shareholders, as provided by the American Jobs Creation Act of 2004 and as extended by the Tax Relief, Unemployment Insurance Reauthorization and Jobs Creation Act of 2010. For the fiscal year ended July 31, 2014, the Fund has reported maximum distributions as follows:
| | | | |
Qualified Interest Income. | | $ | 36,142,123 | |
53
Board of trustees / directors and officers addendum
Delaware Investments® Family of Funds
A mutual fund is governed by a Board of Trustees / Directors (“Trustees”), which has oversight responsibility for the management of a fund’s business affairs. Trustees establish procedures and oversee and review the performance of the investment manager, the distributor, and others who perform services for the fund. The independent fund trustees, in particular, are advocates
| | | | |
| Name, Address, | | Position(s) | | Length of |
| and Birth Date | | Held with Fund(s) | | Time Served |
Interested Trustees | | | | |
| Patrick P. Coyne1 | | Chairman, President, | | Chairman and Trustee |
| 2005 Market Street | | Chief Executive Officer, | | since August 16, 2006 |
| Philadelphia, PA 19103 | | and Trustee | | |
| April 1963 | | | | President and |
| | | | Chief Executive Officer |
| | | | since August 1, 2006 |
| | |
| | | | |
Independent Trustees | | | | |
| Thomas L. Bennett | | Trustee | | Since March 2005 |
| 2005 Market Street | | | | |
| Philadelphia, PA 19103 | | | | |
| October 1947 | | | | |
| Joseph W. Chow | | Trustee | | Since January 2013 |
| 2005 Market Street | | | | |
| Philadelphia, PA 19103 | | | | |
| January 1953 | | | | |
| | |
| | | | | |
| | | | |
| John A. Fry | | Trustee | | Since January 2001 |
| 2005 Market Street | | | | |
| Philadelphia, PA 19103 | | | | |
| May 1960 | | | | |
| 1 | Patrick P. Coyne is considered to be an “Interested Trustee“ because he is an executive officer of the Fund’s(s’) investment advisor. |
54
for shareholder interests. Each trustee has served in that capacity since he or she was elected to or appointed to the Board of Trustees, and will continue to serve until his or her retirement or the election of a new trustee in his or her place. The following is a list of the Trustees and Officers with certain background and related information.
| | | | |
| | Number of Portfolios in | | |
| Principal Occupation(s) | | Fund Complex Overseen | | Other Directorships |
| During Past 5 Years | | by Trustee or Officer | | Held by Trustee or Officer |
| | |
| | | | |
| Patrick P. Coyne has served in | | 70 | | Board of Governors Member |
| various executive capacities | | | | Investment Company |
| at different times at | | | | Institute (ICI) |
| Delaware Investments.2 | | | | |
| | | | Director and Audit |
| | | | Committee Member |
| | | | Kaydon Corp. |
| | | | (2007–2013) |
| | |
| | | | |
| Private Investor | | 70 | | Director |
| (March 2004–Present) | | | | Bryn Mawr Bank Corp. (BMTC) |
| | | | (2007–2011) |
| | |
| | | | | |
| Executive Vice President | | 70 | | Director and Audit Committee |
| (Emerging Economies | | | | Member — Hercules |
| Strategies, Risk and | | | | Technology Growth |
| Corporate Administration) | | | | Capital, Inc. |
| State Street Corporation | | | | |
(July 2004–March 2011) | | | | |
| President | | 70 | | Director — Hershey Trust |
| Drexel University | | | | |
| (August 2010–Present) | | | | Director and Audit |
| | | | Committee Member |
| President | | | | Community Health Systems |
| Franklin & Marshall College | | | | |
(July 2002–July 2010) | | | | |
| 2 | Delaware Investments is the marketing name for Delaware Management Holdings, Inc. and its subsidiaries, including the Fund’s(s’) investment advisor, principal underwriter, and its transfer agent. |
55
Board of trustees / directors and officers addendum
Delaware Investments® Family of Funds
| | | | |
| Name, Address, | | Position(s) | | Length of |
| and Birth Date | | Held with Fund(s) | | Time Served |
Independent Trustees (continued) | | | | |
Lucinda S. Landreth | | Trustee | | Since March 2005 |
| 2005 Market Street | | | | |
| Philadelphia, PA 19103 | | | | |
June 1947 | | | | |
| Frances A. Sevilla-Sacasa | | Trustee | | Since September 2011 |
| 2005 Market Street | | | | |
| Philadelphia, PA 19103 | | | | |
| January 1956 | | | | |
| | |
| | | | | |
| Thomas K. Whitford | | Trustee | | Since January 2013 |
| 2005 Market Street | | | | |
| Philadelphia, PA 19103 | | | | |
| March 1956 | | | | |
| | |
| | | | | |
56
| | | | |
| | Number of Portfolios in | | |
| Principal Occupation(s) | | Fund Complex Overseen | | Other Directorships |
| During Past 5 Years | | by Trustee or Officer | | Held by Trustee or Officer |
| | |
| | | | |
| Private Investor | | 70 | | None |
| (2004–Present) | | | | |
| | |
| | | | | |
| Chief Executive Officer — | | 70 | | Trust Manager and |
| Banco Itaú | | | | Audit Committee |
| International | | | | Member — Camden |
| (April 2012–Present) | | | | Property Trust |
| | |
| Executive Advisor to Dean | | | | |
(August 2011–March 2012) and Interim Dean | | | | |
| (January 2011–July 2011) — | | | | |
| University of Miami School of | | | | |
| Business Administration | | | | |
| | | | |
| President — U.S. Trust, | | | | |
| Bank of America Private | | | | |
| Wealth Management | | | | |
| (Private Banking) | | | | |
(July 2007–December 2008) | | | | |
Vice Chairman | | 70 | | Director — HSBC Finance |
| (2010–April 2013) | | | | Corporation and HSBC |
| Chief Administrative | | | | North America Holdings Inc. |
Officer (2008–2010) and Executive Vice | | | | |
| President and Chief | | | | |
| Administrative Officer | | | | |
| (2007–2009) — | | | | |
| PNC Financial | | | | |
Services Group | | | | |
57
Board of trustees / directors and officers addendum
Delaware Investments® Family of Funds
| | | | |
| Name, Address, | | Position(s) | | Length of |
| and Birth Date | | Held with Fund(s) | | Time Served |
Independent Trustees (continued) | | | | |
| Janet L. Yeomans | | Trustee | | Since April 1999 |
| 2005 Market Street | | | | |
| Philadelphia, PA 19103 | | | | |
| July 1948 | | | | |
| | |
| | | | | |
| J. Richard Zecher | | Trustee | | Since March 2005 |
| 2005 Market Street | | | | |
| Philadelphia, PA 19103 | | | | |
| July 1940 | | | | |
| | |
| | | | | |
58
| | | | |
| | Number of Portfolios in | | |
| Principal Occupation(s) | | Fund Complex Overseen | | Other Directorships |
| During Past 5 Years | | by Trustee or Officer | | Held by Trustee or Officer |
| | |
| | | | |
| Vice President and Treasurer | | 70 | | Director, Audit |
| (January 2006–July 2012) | | | | Committee Chair, Investment |
| Vice President — | | | | Committee Member, |
| Mergers & Acquisitions | | | | and Governance |
| (January 2003–January 2006), | | | | Committee Member |
| and Vice President | | | | Okabena Company |
| and Treasurer | | | | |
| (July 1995–January 2003) | | | | Chair — 3M |
| 3M Corporation | | | | Investment Management |
| | | | Company |
| | | | | (2005–2012) |
| Founder | | 70 | | Director and Compensation |
| Investor Analytics | | | | Committee Member |
| (Risk Management) | | | | Investor Analytics |
| (May 1999–Present) | | | | |
| | | | Director — P/E Investments |
| Founder | | | | |
| P/E Investments | | | | |
| (Hedge Fund) | | | | |
| (September 1996–Present) | | | | |
59
Board of trustees / directors and officers addendum
Delaware Investments® Family of Funds
| | | | |
| Name, Address, | | Position(s) | | Length of |
| and Birth Date | | Held with Fund(s) | | Time Served |
Officers | | | | |
| David F. Connor | | Senior Vice President, | | Senior Vice President, |
| 2005 Market Street | | Deputy General | | Deputy General Counsel |
| Philadelphia, PA 19103 | | Counsel, and Secretary | | since May 2013; |
| December 1963 | | | | Vice President, Deputy |
| | | | General Counsel |
| | | | September 2000 – |
| | | | May 2013; Secretary since |
| | | | | October 2005 |
| Daniel V. Geatens | | Vice President | | Treasurer since October 2007 |
| 2005 Market Street | | and Treasurer | | |
| Philadelphia, PA 19103 | | | | |
| October 1972 | | | | |
| David P. O’Connor | | Executive Vice President, | | Executive Vice President |
| 2005 Market Street | | General Counsel | | since February 2012; |
| Philadelphia, PA 19103 | | and Chief Legal Officer | | Senior Vice President |
| February 1966 | | | | October 2005 – |
| | | | February 2012; |
| | | | General Counsel and |
| | | | Chief Legal Officer |
| | | | | since October 2005 |
| Richard Salus | | Senior Vice President | | Chief Financial Officer |
| 2005 Market Street | | and Chief Financial Officer | | since November 2006 |
| Philadelphia, PA 19103 | | | | |
October 1963 | | | | |
The Statement of Additional Information for the Fund(s) includes additional information about the Trustees and Officers and is available, without charge, upon request by calling 800 523-1918.
60
| | | | |
| | Number of Portfolios in | | |
| Principal Occupation(s) | | Fund Complex Overseen | | Other Directorships |
| During Past 5 Years | | by Trustee or Officer | | Held by Trustee or Officer |
| | |
| | | | |
| David F. Connor has served as | | 70 | | None3 |
| Deputy General Counsel of | | | | |
Delaware Investments since 2000. | | | | |
| | |
| | | | | |
| Daniel V. Geatens has served | | 70 | | None3 |
in various capacities at different times at | | | | |
| Delaware Investments. | | | | |
| David P. O’Connor has served | | 70 | | None3 |
in various executive and legal capacities at different times at Delaware Investments. | | | | |
| | |
| | | | | |
| Richard Salus has served in | | 70 | | None3 |
various executive capacities at different times at | | | | |
| Delaware Investments. | | | | |
| 3 | David F. Connor, Daniel V. Geatens, David P. O’Connor, and Richard Salus serve in similar capacities for the six portfolios of the Optimum Fund Trust, which have the same investment advisor, principal underwriter, and transfer agent as the registrant. |
61
About the organization
| | | | | | |
| Board of trustees | | | | | | |
| | | |
| Patrick P. Coyne | | Joseph W. Chow | | Lucinda S. Landreth | | Thomas K. Whitford |
| Chairman, President, and | | Former Executive Vice | | Former Chief Investment | | Former Vice Chairman |
| Chief Executive Officer | | President | | Officer | | PNC Financial Services Group |
| Delaware Investments ® | | State Street Corporation | | Assurant, Inc. | | Pittsburgh, PA |
| Family of Funds | | Brookline, MA | | Philadelphia, PA | | |
| Philadelphia, PA | | | | | | Janet L. Yeomans |
| | John A. Fry | | Frances A. | | Former Vice President |
| Thomas L. Bennett | | President | | Sevilla-Secasa | | and Treasurer |
| Private Investor | | Drexel University | | Chief Executive Officer | | 3M Corporation |
| Rosemont, PA | | Philadelphia, PA | | Banco Itaú | | St. Paul, MN |
| | | | International Miami, FL | | J. Richard Zecher |
| | | | | Founder |
| | | | | Investor Analytics |
| | | | | | Scottsdale, AZ |
| Affiliated officers | | | | | | |
| | | |
| David F. Connor | | Daniel V. Geatens | | David P. O’Connor | | Richard Salus |
| Senior Vice President, | | Vice President and | | Executive Vice President, | | Senior Vice President and |
| Deputy General Counsel, | | Treasurer | | General Counsel, | | Chief Financial Officer |
| and Secretary | | Delaware Investments | | and Chief Legal Officer | | Delaware Investments |
| Delaware Investments | | Family of Funds | | Delaware Investments | | Family of Funds |
| Family of Funds | | Philadelphia, PA | | Family of Funds | | Philadelphia, PA |
| Philadelphia, PA | | | | Philadelphia, PA | | |
This annual report is for the information of Delaware High-Yield Opportunities Fund shareholders, but it may be used with prospective investors when preceded or accompanied by the Delaware Investments Fund fact sheet for the most recently completed calendar quarter. These documents are available at delawareinvestments.com.
Delaware Investments is the marketing name of Delaware Management Holdings, Inc. and its subsidiaries.
The Fund files its complete schedule of portfolio holdings with the Securities and Exchange Commission (SEC) for the first and third quarters of each fiscal year on Form N-Q. The Fund’s Forms N-Q, as well as a description of the policies and procedures that the Fund uses to determine how to vote proxies (if any) relating to portfolio securities are available without charge (i) upon request, by calling 800 523-1918; and (ii) on the SEC’s website at sec.gov. In addition, a description of the policies and procedures that the Fund uses to determine how to vote proxies (if any) relating to portfolio securities and the Fund’s Schedule of Investments are available without charge on the Fund’s website at delawareinvestments.com. The Fund’s Forms N-Q may be reviewed and copied at the SEC’s Public Reference Room in Washington, D.C.; information on the operation of the Public Reference Room may be obtained by calling 800 SEC-0330.
Information (if any) regarding how the Fund voted proxies relating to portfolio securities during the most recently disclosed 12-month period ended June 30 is available without charge (i) through the Fund’s website at delawareinvestments.com; and (ii) on the SEC’s website at sec.gov.
62

Annual report
Fixed income mutual fund
Delaware Core Bond Fund
July 31, 2014
Carefully consider the Fund’s investment objectives, risk factors, charges, and expenses before investing. This and other information can be found in the Fund’s prospectus and its summary prospectus, which may be obtained by visiting delawareinvestments.com or calling 800 523-1918. Investors should read the prospectus and the summary prospectus carefully before investing.
You can obtain shareholder reports and prospectuses online instead of in the mail. Visit delawareinvestments.com/edelivery.
Experience Delaware Investments
Delaware Investments is committed to the pursuit of consistently superior asset management and unparalleled client service. We believe in our investment processes, which seek to deliver consistent results, and in convenient services that help add value for our clients.
If you are interested in learning more about creating an investment plan, contact your financial advisor.
You can learn more about Delaware Investments or obtain a prospectus for Delaware Core Bond Fund at delawareinvestments.com.
Manage your investments online
| • | | 24-hour access to your account information |
| • | | Check your account balance and recent transactions |
| • | | Request statements or literature |
| • | | Make purchases and redemptions |
Delaware Management Holdings, Inc. and its subsidiaries (collectively known by the marketing name of Delaware Investments) are wholly owned subsidiaries of Macquarie Group Limited, a global provider of banking, financial, advisory, investment and funds management services.
Investments in Delaware Core Bond Fund are not and will not be deposits with or liabilities of Macquarie Bank Limited ABN 46 008 583 542 and its holding companies, including their subsidiaries or related companies (Macquarie Group), and are subject to investment risk, including possible delays in repayment and loss of income and capital invested. No Macquarie Group company guarantees or will guarantee the performance of the Fund, the repayment of capital from the Fund, or any particular rate of return.
Unless otherwise noted, views expressed herein are current as of July 31, 2014, and subject to change.
Funds are not FDIC insured and are not guaranteed. It is possible to lose the principal amount invested.
Mutual fund advisory services provided by Delaware Management Company, a series of Delaware Management Business Trust, which is a registered investment advisor. Delaware Investments, a member of Macquarie Group, refers to Delaware Management Holdings, Inc. and its subsidiaries, including the Fund’s distributor, Delaware Distributors, L.P. Macquarie Group refers to Macquarie Group Limited and its subsidiaries and affiliates worldwide.
© 2014 Delaware Management Holdings, Inc.
All third-party marks cited are the property of their respective owners.
| | |
Portfolio management review | | |
| Delaware Core Bond Fund | | August 12, 2014 |
| | | | | | |
| Performance preview (for the year ended July 31, 2014) | | | | | |
Delaware Core Bond Fund (Class A shares) | | 1-year return | | | +3.50% | |
Barclays U.S. Aggregate Index (benchmark) | | 1-year return | | | +3.97% | |
Past performance does not guarantee future results.
For complete, annualized performance for Delaware Core Bond Fund, please see the table on page 4. The performance of Class A shares excludes the applicable sales charge and reflects the reinvestment of all distributions. Index performance returns do not reflect any management fees, transaction costs, or expenses. Indices are unmanaged and one cannot invest directly in an index.
| | |
Several economic factors had an effect on bond markets during the Fund’s fiscal year ended July 31, 2014. Economic growth was a mixed bag as 2013 gains were essentially erased by a series of persistent weather storms that swept across North America during the first three months of 2014. However, according to estimates released in late July, gross domestic product growth recovered somewhat toward the end of spring and into early summer (source: U.S. Commerce Department). In late 2013, the U.S. Federal Reserve announced it would begin reducing its $85 billion per month quantitative easing (QE3) strategy, along with a series of steps to complete the cycle by late 2014. In 2014, under the direction of newly appointed Fed Chair Janet Yellen, the Fed reduced its purchase of U.S. Treasurys and mortgage-backed securities (MBS) by $10 billion on several occasions. Short-term rates responded to the shift in Fed policy with volatility. The 2-year to 10-year portion of the Treasury curve flattened by 35 basis points in the first quarter of 2014 and then by another 23 basis points in the second. (One basis point equals one one-hundredth of a percentage point.) Toward the end of the Fund’s fiscal year, yields decreased on longer maturities, particularly with regard to 10- to 30-year Treasurys. (Source: Bloomberg.) | | 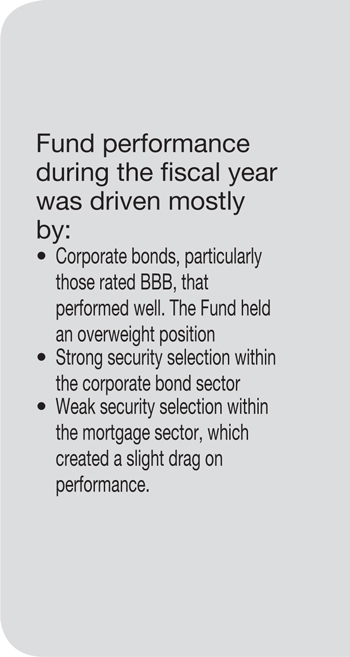 |
1
Portfolio management review
Delaware Core Bond Fund
While the U.S. economy has chugged along near a sluggish 2% growth level for the past several years, euro-zone growth has been almost nonexistent. Despite recent rebounds within several European Union (EU) financial markets, there continue to be concerns about potential deflationary pressures within the single-currency bloc.
Geopolitical tensions in Ukraine, Iraq, and Gaza added to an already fragile economic environment as the market carefully watched broad investor confidence levels for a potential effect on economic growth. Increasing conflicts in the Middle East added to concerns about increasing global oil prices. Meanwhile, the EU sought to reduce energy dependence on imports (particularly from Russia) which threatened to halt gas supplies to Ukraine. Further, global economic uncertainty was enhanced by an unpredictable Chinese growth cycle that was on-again, off-again throughout the fiscal year.
Fund performance
For the fiscal year ended July 31, 2014, Delaware Core Bond Fund (Class A shares) returned +3.50% at net asset value and -1.14% at maximum offer price (both returns reflect all distributions reinvested). For the same period, the Fund’s benchmark, the Barclays U.S. Aggregate Index, returned +3.97%. For complete, annualized performance for Delaware Core Bond Fund, please see the table on page 4.
Throughout the fiscal year, mortgage-backed securities (MBS) became increasingly unpredictable, particularly with regard to lower-coupon holdings. The Fund held an average coupon that was lower than that of the benchmark, which increased the Fund’s sensitivity to interest rate volatility. We transitioned midyear by rotating into what we viewed as a better blend of mid-coupon mortgages that have lower sensitivity characteristics. Even so, when looked
at over the duration of the entire period, MBS detracted from the Fund’s overall performance.
Regarding positive effects, we were able to capitalize on healthy performance within the investment grade corporate bond arena. Not only did the Fund hold an overweight position relative to the benchmark, it also gained additional benefit from strong security selection, particularly among issues rated BBB (the lowest-rated credit quality available within the investment grade universe).
Furthermore, U.S. Treasury securities experienced mediocre gains overall during the fiscal year. Within the portfolio, the Fund benefited somewhat from its coupon maturity selection within the sector. Even so, we saw more positive effects from the Fund’s relative underweight position, which allowed us to capitalize on healthier gains found within the corporate bond sector. During the fiscal year, the Fund’s allocation to Treasury securities remained fairly consistent, starting the year at 22.0% and ending at 22.7%.
Excess return within the investment grade sector was driven primarily by the Fund’s holdings in the industrials and financials sectors. The Fund’s investment strategy is to build a highly diversified portfolio, particularly with regard to nongovernment securities. We research individual corporate securities and seek those that have what we perceive to be an improving credit story or have positive inherent value.
That said, BBB-rated securities represented the strongest source of gains within the Fund’s portfolio and within the benchmark. The Fund’s substantial sector overweight helped boost relative returns. Throughout the fiscal year, we substantially increased the Fund’s exposure to investment grade corporate bonds from a beginning weight of 30% to a composition of 39% at the end of the fiscal year. While we recognize that yields aren’t quite as attractive as they were several years ago, we continue to be comfortable
2
with the credit characteristics of the issues that we currently own. At the time of this writing, we view these holdings as the most attractive value opportunity within the framework of a high-quality bond portfolio. However, we feel it’s worth mentioning that the Fund’s relative position was based on bottom-up (bond by bond) fundamental research. It was not a macro level decision.
On an individual level, each of our corporate holdings represents a small percentage of overall portfolio composition. Even so, it’s worth mentioning a few names that contributed to performance. Our continued emphasis on high-quality banks like BB&T and on regional banks like Fifth Third Bank helped boost absolute gains during the fiscal year. Within the industrials segment, we saw additional excess return from our significant participation in the Verizon Communications record-setting $49 billion new bond issue that took place in September 2013.
The most prominent performance detractor for the year came from the mortgage sector. MBS are inherently unpredictable as payments are dependent upon the punctuality and prepayment strategies of borrowers. Going forward, we believe the extra yield that can be associated with these issues will not compensate for increased uncertainty. During the period, we significantly reduced the Fund’s exposure to these securities from 36% to 27%.
During the period, the Fund’s allocation to asset-backed securities remained fairly consistent, starting the year at 8.3% and ending at 8.3%. Likewise, commercial mortgage-backed securities remained a small percentage of the overall portfolio. These holdings made up 1.9% of composition at the beginning of the period and ended at 1.9%.
The performance of the Fund’s commercial mortgage-backed securities was in line with benchmark returns. The asset-backed securities position was primarily invested in floating rate securities and these performed well relative to
other short duration instruments in the benchmark.
A word on derivatives
During the period, the Fund invested in derivatives, particularly financial futures. Treasury futures were used to hedge the overall interest rate risk of the portfolio. However, the aggregate positions did not have a material effect on absolute or relative performance.
3
| | |
| Performance summary | | |
Delaware Core Bond Fund | | July 31, 2014 |
The performance data quoted represent past performance; past performance does not guarantee future results. Investment return and principal value will fluctuate so your shares, when redeemed, may be worth more or less than their original cost. Please obtain the performance data current for the most recent month end by calling 800 523-1918 or visiting our website at delawareinvestments.com/performance. Current performance may be lower or higher than the performance data quoted.
| | | | | | | | |
| Fund and benchmark performance1, 2 | | Average annual total returns through July 31, 2014 |
| | | | |
| | | 1 year | | 5 years | | 10 years | | Lifetime |
|
Class A (Est. March 12, 1996) | | | | | | | | |
Excluding sales charge | | +3.50% | | +4.42% | | +4.59% | | n/a |
Including sales charge | | -1.14% | | +3.47% | | +4.11% | | n/a |
|
Class C (Est. Sept. 30, 2009) | | | | | | | | |
Excluding sales charge | | +2.72% | | n/a | | n/a | | +3.22% |
Including sales charge | | +1.72% | | n/a | | n/a | | +3.22% |
|
Class R (Est. Sept. 30, 2009) | | | | | | | | |
Excluding sales charge | | +3.26% | | n/a | | n/a | | +3.71% |
Including sales charge | | +3.26% | | n/a | | n/a | | +3.71% |
|
Institutional Class (Est. Sept. 30, 2009) | | | | | | | | |
Excluding sales charge | | +3.74% | | n/a | | n/a | | +4.38% |
Including sales charge | | +3.74% | | n/a | | n/a | | +4.38% |
|
Barclays U.S. Aggregate Index | | +3.97% | | +4.47% | | +4.80% | | n/a |
|
1 Returns reflect the reinvestment of all distributions and are presented both with and without the applicable sales charges described below. Returns do not reflect the deduction of taxes the shareholder would pay on Fund distributions or redemptions of Fund shares.
Delaware Core Bond Fund is the successor to The Intermediate Fixed Income Portfolio of the Delaware Pooled® Trust pursuant to the reorganization (Reorganization) of The Intermediate Fixed Income Portfolio into the Fund. Prior to the Reorganization, the Fund had no investment operations. Accordingly, for periods before Sept. 30, 2009, the performance information shown above that includes data from that period and on pages 4 and 7 is historical information for The Intermediate Fixed Income
Portfolio. The Intermediate Fixed Income Portfolio had the same investment objective and a similar investment strategy as the Fund, and was managed by the same portfolio managers. Because the Fund’s fees and expenses are higher than those of The Intermediate Fixed Income Portfolio, the Fund’s performance would have been lower than that shown for relevant periods in this report.
Expense limitations were in effect for certain classes during some or all of the periods shown in the “Fund and benchmark performance” table. Expenses for each class are listed on the “Fund expense ratios” table on page 6. Performance would have been lower had expense limitations not been in effect.
4
Class A shares are sold with a maximum front-end sales charge of 4.50%, and have an annual distribution and service fee of 0.25% of average daily net assets. Prior to Oct. 1, 2013, the Fund paid an annual distribution and service fee of 0.30% of average daily net assets. This fee was contractually limited to 0.25% of average daily net assets from Nov. 28, 2012 through Sept. 30, 2013. Performance for Class A shares, excluding sale charges, assumes that no front-end sales charge applied.
Class C shares are sold with a contingent deferred sales charge of 1.00% if redeemed during the first 12 months. They are also subject to an annual distribution and service fee of 1.00% of average daily net assets.
Performance for Class C shares, excluding sales charges, assumes either that contingent deferred sales charges did not apply or that the investment was not redeemed.
Class R shares are available only for certain retirement plan products. They are sold without a sales charge and have an annual distribution and service fee of 0.50% of average daily net assets. Prior to Oct. 1, 2013, the Fund paid an annual distribution and service fee of 0.60% of average daily net assets. This fee was contractually limited to 0.50% of average daily net assets from Nov. 28, 2012 through Sept. 30, 2013.
Institutional Class shares are available without sales or asset-based distribution charges only to certain eligible institutional accounts.
The “Fund and benchmark performance” table and the “Performance of a $10,000 investment” graph on page 7 do not reflect the deduction of taxes the shareholder would pay on Fund distributions or redemptions of Fund shares.
Fixed income securities and bond funds can lose value, and investors can lose principal, as interest rates rise. They also may be affected by economic conditions that hinder an issuer’s ability to make interest and principal payments on its debt.
The Fund may also be subject to prepayment risk, the risk that the principal of a fixed income security that is held by the Fund may be prepaid prior to maturity, potentially forcing the Fund to reinvest that money at a lower interest rate.
The Fund may invest in derivatives, which may involve additional expenses and are subject to risk, including the risk that an underlying security or securities index moves in the opposite direction from what the portfolio manager anticipated. A derivative transaction depends upon the counterparties’ ability to fulfill their contractual obligations.
International investments entail risks not ordinarily associated with U.S. investments including fluctuation in currency values, differences in accounting principles, or economic or political instability in other nations.
The Fund may experience portfolio turnover in excess of 100%, which could result in higher transaction costs and tax liability.
Per Standard & Poor’s credit rating agency, bonds rated AA and A are more susceptible to the adverse effects of changes in circumstances and economic conditions than those in the higher-rated AAA category, but the obligor’s capacity to meet its financial commitment on the obligation is still strong. Bonds rated BBB exhibit adequate protection parameters, although adverse economic conditions or changing circumstances are more likely to lead to a weakened capacity of the obligor to meet its financial commitments. Bonds rated BB, B, and CCC are regarded as having significant speculative characteristics, with BB indicating the least degree of speculation of the three.
5
Performance summary
Delaware Core Bond Fund
2 The Fund’s expense ratios, as described in the most recent prospectus, are disclosed in the following “Fund expense ratios” table. Delaware Management Company has agreed to reimburse certain expenses and/or waive certain fees in order to prevent total fund operating expenses (excluding any 12b-1 plan, taxes, interest, inverse floater program expenses, short sale and dividend interest expenses, brokerage fees, certain insurance costs, acquired fund fees and expenses, and nonroutine expenses or costs, including, but not limited to, those relating to reorganizations, litigation, conducting shareholder meetings, and liquidations (collectively, nonroutine expenses)) from exceeding 0.65% of the Fund’s average daily net assets during the period from Aug. 1, 2013, through July 31, 2014.* Please see the most recent prospectus and any applicable supplement(s) for additional information on these fee waivers and/or reimbursements.
| | | | | | | | |
| Fund expense ratios | | Class A | | Class C | | Class R | | Institutional
Class |
Total annual operating expenses (without fee waivers) | | 1.39% | | 2.14% | | 1.64% | | 1.14% |
Net expenses (including fee waivers, if any) | | 0.90% | | 1.65% | | 1.15% | | 0.65% |
Type of waiver | | Contractual | | Contractual | | Contractual | | Contractual |
* The contractual waiver period is from Nov. 28, 2012 through Nov. 28, 2014.
6
Performance of a $10,000 investment1
Average annual total returns from July 31, 2004, through July 31, 2014
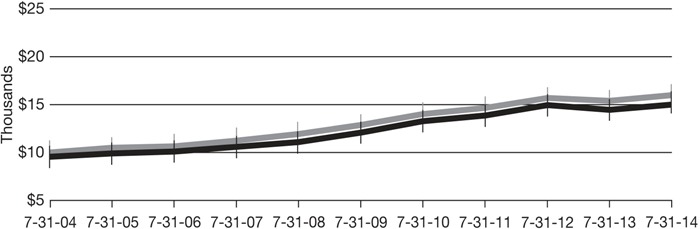
| | | | | | | | | | |
For period beginning July 31, 2004, through July 31, 2014 | | | Starting value | | | | Ending value | |
 | | Barclays U.S. Aggregate Index | | | $10,000 | | | | $15,987 | |
| | Delaware Core Bond Fund — Class A shares | | | $9,550 | | | | $14,962 | |
1 The “Performance of a $10,000 investment” graph assumes $10,000 invested in Class A shares of the Fund on July 31, 2004, and includes the effect of a 4.50% front-end sales charge and the reinvestment of all distributions. The graph does not reflect the deduction of taxes the shareholders would pay on Fund distributions or redemptions of Fund shares. Expense limitations were in effect for some or all of the periods shown. Performance would have been lower had expense limitations not been in effect. Expenses are listed in the “Fund expense ratios” table on page 6. Please note additional details on pages 4 through 7.
The table also assumes $10,000 invested in the
Barclays U.S. Aggregate Index as of
July 31, 2004. The Barclays U.S. Aggregate Index measures the performance of publicly issued investment grade (Baa3/BBB- or better) corporate, U.S. government, mortgage- and asset-backed securities with at least one year to maturity and at least $250 million par amount outstanding.
Index performance returns do not reflect any management fees, transaction costs, or expenses. Indices are unmanaged and one cannot invest directly in an index. Past performance is not a guarantee of future results.
Performance of other Fund classes will vary due to different charges and expenses.
| | | | | | |
| | | Nasdaq symbols | | CUSIPs | | |
Class A | | DPFIX | | 245908710 | |
Class C | | DCBCX | | 245908694 | |
Class R | | DEBRX | | 245908686 | |
Institutional Class | | DCBIX | | 245908678 | |
7
Disclosure of Fund expenses
For the six-month period from February 1, 2014 to July 31, 2014 (Unaudited)
As a shareholder of the Fund, you incur two types of costs: (1) transaction costs, including sales charges (loads) on purchase payments, reinvested dividends, or other distributions; redemption fees; and exchange fees; and (2) ongoing costs, including management fees; distribution and/or service (12b-1) fees; and other Fund expenses. This example is intended to help you understand your ongoing costs (in dollars) of investing in the Fund and to compare these costs with the ongoing costs of investing in other mutual funds.
The example is based on an investment of $1,000 invested at the beginning of the period and held for the entire six-month period from Feb. 1, 2014 to July 31, 2014.
Actual expenses
The first section of the table shown, “Actual Fund return,” provides information about actual account values and actual expenses. You may use the information in this section of the table, together with the amount you invested, to estimate the expenses that you paid over the period. Simply divide your account value by $1,000 (for example, an $8,600 account value divided by $1,000 = 8.6), then multiply the result by the number in the first section under the heading entitled “Expenses Paid During Period” to estimate the expenses you paid on your account during this period.
Hypothetical example for comparison purposes
The second section of the table shown, “Hypothetical 5% return,” provides information about hypothetical account values and hypothetical expenses based on the Fund’s actual expense ratio and an assumed rate of return of 5% per year before expenses, which is not the Fund’s actual return. The hypothetical account values and expenses may not be used to estimate the actual ending account balance or expenses you paid for the period. You may use this information to compare the ongoing costs of investing in the Fund and other funds. To do so, compare this 5% hypothetical example with the 5% hypothetical examples that appear in the shareholder reports of the other funds.
Please note that the expenses shown in the table are meant to highlight your ongoing costs only and do not reflect any transactional costs, such as sales charges (loads), redemption fees, or exchange fees. Therefore, the second section of the table is useful in comparing ongoing costs only, and will not help you determine the relative total costs of owning different funds. In addition, if these transactional costs were included, your costs would have been higher. The Fund’s expenses shown in the table reflect fee waivers in effect. The expenses shown in the table assume reinvestment of all dividends and distributions.
8
Delaware Core Bond Fund
Expense analysis of an investment of $1,000
| | | | | | | | |
| | | Beginning Account Value 2/1/14 | | Ending Account Value 7/31/14 | | Annualized Expense Ratio | | Expenses Paid During Period 2/1/14 to 7/31/14* |
|
Actual Fund return† | | | | | | | | |
Class A | | $1,000.00 | | $1,020.80 | | 0.90% | | $4.51 |
Class C | | 1,000.00 | | 1,016.90 | | 1.65% | | 8.25 |
Class R | | 1,000.00 | | 1,018.70 | | 1.15% | | 5.76 |
Institutional Class | | 1,000.00 | | 1,022.00 | | 0.65% | | 3.26 |
|
Hypothetical 5% return (5% return before expenses) | | | | |
Class A | | $1,000.00 | | $1,020.33 | | 0.90% | | $4.51 |
Class C | | 1,000.00 | | 1,016.61 | | 1.65% | | 8.25 |
Class R | | 1,000.00 | | 1,019.09 | | 1.15% | | 5.76 |
Institutional Class | | 1,000.00 | | 1,021.57 | | 0.65% | | 3.26 |
|
| * | “Expenses Paid During Period” are equal to the Fund’s annualized expense ratio, multiplied by the average account value over the period, multiplied by 181/365 (to reflect the one-half year period). |
| † | Because actual returns reflect only the most recent six-month period, the returns shown may differ significantly from fiscal year returns. |
9
| | |
| Security type / sector allocation | | |
Delaware Core Bond Fund | | As of July 31, 2014 (Unaudited) |
Sector designations may be different than the sector designations presented in other Fund materials. The sector designations may represent the investment manager’s internal sector classifications, which may result in the sector designations for one fund being different than another fund’s sector designations.
| | |
| Security type / sector | | Percentage of net assets |
Agency Asset-Backed Securities | | 0.11% |
|
Agency Collateralized Mortgage Obligations | | 4.36% |
|
Agency Mortgage-Backed Securities | | 23.38% |
|
Commercial Mortgage-Backed Securities | | 1.88% |
|
Corporate Bonds | | 38.87% |
Banking | | 5.76% |
Basic Industry | | 3.03% |
Brokerage | | 0.70% |
Capital Goods | | 0.68% |
Communications | | 4.58% |
Consumer Cyclical | | 2.50% |
Consumer Non-Cyclical | | 3.27% |
Electric | | 4.29% |
Energy | | 4.58% |
Financials | | 2.49% |
Insurance | | 2.67% |
Real Estate | | 1.11% |
Technology | | 2.47% |
Transportation | | 0.74% |
|
Non-Agency Asset-Backed Securities | | 8.17% |
|
U.S. Treasury Obligations | | 22.74% |
|
Preferred Stock | | 0.18% |
|
Short-Term Investments | | 13.22% |
|
Total Value of Securities | | 112.91% |
|
Liabilities Net of Receivables and Other Assets | | (12.91%) |
|
Total Net Assets | | 100.00% |
|
10
| | |
| Schedule of investments | | |
| Delaware Core Bond Fund | | July 31, 2014 |
| | | | | | | | |
| | | Principal amount° | | | Value (U.S. $) | |
| |
Agency Asset-Backed Securities – 0.11% | | | | | | | | |
| |
Fannie Mae Grantor Trust | | | | | | | | |
Series 2003-T4 2A5 5.407% 9/26/33 | | | 11,004 | | | $ | 11,991 | |
Fannie Mae Whole Loan | | | | | | | | |
Series 2001-W2 AS5 6.473% 10/25/31 | | | 3,439 | | | | 3,597 | |
Fannie Mae Whole Loan REMIC Trust | | | | | | | | |
Series 2002-W11 AV1 0.495% 11/25/32 — | | | 688 | | | | 629 | |
| | | | | | | | |
Total Agency Asset-Backed Securities (cost $15,033) | | | | | | | 16,217 | |
| | | | | | | | |
|
| |
| | |
Agency Collateralized Mortgage Obligations – 4.36% | | | | | | | | |
| |
Fannie Mae REMICs | | | | | | | | |
Series 2004-49 EB 5.00% 7/25/24 | | | 22,690 | | | | 24,849 | |
Series 2006-105 ME 5.50% 11/25/36 | | | 235,000 | | | | 265,078 | |
Series 2010-35 AB 5.00% 11/25/49 | | | 29,046 | | | | 31,050 | |
Series 2010-116 Z 4.00% 10/25/40 | | | 40,790 | | | | 42,805 | |
Series 2011-134 PA 4.00% 9/25/40 | | | 23,052 | | | | 24,237 | |
Series 2012-19 HB 4.00% 1/25/42 | | | 47,203 | | | | 48,748 | |
Fannie Mae Whole Loan | | | | | | | | |
Series 2003-W15 2A7 5.55% 8/25/43 | | | 12,337 | | | | 13,092 | |
Freddie Mac REMICs | | | | | | | | |
Series 2326 ZQ 6.50% 6/15/31 | | | 19,545 | | | | 22,092 | |
Series 3027 DE 5.00% 9/15/25 | | | 24,656 | | | | 26,843 | |
Series 3656 PM 5.00% 4/15/40 | | | 10,000 | | | | 11,019 | |
Series 3800 AF 0.652% 2/15/41 — | | | 59,113 | | | | 59,385 | |
GNMA | | | | | | | | |
Series 2010-113 KE 4.50% 9/20/40 | | | 50,000 | | | | 53,702 | |
NCUA Guaranteed Notes Trust | | | | | | | | |
Series 2010-C1 A2 2.90% 10/29/20 | | | 20,000 | | | | 20,674 | |
Vendee Mortgage Trust | | | | | | | | |
Series 2000-1 1A 6.472% 1/15/30 — | | | 14,933 | | | | 16,901 | |
| | | | | | | | |
Total Agency Collateralized Mortgage Obligations (cost $655,218) | | | | | | | 660,475 | |
| | | | | | | | |
|
| |
| |
| | |
Agency Mortgage-Backed Securities – 23.38% | | | | | | | | |
| |
Fannie Mae | | | | | | | | |
5.50% 1/1/36 | | | 8,977 | | | | 10,018 | |
5.50% 8/1/37 | | | 8,098 | | | | 9,067 | |
Fannie Mae ARM | | | | | | | | |
2.149% 8/1/34 — | | | 15,112 | | | | 15,946 | |
2.271% 12/1/33 — | | | 11,430 | | | | 12,059 | |
2.415% 5/1/43 — | | | 10,983 | | | | 10,909 | |
2.546% 6/1/43 — | | | 3,992 | | | | 3,991 | |
3.279% 3/1/44 — | | | 14,924 | | | | 15,418 | |
3.296% 9/1/43 — | | | 13,291 | | | | 13,656 | |
11
Schedule of investments
Delaware Core Bond Fund
| | | | | | | | |
| | | Principal amount° | | | Value (U.S. $) | |
| |
Agency Mortgage-Backed Securities (continued) | | | | | | | | |
| |
Fannie Mae Relocation 30 yr | | | | | | | | |
5.00% 1/1/34 | | | 579 | | | $ | 632 | |
Fannie Mae S.F. 15 yr | | | | | | | | |
2.50% 7/1/27 | | | 2,081 | | | | 2,096 | |
2.50% 2/1/28 | | | 51,299 | | | | 51,698 | |
2.50% 5/1/28 | | | 4,392 | | | | 4,435 | |
3.00% 11/1/27 | | | 1,725 | | | | 1,782 | |
3.50% 7/1/26 | | | 14,836 | | | | 15,662 | |
4.00% 6/1/25 | | | 22,189 | | | | 23,734 | |
4.00% 11/1/25 | | | 91,390 | | | | 97,808 | |
4.00% 12/1/26 | | | 10,041 | | | | 10,709 | |
4.00% 5/1/27 | | | 20,960 | | | | 22,427 | |
4.50% 4/1/18 | | | 1,185 | | | | 1,252 | |
4.50% 10/1/24 | | | 1,788 | | | | 1,908 | |
4.50% 2/1/25 | | | 1,273 | | | | 1,358 | |
4.50% 7/1/25 | | | 774 | | | | 825 | |
5.00% 12/1/20 | | | 1,286 | | | | 1,381 | |
5.00% 6/1/23 | | | 2,221 | | | | 2,409 | |
6.00% 12/1/20 | | | 1,381 | | | | 1,459 | |
Fannie Mae S.F. 15 yr TBA | | | | | | | | |
2.50% 8/1/29 | | | 176,000 | | | | 177,067 | |
3.00% 8/1/29 | | | 175,000 | | | | 180,414 | |
3.50% 8/1/29 | | | 79,000 | | | | 83,257 | |
Fannie Mae S.F. 20 yr | | | | | | | | |
3.00% 8/1/33 | | | 5,661 | | | | 5,732 | |
3.00% 8/1/34 | | | 4,000 | | | | 4,040 | |
3.50% 9/1/33 | | | 7,595 | | | | 7,875 | |
4.00% 1/1/31 | | | 1,785 | | | | 1,904 | |
4.00% 2/1/31 | | | 7,585 | | | | 8,087 | |
5.00% 11/1/23 | | | 1,034 | | | | 1,140 | |
5.50% 8/1/28 | | | 13,984 | | | | 15,549 | |
5.50% 12/1/29 | | | 1,790 | | | | 1,990 | |
6.00% 12/1/21 | | | 733 | | | | 823 | |
6.00% 9/1/29 | | | 6,562 | | | | 7,424 | |
Fannie Mae S.F. 30 yr | | | | | | | | |
3.00% 7/1/42 | | | 23,611 | | | | 23,220 | |
3.00% 10/1/42 | | | 143,052 | | | | 140,683 | |
3.00% 12/1/42 | | | 24,484 | | | | 24,075 | |
3.00% 1/1/43 | | | 58,534 | | | | 57,526 | |
3.00% 2/1/43 | | | 4,626 | | | | 4,547 | |
3.00% 4/1/43 | | | 31,435 | | | | 30,881 | |
3.00% 5/1/43 | | | 26,120 | | | | 25,652 | |
3.50% 1/1/43 | | | 28,962 | | | | 29,538 | |
12
| | | | | | | | |
| | | Principal amount° | | | Value (U.S. $) | |
| |
| | |
Agency Mortgage-Backed Securities (continued) | | | | | | | | |
| |
Fannie Mae S.F. 30 yr | | | | | | | | |
4.00% 7/1/41 | | | 37,035 | | | $ | 39,062 | |
4.00% 8/1/43 | | | 4,705 | | | | 4,962 | |
4.50% 7/1/36 | | | 4,608 | | | | 4,962 | |
4.50% 11/1/40 | | | 13,869 | | | | 14,968 | |
4.50% 3/1/41 | | | 30,862 | | | | 33,313 | |
4.50% 4/1/41 | | | 20,093 | | | | 21,695 | |
4.50% 10/1/41 | | | 19,704 | | | | 21,273 | |
4.50% 11/1/41 | | | 16,580 | | | | 17,902 | |
4.50% 12/1/43 | | | 2,817 | | | | 3,039 | |
4.50% 5/1/44 | | | 10,969 | | | | 11,836 | |
5.00% 2/1/35 | | | 66,404 | | | | 73,391 | |
5.00% 7/1/35 | | | 4,501 | | | | 4,972 | |
5.00% 10/1/35 | | | 10,159 | | | | 11,223 | |
5.00% 11/1/35 | | | 3,184 | | | | 3,520 | |
5.00% 8/1/37 | | | 7,186 | | | | 7,943 | |
5.00% 2/1/38 | | | 2,909 | | | | 3,213 | |
5.50% 12/1/32 | | | 596 | | | | 667 | |
5.50% 2/1/33 | | | 8,266 | | | | 9,254 | |
5.50% 11/1/34 | | | 3,050 | | | | 3,417 | |
5.50% 2/1/35 | | | 7,957 | | | | 8,967 | |
5.50% 3/1/35 | | | 1,808 | | | | 2,018 | |
5.50% 7/1/36 | | | 848 | | | | 949 | |
5.50% 2/1/37 | | | 8,673 | | | | 9,618 | |
5.50% 2/1/38 | | | 3,335 | | | | 3,730 | |
5.50% 9/1/38 | | | 9,905 | | | | 11,049 | |
5.50% 10/1/39 | | | 28,847 | | | | 31,940 | |
6.00% 6/1/36 | | | 865 | | | | 975 | |
6.00% 8/1/37 | | | 8,384 | | | | 9,443 | |
6.00% 9/1/37 | | | 1,412 | | | | 1,591 | |
6.00% 11/1/37 | | | 1,259 | | | | 1,418 | |
6.00% 5/1/38 | | | 13,142 | | | | 14,771 | |
6.00% 7/1/38 | | | 399 | | | | 448 | |
6.00% 10/1/38 | | | 12,250 | | | | 13,740 | |
6.00% 12/1/38 | | | 8,862 | | | | 9,999 | |
6.00% 1/1/39 | | | 5,813 | | | | 6,536 | |
6.00% 9/1/39 | | | 48,820 | | | | 54,837 | |
6.00% 3/1/40 | | | 1,152 | | | | 1,293 | |
7.50% 12/1/32 | | | 4,230 | | | | 4,617 | |
9.50% 4/1/18 | | | 283 | | | | 309 | |
Fannie Mae S.F. 30 yr TBA | | | | | | | | |
3.00% 10/1/44 | | | 413,000 | | | | 402,452 | |
3.50% 8/1/44 | | | 114,000 | | | | 116,150 | |
13
Schedule of investments
Delaware Core Bond Fund
| | | | | | | | |
| | | Principal amount° | | | Value (U.S. $) | |
| |
| | |
Agency Mortgage-Backed Securities (continued) | | | | | | | | |
| |
Fannie Mae S.F. 30 yr TBA | | | | | | | | |
3.50% 9/1/44 | | | 62,000 | | | $ | 62,990 | |
4.00% 8/1/44 | | | 150,000 | | | | 157,707 | |
4.00% 9/1/44 | | | 327,000 | | | | 342,830 | |
4.50% 8/1/44 | | | 95,000 | | | | 102,283 | |
4.50% 9/1/44 | | | 226,000 | | | | 242,770 | |
5.00% 10/1/44 | | | 22,000 | | | | 24,152 | |
5.50% 9/1/44 | | | 45,000 | | | | 49,835 | |
Freddie Mac ARM | | | | | | | | |
2.252% 7/1/36 — | | | 3,329 | | | | 3,555 | |
2.35% 4/1/33 — | | | 3,191 | | | | 3,228 | |
2.433% 4/1/34 — | | | 2,215 | | | | 2,368 | |
2.527% 1/1/44 — | | | 31,638 | | | | 32,252 | |
4.883% 8/1/38 — | | | 66,815 | | | | 70,547 | |
Freddie Mac Relocation 15 yr | | | | | | | | |
3.50% 10/1/18 | | | 760 | | | | 773 | |
Freddie Mac S.F. 15 yr | | | | | | | | |
4.00% 8/1/25 | | | 6,897 | | | | 7,360 | |
4.50% 8/1/24 | | | 9,700 | | | | 10,405 | |
4.50% 7/1/25 | | | 1,989 | | | | 2,130 | |
4.50% 6/1/26 | | | 4,429 | | | | 4,730 | |
5.00% 4/1/20 | | | 3,795 | | | | 4,049 | |
5.50% 6/1/20 | | | 1,211 | | | | 1,295 | |
Freddie Mac S.F. 20 yr | | | | | | | | |
3.50% 1/1/34 | | | 14,422 | | | | 14,903 | |
Freddie Mac S.F. 30 yr | | | | | | | | |
3.00% 10/1/42 | | | 10,297 | | | | 10,126 | |
3.00% 11/1/42 | | | 14,226 | | | | 14,015 | |
4.50% 10/1/39 | | | 7,261 | | | | 7,812 | |
4.50% 3/1/42 | | | 62,788 | | | | 67,568 | |
5.50% 12/1/34 | | | 1,131 | | | | 1,268 | |
5.50% 6/1/36 | | | 834 | | | | 927 | |
5.50% 11/1/36 | | | 2,068 | | | | 2,294 | |
5.50% 6/1/38 | | | 1,272 | | | | 1,406 | |
5.50% 3/1/40 | | | 4,088 | | | | 4,514 | |
5.50% 8/1/40 | | | 45,033 | | | | 49,731 | |
5.50% 1/1/41 | | | 5,890 | | | | 6,505 | |
6.00% 2/1/36 | | | 2,377 | | | | 2,688 | |
6.00% 1/1/38 | | | 1,548 | | | | 1,735 | |
6.00% 6/1/38 | | | 4,253 | | | | 4,770 | |
6.00% 8/1/38 | | | 54,535 | | | | 61,592 | |
GNMA I S.F. 30 yr | | | | | | | | |
5.00% 6/15/40 | | | 2,269 | | | | 2,493 | |
14
| | | | | | | | |
| | | Principal amount° | | | Value (U.S. $) | |
| |
| | |
Agency Mortgage-Backed Securities (continued) | | | | | | | | |
| |
GNMA I S.F. 30 yr | | | | | | | | |
7.50% 2/15/32 | | | 1,557 | | | $ | 1,866 | |
| | | | | | | | |
Total Agency Mortgage-Backed Securities (cost $3,435,221) | | | | | | | 3,542,997 | |
| | | | | | | | |
|
| |
| | |
Commercial Mortgage-Backed Securities – 1.88% | | | | | | | | |
| |
Banc of America Commercial Mortgage Trust | | | | | | | | |
Series 2007-4 AM 5.822% 2/10/51 — | | | 10,000 | | | | 11,118 | |
Citigroup Commercial Mortgage Trust | | | | | | | | |
Series 2014-GC23 AS 3.863% 7/10/47 | | | 10,000 | | | | 10,299 | |
Credit Suisse Commercial Mortgage Trust | | | | | | | | |
Series 2006-C1 AAB 5.463% 2/15/39 — | | | 3,731 | | | | 3,769 | |
FREMF Mortgage Trust | | | | | | | | |
Series 2011-K10 B 144A 4.615% 11/25/49 #— | | | 20,000 | | | | 21,450 | |
Series 2012-K708 B 144A 3.759% 2/25/45 #— | | | 30,000 | | | | 31,075 | |
Series 2013-K712 B 144A 3.368% 5/25/45 #— | | | 50,000 | | | | 50,643 | |
Series 2013-K713 B 144A 3.165% 4/25/46 #— | | | 25,000 | | | | 24,930 | |
Goldman Sachs Mortgage Securities II | | | | | | | | |
Series 2006-GG6 A4 5.553% 4/10/38 — | | | 25,000 | | | | 26,194 | |
JPMBB Commercial Mortgage Securities Trust | | | | | | | | |
Series 2014-C21 AS 3.997% 8/15/47 | | | 10,000 | | | | 10,242 | |
JPMorgan Chase Commercial Mortgage Securities Trust | | | | | | | | |
Series 2005-CB11 E 5.477% 8/12/37 — | | | 10,000 | | | | 10,733 | |
Series 2005-LDP5 D 5.392% 12/15/44 — | | | 10,000 | | | | 10,385 | |
Series 2006-LDP8 AM 5.44% 5/15/45 | | | 25,000 | | | | 26,976 | |
Series 2011-C5 A3 4.171% 8/15/46 | | | 20,000 | | | | 21,583 | |
Morgan Stanley Capital I Trust | | | | | | | | |
Series 2005-HQ7 AJ 5.204% 11/14/42 — | | | 25,000 | | | | 26,039 | |
| | | | | | | | |
Total Commercial Mortgage-Backed Securities (cost $286,000) | | | | | | | 285,436 | |
| | | | | | | | |
|
| |
| | |
Corporate Bonds – 38.87% | | | | | | | | |
| |
Banking – 5.76% | | | | | | | | |
Abbey National Treasury Services 3.05% 8/23/18 | | | 20,000 | | | | 20,788 | |
Bank of America 4.00% 4/1/24 | | | 40,000 | | | | 40,637 | |
Bank of New York Mellon 3.40% 5/15/24 | | | 40,000 | | | | 40,259 | |
BB&T | | | | | | | | |
5.20% 12/23/15 | | | 30,000 | | | | 31,768 | |
5.25% 11/1/19 | | | 101,000 | | | | 114,070 | |
Citigroup 4.00% 8/5/24 | | | 20,000 | | | | 19,691 | |
City National 5.25% 9/15/20 | | | 15,000 | | | | 16,732 | |
Fifth Third Bancorp 4.30% 1/16/24 | | | 15,000 | | | | 15,633 | |
Goldman Sachs Group 3.85% 7/8/24 | | | 10,000 | | | | 9,966 | |
JPMorgan Chase | | | | | | | | |
4.85% 2/1/44 | | | 20,000 | | | | 20,979 | |
15
Schedule of investments
Delaware Core Bond Fund
| | | | | | | | |
| | | Principal amount° | | | Value (U.S. $) | |
| |
| | |
Corporate Bonds (continued) | | | | | | | | |
| |
Banking (continued) | | | | | | | | |
JPMorgan Chase | | | | | | | | |
6.75% 8/29/49 — | | | 35,000 | | | $ | 37,537 | |
Morgan Stanley | | | | | | | | |
2.375% 7/23/19 | | | 15,000 | | | | 14,891 | |
5.00% 11/24/25 | | | 65,000 | | | | 69,329 | |
Northern Trust 3.95% 10/30/25 | | | 45,000 | | | | 46,798 | |
PNC Financial Services Group 3.90% 4/29/24 | | | 10,000 | | | | 10,127 | |
Santander Holdings USA 4.625% 4/19/16 | | | 20,000 | | | | 21,204 | |
State Street 3.10% 5/15/23 | | | 15,000 | | | | 14,738 | |
SunTrust Banks 3.60% 4/15/16 | | | 20,000 | | | | 20,919 | |
SVB Financial Group 5.375% 9/15/20 | | | 50,000 | | | | 56,256 | |
US Bancorp | | | | | | | | |
3.15% 3/4/15 | | | 55,000 | | | | 55,894 | |
3.70% 1/30/24 | | | 35,000 | | | | 36,178 | |
Wells Fargo | | | | | | | | |
4.10% 6/3/26 | | | 50,000 | | | | 50,507 | |
5.90% 12/29/49 — | | | 30,000 | | | | 31,410 | |
Zions Bancorp 7.75% 9/23/14 | | | 75,000 | | | | 75,747 | |
| | | | | | | | |
| | | | | | | 872,058 | |
| | | | | | | | |
Basic Industry – 3.03% | | | | | | | | |
CF Industries | | | | | | | | |
5.15% 3/15/34 | | | 10,000 | | | | 10,642 | |
6.875% 5/1/18 | | | 75,000 | | | | 87,481 | |
Eastman Chemical 4.65% 10/15/44 | | | 35,000 | | | | 34,679 | |
Georgia-Pacific 8.00% 1/15/24 | | | 45,000 | | | | 60,556 | |
International Paper | | | | | | | | |
3.65% 6/15/24 | | | 10,000 | | | | 9,893 | |
6.00% 11/15/41 | | | 15,000 | | | | 17,527 | |
7.50% 8/15/21 | | | 10,000 | | | | 12,657 | |
Lubrizol 5.50% 10/1/14 | | | 15,000 | | | | 15,124 | |
Monsanto 4.40% 7/15/44 | | | 50,000 | | | | 50,105 | |
Mosaic 5.625% 11/15/43 | | | 45,000 | | | | 50,786 | |
Plains Exploration & Production 6.50% 11/15/20 | | | 9,000 | | | | 10,035 | |
Rio Tinto Finance U.S.A 3.50% 11/2/20 | | | 25,000 | | | | 26,066 | |
Rock-Tenn | | | | | | | | |
3.50% 3/1/20 | | | 15,000 | | | | 15,346 | |
4.00% 3/1/23 | | | 10,000 | | | | 10,213 | |
Weyerhaeuser 4.625% 9/15/23 | | | 30,000 | | | | 32,258 | |
Yamana Gold 144A 4.95% 7/15/24 # | | | 15,000 | | | | 15,033 | |
| | | | | | | | |
| | | | | | | 458,401 | |
| | | | | | | | |
16
| | | | | | | | |
| | | Principal amount° | | | Value (U.S. $) | |
| |
| | |
Corporate Bonds (continued) | | | | | | | | |
| |
Brokerage – 0.70% | | | | | | | | |
Jefferies Group | | | | | | | | |
5.125% 1/20/23 | | | 20,000 | | | $ | 21,377 | |
6.45% 6/8/27 | | | 15,000 | | | | 16,969 | |
6.50% 1/20/43 | | | 10,000 | | | | 11,309 | |
Lazard Group 6.85% 6/15/17 | | | 50,000 | | | | 56,815 | |
| | | | | | | | |
| | | | | | | 106,470 | |
| | | | | | | | |
Capital Goods – 0.68% | | | | | | | | |
Caterpillar | | | | | | | | |
3.40% 5/15/24 | | | 15,000 | | | | 15,108 | |
4.30% 5/15/44 | | | 25,000 | | | | 25,135 | |
Crane | | | | | | | | |
2.75% 12/15/18 | | | 5,000 | | | | 5,092 | |
4.45% 12/15/23 | | | 20,000 | | | | 21,007 | |
Ingersoll-Rand Global Holding 4.25% 6/15/23 | | | 30,000 | | | | 31,663 | |
URS 3.85% 4/1/17 | | | 5,000 | | | | 5,184 | |
| | | | | | | | |
| | | | | | | 103,189 | |
| | | | | | | | |
Communications – 4.58% | | | | | | | | |
American Tower Trust I | | | | | | | | |
144A 1.551% 3/15/43 # | | | 10,000 | | | | 9,922 | |
144A 3.07% 3/15/23 # | | | 30,000 | | | | 29,516 | |
AT&T 4.80% 6/15/44 | | | 65,000 | | | | 66,117 | |
CC Holdings GS V 3.849% 4/15/23 | | | 10,000 | | | | 9,983 | |
Crown Castle Towers 144A 4.883% 8/15/20 # | | | 65,000 | | | | 72,001 | |
DIRECTV Holdings | | | | | | | | |
4.45% 4/1/24 | | | 40,000 | | | | 41,980 | |
5.15% 3/15/42 | | | 5,000 | | | | 5,179 | |
Historic TW 6.875% 6/15/18 | | | 85,000 | | | | 100,385 | |
SBA Tower Trust 144A 2.24% 4/16/18 # | | | 25,000 | | | | 24,772 | |
SES 144A 3.60% 4/4/23 # | | | 45,000 | | | | 45,338 | |
SES Global Americas Holdings 144A 5.30% 3/25/44 # | | | 15,000 | | | | 15,939 | |
Telefonica Emisiones 6.421% 6/20/16 | | | 85,000 | | | | 93,114 | |
Time Warner Cable 8.25% 4/1/19 | | | 35,000 | | | | 44,008 | |
Verizon Communications | | | | | | | | |
5.15% 9/15/23 | | | 50,000 | | | | 55,436 | |
6.40% 9/15/33 | | | 10,000 | | | | 12,437 | |
6.55% 9/15/43 | | | 25,000 | | | | 31,511 | |
Viacom 5.25% 4/1/44 | | | 35,000 | | | | 36,848 | |
| | | | | | | | |
| | | | | | | 694,486 | |
| | | | | | | | |
Consumer Cyclical – 2.50% | | | | | | | | |
Bed Bath & Beyond | | | | | | | | |
4.915% 8/1/34 | | | 15,000 | | | | 15,165 | |
5.165% 8/1/44 | | | 15,000 | | | | 14,995 | |
17
Schedule of investments
Delaware Core Bond Fund
| | | | | | | | |
| | | Principal amount° | | | Value (U.S. $) | |
| |
| | |
Corporate Bonds (continued) | | | | | | | | |
| |
Consumer Cyclical (continued) | | | | | | | | |
Delphi 4.15% 3/15/24 | | | 20,000 | | | $ | 20,482 | |
eBay 3.45% 8/1/24 | | | 35,000 | | | | 34,675 | |
Host Hotels & Resorts 3.75% 10/15/23 | | | 50,000 | | | | 49,476 | |
Hyundai Capital America 144A 2.55% 2/6/19 # | | | 20,000 | | | | 20,229 | |
International Game Technology 5.35% 10/15/23 | | | 25,000 | | | | 25,933 | |
Magna International 3.625% 6/15/24 | | | 15,000 | | | | 15,096 | |
Marriott International 3.375% 10/15/20 | | | 15,000 | | | | 15,460 | |
QVC 4.375% 3/15/23 | | | 35,000 | | | | 35,233 | |
Signet UK Finance 4.70% 6/15/24 | | | 20,000 | | | | 20,344 | |
Target | | | | | | | | |
2.30% 6/26/19 | | | 10,000 | | | | 10,050 | |
3.50% 7/1/24 | | | 10,000 | | | | 10,057 | |
TRW Automotive 144A 4.45% 12/1/23 # | | | 40,000 | | | | 40,800 | |
Wyndham Worldwide 4.25% 3/1/22 | | | 50,000 | | | | 51,007 | |
| | | | | | | | |
| | | | | | | 379,002 | |
| | | | | | | | |
Consumer Non-Cyclical – 3.27% | | | | | | | | |
Actavis Funding 144A 3.85% 6/15/24 # | | | 40,000 | | | | 39,995 | |
Amgen 3.625% 5/22/24 | | | 65,000 | | | | 65,255 | |
Boston Scientific | | | | | | | | |
2.65% 10/1/18 | | | 10,000 | | | | 10,169 | |
6.00% 1/15/20 | | | 25,000 | | | | 28,970 | |
CareFusion 6.375% 8/1/19 | | | 25,000 | | | | 29,094 | |
Celgene 3.95% 10/15/20 | | | 35,000 | | | | 36,672 | |
Express Scripts Holding | | | | | | | | |
2.25% 6/15/19 | | | 10,000 | | | | 9,910 | |
3.50% 6/15/24 | | | 30,000 | | | | 29,651 | |
Forest Laboratories 144A 4.375% 2/1/19 # | | | 10,000 | | | | 10,735 | |
Gilead Sciences 3.70% 4/1/24 | | | 25,000 | | | | 25,678 | |
McKesson 3.796% 3/15/24 | | | 35,000 | | | | 35,608 | |
PepsiCo 3.60% 3/1/24 | | | 50,000 | | | | 51,394 | |
Quest Diagnostics 2.70% 4/1/19 | | | 10,000 | | | | 10,051 | |
Thermo Fisher Scientific | | | | | | | | |
2.40% 2/1/19 | | | 20,000 | | | | 20,088 | |
4.15% 2/1/24 | | | 10,000 | | | | 10,393 | |
Zimmer Holdings 4.625% 11/30/19 | | | 75,000 | | | | 82,432 | |
| | | | | | | | |
| | | | | | | 496,095 | |
| | | | | | | | |
Electric – 4.29% | | | | | | | | |
Ameren Illinois 4.30% 7/1/44 | | | 50,000 | | | | 50,444 | |
American Transmission Systems 144A 5.25% 1/15/22 # | | | 10,000 | | | | 10,911 | |
Berkshire Hathaway Energy 3.75% 11/15/23 | | | 55,000 | | | | 56,470 | |
Cleveland Electric Illuminating 5.50% 8/15/24 | | | 10,000 | | | | 11,564 | |
Electricite de France 144A 4.60% 1/27/20 # | | | 35,000 | | | | 38,794 | |
18
| | | | | | | | |
| | | Principal amount° | | | Value (U.S. $) | |
| |
Corporate Bonds (continued) | | | | | | | | |
| |
Electric (continued) | | | | | | | | |
Entergy Arkansas 3.70% 6/1/24 | | | 5,000 | | | $ | 5,192 | |
Entergy Louisiana 4.05% 9/1/23 | | | 35,000 | | | | 37,111 | |
Exelon Generation 4.25% 6/15/22 | | | 35,000 | | | | 36,347 | |
Great Plains Energy | | | | | | | | |
4.85% 6/1/21 | | | 15,000 | | | | 16,543 | |
5.292% 6/15/22 | | | 15,000 | | | | 17,130 | |
Integrys Energy Group 6.11% 12/1/66 — | | | 35,000 | | | | 35,726 | |
ITC Holdings 3.65% 6/15/24 | | | 10,000 | | | | 9,966 | |
LG&E & KU Energy | | | | | | | | |
3.75% 11/15/20 | | | 25,000 | | | | 26,165 | |
4.375% 10/1/21 | | | 30,000 | | | | 32,215 | |
National Rural Utilities Cooperative Finance | | | | | | | | |
4.75% 4/30/43 — | | | 25,000 | | | | 24,953 | |
NextEra Energy Capital Holdings | | | | | | | | |
2.40% 9/15/19 | | | 15,000 | | | | 15,056 | |
3.625% 6/15/23 | | | 10,000 | | | | 10,071 | |
Pennsylvania Electric 5.20% 4/1/20 | | | 50,000 | | | | 55,011 | |
PPL Electric Utilities 3.00% 9/15/21 | | | 20,000 | | | | 20,371 | |
Public Service New Hampshire 3.50% 11/1/23 | | | 15,000 | | | | 15,441 | |
SCANA 4.125% 2/1/22 | | | 10,000 | | | | 10,381 | |
Southwestern Electric Power 6.45% 1/15/19 | | | 45,000 | | | | 52,776 | |
Wisconsin Energy 6.25% 5/15/67 — | | | 60,000 | | | | 61,848 | |
| | | | | | | | |
| | | | | | | 650,486 | |
| | | | | | | | |
Energy – 4.58% | | | | | | | | |
Anadarko Petroleum 3.45% 7/15/24 | | | 15,000 | | | | 14,886 | |
Continental Resources 4.50% 4/15/23 | | | 45,000 | | | | 48,024 | |
El Paso Pipeline Partners Operating 4.30% 5/1/24 | | | 20,000 | | | | 20,099 | |
Energy Transfer Partners | | | | | | | | |
5.15% 2/1/43 | | | 20,000 | | | | 20,157 | |
5.95% 10/1/43 | | | 40,000 | | | | 44,621 | |
9.70% 3/15/19 | | | 18,000 | | | | 23,398 | |
EnLink Midstream Partners 4.40% 4/1/24 | | | 30,000 | | | | 31,421 | |
Enterprise Products Operating 7.034% 1/15/68 — | | | 20,000 | | | | 22,793 | |
Kinder Morgan Energy Partners 9.00% 2/1/19 | | | 50,000 | | | | 63,544 | |
NiSource Finance 6.125% 3/1/22 | | | 15,000 | | | | 17,751 | |
Petroleos Mexicanos 5.50% 1/21/21 | | | 20,000 | | | | 22,206 | |
Plains All American Pipeline 8.75% 5/1/19 | | | 45,000 | | | | 57,535 | |
Pride International 6.875% 8/15/20 | | | 80,000 | | | | 96,333 | |
Southern Natural Gas 4.40% 6/15/21 | | | 20,000 | | | | 21,648 | |
Statoil 2.90% 11/8/20 | | | 15,000 | | | | 15,326 | |
Sunoco Logistics Partners Operations 3.45% 1/15/23 | | | 25,000 | | | | 24,441 | |
Talisman Energy 5.50% 5/15/42 | | | 50,000 | | | | 54,306 | |
19
Schedule of investments
Delaware Core Bond Fund
| | | | | | | | |
| | | Principal amount° | | | Value (U.S. $) | |
| |
Corporate Bonds (continued) | | | | | | | | |
| |
Energy (continued) | | | | | | | | |
TransCanada PipeLines 6.35% 5/15/67 — | | | 45,000 | | | $ | 47,003 | |
Williams 4.55% 6/24/24 | | | 10,000 | | | | 9,983 | |
Woodside Finance 144A 8.75% 3/1/19 # | | | 30,000 | | | | 37,858 | |
| | | | | | | | |
| | | | | | | 693,333 | |
| | | | | | | | |
Financials – 2.49% | | | | | | | | |
General Electric Capital | | | | | | | | |
3.45% 5/15/24 | | | 335,000 | | | | 336,322 | |
6.00% 8/7/19 | | | 35,000 | | | | 41,160 | |
| | | | | | | | |
| | | | | | | 377,482 | |
| | | | | | | | |
Insurance – 2.67% | | | | | | | | |
Allstate 5.75% 8/15/53 — | | | 20,000 | | | | 21,550 | |
American International Group 2.30% 7/16/19 | | | 30,000 | | | | 29,845 | |
Berkshire Hathaway Finance 2.90% 10/15/20 | | | 55,000 | | | | 56,217 | |
Chubb 6.375% 3/29/67 — | | | 35,000 | | | | 38,763 | |
Highmark | | | | | | | | |
144A 4.75% 5/15/21 # | | | 20,000 | | | | 20,339 | |
144A 6.125% 5/15/41 # | | | 5,000 | | | | 4,966 | |
Liberty Mutual Group | | | | | | | | |
144A 4.25% 6/15/23 # | | | 25,000 | | | | 25,755 | |
144A 4.95% 5/1/22 # | | | 5,000 | | | | 5,441 | |
MetLife 6.817% 8/15/18 | | | 110,000 | | | | 130,305 | |
Prudential Financial | | | | | | | | |
5.625% 6/15/43 — | | | 40,000 | | | | 43,000 | |
6.00% 12/1/17 | | | 25,000 | | | | 28,432 | |
| | | | | | | | |
| | | | | | | 404,613 | |
| | | | | | | | |
Real Estate – 1.11% | | | | | | | | |
Alexandria Real Estate Equities | | | | | | | | |
3.90% 6/15/23 | | | 5,000 | | | | 4,970 | |
4.50% 7/30/29 | | | 10,000 | | | | 10,096 | |
CBL & Associates 5.25% 12/1/23 | | | 15,000 | | | | 16,025 | |
Corporate Office Properties | | | | | | | | |
3.60% 5/15/23 | | | 20,000 | | | | 19,181 | |
5.25% 2/15/24 | | | 10,000 | | | | 10,696 | |
Digital Realty Trust 5.875% 2/1/20 | | | 35,000 | | | | 38,968 | |
Excel Trust 4.625% 5/15/24 | | | 10,000 | | | | 10,212 | |
Healthcare Trust of America Holdings 3.375% 7/15/21 | | | 10,000 | | | | 9,951 | |
Regency Centers | | | | | | | | |
4.80% 4/15/21 | | | 15,000 | | | | 16,406 | |
5.875% 6/15/17 | | | 14,000 | | | | 15,663 | |
WP Carey 4.60% 4/1/24 | | | 15,000 | | | | 15,484 | |
| | | | | | | | |
| | | | | | | 167,652 | |
| | | | | | | | |
20
| | | | | | | | |
| | | Principal amount° | | | Value (U.S. $) | |
| |
Corporate Bonds (continued) | | | | | | | | |
| |
Technology – 2.47% | | | | | | | | |
Apple 3.45% 5/6/24 | | | 55,000 | | | $ | 55,448 | |
Broadcom | | | | | | | | |
3.50% 8/1/24 | | | 5,000 | | | | 4,972 | |
4.50% 8/1/34 | | | 15,000 | | | | 15,250 | |
Hewlett-Packard 1.174% 1/14/19 — | | | 20,000 | | | | 20,178 | |
Microsoft 2.125% 11/15/22 | | | 30,000 | | | | 28,489 | |
National Semiconductor 6.60% 6/15/17 | | | 50,000 | | | | 57,482 | |
NetApp 3.25% 12/15/22 | | | 15,000 | | | | 14,475 | |
Oracle | | | | | | | | |
3.40% 7/8/24 | | | 25,000 | | | | 24,945 | |
4.50% 7/8/44 | | | 10,000 | | | | 10,103 | |
Seagate HDD Cayman 144A 4.75% 1/1/25 # | | | 25,000 | | | | 24,750 | |
Tyco Electronics Group 3.45% 8/1/24 | | | 55,000 | | | | 54,582 | |
Xerox 6.35% 5/15/18 | | | 55,000 | | | | 63,355 | |
| | | | | | | | |
| | | | | | | 374,029 | |
| | | | | | | | |
Transportation – 0.74% | | | | | | | | |
Burlington Northern Santa Fe 4.90% 4/1/44 | | | 20,000 | | | | 21,336 | |
ERAC USA Finance 144A 4.50% 8/16/21 # | | | 30,000 | | | | 32,542 | |
Norfolk Southern 3.85% 1/15/24 | | | 15,000 | | | | 15,564 | |
United Airlines 2014-1 Class A Pass Through Trust | | | | | | | | |
4.00% 4/11/26 ¿ | | | 5,000 | | | | 5,069 | |
United Airlines 2014-2 Class A Pass Through Trust | | | | | | | | |
3.75% 9/3/26 ¿ | | | 15,000 | | | | 14,996 | |
United Parcel Service 5.125% 4/1/19 | | | 20,000 | | | | 22,725 | |
| | | | | | | | |
| | | | | | | 112,232 | |
| | | | | | | | |
Total Corporate Bonds (cost $5,757,206) | | | | | | | 5,889,528 | |
| | | | | | | | |
|
| |
Non-Agency Asset-Backed Securities – 8.17% | | | | | | | | |
| |
Ally Master Owner Trust | | | | | | | | |
Series 2014-2 A 0.522% 1/16/18 — | | | 40,000 | | | | 40,024 | |
American Express Credit Account Master Trust | | | | | | | | |
Series 2013-1 A 0.572% 2/16/21 — | | | 100,000 | | | | 100,420 | |
Capital One Multi-Asset Execution Trust | | | | | | | | |
Series 2007-A1 A1 0.202% 11/15/19 — | | | 200,000 | | | | 199,005 | |
Chase Issuance Trust | | | | | | | | |
Series 2007-A5 A5 0.192% 3/15/19 — | | | 100,000 | | | | 99,637 | |
Series 2012-A9 A9 0.302% 10/16/17 — | | | 115,000 | | | | 115,000 | |
Series 2013-A3 A3 0.432% 4/15/20 — | | | 105,000 | | | | 105,114 | |
Citibank Credit Card Issuance Trust | | | | | | | | |
Series 2013-A2 A2 0.435% 5/26/20 — | | | 100,000 | | | | 99,992 | |
Fifth Third Auto Trust | | | | | | | | |
Series 2014-2 A2B 0.312% 4/17/17 — | | | 65,000 | | | | 65,214 | |
21
Schedule of investments
Delaware Core Bond Fund
| | | | | | | | |
| | | Principal amount° | | | Value (U.S. $) | |
| |
| | |
Non-Agency Asset-Backed Securities (continued) | | | | | | | | |
| |
Ford Credit Floorplan Master Owner Trust A | | | | | | | | |
Series 2014-1 A2 0.552% 2/15/19 — | | | 35,000 | | | $ | 35,016 | |
GE Equipment Transportation | | | | | | | | |
Series 2014-1 A3 0.97% 4/23/18 | | | 35,000 | | | | 34,930 | |
Golden Credit Card Trust | | | | | | | | |
Series 2014-2A A 144A 0.602% 3/15/21 #— | | | 275,000 | | | | 275,761 | |
Mid-State Trust XI | | | | | | | | |
Series 11 A1 4.864% 7/15/38 | | | 21,606 | | | | 23,026 | |
Nissan Auto Receivables Owner Trust | | | | | | | | |
Series 2013-C A3 0.67% 8/15/18 | | | 30,000 | | | | 29,921 | |
World Omni Automobile Lease Securitization Trust | | | | | | | | |
Series 2012-A A3 0.93% 11/16/15 | | | 15,414 | | | | 15,425 | |
| | | | | | | | |
Total Non-Agency Asset-Backed Securities
(cost $1,233,269) | | | | | | | 1,238,485 | |
| | | | | | | | |
|
| |
| | |
U.S. Treasury Obligations – 22.74% | | | | | | | | |
| |
U.S. Treasury Bonds | | | | | | | | |
2.50% 5/15/24 | | | 1,535,000 | | | | 1,527,684 | |
3.375% 5/15/44 | | | 165,000 | | | | 167,011 | |
U.S. Treasury Notes | | | | | | | | |
0.094% 4/30/16 — | | | 935,000 | | | | 935,075 | |
1.625% 6/30/19 | | | 820,000 | | | | 815,035 | |
| | | | | | | | |
Total U.S. Treasury Obligations (cost $3,446,210) | | | | | | | 3,444,805 | |
| | | | | | | | |
|
| |
| | |
Preferred Stock – 0.18% | | | | | | | | |
| |
Alabama Power 5.625% | | | 825 | | | | 20,245 | |
Integrys Energy Group 6.00% — | | | 250 | | | | 6,433 | |
| | | | | | | | |
Total Preferred Stock (cost $26,339) | | | | | | | 26,678 | |
| | | | | | | | |
|
| |
| | |
Short-Term Investments – 13.22% | | | | | | | | |
| |
Discount Notes – 5.98%≠ | | | | | | | | |
Federal Home Loan Bank | | | | | | | | |
0.05% 8/14/14 | | | 465,627 | | | | 465,624 | |
0.05% 8/15/14 | | | 73,424 | | | | 73,424 | |
0.06% 8/18/14 | | | 250,044 | | | | 250,042 | |
0.075% 11/19/14 | | | 116,547 | | | | 116,522 | |
| | | | | | | | |
| | | | | | | 905,612 | |
| | | | | | | | |
Repurchase Agreements – 5.54% | | | | | | | | |
Bank of America Merrill Lynch | | | | | | | | |
0.04%, dated 7/31/14, to be repurchased on 8/1/14, repurchase price $261,850 (collateralized by U.S. government obligations 0.00%-0.375% 6/25/15-2/15/24; market value $267,087) | | | 261,850 | | | | 261,850 | |
22
| | | | | | | | |
| | | Principal amount° | | | Value (U.S. $) | |
| |
| | |
Short-Term Investments (continued) | | | | | | | | |
| |
Repurchase Agreements (continued) | | | | | | | | |
Bank of Montreal | | | | | | | | |
0.07%, dated 7/31/14, to be repurchased on 8/1/14, repurchase price $87,283 (collateralized by U.S. government obligations 0.00%-4.375% 8/21/14-11/15/43; market value $89,029) | | | 87,283 | | | $ | 87,283 | |
BNP Paribas | | | | | | | | |
0.07%, dated 7/31/14, to be repurchased on 8/1/14, repurchase price $489,868 (collateralized by U.S. government obligations 0.00%-2.75% 8/7/14-11/15/23; market value $499,665) | | | 489,867 | | | | 489,867 | |
| | | | | | | | |
| | | | | | | 839,000 | |
| | | | | | | | |
U.S. Treasury Obligation – 1.70%≠ | | | | | | | | |
U.S. Treasury Bill 0.093% 11/13/14 | | | 257,651 | | | | 257,627 | |
| | | | | | | | |
| | | | | | | 257,627 | |
| | | | | | | | |
Total Short-Term Investments (cost $2,002,181) | | | | | | | 2,002,239 | |
| | | | | | | | |
| | |
Total Value of Securities – 112.91%
(cost $16,856,677) | | | | | | $ | 17,106,860 | |
| | | | | | | | |
| # | Security exempt from registration under Rule 144A of the Securities Act of 1933, as amended. At July 31, 2014, the aggregate value of Rule 144A securities was $929,495, which represents 6.14% of the Fund’s net assets. See Note 11 in “Notes to financial statements.” |
| ¿ | Pass Through Agreement. Security represents the contractual right to receive a proportionate amount of underlying payments due to the counterparty pursuant to various agreements related to the rescheduling of obligations and the exchange of certain notes. |
| ≠ | The rate shown is the effective yield at the time of purchase. |
| ° | Principal amount shown is stated in U.S. dollars unless noted that the security is denominated in another currency. |
| — | Variable rate security. The rate shown is the rate as of July 31, 2014. Interest rates reset periodically. |
23
Schedule of investments
Delaware Core Bond Fund
Summary of abbreviations:
ARM – Adjustable Rate Mortgage
GNMA – Government National Mortgage Association
NCUA – National Credit Union Administration
REMIC – Real Estate Mortgage Investment Conduit
S.F. – Single Family
TBA – To be announced
yr – Year
See accompanying notes, which are an integral part of the financial statements.
24
This page intentionally left blank.
| | |
| Statement of assets and liabilities | | |
Delaware Core Bond Fund | | July 31, 2014 |
| | | | |
Assets: | | | | |
Investments, at value1 | | | $15,104,621 | |
Short-term investments, at value2 | | | 2,002,239 | |
Cash | | | 1,401 | |
Receivables for securities sold | | | 1,242,112 | |
Dividends and interest receivable | | | 89,108 | |
Receivables for fund shares sold | | | 1,279 | |
Due from manager | | | 9,905 | |
| | | | |
Total assets | | | 18,450,665 | |
| | | | |
| |
Liabilities: | | | | |
Payable for securities purchased | | | 3,190,390 | |
Payable for fund shares redeemed | | | 36,000 | |
Distribution payable | | | 8,005 | |
Other accrued expenses | | | 62,636 | |
Other affiliates payable | | | 2,254 | |
Distribution fees payable to affiliates | | | 1,094 | |
Trustees’ fees and expenses payable | | | 36 | |
| | | | |
Total liabilities | | | 3,300,415 | |
| | | | |
Total Net Assets | | | $15,150,250 | |
| | | | |
| |
Net Assets Consist of: | | | | |
Paid-in capital | | | $15,331,222 | |
Distributions in excess of net investment income | | | (8,005 | ) |
Accumulated net realized loss on investments | | | (423,150 | ) |
Net unrealized appreciation of investments | | | 250,183 | |
| | | | |
Total Net Assets | | | $15,150,250 | |
| | | | |
26
| | | | |
Net Asset Value | | | | |
Class A: | | | | |
Net assets | | $ | 2,514,669 | |
Shares of beneficial interest outstanding, unlimited authorization, no par | | | 242,509 | |
Net asset value per share | | $ | 10.37 | |
Sales charge | | | 4.50 | % |
Offering price per share, equal to net asset value per share / (1 – sales charge) | | $ | 10.86 | |
| |
Class C: | | | | |
Net assets | | $ | 615,104 | |
Shares of beneficial interest outstanding, unlimited authorization, no par | | | 59,094 | |
Net asset value per share | | $ | 10.41 | |
| |
Class R: | | | | |
Net assets | | $ | 2,410 | |
Shares of beneficial interest outstanding, unlimited authorization, no par | | | 232 | |
Net asset value per share | | $ | 10.39 | |
| |
Institutional Class: | | | | |
Net assets | | $ | 12,018,067 | |
Shares of beneficial interest outstanding, unlimited authorization, no par | | | 1,149,339 | |
Net asset value per share | | $ | 10.46 | |
1 Investments, at cost | | $ | 14,854,496 | |
| 2 Short-term investments, at cost | | | 2,002,181 | |
See accompanying notes, which are an integral part of the financial statements.
27
| | | | |
| Statement of operations | | | | |
| Delaware Core Bond Fund | | | Year ended July 31, 2014 | |
| | | | |
Investment Income: | | | | |
Interest | | $ | 383,427 | |
Dividends | | | 2,236 | |
| | | | |
| | | 385,663 | |
| | | | |
Expenses: | | | | |
Management fees | | | 82,098 | |
Distribution expenses — Class A | | | 7,009 | |
Distribution expenses — Class C | | | 6,085 | |
Distribution expenses — Class R | | | 12 | |
Consulting fees | | | 59,078 | |
Audit and tax | | | 43,133 | |
Reports and statements to shareholders | | | 15,151 | |
Pricing fees | | | 13,388 | |
Dividend disbursing and transfer agent fees and expenses | | | 9,950 | |
Custodian fees | | | 8,085 | |
Accounting and administration expenses | | | 5,886 | |
Legal fees | | | 1,282 | |
Trustees’ fees and expenses | | | 830 | |
Other | | | 9,355 | |
| | | | |
| | | 261,342 | |
Less expenses waived | | | (141,360 | ) |
Less waived distribution expenses — Class A | | | (239 | ) |
Less expense paid indirectly | | | (10 | ) |
| | | | |
Total operating expenses | | | 119,733 | |
| | | | |
Net Investment Income | | | 265,930 | |
| | | | |
| |
Net Realized and Unrealized Gain (Loss): | | | | |
Net realized gain (loss) on: | | | | |
Investments | | | 97,860 | |
Futures contracts | | | (29,407 | ) |
| | | | |
Net realized gain | | | 68,453 | |
| | | | |
Net change in unrealized appreciation (depreciation) of investments | | | 267,803 | |
| | | | |
Net Realized and Unrealized Gain | | | 336,256 | |
| | | | |
Net Increase in Net Assets Resulting from Operations | | $ | 602,186 | |
| | | | |
See accompanying notes, which are an integral part of the financial statements.
28
This page intentionally left blank.
Statements of changes in net assets
Delaware Core Bond Fund
| | | | | | | | |
| | | Year ended | |
| | | 7/31/14 | | | 7/31/13 | |
Increase (Decrease) in Net Assets from Operations: | | | | | | | | |
Net investment income | | $ | 265,930 | | | $ | 264,679 | |
Net realized gain (loss) | | | 68,453 | | | | (18,367 | ) |
Net change in unrealized appreciation (depreciation) | | | 267,803 | | | | (855,399 | ) |
| | | | | | | | |
Net increase (decrease) in net assets resulting from operations | | | 602,186 | | | | (609,087 | ) |
| | | | | | | | |
| | |
Dividends and Distributions to Shareholders from: | | | | | | | | |
Net investment income: | | | | | | | | |
Class A | | | (51,945 | ) | | | (50,107 | ) |
Class C | | | (6,959 | ) | | | (9,892 | ) |
Class R | | | (39 | ) | | | (32 | ) |
Institutional Class | | | (285,767 | ) | | | (397,291 | ) |
| | |
Return of capital: | | | | | | | | |
Class A | | | (9,137 | ) | | | — | |
Class C | | | (2,226 | ) | | | — | |
Class R | | | (9 | ) | | | — | |
Institutional Class | | | (43,304 | ) | | | — | |
| | |
Net realized gain: | | | | | | | | |
Class A | | | — | | | | (105,982 | ) |
Class C | | | — | | | | (46,744 | ) |
Class R | | | — | | | | (79 | ) |
Institutional Class | | | — | | | | (732,994 | ) |
| | | | | | | | |
| | | (399,386 | ) | | | (1,343,121 | ) |
| | | | | | | | |
30
| | | | | | | | |
| | | Year ended | |
| | | 7/31/14 | | | 7/31/13 | |
| | |
Capital Share Transactions: | | | | | | | | |
Proceeds from shares sold: | | | | | | | | |
Class A | | $ | 671,195 | | | $ | 1,863,974 | |
Class C | | | 169,801 | | | | 754,234 | |
Class R | | | 91 | | | | — | |
Institutional Class | | | 1,900,312 | | | | 7,940,608 | |
| | |
Net asset value of shares issued upon reinvestment of dividends and distributions: | | | | | | | | |
Class A | | | 58,158 | | | | 153,555 | |
Class C | | | 7,622 | | | | 48,107 | |
Class R | | | 51 | | | | 111 | |
Institutional Class | | | 325,466 | | | | 1,069,642 | |
| | | | | | | | |
| | | 3,132,696 | | | | 11,830,231 | |
| | | | | | | | |
| | |
Cost of shares redeemed: | | | | | | | | |
Class A | | | (1,261,496 | ) | | | (1,756,938 | ) |
Class C | | | (269,738 | ) | | | (1,489,083 | ) |
Class R | | | (91 | ) | | | — | |
Institutional Class | | | (4,372,901 | ) | | | (18,356,165 | ) |
| | | | | | | | |
| | | (5,904,226 | ) | | | (21,602,186 | ) |
| | | | | | | | |
Decrease in net assets derived from capital share transactions | | | (2,771,530 | ) | | | (9,771,955 | ) |
| | | | | | | | |
Net Decrease in Net Assets | | | (2,568,730 | ) | | | (11,724,163 | ) |
| | |
Net Assets: | | | | | | | | |
Beginning of year | | | 17,718,980 | | | | 29,443,143 | |
| | | | | | | | |
End of year | | $ | 15,150,250 | | | $ | 17,718,980 | |
| | | | | | | | |
Distributions in excess of net investment income | | $ | (8,005 | ) | | $ | (8,420 | ) |
| | | | | | | | |
See accompanying notes, which are an integral part of the financial statements.
31
Financial highlights
Delaware Core Bond Fund Class A
Selected data for each share of the Fund outstanding throughout each period were as follows:
|
Net asset value, beginning of period |
|
Income (loss) from investment operations: |
Net investment income3 |
Net realized and unrealized gain (loss) |
Total from investment operations |
|
Less dividends and distributions from: |
Net investment income |
Return of capital |
Net realized gain |
Total dividends and distributions |
|
Net asset value, end of period |
|
Total return4 |
|
Ratios and supplemental data: |
Net assets, end of period (000 omitted) |
Ratio of expenses to average net assets |
Ratio of expenses to average net assets prior to fees waived |
Ratio of net investment income to average net assets |
Ratio of net investment income to average net assets prior to fees waived |
Portfolio turnover |
| 1 | During the period ended July 31, 2010, the Fund changed its fiscal year end from October to July. Ratios have been annualized and total return and portfolio turnover have not been annualized. |
| 2 | Effective Sept. 30, 2009, the Fund received all of the assets and liabilities of the Delaware Pooled® Trust – The Intermediate Fixed Income Portfolio (the Portfolio). The Class A shares’ financial highlights for the periods prior to Sept. 30, 2009 reflect the performance of the Institutional Class shares of the Portfolio. Fees paid by the Portfolio were less than Class A share fees, and performance would have been lower if Class A fees were paid. |
| 3 | The average shares outstanding method has been applied for per share information. |
| 4 | Total investment return is based on the change in net asset value of a share during the period and assumes reinvestment of dividends and distributions at net asset value and does not reflect the impact of a sales charge. Total investment return during all of the periods shown reflects waivers by the manager and/or distributor. Performance would have been lower had the waivers not been in effect. |
See accompanying notes, which are an integral part of the financial statements.
32
| | | | | | | | | | | | | | | | | | | | | | | | |
| | | Year ended | | | 11/1/09 to | | | Year ended | |
| | | | | | |
| | | 7/31/14 | | | 7/31/13 | | | 7/31/12 | | | 7/31/11 | | | 7/31/101 | | | 10/31/092 | |
| |
| | $ | 10.250 | | | $ | 11.150 | | | $ | 10.890 | | | $ | 10.750 | | | $ | 10.370 | | | $ | 9.200 | |
| | | | | | |
| | | 0.149 | | | | 0.091 | | | | 0.140 | | | | 0.199 | | | | 0.159 | | | | 0.445 | |
| | | 0.204 | | | | (0.454 | ) | | | 0.707 | | | | 0.274 | | | | 0.434 | | | | 1.195 | |
| | | | | | | | | | | | | | | | | | | | | | | | |
| | | 0.353 | | | | (0.363 | ) | | | 0.847 | | | | 0.473 | | | | 0.593 | | | | 1.640 | |
| | | | | | | | | | | | | | | | | | | | | | | | |
| | | | | | |
| | | (0.195 | ) | | | (0.171 | ) | | | (0.205 | ) | | | (0.249 | ) | | | (0.213 | ) | | | (0.470 | ) |
| | | (0.038 | ) | | | — | | | | — | | | | — | | | | — | | | | — | |
| | | — | | | | (0.366 | ) | | | (0.382 | ) | | | (0.084 | ) | | | — | | | | — | |
| | | | | | | | | | | | | | | | | | | | | | | | |
| | | (0.233 | ) | | | (0.537 | ) | | | (0.587 | ) | | | (0.333 | ) | | | (0.213 | ) | | | (0.470 | ) |
| | | | | | | | | | | | | | | | | | | | | | | | |
| | | | | | |
| | $ | 10.370 | | | $ | 10.250 | | | $ | 11.150 | | | $ | 10.890 | | | $ | 10.750 | | | $ | 10.370 | |
| | | | | | | | | | | | | | | | | | | | | | | | |
| | | | | | |
| | | 3.50% | | | | (3.42% | ) | | | 8.03% | | | | 4.49% | | | | 5.89% | | | | 18.29% | |
| | | | | | |
| | $ | 2,515 | | | $ | 3,018 | | | $ | 3,021 | | | $ | 4,348 | | | $ | 4,022 | | | $ | 6,346 | |
| | | 0.90% | | | | 0.90% | | | | 0.90% | | | | 0.90% | | | | 0.90% | | | | 0.70% | |
| | | 1.77% | | | | 1.44% | | | | 1.34% | | | | 1.46% | | | | 2.25% | | | | 1.60% | |
| | | 1.45% | | | | 0.85% | | | | 1.27% | | | | 1.86% | | | | 2.04% | | | | 4.35% | |
| | | 0.58% | | | | 0.31% | | | | 0.83% | | | | 1.30% | | | | 0.69% | | | | 3.45% | |
| | | 401% | | | | 537% | | | | 517% | | | | 503% | | | | 528% | | | | 346% | |
|
| |
33
Financial highlights
Delaware Core Bond Fund Class C
Selected data for each share of the Fund outstanding throughout each period were as follows:
|
Net asset value, beginning of period |
|
Income (loss) from investment operations: |
Net investment income3 |
Net realized and unrealized gain (loss) |
Total from investment operations. |
|
Less dividends and distributions from: |
Net investment income |
Return of capital |
Net realized gain |
Total dividends and distributions |
|
Net asset value, end of period |
|
Total return4 |
|
Ratios and supplemental data: |
Net assets, end of period (000 omitted) |
Ratio of expenses to average net assets |
Ratio of expenses to average net assets prior to fees waived |
Ratio of net investment income to average net assets |
Ratio of net investment income (loss) to average net assets prior to fees waived |
Portfolio turnover |
| 1 | During the period ended July 31, 2010, the Fund changed its fiscal year end from October to July. Ratios have been annualized and total return and portfolio turnover have not been annualized. |
| 2 | Date of commencement of operations; ratios have been annualized and total return and portfolio turnover have not been annualized. |
| 3 | The average shares outstanding method has been applied for per share information. |
| 4 | Total investment return is based on the change in net asset value of a share during the period and assumes reinvestment of dividends and distributions at net asset value and does not reflect the impact of a sales charge. Total investment return during all of the periods shown reflects a waiver by the manager. Performance would have been lower had the waiver not been in effect. |
| 5 | Portfolio turnover is representative of the Fund for the entire year. |
See accompanying notes, which are an integral part of the financial statements.
34
| | | | | | | | | | | | | | | | | | | | | | | | |
| | | Year ended | | | 11/1/09 to | | | 9/30/092 to | |
| | | | | | |
| | | 7/31/14 | | | 7/31/13 | | | 7/31/12 | | | 7/31/11 | | | 7/31/101 | | | 10/31/09 | |
| |
| | $ | 10.290 | | | $ | 11.190 | | | $ | 10.930 | | | $ | 10.790 | | | $ | 10.370 | | | $ | 10.310 | |
| | | | | | |
| | | 0.072 | | | | 0.010 | | | | 0.058 | | | | 0.120 | | | | 0.103 | | | | 0.030 | |
| | | 0.204 | | | | (0.453 | ) | | | 0.707 | | | | 0.273 | | | | 0.469 | | | | 0.059 | |
| | | | | | | | | | | | | | | | | | | | | | | | |
| | | 0.276 | | | | (0.443 | ) | | | 0.765 | | | | 0.393 | | | | 0.572 | | | | 0.089 | |
| | | | | | | | | | | | | | | | | | | | | | | | |
| | | | | | |
| | | (0.118 | ) | | | (0.091 | ) | | | (0.123 | ) | | | (0.169 | ) | | | (0.152 | ) | | | (0.029 | ) |
| | | (0.038 | ) | | | — | | | | — | | | | — | | | | — | | | | — | |
| | | — | | | | (0.366 | ) | | | (0.382 | ) | | | (0.084 | ) | | | — | | | | — | |
| | | | | | | | | | | | | | | | | | | | | | | | |
| | | (0.156 | ) | | | (0.457 | ) | | | (0.505 | ) | | | (0.253 | ) | | | (0.152 | ) | | | (0.029 | ) |
| | | | | | | | | | | | | | | | | | | | | | | | |
| | | | | | |
| | $ | 10.410 | | | $ | 10.290 | | | $ | 11.190 | | | $ | 10.930 | | | $ | 10.790 | | | $ | 10.370 | |
| | | | | | | | | | | | | | | | | | | | | | | | |
| | | | | | |
| | | 2.72% | | | | (4.12% | ) | | | 7.20% | | | | 3.70% | | | | 5.67% | | | | 0.86% | |
| | | | | | |
| | $ | 615 | | | $ | 702 | | | $ | 1,483 | | | $ | 347 | | | $ | 145 | | | $ | 2 | |
| | | 1.65% | | | | 1.65% | | | | 1.65% | | | | 1.65% | | | | 1.65% | | | | 1.65% | |
| | | 2.51% | | | | 2.14% | | | | 2.04% | | | | 2.16% | | | | 2.95% | | | | 5.32% | |
| | | 0.70% | | | | 0.10% | | | | 0.52% | | | | 1.11% | | | | 1.29% | | | | 3.33% | |
| | | (0.16%) | | | | (0.39% | ) | | | 0.13% | | | | 0.60% | | | | (0.01% | ) | | | (0.34% | ) |
| | | 401% | | | | 537% | | | | 517% | | | | 503% | | | | 528% | | | | 346% | 5 |
|
| |
35
Financial highlights
Delaware Core Bond Fund Class R
Selected data for each share of the Fund outstanding throughout each period were as follows:
|
Net asset value, beginning of period |
|
Income (loss) from investment operations: |
Net investment income3 |
Net realized and unrealized gain (loss) |
Total from investment operations |
|
Less dividends and distributions from: |
Net investment income |
Return of capital |
Net realized gain |
Total dividends and distributions |
|
Net asset value, end of period |
|
Total return5 |
|
Ratios and supplemental data: |
Net assets, end of period (000 omitted) |
Ratio of expenses to average net assets |
Ratio of expenses to average net assets prior to fees waived |
Ratio of net investment income to average net assets |
Ratio of net investment income to average net assets prior to fees waived |
Portfolio turnover |
| 1 | During the period ended July 31, 2010, the Fund changed its fiscal year end from October to July. Ratios have been annualized and total return and portfolio turnover have not been annualized. |
| 2 | Date of commencement of operations; ratios have been annualized and total return has not been annualized. |
| 3 | The average shares outstanding method has been applied for per share information. |
| 4 | Includes adjustments from the period ending July 31, 2010 in the amount of $13 (or $0.063 per share) which impacted total return by -0.59%. The adjustment is to correct a misallocation of distributions among share classes, which had no impact on distribution amounts reported and paid to shareholders. |
| 5 | Total investment return is based on the change in net asset value of a share during the period and assumes reinvestment of dividends and distributions at net asset value. Total investment return during all of the periods shown reflects waivers by the manager and/or distributor. Performance would have been lower had the waivers not been in effect. |
| 6 | Includes 0.01% attributable to 12b-1 waiver. |
| 7 | Portfolio turnover is representative of the Fund for the entire year. |
See accompanying notes, which are an integral part of the financial statements.
36
| | | | | | | | | | | | | | | | | | | | | | | | |
| | | Year ended | | | 11/1/09 to | | | 9/30/092 to | |
| | | | | | |
| | | 7/31/14 | | | 7/31/13 | | | 7/31/12 | | | 7/31/11 | | | 7/31/101 | | | 10/31/09 | |
| |
| | | $ | 10.270 | | | $ | 11.170 | | | $ | 10.920 | | | $ | 10.830 | | | $ | 10.370 | | | $ | 10.310 | |
| | | | | | |
| | | 0.124 | | | | 0.064 | | | | 0.113 | | | | 0.174 | | | | 0.141 | | | | 0.035 | |
| | | 0.206 | | | | (0.457 | ) | | | 0.700 | | | | 0.226 | 4 | | | 0.510 | | | | 0.059 | |
| | | | | | | | | | | | | | | | | | | | | | | | |
| | | 0.330 | | | | (0.393 | ) | | | 0.813 | | | | 0.400 | 4 | | | 0.651 | | | | 0.094 | |
| | | | | | | | | | | | | | | | | | | | | | | | |
| | | | | | |
| | | (0.172 | ) | | | (0.141 | ) | | | (0.181 | ) | | | (0.226 | ) | | | (0.191 | ) | | | (0.034 | ) |
| | | (0.038 | ) | | | — | | | | — | | | | — | | | | — | | | | — | |
| | | — | | | | (0.366 | ) | | | (0.382 | ) | | | (0.084 | ) | | �� | — | | | | — | |
| | | | | | | | | | | | | | | | | | | | | | | | |
| | | (0.210 | ) | | | (0.507 | ) | | | (0.563 | ) | | | (0.310 | ) | | | (0.191 | ) | | | (0.034 | ) |
| | | | | | | | | | | | | | | | | | | | | | | | |
| | | | | | |
| | $ | 10.390 | | | $ | 10.270 | | | $ | 11.170 | | | $ | 10.920 | 4 | | $ | 10.830 | | | $ | 10.370 | |
| | | | | | | | | | | | | | | | | | | | | | | | |
| | | | | | |
| | | 3.26% | | | | (3.68% | ) | | | 7.68% | | | | 3.76% | 4 | | | 6.44% | | | | 0.90% | |
| | | | | | |
| | $ | 2 | | | $ | 2 | | | $ | 2 | | | $ | 2 | | | $ | 2 | | | $ | 2 | |
| | | 1.15% | | | | 1.15% | | | | 1.15% | | | | 1.15% | | | | 1.15% | | | | 1.15% | |
| | | 2.02% | 6 | | | 1.74% | | | | 1.64% | | | | 1.76% | | | | 2.55% | | | | 4.92% | |
| | | 1.20% | | | | 0.60% | | | | 1.02% | | | | 1.61% | | | | 1.79% | | | | 3.83% | |
| | | 0.33% | | | | 0.01% | | | | 0.53% | | | | 1.00% | | | | 0.39% | | | | 0.06% | |
| | | | 401% | | | | 537% | | | | 517% | | | | 503% | | | | 528% | | | | 346% | 7 |
37
Financial highlights
Delaware Core Bond Fund Institutional Class
Selected data for each share of the Fund outstanding throughout each period were as follows:
|
Net asset value, beginning of period |
|
Income (loss) from investment operations: |
Net investment income3 |
Net realized and unrealized gain (loss) |
Total from investment operations |
|
Less dividends and distributions from: |
Net investment income |
Return of capital |
Net realized gain |
Total dividends and distributions |
|
Net asset value, end of period |
|
Total return4 |
|
Ratios and supplemental data: |
Net assets, end of period (000 omitted) |
Ratio of expenses to average net assets |
Ratio of expenses to average net assets prior to fees waived |
Ratio of net investment income to average net assets |
Ratio of net investment income to average net assets prior to fees waived |
Portfolio turnover |
| 1 | During the period ended July 31, 2010, the Fund changed its fiscal year end from October to July. Ratios have been annualized and total return and portfolio turnover have not been annualized. |
| 2 | Date of commencement of operations; ratios have been annualized and total return and portfolio turnover have not been annualized. |
| 3 | The average shares outstanding method has been applied for per share information. |
| 4 | Total investment return is based on the change in net asset value of a share during the period and assumes reinvestment of dividends and distributions at net asset value. Total investment return during all of the periods shown reflects a waiver by the manager. Performance would have been lower had the waiver not been in effect. |
| 5 | Portfolio turnover is representative of the Fund for the entire year. |
See accompanying notes, which are an integral part of the financial statements.
38
| | | | | | | | | | | | | | | | | | | | | | | | |
| | | Year ended | | | 11/1/09 to | | | 9/30/092 to | |
| | | | | | |
| | | 7/31/14 | | | 7/31/13 | | | 7/31/12 | | | 7/31/11 | | | 7/31/101 | | | 10/31/09 | |
| |
| | $ | 10.340 | | | $ | 11.240 | | | $ | 10.980 | | | $ | 10.830 | | | $ | 10.370 | | | $ | 10.310 | |
| | | | | | |
| | | 0.176 | | | | 0.119 | | | | 0.168 | | | | 0.227 | | | | 0.181 | | | | 0.039 | |
| | | 0.205 | | | | (0.453 | ) | | | 0.708 | | | | 0.285 | | | | 0.512 | | | | 0.060 | |
| | | | | | | | | | | | | | | | | | | | | | | | |
| | | 0.381 | | | | (0.334 | ) | | | 0.876 | | | | 0.512 | | | | 0.693 | | | | 0.099 | |
| | | | | | | | | | | | | | | | | | | | | | | | |
| | | | | | |
| | | (0.223 | ) | | | (0.200 | ) | | | (0.234 | ) | | | (0.278 | ) | | | (0.233 | ) | | | (0.039 | ) |
| | | (0.038 | ) | | | — | | | | — | | | | — | | | | — | | | | — | |
| | | — | | | | (0.366 | ) | | | (0.382 | ) | | | (0.084 | ) | | | — | | | | — | |
| | | | | | | | | | | | | | | | | | | | | | | | |
| | | (0.261 | ) | | | (0.566 | ) | | | (0.616 | ) | | | (0.362 | ) | | | (0.233 | ) | | | (0.039 | ) |
| | | | | | | | | | | | | | | | | | | | | | | | |
| | | | | | |
| | $ | 10.460 | | | $ | 10.340 | | | $ | 11.240 | | | $ | 10.980 | | | $ | 10.830 | | | $ | 10.370 | |
| | | | | | | | | | | | | | | | | | | | | | | | |
| | | | | | |
| | | 3.74% | | | | (3.13% | ) | | | 8.25% | | | | 4.83% | | | | 6.76% | | | | 0.96% | |
| | | | | | |
| | $ | 12,018 | | | $ | 13,997 | | | $ | 24,937 | | | $ | 21,350 | | | $ | 15,895 | | | $ | 2 | |
| | | 0.65% | | | | 0.65% | | | | 0.65% | | | | 0.65% | | | | 0.65% | | | | 0.65% | |
| | | 1.51% | | | | 1.14% | | | | 1.04% | | | | 1.16% | | | | 1.95% | | | | 4.32% | |
| | | 1.70% | | | | 1.10% | | | | 1.52% | | | | 2.11% | | | | 2.29% | | | | 4.33% | |
| | | 0.84% | | | | 0.61% | | | | 1.13% | | | | 1.60% | | | | 0.99% | | | | 0.66% | |
| | | | 401% | | | | 537% | | | | 517% | | | | 503% | | | | 528% | | | | 346% | 5 |
39
| | |
Notes to financial statements Delaware Core Bond Fund | | July 31, 2014 |
Delaware Group® Income Funds (Trust) is organized as a Delaware statutory trust and offers five series: Delaware Core Bond Fund, Delaware Corporate Bond Fund, Delaware Diversified Floating Rate Fund, Delaware Extended Duration Bond Fund, and Delaware High-Yield Opportunities Fund. These financial statements and the related notes pertain to Delaware Core Bond Fund (Fund). The Trust is an open-end investment company. The Fund is considered diversified under the Investment Company Act of 1940, as amended, and offers Class A, Class C, Class R and Institutional Class shares. Class A shares are sold with a maximum front-end sales charge of 4.50%. Class A share purchases of $1,000,000 or more will incur a contingent deferred sales charge (CDSC) of 1.00% if redeemed during the first year and 0.50% during the second year, provided that Delaware Distributors, L.P. (DDLP) paid a financial advisor a commission on the purchase of those shares. Class C shares are sold with a CDSC of 1.00%, if redeemed during the first 12 months. Class R and Institutional Class shares are not subject to a sales charge and are offered for sale exclusively to certain eligible investors.
The investment objective of the Fund is to seek maximum long-term total return, consistent with reasonable risk.
1. Significant Accounting Policies
The following accounting policies are in accordance with U.S. generally accepted accounting principles (U.S. GAAP) and are consistently followed by the Fund.
Security Valuation – Equity securities, except those traded on the Nasdaq Stock Market, Inc. (Nasdaq), are valued at the last quoted sales price as of the time of the regular close of the New York Stock Exchange on the valuation date. Securities traded on the Nasdaq are valued in accordance with the Nasdaq Official Closing Price, which may not be the last sales price. If, on a particular day an equity security does not trade, then the mean between the bid and ask prices will be used, which approximates fair value. Debt securities are valued based upon valuations provided by an independent pricing service or broker and reviewed by management. To the extent current market prices are not available, the pricing service may take into account developments related to the specific security, as well as transactions in comparable securities. U.S. government and agency securities are valued at the mean between the bid and ask prices, which approximates fair value. Valuations for fixed income securities utilize matrix systems, which reflect such factors as security prices, yields, maturities, and ratings, and are supplemented by dealer and exchange quotations. For asset-backed securities, collateralized mortgage obligations, commercial mortgage securities, and U.S. government agency mortgage securities, pricing vendors utilize matrix pricing which considers prepayment speed; attributes of the collateral; yield or price of bonds of comparable quality, coupon, maturity, and type as well as broker/ dealer-supplied prices. Futures contracts and options on futures contracts are valued at the daily quoted settlement prices. Generally, other securities and assets for which market quotations are not readily available are valued at fair value as determined in good faith under the direction of the Fund’s Board of Trustees (Board). In determining whether market quotations are readily available or fair valuation will be used, various factors will be taken into consideration, such as market closures or suspension of trading in a security.
Federal Income Taxes – No provision for federal income taxes has been made as the Fund intends to continue to qualify for federal income tax purposes as a regulated investment company under Subchapter M of the Internal Revenue Code of 1986, as amended, and make the requisite distributions
40
to shareholders. The Fund evaluates tax positions taken or expected to be taken in the course of preparing the Fund’s tax returns to determine whether the tax positions are “more-likely-than-not” of being sustained by the applicable tax authority. Tax positions not deemed to meet the “more-likely-than-not” threshold are recorded as a tax benefit or expense in the current year. Management has analyzed the Fund’s tax positions taken for all open federal income tax years (July 31, 2011–July 31, 2014), and has concluded that no provision for federal income tax is required in the Fund’s financial statements.
Class Accounting – Investment income and common expenses are allocated to the various classes of the Fund on the basis of “settled shares” of each class in relation to the net assets of the Fund. Realized and unrealized gain (loss) on investments are allocated to the various classes of the Fund on the basis of daily net assets of each class. Distribution expenses relating to a specific class are charged directly to that class.
Repurchase Agreements – The Fund may purchase certain U.S. government securities subject to the counterparty’s agreement to repurchase them at an agreed upon date and price. The counterparty will be required on a daily basis to maintain the value of the collateral subject to the agreement at not less than the repurchase price (including accrued interest). The agreements are conditioned upon the collateral being deposited under the Federal Reserve book-entry system with the Fund’s custodian or a third party sub-custodian. In the event of default or bankruptcy by the other party to the agreement, retention of the collateral may be subject to legal proceedings. All open repurchase agreements as of the date of this report were entered into on July 31, 2014.
To Be Announced Trades(TBA) – The Fund may contract to purchase or sell securities for a fixed price at a transaction date beyond the customary settlement period (examples: when issued, delayed delivery, forward commitment, or TBA transactions) consistent with the Fund’s ability to manage its investment portfolio and meet redemption requests. These transactions involve a commitment by the Fund to purchase or sell securities for a predetermined price or yield with payment and delivery taking place more than three days in the future, or after a period longer than the customary settlement period for that type of security. No interest will be earned by the Fund on such purchases until the securities are delivered or the transaction is completed; however, the market value may change prior to delivery.
Use of Estimates – The preparation of financial statements in conformity with U.S. GAAP requires management to make estimates and assumptions that affect the fair value of investments, the reported amounts of assets and liabilities and disclosure of contingent assets and liabilities at the date of the financial statements, and the reported amounts of revenues and expenses during the reporting period. Actual results could differ from those estimates and the differences could be material.
Other – Expenses directly attributable to the Fund are charged directly to the Fund. Other expenses common to various funds within the Delaware Investments® Family of Funds are generally allocated among such funds on the basis of average net assets. Management fees and some other expenses are paid monthly. Security transactions are recorded on the date the securities are purchased or sold (trade date) for financial reporting purposes. Costs used in calculating realized gains and losses on the sale of investment securities are those of the specific securities sold. Dividend income is recorded on the ex-dividend date and interest income is recorded on the accrual basis. Discounts and premiums on debt securities are amortized to interest income over the lives of the respective securities using the effective
41
Notes to financial statements
Delaware Core Bond Fund
1. Significant Accounting Policies (continued)
interest method. Realized gains (losses) on paydowns of asset- and mortgage-backed securities are classified as interest income. The Fund declares dividends daily from net investment income and pays dividends monthly and declares and pays distributions from net realized gain on investments, if any, annually. The Fund may distribute more frequently, if necessary for tax purposes. Dividends and distributions, if any, are recorded on the ex-dividend date.
The Fund may receive earnings credits from its custodian when positive cash balances are maintained, which may be used to offset custody fees. There were no earnings credits for the year ended July 31, 2014.
The Fund receives earnings credits from its transfer agent when positive cash balances are maintained, which may be used to offset transfer agent fees. If the amount earned is greater than one dollar, the expense paid under this arrangement is included on the “Statement of operations” under “Dividend disbursing and transfer agent fees and expenses” with the corresponding expense offset shown as “Less expense paid indirectly.” For the year ended July 31, 2014, the Fund earned $10 under this agreement.
2. Investment Management, Administration Agreements and Other Transactions with Affiliates
In accordance with the terms of its investment management agreement, the Fund pays Delaware Management Company (DMC), a series of Delaware Management Business Trust and the investment manager, an annual fee which is calculated daily at the rate of 0.50% on the first $500 million of average daily net assets of the Fund, 0.475% on the next $500 million, 0.45% on the next $1.5 billion, and 0.425% on average daily net assets in excess of $2.5 billion.
DMC has contractually agreed to waive that portion, if any, of its management fee and/or pay/reimburse the Fund to the extent necessary to limit annual operating expenses, (excluding any 12b-1 fees, acquired fund fees and expenses, taxes, interest, inverse floater program expenses, short sale and dividend interest expenses, brokerage fees, certain insurance costs, and nonroutine expenses or costs including, but not limited to, those relating to reorganizations, litigation, conducting shareholder meetings, and liquidations), to 0.65% of the Fund’s average daily net assets from Aug. 1, 2013 through July 31, 2014.* For purposes of this waiver and reimbursement, nonroutine expenses may also include such additional costs and expenses, as may be agreed upon from time to time by the Fund’s Board and DMC. This expense waiver and reimbursement apply only to the expenses paid directly to the Fund and may only be terminated by agreement of DMC and the Fund.
Delaware Service Company, Inc. (DSC), an affiliate of DMC, provides fund accounting and financial administration oversight services to the Fund. For these services, the Fund pays DSC fees based on the aggregate daily net assets of the Delaware Investments® Family of Funds at the following annual rate: 0.0050% of the first $30 billion; 0.0045% of the next $10 billion; 0.0040% of the next $10 billion; and 0.0025% of aggregate average daily net assets in excess of $50 billion. The fees payable to DSC under the service agreement described above are allocated among all Funds in the Delaware Investments Family of Funds on a relative net asset value basis. For the year ended July 31, 2014, the Fund was charged $792 for these services.
42
DSC is also the transfer agent and dividend disbursing agent of the Fund. For these services, the Fund pays DSC fees based on the aggregate daily net assets of the retail funds within the Delaware Investments® Family of Funds at the following annual rate: 0.025% of the first $20 billion; 0.020% of the next $5 billion; 0.015% of the next $5 billion; and 0.013% on average daily net assets in excess of $30 billion. This amount is included on the “Statement of operations” under “Dividend disbursing and transfer agent fees and expenses.” For the year ended July 31, 2014, the amount charged by DSC was $3,601. Pursuant to a sub-transfer agency agreement between DSC and BNY Mellon Investment Servicing (US) Inc. (BNYMIS), BNYMIS provides certain sub-transfer agency services to the Fund. Sub-transfer agency fees are passed on to and paid directly by the Fund.
Pursuant to a distribution agreement and distribution plan, effective Oct. 1, 2013, the Fund pays DDLP, the distributor and an affiliate of DMC, an annual distribution and service fee of 0.25% of the average daily net assets of the Class A shares, 1.00% of the average daily net assets of the Class C shares, and 0.50% of the average daily net assets of the Class R shares. For the period Aug. 1, 2013 through Sept. 30, 2013, the Fund paid DDLP an annual distribution fee of 0.30% of the average daily net assets of Class A shares, 1.00% of the average daily net assets of the Class C shares, and 0.60% of the average daily net assets of the Class R shares, respectively. DDLP contracted to limit the Class A and Class R shares 12b-1 fees from Aug. 1, 2013 through Sept. 30, 2013** to no more than 0.25% and 0.50%, respectively of the classes’ average daily net assets. Institutional Class shares pay no distribution and service expenses.
As provided in the investment management agreement, the Fund bears a portion of the cost of certain resources shared with DMC, including the cost of internal personnel of DMC and/or its affiliates that provide legal, tax, and regulatory reporting services to the Fund. For the year ended July 31, 2014, the Fund was charged $468 for internal legal, tax, and regulatory reporting services provided by DMC and/or its affiliates’ employees.
For the year ended July 31, 2014, DDLP earned $413 for commissions on sales of the Fund’s Class A shares. For the year ended July 31, 2014, DDLP received gross CDSC commissions of $3 on redemptions of Class C shares and these commissions were entirely used to offset upfront commissions previously paid by DDLP to broker/dealers on sales of those shares.
Trustees’ fees include expenses accrued by the Fund for each Trustee’s retainer and meeting fees. Certain officers of DMC, DSC, and DDLP are officers and/or Trustees of the Trust. These officers and Trustees are paid no compensation by the Fund.
*The contractual waiver period is Nov. 28, 2012 through Nov. 28, 2014.
**The contractual waiver period was Nov. 28, 2012 through Nov. 28, 2013.
43
Notes to financial statements
Delaware Core Bond Fund
3. Investments
For the year ended July 31, 2014, the Fund made purchases and sales of investment securities other than short-term investments as follows:
| | | | |
Purchases other than U.S. government securities | | $ | 32,811,134 | |
Purchases of U.S. government securities | | | 28,894,097 | |
Sales other than U.S. government securities | | | 40,812,673 | |
Sales of U.S. government securities | | | 23,027,977 | |
At July 31, 2014 the cost of investments and unrealized appreciation (depreciation) for federal income tax purposes were as follows:
| | | | |
Cost of investments | | $ | 16,955,839 | |
| | | | |
Aggregate unrealized appreciation | | $ | 297,029 | |
Aggregate unrealized depreciation | | | (146,008 | ) |
| | | | |
Net unrealized appreciation | | $ | 151,021 | |
| | | | |
U.S. GAAP defines fair value as the price that the Fund would receive to sell an asset or pay to transfer a liability in an orderly transaction between market participants at the measurement date under current market conditions. A three-level hierarchy for fair value measurements has been established based upon the transparency of inputs to the valuation of an asset or liability. Inputs may be observable or unobservable and refer broadly to the assumptions that market participants would use in pricing the asset or liability. Observable inputs reflect the assumptions market participants would use in pricing the asset or liability based on market data obtained from sources independent of the reporting entity. Unobservable inputs reflect the reporting entity’s own assumptions about the assumptions that market participants would use in pricing the asset or liability developed based on the best information available under the circumstances. The Fund’s investment in its entirety is assigned a level based upon the observability of the inputs which are significant to the overall valuation. The three-level hierarchy of inputs is summarized below.
| | | | |
| Level 1 | | – | | Inputs are quoted prices in active markets for identical investments. (Examples: equity securities, open-end investment companies, futures contracts, exchange-traded options contracts) |
| | |
| Level 2 | | – | | Other observable inputs, including, but not limited to: quoted prices for similar assets or liabilities in markets that are active, quoted prices for identical or similar assets or liabilities in markets that are not active, inputs other than quoted prices that are observable for the assets or liabilities (such as interest rates, yield curves, volatilities, prepayment speeds, loss severities, credit risks, and default rates) or other market-corroborated inputs. (Examples: debt securities, government securities, swap contracts, foreign currency exchange contracts, foreign securities utilizing international fair value pricing, broker-quoted securities, fair value securities) |
| | |
| Level 3 | | – | | Significant unobservable inputs, including the Fund’s own assumptions used to determine the fair value of investments. (Examples: broker-quoted securities, fair valued securities) |
Level 3 investments are valued using significant unobservable inputs. The Fund may also use an income-based valuation approach in which the anticipated future cash flows of the investment are discounted to
44
calculate fair value. Discounts may also be applied due to the nature or duration of any restrictions on the disposition of the investments. Valuations may also be based upon current market prices of securities that are comparable in coupon, rating, maturity, and industry. The derived value of a Level 3 investment may not represent the value which is received upon disposition and this could impact the results of operations.
The following table summarizes the valuation of the Fund’s investments by fair value hierarchy levels as of July 31, 2014:
| | | | | | | | | | | | | | | | |
| | | Level 1 | | | Level 2 | | | Level 3 | | | Total | |
| | | | |
Agency, Asset-Backed & Mortgage-Backed Securities1 | | $ | — | | | $ | 5,733,311 | | | $ | 10,299 | | | $ | 5,743,610 | |
Corporate Debt | | | — | | | | 5,889,528 | | | | — | | | | 5,889,528 | |
Preferred Stock | | | 26,678 | | | | — | | | | — | | | | 26,678 | |
Short-Term Investments | | | — | | | | 2,002,239 | | | | — | | | | 2,002,239 | |
U.S. Treasury Obligations | | | — | | | | 3,444,805 | | | | — | | | | 3,444,805 | |
| | | | | | | | | | | | | | | | |
| | | | |
Total | | $ | 26,678 | | | $ | 17,069,883 | | | $ | 10,299 | | | $ | 17,106,860 | |
| | | | | | | | | | | | | | | | |
1Security type is valued across multiple levels. The amounts attributed to Level 2 investments and Level 3 investments represent 99.82% and 0.18%, respectively of the total market value of this security type. Level 2 investments represent investments with observable inputs or matrix-price investments, and Level 3 investments represent investments without observable inputs.
During the year ended July 31, 2014, there were no transfers between Level 1 investments, Level 2 investments, or Level 3 investments that had a significant impact to the Fund. The Fund’s policy is to recognize transfers between levels at the beginning of the reporting period.
A reconciliation of Level 3 investments is presented when the Fund has a significant amount of Level 3 investments at the beginning, interim, or end of the period in relation to net assets. Management has determined not to provide additional disclosure on Level 3 inputs under ASU No. 2011-04 since the Level 3 investments are not considered significant to the Fund’s net assets at the end of the period.
45
Notes to financial statements
Delaware Core Bond Fund
4. Dividend and Distribution Information
Income and long-term capital gain distributions are determined in accordance with federal income tax regulations, which may differ from U.S. GAAP. Additionally, distributions from net short-term gains on sales of investment securities are treated as ordinary income for federal income tax purposes. The tax character of dividends and distributions paid during the years ended July 31, 2014 and 2013 was as follows:
| | | | | | | | |
| | | Year ended | |
| | | 7/31/14 | | | 7/31/13 | |
Ordinary income | | $ | 344,710 | | | $ | 1,151,224 | |
Long-term capital gain | | | — | | | | 191,897 | |
Return of capital | | | 54,676 | | | | — | |
| | | | | | | | |
Total | | $ | 399,386 | | | $ | 1,343,121 | |
| | | | | | | | |
5. Components of Net Assets on a Tax Basis
As of July 31, 2014, the components of net assets on a tax basis were as follows:
| | | | |
Shares of beneficial interest | | $ | 15,331,222 | |
Distributions payable | | | (8,005 | ) |
Capital loss carryforwards | | | (323,988 | ) |
Unrealized appreciation | | | 151,021 | |
| | | | |
Net assets | | $ | 15,150,250 | |
| | | | |
The differences between book basis and tax basis components of net assets are primarily attributable to tax deferral of losses on wash sales and tax treatment of market discount and premium on debt instruments.
For financial reporting purposes, capital accounts are adjusted to reflect the tax character of permanent book/tax differences. Reclassifications are primarily due to market discount and premium on certain debt instruments and paydowns of mortgage- and asset-backed securities. Results of operations and net assets were not affected by these reclassifications. For the year ended July 31, 2014, the Fund recorded the following reclassifications.
| | | | |
Undistributed net investment income | | $ | 79,195 | |
Accumulated net realized loss | | | (79,195 | ) |
On Dec. 22, 2010, the Regulated Investment Company Modernization Act of 2010 (Act) was enacted, which changed various technical rules governing the tax treatment of regulated investment companies. The changes were generally effective for taxable years beginning after the date of enactment. Under the Act, the Fund is permitted to carry forward capital losses incurred in taxable years beginning after the date of enactment for an unlimited period.
Losses incurred that will be carried forward under the Act are as follows:
| | | | |
| | | Loss carryforward character |
| | | Short-term | | Long-term |
| | $323,375 | | $613 |
46
6. Capital Shares
Transactions in capital shares were as follows:
| | | | | | | | |
| | | Year ended | |
| | | 7/31/14 | | | 7/31/13 | |
Shares sold: | | | | | | | | |
Class A | | | 65,472 | | | | 172,416 | |
Class C | | | 16,394 | | | | 68,139 | |
Class R | | | 9 | | | | — | |
Institutional Class | | | 184,821 | | | | 717,255 | |
| | |
Shares issued upon reinvestment of dividends and distributions: | | | | | | | | |
Class A | | | 5,676 | | | | 14,294 | |
Class C | | | 741 | | | | 4,457 | |
Class R | | | 5 | | | | 10 | |
Institutional Class | | | 31,505 | | | | 98,630 | |
| | | | | | | | |
| | | 304,623 | | | | 1,075,201 | |
| | | | | | | | |
| | |
Shares redeemed: | | | | | | | | |
Class A | | | (123,019 | ) | | | (163,339 | ) |
Class C | | | (26,270 | ) | | | (136,919 | ) |
Class R | | | (9 | ) | | | — | |
Institutional Class | | | (420,966 | ) | | | (1,681,006 | ) |
| | | | | | | | |
| | | (570,264 | ) | | | (1,981,264 | ) |
| | | | | | | | |
Net decrease | | | (265,641 | ) | | | (906,063 | ) |
| | | | | | | | |
7. Line of Credit
The Fund, along with certain other funds in the Delaware Investments® Family of Funds (Participants), was a participant in a $125,000,000 revolving line of credit to be used for temporary or emergency purposes as an additional source of liquidity to fund redemptions of investor shares. Under the agreement, the Participants were charged an annual commitment fee of 0.08%, which was allocated across the Participants on the basis of each Participant’s allocation of the entire facility. The Participants were permitted to borrow up to a maximum of one third of their net assets under the agreement. Each Participant was individually, and not jointly, liable for its particular advances, if any, under the line of credit. The line of credit under the agreement expired on Nov. 12, 2013.
On Nov. 12, 2013, the Fund, along with the other Participants, entered into an amendment to the agreement for a $225,000,000 revolving line of credit. The line of credit is to be used as described above and operates in substantially the same manner as the original agreement. The line of credit available under the agreement will expire on Nov. 10, 2014.
The Fund had no amounts outstanding as of July 31, 2014, or at any time during the year then ended.
47
Notes to financial statements
Delaware Core Bond Fund
8. Derivatives
U.S. GAAP requires disclosures that enable investors to understand: (1) how and why an entity uses derivatives; (2) how they are accounted for; and (3) how they affect an entity’s results of operations and financial position.
Futures Contracts — A futures contract is an agreement in which the writer (or seller) of the contract agrees to deliver to the buyer an amount of cash or securities equal to a specific dollar amount times the difference between the value of a specific security or index at the close of the last trading day of the contract and the price at which the agreement is made. The Fund may use futures in the normal course of pursuing its investment objective. The Fund may invest in futures contracts during the period to hedge its existing portfolio securities against fluctuations in value caused by changes in interest rates or market conditions. Upon entering into a futures contract, the Fund deposits cash or pledges U.S. government securities to a broker, equal to the minimum “initial margin” requirements of the exchange on which the contract is traded. Subsequent payments are received from the broker or paid to the broker each day, based on the daily fluctuation in the market value of the contract. These receipts or payments are known as “variation margin” and are recorded daily by the Fund as unrealized gains or losses until the contracts are closed. When the contracts are closed, the Fund records a realized gain or loss equal to the difference between the value of the contract at the time it was opened and the value at the time it was closed. Risks of entering into futures contracts include potential imperfect correlation between the futures contracts and the underlying securities and the possibility of an illiquid secondary market for these instruments. When investing in futures, there is reduced counterparty credit risk to the Fund because futures are exchange-traded and the exchange’s clearinghouse, as counterparty to all exchange-traded futures, guarantees against default.
During the year ended July 31, 2014, the Fund used futures contracts to hedge the Fund’s existing portfolio securities against fluctuations in value caused by changes in interest rates or market conditions.
During the year ended July 31, 2014 the Fund held futures contracts which are reflected on the “Statement of operations” under “Net realized gain (loss) on futures contracts.”
Derivatives Generally. The table below summarizes the average balance of derivative holdings by the Fund during the year ended July 31, 2014.
| | | | | | | | | | | | |
| | | Long Derivative
Volume | | | | Short Derivative
Volume | |
Futures contracts (average notional value) | | USD | | — | | | USD | | | | 632,048 | |
9. Offsetting
In December 2011, the Financial Accounting Standards Board (FASB) issued guidance that expands current disclosure requirements on the offsetting of certain assets and liabilities. The new disclosures are required for investments and derivative financial instruments subject to master netting or similar agreements which are eligible for offset in the “Statement of assets and liabilities” and require an entity to disclose both gross and net information about such investments and transactions in the financial statements. In January 2013, the FASB issued guidance that clarifies which investments and transactions are subject to the offsetting disclosure requirements. The scope of the disclosure requirements for offsetting is limited to derivative instruments, repurchase agreements and reverse
48
repurchase agreements, and securities borrowing. The guidance is effective for financial statements with fiscal years beginning on or after Jan. 1, 2013, and interim periods within those fiscal years. The Fund adopted the disclosure provisions on offsetting during the current reporting period.
In order to better define its contractual rights and to secure rights that will help the Fund mitigate its counterparty risk, the Fund entered into an International Swaps and Derivatives Association, Inc. Master Agreement (ISDA Master Agreement) or similar agreement with each of its derivative contract counterparties. An ISDA Master Agreement is a bilateral agreement between the Fund and a counterparty that governs over-the-counter (OTC) derivatives and foreign exchange contracts and typically contains, among other things, collateral posting items and netting provisions in the event of a default and/or termination event. Under an ISDA Master Agreement, the Fund may, under certain circumstances, offset with the counterparty certain derivative financial instrument’s payables and/or receivables with collateral held and/or posted and create one single net payment. The provisions of the ISDA Master Agreement typically permit a single net payment in the event of default (close-out) netting including the bankruptcy or insolvency of the counterparty. However, bankruptcy or insolvency laws of a particular jurisdiction may impose restrictions on or prohibitions against the right of offset in bankruptcy, insolvency or other events.
For financial reporting purposes, the Fund does not offset derivative assets and liabilities that are subject to netting arrangements in the “Statement of assets and liabilities.”
At July 31, 2014, the Fund had the following assets subject to offsetting provisions:
Offsetting of Financial Assets and Liabilities and Derivative Assets and Liabilities
| | | | | | | | | | | | | | | | | | | | |
| | | | | Fair Value of | | | | |
| | | Repurchase | | Non-Cash | | Cash Collateral | | |
Counterparty | | Agreements | | Collateral Received | | Received | | Net Amount(a) |
Bank of America Merrill Lynch | | | $ | 261,850 | | | | | $(261,850 | ) | | | $ | — | | | | $ | — | |
Bank of Montreal | | | | 87,283 | | | | | (87,283 | ) | | | | — | | | | | — | |
BNP Paribas | | | | 489,867 | | | | | (489,867 | ) | | | | — | | | | | — | |
| | | | | | | | | | | | | | | | | | | | |
Total | | | $ | 839,000 | | | | | $(839,000 | ) | | | $ | — | | | | $ | — | |
| | | | | | | | | | | | | | | | | | | | |
(a)Net amount represents the receivable/(payable) that would be due from/(to) the counterparty in an event of default.
10. Securities Lending
The Fund, along with other funds in the Delaware Investments® Family of Funds, may lend its securities pursuant to a security lending agreement (Lending Agreement) with The Bank of New York Mellon (BNY Mellon). At the time a security is loaned, the borrower must post collateral equal to the required percentage of the market value of the loaned security, including any accrued interest. The required percentage is: (1) 102% with respect to U.S. securities and foreign securities that are denominated and payable in U.S. dollars; and (2) 105% with respect to foreign securities. With respect to each loan, if on any business day the aggregate market value of securities collateral plus cash collateral held is less than
49
Notes to financial statements
Delaware Core Bond Fund
10. Securities Lending (continued)
the aggregate market value of the securities which are the subject of such loan, the borrower will be notified to provide additional collateral by the end of the following business day which, together with the collateral already held, will be not less than the applicable initial collateral requirements for such security loan. If the aggregate market value of securities collateral and cash collateral held with respect to a security loan exceeds the applicable initial collateral requirement, upon request of the borrower, BNY Mellon must return enough collateral to the borrower by the end of the following business day to reduce the value of the remaining collateral to the applicable initial collateral requirement for such security loan. As a result of the foregoing, the value of the collateral held with respect to a loaned security on any particular day may be more or less than the value of the security on loan.
Cash collateral received is generally invested in the Delaware Investments® Collateral Fund No. 1 (Collective Trust) established by BNY Mellon for the purpose of investment on behalf of funds managed by DMC that participate in BNY Mellon’s securities lending program. The Collective Trust may invest in U.S. government securities and high-quality corporate debt, asset-backed and other money market securities, and in repurchase agreements collateralized by such securities, provided that the Collective Trust will generally have a dollar-weighted average portfolio maturity of 60 days or less. The Fund can also accept U.S. government securities and letters of credit (non-cash collateral) in connection with securities loans. In the event of default or bankruptcy by the lending agent, realization and/or retention of the collateral may be subject to legal proceedings. In the event the borrower fails to return the loaned securities and the collateral received is insufficient to cover the value of the loaned securities and provided such collateral shortfall is not the result of investment losses, the lending agent has agreed to pay the amount of the shortfall to the Fund or, at the discretion of the lending agent, replace the loaned securities. The Fund continues to record dividends or interest, as applicable, on the securities loaned and is subject to changes in value of the securities loaned that may occur during the term of the loan. The Fund has the right under the Lending Agreement to recover the securities from the borrower on demand. With respect to security loans collateralized by non-cash collateral, the Fund receives loan premiums paid by the borrower. With respect to security loans collateralized by cash collateral, the earnings from the collateral investments are shared among the Fund, the security lending agent and the borrower. The Fund records security lending income net of allocations to the security lending agent and the borrower.
The Collective Trust used for the investment of cash collateral received from borrowers of securities seeks to maintain a net asset value per unit of $1.00, but there can be no assurance that it will always be able to do so. The Fund may incur investment losses as a result of investing securities lending collateral in the Collective Trust. This could occur if an investment in the Collective Trust defaulted or if it were necessary to liquidate assets in the Collective Trust to meet returns on outstanding security loans at a time when the Collective Trust’s net asset value per unit was less than $1.00. Under those circumstances, the Fund may not receive an amount from the Collective Trust that is equal in amount to the collateral the Fund would be required to return to the borrower of the securities and the Fund would be required to make up for this shortfall.
At July 31, 2014, the Fund had no securities out on loan.
50
11. Credit and Market Risk
The Fund invests in fixed income securities whose value is derived from an underlying pool of mortgages or consumer loans. The value of these securities is sensitive to changes in economic conditions, including delinquencies and/or defaults, and may be adversely affected by shifts in the market’s perception of the issuers and changes in interest rates. Investors receive principal and interest payments as the underlying mortgages and consumer loans are paid back. Some of these securities are collateralized mortgage obligations (CMOs). CMOs are debt securities issued by U.S. government agencies or by financial institutions and other mortgage lenders, which are collateralized by a pool of mortgages held under an indenture. Prepayment of mortgages may shorten the stated maturity of the obligations and can result in a loss of premium, if any has been paid. Certain of these securities may be stripped (securities which provide only the principal or interest feature of the underlying security). The yield to maturity on an interest-only CMO is extremely sensitive not only to changes in prevailing interest rates, but also to the rate of principal payments (including prepayments) on the related underlying mortgage assets. A rapid rate of principal payments may have a material adverse affect on the Fund’s yield to maturity. If the underlying mortgage assets experience greater than anticipated prepayments of principal, the Fund may fail to fully recoup its initial investment in these securities even if the securities are rated in the highest rating categories.
The Fund invests a portion of its assets in high yield, fixed income securities, which are securities rated lower than BBB- by Standard & Poor’s and lower than Baa3 by Moody’s Investors Service Inc., or similarly rated by another nationally recognized statistical rating organization. Investments in these higher yielding securities are generally accompanied by a greater degree of credit risk than higher rated securities. Additionally, lower rated securities maybe more susceptible to adverse economic and competitive industry conditions than investment grade securities.
The Fund invests in certain obligations that may have liquidity protection designed to ensure that the receipt of payments due on the underlying security is timely. Such protection may be provided through guarantees, insurance policies, or letters of credit obtained by the issuer or sponsor through third parties, through various means of structuring the transaction, or through a combination of such approaches. The Fund will not pay additional fees for such credit support, although the existence of credit support may increase the price of a security.
The Fund may invest up to 15% of its net assets in illiquid securities, which may include securities with contractual restrictions on resale, securities exempt from registration under Rule 144A of the Securities Act of 1933, as amended, and other securities which may not be readily marketable. The relative illiquidity of these securities may impair the Fund from disposing of them in a timely manner and at a fair price when it is necessary or desirable to do so. While maintaining oversight, the Fund’s Board has delegated to DMC, the day-to-day functions of determining whether individual securities are illiquid for purposes of the Fund’s limitation on investments in illiquid securities. Securities eligible for resale pursuant to Rule 144A, which are determined to be liquid, are not subject to the Fund’s 15% limit on investments in illiquid securities. As of July 31, 2014, no securities held by the Fund have been determined to be illiquid under the Fund’s Liquidity Procedures. Rule 144A securities have been identified on the “Schedule of investments.”
51
Notes to financial statements
Delaware Core Bond Fund
12. Contractual Obligations
The Fund enters into contracts in the normal course of business that contain a variety of indemnifications. The Fund’s maximum exposure under these arrangements is unknown. However, the Fund has not had prior claims or losses pursuant to these contracts. Management has reviewed the Fund’s existing contracts and expects the risk of loss to be remote.
13. Recent Accounting Pronouncements
In June 2014, the Financial Accounting Standards Board issued guidance to improve the financial reporting of reverse repurchase agreements and other similar transactions. The guidance includes expanded disclosure requirements for entities that enter into reverse repurchase agreements and similar transactions accounted for as secured borrowings. The guidance is effective for financial statements with fiscal years beginning on or after Dec. 15, 2014 and interim periods within those fiscal years. Management is evaluating the impact, if any, of this guidance on the Fund’s financial statement disclosures.
14. Subsequent Events
On Aug. 20, 2014, the Board of Trustees of Delaware Group Income Funds unanimously voted and approved a proposal to liquidate the Fund. Please read the prospectus, summary prospectus, and related supplements dated Aug. 21, 2014 for more information concerning this event.
Management has determined that no other material events or transactions occurred subsequent to July 31, 2014 that would require recognition or disclosure in the Fund’s financial statements.
52
Report of independent
registered public accounting firm
To the Board of Trustees of Delaware Group® Income Funds
and the Shareholders of Delaware Core Bond Fund:
In our opinion, the accompanying statement of assets and liabilities, including the schedule of investments, and the related statements of operations and of changes in net assets and the financial highlights present fairly, in all material respects, the financial position of Delaware Core Bond Fund (one of the series constituting Delaware Group® Income Funds, hereinafter referred to as the “Fund”) at July 31, 2014, the results of its operations for the year then ended, the changes in its net assets for each of the two years in the period then ended and the financial highlights for each of the four years in the period then ended and for the period November 1, 2009 through July 31, 2010, in conformity with accounting principles generally accepted in the United States of America. These financial statements and financial highlights (hereafter referred to as “financial statements”) are the responsibility of the Fund’s management. Our responsibility is to express an opinion on these financial statements based on our audit. We conducted our audit of these financial statements in accordance with the standards of the Public Company Accounting Oversight Board (United States). Those standards require that we plan and perform the audit to obtain reasonable assurance about whether the financial statements are free of material misstatement. An audit includes examining, on a test basis, evidence supporting the amounts and disclosures in the financial statements, assessing the accounting principles used and significant estimates made by management, and evaluating the overall financial statement presentation. We believe that our audit, which included confirmation of securities at July 31, 2014 by correspondence with the custodian and brokers, and the application of alternative auditing procedures where confirmations of security purchases had not been received, provides a reasonable basis for our opinion. The financial highlights for the period ended October 31, 2009 were audited by other independent accountants whose report dated December 22, 2009 expressed an unqualified opinion on those statements.
PricewaterhouseCoopers LLP
Philadelphia, Pennsylvania
September 19, 2014
53
Other Fund information (Unaudited)
Delaware Core Bond Fund
Tax Information
The information set forth below is for the Fund’s fiscal year as required by federal income tax laws. Shareholders, however, must report distributions on a calendar year basis for income tax purposes, which may include distributions for portions of two fiscal years of a fund. Accordingly, the information needed by shareholders for income tax purposes will be sent to them in January of each year. Please consult your tax advisor for proper treatment of this information.
All disclosures are based on financial information available as of the date of this annual report and, accordingly are subject to change. For any and all items requiring reporting, it is the intention of the Fund to report the maximum amount permitted under the Internal Revenue Code and the regulations thereunder.
For the fiscal year ended July 31, 2014, the Fund reports distributions paid during the year as follows:
| | | | |
(A) Ordinary Income Distribution (Tax Basis)* | | | 86.31% | |
(B) Return of Capital (Tax Basis) | | | 13.69% | |
Total Distributions (Tax Basis) | | | 100% | |
(C) Qualifying dividends1 | | | 0.64% | |
(A) and (B) are based on a percentage of the Fund’s total distributions.
(C) is based on a percentage of the Fund’s ordinary income distributions
1 Qualifying dividends represent dividends which qualify for the corporate dividends received deduction.
*For the fiscal year ended July 31, 2014, certain dividends paid by the Fund may be subject to a maximum tax rate of 15%, as provided for by the Jobs and Growth Tax Relief Reconciliation Act of 2003, as extended by the Tax Relief, Unemployment Insurance Reauthorization and Jobs Creation Act of 2010, and made permanent by the American Taxpayer Relief Act of 2012. The Fund intends to report up to a maximum of 0.64% to be taxed at a maximum rate of 15%. Complete information will be computed and reported in conjunction with your 2014 Form 1099-DIV.
54
This page intentionally left blank.
Board of trustees / directors and officers addendum
Delaware Investments® Family of Funds
A mutual fund is governed by a Board of Trustees / Directors (“Trustees”), which has oversight responsibility for the management of a fund’s business affairs. Trustees establish procedures and oversee and review the performance of the investment manager, the distributor, and others who perform services for the fund. The independent fund trustees, in particular, are advocates
| | | | |
Name, Address, and Birth Date | | Position(s) Held with Fund(s) | | Length of Time Served |
| Interested Trustees | | | | |
| | |
Patrick P. Coyne1 2005 Market Street Philadelphia, PA 19103 April 1963 | | Chairman, President, Chief Executive Officer, and Trustee | | Chairman and Trustee since August 16, 2006 President and Chief Executive Officer since August 1, 2006 |
| Independent Trustees | | | | |
Thomas L. Bennett 2005 Market Street Philadelphia, PA 19103 October 1947 | | Trustee | | Since March 2005 |
Joseph W. Chow 2005 Market Street Philadelphia, PA 19103 January 1953 | | Trustee | | Since January 2013 |
John A. Fry 2005 Market Street Philadelphia, PA 19103 May 1960 | | Trustee | | Since January 2001 |
| 1 | Patrick P. Coyne is considered to be an “Interested Trustee“ because he is an executive officer of the Fund’s(s’) investment advisor. |
56
for shareholder interests. Each trustee has served in that capacity since he or she was elected to or appointed to the Board of Trustees, and will continue to serve until his or her retirement or the election of a new trustee in his or her place. The following is a list of the Trustees and Officers with certain background and related information.
| | | | |
| | |
Principal Occupation(s) During Past 5 Years | | Number of Portfolios in Fund Complex Overseen by Trustee or Officer | | Other Directorships Held by Trustee or Officer |
| | | | | |
| | |
Patrick P. Coyne has served in various executive capacities at different times at Delaware Investments.2 | | 70 | | Board of Governors Member Investment Company Institute (ICI) Director and Audit Committee Member Kaydon Corp. (2007–2013) |
| | | | | |
Private Investor (March 2004–Present) | | 70 | | Director Bryn Mawr Bank Corp. (BMTC) (2007–2011) |
Executive Vice President (Emerging Economies Strategies, Risk and Corporate Administration) State Street Corporation (July 2004–March 2011) | | 70 | | Director and Audit Committee Member — Hercules Technology Growth Capital, Inc. |
| | |
President Drexel University (August 2010–Present) | | 70 | | Director — Hershey Trust Director and Audit Committee Member Community Health Systems |
President Franklin & Marshall College (July 2002–July 2010) | | | |
| 2 | Delaware Investments is the marketing name for Delaware Management Holdings, Inc. and its subsidiaries, including the Fund’s(s’) investment advisor, principal underwriter, and its transfer agent. |
57
Board of trustees / directors and officers addendum
Delaware Investments® Family of Funds
| | | | |
Name, Address, and Birth Date | | Position(s) Held with Fund(s) | | Length of Time Served |
| Independent Trustees (continued) | | | | |
Lucinda S. Landreth 2005 Market Street Philadelphia, PA 19103 June 1947 | | Trustee | | Since March 2005 |
Frances A. Sevilla-Sacasa 2005 Market Street Philadelphia, PA 19103 January 1956 | | Trustee | | Since September 2011 |
Thomas K. Whitford 2005 Market Street Philadelphia, PA 19103 March 1956 | | Trustee | | Since January 2013 |
58
| | | | |
Principal Occupation(s) During Past 5 Years | | Number of Portfolios in Fund Complex Overseen by Trustee or Officer | | Other Directorships Held by Trustee or Officer |
| | | | | |
Private Investor (2004–Present) | | 70 | | None |
Chief Executive Officer — Banco Itaú International (April 2012–Present) | | 70 | | Trust Manager and Audit Committee Member — Camden Property Trust |
Executive Advisor to Dean (August 2011–March 2012) and Interim Dean (January 2011–July 2011) — University of Miami School of Business Administration | | | | |
President — U.S. Trust, Bank of America Private Wealth Management (Private Banking) (July 2007–December 2008) | | | | |
Vice Chairman (2010–April 2013) Chief Administrative Officer (2008–2010) and Executive Vice President and Chief Administrative Officer (2007–2009) — PNC Financial Services Group | | 70 | | Director — HSBC Finance
Corporation and HSBC
North America Holdings Inc. |
59
Board of trustees / directors and officers addendum
Delaware Investments® Family of Funds
| | | | |
Name, Address, and Birth Date | | Position(s) Held with Fund(s) | | Length of Time Served |
| Independent Trustees (continued) | | | | |
Janet L. Yeomans
2005 Market Street
Philadelphia, PA 19103
July 1948 | | Trustee | | Since April 1999 |
J. Richard Zecher 2005 Market Street Philadelphia, PA 19103 July 1940 | | Trustee | | Since March 2005 |
60
| | | | |
Principal Occupation(s) During Past 5 Years | | Number of Portfolios in Fund Complex Overseen by Trustee or Officer | | Other Directorships Held by Trustee or Officer |
| | | | | |
Vice President and Treasurer (January 2006–July 2012) Vice President — Mergers & Acquisitions (January 2003–January 2006), and Vice President and Treasurer (July 1995–January 2003) 3M Corporation | | 70 | | Director, Audit Committee Chair, Investment Committee Member, and Governance Committee Member Okabena Company Chair — 3M Investment Management Company (2005–2012) |
Founder Investor Analytics (Risk Management) (May 1999–Present) | | 70 | | Director and Compensation Committee Member Investor Analytics |
Founder P/E Investments (Hedge Fund) (September 1996–Present) | | | | Director — P/E Investments |
61
Board of trustees / directors and officers addendum
Delaware Investments® Family of Funds
| | | | |
Name, Address, and Birth Date | | Position(s) Held with Fund(s) | | Length of Time Served |
| Officers | | | | |
David F. Connor 2005 Market Street Philadelphia, PA 19103 December 1963 | | Senior Vice President, Deputy General Counsel, and Secretary | | Senior Vice President, Deputy General Counsel since May 2013; Vice President, Deputy General Counsel September 2000 – May 2013; Secretary since October 2005 |
Daniel V. Geatens 2005 Market Street Philadelphia, PA 19103 October 1972 | | Vice President and Treasurer | | Treasurer since October 2007 |
David P. O’Connor 2005 Market Street Philadelphia, PA 19103 February 1966 | | Executive Vice President, General Counsel and Chief Legal Officer | | Executive Vice President since February 2012; Senior Vice President October 2005 – February 2012; General Counsel and Chief Legal Officer since October 2005 |
Richard Salus 2005 Market Street Philadelphia, PA 19103 October 1963 | | Senior Vice President and Chief Financial Officer | | Chief Financial Officer since November 2006 |
The Statement of Additional Information for the Fund(s) includes additional information about the Trustees and Officers and is available, without charge, upon request by calling 800 523-1918.
62
| | | | |
Principal Occupation(s) During Past 5 Years | | Number of Portfolios in Fund Complex Overseen by Trustee or Officer | | Other Directorships Held by Trustee or Officer |
| | | | | |
David F. Connor has served as Deputy General Counsel of Delaware Investments since 2000. | | 70 | | None3 |
Daniel V. Geatens has served in various capacities at different times at Delaware Investments. | | 70 | | None3 |
David P. O’Connor has served in various executive and legal capacities at different times at Delaware Investments. | | 70 | | None3 |
Richard Salus has served in various executive capacities at different times at Delaware Investments. | | 70 | | None3 |
| 3 | David F. Connor, Daniel V. Geatens, David P. O’Connor, and Richard Salus serve in similar capacities for the six portfolios of the Optimum Fund Trust, which have the same investment advisor, principal underwriter, and transfer agent as the registrant. |
63
About the organization
| | | | | | |
| Board of trustees | | | | | | |
| Patrick P. Coyne | | Joseph W. Chow | | Lucinda S. Landreth | | Thomas K. Whitford |
| Chairman, President, and | | Former Executive Vice | | Former Chief Investment | | Former Vice Chairman |
| Chief Executive Officer | | President | | Officer | | PNC Financial Services Group |
| Delaware Investments® | | State Street Corporation | | Assurant, Inc. | | Pittsburgh, PA |
| Family of Funds | | Brookline, MA | | Philadelphia, PA | | |
| Philadelphia, PA | | | | | | Janet L. Yeomans |
| | John A. Fry | | Frances A. | | Former Vice President |
| Thomas L. Bennett | | President | | Sevilla-Sacasa | | and Treasurer |
| Private Investor | | Drexel University | | Chief Executive Officer | | 3M Corporation |
| Rosemont, PA | | Philadelphia, PA | | Banco Itaú | | St. Paul, MN |
| | | | International | | |
| | | | Miami, FL | | J. Richard Zecher |
| | | | | | Founder |
| | | | | | Investor Analytics |
| | | | | | Scottsdale, AZ |
Affiliated officers | | | | | | |
| David F. Connor | | Daniel V. Geatens | | David P. O’Connor | | Richard Salus |
| Senior Vice President, | | Vice President and | | Executive Vice President, | | Senior Vice President and |
| Deputy General Counsel, | | Treasurer | | General Counsel, | | Chief Financial Officer |
| and Secretary | | Delaware Investments | | and Chief Legal Officer | | Delaware Investments |
| Delaware Investments | | Family of Funds | | Delaware Investments | | Family of Funds |
| Family of Funds | | Philadelphia, PA | | Family of Funds | | Philadelphia, PA |
| Philadelphia, PA | | | | Philadelphia, PA | | |
This annual report is for the information of Delaware Core Bond Fund shareholders, but it may be used with prospective investors when preceded or accompanied by the Delaware Investments Fund fact sheet for the most recently completed calendar quarter. These documents are available at delawareinvestments.com.
Delaware Investments is the marketing name of Delaware Management Holdings, Inc. and its subsidiaries.
The Fund files its complete schedule of portfolio holdings with the Securities and Exchange Commission (SEC) for the first and third quarters of each fiscal year on Form N-Q. The Fund’s Forms N-Q, as well as a description of the policies and procedures that the Fund uses to determine how to vote proxies (if any) relating to portfolio securities are available without charge (i) upon request, by calling 800 523-1918; and (ii) on the SEC’s website at sec.gov. In addition, a description of the policies and procedures that the Fund uses to determine how to vote proxies (if any) relating to portfolio securities and the Fund’s Schedule of Investments are available without charge on the Fund’s website at delawareinvestments.com. The Fund’s Forms N-Q may be reviewed and copied at the SEC’s Public Reference Room in Washington, D.C.; information on the operation of the Public Reference Room may be obtained by calling 800 SEC-0330.
Information (if any) regarding how the Fund voted proxies relating to portfolio securities during the most recently disclosed 12-month period ended June 30 is available without charge (i) through the Fund’s website at delawareinvestments.com; and (ii) on the SEC’s website at sec.gov.
64
Annual report
Fixed income mutual fund
Delaware Diversified Floating Rate Fund
July 31, 2014
Carefully consider the Fund’s investment objectives, risk factors, charges, and expenses before investing. This and other information can be found in the Fund’s prospectus and its summary prospectus, which may be obtained by visiting delawareinvestments.com or calling 800 523-1918. Investors should read the prospectus and the summary prospectus carefully before investing.
You can obtain shareholder reports and prospectuses online instead of in the mail.
Visit delawareinvestments.com/edelivery.
Experience Delaware Investments
Delaware Investments is committed to the pursuit of consistently superior asset management and unparalleled client service. We believe in our investment processes, which seek to deliver consistent results, and in convenient services that help add value for our clients.
If you are interested in learning more about creating an investment plan, contact your financial advisor.
You can learn more about Delaware Investments or obtain a prospectus for Delaware Diversified Floating Rate Fund at delawareinvestments.com.
Manage your investments online
| — | | 24-hour access to your account information |
| — | | Check your account balance and recent transactions |
| — | | Request statements or literature |
| — | | Make purchases and redemptions |
Delaware Management Holdings, Inc. and its subsidiaries (collectively known by the marketing name of Delaware Investments) are wholly owned subsidiaries of Macquarie Group Limited, a global provider of banking, financial, advisory, investment and funds management services.
Investments in Delaware Diversified Floating Rate Fund are not and will not be deposits with or liabilities of Macquarie Bank Limited ABN 46 008 583 542 and its holding companies, including their subsidiaries or related companies (Macquarie Group), and are subject to investment risk, including possible delays in repayment and loss of income and capital invested. No Macquarie Group company guarantees or will guarantee the performance of the Fund, the repayment of capital from the Fund, or any particular rate of return.
Unless otherwise noted, views expressed herein are current as of July 31, 2014, and subject to change.
Funds are not FDIC insured and are not guaranteed. It is possible to lose the principal amount invested.
Mutual fund advisory services provided by Delaware Management Company, a series of Delaware Management Business Trust, which is a registered investment advisor. Delaware Investments, a member of Macquarie Group, refers to Delaware Management Holdings, Inc. and its subsidiaries, including the Fund’s distributor, Delaware Distributors, L.P. Macquarie Group refers to Macquarie Group Limited and its subsidiaries and affiliates worldwide.
© 2014 Delaware Management Holdings, Inc.
All third-party marks cited are the property of their respective owners.
| | |
| Portfolio management review | | |
| |
Delaware Diversified Floating Rate Fund | | August 12, 2014 |
| | | | | | |
Performance preview (for the year ended July 31, 2014) | | | | | | |
Delaware Diversified Floating Rate Fund (Class A shares) | | 1-year return | | | +2.40% | |
BofA Merrill Lynch U.S. Dollar 3-Month LIBOR Constant | | | | | | |
Maturity Index (benchmark) | | 1-year return | | | +0.25% | |
Past performance does not guarantee future results.
For complete, annualized performance for Delaware Diversified Floating Rate Fund, please see the table on page 4. The performance of Class A shares excludes the applicable sales charge and reflects the reinvestment of all distributions. Index performance returns do not reflect any management fees, transaction costs, or expenses. Indices are unmanaged and one cannot invest directly in an index.
Volatile environment favored riskier assets
The Fund’s fiscal year began with a high level of market volatility after investors responded with surprise and unease to the U.S. Federal Reserve’s June 2013 statement that it could begin tapering asset purchases that fall. The market’s “taper tantrum” affected all fixed income investments. Risk premiums rose broadly and rising interest rates led to an increase in the selling of fixed-rate bonds, whose rates were viewed by many as less attractive.
Once the Fed’s actual steady and well-telegraphed asset purchase tapering began in January, however, the market calmed down and largely took it in stride. Overall, during the Fund’s fiscal year, lower-quality assets generated the highest absolute returns, as investors appeared to seek higher yields.
Within the Fund
For the fiscal year ended July 31, 2014, Delaware Diversified Floating Rate Fund (Class A shares) returned +2.40% at net asset value and -0.38% at maximum offer price (both returns reflect all distributions reinvested). During the same period, the BofA Merrill Lynch U.S. Dollar 3-Month LIBOR Constant Maturity Index returned +0.25%. For complete, annualized performance of Delaware Diversified Floating Rate Fund, please see the table on page 4.
During the fiscal year, we maintained the Fund’s strategic asset allocation largely intact, with
modest adjustments rather than any large shifts. Generally, lower-quality assets added the most to the Fund’s performance:
| — | | Bank loans were the largest contributor to the Fund’s strong relative performance, as many investors were attracted to the higher yields of these riskier assets. Although bank loans made up slightly less than one-third of the Fund’s assets, they accounted for nearly half of its total returns. |
| — | | Though high yield corporate bonds made up a modest allocation within the Fund, they added to performance, earning double-digit absolute returns. They highlighted the effect of the down-in-quality market environment, in which lower-quality securities outperformed the rest of the market. |
| — | | Emerging market bonds performed well as the fiscal year progressed, recovering from their sharp selloff of 2013. The higher-beta (a measure of risk in comparison to the market), lower-quality issues were among the strongest performers. As with high yield, emerging market debt contributed quite decently to Fund performance, considering the Fund’s very small allocation (4% of the portfolio). |
| — | | Investment grade corporate credit, which made up roughly half of the Fund’s portfolio, easily outpaced the Fund’s Libor-based* benchmark, but generated more-modest returns than those of riskier assets. The strongest-performing |
1
Portfolio management review
Delaware Diversified Floating Rate Fund
| | | sectors within investment grade credit were financials and industrials. Financials performed best in absolute terms, but the Fund had a much higher exposure to industrials (approximately 30% of the portfolio). |
| — | | Higher-quality structured products, including asset-backed securities, underperformed for the Fund’s fiscal year. We view these securities as playing an important strategic role, providing diversification to the Fund’s portfolio. Of course, we should note that diversification does not guarantee against losses. |
A focus on managing risk
We believe the fixed income market has featured favorable conditions for managing a floating-rate strategy. The past few years have been a period in which a “rising tide lifted all boats.” As of the Fund’s fiscal year end, we believe investors could face more idiosyncratic risk, which if accurate, could make credit selection very important. For now, managing credit risk is a key focus. Spreads are relatively tight across the board in corporate investment grade and high yield credit. Because of this, we wouldn’t have much yield cushion to offset any potential price deterioration in underlying assets.
Still, we are focused less on corporate fundamentals than market technicals, which have been supportive as a result of accommodative monetary policy and high levels of liquidity. Despite the importance of corporate fundamentals, during the fiscal year market technicals have been supportive as a result of accommodative monetary policy and high levels of liquidity.
Managing the structural risk of the Fund’s underlying investments is another concern. Bank loans, which make up about one-third of the Fund, are generally callable at any time, and in many cases they have been trading close to or above par. There is a fair amount of call risk associated with this asset class, however. Most if not all of
the bank loans in the Fund’s portfolio have Libor floors that won’t reset until Libor rises by about 0.75 percentage points. This lag could be costly in a rising rate environment. That said, the strategy’s flexibility would allow us to attempt to mitigate this risk by diversifying out of bank loans if they were to become less favorable and reinvest in corporate investment grade floaters that would reset immediately.
By the end of the fiscal year, our biggest overall concern was the Fed’s anticipated exit from quantitative easing and the market volatility that could follow. A change in monetary policy, in general, could lead us to shift the Fund’s asset allocations.
Use of derivatives
For the fiscal year, the Fund employed three types of derivatives to help manage risks: credit hedges, interest rate swaps, and interest rate swap futures. Interest rate swaps were the largest hedge against risk used by the Fund to convert the interest payments from fixed-rate bond holdings into floating-rate payments. It’s important to note that we can’t utilize leverage as part of the Fund’s strategy.
In using interest rate swaps, we sought to select from a wider group of potential investment opportunities beyond traditional floating-rate markets. As of July 31, 2014, the Fund had 2% of its net assets allocated to credit hedges, 20% to interest rate swaps, and 3% to interest rate swap futures. No single type of derivative had a material effect on the Fund’s performance –– in other words, contributing more than 50 basis points to the Fund’s rate of return (one basis point equals one one-hundredth of a percentage point). However, in total, the use of derivatives did affect the Fund’s performance by more than 50 basis points.
The interest rate swaps negatively affected performance. However, it is important to highlight that the interest rate hedges represented the
2
majority of the performance and they are in place to swap fixed rate bonds to floating rate bonds. Therefore, they offsetted the price increases the fixed rate bonds experienced due to changing rates.
*The London interbank offered rate (Libor) is a composite of the rates of interest at which banks borrow from one another in the London market, and it is a widely used benchmark for short-term interest rates.
3
| | | | |
| Performance summary | | | | |
| |
Delaware Diversified Floating Rate Fund | | | July 31, 2014 | |
The performance data quoted represent past performance; past performance does not guarantee future results. Investment return and principal value will fluctuate so your shares, when redeemed, may be worth more or less than their original cost. Please obtain the performance data current for the most recent month end by calling 800 523-1918 or visiting our website at delawareinvestments.com/performance. Current performance may be lower or higher than the performance data quoted.
| | | | | | |
| Fund and benchmark performance1,2 | | Average annual total returns through July 31, 2014 |
| | | 1 year | | 3 years | | Lifetime |
Class A (Est. Feb. 26, 2010) | | | | | | |
Excluding sales charge | | +2.40% | | +2.42% | | +2.59% |
Including sales charge | | -0.38% | | +1.48% | | +1.94% |
Class C (Est. Feb. 26, 2010) | | | | | | |
Excluding sales charge | | +1.64% | | +1.65% | | +1.83% |
Including sales charge | | +0.64% | | +1.65% | | +1.83% |
Class R (Est. Feb. 26, 2010) | | | | | | |
Excluding sales charge | | +2.15% | | +2.15% | | +2.32% |
Including sales charge | | +2.15% | | +2.15% | | +2.32% |
Institutional Class (Est. Feb. 26, 2010) | | | | | | |
Excluding sales charge | | +2.66% | | +2.67% | | +2.85% |
Including sales charge | | +2.66% | | +2.67% | | +2.85% |
BofA Merrill Lynch U.S. Dollar 3-Month | | | | | | |
LIBOR Constant Maturity Index | | +0.25% | | +0.34% | | +0.34% |
1 Returns reflect the reinvestment of all distributions and are presented both with and without the applicable sales charges described below. Returns do not reflect the deduction of taxes the shareholder would pay on Fund distributions or redemptions of Fund shares.
Expense limitations were in effect for certain classes during some or all of the periods shown in the “Fund and benchmark performance” table. Expenses for each class are listed on the “Fund expense ratios” table on page 6. Performance would have been lower had expense limitations not been in effect.
Class A shares are sold with a maximum front-end sales charge of 2.75%, and have an annual distribution and service fee of 0.25% of average
daily net assets. Prior to Oct. 1, 2013, the Fund paid an annual distribution and service fee of 0.30% of average daily net assets. This fee was contractually limited to 0.25% of average daily net assets from Nov. 28, 2012 through Oct. 1, 2013. Performance for Class A shares, excluding sales charges, assumes that no front-end sales charge applied.
Class C shares are sold with a contingent deferred sales charge of 1.00% if redeemed during the first 12 months. They are also subject to an annual distribution and service fee of 1.00% of average daily net assets.
Performance for Class C shares, excluding sales charges, assumes either that contingent deferred
4
sales charges did not apply or that the investment was not redeemed.
Class R shares are available only for certain retirement plan products. They are sold without a sales charge and have an annual distribution and service fee of 0.50% of average daily net assets. Prior to Oct. 1, 2013, the Fund paid an annual distribution and service fee of 0.60% of average daily net assets. This fee was contractually limited to 0.50% of average daily net assets from Nov. 28, 2012 through Oct. 1, 2013.
Institutional Class shares are available without sales or asset-based distribution charges only to certain eligible institutional accounts.
The “Fund and benchmark performance” table and the “Performance of a $10,000 investment” graph on page 7 do not reflect the deduction of taxes the shareholder would pay on Fund distributions or redemptions of Fund shares.
Fixed income securities and bond funds can lose value, and investors can lose principal, as interest rates rise. They also may be affected by economic conditions that hinder an issuer’s ability to make interest and principal payments on its debt.
The Fund may also be subject to prepayment risk, the risk that the principal of a fixed income security that is held by the Fund may be prepaid prior to maturity, potentially forcing the Fund to reinvest that money at a lower interest rate.
High yielding, noninvestment grade bonds (junk bonds) involve higher risk than investment grade bonds. The high yield secondary market is particularly susceptible to liquidity problems when institutional investors, such as mutual funds and certain other financial institutions, temporarily stop buying bonds for regulatory, financial, or other reasons. In addition, a less liquid secondary
market makes it more difficult for the Fund to obtain precise valuations of the high yield securities in its portfolio.
International investments entail risks not ordinarily associated with U.S. investments including fluctuation in currency values, differences in accounting principles, or economic or political instability in other nations.
Investing in emerging markets can be riskier than investing in established foreign markets due to increased volatility and lower trading volume.
The Fund may invest in derivatives, which may involve additional expenses and are subject to risk, including the risk that an underlying security or securities index moves in the opposite direction from what the portfolio manager anticipated. A derivative transaction depends upon the counterparties’ ability to fulfill their contractual obligations.
Because the Fund may invest in bank loans and other direct indebtedness, it is subject to the risk that the Fund will not receive payment of principal, interest, and other amounts due in connection with these investments, which primarily depend on the financial condition of the borrower and the lending institution.
5
Performance summary
Delaware Diversified Floating Rate Fund
2 The Fund’s expense ratios, as described in the most recent prospectus, are disclosed in the following “Fund expense ratios” table. Delaware Management Company has agreed to reimburse certain expenses and/or waive certain fees in order to prevent total annual fund operating expenses (excluding any 12b-1 plan, taxes, interest, inverse floater program expenses, short sale and dividend interest expenses, brokerage fees, certain insurance costs, acquired fund fees and expenses, and nonroutine expenses or costs, including, but not limited to, those relating to reorganizations, litigation, conducting shareholder meetings, and liquidations (collectively, nonroutine expenses)) from exceeding 0.80% of the Fund’s average daily net assets from Aug. 1, 2013, through July 31, 2014.* Please see the most recent prospectus and any applicable supplement(s) for additional information on these fee waivers and/or reimbursements.
| | | | | | | | | | | | | | | | |
| Fund expense ratios | | Class A | | | Class C | | | Class R | | | Institutional
Class | |
| | | | |
Total annual operating expenses | | | 1.01% | | | | 1.76% | | | | 1.26% | | | | 0.76% | |
(without fee waivers) | | | | | | | | | | | | | | | | |
Net expenses | | | 1.01% | | | | 1.76% | | | | 1.26% | | | | 0.76% | |
(including fee waivers, if any) | | | | | | | | | | | | | | | | |
Type of waiver | | | Contractual | | | | Contractual | | | | Contractual | | | | Contractual | |
* This contractual waiver period is from Nov. 28, 2012, through Nov. 28, 2014.
6
Performance of a $10,000 investment1
Average annual total returns from Feb. 26, 2010 (Fund’s inception), through July 31, 2014
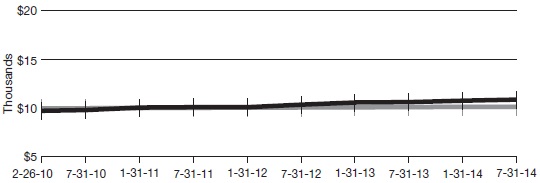
| | | | | | | | |
For period beginning Feb. 26, 2010, through July 31, 2014 | | Starting value | | | Ending value | |
 Delaware Diversified Floating Rate Fund — Delaware Diversified Floating Rate Fund —
| | | | | | | | |
Class A shares | | | $9,725 | | | | $10,889 | |
 BofA Merrill Lynch U.S. Dollar 3-Month BofA Merrill Lynch U.S. Dollar 3-Month
| | | | | | | | |
LIBOR Constant Maturity Index | | | $10,000 | | | | $10,151 | |
1 The “Performance of a $10,000 investment” graph assumes $10,000 invested in Class A shares of the Fund on Feb. 26, 2010, and includes the effect of a 2.75% front-end sales charge and the reinvestment of all distributions. The graph does not reflect the deduction of taxes the shareholders would pay on Fund distributions or redemptions of Fund shares. Expense limitations were in effect for some or all of the periods shown. Performance would have been lower had expense limitations not been in effect. Expenses are listed in the “Fund expense ratios” table on page 6. Please note additional details on pages 4 through 7.
The graph also assumes $10,000 invested in the BofA Merrill Lynch U.S. Dollar 3-Month LIBOR Constant Maturity Index as of Feb. 26, 2010. The
BofA Merrill Lynch U.S. Dollar 3-Month LIBOR Constant Maturity Index represents the London interbank offered rate (LIBOR) with a constant 3-month average maturity. LIBOR, published by the British Bankers’ Association, is a composite of the rates of interest at which banks borrow from one another in the London market, and it is a widely used benchmark for short-term interest rates.
Index performance returns do not reflect any management fees, transaction costs, or expenses. Indices are unmanaged and one cannot invest directly in an index. Past performance is not a guarantee of future results.
Performance of other Fund classes will vary due to different charges and expenses.
| | | | | | | | | | | | |
| | | Nasdaq symbols | | CUSIPs | | | | | | | | |
Class A | | DDFAX | | 245908660 | | | | | | | | |
Class C | | DDFCX | | 245908652 | | | | | | | | |
Class R | | DDFFX | | 245908645 | | | | | | | | |
Institutional Class | | DDFLX | | 245908637 | | | | | | | | |
7
Disclosure of Fund expenses
For the six-month period from February 1, 2014 to July 31, 2014 (Unaudited)
As a shareholder of the Fund, you incur two types of costs: (1) transaction costs, including sales charges (loads) on purchase payments, reinvested dividends, or other distributions; redemption fees; and exchange fees; and (2) ongoing costs, including management fees; distribution and/or service (12b-1) fees; and other Fund expenses. This example is intended to help you understand your ongoing costs (in dollars) of investing in the Fund and to compare these costs with the ongoing costs of investing in other mutual funds.
The example is based on an investment of $1,000 invested at the beginning of the period and held for the entire six-month period from Feb. 1, 2014 to July 31, 2014.
Actual expenses
The first section of the table shown, “Actual Fund return,” provides information about actual account values and actual expenses. You may use the information in this section of the table, together with the amount you invested, to estimate the expenses that you paid over the period. Simply divide your account value by $1,000 (for example, an $8,600 account value divided by $1,000 = 8.6), then multiply the result by the number in the first section under the heading entitled “Expenses Paid During Period” to estimate the expenses you paid on your account during this period.
Hypothetical example for comparison purposes
The second section of the table shown, “Hypothetical 5% return,” provides information about hypothetical account values and hypothetical expenses based on the Fund’s actual expense ratio and an assumed rate of return of 5% per year before expenses, which is not the Fund’s actual return. The hypothetical account values and expenses may not be used to estimate the actual ending account balance or expenses you paid for the period. You may use this information to compare the ongoing costs of investing in the Fund and other funds. To do so, compare this 5% hypothetical example with the 5% hypothetical examples that appear in the shareholder reports of the other funds.
Please note that the expenses shown in the table are meant to highlight your ongoing costs only and do not reflect any transactional costs, such as sales charges (loads), redemption fees, or exchange fees. Therefore, the second section of the table is useful in comparing ongoing costs only, and will not help you determine the relative total costs of owning different funds. In addition, if these transactional costs were included, your costs would have been higher. The Fund’s expenses shown in the table reflect fee waivers in effect. The expenses shown in the table assume reinvestment of all dividends and distributions.
8
Delaware Diversified Floating Rate Fund
Expense analysis of an investment of $1,000
| | | | | | | | |
| | | Beginning
Account Value
2/1/14 | | Ending
Account Value
7/31/14 | | Annualized
Expense Ratio | | Expenses
Paid During Period
2/1/14 to 7/31/14* |
| | | | |
Actual Fund return† | | | | | | | | |
Class A | | $1,000.00 | | $1,011.20 | | 0.96% | | $4.79 |
Class C | | 1,000.00 | | 1,008.60 | | 1.71% | | 8.52 |
Class R | | 1,000.00 | | 1,011.10 | | 1.21% | | 6.03 |
Institutional Class | | 1,000.00 | | 1,013.60 | | 0.71% | | 3.54 |
Hypothetical 5% return (5% return before expenses) | | | | | | | | |
Class A | | $1,000.00 | | $1,020.03 | | 0.96% | | $4.81 |
Class C | | 1,000.00 | | 1,016.31 | | 1.71% | | 8.55 |
Class R | | 1,000.00 | | 1,018.79 | | 1.21% | | 6.06 |
Institutional Class | | 1,000.00 | | 1,021.27 | | 0.71% | | 3.56 |
| * | “Expenses Paid During Period” are equal to the Fund’s annualized expense ratio, multiplied by the average account value over the period, multiplied by 181/365 (to reflect the one-half year period). |
| † | Because actual returns reflect only the most recent six-month period, the returns shown may differ significantly from fiscal year returns. |
9
| | |
| Security type / sector allocation | | |
Delaware Diversified Floating Rate Fund | | As of July 31, 2014 (Unaudited) |
Sector designations may be different than the sector designations presented in other Fund materials. The sector designations may represent the investment manager’s internal sector classifications, which may result in the sector designations for one fund being different than another fund’s sector designations.
| | | | | |
| Security type / sector | | Percentage of net assets |
Agency Collateralized Mortgage Obligations | | | | 0.16% | |
Agency Mortgage-Backed Security | | | | 0.00% | |
Convertible Bonds | | | | 1.06% | |
Corporate Bonds | | | | 58.69% | |
Aerospace/Defense | | | | 0.67% | |
Airlines | | | | 0.06% | |
Auto Manufacturers | | | | 1.67% | |
Auto Parts & Equipment | | | | 0.58% | |
Banking | | | | 12.69% | |
Beverages | | | | 1.24% | |
Biotechnology | | | | 0.68% | |
Building Materials | | | | 0.31% | |
Chemicals | | | | 0.38% | |
Commercial Services | | | | 0.18% | |
Computers | | | | 3.41% | |
Diversified Financial Services | | | | 4.43% | |
Electric | | | | 3.90% | |
Electronics | | | | 0.36% | |
Engineering & Construction | | | | 0.26% | |
Entertainment | | | | 0.16% | |
Food | | | | 1.62% | |
Forest Products & Paper | | | | 0.44% | |
Gas | | | | 0.03% | |
Healthcare | | | | 0.44% | |
Household Products/Wares | | | | 0.28% | |
Insurance | | | | 2.07% | |
Internet | | | | 0.76% | |
Iron/Steel | | | | 0.14% | |
Leisure Time | | | | 0.06% | |
Lodging | | | | 0.13% | |
Machinery - Construction & Mining | | | | 0.09% | |
Media | | | | 1.43% | |
Mining | | | | 0.41% | |
Miscellaneous Manufacturing | | | | 0.82% | |
Natural Gas | | | | 0.41% | |
Oil & Gas | | | | 5.93% | |
Packaging & Containers | | | | 0.28% | |
10
| | | | | |
| Security type / sector | | Percentage of net assets |
Pharmaceuticals | | | | 2.52% | |
Pipelines | | | | 2.14% | |
Real Estate | | | | 1.13% | |
Retail | | | | 0.36% | |
Software | | | | 0.95% | |
Telecommunications | | | | 3.69% | |
Transportation | | | | 1.58% | |
Municipal Bonds | | | | 1.51% | |
Non-Agency Asset-Backed Securities | | | | 5.33% | |
Non-Agency Collateralized Mortgage Obligations | | | | 0.48% | |
Senior Secured Loans | | | | 31.32% | |
Sovereign Bonds | | | | 0.37% | |
Convertible Preferred Stock | | | | 0.20% | |
Preferred Stock | | | | 0.30% | |
Short-Term Investments | | | | 2.60% | |
Total Value of Securities | | | | 102.02% | |
Liabilities Net of Receivables and Other Assets | | | | (2.02% | ) |
Total Net Assets | | | | 100.00% | |
11
| | |
| Schedule of investments | | |
Delaware Diversified Floating Rate Fund | | July 31, 2014 |
| | | | | | | | |
| | | Principal amount° | | | Value (U.S. $) | |
| |
Agency Collateralized Mortgage Obligations – 0.16% | | | | | | | | |
| |
Fannie Mae REMICs | | | | | | | | |
Series 2004-36 FA 0.555% 5/25/34 — | | | 59,739 | | | $ | 59,856 | |
Series 2005-66 FD 0.455% 7/25/35 — | | | 70,432 | | | | 70,241 | |
Series 2005-106 QF 0.665% 12/25/35 — | | | 401,241 | | | | 404,467 | |
Series 2006-105 FB 0.575% 11/25/36 — | | | 47,777 | | | | 47,903 | |
Series 2007-109 NF 0.705% 12/25/37 — | | | 30,279 | | | | 30,509 | |
Freddie Mac REMICs | | | | | | | | |
Series 3067 FA 0.502% 11/15/35 — | | | 121,398 | | | | 121,283 | |
Series 3239 EF 0.502% 11/15/36 — | | | 102,556 | | | | 102,538 | |
Series 3241 FM 0.532% 11/15/36 — | | | 10,985 | | | | 11,000 | |
Series 3780 LF 0.552% 3/15/29 — | | | 18,553 | | | | 18,586 | |
| | | | | | | | |
Total Agency Collateralized Mortgage Obligations (cost $859,712) | | | | | | | 866,383 | |
| | | | | | | | |
|
| |
| |
Agency Mortgage-Backed Security – 0.00% | | | | | | | | |
| |
Freddie Mac ARM | | | | | | | | |
2.375% 2/1/35 — | | | 19,386 | | | | 20,749 | |
| | | | | | | | |
Total Agency Mortgage-Backed Security (cost $20,477) | | | | | | | 20,749 | |
| | | | | | | | |
|
| |
| |
Convertible Bonds – 1.06% | | | | | | | | |
| |
Alere 3.00% exercise price $43.98, expiration date 5/15/16 | | | 131,000 | | | | 145,901 | |
Ares Capital 5.75% exercise price $19.13, expiration date 2/1/16 | | | 53,000 | | | | 56,677 | |
ArvinMeritor 4.00% exercise price $26.73, expiration date 2/12/27 f | | | 454,000 | | | | 480,673 | |
Blackstone Mortgage Trust 5.25% exercise price $28.66, expiration date 12/1/18 | | | 341,000 | | | | 364,870 | |
Campus Crest Communities Operating Partnership 144A | | | | | | | | |
4.75% exercise price $12.56, expiration date 10/11/18 # | | | 352,000 | | | | 346,280 | |
Chesapeake Energy | | | | | | | | |
2.25% exercise price $80.36, expiration date 12/14/38 | | | 83,000 | | | | 80,251 | |
2.50% exercise price $47.77, expiration date 5/15/37 | | | 51,000 | | | | 53,996 | |
Ciena 144A 3.75% exercise price $20.17, expiration date 10/15/18 # | | | 37,000 | | | | 47,961 | |
Energy XXI Bermuda 144A 3.00% exercise price $40.40, expiration date 12/13/18 # | | | 350,000 | | | | 332,063 | |
General Cable 4.50% exercise price $35.64, expiration date 11/15/29 f | | | 432,000 | | | | 395,280 | |
Gilead Sciences 1.625% exercise price $22.71, expiration date 4/29/16 | | | 22,000 | | | | 88,495 | |
Jefferies Group 3.875% exercise price $45.29, expiration date 10/31/29 | | | 544,000 | | | | 582,420 | |
MGM Resorts International 4.25% exercise price $18.58, expiration date 4/10/15 | | | 139,000 | | | | 206,676 | |
12
| | | | | | | | |
| | | Principal amount° | | | Value (U.S. $) | |
| |
Convertible Bonds (continued) | | | | | | | | |
| |
Mylan 3.75% exercise price $13.32, expiration date 9/15/15 | | | 13,000 | | | $ | 48,295 | |
Nuance Communications 2.75% exercise price $32.30,expiration date 11/1/31 | | | 330,000 | | | | 330,000 | |
NuVasive 2.75% exercise price $42.13, expiration date 6/30/17 | | | 200,000 | | | | 233,250 | |
SanDisk 1.50% exercise price $51.69, expiration date 8/11/17 | | | 289,000 | | | | 528,689 | |
Titan Machinery 3.75% exercise price $43.17, expiration date 4/30/19 | | | 98,000 | | | | 85,199 | |
TPG Specialty Lending 144A 4.50% exercise price $25.83,expiration date 12/15/19 # | | | 127,000 | | | | 126,286 | |
Vantage Drilling 144A 5.50% exercise price $2.39,expiration date 7/15/43 # | | | 208,000 | | | | 225,680 | |
Vector Group 1.75% exercise price $27.16, expiration date 4/15/20 | | | 397,000 | | | | 426,031 | |
VeriSign 3.25% exercise price $34.37, expiration date 8/15/37 | | | 239,000 | | | | 395,545 | |
| | | | | | | | |
Total Convertible Bonds (cost $5,251,438) | | | | | | | 5,580,518 | |
| | | | | | | | |
|
| |
| |
Corporate Bonds – 58.69% | | | | | | | | |
| |
Aerospace/Defense - 0.67% | | | | | | | | |
Rockwell Collins 0.581% 12/15/16 — | | | 3,520,000 | | | | 3,530,331 | |
| | | | | | | | |
| | | | | | | 3,530,331 | |
| | | | | | | | |
Airlines - 0.06% | | | | | | | | |
United Airlines 2014-1 Class A Pass Through Trust | | | | | | | | |
4.00% 4/11/26 ¿ | | | 200,000 | | | | 202,750 | |
United Airlines 2014-2 Class A Pass Through Trust | | | | | | | | |
3.75% 9/3/26 ¿ | | | 110,000 | | | | 109,969 | |
| | | | | | | | |
| | | | | | | 312,719 | |
| | | | | | | | |
Auto Manufacturers – 1.67% | | | | | | | | |
Daimler Finance North America | | | | | | | | |
144A 0.58% 3/10/17 #— | | | 1,200,000 | | | | 1,202,000 | |
144A 0.58% 8/1/17 #— | | | 3,420,000 | | | | 3,423,547 | |
General Motors 3.50% 10/2/18 | | | 450,000 | | | | 454,500 | |
Volkswagen International Finance 144A | | | | | | | | |
0.666% 11/18/16 #— | | | 3,745,000 | | | | 3,760,740 | |
| | | | | | | | |
| | | | | | | 8,840,787 | |
| | | | | | | | |
Auto Parts & Equipment – 0.58% | | | | | | | | |
Delphi 6.125% 5/15/21 | | | 265,000 | | | | 294,813 | |
Magna International 3.625% 6/15/24 | | | 1,550,000 | | | | 1,559,894 | |
13
Schedule of investments
Delaware Diversified Floating Rate Fund
| | | | | | | | |
| | | Principal amount° | | | Value (U.S. $) | |
| |
Corporate Bonds (continued) | | | | | | | | |
| |
Auto Parts & Equipment (continued) | | | | | | | | |
TRW Automotive 144A 4.45% 12/1/23 # | | | 1,205,000 | | | $ | 1,229,100 | |
| | | | | | | | |
| | | | | | | 3,083,807 | |
| | | | | | | | |
Banking – 12.69% | | | | | | | | |
Australia & New Zealand Banking Group 144A | | | | | | | | |
0.614% 1/10/17 #— | | | 2,250,000 | | | | 2,257,339 | |
Banco de Costa Rica 144A 5.25% 8/12/18 # | | | 600,000 | | | | 616,500 | |
Banco Santander Mexico 144A 5.95% 1/30/24 #— | | | 375,000 | | | | 398,437 | |
BanColombia 5.95% 6/3/21 | | | 290,000 | | | | 321,175 | |
Bank of America | | | | | | | | |
0.494% 10/14/16 — | | | 575,000 | | | | 572,969 | |
0.695% 11/14/16 — | | | 3,400,000 | | | | 3,408,061 | |
1.274% 1/15/19 — | | | 2,175,000 | | | | 2,210,496 | |
Bank of Georgia 144A 7.75% 7/5/17 # | | | 375,000 | | | | 404,063 | |
Bank of Montreal 0.754% 7/15/16 — | | | 2,220,000 | | | | 2,234,961 | |
Barclays Bank | | | | | | | | |
3.75% 5/15/24 | | | 880,000 | | | | 882,753 | |
7.625% 11/21/22 | | | 400,000 | | | | 452,250 | |
BB&T 1.091% 6/15/18 — | | | 2,086,000 | | | | 2,124,645 | |
BBVA Bancomer 144A 6.50% 3/10/21 # | | | 395,000 | | | | 446,350 | |
Branch Banking & Trust | | | | | | | | |
0.527% 5/23/17 — | | | 1,405,000 | | | | 1,395,584 | |
0.55% 9/13/16 — | | | 775,000 | | | | 773,357 | |
Capital One 2.95% 7/23/21 | | | 445,000 | | | | 440,736 | |
Citigroup 4.00% 8/5/24 | | | 740,000 | | | | 728,549 | |
CoBank 144A 0.831% 6/15/22 #— | | | 75,000 | | | | 67,380 | |
Credit Suisse 144A 6.50% 8/8/23 # | | | 515,000 | | | | 570,363 | |
Credit Suisse Group | | | | | | | | |
144A 6.25% 12/29/49 #— | | | 230,000 | | | | 231,012 | |
144A 7.50% 12/31/49 #— | | | 375,000 | | | | 412,500 | |
Export-Import Bank of China 144A 2.50% 7/31/19 # | | | 1,005,000 | | | | 997,643 | |
Export-Import Bank of Korea 0.984% 1/14/17 — | | | 2,250,000 | | | | 2,266,061 | |
Fifth Third Bank 0.637% 2/26/16 — | | | 3,355,000 | | | | 3,363,129 | |
Goldman Sachs Group | | | | | | | | |
1.436% 4/30/18 — | | | 710,000 | | | | 724,264 | |
3.85% 7/8/24 | | | 285,000 | | | | 284,038 | |
HBOS 144A 6.75% 5/21/18 # | | | 1,100,000 | | | | 1,259,310 | |
HSBC Bank 144A 0.864% 5/15/18 #— | | | 1,400,000 | | | | 1,413,856 | |
ING Bank 144A 5.80% 9/25/23 # | | | 1,120,000 | | | | 1,251,980 | |
JPMorgan Chase 6.75% 1/29/49 — | | | 1,120,000 | | | | 1,201,200 | |
Lloyds Banking Group 7.50% 4/30/49 — | | | 1,365,000 | | | | 1,436,663 | |
Morgan Stanley | | | | | | | | |
1.083% 1/24/19 — | | | 1,715,000 | | | | 1,735,683 | |
14
| | | | | | | | |
| | | Principal amount° | | | Value (U.S. $) | |
| |
Corporate Bonds (continued) | | | | | | | | |
| |
Banking (continued) | | | | | | | | |
Morgan Stanley | | | | | | | | |
1.477% 2/25/16 — | | | 930,000 | | | $ | 944,065 | |
1.514% 4/25/18 — | | | 1,735,000 | | | | 1,781,248 | |
2.375% 7/23/19 | | | 560,000 | | | | 555,929 | |
National City Bank 0.601% 6/7/17 — | | | 4,500,000 | | | | 4,495,819 | |
Oversea-Chinese Banking 144A 4.00% 10/15/24 #— | | | 765,000 | | | | 775,358 | |
PNC Financial Services Group 3.90% 4/29/24 | | | 255,000 | | | | 258,251 | |
PNC Preferred Funding Trust II 144A 1.453% 3/29/49 #— | | | 2,500,000 | | | | 2,468,750 | |
Rabobank 4.625% 12/1/23 | | | 400,000 | | | | 419,242 | |
Royal Bank of Scotland Group 5.125% 5/28/24 | | | 605,000 | | | | 606,064 | |
Santander Holdings USA 3.45% 8/27/18 | | | 495,000 | | | | 518,877 | |
Santander UK 144A 5.00% 11/7/23 # | | | 1,505,000 | | | | 1,618,850 | |
Siam Commercial Bank 144A 3.50% 4/7/19 # | | | 405,000 | | | | 413,234 | |
SunTrust Bank 0.517% 8/24/15 — | | | 985,000 | | | | 984,140 | |
Svenska Handelsbanken 0.68% 3/21/16 — | | | 615,000 | | | | 618,374 | |
Toronto-Dominion Bank 0.786% 4/30/18 — | | | 1,325,000 | | | | 1,337,126 | |
U.S. Bancorp 0.714% 11/15/18 — | | | 4,340,000 | | | | 4,379,455 | |
USB Capital IX 3.50% 10/29/49 — | | | 440,000 | | | | 379,500 | |
Wells Fargo | | | | | | | | |
0.764% 7/20/16 — | | | 1,480,000 | | | | 1,489,769 | |
0.863% 4/23/18 — | | | 2,600,000 | | | | 2,625,535 | |
4.10% 6/3/26 | | | 930,000 | | | | 939,439 | |
5.90% 12/29/49 — | | | 1,035,000 | | | | 1,083,645 | |
Woori Bank | | | | | | | | |
144A 2.875% 10/2/18 # | | | 200,000 | | | | 204,069 | |
144A 4.75% 4/30/24 # | | | 580,000 | | | | 587,450 | |
Zions Bancorp | | | | | | | | |
4.50% 3/27/17 | | | 315,000 | | | | 334,515 | |
4.50% 6/13/23 | | | 420,000 | | | | 432,949 | |
| | | | | | | | |
| | | | | | | 67,134,960 | |
| | | | | | | | |
Beverages – 1.24% | | | | | | | | |
Anheuser-Busch InBev Finance 0.64% 2/1/19 — | | | 2,615,000 | | | | 2,619,056 | |
Constellation Brands 4.25% 5/1/23 | | | 110,000 | | | | 108,900 | |
PepsiCo 0.437% 2/26/16 — | | | 890,000 | | | | 891,878 | |
Pernod-Ricard 144A 2.95% 1/15/17 # | | | 1,250,000 | | | | 1,293,974 | |
SABMiller Holdings 144A 0.93% 8/1/18 #— | | | 1,630,000 | | | | 1,640,564 | |
| | | | | | | | |
| | | | | | | 6,554,372 | |
| | | | | | | | |
Biotechnology – 0.68% | | | | | | | | |
Amgen 3.625% 5/22/24 | | | 1,210,000 | | | | 1,214,746 | |
Celgene | | | | | | | | |
3.25% 8/15/22 | | | 950,000 | | | | 947,928 | |
3.625% 5/15/24 | | | 605,000 | | | | 606,162 | |
15
Schedule of investments
Delaware Diversified Floating Rate Fund
| | | | | | | | |
| | | Principal amount° | | | Value (U.S. $) | |
| |
Corporate Bonds (continued) | | | | | | | | |
| |
Biotechnology (continued) | | | | | | | | |
Gilead Sciences 3.70% 4/1/24 | | | 820,000 | | | $ | 842,242 | |
| | | | | | | | |
| | | | | | | 3,611,078 | |
| | | | | | | | |
Building Materials – 0.31% | | | | | | | | |
Cemex 144A 4.984% 10/15/18 #— | | | 1,535,000 | | | | 1,643,217 | |
| | | | | | | 1,643,217 | |
Chemicals – 0.38% | | | | | | | | |
Braskem Finance 6.45% 2/3/24 | | | 510,000 | | | | 536,622 | |
CF Industries 7.125% 5/1/20 | | | 250,000 | | | | 304,032 | |
Dow Chemical 8.55% 5/15/19 | | | 140,000 | | | | 178,482 | |
OCP 144A 5.625% 4/25/24 # | | | 925,000 | | | | 971,250 | |
| | | | | | | | |
| | | | | | | 1,990,386 | |
| | | | | | | | |
Commercial Services – 0.18% | | | | | | | | |
Avis Budget Car Rental 2.977% 12/1/17 — | | | 965,000 | | | | 962,587 | |
| | | | | | | | |
| | | | | | | 962,587 | |
| | | | | | | | |
Computers – 3.41% | | | | | | | | |
Apple 0.537% 5/6/19 — | | | 6,090,000 | | | | 6,088,572 | |
Hewlett-Packard 1.174% 1/14/19 — | | | 5,170,000 | | | | 5,216,023 | |
International Business Machines | | | | | | | | |
0.593% 2/12/19 — | | | 4,660,000 | | | | 4,692,284 | |
1.625% 5/15/20 | | | 590,000 | | | | 564,795 | |
NetApp 3.25% 12/15/22 | | | 645,000 | | | | 622,420 | |
Seagate HDD Cayman 144A 4.75% 1/1/25 # | | | 875,000 | | | | 866,250 | |
| | | | | | | | |
| | | | | | | 18,050,344 | |
| | | | | | | | |
Diversified Financial Services – 4.43% | | | | | | | | |
American Honda Finance 144A 0.602% 5/26/16 #— | | | 1,430,000 | | | | 1,436,472 | |
Crown Castle Towers 144A 4.883% 8/15/20 # | | | 685,000 | | | | 758,775 | |
ERAC USA Finance | | | | | | | | |
144A 4.50% 8/16/21 # | | | 555,000 | | | | 602,032 | |
144A 5.25% 10/1/20 # | | | 120,000 | | | | 135,858 | |
Ford Motor Credit 1.474% 5/9/16 — | | | 3,300,000 | | | | 3,347,642 | |
General Electric Capital | | | | | | | | |
0.618% 5/5/26 — | | | 965,000 | | | | 906,298 | |
0.744% 1/14/19 — | | | 2,050,000 | | | | 2,064,824 | |
1.231% 3/15/23 — | | | 1,050,000 | | | | 1,056,447 | |
144A 3.80% 6/18/19 # | | | 250,000 | | | | 267,039 | |
6.00% 8/7/19 | | | 215,000 | | | | 252,837 | |
7.125% 12/29/49 — | | | 900,000 | | | | 1,054,624 | |
Hyundai Capital America | | | | | | | | |
144A 2.55% 2/6/19 # | | | 220,000 | | | | 222,513 | |
144A 4.00% 6/8/17 # | | | 310,000 | | | | 329,202 | |
Jefferies Group 5.125% 1/20/23 | | | 875,000 | | | | 935,252 | |
Lazard Group 4.25% 11/14/20 | | | 1,405,000 | | | | 1,469,359 | |
16
| | | | | | | | |
| | | Principal amount° | | | Value (U.S. $) | |
| |
Corporate Bonds (continued) | | | | | | | | |
| |
Diversified Financial Services (continued) | | | | | | | | |
MMC Norilsk Nickel via MMC Finance 144A | | | | | | | | |
5.55% 10/28/20 # | | | 284,000 | | | $ | 284,710 | |
National Rural Utilities Cooperative Finance | | | | | | | | |
0.48% 5/27/16 — | | | 1,750,000 | | | | 1,752,721 | |
0.527% 11/23/16 — | | | 2,500,000 | | | | 2,514,595 | |
4.75% 4/30/43 — | | | 1,110,000 | | | | 1,107,891 | |
PACCAR Financial 0.83% 12/6/18 — | | | 2,000,000 | | | | 2,019,242 | |
USB Realty 144A 1.381% 12/29/49 #— | | | 300,000 | | | | 277,500 | |
Woodside Finance 144A 8.75% 3/1/19 # | | | 510,000 | | | | 643,579 | |
| | | | | | | | |
| | | | | | | 23,439,412 | |
| | | | | | | | |
Electric – 3.90% | | | | | | | | |
Ameren Illinois 9.75% 11/15/18 | | | 165,000 | | | | 215,650 | |
American Transmission Systems 144A 5.25% 1/15/22 # | | | 1,210,000 | | | | 1,320,267 | |
Cleveland Electric Illuminating 5.50% 8/15/24 | | | 360,000 | | | | 416,289 | |
Duke Energy Indiana 0.584% 7/11/16 — | | | 2,350,000 | | | | 2,359,407 | |
Electricite de France | | | | | | | | |
144A 0.694% 1/20/17 #— | | | 2,460,000 | | | | 2,468,197 | |
144A 5.25% 1/29/49 #— | | | 1,995,000 | | | | 2,032,167 | |
Enel 144A 8.75% 9/24/73 #— | | | 1,060,000 | | | | 1,256,100 | |
Great Plains Energy 4.85% 6/1/21 | | | 730,000 | | | | 805,101 | |
Integrys Energy Group 6.11% 12/1/66 — | | | 410,000 | | | | 418,507 | |
ITC Holdings 3.65% 6/15/24 | | | 365,000 | | | | 363,754 | |
LG&E & KU Energy | | | | | | | | |
3.75% 11/15/20 | | | 350,000 | | | | 366,305 | |
4.375% 10/1/21 | | | 300,000 | | | | 322,155 | |
Metropolitan Edison 144A 4.00% 4/15/25 # | | | 325,000 | | | | 330,052 | |
NextEra Energy Capital Holdings | | | | | | | | |
2.40% 9/15/19 | | | 805,000 | | | | 808,028 | |
3.625% 6/15/23 | | | 180,000 | | | | 181,272 | |
NiSource Finance 5.45% 9/15/20 | | | 2,055,000 | | | | 2,330,273 | |
NSTAR Electric 0.466% 5/17/16 — | | | 850,000 | | | | 849,330 | |
NV Energy 6.25% 11/15/20 | | | 390,000 | | | | 462,467 | |
Pennsylvania Electric 5.20% 4/1/20 | | | 625,000 | | | | 687,631 | |
Public Service New Hampshire 3.50% 11/1/23 | | | 390,000 | | | | 401,454 | |
SCANA 4.125% 2/1/22 | | | 370,000 | | | | 384,103 | |
State Grid Overseas Investment 2014 | | | | | | | | |
144A 2.75% 5/7/19 # | | | 1,005,000 | | | | 1,009,537 | |
144A 4.125% 5/7/24 # | | | 295,000 | | | | 305,636 | |
Transelec 144A 4.25% 1/14/25 # | | | 400,000 | | | | 397,663 | |
Wisconsin Energy 6.25% 5/15/67 — | | | 155,000 | | | | 159,774 | |
| | | | | | | | |
| | | | | | | 20,651,119 | |
| | | | | | | | |
17
Schedule of investments
Delaware Diversified Floating Rate Fund
| | | | | | | | |
| | | Principal amount° | | | Value (U.S. $) | |
| |
Corporate Bonds (continued) | | | | | | | | |
| |
Electronics – 0.36% | | | | | | | | |
Broadcom 3.50% 8/1/24 | | | 640,000 | | | $ | 636,471 | |
National Semiconductor 6.60% 6/15/17 | | | 310,000 | | | | 356,391 | |
Samsung Electronics America 144A 1.75% 4/10/17 # | | | 500,000 | | | | 502,024 | |
Thermo Fisher Scientific 4.15% 2/1/24 | | | 405,000 | | | | 420,918 | |
| | | | | | | | |
| | | | | | | 1,915,804 | |
| | | | | | | | |
Engineering & Construction – 0.26% | | | | | | | | |
OAS Finance 144A 8.00% 7/2/21 # | | | 200,000 | | | | 200,000 | |
OAS Investments 144A 8.25% 10/19/19 # | | | 605,000 | | | | 618,613 | |
Odebrecht Offshore Drilling Finance 144A | | | | | | | | |
6.625% 10/1/22 # | | | 445,005 | | | | 470,037 | |
URS 3.85% 4/1/17 | | | 85,000 | | | | 88,130 | |
| | | | | | | | |
| | | | | | | 1,376,780 | |
| | | | | | | | |
Entertainment – 0.16% | | | | | | | | |
International Game Technology 5.35% 10/15/23 | | | 800,000 | | | | 829,847 | |
| | | | | | | | |
| | | | | | | 829,847 | |
| | | | | | | | |
Food – 1.62% | | | | | | | | |
Aramark Services 5.75% 3/15/20 | | | 1,300,000 | | | | 1,345,500 | |
ConAgra Foods 0.603% 7/21/16 — | | | 2,670,000 | | | | 2,670,208 | |
General Mills | | | | | | | | |
0.435% 1/28/16 — | | | 1,780,000 | | | | 1,781,712 | |
0.534% 1/29/16 — | | | 770,000 | | | | 771,764 | |
JBS Investments 144A 7.75% 10/28/20 # | | | 560,000 | | | | 603,400 | |
Kroger 0.763% 10/17/16 — | | | 1,400,000 | | | | 1,403,822 | |
| | | | | | | | |
| | | | | | | 8,576,406 | |
| | | | | | | | |
Forest Products & Paper – 0.44% | | | | | | | | |
Fibria Overseas Finance 5.25% 5/12/24 | | | 385,000 | | | | 382,690 | |
Georgia-Pacific 8.00% 1/15/24 | | | 400,000 | | | | 538,278 | |
International Paper | | | | | | | | |
3.65% 6/15/24 | | | 25,000 | | | | 24,731 | |
7.50% 8/15/21 | | | 1,070,000 | | | | 1,354,345 | |
| | | | | | | | |
| | | | | | | 2,300,044 | |
| | | | | | | | |
Gas – 0.03% | | | | | | | | |
CenterPoint Energy 6.50% 5/1/18 | | | 150,000 | | | | 173,950 | |
| | | | | | | | |
| | | | | | | 173,950 | |
| | | | | | | | |
Healthcare – 0.44% | | | | | | | | |
Boston Scientific | | | | | | | | |
2.65% 10/1/18 | | | 285,000 | | | | 289,817 | |
6.00% 1/15/20 | | | 685,000 | | | | 793,782 | |
CareFusion 6.375% 8/1/19 | | | 805,000 | | | | 936,841 | |
Quest Diagnostics 2.70% 4/1/19 | | | 305,000 | | | | 306,568 | |
| | | | | | | | |
| | | | | | | 2,327,008 | |
| | | | | | | | |
18
| | | | | | | | |
| | | Principal amount° | | | Value (U.S. $) | |
| |
Corporate Bonds (continued) | | | | | | | | |
| |
Household Products/Wares – 0.28% | | | | | | | | |
Reynolds Group Issuer 8.25% 2/15/21 | | | 1,405,000 | | | $ | 1,496,325 | |
| | | | | | | | |
| | | | | | | 1,496,325 | |
| | | | | | | | |
Insurance – 2.07% | | | | | | | | |
American International Group | | | | | | | | |
2.30% 7/16/19 | | | 705,000 | | | | 701,348 | |
8.25% 8/15/18 | | | 700,000 | | | | 862,025 | |
Berkshire Hathaway Finance 0.384% 1/10/17 — | | | 735,000 | | | | 735,980 | |
Chubb 6.375% 3/29/67 — | | | 260,000 | | | | 287,950 | |
ING U.S. 5.65% 5/15/53 — | | | 485,000 | | | | 495,913 | |
Metropolitan Life Global Funding I 144A | | | | | | | | |
0.764% 7/15/16 # — | | | 4,350,000 | | | | 4,382,695 | |
Prudential Financial | | | | | | | | |
1.004% 8/15/18 — | | | 2,800,000 | | | | 2,817,178 | |
5.625% 6/15/43 — | | | 365,000 | | | | 392,375 | |
XL Group 6.50% 12/29/49 — | | | 255,000 | | | | 250,537 | |
| | | | | | | | |
| | | | | | | 10,926,001 | |
| | | | | | | | |
Internet – 0.76% | | | | | | | | |
Baidu | | | | | | | | |
2.75% 6/9/19 | | | 425,000 | | | | 425,354 | |
3.25% 8/6/18 | | | 585,000 | | | | 603,495 | |
Ebay 0.715% 8/1/19 — | | | 2,635,000 | | | | 2,640,757 | |
Tencent Holdings 144A 3.375% 5/2/19 # | | | 350,000 | | | | 355,832 | |
| | | | | | | | |
| | | | | | | 4,025,438 | |
| | | | | | | | |
Iron/Steel – 0.14% | | | | | | | | |
Metalloinvest Finance 144A 5.625% 4/17/20 # | | | 600,000 | | | | 550,500 | |
Tupy Overseas 144A 6.625% 7/17/24 # | | | 200,000 | | | | 206,000 | |
| | | | | | | | |
| | | | | | | 756,500 | |
| | | | | | | | |
Leisure Time – 0.06% | | | | | | | | |
Carnival 1.20% 2/5/16 | | | 305,000 | | | | 306,528 | |
| | | | | | | | |
| | | | | | | 306,528 | |
| | | | | | | | |
Lodging – 0.13% | | | | | | | | |
Marriott International 3.375% 10/15/20 | | | 395,000 | | | | 407,104 | |
Wyndham Worldwide 3.90% 3/1/23 | | | 290,000 | | | | 289,344 | |
| | | | | | | | |
| | | | | | | 696,448 | |
| | | | | | | | |
Machinery - Construction & Mining – 0.09% | | | | | | | | |
Caterpillar 3.40% 5/15/24 | | | 465,000 | | | | 468,350 | |
| | | | | | | | |
| | | | | | | 468,350 | |
| | | | | | | | |
Media – 1.43% | | | | | | | | |
Columbus International 144A 7.375% 3/30/21 # | | | 1,020,000 | | | | 1,079,925 | |
DIRECTV Holdings 4.45% 4/1/24 | | | 1,520,000 | | | | 1,595,260 | |
Historic TW 6.875% 6/15/18 | | | 400,000 | | | | 472,399 | |
NBCUniversal Enterprise 144A 0.919% 4/15/18 # — | | | 2,910,000 | | | | 2,944,158 | |
19
Schedule of investments
Delaware Diversified Floating Rate Fund
| | | | | | | | |
| | | Principal amount° | | | Value (U.S. $) | |
| |
Corporate Bonds (continued) | | | | | | | | |
| |
Media (continued) | | | | | | | | |
Time Warner Cable 8.25% 4/1/19 | | | 1,190,000 | | | $ | 1,496,260 | |
| | | | | | | | |
| | | | | | | 7,588,002 | |
| | | | | | | | |
Mining – 0.41% | | | | | | | | |
FMG Resources August 2006 144A 6.875% 4/1/22 # | | | 475,000 | | | | 507,063 | |
Rio Tinto Finance USA 1.072% 6/17/16 — | | | 995,000 | | | | 1,003,618 | |
Vedanta Resources 144A 6.00% 1/31/19 # | | | 215,000 | | | | 221,987 | |
Yamana Gold 144A 4.95% 7/15/24 # | | | 420,000 | | | | 420,917 | |
| | | | | | | | |
| | | | | | | 2,153,585 | |
| | | | | | | | |
Miscellaneous Manufacturing – 0.82% | | | | | | | | |
Crane | | | | | | | | |
2.75% 12/15/18 | | | 145,000 | | | | 147,681 | |
4.45% 12/15/23 | | | 655,000 | | | | 687,989 | |
Ingersoll-Rand Global Holding 4.25% 6/15/23 | | | 775,000 | | | | 817,958 | |
Tyco Electronics Group 0.437% 1/29/16 — | | | 2,670,000 | | | | 2,671,610 | |
| | | | | | | | |
| | | | | | | 4,325,238 | |
| | | | | | | | |
Natural Gas – 0.41% | | | | | | | | |
El Paso Pipeline Partners Operating 4.30% 5/1/24 | | | 1,020,000 | | | | 1,025,039 | |
EnLink Midstream Partners 4.40% 4/1/24 | | | 1,090,000 | | | | 1,141,647 | |
| | | | | | | | |
| | | | | | | 2,166,686 | |
| | | | | | | | |
Oil & Gas – 5.93% | | | | | | | | |
Anadarko Petroleum 3.45% 7/15/24 | | | 585,000 | | | | 580,553 | |
BP Capital Markets | | | | | | | | |
0.657% 11/7/16 — | | | 1,480,000 | | | | 1,487,470 | |
0.763% 5/10/19 — | | | 2,360,000 | | | | 2,377,152 | |
Canadian Natural Resources 0.609% 3/30/16 — | | | 3,760,000 | | | | 3,772,976 | |
Chesapeake Energy 3.484% 4/15/19 — | | | 1,375,000 | | | | 1,381,875 | |
Cimarex Energy 4.375% 6/1/24 | | | 365,000 | | | | 373,669 | |
CNOOC Nexen Finance 2014 4.25% 4/30/24 | | | 715,000 | | | | 733,265 | |
Continental Resources 4.50% 4/15/23 | | | 1,410,000 | | | | 1,504,752 | |
Devon Energy 0.771% 12/15/16 — | | | 2,465,000 | | | | 2,477,424 | |
KazMunayGas National 144A 9.125% 7/2/18 # | | | 430,000 | | | | 521,913 | |
Newfield Exploration 5.625% 7/1/24 | | | 1,095,000 | | | | 1,188,075 | |
ONGC Videsh 2.50% 5/7/18 | | | 415,000 | | | | 408,746 | |
Pacific Rubiales Energy | | | | | | | | |
144A 5.375% 1/26/19 # | | | 465,000 | | | | 475,463 | |
144A 7.25% 12/12/21 # | | | 335,000 | | | | 366,825 | |
Pertamina Persero 144A 4.875% 5/3/22 # | | | 200,000 | | | | 201,500 | |
Petrobras Global Finance | | | | | | | | |
2.374% 1/15/19 — | | | 1,025,000 | | | | 1,024,487 | |
4.875% 3/17/20 | | | 255,000 | | | | 260,431 | |
6.25% 3/17/24 | | | 255,000 | | | | 269,813 | |
Plains Exploration & Production 6.50% 11/15/20 | | | 248,000 | | | | 276,520 | |
20
| | | | | | | | |
| | | Principal amount° | | | Value (U.S. $) | |
| |
Corporate Bonds (continued) | | | | | | | | |
| |
Oil & Gas (continued) | | | | | | | | |
PTT Exploration & Production 144A 4.875% 12/29/49 #— | | | 725,000 | | | $ | 734,787 | |
Shell International Finance 0.434% 11/15/16 — | | | 2,500,000 | | | | 2,507,090 | |
Statoil | | | | | | | | |
0.514% 5/15/18 — | | | 2,280,000 | | | | 2,283,010 | |
0.685% 11/8/18 — | | | 2,640,000 | | | | 2,659,444 | |
Total Capital International | | | | | | | | |
0.58% 6/19/19 — | | | 645,000 | | | | 647,630 | |
0.793% 8/10/18 — | | | 2,320,000 | | | | 2,346,260 | |
YPF 7.724% 8/15/18 — | | | 500,000 | | | | 512,500 | |
| | | | | | | | |
| | | | | | | 31,373,630 | |
| | | | | | | | |
Packaging & Containers – 0.28% | | | | | | | | |
Beverage Packaging Holdings Luxembourg II 144A | | | | | | | | |
6.00% 6/15/17 # | | | 600,000 | | | | 597,750 | |
Rock-Tenn | | | | | | | | |
3.50% 3/1/20 | | | 640,000 | | | | 654,778 | |
4.00% 3/1/23 | | | 240,000 | | | | 245,102 | |
| | | | | | | | |
| | | | | | | 1,497,630 | |
| | | | | | | | |
Pharmaceuticals – 2.52% | | | | | | | | |
Actavis Funding 144A 3.85% 6/15/24 # | | | 1,380,000 | | | | 1,379,843 | |
Express Scripts Holding | | | | | | | | |
2.25% 6/15/19 | | | 415,000 | | | | 411,275 | |
3.50% 6/15/24 | | | 975,000 | | | | 963,651 | |
Forest Laboratories 144A 4.375% 2/1/19 # | | | 315,000 | | | | 338,153 | |
McKesson 0.63% 9/10/15 — | | | 2,495,000 | | | | 2,500,050 | |
Merck 0.586% 5/18/18 — | | | 4,695,000 | | | | 4,715,306 | |
Pfizer 0.531% 6/15/18 — | | | 3,010,000 | | | | 3,018,729 | |
| | | | | | | | |
| | | | | | | 13,327,007 | |
| | | | | | | | |
Pipelines – 2.14% | | | | | | | | |
Enbridge | | | | | | | | |
0.678% 6/2/17 — | | | 1,800,000 | | | | 1,804,774 | |
0.885% 10/1/16 — | | | 2,700,000 | | | | 2,715,933 | |
Enbridge Energy Partners 8.05% 10/1/37 — | | | 411,000 | | | | 465,457 | |
Enterprise Products Operating 7.034% 1/15/68 — | | | 635,000 | | | | 723,667 | |
Oleoducto Central 144A 4.00% 5/7/21 # | | | 685,000 | | | | 694,419 | |
Sunoco Logistics Partners Operations 3.45% 1/15/23 | | | 1,960,000 | | | | 1,916,214 | |
TransCanada PipeLines | | | | | | | | |
0.914% 6/30/16 — | | | 2,500,000 | | | | 2,523,565 | |
6.35% 5/15/67 — | | | 50,000 | | | | 52,225 | |
Williams 4.55% 6/24/24 | | | 410,000 | | | | 409,302 | |
| | | | | | | | |
| | | | | | | 11,305,556 | |
| | | | | | | | |
21
Schedule of investments
Delaware Diversified Floating Rate Fund
| | | | | | | | |
| | | Principal amount° | | | Value (U.S. $) | |
| |
Corporate Bonds (continued) | | | | | | | | |
| |
Real Estate – 1.13% | | | | | | | | |
Alexandria Real Estate Equities | | | | | | | | |
3.90% 6/15/23 | | | 320,000 | | | $ | 318,067 | |
4.60% 4/1/22 | | | 80,000 | | | | 84,356 | |
American Tower Trust I 144A 1.551% 3/15/43 # | | | 1,280,000 | | | | 1,270,045 | |
CBL & Associates 5.25% 12/1/23 | | | 405,000 | | | | 432,671 | |
Corporate Office Properties | | | | | | | | |
3.60% 5/15/23 | | | 225,000 | | | | 215,787 | |
5.25% 2/15/24 | | | 575,000 | | | | 615,040 | |
Excel Trust 4.625% 5/15/24 | | | 280,000 | | | | 285,924 | |
Healthcare Trust of America Holdings 3.375% 7/15/21 | | | 250,000 | | | | 248,779 | |
Host Hotels & Resorts | | | | | | | | |
3.75% 10/15/23 | | | 1,415,000 | | | | 1,400,178 | |
4.75% 3/1/23 | | | 40,000 | | | | 42,482 | |
Weyerhaeuser 4.625% 9/15/23 | | | 590,000 | | | | 634,415 | |
WP Carey 4.60% 4/1/24 | | | 400,000 | | | | 412,913 | |
| | | | | | | | |
| | | | | | | 5,960,657 | |
| | | | | | | | |
Retail – 0.36% | | | | | | | | |
QVC 4.375% 3/15/23 | | | 545,000 | | | | 548,635 | |
Signet UK Finance 4.70% 6/15/24 | | | 700,000 | | | | 712,037 | |
Target | | | | | | | | |
2.30% 6/26/19 | | | 295,000 | | | | 296,473 | |
3.50% 7/1/24 | | | 345,000 | | | | 346,974 | |
| | | | | | | | |
| | | | | | | 1,904,119 | |
| | | | | | | | |
Software – 0.95% | | | | | | | | |
Oracle | | | | | | | | |
0.743% 10/8/19 — | | | 5,000,000 | | | | 5,026,620 | |
3.40% 7/8/24 | | | 15,000 | | | | 14,967 | |
| | | | | | | | |
| | | | | | | 5,041,587 | |
| | | | | | | | |
Telecommunications – 3.69% | | | | | | | | |
America Movil 1.23% 9/12/16 — | | | 1,715,000 | | | | 1,730,558 | |
AT&T | | | | | | | | |
0.901% 3/11/19 — | | | 2,200,000 | | | | 2,222,398 | |
1.137% 11/27/18 — | | | 295,000 | | | | 300,694 | |
Bharti Airtel International Netherlands 144A | | | | | | | | |
5.35% 5/20/24 # | | | 670,000 | | | | 704,894 | |
CenturyLink 5.80% 3/15/22 | | | 225,000 | | | | 231,750 | |
Cisco Systems 0.727% 3/1/19 — | | | 1,875,000 | | | | 1,892,336 | |
Digicel Group 144A 8.25% 9/30/20 # | | | 595,000 | | | | 644,087 | |
ENTEL Chile 144A 4.875% 10/30/24 # | | | 285,000 | | | | 286,741 | |
Millicom International Cellular 144A 6.625% 10/15/21 # | | | 400,000 | | | | 427,000 | |
MTS International Funding 144A 8.625% 6/22/20 # | | | 660,000 | | | | 765,468 | |
SBA Tower Trust 144A 2.24% 4/16/18 # | | | 220,000 | | | | 217,998 | |
22
| | | | | | | | |
| | | Principal amount° | | | Value (U.S. $) | |
| |
Corporate Bonds (continued) | | | | | | | | |
| |
Telecommunications (continued) | | | | | | | | |
SES 144A 3.60% 4/4/23 # | | | 1,100,000 | | | $ | 1,108,273 | |
Telefonica Emisiones 4.57% 4/27/23 | | | 1,440,000 | | | | 1,523,714 | |
Telemar Norte Leste 144A 5.50% 10/23/20 # | | | 205,000 | | | | 202,437 | |
Turk Telekomunikasyon 144A 3.75% 6/19/19 # | | | 610,000 | | | | 607,941 | |
Verizon Communications | | | | | | | | |
0.631% 6/9/17 — | | | 1,150,000 | | | | 1,152,746 | |
1.981% 9/14/18 — | | | 2,770,000 | | | | 2,915,206 | |
2.00% 11/1/16 | | | 385,000 | | | | 392,913 | |
5.15% 9/15/23 | | | 585,000 | | | | 648,596 | |
Virgin Media Finance 144A 6.375% 4/15/23 # | | | 200,000 | | | | 211,000 | |
Vodafone Group 0.611% 2/19/16 — | | | 1,300,000 | | | | 1,303,615 | |
| | | | | | | | |
| | | | | | | 19,490,365 | |
| | | | | | | | |
Transportation – 1.58% | | | | | | | | |
Canadian National Railway 0.437% 11/6/15 — | | | 3,800,000 | | | | 3,802,136 | |
Kansas City Southern de Mexico 0.935% 10/28/16 — | | | 2,490,000 | | | | 2,499,616 | |
Norfolk Southern 3.85% 1/15/24 | | | 1,505,000 | | | | 1,561,606 | |
United Parcel Service 5.125% 4/1/19 | | | 415,000 | | | | 471,544 | |
| | | | | | | | |
| | | | | | | 8,334,902 | |
| | | | | | | | |
Total Corporate Bonds (cost $306,511,814) | | | | | | | 310,449,512 | |
| | | | | | | | |
|
| |
Municipal Bonds – 1.51% | | | | | | | | |
| |
Missouri Higher Education Loan Authority | | | | | | | | |
Series A-1 1.079% 8/27/29 — | | | 38,747 | | | | 38,961 | |
New Mexico Educational Assistance | | | | | | | | |
Foundation (Libor Floating) | | | | | | | | |
Series A-3 1.427% 12/1/38 — | | | 120,000 | | | | 119,702 | |
New York City, New York | | | | | | | | |
Series I 5.00% 8/1/22 | | | 185,000 | | | | 220,962 | |
New York State Thruway Authority Revenue | | | | | | | | |
Series A 5.00% 5/1/19 | | | 260,000 | | | | 301,506 | |
North Texas Higher Education Authority Student Loan | | | | | | | | |
Revenue (Libor Floating) | | | | | | | | |
Series A-1 1.335% 4/1/40 — | | | 253,311 | | | | 255,900 | |
Series A-2 1.13% 7/1/30 — | | | 75,000 | | | | 75,117 | |
Oklahoma Student Loan Authority (Libor-Indexed) | | | | | | | | |
Series A-1 1.386% 6/1/40 — | | | 686,160 | | | | 689,495 | |
Series A-2A 1.436% 9/1/37 — | | | 95,000 | | | | 96,793 | |
Pennsylvania Turnpike Commission | | | | | | | | |
Series B-1 1.04% 12/1/21 — | | | 1,150,000 | | | | 1,151,207 | |
State of California | | | | | | | | |
Series D 0.809% 12/1/28 — | | | 2,000,000 | | | | 2,016,580 | |
23
Schedule of investments
Delaware Diversified Floating Rate Fund
| | | | | | | | |
| | | Principal amount° | | | Value (U.S. $) | |
| |
Municipal Bonds (continued) | | | | | | | | |
| |
State of Connecticut | | | | | | | | |
Series A 1.61% 3/1/21 — | | | 750,000 | | | $ | 755,723 | |
State of Maryland Local Facilities | | | | | | | | |
Series A 5.00% 8/1/21 | | | 225,000 | | | | 273,215 | |
University of California | | | | | | | | |
(Floating Taxable) Series Y-1 0.656% 7/1/41 — | | | 2,000,000 | | | | 2,009,020 | |
| | | | | | | | |
Total Municipal Bonds (cost $7,934,368) | | | | | | | 8,004,181 | |
| | | | | | | | |
|
| |
Non-Agency Asset-Backed Securities – 5.33% | | | | | | | | |
| |
ARI Fleet Lease Trust | | | | | | | | |
Series 2014-A A2 144A 0.81% 11/15/22 # | | | 2,000,000 | | | | 2,000,158 | |
Avenue CLO VI | | | | | | | | |
Series 2007-6A A1 144A 0.458% 7/17/19 #— | | | 101,832 | | | | 100,909 | |
Capital One Multi-Asset Execution Trust | | | | | | | | |
Series 2007-A1 A1 0.202% 11/15/19 — | | | 2,000,000 | | | | 1,990,050 | |
Series 2014-A3 A3 0.532% 1/18/22 — | | | 615,000 | | | | 615,285 | |
Chase Issuance Trust | | | | | | | | |
Series 2013-A3 A3 0.432% 4/15/20 — | | | 1,000,000 | | | | 1,001,083 | |
Chesapeake Funding | | | | | | | | |
Series 2012-2A A 144A 0.606% 5/7/24 #— | | | 705,489 | | | | 706,569 | |
Series 2014-1A A 144A 0.576% 3/7/26 #— | | | 200,000 | | | | 200,053 | |
Discover Card Execution Note Trust | | | | | | | | |
Series 2013-A1 A1 0.452% 8/17/20 — | | | 675,000 | | | | 676,108 | |
Flagship VII | | | | | | | | |
Series 2013-7A A1 144A 1.704% 1/20/26 #— | | | 1,000,000 | | | | 997,500 | |
Ford Credit Floorplan Master Owner Trust A | | | | | | | | |
Series 2014-1 A2 0.552% 2/15/19 — | | | 2,000,000 | | | | 2,000,944 | |
Golden Credit Card Trust | | | | | | | | |
Series 2012-3A A 144A 0.602% 7/17/17 #— | | | 765,000 | | | | 766,661 | |
Hertz Fleet Lease Funding | | | | | | | | |
Series 2014-1 A 144A 0.553% 4/10/28 #— | | | 250,000 | | | | 250,115 | |
KKR Financial CLO | | | | | | | | |
Series 2013-1A A1 144A 1.384% 7/15/25 #— | | | 1,395,000 | | | | 1,379,153 | |
LCM VI | | | | | | | | |
Series 6A A 144A 0.459% 5/28/19 #— | | | 405,263 | | | | 401,989 | |
MAPS CLO Fund II | | | | | | | | |
Series 2007-2A A1 144A 0.474% 7/20/22 #— | | | 1,450,000 | | | | 1,434,877 | |
Master Credit Card Trust II | | | | | | | | |
Series 2012-2A A 144A 0.78% 4/21/17 # | | | 750,000 | | | | 750,965 | |
Mercedes-Benz Auto Lease Trust | | | | | | | | |
Series 2014-A A2B 0.332% 6/15/16 — | | | 3,000,000 | | | | 3,000,111 | |
Motor | | | | | | | | |
Series 2013-1A A1 144A 0.655% 2/25/21 #— | | | 600,000 | | | | 600,578 | |
24
| | | | | | | | |
| | | Principal amount° | | | Value (U.S. $) | |
| |
Non-Agency Asset-Backed Securities (continued) | | | | | | | | |
| |
Mountain View CLO III | | | | | | | | |
Series 2007-3A A1 144A 0.448% 4/16/21 #— | | | 1,460,833 | | | $ | 1,449,526 | |
NYLIM Flatiron CLO | | | | | | | | |
Series 2006-1A A2A 144A 0.445% 8/8/20 #— | | | 331,744 | | | | 328,343 | |
OCP CLO | | | | | | | | |
Series 2013-4A A1A 144A 1.633% 10/24/25 #— | | | 1,500,000 | | | | 1,496,250 | |
PFS Financing | | | | | | | | |
Series 2013-AA A 144A 0.702% 2/15/18 #— | | | 680,000 | | | | 680,602 | |
Sudbury Mill CLO | | | | | | | | |
Series 2013-1A X 144A 1.233% 1/17/26 #— | | | 535,385 | | | | 535,385 | |
Telos CLO | | | | | | | | |
Series 2013-4A A 144A 1.533% 7/17/24 #— | | | 2,000,000 | | | | 1,977,540 | |
Series 2013-4A X 144A 1.183% 7/17/24 #— | | | 750,000 | | | | 750,000 | |
Trade MAPS 1 | | | | | | | | |
Series 2013-1A A 144A 0.853% 12/10/18 #— | | | 1,000,000 | | | | 1,002,993 | |
Trafigura Securitisation Finance | | | | | | | | |
Series 2012-1A A 144A 2.552% 10/15/15 #— | | | 1,080,000 | | | | 1,088,142 | |
| | | | | | | | |
Total Non-Agency Asset-Backed Securities | | | | | | | | |
(cost $28,096,326) | | | | | | | 28,181,889 | |
| | | | | | | | |
|
| |
Non-Agency Collateralized Mortgage Obligations – 0.48% | | | | | | | | |
| |
Fannie Mae Connecticut Avenue Securities | | | | | | | | |
Series 2014-C02 1M1 1.105% 5/25/24 — | | | 631,360 | | | | 625,848 | |
Series 2014-C03 1M1 1.355% 7/25/24 — | | | 455,000 | | | | 453,330 | |
Freddie Mac Structured Agency Credit Risk Debt Notes | | | | | | | | |
Series 2014-DN2 M1 1.005% 4/25/24 — | | | 1,475,121 | | | | 1,464,853 | |
| | | | | | | | |
Total Non-Agency Collateralized Mortgage Obligations (cost $2,561,481) | | | | | | | 2,544,031 | |
| | | | | | | | |
|
| |
Senior Secured Loans – 31.32%« | | | | | | | | |
| |
Air Medical Group Holdings Tranche B1 5.00% 5/29/18 | | | 743,987 | | | | 746,777 | |
Akorn Tranche B 1st Lien 4.50% 4/17/21 | | | 375,000 | | | | 376,406 | |
Albertsons Tranche B 1st Lien 4.75% 3/21/19 | | | 360,367 | | | | 362,650 | |
Amaya Gaming 1st Lien 5.00% 7/29/21 | | | 2,150,000 | | | | 2,130,852 | |
Amaya Gaming 2nd Lien 8.00% 7/29/22 | | | 1,005,000 | | | | 1,017,982 | |
American Tire 1st Lien 5.75% 6/1/18 | | | 548,887 | | | | 548,887 | |
Applied Systems 1st Lien 4.25% 1/15/21 | | | 921,370 | | | | 920,794 | |
Applied Systems 2nd Lien 7.50% 1/15/22 | | | 965,000 | | | | 980,380 | |
ARAMARK Tranche E 3.25% 9/7/19 | | | 1,246,875 | | | | 1,238,981 | |
Arysta Lifescience 1st Lien 4.50% 5/20/20 | | | 297,000 | | | | 297,124 | |
Ashland Water 1st Lien 4.25% 7/2/21 | | | 590,000 | | | | 585,698 | |
Ashland Water 2nd Lien 7.75% 7/2/22 | | | 475,000 | | | | 474,604 | |
Atkore International 2nd Lien 7.75% 9/27/21 | | | 635,000 | | | | 634,206 | |
Avast Software 1st Lien 5.00% 3/18/20 | | | 1,313,375 | | | | 1,316,111 | |
25
Schedule of investments
Delaware Diversified Floating Rate Fund
| | | | | | | | |
| | | Principal amount° | | | Value (U.S. $) | |
| |
Senior Secured Loans« (continued) | | | | | | | | |
| |
Avaya Tranche B-3 4.50% 10/27/17 | | | 498,537 | | | $ | 483,425 | |
Axalta Coating Systems U.S. Holdings 1st Lien | | | | | | | | |
4.00% 2/1/20 | | | 346,500 | | | | 345,201 | |
Azure Midstream Tranche B 6.50% 10/21/18 | | | 1,249,851 | | | | 1,257,663 | |
Bally Technologies Tranche B 4.25% 8/22/20 | | | 1,562,614 | | | | 1,567,731 | |
BJ’s Wholesale Club 2nd Lien 8.50% 3/31/20 | | | 1,260,000 | | | | 1,280,082 | |
BJ’s Wholesale Club Tranche B 1st Lien 4.50% 9/26/19 | | | 640,975 | | | | 640,624 | |
Bowie Recourse Tranche B 1st Lien 6.75% 8/9/20 | | | 919,188 | | | | 926,081 | |
Burlington Coat Factory Warehouse Tranche B2 | | | | | | | | |
4.25% 2/23/17 | | | 2,776,442 | | | | 2,785,118 | |
Caesars Growth Partners Tranche B 1st Lien | | | | | | | | |
6.25% 5/8/21 | | | 2,645,000 | | | | 2,639,215 | |
Calpine Construction Finance Tranche B 3.00% 5/1/20 | | | 1,891,596 | | | | 1,857,311 | |
Charter Communications Operating 3.00% 4/10/20 | | | 2,529,450 | | | | 2,476,491 | |
Charter Communications Operating Tranche F | | | | | | | | |
3.00% 1/3/21 | | | 2,871,000 | | | | 2,813,324 | |
Chrysler Group Tranche B 1st Lien 3.50% 5/24/17 | | | 501,537 | | | | 502,318 | |
Citycenter Holdings Tranche B 5.00% 10/9/20 | | | 709,226 | | | | 711,886 | |
Clear Channel Communications Tranche B 3.65% 1/29/16 | | | 4,679,171 | | | | 4,644,652 | |
Clear Channel Communications Tranche D 6.75% 1/30/19 | | | 1,075,000 | | | | 1,058,091 | |
Clear Channel Communications Tranche E 1st Lien | | | | | | | | |
7.50% 7/30/19 | | | 498,032 | | | | 498,299 | |
Community Health Systems Tranche D 4.25% 1/27/21 | | | 3,059,310 | | | | 3,070,782 | |
Community Health Systems Tranche E 3.25% 1/25/17 | | | 865,965 | | | | 867,654 | |
Crown Castles Operating Tranche B2 3.00% 1/31/21 | | | 1,055,071 | | | | 1,049,513 | |
Davita Healthcare Partners Tranche B 3.50% 6/19/21 | | | 1,435,000 | | | | 1,434,615 | |
Delta Air Lines Tranche B 1st Lien 3.50% 4/20/17 | | | 1,144,809 | | | | 1,145,740 | |
Delta Air Lines Tranche B1 3.50% 10/18/18 | | | 494,975 | | | | 494,604 | |
Diamond Reports 1st Lien 5.50% 4/25/21 | | | 1,295,000 | | | | 1,303,903 | |
Drillships Financing Holding Tranche B1 6.00% 2/17/21 | | | 2,979,707 | | | | 3,009,504 | |
Dynegy Tranche B2 4.00% 4/16/20 | | | 1,836,171 | | | | 1,837,893 | |
Emdeon 1st Lien 3.75% 11/2/18 | | | 2,050,771 | | | | 2,051,540 | |
Emerald Performance 1st Lien 4.50% 7/23/21 | | | 425,000 | | | | 425,000 | |
Energy Transfer 1st Lien 3.25% 12/2/19 | | | 2,775,000 | | | | 2,741,303 | |
Fieldwood Energy 2nd Lien 8.375% 9/30/20 | | | 910,000 | | | | 933,604 | |
First Data Tranche B 1st Lien 4.00% 3/24/21 | | | 2,777,625 | | | | 2,779,113 | |
Flint Group 1st Lien 4.75% 5/2/21 | | | 625,000 | | | | 626,172 | |
Flint Group Tranche 2nd Lien 8.25% 5/2/22 | | | 250,000 | | | | 251,979 | |
Gates Global 1st Lien 4.25% 6/12/21 | | | 1,375,000 | | | | 1,368,003 | |
Gentiva Health Services Tranche B 6.50% 10/10/19 | | | 1,329,173 | | | | 1,332,281 | |
Gentiva Health Services Tranche C 5.75% 10/10/18 | | | 1,123,121 | | | | 1,123,823 | |
HD Supply Tranche B 4.00% 6/28/18 | | | 2,467,286 | | | | 2,469,270 | |
Hilton Worldwide Finance Tranche B2 3.50% 9/23/20 | | | 2,505,789 | | | | 2,497,307 | |
Hostess Brands 1st Lien 6.75% 3/12/20 | | | 763,088 | | | | 788,842 | |
26
| | | | | | | | |
| | | Principal amount° | | | Value (U.S. $) | |
| |
Senior Secured Loans« (continued) | | | | | | | | |
| |
Houghton International 1st Lien 4.00% 12/10/19 | | | 1,137,700 | | | $ | 1,136,989 | |
Houghton International 2nd Lien 9.50% 11/20/20 | | | 195,000 | | | | 198,900 | |
Hudson’s Bay Tranche B 1st Lien 4.75% 10/7/20 | | | 729,750 | | | | 736,591 | |
Huntsman International Tranche B 3.75% 10/11/20 | | | 2,570,000 | | | | 2,570,951 | |
Husky International 2nd Lien 7.25% 6/10/22 | | | 175,000 | | | | 176,604 | |
Husky International Tranche B 1st Lien 4.25% 6/10/21 | | | 175,000 | | | | 175,629 | |
IASIS Healthcare Tranche B 1st Lien 4.50% 5/3/18 | | | 870,255 | | | | 873,383 | |
Immucor Tranche B2 5.00% 8/19/18 | | | 2,159,465 | | | | 2,171,612 | |
Ineos U.S. Finance Tranche B 3.75% 5/4/18 | | | 553,483 | | | | 551,555 | |
Infor U.S. Tranche B5 1st Lien 3.75% 6/3/20 | | | 1,430,287 | | | | 1,420,454 | |
Intelsat Jackson Holdings Tranche B2 3.75% 6/30/19 | | | 2,345,641 | | | | 2,345,641 | |
Ipreo (U.S. 2) Tranche B 1st Lien 4.25% 7/16/21 | | | 710,000 | | | | 706,450 | |
J. Crew Group Tranche B 1st Lien 4.00% 2/28/21 | | | 354,113 | | | | 346,455 | |
KIK Custom Products 1st Lien 5.50% 5/17/19 | | | 1,406,559 | | | | 1,408,903 | |
Kinetic Concepts Tranche E1 4.00% 5/8/18 | | | 1,431,678 | | | | 1,433,207 | |
Landry’s Tranche B 4.00% 4/24/18 | | | 1,742,787 | | | | 1,748,887 | |
Level 3 Financing Tranche B 4.00% 1/15/20 | | | 2,365,000 | | | | 2,362,784 | |
Lightower Fiber Networks 4.00% 4/1/20 | | | 173,250 | | | | 172,870 | |
LTS Buyer 2nd Lien 8.00% 3/15/21 | | | 1,488,075 | | | | 1,507,915 | |
Mallinckrodt Tranche B1 1st Lien 0.00% 3/19/21 | | | 430,000 | | | | 427,850 | |
Mauser Holdings 2nd Lien 8.25% 6/30/22 | | | 1,050,000 | | | | 1,051,969 | |
MGM Resorts International 3.50% 12/20/19 | | | 3,283,787 | | | | 3,268,737 | |
Michael Stores Tranche B 1st Lien 3.75% 1/16/20 | | | 987,500 | | | | 985,384 | |
Moxie Liberty Tranche B 7.50% 8/21/20 | | | 1,804,000 | | | | 1,862,630 | |
Moxie Patriot (Panda Power Fund) Tranche B1 | | | | | | | | |
6.75% 12/18/20 | | | 1,895,000 | | | | 1,956,587 | |
National Vision 4.00% 3/6/21 | | | 418,950 | | | | 415,983 | |
NEP Broadcasting 2nd Lien 9.50% 7/3/20 | | | 1,449,286 | | | | 1,489,141 | |
NEP/NCP Tranche B 1st Lien 4.25% 1/22/20 | | | 234,413 | | | | 234,632 | |
New Albertsons 1st Lien 4.75% 6/24/21 | | | 375,000 | | | | 376,592 | |
NRG Energy Tranche B 2.75% 7/1/18 | | | 403,197 | | | | 399,890 | |
Numericable 4.50% 4/23/20 | | | 1,807,160 | | | | 1,820,069 | |
Numericable U.S. Tranche B2 1st Lien 4.50% 4/23/20 | | | 1,563,440 | | | | 1,569,914 | |
Nuveen Investments 1st Lien 4.00% 5/13/17 | | | 1,640,000 | | | | 1,641,937 | |
Nuveen Investments 2nd Lien 6.50% 2/28/19 | | | 4,795,000 | | | | 4,808,987 | |
Ocean Rig (Drillship) Tranche B 1st Lien 5.50% 7/18/21 | | | 710,000 | | | | 714,881 | |
Open Text Tranche B 3.25% 12/19/20 | | | 2,537,250 | | | | 2,536,458 | |
Ortho-Clinical Diagnostics Tranche B 1st Lien | | | | | | | | |
4.75% 6/30/21 | | | 800,000 | | | | 800,834 | |
OSI Restaurants Tranche B 1st Lien 3.50% 10/26/19 | | | 91,125 | | | | 91,280 | |
Panda Temple Power II Tranche B 1st Lien 7.25% 3/28/19 | | | 1,779,000 | | | | 1,836,817 | |
Paragon Offshore Finance Tranche B 3.75% 7/11/21 | | | 595,000 | | | | 592,583 | |
Peabody Energy Tranche B 4.25% 9/20/20 | | | 1,295,213 | | | | 1,296,254 | |
27
Schedule of investments
Delaware Diversified Floating Rate Fund
| | | | | | | | |
| | | Principal amount° | | | Value (U.S. $) | |
| |
Senior Secured Loans« (continued) | | | | | | | | |
| |
Pinnacle Entertainment Tranche B2 3.75% 8/13/20 | | | 292,884 | | | $ | 293,829 | |
Ply Gem Industries 1st Lien 4.00% 1/22/21 | | | 758,100 | | | | 753,125 | |
Polymer Group Tranche B | | | | | | | | |
5.25% 12/13/19 | | | 3,794,727 | | | | 3,803,030 | |
5.25% 12/19/19 | | | 180,241 | | | | 181,368 | |
PVH tranche B 1st Lien 3.25% 2/13/20 | | | 328,096 | | | | 330,511 | |
Quickrete 2nd Lien 7.00% 3/19/21 | | | 995,000 | | | | 1,017,387 | |
Ranpak 2nd Lien 8.50% 4/10/20 | | | 530,000 | | | | 541,263 | |
Regent Seven Seas Cruises Tranche B 1st Lien | | | | | | | | |
3.75% 12/21/18 | | | 786,050 | | | | 785,559 | |
Remy International Tranche B 1st Lien 4.25% 3/5/20 | | | 183,738 | | | | 183,968 | |
Reynolds & Reynolds Tranche B 2.00% 4/21/16 | | | 234,799 | | | | 235,826 | |
Reynolds Group 1st Lien 4.00% 12/31/18 | | | 571,329 | | | | 570,933 | |
Rite Aid 2nd Lien | | | | | | | | |
4.875% 6/13/21 | | | 750,000 | | | | 758,672 | |
5.75% 8/3/20 | | | 1,275,000 | | | | 1,301,775 | |
Royalty Pharma Tranche B2 1st Lien 3.25% 5/9/18 | | | 1,118,129 | | | | 1,120,081 | |
Salix Pharmaceuticals Tranche B 4.25% 12/17/19 | | | 858,000 | | | | 862,960 | |
Samson Investment 2nd Lien 5.00% 9/25/18 | | | 2,183,000 | | | | 2,180,662 | |
Santander Asset Management Tranche B 4.25% 11/26/20 | | | 641,775 | | | | 643,781 | |
Scientific Games International 4.25% 5/22/20 | | | 2,228,800 | | | | 2,200,343 | |
Seminole Tribe of Florida Tranche B 3.00% 4/11/20 | | | 912,500 | | | | 911,787 | |
Sensus 2nd Lien 8.50% 4/13/18 | | | 565,000 | | | | 568,178 | |
Sinclair Broadcasting Tranche B1 1st Lien 3.50% 7/22/21 | | | 690,000 | | | | 688,994 | |
Smart & Final Tranche B 1st Lien 4.75% 11/15/19 | | | 1,802,590 | | | | 1,806,534 | |
Sprouts Farmers Markets Holdings 4.00% 4/12/20 | | | 1,123,798 | | | | 1,124,267 | |
Stena 1st Lien 4.00% 2/21/21 | | | 997,500 | | | | 999,059 | |
Supervalu 1st Lien 4.50% 3/21/19 | | | 662,329 | | | | 662,374 | |
Surgical Care Affiliates Tranche C 4.25% 6/30/18 | | | 143,550 | | | | 143,460 | |
TransDigm Tranche C 3.75% 2/7/20 | | | 1,851,206 | | | | 1,842,611 | |
United Continental Tranche B 3.50% 4/1/19 | | | 375,250 | | | | 374,406 | |
Univision Communications 1st Lien 4.00% 3/1/20 | | | 1,999,231 | | | | 1,988,735 | |
Univision Communications Tranche C4 4.00% 3/1/20 | | | 1,529,546 | | | | 1,521,898 | |
US Airways Tranche B1 3.50% 5/23/19 | | | 1,227,600 | | | | 1,222,997 | |
US Airways Tranche B2 3.00% 11/23/16 | | | 150,480 | | | | 150,630 | |
USI Insurance Services | | | | | | | | |
Tranche B 1st Lien 4.25% 12/3/18 | | | 689,539 | | | | 690,545 | |
Valeant Pharmaceuticals International Tranche BE | | | | | | | | |
3.75% 8/5/20 | | | 1,765,060 | | | | 1,763,711 | |
Vantage Drilling Tranche B 1st Lien 5.00% 10/25/17 | | | 486,465 | | | | 484,945 | |
Wide Open West Finance 4.75% 3/27/19 | | | 3,572,252 | | | | 3,588,716 | |
Windstream Tranche B3 1st Lien 3.50% 8/8/19 | | | 884,306 | | | | 883,478 | |
WR Grace Tranche B 1st Lien 3.00% 1/23/21 | | | 1,819,125 | | | | 1,816,662 | |
28
| | | | | | | | |
| | | Principal amount° | | | Value (U.S. $) | |
| |
Senior Secured Loans« (continued) | | | | | | | | |
| |
Zayo Group Tranche B 1st Lien 4.00% 7/2/19 | | | 717,199 | | | $ | 714,790 | |
| | | | | | | | |
Total Senior Secured Loans (cost $165,468,776) | | | | | | | 165,660,448 | |
| | | | | | | | |
|
| |
Sovereign Bonds – 0.37% D | | | | | | | | |
| |
Colombia – 0.05% | | | | | | | | |
Colombia Government International Bond | | | | | | | | |
2.025% 11/16/15 — | | | 240,000 | | | | 243,600 | |
| | | | | | | | |
| | | | | | | 243,600 | |
| | | | | | | | |
Guatemala – 0.07% | | | | | | | | |
Guatemala Government Bond 144A 5.75% 6/6/22 # | | | 330,000 | | | | 357,225 | |
| | | | | | | | |
| | | | | | | 357,225 | |
| | | | | | | | |
Iceland – 0.08% | | | | | | | | |
Republic of Iceland 144A 5.875% 5/11/22 # | | | 395,000 | | | | 436,098 | |
| | | | | | | | |
| | | | | | | 436,098 | |
| | | | | | | | |
Kenya – 0.08% | | | | | | | | |
Kenya Government International Bond 144A | | | | | | | | |
5.875% 6/24/19 # | | | 385,000 | | | | 397,589 | |
| | | | | | | | |
| | | | | | | 397,589 | |
| | | | | | | | |
Norway – 0.09% | | | | | | | | |
Kommunalbanken 144A 0.409% 2/20/18 #— | | | 500,000 | | | | 501,141 | |
| | | | | | | | |
| | | | | | | 501,141 | |
| | | | | | | | |
Total Sovereign Bonds (cost $1,894,450) | | | | | | | 1,935,653 | |
| | | Number of shares | | | | |
| |
Convertible Preferred Stock – 0.20% | | | | | | | | |
| |
ArcelorMittal 6.00% exercise price $20.36, expiration date 12/21/15 | | | 3,075 | | | | 71,446 | |
Chesapeake Energy 144A 5.75% exercise price $26.14, expiration date 12/31/49 # | | | 145 | | | | 170,375 | |
Crown Castle International 4.50% exercise price $92.50, expiration date 11/1/16 | | | 350 | | | | 35,081 | |
Intelsat 5.75% exercise price $22.05, expiration date 5/1/16 | | | 2,669 | | | | 131,448 | |
Maiden Holdings 7.25% exercise price $15.47, expiration date 9/15/16 | | | 11,500 | | | | 540,500 | |
SandRidge Energy 8.50% exercise price $8.01, expiration date 12/31/49 | | | 850 | | | | 88,506 | |
| | | | | | | | |
Total Convertible Preferred Stock (cost $1,093,036) | | | | | | | 1,037,356 | |
| | | | | | | | |
|
| |
Preferred Stock – 0.30% | | | | | | | | |
| |
Integrys Energy Group 6.00% — | | | 29,900 | | | | 769,327 | |
National Retail Properties 5.70% | | | 7,525 | | | | 176,311 | |
29
Schedule of investments
Delaware Diversified Floating Rate Fund
| | | | | | | | |
| | | Number of shares | | | Value (U.S. $) | |
| |
Preferred Stock (continued) | | | | | | | | |
| |
Public Storage 5.20% | | | 3,200 | | | $ | 71,904 | |
Qwest 6.125% | | | 9,000 | | | | 211,500 | |
Regions Financial 6.375% — | | | 14,200 | | | | 361,390 | |
| | | | | | | | |
Total Preferred Stock (cost $1,595,625) | | | | | | | 1,590,432 | |
| | | | | | | | |
| | | | | | | | |
| | | Principal amount° | | | | |
| |
Short-Term Investments – 2.60% | | | | | | | | |
| |
Discount Notes – 0.24%≠ | | | | | | | | |
Federal Home Loan Bank | | | | | | | | |
0.05% 8/14/14 | | | 541,081 | | | | 541,077 | |
0.05% 8/15/14 | | | 96,551 | | | | 96,550 | |
0.06% 8/18/14 | | | 469,801 | | | | 469,796 | |
0.075% 11/19/14 | | | 153,255 | | | | 153,222 | |
| | | | | | | | |
| | | | | | | 1,260,645 | |
| | | | | | | | |
Repurchase Agreements – 1.99% | | | | | | | | |
Bank of America Merrill Lynch | | | | | | | | |
0.04%, dated 7/31/14, to be repurchased on 8/1/14, repurchase price $3,282,954 (collateralized by U.S. government obligations 0.00%–0.375% | | | | | | | | |
6/25/15–2/15/24; market value $3,348,610) | | | 3,282,950 | | | | 3,282,950 | |
Bank of Montreal | | | | | | | | |
0.07%, dated 7/31/14, to be repurchased on 8/1/14, repurchase price $1,094,319 (collateralized by U.S. government obligations 0.00%–4.375% | | | | | | | | |
8/21/14–11/15/43; market value $1,116,203) | | | 1,094,317 | | | | 1,094,317 | |
BNP Paribas | | | | | | | | |
0.07%, dated 7/31/14, to be repurchased on 8/1/14, repurchase price $6,141,745 (collateralized by U.S. government obligations 0.00%–2.75% | | | | | | | | |
8/7/14–11/15/23; market value $6,264,567) | | | 6,141,733 | | | | 6,141,733 | |
| | | | | | | | |
| | | | | | | 10,519,000 | |
| | | | | | | | |
U.S. Treasury Obligation – 0.37%≠ | | | | | | | | |
U.S. Treasury Bill 0.093% 11/13/14 | | | 1,961,987 | | | | 1,961,803 | |
| | | | | | | | |
| | | | | | | 1,961,803 | |
| | | | | | | | |
Total Short-Term Investments (cost $13,741,090) | | | | | | | 13,741,448 | |
| | | | | | | | |
Total Value of Securities – 102.02% | | | | | | | | |
(cost $535,028,593) | | | | | | $ | 539,612,600 | |
| | | | | | | | |
30
| # | Security exempt from registration under Rule 144A of the Securities Act of 1933, as amended. At July 31, 2014, the aggregate value of Rule 144A securities was $93,161,079, which represents 17.61% of the Fund’s net assets. See Note 12 in “Notes to financial statements.” |
| ¿ | Pass Through Agreement. Security represents the contractual right to receive a proportionate amount of underlying payments due to the counterparty pursuant to various agreements related to the rescheduling of obligations and the exchange of certain notes. |
| ≠ | The rate shown is the effective yield at the time of purchase. |
| ° | Principal amount shown is stated in U.S. dollars unless noted that the security is denominated in another currency. |
| — | Variable rate security. The rate shown is the rate as of July 31, 2014. Interest rates reset periodically. |
| D | Securities have been classified by country of origin. |
| « | Senior secured loans generally pay interest at rates which are periodically redetermined by reference to a base lending rate plus a premium. These base lending rates are generally: (i) the prime rate offered by one or more United States banks, (ii) the lending rate offered by one or more European banks such as the London Inter-Bank Offered Rate (LIBOR), and (iii) the certificate of deposit rate. Senior secured loans may be subject to restrictions on resale. Stated rate in effect at July 31, 2014. |
| f | Step coupon bond. Coupon increases or decreases periodically based on a predetermined schedule. Stated rate in effect at July 31, 2014. |
The following futures contracts and swap contracts were outstanding at July 31, 2014:1
Futures Contracts
| | | | | | | | | | | | | | | | |
Contracts to Buy (Sell) | | Notional
Cost
(Proceeds) | | | Notional
Value | | | Expiration
Date | | Unrealized
Appreciation
(Depreciation) | |
(90) | | USD IRS 5 yr PRIM | | $ | (9,147,386 | ) | | $ | (9,126,562 | ) | | 9/16/14 | | $ | 20,824 | |
(50) | | USD IRS 10 yr PRIM | | | (5,213,921 | ) | | | (5,232,813 | ) | | 9/16/14 | | | (18,892 | ) |
| | | | | | | | | | | | | | | | |
| | | | $ | (14,361,307 | ) | | | | | | | | $ | 1,932 | |
| | | | | | | | | | | | | | | | |
Swap Contracts
CDS Contracts2
| | | | | | | | | | | | | | |
Counterparty | | Swap Referenced Obligation | | Notional Value3 | | | Annual
Protection
Payments | | Termination
Date | | Unrealized
Appreciation
(Depreciation) | |
| | Protection Purchased: | | | | | | | | | | | | |
BCLY | | ICE - CDX.NA.IG.22 | | | 5,000,000 | | | 1.00% | | 6/20/19 | | $ | (17,026 | ) |
DB | | CDX.EM.21 | | | 4,035,000 | | | 5.00% | | 6/20/19 | | | 50,869 | |
MSC | | CDX.EM.21 | | | 1,005,000 | | | 5.00% | | 6/20/19 | | | 428 | |
| | | | | | | | | | | | | | |
| | | | | | | | | | | | $ | 34,271 | |
| | | | | | | | | | | | | | |
31
Schedule of investments
Delaware Diversified Floating Rate Fund
Interest Rate Swap Contracts4
| | | | | | | | | | | | | | | | | | |
Counterparty & Referenced Obligation | | Notional Value3 | | | Fixed
Interest Rate
Received
(Paid) | | | Floating
Interest Rate
Received
(Paid) | | Termination
Date | | | Unrealized
Appreciation
(Depreciation) | |
CME | | | | | | | | | | | | | | | | | | |
3 yr | | | 23,900,000 | | | | (0.869%) | | | 0.236% | | | 1/30/17 | | | $ | 56,184 | |
5 yr | | | 24,300,000 | | | | (1.677%) | | | 0.234% | | | 7/11/18 | | | | (98,844 | ) |
7 yr | | | 14,000,000 | | | | (2.215%) | | | 0.223% | | | 8/7/20 | | | | (74,528 | ) |
7 yr | | | 10,000,000 | | | | (2.215%) | | | 0.223% | | | 5/12/21 | | | | 31,258 | |
7 yr | | | 1,000,000 | | | | (2.226%) | | | 0.224% | | | 10/15/21 | | | | 11,685 | |
10 yr | | | 7,560,000 | | | | (2.726%) | | | 0.230% | | | 6/6/24 | | | | (32,647 | ) |
10 yr | | | 25,600,000 | | | | (2.880%) | | | 0.234% | | | 7/11/23 | | | | (639,637 | ) |
LCH | | | | | | | | | | | | | | | | | | |
5 yr | | | 3,300,000 | | | | (1.214%) | | | 0.230% | | | 6/11/18 | | | | 41,269 | |
| | | | | | | | | | | | | | | | | | |
| | | | | | | | | | | | | | | | $ | (705,260 | ) |
| | | | | | | | | | | | | | | | | | |
The use of future contracts and swap contracts involves elements of market risk and risks in excess of the amounts disclosed in the financial statements. The notional values presented above represent the Fund’s total exposure in such contracts, whereas only the net unrealized appreciation (depreciation) is reflected in the Fund’s net assets.
1See Note 9 in “Notes to financial statements.”
2A CDS contract is a risk-transfer instrument through which one party (purchaser of protection) transfers to another party (seller of protection) the financial risk of a credit event (as defined in the CDS agreement), as it relates to a particular reference security or basket of securities (such as an index). Periodic payments (receipts) on such contracts are accrued daily and recorded as unrealized losses (gains) on swap contracts. Upon payment (receipt), such amounts are recorded as realized losses (gains) on swap contracts. Upfront payments made or received in connection with CDS contracts are amortized over the expected life of the CDS contracts as unrealized losses (gains) on swap contracts. The change in value of CDS contracts is recorded as unrealized appreciation or depreciation daily. A realized gain or loss is recorded upon a credit event (as defined in the CDS agreement) or the maturity or termination of the agreement.
3Notional value shown is stated in U.S. dollars unless noted that the swap is denominated in another currency.
4An interest rate swap agreement is an exchange of interest rates between counterparties. Periodic payments on such contracts are accrued daily and recorded as unrealized appreciation (depreciation) on swap contracts. Upon periodic payment (receipt) or termination of the contract, such amounts are recorded as realized gains (losses) on swap contracts.
32
Summary of abbreviations:
ARM – Adjustable Rate Mortgage
BCLY – Barclays Bank
CDS – Credit Default Swap
CDX.NA.IG – Credit Default Swap Index North America Investment Grade
CDX.EM – Credit Default Swap Index Emerging Markets
CLO – Collateralized Loan Obligation
CME – Chicago Mercantile Exchange Inc.
DB – Deutsche Bank
ICE – IntercontinentalExchange, Inc.
IRS – Interest Rate Swap
LCH – LCH.Clearnet Limited
MSC – Morgan Stanley Capital
REMIC – Real Estate Mortgage Investment Conduit
yr – Year
See accompanying notes, which are an integral part of the financial statements.
33
| | |
| Statement of assets and liabilities | | |
| Delaware Diversified Floating Rate Fund | | July 31, 2014 |
| | | | |
Assets: | | | | |
Investments, at value1 | | $ | 525,871,152 | |
Short-term investments, at value2 | | | 13,741,448 | |
Cash collateral due from brokers | | | 3,738,663 | |
Cash | | | 2,070,545 | |
Receivable for securities sold | | | 3,807,286 | |
Dividends and interest receivable | | | 2,285,493 | |
Receivable for fund shares sold | | | 1,066,969 | |
Swap payments receivable | | | 23,598 | |
Variation margin due from broker on futures contracts | | | 2,344 | |
Unrealized gain on interest rate swap contracts | | | 140,396 | |
Unrealized gain on credit default swap contracts | | | 51,297 | |
Other assets | | | 1,359 | |
| | | | |
Total assets | | | 552,800,550 | |
| | | | |
Liabilities: | | | | |
Payable for securities purchased | | | 20,115,829 | |
Payable for fund shares redeemed | | | 1,083,258 | |
Swap payments payable | | | 339,188 | |
Distribution payable | | | 260,960 | |
Investment management fees payable | | | 222,896 | |
Other accrued expenses | | | 205,579 | |
Distribution fees payable to affiliates | | | 122,745 | |
Trustees’ fees and expenses payable | | | 1,234 | |
Unrealized loss on interest rate swap contracts | | | 845,656 | |
Upfront payments paid on credit default swap contracts | | | 625,871 | |
Unrealized loss on credit default swap contracts | | | 17,026 | |
Other affiliates payable | | | 16,217 | |
| | | | |
Total liabilities | | | 23,856,459 | |
| | | | |
Total Net Assets | | $ | 528,944,091 | |
| | | | |
| |
Net Assets Consist of: | | | | |
Paid-in capital | | $ | 526,231,018 | |
Distributions in excess of net investment income | | | (60,273 | ) |
Accumulated net realized loss on investments | | | (842,369 | ) |
Net unrealized appreciation of investments, foreign currencies, and derivatives | | | 3,615,715 | |
| | | | |
Total Net Assets | | $ | 528,944,091 | |
| | | | |
34
| | | | |
Net Asset Value | | | | |
Class A: | | | | |
Net assets | | $ | 158,690,722 | |
Shares of beneficial interest outstanding, unlimited authorization, no par | | | 18,391,532 | |
Net asset value per share | | $ | 8.63 | |
Sales charge | | | 2.75 | % |
Offering price per share, equal to net asset value per share/(1 – sales charge) | | $ | 8.87 | |
| |
Class C: | | | | |
Net assets | | $ | 100,779,308 | |
Shares of beneficial interest outstanding, unlimited authorization, no par | | | 11,683,331 | |
Net asset value per share | | $ | 8.63 | |
| |
Class R: | | | | |
Net assets | | $ | 845,429 | |
Shares of beneficial interest outstanding, unlimited authorization, no par | | | 98,011 | |
Net asset value per share | | $ | 8.63 | |
| |
Institutional Class: | | | | |
Net assets | | $ | 268,628,632 | |
Shares of beneficial interest outstanding, unlimited authorization, no par | | | 31,142,641 | |
Net asset value per share | | $ | 8.63 | |
| |
| | | | |
1Investments, at cost | | $ | 521,287,503 | |
2Short-term investments, at cost | | | 13,741,090 | |
See accompanying notes, which are an integral part of the financial statements.
35
Statement of operations
| | |
| Delaware Diversified Floating Rate Fund | | Year ended July 31, 2014 |
| | | | | | |
Investment Income: | | | | | | |
Interest | | $ | 14,065,288 | | | |
Dividends | | | 117,148 | | | |
| | | | | | |
| | | 14,182,436 | | | |
| | | | | | |
Expenses: | | | | | | |
Management fees | | | 2,491,473 | | | |
Distribution expenses – Class A | | | 548,622 | | | |
Distribution expenses – Class C | | | 1,042,010 | | | |
Distribution expenses – Class R | | | 852 | | | |
Dividend disbursing and transfer agent fees and expenses | | | 509,771 | | | |
Accounting and administration expenses | | | 177,975 | | | |
Registration fees | | | 93,545 | | | |
Reports and statements to shareholders | | | 58,566 | | | |
Audit and tax | | | 45,334 | | | |
Legal fees | | | 39,759 | | | |
Custodian fees | | | 32,481 | | | |
Trustees’ fees and expenses | | | 24,651 | | | |
Other | | | 32,816 | | | |
| | | | | | |
| | | 5,097,855 | | | |
Less waived distribution expenses – Class A | | | (17,227 | ) | | |
Less waived distribution expenses – Class R | | | (8 | ) | | |
Less expense paid indirectly | | | (73 | ) | | |
| | | | | | |
Total operating expenses | | | 5,080,547 | | | |
| | | | | | |
Net Investment Income | | | 9,101,889 | | | |
| | | | | | |
| | |
Net Realized and Unrealized Gain (Loss): | | | | | | |
Net realized gain (loss) on: | | | | | | |
Investments | | | 1,628,850 | | | |
Foreign currencies | | | (128,499 | ) | | |
Foreign currency exchange contracts | | | (135,275 | ) | | |
Futures contracts | | | (492,497 | ) | | |
Swap contracts | | | (2,561,369 | ) | | |
| | | | | | |
Net realized loss | | | (1,688,790 | ) | | |
| | | | | | |
36
| | | | | | |
Net change in unrealized appreciation (depreciation) of: | | | | | | |
Investments | | $ | 4,893,387 | | | |
Foreign currencies | | | 827 | | | |
Foreign currency exchange contracts | | | 11,377 | | | |
Futures contracts | | | 1,932 | | | |
Swap contracts | | | (601,679 | ) | | |
| | | | | | |
Net change in unrealized appreciation (depreciation) | | | 4,305,844 | | | |
| | | | | | |
Net Realized and Unrealized Gain | | | 2,617,054 | | | |
| | | | | | |
Net Increase in Net Assets Resulting from Operations | | $ | 11,718,943 | | | |
| | | | | | |
See accompanying notes, which are an integral part of the financial statements.
37
Statements of changes in net assets
Delaware Diversified Floating Rate Fund
| | | | | | | | | | |
| | | Year ended | | | |
| | | 7/31/14 | | | 7/31/13 | | | |
Increase (Decrease) in Net Assets from Operations: | | | | | | | | | | |
Net investment income | | $ | 9,101,889 | | | $ | 3,593,328 | | | |
Net realized gain (loss) | | | (1,688,790 | ) | | | 1,553,312 | | | |
Net change in unrealized appreciation (depreciation) | | | 4,305,844 | | | | (2,184,865 | ) | | |
| | | | | | | | | | |
Net increase in net assets resulting from operations | | | 11,718,943 | | | | 2,961,775 | | | |
| | | | | | | | | | |
| | | |
Dividends and Distributions to Shareholders from: | | | | | | | | | | |
Net investment income: | | | | | | | | | | |
Class A | | | (3,771,203 | ) | | | (1,643,562 | ) | | |
Class C | | | (991,928 | ) | | | (457,494 | ) | | |
Class R | | | (166 | ) | | | (546 | ) | | |
Institutional Class | | | (3,215,759 | ) | | | (1,089,449 | ) | | |
| | | |
Return of capital: | | | | | | | | | | |
Class A | | | (542,903 | ) | | | (440,615 | ) | | |
Class C | | | (344,882 | ) | | | (122,647 | ) | | |
Class R | | | (2,893 | ) | | | (147 | ) | | |
Institutional Class | | | (919,304 | ) | | | (292,065 | ) | | |
| | | | | | | | | | |
| | | (9,789,038 | ) | | | (4,046,525 | ) | | |
| | | | | | | | | | |
Capital Share Transactions: | | | | | | | | | | |
Proceeds from shares sold: | | | | | | | | | | |
Class A | | | 130,841,082 | | | | 183,925,093 | | | |
Class C | | | 52,205,860 | | | | 67,175,702 | | | |
Class R | | | 855,063 | | | | 78,949 | | | |
Institutional Class | | | 216,519,940 | | | | 138,264,710 | | | |
| | | |
Net asset value of shares issued upon reinvestment of dividends and distributions: | | | | | | | | | | |
Class A | | | 3,974,862 | | | | 1,942,197 | | | |
Class C | | | 1,220,500 | | | | 535,851 | | | |
Class R | | | 2,691 | | | | 654 | | | |
Institutional Class | | | 2,791,482 | | | | 1,083,134 | | | |
| | | | | | | | | | |
| | | 408,411,480 | | | | 393,006,290 | | | |
| | | | | | | | | | |
38
| | | | | | | | | | |
| | | Year ended | | | |
| | | 7/31/14 | | | 7/31/13 | | | |
Capital Share Transactions (continued): | | | | | | | | | | |
Cost of shares redeemed: | | | | | | | | | | |
Class A | | $ | (171,843,344 | ) | | $ | (39,472,373 | ) | | |
Class C | | | (36,704,562 | ) | | | (9,438,687 | ) | | |
Class R | | | (56,446 | ) | | | (40,069 | ) | | |
Institutional Class | | | (90,347,875 | ) | | | (31,587,070 | ) | | |
| | | | | | | | | | |
| | | (298,952,227 | ) | | | (80,538,199 | ) | | |
| | | | | | | | | | |
Increase in net assets derived from capital share transactions | | | 109,459,253 | | | | 312,468,091 | | | |
| | | | | | | | | | |
Net Increase in Net Assets | | | 111,389,158 | | | | 311,383,341 | | | |
| | | |
Net Assets: | | | | | | | | | | |
Beginning of year | | | 417,554,933 | | | | 106,171,592 | | | |
| | | | | | | | | | |
End of year | | $ | 528,944,091 | | | $ | 417,554,933 | | | |
| | | | | | | | | | |
Undistributed (distributions in excess of) net investment income | | $ | (60,273 | ) | | $ | 240,741 | | | |
| | | | | | | | | | |
See accompanying notes, which are an integral part of the financial statements.
39
Financial highlights
Delaware Diversified Floating Rate Fund Class A
Selected data for each share of the Fund outstanding throughout each period were as follows:
|
| Net asset value, beginning of period |
|
| Income (loss) from investment operations: |
| Net investment income2 |
| Net realized and unrealized gain (loss) |
| Total from investment operations |
|
| Less dividends and distributions from: |
| Net investment income |
| Return of capital |
| Total dividends and distributions |
|
| Net asset value, end of period |
|
| Total return3 |
|
| Ratios and supplemental data: |
| Net assets, end of period (000 omitted) |
| Ratio of expenses to average net assets |
| Ratio of expenses to average net assets prior to fees waived |
| Ratio of net investment income to average net assets |
| Ratio of net investment income (loss) to average net assets prior to fees waived |
| Portfolio turnover |
| 1 | Date of commencement of operations; ratios have been annualized and total return has not been annualized. |
| 2 | The average shares outstanding method has been applied for per share information. |
| 3 | Total investment return is based on the change in net asset value of a share during the period and assumes reinvestment of dividends and distributions at net asset value and does not reflect the impact of a sales charge. Total investment return during all of the periods reflects waivers by the manager and/ or the distributor. Performance would have been lower had the waivers not been in effect. |
See accompanying notes, which are an integral part of the financial statements.
40
| | | | | | | | | | | | | | | | | | | | |
| | | Year ended | | | 2/26/101 to 7/31/10 | |
| | | 7/31/14 | | | 7/31/13 | | | 7/31/12 | | | 7/31/11 | | |
| | | $ 8.600 | | | $ | 8.570 | | | $ | 8.590 | | | $ | 8.490 | | | $ | 8.500 | |
| | | | | |
| | | 0.163 | | | | 0.163 | | | | 0.193 | | | | 0.166 | | | | 0.088 | |
| | | 0.042 | | | | 0.060 | | | | (0.005 | ) | | | 0.114 | | | | (0.014 | ) |
| | | | | | | | | | | | | | | | | | | | |
| | | 0.205 | | | | 0.223 | | | | 0.188 | | | | 0.280 | | | | 0.074 | |
| | | | | | | | | | | | | | | | | | | | |
| | | | | |
| | | (0.145 | ) | | | (0.175 | ) | | | (0.208 | ) | | | (0.180 | ) | | | (0.084 | ) |
| | | (0.030 | ) | | | (0.018 | ) | | | — | | | | — | | | | — | |
| | | | | | | | | | | | | | | | | | | | |
| | | (0.175 | ) | | | (0.193 | ) | | | (0.208 | ) | | | (0.180 | ) | | | (0.084 | ) |
| | | | | | | | | | | | | | | | | | | | |
| | | | | |
| | | $ 8.630 | | | $ | 8.600 | | | $ | 8.570 | | | $ | 8.590 | | | $ | 8.490 | |
| | | | | | | | | | | | | | | | | | | | |
| | | | | |
| | | 2.40% | | | | 2.61% | | | | 2.24% | | | | 3.33% | | | | 0.87% | |
| | | | | |
| | | $158,691 | | | $ | 194,795 | | | $ | 49,009 | | | $ | 55,209 | | | $ | 2,959 | |
| | | 0.95% | | | | 1.01% | | | | 1.05% | | | | 1.05% | | | | 1.04% | |
| | | | | |
| | | 0.96% | | | | 1.06% | | | | 1.12% | | | | 1.34% | | | | 4.92% | |
| | | 1.89% | | | | 1.88% | | | | 2.28% | | | | 1.92% | | | | 2.43% | |
| | | | | |
| | | 1.88% | | | | 1.83% | | | | 2.21% | | | | 1.63% | | | | (1.45% | ) |
| | | 96% | | | | 112% | | | | 97% | | | | 75% | | | | 39% | |
41
Financial highlights
Delaware Diversified Floating Rate Fund Class C
Selected data for each share of the Fund outstanding throughout each period were as follows:
|
| Net asset value, beginning of period |
|
| Income (loss) from investment operations: |
| Net investment income2 |
| Net realized and unrealized gain (loss) |
| Total from investment operations. |
|
| Less dividends and distributions from: |
| Net investment income |
| Return of capital |
| Total dividends and distributions |
|
| Net asset value, end of period |
|
| Total return3 |
|
| Ratios and supplemental data: |
| Net assets, end of period (000 omitted) |
| Ratio of expenses to average net assets |
| Ratio of expenses to average net assets prior to fees waived |
| Ratio of net investment income to average net assets |
| Ratio of net investment income (loss) to average net assets prior to fees waived |
| Portfolio turnover |
| 1 | Date of commencement of operations; ratios have been annualized and total return has not been annualized. |
| 2 | The average shares outstanding method has been applied for per share information. |
| 3 | Total investment return is based on the change in net asset value of a share during the period and assumes reinvestment of dividends and distributions at net asset value and does not reflect the impact of a sales charge. Total investment return during some of the periods reflects a waiver by the manager. Performance would have been lower had the waiver not been in effect. |
See accompanying notes, which are an integral part of the financial statements.
42
| | | | | | | | | | | | | | | | | | | | |
| | | Year ended | | | 2/26/101 to | |
| | | 7/31/14 | | | 7/31/13 | | | 7/31/12 | | | 7/31/11 | | | 7/31/10 | |
| | $ | 8.600 | | | $ | 8.570 | | | $ | 8.590 | | | $ | 8.490 | | | $ | 8.500 | |
| | | | | |
| | | 0.098 | | | | 0.098 | | | | 0.130 | | | | 0.102 | | | | 0.062 | |
| | | 0.042 | | | | 0.060 | | | | (0.006 | ) | | | 0.116 | | | | (0.014 | ) |
| | | | | | | | | | | | | | | | | | | | |
| | | 0.140 | | | | 0.158 | | | | 0.124 | | | | 0.218 | | | | 0.048 | |
| | | | | | | | | | | | | | | | | | | | |
| | | | | |
| | | (0.080 | ) | | | (0.110 | ) | | | (0.144 | ) | | | (0.118 | ) | | | (0.058 | ) |
| | | (0.030 | ) | | | (0.018 | ) | | | — | | | | — | | | | — | |
| | | | | | | | | | | | | | | | | | | | |
| | | (0.110 | ) | | | (0.128 | ) | | | (0.144 | ) | | | (0.118 | ) | | | (0.058 | ) |
| | | | | | | | | | | | | | | | | | | | |
| | | | | |
| | $ | 8.630 | | | $ | 8.600 | | | $ | 8.570 | | | $ | 8.590 | | | $ | 8.490 | |
| | | | | | | | | | | | | | | | | | | | |
| | | | | |
| | | 1.64% | | | | 1.85% | | | | 1.47% | | | | 2.58% | | | | 0.56% | |
| | | | | |
| | $ | 100,779 | | | $ | 83,619 | | | $ | 25,495 | | | $ | 25,769 | | | $ | 1,714 | |
| | | 1.70% | | | | 1.76% | | | | 1.80% | | | | 1.80% | | | | 1.79% | |
| | | | | |
| | | 1.70% | | | | 1.76% | | | | 1.82% | | | | 2.04% | | | | 5.62% | |
| | | 1.14% | | | | 1.13% | | | | 1.53% | | | | 1.17% | | | | 1.68% | |
| | | | | |
| | | 1.14% | | | | 1.13% | | | | 1.51% | | | | 0.93% | | | | (2.15% | ) |
| | | 96% | | | | 112% | | | | 97% | | | | 75% | | | | 39% | |
43
Financial highlights
Delaware Diversified Floating Rate Fund Class R
Selected data for each share of the Fund outstanding throughout each period were as follows:
|
| Net asset value, beginning of period |
|
| Income (loss) from investment operations: |
| Net investment income2 |
| Net realized and unrealized gain (loss) |
| Total from investment operations. |
|
| Less dividends and distributions from: |
| Net investment income |
| Return of capital |
| Total dividends and distributions |
|
| Net asset value, end of period |
|
| Total return4 |
|
| Ratios and supplemental data: |
| Net assets, end of period (000 omitted) |
| Ratio of expenses to average net assets |
| Ratio of expenses to average net assets prior to fees waived |
| Ratio of net investment income to average net assets |
| Ratio of net investment income (loss) to average net assets prior to fees waived |
| Portfolio turnover |
| 1 | Date of commencement of operations; ratios have been annualized and total return has not been annualized. |
| 2 | The average shares outstanding method has been applied for per share information. |
| 3 | Includes adjustments from the period ending July 31, 2010 in the amount of $9 (or $0.010 per share) which impacted total return by -0.12%. The adjustment is to correct a misallocation of distributions among share classes which had no impact on distribution amounts reported and paid to shareholders. |
| 4 | Total investment return is based on the change in net asset value of a share during the period and assumes reinvestment of dividends and distributions at net asset value. Total investment return during all of the periods reflects a waiver by the manager and/or the distributor. Performance would have been lower had the waivers not been in effect. |
See accompanying notes, which are an integral part of the financial statements.
44
| | | | | | | | | | | | | | | | | | | | |
| | | Year ended | | | 2/26/101 to 7/31/10 | |
| | | 7/31/14 | | | 7/31/13 | | | 7/31/12 | | | 7/31/11 | | |
| | | $8.600 | | | $ | 8.570 | | | $ | 8.590 | | | $ | 8.500 | | | $ | 8.500 | |
| | | | | |
| | | 0.142 | | | | 0.141 | | | | 0.173 | | | | 0.145 | | | | 0.079 | |
| | | 0.041 | | | | 0.060 | | | | (0.011 | ) | | | 0.1063 | | | | (0.004 | ) |
| | | | | | | | | | | | | | | | | | | | |
| | | 0.183 | | | | 0.201 | | | | 0.162 | | | | 0.2513 | | | | 0.075 | |
| | | | | | | | | | | | | | | | | | | | |
| | | | | |
| | | (0.123 | ) | | | (0.153 | ) | | | (0.182 | ) | | | (0.161 | ) | | | (0.075 | ) |
| | | (0.030 | ) | | | (0.018 | ) | | | — | | | | — | | | | — | |
| | | | | | | | | | | | | | | | | | | | |
| | | (0.153 | ) | | | (0.171 | ) | | | (0.182 | ) | | | (0.161 | ) | | | (0.075 | ) |
| | | | | | | | | | | | | | | | | | | | |
| | | $8.630 | | | $ | 8.600 | | | $ | 8.570 | | | $ | 8.5903 | | | $ | 8.500 | |
| | | | | | | | | | | | | | | | | | | | |
| | | | | |
| | | 2.15% | | | | 2.36% | | | | 1.93% | | | | 2.96% | | | | 0.89% | |
| | | | | |
| | | $845 | | | $ | 44 | | | $ | 5 | | | $ | 5 | | | $ | 5 | |
| | | 1.20% | | | | 1.26% | | | | 1.30% | | | | 1.30% | | | | 1.29% | |
| | | | | |
| | | 1.20% | | | | 1.36% | | | | 1.42% | | | | 1.64% | | | | 5.22% | |
| | | 1.64% | | | | 1.63% | | | | 2.03% | | | | 1.67% | | | | 2.18% | |
| | | | | |
| | | 1.64% | | | | 1.53% | | | | 1.91% | | | | 1.33% | | | | (1.75% | ) |
| | | 96% | | | | 112% | | | | 97% | | | | 75% | | | | 39% | |
| |
45
Financial highlights
Delaware Diversified Floating Rate Fund Institutional Class
Selected data for each share of the Fund outstanding throughout each period were as follows:
|
Net asset value, beginning of period |
|
Income (loss) from investment operations: |
Net investment income2 |
Net realized and unrealized gain (loss) |
Total from investment operations. |
|
Less dividends and distributions from: |
Net investment income |
Return of capital |
Total dividends and distributions |
|
Net asset value, end of period |
|
Total return3 |
|
Ratios and supplemental data: |
Net assets, end of period (000 omitted) |
Ratio of expenses to average net assets |
Ratio of expenses to average net assets prior to fees waived |
Ratio of net investment income to average net assets |
Ratio of net investment income (loss) to average net assets prior to fees waived |
Portfolio turnover |
| 1 | Date of commencement of operations; ratios have been annualized and total return has not been annualized. |
| 2 | The average shares outstanding method has been applied for per share information. |
| 3 | Total investment return is based on the change in net asset value of a share during the period and assumes reinvestment of dividends and distributions at net asset value. Total investment return during some of the periods shown reflects a waiver by the manager. Performance would have been lower had the waiver not been in effect. |
See accompanying notes, which are an integral part of the financial statements.
46
| | | | | | | | | | | | | | | | | | | | |
| | | Year ended | | | 2/26/101 to | |
| | | 7/31/14 | | | 7/31/13 | | | 7/31/12 | | | 7/31/11 | | | 7/31/10 | |
| | $ | 8.600 | | | $ | 8.570 | | | $ | 8.590 | | | $ | 8.490 | | | $ | 8.500 | |
| | | | | |
| | | 0.184 | | | | 0.184 | | | | 0.214 | | | | 0.187 | | | | 0.098 | |
| | | 0.042 | | | | 0.061 | | | | (0.005) | | | | 0.117 | | | | (0.016) | |
| | | | | | | | | | | | | | | | | | | | |
| | | 0.226 | | | | 0.245 | | | | 0.209 | | | | 0.304 | | | | 0.082 | |
| | | | | | | | | | | | | | | | | | | | |
| | | | | |
| | | (0.166) | | | | (0.197) | | | | (0.229) | | | | (0.204) | | | | (0.092) | |
| | | (0.030) | | | | (0.018) | | | | — | | | | — | | | | — | |
| | | | | | | | | | | | | | | | | | | | |
| | | (0.196) | | | | (0.215) | | | | (0.229) | | | | (0.204) | | | | (0.092) | |
| | | | | | | | | | | | | | | | | | | | |
| | $ | 8.630 | | | $ | 8.600 | | | $ | 8.570 | | | $ | 8.590 | | | $ | 8.490 | |
| | | | | | | | | | | | | | | | | | | | |
| | | | | |
| | | 2.66% | | | | 2.87% | | | | 2.49% | | | | 3.61% | | | | 0.97% | |
| | | | | |
| | $ | 268,629 | | | $ | 139,097 | | | $ | 31,663 | | | $ | 33,231 | | | $ | 3,394 | |
| | | 0.70% | | | | 0.76% | | | | 0.80% | | | | 0.80% | | | | 0.79% | |
| | | | | |
| | | 0.70% | | | | 0.76% | | | | 0.82% | | | | 1.04% | | | | 4.62% | |
| | | 2.14% | | | | 2.13% | | | | 2.53% | | | | 2.17% | | | | 2.68% | |
| | | | | |
| | | 2.14% | | | | 2.13% | | | | 2.51% | | | | 1.93% | | | | (1.15%) | |
| | | 96% | | | | 112% | | | | 97% | | | | 75% | | | | 39% | |
| |
47
Notes to financial statements
| | |
| Delaware Diversified Floating Rate Fund | | July 31, 2014 |
Delaware Group® Income Funds (Trust) is organized as a Delaware statutory trust and offers five series: Delaware Core Bond Fund, Delaware Corporate Bond Fund, Delaware Diversified Floating Rate Fund, Delaware Extended Duration Bond Fund, and Delaware High-Yield Opportunities Fund. These financial statements and the related notes pertain to Delaware Diversified Floating Rate Fund (Fund). The Trust is an open-end investment company. The Fund is considered diversified under the Investment Company Act of 1940, as amended, and offers Class A, Class C, Class R, and Institutional Class shares. Class A shares are sold with a maximum front-end sales charge of 2.75%. Class A share purchases of $1,000,000 or more will incur a contingent deferred sales charge (CDSC) of 0.75% if redeemed during the first year, provided that Delaware Distributors, L.P. (DDLP) paid a financial advisor a commission on the purchase of those shares. Class C shares are sold with a CDSC of 1.00%, if redeemed during the first 12 months. Class R and Institutional Class shares are not subject to a sales charge and are offered for sale exclusively to certain eligible investors.
The investment objective of the Fund is to seek total return.
1. Significant Accounting Policies
The following accounting policies are in accordance with U.S. generally accepted accounting principles (U.S. GAAP) and are consistently followed by the Fund.
Security Valuation — Equity securities, except those traded on the Nasdaq Stock Market, Inc. (Nasdaq), are valued at the last quoted sales price as of the time of the regular close of the New York Stock Exchange on the valuation date. Securities traded on the Nasdaq are valued in accordance with the Nasdaq Official Closing Price, which may not be the last sales price. If, on a particular day, an equity security does not trade, then the mean between the bid and ask prices will be used, which approximates fair value. Debt securities, credit default swap (CDS) contracts, and interest rate swap contracts are valued based upon valuations provided by an independent pricing service or broker/counterparty and reviewed by management. To the extent current market prices are not available, the pricing service may take into account developments related to the specific security, as well as transactions in comparable securities. U.S. government and agency securities are valued at the mean between the bid and ask prices, which approximates fair value. Valuations for fixed income securities utilize matrix systems, which reflect such factors as security prices, yields, maturities, and ratings, and are supplemented by dealer and exchange quotations. For asset-backed securities, collateralized mortgage obligations, commercial mortgage securities and U.S. government agency mortgage securities, pricing vendors utilize matrix pricing which considers prepayment speed, attributes of the collateral, yield or price of bonds of comparable quality, coupon, maturity, and type as well as broker/dealer-supplied prices. Swap prices are derived using daily swap curves and models that incorporate a number of market data factors, such as discounted cash flows, trades and values of the underlying reference instruments. Foreign currency exchange contracts and foreign cross currency exchange contracts are valued at the mean between the bid and ask prices, which approximates fair value. Interpolated values are derived when the settlement date of the contract is an interim date for which quotations are not available. Futures contracts and options on futures contracts are valued at the daily quoted settlement prices. Generally, other securities and assets for which market quotations are not readily available are valued at fair value as determined in good faith under the direction of the Fund’s Board of Trustees (Board). In determining whether market
48
quotations are readily available or fair valuation will be used, various factors will be taken into consideration, such as market closures or suspension of trading in a security.
Federal and Foreign Income Taxes — No provision for federal income taxes has been made as the Fund intends to continue to qualify for federal income tax purposes as a regulated investment company under Subchapter M of the Internal Revenue Code of 1986, as amended, and make the requisite distributions to shareholders. The Fund evaluates tax positions taken or expected to be taken in the course of preparing the Fund’s tax returns to determine whether the tax positions are “more-likely-than-not” of being sustained by the applicable tax authority. Tax positions not deemed to meet the “more-likely-than-not” threshold are recorded as a tax benefit or expense in the current year.
Management has analyzed the Fund’s tax positions taken for all open federal income tax years (July 31, 2011–July 31, 2014) and has concluded that no provision for federal income tax is required in the Fund’s financial statements. In regard to foreign taxes only, the Fund has open tax years in certain foreign countries it invests in that may date back to the inception of the Fund.
Class Accounting — Investment income and common expenses are allocated to the various classes of the Fund on the basis of “settled shares” of each class in relation to the net assets of the Fund. Realized and unrealized gain (loss) on investments are allocated to the various classes of the Fund on the basis of daily net assets of each class. Distribution expenses relating to a specific class are charged directly to that class.
Repurchase Agreements — The Fund may purchase certain U.S. government securities subject to the counterparty’s agreement to repurchase them at an agreed upon date and price. The counterparty will be required on a daily basis to maintain the value of the collateral subject to the agreement at not less than the repurchase price (including accrued interest). The agreements are conditioned upon the collateral being deposited under the Federal Reserve book-entry system with the Fund’s custodian or a third-party sub-custodian. In the event of default or bankruptcy by the other party to the agreement, retention of the collateral may be subject to legal proceedings. All open repurchase agreements as of the date of this report were entered into on July 31, 2014.
Foreign Currency Transactions — Transactions denominated in foreign currencies are recorded at the prevailing exchange rates on the valuation date in accordance with the Fund’s prospectus. The value of all assets and liabilities denominated in foreign currencies is translated daily into U.S. dollars at the exchange rate of such currencies against the U.S. dollar. Transaction gains or losses resulting from changes in exchange rates during the reporting period or upon settlement of the foreign currency transaction are reported in operations for the current period. The Fund generally bifurcates that portion of realized gains and losses on investments in debt securities which is due to changes in foreign exchange rates from that which is due to changes in market prices of debt securities. That portion of gains (losses) is included in the “Statement of operations” under “Net realized gain (loss) on foreign currencies.” The Fund reports certain foreign currency related transactions as components of realized gains (losses) for financial reporting purposes, whereas such components are treated as ordinary income (loss) for federal income tax purposes.
Use of Estimates — The preparation of financial statements in conformity with U.S. GAAP requires management to make estimates and assumptions that affect the fair value of investments, the reported
49
Notes to financial statements
Delaware Diversified Floating Rate Fund
1. Significant Accounting Policies (continued)
amounts of assets and liabilities and disclosure of contingent assets and liabilities at the date of the financial statements, and the reported amounts of revenues and expenses during the reporting period. Actual results could differ from those estimates and the differences could be material.
Other — Expenses directly attributable to the Fund are charged directly to the Fund. Other expenses common to various funds within the Delaware Investments® Family of Funds are generally allocated among such funds on the basis of average net assets. Management fees and some other expenses are paid monthly. Security transactions are recorded on the date the securities are purchased or sold (trade date) for financial reporting purposes. Costs used in calculating realized gains and losses on the sale of investment securities are those of the specific securities sold. Dividend income is recorded on the ex-dividend date and interest income is recorded on the accrual basis. Discounts and premiums on debt securities are amortized to interest income over the lives of the respective securities using the effective interest method. Realized gains (losses) on paydowns of asset- and mortgage-backed securities are classified as interest income. The Fund declares dividends daily from net investment income and pays the dividends monthly and declares and pays distributions from net realized gain on investments, if any, annually. The Fund may distribute more frequently, if necessary for tax purposes. Dividends and distributions, if any, are recorded on the ex-dividend date.
The Fund may receive earnings credits from its custodian when positive cash balances are maintained, which may be used to offset custody fees. There were no earnings credits for the year ended July 31, 2014.
The Fund receives earnings credits from its transfer agent when positive cash balances are maintained, which may be used to offset transfer agent fees. If the amount earned is greater than one dollar, the expense paid under this arrangement is included on the “Statement of operations” under “Dividend disbursing and transfer agent fees and expenses” with the corresponding expense offset shown under “Less expense paid indirectly.” For the year ended July 31, 2014, the Fund earned $73 under this agreement.
2. Investment Management, Administration Agreements and Other Transactions with Affiliates
In accordance with the terms of its investment management agreement, the Fund pays Delaware Management Company (DMC), a series of Delaware Management Business Trust and the investment manager, an annual fee which is calculated daily at the rate of 0.50% on the first $500 million of average daily net assets of the Fund, 0.475% on the next $500 million, 0.45% on the next $1.5 billion, and 0.425% on average daily net assets in excess of $2.5 billion.
DMC has contractually agreed to waive that portion, if any, of its management fee and reimburse the Fund to the extent necessary to ensure that total annual operating expenses (excluding any 12b-1 fees, acquired fund fees and expenses, taxes, interest, inverse floater program expenses, short sale and dividend interest expenses, brokerage fees, certain insurance costs, and nonroutine expenses or costs, including, but not limited to, those relating to reorganizations, litigation, conducting shareholder meetings, and liquidations (collectively, nonroutine expenses)), do not exceed 0.80% of the Fund’s average daily net assets from Aug. 1, 2013 through July 31, 2014.* For purposes of this waiver and reimbursement, nonroutine expenses may also include such additional costs and expenses, as may be
50
agreed upon from time to time by the Fund’s Board and DMC. This expense waiver and reimbursement applies only to expenses paid directly by the Fund and may only be terminated by agreement of DMC and the Fund.
*The contractual waiver period is Nov. 28, 2012 through Nov. 28, 2014.
Delaware Service Company, Inc. (DSC), an affiliate of DMC, provides fund accounting and financial administration oversight services to the Fund. For these services, the Fund pays DSC fees based on the aggregate daily net assets of the Delaware Investments® Family of Funds at the following annual rate: 0.0050% of the first $30 billion; 0.0045% of the next $10 billion; 0.0040% of the next $10 billion; and 0.0025% of aggregate average daily net assets in excess of $50 billion. The fees payable to DSC under the service agreement described above are allocated among all Funds in the Delaware Investments Family of Funds on a relative net asset value basis. For the year ended July 31, 2014, the Fund was charged $24,029 for these services.
DSC is also the transfer agent and dividend disbursing agent of the Fund. For these services, the Fund pays DSC fees based on the aggregate daily net assets of the retail funds within the Delaware Investments Family of Funds at the following annual rate: 0.025% of the first $20 billion; 0.020% of the next $5 billion, 0.015% of the next $5 billion; and 0.013% of average daily net assets in excess of $30 billion. This amount is included on the “Statement of operations” under “Dividend disbursing and transfer agent fees and expenses.” For the year ended July 31, 2014, the amount charged by DSC was $109,253. Pursuant to a sub-transfer agency agreement between DSC and BNY Mellon Investment Servicing (US) Inc. (BNYMIS), BNYMIS provides certain sub-transfer agency services to the Fund. Sub-transfer agency fees are passed on to and paid directly by the Fund.
Pursuant to a distribution agreement and distribution plan, the Fund pays DDLP, the distributor and an affiliate of DMC, an annual distribution and service fee of 1.00% of the average daily net assets of the Class C shares. Effective Oct. 1, 2013, the Fund pays DDLP an annual distribution and service fee of 0.25% and 0.50% of the average daily net assets of the Class A and Class R shares, respectively. Prior to Oct. 1, 2013, the Fund paid an annual distribution and service fee of 0.30% and 0.60% of the average daily net assets of the Class A and Class R shares, respectively. For the period from Aug. 1, 2013 to Oct. 1, 2013, the distribution and service fees for the Fund’s Class A and Class R shares were contractually limited to 0.25% and 0.50% of the classes’ average daily net assets. These waivers and reimbursements may only be terminated by agreement of DDLP and the Fund. Institutional Class shares pay no distribution and service fees.
As provided in the investment management agreement, the Fund bears a portion of the cost of certain resources shared with DMC, including the cost of internal personnel of DMC and/or its affiliates that provide legal, tax, and regulatory reporting services to the Fund. For the year ended July 31, 2014, the Fund was charged $14,206 for internal legal, tax, and regulatory reporting services provided by DMC and/or its affiliates’ employees.
For the year ended July 31, 2014, DDLP earned $3,672 for commissions on sales of the Fund’s Class A shares. For the year ended July 31, 2014, DDLP received gross CDSC commissions of $227 and
51
Notes to financial statements
Delaware Diversified Floating Rate Fund
2. Investment Management, Administration Agreements and Other Transactions with Affiliates (continued)
$4,737 on redemptions of the Fund’s Class A and Class C shares, respectively, and these commissions were entirely used to offset upfront commissions previously paid by DDLP to broker/dealers on sales of those shares.
Trustees’ fees include expenses accrued by the Fund for each Trustee’s retainer and meeting fees. Certain officers of DMC, DSC, and DDLP are officers and/or Trustees of the Trust. These officers and Trustees are paid no compensation by the Fund.
3. Investments
For the year ended July 31, 2014, the Fund made purchases and sales of investment securities other than short-term investments as follows:
| | | | |
Purchases other than U.S. government securities | | $ | 542,540,873 | |
Purchases of U.S. government securities | | | 36,850,678 | |
Sales other than U.S. government securities | | | 429,813,037 | |
Sales of U.S. government securities | | | 37,180,169 | |
At July 31, 2014, the cost of investments and unrealized appreciation (depreciation) for federal income tax purposes were as follows:
| | | | |
Cost of investments | | $ | 535,435,821 | |
| | | | |
Aggregate unrealized appreciation | | $ | 5,862,188 | |
Aggregate unrealized depreciation | | | (1,685,409 | ) |
| | | | |
Net unrealized appreciation | | $ | 4,176,779 | |
| | | | |
U.S. GAAP defines fair value as the price that the Fund would receive to sell an asset or pay to transfer a liability in an orderly transaction between market participants at the measurement date under current market conditions. A three-level hierarchy for fair value measurements has been established based upon the transparency of inputs to the valuation of an asset or liability. Inputs may be observable or unobservable and refer broadly to the assumptions that market participants would use in pricing the asset or liability. Observable inputs reflect the assumptions market participants would use in pricing the asset or liability based on market data obtained from sources independent of the reporting entity. Unobservable inputs reflect the reporting entity’s own assumptions about the assumptions that market participants would use in pricing the asset or liability developed based on the best information available under the circumstances. The Fund’s investment in its entirety is assigned a level based upon the observability of the inputs which are significant to the overall valuation. The three-level hierarchy of inputs is summarized below.
| | |
| Level 1 – | | Inputs are quoted prices in active markets for identical investments. (Examples: equity securities, open-end investment companies, futures contracts, exchange-traded options contracts) |
| |
| Level 2 – | | Other observable inputs, including, but not limited to: quoted prices for similar assets or liabilities in markets that are active, quoted prices for identical or similar assets or liabilities in |
52
| | |
| | markets that are not active, inputs other than quoted prices that are observable for the assets or liabilities (such as interest rates, yield curves, volatilities, prepayment speeds, loss severities, credit risks and default rates) or other market-corroborated inputs. (Examples: debt securities, government securities, swap contracts, foreign currency exchange contracts, foreign securities utilizing international fair value pricing, broker-quoted securities, fair value securities) |
| |
| Level 3 – | | Significant unobservable inputs, including the Fund’s own assumptions used to determine the fair value of investments. (Examples: broker-quoted securities, fair valued securities) |
Level 3 investments are valued using significant unobservable inputs. The Fund may also use an income-based valuation approach in which the anticipated future cash flows of the investment are discounted to calculate fair value. Discounts may also be applied due to the nature or duration of any restrictions on the disposition of the investments. Valuations may also be based upon current market prices of securities that are comparable in coupon, rating, maturity, and industry. The derived value of a Level 3 investment may not represent the value which is received upon disposition and this could impact the results of operations.
The following table summarizes the valuation of the Fund’s investments by fair value hierarchy levels as of July 31, 2014:
| | | | | | | | | | | | |
| | | Level 1 | | | Level 2 | | | Total | |
| | | |
Agency, Asset- & Mortgage-Backed Securities | | $ | — | | | $ | 31,613,052 | | | $ | 31,613,052 | |
Corporate Debt | | | — | | | | 316,030,030 | | | | 316,030,030 | |
Sovereign Bonds | | | — | | | | 1,935,653 | | | | 1,935,653 | |
Municipal Bonds | | | — | | | | 8,004,181 | | | | 8,004,181 | |
Senior Secured Loans | | | — | | | | 165,660,448 | | | | 165,660,448 | |
Convertible Preferred Stock1 | | | 707,029 | | | | 330,327 | | | | 1,037,356 | |
Preferred Stock | | | 1,590,432 | | | | — | | | | 1,590,432 | |
Short-Term Investments | | | — | | | | 13,741,448 | | | | 13,741,448 | |
| | | | | | | | | | | | |
| | | |
Total | | $ | 2,297,461 | | | $ | 537,315,139 | | | $ | 539,612,600 | |
| | | | | | | | | | | | |
Futures Contracts | | $ | 1,932 | | | $ | — | | | $ | 1,932 | |
Swap Contracts | | | — | | | | (670,989 | ) | | | (670,989 | ) |
1 Security type is valued across multiple levels. Level 1 investments represent exchange-traded investments, and Level 2 investments represent investments with observable inputs. The amounts attributed to Level 1 investments, and Level 2 investments represent the following percentages of the total market value of this security type:
| | | | | | | | | | | | |
| | | Level 1 | | | Level 2 | | | Total | |
| | | |
Convertible Preferred Stock | | | 68.16 | % | | | 31.84 | % | | | 100.00 | % |
During the year ended July 31, 2014, there were no transfers between Level 1 investments, Level 2 investments, or Level 3 investments that had a significant impact to the Fund. The Fund’s policy is to recognize transfers between levels at the beginning of the reporting period.
53
Notes to financial statements
Delaware Diversified Floating Rate Fund
A reconciliation of Level 3 investments is presented when the Fund has a significant amount of Level 3 investments at the beginning, interim, or end of the period in relation to net assets. At July 31, 2014, there were no Level 3 investments.
4. Dividend and Distribution Information
Income and long-term capital gain distributions are determined in accordance with federal income tax regulations, which may differ from U.S. GAAP. Additionally, distributions from net gains on foreign currency transactions and net short-term gains on sales of investment securities are treated as ordinary income for federal income tax purposes. The tax character of dividends and distributions paid during the years ended July 31, 2014 and 2013 were as follows:
| | | | | | | | |
| | | Year ended | |
| | |
| | | 7/31/14 | | | 7/31/13 | |
Ordinary income | | $ | 7,979,056 | | | $ | 3,028,266 | |
Long-term capital gains | | | — | | | | 162,785 | |
Return of capital | | | 1,809,982 | | | | 855,474 | |
| | | | | | | | |
Total | | $ | 9,789,038 | | | $ | 4,046,525 | |
| | | | | | | | |
5. Components of Net Assets on a Tax Basis
As of July 31, 2014, the components of net assets on a tax basis were as follows:
| | | | |
Shares of beneficial interest | | $ | 526,231,018 | |
Dividends payable | | | (260,960 | ) |
Other temporary differences | | | (390 | ) |
Capital loss carryforwards | | | (498,455 | ) |
Unrealized appreciation | | | 3,472,878 | |
| | | | |
Net assets | | $ | 528,944,091 | |
| | | | |
The differences between book basis and tax basis components of net assets are primarily attributable to tax deferral of losses on wash sales, tax treatment of CDS contracts, mark-to-market of futures contracts, tax treatment of contingent payment on debt instruments, tax deferral of losses on straddles and tax treatment of market discount and premium on debt instruments.
For financial reporting purposes, capital accounts are adjusted to reflect the tax character of permanent book/tax differences. Reclassifications are primarily due to tax treatment of gain (loss) on foreign currency transactions, contingent payment debt instruments, market discount and premium on certain debt instruments, paydowns of mortgage- and asset-backed securities, and tax treatment of CDS contracts. Results of operations and net assets were not affected by these reclassifications. For the year ended July 31, 2014, the Fund recorded the following reclassifications.
| | | | |
Distributions in excess of net investment income | | $ | (1,423,847 | ) |
Accumulated net realized loss | | | 1,423,847 | |
On Dec. 22, 2010, the Regulated Investment Company Modernization Act of 2010 (Act) was enacted, which changed various technical rules governing the tax treatment of regulated investment companies.
54
The changes were generally effective for taxable years beginning after the date of enactment. Under the Act, the Fund is permitted to carry forward capital losses incurred in taxable years beginning after the date of enactment for an unlimited period. Additionally, post-enactment capital loss carryforwards will retain their character as either short-term or long-term capital losses rather than being considered all short-term as permitted under previous regulation.
Losses incurred that will be carried forward under the Act are as follows:
| | | | | | | | |
| | | Loss carryforward character | |
| | |
| | | Short-term | | | Long-term | |
| | $ | 144,714 | | | $ | 353,741 | |
6. Capital Shares
Transactions in capital shares were as follows:
| | | | | | | | |
| | | Year ended | |
| | |
| | | 7/31/14 | | | 7/31/13 | |
Shares sold: | | | | | | | | |
Class A | | | 15,206,757 | | | | 21,283,523 | |
Class C | | | 6,073,699 | | | | 7,783,697 | |
Class R | | | 99,113 | | | | 9,119 | |
Institutional Class | | | 25,126,646 | | | | 16,019,956 | |
| | |
Shares issued upon reinvestment of dividends and distributions: | | | | | | | | |
Class A | | | 461,521 | | | | 224,721 | |
Class C | | | 141,692 | | | | 62,028 | |
Class R | | | 312 | | | | 76 | |
Institutional Class | | | 324,035 | | | | 125,407 | |
| | | | | | | | |
| | | 47,433,775 | | | | 45,508,527 | |
| | | | | | | | |
| | |
Shares redeemed: | | | | | | | | |
Class A | | | (19,931,678 | ) | | | (4,572,137 | ) |
Class C | | | (4,260,356 | ) | | | (1,093,407 | ) |
Class R | | | (6,571 | ) | | | (4,659 | ) |
Institutional Class | | | (10,490,343 | ) | | | (3,658,687 | ) |
| | | | | | | | |
| | | (34,688,948 | ) | | | (9,328,890 | ) |
| | | | | | | | |
Net increase | | | 12,744,827 | | | | 36,179,637 | |
| | | | | | | | |
Certain shareholders of Class A and Class C shares may exchange their shares for Institutional Class shares. For the year ended July 31, 2014, 83,073 Class A shares and 63,345 Class C shares were converted to 146,452 Institutional Class shares valued at $1,265,349. These exchange transactions are included as subscriptions and redemptions in the table above.
55
Notes to financial statements
Delaware Diversified Floating Rate Fund
7. Line of Credit
The Fund, along with certain other funds in the Delaware Investments® Family of Funds (Participants), was a participant in a $125,000,000 revolving line of credit to be used for temporary or emergency purposes as an additional source of liquidity to fund redemptions of investor shares. Under the agreement, the Participants were charged an annual commitment fee of 0.08%, which was allocated across the Participants on the basis of each Participant’s allocation of the entire facility. The Participants were permitted to borrow up to a maximum of one third of their net assets under the agreement. Each Participant was individually, and not jointly, liable for its particular advances, if any, under the line of credit. The line of credit under the agreement expired on Nov. 12, 2013.
On Nov. 12, 2013, the Fund, along with the other Participants, entered into an amendment to the agreement for a $225,000,000 revolving line of credit. The line of credit is to be used as described above and operates in substantially the same manner as the original agreement. The line of credit available under the agreement expires on Nov. 10, 2014.
The Fund had no amounts outstanding as of July 31, 2014 or at any time during the year then ended.
8. Unfunded Commitments
The Fund may invest in floating rate loans. In connection with these investments, the Fund may also enter into unfunded corporate loan commitments (commitments). Commitments may obligate the Fund to furnish temporary financing to a borrower until permanent financing can be arranged. In connection with these commitments, the Fund earns a commitment fee, typically set as a percentage of the commitment amount. As of July 31, 2014, the Fund had the following unfunded loan commitments:
| | | | |
| Borrower | | | |
Polymer Group | | $ | 98,072 | |
WR Grace | | | 649,688 | |
9. Derivatives
U.S. GAAP requires disclosures that enable investors to understand: (1) how and why an entity uses derivatives; (2) how they are accounted for; and (3) how they affect an entity’s results of operations and financial position.
Foreign Currency Exchange Contracts — The Fund may enter into foreign currency exchange contracts and foreign cross currency exchange contracts as a way of managing foreign exchange rate risk. The Fund may enter into these contracts to fix the U.S. dollar value of a security that it has agreed to buy or sell for the period between the date the trade was entered into and the date the security is delivered and paid for. The Fund may also use these contracts to hedge the U.S. dollar value of securities it already owns that are denominated in foreign currencies. In addition, The Fund may enter into these contracts to facilitate or expedite the settlement of portfolio transactions. The change in value is recorded as an unrealized gain or loss. When the contract is closed, a realized gain or loss is recorded equal to the difference between the value of the contract at the time it was opened and the value at the time it was closed.
56
The use of foreign currency exchange contracts and foreign cross currency exchange contracts does not eliminate fluctuations in the underlying prices of the securities, but does establish a rate of exchange that can be achieved in the future. Although foreign currency exchange contracts and foreign cross currency exchange contracts limit the risk of loss due to an unfavorable change in the value of the hedged currency, they also limit any potential gain that might result should the value of the currency change favorably. In addition, the Fund could be exposed to risks if the counterparties to the contracts are unable to meet the terms of their contracts. The Fund’s maximum risk of loss from counterparty credit risk is the value of its currency exchanged with the counterparty. The risk is generally mitigated by having a netting arrangement between the Fund and the counterparty and by the posting of collateral by the counterparty to the Fund to cover the Fund’s exposure to the counterparty. No foreign currency exchange contracts were outstanding at July 31, 2014.
During the year ended July 31, 2014, the Fund used foreign currency exchange contracts to hedge the U.S. dollar value of securities it already owns that are denominated in foreign currencies.
Futures Contracts — A futures contract is an agreement in which the writer (or seller) of the contract agrees to deliver to the buyer an amount of cash or securities equal to a specific dollar amount times the difference between the value of a specific security or index at the close of the last trading day of the contract and the price at which the agreement is made. The Fund may use futures in the normal course of pursuing its investment objective. The Fund may invest in futures contracts to hedge its existing portfolio securities against fluctuations in fair value caused by changes in interest rates or market conditions. Upon entering into a futures contract, the Fund deposits cash or pledges U.S. government securities to a broker, equal to the minimum “initial margin” requirements of the exchange on which the contract is traded. Subsequent payments are received from the broker or paid to the broker each day, based on the daily fluctuation in the market value of the contract. These receipts or payments are known as “variation margin” and are recorded daily by the Fund as unrealized gains or losses until the contracts are closed. When the contracts are closed, the Fund records a realized gain or loss equal to the difference between the value of the contract at the time it was opened and the value at the time it was closed. Risks of entering into futures contracts include potential imperfect correlation between the futures contracts and the underlying securities and the possibility of an illiquid secondary market for these instruments. When investing in futures, there is reduced counterparty credit risk to the Fund because futures are exchange-traded and the exchange’s clearinghouse, as counterparty to all exchange-traded futures, guarantees against default. At July 31, 2014, the Fund posted $191,000 cash collateral for open futures contracts, which is included on the “Statement of asset and liabilities” under “Cash collateral due from brokers.”
During the year ended July 31, 2014, the Fund used futures contracts to hedge the Fund’s existing portfolio securities against fluctuations in value caused by changes in interest rates or market conditions.
Swap Contracts — The Fund may enter into interest rate swap contracts and CDS contracts in the normal course of pursuing its investment objective. The Fund may use interest rate swaps to adjust the Fund’s sensitivity to interest rates or to hedge against changes in interest rates. The Fund may enter into CDS contracts in order to hedge against a credit event, to enhance total return or to gain exposure to certain securities or markets. The Fund will not be permitted to enter into any swap transactions unless, at the time of entering into such transactions, the unsecured long-term debt of the actual counterparty,
57
Notes to financial statements
Delaware Diversified Floating Rate Fund
9. Derivatives (continued)
combined with any credit enhancements, is rated at least BBB- by Standard & Poor’s Financial Services LLC (S&P) or Baa3 by Moody’s Investors Service Inc. (Moody’s) or is determined to be of equivalent credit quality by the DMC.
Interest Rate Swaps. An interest rate swap contract is an exchange of interest rates between counterparties. In one instance, an interest rate swap involves payments received by the Fund from another party based on a variable or floating interest rate, in return for making payments based on a fixed interest rate. An interest rate swap can also work in reverse with the Fund receiving payments based on a fixed interest rate and making payments based on a variable or floating interest rate. Interest rate swaps may be used to adjust the Fund’s sensitivity to interest rates or to hedge against changes in interest rates. Periodic payments on such contracts are accrued daily and recorded as unrealized appreciation/depreciation on swap contracts. Upon periodic payment/receipt or termination of the contract, such amounts are recorded as realized gains or losses on swap contracts. The Fund’s maximum risk of loss from counterparty credit risk is the discounted net value of the cash flows to be received from/paid to the counterparty over the interest rate swap contract’s remaining life, to the extent that the amount is positive. This risk is mitigated by (1) for bilateral swap contacts, having a netting arrangement between the Fund and the counterparty and by the posting of collateral by the counterparty to the Fund to cover the Fund’s exposure to the counterparty, and (2) for cleared swaps, trading these instruments through a central counterparty.
During the year ended July 31, 2014, the Fund used interest rate swap contracts to manage the Fund’s sensitivity to interest rates or to hedge against changes in interest rates.
Credit Default Swaps. A CDS contract is a risk-transfer instrument through which one party (purchaser of protection) transfers to another party (seller of protection) the financial risk of a credit event (as defined in the CDS agreement), as it relates to a particular reference security or basket of securities (such as an index). In exchange for the protection offered by the seller of protection, the purchaser of protection agrees to pay the seller of protection a periodic amount at a stated rate that is applied to the notional amount of the CDS contract. In addition, an upfront payment may be made or received by the Fund in connection with an unwinding or assignment of a CDS contract. Upon the occurrence of a credit event, the seller of protection would pay the par (or other agreed-upon) value of the reference security (or basket of securities) to the counterparty. Credit events generally include, among others, bankruptcy, failure to pay, and obligation default.
During the year ended July 31, 2014, the Fund entered into CDS contracts as a purchaser of protection. Periodic payments (receipts) on such contracts are accrued daily and recorded as unrealized losses (gains) on swap contracts. Upon payment (receipt), such amounts are recorded as realized losses (gains) on swap contracts. Upfront payments made or received in connection with CDS contracts are amortized over the expected life of the CDS contracts as unrealized losses (gains) on swap contracts. The change in value of CDS contracts is recorded daily as unrealized appreciation or depreciation. A realized gain or loss is recorded upon a credit event (as defined in the CDS agreement) or the maturity or termination of the agreement. For the year ended July 31, 2014, the Fund did not enter into any CDS contracts as a seller of protection. At July 31, 2014, the Fund had posted $610,000 in cash collateral for open bilateral swap contracts. Initial margin and variation margin are posted to central counterparties for CDS basket
58
trades determined by the applicable central counterparty. At July 31, 2014, the Fund has posted $2,937,663 in cash as collateral for open cleared swap contracts. These amounts are included on the “Statement of assets and liabilities” under “Cash collateral due from brokers.”
CDS contracts may involve greater risks than if the Fund had invested in the reference obligation directly. CDS contracts are subject to general market risk, liquidity risk, counterparty risk and credit risk. The Fund’s maximum risk of loss from counterparty credit risk, either as the seller of protection or the buyer of protection, is the fair value of the contract. This risk is mitigated by (1) for bilateral swap contacts, having a netting arrangement between the Fund and the counterparty and by the posting of collateral by the counterparty to the Fund to cover the Fund’s exposure to the counterparty, and (2) for cleared swaps, trading these instruments through a central counterparty.
During the year ended July 31, 2014, the Fund used CDS contracts to hedge against credit events.
Swaps Generally. The value of open swaps may differ from that which would be realized in the event the Fund terminated its position in the contract on a given day. Risks of entering into these contracts include the potential inability of the counterparty to meet the terms of the contracts. This type of risk is generally limited to the amount of favorable movement in the value of the underlying security, instrument or basket of instruments, if any, at the day of default. Risks also arise from potential losses from adverse market movements and such losses could exceed the unrealized amounts shown on the “Schedule of investments.”
Fair values of derivative instruments as of July 31, 2014 were as follows:
| | | | | | | | | | | | |
| | | Asset Derivatives | | | Liability Derivatives | |
| | | Statement of Assets and | | | | | Statement of Assets and | | | |
| | | Liabilities Location | | Fair Value | | | Liabilities Location | | Fair Value | |
Interest rate contracts (Futures contracts) | | Variation margin
due from broker
on futures
contracts | | | $20,824* | | | Variation margin
due from broker
on futures
contracts | | $ | (18,892 | )* |
| | Unrealized gain | | | | | | Unrealized loss | | | | |
Interest rate contracts (Swap contracts) | | on interest rate
swap contracts | | | 140,396 | | | on interest rate
swap contracts | | | (845,656 | ) |
| | Unrealized gain | | | | | | Unrealized loss | | | | |
Credit contracts (Swap contracts) | | on credit default
swap contracts | | | 51,297 | | | on credit default
swap contracts | | | (17,026 | ) |
| | | | | | | | | | | | |
Total | | | | $ | 212,517 | | | | | $ | (881,574 | ) |
| | | | | | | | | | | | |
*Includes cumulative appreciation (depreciation) of futures contracts from the date the contracts are opened through July 31, 2014. Only current day variation margin is reported on the Fund’s “Statement of assets and liabilities.”
59
Notes to financial statements
Delaware Diversified Floating Rate Fund
The effect of derivative instruments on the “Statement of operations” for the year ended July 31, 2014 was as follows:
| | | | | | | | | | | | | | | | |
| | | | | | Net Realized Loss on: | | | | |
| | | | |
| | | Foreign
Currency
Exchange
Contracts | | | Futures
Contracts | | | Swaps
Contracts | | | Total | |
Forward currency exchange contracts | | $ | (135,275 | ) | | $ | — | | | $ | — | | | $ | (135,275 | ) |
Interest rate contracts | | | — | | | | (492,497 | ) | | | (911,277 | ) | | | (1,403,774 | ) |
Credit contracts | | | — | | | | — | | | | (1,650,092 | ) | | | (1,650,092 | ) |
| | | | | | | | | | | | | | | | |
Total | | $ | (135,275 | ) | | $ | (492,497 | ) | | $ | (2,561,369 | ) | | $ | (3,189,141 | ) |
| | | | | | | | | | | | | | | | |
| | | | | | | | | | | | | | | | |
| | | Net Change in Unrealized Appreciation (Depreciation) of: | |
| | | | |
| | | Foreign
Currency
Exchange
Contracts | | | Futures
Contracts | | | Swaps
Contracts | | | Total | |
Forward currency exchange contracts | | | $11,377 | | | | $ — | | | | $ — | | | | $ 11,377 | |
Interest rate contracts | | | — | | | | 1,932 | | | | (975,269) | | | | (973,337) | |
Credit contracts | | | — | | | | — | | | | 373,590 | | | | 373,590 | |
| | | | | | | | | | | | | | | | |
Total | | | $11,377 | | | | $1,932 | | | | $(601,679) | | | | $(588,370) | |
| | | | | | | | | | | | | | | | |
Derivatives Generally. The table below summarizes the average balance of derivative holdings by the Fund during the year ended July 31, 2014.
| | | | | | | | |
| | | Long Derivative
Volume | | | Short Derivative
Volume | |
Foreign currency exchange contracts (average cost) | | | USD 376,768 | | | | USD 425,379 | |
Futures contracts (average notional value) | | | — | | | | 12,958,057 | |
CDS contracts (average notional value)* | | | 6,669,755 | | | | — | |
| | | EUR 3,487,470 | | | | — | |
Interest rate swap contracts (average notional value)** | | | USD 91,156,917 | | | | — | |
*Long represents buying protection and short represents selling protection.
**Long represents receiving fixed interest payments and short represents paying fixed interest payments.
10. Offsetting
In December 2011, the Financial Accounting Standards Board (FASB) issued guidance that expands current disclosure requirements on the offsetting of certain assets and liabilities. The new disclosures are required for investments and derivative financial instruments subject to master netting or similar agreements which are eligible for offset on the “Statement of assets and liabilities” and require an entity to disclose both gross and net information about such investments and transactions in the financial statements. In January 2013, the FASB issued guidance that clarifies which investments and transactions are subject to the offsetting disclosure requirements. The scope of the disclosure
60
requirements for offsetting is limited to derivative instruments, repurchase agreements and reverse repurchase agreements, and securities borrowing. The guidance is effective for financial statements with fiscal years beginning on or after Jan. 1, 2013, and interim periods within those fiscal years. The Fund adopted the disclosure provisions on offsetting during the current reporting period.
In order to better define its contractual rights and to secure rights that will help the Fund mitigate its counterparty risk, the Fund entered into an International Swaps and Derivatives Association, Inc. Master Agreement (ISDA Master Agreement) or a similar agreement with its derivative contract counterparties. An ISDA Master Agreement is a bilateral agreement between the Fund and a counterparty that governs over-the-counter (OTC) derivatives and foreign exchange contracts and typically contains, among other things, collateral posting items and netting provisions in the event of a default and/or termination event. Under an ISDA Master Agreement, the Fund may, under certain circumstances, offset with the counterparty certain derivative financial instruments’ payables and/or receivables with collateral held and/or posted and create one single net payment. The provisions of the ISDA Master Agreement typically permit a single net payment in the event of default (close-out) netting including the bankruptcy or insolvency of the counterparty. However, bankruptcy or insolvency laws of a particular jurisdiction may impose restrictions on or prohibitions against the right of offset in bankruptcy, insolvency or other events.
For financial reporting purposes, the Fund does not offset derivative assets and derivative liabilities that are subject to netting arrangements on the “Statement of assets and liabilities.”
At July 31, 2014, the Fund had the following assets and liabilities subject to offsetting provisions:
Offsetting of Financial Assets and Liabilities and Derivative Assets and Liabilities
| | | | | | | | | | | | |
| Counterparty | | Gross Value of
Derivative Asset | | | Gross Value of
Derivative Liability | | | Net Position | |
ICE | | | $ — | | | | $ (17,026 | ) | | | $ (17,026 | ) |
Chicago Mercantile Exchange | | | 99,127 | | | | (845,656 | ) | | | (746,529 | ) |
Deutsche Bank | | | 50,869 | | | | — | | | | 50,869 | |
LCH.Clearnet Limited | | | 41,269 | | | | — | | | | 41,269 | |
Morgan Stanley Capital | | | 428 | | | | | | | | 428 | |
| | | | | | | | | | | | |
Total | | | $191,693 | | | | $(862,682 | ) | | | $(670,989 | ) |
| | | | | | | | | | | | |
61
Notes to financial statements
Delaware Diversified Floating Rate Fund
10. Offsetting (continued)
| | | | | | | | | | | | | | | | | | | | | | | | |
| Counterparty | | Net Position | | | Fair Value
of Non-Cash
Collateral
Received | | | Cash
Collateral
Received | | | Fair Value
of Non-Cash
Collateral
Pledged | | | Cash
Collateral
Pledged | | | Net
Amount(a) | |
ICE | | | $(17,026 | ) | | | $— | | | | $— | | | | $— | | | | $— | | | | $(17,026 | ) |
Chicago Mercantile Exchange | | | (746,529 | ) | | | — | | | | — | | | | — | | | | — | | | | (746,529 | ) |
Deutsche Bank | | | 50,869 | | | | — | | | | — | | | | — | | | | — | | | | 50,869 | |
LCH.Clearnet Limited | | | 41,269 | | | | — | | | | — | | | | — | | | | — | | | | 41,269 | |
Morgan Stanley Capital | | | 428 | | | | — | | | | — | | | | — | | | | — | | | | 428 | |
| | | | | | | | | | | | | | | | | | | | | | | | |
Total | | | $(670,989 | ) | | | $— | | | | $— | | | | $— | | | | $— | | | | $(670,989 | ) |
| | | | | | | | | | | | | | | | | | | | | | | | |
| | | | | | | | | | | | |
| Counterparty | | Repurchase Agreements | | | Fair Value of
Non-Cash Collateral Received | | | Cash Collateral
Received | | Net Amount(a) |
Bank of America Merrill Lynch | | | $3,282,950 | | | | $(3,282,950 | ) | | $— | | $— |
Bank of Montreal | | | 1,094,317 | | | | (1,094,317 | ) | | — | | — |
BNP Paribas | | | 6,141,733 | | | | (6,141,733 | ) | | — | | — |
| | | | | | | | | | | | |
Total | | | $10,519,000 | | | | $(10,519,000 | ) | | $— | | $— |
| | | | | | | | | | | | |
(a) Net represents the net receivable/(payable) that would be due from/(to) the counterparty in an event of default.
11. Securities Lending
The Fund, along with other funds in the Delaware Investments® Family of Funds, may lend its securities pursuant to a security lending agreement (Lending Agreement) with The Bank of New York Mellon (BNY Mellon). At the time a security is loaned, the borrower must post collateral equal to the required percentage of the market value of the loaned security, including any accrued interest. The required percentage is: (1) 102% with respect to U.S. securities and foreign securities that are denominated and payable in U.S. dollars; and (2) 105% with respect to foreign securities. With respect to each loan, if on any business day the aggregate market value of securities collateral plus cash collateral held is less than the aggregate market value of the securities which are the subject of such loan, the borrower will be notified to provide additional collateral by the end of the following business day which, together with the collateral already held, will be not less than the applicable initial collateral requirements for such security loan. If the aggregate market value of securities collateral and cash collateral held with respect to a security loan exceeds the applicable initial collateral requirement, upon the request of the borrower, BNY Mellon must return enough collateral to the borrower by the end of the following business day to reduce the value of the remaining collateral to the applicable initial collateral requirement for such security loan. As a result of the foregoing, the value of the collateral held with respect to a loaned security on any particular day may be more or less than the value of the security on loan.
Cash collateral received is generally invested in the Delaware Investments® Collateral Fund No. 1 (Collective Trust) established by BNY Mellon for the purpose of investment on behalf of funds managed
62
by DMC that participate in BNY Mellon’s securities lending program. The Collective Trust may invest in U.S. government securities, and high-quality corporate debt, asset-backed and other money market securities, and in repurchase agreements collateralized by such securities, provided that the Collective Trust will generally have a dollar-weighted average portfolio maturity of 60 days or less. The Fund can also accept U.S. government securities and letters of credit (non-cash collateral) in connection with securities loans. In the event of default or bankruptcy by the lending agent, realization and/or retention of the collateral may be subject to legal proceedings. In the event the borrower fails to return loaned securities and the collateral received is insufficient to cover the value of the loaned securities and provided such collateral shortfall is not the result of investment losses, the lending agent has agreed to pay the amount of the shortfall to the Fund or, at the discretion of the lending agent, replace the loaned securities. The Fund continues to record dividends or interest, as applicable, on the securities loaned and is subject to changes in value of the securities loaned that may occur during the term of the loan. The Fund has the right under the Lending Agreement to recover the securities from the borrower on demand. With respect to security loans collateralized by non-cash collateral, the Fund receives loan premiums paid by the borrower. With respect to security loans collateralized by cash collateral, the earnings from the collateral investments are shared among the Fund, the security lending agent, and the borrower. The Fund records security lending income net of allocations to the security lending agent, and the borrower.
The Collective Trust used for the investment of cash collateral received from borrowers of securities seeks to maintain a net asset value per unit of $1.00, but there can be no assurance that it will always be able to do so. The Fund may incur investment losses as a result of investing securities lending collateral in the Collective Trust. This could occur if an investment in the Collective Trust defaulted or if it were necessary to liquidate assets in the Collective Trust to meet returns on outstanding security loans at a time when the Collective Trust’s net asset value per unit was less than $1.00. Under those circumstances, the Fund may not receive an amount from the Collective Trust that is equal in amount to the collateral the Fund would be required to return to the borrower of the securities and the Fund would be required to make up for this shortfall.
At July 31, 2014, the Fund had no securities out on loan.
12. Credit and Market Risk
Some countries in which the Fund may invest require governmental approval for the repatriation of investment income, capital or the proceeds of sales of securities by foreign investors. In addition, if there is deterioration in a country’s balance of payments or for other reasons, a country may impose temporary restrictions on foreign capital remittances abroad.
The securities exchanges of certain foreign markets are substantially smaller, less liquid and more volatile than the major securities markets in the United States. Consequently, acquisition and disposition of securities by the Fund may be inhibited. In addition, a significant portion of the aggregate market value of securities listed on the major securities exchanges in emerging markets is held by a smaller number of investors. This may limit the number of shares available for acquisition or disposition by the Fund.
63
Notes to financial statements
Delaware Diversified Floating Rate Fund
The Fund invests a portion of its assets in high yield fixed income securities, which are securities rated lower than BBB- by S&P and lower than Baa3 by Moody’s, or similarly rated by another nationally recognized statistical rating organization. Investments in these higher yielding securities are generally accompanied by a greater degree of credit risk than higher rated securities. Additionally, lower rated securities may be more susceptible to adverse economic and competitive industry conditions than investment grade securities.
The Fund invests in fixed income securities whose value is derived from an underlying pool of mortgages or consumer loans. The value of these securities is sensitive to changes in economic conditions, including delinquencies and/or defaults, and may be adversely affected by shifts in the market’s perception of the issuers and changes in interest rates. Investors receive principal and interest payments as the underlying mortgages and consumer loans are paid back. Some of these securities are collateralized mortgage obligations (CMOs). CMOs are debt securities issued by U.S. government agencies or by financial institutions and other mortgage lenders, which are collateralized by a pool of mortgages held under an indenture. Prepayment of mortgages may shorten the stated maturity of the obligations and can result in a loss of premium, if any has been paid. Certain of these securities may be stripped (securities which provide only the principal or interest feature of the underlying security). The yield to maturity on an interest-only CMO is extremely sensitive not only to changes in prevailing interest rates, but also to the rate of principal payments (including prepayments) on the related underlying mortgage assets. A rapid rate of principal payments may have a material adverse affect on the Fund’s yield to maturity. If the underlying mortgage assets experience greater-than-anticipated prepayments of principal, the Fund may fail to fully recoup its initial investment in these securities even if the securities are rated in the highest rating categories.
The Fund invests in certain obligations that may have liquidity protection designed to ensure that the receipt of payments due on the underlying security is timely. Such protection may be provided through guarantees, insurance policies or letters of credit obtained by the issuer or sponsor through third parties, through various means of structuring the transaction or through a combination of such approaches. The Fund will not pay any additional fees for such credit support, although the existence of credit support may increase the price of the security.
The Fund may invest up to 15% of its net assets in illiquid securities, which may include securities with contractual restrictions on resale, securities exempt from registration under Rule 144A of the Securities Act of 1933, as amended, and other securities which may not be readily marketable. The relative illiquidity of these securities may impair the Fund from disposing of them in a timely manner and at a fair price when it is necessary or desirable to do so. While maintaining oversight, the Fund’s Board has delegated to DMC the day-to-day functions of determining whether individual securities are illiquid for purposes of the Fund’s limitation on investments in illiquid securities. Securities eligible for resale pursuant to Rule 144A, which are determined to be liquid, are not subject to the Fund’s 15% limit on investments in illiquid securities. As of July 31, 2014, no securities have been determined to be illiquid under the Fund’s Liquidity Procedures. Rule 144A securities have been identified on the “Schedule of investments.”
64
13. Contractual Obligations
The Fund enters into contracts in the normal course of business that contain a variety of indemnifications. The Fund’s maximum exposure under these arrangements is unknown. However, the Fund has not had prior claims or losses pursuant to these contracts. Management has reviewed the Fund’s existing contracts and expects the risk of loss to be remote.
14. Recent Accounting Pronouncements
In June 2014, the Financial Accounting Standards Board issued guidance to improve the financial reporting of reverse repurchase agreements and other similar transactions. The guidance includes expanded disclosure requirements for entities that enter into reverse repurchase agreements and similar transactions accounted for as secured borrowings. The guidance is effective for financial statements with fiscal years beginning on or after Dec. 15, 2014 and interim periods within those years. Management is evaluating the impact, if any, of this guidance on the Fund’s financial statement disclosures.
15. Subsequent Events
Management has determined that no other material events or transactions occurred subsequent to July 31, 2014 that would require recognition or disclosure in the Fund’s financial statements.
65
Report of independent
registered public accounting firm
To the Board of Trustees Delaware Group® Income Funds
and the Shareholders of Delaware Diversified Floating Rate Fund:
In our opinion, the accompanying statement of assets and liabilities, including the schedule of investments, and the related statements of operations and of changes in net assets and the financial highlights present fairly, in all material respects, the financial position of Delaware Diversified Floating Rate Fund (one of the series constituting Delaware Group® Income Funds, hereinafter referred to as the “Fund”) at July 31, 2014, the results of its operations for the year then ended, the changes in its net assets for each of the two years in the period then ended and the financial highlights for each of the four years in the period then ended and for the period February 26, 2010 (commencement of operations) through July 31, 2010, in conformity with accounting principles generally accepted in the United States of America. These financial statements and financial highlights (hereafter referred to as “financial statements”) are the responsibility of the Fund’s management. Our responsibility is to express an opinion on these financial statements based on our audit. We conducted our audit of these financial statements in accordance with the standards of the Public Company Accounting Oversight Board (United States). Those standards require that we plan and perform the audit to obtain reasonable assurance about whether the financial statements are free of material misstatement. An audit includes examining, on a test basis, evidence supporting the amounts and disclosures in the financial statements, assessing the accounting principles used and significant estimates made by management, and evaluating the overall financial statement presentation. We believe that our audit, which included confirmation of securities at July 31, 2014 by correspondence with the custodian and brokers, and the application of alternative auditing procedures where confirmations of security purchases had not been received, provides a reasonable basis for our opinion.
PricewaterhouseCoopers LLP
Philadelphia, Pennsylvania
September 19, 2014
66
Other Fund information (Unaudited)
Delaware Diversified Floating Rate Fund
Tax Information
The information set forth below is for the Fund’s fiscal year as required by federal income tax laws. Shareholders, however, must report distributions on a calendar year basis for income tax purposes, which may include distributions for portions of two fiscal years of the Fund. Accordingly, the information needed by shareholders for income tax purposes will be sent to them in January of each year. Please consult your tax advisor for proper treatment of this information.
All disclosures are based on financial information available as of the date of this annual report and, accordingly are subject to change. For any and all items requiring reporting, it is the intention of the Fund to report the maximum amount permitted under the Internal Revenue Code and the regulations thereunder.
For the fiscal year ended July 31, 2014, the Fund reports distributions paid during the year as follows:
| | | | |
(A) Ordinary Income Distribution (Tax Basis) | | | 81.51 | % |
(B) Return of Capital (Tax Basis) | | | 18.49 | % |
Total Distributions (Tax Basis) | | | 100.00 | % |
| |
(A) and (B) are based on a percentage of the Fund’s total distributions. | | | | |
67
Board of trustees / directors and officers addendum
Delaware Investments® Family of Funds
A mutual fund is governed by a Board of Trustees / Directors (“Trustees”), which has oversight responsibility for the management of a fund’s business affairs. Trustees establish procedures and oversee and review the performance of the investment manager, the distributor, and others who perform services for the fund. The independent fund trustees, in particular, are advocates
| | | | |
| Name, Address, | | Position(s) | | Length of |
| and Birth Date | | Held with Fund(s) | | Time Served |
Interested Trustees | | | | |
| Patrick P. Coyne1 | | Chairman, President, | | Chairman and Trustee |
| 2005 Market Street | | Chief Executive Officer, | | since August 16, 2006 |
| Philadelphia, PA 19103 | | and Trustee | | |
| April 1963 | | | | President and |
| | | | Chief Executive Officer |
| | | | since August 1, 2006 |
Independent Trustees | | | | |
| Thomas L. Bennett | | Trustee | | Since March 2005 |
| 2005 Market Street | | | | |
| Philadelphia, PA 19103 | | | | |
October 1947 | | | | |
|
| Joseph W. Chow | | Trustee | | Since January 2013 |
| 2005 Market Street | | | | |
| Philadelphia, PA 19103 | | | | |
| January 1953 | | | | |
| | |
| | | | |
|
| John A. Fry | | Trustee | | Since January 2001 |
| 2005 Market Street | | | | |
| Philadelphia, PA 19103 | | | | |
| May 1960 | | | | |
| | |
| | | | |
|
| 1 | Patrick P. Coyne is considered to be an “Interested Trustee” because he is an executive officer of the Fund’s(s’) investment advisor. |
68
for shareholder interests. Each trustee has served in that capacity since he or she was elected to or appointed to the Board of Trustees, and will continue to serve until his or her retirement or the election of a new trustee in his or her place. The following is a list of the Trustees and Officers with certain background and related information.
| | | | |
| | | Number of Portfolios in | | |
| Principal Occupation(s) | | Fund Complex Overseen | | Other Directorships |
| During Past 5 Years | | by Trustee or Officer | | Held by Trustee or Officer |
| | |
| | | | |
| Patrick P. Coyne has served in | | 70 | | Board of Governors Member |
| various executive capacities | | | | Investment Company |
| at different times at | | | | Institute (ICI) |
| Delaware Investments.2 | | | | |
| | | | Director and Audit |
| | | | Committee Member |
| | | | Kaydon Corp. |
| | | | (2007–2013) |
| | |
| | | | |
| | | | |
| Private Investor | | 70 | | Director |
| (March 2004–Present) | | | | Bryn Mawr Bank Corp. (BMTC) |
| | | | (2007–2011) |
| | | | |
|
| Executive Vice President | | 70 | | Director and Audit Committee |
| (Emerging Economies | | | | Member — Hercules |
| Strategies, Risk and | | | | Technology Growth |
| Corporate Administration) | | | | Capital, Inc. |
| State Street Corporation | | | | |
| (July 2004–March 2011) | | | | |
|
| President | | 70 | | Director — Hershey Trust |
| Drexel University | | | | |
| (August 2010–Present) | | | | Director and Audit |
| | | | Committee Member |
| President | | | | Community Health Systems |
| Franklin & Marshall College | | | | |
| (July 2002–July 2010) | | | | |
|
| 2 | Delaware Investments is the marketing name for Delaware Management Holdings, Inc. and its subsidiaries, including the Fund’s(s’) investment advisor, principal underwriter, and its transfer agent. |
69
Board of trustees / directors and officers addendum
Delaware Investments® Family of Funds
| | | | |
| Name, Address, | | Position(s) | | Length of |
| and Birth Date | | Held with Fund(s) | | Time Served |
Independent Trustees (continued) | | | | |
| | |
| Lucinda S. Landreth | | Trustee | | Since March 2005 |
| 2005 Market Street | | | | |
| Philadelphia, PA 19103 | | | | |
June 1947 | | | | |
|
| Frances A. Sevilla-Sacasa | | Trustee | | Since September 2011 |
| 2005 Market Street | | | | |
| Philadelphia, PA 19103 | | | | |
January 1956 | | | | |
|
| Thomas K. Whitford | | Trustee | | Since January 2013 |
| 2005 Market Street | | | | |
| Philadelphia, PA 19103 | | | | |
March 1956 | | | | |
|
70
| | | | |
| | | Number of Portfolios in | | |
| Principal Occupation(s) | | Fund Complex Overseen | | Other Directorships |
| During Past 5 Years | | by Trustee or Officer | | Held by Trustee or Officer |
| | |
| | | | |
| Private Investor | | 70 | | None |
(2004–Present) | | | | |
|
| Chief Executive Officer — | | 70 | | Trust Manager and |
| Banco Itaú | | | | Audit Committee |
| International | | | | Member — Camden |
| (April 2012–Present) | | | | Property Trust |
| | |
| Executive Advisor to Dean | | | | |
(August 2011–March 2012) and Interim Dean | | | | |
| (January 2011–July 2011) — | | | | |
| University of Miami School of | | | | |
| Business Administration | | | | |
| | |
| President — U.S. Trust, | | | | |
| Bank of America Private | | | | |
| Wealth Management | | | | |
| (Private Banking) | | | | |
(July 2007–December 2008) | | | | |
|
| Vice Chairman | | 70 | | Director — HSBC Finance |
| (2010–April 2013) | | | | Corporation and HSBC |
| Chief Administrative | | | | North America Holdings Inc. |
Officer (2008–2010) and Executive Vice | | | | |
| President and Chief | | | | |
| Administrative Officer | | | | |
| (2007–2009) — | | | | |
| PNC Financial | | | | |
Services Group | | | | |
|
71
Board of trustees / directors and officers addendum
Delaware Investments® Family of Funds
| | | | |
| Name, Address, | | Position(s) | | Length of |
| and Birth Date | | Held with Fund(s) | | Time Served |
Independent Trustees (continued) | | | | |
| Janet L. Yeomans | | Trustee | | Since April 1999 |
| 2005 Market Street | | | | |
| Philadelphia, PA 19103 | | | | |
July 1948 | | | | |
|
| J. Richard Zecher | | Trustee | | Since March 2005 |
| 2005 Market Street | | | | |
| Philadelphia, PA 19103 | | | | |
July 1940 | | | | |
|
72
| | | | |
| | | Number of Portfolios in | | |
| Principal Occupation(s) | | Fund Complex Overseen | | Other Directorships |
| During Past 5 Years | | by Trustee or Officer | | Held by Trustee or Officer |
| | |
| | | | |
| Vice President and Treasurer | | 70 | | Director, Audit |
| (January 2006–July 2012) | | | | Committee Chair, Investment |
| Vice President — | | | | Committee Member, |
| Mergers & Acquisitions | | | | and Governance |
| (January 2003–January 2006), | | | | Committee Member |
| and Vice President | | | | Okabena Company |
| and Treasurer | | | | |
| (July 1995–January 2003) | | | | Chair — 3M |
| 3M Corporation | | | | Investment Management |
| | | | Company |
| | | | (2005–2012) |
|
| | |
| Founder | | 70 | | Director and Compensation |
| Investor Analytics | | | | Committee Member |
| (Risk Management) | | | | Investor Analytics |
| (May 1999–Present) | | | | |
| | | | Director — P/E Investments |
| Founder | | | | |
| P/E Investments | | | | |
| (Hedge Fund) | | | | |
| (September 1996–Present) | | | | |
|
73
Board of trustees / directors and officers addendum
Delaware Investments® Family of Funds
| | | | |
| Name, Address, | | Position(s) | | Length of |
| and Birth Date | | Held with Fund(s) | | Time Served |
Officers | | | | |
| David F. Connor | | Senior Vice President, | | Senior Vice President, |
| 2005 Market Street | | Deputy General | | Deputy General Counsel |
| Philadelphia, PA 19103 | | Counsel, and Secretary | | since May 2013; |
| December 1963 | | | | Vice President, Deputy |
| | | | General Counsel |
| | | | September 2000 – |
| | | | May 2013; Secretary since |
| | | | October 2005 |
|
| Daniel V. Geatens | | Vice President | | Treasurer since October 2007 |
| 2005 Market Street | | and Treasurer | | |
| Philadelphia, PA 19103 | | | | |
October 1972 | | | | |
|
| David P. O’Connor | | Executive Vice President, | | Executive Vice President |
| 2005 Market Street | | General Counsel | | since February 2012; |
| Philadelphia, PA 19103 | | and Chief Legal Officer | | Senior Vice President |
| February 1966 | | | | October 2005 – |
| | | | February 2012; |
| | | | General Counsel and |
| | | | Chief Legal Officer |
| | | | since October 2005 |
|
| Richard Salus | | Senior Vice President | | Chief Financial Officer |
| 2005 Market Street | | and Chief Financial Officer | | since November 2006 |
| Philadelphia, PA 19103 | | | | |
October 1963 | | | | |
|
The Statement of Additional Information for the Fund(s) includes additional information about the Trustees and Officers and is available, without charge, upon request by calling 800 523-1918.
74
| | | | |
| | | Number of Portfolios in | | |
| Principal Occupation(s) | | Fund Complex Overseen | | Other Directorships |
| During Past 5 Years | | by Trustee or Officer | | Held by Trustee or Officer |
| | |
| | | | |
| David F. Connor has served as | | 70 | | None3 |
| Deputy General Counsel of | | | | |
Delaware Investments since 2000. | | | | |
|
| Daniel V. Geatens has served | | 70 | | None3 |
in various capacities at different times at | | | | |
Delaware Investments. | | | | |
|
| David P. O’Connor has served | | 70 | | None3 |
in various executive and legal capacities at different times at Delaware Investments. | | | | |
|
| Richard Salus has served in | | 70 | | None3 |
various executive capacities at different times at | | | | |
Delaware Investments. | | | | |
|
| 3 | David F. Connor, Daniel V. Geatens, David P. O’Connor, and Richard Salus serve in similar capacities for the six portfolios of the Optimum Fund Trust, which have the same investment advisor, principal underwriter, and transfer agent as the registrant. |
75
About the organization
| | | | | | |
| Board of trustees | | | | |
| Patrick P. Coyne | | Joseph W. Chow | | Lucinda S. Landreth | | Thomas K. Whitford |
| Chairman, President, and | | Former Executive Vice | | Former Chief Investment | | Former Vice Chairman |
| Chief Executive Officer | | President | | Officer | | PNC Financial Services Group |
| Delaware Investments ® | | State Street Corporation | | Assurant, Inc. | | Pittsburgh, PA |
| Family of Funds | | Brookline, MA | | Philadelphia, PA | | |
| Philadelphia, PA | | | | | | Janet L. Yeomans |
| | | | | | Former Vice President and |
| | John A. Fry | | Frances A. | | Treasurer |
| Thomas L. Bennett | | President | | Sevilla-Sacasa | | 3M Corporation |
| Private Investor | | Drexel University | | Chief Executive Officer | | St. Paul, MN |
| Rosemont, PA | | Philadelphia, PA | | Banco Itaú | | |
| | | | International | | J. Richard Zecher |
| | | | Miami, FL | | Founder |
| | | | | | Investor Analytics |
| | | | | | Scottsdale, AZ |
| | | |
| Affiliated officers | | | | | | |
| | | |
| David F. Connor | | Daniel V. Geatens | | David P. O’Connor | | Richard Salus |
| Senior Vice President, | | Vice President and | | Executive Vice President, | | Senior Vice President and |
| Deputy General Counsel, | | Treasurer | | General Counsel, | | Chief Financial Officer |
| and Secretary | | Delaware Investments | | and Chief Legal Officer | | Delaware Investments |
| Delaware Investments | | Family of Funds | | Delaware Investments | | Family of Funds |
| Family of Funds | | Philadelphia, PA | | Family of Funds | | Philadelphia, PA |
| Philadelphia, PA | | | | Philadelphia, PA | | |
This annual report is for the information of Delaware Diversified Floating Rate Fund shareholders, but it may be used with prospective investors when preceded or accompanied by the Delaware Investments Fund fact sheet for the most recently completed calendar quarter. These documents are available at delawareinvestments.com.
Delaware Investments is the marketing name of Delaware Management Holdings, Inc. and its subsidiaries.
The Fund files its complete schedule of portfolio holdings with the Securities and Exchange Commission (SEC) for the first and third quarters of each fiscal year on Form N-Q. The Fund’s Forms N-Q, as well as a description of the policies and procedures that the Fund uses to determine how to vote proxies (if any) relating to portfolio securities are available without charge (i) upon request, by calling 800 523-1918; and (ii) on the SEC’s website at sec.gov. In addition, a description of the policies and procedures that the Fund uses to determine how to vote proxies (if any) relating to portfolio securities and the Fund’s Schedule of Investments are available without charge on the Fund’s website at delawareinvestments.com. The Fund’s Forms N-Q may be reviewed and copied at the SEC’s Public Reference Room in Washington, D.C.; information on the operation of the Public Reference Room may be obtained by calling 800 SEC-0330.
Information (if any) regarding how the Fund voted proxies relating to portfolio securities during the most recently disclosed 12-month period ended June 30 is available without charge (i) through the Fund’s website at delawareinvestments.com; and (ii) on the SEC’s website at sec.gov.
76
Item 2. Code of Ethics
The registrant has adopted a code of ethics that applies to the registrant’s principal executive officer, principal financial officer, principal accounting officer or controller, or persons performing similar functions, regardless of whether these individuals are employed by the registrant or a third party. A copy of the registrant’s Code of Business Ethics has been posted on the Delaware Investments Internet Web site at www.delawareinvestments.com. Any amendments to the Code of Business Ethics, and information on any waiver from its provisions granted by the registrant, will also be posted on this Web site within five business days of such amendment or waiver and will remain on the Web site for at least 12 months.
Item 3. Audit Committee Financial Expert
The registrant’s Board of Trustees/Directors has determined that certain members of the registrant’s Audit Committee are audit committee financial experts, as defined below. For purposes of this item, an “audit committee financial expert” is a person who has the following attributes:
a. An understanding of generally accepted accounting principles and financial statements;
b. The ability to assess the general application of such principles in connection with the accounting for estimates, accruals, and reserves;
c. Experience preparing, auditing, analyzing, or evaluating financial statements that present a breadth and level of complexity of accounting issues that are generally comparable to the breadth and complexity of issues that can reasonably be expected to be raised by the registrant’s financial statements, or experience actively supervising one or more persons engaged in such activities;
d. An understanding of internal controls and procedures for financial reporting; and
e. An understanding of audit committee functions.
An “audit committee financial expert” shall have acquired such attributes through:
a. Education and experience as a principal financial officer, principal accounting officer, controller, public accountant, or auditor or experience in one or more positions that involve the performance of similar functions;
b. Experience actively supervising a principal financial officer, principal accounting officer, controller, public accountant, auditor, or person performing similar functions;
c. Experience overseeing or assessing the performance of companies or public accountants with respect to the preparation, auditing, or evaluation of financial statements; or
d. Other relevant experience.
The registrant’s Board of Trustees/Directors has also determined that each member of the registrant’s Audit Committee is independent. In order to be “independent” for purposes of this item, the Audit Committee member may not: (i) other than in his or her capacity as a member of the Board of Trustees/Directors or any committee thereof, accept directly or indirectly any consulting, advisory or other compensatory fee from the issuer; or (ii) be an “interested person” of the registrant as defined in Section 2(a)(19) of the Investment Company Act of 1940.
The names of the audit committee financial experts on the registrant’s Audit Committee are set forth below:
Joseph W. Chow
Lucinda S. Landreth1
Frances A. Sevilla-Sacasa
Janet L. Yeomans
Item 4. Principal Accountant Fees and Services
(a) Audit fees.
The aggregate fees billed for services provided to the registrant by its independent auditors for the audit of the registrant’s annual financial statements and for services normally provided by the independent auditors in connection with statutory and regulatory filings or engagements were $186,020 for the fiscal year ended July 31, 2014.
The aggregate fees billed for services provided to the registrant by its independent auditors for the audit of the registrant’s annual financial statements and for services normally provided by the independent auditors in connection with statutory and regulatory filings or engagements were $163,175 for the fiscal year ended July 31, 2013.
(b) Audit-related fees.
The aggregate fees billed by the registrant’s independent auditors for services relating to the performance of the audit of the registrant’s financial statements and not reported under paragraph (a) of this Item were $0 for the fiscal year ended July 31, 2014.
The aggregate fees billed by the registrant’s independent auditors for services relating to the performance of the audit of the financial statements of the registrant’s investment adviser and other service providers under common control with the adviser and that relate directly to the operations or financial reporting of the registrant were $618,000 for the registrant’s fiscal year ended July 31, 2014. The percentage of these fees relating to services approved by the registrant’s Audit Committee pursuant to the de minimis exception from the pre-approval requirement in Rule 2-01(c)(7)(i)(C) of Regulation S-X was 0%. These audit-related services were as follows: year end audit procedures; group reporting and subsidiary statutory audits.
The aggregate fees billed by the registrant’s independent auditors for services relating to the performance of the audit of the registrant’s financial statements and not reported under paragraph (a) of this Item were $0 for the fiscal year ended July 31, 2013.
____________________
1 The instructions to Form N-CSR require disclosure on the relevant experience of persons who qualify as audit committee financial experts based on “other relevant experience.” The Board of Trustees/Directors has determined that Ms. Landreth qualifies as an audit committee financial expert by virtue of her experience as a financial analyst, her Chartered Financial Analyst (CFA) designation and her service as an audit committee chairperson for a non-profit organization.
The aggregate fees billed by the registrant’s independent auditors for services relating to the performance of the audit of the financial statements of the registrant’s investment adviser and other service providers under common control with the adviser and that relate directly to the operations or financial reporting of the registrant were $618,000 for the registrant’s fiscal year ended July 31, 2013. The percentage of these fees relating to services approved by the registrant’s Audit Committee pursuant to the de minimis exception from the pre-approval requirement in Rule 2-01(c)(7)(i)(C) of Regulation S-X was 0%. These audit-related services were as follows: year end audit procedures; group reporting and subsidiary statutory audits.
(c) Tax fees.
The aggregate fees billed by the registrant’s independent auditors for tax-related services provided to the registrant were $25,545 for the fiscal year ended July 31, 2014. The percentage of these fees relating to services approved by the registrant’s Audit Committee pursuant to the de minimis exception from the pre-approval requirement in Rule 2-01(c)(7)(i)(C) of Regulation S-X was 0%. These tax-related services were as follows: review of income tax returns and review of annual excise distribution calculations.
The aggregate fees billed by the registrant’s independent auditors for tax-related services provided to the registrant’s investment adviser and other service providers under common control with the adviser and that relate directly to the operations or financial reporting of the registrant were $0 for the registrant’s fiscal year ended July 31, 2014.
The aggregate fees billed by the registrant’s independent auditors for tax-related services provided to the registrant were $24,250 for the fiscal year ended July 31, 2013. The percentage of these fees relating to services approved by the registrant’s Audit Committee pursuant to the de minimis exception from the pre-approval requirement in Rule 2-01(c)(7)(i)(C) of Regulation S-X was 0%. These tax-related services were as follows: review of income tax returns and review of annual excise distribution calculations.
The aggregate fees billed by the registrant’s independent auditors for tax-related services provided to the registrant’s investment adviser and other service providers under common control with the adviser and that relate directly to the operations or financial reporting of the registrant were $0 for the registrant’s fiscal year ended July 31, 2013.
(d) All other fees.
The aggregate fees billed for all services provided by the independent auditors to the registrant other than those set forth in paragraphs (a), (b) and (c) of this Item were $0 for the fiscal year ended July 31, 2014.
The aggregate fees billed for all services other than those set forth in paragraphs (b) and (c) of this Item provided by the registrant’s independent auditors to the registrant’s adviser and other service providers under common control with the adviser and that relate directly to the operations or financial reporting of the registrant were $0 for the registrant’s fiscal year ended July 31, 2014. The percentage of these fees relating to services approved by the registrant’s Audit Committee pursuant to the de minimis exception from the pre-approval requirement in Rule 2-01(c)(7)(i)(C) of Regulation S-X was 0%.
The aggregate fees billed for all services provided by the independent auditors to the registrant other than those set forth in paragraphs (a), (b) and (c) of this Item were $0 for the fiscal year ended July 31, 2013.
The aggregate fees billed for all services other than those set forth in paragraphs (b) and (c) of this Item provided by the registrant’s independent auditors to the registrant’s adviser and other service providers under common control with the adviser and that relate directly to the operations or financial reporting of the registrant were $0 for the registrant’s fiscal year ended July 31, 2013. The percentage of these fees relating to services approved by the registrant’s Audit Committee pursuant to the de minimis exception from the pre-approval requirement in Rule 2-01(c)(7)(i)(C) of Regulation S-X was 0%.
(e) The registrant’s Audit Committee has established pre-approval policies and procedures as permitted by Rule 2-01(c)(7)(i)(B) of Regulation S-X (the “Pre-Approval Policy”) with respect to services provided by the registrant’s independent auditors. Pursuant to the Pre-Approval Policy, the Audit Committee has pre-approved the services set forth in the table below with respect to the registrant up to the specified fee limits. Certain fee limits are based on aggregate fees to the registrant and other registrants within the Delaware Investments Family of Funds.
| Service | Range of Fees |
| Audit Services | |
| Statutory audits or financial audits for new Funds | up to $40,000 per Fund |
| Services associated with SEC registration statements (e.g., Form N-1A, Form N-14, etc.), periodic reports and other documents filed with the SEC or other documents issued in connection with securities offerings (e.g., comfort letters for closed-end Fund offerings, consents), and assistance in responding to SEC comment letters | up to $10,000 per Fund |
| Consultations by Fund management as to the accounting or disclosure treatment of transactions or events and/or the actual or potential impact of final or proposed rules, standards or interpretations by the SEC, FASB, or other regulatory or standard-setting bodies (Note: Under SEC rules, some consultations may be considered “audit-related services” rather than “audit services”) | up to $25,000 in the aggregate |
| Audit-Related Services | |
| Consultations by Fund management as to the accounting or disclosure treatment of transactions or events and/or the actual or potential impact of final or proposed rules, standards or interpretations by the SEC, FASB, or other regulatory or standard-setting bodies (Note: Under SEC rules, some consultations may be considered “audit services” rather than “audit-related services”) | up to $25,000 in the aggregate |
| Tax Services | |
| U.S. federal, state and local and international tax planning and advice (e.g., consulting on statutory, regulatory or administrative developments, evaluation of Funds’ tax compliance function, etc.) | up to $25,000 in the aggregate |
| U.S. federal, state and local tax compliance (e.g., excise distribution reviews, etc.) | up to $5,000 per Fund |
| Review of federal, state, local and international income, franchise and other tax returns | up to $5,000 per Fund |
Under the Pre-Approval Policy, the Audit Committee has also pre-approved the services set forth in the table below with respect to the registrant’s investment adviser and other entities controlling, controlled by or under common control with the investment adviser that provide ongoing services to the registrant (the “Control Affiliates”) up to the specified fee limit. This fee limit is based on aggregate fees to the investment adviser and its Control Affiliates.
| Service | Range of Fees |
| Non-Audit Services | |
| Services associated with periodic reports and other documents filed with the SEC and assistance in responding to SEC comment letters | up to $10,000 in the aggregate |
The Pre-Approval Policy requires the registrant’s independent auditors to report to the Audit Committee at each of its regular meetings regarding all services initiated since the last such report was rendered, including those services authorized by the Pre-Approval Policy.
(f) Not applicable.
(g) The aggregate non-audit fees billed by the registrant’s independent auditors for services rendered to the registrant and to its investment adviser and other service providers under common control with the adviser were $8,090,937 and $8,891,311 for the registrant’s fiscal years ended July 31, 2014 and July 31, 2013, respectively.
(h) In connection with its selection of the independent auditors, the registrant’s Audit Committee has considered the independent auditors’ provision of non-audit services to the registrant’s investment adviser and other service providers under common control with the adviser that were not required to be pre-approved pursuant to Rule 2-01(c)(7)(ii) of Regulation S-X. The Audit Committee has determined that the independent auditors’ provision of these services is compatible with maintaining the auditors’ independence.
Item 5. Audit Committee of Listed Registrants
Not applicable.
Item 6. Investments
(a) Included as part of report to shareholders filed under Item 1 of this Form N-CSR.
(b) Divestment of securities in accordance with Section 13(c) of the Investment Company Act of 1940.
Not applicable.
Item 7. Disclosure of Proxy Voting Policies and Procedures for Closed-End Management Investment Companies
Not applicable.
Item 8. Portfolio Managers of Closed-End Management Investment Companies
Not applicable.
Item 9. Purchases of Equity Securities by Closed-End Management Investment Company and Affiliated Purchasers
Not applicable.
Item 10. Submission of Matters to a Vote of Security Holders
Not applicable.
Item 11. Controls and Procedures
The registrant’s principal executive officer and principal financial officer have evaluated the registrant’s disclosure controls and procedures within 90 days of the filing of this report and have concluded that they are effective in providing reasonable assurance that the information required to be disclosed by the registrant in its reports or statements filed under the Securities Exchange Act of 1934 is recorded, processed, summarized and reported within the time periods specified in the rules and forms of the Securities and Exchange Commission.
There were no significant changes in the registrant’s internal control over financial reporting that occurred during the second fiscal quarter of the period covered by the report to stockholders included herein (i.e., the registrant’s fourth fiscal quarter) that have materially affected, or are reasonably likely to materially affect, the registrant’s internal control over financial reporting.
Item 12. Exhibits
(a) (1) Code of Ethics
Not applicable.
(2) Certifications of Principal Executive Officer and Principal Financial Officer pursuant to Rule 30a-2 under the Investment Company Act of 1940 are attached hereto as Exhibit 99.CERT.
(3) Written solicitations to purchase securities pursuant to Rule 23c-1 under the Securities Exchange Act of 1934.
Not applicable.
(b) Certifications pursuant to Section 906 of the Sarbanes-Oxley Act of 2002 are furnished herewith as Exhibit 99.906CERT.
SIGNATURES
Pursuant to the requirements of the Securities Exchange Act of 1934 and the Investment Company Act of 1940, the registrant has duly caused this report to be signed on its behalf, by the undersigned, thereunto duly authorized.
DELAWARE GROUP® INCOME FUNDS
| /s/ PATRICK P. COYNE |
| By: | Patrick P. Coyne |
| Title: | Chief Executive Officer |
| Date: | October 1, 2014 |
Pursuant to the requirements of the Securities Exchange Act of 1934 and the Investment Company Act of 1940, this report has been signed below by the following persons on behalf of the registrant and in the capacities and on the dates indicated.
| /s/ PATRICK P. COYNE |
| By: | Patrick P. Coyne |
| Title: | Chief Executive Officer |
| Date: | October 1, 2014 |
| |
| /s/ RICHARD SALUS |
| By: | Richard Salus |
| Title: | Chief Financial Officer |
| Date: | October 1, 2014 |