Item 1. Reports to Stockholders
Annual report
Fixed income mutual funds
Delaware Corporate Bond Fund
Delaware Extended Duration Bond Fund
July 31, 2016
Carefully consider the Funds’ investment objectives, risk factors, charges, and expenses before investing. This and other information can be found in the Funds’ prospectus and their summary prospectuses, which may be obtained by visiting delawareinvestments.com/literature or calling 800 523-1918. Investors should read the prospectus and the summary prospectus carefully before investing.
You can obtain shareholder reports and prospectuses online instead of in the mail.
Visit delawareinvestments.com/edelivery.
Experience Delaware Investments
Delaware Investments is committed to the pursuit of consistently superior asset management and unparalleled client service. We believe in our investment processes, which seek to deliver consistent results, and in convenient services that help add value for our clients.
If you are interested in learning more about creating an investment plan, contact your financial advisor.
You can learn more about Delaware Investments or obtain a prospectus for Delaware Corporate Bond Fund and Delaware Extended Duration Bond Fund at delawareinvestments.com/literature.
Manage your investments online
| ● | | 24-hour access to your account information |
| ● | | Check your account balance and recent transactions |
| ● | | Request statements or literature |
| ● | | Make purchases and redemptions |
Delaware Management Holdings, Inc. and its subsidiaries (collectively known by the marketing name of Delaware Investments) are wholly owned subsidiaries of Macquarie Group Limited, a global provider of banking, financial, advisory, investment and funds management services.
Neither Delaware Investments nor its affiliates referred to in this document are authorized deposit-taking institutions for the purposes of the Banking Act 1959 (Commonwealth of Australia). The obligations of these entities do not represent deposits or other liabilities of Macquarie Bank Limited (MBL), a subsidiary of Macquarie Group Limited and an affiliate of Delaware Investments. MBL does not guarantee or otherwise provide assurance in respect of the obligations of these entities, unless noted otherwise. The Funds are governed by U.S. laws and regulations.
Table of contents
Unless otherwise noted, views expressed herein are current as of July 31, 2016, and subject to change for events occurring after such date.
The Funds are not FDIC insured and are not guaranteed. It is possible to lose the principal amount invested.
Mutual fund advisory services provided by Delaware Management Company, a series of Delaware Management Business Trust, which is a registered investment advisor. Delaware Investments, a member of Macquarie Group, refers to Delaware Management Holdings, Inc. and its subsidiaries, including the Funds’ distributor, Delaware Distributors, L.P. Macquarie Group refers to Macquarie Group Limited and its subsidiaries and affiliates worldwide.
© 2016 Delaware Management Holdings, Inc.
All third-party marks cited are the property of their respective owners.
| | |
| Portfolio management review | | |
| | | | |
| Delaware Corporate Bond Fund and Delaware Extended Duration Bond Fund | | | August 9, 2016 | |
| | | | |
| Performance preview (for the year ended July 31, 2016) | | | | |
Delaware Corporate Bond Fund (Institutional Class shares) | | 1-year return | | +6.18% |
Delaware Corporate Bond Fund (Class A shares) | | 1-year return | | +5.91% |
Bloomberg Barclays U.S. Corporate Investment Grade Index1 (benchmark) | | 1-year return | | +8.78% |
Past performance does not guarantee future results.
For complete, annualized performance for Delaware Corporate Bond Fund, please see the table on page 5. Institutional Class shares are available without sales or asset-based distribution charges only to certain eligible accounts. The performance of Class A shares excludes the applicable sales charge and reflects the reinvestment of all distributions. Please see page 7 for a description of the index.
Index performance returns do not reflect any management fees, transaction costs, or expenses. Indices are unmanaged and one cannot invest directly in an index.
| | | | |
Delaware Extended Duration Bond Fund (Institutional Class shares) | | 1-year return | | +12.26% |
Delaware Extended Duration Bond Fund (Class A shares) | | 1-year return | | +12.14% |
Bloomberg Barclays Long U.S. Corporate Index2 (benchmark) | | 1-year return | | +15.70% |
Past performance does not guarantee future results.
For complete, annualized performance for Delaware Extended Duration Bond Fund, please see the table on page 9. Institutional Class shares are available without sales or asset-based distribution charges only to certain eligible accounts. The performance of Class A shares excludes the applicable sales charge and reflects the reinvestment of all distributions. Please see page 12 for a description of the index.
Index performance returns do not reflect any management fees, transaction costs, or expenses. Indices are unmanaged and one cannot invest directly in an index.
1 Formerly known as the Barclays U.S. Corporate Investment Grade Index.
2 Formerly known as the Barclays Long U.S. Corporate Index.
To borrow a phrase from Charles Dickens, the Funds experienced a tale of two market environments during the fiscal year ended July 31, 2016.
For the first seven months of the Funds’ fiscal year – August 2015 through February 2016 – investment grade and high yield corporates lagged Treasury securities, by 2.96 percentage points and 9.68 percentage points, respectively (source: Barclays). The volatility in commodity prices that continued from the previous fiscal year appeared to be a contributing factor. China’s currency devaluation in August 2015, coming amid further signs of a slowdown in the country’s economy, further exacerbated corporate bond performance. New-issue supply was substantial across the board due to debt-financed mergers and
acquisitions. Typical of issuer behavior late in the credit cycle, share buybacks also increased. The combination of oversupply and global growth concerns put pressure on virtually every sector of the corporate bond market.
At the beginning of March 2016, however, the corporate market experienced a shift that lasted through the end of the fiscal year. During the final five months of the Funds’ fiscal year, investment grade corporate credits and high yield outperformed Treasurys by 4.72 percentage points and 11.48 percentage points, respectively (source: Barclays).
The proximate cause for this reversal was the European Central Bank’s (ECB’s) announcement of a quantitative-easing program that increased its
1
Portfolio management review
Delaware Corporate Bond Fund and Delaware Extended Duration Bond Fund
monthly bond purchases by 20 billion euros, equally divided between corporate credit and sovereign paper. This stimulus provided tsunami-like technical support for corporate credit prices, which in turn triggered a worldwide grab for yield. Government bonds in major markets such as Japan and Germany experienced negative yields, while France’s bellwether 10-year bond yield was barely in positive territory at the end of the fiscal year.
Another important reversal occurred in the energy sector, which had performed poorly in the first half of the fiscal year. Thanks to improved market technicals and a rebound in oil prices during the first quarter of 2016, energy companies were able to access the capital market, which had positive fundamental implications (source: Bloomberg).
Fund performance
For the fiscal year ended July 31, 2016, Delaware Corporate Bond Fund underperformed its benchmark, the Bloomberg Barclays U.S. Corporate Investment Grade Index. The Fund’s Institutional Class shares returned +6.18%. The Fund’s Class A shares returned +5.91% at net asset value and +1.21% at maximum offer price. These figures reflect all distributions reinvested. During the same period, the Fund’s benchmark returned +8.78%. For complete annualized performance of Delaware Corporate Bond Fund, please see the table on page 5.
During the same period, Delaware Extended Duration Bond Fund underperformed its benchmark, the Bloomberg Barclays Long U.S. Corporate Index. The Fund’s Institutional Class shares returned +12.26%. The Fund’s Class A shares returned +12.14% at net asset value and +7.03% at maximum offer price. These figures reflect all distributions reinvested. During the same period, the Fund’s benchmark returned +15.70%. For complete annualized performance of
Delaware Extended Duration Bond Fund, please see the table on page 9.
Delaware Corporate Bond Fund
Careful analysis of the fundamentals specific to each credit, evaluating both risk and opportunity, guides our security selection process for the Fund.
Most of the Fund’s underperformance occurred during the first half of the fiscal year. Our reading of the fundamentals – including rising interest rates and firming oil prices – gave us confidence that the credit cycle would support more risk. Believing high yield bonds would be an attractive allocation, we had increased the Fund’s holdings to 16% of the portfolio by the beginning of the fiscal year. (The Fund’s investment policy allows a 20% maximum high yield exposure.) We also had modestly increased the Fund’s energy sector exposure to 12%.
Unfortunately, the global economic backdrop deteriorated significantly in August 2015, with the unexpected devaluation of China’s currency and news of oversupply in the oil markets. Default expectations for high yield increased, and that placed tremendous technical selling pressure on the entire asset class, given its exposure to commodity-driven sectors. We cut the Fund’s high yield exposure from 16% to 9%, and its energy exposure from 12% to 5%, based on our concern with the potential for further declines in valuations.
At the same time, we increased the Fund’s allocation to cash and Treasurys to prepare for potential opportunities late in the first quarter or early in the second quarter of 2016. Thanks to the ECB’s surprise move, the market snapped back more quickly than we had anticipated. Although we did not catch the entire upward move, we were poised to reinvest and the Fund had strong absolute performance in the second half of the fiscal year.
The Fund’s weakest-performing sector was energy, where it detracted 0.95% from the Fund’s
2
overall performance due to poor security selection. The Fund owned Chesapeake Energy based on our view of the quality of its assets that could be used for deleveraging. However, late in 2015, Chesapeake proposed a debt exchange offer to certain of its creditors; we viewed this move as detrimental to our investment thesis, and we accordingly exited the position.
The Fund also underperformed in the communications sector, which contained some of the Fund’s problematic high yield credits. iHeartCommunications, Intelsat, and Abengoa all had plans in place to clean up their balance sheets; however, these plans did not materialize. We exited all three positions during the fiscal year.
Also in the communications sector, Charter Communications was one of the Fund’s strongest performers. We took positions in Charter Communications’ secured bonds when the company announced its plan to acquire Bright House Networks – and thereafter Time Warner Cable – to become the second-largest cable company in the United States.
Anheuser-Busch InBev also performed well following its proposed acquisition of SABMiller. We consider this a textbook example of a company taking on leverage to finance a deal that we view as having the potential to produce sufficient free cash flow over the next few years to return it to low, pre-merger leverage levels.
Lastly, long-dated Verizon Communications bonds were a meaningful contributor to the Fund’s performance. Verizon, in our view, remains committed to improving its balance sheet as evidenced by its modest deleveraging, disciplined approach to acquisitions, and transparency to investors.
The Fund’s use of derivatives was relatively modest during the fiscal period. We used Treasury futures to hedge duration. This strategy averaged 0.25% on a notional basis throughout the fiscal year, and we closed the position before the end of
the period. (Notional value is the face amount of a security that is used to calculate the payout on a derivative contract of that underlying security at settlement.) The Fund also held a single name 5-year credit default swap (CDS) instrument to hedge the risk of further declines in oil prices. This position averaged 0.30% on a notional basis during the fiscal year, and we held it at the end of the fiscal year. Altogether, the use of derivatives cost the Fund 0.05% in relative performance.
Delaware Extended Duration Bond Fund
As with Delaware Corporate Bond Fund, careful analysis of the fundamentals specific to each credit, evaluating both risk and opportunity, guides our security selection process for the Fund. During periods in the markets when momentum-driven investing holds sway over fundamentals, conservative positioning within investment grade corporates tends to underperform the Fund’s benchmark.
This appeared to be the case for the fiscal year. Our conservative bias was pervasive across multiple industries, but was particularly pronounced in the Fund’s energy holdings. The commodity sector, which includes energy, makes up an important part of the overall longer-dated corporate market. Investors’ willingness to invest in lower-quality energy issues provided a significant boost to the benchmark’s returns. The Fund’s significant underweight in energy during the fiscal period seemed to play a meaningful role in its underperformance.
Within the Fund’s underweight allocation to energy holdings, we focused on midstream assets such as pipeline companies. Because they generally have more of a volume-driven business than a commodity-price-sensitive business, we viewed these companies as suitable Fund investments while adhering to our discipline. Nonetheless, this segment of the market moved lower. Pipeline companies Williams Partners, Energy Transfer Partners, and Enbridge Energy
3
Portfolio management review
Delaware Corporate Bond Fund and Delaware Extended Duration Bond Fund
Partners all detracted from Fund performance. We sold the Williams and Enbridge positions during the fiscal year.
Our conservative bias included underweight positions compared to the benchmark in what were the outperforming communications and basic industries sectors. Methanol producer Methanex, one of the Fund’s basic industries holdings, performed poorly in relative terms. The Fund’s lack of exposure to the metals and mining sector, which rebounded in conjunction with energy, also detracted from relative performance.
The Fund’s exposure to the electric utility sector was a strong contributor to Fund performance. Nearly 20% of the portfolio was held in electrics. This sector is somewhat more sensitive to changes in interest rates, and the Fund benefited when U.S. Treasurys rallied. Holdings in this space that performed well included Duke Energy and Appalachian Power.
The Fund also benefited from its allocation to broker–asset managers; Jefferies Group in
particular performed well. The Fund’s positions in noncorporate issues, including foreign local governments, also helped performance. U.S.-domiciled taxable municipal issues Long Island (N.Y.) Power Authority and Oregon Department of Transportation were among the Fund’s standout performers. The long maturity aspect and high-quality nature of these assets helped them outperform the broader market.
During the fiscal year, we used derivatives to manage the Fund’s underlying yield-curve risk and the overall duration of the portfolio. This was accomplished primarily through U.S. Treasury futures, and we maintained exposure to these futures at fiscal year end. Additionally, the Fund utilized credit default swaps to hedge volatility of the credit positions within the portfolio. Derivatives contributed to the Fund’s performance but accounted for less than 0.50% of performance at the portfolio level.
4
| | |
| Performance summaries | | |
| Delaware Corporate Bond Fund | | July 31, 2016 |
The performance data quoted represent past performance; past performance does not guarantee future results. Investment return and principal value will fluctuate so your shares, when redeemed, may be worth more or less than their original cost. Please obtain the performance data current for the most recent month end by calling 800 523-1918 or visiting our website at delawareinvestments.com/performance. Current performance may be lower or higher than the performance data quoted.
| | | | | | |
| Fund and benchmark performance1,2 | | Average annual total returns through July 31, 2016 |
| | | | | | | | | | | | |
| | | 1 year | | | 5 years | | | 10 years | |
Class A (Est. Sept. 15, 1998) | | | | | | | | | | | | |
Excluding sales charge | | | +5.91 | % | | | +5.44 | % | | | +7.11 | % |
Including sales charge | | | +1.21 | % | | | +4.46 | % | | | +6.61 | % |
Class C (Est. Sept. 15, 1998) | | | | | | | | | | | | |
Excluding sales charge | | | +5.12 | % | | | +4.66 | % | | | +6.31 | % |
Including sales charge | | | +4.12 | % | | | +4.66 | % | | | +6.31 | % |
Class R (Est. June 2, 2003) | | | | | | | | | | | | |
Excluding sales charge | | | +5.47 | % | | | +5.18 | % | | | +6.84 | % |
Including sales charge | | | +5.47 | % | | | +5.18 | % | | | +6.84 | % |
Institutional Class (Est. Sept. 15, 1998) | | | | | | | | | | | | |
Excluding sales charge | | | +6.18 | % | | | +5.70 | % | | | +7.39 | % |
Including sales charge | | | +6.18 | % | | | +5.70 | % | | | +7.39 | % |
Bloomberg Barclays U.S. Corporate
Investment Grade Index | | | +8.78 | % | | | +5.21 | % | | | +6.24 | % |
1Returns reflect the reinvestment of all distributions and are presented both with and without the applicable sales charges described below. Returns do not reflect the deduction of taxes the shareholder would pay on Fund distributions or redemptions of Fund shares.
Expense limitations were in effect for certain classes during some or all of the periods shown in the “Fund and benchmark performance” table. Expenses for each class are listed on the “Fund expense ratios” table on page 6. Performance would have been lower had expense limitations not been in effect.
Institutional Class shares are available without sales or asset-based distribution charges only to certain eligible accounts.
Class A shares are sold with a maximum front-end sales charge of 4.50%, and have an annual distribution and service fee of 0.25% of average daily net assets. Performance for Class A shares, excluding sales charges, assumes that no front-end sales charge applied.
Class C shares are sold with a contingent deferred sales charge of 1.00% if redeemed during the first 12 months. They are also subject to an annual distribution and service fee of 1.00% of average daily net assets. Performance for Class C shares, excluding sales charges, assumes either that contingent deferred sales charges did not apply or that the investment was not redeemed.
Class R shares are available only for certain retirement plan products. They are sold without a sales charge and have an annual distribution and service fee of 0.50% of average daily net assets.
5
Performance summaries
Delaware Corporate Bond Fund
Fixed income securities and bond funds can lose value, and investors can lose principal, as interest rates rise. They also may be affected by economic conditions that hinder an issuer’s ability to make interest and principal payments on its debt.
The Fund may also be subject to prepayment risk, the risk that the principal of a fixed income security that is held by the Fund may be prepaid prior to maturity, potentially forcing the Fund to reinvest that money at a lower interest rate.
International investments entail risks not ordinarily associated with U.S. investments including fluctuation in currency values, differences in accounting principles, or economic or political instability in other nations.
Investing in emerging markets can be riskier than investing in established foreign markets due to increased volatility and lower trading volume.
High yielding, non-investment-grade bonds (junk bonds) involve higher risk than investment grade bonds.
If and when the Fund invests in forward foreign currency contracts or uses other investments to hedge against currency risks, the Fund will be subject to special risks, including counterparty risk.
The Fund may experience portfolio turnover in excess of 100%, which could result in higher transaction costs and tax liability.
The Fund may invest in derivatives, which may involve additional expenses and are subject to risk, including the risk that an underlying security or securities index moves in the opposite direction from what the portfolio manager anticipated. A derivative transaction depends upon the counterparties’ ability to fulfill their contractual obligations.
2 The Fund’s expense ratios, as described in the most recent prospectus, are disclosed in the following “Fund expense ratios” table. Delaware Management Company has agreed to reimburse certain expenses and/or waive certain fees in order to prevent total annual fund operating expenses (excluding any 12b-1 fees, acquired fund fees and expenses, taxes, interest, short sale and dividend interest expenses, brokerage fees, certain insurance costs, and nonroutine expenses or costs, including, but not limited to, those relating to reorganizations, litigation, conducting shareholder meetings, and liquidations (collectively, nonroutine expenses)) from exceeding 0.69% of the Fund’s average daily net assets during the period from Aug. 1, 2015 through July 31, 2016.* Please see the most recent prospectus and any applicable supplement(s) for additional information on these fee waivers and/or reimbursements.
| | | | | | | | |
Fund expense ratios | | Class A | | Class C | | Class R | | Institutional Class |
Total annual operating expenses | | 0.95% | | 1.70% | | 1.20% | | 0.70% |
(without fee waivers) | | | | | | | | |
Net expenses | | 0.94% | | 1.69% | | 1.19% | | 0.69% |
(including fee waivers, if any) | | | | | | | | |
Type of waiver | | Contractual | | Contractual | | Contractual | | Contractual |
| | | | | | | | | |
*The aggregate contractual waiver period covering this report is from Nov. 28, 2014, through Nov. 28, 2016.
6
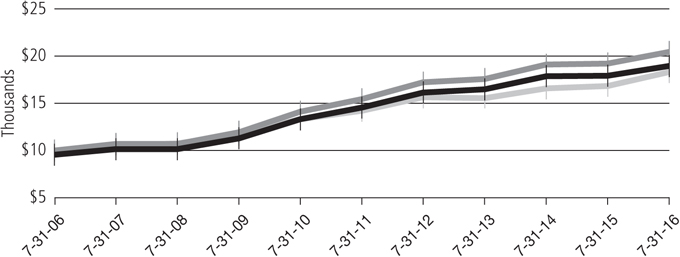
Performance of a $10,000 investment1
Average annual total returns from July 31, 2006, through July 31, 2016
| | | | | | | | | | |
For period beginning July 31, 2006, through July 31, 2016 | | Starting value | | | Ending value | |
 Delaware Corporate Bond Fund — Institutional Class shares Delaware Corporate Bond Fund — Institutional Class shares
| | | $10,000 | | | | $20,405 | |
 Delaware Corporate Bond Fund — Class A shares Delaware Corporate Bond Fund — Class A shares
| | | $9,550 | | | | $18,968 | |
 Bloomberg Barclays U.S. Corporate Investment Grade Index Bloomberg Barclays U.S. Corporate Investment Grade Index
| | | $10,000 | | | | $18,310 | |
1 The “Performance of a $10,000 investment” graph assumes $10,000 invested in Institutional Class and Class A shares of the Fund on July 31, 2006, and includes the effect of a 4.50% front-end sales charge (for Class A shares) and the reinvestment of all distributions. The graph does not reflect the deduction of taxes the shareholders would pay on Fund distributions or redemptions of Fund shares. Expense limitations were in effect for some or all of the periods shown. Performance would have been lower had expense limitations not been in effect. Expenses are listed in the “Fund expense ratios” table on page 6. Please note additional details on pages 5 through 8.
The graph also assumes $10,000 invested in the Bloomberg Barclays U.S. Corporate Investment Grade Index as of July 31, 2006. The Bloomberg Barclays U.S. Corporate Investment Grade Index (formerly known as the Barclays U.S. Corporate Investment Grade Index) is composed of U.S. dollar-denominated, investment grade, SEC-registered corporate bonds issued by industrial, utility, and financial companies. All bonds in the index have at least one year to maturity.
Index performance returns do not reflect any management fees, transaction costs, or expenses. Indices are unmanaged and one cannot invest directly in an index. Past performance is not a guarantee of future results.
Performance of other Fund classes will vary due to different charges and expenses.
7
Performance summaries
Delaware Corporate Bond Fund
| | | | | | |
| | | Nasdaq symbols | | CUSIPs | | |
Class A | | DGCAX | | 245908785 | | |
Class C | | DGCCX | | 245908769 | | |
Class R | | DGCRX | | 245908744 | | |
Institutional Class | | DGCIX | | 245908751 | | |
8
| | | | |
| Performance summaries | | | | |
| Delaware Extended Duration Bond Fund | | | July 31, 2016 | |
The performance data quoted represent past performance; past performance does not guarantee future results. Investment return and principal value will fluctuate so your shares, when redeemed, may be worth more or less than their original cost. Please obtain the performance data current for the most recent month end by calling 800 523-1918 or visiting our website at delawareinvestments.com/performance. Current performance may be lower or higher than the performance data quoted.
| | | | | | | | | | | | | | | | |
| Fund and benchmark performance1,2 | | Average annual total returns through July 31, 2016 | |
| | | 1 year | | | 5 years | | | 10 years | | | Lifetime | |
Class A (Est. Sept. 15, 1998) | | | | | | | | | | | | | | | | |
Excluding sales charge | | | +12.14 | % | | | +8.85 | % | | | +9.76 | % | | | +8.52 | % |
Including sales charge | | | +7.03 | % | | | +7.85 | % | | | +9.26 | % | | | +8.24 | % |
Class C (Est. Sept. 15, 1998) | | | | | | | | | | | | | | | | |
Excluding sales charge | | | +11.14 | % | | | +8.01 | % | | | +8.92 | % | | | +7.72 | % |
Including sales charge | | | +10.14 | % | | | +8.01 | % | | | +8.92 | % | | | +7.72 | % |
Class R (Est. Oct. 3, 2005) | | | | | | | | | | | | | | | | |
Excluding sales charge | | | +11.84 | % | | | +8.57 | % | | | +9.50 | % | | | +8.47 | % |
Including sales charge | | | +11.84 | % | | | +8.57 | % | | | +9.50 | % | | | +8.47 | % |
Institutional Class (Est. Sept. 15, 1998) | | | | | | | | | | | | | | | | |
Excluding sales charge | | | +12.26 | % | | | +9.09 | % | | | +10.01 | % | | | +8.78 | % |
Including sales charge | | | +12.26 | % | | | +9.09 | % | | | +10.01 | % | | | +8.78 | % |
Class R6 (Est. May 2, 2016) | | | | | | | | | | | | | | | | |
Excluding sales charge | | | n/a | | | | n/a | | | | n/a | | | | +7.20 | % |
Including sales charge | | | n/a | | | | n/a | | | | n/a | | | | +7.20 | % |
Bloomberg Barclays Long U.S. Corporate Index* | | | +15.70 | % | | | +8.15 | % | | | +8.21 | % | | | +7.16 | % |
*The benchmark lifetime return is for Class A share comparison only and is calculated using the last business day in the month of the Fund’s Class A inception date.
1Returns reflect the reinvestment of all distributions and are presented both with and without the applicable sales charges described below. Returns do not reflect the deduction of taxes the shareholder would pay on Fund distributions or redemptions of Fund shares.
Expense limitations were in effect for certain classes during some or all of the periods shown in the “Fund and benchmark performance” table. Expenses for each class are listed on the “Fund expense ratios” table on page 11. Performance would have been lower had expense limitations not been in effect.
Institutional Class shares are available without sales or asset-based distribution charges only to certain eligible accounts.
Class A shares are sold with a maximum front-end sales charge of 4.50%, and have an annual distribution and service fee of 0.25% of average daily net assets. Performance for Class A shares, excluding sales charges, assumes that no front-end sales charge applied.
Class C shares are sold with a contingent deferred sales charge of 1.00% if redeemed during the first 12 months. They are also subject to an annual
9
Performance summaries
Delaware Extended Duration Bond Fund
distribution and service fee of 1.00% of average daily net assets. Performance for Class C shares, excluding sales charges, assumes either that contingent deferred sales charges did not apply or that the investment was not redeemed.
Class R shares are available only for certain retirement plan products. They are sold without a sales charge and have an annual distribution and service fee of 0.50% of average daily net assets.
Class R6 shares are available only to certain investors.
Fixed income securities and bond funds can lose value, and investors can lose principal, as interest rates rise. They also may be affected by economic conditions that hinder an issuer’s ability to make interest and principal payments on its debt.
The Fund may also be subject to prepayment risk, the risk that the principal of a fixed income security that is held by the Fund may be prepaid prior to maturity, potentially forcing the Fund to reinvest that money at a lower interest rate.
International investments entail risks not ordinarily associated with U.S. investments including fluctuation in currency values, differences in
accounting principles, or economic or political instability in other nations.
Investing in emerging markets can be riskier than investing in established foreign markets due to increased volatility and lower trading volume.
High yielding, non-investment-grade bonds (junk bonds) involve higher risk than investment grade bonds.
If and when the Fund invests in forward foreign currency contracts or uses other investments to hedge against currency risks, the Fund will be subject to special risks, including counterparty risk.
The Fund may experience portfolio turnover in excess of 100%, which could result in higher transaction costs and tax liability.
The Fund may invest in derivatives, which may involve additional expenses and are subject to risk, including the risk that an underlying security or securities index moves in the opposite direction from what the portfolio manager anticipated. A derivative transaction depends upon the counterparties’ ability to fulfill their contractual obligations.
10
2 The Fund’s expense ratios, as described in the most recent prospectus, are disclosed in the following “Fund expense ratios” table. Delaware Management Company has agreed to reimburse certain expenses and/or waive certain fees in order to prevent total annual fund operating expenses (excluding any 12b-1 fees, acquired fund fees and expenses, taxes, interest, short sale and dividend interest expenses, brokerage fees, certain insurance costs, and nonroutine expenses or costs, including, but not limited to, those relating to reorganizations, litigation, conducting shareholder meetings, and liquidations (collectively, nonroutine expenses)) from exceeding 0.71% of the Fund’s average daily net assets for all share classes other than Class R6 from Aug. 1, 2015 through July 31, 2016,* and 0.63% of the Fund’s Class R6 shares’ average daily net assets from April 30, 2016 (Class R6 inception date) through July 31, 2016.* Please see the most recent prospectus and any applicable supplement(s) for additional information on these fee waivers and/or reimbursements.
| | | | | | | | | | |
Fund expense ratios | | Class A | | Class C | | Class R | | Institutional Class | | Class R6 |
Total annual operating expenses | | 1.00% | | 1.75% | | 1.25% | | 0.75% | | 0.67% |
(without fee waivers) | | | | | | | | | | |
Net expenses | | 0.96% | | 1.71% | | 1.21% | | 0.71% | | 0.63% |
(including fee waivers, if any) | | | | | | | | | | |
Type of waiver | | Contractual | | Contractual | | Contractual | | Contractual | | Contractual |
|
*The aggregate contractual waiver period covering this report is from Nov. 28, 2014, through April 30, 2017.
11
Performance summaries
Delaware Extended Duration Bond Fund
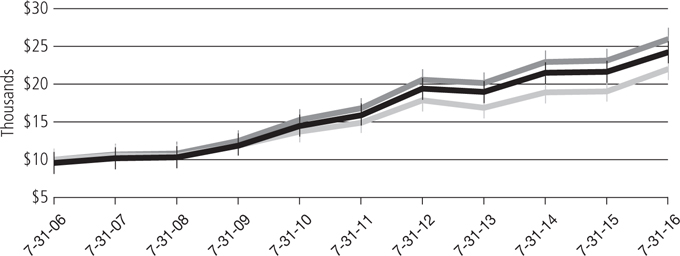
Performance of a $10,000 investment1
Average annual total returns from July 31, 2006, through July 31, 2016
| | | | | | | | | | |
For period beginning July 31, 2006, through July 31, 2016 | | Starting value | | | Ending value | |
Delaware Extended Duration Bond Fund — Institutional Class shares | | | $10,000 | | | | $25,949 | |
Delaware Extended Duration Bond Fund — Class A shares | | | $9,550 | | | | $24,249 | |
Bloomberg Barclays Long U.S. Corporate Index | | | $10,000 | | | | $22,023 | |
1The “Performance of a $10,000 investment” graph assumes $10,000 invested in Institutional Class and Class A shares of the Fund on July 31, 2006, and includes the effect of a 4.50% front-end sales charge (for Class A shares) and the reinvestment of all distributions. The graph does not reflect the deduction of taxes the shareholders would pay on Fund distributions or redemptions of Fund shares. Expense limitations were in effect for some or all of the periods shown. Performance would have been lower had expense limitations not been in effect. Expenses are listed in the “Fund expense ratios” table on page 11. Please note additional details on pages 9 through 13.
The graph also assumes $10,000 invested in the Bloomberg Barclays Long U.S. Corporate Index as of July 31, 2006. The Bloomberg Barclays Long U.S. Corporate Index (formerly known as the Barclays Long U.S. Corporate Index) is composed of U.S. dollar-denominated, investment grade, SEC-registered corporate bonds issued by industrial, utility, and financial companies. All bonds in the index have at least 10 years to maturity.
Index performance returns do not reflect any management fees, transaction costs, or expenses. Indices are unmanaged and one cannot invest directly in an index. Past performance is not a guarantee of future results.
Performance of other Fund classes will vary due to different charges and expenses.
12
| | | | | | |
| | | Nasdaq symbols | | CUSIPs | | |
Class A | | DEEAX | | 245908835 | | |
Class C | | DEECX | | 245908819 | | |
Class R | | DEERX | | 245908728 | | |
Institutional Class | | DEEIX | | 245908793 | | |
Class R6 | | DEZRX | | 245908629 | | |
13
Disclosure of Fund expenses
For the six-month period from February 1, 2016 to July 31, 2016 (Unaudited)
As a shareholder of a Fund, you incur two types of costs: (1) transaction costs, including sales charges (loads) on purchase payments, reinvested dividends, or other distributions; redemption fees; and exchange fees; and (2) ongoing costs, including management fees; distribution and/or service (12b-1) fees; and other Fund expenses. These following examples are intended to help you understand your ongoing costs (in dollars) of investing in a Fund and to compare these costs with the ongoing costs of investing in other mutual funds.
The examples are based on an investment of $1,000 invested at the beginning of the period and held for the entire six-month period from Feb. 1, 2016 to July 31, 2016.
Actual expenses
The first section of the tables shown, “Actual Fund return,” provides information about actual account values and actual expenses. You may use the information in this section of the table, together with the amount you invested, to estimate the expenses that you paid over the period. Simply divide your account value by $1,000 (for example, an $8,600 account value divided by $1,000 = 8.6), then multiply the result by the number in the first section under the heading entitled “Expenses Paid During Period” to estimate the expenses you paid on your account during this period.
Hypothetical example for comparison purposes
The second section of the tables shown, “Hypothetical 5% return,” provides information about hypothetical account values and hypothetical expenses based on the Funds’ actual expense ratios and an assumed rate of return of 5% per year before expenses, which is not the Funds’ actual return. The hypothetical account values and expenses may not be used to estimate the actual ending account balance or expenses you paid for the period. You may use this information to compare the ongoing costs of investing in each Fund and other funds. To do so, compare this 5% hypothetical example with the 5% hypothetical examples that appear in the shareholder reports of the other funds.
Please note that the expenses shown in the tables are meant to highlight your ongoing costs only and do not reflect any transactional costs, such as sales charges (loads), redemption fees, or exchange fees. Therefore, the second section of each table is useful in comparing ongoing costs only, and will not help you determine the relative total costs of owning different funds. In addition, if these transactional costs were included, your costs would have been higher. The Funds’ expenses shown in the tables reflect fee waivers in effect. The expenses shown in each table assume reinvestment of all dividends and distributions.
14
Delaware Corporate Bond Fund
Expense analysis of an investment of $1,000
| | | | | | | | | | | | | | | | |
| | | Beginning Account Value 2/1/16 | | | Ending Account Value 7/31/16 | | | Annualized Expense Ratio | | | Expenses Paid During Period 2/1/16 to 7/31/16* | |
Actual Fund return† | | | | | | | | | | | | | | | | |
Class A | | | $1,000.00 | | | | $1,078.20 | | | | 0.94% | | | | $4.86 | |
Class C | | | 1,000.00 | | | | 1,074.20 | | | | 1.69% | | | | 8.72 | |
Class R | | | 1,000.00 | | | | 1,076.80 | | | | 1.19% | | | | 6.14 | |
Institutional Class | | | 1,000.00 | | | | 1,079.50 | | | | 0.69% | | | | 3.57 | |
Hypothetical 5% return (5% return before expenses) | |
Class A | | | $1,000.00 | | | | $1,020.19 | | | | 0.94% | | | | $4.72 | |
Class C | | | 1,000.00 | | | | 1,016.46 | | | | 1.69% | | | | 8.47 | |
Class R | | | 1,000.00 | | | | 1,018.95 | | | | 1.19% | | | | 5.97 | |
Institutional Class | | | 1,000.00 | | | | 1,021.43 | | | | 0.69% | | | | 3.47 | |
15
Disclosure of Fund expenses
For the six-month period from February 1, 2016 to July 31, 2016 (Unaudited)
Delaware Extended Duration Bond Fund
Expense analysis of an investment of $1,000
| | | | | | | | | | | | | | | | |
| | | Beginning Account Value 2/1/16 | | | Ending Account Value 7/31/16 | | | Annualized Expense Ratio | | | Expenses Paid During Period 2/1/16 to 7/31/16* | |
Actual Fund return† | | | | | | | | | | | | | | | | |
Class A | | | $1,000.00 | | | | $1,128.20 | | | | 0.96% | | | | $5.08 | |
Class C | | | 1,000.00 | | | | 1,124.20 | | | | 1.71% | | | | 9.03 | |
Class R | | | 1,000.00 | | | | 1,126.60 | | | | 1.21% | | | | 6.40 | |
Institutional Class | | | 1,000.00 | | | | 1,128.10 | | | | 0.71% | | | | 3.76 | |
Class R6** | | | 1,000.00 | | | | 1,072.00 | | | | 0.63% | | | | 1.60 | |
Hypothetical 5% return (5% return before expenses) | |
Class A | | | $1,000.00 | | | | $1,020.09 | | | | 0.96% | | | | $4.82 | |
Class C | | | 1,000.00 | | | | 1,016.36 | | | | 1.71% | | | | 8.57 | |
Class R | | | 1,000.00 | | | | 1,018.85 | | | | 1.21% | | | | 6.07 | |
Institutional Class | | | 1,000.00 | | | | 1,021.33 | | | | 0.71% | | | | 3.57 | |
Class R6** | | | 1,000.00 | | | | 1,021.73 | | | | 0.63% | | | | 3.17 | |
| * | “Expenses Paid During Period” are equal to the relevant Fund’s annualized expense ratio, multiplied by the average account value over the period, multiplied by 182/366 (to reflect the one-half year period). |
| † | Because actual returns reflect only the most recent six-month period, the returns shown may differ significantly from fiscal year returns. |
| ** | The Class R6 shares commenced operations on May 2, 2016. The ending account value for “Actual” uses the performance since inception and is not annualized and the expenses paid during the period for “Actual” are equal to the Class R6 annualized expense ratio, multiplied by the average account value over the period, multiplied by 90/366 (to reflect the actual days since inception). |
16
| | | | |
| Security type / sector allocations | | | | |
| Delaware Corporate Bond Fund | | | As of July 31, 2016 (Unaudited) | |
Sector designations may be different than the sector designations presented in other Fund materials. The sector designations may represent the investment manager’s internal sector classifications, which may result in the sector designations for one fund being different than another fund’s sector designations.
| | | | |
Security type / sector | | Percentage of net assets | |
Convertible Bonds | | | 0.73% | |
Corporate Bonds | | | 93.89% | |
Banking | | | 18.14% | |
Basic Industry | | | 5.06% | |
Brokerage | | | 1.32% | |
Capital Goods | | | 1.90% | |
Communications | | | 13.50% | |
Consumer Cyclical | | | 4.62% | |
Consumer Non-Cyclical | | | 12.52% | |
Electric | | | 11.63% | |
Energy | | | 6.89% | |
Finance Companies | | | 2.92% | |
Insurance | | | 2.62% | |
Natural Gas | | | 0.81% | |
Real Estate Investment Trusts | | | 3.54% | |
Technology | | | 4.88% | |
Transportation | | | 3.54% | |
Municipal Bond | | | 0.74% | |
Senior Secured Loans | | | 1.21% | |
Sovereign Bond | | | 0.14% | |
U.S. Treasury Obligation | | | 0.21% | |
Preferred Stock | | | 2.20% | |
Short-Term Investments | | | 0.86% | |
Total Value of Securities | | | 99.98% | |
Receivables and Other Assets Net of Liabilities | | | 0.02% | |
Total Net Assets | | | 100.00% | |
17
| | | | |
| Security type / sector allocations | | | | |
| Delaware Extended Duration Bond Fund | | | As of July 31, 2016 (Unaudited) | |
Sector designations may be different than the sector designations presented in other Fund materials. The sector designations may represent the investment manager’s internal sector classifications, which may result in the sector designations for one fund being different than another fund’s sector designations.
| | | | |
Security type / sector | | Percentage of net assets | |
Corporate Bonds | | | 91.52% | |
Banking | | | 14.61% | |
Basic Industry | | | 4.99% | |
Brokerage | | | 1.79% | |
Capital Goods | | | 2.79% | |
Communications | | | 11.78% | |
Consumer Cyclical | | | 6.66% | |
Consumer Non-Cyclical | | | 15.32% | |
Electric | | | 16.85% | |
Energy | | | 5.09% | |
Finance Companies | | | 0.45% | |
Insurance | | | 4.76% | |
Natural Gas | | | 0.94% | |
Real Estate Investment Trusts | | | 0.27% | |
Technology | | | 3.51% | |
Transportation | | | 1.71% | |
Municipal Bonds | | | 4.06% | |
U.S. Treasury Obligations | | | 0.73% | |
Preferred Stock | | | 1.90% | |
Short-Term Investments | | | 1.68% | |
Total Value of Securities | | | 99.89% | |
Receivables and Other Assets Net of Liabilities | | | 0.11% | |
Total Net Assets | | | 100.00% | |
18
Schedules of investments
| | | | |
Delaware Corporate Bond Fund | | | July 31, 2016 | |
| | | | | | | | |
| | | Principal amount° | | | Value (U.S. $) | |
| |
Convertible Bonds – 0.73% | | | | | | | | |
| |
Clearwire Communications 144A 8.25% exercise price | | | | | | | | |
$19.90, expiration date 12/1/40 # | | | 5,502,000 | | | $ | 5,722,080 | |
Meritor 4.00% exercise price $26.73, expiration date | | | | | | | | |
2/15/27 f | | | 2,603,000 | | | | 2,533,044 | |
| | | | | | | | |
Total Convertible Bonds (cost $8,118,344) | | | | | | | 8,255,124 | |
| | | | | | | | |
|
| |
Corporate Bonds – 93.89% | | | | | | | | |
| |
Banking – 18.14% | | | | | | | | |
Ally Financial 8.00% 11/1/31 | | | 1,840,000 | | | | 2,249,400 | |
Bank of America 4.45% 3/3/26 | | | 10,770,000 | | | | 11,589,198 | |
Bank of New York Mellon 4.625% 12/29/49 ● | | | 3,430,000 | | | | 3,430,000 | |
Branch Banking & Trust 3.625% 9/16/25 | | | 10,125,000 | | | | 10,959,472 | |
Capital One Financial 3.75% 7/28/26 | | | 8,400,000 | | | | 8,473,861 | |
Citizens Financial Group 4.30% 12/3/25 | | | 6,955,000 | | | | 7,396,566 | |
Compass Bank 3.875% 4/10/25 | | | 7,970,000 | | | | 7,705,563 | |
Cooperatieve Rabobank 3.75% 7/21/26 | | | 5,490,000 | | | | 5,516,456 | |
Credit Suisse Group 144A 6.25% 12/29/49 #● | | | 3,865,000 | | | | 3,749,607 | |
Credit Suisse Group Funding Guernsey | | | | | | | | |
144A 3.80% 6/9/23 # | | | 1,745,000 | | | | 1,773,149 | |
144A 4.55% 4/17/26 # | | | 12,330,000 | | | | 13,039,086 | |
Fifth Third Bancorp 2.875% 7/27/20 | | | 4,065,000 | | | | 4,234,063 | |
Fifth Third Bank 3.85% 3/15/26 | | | 9,115,000 | | | | 9,741,766 | |
JPMorgan Chase | | | | | | | | |
2.95% 10/1/26 | | | 4,230,000 | | | | 4,276,517 | |
4.25% 10/1/27 | | | 10,300,000 | | | | 11,125,071 | |
6.75% 1/29/49 ● | | | 4,000,000 | | | | 4,509,600 | |
KeyBank | | | | | | | | |
3.18% 5/22/22 | | | 5,495,000 | | | | 5,684,001 | |
3.40% 5/20/26 | | | 12,610,000 | | | | 12,990,444 | |
Morgan Stanley | | | | | | | | |
3.125% 7/27/26 | | | 9,375,000 | | | | 9,461,925 | |
3.95% 4/23/27 | | | 10,355,000 | | | | 10,719,931 | |
PNC Bank | | | | | | | | |
2.45% 11/5/20 | | | 3,455,000 | | | | 3,571,986 | |
2.60% 7/21/20 | | | 2,500,000 | | | | 2,597,010 | |
Popular 7.00% 7/1/19 | | | 4,475,000 | | | | 4,575,688 | |
Royal Bank of Scotland Group 8.00% 12/29/49 ● | | | 1,100,000 | | | | 1,095,875 | |
Santander UK Group Holdings 3.125% 1/8/21 | | | 2,595,000 | | | | 2,640,553 | |
State Street 3.55% 8/18/25 | | | 2,310,000 | | | | 2,542,090 | |
SVB Financial Group 3.50% 1/29/25 | | | 655,000 | | | | 655,133 | |
UBS 7.625% 8/17/22 | | | 7,555,000 | | | | 8,801,575 | |
UBS Group Funding Jersey | | | | | | | | |
144A 3.00% 4/15/21 # | | | 200,000 | | | | 206,094 | |
19
Schedules of investments
Delaware Corporate Bond Fund
| | | | | | | | |
| | | Principal amount° | | | Value (U.S. $) | |
| |
Corporate Bonds (continued) | | | | | | | | |
| |
Banking (continued) | | | | | | | | |
UBS Group Funding Jersey | | | | | | | | |
144A 4.125% 4/15/26 # | | | 1,430,000 | | | $ | 1,514,985 | |
US Bancorp | | | | | | | | |
2.375% 7/22/26 | | | 5,175,000 | | | | 5,189,438 | |
3.60% 9/11/24 | | | 6,730,000 | | | | 7,324,770 | |
USB Capital IX 3.50% 10/29/49 @● | | | 3,207,000 | | | | 2,762,029 | |
Wells Fargo | | | | | | | | |
4.30% 7/22/27 | | | 1,450,000 | | | | 1,589,742 | |
4.40% 6/14/46 | | | 7,960,000 | | | | 8,460,676 | |
Zions Bancorporation 4.50% 6/13/23 | | | 4,100,000 | | | | 4,291,462 | |
| | | | | | | | |
| | | | | | | 206,444,782 | |
| | | | | | | | |
Basic Industry – 5.06% | | | | | | | | |
BHP Billiton Finance USA 144A 6.25% 10/19/75 #● | | | 2,705,000 | | | | 2,934,925 | |
Dow Chemical 8.55% 5/15/19 | | | 4,420,000 | | | | 5,266,770 | |
Eastman Chemical | | | | | | | | |
3.80% 3/15/25 | | | 695,000 | | | | 738,388 | |
4.65% 10/15/44 | | | 10,815,000 | | | | 11,398,848 | |
Georgia-Pacific 8.00% 1/15/24 | | | 8,345,000 | | | | 11,220,979 | |
International Paper 5.15% 5/15/46 | | | 4,350,000 | | | | 5,046,753 | |
INVISTA Finance 144A 4.25% 10/15/19 # | | | 4,580,000 | | | | 4,568,170 | |
Mexichem 144A 5.875% 9/17/44 # | | | 3,595,000 | | | | 3,562,465 | |
NOVA Chemicals 144A 5.00% 5/1/25 # | | | 3,860,000 | | | | 3,927,550 | |
Rio Tinto Finance USA 3.75% 6/15/25 | | | 5,900,000 | | | | 6,349,497 | |
Vale Overseas 5.875% 6/10/21 | | | 2,445,000 | | | | 2,536,688 | |
| | | | | | | | |
| | | | | | | 57,551,033 | |
| | | | | | | | |
Brokerage – 1.32% | | | | | | | | |
Affiliated Managers Group 3.50% 8/1/25 | | | 4,135,000 | | | | 4,166,170 | |
Jefferies Group | | | | | | | | |
5.125% 1/20/23 | | | 255,000 | | | | 271,185 | |
6.45% 6/8/27 | | | 5,627,000 | | | | 6,298,678 | |
6.50% 1/20/43 | | | 1,575,000 | | | | 1,636,970 | |
Lazard Group | | | | | | | | |
3.75% 2/13/25 | | | 1,075,000 | | | | 1,087,611 | |
6.85% 6/15/17 | | | 1,525,000 | | | | 1,593,148 | |
| | | | | | | | |
| | | | | | | 15,053,762 | |
| | | | | | | | |
Capital Goods – 1.90% | | | | | | | | |
Ardagh Packaging Finance 144A 4.625% 5/15/23 # | | | 2,900,000 | | | | 2,932,625 | |
Eagle Materials 4.50% 8/1/26 | | | 840,000 | | | | 854,175 | |
Fortive 144A 3.15% 6/15/26 # | | | 4,325,000 | | | | 4,585,214 | |
Fortune Brands Home & Security 3.00% 6/15/20 | | | 2,865,000 | | | | 2,955,038 | |
HD Supply 144A 5.75% 4/15/24 # | | | 1,310,000 | | | | 1,398,229 | |
Masco 3.50% 4/1/21 | | | 3,835,000 | | | | 4,002,896 | |
20
| | | | | | | | |
| | | Principal amount° | | | Value (U.S. $) | |
| |
Corporate Bonds (continued) | | | | | | | | |
| |
Capital Goods (continued) | | | | | | | | |
Reynolds Group Issuer 144A 5.125% 7/15/23 # | | | 2,815,000 | | | $ | 2,906,488 | |
Waste Management 2.40% 5/15/23 | | | 1,995,000 | | | | 2,034,581 | |
| | | | | | | | |
| | | | | | | 21,669,246 | |
| | | | | | | | |
Communications – 13.50% | | | | | | | | |
21st Century Fox America 4.95% 10/15/45 | | | 4,300,000 | | | | 5,121,003 | |
Altice Luxembourg 144A 7.75% 5/15/22 # | | | 2,270,000 | | | | 2,311,201 | |
American Tower | | | | | | | | |
2.80% 6/1/20 | | | 4,730,000 | | | | 4,881,261 | |
4.00% 6/1/25 | | | 9,130,000 | | | | 9,944,442 | |
AT&T | | | | | | | | |
3.60% 2/17/23 | | | 3,140,000 | | | | 3,339,939 | |
4.35% 6/15/45 | | | 2,800,000 | | | | 2,815,134 | |
5.65% 2/15/47 | | | 6,130,000 | | | | 7,334,324 | |
CCO Holdings | | | | | | | | |
144A 5.50% 5/1/26 # | | | 2,565,000 | | | | 2,683,631 | |
144A 5.875% 4/1/24 # | | | 335,000 | | | | 358,450 | |
Charter Communications Operating 144A | | | | | | | | |
4.908% 7/23/25 # | | | 9,555,000 | | | | 10,569,129 | |
Comcast 2.35% 1/15/27 | | | 9,245,000 | | | | 9,268,760 | |
Crown Castle International 5.25% 1/15/23 | | | 4,295,000 | | | | 4,932,421 | |
Crown Castle Towers 144A 3.663% 5/15/25 # | | | 7,035,000 | | | | 7,316,470 | |
Digicel 144A 6.00% 4/15/21 # | | | 2,100,000 | | | | 1,960,875 | |
Digicel Group 144A 8.25% 9/30/20 # | | | 2,785,000 | | | | 2,555,237 | |
DISH DBS 144A 7.75% 7/1/26 # | | | 2,720,000 | | | | 2,827,100 | |
Gray Television 144A 5.875% 7/15/26 # | | | 2,645,000 | | | | 2,725,673 | |
Grupo Televisa 5.00% 5/13/45 | | | 4,770,000 | | | | 4,856,680 | |
GTP Acquisition Partners I 144A 2.35% 6/15/20 # | | | 2,130,000 | | | | 2,122,609 | |
Historic TW 6.875% 6/15/18 | | | 5,285,000 | | | | 5,819,335 | |
Level 3 Financing 144A 5.25% 3/15/26 # | | | 3,505,000 | | | | 3,675,869 | |
Neptune Finco 144A 6.625% 10/15/25 # | | | 2,125,000 | | | | 2,295,000 | |
SBA Tower Trust | | | | | | | | |
144A 2.24% 4/16/18 # | | | 4,945,000 | | | | 4,954,881 | |
144A 2.898% 10/15/19 # | | | 3,005,000 | | | | 3,042,506 | |
SFR Group 144A 6.00% 5/15/22 # | | | 1,270,000 | | | | 1,243,013 | |
Sky 144A 3.75% 9/16/24 # | | | 7,675,000 | | | | 8,162,501 | |
Time Warner Cable 7.30% 7/1/38 | | | 7,785,000 | | | | 10,192,270 | |
T-Mobile USA | | | | | | | | |
6.00% 4/15/24 | | | 950,000 | | | | 1,016,206 | |
6.50% 1/15/26 | | | 1,885,000 | | | | 2,048,524 | |
UPCB Finance IV 144A 5.375% 1/15/25 # | | | 1,600,000 | | | | 1,620,128 | |
Verizon Communications | | | | | | | | |
1.75% 8/15/21 | | | 7,000,000 | | | | 7,007,000 | |
21
Schedules of investments
Delaware Corporate Bond Fund
| | | | | | | | |
| | | Principal amount° | | | Value (U.S. $) | |
| |
Corporate Bonds (continued) | | | | | | | | |
| |
Communications (continued) | | | | | | | | |
Verizon Communications | | | | | | | | |
4.522% 9/15/48 | | | 9,865,000 | | | $ | 10,573,603 | |
WPP Finance 2010 5.625% 11/15/43 | | | 3,446,000 | | | | 4,162,361 | |
| | | | | | | | |
| | | | | | | 153,737,536 | |
| | | | | | | | |
Consumer Cyclical – 4.62% | | | | | | | | |
BMW U.S. Capital 144A 2.00% 4/11/21 # | | | 2,500,000 | | | | 2,543,453 | |
Boyd Gaming 144A 6.375% 4/1/26 # | | | 2,100,000 | | | | 2,249,625 | |
Ford Motor Credit 3.336% 3/18/21 | | | 2,640,000 | | | | 2,756,625 | |
General Motors Financial | | | | | | | | |
3.45% 4/10/22 | | | 4,155,000 | | | | 4,243,950 | |
5.25% 3/1/26 | | | 5,445,000 | | | | 6,090,984 | |
GEO Group 6.00% 4/15/26 | | | 2,720,000 | | | | 2,798,200 | |
Hyundai Capital America 144A 3.00% 3/18/21 # | | | 5,860,000 | | | | 6,081,039 | |
KFC Holding 144A 5.00% 6/1/24 # | | | 2,824,000 | | | | 2,958,140 | |
Marriott International 3.125% 6/15/26 | | | 7,310,000 | | | | 7,475,184 | |
MGM Growth Properties Operating Partnership 144A | | | | | | | | |
5.625% 5/1/24 # | | | 917,000 | | | | 984,399 | |
Starwood Hotels & Resorts Worldwide 3.75% 3/15/25 @ | | | 3,135,000 | | | | 3,326,188 | |
Walgreens Boots Alliance | | | | | | | | |
3.10% 6/1/23 | | | 9,520,000 | | | | 9,848,392 | |
4.80% 11/18/44 | | | 1,090,000 | | | | 1,238,451 | |
| | | | | | | | |
| | | | | | | 52,594,630 | |
| | | | | | | | |
Consumer Non-Cyclical – 12.52% | | | | | | | | |
AbbVie 3.20% 5/14/26 | | | 6,175,000 | | | | 6,346,375 | |
Anheuser-Busch InBev Finance 3.65% 2/1/26 | | | 12,865,000 | | | | 13,840,167 | |
AstraZeneca 3.375% 11/16/25 | | | 7,170,000 | | | | 7,699,153 | |
Biogen | | | | | | | | |
4.05% 9/15/25 | | | 1,200,000 | | | | 1,316,114 | |
5.20% 9/15/45 | | | 3,625,000 | | | | 4,361,875 | |
Celgene | | | | | | | | |
3.25% 8/15/22 | | | 2,315,000 | | | | 2,432,188 | |
3.875% 8/15/25 | | | 4,345,000 | | | | 4,722,724 | |
HCA 5.875% 2/15/26 | | | 2,660,000 | | | | 2,852,850 | |
HealthSouth 5.75% 11/1/24 | | | 2,405,000 | | | | 2,507,213 | |
JB y Cia 144A 3.75% 5/13/25 # | | | 8,965,000 | | | | 9,288,556 | |
Molson Coors Brewing | | | | | | | | |
2.10% 7/15/21 | | | 1,020,000 | | | | 1,034,739 | |
3.00% 7/15/26 | | | 2,865,000 | | | | 2,932,035 | |
4.20% 7/15/46 | | | 1,640,000 | | | | 1,735,527 | |
Mylan | | | | | | | | |
144A 3.15% 6/15/21 # | | | 1,930,000 | | | | 1,992,677 | |
144A 3.95% 6/15/26 # | | | 10,130,000 | | | | 10,570,027 | |
22
| | | | | | | | |
| | | Principal amount° | | | Value (U.S. $) | |
| |
Corporate Bonds (continued) | | | | | | | | |
| |
Consumer Non-Cyclical (continued) | | | | | | | | |
Pernod Ricard | | | | | | | | |
144A 3.25% 6/8/26 # | | | 7,100,000 | | | $ | 7,353,569 | |
144A 4.45% 1/15/22 # | | | 2,515,000 | | | | 2,783,552 | |
Perrigo Finance Unlimited 3.50% 12/15/21 | | | 2,710,000 | | | | 2,829,655 | |
Reynolds American | | | | | | | | |
4.00% 6/12/22 | | | 7,260,000 | | | | 7,973,026 | |
4.45% 6/12/25 | | | 6,720,000 | | | | 7,600,797 | |
Sigma Alimentos 144A 4.125% 5/2/26 # | | | 4,705,000 | | | | 4,893,200 | |
Sysco 3.30% 7/15/26 | | | 9,530,000 | | | | 10,091,574 | |
Tenet Healthcare 6.75% 6/15/23 | | | 2,700,000 | | | | 2,608,875 | |
Teva Pharmaceutical Finance Netherlands III | | | | | | | | |
2.20% 7/21/21 | | | 3,370,000 | | | | 3,390,938 | |
2.80% 7/21/23 | | | 3,530,000 | | | | 3,596,894 | |
3.15% 10/1/26 | | | 2,205,000 | | | | 2,258,229 | |
Thermo Fisher Scientific 3.00% 4/15/23 | | | 6,775,000 | | | | 7,000,506 | |
Universal Health Services 144A 4.75% 8/1/22 # | | | 2,170,000 | | | | 2,240,525 | |
Zimmer Biomet Holdings 4.45% 8/15/45 | | | 4,025,000 | | | | 4,320,254 | |
| | | | | | | | |
| | | | | | | 142,573,814 | |
| | | | | | | | |
Electric – 11.63% | | | | | | | | |
Ameren 3.65% 2/15/26 | | | 2,555,000 | | | | 2,778,673 | |
Ameren Illinois 9.75% 11/15/18 | | | 6,971,000 | | | | 8,248,770 | |
Appalachian Power | | | | | | | | |
3.40% 6/1/25 | | | 6,700,000 | | | | 7,202,306 | |
4.45% 6/1/45 | | | 2,850,000 | | | | 3,170,691 | |
Calpine 5.50% 2/1/24 | | | 3,155,000 | | | | 3,162,887 | |
Cleveland Electric Illuminating 5.50% 8/15/24 | | | 8,160,000 | | | | 9,809,634 | |
ComEd Financing III 6.35% 3/15/33 @ | | | 7,500,000 | | | | 7,963,387 | |
Commonwealth Edison 3.65% 6/15/46 | | | 5,075,000 | | | | 5,351,161 | |
Dominion Resources 3.90% 10/1/25 | | | 7,870,000 | | | | 8,572,917 | |
Duke Energy Ohio 3.70% 6/15/46 | | | 3,325,000 | | | | 3,538,166 | |
Electricite de France 144A 5.25% 12/29/49 #● | | | 4,860,000 | | | | 4,756,725 | |
Emera 6.75% 6/15/76 ● | | | 5,975,000 | | | | 6,471,003 | |
Emera US Finance 144A 4.75% 6/15/46 # | | | 1,870,000 | | | | 2,067,910 | |
Enel 144A 8.75% 9/24/73 #● | | | 4,125,000 | | | | 4,790,156 | |
Entergy 4.00% 7/15/22 | | | 1,620,000 | | | | 1,759,364 | |
Entergy Louisiana 3.78% 4/1/25 | | | 7,220,000 | | | | 7,844,479 | |
ITC Holdings 3.25% 6/30/26 | | | 4,355,000 | | | | 4,452,160 | |
Kansas City Power & Light 3.65% 8/15/25 | | | 10,115,000 | | | | 10,849,561 | |
National Rural Utilities Cooperative Finance | | | | | | | | |
5.25% 4/20/46 ● | | | 1,790,000 | | | | 1,893,641 | |
NV Energy 6.25% 11/15/20 | | | 4,475,000 | | | | 5,315,222 | |
Pennsylvania Electric 5.20% 4/1/20 | | | 8,131,000 | | | | 8,838,421 | |
23
Schedules of investments
Delaware Corporate Bond Fund
| | | | | | | | |
| | | Principal amount° | | | Value (U.S. $) | |
| |
Corporate Bonds (continued) | | | | | | | | |
| |
Electric (continued) | | | | | | | | |
Southern | | | | | | | | |
3.25% 7/1/26 | | | 8,340,000 | | | $ | 8,740,078 | |
4.40% 7/1/46 | | | 2,355,000 | | | | 2,620,211 | |
Trans-Allegheny Interstate Line 144A 3.85% 6/1/25 # | | | 2,000,000 | | | | 2,146,736 | |
| | | | | | | | |
| | | | | | | 132,344,259 | |
| | | | | | | | |
Energy – 6.89% | | | | | | | | |
Anadarko Petroleum 5.55% 3/15/26 | | | 2,325,000 | | | | 2,542,613 | |
ConocoPhillips | | | | | | | | |
4.95% 3/15/26 | | | 5,905,000 | | | | 6,579,445 | |
5.95% 3/15/46 | | | 2,400,000 | | | | 2,905,339 | |
Energy Transfer Partners | | | | | | | | |
4.75% 1/15/26 | | | 3,215,000 | | | | 3,291,585 | |
6.125% 12/15/45 | | | 770,000 | | | | 809,385 | |
EnLink Midstream Partners | | | | | | | | |
2.70% 4/1/19 | | | 5,895,000 | | | | 5,778,639 | |
4.85% 7/15/26 | | | 1,705,000 | | | | 1,660,510 | |
Enterprise Products Operating | | | | | | | | |
3.95% 2/15/27 | | | 3,485,000 | | | | 3,679,606 | |
5.10% 2/15/45 | | | 1,625,000 | | | | 1,769,073 | |
Noble Energy | | | | | | | | |
4.15% 12/15/21 | | | 3,440,000 | | | | 3,650,580 | |
5.05% 11/15/44 | | | 2,040,000 | | | | 2,030,934 | |
5.625% 5/1/21 | | | 1,520,000 | | | | 1,602,340 | |
Petroleos Mexicanos | | | | | | | | |
3.50% 7/23/20 | | | 925,000 | | | | 933,094 | |
5.50% 6/27/44 | | | 2,486,000 | | | | 2,261,987 | |
Regency Energy Partners 5.875% 3/1/22 | | | 3,991,000 | | | | 4,357,821 | |
Shell International Finance | | | | | | | | |
2.875% 5/10/26 | | | 8,155,000 | | | | 8,326,239 | |
4.00% 5/10/46 | | | 3,525,000 | | | | 3,635,428 | |
Sunoco Logistics Partners Operations 3.90% 7/15/26 | | | 3,185,000 | | | | 3,171,970 | |
Williams Partners 7.25% 2/1/17 | | | 8,087,000 | | | | 8,285,617 | |
Woodside Finance | | | | | | | | |
144A 3.65% 3/5/25 # | | | 2,055,000 | | | | 2,051,184 | |
144A 8.75% 3/1/19 # | | | 7,800,000 | | | | 9,070,534 | |
| | | | | | | | |
| | | | | | | 78,393,923 | |
| | | | | | | | |
Finance Companies – 2.92% | | | | | | | | |
AerCap Ireland Capital | | | | | | | | |
3.95% 2/1/22 | | | 4,575,000 | | | | 4,802,286 | |
4.625% 10/30/20 | | | 3,095,000 | | | | 3,319,387 | |
Aviation Capital Group | | | | | | | | |
144A 2.875% 9/17/18 # | | | 405,000 | | | | 411,581 | |
24
| | | | | | | | |
| | | Principal amount° | | | Value (U.S. $) | |
| |
Corporate Bonds (continued) | | | | | | | | |
| |
Finance Companies (continued) | | | | | | | | |
Aviation Capital Group | | | | | | | | |
144A 4.875% 10/1/25 # | | | 2,870,000 | | | $ | 2,998,145 | |
144A 6.75% 4/6/21 # | | | 3,005,000 | | | | 3,515,099 | |
Depository Trust & Clearing 144A 4.875% 12/29/49 #● | | | 6,000,000 | | | | 6,090,000 | |
Peachtree Corners Funding Trust 144A 3.976% 2/15/25 # | | | 9,115,000 | | | | 9,273,929 | |
SMBC Aviation Capital Finance 144A 2.65% 7/15/21 # | | | 2,800,000 | | | | 2,819,852 | |
| | | | | | | | |
| | | | | | | 33,230,279 | |
| | | | | | | | |
Insurance – 2.62% | | | | | | | | |
Highmark 144A 6.125% 5/15/41 #@ | | | 920,000 | | | | 925,174 | |
MetLife 5.25% 12/29/49 ● | | | 4,200,000 | | | | 4,213,860 | |
MetLife Capital Trust X 144A 9.25% 4/8/38 # | | | 2,160,000 | | | | 3,091,500 | |
Principal Life Global Funding II 144A 3.00% 4/18/26 # | | | 3,584,000 | | | | 3,722,081 | |
Prudential Financial 5.375% 5/15/45 ● | | | 3,370,000 | | | | 3,509,013 | |
TIAA Asset Management Finance 144A 4.125% 11/1/24 # | | | 9,450,000 | | | | 10,003,061 | |
XLIT | | | | | | | | |
4.45% 3/31/25 | | | 2,380,000 | | | | 2,418,280 | |
6.50% 10/29/49 ● | | | 2,822,000 | | | | 1,954,235 | |
| | | | | | | | |
| | | | | | | 29,837,204 | |
| | | | | | | | |
Natural Gas – 0.81% | | | | | | | | |
Korea Gas 144A 2.875% 7/29/18 # | | | 6,425,000 | | | | 6,598,032 | |
Southern Gas Capital 3.25% 6/15/26 | | | 2,555,000 | | | | 2,658,531 | |
| | | | | | | | |
| | | | | | | 9,256,563 | |
| | | | | | | | |
Real Estate Investment Trusts – 3.54% | | | | | | | | |
Alexandria Real Estate Equities 3.95% 1/15/27 | | | 1,260,000 | | | | 1,319,773 | |
Corporate Office Properties 5.25% 2/15/24 | | | 5,730,000 | | | | 6,222,098 | |
CubeSmart 4.00% 11/15/25 | | | 4,690,000 | | | | 5,003,029 | |
Education Realty Operating Partnership 4.60% 12/1/24 | | | 4,170,000 | | | | 4,382,270 | |
ESH Hospitality 144A 5.25% 5/1/25 # | | | 3,070,000 | | | | 3,070,000 | |
Host Hotels & Resorts | | | | | | | | |
3.75% 10/15/23 | | | 8,645,000 | | | | 8,835,389 | |
4.50% 2/1/26 | | | 2,250,000 | | | | 2,405,317 | |
Kimco Realty 3.40% 11/1/22 | | | 875,000 | | | | 922,208 | |
Sovran Acquisition 3.50% 7/1/26 | | | 2,745,000 | | | | 2,784,317 | |
Trust F/1401 144A 5.25% 1/30/26 # | | | 2,030,000 | | | | 2,144,188 | |
WP Carey 4.60% 4/1/24 | | | 3,120,000 | | | | 3,250,129 | |
| | | | | | | | |
| | | | | | | 40,338,718 | |
| | | | | | | | |
Technology – 4.88% | | | | | | | | |
Apple | | | | | | | | |
2.45% 8/4/26 | | | 2,250,000 | | | | 2,257,029 | |
3.85% 8/4/46 | | | 4,250,000 | | | | 4,276,924 | |
Diamond 1 Finance | | | | | | | | |
144A 6.02% 6/15/26 # | | | 3,715,000 | | | | 3,987,250 | |
25
Schedules of investments
Delaware Corporate Bond Fund
| | | | | | | | |
| | | Principal amount° | | | Value (U.S. $) | |
| |
Corporate Bonds (continued) | | | | | | | | |
| |
Technology (continued) | | | | | | | | |
Diamond 1 Finance | | | | | | | | |
144A 8.10% 7/15/36 # | | | 4,360,000 | | | $ | 4,980,864 | |
Fidelity National Information Services 5.00% 10/15/25 | | | 7,410,000 | | | | 8,591,050 | |
First Data 144A 7.00% 12/1/23 # | | | 3,160,000 | | | | 3,262,700 | |
Iron Mountain 144A 4.375% 6/1/21 # | | | 2,605,000 | | | | 2,702,687 | |
National Semiconductor 6.60% 6/15/17 | | | 6,644,000 | | | | 6,971,576 | |
NXP | | | | | | | | |
144A 4.125% 6/1/21 # | | | 1,000,000 | | | | 1,032,499 | |
144A 4.625% 6/1/23 # | | | 2,765,000 | | | | 2,870,428 | |
Oracle | | | | | | | | |
2.40% 9/15/23 | | | 8,520,000 | | | | 8,612,698 | |
4.00% 7/15/46 | | | 5,735,000 | | | | 5,955,459 | |
| | | | | | | | |
| | | | | | | 55,501,164 | |
| | | | | | | | |
Transportation – 3.54% | | | | | | | | |
Air Canada 2015-1 Class A Pass Through Trust 144A | | | | | | | | |
3.60% 3/15/27 #¿ | | | 2,544,592 | | | | 2,633,652 | |
American Airlines 2014-1 Class A Pass Through Trust | | | | | | | | |
3.70% 10/1/26 ¿ | | | 1,849,618 | | | | 1,946,723 | |
American Airlines 2015-1 Class A Pass Through Trust | | | | | | | | |
3.375% 5/1/27 ¿ | | | 3,116,467 | | | | 3,229,439 | |
American Airlines 2015-2 Class AA Pass Through Trust | | | | | | | | |
3.60% 9/22/27 ¿ | | | 1,415,000 | | | | 1,523,035 | |
American Airlines 2016-1 Class AA Pass Through Trust | | | | | | | | |
3.575% 1/15/28 ¿ | | | 643,420 | | | | 692,480 | |
Canadian National Railway 3.20% 8/2/46 | | | 2,335,000 | | | | 2,333,566 | |
ERAC USA Finance 144A 3.30% 12/1/26 # | | | 6,515,000 | | | | 6,737,507 | |
Hertz 6.75% 4/15/19 | | | 1,630,000 | | | | 1,662,600 | |
Penske Truck Leasing | | | | | | | | |
144A 3.30% 4/1/21 # | | | 4,400,000 | | | | 4,552,759 | |
144A 3.375% 2/1/22 # | | | 3,135,000 | | | | 3,202,587 | |
TTX 144A 4.20% 7/1/46 # | | | 5,365,000 | | | | 5,858,092 | |
United Airlines 2014-1 Class A Pass Through Trust | | | | | | | | |
4.00% 4/11/26 ¿ | | | 1,470,657 | | | | 1,583,714 | |
United Airlines 2014-2 Class A Pass Through Trust | | | | | | | | |
3.75% 9/3/26 ¿ | | | 3,771,959 | | | | 4,021,851 | |
United Airlines 2016-1 Class AA Pass Through Trust | | | | | | | | |
3.10% 7/7/28 ¿ | | | 275,000 | | | | 286,344 | |
| | | | | | | | |
| | | | | | | 40,264,349 | |
| | | | | | | | |
Total Corporate Bonds (cost $1,026,236,770) | | | | | | | 1,068,791,262 | |
| | | | | | | | |
26
| | | | | | | | |
| | | Principal amount° | | | Value (U.S. $) | |
Municipal Bond – 0.74% | | | | | | | | |
Los Angeles, California Department of Water & Power Revenue (Taxable Build America Bond) | | | | | | | | |
Series D 6.574% 7/1/45 | | | 5,365,000 | | | $ | 8,463,770 | |
| | | | | | | | |
Total Municipal Bond (cost $5,365,000) | | | | | | | 8,463,770 | |
| | | | | | | | |
| | |
| | | | | | | | | |
Senior Secured Loans – 1.21%« | | | | | | | | |
Gardner Denver 1st Lien 4.25% 7/30/20 | | | 2,093,625 | | | | 1,996,142 | |
KIK Custom Products 1st Lien 6.00% 8/26/22 @ | | | 2,976,256 | | | | 2,967,575 | |
Mohegan Tribal Gaming Authority Tranche B 1st Lien | | | | | | | | |
5.50% 6/15/18 | | | 2,959,382 | | | | 2,959,843 | |
Rite Aid 2nd Lien 5.75% 8/21/20 | | | 2,849,000 | | | | 2,863,838 | |
Solera Tranche B 1st Lien 5.75% 3/3/23 | | | 2,952,600 | | | | 2,980,543 | |
| | | | | | | | |
Total Senior Secured Loans (cost $13,617,260) | | | | | | | 13,767,941 | |
| | | | | | | | |
| | |
| | | | | | | | | |
Sovereign Bond – 0.14%D | | | | | | | | |
Qatar – 0.14% | | | | | | | | |
Qatar Government International Bond 144A | | | | | | | | |
3.25% 6/2/26 # | | | 1,585,000 | | | | 1,628,730 | |
| | | | | | | | |
Total Sovereign Bond (cost $1,568,564) | | | | | | | 1,628,730 | |
| | | | | | | | |
| | |
| | | | | | | | | |
U.S. Treasury Obligation – 0.21% | | | | | | | | |
U.S. Treasury Note | | | | | | | | |
1.625% 5/15/26 | | | 2,400,000 | | | | 2,436,000 | |
| | | | | | | | |
Total U.S. Treasury Obligation (cost $2,424,656) | | | | | | | 2,436,000 | |
| | | | | | | | |
| | |
| | | Number of shares | | | | |
Preferred Stock – 2.20% | | | | | | | | |
Bank of America 6.50% ● | | | 2,610,000 | | | | 2,853,057 | |
DTE Energy 5.25% | | | 105,000 | | | | 2,709,000 | |
General Electric 5.00% ● | | | 9,227,000 | | | | 9,953,626 | |
GMAC Capital Trust I 6.411% ● | | | 50,000 | | | | 1,271,000 | |
PNC Preferred Funding Trust II 144A 1.875% #● | | | 8,600,000 | | | | 7,881,040 | |
USB Realty 144A 1.827% #@● | | | 400,000 | | | | 343,000 | |
| | | | | | | | |
Total Preferred Stock (cost $24,075,482) | | | | | | | 25,010,723 | |
| | | | | | | | |
27
Schedules of investments
Delaware Corporate Bond Fund
| | | | | | | | |
| | | Principal amount° | | | Value (U.S. $) | |
Short-Term Investments – 0.86% | | | | | | | | |
Repurchase Agreements – 0.86% | | | | | | | | |
Bank of America Merrill Lynch
0.29%, dated 7/29/16, to be repurchased on 8/1/16, repurchase price $2,771,378 (collateralized by U.S. government obligations 3.375% 5/15/44; market value $2,826,738) | | | 2,771,311 | | | $ | 2,771,311 | |
Bank of Montreal
0.26%, dated 7/29/16, to be repurchased on 8/1/16, repurchase price $4,618,951 (collateralized by U.S. government obligations 0.125%–3.125% 2/15/19–11/15/45; market value $4,711,229) | | | 4,618,851 | | | | 4,618,851 | |
BNP Paribas
0.33%, dated 7/29/16, to be repurchased on 8/1/16, repurchase price $2,378,903 (collateralized by U.S. government obligations 0.00%–4.250% 8/31/19–11/15/40; market value $2,426,415) | | | 2,378,838 | | | | 2,378,838 | |
| | | | | | | | |
| | | | | | | 9,769,000 | |
| | | | | | | | |
Total Short-Term Investments (cost $9,769,000) | | | | | | | 9,769,000 | |
| | | | | | | | |
| | |
Total Value of Securities – 99.98%
(cost $1,091,175,076) | | | | | | $ | 1,138,122,550 | |
| | | | | | | | |
| # | Security exempt from registration under Rule 144A of the Securities Act of 1933, as amended. At July 31, 2016, the aggregate value of Rule 144A securities was $298,403,386, which represents 26.21% of the Fund’s net assets. See Note 11 in “Notes to financial statements.” |
| @ | Illiquid security. At July 31, 2016, the aggregate value of illiquid securities was $18,287,353, which represents 1.61% of the Fund’s net assets. See Note 11 in “Notes to financial statements.” |
| ¿ | Pass Through Agreement. Security represents the contractual right to receive a proportionate amount of underlying payments due to the counterparty pursuant to various agreements related to the rescheduling of obligations and the exchange of certain notes. |
| ° | Principal amount shown is stated in U.S. dollars unless noted that the security is denominated in another currency. |
| ● | Variable rate security. The rate shown is the rate as of July 31, 2016. Interest rates reset periodically. |
| D | Securities have been classified by country of origin. |
| « | Senior secured loans generally pay interest at rates which are periodically redetermined by reference to a base lending rate plus a premium. These base lending rates are generally: (i) the prime rate offered by one or more U.S. banks, (ii) the lending rate offered by one or more European banks such as the London Interbank Offered Rate (LIBOR), and (iii) the certificate of deposit rate. Senior secured loans may be subject to restrictions on resale. Stated rate in effect at July 31, 2016. |
| f | Step coupon bond. Coupon increases or decreases periodically based on a predetermined schedule. Stated rate in effect at July 31, 2016. |
28
The following swap contract were outstanding at July 31, 2016:1
Swap Contract
CDS Contract2
| | | | | | | | | | | | | | | | | | | | | | |
Counterparty | | Swap
Referenced
Obligation | | Notional Value | | | Annual
Protection
Payments | | | Termination
Date | | | Upfront
Payment
Paid | | | Unrealized
Appreciation
(Depreciation)3 | |
| | Protection | | | | | | | | | | | | | | | | | | | | |
| | Purchased: | | | | | | | | | | | | | | | | | | | | |
| | Halliburton 5 yr | | | | | | | | | | | | | | | | | | | | |
MSC | | 8.75% 2/15/21 | | $ | 5,900,000 | | | | 1.00% | | | | 12/20/20 | | | $ | 119,905 | | | $ | (109,880 | ) |
The use of swap contracts involves elements of market risk and risks in excess of the amounts disclosed in the financial statements. The notional values presented above represents the Fund’s total exposure in such contracts, whereas only the net unrealized appreciation (depreciation) is reflected in the Fund’s net assets.
1See Note 8 in “Notes to financial statements.”
2 A CDS contract is a risk-transfer instrument through which one party (purchaser of protection) transfers to another party (seller of protection) the financial risk of a credit event (as defined in the CDS agreement), as it relates to a particular reference security or basket of securities (such as an index). Periodic payments (receipts) on such contracts are accrued daily and recorded as unrealized losses (gains) on swap contracts. Upon payment (receipt), such amounts are recorded as realized losses (gains) on swap contracts. Upfront payments made or received in connection with CDS contracts are amortized over the expected life of the CDS contracts as unrealized losses (gains) on swap contracts. The change in value of CDS contracts is recorded daily as unrealized appreciation or depreciation. A realized gain or loss is recorded upon a credit event (as defined in the CDS agreement) or the maturity or termination of the agreement.
3 Unrealized appreciation (depreciation) does not include periodic interest payments on swap contracts accrued daily in the amount of $(6,883).
Summary of abbreviations:
CDS – Credit Default Swap
MSC – Morgan Stanley Capital
yr – Year
See accompanying notes, which are an integral part of the financial statements.
29
| | | | |
| Schedules of investments | | | | |
| Delaware Extended Duration Bond Fund | | | July 31, 2016 | |
| | | | | | | | |
| | | Principal amount° | | | Value (U.S. $) | |
Corporate Bonds – 91.52% | | | | | | | | |
Banking – 14.61% | | | | | | | | |
Ally Financial 8.00% 11/1/31 | | | 595,000 | | | $ | 727,387 | |
Bank of America | | | | | | | | |
4.45% 3/3/26 | | | 4,690,000 | | | | 5,046,735 | |
5.00% 1/21/44 | | | 5,740,000 | | | | 6,838,699 | |
Bank of New York Mellon | | | | | | | | |
2.80% 5/4/26 | | | 1,405,000 | | | | 1,464,662 | |
4.625% 12/29/49 ● | | | 2,055,000 | | | | 2,055,000 | |
Citigroup 4.65% 7/30/45 | | | 2,950,000 | | | | 3,343,725 | |
Citizens Financial Group 4.30% 12/3/25 | | | 4,700,000 | | | | 4,998,398 | |
Credit Suisse Group 144A 6.25% 12/29/49 #● | | | 2,272,000 | | | | 2,204,167 | |
Credit Suisse Group Funding Guernsey 4.875% 5/15/45 | | | 6,825,000 | | | | 7,325,273 | |
Fifth Third Bank 3.85% 3/15/26 | | | 5,000,000 | | | | 5,343,810 | |
First Republic Bank 4.375% 8/1/46 | | | 3,195,000 | | | | 3,233,068 | |
Goldman Sachs Group 4.75% 10/21/45 | | | 5,240,000 | | | | 5,991,510 | |
JPMorgan Chase | | | | | | | | |
4.25% 10/1/27 | | | 5,255,000 | | | | 5,675,946 | |
4.85% 2/1/44 | | | 4,835,000 | | | | 5,907,011 | |
KeyBank 6.95% 2/1/28 | | | 2,467,000 | | | | 3,257,047 | |
Morgan Stanley | | | | | | | | |
3.125% 7/27/26 | | | 640,000 | | | | 645,934 | |
3.95% 4/23/27 | | | 5,180,000 | | | | 5,362,554 | |
4.30% 1/27/45 | | | 3,730,000 | | | | 4,051,433 | |
SVB Financial Group 3.50% 1/29/25 | | | 2,440,000 | | | | 2,440,495 | |
UBS 7.625% 8/17/22 | | | 4,020,000 | | | | 4,683,300 | |
US Bancorp | | | | | | | | |
2.375% 7/22/26 | | | 2,285,000 | | | | 2,291,375 | |
3.10% 4/27/26 | | | 2,830,000 | | | | 2,955,587 | |
5.125% 12/29/49 ● | | | 2,805,000 | | | | 2,952,291 | |
USB Capital IX 3.50% 10/29/49 @● | | | 810,000 | | | | 697,613 | |
Wells Fargo 4.40% 6/14/46 | | | 9,465,000 | | | | 10,060,339 | |
| | | | | | | | |
| | | | | | | 99,553,359 | |
| | | | | | | | |
Basic Industry – 4.99% | | | | | | | | |
CF Industries 5.375% 3/15/44 | | | 2,119,000 | | | | 2,098,927 | |
Eastman Chemical 4.65% 10/15/44 | | | 5,750,000 | | | | 6,060,414 | |
Georgia-Pacific 8.00% 1/15/24 | | | 3,280,000 | | | | 4,410,403 | |
International Paper 5.15% 5/15/46 | | | 6,889,000 | | | | 7,992,432 | |
LYB International Finance 4.875% 3/15/44 | | | 2,525,000 | | | | 2,785,416 | |
Methanex 5.65% 12/1/44 | | | 6,715,000 | | | | 5,946,670 | |
Mexichem 144A 5.875% 9/17/44 # | | | 1,775,000 | | | | 1,758,936 | |
Rio Tinto Finance USA 3.75% 6/15/25 | | | 2,755,000 | | | | 2,964,892 | |
| | | | | | | | |
| | | | | | | 34,018,090 | |
| | | | | | | | |
30
| | | | | | | | |
| | | Principal amount° | | | Value (U.S. $) | |
Corporate Bonds (continued) | | | | | | | | |
Brokerage – 1.79% | | | | | | | | |
Jefferies Group | | | | | | | | |
6.45% 6/8/27 | | | 2,640,000 | | | $ | 2,955,129 | |
6.50% 1/20/43 | | | 1,985,000 | | | | 2,063,102 | |
Legg Mason 5.625% 1/15/44 | | | 5,000,000 | | | | 5,342,220 | |
Neuberger Berman Group 144A 4.875% 4/15/45 # | | | 2,140,000 | | | | 1,877,388 | |
| | | | | | | | |
| | | | | | | 12,237,839 | |
| | | | | | | | |
Capital Goods – 2.79% | | | | | | | | |
Fortive 144A 4.30% 6/15/46 # | | | 5,930,000 | | | | 6,678,983 | |
Valmont Industries 5.00% 10/1/44 | | | 6,255,000 | | | | 6,207,712 | |
WW Grainger 3.75% 5/15/46 | | | 5,725,000 | | | | 6,111,226 | |
| | | | | | | | |
| | | | | | | 18,997,921 | |
| | | | | | | | |
Communications – 11.78% | | | | | | | | |
21st Century Fox America 4.95% 10/15/45 | | | 5,345,000 | | | | 6,365,526 | |
American Tower 4.40% 2/15/26 | | | 5,735,000 | | | | 6,364,428 | |
AT&T | | | | | | | | |
4.35% 6/15/45 | | | 3,545,000 | | | | 3,564,161 | |
5.65% 2/15/47 | | | 5,540,000 | | | | 6,628,411 | |
Charter Communications Operating 144A | | | | | | | | |
4.908% 7/23/25 # | | | 5,105,000 | | | | 5,646,824 | |
Comcast 3.40% 7/15/46 | | | 6,940,000 | | | | 6,849,516 | |
Crown Castle International 5.25% 1/15/23 | | | 6,319,000 | | | | 7,256,803 | |
Deutsche Telekom International Finance 8.75% 6/15/30 | | | 1,335,000 | | | | 2,097,728 | |
Grupo Televisa 5.00% 5/13/45 | | | 3,785,000 | | | | 3,853,781 | |
Time Warner 4.85% 7/15/45 | | | 6,310,000 | | | | 7,325,632 | |
Time Warner Cable 7.30% 7/1/38 | | | 6,405,000 | | | | 8,385,548 | |
Verizon Communications | | | | | | | | |
4.125% 8/15/46 | | | 1,905,000 | | | | 1,932,554 | |
4.522% 9/15/48 | | | 7,905,000 | | | | 8,472,816 | |
4.862% 8/21/46 | | | 1,033,000 | | | | 1,164,277 | |
WPP Finance 2010 5.625% 11/15/43 | | | 3,605,000 | | | | 4,354,415 | |
| | | | | | | | |
| | | | | | | 80,262,420 | |
| | | | | | | | |
Consumer Cyclical – 6.66% | | | | | | | | |
General Motors 6.75% 4/1/46 | | | 4,775,000 | | | | 6,226,743 | |
Home Depot 4.25% 4/1/46 | | | 8,040,000 | | | | 9,495,988 | |
Lowe’s 4.375% 9/15/45 | | | 6,995,000 | | | | 8,267,957 | |
Starwood Hotels & Resorts Worldwide 4.50% 10/1/34 @ | | | 4,610,000 | | | | 4,834,087 | |
Target 3.625% 4/15/46 | | | 8,930,000 | | | | 9,341,066 | |
Walgreens Boots Alliance 4.65% 6/1/46 | | | 6,395,000 | | | | 7,220,722 | |
| | | | | | | | |
| | | | | | | 45,386,563 | |
| | | | | | | | |
Consumer Non-Cyclical – 15.32% | | | | | | | | |
AbbVie | | | | | | | | |
3.20% 5/14/26 | | | 1,865,000 | | | | 1,916,759 | |
31
Schedules of investments
Delaware Extended Duration Bond Fund
| | | | | | | | |
| | | Principal amount° | | | Value (U.S. $) | |
Corporate Bonds (continued) | | | | | | | | |
Consumer Non-Cyclical (continued) | | | | | | | | |
AbbVie | | | | | | | | |
4.45% 5/14/46 | | | 3,515,000 | | | $ | 3,754,445 | |
Anheuser-Busch InBev Finance | | | | | | | | |
3.65% 2/1/26 | | | 1,885,000 | | | | 2,027,883 | |
4.90% 2/1/46 | | | 6,910,000 | | | | 8,452,506 | |
AstraZeneca 4.375% 11/16/45 | | | 4,730,000 | | | | 5,318,019 | |
Biogen 5.20% 9/15/45 | | | 5,845,000 | | | | 7,033,148 | |
Celgene | | | | | | | | |
4.625% 5/15/44 | | | 2,000,000 | | | | 2,166,648 | |
5.25% 8/15/43 | | | 4,315,000 | | | | 5,109,331 | |
Hasbro 5.10% 5/15/44 | | | 1,375,000 | | | | 1,518,127 | |
Kellogg 4.50% 4/1/46 | | | 2,865,000 | | | | 3,198,157 | |
Kraft Heinz Foods 144A 4.375% 6/1/46 # | | | 4,900,000 | | | | 5,353,323 | |
Molson Coors Brewing | | | | | | | | |
3.00% 7/15/26 | | | 2,260,000 | | | | 2,312,879 | |
4.20% 7/15/46 | | | 3,230,000 | | | | 3,418,141 | |
Mylan 144A 5.25% 6/15/46 # | | | 8,020,000 | | | | 9,074,133 | |
Pernod Ricard | | | | | | | | |
144A 3.25% 6/8/26 # | | | 2,005,000 | | | | 2,076,607 | |
144A 5.50% 1/15/42 # | | | 2,215,000 | | | | 2,766,918 | |
Reynolds American 5.85% 8/15/45 | | | 5,920,000 | | | | 7,815,921 | |
SC Johnson & Son 144A 4.35% 9/30/44 # | | | 3,050,000 | | | | 3,491,722 | |
Sysco 4.50% 4/1/46 | | | 6,515,000 | | | | 7,302,051 | |
Teva Pharmaceutical Finance Netherlands III | | | | | | | | |
3.15% 10/1/26 | | | 1,990,000 | | | | 2,038,039 | |
4.10% 10/1/46 | | | 3,935,000 | | | | 4,069,546 | |
Thermo Fisher Scientific 5.30% 2/1/44 | | | 2,365,000 | | | | 2,892,059 | |
Zimmer Biomet Holdings 4.45% 8/15/45 | | | 6,750,000 | | | | 7,245,146 | |
Zoetis 4.70% 2/1/43 | | | 3,800,000 | | | | 4,053,217 | |
| | | | | | | | |
| | | | | | | 104,404,725 | |
| | | | | | | | |
Electric – 16.85% | | | | | | | | |
Alabama Power 4.30% 1/2/46 | | | 2,190,000 | | | | 2,544,657 | |
Ameren 3.65% 2/15/26 | | | 845,000 | | | | 918,974 | |
American Transmission Systems 144A 5.00% 9/1/44 # | | | 5,110,000 | | | | 5,803,023 | |
Appalachian Power 4.40% 5/15/44 | | | 6,950,000 | | | | 7,694,595 | |
Arizona Public Service 4.35% 11/15/45 | | | 3,680,000 | | | | 4,320,077 | |
Berkshire Hathaway Energy 4.50% 2/1/45 | | | 6,950,000 | | | | 8,024,957 | |
ComEd Financing III 6.35% 3/15/33 @ | | | 4,800,000 | | | | 5,096,568 | |
Dominion Resources | | | | | | | | |
3.90% 10/1/25 | | | 1,220,000 | | | | 1,328,965 | |
4.70% 12/1/44 | | | 3,750,000 | | | | 4,261,369 | |
Duke Energy 4.80% 12/15/45 | | | 4,795,000 | | | | 5,787,680 | |
32
| | | | | | | | |
| | | Principal amount° | | | Value (U.S. $) | |
Corporate Bonds (continued) | | | | | | | | |
Electric (continued) | | | | | | | | |
Electricite de France 144A 5.25% 12/29/49 #● | | | 2,885,000 | | | $ | 2,823,694 | |
Emera 6.75% 6/15/76 ● | | | 3,450,000 | | | | 3,736,395 | |
Emera US Finance 144A 4.75% 6/15/46 # | | | 1,070,000 | | | | 1,183,242 | |
Enel Finance International 144A 6.00% 10/7/39 # | | | 4,800,000 | | | | 5,833,978 | |
Entergy Arkansas 4.95% 12/15/44 | | | 2,765,000 | | | | 2,942,358 | |
Entergy Louisiana 4.95% 1/15/45 | | | 125,000 | | | | 134,264 | |
Indianapolis Power & Light 144A 4.05% 5/1/46 # | | | 5,110,000 | | | | 5,506,393 | |
National Rural Utilities Cooperative Finance | | | | | | | | |
5.25% 4/20/46 ● | | | 935,000 | | | | 989,137 | |
Oncor Electric Delivery 3.75% 4/1/45 | | | 5,265,000 | | | | 5,637,114 | |
PPL Electric Utilities 4.15% 10/1/45 | | | 3,765,000 | | | | 4,312,088 | |
Puget Sound Energy 4.434% 11/15/41 | | | 4,870,000 | | | | 5,639,002 | |
South Carolina Electric & Gas | | | | | | | | |
4.50% 6/1/64 | | | 5,600,000 | | | | 6,117,530 | |
5.10% 6/1/65 | | | 2,635,000 | | | | 3,166,843 | |
Southern 4.40% 7/1/46 | | | 4,300,000 | | | | 4,784,249 | |
Tampa Electric 4.20% 5/15/45 | | | 2,175,000 | | | | 2,423,022 | |
Tri-State Generation & Transmission Association | | | | | | | | |
4.25% 6/1/46 | | | 4,350,000 | | | | 4,563,955 | |
Union Electric 3.65% 4/15/45 | | | 3,855,000 | | | | 4,095,012 | |
Westar Energy 4.25% 12/1/45 | | | 4,485,000 | | | | 5,201,954 | |
| | | | | | | | |
| | | | | | | 114,871,095 | |
| | | | | | | | |
Energy – 5.09% | | | | | | | | |
ConocoPhillips | | | | | | | | |
4.95% 3/15/26 | | | 1,700,000 | | | | 1,894,167 | |
5.95% 3/15/46 | | | 1,565,000 | | | | 1,894,523 | |
Dominion Gas Holdings 4.60% 12/15/44 | | | 1,595,000 | | | | 1,736,687 | |
Energy Transfer Partners 6.125% 12/15/45 | | | 6,600,000 | | | | 6,937,590 | |
Eni 144A 5.70% 10/1/40 # | | | 3,450,000 | | | | 3,773,914 | |
Enterprise Products Operating 5.10% 2/15/45 | | | 4,485,000 | | | | 4,882,640 | |
Noble Energy | | | | | | | | |
5.05% 11/15/44 | | | 3,170,000 | | | | 3,155,912 | |
5.25% 11/15/43 | | | 1,465,000 | | | | 1,486,786 | |
Petroleos Mexicanos 6.625% 6/15/35 | | | 1,595,000 | | | | 1,657,125 | |
Shell International Finance 4.00% 5/10/46 | | | 6,030,000 | | | | 6,218,902 | |
Sunoco Logistics Partners Operations 3.90% 7/15/26 | | | 1,090,000 | | | | 1,085,541 | |
| | | | | | | | |
| | | | | | | 34,723,787 | |
| | | | | | | | |
Finance Companies – 0.45% | | | | | | | | |
Depository Trust & Clearing 144A 4.875% 12/29/49 #● | | | 3,000,000 | | | | 3,045,000 | |
| | | | | | | | |
| | | | | | | 3,045,000 | |
| | | | | | | | |
Insurance – 4.76% | | | | | | | | |
Alleghany 4.90% 9/15/44 | | | 3,525,000 | | | | 3,770,893 | |
33
Schedules of investments
Delaware Extended Duration Bond Fund
| | | | | | | | |
| | | Principal amount° | | | Value (U.S. $) | |
Corporate Bonds (continued) | | | | | | | | |
Insurance (continued) | | | | | | | | |
Berkshire Hathaway Finance 4.30% 5/15/43 | | | 1,800,000 | | | $ | 2,073,802 | |
Highmark 144A 6.125% 5/15/41 #@ | | | 3,410,000 | | | | 3,429,178 | |
MetLife 4.60% 5/13/46 | | | 4,905,000 | | | | 5,423,218 | |
Nationwide Mutual Insurance 144A 4.95% 4/22/44 # | | | 3,200,000 | | | | 3,406,550 | |
TIAA Asset Management Finance 144A 4.125% 11/1/24 # | | | 2,400,000 | | | | 2,540,460 | |
Transatlantic Holdings 8.00% 11/30/39 | | | 704,000 | | | | 991,932 | |
Trinity Acquisition 6.125% 8/15/43 | | | 4,570,000 | | | | 5,179,186 | |
XLIT | | | | | | | | |
5.50% 3/31/45 | | | 4,590,000 | | | | 4,614,795 | |
6.50% 10/29/49 ● | | | 1,480,000 | | | | 1,024,900 | |
| | | | | | | | |
| | | | | | | 32,454,914 | |
| | | | | | | | |
Natural Gas – 0.94% | | | | | | | | |
Piedmont Natural Gas 3.64% 11/1/46 | | | 6,300,000 | | | | 6,399,244 | |
| | | | | | | | |
| | | | | | | 6,399,244 | |
| | | | | | | | |
Real Estate Investment Trusts – 0.27% | | | | | | | | |
Alexandria Real Estate Equities 3.95% 1/15/27 | | | 720,000 | | | | 754,156 | |
DDR 4.25% 2/1/26 | | | 1,045,000 | | | | 1,111,709 | |
| | | | | | | | |
| | | | | | | 1,865,865 | |
| | | | | | | | |
Technology – 3.51% | | | | | | | | |
Apple | | | | | | | | |
2.45% 8/4/26 | | | 1,420,000 | | | | 1,424,436 | |
3.85% 8/4/46 | | | 2,685,000 | | | | 2,702,010 | |
4.65% 2/23/46 | | | 3,890,000 | | | | 4,450,386 | |
Diamond 1 Finance 144A 8.10% 7/15/36 # | | | 5,100,000 | | | | 5,826,240 | |
Oracle 4.00% 7/15/46 | | | 9,150,000 | | | | 9,501,735 | |
| | | | | | | | |
| | | | | | | 23,904,807 | |
| | | | | | | | |
Transportation – 1.71% | | | | | | | | |
Burlington Northern Santa Fe 4.70% 9/1/45 | | | 5,650,000 | | | | 6,912,476 | |
Canadian National Railway 3.20% 8/2/46 | | | 1,405,000 | | | | 1,404,137 | |
TTX 144A 4.20% 7/1/46 # | | | 3,070,000 | | | | 3,352,161 | |
| | | | | | | 11,668,774 | |
| | | | | | | | |
Total Corporate Bonds (cost $580,789,791) | | | | | | | 623,794,403 | |
| | | | | | | | |
| | |
| | | | | | | | | |
Municipal Bonds – 4.06% | | | | | | | | |
California State | | | | | | | | |
(Taxable Build America Bond) 5.00% 9/1/26 | | | 1,555,000 | | | | 2,051,387 | |
Chicago, Illinois O’Hare International Airport Revenue | | | | | | | | |
(Taxable Build America Bond) Series B 6.395% 1/1/40 | | | 3,800,000 | | | | 5,562,250 | |
Commonwealth of Massachusetts | | | | | | | | |
Series B 5.00% 7/1/26 | | | 565,000 | | | | 743,331 | |
Series D 5.00% 4/1/26 | | | 475,000 | | | | 622,288 | |
34
| | | | | | | | |
| | | Principal amount° | | | Value (U.S. $) | |
Municipal Bonds (continued) | | | | | | | | |
Dallas, Texas Area Rapid Transit | | | | | | | | |
Series A 5.00% 12/1/46 | | | 1,585,000 | | | $ | 1,927,899 | |
Long Island Power Authority, New York Electric System Revenue
(Taxable Build America Bond) | | | | | | | | |
Series B 5.85% 5/1/41 | | | 3,600,000 | | | | 4,563,180 | |
Los Angeles, California Department of Water & Power Revenue
(Taxable Build America Bond) | | | | | | | | |
Series D 6.574% 7/1/45 | | | 2,225,000 | | | | 3,510,138 | |
Metropolitan Transportation Authority, New York Revenue
(Taxable Build America Bond) | | | | | | | | |
Series A2 6.089% 11/15/40 | | | 3,205,000 | | | | 4,530,043 | |
New Jersey Turnpike Authority | | | | | | | | |
Series E 5.00% 1/1/45 | | | 1,395,000 | | | | 1,659,520 | |
Oregon Department of Transportation Highway User Tax Revenue
(Taxable Build America Bond-Subordinate Lien) | | | | | | | | |
Series A 5.834% 11/15/34 | | | 1,605,000 | | | | 2,250,643 | |
Texas Water Development Board | | | | | | | | |
Series A 5.00% 10/15/45 | | | 200,000 | | | | 244,402 | |
| | | | | | | | |
Total Municipal Bonds (cost $21,568,936) | | | | | | | 27,665,081 | |
| | | | | | | | |
| | |
| | | | | | | | | |
U.S. Treasury Obligations – 0.73% | | | | | | | | |
U.S. Treasury Bond | | | | | | | | |
2.50% 5/15/46 | | | 2,115,000 | | | | 2,260,738 | |
U.S. Treasury Notes | | | | | | | | |
0.475% 4/30/18 ● | | | 1,270,000 | | | | 1,271,734 | |
1.625% 5/15/26 | | | 1,390,000 | | | | 1,410,850 | |
| | | | | | | | |
Total U.S. Treasury Obligations (cost $4,915,436) | | | | | | | 4,943,322 | |
| | | | | | | | |
| | |
| | | Number of shares | | | | |
Preferred Stock – 1.90% | | | | | | | | |
DTE Energy 5.25% | | | 60,000 | | | | 1,548,000 | |
General Electric 5.00% ● | | | 4,814,000 | | | | 5,193,103 | |
Morgan Stanley 5.55% ● | | | 2,280,000 | | | | 2,311,350 | |
PNC Preferred Funding Trust II 144A 1.875% #● | | | 3,900,000 | | | | 3,573,960 | |
USB Realty 144A 1.827% #@● | | | 400,000 | | | | 343,000 | |
| | | | | | | | |
Total Preferred Stock (cost $11,974,265) | | | | | | | 12,969,413 | |
| | | | | | | | |
| | |
| | | Principal amount° | | | | |
Short-Term Investments – 1.68% | | | | | | | | |
Discount Notes – 1.68%≠ | | | | | | | | |
Federal Home Loan Bank | | | | | | | | |
0.162% 8/3/16 | | | 1,831,693 | | | | 1,831,675 | |
35
Schedules of investments
Delaware Extended Duration Bond Fund
| | | | | | | | |
| | | Principal amount° | | | Value (U.S. $) | |
Short-Term Investments (continued) | | | | | | | | |
Discount Notes≠ (continued) | | | | | | | | |
Federal Home Loan Bank | | | | | | | | |
0.241% 8/10/16 | | | 2,627,597 | | | $ | 2,627,481 | |
0.271% 8/29/16 | | | 1,160,147 | | | | 1,159,986 | |
0.282% 8/26/16 | | | 2,481,286 | | | | 2,480,981 | |
0.318% 9/7/16 | | | 854,595 | | | | 854,382 | |
0.322% 9/19/16 | | | 773,721 | | | | 773,467 | |
0.375% 9/21/16 | | | 127,787 | | | | 127,735 | |
0.376% 9/23/16 | | | 155,876 | | | | 155,821 | |
0.464% 8/15/16 | | | 1,436,759 | | | | 1,436,660 | |
| | | | | | | | |
Total Short-Term Investments (cost $11,447,343) | | | | | | $ | 11,448,188 | |
| | | | | | | | |
| | |
Total Value of Securities – 99.89%
(cost $630,695,771) | | | | | | $ | 680,820,407 | |
| | | | | | | | |
| # | Security exempt from registration under Rule 144A of the Securities Act of 1933, as amended. At July 31, 2016, the aggregate value of Rule 144A securities was $91,369,794, which represents 13.41% of the Fund’s net assets. See Note 11 in “Notes to financial statements.” |
| @ | Illiquid security. At July 31, 2016, the aggregate value of illiquid securities was $14,400,446, which represents 2.11% of the Fund’s net assets. See Note 11 in “Notes to financial statements.” |
| ≠ | The rate shown is the effective yield at the time of purchase. |
| ° | Principal amount shown is stated in U.S. dollars unless noted that the security is denominated in another currency. |
| ● | Variable rate security. The rate shown is the rate as of July 31, 2016. Interest rates reset periodically. |
The following futures contracts were outstanding at July 31, 2016:1
Futures Contracts
| | | | | | | | | | | | | | |
Contracts to Buy (Sell) | | Notional
Cost
(Proceeds) | | | Notional
Value | | | Expiration
Date | | Unrealized
Appreciation
(Depreciation) | |
(120) U.S. Treasury 10 yr Notes | | $ | (15,841,535 | ) | | $ | (15,965,625 | ) | | 9/22/16 | | $ | (124,090 | ) |
| | | | | | | | | | | | | | |
The use of futures contracts involves elements of market risk and risks in excess of the amounts disclosed in the financial statements. The notional value presented above represents the Fund’s total exposure in such contracts, whereas only the net unrealized appreciation (depreciation) is reflected in the Fund’s net assets.
1 See Note 8 in “Notes to financial statements.”
yr – Year
See accompanying notes, which are an integral part of the financial statements.
36
Statements of assets and liabilities
July 31, 2016
| | | | | | | | |
| | | Delaware
Corporate
Bond Fund | | | Delaware
Extended Duration
Bond Fund | |
Assets: | | | | | | | | |
Investments, at value1 | | $ | 1,128,353,550 | | | $ | 669,372,219 | |
Short-term investments, at value2 | | | 9,769,000 | | | | 11,448,188 | |
Cash | | | 328,011 | | | | — | |
Cash collateral due from broker for futures contracts | | | — | | | | 163,000 | |
Receivable for securities sold | | | 26,239,356 | | | | 12,269,758 | |
Dividends and interest receivable | | | 11,331,028 | | | | 7,004,765 | |
Receivable for fund shares sold | | | 1,438,699 | | | | 1,369,369 | |
Upfront payments paid on credit default swap contracts | | | 119,905 | | | | — | |
Other assets3 | | | 438,287 | | | | 166,247 | |
| | | | | | | | |
Total assets | | | 1,178,017,836 | | | | 701,793,546 | |
| | | | | | | | |
Liabilities: | | | | | | | | |
Cash overdraft | | | — | | | | 341,877 | |
Payable for securities purchased | | | 34,375,194 | | | | 17,339,283 | |
Payable for fund shares redeemed | | | 1,736,804 | | | | 792,033 | |
Income distribution payable | | | 904,027 | | | | 552,424 | |
Swap payments payable | | | 6,883 | | | | — | |
Accounting and administration expenses payable to affiliates | | | 4,520 | | | | 2,681 | |
Legal fees payable to affiliates | | | 1,662 | | | | 963 | |
Variation margin due to broker on futures contracts | | | — | | | | 58,126 | |
Investment management fees payable to affiliates | | | 461,788 | | | | 289,214 | |
Other accrued expenses | | | 362,867 | | | | 192,234 | |
Distribution fees payable to affiliates | | | 232,782 | | | | 89,382 | |
Audit and tax fee payable | | | 5,558 | | | | 5,558 | |
Trustees’ fees and expenses payable | | | 2,733 | | | | 1,587 | |
Unrealized depreciation on credit default swap contracts | | | 109,880 | | | | — | |
Bond proceeds payable3 | | | 1,460,956 | | | | 554,156 | |
Reports and statements to shareholders payable to affiliates | | | 476 | | | | 285 | |
Dividend disbursing and transfer agent fees and expenses payable to affiliates | | | 19,542 | | | | 11,588 | |
| | | | | | | | |
Total liabilities | | | 39,685,672 | | | | 20,231,391 | |
| | | | | | | | |
Total Net Assets | | $ | 1,138,332,164 | | | $ | 681,562,155 | |
| | | | | | | | |
37
Statements of assets and liabilities
| | | | | | | | |
| | | Delaware
Corporate
Bond Fund | | | Delaware
Extended Duration
Bond Fund | |
Net Assets Consist of: | | | | | | | | |
Paid-in capital | | $ | 1,140,940,980 | | | $ | 640,359,872 | |
Undistributed (distributions in excess of) net investment income | | | 20,790 | | | | (596,526 | ) |
Accumulated net realized loss | | | (49,460,317 | ) | | | (8,201,737 | ) |
Net unrealized appreciation of investments | | | 46,947,474 | | | | 50,124,636 | |
Net unrealized depreciation of futures contracts | | | — | | | | (124,090 | ) |
Net unrealized depreciation of swap contracts | | | (116,763 | ) | | | — | |
| | | | | | | | |
Total Net Assets | | $ | 1,138,332,164 | | | $ | 681,562,155 | |
| | | | | | | | |
38
| | | | | | | | |
| | | Delaware
Corporate
Bond Fund | | | Delaware
Extended Duration
Bond Fund | |
Net Asset Value | | | | | | | | |
Class A: | | | | | | | | |
Net assets | | $ | 352,477,414 | | | $ | 241,189,890 | |
Shares of beneficial interest outstanding, unlimited authorization, no par | | | 59,383,294 | | | | 35,540,921 | |
Net asset value per share | | $ | 5.94 | | | $ | 6.79 | |
Sales charge | | | 4.50 | % | | | 4.50 | % |
Offering price per share, equal to net asset value per share/(1 – sales charge) | | $ | 6.22 | | | $ | 7.11 | |
| | |
Class C: | | | | | | | | |
Net assets | | $ | 173,056,517 | | | $ | 33,776,977 | |
Shares of beneficial interest outstanding, unlimited authorization, no par | | | 29,152,672 | | | | 4,979,420 | |
Net asset value per share | | $ | 5.94 | | | $ | 6.78 | |
| | |
Class R: | | | | | | | | |
Net assets | | $ | 29,148,875 | | | $ | 25,965,239 | |
Shares of beneficial interest outstanding, unlimited authorization, no par | | | 4,906,703 | | | | 3,820,868 | |
Net asset value per share | | $ | 5.94 | | | $ | 6.80 | |
| | |
Institutional Class: | | | | | | | | |
Net assets | | $ | 583,649,358 | | | $ | 372,051,959 | |
Shares of beneficial interest outstanding, unlimited authorization, no par | | | 98,335,117 | | | | 54,914,812 | |
Net asset value per share | | $ | 5.94 | | | $ | 6.78 | |
| | |
Class R6: | | | | | | | | |
Net assets | | $ | — | | | $ | 8,578,090 | |
Shares of beneficial interest outstanding, unlimited authorization, no par | | | — | | | | 1,265,162 | |
Net asset value per share | | $ | — | | | $ | 6.78 | |
| | | | | | | | |
1 Investments, at cost | | $ | 1,081,406,076 | | | $ | 619,248,428 | |
2 Short-term investments, at cost | | | 9,769,000 | | | | 11,447,343 | |
3 See Note 13 in “Notes to financial statements.” | | | | | | | | |
See accompanying notes, which are an integral part of the financial statements.
39
Statements of operations
Year ended July 31, 2016
| | | | | | | | |
| | | Delaware
Corporate
Bond Fund | | | Delaware
Extended Duration
Bond Fund | |
Investment Income: | | | | | | | | |
Interest | | $ | 51,277,202 | | | $ | 27,554,613 | |
Dividends | | | 1,069,145 | | | | 487,208 | |
| | | | | | | | |
| | | 52,346,347 | | | | 28,041,821 | |
| | | | | | | | |
Expenses: | | | | | | | | |
Management fees | | | 5,949,558 | | | | 3,330,902 | |
Distribution expenses – Class A | | | 968,731 | | | | 557,208 | |
Distribution expenses – Class C | | | 1,779,454 | | | | 315,534 | |
Distribution expenses – Class R | | | 138,596 | | | | 124,472 | |
Dividend disbursing and transfer agent fees and expenses | | | 1,817,283 | | | | 714,882 | |
Accounting and administration expenses | | | 401,905 | | | | 199,820 | |
Reports and statements to shareholders | | | 149,009 | | | | 72,885 | |
Legal fees | | | 121,223 | | | | 60,552 | |
Registration fees | | | 100,458 | | | | 92,529 | |
Custodian fees | | | 77,510 | | | | 45,153 | |
Trustees’ fees and expenses | | | 60,952 | | | | 29,812 | |
Audit and tax fees | | | 52,672 | | | | 52,116 | |
Other | | | 55,505 | | | | 33,988 | |
| | | | | | | | |
| | | 11,672,856 | | | | 5,629,853 | |
Less expenses waived | | | (214,626 | ) | | | (253,141 | ) |
Less expense paid indirectly | | | (1,384 | ) | | | (654 | ) |
| | | | | | | | |
Total operating expenses | | | 11,456,846 | | | | 5,376,058 | |
| | | | | | | | |
Net Investment Income | | | 40,889,501 | | | | 22,665,763 | |
| | | | | | | | |
40
| | | | | | | | |
| | | Delaware
Corporate Bond
Fund | | | Delaware
Extended Duration
Bond Fund | |
Net Realized and Unrealized Gain (Loss): | | | | | | | | |
Net realized gain (loss) on: | | | | | | | | |
Investments | | $ | (31,814,404 | ) | | $ | (7,814,461 | ) |
Foreign currencies | | | — | | | | 7,669 | |
Foreign currency exchange contracts | | | — | | | | 12,537 | |
Futures contracts | | | (1,091,783 | ) | | | 1,961,227 | |
Swap contracts | | | (39,193 | ) | | | 218,389 | |
| | | | | | | | |
Net realized loss | | | (32,945,380 | )�� | | | (5,614,639 | ) |
| | | | | | | | |
Net change in unrealized appreciation (depreciation) of: | | | | | | | | |
Investments | | | 51,949,416 | | | | 55,698,473 | |
Foreign currencies | | | — | | | | (1,243 | ) |
Futures contracts | | | 487,426 | | | | (1,206,304 | ) |
Swap contracts | | | (116,763 | ) | | | 19,573 | |
| | | | | | | | |
Net change in unrealized appreciation (depreciation) | | | 52,320,079 | | | | 54,510,499 | |
| | | | | | | | |
Net Realized and Unrealized Gain | | | 19,374,699 | | | | 48,895,860 | |
| | | | | | | | |
Net Increase in Net Assets Resulting from Operations | | $ | 60,264,200 | | | $ | 71,561,623 | |
| | | | | | | | |
See accompanying notes, which are an integral part of the financial statements.
41
Statements of changes in net assets
Delaware Corporate Bond Fund
| | | | | | | | |
| | | Year ended | |
| | | 7/31/16 | | | 7/31/15 | |
Increase (Decrease) in Net Assets from Operations: | | | | | | | | |
Net investment income | | $ | 40,889,501 | | | $ | 45,883,007 | |
Net realized gain (loss) | | | (32,945,380 | ) | | | 2,406,053 | |
Net change in unrealized appreciation (depreciation) | | | 52,320,079 | | | | (47,323,560 | ) |
| | | | | | | | |
Net increase in net assets resulting from operations | | | 60,264,200 | | | | 965,500 | |
| | | | | | | | |
| | |
Dividends and Distributions to Shareholders from: | | | | | | | | |
Net investment income: | | | | | | | | |
Class A | | | (13,714,939 | ) | | | (18,241,037 | ) |
Class B | | | — | | | | (4,573 | ) |
Class C | | | (4,947,954 | ) | | | (6,240,166 | ) |
Class R | | | (905,876 | ) | | | (1,060,733 | ) |
Institutional Class | | | (24,527,878 | ) | | | (25,316,843 | ) |
| | |
Net realized gain: | | | | | | | | |
Class A | | | (72,919 | ) | | | (4,764,001 | ) |
Class C | | | (32,194 | ) | | | (2,047,006 | ) |
Class R | | | (4,867 | ) | | | (296,460 | ) |
Institutional Class | | | (110,366 | ) | | | (5,836,204 | ) |
| | | | | | | | |
| | | (44,316,993 | ) | | | (63,807,023 | ) |
| | | | | | | | |
| | |
Capital Share Transactions: | | | | | | | | |
Proceeds from shares sold: | | | | | | | | |
Class A | | | 74,940,063 | | | | 156,061,190 | |
Class C | | | 17,081,334 | | | | 27,897,575 | |
Class R | | | 10,126,554 | | | | 9,547,691 | |
Institutional Class | | | 238,689,064 | | | | 591,301,968 | |
| | |
Net asset value of shares issued upon reinvestment of
dividends and distributions: | | | | | | | | |
Class A | | | 12,266,547 | | | | 20,959,352 | |
Class B | | | — | | | | 4,099 | |
Class C | | | 4,326,651 | | | | 7,255,461 | |
Class R | | | 910,743 | | | | 1,356,052 | |
Institutional Class | | | 17,812,496 | | | | 23,920,447 | |
| | | | | | | | |
| | | 376,153,452 | | | | 838,303,835 | |
| | | | | | | | |
42
| | | | | | | | |
| | | Year ended | |
| | | 7/31/16 | | | 7/31/15 | |
| | |
Capital Share Transactions (continued): | | | | | | | | |
Cost of shares redeemed: | | | | | | | | |
Class A | | $ | (181,824,347 | ) | | $ | (224,361,872 | ) |
Class B | | | — | | | | (683,656 | ) |
Class C | | | (45,196,503 | ) | | | (42,134,432 | ) |
Class R | | | (10,714,795 | ) | | | (16,483,124 | ) |
Institutional Class | | | (504,697,959 | ) | | | (228,408,781 | ) |
| | | | | | | | |
| | | (742,433,604 | ) | | | (512,071,865 | ) |
| | | | | | | | |
Increase (decrease) in net assets derived from capital share transactions | | | (366,280,152 | ) | | | 326,231,970 | |
| | | | | | | | |
Net Increase (Decrease) in Net Assets | | | (350,332,945 | ) | | | 263,390,447 | |
Net Assets: | | | | | | | | |
Beginning of year | | | 1,488,665,109 | | | | 1,225,274,662 | |
| | | | | | | | |
End of year | | $ | 1,138,332,164 | | | $ | 1,488,665,109 | |
| | | | | | | | |
Undistributed net investment income | | $ | 20,790 | | | $ | 142,556 | |
| | | | | | | | |
See accompanying notes, which are an integral part of the financial statements.
43
Statements of changes in net assets
Delaware Extended Duration Bond Fund
| | | | | | | | |
| | | Year ended | |
| | | 7/31/16 | | | 7/31/15 | |
| | |
Increase (Decrease) in Net Assets from Operations: | | | | | | | | |
Net investment income | | $ | 22,665,763 | | | $ | 26,773,387 | |
Net realized gain (loss) | | | (5,614,639 | ) | | | 10,028,705 | |
Net change in unrealized appreciation (depreciation) | | | 54,510,499 | | | | (34,491,543 | ) |
| | | | | | | | |
Net increase in net assets resulting from operations | | | 71,561,623 | | | | 2,310,549 | |
| | | | | | | | |
| | |
Dividends and Distributions to Shareholders from: | | | | | | | | |
Net investment income: | | | | | | | | |
Class A | | | (8,060,146 | ) | | | (10,577,818 | ) |
Class B | | | — | | | | (2,069 | ) |
Class C | | | (904,833 | ) | | | (1,078,659 | ) |
Class R | | | (836,690 | ) | | | (1,210,107 | ) |
Institutional Class | | | (12,962,354 | ) | | | (14,774,427 | ) |
Class R6 | | | (7,913 | ) | | | — | |
| | |
Net realized gain: | | | | | | | | |
Class A | | | (349,440 | ) | | | (11,166,547 | ) |
Class C | | | (52,034 | ) | | | (1,380,519 | ) |
Class R | | | (39,832 | ) | | | (1,411,748 | ) |
Institutional Class | | | (530,078 | ) | | | (14,445,938 | ) |
| | |
Return of capital: | | | | | | | | |
Class A | | | (99,043 | ) | | | — | |
Class C | | | (13,876 | ) | | | — | |
Class R | | | (10,648 | ) | | | — | |
Institutional Class | | | (153,033 | ) | | | — | |
Class R6 | | | (3,526 | ) | | | — | |
| | | | | | | | |
| | | (24,023,446 | ) | | | (56,047,832 | ) |
| | | | | | | | |
44
| | | | | | | | |
| | | Year ended | |
| | | 7/31/16 | | | 7/31/15 | |
| | |
Capital Share Transactions: | | | | | | | | |
Proceeds from shares sold: | | | | | | | | |
Class A | | $ | 66,062,847 | | | $ | 117,415,156 | |
Class C | | | 5,838,907 | | | | 11,087,468 | |
Class R | | | 5,881,821 | | | | 15,059,672 | |
Institutional Class | | | 104,015,687 | | | | 171,197,251 | |
Class R6 | | | 8,480,805 | | | | — | |
| | |
Net asset value of shares issued upon reinvestment of dividends and distributions: | | | | | | | | |
Class A | | | 8,220,984 | | | | 21,185,346 | |
Class B | | | — | | | | 2,221 | |
Class C | | | 889,878 | | | | 2,254,773 | |
Class R | | | 887,170 | | | | 2,638,205 | |
Institutional Class | | | 13,105,599 | | | | 27,780,622 | |
Class R6 | | | 4,071 | | | | — | |
| | | | | | | | |
| | | 213,387,769 | | | | 368,620,714 | |
| | | | | | | | |
| | |
Cost of shares redeemed: | | | | | | | | |
Class A | | | (94,248,471 | ) | | | (149,490,226 | ) |
Class B | | | — | | | | (299,879 | ) |
Class C | | | (8,621,363 | ) | | | (7,374,518 | ) |
Class R | | | (9,120,791 | ) | | | (23,496,184 | ) |
Institutional Class | | | (113,840,914 | ) | | | (136,740,882 | ) |
Class R6 | | | (27,699 | ) | | | — | |
| | | | | | | | |
| | | (225,859,238 | ) | | | (317,401,689 | ) |
| | | | | | | | |
Increase (decrease) in net assets derived from capital share transactions | | | (12,471,469 | ) | | | 51,219,025 | |
| | | | | | | | |
Net Increase (Decrease) in Net Assets | | | 35,066,708 | | | | (2,518,258 | ) |
Net Assets: | | | | | | | | |
Beginning of year | | | 646,495,447 | | | | 649,013,705 | |
| | | | | | | | |
End of year | | $ | 681,562,155 | | | $ | 646,495,447 | |
| | | | | | | | |
Distributions in excess of net investment income | | $ | (596,526 | ) | | $ | (655,706 | ) |
| | | | | | | | |
See accompanying notes, which are an integral part of the financial statements.
45
Financial highlights
Delaware Corporate Bond Fund Class A
Selected data for each share of the Fund outstanding throughout each period were as follows:
|
Net asset value, beginning of period |
|
Income (loss) from investment operations: |
Net investment income1 |
Net realized and unrealized gain (loss) |
Total from investment operations. |
|
Less dividends and distributions from: |
Net investment income |
Net realized gain |
Total dividends and distributions |
|
Net asset value, end of period |
|
Total return2 |
|
Ratios and supplemental data: |
Net assets, end of period (000 omitted) |
Ratio of expenses to average net assets |
Ratio of expenses to average net assets prior to fees waived |
Ratio of net investment income to average net assets |
Ratio of net investment income to average net assets prior to fees waived |
Portfolio turnover |
| 1 | The average shares outstanding method has been applied for per share information. |
| 2 | Total investment return is based on the change in net asset value of a share during the period and assumes reinvestment of dividends and distributions at net asset value and does not reflect the impact of a sales charge. Total investment return during all of the periods shown reflects waivers by the manager and/or distributor. Performance would have been lower had the waivers not been in effect. |
See accompanying notes, which are an integral part of the financial statements.
46
| | | | | | | | | | | | | | | | | | | | |
| | | Year ended | |
| | | 7/31/16 | | | 7/31/15 | | | 7/31/14 | | | 7/31/13 | | | 7/31/12 | |
| | $ | 5.810 | | | $ | 6.080 | | | $ | 5.950 | | | $ | 6.260 | | | $ | 6.050 | |
| | | | | |
| | | | | | | | | | | | | | | | | | | | |
| | | 0.187 | | | | 0.205 | | | | 0.227 | | | | 0.230 | | | | 0.246 | |
| | | 0.145 | | | | (0.187 | ) | | | 0.251 | | | | (0.099 | ) | | | 0.384 | |
| | | | | | | | | | | | | | | | | | | | |
| | | 0.332 | | | | 0.018 | | | | 0.478 | | | | 0.131 | | | | 0.630 | |
| | | | | | | | | | | | | | | | | | | | |
| | | | | |
| | | | | | | | | | | | | | | | | | | | |
| | | (0.201 | ) | | | (0.228 | ) | | | (0.252 | ) | | | (0.252 | ) | | | (0.284 | ) |
| | | (0.001 | ) | | | (0.060 | ) | | | (0.096 | ) | | | (0.189 | ) | | | (0.136 | ) |
| | | | | | | | | | | | | | | | | | | | |
| | | (0.202 | ) | | | (0.288 | ) | | | (0.348 | ) | | | (0.441 | ) | | | (0.420 | ) |
| | | | | | | | | | | | | | | | | | | | |
| | | | | |
| | $ | 5.940 | | | $ | 5.810 | | | $ | 6.080 | | | $ | 5.950 | | | $ | 6.260 | |
| | | | | | | | | | | | | | | | | | | | |
| | | | | |
| | | 5.91% | | | | 0.28% | | | | 8.33% | | | | 2.02% | | | | 11.04% | |
| | | | | |
| | | | | | | | | | | | | | | | | | | | |
| | $ | 352,477 | | | $ | 442,509 | | | $ | 511,351 | | | $ | 645,585 | | | $ | 638,481 | |
| | | 0.94% | | | | 0.95% | | | | 0.94% | | | | 0.93% | | | | 0.94% | |
| | | 0.96% | | | | 0.96% | | | | 0.96% | | | | 0.98% | | | | 1.01% | |
| | | 3.28% | | | | 3.43% | | | | 3.81% | | | | 3.70% | | | | 4.11% | |
| | | 3.26% | | | | 3.42% | | | | 3.79% | | | | 3.65% | | | | 4.04% | |
| | | 217% | | | | 215% | | | | 215% | | | | 230% | | | | 202% | |
47
Financial highlights
Delaware Corporate Bond Fund Class C
Selected data for each share of the Fund outstanding throughout each period were as follows:
|
Net asset value, beginning of period |
|
Income (loss) from investment operations: |
Net investment income1 |
Net realized and unrealized gain (loss) |
Total from investment operations |
|
Less dividends and distributions from: |
Net investment income |
Net realized gain |
Total dividends and distributions |
|
Net asset value, end of period |
|
Total return2 |
|
Ratios and supplemental data: |
Net assets, end of period (000 omitted) |
Ratio of expenses to average net assets |
Ratio of expenses to average net assets prior to fees waived |
Ratio of net investment income to average net assets |
Ratio of net investment income to average net assets prior to fees waived |
Portfolio turnover |
| 1 | The average shares outstanding method has been applied for per share information. |
| 2 | Total investment return is based on the change in net asset value of a share during the period and assumes reinvestment of dividends and distributions at net asset value and does not reflect the impact of a sales charge. Total investment return during some of the periods shown reflects a waiver by the manager. Performance would have been lower had the waiver not been in effect. |
See accompanying notes, which are an integral part of the financial statements.
48
| | | | | | | | | | | | | | | | | | | | |
| | | Year ended | |
| | | 7/31/16 | | | 7/31/15 | | | 7/31/14 | | | 7/31/13 | | | 7/31/12 | |
| | $ | 5.810 | | | $ | 6.080 | | | $ | 5.960 | | | $ | 6.260 | | | $ | 6.050 | |
| | | | | |
| | | | | | | | | | | | | | | | | | | | |
| | | 0.145 | | | | 0.161 | | | | 0.182 | | | | 0.183 | | | | 0.202 | |
| | | 0.144 | | | | (0.188 | ) | | | 0.241 | | | | (0.088 | ) | | | 0.383 | |
| | | | | | | | | | | | | | | | | | | | |
| | | 0.289 | | | | (0.027 | ) | | | 0.423 | | | | 0.095 | | | | 0.585 | |
| | | | | | | | | | | | | | | | | | | | |
| | | | | |
| | | | | | | | | | | | | | | | | | | | |
| | | (0.158 | ) | | | (0.183 | ) | | | (0.207 | ) | | | (0.206 | ) | | | (0.239 | ) |
| | | (0.001 | ) | | | (0.060 | ) | | | (0.096 | ) | | | (0.189 | ) | | | (0.136 | ) |
| | | | | | | | | | | | | | | | | | | | |
| | | (0.159 | ) | | | (0.243 | ) | | | (0.303 | ) | | | (0.395 | ) | | | (0.375 | ) |
| | | | | | | | | | | | | | | | | | | | |
| | | | | |
| | $ | 5.940 | | | $ | 5.810 | | | $ | 6.080 | | | $ | 5.960 | | | $ | 6.260 | |
| | | | | | | | | | | | | | | | | | | | |
| | | | | |
| | | 5.12% | | | | (0.48% | ) | | | 7.35% | | | | 1.43% | | | | 10.21% | |
| | | | | |
| | | | | | | | | | | | | | | | | | | | |
| | $ | 173,057 | | | $ | 193,746 | | | $ | 209,893 | | | $ | 273,594 | | | $ | 249,029 | |
| | | 1.69% | | | | 1.70% | | | | 1.69% | | | | 1.68% | | | | 1.69% | |
| | | 1.71% | | | | 1.71% | | | | 1.70% | | | | 1.68% | | | | 1.71% | |
| | | 2.53% | | | | 2.68% | | | | 3.06% | | | | 2.95% | | | | 3.36% | |
| | | 2.51% | | | | 2.67% | | | | 3.05% | | | | 2.95% | | | | 3.34% | |
| | | 217% | | | | 215% | | | | 215% | | | | 230% | | | | 202% | |
49
Financial highlights
Delaware Corporate Bond Fund Class R
Selected data for each share of the Fund outstanding throughout each period were as follows:
|
Net asset value, beginning of period |
|
Income (loss) from investment operations: |
Net investment income1 |
Net realized and unrealized gain (loss) |
Total from investment operations |
|
Less dividends and distributions from: |
Net investment income |
Net realized gain |
Total dividends and distributions |
|
Net asset value, end of period |
|
Total return2 |
|
Ratios and supplemental data: |
Net assets, end of period (000 omitted) |
Ratio of expenses to average net assets |
Ratio of expenses to average net assets prior to fees waived |
Ratio of net investment income to average net assets |
Ratio of net investment income to average net assets prior to fees waived |
Portfolio turnover |
| 1 | The average shares outstanding method has been applied for per share information. |
| 2 | Total investment return is based on the change in net asset value of a share during the period and assumes reinvestment of dividends and distributions at net asset value. Total investment return during all of the periods shown reflects waivers by the manager and/or distributor. Performance would have been lower had the waivers not been in effect. |
See accompanying notes, which are an integral part of the financial statements.
50
| | | | | | | | | | | | | | | | | | | | |
| | | Year ended | |
| | | 7/31/16 | | | 7/31/15 | | | 7/31/14 | | | 7/31/13 | | | 7/31/12 | |
| | $ | 5.820 | | | $ | 6.090 | | | $ | 5.960 | | | $ | 6.270 | | | $ | 6.050 | |
| | | | | |
| | | | | | | | | | | | | | | | | | | | |
| | | 0.173 | | | | 0.191 | | | | 0.212 | | | | 0.214 | | | | 0.231 | |
| | | 0.135 | | | | (0.188 | ) | | | 0.251 | | | | (0.098 | ) | | | 0.394 | |
| | | | | | | | | | | | | | | | | | | | |
| | | 0.308 | | | | 0.003 | | | | 0.463 | | | | 0.116 | | | | 0.625 | |
| | | | | | | | | | | | | | | | | | | | |
| | | | | |
| | | | | | | | | | | | | | | | | | | | |
| | | (0.187 | ) | | | (0.213 | ) | | | (0.237 | ) | | | (0.237 | ) | | | (0.269 | ) |
| | | (0.001 | ) | | | (0.060 | ) | | | (0.096 | ) | | | (0.189 | ) | | | (0.136 | ) |
| | | | | | | | | | | | | | | | | | | | |
| | | (0.188 | ) | | | (0.273 | ) | | | (0.333 | ) | | | (0.426 | ) | | | (0.405 | ) |
| | | | | | | | | | | | | | | | | | | | |
| | | | | |
| | $ | 5.940 | | | $ | 5.820 | | | $ | 6.090 | | | $ | 5.960 | | | $ | 6.270 | |
| | | | | | | | | | | | | | | | | | | | |
| | | | | |
| | | 5.47% | | | | 0.03% | | | | 8.06% | | | | 1.77% | | | | 10.94% | |
| | | | | |
| | | | | | | | | | | | | | | | | | | | |
| | $ | 29,149 | | | $ | 28,245 | | | $ | 35,142 | | | $ | 37,293 | | | $ | 22,661 | |
| | | 1.19% | | | | 1.20% | | | | 1.19% | | | | 1.18% | | | | 1.19% | |
| | | 1.21% | | | | 1.21% | | | | 1.22% | | | | 1.28% | | | | 1.31% | |
| | | 3.03% | | | | 3.18% | | | | 3.56% | | | | 3.45% | | | | 3.86% | |
| | | 3.01% | | | | 3.17% | | | | 3.53% | | | | 3.35% | | | | 3.74% | |
| | | 217% | | | | 215% | | | | 215% | | | | 230% | | | | 202% | |
51
Financial highlights
Delaware Corporate Bond Fund Institutional Class
Selected data for each share of the Fund outstanding throughout each period were as follows:
|
Net asset value, beginning of period |
|
Income (loss) from investment operations: |
Net investment income1 |
Net realized and unrealized gain (loss) |
Total from investment operations |
|
Less dividends and distributions from: |
Net investment income |
Net realized gain |
Total dividends and distributions |
|
Net asset value, end of period |
|
Total return2 |
|
Ratios and supplemental data: |
Net assets, end of period (000 omitted) |
Ratio of expenses to average net assets |
Ratio of expenses to average net assets prior to fees waived |
Ratio of net investment income to average net assets |
Ratio of net investment income to average net assets prior to fees waived |
Portfolio turnover |
| 1 | The average shares outstanding method has been applied for per share information. |
| 2 | Total investment return is based on the change in net asset value of a share during the period and assumes reinvestment of dividends and distributions at net asset value. Total investment return during some of the periods shown reflects a waiver by the manager. Performance would have been lower had the waiver not been in effect. |
See accompanying notes, which are an integral part of the financial statements.
52
| | | | | | | | | | | | | | | | | | | | |
| | | Year ended | |
| | | 7/31/16 | | | 7/31/15 | | | 7/31/14 | | | 7/31/13 | | | 7/31/12 | |
| | $ | 5.810 | | | $ | 6.080 | | | $ | 5.950 | | | $ | 6.260 | | | $ | 6.050 | |
| | | | | |
| | | | | | | | | | | | | | | | | | | | |
| | | 0.202 | | | | 0.218 | | | | 0.242 | | | | 0.245 | | | | 0.261 | |
| | | 0.144 | | | | (0.186 | ) | | | 0.251 | | | | (0.098 | ) | | | 0.384 | |
| | | | | | | | | | | | | | | | | | | | |
| | | 0.346 | | | | 0.032 | | | | 0.493 | | | | 0.147 | | | | 0.645 | |
| | | | | | | | | | | | | | | | | | | | |
| | | | | |
| | | | | | | | | | | | | | | | | | | | |
| | | (0.215 | ) | | | (0.242 | ) | | | (0.267 | ) | | | (0.268 | ) | | | (0.299 | ) |
| | | (0.001 | ) | | | (0.060 | ) | | | (0.096 | ) | | | (0.189 | ) | | | (0.136 | ) |
| | | | | | | | | | | | | | | | | | | | |
| | | (0.216 | ) | | | (0.302 | ) | | | (0.363 | ) | | | (0.457 | ) | | | (0.435 | ) |
| | | | | | | | | | | | | | | | | | | | |
| | | | | |
| | $ | 5.940 | | | $ | 5.810 | | | $ | 6.080 | | | $ | 5.950 | | | $ | 6.260 | |
| | | | | | | | | | | | | | | | | | | | |
| | | | | |
| | | 6.18% | | | | 0.52% | | | | 8.60% | | | | 2.28% | | | | 11.32% | |
| | | | | |
| | | | | | | | | | | | | | | | | | | | |
| | $ | 583,649 | | | $ | 824,165 | | | $ | 468,205 | | | $ | 518,576 | | | $ | 507,190 | |
| | | 0.69% | | | | 0.70% | | | | 0.69% | | | | 0.68% | | | | 0.69% | |
| | | 0.71% | | | | 0.71% | | | | 0.70% | | | | 0.68% | | | | 0.71% | |
| | | 3.53% | | | | 3.68% | | | | 4.06% | | | | 3.95% | | | | 4.36% | |
| | | 3.51% | | | | 3.67% | | | | 4.05% | | | | 3.95% | | | | 4.34% | |
| | | 217% | | | | 215% | | | | 215% | | | | 230% | | | | 202% | |
53
Financial highlights
Delaware Extended Duration Bond Fund Class A
Selected data for each share of the Fund outstanding throughout each period were as follows:
|
Net asset value, beginning of period |
|
Income (loss) from investment operations: |
Net investment income1 |
Net realized and unrealized gain (loss) |
Total from investment operations |
|
Less dividends and distributions from: |
Net investment income |
Net realized gain |
Return of capital |
Total dividends and distributions |
|
Net asset value, end of period |
|
Total return2 |
|
Ratios and supplemental data: |
Net assets, end of period (000 omitted) |
Ratio of expenses to average net assets |
Ratio of expenses to average net assets prior to fees waived |
Ratio of net investment income to average net assets |
Ratio of net investment income to average net assets prior to fees waived |
Portfolio turnover |
| 1 | The average shares outstanding method has been applied for per share information. |
| 2 | Total investment return is based on the change in net asset value of a share during the period and assumes reinvestment of dividends and distributions at net asset value and does not reflect the impact of a sales charge. Total investment return during all of the periods shown reflects waivers by the manager and/or distributor. Performance would have been lower had the waivers not been in effect. |
See accompanying notes, which are an integral part of the financial statements.
54
| | | | | | | | | | | | | | | | | | | | |
| | | Year ended | |
| | | 7/31/16 | | | 7/31/15 | | | 7/31/14 | | | 7/31/13 | | | 7/31/12 | |
| | $ | 6.290 | | | $ | 6.810 | | | $ | 6.280 | | | $ | 7.150 | | | $ | 6.380 | |
| | | | | |
| | | | | | | | | | | | | | | | | | | | |
| | | 0.226 | | | | 0.259 | | | | 0.278 | | | | 0.280 | | | | 0.300 | |
| | | 0.513 | | | | (0.216 | ) | | | 0.542 | | | | (0.427 | ) | | | 1.055 | |
| | | | | | | | | | | | | | | | | | | | |
| | | 0.739 | | | | 0.043 | | | | 0.820 | | | | (0.147 | ) | | | 1.355 | |
| | | | | | | | | | | | | | | | | | | | |
| | | | | |
| | | | | | | | | | | | | | | | | | | | |
| | | (0.226 | ) | | | (0.268 | ) | | | (0.290 | ) | | | (0.287 | ) | | | (0.319 | ) |
| | | (0.010 | ) | | | (0.295 | ) | | | — | | | | (0.436 | ) | | | (0.266 | ) |
| | | (0.003 | ) | | | — | | | | — | | | | — | | | | — | |
| | | | | | | | | | | | | | | | | | | | |
| | | (0.239 | ) | | | (0.563 | ) | | | (0.290 | ) | | | (0.723 | ) | | | (0.585 | ) |
| | | | | | | | | | | | | | | | | | | | |
| | | | | |
| | $ | 6.790 | | | $ | 6.290 | | | $ | 6.810 | | | $ | 6.280 | | | $ | 7.150 | |
| | | | | | | | | | | | | | | | | | | | |
| | | | | |
| | | 12.14% | | | | 0.53% | | | | 13.42% | | | | (2.45% | ) | | | 22.48% | |
| | | | | |
| | | | | | | | | | | | | | | | | | | | |
| | $ | 241,190 | | | $ | 244,514 | | | $ | 277,041 | | | $ | 370,553 | | | $ | 402,639 | |
| | | 0.96% | | | | 0.98% | | | | 0.96% | | | | 0.95% | | | | 0.95% | |
| | | 1.00% | | | | 1.02% | | | | 1.01% | | | | 1.04% | | | | 1.06% | |
| | | 3.60% | | | | 3.89% | | | | 4.35% | | | | 4.13% | | | | 4.53% | |
| | | 3.56% | | | | 3.85% | | | | 4.30% | | | | 4.04% | | | | 4.42% | |
| | | 219% | | | | 185% | | | | 216% | | | | 217% | | | | 172% | |
55
Financial highlights
Delaware Extended Duration Bond Fund Class C
Selected data for each share of the Fund outstanding throughout each period were as follows:
|
Net asset value, beginning of period |
|
Income (loss) from investment operations: |
Net investment income1 |
Net realized and unrealized gain (loss) |
Total from investment operations |
|
Less dividends and distributions from: |
Net investment income |
Net realized gain |
Return of capital |
Total dividends and distributions |
|
Net asset value, end of period |
|
Total return2 |
|
Ratios and supplemental data: |
Net assets, end of period (000 omitted) |
Ratio of expenses to average net assets |
Ratio of expenses to average net assets prior to fees waived |
Ratio of net investment income to average net assets |
Ratio of net investment income to average net assets prior to fees waived |
Portfolio turnover |
| 1 | The average shares outstanding method has been applied for per share information. |
| 2 | Total investment return is based on the change in net asset value of a share during the period and assumes reinvestment of dividends and distributions at net asset value and does not reflect the impact of a sales charge. Total investment return during all of the periods shown reflects a waiver by the manager. Performance would have been lower had the waiver not been in effect. |
See accompanying notes, which are an integral part of the financial statements.
56
| | | | | | | | | | | | | | | | | | | | |
| | | Year ended | |
| | | 7/31/16 | | | 7/31/15 | | | 7/31/14 | | | 7/31/13 | | | 7/31/12 | |
| | $ | 6.290 | | | $ | 6.810 | | | $ | 6.280 | | | $ | 7.150 | | | $ | 6.380 | |
| | | | | |
| | | | | | | | | | | | | | | | | | | | |
| | | 0.179 | | | | 0.208 | | | | 0.230 | | | | 0.230 | | | | 0.251 | |
| | | 0.503 | | | | (0.216 | ) | | | 0.542 | | | | (0.428 | ) | | | 1.055 | |
| | | | | | | | | | | | | | | | | | | | |
| | | 0.682 | | | | (0.008 | ) | | | 0.772 | | | | (0.198 | ) | | | 1.306 | |
| | | | | | | | | | | | | | | | | | | | |
| | | | | |
| | | | | | | | | | | | | | | | | | | | |
| | | (0.179 | ) | | | (0.217 | ) | | | (0.242 | ) | | | (0.236 | ) | | | (0.270 | ) |
| | | (0.010 | ) | | | (0.295 | ) | | | — | | | | (0.436 | ) | | | (0.266 | ) |
| | | (0.003 | ) | | | — | | | | — | | | | — | | | | — | |
| | | | | | | | | | | | | | | | | | | | |
| | | (0.192 | ) | | | (0.512 | ) | | | (0.242 | ) | | | (0.672 | ) | | | (0.536 | ) |
| | | | | | | | | | | | | | | | | | | | |
| | | | | |
| | $ | 6.780 | | | $ | 6.290 | | | $ | 6.810 | | | $ | 6.280 | | | $ | 7.150 | |
| | | | | | | | | | | | | | | | | | | | |
| | | | | |
| | | 11.14% | | | | (0.22% | ) | | | 12.59% | | | | (3.17% | ) | | | 21.57% | |
| | | | | |
| | | | | | | | | | | | | | | | | | | | |
| | $ | 33,777 | | | $ | 33,323 | | | $ | 30,091 | | | $ | 47,326 | | | $ | 62,275 | |
| | | 1.71% | | | | 1.73% | | | | 1.71% | | | | 1.70% | | | | 1.70% | |
| | | 1.75% | | | | 1.77% | | | | 1.75% | | | | 1.74% | | | | 1.76% | |
| | | 2.85% | | | | 3.14% | | | | 3.60% | | | | 3.38% | | | | 3.78% | |
| | | 2.81% | | | | 3.10% | | | | 3.56% | | | | 3.34% | | | | 3.72% | |
| | | 219% | | | | 185% | | | | 216% | | | | 217% | | | | 172% | |
57
Financial highlights
Delaware Extended Duration Bond Fund Class R
Selected data for each share of the Fund outstanding throughout each period were as follows:
|
Net asset value, beginning of period |
|
Income (loss) from investment operations: |
Net investment income1 |
Net realized and unrealized gain (loss) |
Total from investment operations |
|
Less dividends and distributions from: |
Net investment income |
Net realized gain |
Return of capital |
Total dividends and distributions |
|
Net asset value, end of period |
|
Total return2 |
|
Ratios and supplemental data: |
Net assets, end of period (000 omitted) |
Ratio of expenses to average net assets |
Ratio of expenses to average net assets prior to fees waived |
Ratio of net investment income to average net assets |
Ratio of net investment income to average net assets prior to fees waived |
Portfolio turnover |
| 1 | The average shares outstanding method has been applied for per share information. |
| 2 | Total investment return is based on the change in net asset value of a share during the period and assumes reinvestment of dividends and distributions at net asset value. Total investment return during all of the periods shown reflects waivers by the manager and/or distributor. Performance would have been lower had the waivers not been in effect. |
See accompanying notes, which are an integral part of the financial statements.
58
| | | | | | | | | | | | | | | | | | | | |
| | | Year ended | |
| | | 7/31/16 | | | 7/31/15 | | | 7/31/14 | | | 7/31/13 | | | 7/31/12 | |
| | $ | 6.300 | | | $ | 6.820 | | | $ | 6.290 | | | $ | 7.160 | | | $ | 6.390 | |
| | | | | |
| | | | | | | | | | | | | | | | | | | | |
| | | 0.211 | | | | 0.243 | | | | 0.265 | | | | 0.263 | | | | 0.284 | |
| | | 0.513 | | | | (0.217 | ) | | | 0.539 | | | | (0.426 | ) | | | 1.055 | |
| | | | | | | | | | | | | | | | | | | | |
| | | 0.724 | | | | 0.026 | | | | 0.804 | | | | (0.163 | ) | | | 1.339 | |
| | | | | | | | | | | | | | | | | | | | |
| | | | | |
| | | | | | | | | | | | | | | | | | | | |
| | | (0.211 | ) | | | (0.251 | ) | | | (0.274 | ) | | | (0.271 | ) | | | (0.303 | ) |
| | | (0.010 | ) | | | (0.295 | ) | | | — | | | | (0.436 | ) | | | (0.266 | ) |
| | | (0.003 | ) | | | — | | | | — | | | | — | | | | — | |
| | | | | | | | | | | | | | | | | | | | |
| | | (0.224 | ) | | | (0.546 | ) | | | (0.274 | ) | | | (0.707 | ) | | | (0.569 | ) |
| | | | | | | | | | | | | | | | | | | | |
| | | | | |
| | $ | 6.800 | | | $ | 6.300 | | | $ | 6.820 | | | $ | 6.290 | | | $ | 7.160 | |
| | | | | | | | | | | | | | | | | | | | |
| | | | | |
| | | 11.84% | | | | 0.29% | | | | 13.13% | | | | (2.68% | ) | | | 22.15% | |
| | | | | |
| | | | | | | | | | | | | | | | | | | | |
| | $ | 25,965 | | | $ | 26,449 | | | $ | 34,545 | | | $ | 29,423 | | | $ | 20,080 | |
| | | 1.21% | | | | 1.23% | | | | 1.21% | | | | 1.20% | | | | 1.20% | |
| | | 1.25% | | | | 1.27% | | | | 1.27% | | | | 1.34% | | | | 1.36% | |
| | | 3.35% | | | | 3.64% | | | | 4.10% | | | | 3.88% | | | | 4.28% | |
| | | 3.31% | | | | 3.60% | | | | 4.04% | | | | 3.74% | | | | 4.12% | |
| | | 219% | | | | 185% | | | | 216% | | | | 217% | | | | 172% | |
59
Financial highlights
Delaware Extended Duration Bond Fund Institutional Class
Selected data for each share of the Fund outstanding throughout each period were as follows:
|
Net asset value, beginning of period |
|
Income (loss) from investment operations: |
Net investment income1 |
Net realized and unrealized gain (loss) |
Total from investment operations |
|
Less dividends and distributions from: |
Net investment income |
Net realized gain |
Return of capital |
Total dividends and distributions |
|
Net asset value, end of period |
|
Total return2 |
|
Ratios and supplemental data: |
Net assets, end of period (000 omitted) |
Ratio of expenses to average net assets |
Ratio of expenses to average net assets prior to fees waived |
Ratio of net investment income to average net assets |
Ratio of net investment income to average net assets prior to fees waived |
Portfolio turnover |
| 1 | The average shares outstanding method has been applied for per share information. |
| 2 | Total investment return is based on the change in net asset value of a share during the period and assumes reinvestment of dividends and distributions at net asset value. Total investment return during all of the periods shown reflects a waiver by the manager. Performance would have been lower had the waiver not been in effect. |
See accompanying notes, which are an integral part of the financial statements.
60
| | | | | | | | | | | | | | | | | | | | |
| | | Year ended | |
| | | 7/31/16 | | | 7/31/15 | | | 7/31/14 | | | 7/31/13 | | | 7/31/12 | |
| | $ | 6.280 | | | $ | 6.800 | | | $ | 6.270 | | | $ | 7.140 | | | $ | 6.370 | |
| | | | | |
| | | | | | | | | | | | | | | | | | | | |
| | | 0.241 | | | | 0.274 | | | | 0.295 | | | | 0.297 | | | | 0.317 | |
| | | 0.513 | | | | (0.215 | ) | | | 0.541 | | | | (0.427 | ) | | | 1.055 | |
| | | | | | | | | | | | | | | | | | | | |
| | | 0.754 | | | | 0.059 | | | | 0.836 | | | | (0.130 | ) | | | 1.372 | |
| | | | | | | | | | | | | | | | | | | | |
| | | | | |
| | | | | | | | | | | | | | | | | | | | |
| | | (0.241 | ) | | | (0.284 | ) | | | (0.306 | ) | | | (0.304 | ) | | | (0.336 | ) |
| | | (0.010 | ) | | | (0.295 | ) | | | — | | | | (0.436 | ) | | | (0.266 | ) |
| | | (0.003 | ) | | | — | | | | — | | | | — | | | | — | |
| | | | | | | | | | | | | | | | | | | | |
| | | (0.254 | ) | | | (0.579 | ) | | | (0.306 | ) | | | (0.740 | ) | | | (0.602 | ) |
| | | | | | | | | | | | | | | | | | | | |
| | | | | |
| | $ | 6.780 | | | $ | 6.280 | | | $ | 6.800 | | | $ | 6.270 | | | $ | 7.140 | |
| | | | | | | | | | | | | | | | | | | | |
| | | | | |
| | | 12.26% | | | | 0.78% | | | | 13.72% | | | | (2.21% | ) | | | 22.82% | |
| | | | | |
| | | | | | | | | | | | | | | | | | | | |
| | $ | 372,052 | | | $ | 342,209 | | | $ | 307,039 | | | $ | 304,299 | | | $ | 344,628 | |
| | | 0.71% | | | | 0.73% | | | | 0.71% | | | | 0.70% | | | | 0.70% | |
| | | 0.75% | | | | 0.77% | | | | 0.75% | | | | 0.74% | | | | 0.76% | |
| | | 3.85% | | | | 4.14% | | | | 4.60% | | | | 4.38% | | | | 4.78% | |
| | | 3.81% | | | | 4.10% | | | | 4.56% | | | | 4.34% | | | | 4.72% | |
| | | 219% | | | | 185% | | | | 216% | | | | 217% | | | | 172% | |
61
Financial highlights
Delaware Extended Duration Bond Fund Class R6
Selected data for each share of the Fund outstanding throughout the period were as follows:
| | | | |
| | | 5/02/161
to
7/31/16 | |
Net asset value, beginning of period | | | $6.380 | |
| |
Income from investment operations: | | | | |
Net investment income2 | | | 0.229 | |
Net realized and unrealized gain | | | 0.228 | |
| | | | |
Total from investment operations | | | 0.457 | |
| | | | |
| |
Less dividends and distributions from: | | | | |
Net investment income | | | (0.054 | ) |
Return of capital | | | (0.003 | ) |
| | | | |
Total dividends and distributions | | | (0.057 | ) |
| | | | |
| |
Net asset value, end of period | | | $6.780 | |
| | | | |
| |
Total return3 | | | 7.20% | |
| |
Ratios and supplemental data: | | | | |
Net assets, end of period (000 omitted) | | | $8,578 | |
Ratio of expenses to average net assets | | | 0.63% | |
Ratio of expenses to average net assets prior to fees waived | | | 0.65% | |
Ratio of net investment income to average net assets | | | 3.40% | |
Ratio of net investment income to average net assets prior to fees waived | | | 3.38% | |
Portfolio turnover | | | 219%4 | |
| 1 | Date of commencement of operations; ratios have been annualized and total return has not been annualized. |
| 2 | The average shares outstanding method has been applied for per share information. |
| 3 | Total investment return is based on the change in net asset value of a share during the period and assumes reinvestment of dividends and distributions at net asset value. Total investment return during the period shown reflects a waiver by the manager. Performance would have been lower had the waivers not been in effect. |
| 4 | Portfolio turnover is representative of the Fund for the year ended July 31, 2016. |
See accompanying notes, which are an integral part of the financial statements.
62
Notes to financial statements
Delaware Corporate Bond Fund and Delaware Extended Duration Bond Fund
July 31, 2016
Delaware Group® Income Funds (Trust) is organized as a Delaware statutory trust and offers four series: Delaware Corporate Bond Fund, Delaware Diversified Floating Rate Fund, Delaware Extended Duration Bond Fund, and Delaware High-Yield Opportunities Fund. These financial statements and the related notes pertain to Delaware Corporate Bond Fund and Delaware Extended Duration Bond Fund (each, a Fund or collectively, the Funds). The Trust is an open-end investment company. The Funds are considered diversified under the Investment Company Act of 1940 (1940 Act), as amended, and offer Class A, Class C, Class R, and Institutional Class, and Delaware Extended Duration Bond Fund also offers Class R6 shares. Class A shares are sold with a maximum front-end sales charge of 4.50%. Class A share purchases of $1,000,000 or more will incur a contingent deferred sales charge (CDSC) of 1.00% if redeemed during the first year and 0.50% during the second year, provided that Delaware Distributors, L.P. (DDLP) paid a financial advisor a commission on the purchase of those shares. Effective Sept. 25, 2014, all remaining shares of Class B were converted to Class A shares. Class C shares are sold with a CDSC of 1.00%, if redeemed during the first 12 months. Class R, Institutional Class, and Class R6 shares are not subject to a sales charge and are offered for sale exclusively to certain eligible investors. In addition, Class R6 shares do not pay any service fees, sub-accounting fees, and/or sub-transfer agency fees. Class R6 commenced operations on May 2, 2016.
The investment objective of the Funds is to seek to provide investors with total return.
1. Significant Accounting Policies
The following accounting policies are in accordance with U.S. generally accepted accounting principles (U.S. GAAP) and are consistently followed by the Funds.
Security Valuation – Equity securities, except those traded on the Nasdaq Stock Market LLC (Nasdaq), are valued at the last quoted sales price as of the time of the regular close of the New York Stock Exchange on the valuation date. Securities traded on the Nasdaq are valued in accordance with the Nasdaq Official Closing Price, which may not be the last sales price. If, on a particular day, an equity security does not trade, the mean between the bid and ask prices will be used, which approximates fair value. U.S. government and agency securities are valued at the mean between the bid and ask prices, which approximates fair value. Other debt securities and credit default swap (CDS) contracts are valued based upon valuations provided by an independent pricing service or broker/counterparty and reviewed by management. To the extent current market prices are not available, the pricing service may take into account developments related to the specific security, as well as transactions in comparable securities. Valuations for fixed income securities utilize matrix systems, which reflect such factors as security prices, yields, maturities, and ratings, and are supplemented by dealer and exchange quotations. Swap prices are derived using daily swap curves and models that incorporate a number of market data factors, such as discounted cash flows, trades, and values of the underlying reference instruments. Foreign currency exchange contracts and foreign cross currency exchange contracts are valued at the mean between the bid and ask prices, which approximates fair value. Interpolated values are derived when the settlement date of the contract is an interim date for which quotations are not available. Futures contracts are valued at the daily quoted settlement prices. Generally, other securities and assets for which market quotations are not readily available are valued at fair value as determined in good faith under the direction of the Trust’s Board of Trustees (Board). In determining whether market quotations are readily available or fair valuation will be used, various factors will be taken into consideration, such as market closures or suspension of trading in a security.
63
Notes to financial statements
Delaware Corporate Bond Fund and Delaware Extended Duration Bond Fund
1. Significant Accounting Policies (continued)
Federal Income Taxes – No provision for federal income taxes has been made as each Fund intends to continue to qualify for federal income tax purposes as a regulated investment company under Subchapter M of the Internal Revenue Code of 1986, as amended, and make the requisite distributions to shareholders. The Funds evaluate tax positions taken or expected to be taken in the course of preparing the Funds’ tax returns to determine whether the tax positions are “more-likely-than-not” of being sustained by the applicable tax authority. Tax positions not deemed to meet the “more-likely-than-not” threshold are recorded as a tax benefit or expense in the current year. Management has analyzed each Fund’s tax positions taken for all open federal income tax years (July 31, 2013–July 31, 2016) and has concluded that no provision for federal income tax is required in the Funds’ financial statements.
Class Accounting – Investment income and common expenses are allocated to the various classes of each Fund on the basis of “settled shares” of each class in relation to the net assets of each Fund. Realized and unrealized gain (loss) on investments are allocated to the various classes of each Fund on the basis of daily net assets of each class. Distribution expenses relating to a specific class are charged directly to that class. R6 shares will not be allocated any expenses related to service fees, sub-accounting fees, and/or sub-transfer agency fees paid to brokers, dealers, or other financial intermediaries.
Repurchase Agreements – The Funds may purchase certain U.S. government securities subject to the counterparty’s agreement to repurchase them at an agreed upon date and price. The counterparty will be required on a daily basis to maintain the value of the collateral subject to the agreement at not less than the repurchase price (including accrued interest). The agreements are conditioned upon the collateral being deposited under the Federal Reserve book-entry system with the Funds’ custodian or a third-party sub-custodian. In the event of default or bankruptcy by the other party to the agreement, retention of the collateral may be subject to legal proceedings. All open repurchase agreements as of the date of this report were entered into on July 29, 2016, and matured on the next business day.
Foreign Currency Transactions – Transactions denominated in foreign currencies are recorded at the prevailing exchange rates on the valuation date in accordance with the Funds’ prospectus. The value of all assets and liabilities denominated in foreign currencies is translated daily into U.S. dollars at the exchange rate of such currencies against the U.S. dollar. Transaction gains or losses resulting from changes in exchange rates during the reporting period or upon settlement of the foreign currency transaction are reported in operations for the current period. The Funds generally bifurcate that portion of realized gains and losses on investments in debt securities which is due to changes in foreign exchange rates from that which is due to changes in market prices of debt securities. That portion of gains (losses), which is due to changes in foreign exchange rates, is included on the “Statements of operations” under “Net realized gain (loss) on foreign currencies.” The Funds report certain foreign currency related transactions as components of realized gains (losses) for financial reporting purposes, whereas such components are treated as ordinary income (loss) for federal income tax purposes.
64
Use of Estimates – Each Fund is an investment company, whose financial statements are prepared in conformity with U.S. GAAP. Therefore, each Fund follows the accounting and reporting guidelines for investment companies. The preparation of financial statements in conformity with U.S. GAAP requires management to make estimates and assumptions that affect the fair value of investments, the reported amounts of assets and liabilities and disclosure of contingent assets and liabilities at the date of the financial statements, and the reported amounts of revenues and expenses during the reporting period. Actual results could differ from those estimates and the differences could be material.
Other – Expenses directly attributable to a Fund are charged directly to that Fund. Other expenses common to various funds within the Delaware Investments® Family of Funds are generally allocated among such funds on the basis of average net assets. Management fees and some other expenses are paid monthly. Security transactions are recorded on the date the securities are purchased or sold (trade date) for financial reporting purposes. Costs used in calculating realized gains and losses on the sale of investment securities are those of the specific securities sold. Dividend income is recorded on the ex-dividend date and interest income is recorded on the accrual basis. Discounts and premiums on debt securities are accreted or amortized to interest income, respectively, over the lives of the respective securities using the effective interest method. Each Fund declares dividends daily from net investment income and pays the dividends monthly and declares and pays distributions from net realized gain on investments, if any, annually. Each Fund may distribute more frequently, if necessary for tax purposes. Dividends and distributions, if any, are recorded on the ex-dividend date.
Each Fund may receive earnings credits from its custodian when positive cash balances are maintained, which may be used to offset custody fees. There were no such earnings credits for the year ended July 31, 2016.
Each Fund receives earnings credits from its transfer agent when positive cash balances are maintained, which may be used to offset transfer agent fees. If the amount earned is greater than one dollar, the expense paid under this arrangement is included on the “Statements of operations” under “Dividend disbursing and transfer agent fees and expenses” with the corresponding expense offset shown under “Less expense paid indirectly.” For the year ended July 31, 2016, each Fund earned the following amounts under this agreement:
| | | | |
| | | Delaware
Corporate
Bond Fund | | Delaware
Extended Duration
Bond Fund |
| | |
| | $1,384 | | $654 |
65
Notes to financial statements
Delaware Corporate Bond Fund and Delaware Extended Duration Bond Fund
2. Investment Management, Administration Agreements, and Other Transactions with Affiliates
In accordance with the terms of its respective investment management agreement, each Fund pays Delaware Management Company (DMC), a series of Delaware Management Business Trust and the investment manager, an annual fee which is calculated based on each Fund’s average daily net assets as follows:
| | | | | | |
| | | Delaware
Corporate
Bond Fund | | | Delaware
Extended Duration
Bond Fund |
| | |
On the first $500 million | | | 0.5000% | | | 0.5500% |
On the next $500 million | | | 0.4750% | | | 0.5000% |
On the next $1.5 billion | | | 0.4500% | | | 0.4500% |
In excess of $2.5 billion | | | 0.4250% | | | 0.4250% |
DMC has contractually agreed to waive that portion, if any, of its management fee and/or pay/reimburse each Fund to the extent necessary to ensure that total annual operating expenses ((excluding any distribution and service (12b-1) fees, acquired fund fees and expenses, taxes, interest, short sale and dividend interest expenses, brokerage fees, certain insurance costs, and nonroutine expenses or costs, including, but not limited to, those relating to reorganizations, litigation, conducting shareholder meetings, and liquidations) (collectively, nonroutine expenses)), do not exceed specified percentages of average daily net assets of each Fund from Aug. 1, 2015 through July 31, 2016* as shown below. For purpose of these waivers and reimbursements, nonroutine expenses may also include such additional costs and expenses as may be agreed upon from time to time by the Board and DMC. These expense waivers and reimbursements apply only to expenses paid directly by the Funds and may only be terminated by agreement of DMC and the Funds.
| | | | | | |
| | | Delaware
Corporate
Bond Fund | | Delaware
Extended Duration
Bond Fund
(Class A, Class C, Class R,
and Institutional Class shares) | | Delaware
Extended Duration
Bond Fund
(Class R6 shares) |
Operating expense limitation as a percentage of average daily net assets (per annum) | | 0.69% | | 0.71% | | 0.63% |
*The aggregate contractual waiver period covering this report is from Nov. 28, 2014 through Nov. 28, 2016 for Delaware Corporate Bond Fund, and from Nov. 28, 2014 through April 30, 2017 for Delaware Extended Duration Bond Fund.
Delaware Investments Fund Services Company (DIFSC), an affiliate of DMC, provides fund accounting and financial administration oversight services to the Funds. For these services, DIFSC’s fees are calculated based on the aggregate daily net assets of the Delaware Investments® Family of Funds at the following annual rate: 0.0050% of the first $30 billion; 0.0045% of the next $10 billion; 0.0040% of the next $10 billion; and 0.0025% of aggregate average daily net assets in excess of $50 billion. The fees
66
payable to DIFSC under the service agreement described above are allocated among all funds in the Delaware Investments® Family of Funds on a relative net asset value (NAV) basis. These amounts are included on the “Statements of operations” under “Accounting and administration expenses.” For the year ended July 31, 2016, the Funds were charged for these services as follows:
| | | | |
| | | Delaware
Corporate
Bond Fund | | Delaware
Extended Duration
Bond Fund |
| | |
| | $58,888 | | $29,284 |
DIFSC is also the transfer agent and dividend disbursing agent of the Funds. For these services, DIFSC’s fees are calculated based on the aggregate daily net assets of the retail funds within the Delaware Investments Family of Funds at the following annual rate: 0.025% of the first $20 billion; 0.020% of the next $5 billion; 0.015% of the next $5 billion; and 0.013% of average daily net assets in excess of $30 billion. The fees payable to DIFSC under the service agreement described above are allocated among all retail funds in the Delaware Investments Family of Funds on a relative NAV basis. These amounts are included on the “Statements of operations” under “Dividend disbursing and transfer agent fees and expenses.” For the year ended July 31, 2016, each Fund was charged for these services as follows:
| | | | |
| | | Delaware
Corporate
Bond Fund | | Delaware
Extended Duration
Bond Fund |
| | |
| | $257,977 | | $128,237 |
Pursuant to a sub-transfer agency agreement between DIFSC and BNY Mellon Investment Servicing (US) Inc. (BNYMIS), BNYMIS provides certain sub-transfer agency services to the Funds. Sub-transfer agency fees are paid by the Funds and are also included on the “Statements of operations” under “Dividend disbursing and transfer agent fees and expenses.”
Pursuant to a distribution agreement and distribution plan, each Fund pays DDLP, the distributor and an affiliate of DMC, an annual 12b-1 fees of 0.25%,1.00%, and 0.50% of the average daily net assets of the Class A, Class C, and Class R shares, respectively. Institutional Class and Class R6 shares pay no distribution and service fees.
As provided in the investment management agreement, each Fund bears a portion of the cost of certain resources shared with DMC, including the cost of internal personnel of DMC and/or its affiliates that provide legal, tax, and regulatory reporting services to the Funds. These amounts are included on the “Statements of operations” under “Legal fees.” For the year ended July 31, 2016, each Fund was charged for internal legal, tax, and regulatory reporting services provided by DMC and/or its affiliates’ employees as follows:
| | | | |
| | | Delaware
Corporate
Bond Fund | | Delaware
Extended Duration
Bond Fund |
| | |
| | $26,493 | | $12,970 |
67
Notes to financial statements
Delaware Corporate Bond Fund and Delaware Extended Duration Bond Fund
2. Investment Management, Administration Agreements, and Other Transactions with Affiliates (continued)
For the year ended July 31, 2016, DDLP earned commissions on sales of Class A shares for each Fund as follows:
| | | | |
| | | Delaware
Corporate
Bond Fund | | Delaware
Extended Duration
Bond Fund |
| | |
| | $15,502 | | $23,383 |
For the year ended July 31, 2016, DDLP received gross CDSC commissions on redemptions of each Fund’s Class A and Class C shares, respectively, and these commissions were entirely used to offset upfront commissions previously paid by DDLP to broker/dealers on sales of those shares. The amounts received were as follows:
| | | | | | | | | | |
| | | Delaware
Corporate
Bond Fund | | Delaware
Extended Duration
Bond Fund |
| | |
Class A | | | $ | 127 | | | | $ | 245 | |
Class C | | | | 13,710 | | | | | 6,122 | |
Trustees’ fees include expenses accrued by the Funds for each Trustee’s retainer and meeting fees. Certain officers of DMC, DIFSC and DDLP are officers and/or Trustees of the Trust. These officers and Trustees are paid no compensation by the Funds.
Cross trades for the year ended July 31, 2016, were executed by the Funds pursuant to procedures adopted by the Board designed to ensure compliance with Rule 17a-7 under the 1940 Act. Cross trading is the buying or selling of portfolio securities between funds of investment companies, or between a fund of an investment company and another entity, that are or could be considered affiliates by virtue of having a common investment advisor (or affiliated investment advisors), common directors/trustees and/ or common officers. At its regularly scheduled meetings, the Board reviews such transactions for compliance with the procedures adopted by the Board. Pursuant to these procedures, for the year ended July 31, 2016, the Funds engaged in securities sales, which resulted in the following net realized gains (losses). There were no Rule 17a-7 securities purchases for the year ended July 31, 2016.
| | | | | | | | | | |
| | | Delaware
Corporate
Bond Fund | | Delaware
Extended Duration
Bond Fund |
| | |
Sales | | | $ | 70,202,713 | | | | $ | 19,866,036 | |
Net realized gain (loss) | | | | 21,129 | | | | | (31,339 | ) |
68
3. Investments
For the year ended July 31, 2016, the Funds made purchases and sales of investment securities other than short-term investments as follows:
| | | | | | | | |
| | | Delaware
Corporate
Bond Fund | | | Delaware
Extended Duration
Bond Fund | |
| | |
Purchases other than U.S. government securities | | | $1,911,801,217 | | | | $812,816,280 | |
Purchases of U.S. government securities | | | 742,851,161 | | | | 490,556,633 | |
Sales other than U.S. government securities | | | 2,271,352,072 | | | | 807,312,758 | |
Sales of U.S. government securities | | | 754,241,482 | | | | 494,873,812 | |
At July 31, 2016, the cost and unrealized appreciation (depreciation) of investments for federal income tax purposes for each Fund were as follows:
| | | | | | | | |
| | | Delaware Corporate
Bond Fund | | | Delaware
Extended Duration
Bond Fund | |
| | |
Cost of investments | | $ | 1,098,484,203 | | | $ | 631,002,841 | |
| | | | | | | | |
Aggregate unrealized appreciation of investments | | $ | 54,619,012 | | | $ | 52,960,007 | |
Aggregate unrealized depreciation of investments | | | (14,980,665) | | | | (3,142,441) | |
| | | | | | | | |
Net unrealized appreciation of investments | | $ | 39,638,347 | | | $ | 49,817,566 | |
| | | | | | | | |
U.S. GAAP defines fair value as the price that each Fund would receive to sell an asset or pay to transfer a liability in an orderly transaction between market participants at the measurement date under current market conditions. A three-level hierarchy for fair value measurements has been established based upon the transparency of inputs to the valuation of an asset or liability. Inputs may be observable or unobservable and refer broadly to the assumptions that market participants would use in pricing the asset or liability. Observable inputs reflect the assumptions market participants would use in pricing the asset or liability based on market data obtained from sources independent of the reporting entity. Unobservable inputs reflect the reporting entity’s own assumptions about the assumptions that market participants would use in pricing the asset or liability based on the best information available under the circumstances. Each Fund’s investment in its entirety is assigned a level based upon the observability of the inputs which are significant to the overall valuation. The three-level hierarchy of inputs is summarized below.
| Level 1 – | Inputs are quoted prices in active markets for identical investments. (Examples: equity securities, open-end investment companies, futures contracts, exchange-traded options contracts) |
| Level 2 – | Other observable inputs, including, but not limited to: quoted prices for similar assets or liabilities in markets that are active, quoted prices for identical or similar assets or liabilities in markets that are not active, inputs other than quoted prices that are observable for the assets or liabilities (such as interest rates, yield curves, volatilities, prepayment speeds, loss severities, credit risks, and default rates) or other market-corroborated inputs. (Examples: debt securities, government securities, swap contracts, foreign currency exchange contracts, foreign securities utilizing international fair value pricing, broker-quoted securities, fair valued securities) |
69
Notes to financial statements
Delaware Corporate Bond Fund and Delaware Extended Duration Bond Fund
3. Investments (continued)
| Level 3 – | Significant unobservable inputs, including each Fund’s own assumptions used to determine the fair value of investments. (Examples: broker-quoted securities, fair valued securities) |
Level 3 investments are valued using significant unobservable inputs. Each Fund may also use an income-based valuation approach in which the anticipated future cash flows of the investment are discounted to calculate fair value. Discounts may also be applied due to the nature or duration of any restrictions on the disposition of the investments. Valuations may also be based upon current market prices of securities that are comparable in coupon, rating, maturity, and industry. The derived value of a Level 3 investment may not represent the value which is received upon disposition and this could impact the results of operations.
The following tables summarize the valuation of each Fund’s investments by fair value hierarchy levels as of July 31, 2016:
| | | | | | | | | | | | |
| | | Delaware Corporate Bond Fund | |
Securities | | Level 1 | | | Level 2 | | | Total | |
Corporate Debt | | $ | — | | | $ | 1,077,046,386 | | | $ | 1,077,046,386 | |
Foreign Debt | | | — | | | | 1,628,730 | | | | 1,628,730 | |
Municipal Bonds | | | — | | | | 8,463,770 | | | | 8,463,770 | |
Senior Secured Loans | | | — | | | | 13,767,941 | | | | 13,767,941 | |
Preferred Stock1 | | | 3,980,000 | | | | 21,030,723 | | | | 25,010,723 | |
U.S. Treasury Obligation | | | — | | | | 2,436,000 | | | | 2,436,000 | |
Short-Term Investments | | | — | | | | 9,769,000 | | | | 9,769,000 | |
| | | | | | | | | | | | |
Total Value of Securities | | $ | 3,980,000 | | | $ | 1,134,142,550 | | | $ | 1,138,122,550 | |
| | | | | | | | | | | | |
| | | |
Swap Contracts | | $ | — | | | $ | (109,880 | ) | | $ | (109,880 | ) |
| | | | | | | | | | | | |
| | | Delaware Extended Duration Bond Fund | |
Securities | | Level 1 | | | Level 2 | | | Total | |
Corporate Debt | | $ | — | | | $ | 623,794,403 | | | $ | 623,794,403 | |
Municipal Bonds | | | — | | | | 27,665,081 | | | | 27,665,081 | |
Preferred Stock1 | | | 1,548,000 | | | | 11,421,413 | | | | 12,969,413 | |
U.S. Treasury Obligations | | | — | | | | 4,943,322 | | | | 4,943,322 | |
Short-Term Investments | | | — | | | | 11,448,188 | | | | 11,448,188 | |
| | | | | | | | | | | | |
Total Value of Securities | | $ | 1,548,000 | | | $ | 679,272,407 | | | $ | 680,820,407 | |
| | | | | | | | | | | | |
| | | |
Futures Contracts | | $ | (124,090 | ) | | $ | — | | | $ | (124,090 | ) |
70
| 1 | Security type is valued across multiple levels. Level 1 investments represent exchange-traded investments while Level 2 investments represent investments with observable input or matrix-priced investments. The amounts attributed to Level 1 investments and Level 2 investments represent the following percentages of the total market value of these security types for each Fund: |
| | | | | | |
| |
| | | Delaware Corporate Bond Fund |
| | | Level 1 | | Level 2 | | Total |
Preferred Stock | | 15.91% | | 84.09% | | 100.00% |
| |
| | | Delaware Extended Duration Bond Fund |
| | | Level 1 | | Level 2 | | Total |
Preferred Stock | | 11.94% | | 88.06% | | 100.00% |
During the year ended July 31, 2016, there were no transfers between Level 1 investments, Level 2 investments, or Level 3 investments that had a significant impact to the Funds. Each Fund’s policy is to recognize transfers between levels at the beginning of the reporting period.
A reconciliation of Level 3 investments is presented when each Fund has a significant amount of Level 3 investments at the beginning, interim, or end of the period in relation to net assets. At July 31, 2016, there were no Level 3 investments.
4. Dividend and Distribution Information
Income and long-term capital gain distributions are determined in accordance with federal income tax regulations, which may differ from U.S. GAAP. Additionally, distributions from net gains on foreign currency transactions and net short-term gains on sales of investment securities are treated as ordinary income for federal income tax purposes. The tax character of dividends and distributions paid during the years ended July 31, 2016 and 2015 was as follows:
| | | | | | | | |
| | | Delaware Corporate
Bond Fund | |
| | | Year ended | |
| | | 7/31/16 | | | 7/31/15 | |
Ordinary income | | $ | 44,316,993 | | | $ | 52,887,174 | |
Long-term capital gains | | | — | | | | 10,919,849 | |
| | | | | | | | |
Total | | $ | 44,316,993 | | | $ | 63,807,023 | |
| | | | | | | | |
| |
| | | Delaware
Extended Duration
Bond Fund | |
| | | Year ended | |
| | | 7/31/16 | | | 7/31/15 | |
Ordinary income | | $ | 22,858,593 | | | $ | 30,338,638 | |
Long-term capital gains | | | 884,727 | | | | 25,709,194 | |
Return of capital | | | 280,126 | | | | — | |
| | | | | | | | |
Total | | $ | 24,023,446 | | | $ | 56,047,832 | |
| | | | | | | | |
71
Notes to financial statements
Delaware Corporate Bond Fund and Delaware Extended Duration Bond Fund
5. Components of Net Assets on a Tax Basis
As of July 31, 2016, the components of net assets on a tax basis were as follows:
| | | | | | | | |
| | | Delaware
Corporate
Bond Fund | | | Delaware
Extended Duration
Bond Fund | |
Shares of beneficial interest | | $ | 1,140,940,980 | | | $ | 640,359,872 | |
Undistributed ordinary income | | | 815,984 | | | | — | |
Distributions payable | | | (904,027 | ) | | | (552,424) | |
Other temporary differences | | | (11,344 | ) | | | (27,886) | |
Troubled debt litigation | | | (1,022,669 | ) | | | (387,909) | |
Capital loss carryforwards | | | (41,125,107 | ) | | | (7,602,962) | |
Qualified late year loss deferrals | | | — | | | | (44,102) | |
Unrealized appreciation of investments, foreign currencies and derivatives | | | 39,638,347 | | | | 49,817,566 | |
| | | | | | | | |
Net assets | | $ | 1,138,332,164 | | | $ | 681,562,155 | |
| | | | | | | | |
The differences between book basis and tax basis components of net assets are primarily attributable to tax deferral of losses on wash sales, tax deferral of straddle losses, mark-to-market of futures contracts, tax treatment of CDS contracts, trust preferred securities, and market discount and premium on debt instruments.
Qualified late year currency and specified losses represent losses realized from Nov. 1, 2015 through July 31, 2016, that in accordance with federal income tax regulations, the Funds have elected to defer and treat as having arisen in the following fiscal year.
For financial reporting purposes, capital accounts are adjusted to reflect the tax character of permanent book/tax differences. Reclassifications are primarily due to tax treatment of gain (loss) on foreign currency transactions, dividends and distributions, market discount and premium on debt instruments, and CDS contracts. Results of operations and net assets were not affected by these reclassifications. For the year ended July 31, 2016 , the Funds recorded the following reclassifications:
| | | | | | | | | | |
| | | Delaware
Corporate
Bond Fund | | Delaware
Extended Duration
Bond Fund |
Undistributed (distributions in excess of) net investment income | | | $ | 3,085,380 | | | | $ | 165,353 | |
Accumulated net realized loss | | | | (3,085,380 | ) | | | | (165,353 | ) |
On Dec. 22, 2010, the Regulated Investment Company Modernization Act of 2010 (Act) was enacted, which changed various technical rules governing the tax treatment of regulated investment companies. The changes were generally effective for taxable years beginning after the date of enactment. Under the Act, each Fund is permitted to carry forward capital losses incurred in taxable years beginning after the date of enactment for an unlimited period. Additionally, post-enactment capital loss carryforwards will retain their character as either short-term or long-term capital losses rather than being considered all short-term as permitted under previous regulation.
72
Losses incurred that will be carried under the Act are as follows:
| | | | | | | | |
| | | Loss carryforward character | |
| | | Short-term | | | Long-term | |
Delaware Corporate Bond Fund | | $ | 22,882,644 | | | $ | 18,242,463 | |
Delaware Extended Duration Bond Fund | | | — | | | | 7,602,962 | |
6. Capital Shares
Transactions in capital shares were as follows:
| | | | | | | | | | | | | | | | |
| | | Delaware Corporate
Bond Fund | | | Delaware Extended Duration
Bond Fund | |
| | | | |
| | | Year ended | | | Year ended | | | Year ended | | | Year ended | |
| | | 7/31/16 | | | 7/31/15 | | | 7/31/16 | | | 7/31/15 | |
Shares sold: | | | | | | | | | | | | | | | | |
Class A | | | 13,130,903 | | | | 26,035,011 | | | | 10,458,177 | | | | 17,488,346 | |
Class C | | | 3,003,061 | | | | 4,662,743 | | | | 916,079 | | | | 1,660,867 | |
Class R | | | 1,773,012 | | | | 1,595,091 | | | | 928,514 | | | | 2,295,439 | |
Institutional Class | | | 41,839,997 | | | | 99,203,167 | | | | 16,558,897 | | | | 25,635,558 | |
Class R6 | | | — | | | | — | | | | 1,268,678 | | | | — | |
| |
Shares issued upon reinvestment of dividends and distributions: | | | | | |
Class A | | | 2,149,957 | | | | 3,512,859 | | | | 1,310,984 | | | | 3,227,370 | |
Class B | | | — | | | | 673 | | | | — | | | | 325 | |
Class C | | | 758,010 | | | | 1,216,121 | | | | 142,135 | | | | 344,116 | |
Class R | | | 159,585 | | | | 227,045 | | | | 142,443 | | | | 401,068 | |
Institutional Class | | | 3,121,204 | | | | 4,014,914 | | | | 2,092,804 | | | | 4,238,471 | |
Class R6 | | | — | | | | — | | | | 606 | | | | — | |
| | | | | | | | | | | | | | | | |
| | | 65,935,729 | | | | 140,467,624 | | | | 33,819,317 | | | | 55,291,560 | |
| | | | | | | | | | | | | | | | |
| |
Shares redeemed: | | | | | |
Class A | | | (32,022,046 | ) | | | (37,484,235 | ) | | | (15,100,859 | ) | | | (22,527,480 | ) |
Class B | | | — | | | | (113,170 | ) | | | — | | | | (44,229 | ) |
Class C | | | (7,933,176 | ) | | | (7,053,497 | ) | | | (1,378,607 | ) | | | (1,125,630 | ) |
Class R | | | (1,880,417 | ) | | | (2,739,467 | ) | | | (1,449,098 | ) | | | (3,563,558 | ) |
Institutional Class | | | (88,409,759 | ) | | | (38,397,802 | ) | | | (18,228,734 | ) | | | (20,537,978 | ) |
Class R6 | | | — | | | | — | | | | (4,122 | ) | | | — | |
| | | | | | | | | | | | | | | | |
| | | (130,245,398 | ) | | | (85,788,171 | ) | | | (36,161,420 | ) | | | (47,798,875 | ) |
| | | | | | | | | | | | | | | | |
Net increase (decrease) | | | (64,309,669 | ) | | | 54,679,453 | | | | (2,342,103 | ) | | | 7,492,685 | |
| | | | | | | | | | | | | | | | |
73
Notes to financial statements
Delaware Corporate Bond Fund and Delaware Extended Duration Bond Fund
6. Capital Shares (continued)
For the year ended July 31, 2015, the following shares and values were converted from Class B to Class A. The amounts are included in Class B redemptions and Class A subscriptions in the tables above, and the “Statements of changes in net assets.”
| | | | | | | | | | | | |
| | | Class B
Shares | | | Year ended 7/31/15 Class A Shares | | | Value | |
Delaware Corporate Bond Fund | | | 19,995 | | | | 19,967 | | | | $120,802 | |
Delaware Extended Duration Bond Fund | | | 9,053 | | | | 9,042 | | | | 61,397 | |
Certain shareholders may exchange shares of one class for another class in the same Fund. For the years ended July 31, 2016 and 2015, the Funds had the following exchange transactions. These exchange transactions are included as subscriptions and redemptions in the tables on the previous page, and the “Statements of changes in net assets.”
| | | | | | | | | | | | | | | | | | | | | | | | | | | | |
| | | Year ended 7/31/16 | |
| | | Exchange Redemptions | | | Exchange Subscriptions | |
| | | Class A
Shares | | | Class C
Shares | | | Institutional
Class
Shares | | | Value | | | Class A
Shares | | | Institutional
Class
Shares | | | Value | |
Delaware Corporate Bond Fund | | | 2,576,461 | | | | 16,485 | | | | — | | | $ | 15,070,249 | | | | 3,327 | | | | 2,594,863 | | | $ | 15,070,249 | |
Delaware Extended Duration Bond Fund | | | 19,810 | | | | — | | | | 2,721 | | | | 146,180 | | | | 2,718 | | | | 19,879 | | | | 146,180 | |
| |
| | | Year ended 7/31/15 | |
| | | Exchange Redemptions | | | Exchange Subscriptions | |
| | | Class A
Shares | | | Class C
Shares | | | Institutional
Class
Shares | | | Value | | | Class A
Shares | | | Institutional
Class
Shares | | | Value | |
Delaware Corporate Bond Fund | | | 0.29 | | | | 22,550 | | | | 87,791 | | | $ | 661,383 | | | | 87,791 | | | | 22,581 | | | $ | 661,383 | |
Delaware Extended Duration Bond Fund | | | 2,769 | | | | — | | | | 4,348 | | | | 46,534 | | | | 4,348 | | | | 2,781 | | | | 46,534 | |
7. Line of Credit
Each Fund, along with certain other funds in the Delaware Investments® Family of Funds (Participants), was a participant in a $275,000,000 revolving line of credit intended to be used for temporary or emergency purposes as an additional source of liquidity to fund redemptions of investor shares. Under
74
the agreement, the Participants were charged an annual commitment fee of 0.08%, which was allocated across the Participants on the basis of each Participant’s allocation of the entire facility. The Participants were permitted to borrow up to a maximum of one third of their net assets under the agreement. Each Participant was individually, and not jointly, liable for its particular advances, if any, under the line of credit. The line of credit under the agreement expired on Nov. 9, 2015.
On Nov. 9, 2015, the Fund, along with the other Participants, entered into an amendment to the agreement for a $155,000,000 revolving line of credit. The line of credit is to be used as described above and operates in substantially the same manner as the original agreement, with the exception of the annual commitment fee. Under the amendment to the agreement, the Participants are charged an annual commitment fee of 0.10%, which is allocated across the Participants on the basis of each Participant’s allocation of the entire facility. The line of credit available under the agreement expires on Nov. 7, 2016.
The Funds had no amounts outstanding as of July 31, 2016, or at any time during the year then ended.
8. Derivatives
U.S. GAAP requires disclosures that enable investors to understand: (1) how and why an entity uses derivatives; (2) how they are accounted for; and (3) how they affect an entity’s results of operations and financial position.
Foreign Currency Exchange Contracts – Each Fund may enter into foreign currency exchange contracts and foreign cross currency exchange contracts as a way of managing foreign exchange rate risk. Each Fund may enter into these contracts to fix the U.S. dollar value of a security that it has agreed to buy or sell for the period between the date the trade was entered into and the date the security is delivered and paid for. Each Fund may also use these contracts to hedge the U.S. dollar value of securities it already owns that are denominated in foreign currencies. In addition, each Fund may enter into these contracts to facilitate or expedite the settlement of portfolio transactions. The change in value is recorded as an unrealized gain or loss. When the contract is closed, a realized gain or loss is recorded equal to the difference between the value of the contract at the time it was opened and the value at the time it was closed.
The use of foreign currency exchange contracts and foreign cross currency exchange contracts does not eliminate fluctuations in the underlying prices of the securities, but does establish a rate of exchange that can be achieved in the future. Although foreign currency exchange contracts and foreign cross currency exchange contracts limit the risk of loss due to an unfavorable change in the value of the hedged currency, they also limit any potential gain that might result should the value of the currency change favorably. In addition, each Fund could be exposed to risks if the counterparties to the contracts are unable to meet the terms of their contracts. Each Fund’s maximum risk of loss from counterparty credit risk is the value of its currency exchanged with the counterparty. The risk is generally mitigated by having a netting arrangement between each Fund and the counterparty and by the posting of collateral by the counterparty to the Funds to cover the Funds’ exposure to the counterparty. No foreign currency exchange contracts were outstanding at July 31, 2016.
During the year ended July 31, 2016, Delaware Extended Duration Bond Fund used foreign currency exchange contracts to facilitate or expedite the settlement of portfolio transactions.
75
Notes to financial statements
Delaware Corporate Bond Fund and Delaware Extended Duration Bond Fund
8. Derivatives (continued)
Futures Contracts – A futures contract is an agreement in which the writer (or seller) of the contract agrees to deliver to the buyer an amount of cash or securities equal to a specific dollar amount times the difference between the value of a specific security or index at the close of the last trading day of the contract and the price at which the agreement is made. Each Fund may use futures in the normal course of pursuing its investment objective. Each Fund may invest in futures contracts to hedge its existing portfolio securities against fluctuations in value caused by changes in interest rates or market conditions. Upon entering into a futures contract, each Fund deposits cash or pledges U.S. government securities to a broker, equal to the minimum “initial margin” requirements of the exchange on which the contract is traded. Subsequent payments are received from the broker or paid to the broker each day, based on the daily fluctuation in the market value of the contract. These receipts or payments are known as “variation margin” and are recorded daily by the Funds as unrealized gains or losses until the contracts are closed. When the contracts are closed, the Funds record a realized gain or loss equal to the difference between the value of the contract at the time it was opened and the value at the time it was closed. Risks of entering into futures contracts include potential imperfect correlation between the futures contracts and the underlying securities and the possibility of an illiquid secondary market for these instruments. When investing in futures, there is reduced counterparty credit risk to a Fund because futures are exchange-traded and the exchange’s clearinghouse, as counterparty to all exchange-traded futures, guarantees against default. No futures contracts were outstanding at July 31, 2016 for Delaware Corporate Bond Fund.
During the year ended July 31, 2016, the Funds used futures contracts to hedge the Funds’ existing portfolio securities against fluctuations in value caused by changes in interest rates or market conditions.
Swap Contracts – Each Fund may enter into CDS contracts in the normal course of pursuing its investment objective. Each Fund may enter into CDS contracts in order to hedge against a credit event, to enhance total return or to gain exposure to certain securities or markets. The Funds will not be permitted to enter into any swap transactions unless, at the time of entering into such transactions, the unsecured long-term debt of the actual counterparty, combined with any credit enhancements, is rated at least BBB- by Standard & Poor’s Financial Services LLC. (S&P) or Baa3 by Moody’s Investors Service, Inc. (Moody’s) or is determined to be of equivalent credit quality by DMC.
Credit Default Swaps. A CDS contract is a risk-transfer instrument through which one party (purchaser of protection) transfers to another party (seller of protection) the financial risk of a credit event (as defined in the CDS agreement), as it relates to a particular reference security or basket of securities (such as an index). In exchange for the protection offered by the seller of protection, the purchaser of protection agrees to pay the seller of protection a periodic amount at a stated rate that is applied to the notional amount of the CDS contract. In addition, an upfront payment may be made or received by the Funds in connection with an unwinding or assignment of a CDS contract. Upon the occurrence of a credit event, the seller of protection would pay the par (or other agreed-upon) value of the reference security (or basket of securities) to the counterparty. Credit events generally include, among others, bankruptcy, failure to pay, and obligation default.
76
During the year ended July 31, 2016, the Funds entered into CDS contracts as a purchaser of protection. Periodic payments (receipts) on such contracts are accrued daily and recorded as unrealized losses (gains) on swap contracts. Upon payment (receipt), such amounts are recorded as realized losses (gains) on swap contracts. Upfront payments made or received in connection with CDS contracts are amortized over the expected life of the CDS contracts as unrealized losses (gains) on swap contracts. The change in value of CDS contracts is recorded daily as unrealized appreciation or depreciation. A realized gain or loss is recorded upon a credit event (as defined in the CDS agreement) or the maturity or termination of the agreement. Initial margin and variation margin are posted to central counterparties for CDS basket trades, as determined by the applicable central counterparty. During the year ended July 31, 2016, the Funds did not enter into any CDS contracts as a seller of protection.
CDS contracts may involve greater risks than if the Funds had invested in the reference obligation directly. CDS contracts are subject to general market risk, liquidity risk, counterparty risk, and credit risk. The Funds’ maximum risk of loss from counterparty credit risk, either as the seller of protection or the buyer of protection, is the fair value of the contract. This risk is mitigated by (1) for bilateral swap contracts, having a netting arrangement between the Funds and the counterparty and by the posting of collateral by the counterparty to the Funds to cover the Funds’ exposure to the counterparty, and (2) for cleared swaps, trading these instruments through a central counterparty.
During the year ended July 31, 2016, the Funds used CDS contracts to hedge against credit events.
Swaps Generally. The value of open swaps may differ from that which would be realized in the event each Fund terminated its position in the contract on a given day. Risks of entering into these contracts include the potential inability of the counterparty to meet the terms of the contracts. This type of risk is generally limited to the amount of favorable movement in the value of the underlying security, instrument, or basket of instruments, if any, at the day of default. Risks also arise from potential losses from adverse market movements and such losses could exceed the unrealized amounts shown on the “Schedules of investments.” No swap contracts were outstanding at July 31, 2016 for Delaware Extended Duration Bond Fund.
Fair values of derivative instruments as of July 31, 2016 were as follows:
| | |
| | | Delaware Corporate Bond Fund |
Statements of Assets and Liabilities Location | | Liability Derivatives
Fair Value
Credit Contracts |
Unrealized depreciation on swap contracts | | $(109,880) |
| | |
| | | Delaware Extended Duration Bond Fund |
Statements of Assets and Liabilities Location | | Liability Derivatives
Fair Value
Interest Rate Contracts |
| Variation margin due to broker on futures contracts* | | $(124,090) |
*Includes cumulative appreciation (depreciation) of futures contracts from the date the contracts are opened through July 31, 2016. Only current day variation margin is reported on the Funds’ “Statements of assets and liabilities.”
77
Notes to financial statements
Delaware Corporate Bond Fund and Delaware Extended Duration Bond Fund
8. Derivatives (continued)
The effect of derivative instruments on the “Statements of operations” for the year ended July 31, 2016 was as follows:
| | | | | | | | | | | | |
| | | Delaware Corporate Bond Fund | |
| | | Net Realized Gain (Loss) on: | |
| | | Futures Contracts | | | Swap
Contracts | | | Total | |
Interest rate contracts | | | $(1,091,783) | | | | $ — | | | | $(1,091,783) | |
Credit contracts | | | | | | | (39,193) | | | | (39,193) | |
| | | | | | | | | | | | |
Total | | | $(1,091,783) | | | | $(39,193) | | | | $(1,130,976) | |
| | | | | | | | | | | | |
| | | | | | | | | | | | |
| | | Delaware Corporate Bond Fund | |
| | | Net Change in Unrealized Appreciation (Depreciation) of: | |
| | | Futures Contracts | | | Swap
Contracts | | | Total | |
Interest rate contracts | | | $487,426 | | | | $ — | | | | $ 487,426 | |
Credit contracts | | | — | | | | (116,763) | | | | (116,763) | |
| | | | | | | | | | | | |
Total | | | $487,426 | | | | $(116,763) | | | | $ 370,663 | |
| | | | | | | | | | | | |
| | | | | | | | | | | | | | | | |
| | | Delaware Extended Duration Bond Fund | |
| | | Net Realized Gain (Loss) on: | |
| | | Foreign
Currency
Exchange
Contracts | | | Futures
Contracts | | | Swap
Contracts | | | Total | |
Forward currency exchange contracts | | | $12,537 | | | | $ — | | | | $ — | | | | $12,537 | |
Interest rate contracts | | | — | | | | 1,961,227 | | | | — | | | | 1,961,227 | |
Credit contracts | | | — | | | | — | | | | 218,389 | | | | 218,389 | |
| | | | | | | | | | | | | | | | |
Total | | | $12,537 | | | | $1,961,227 | | | | $218,389 | | | | $2,192,153 | |
| | | | | | | | | | | | | | | | |
| | | | | | | | | | | | |
| | | Delaware Extended Duration Bond Fund | |
| | | Net Change in Unrealized Appreciation (Depreciation) of: | |
| | | Futures Contracts | | | Swap
Contracts | | | Total | |
Interest rate contracts | | | $(1,206,304) | | | | $ — | | | | $(1,206,304) | |
Credit contracts | | | — | | | | 19,573 | | | | 19,573 | |
| | | | | | | | | | | | |
Total | | | $(1,206,304) | | | | $19,573 | | | | $(1,186,731) | |
| | | | | | | | | | | | |
78
Derivatives generally. The table below summarizes the average balance of derivative holdings by the Funds during the year ended July 31, 2016:
| | | | | | | | | | | | | | | | |
| | | | | | Long Derivative Volume | |
| | | | | | Delaware Corporate Bond Fund | | | | | | Delaware Extended Duration Bond Fund | |
Futures contracts (average notional value) | | | USD | | | | 6,255,984 | | | | USD | | | | 60,074,570 | |
CDS contracts (average notional value)* | | | EUR | | | | — | | | | EUR | | | | 3,176,275 | |
| | | USD | | | | 3,149,801 | | | | USD | | | | — | |
| | | | | | Short Derivative Volume | |
| | | | | | Delaware Corporate Bond Fund | | | | | | Delaware Extended Duration Bond Fund | |
Futures contracts (average notional value) | | | USD | | | | 1,836,559 | | | | USD | | | | 3,135,742 | |
*Long represents buying protection and short represents selling protection.
9. Offsetting
In December 2011, the Financial Accounting Standards Board (FASB) issued guidance that expanded disclosure requirements on the offsetting of certain assets and liabilities. The disclosures are required for investments and derivative financial instruments subject to master netting or similar agreements which are eligible for offset on the “Statements of assets and liabilities” and require an entity to disclose both gross and net information about such investments and transactions in the financial statements. In January 2013, the FASB issued guidance that clarified which investments and transactions are subject to the offsetting disclosure requirements. The scope of the disclosure requirements for offsetting is limited to derivative instruments, repurchase agreements and reverse repurchase agreements, and securities borrowing.
In order to better define its contractual rights and to secure rights that will help each Fund mitigate its counterparty risk, each Fund entered into an International Swaps and Derivatives Association, Inc. Master Agreement (ISDA Master Agreement) or a similar agreement with certain of its derivative contract counterparties. An ISDA Master Agreement is a bilateral agreement between the Funds and a counterparty that governs certain over-the-counter (OTC) derivatives and foreign exchange contracts and typically contains, among other things, collateral posting items and netting provisions in the event of a default and/or termination event. Under an ISDA Master Agreement, each Fund may, under certain circumstances, offset with the counterparty certain derivative financial instruments’ payables and/or receivables with collateral held and/or posted and create one single net payment. The provisions of the ISDA Master Agreement typically permit a single net payment in the event of default (close-out), including the bankruptcy or insolvency of the counterparty. However, bankruptcy or insolvency laws of a particular jurisdiction may impose restrictions on or prohibitions against the right of offset in bankruptcy, insolvency or other events.
For financial reporting purposes, each Fund does not offset derivative assets and derivative liabilities that are subject to netting arrangements on the “Statements of assets and liabilities.”
79
Notes to financial statements
Delaware Corporate Bond Fund and Delaware Extended Duration Bond Fund
9. Offsetting (continued)
At July 31, 2016, the Funds had the following assets and liabilities subject to offsetting provisions:
Offsetting of Financial Assets and Liabilities and Derivative Assets and Liabilities
| | | | | | |
| | | Delaware Corporate Bond Fund |
Counterparty | | Gross Value of Derivative Asset | | Gross Value of
Derivative Liability | | Net Position |
Morgan Stanley Capital | | $— | | $(109,880) | | $(109,880) |
| | | | | | | | | | | | |
| | | Delaware Corporate Bond Fund |
Counterparty | | Net Position | | Fair Value of
Non-Cash
Collateral
Received | | Cash
Collateral
Received | | Fair Value of
Non-Cash
Collateral
Pledged | | Cash
Collateral
Pledged | | Net
Exposure(a) |
Morgan Stanley Capital | | $(109,880) | | $— | | $— | | $— | | $— | | $(109,880) |
Master Repurchase Agreements
| | | | | | | | | | | | | | | | | | | | |
| | | Delaware Corporate Bond Fund | |
Counterparty | | Repurchase Agreements | | | Fair Value of Non-Cash
Collateral Received | | | Cash Collateral
Received | | | Net Collateral
Received | | | Net Exposure(a) | |
Bank of America
Merrill Lynch | | | $2,771,311 | | | | $(2,771,311) | | | | $— | | | | $(2,771,311) | | | | $— | |
Bank of Montreal | | | 4,618,851 | | | | (4,618,851) | | | | — | | | | (4,618,851) | | | | — | |
BNP Paribas | | | 2,378,838 | | | | (2,378,838) | | | | — | | | | (2,378,838) | | | | — | |
Total | | | $9,769,000 | | | | $(9,769,000) | | | | $— | | | | $(9,769,000) | | | | $— | |
(a)Net exposure represents the receivable (payable) that would be due from (to) the counterparty in the event of default.
10. Securities Lending
Each Fund, along with other funds in the Delaware Investments® Family of Funds, may lend its securities pursuant to a security lending agreement (Lending Agreement) with The Bank of New York Mellon (BNY Mellon). At the time a security is loaned, the borrower must post collateral equal to the required percentage of the market value of the loaned security, including any accrued interest. The required percentage is: (1) 102% with respect to U.S. securities and foreign securities that are denominated and payable in U.S. dollars; and (2) 105% with respect to foreign securities. With respect to each loan, if on any business day the aggregate market value of securities collateral plus cash collateral held is less than the aggregate market value of the securities that are the subject of such loan, the borrower will be notified to provide additional collateral by the end of the following business day, which, together with the collateral already held, will be not less than the applicable initial collateral requirements for such security loan. If the aggregate market value of securities collateral and cash collateral held with respect to a security loan exceeds the applicable initial collateral requirement, upon the request of the borrower, BNY Mellon must return enough collateral to the borrower by the end of the following business day to reduce the value of the remaining collateral to the applicable initial collateral requirement for such security loan. As a result of the foregoing, the value of the collateral held with respect to a loaned security on any particular day may be more or less than the value of the security on loan.
80
Prior to Dec. 29, 2015, cash collateral received was generally invested in the Delaware Investments Collateral Fund No. 1 (Collective Trust), a pooled account established by BNY Mellon for the use of funds managed by DMC that participate in BNY Mellon’s securities lending program. The Collective Trust sought to maintain a NAV per unit of $1.00.
On Dec. 29, 2015, the assets in the Collective Trust were transferred to a series of individual separate accounts, each corresponding to a Fund. The investment guidelines permit each separate account to hold certain securities that would be considered eligible securities for a money market fund. Cash collateral received is generally invested in government securities; certain obligations issued by government sponsored enterprises; repurchase agreements collateralized by U.S. Treasury securities; obligations issued by the central government of any Organization for Economic Cooperation and Development (OECD) country or its agencies, instrumentalities, or establishments; obligations of supranational organizations; commercial paper, notes, bonds, and other debt obligations; certificates of deposit, time deposits, and other bank obligations; and asset-backed securities.
In the event of default or bankruptcy by the lending agent, realization and/or retention of the collateral may be subject to legal proceedings. In the event the borrower fails to return loaned securities and the collateral received is insufficient to cover the value of the loaned securities and provided such collateral shortfall is not the result of investment losses, the lending agent has agreed to pay the amount of the shortfall to the Funds or, at the discretion of the lending agent, replace the loaned securities. The Funds continue to record dividends or interest, as applicable, on the securities loaned and are subject to changes in value of the securities loaned that may occur during the term of the loan. The Funds have the right under the Lending Agreement to recover the securities from the borrower on demand. With respect to security loans collateralized by non-cash collateral, the Funds receive loan premiums paid by the borrower. With respect to security loans collateralized by cash collateral, the earnings from the collateral investments are shared among the Funds, the security lending agent, and the borrower. The Funds record security lending income net of allocations to the security lending agent and the borrower.
Each Fund may incur investment losses as a result of investing securities lending collateral. This could occur if an investment in the collateral investment account defaulted or became impaired. Under those circumstances, the value of a Fund’s cash collateral account may be less than the amount a Fund would be required to return to the borrowers of the securities and that Fund would be required to make up for this shortfall.
During the year ended July 31, 2016, the Funds had no securities on loan.
11. Credit and Market Risk
Some countries in which the Funds may invest require governmental approval for the repatriation of investment income, capital, or the proceeds of sales of securities by foreign investors. In addition, if there is deterioration in a country’s balance of payments or for other reasons, a country may impose temporary restrictions on foreign capital remittances abroad.
81
Notes to financial statements
Delaware Corporate Bond Fund and Delaware Extended Duration Bond Fund
11. Credit and Market Risk (continued)
The securities exchanges of certain foreign markets are substantially smaller, less liquid, and more volatile than the major securities markets in the United States. Consequently, acquisition and disposition of securities by the Funds may be inhibited. In addition, a significant portion of the aggregate market value of securities listed on the major securities exchanges in emerging markets is held by a smaller number of investors. This may limit the number of shares available for acquisition or disposition by the Funds.
Each Fund invests in high yield fixed income securities, which are securities rated lower than BBB- by S&P and lower than Baa3 by Moody’s, or similarly rated by another nationally recognized statistical rating organization. Investments in these higher yielding securities are generally accompanied by a greater degree of credit risk than higher rated securities. Additionally, lower rated securities may be more susceptible to adverse economic and competitive industry conditions than investment grade securities.
Each Fund invests in bank loans and other securities that may subject it to direct indebtedness risk, the risk that the Funds will not receive payment of principal, interest, and other amounts due in connection with these investments and will depend primarily on the financial condition of the borrower. Loans that are fully secured offer the Funds more protection than unsecured loans in the event of nonpayment of scheduled interest or principal, although there is no assurance that the liquidation of collateral from a secured loan would satisfy the corporate borrower’s obligation, or that the collateral can be liquidated. Some loans or claims may be in default at the time of purchase. Certain of the loans and the other direct indebtedness acquired by the Funds may involve revolving credit facilities or other standby financing commitments that obligate the Funds to pay additional cash on a certain date or on demand. These commitments may require each Fund to increase its investment in a company at a time when the Funds might not otherwise decide to do so (including at a time when the company’s financial condition makes it unlikely that such amounts will be repaid). To the extent that each Fund is committed to advance additional funds, it will at all times hold and maintain cash or other high-grade debt obligations in an amount sufficient to meet such commitments. As the Funds may be required to rely upon another lending institution to collect and pass on to the Funds amounts payable with respect to the loan and to enforce the Funds’ rights under the loan and other direct indebtedness, an insolvency, bankruptcy, or reorganization of the lending institution may delay or prevent the Funds from receiving such amounts. The highly leveraged nature of many loans may make them especially vulnerable to adverse changes in economic or market conditions. Investments in such loans and other direct indebtedness may involve additional risk to the Funds.
Each Fund invests in certain obligations that may have liquidity protection designed to ensure that the receipt of payments due on the underlying security is timely. Such protection may be provided through guarantees, insurance policies, or letters of credit obtained by the issuer or sponsor through third parties, through various means of structuring the transaction, or through a combination of such approaches. The Funds will not pay any additional fees for such credit support, although the existence of credit support may increase the price of a security.
Each Fund may invest up to 15% of its net assets in illiquid securities, which may include securities with contractual restrictions on resale, securities exempt from registration under Rule 144A, promulgated under the Securities Act of 1933, as amended, and other securities which may not be readily marketable.
82
The relative illiquidity of these securities may impair each Fund from disposing of them in a timely manner and at a fair price when it is necessary or desirable to do so. While maintaining oversight, the Board has delegated to DMC, the day-to-day functions of determining whether individual securities are liquid for purposes of the Funds’ limitation on investments in illiquid securities. Securities eligible for resale pursuant to Rule 144A, which are determined to be liquid, are not subject to the Funds’ 15% limit on investments in illiquid securities. Rule 144A and illiquid securities have been identified on the “Schedules of investments.” When monitoring compliance with the Funds’ illiquid limit, certain holdings that are common to multiple clients of the investment manager may be aggregated and considered illiquid in the aggregate solely for monitoring purposes. For purposes of determining illiquidity for financial reporting purposes, only the holdings of these Funds will be considered.
12. Contractual Obligations
Each Fund enters into contracts in the normal course of business that contain a variety of indemnifications. The Funds’ maximum exposure under these arrangements is unknown. However, each Fund has not had prior claims or losses pursuant to these contracts. Management has reviewed the Funds’ existing contracts and expects the risk of loss to be remote.
13. General Motors Corporation Term Loan Litigation
Delaware Corporate Bond Fund and Delaware Extended Duration Bond Fund received notice of a litigation proceeding related to a General Motors Corporation (G.M.) term loan participation previously held by the Funds in 2009. We believe the matter subject to the litigation notice will likely lead to a recovery from the Funds of certain amounts received by the Funds because a U.S. Court of Appeals has ruled that the Funds and similarly situated investors were unsecured creditors rather than secured lenders of G.M. as a result of an erroneous Uniform Commercial Code filing made by a third party. The Funds received the full principal on the loans in 2009 after the G.M. bankruptcy. However, based upon the court ruling the estate is seeking to recover such amounts arguing that, as unsecured creditors, the Funds should not have received payment in full. Based upon currently available information related to the litigation and the Funds’ potential exposure, the Funds recorded a liability and an asset based on the expected recoveries to unsecured creditors as of July 31, 2016 that resulted in a decrease in the Funds’ NAVs to reflect this likely recovery as follows:
| | | | |
| | | Delaware
Corporate
Bond Fund | | Delaware
Extended Duration
Bond Fund |
Asset | | $ 438,287 | | $166,247 |
Liability | | 1,460,956 | | 554,156 |
14. Subsequent Events
Management has determined that no material events or transactions occurred subsequent to July 31, 2016 that would require recognition or disclosure in the Funds’ financial statements.
83
Report of independent registered
public accounting firm
To the Board of Trustees of Delaware Group® Income Funds
and the Shareholders of Delaware Corporate Bond Fund and Delaware Extended Duration Bond Fund:
In our opinion, the accompanying statements of assets and liabilities, including the schedules of investments, and the related statements of operations and of changes in net assets and the financial highlights present fairly, in all material respects, the financial position of Delaware Corporate Bond Fund and Delaware Extended Duration Bond Fund (two of the series constituting Delaware Group® Income Funds, hereinafter referred to as the “Funds”) at July 31, 2016, the results of each of their operations for the year then ended, the changes in each of their net assets for each of the two years in the period then ended and the financial highlights for the periods presented, in conformity with accounting principles generally accepted in the United States of America. These financial statements and financial highlights (hereafter referred to as “financial statements”) are the responsibility of the Funds’ management. Our responsibility is to express an opinion on these financial statements based on our audits. We conducted our audits of these financial statements in accordance with the standards of the Public Company Accounting Oversight Board (United States). Those standards require that we plan and perform the audit to obtain reasonable assurance about whether the financial statements are free of material misstatement. An audit includes examining, on a test basis, evidence supporting the amounts and disclosures in the financial statements, assessing the accounting principles used and significant estimates made by management, and evaluating the overall financial statement presentation. We believe that our audits, which included confirmation of securities at July 31, 2016 by correspondence with the custodian and brokers and the application of alternative auditing procedures where confirmations of securities purchased had not been received, provide a reasonable basis for our opinion.
PricewaterhouseCoopers LLP
Philadelphia, Pennsylvania
September 19, 2016
84
Other Fund information (Unaudited)
Delaware Corporate Bond Fund and Delaware Extended Duration Bond Fund
Tax Information
The information set forth below is for each Fund’s fiscal year as required by federal income tax laws. Shareholders, however, must report distributions on a calendar year basis for income tax purposes, which may include distributions for portions of two fiscal years of the Funds. Accordingly, the information needed by shareholders for income tax purposes will be sent to them in January of each year. Please consult your tax advisor for proper treatment of this information.
All disclosures are based on financial information available as of the date of this annual report and, accordingly are subject to change. For any and all items requiring reporting, it is the intention of the Funds to report the maximum amount permitted under the Internal Revenue Code and the regulations thereunder.
For the fiscal year ended July 31, 2016, each Fund reports distributions paid during the year as follows:
| | | | | | | | | | |
| | | (A)
Long-Term
Capital Gains
Distributions
(Tax Basis) | | (B)
Ordinary Income
Distributions*
(Tax Basis) | | (C)
Return of
Capital
(Tax Basis) | | Total
Distributions
(Tax Basis) | | (D)
Qualifying
Dividends1 |
Delaware Corporate Bond Fund | | 0.00% | | 100.00% | | 0.00% | | 100.00% | | 2.07% |
Delaware Extended Duration Bond Fund | | 3.68% | | 95.15% | | 1.17% | | 100.00% | | 2.19% |
(A), (B) and (C) are based on a percentage of each Fund’s total distributions.
(D) is based on a percentage of each Fund’s ordinary income distributions
1 Qualifying dividends represent dividends which qualify for the corporate dividends received deduction.
*For the fiscal year ended July 31, 2016, certain dividends paid by the Funds may be subject to a maximum tax rate of 20%. The percentage of dividends paid by the Funds from ordinary income reported as qualified income are reported in the following table. Complete information will be computed and reported in conjunction with your 2016 Form 1099-DIV.
| | | | |
| | | Delaware
Corporate
Bond Fund | | Delaware
Extended Duration
Bond Fund |
| | 2.07% | | 2.19% |
For the fiscal year ended July 31, 2016, certain interest income paid by Delaware Corporate Bond Fund determined to be Qualified Interest Income and Short-Term Capital Gains may be subject to relief from U.S. withholding for foreign shareholders, as provided by the American Jobs Creation Act of 2004, and by the Tax Relief Unemployment Insurance Reauthorization and Job Creations Act of 2010, and as extended by the American Taxpayer Relief Act of 2012. Delaware Extended Duration Bond Fund did not have any foreign shareholders for the fiscal year ended July 31, 2016. For the fiscal year ended July 31, 2016, Delaware Corporate Bond Fund has reported maximum distributions of Qualified Interest Income and Short-Term Capital Gains as follows:
| | | | |
Qualified Interest Income | | $ | 42,391,666 | |
Short-Term Capital Gains | | | 137,773 | |
85
Board of trustees / directors and officers addendum
Delaware Investments® Family of Funds
A mutual fund is governed by a Board of Trustees/Directors (“Trustees”), which has oversight responsibility for the management of a fund’s business affairs. Trustees establish procedures and oversee and review the performance of the investment manager, the distributor, and others who perform services for the fund. The independent fund trustees, in particular, are advocates
| | | | |
Name, Address, and Birth Date | | Position(s) Held with Fund(s) | | Length of Time Served |
Interested Trustee | | | | |
Shawn K. Lytle1, 3 | | President, | | Trustee since |
2005 Market Street | | Chief Executive Officer, | | September 2015 |
Philadelphia, PA 19103 | | and Trustee | | |
February 1970 | | | | President and |
| | | | Chief Executive Officer |
| | | | since August 2015 |
| | | | |
| | | | |
Independent Trustees | | | | |
Thomas L. Bennett | | Chairman and Trustee | | Trustee since |
2005 Market Street | | | | March 2005 |
Philadelphia, PA 19103 | | | | |
October 1947 | | | | Chairman since |
| | | | | March 2015 |
Ann D. Borowiec | | Trustee | | Since March 2015 |
2005 Market Street | | | | |
Philadelphia, PA 19103 | | | | |
November 1958 | | | | |
| | | | |
| | | | |
| | | | | |
Joseph W. Chow | | Trustee | | Since January 2013 |
2005 Market Street | | | | |
Philadelphia, PA 19103 | | | | |
January 1953 | | | | |
| | | | |
| | | | |
| | | | | |
| 1 | Shawn K. Lytle is considered to be an “Interested Trustee” because he is an executive officer of the Fund’s (s’) investment advisor. |
86
for shareholder interests. Each trustee has served in that capacity since he or she was elected to or appointed to the Board of Trustees, and will continue to serve until his or her retirement or the election of a new trustee in his or her place. The following is a list of the Trustees and Officers with certain background and related information.
| | | | |
| | Number of Portfolios in | | |
| Principal Occupation(s) | | Fund Complex Overseen | | Other Directorships |
| During the Past Five Years | | by Trustee or Officer | | Held by Trustee or Officer |
| | |
| | | | |
Shawn K. Lytle has served as | | 62 | | Trustee — UBS |
President of | | | | Relationship Funds, |
Delaware Investments2 | | | | SMA Relationship |
since June 2015 and was the | | | | Trust, and UBS Funds |
Regional Head of Americas for | | | | (May 2010–April 2015) |
UBS Global Asset | | | | |
Management from | | | | |
2010 through 2015. | | | | |
| | |
| | | | |
Private Investor | | 62 | | Director — |
(March 2004–Present) | | | | Bryn Mawr Bank Corp. (BMTC) |
| | | | (2007–2011) |
| | | | |
| | | | | |
Chief Executive Officer | | 62 | | None |
Private Wealth Management | | | | |
(2011–2013) and | | | | |
Market Manager, | | | | |
New Jersey Private | | | | |
Bank (2005–2011) — | | | | |
J.P. Morgan Chase & Co. | | | | |
Executive Vice President | | 62 | | Director and Audit Committee |
(Emerging Economies | | | | Member — Hercules |
Strategies, Risks, and | | | | Technology Growth |
Corporate Administration) | | | | Capital, Inc. |
State Street Corporation | | | | (2004–2014) |
(July 2004–March 2011) | | | | |
| 2 | Delaware Investments is the marketing name for Delaware Management Holdings, Inc. and its subsidiaries, including the Fund’s (s’) investment advisor, principal underwriter, and its transfer agent. |
87
Board of trustees / directors and officers addendum
Delaware Investments® Family of Funds
| | | | |
| Name, Address, | | Position(s) | | Length of |
| and Birth Date | | Held with Fund(s) | | Time Served |
Independent Trustees (continued) |
John A. Fry | | Trustee | | Since January 2001 |
2005 Market Street | | | | |
Philadelphia, PA 19103 | | | | |
May 1960 | | | | |
| | | | |
| | | | |
| | | | |
| | | | | |
Lucinda S. Landreth | | Trustee | | Since March 2005 |
2005 Market Street | | | | |
Philadelphia, PA 19103 | | | | |
June 1947 | | | | |
| | | | | |
Frances A. Sevilla-Sacasa | | Trustee | | Since September 2011 |
2005 Market Street | | | | |
Philadelphia, PA 19103 | | | | |
January 1956 | | | | |
| | | | |
| | | | |
| | | | |
| | | | |
| | | | |
| | | | |
| | | | |
| | | | | |
88
| | | | |
| | Number of Portfolios in | | |
| Principal Occupation(s) | | Fund Complex Overseen | | Other Directorships |
| During the Past Five Years | | by Trustee or Officer | | Held by Trustee or Officer |
| | |
| | | | |
President — | | 62 | | Director, Audit Committee, |
Drexel University | | | | and Governance Committee |
(August 2010–Present) | | | | Member — Community |
| | | | Health Systems |
President — | | | | |
Franklin & Marshall College | | | | Director — Drexel |
(July 2002–July 2010) | | | | Morgan & Co. |
Private Investor | | 62 | | None |
(2004–Present) | | | | |
| | | | |
| | | | | |
Chief Executive Officer — | | 62 | | Trust Manager and |
Banco Itaú | | | | Audit Committee |
International | | | | Member — Camden |
(April 2012–Present) | | | | Property Trust |
| | | | |
Executive Advisor to Dean | | | | |
(August 2011–March 2012) and Interim Dean | | | | |
(January 2011–July 2011) — | | | | |
University of Miami School of | | | | |
Business Administration | | | | |
| | | | |
President — U.S. Trust, | | | | |
Bank of America Private | | | | |
Wealth Management | | | | |
(Private Banking) | | | | |
(July 2007–December 2008) | | | | |
89
Board of trustees / directors and officers addendum
Delaware Investments® Family of Funds
| | | | |
| Name, Address, | | Position(s) | | Length of |
| and Birth Date | | Held with Fund(s) | | Time Served |
Independent Trustees (continued) | | |
Thomas K. Whitford | | Trustee | | Since January 2013 |
2005 Market Street | | | | |
Philadelphia, PA 19103 | | | | |
March 1956 | | | | |
| | | | |
| | | | |
| | | | |
| | | | |
| | | | | |
Janet L. Yeomans | | Trustee | | Since April 1999 |
2005 Market Street | | | | |
Philadelphia, PA 19103 | | | | |
July 1948 | | | | |
| | | | |
| | | | |
| | | | |
| | | | |
| | | | |
| | | | |
| | | | | |
90
| | | | |
Principal Occupation(s) During the Past Five Years | | Number of Portfolios in Fund Complex Overseen by Trustee or Officer | | Other Directorships Held by Trustee or Officer |
| | |
| | | | |
| Vice Chairman | | 62 | | Director — HSBC Finance |
| (2010–April 2013), | | | | Corporation and HSBC |
| Chief Administrative | | | | North America Holdings Inc. |
Officer (2008–2010), and Executive Vice | | | | Director — |
| President and Chief | | | | HSBC Bank |
| Administrative Officer | | | | |
| (2007–2009) — | | | | |
| PNC Financial | | | | |
Services Group | | | | |
| Vice President and Treasurer | | 62 | | Director, Audit and |
| (January 2006–July 2012) | | | | Compliance Committee Chair, |
| Vice President — | | | | Investment Committee |
| Mergers & Acquisitions | | | | Member, and Governance |
| (January 2003–January 2006), | | | | Committee Member — |
| and Vice President | | | | Okabena Company |
| and Treasurer | | | | |
| (July 1995–January 2003) | | | | |
3M Company | | | | |
91
Board of trustees / directors and officers addendum
Delaware Investments® Family of Funds
| | | | |
| Name, Address, | | Position(s) | | Length of |
| and Birth Date | | Held with Fund(s) | | Time Served |
| | |
Officers | | | | |
David F. Connor | | Senior Vice President, | | Senior Vice President |
2005 Market Street | | General Counsel, | | since May 2013; |
Philadelphia, PA 19103 | | and Secretary | | General Counsel |
December 1963 | | | | since May 2015; |
| | | | Secretary since |
| | | | October 2005 |
| | | | |
| | | | |
| | | | | |
Daniel V. Geatens | | Vice President | | Treasurer since October 2007 |
2005 Market Street | | and Treasurer | | |
Philadelphia, PA 19103 | | | | |
October 1972 | | | | |
| | | | |
| | | | | |
Richard Salus | | Senior Vice President | | Chief Financial Officer |
2005 Market Street | | and Chief Financial Officer | | since November 2006 |
Philadelphia, PA 19103 | | | | |
October 1963 | | | | |
| | | | |
| | | | | |
The Statement of Additional Information for the Fund(s) includes additional information about the Trustees and Officers and is available, without charge, upon request by calling 800 523-1918.
92
| | | | |
| | Number of Portfolios in | | |
Principal Occupation(s) During the Past Five Years | | Fund Complex Overseen by Trustee or Officer | | Other Directorships Held by Trustee or Officer |
| | |
| | | | |
| David F. Connor has served as | | 62 | | None3 |
Senior Vice President of
the Fund(s) and
the investment advisor
since 2013, General Counsel
of the Fund(s) and
the investment advisor
since 2015, and Secretary
of the Fund(s) and the
investment advisor since 2005. | | | | |
| Daniel V. Geatens has served | | 62 | | None3 |
| as Vice President and | | | | |
Treasurer of the Fund(s)
since 2007 and Vice President
and Director of Financial | | | | |
Administration of the
investment advisor since 2010. | | | | |
| Richard Salus has served as | | 62 | | None3 |
Senior Vice President
and Chief Financial Officer
of the Fund(s) and the
investment advisor since 2006. | | | | |
| 3 | Shawn K. Lytle, David F. Connor, Daniel V. Geatens, and Richard Salus serve in similar capacities for the six portfolios of the Optimum Fund Trust, which have the same investment advisor, principal underwriter, and transfer agent as the registrant. |
93
About the organization
| | | | | | |
Board of trustees | | | | | | |
Shawn K. Lytle | | Ann D. Borowiec | | John A. Fry | | Frances A. |
President and | | Former Chief Executive | | President | | Sevilla-Sacasa |
Chief Executive Officer | | Officer | | Drexel University | | Chief Executive Officer |
Delaware Investments® | | Private Wealth Management | | Philadelphia, PA | | Banco Itaú |
Family of Funds | | J.P. Morgan Chase & Co. | | | | International |
Philadelphia, PA Thomas L. Bennett Chairman of the Board Delaware Investments Family of Funds Private Investor Rosemont, PA | | New York, NY Joseph W. Chow Former Executive Vice President State Street Corporation Boston, MA | | Lucinda S. Landreth Former Chief Investment Officer Assurant, Inc. New York, NY | | Miami, FL Thomas K. Whitford Former Vice Chairman PNC Financial Services Group Pittsburgh, PA Janet L. Yeomans Former Vice President and |
| | | | | | Treasurer |
| | | | | | 3M Company |
| | | | | | St. Paul, MN |
| | | | | | |
| Affiliated officers | | | | | | |
| | | |
David F. Connor | | Daniel V. Geatens | | Richard Salus | | |
Senior Vice President, | | Vice President and | | Senior Vice President and | | |
General Counsel, | | Treasurer | | Chief Financial Officer | | |
and Secretary | | Delaware Investments | | Delaware Investments | | |
Delaware Investments | | Family of Funds | | Family of Funds | | |
Family of Funds | | Philadelphia, PA | | Philadelphia, PA | | |
Philadelphia, PA | | | | | | |
This annual report is for the information of Delaware Corporate Bond Fund and Delaware Extended Duration Bond Fund shareholders, but it may be used with prospective investors when preceded or accompanied by the Delaware Investments Fund fact sheet for the most recently completed calendar quarter. These documents are available at delawareinvestments.com/literature.
Delaware Investments is the marketing name of Delaware Management Holdings, Inc. and its subsidiaries.
Each Fund files its complete schedule of portfolio holdings with the Securities and Exchange Commission (SEC) for the first and third quarters of each fiscal year on Form N-Q. Each Fund’s Forms N-Q, as well as a description of the policies and procedures that the Funds use to determine how to vote proxies (if any) relating to portfolio securities are available without charge (i) upon request, by calling 800 523-1918; and (ii) on the SEC’s website at sec.gov. In addition, a description of the policies and procedures that the Funds use to determine how to vote proxies (if any) relating to portfolio securities and the Schedules of Investments included in the Funds’ most recent Forms N-Q are available without charge on the Funds’ website at delawareinvestments.com/literature. Each Fund’s Forms N-Q may be reviewed and copied at the SEC’s Public Reference Room in Washington, D.C.; information on the operation of the Public Reference Room may be obtained by calling 800 SEC-0330.
Information (if any) regarding how the Funds voted proxies relating to portfolio securities during the most recently disclosed 12-month period ended June 30 is available without charge (i) through the Funds’ website at delawareinvestments.com/proxy; and (ii) on the SEC’s website at sec.gov.
94
Annual report
Fixed income mutual fund
Delaware High-Yield Opportunities Fund
July 31, 2016
Carefully consider the Fund’s investment objectives, risk factors, charges, and expenses before investing. This and other information can be found in the Fund’s prospectus and its summary prospectus, which may be obtained by visiting delawareinvestments.com/literature or calling 800 523-1918. Investors should read the prospectus and the summary prospectus carefully before investing.
You can obtain shareholder reports and prospectuses online instead of in the mail.
Visit delawareinvestments.com/edelivery.
Experience Delaware Investments
Delaware Investments is committed to the pursuit of consistently superior asset management and unparalleled client service. We believe in our investment processes, which seek to deliver consistent results, and in convenient services that help add value for our clients.
If you are interested in learning more about creating an investment plan, contact your financial advisor.
You can learn more about Delaware Investments or obtain a prospectus for Delaware High-Yield Opportunities Fund at delawareinvestments.com/literature.
Manage your investments online
| ● | | 24-hour access to your account information |
| ● | | Check your account balance and recent transactions |
| ● | | Request statements or literature |
| ● | | Make purchases and redemptions |
Delaware Management Holdings, Inc. and its subsidiaries (collectively known by the marketing name of Delaware Investments) are wholly owned subsidiaries of Macquarie Group Limited, a global provider of banking, financial, advisory, investment, and funds management services.
Neither Delaware Investments nor its affiliates referred to in this document are authorized deposit-taking institutions for the purpose of the Banking Act 1959 (Commonwealth of Australia). The obligations of these entities do not represent deposits or other liabilities of Macquarie Bank Limited (MBL), a subsidiary of Macquarie Group Limited and an affiliate of Delaware Investments. MBL does not guarantee or otherwise provide assurance in respect of the obligations of these entities, unless noted otherwise. The Fund is governed by U.S. laws and regulations.
Table of contents
Unless otherwise noted, views expressed herein are current as of July 31, 2016, and subject to change for events occurring after such date.
The Fund is not FDIC insured and is not guaranteed. It is possible to lose the principal amount invested.
Mutual fund advisory services provided by Delaware Management Company, a series of Delaware Management Business Trust, which is a registered investment advisor. Delaware Investments, a member of Macquarie Group, refers to Delaware Management Holdings, Inc. and its subsidiaries, including the Fund’s distributor, Delaware Distributors, L.P. Macquarie Group refers to Macquarie Group Limited and its subsidiaries and affiliates worldwide.
© 2016 Delaware Management Holdings, Inc.
All third-party marks cited are the property of their respective owners.
| | |
| Portfolio management review | | |
| Delaware High-Yield Opportunities Fund | | August 9, 2016 |
| | | | | | | | |
Performance preview (for the fiscal year ended July 31, 2016) | | | | | | | | |
Delaware High-Yield Opportunities Fund (Institutional Class shares) | | | 1-year return | | | | +0.66% | |
Delaware High-Yield Opportunities Fund (Class A shares) | | | 1-year return | | | | +0.41% | |
BofA Merrill Lynch U.S. High Yield Constrained Index (benchmark) | | | 1-year return | | | | +4.95% | |
Past performance does not guarantee future results.
For complete, annualized performance for Delaware High-Yield Opportunities Fund, please see the table on page 4. Institutional Class shares are available without sales or asset-based distribution charges only to certain eligible accounts. The performance of Class A shares excludes the applicable sales charge and reflects the reinvestment of all distributions. Please see page 7 for a description of the index.
Index performance returns do not reflect any management fees, transaction costs, or expenses. Indices are unmanaged and one cannot invest directly in an index.
A rebound in commodity prices and the U.S. Federal Reserve’s assurances of continued monetary accommodation sparked a rally in high yield bond prices over the second half of the Fund’s fiscal year ended July 31, 2016. However, conditions were anything but accommodative in the first half of the fiscal year, as a steep fall in commodity prices — especially oil — magnified the effect of the Fed’s first interest rate hike since the global financial crisis. As such, the high yield market took on bipolar characteristics, with negative returns from August 2015 through January 2016 and solidly positive returns from February through July 2016. Despite this volatility, credit spreads finished close to their historical averages and only slightly higher than where they were at the start of the fiscal year.
Importantly, the recovery in oil prices that began in February — coupled with a global search for yield — reopened capital markets to energy companies. This backdrop allowed many distressed businesses to extend maturity profiles by accessing both debt and equity markets, despite an oil price environment that, in our view, was not supportive of business models and balance sheets. Given the weak pricing environment, defaults among high yield energy companies climbed to the low double digits, versus low single digits for the rest of the high yield sector. Weakness was concentrated in the energy sector’s exploration and production
High yield bonds
were affected by the
following factors
over the fiscal
period:
| | ● | | A sharp down-up pattern in the energy and commodity sectors |
| | ● | | Strong global demand amid low U.S. interest rates and negative rates overseas |
| | ● | | Relatively modest defaults outside of the energy sector. |
| | |
| Portfolio management review | | |
| Delaware High-Yield Opportunities Fund | | |
subgroup — which, even after the powerful late rally, finished down 14% over the fiscal year.
More broadly, domestic high yield bonds benefited from a global search for income. Almost three-quarters of developed market debt now trades at a negative yield, and global central banks gave no indication that a new monetary tightening cycle was close at hand. In that environment, most industry groups performed relatively well, with gaming, consumer goods, capital goods, and technology all outperforming the BofA Merrill Lynch U.S. High Yield Constrained Index by at least 3 percentage points. Excluding the still-depressed commodity group, high yield bonds generally finished the fiscal year at prices that we believe to be slightly overvalued given their underlying fundamentals. Any mild overvaluation, however, is likely to be expected given the continued low level of global interest rates.
Fund performance
For its fiscal year ended July 31, 2016, Delaware High-Yield Opportunities Fund lagged its benchmark, the BofA Merrill Lynch U.S. High Yield Constrained Index. The Fund’s Institutional Class shares returned +0.66%. The Fund’s Class A shares returned +0.41% at net asset value and -4.20% at maximum offer price (these figures reflect all distributions reinvested). During the same period, the benchmark returned +4.95%. For complete, annualized performance of Delaware High-Yield Opportunities Fund, please see the table on page 4.
Shifting currents within the high yield market created significant managerial challenges. As the fiscal year began, we trimmed exposure to the energy sector; at one point, the Fund’s allocation to the group fell to just 3% of assets. Though we subsequently increased the Fund’s energy holdings, we finished the period about 3 percentage points below the sector’s 13% weighting in the benchmark index. With the short-
to medium-term outlook for energy prices likely to remain cloudy, we took a cautious approach, preferring companies with what we view as having favorable cost structures, manageable free cash flows, diversified assets, and geographic exposure, and the ability to withstand a $40-a-barrel oil price for a lengthy period of time.
Elsewhere, we added marginally to the Fund’s metals and mining allocation as the recovery in commodity prices gained traction. We also added so-called “fallen angels,” whose credit ratings had dropped below investment grade after the plunge in oil prices. Finally, we increased the Fund’s weighting to holdings that fit our up-in-quality criteria.
Among individual holdings, the Fund’s overweight stake in Builders FirstSource contributed to the Fund’s relative performance. The company owns and operates 55 distribution centers and manufacturing facilities for building materials throughout the United States. While Builders FirstSource benefited from a healthy environment for residential home construction, the company also exhibited many of the characteristics we prefer in a high yield credit, including strong free cash flow, U.S.-centric clientele, and a plan for shedding debt. The Fund’s position in Builders FirstSource — which grew to about 0.80% of assets by the end of the fiscal year — contributed 0.10 percentage points to the Fund’s total return during the fiscal year.
AK Steel, which operates steelmaking plants in Ohio, Kentucky, Indiana, Michigan, and Pennsylvania, also contributed to the Fund’s results. After several difficult years — during which the Fund continued to hold the bonds — the company recovered strongly in 2016 following several favorable trade rulings that seemed to boost the price of its key commodity. AK Steel also benefited from continued strength in the U.S. auto industry.
Another basic materials company, the Australia-based FMG Resources, contributed to the Fund’s
performance. FMG Resources gained from a recovery in iron ore prices, positive freecash flow, a reduction in debt, and a favorable cost structure. As a result, we added to the Fund’s position in FMG Resources during the fiscal year.
Most of the Fund’s underperforming positions suffered from weak free cash flows and overleveraged balance sheets, exacerbated by a difficult business environment. Among the primary detractors from relative performance was Immucor, whose products are designed to support immune system health. Given the near-term challenges posed by, in our view, an overlevered balance sheet, we reduced the Fund’s holdings with an emphasis on the secured part of the company’s capital structure.
The global networking company Intelsat also detracted from relative performance. Intelsat operates a fleet of nearly 50 satellites, but the company suffered from liquidity issues that called into serious question its ability to refund maturing bonds at par. Consequently, we exited the Fund’s position during the fiscal period.
The Fund’s stake in Neiman Marcus likewise reduced returns. The luxury products retailer suffered a 5% drop in same-store sales despite generally robust consumer spending. Revenues from the Dallas-based company’s eight Texas stores were particularly hurt by the decline in oil prices. Neiman Marcus announced stronger earnings toward the end of the fiscal year, however, and the Fund retains a decreased position.
We believe the Fund may be positioned to benefit from a bottom-up, bond-by-bond approach that, if accurate, would play to our strength as fundamental credit analysts. However, given the resilience of the U.S. economy (compared to much of the developed world) we continue to favor companies with a domestic focus. As noted earlier, the Fund continues to be overweight businesses with what we view as having healthy free cash flows, a disciplined strategy of capital allocation, and a commitment to deleveraging. We are satisfied with the Fund’s current yield profile, though we may look to add income to the portfolio if opportunities present themselves.
| | |
| Performance summary | | |
| Delaware High-Yield Opportunities Fund | | July 31, 2016 |
The performance data quoted represent past performance; past performance does not guarantee future results. Investment return and principal value will fluctuate so your shares, when redeemed, may be worth more or less than their original cost. Please obtain the performance data current for the most recent month end by calling 800 523-1918 or visiting our website at delawareinvestments.com/performance. Current performance may be lower or higher than the performance data quoted.
| | | | | | | | | | | | |
| Fund and benchmark performance1,2 | | Average annual total returns through July 31, 2016 | |
| | | |
| | | 1 year | | | 5 years | | | 10 years | |
| | | |
Class A (Est. Dec. 30, 1996) | | | | | | | | | | | | |
Excluding sales charge | | | +0.41% | | | | +4.39% | | | | +6.33% | |
Including sales charge | | | –4.20% | | | | +3.42% | | | | +5.84% | |
Class C (Est. Feb. 17, 1998) | | | | | | | . | | | | | |
Excluding sales charge | | | –0.59% | | | | +3.63% | | | | +5.57% | |
Including sales charge | | | –1.54% | | | | +3.63% | | | | +5.57% | |
Class R (Est. June 2, 2003) | | | | | | | | | | | | |
Excluding sales charge | | | –0.09% | | | | +4.15% | | | | +6.10% | |
Including sales charge | | | –0.09% | | | | +4.15% | | | | +6.10% | |
Institutional Class (Est. Dec. 30, 1996) | | | | | | | | | | | | |
Excluding sales charge | | | +0.66% | | | | +4.67% | | | | +6.63% | |
Including sales charge | | | +0.66% | | | | +4.67% | | | | +6.63% | |
BofA Merrill Lynch U.S. High Yield Constrained Index | | | +4.95% | | | | +5.97% | | | | +7.67% | |
1 Returns reflect the reinvestment of all distributions and are presented both with and without the applicable sales charges described below. Returns do not reflect the deduction of taxes the shareholder would pay on Fund distributions or redemptions of Fund shares.
Expense limitations were in effect for certain classes during some or all of the periods shown in the “Fund and benchmark performance” table. Expenses for each class are listed on the “Fund expense ratios” table on page 6. Performance would have been lower had expense limitations not been in effect.
Institutional Class shares are available without sales or asset-based distribution charges only to certain eligible accounts.
Class A shares are sold with a maximum front-end sales charge of 4.50%, and have an annual distribution and service fee of 0.25% of average daily net assets. The Board has adopted a formula for calculating 12b-1 plan fees for the Fund’s Class A shares. The Fund’s Class A shares are currently subject to a blended 12b-1 fee equal to the sum of: (i) 0.10% of average daily net assets representing shares acquired prior to June 1, 1992, and (ii) 0.25% of average daily net assets representing shares acquired on or after June 1, 1992. All Class A shares currently bear 12b-1 fees at the same rate, the blended rate, currently 0.25% of average daily net assets, based on the formula described above. This method of calculating Class A 12b-1 fees may be discontinued at the sole discretion of the Board. Performance for Class A shares, excluding sales
charges, assumes that no front-end sales charge applied.
Class C shares are sold with a contingent deferred sales charge of 1.00% if redeemed during the first 12 months. They are also subject to an annual distribution and service fee of 1.00% of average daily net assets. Performance for Class C shares, excluding sales charges, assumes either that contingent deferred sales charges did not apply or that the investment was not redeemed.
Class R shares are available only for certain retirement plan products. They are sold without a sales charge and have an annual distribution and service fee of 0.50% of average daily net assets.
Fixed income securities and bond funds can lose value, and investors can lose principal, as interest rates rise. They also may be affected by economic conditions that hinder an issuer’s ability to make interest and principal payments on its debt.
The Fund may also be subject to prepayment risk, the risk that the principal of a fixed income security that is held by the Fund may be prepaid prior to maturity, potentially forcing the Fund to reinvest that money at a lower interest rate.
High yielding, non-investment-grade bonds (junk bonds) involve higher risk than investment grade bonds. The high yield secondary market is particularly susceptible to liquidity problems when institutional investors, such as mutual funds and certain other financial institutions, temporarily stop buying bonds for regulatory, financial, or other reasons. In addition, a less liquid secondary market makes it more difficult for the Fund to obtain precise valuations of the high yield securities in its portfolio.
The Fund may invest in derivatives, which may involve additional expenses and are subject to risk, including the risk that an underlying security or securities index moves in the opposite direction from what the portfolio manager anticipated. A derivative transaction depends upon the counterparties’ ability to fulfill their contractual obligations.
The Fund may experience portfolio turnover in excess of 100%, which could result in higher transaction costs and tax liability.
International investments entail risks not ordinarily associated with U.S. investments including fluctuation in currency values, differences in accounting principles, or economic or political instability in other nations.
Investing in emerging markets can be riskier than investing in established foreign markets due to increased volatility and lower trading volume.
Per Standard & Poor’s credit rating agency, bonds rated AA and A are more susceptible to the adverse effects of changes in circumstances and economic conditions than those in the higher-rated AAA category, but the obligor’s capacity to meet its financial commitment on the obligation is still strong. Bonds rated BBB exhibit adequate protection parameters, although adverse economic conditions or changing circumstances are more likely to lead to a weakened capacity of the obligor to meet its financial commitments. Bonds rated BB, B, and CCC are regarded as having significant speculative characteristics, with BB indicating the least degree of speculation of the three.
| | |
| Performance summary | | |
| Delaware High-Yield Opportunities Fund | | |
2 The Fund’s expense ratios, as described in the most recent prospectus, are disclosed in the following “Fund expense ratios” table. Delaware Management Company has agreed to reimburse certain expenses and/or waive certain fees in order to prevent total fund operating expenses (excluding any 12b-1 fees, acquired fund fees and expenses, taxes, interest, short sale and dividend interest expenses, brokerage fees, certain insurance costs, and nonroutine expenses or costs, including, but not limited to, those relating to reorganizations, litigation, conducting shareholder meetings, and liquidations (collectively, nonroutine expenses)) from exceeding 0.80% of the Fund’s average daily net assets during the period from Aug. 1, 2015 through July 31, 2016.* Please see the most recent prospectus and any applicable supplement(s) for additional information on these fee waivers and/or reimbursements.
| | | | | | | | |
| Fund expense ratios | | Class A | | Class C | | Class R | | Institutional Class |
Total annual operating expenses | | 1.12% | | 1.87% | | 1.37% | | 0.87% |
(without fee waivers) | | | | | | | | |
Net expenses | | 1.05% | | 1.80% | | 1.30% | | 0.80% |
(including fee waivers, if any) | | | | | | | | |
Type of waiver | | Contractual | | Contractual | | Contractual | | Contractual |
*The aggregate contractual waiver period covering this report is from Nov. 28, 2014 to Nov. 28, 2016.
Performance of a $10,000 investment1
Average annual total returns from July 31, 2006, through July 31, 2016
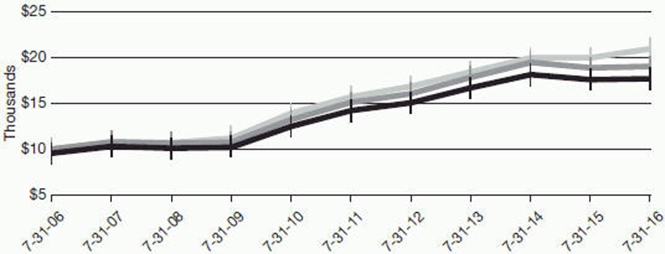
| | | | | | | | |
| For period beginning July 31, 2006, through July 31, 2016 | | Starting value | | | Ending value |

| | BofA Merrill Lynch U.S. High Yield Constrained Index | | | $10,000 | | | $20,940 |

| | Delaware High-Yield Opportunities
Fund — Institutional Class shares | | | $10,000 | | | $19,005 |

| | Delaware High-Yield Opportunities
Fund — Class A shares | | | $9,550 | | | $17,647 |
1 The “Performance of a $10,000 investment” graph assumes $10,000 invested in Institutional Class and Class A shares of the Fund on July 31, 2006, and includes the effect of a 4.50% front-end sales charge (for Class A shares), and the reinvestment of all distributions. The graph does not reflect the deduction of taxes the shareholders would pay on Fund distributions or redemptions of Fund shares. Expense limitations were in effect for some or all of the periods shown. Performance would have been lower had expense limitations not been in effect. Expenses are listed in the “Fund expense ratios” table on page 6. Please note additional details on pages 4 through 7.
The graph also assumes $10,000 invested in the BofA Merrill Lynch U.S. High Yield Constrained Index as of July 31, 2006. The BofA Merrill Lynch U.S. High Yield Constrained Index tracks the performance of U.S. dollar–denominated high yield corporate debt publicly issued in the U.S. domestic market, but caps individual issuer exposure at 2% of the benchmark.
Index performance returns do not reflect any management fees, transaction costs, or expenses. Indices are unmanaged and one cannot invest directly in an index. Past performance is not a guarantee of future results.
Performance of other Fund classes will vary due to different charges and expenses.
| | | | | | |
| | | | |
| | | Nasdaq symbols | | CUSIPs | | |
Class A | | DHOAX | | 245908876 | | |
Class C | | DHOCX | | 245908850 | | |
Class R | | DHIRX | | 245908736 | | |
Institutional Class | | DHOIX | | 245908843 | | |
| | |
| Disclosure of Fund expenses | | |
| For the six-month period from February 1, 2016 to July 31, 2016 (Unaudited) | | |
As a shareholder of the Fund, you incur two types of costs: (1) transaction costs, including sales charges (loads) on purchase payments, reinvested dividends, or other distributions; redemption fees; and exchange fees; and (2) ongoing costs, including management fees; distribution and/or service (12b-1) fees; and other Fund expenses. This example is intended to help you understand your ongoing costs (in dollars) of investing in the Fund and to compare these costs with the ongoing costs of investing in other mutual funds.
The example is based on an investment of $1,000 invested at the beginning of the period and held for the entire six-month period from Feb. 1, 2016 to July 31, 2016.
Actual expenses
The first section of the table shown, “Actual Fund return,” provides information about actual account values and actual expenses. You may use the information in this section of the table, together with the amount you invested, to estimate the expenses that you paid over the period. Simply divide your account value by $1,000 (for example, an $8,600 account value divided by $1,000 = 8.6), then multiply the result by the number in the first section under the heading entitled “Expenses Paid During Period” to estimate the expenses you paid on your account during this period.
Hypothetical example for comparison purposes
The second section of the table shown, “Hypothetical 5% return,” provides information about hypothetical account values and hypothetical expenses based on the Fund’s actual expense ratio and an assumed rate of return of 5% per year before expenses, which is not the Fund’s actual return. The hypothetical account values and expenses may not be used to estimate the actual ending account balance or expenses you paid for the period. You may use this information to compare the ongoing costs of investing in the Fund and other funds. To do so, compare this 5% hypothetical example with the 5% hypothetical examples that appear in the shareholder reports of the other funds.
Please note that the expenses shown in the table are meant to highlight your ongoing costs only and do not reflect any transactional costs, such as sales charges (loads), redemption fees, or exchange fees. Therefore, the second section of the table is useful in comparing ongoing costs only, and will not help you determine the relative total costs of owning different funds. In addition, if these transactional costs were included, your costs would have been higher. The Fund’s expenses shown in the table reflect fee waivers in effect. The expenses shown in the table assume reinvestment of all dividends and distributions.
Delaware High-Yield Opportunities Fund
Expense analysis of an investment of $1,000
| | | | | | | | | | | | | | | | |
| | | Beginning Account Value 2/1/16 | | | Ending Account Value 7/31/16 | | | Annualized Expense Ratio | | | Expenses Paid During Period 2/1/16 to 7/31/16* | |
| | | | |
Actual Fund return† | | | | | | | | | | | | | | | | |
Class A | | | $1,000.00 | | | | $1,101.70 | | | | 1.05% | | | | $5.49 | |
Class C | | | 1,000.00 | | | | 1,094.60 | | | | 1.80% | | | | 9.37 | |
Class R | | | 1,000.00 | | | | 1,100.10 | | | | 1.30% | | | | 6.79 | |
Institutional Class | | | 1,000.00 | | | | 1,103.10 | | | | 0.80% | | | | 4.18 | |
| | |
Hypothetical 5% return (5% return before expenses) | | | | | | | | | |
Class A | | | $1,000.00 | | | | $1,019.64 | | | | 1.05% | | | | $5.27 | |
Class C | | | 1,000.00 | | | | 1,015.91 | | | | 1.80% | | | | 9.02 | |
Class R | | | 1,000.00 | | | | 1,018.40 | | | | 1.30% | | | | 6.52 | |
Institutional Class | | | 1,000.00 | | | | 1,020.89 | | | | 0.80% | | | | 4.02 | |
* “Expenses Paid During Period” are equal to the Fund’s annualized expense ratio, multiplied by the average account value over the period, multiplied by 182/366 (to reflect the one-half year period).
† Because actual returns reflect only the most recent six-month period, the returns shown may differ significantly from fiscal year returns.
| | |
| Security type / sector allocation | | |
| Delaware High-Yield Opportunities Fund | | As of July 31, 2016 (Unaudited) |
Sector designations may be different than the sector designations presented in other Fund materials. The sector designations may represent the investment manager’s internal sector classifications.
| | | | | | |
| Security type / sector | | Percentage of net assets | | | |
Convertible Bond | | 0.21% | | | | |
Corporate Bonds | | 88.61% | | | | |
Automotive | | 0.37% | | | | |
Banking | | 4.24% | | | | |
Basic Industry | | 8.49% | | | | |
Capital Goods | | 7.92% | | | | |
Consumer Cyclical | | 5.83% | | | | |
Consumer Non-Cyclical | | 6.11% | | | | |
Energy | | 10.97% | | | | |
Healthcare | | 7.68% | | | | |
Insurance | | 1.96% | | | | |
Media | | 11.14% | | | | |
Services | | 7.74% | | | | |
Technology & Electronics | | 5.51% | | | | |
Telecommunications | | 7.66% | | | | |
Utilities | | 2.99% | | | | |
Senior Secured Loans | | 6.66% | | | | |
Common Stock | | 0.00% | | | | |
Preferred Stock | | 1.67% | | | | |
Short-Term Investments | | 2.68% | | | | |
Total Value of Securities | | 99.83% | | | | |
Receivables and Other Assets Net of Liabilities | | 0.17% | | | | |
Total Net Assets | | 100.00% | | | | |
| | |
| Schedule of investments | | |
| Delaware High-Yield Opportunities Fund | | July 31, 2016 |
| | | | | | | | |
| | | Principal amount° | | | Value (U.S. $) | |
| |
Convertible Bond – 0.21% | | | | | | | | |
| |
Clearwire Communications 144A 8.25% exercise price $7.08, maturity date 12/1/40 # | | | 688,000 | | | $ | 715,520 | |
| | | | | | | | |
Total Convertible Bond (cost $704,470) | | | | | | | 715,520 | |
| | | | | | | | |
|
| |
Corporate Bonds – 88.61% | | | | | | | | |
| |
Automotive – 0.37% | | | | | | | | |
Group 1 Automotive 144A 5.25% 12/15/23 # | | | 1,230,000 | | | | 1,226,925 | |
| | | | | | | | |
| | | | | | | 1,226,925 | |
| | | | | | | | |
Banking – 4.24% | | | | | | | | |
Ally Financial 5.75% 11/20/25 | | | 2,370,000 | | | | 2,476,650 | |
Credit Suisse Group 144A 6.25% 12/29/49 #• | | | 1,580,000 | | | | 1,532,828 | |
JPMorgan Chase 6.75% 1/29/49 • | | | 3,070,000 | | | | 3,461,118 | |
Lloyds Banking Group 7.50% 4/30/49 • | | | 1,785,000 | | | | 1,785,000 | |
Popular 7.00% 7/1/19 | | | 2,238,000 | | | | 2,288,355 | |
Royal Bank of Scotland Group 8.00% 12/29/49 • | | | 870,000 | | | | 866,737 | |
UBS Group 6.875% 12/29/49 • | | | 1,730,000 | | | | 1,704,050 | |
| | | | | | | | |
| | | | | | | 14,114,738 | |
| | | | | | | | |
Basic Industry – 8.49% | | | | | | | | |
AK Steel 7.625% 5/15/20 | | | 1,277,000 | | | | 1,262,634 | |
ArcelorMittal 10.85% 6/1/19 | | | 1,045,000 | | | | 1,233,100 | |
Builders FirstSource | | | | | | | | |
144A 7.625% 6/1/21 # | | | 1,065,000 | | | | 1,129,433 | |
144A 10.75% 8/15/23 # | | | 2,415,000 | | | | 2,692,725 | |
Cemex | | | | | | | | |
144A 7.25% 1/15/21 # | | | 2,060,000 | | | | 2,245,194 | |
144A 7.75% 4/16/26 # | | | 520,000 | | | | 578,500 | |
Chemours | | | | | | | | |
6.625% 5/15/23 | | | 1,015,000 | | | | 880,513 | |
7.00% 5/15/25 | | | 500,000 | | | | 427,500 | |
CVR Partners 144A 9.25% 6/15/23 # | | | 945,000 | | | | 969,806 | |
FMG Resources August 2006 144A 6.875% 4/1/22 # | | | 2,715,000 | | | | 2,660,700 | |
Joseph T Ryerson & Son 144A 11.00% 5/15/22 # | | | 715,000 | | | | 781,137 | |
Kraton Polymers 144A 10.50% 4/15/23 # | | | 680,000 | | | | 744,600 | |
NCI Building Systems 144A 8.25% 1/15/23 # | | | 1,465,000 | | | | 1,611,500 | |
New Gold | | | | | | | | |
144A 6.25% 11/15/22 # | | | 615,000 | | | | 628,837 | |
144A 7.00% 4/15/20 # | | | 770,000 | | | | 799,837 | |
NOVA Chemicals 144A 5.00% 5/1/25 # | | | 1,430,000 | | | | 1,455,025 | |
PQ 144A 6.75% 11/15/22 # | | | 1,716,000 | | | | 1,809,316 | |
Rayonier AM Products 144A 5.50% 6/1/24 # | | | 1,150,000 | | | | 1,002,662 | |
Steel Dynamics 5.50% 10/1/24 | | | 1,025,000 | | | | 1,089,063 | |
Summit Materials | | | | | | | | |
6.125% 7/15/23 | | | 2,110,000 | | | | 2,136,375 | |
| | |
| Schedule of investments | | |
| Delaware High-Yield Opportunities Fund | | |
| | | | | | | | |
| | | Principal amount° | | | Value (U.S. $) | |
| |
Corporate Bonds (continued) | | | | | | | | |
| |
Basic Industry (continued) | | | | | | | | |
Summit Materials | | | | | | | | |
144A 8.50% 4/15/22 # | | | 315,000 | | | $ | 340,987 | |
U.S. Concrete 144A 6.375% 6/1/24 # | | | 1,715,000 | | | | 1,762,746 | |
| | | | | | | | |
| | | | | | | 28,242,190 | |
| | | | | | | | |
Capital Goods – 7.92% | | | | | | | | |
Ardagh Finance Holdings 144A PIK 8.625% 6/15/19 #✥ | | | 803,206 | | | | 831,318 | |
Ardagh Packaging Finance | | | | | | | | |
144A 4.625% 5/15/23 # | | | 200,000 | | | | 202,250 | |
144A 6.00% 6/30/21 # | | | 1,665,000 | | | | 1,702,463 | |
144A 7.25% 5/15/24 # | | | 675,000 | | | | 715,500 | |
BWAY Holding 144A 9.125% 8/15/21 # | | | 2,157,000 | | | | 2,157,000 | |
Cloud Crane 144A 10.125% 8/1/24 # | | | 650,000 | | | | 671,125 | |
Gardner Denver 144A 6.875% 8/15/21 # | | | 2,739,000 | | | | 2,554,117 | |
James Hardie International Finance 144A 5.875% 2/15/23 # | | | 1,655,000 | | | | 1,733,613 | |
KLX 144A 5.875% 12/1/22 # | | | 1,685,000 | | | | 1,714,487 | |
Plastipak Holdings 144A 6.50% 10/1/21 # | | | 1,795,000 | | | | 1,848,850 | |
Reynolds Group Issuer 8.25% 2/15/21 | | | 2,315,000 | | | | 2,410,725 | |
Signode Industrial Group 144A 6.375% 5/1/22 # | | | 1,805,000 | | | | 1,801,607 | |
StandardAero Aviation Holdings 144A 10.00% 7/15/23 # | | | 1,810,000 | | | | 1,882,400 | |
TransDigm | | | | | | | | |
144A 6.375% 6/15/26 # | | | 2,470,000 | | | | 2,550,275 | |
6.50% 5/15/25 | | | 515,000 | | | | 540,106 | |
Xerium Technologies 144A 9.50% 8/15/21 # | | | 465,000 | | | | 463,837 | |
Zekelman Industries 144A 9.875% 6/15/23 # | | | 2,465,000 | | | | 2,594,413 | |
| | | | | | | | |
| | | | | | | 26,374,086 | |
| | | | | | | | |
Consumer Cyclical – 5.83% | | | | | | | | |
American Tire Distributors 144A 10.25% 3/1/22 # | | | 1,325,000 | | | | 1,223,969 | |
Beacon Roofing Supply 6.375% 10/1/23 | | | 1,295,000 | | | | 1,398,600 | |
Boyd Gaming | | | | | | | | |
144A 6.375% 4/1/26 # | | | 660,000 | | | | 707,025 | |
6.875% 5/15/23 | | | 2,180,000 | | | | 2,346,225 | |
Golden Nugget Escrow 144A 8.50% 12/1/21 # | | | 500,000 | | | | 521,250 | |
HD Supply 144A 5.75% 4/15/24 # | | | 890,000 | | | | 949,941 | |
JC Penney 8.125% 10/1/19 | | | 1,700,000 | | | | 1,785,000 | |
L Brands | | | | | | | | |
6.75% 7/1/36 | | | 840,000 | | | | 884,629 | |
6.875% 11/1/35 | | | 2,090,000 | | | | 2,226,895 | |
M/I Homes 6.75% 1/15/21 | | | 1,450,000 | | | | 1,500,750 | |
Mohegan Tribal Gaming Authority 9.75% 9/1/21 | | | 3,126,000 | | | | 3,372,173 | |
| | | | | | | | |
| | | Principal amount° | | | Value (U.S. $) | |
| |
Corporate Bonds (continued) | | | | | | | | |
| |
Consumer Cyclical (continued) | | | | | | | | |
Neiman Marcus Group 144A 8.00% 10/15/21 # | | | 970,000 | | | $ | 827,022 | |
Penske Automotive Group 5.50% 5/15/26 | | | 1,685,000 | | | | 1,668,150 | |
| | | | | | | | |
| | | | | | | 19,411,629 | |
| | | | | | | | |
Consumer Non-Cyclical – 6.11% | | | | | | | | |
Albertsons 144A 6.625% 6/15/24 # | | | 1,645,000 | | | | 1,751,925 | |
Amsurg 5.625% 7/15/22 | | | 1,300,000 | | | | 1,369,875 | |
Dean Foods 144A 6.50% 3/15/23 # | | | 1,285,000 | | | | 1,362,100 | |
FAGE International 144A 5.625% 8/15/26 # | | | 615,000 | | | | 629,606 | |
JBS Investments 144A 7.75% 10/28/20 # | | | 200,000 | | | | 213,000 | |
JBS USA 144A 5.75% 6/15/25 # | | | 2,860,000 | | | | 2,802,800 | |
Kronos Acquisition Holdings 144A 9.00% 8/15/23 # | | | 2,390,000 | | | | 2,503,525 | |
NBTY 144A 7.625% 5/15/21 # | | | 2,465,000 | | | | 2,520,463 | |
Prestige Brands 144A 5.375% 12/15/21 # | | | 886,000 | | | | 909,257 | |
Revlon Escrow 144A 6.25% 8/1/24 # | | | 925,000 | | | | 938,875 | |
Spectrum Brands 6.125% 12/15/24 | | | 985,000 | | | | 1,068,725 | |
SUPERVALU 7.75% 11/15/22 | | | 800,000 | | | | 700,000 | |
U.S. Foods 144A 5.875% 6/15/24 # | | | 1,410,000 | | | | 1,480,500 | |
Valeant Pharmaceuticals International | | | | | | | | |
144A 5.375% 3/15/20 # | | | 485,000 | | | | 434,984 | |
144A 6.125% 4/15/25 # | | | 800,000 | | | | 666,000 | |
144A 6.75% 8/15/18 # | | | 1,000,000 | | | | 992,500 | |
| | | | | | | | |
| | | | | | | 20,344,135 | |
| | | | | | | | |
Energy – 10.97% | | | | | | | | |
AmeriGas Partners 5.875% 8/20/26 | | | 2,155,000 | | | | 2,260,056 | |
Antero Resources | | | | | | | | |
5.125% 12/1/22 | | | 400,000 | | | | 375,000 | |
5.375% 11/1/21 | | | 750,000 | | | | 721,875 | |
6.00% 12/1/20 | | | 305,000 | | | | 303,475 | |
Baytex Energy 144A 5.625% 6/1/24 # | | | 930,000 | | | | 739,350 | |
Cheniere Corpus Christi Holdings 144A 7.00% 6/30/24 # | | | 830,000 | | | | 870,463 | |
Continental Resources 5.00% 9/15/22 | | | 905,000 | | | | 850,700 | |
Energy Transfer Equity 7.50% 10/15/20 | | | 1,050,000 | | | | 1,136,625 | |
EnLink Midstream Partners 4.15% 6/1/25 | | | 2,114,000 | | | | 1,987,359 | |
Freeport-McMoran Oil & Gas 6.50% 11/15/20 | | | 1,600,000 | | | | 1,592,000 | |
Genesis Energy | | | | | | | | |
5.75% 2/15/21 | | | 855,000 | | | | 850,725 | |
6.00% 5/15/23 | | | 855,000 | | | | 855,000 | |
6.75% 8/1/22 | | | 1,090,000 | | | | 1,103,625 | |
Hilcorp Energy I | | | | | | | | |
144A 5.00% 12/1/24 # | | | 700,000 | | | | 654,500 | |
144A 5.75% 10/1/25 # | | | 740,000 | | | | 703,000 | |
Holly Energy Partners 144A 6.00% 8/1/24 # | | | 930,000 | | | | 943,950 | |
| | |
| Schedule of investments | | |
| Delaware High-Yield Opportunities Fund | | |
| | | | | | | | |
| | | Principal amount° | | | Value (U.S. $) | |
| |
Corporate Bonds (continued) | | | | | | | | |
| |
Energy (continued) | | | | | | | | |
Laredo Petroleum 7.375% 5/1/22 | | | 830,000 | | | $ | 811,325 | |
Murphy Oil USA 6.00% 8/15/23 | | | 1,695,000 | | | | 1,792,463 | |
Newfield Exploration 5.625% 7/1/24 | | | 1,233,000 | | | | 1,223,753 | |
Noble Holding International 5.00% 3/16/18 | | | 925,000 | | | | 893,365 | |
NuStar Logistics 6.75% 2/1/21 | | | 1,630,000 | | | | 1,707,425 | |
Oasis Petroleum 6.875% 3/15/22 | | | 1,845,000 | | | | 1,618,987 | |
QEP Resources 5.25% 5/1/23 | | | 1,760,000 | | | | 1,667,600 | |
Regency Energy Partners 5.875% 3/1/22 | | | 1,145,000 | | | | 1,250,239 | |
Sabine Pass Liquefaction 144A 5.875% 6/30/26 # | | | 705,000 | | | | 724,387 | |
Southwestern Energy 6.70% 1/23/25 | | | 930,000 | | | | 906,750 | |
Targa Resources Partners | | | | | | | | |
144A 6.75% 3/15/24 # | | | 1,650,000 | | | | 1,728,375 | |
6.875% 2/1/21 | | | 1,355,000 | | | | 1,395,650 | |
Tesoro Logistics | | | | | | | | |
6.125% 10/15/21 | | | 240,000 | | | | 250,524 | |
6.375% 5/1/24 | | | 1,295,000 | | | | 1,371,897 | |
Transocean 5.05% 10/15/22 | | | 2,225,000 | | | | 1,602,000 | |
WPX Energy 7.50% 8/1/20 | | | 1,650,000 | | | | 1,633,500 | |
| | | | | | | | |
| | | | | | | 36,525,943 | |
| | | | | | | | |
Healthcare – 7.68% | | | | | | | | |
Community Health Systems 6.875% 2/1/22 | | | 1,963,000 | | | | 1,697,995 | |
DaVita HealthCare Partners 5.00% 5/1/25 | | | 1,945,000 | | | | 1,971,744 | |
HCA | | | | | | | | |
5.375% 2/1/25 | | | 1,815,000 | | | | 1,893,281 | |
5.875% 2/15/26 | | | 1,020,000 | | | | 1,093,950 | |
HealthSouth | | | | | | | | |
5.75% 11/1/24 | | | 1,750,000 | | | | 1,824,375 | |
5.75% 9/15/25 | | | 875,000 | | | | 907,917 | |
Hill-Rom Holdings 144A 5.75% 9/1/23 # | | | 1,730,000 | | | | 1,814,337 | |
IASIS Healthcare 8.375% 5/15/19 | | | 2,668,000 | | | | 2,574,620 | |
Immucor 11.125% 8/15/19 | | | 365,000 | | | | 337,625 | |
Kinetic Concepts | | | | | | | | |
10.50% 11/1/18 | | | 990,000 | | | | 1,015,987 | |
12.50% 11/1/19 | | | 1,755,000 | | | | 1,724,287 | |
LifePoint Health 5.875% 12/1/23 | | | 1,980,000 | | | | 2,093,850 | |
Mallinckrodt International Finance | | | | | | | | |
4.75% 4/15/23 | | | 250,000 | | | | 220,000 | |
144A 5.50% 4/15/25 # | | | 285,000 | | | | 264,337 | |
144A 5.625% 10/15/23 # | | | 1,030,000 | | | | 993,950 | |
MPH Acquisition Holdings 144A 7.125% 6/1/24 # | | | 2,425,000 | | | | 2,593,234 | |
Tenet Healthcare 8.125% 4/1/22 | | | 2,455,000 | | | | 2,547,063 | |
| | | | | | | | |
| | | | | | | 25,568,552 | |
| | | | | | | | |
| | | | | | | | |
| | | Principal amount° | | | Value (U.S. $) | |
| |
Corporate Bonds (continued) | | | | | | | | |
| |
Insurance – 1.96% | | | | | | | | |
HUB International | | | | | | | | |
144A 7.875% 10/1/21 # | | | 2,745,000 | | | $ | 2,758,725 | |
144A 9.25% 2/15/21 # | | | 510,000 | | | | 540,600 | |
USI 144A 7.75% 1/15/21 # | | | 1,800,000 | | | | 1,827,000 | |
XLIT 6.50% 10/29/49 • | | | 1,997,000 | | | | 1,382,923 | |
| | | | | | | | |
| | | | | | | 6,509,248 | |
| | | | | | | | |
Media – 11.14% | | | | | | | | |
Altice Luxembourg 144A 7.75% 5/15/22 # | | | 1,190,000 | | | | 1,211,599 | |
CCO Holdings | | | | | | | | |
144A 5.375% 5/1/25 # | | | 505,000 | | | | 526,463 | |
144A 5.50% 5/1/26 # | | | 25,000 | | | | 26,156 | |
144A 5.75% 2/15/26 # | | | 1,620,000 | | | | 1,713,150 | |
144A 5.875% 5/1/27 # | | | 1,175,000 | | | | 1,242,563 | |
Cequel Communications Holdings I 144A 7.75% 7/15/25 # | | | 1,535,000 | | | | 1,642,450 | |
Columbus International 144A 7.375% 3/30/21 # | | | 1,035,000 | | | | 1,108,444 | |
CSC Holdings 5.25% 6/1/24 | | | 2,555,000 | | | | 2,438,466 | |
DISH DBS | | | | | | | | |
5.875% 11/15/24 | | | 467,000 | | | | 452,406 | |
144A 7.75% 7/1/26 # | | | 1,936,000 | | | | 2,012,230 | |
Gray Television 144A 5.875% 7/15/26 # | | | 1,655,000 | | | | 1,705,477 | |
Lamar Media 144A 5.75% 2/1/26 # | | | 1,615,000 | | | | 1,736,125 | |
Midcontinent Communications & Midcontinent Finance 144A 6.875%
8/15/23 # | | | 1,130,000 | | | | 1,186,500 | |
Neptune Finco 144A 10.875% 10/15/25 # | | | 425,000 | | | | 498,313 | |
Nexstar Escrow 144A 5.625% 8/1/24 # | | | 2,905,000 | | | | 2,959,469 | |
RCN Telecom Services 144A 8.50% 8/15/20 # | | | 1,650,000 | | | | 1,734,563 | |
SFR Group 144A 7.375% 5/1/26 # | | | 3,370,000 | | | | 3,370,000 | |
Sirius XM Radio 144A 5.375% 4/15/25 # | | | 1,660,000 | | | | 1,709,285 | |
Tribune Media 5.875% 7/15/22 | | | 1,860,000 | | | | 1,906,500 | |
Unitymedia 144A 6.125% 1/15/25 # | | | 1,535,000 | | | | 1,627,100 | |
Virgin Media Secured Finance 144A 5.25% 1/15/26 # | | | 1,995,000 | | | | 1,999,987 | |
VTR Finance 144A 6.875% 1/15/24 # | | | 2,060,000 | | | | 2,126,950 | |
WideOpenWest Finance 10.25% 7/15/19 | | | 2,055,000 | | | | 2,150,044 | |
| | | | | | | | |
| | | | | | | 37,084,240 | |
| | | | | | | | |
Services – 7.74% | | | | | | | | |
Air Medical Merger Sub 144A 6.375% 5/15/23 # | | | 1,900,000 | | | | 1,843,000 | |
BlueLine Rental Finance 144A 7.00% 2/1/19 # | | | 1,460,000 | | | | 1,350,500 | |
Communications Sales & Leasing | | | | | | | | |
144A 6.00% 4/15/23 # | | | 660,000 | | | | 682,691 | |
8.25% 10/15/23 | | | 855,000 | | | | 877,444 | |
ESH Hospitality 144A 5.25% 5/1/25 # | | | 2,290,000 | | | | 2,290,000 | |
| | |
| Schedule of investments | | |
| Delaware High-Yield Opportunities Fund | | |
| | | | | | | | |
| | | Principal amount° | | | Value (U.S. $) | |
| |
Corporate Bonds (continued) | | | | | | | | |
| |
Services (continued) | | | | | | | | |
GEO Group | | | | | | | | |
5.875% 10/15/24 | | | 590,000 | | | $ | 607,700 | |
6.00% 4/15/26 | | | 1,215,000 | | | | 1,249,931 | |
GFL Environmental 144A 9.875% 2/1/21 # | | | 1,190,000 | | | | 1,297,100 | |
Iron Mountain U.S. Holdings 144A 5.375% 6/1/26 # | | | 1,785,000 | | | | 1,814,006 | |
Mattamy Group 144A 6.50% 11/15/20 # | | | 1,170,000 | | | | 1,162,687 | |
NES Rentals Holdings 144A 7.875% 5/1/18 # | | | 1,035,000 | | | | 1,014,300 | |
OPE KAG Finance Sub 144A 7.875% 7/31/23 # | | | 1,330,000 | | | | 1,353,275 | |
Prime Security Services Borrower 144A 9.25% 5/15/23 # | | | 3,160,000 | | | | 3,381,200 | |
Scientific Games 8.125% 9/15/18 | | | 890,000 | | | | 890,000 | |
Team Health 144A 7.25% 12/15/23 # | | | 1,190,000 | | | | 1,300,075 | |
United Rentals North America | | | | | | | | |
5.50% 7/15/25 | | | 1,010,000 | | | | 1,042,078 | |
5.75% 11/15/24 | | | 1,475,000 | | | | 1,537,687 | |
Vander Intermediate Holding II 144A PIK 9.75% 2/1/19 #❆ | | | 1,035,000 | | | | 595,125 | |
XPO Logistics 144A 6.50% 6/15/22 # | | | 1,490,000 | | | | 1,482,550 | |
| | | | | | | | |
| | | | | | | 25,771,349 | |
| | | | | | | | |
Technology & Electronics – 5.51% | | | | | | | | |
CommScope 144A 5.50% 6/15/24 # | | | 900,000 | | | | 939,375 | |
CommScope Technologies Finance 144A 6.00% 6/15/25 # | | | 835,000 | | | | 885,100 | |
Diamond 1 Finance 144A 8.10% 7/15/36 # | | | 1,300,000 | | | | 1,485,120 | |
Entegris 144A 6.00% 4/1/22 # | | | 1,610,000 | | | | 1,664,337 | |
First Data 144A 7.00% 12/1/23 # | | | 3,445,000 | | | | 3,556,963 | |
Infor Software Parent 144A PIK 7.125% 5/1/21 #❆ | | | 325,000 | | | | 306,313 | |
Infor U.S. 6.50% 5/15/22 | | | 2,205,000 | | | | 2,193,975 | |
Micron Technology | | | | | | | | |
144A 5.25% 8/1/23 # | | | 935,000 | | | | 841,500 | |
144A 7.50% 9/15/23 # | | | 770,000 | | | | 843,874 | |
Microsemi 144A 9.125% 4/15/23 # | | | 1,805,000 | | | | 2,057,700 | |
Sensata Technologies UK Financing 144A 6.25% 2/15/26 # | | | 1,545,000 | | | | 1,678,256 | |
Solera 144A 10.50% 3/1/24 # | | | 1,120,000 | | | | 1,214,506 | |
Western Digital 144A 10.50% 4/1/24 # | | | 605,000 | | | | 682,894 | |
| | | | | | | | |
| | | | | | | 18,349,913 | |
| | | | | | | | |
Telecommunications – 7.66% | | | | | | | | |
CenturyLink | | | | | | | | |
6.75% 12/1/23 | | | 1,935,000 | | | | 2,019,656 | |
7.50% 4/1/24 | | | 255,000 | | | | 272,850 | |
Cogent Communications Finance 144A 5.625% 4/15/21 #@ | | | 1,470,000 | | | | 1,484,700 | |
Cogent Communications Group 144A 5.375% 3/1/22 # | | | 705,000 | | | | 726,150 | |
| | | | | | | | |
| | | Principal amount° | | | Value (U.S. $) | |
| |
Corporate Bonds (continued) | | | | | | | | |
| |
Telecommunications (continued) | | | | | | | | |
Digicel | | | | | | | | |
144A 6.00% 4/15/21 # | | | 350,000 | | | $ | 326,813 | |
144A 6.75% 3/1/23 # | | | 1,580,000 | | | | 1,472,560 | |
Digicel Group 144A 8.25% 9/30/20 # | | | 1,625,000 | | | | 1,490,937 | |
Frontier Communications | | | | | | | | |
10.50% 9/15/22 | | | 1,510,000 | | | | 1,636,463 | |
11.00% 9/15/25 | | | 1,470,000 | | | | 1,574,737 | |
Level 3 Financing | | | | | | | | |
5.375% 1/15/24 | | | 330,000 | | | | 346,913 | |
5.375% 5/1/25 | | | 975,000 | | | | 1,027,406 | |
Sable International Finance 144A 6.875% 8/1/22 # | | | 955,000 | | | | 983,650 | |
Sprint | | | | | | | | |
7.125% 6/15/24 | | | 625,000 | | | | 555,500 | |
7.25% 9/15/21 | | | 1,560,000 | | | | 1,463,483 | |
7.875% 9/15/23 | | | 640,000 | | | | 587,603 | |
Sprint Communications | | | | | | | | |
144A 7.00% 3/1/20 # | | | 675,000 | | | | 719,719 | |
7.00% 8/15/20 | | | 1,242,000 | | | | 1,185,862 | |
144A 9.00% 11/15/18 # | | | 1,010,000 | | | | 1,098,375 | |
T-Mobile USA | | | | | | | | |
6.00% 3/1/23 | | | 575,000 | | | | 610,069 | |
6.00% 4/15/24 | | | 370,000 | | | | 395,785 | |
6.375% 3/1/25 | | | 1,145,000 | | | | 1,229,444 | |
6.50% 1/15/26 | | | 1,120,000 | | | | 1,217,160 | |
Wind Acquisition Finance 144A 7.375% 4/23/21 # | | | 1,725,000 | | | | 1,720,687 | |
Zayo Group 6.00% 4/1/23 | | | 1,300,000 | | | | 1,358,500 | |
| | | | | | | | |
| | | | | | | 25,505,022 | |
| | | | | | | | |
Utilities – 2.99% | | | | | | | | |
AES | | | | | | | | |
5.50% 4/15/25 | | | 1,405,000 | | | | 1,445,394 | |
6.00% 5/15/26 | | | 285,000 | | | | 300,675 | |
Calpine | | | | | | | | |
5.50% 2/1/24 | | | 1,220,000 | | | | 1,223,050 | |
5.75% 1/15/25 | | | 1,625,000 | | | | 1,629,063 | |
Dynegy | | | | | | | | |
7.375% 11/1/22 | | | 125,000 | | | | 123,125 | |
7.625% 11/1/24 | | | 2,230,000 | | | | 2,174,250 | |
Emera 6.75% 6/15/76 • | | | 1,645,000 | | | | 1,781,556 | |
Enel 144A 8.75% 9/24/73 #• | | | 1,108,000 | | | | 1,286,665 | |
| | | | | | | | |
| | | | | | | 9,963,778 | |
| | | | | | | | |
Total Corporate Bonds (cost $288,671,068) | | | | | | | 294,991,748 | |
| | | | | | | | |
| | |
| Schedule of investments | | |
| Delaware High-Yield Opportunities Fund | | |
| | | | | | | | |
| | | Principal amount° | | | Value (U.S. $) | |
| |
Senior Secured Loans – 6.66%« | | | | | | | | |
| |
Accudyne Industries Borrower 1st Lien 4.00% 12/13/19 | | | 1,866,580 | | | $ | 1,738,253 | |
Amaya Holdings 1st Lien 5.00% 8/1/21 | | | 1,596,935 | | | | 1,582,249 | |
Applied Systems Tranche 2nd Lien 7.50% 1/23/22 @ | | | 3,122,132 | | | | 3,137,743 | |
BJ’s Wholesale Club 2nd Lien 8.50% 3/31/20 | | | 1,894,931 | | | | 1,884,865 | |
Blue Ribbon 1st Lien 5.00% 11/13/21 | | | 1,052,363 | | | | 1,058,940 | |
Flint Group 2nd Lien 8.25% 9/7/22 @ | | | 1,985,000 | | | | 1,865,900 | |
FMG Resources August 2006 Pty 1st Lien 4.25% 6/30/19 | | | 1,730,527 | | | | 1,698,485 | |
Frank Russell Tranche B 1st Lien 6.75% 6/1/23 | | | 947,000 | | | | 894,323 | |
Immucor Tranche B2 1st Lien 5.00% 8/17/18 | | | 1,396,382 | | | | 1,356,819 | |
KIK Custom Products 1st Lien 6.00% 8/26/22 @ | | | 1,022,549 | | | | 1,019,566 | |
KRATON Polymers Tranche B 1st Lien 6.00% 1/6/22 | | | 325,000 | | | | 323,578 | |
Marina District Finance Tranche B 1st Lien 6.50% 8/15/18 | | | 824,866 | | | | 826,241 | |
Mohegan Tribal Gaming Authority Tranche B 1st Lien 5.50% 6/15/18 | | | 1,218,569 | | | | 1,218,759 | |
Neiman Marcus Group 1st Lien 4.25% 10/25/20 | | | 468,798 | | | | 442,399 | |
Solera Tranche B 1st Lien 5.75% 3/3/23 | | | 613,463 | | | | 619,268 | |
Stardust Finance Holdings 2nd Lien 10.50% 3/13/23 | | | 820,000 | | | | 812,825 | |
Stardust Finance Holdings Tranche B 1st Lien 6.50% 3/13/22 @ | | | 853,481 | | | | 850,280 | |
Windstream Services Tranche B6 1st Lien 5.75% 3/29/21 | | | 835,905 | | | | 843,219 | |
| | | | | | | | |
Total Senior Secured Loans (cost $21,869,104) | | | | | | | 22,173,712 | |
| | | | | | | | |
| | |
| | | Number of Shares | | | | |
| |
Common Stock – 0.00% | | | | | | | | |
| |
Century Communications @=† | | | 4,250,000 | | | | 0 | |
| | | | | | | | |
Total Common Stock (cost $128,662) | | | | | | | 0 | |
| | | | | | | | |
|
| |
Preferred Stock – 1.67% | | | | | | | | |
| |
Bank of America 6.50% • | | | 1,970,000 | | | | 2,153,456 | |
GMAC Capital Trust I 6.411% • | | | 73,000 | | | | 1,855,660 | |
Morgan Stanley 5.55% • | | | 1,520,000 | | | | 1,540,900 | |
| | | | | | | | |
Total Preferred Stock (cost $5,411,900) | | | | | | | 5,550,016 | |
| | | | | | | | |
| | |
| | | Principal amount° | | | | |
| |
Short-Term Investments – 2.68% | | | | | | | | |
| |
Repurchase Agreements – 2.68% | | | | | | | | |
Bank of America Merrill Lynch
0.29%, dated 7/29/16, to be repurchased on 8/1/16, repurchase price $2,526,836 (collateralized by U.S. government obligations 3.375% 5/15/44; market value $2,577,312) | | | 2,526,775 | | | $ | 2,526,775 | |
| | | | | | | | |
| | | Principal amount° | | | Value (U.S. $) | |
| |
Short-Term Investments (continued) | | | | | | | | |
| |
Repurchase Agreements (continued) | | | | | | | | |
Bank of Montreal
0.26%, dated 7/29/16, to be repurchased on 8/1/16, repurchase price $4,211,383 (collateralized by U.S. government obligations 0.125%-3.125% 2/15/19-11/15/45; market value $4,295,518) | | | 4,211,292 | | | $ | 4,211,292 | |
BNP Paribas
0.33%, dated 7/29/16, to be repurchased on 8/1/16, repurchase price $2,168,993 (collateralized by U.S. government obligations 0.00%-4.25% 8/31/19-11/15/40; market value $2,212,312) | | | 2,168,933 | | | | 2,168,933 | |
| | | | | | | | |
Total Short-Term Investments (cost $8,907,000) | | | | | | | 8,907,000 | |
| | | | | | | | |
| | |
Total Value of Securities – 99.83%
(cost $325,692,204) | | | | | | $ | 332,337,996 | |
| | | | | | | | |
| # | Security exempt from registration under Rule 144A of the Securities Act of 1933, as amended. At July 31, 2016, the aggregate value of Rule 144A securities was $163,872,010, which represents 49.22% of the Fund’s net assets. See Note 10 in “Notes to financial statements.” |
| @ | Illiquid security. At July 31, 2016, the aggregate value of illiquid securities was $8,358,189, which represents 2.51% of the Fund’s net assets. See Note 10 in “Notes to financial statements.” |
| ✥ | 100% of the income received was in the form of additional par. |
| ❆ | 100% of the income received was in the form of cash. |
| = | Security is being fair valued in accordance with the Fund’s fair valuation policy. At July 31, 2016, the aggregate value of fair valued securities was $0, which represents 0.00% of the Fund’s net assets. See Note 1 in “Notes to financial statements.” |
| ° | Principal amount shown is stated in U.S. dollars unless noted that the security is denominated in another currency. |
| † | Non-income-producing security. |
| • | Variable rate security. The rate shown is the rate as of July 31, 2016. Interest rates reset periodically. |
| « | Senior secured loans generally pay interest at rates which are periodically redetermined by reference to a base lending rate plus a premium. These base lending rates are generally: (i) the prime rate offered by one or more U.S. banks, (ii) the lending rate offered by one or more European banks such as the London Interbank Offered Rate (LIBOR), and (iii) the certificate of deposit rate. Senior secured loans may be subject to restrictions on resale. Stated rate in effect at July 31, 2016. |
PIK – Payment-in-kind
See accompanying notes, which are an integral part of the financial statements.
| | |
| Statement of assets and liabilities | | |
| Delaware High-Yield Opportunities Fund | | July 31, 2016 |
| | | | |
Assets: | | | | |
Investments, at value1 | | $ | 323,430,996 | |
Short-term investments, at value2 | | | 8,907,000 | |
Cash | | | 2,838,448 | |
Interest receivable | | | 5,689,234 | |
Receivable for securities sold | | | 3,036,199 | |
Receivable for fund shares sold | | | 127,354 | |
Other assets3 | | | 786,990 | |
| | | | |
Total assets | | | 344,816,221 | |
| | | | |
| |
Liabilities: | | | | |
Payable for securities purchased | | | 6,959,613 | |
Payable for fund shares redeemed | | | 1,436,264 | |
Income distribution payable | | | 458,880 | |
Investment management fees payable to affiliates | | | 186,749 | |
Other accrued expenses | | | 146,153 | |
Distribution fees payable to affiliates | | | 80,690 | |
Dividend disbursing and transfer agent fees and expenses payable to affiliates | | | 5,793 | |
Audit and tax fees payable | | | 4,128 | |
Accounting and administration expenses payable to affiliates | | | 1,340 | |
Trustees’ fees and expenses payable | | | 812 | |
Legal fees payable to affiliates | | | 492 | |
Reports and statements to shareholders payable to affiliates | | | 140 | |
Bond proceeds payable3 | | | 2,623,299 | |
| | | | |
Total liabilities | | | 11,904,353 | |
| | | | |
Total Net Assets | | $ | 332,911,868 | |
| | | | |
| |
Net Assets Consist of: | | | | |
Paid-in capital | | $ | 410,613,048 | |
Distributions in excess of net investment income | | | (482,938 | ) |
Accumulated net realized loss on investments | | | (83,864,034 | ) |
Net unrealized appreciation of investments | | | 6,645,792 | |
| | | | |
Total Net Assets | | $ | 332,911,868 | |
| | | | |
| | | | |
Net Asset Value | | | | |
Class A: | | | | |
Net assets | | $ | 173,814,536 | |
Shares of beneficial interest outstanding, unlimited authorization, no par | | | 46,511,280 | |
Net asset value per share | | $ | 3.74 | |
Sales charge | | | 4.50 | % |
Offering price per share, equal to net asset value per share / (1 – sales charge) | | $ | 3.92 | |
| |
Class C: | | | | |
Net assets | | $ | 46,842,333 | |
Shares of beneficial interest outstanding, unlimited authorization, no par | | | 12,518,526 | |
Net asset value per share | | $ | 3.74 | |
| |
Class R: | | | | |
Net assets | | $ | 8,766,126 | |
Shares of beneficial interest outstanding, unlimited authorization, no par | | | 2,338,315 | |
Net asset value per share | | $ | 3.75 | |
| |
Institutional Class: | | | | |
Net assets | | $ | 103,488,873 | |
Shares of beneficial interest outstanding, unlimited authorization, no par | | | 27,699,185 | |
Net asset value per share | | $ | 3.74 | |
| |
| | | | | |
1 Investments, at cost | | $ | 316,785,204 | |
2 Short-term investments, at cost | | | 8,907,000 | |
3 See Note 12 in “Notes to financial statements.” | | | | |
See accompanying notes, which are an integral part of the financial statements.
| | |
| Statement of operations | | |
| Delaware High-Yield Opportunities Fund | | Year ended July 31, 2016 |
| | | | |
Investment Income: | | | | |
Interest | | $ | 25,810,964 | |
Dividends | | | 260,481 | |
| | | | |
| | | 26,071,445 | |
| | | | |
| |
Expenses: | | | | |
Management fees | | | 2,406,684 | |
Distribution expenses — Class A | | | 479,702 | |
Distribution expenses — Class C | | | 523,976 | |
Distribution expenses — Class R | | | 49,246 | |
Dividend disbursing and transfer agent fees and expenses | | | 493,890 | |
Accounting and administration expenses | | | 120,105 | |
Reports and statements to shareholders | | | 93,625 | |
Registration fees | | | 66,495 | |
Audit and tax fees | | | 45,442 | |
Legal fees | | | 35,612 | |
Custodian fees | | | 21,427 | |
Trustees’ fees and expenses | | | 18,239 | |
Other | | | 34,580 | |
| | | | |
| | | 4,389,023 | |
Less expenses waived | | | (325,128 | ) |
Less expense paid indirectly | | | (766 | ) |
| | | | |
Total operating expenses | | | 4,063,129 | |
| | | | |
Net Investment Income | | | 22,008,316 | |
| | | | |
| |
Net Realized and Unrealized Gain (Loss): | | | | |
Net realized loss on investments | | | (50,513,603 | ) |
Net change in unrealized appreciation (depreciation) of: | | | | |
Investments | | | 22,155,575 | |
Foreign currencies | | | (6 | ) |
| | | | |
Net change in unrealized appreciation (depreciation) | | | 22,155,569 | |
| | | | |
Net Realized and Unrealized Loss | | | (28,358,034 | ) |
| | | | |
Net Decrease in Net Assets Resulting from Operations | | $ | (6,349,718 | ) |
| | | | |
See accompanying notes, which are an integral part of the financial statements.
This page intentionally left blank.
| | |
| Statements of changes in net assets | | |
| Delaware High-Yield Opportunities Fund | | |
| | | | | | | | |
| | | Year ended | |
| | | 7/31/16 | | | 7/31/15 | |
| | |
Increase (Decrease) in Net Assets from Operations: | | | | | | | | |
Net investment income | | $ | 22,008,316 | | | $ | 34,258,936 | |
Net realized loss | | | (50,513,603 | ) | | | (20,512,248 | ) |
Net change in unrealized appreciation (depreciation) | | | 22,155,569 | | | | (33,838,612 | ) |
| | | | | | | | |
Net decrease in net assets resulting from operations | | | (6,349,718 | ) | | | (20,091,924 | ) |
| | | | | | | | |
| | |
Dividends and Distributions to Shareholders from: | | | | | | | | |
Net investment income: | | | | | | | | |
Class A | | | (11,219,277 | ) | | | (16,005,474 | ) |
Class B | | | — | | | | (11,663 | ) |
Class C | | | (2,657,517 | ) | | | (3,877,437 | ) |
Class R | | | (548,084 | ) | | | (796,438 | ) |
Institutional Class | | | (7,022,928 | ) | | | (13,398,301 | ) |
| | |
Return of capital: | | | | | | | | |
Class A | | | (150,785 | ) | | | — | |
Class C | | | (40,584 | ) | | | — | |
Class R | | | (7,580 | ) | | | — | |
Institutional Class | | | (89,798 | ) | | | — | |
| | |
Net realized gain: | | | | | | | | |
Class A | | | — | | | | (4,128,685 | ) |
Class C | | | — | | | | (1,125,756 | ) |
Class R | | | — | | | | (200,283 | ) |
Institutional Class | | | — | | | | (3,279,926 | ) |
| | | | | | | | |
| | | (21,736,553 | ) | | | (42,823,963 | ) |
| | | | | | | | |
| | |
Capital Share Transactions: | | | | | | | | |
Proceeds from shares sold: | | | | | | | | |
Class A | | | 11,038,316 | | | | 48,226,707 | |
Class C | | | 4,297,791 | | | | 5,087,511 | |
Class R | | | 2,431,583 | | | | 4,147,100 | |
Institutional Class | | | 24,823,227 | | | | 72,465,025 | |
| | | | | | | | |
| | | Year ended | |
| | | 7/31/16 | | | 7/31/15 | |
| | |
Capital Share Transactions (continued): | | | | | | | | |
Net asset value of shares issued upon reinvestment of dividends and distributions: | | | | | | | | |
Class A | | $ | 9,902,692 | | | $ | 17,820,100 | |
Class B | | | — | | | | 10,535 | |
Class C | | | 2,457,184 | | | | 4,526,942 | |
Class R | | | 550,479 | | | | 997,863 | |
Institutional Class | | | 6,872,798 | | | | 15,999,960 | |
| | | | | | | | |
| | | 62,374,070 | | | | 169,281,743 | |
| | | | | | | | |
Cost of shares redeemed: | | | | | | | | |
Class A | | | (71,228,482 | ) | | | (125,187,789 | ) |
Class B | | | — | | | | (1,327,550 | ) |
Class C | | | (22,321,850 | ) | | | (24,223,790 | ) |
Class R | | | (6,471,729 | ) | | | (7,228,870 | ) |
Institutional Class | | | (66,099,003 | ) | | | (150,755,771 | ) |
| | | | | | | | |
| | | (166,121,064 | ) | | | (308,723,770 | ) |
| | | | | | | | |
Decrease in net assets derived from capital share transactions | | | (103,746,994 | ) | | | (139,442,027 | ) |
| | | | | | | | |
Net Decrease in Net Assets | | | (131,833,265 | ) | | | (202,357,914 | ) |
| | |
Net Assets: | | | | | | | | |
Beginning of year | | | 464,745,133 | | | | 667,103,047 | |
| | | | | | | | |
End of year | | $ | 332,911,868 | | | $ | 464,745,133 | |
| | | | | | | | |
| | |
Distributions in excess of net investment income | | $ | (482,938 | ) | | $ | (771,685 | ) |
| | | | | | | | |
See accompanying notes, which are an integral part of the financial statements.
Financial highlights
Delaware High-Yield Opportunities Fund Class A
Selected data for each share of the Fund outstanding throughout each period were as follows:
|
| |
|
| |
|
Net asset value, beginning of period |
|
Income (loss) from investment operations: |
Net investment income1 |
Net realized and unrealized gain (loss) |
|
Total from investment operations |
|
|
Less dividends and distributions from: |
Net investment income |
Return of capital |
Net realized gain |
|
Total dividends and distributions |
|
|
Net asset value, end of period |
|
|
Total return2 |
|
Ratios and supplemental data: |
Net assets, end of period (000 omitted) |
Ratio of expenses to average net assets |
Ratio of expenses to average net assets prior to fees waived |
Ratio of net investment income to average net assets |
Ratio of net investment income to average net assets prior to fees waived |
Portfolio turnover |
|
|
| 1 | The average shares outstanding has been applied for per share information. |
| 2 | Total investment return is based on the change in net asset value of a share during the period and assumes reinvestment of dividends and distributions at net asset value and does not reflect the impact of a sales charge. Total investment return during all of the periods shown reflects a waiver by the manager. Performance would have been lower had the waiver not been in effect. |
See accompanying notes, which are an integral part of the financial statements.
| | | | | | | | | | | | | | | | | | | | | | | | | | | | |
| Year ended | |
| |
| | | 7/31/16 | | | | | 7/31/15 | | | | | 7/31/14 | | | | | 7/31/13 | | | | | 7/31/12 | |
| |
| | $ | 3.950 | | | | | $ | 4.380 | | | | | $ | 4.270 | | | | | $ | 4.110 | | | | | $ | 4.200 | |
| | | | | | | | | |
| | | | | | | | | | | | | | | | | | | | | | | | | | | | |
| | | 0.218 | | | | | | 0.238 | | | | | | 0.238 | | | | | | 0.271 | | | | | | 0.308 | |
| | | (0.213 | ) | | | | | (0.373 | ) | | | | | 0.121 | | | | | | 0.173 | | | | | | (0.090 | ) |
| | | | | | | | | | | | | | | | | | | | | | | | | | | | |
| | | 0.005 | | | | | | (0.135 | ) | | | | | 0.359 | | | | | | 0.444 | | | | | | 0.218 | |
| | | | | | | | | | | | | | | | | | | | | | | | | | | | |
| | | | | | | | | |
| | | | | | | | | | | | | | | | | | | | | | | | | | | | |
| | | (0.212 | ) | | | | | (0.237 | ) | | | | | (0.249 | ) | | | | | (0.284 | ) | | | | | (0.308 | ) |
| | | (0.003 | ) | | | | | — | | | | | | — | | | | | | — | | | | | | — | |
| | | — | | | | | | (0.058 | ) | | | | | — | | | | | | — | | | | | | — | |
| | | | | | | | | | | | | | | | | | | | | | | | | | | | |
| | | (0.215 | ) | | | | | (0.295 | ) | | | | | (0.249 | ) | | | | | (0.284 | ) | | | | | (0.308 | ) |
| | | | | | | | | | | | | | | | | | | | | | | | | | | | |
| | | | | | | | | |
| | $ | 3.740 | | | | | $ | 3.950 | | | | | $ | 4.380 | | | | | $ | 4.270 | | | | | $ | 4.110 | |
| | | | | | | | | | | | | | | | | | | | | | | | | | | | |
| | | | | | | | | |
| | | 0.41% | | | | | | (3.15% | ) | | | | | 8.59% | | | | | | 11.02% | | | | | | 5.73% | |
| | | | | | | | | |
| | | | | | | | | | | | | | | | | | | | | | | | | | | | |
| | $ | 173,815 | | | | | $ | 238,290 | | | | | $ | 327,088 | | | | | $ | 328,534 | | | | | $ | 311,859 | |
| | | 1.06% | | | | | | 1.07% | | | | | | 1.07% | | | | | | 1.11% | | | | | | 1.11% | |
| | | 1.15% | | | | | | 1.14% | | | | | | 1.12% | | | | | | 1.16% | | | | | | 1.18% | |
| | | 5.98% | | | | | | 5.78% | | | | | | 5.46% | | | | | | 6.33% | | | | | | 7.71% | |
| | | 5.89% | | | | | | 5.71% | | | | | | 5.41% | | | | | | 6.28% | | | | | | 7.64% | |
| | | 109% | | | | | | 86% | | | | | | 105% | | | | | | 88% | | | | | | 61% | |
| | | | | | | | | | | | | | | | | | | | | | | | | | | | |
| |
Financial highlights
Delaware High-Yield Opportunities Fund Class C
Selected data for each share of the Fund outstanding throughout each period were as follows:
|
| |
|
| |
|
Net asset value, beginning of period |
|
Income (loss) from investment operations: |
Net investment income1 |
Net realized and unrealized gain (loss) |
|
Total from investment operations |
|
|
Less dividends and distributions from: |
Net investment income |
Return of capital |
Net realized gain |
|
Total dividends and distributions |
|
|
Net asset value, end of period |
|
|
Total return2 |
|
Ratios and supplemental data: |
Net assets, end of period (000 omitted) |
Ratio of expenses to average net assets |
Ratio of expenses to average net assets prior to fees waived |
Ratio of net investment income to average net assets |
Ratio of net investment income to average net assets prior to fees waived |
Portfolio turnover |
|
|
| 1 | The average shares outstanding has been applied for per share information. |
| 2 | Total investment return is based on the change in net asset value of a share during the period and assumes reinvestment of dividends and distributions at net asset value and does not reflect the impact of a sales charge. Total investment return during all of the periods shown reflects a waiver by the manager. Performance would have been lower had the waiver not been in effect. |
See accompanying notes, which are an integral part of the financial statements.
| | | | | | | | | | | | | | | | | | | | | | | | | | | | |
| Year ended | |
| |
| | | 7/31/16 | | | | | 7/31/15 | | | | | 7/31/14 | | | | | 7/31/13 | | | | | 7/31/12 | |
| |
| | $ | 3.960 | | | | | $ | 4.390 | | | | | $ | 4.280 | | | | | $ | 4.120 | | | | | $ | 4.200 | |
| | | | | | | | | |
| | | | | | | | | | | | | | | | | | | | | | | | | | | | |
| | | 0.190 | | | | | | 0.207 | | | | | | 0.206 | | | | | | 0.241 | | | | | | 0.280 | |
| | | (0.223 | ) | | | | | (0.373 | ) | | | | | 0.121 | | | | | | 0.173 | | | | | | (0.080 | ) |
| | | | | | | | | | | | | | | | | | | | | | | | | | | | |
| | | (0.033 | ) | | | | | (0.166 | ) | | | | | 0.327 | | | | | | 0.414 | | | | | | 0.200 | |
| | | | | | | | | | | | | | | | | | | | | | | | | | | | |
| | | | | | | | | |
| | | | | | | | | | | | | | | | | | | | | | | | | | | | |
| | | (0.184 | ) | | | | | (0.206 | ) | | | | | (0.217 | ) | | | | | (0.254 | ) | | | | | (0.280 | ) |
| | | (0.003 | ) | | | | | — | | | | | | — | | | | | | — | | | | | | — | |
| | | — | | | | | | (0.058 | ) | | | | | — | | | | | | — | | | | | | — | |
| | | | | | | | | | | | | | | | | | | | | | | | | | | | |
| | | (0.187 | ) | | | | | (0.264 | ) | | | | | (0.217 | ) | | | | | (0.254 | ) | | | | | (0.280 | ) |
| | | | | | | | | | | | | | | | | | | | | | | | | | | | |
| | | | | | | | | |
| | $ | 3.740 | | | | | $ | 3.960 | | | | | $ | 4.390 | | | | | $ | 4.280 | | | | | $ | 4.120 | |
| | | | | | | | | | | | | | | | | | | | | | | | | | | | |
| | | | | | | | | |
| | | (0.59% | ) | | | | | (3.85% | ) | | | | | 7.79% | | | | | | 10.23% | | | | | | 5.24% | |
| | | | | | | | | |
| | | | | | | | | | | | | | | | | | | | | | | | | | | | |
| | $ | 46,842 | | | | | $ | 66,354 | | | | | $ | 89,127 | | | | | $ | 85,574 | | | | | $ | 65,771 | |
| | | 1.81% | | | | | | 1.82% | | | | | | 1.81% | | | | | | 1.81% | | | | | | 1.81% | |
| | | 1.90% | | | | | | 1.89% | | | | | | 1.86% | | | | | | 1.86% | | | | | | 1.88% | |
| | | 5.23% | | | | | | 5.03% | | | | | | 4.72% | | | | | | 5.63% | | | | | | 7.01% | |
| | | 5.14% | | | | | | 4.96% | | | | | | 4.67% | | | | | | 5.58% | | | | | | 6.94% | |
| | | 109% | | | | | | 86% | | | | | | 105% | | | | | | 88% | | | | | | 61% | |
| | | | | | | | | | | | | | | | | | | | | | | | | | | | |
| |
Financial highlights
Delaware High-Yield Opportunities Fund Class R
Selected data for each share of the Fund outstanding throughout each period were as follows:
|
| |
|
| |
|
Net asset value, beginning of period |
|
Income (loss) from investment operations: |
Net investment income1 |
Net realized and unrealized gain (loss) |
|
Total from investment operations |
|
|
Less dividends and distributions from: |
Net investment income |
Return of capital |
Net realized gain |
|
Total dividends and distributions |
|
|
Net asset value, end of period |
|
|
Total return2 |
|
Ratios and supplemental data: |
Net assets, end of period (000 omitted) |
Ratio of expenses to average net assets |
Ratio of expenses to average net assets prior to fees waived |
Ratio of net investment income to average net assets |
Ratio of net investment income to average net assets prior to fees waived |
Portfolio turnover |
|
|
| 1 | The average shares outstanding has been applied for per share information. |
| 2 | Total investment return is based on the change in net asset value of a share during the period and assumes reinvestment of dividends and distributions at net asset value. Total investment return during all of the periods shown reflects waivers by the manager and/or distributor. Performance would have been lower had the waivers not been in effect. |
See accompanying notes, which are an integral part of the financial statements.
| | | | | | | | | | | | | | | | | | | | | | | | | | | | |
| Year ended | |
| |
| | | 7/31/16 | | | | | 7/31/15 | | | | | 7/31/14 | | | | | 7/31/13 | | | | | 7/31/12 | |
| |
| | $ | 3.970 | | | | | $ | 4.390 | | | | | $ | 4.290 | | | | | $ | 4.120 | | | | | $ | 4.210 | |
| | | | | | | | | |
| | | | | | | | | | | | | | | | | | | | | | | | | | | | |
| | | 0.209 | | | | | | 0.229 | | | | | | 0.228 | | | | | | 0.263 | | | | | | 0.301 | |
| | | (0.223 | ) | | | | | (0.363 | ) | | | | | 0.111 | | | | | | 0.183 | | | | | | (0.090 | ) |
| | | | | | | | | | | | | | | | | | | | | | | | | | | | |
| | | (0.014 | ) | | | | | (0.134 | ) | | | | | 0.339 | | | | | | 0.446 | | | | | | 0.211 | |
| | | | | | | | | | | | | | | | | | | | | | | | | | | | |
| | | | | | | | | |
| | | | | | | | | | | | | | | | | | | | | | | | | | | | |
| | | (0.203 | ) | | | | | (0.228 | ) | | | | | (0.239 | ) | | | | | (0.276 | ) | | | | | (0.301 | ) |
| | | (0.003 | ) | | | | | — | | | | | | — | | | | | | — | | | | | | — | |
| | | — | | | | | | (0.058 | ) | | | | | — | | | | | | — | | | | | | — | |
| | | | | | | | | | | | | | | | | | | | | | | | | | | | |
| | | (0.206 | ) | | | | | (0.286 | ) | | | | | (0.239 | ) | | | | | (0.276 | ) | | | | | (0.301 | ) |
| | | | | | | | | | | | | | | | | | | | | | | | | | | | |
| | | | | | | | | |
| | $ | 3.750 | | | | | $ | 3.970 | | | | | $ | 4.390 | | | | | $ | 4.290 | | | | | $ | 4.120 | |
| | | | | | | | | | | | | | | | | | | | | | | | | | | | |
| | | | | | | | | |
| | | (0.09% | ) | | | | | (3.13% | ) | | | | | 8.08% | | | | | | 11.05% | | | | | | 5.51% | |
| | | | | | | | | |
| | | | | | | | | | | | | | | | | | | | | | | | | | | | |
| | $ | 8,766 | | | | | $ | 13,032 | | | | | $ | 16,580 | | | | | $ | 16,506 | | | | | $ | 14,637 | |
| | | 1.31% | | | | | | 1.32% | | | | | | 1.31% | | | | | | 1.31% | | | | | | 1.31% | |
| | | 1.40% | | | | | | 1.39% | | | | | | 1.38% | | | | | | 1.46% | | | | | | 1.48% | |
| | | 5.73% | | | | | | 5.53% | | | | | | 5.22% | | | | | | 6.13% | | | | | | 7.51% | |
| | | 5.64% | | | | | | 5.46% | | | | | | 5.15% | | | | | | 5.98% | | | | | | 7.34% | |
| | | 109% | | | | | | 86% | | | | | | 105% | | | | | | 88% | | | | | | 61% | |
| | | | | | | | | | | | | | | | | | | | | | | | | | | | |
| |
Financial highlights
Delaware High-Yield Opportunities Fund Institutional Class
Selected data for each share of the Fund outstanding throughout each period were as follows:
|
| |
|
| |
|
Net asset value, beginning of period |
|
Income (loss) from investment operations: |
Net investment income1 |
Net realized and unrealized gain (loss) |
|
Total from investment operations |
|
|
Less dividends and distributions from: |
Net investment income |
Return of capital |
Net realized gain |
|
Total dividends and distributions |
|
|
Net asset value, end of period |
|
|
Total return2 |
|
Ratios and supplemental data: |
Net assets, end of period (000 omitted) |
Ratio of expenses to average net assets |
Ratio of expenses to average net assets prior to fees waived |
Ratio of net investment income to average net assets |
Ratio of net investment income to average net assets prior to fees waived |
Portfolio turnover |
|
|
| 1 | The average shares outstanding has been applied for per share information. |
| 2 | Total investment return is based on the change in net asset value of a share during the period and assumes reinvestment of dividends and distributions at net asset value. Total investment return during all of the periods shown reflects a waiver by the manager. Performance would have been lower had the waiver not been in effect. |
See accompanying notes, which are an integral part of the financial statements.
| | | | | | | | | | | | | | | | | | | | | | | | | | | | |
| Year ended | |
| |
| | | 7/31/16 | | | | | 7/31/15 | | | | | 7/31/14 | | | | | 7/31/13 | | | | | 7/31/12 | |
| |
| | $ | 3.950 | | | | | $ | 4.380 | | | | | $ | 4.270 | | | | | $ | 4.110 | | | | | $ | 4.200 | |
| | | | | | | | | |
| | | | | | | | | | | | | | | | | | | | | | | | | | | | |
| | | 0.227 | | | | | | 0.249 | | | | | | 0.249 | | | | | | 0.284 | | | | | | 0.320 | |
| | | (0.213 | ) | | | | | (0.373 | ) | | | | | 0.121 | | | | | | 0.173 | | | | | | (0.090 | ) |
| | | | | | | | | | | | | | | | | | | | | | | | | | | | |
| | | 0.014 | | | | | | (0.124 | ) | | | | | 0.370 | | | | | | 0.457 | | | | | | 0.230 | |
| | | | | | | | | | | | | | | | | | | | | | | | | | | | |
| | | | | | | | | |
| | | | | | | | | | | | | | | | | | | | | | | | | | | | |
| | | (0.221 | ) | | | | | (0.248 | ) | | | | | (0.260 | ) | | | | | (0.297 | ) | | | | | (0.320 | ) |
| | | (0.003 | ) | | | | | — | | | | | | — | | | | | | — | | | | | | — | |
| | | — | | | | | | (0.058 | ) | | | | | — | | | | | | — | | | | | | — | |
| | | | | | | | | | | | | | | | | | | | | | | | | | | | |
| | | (0.224 | ) | | | | | (0.306 | ) | | | | | (0.260 | ) | | | | | (0.297 | ) | | | | | (0.320 | ) |
| | | | | | | | | | | | | | | | | | | | | | | | | | | | |
| | | | | | | | | |
| | $ | 3.740 | | | | | $ | 3.950 | | | | | $ | 4.380 | | | | | $ | 4.270 | | | | | $ | 4.110 | |
| | | | | | | | | | | | | | | | | | | | | | | | | | | | |
| | | | | | | | | |
| | | 0.66% | | | | | | (2.91% | ) | | | | | 8.87% | | | | | | 11.34% | | | | | | 6.03% | |
| | | | | | | | | |
| | | | | | | | | | | | | | | | | | | | | | | | | | | | |
| | $ | 103,489 | | | | | $ | 147,069 | | | | | $ | 232,971 | | | | | $ | 200,282 | | | | | $ | 185,843 | |
| | | 0.81% | | | | | | 0.82% | | | | | | 0.81% | | | | | | 0.81% | | | | | | 0.81% | |
| | | 0.90% | | | | | | 0.89% | | | | | | 0.86% | | | | | | 0.86% | | | | | | 0.88% | |
| | | 6.23% | | | | | | 6.03% | | | | | | 5.72% | | | | | | 6.63% | | | | | | 8.01% | |
| | | 6.14% | | | | | | 5.96% | | | | | | 5.67% | | | | | | 6.58% | | | | | | 7.94% | |
| | | 109% | | | | | | 86% | | | | | | 105% | | | | | | 88% | | | | | | 61% | |
| | | | | | | | | | | | | | | | | | | | | | | | | | | | |
| |
| | |
| Notes to financial statements | | |
| Delaware High-Yield Opportunities Fund | | July 31, 2016 |
Delaware Group® Income Funds (Trust) is organized as a Delaware statutory trust and offers four series: Delaware Corporate Bond Fund, Delaware Diversified Floating Rate Fund, Delaware Extended Duration Bond Fund, and Delaware High-Yield Opportunities Fund. These financial statements and the related notes pertain to Delaware High-Yield Opportunities Fund (Fund). The Trust is an open-end investment company. The Fund is considered diversified under the Investment Company Act of 1940 (1940 Act), as amended, and offers Class A, Class C, Class R, and Institutional Class shares. Class A shares are sold with a maximum front-end sales charge of 4.50%. Class A share purchases of $1,000,000 or more will incur a contingent deferred sales charge (CDSC) of 1.00% if redeemed during the first year, and 0.50% during the second year, provided that Delaware Distributors, L.P. (DDLP) paid a financial advisor a commission on the purchase of those shares. Effective Sept. 25, 2014, all remaining shares of Class B were converted to Class A shares. Class C shares are sold with a CDSC of 1.00%, if redeemed during the first 12 months. Class R and Institutional Class shares are not subject to a sales charge and are offered for sale exclusively to certain eligible investors.
The investment objective of the Fund is to seek total return and, as a secondary objective, high current income.
1. Significant Accounting Policies
The following accounting policies are in accordance with U.S. generally accepted accounting principles (U.S. GAAP) and are consistently followed by the Fund.
Security Valuation — Equity securities, except those traded on the Nasdaq Stock Market LLC (Nasdaq), are valued at the last quoted sales price as of the time of the regular close of the New York Stock Exchange on the valuation date. Equity securities traded on the Nasdaq are valued in accordance with the Nasdaq Official Closing Price, which may not be the last sales price. If, on a particular day, an equity security does not trade, the mean between the bid and ask prices will be used, which approximates fair value. Debt securities are valued based upon valuations provided by an independent pricing service or broker and reviewed by management. To the extent current market prices are not available, the pricing service may take into account developments related to the specific security, as well as transactions in comparable securities. U.S. government and agency securities are valued at the mean between the bid and ask prices, which approximates fair value. Valuations for fixed income securities utilize matrix systems, which reflect such factors as security prices, yields, maturities, and ratings, and are supplemented by dealer and exchange quotations. Generally, other securities and assets for which market quotations are not readily available are valued at fair value as determined in good faith under the direction of the Trust’s Board of Trustees (Board). In determining whether market quotations are readily available or fair valuation will be used, various factors will be taken into consideration, such as market closures or suspension of trading in a security.
Federal Income Taxes — No provision for federal income taxes has been made as the Fund intends to continue to qualify for federal income tax purposes as a regulated investment company under Subchapter M of the Internal Revenue Code of 1986, as amended, and make the requisite distributions to shareholders. The Fund evaluates tax positions taken or expected to be taken in the course of preparing the Fund’s tax returns to determine whether the tax positions are “more-likely-than-not” of being sustained by the applicable tax authority. Tax positions not deemed to meet the “more-likely-than-not” threshold are recorded as a tax benefit or expense in the current year. Management has analyzed
the Fund’s tax positions taken for all open federal income tax years (July 31, 2013–July 31, 2016), and has concluded that no provision for federal income tax is required in the Fund’s financial statements.
Class Accounting — Investment income and common expenses are allocated to the various classes of the Fund on the basis of “settled shares” of each class in relation to the net assets of the Fund. Realized and unrealized gain (loss) on investments are allocated to the various classes of the Fund on the basis of daily net assets of each class. Distribution expenses relating to a specific class are charged directly to that class.
Repurchase Agreements — The Fund may purchase certain U.S. government securities subject to the counterparty’s agreement to repurchase them at an agreed upon date and price. The counterparty will be required on a daily basis to maintain the value of the collateral subject to the agreement at not less than the repurchase price (including accrued interest). The agreements are conditioned upon the collateral being deposited under the Federal Reserve book-entry system with the Fund’s custodian or a third party subcustodian. In the event of default or bankruptcy by the other party to the agreement, retention of the collateral may be subject to legal proceedings. All open repurchase agreements as of the date of this report were entered into on July 29, 2016 and matured on the next business day.
Use of Estimates — The Fund is an investment company, whose financial statements are prepared in conformity with U.S. GAAP. Therefore, the Fund follows the accounting and reporting guidelines for investment companies. The preparation of financial statements in conformity with U.S. GAAP requires management to make estimates and assumptions that affect the fair value of investments, the reported amounts of assets and liabilities and disclosure of contingent assets and liabilities at the date of the financial statements, and the reported amounts of revenues and expenses during the reporting period. Actual results could differ from those estimates and the differences could be material.
Other — Expenses directly attributable to the Fund are charged directly to the Fund. Other expenses common to various funds within the Delaware Investments® Family of Funds are generally allocated among such funds on the basis of average net assets. Management fees and some other expenses are paid monthly. Security transactions are recorded on the date the securities are purchased or sold (trade date) for financial reporting purposes. Costs used in calculating realized gains and losses on the sale of investment securities are those of the specific securities sold. Dividend income is recorded on the ex-dividend date and interest income is recorded on the accrual basis. Discounts and premiums on debt securities are accreted or amortized to interest income, respectively, over the lives of the respective securities using the effective interest method. The Fund declares dividends daily from net investment income and pays the dividends monthly and declares and pays distributions from net realized gain on investments, if any, annually. The Fund may distribute more frequently, if necessary for tax purposes. Dividends and distributions, if any, are recorded on the ex-dividend date.
The Fund may receive earnings credits from its custodian when positive cash balances are maintained, which may be used to offset custody fees. There were no such earnings credits for the year ended July 31, 2016.
The Fund receives earnings credits from its transfer agent when positive cash balances are maintained, which may be used to offset transfer agent fees. If the amount earned is greater than $1.00, the expense paid under this arrangement is included on the “Statement of operations” under “Dividend
| | |
| Notes to financial statements | | |
| Delaware High-Yield Opportunities Fund | | |
1. Significant Accounting Policies (continued)
disbursing and transfer agent fees and expenses” with the corresponding expense offset shown under “Less expense paid indirectly.” For the year ended July 31, 2016, the Fund earned $766 under this agreement.
2. Investment Management, Administration Agreements, and Other Transactions with Affiliates
In accordance with the terms of its investment management agreement, the Fund pays Delaware Management Company (DMC), a series of Delaware Management Business Trust and the investment manager, an annual fee which is calculated daily at the rate of 0.65% on the first $500 million of average daily net assets of the Fund, 0.60% on the next $500 million, 0.55% on the next $1.5 billion, and 0.50% on average daily net assets in excess of $2.5 billion.
DMC has contractually agreed to waive all or a portion, if any, of its investment advisory fee and/or pay/reimburse the Fund to the extent necessary to ensure total annual operating expenses (excluding any distribution and service (12b-1) fees, acquired fund fees and expenses, taxes, interest, short sale and dividend interest expenses, brokerage fees, certain insurance costs, and nonroutine expenses or costs, including, but not limited to, those relating to reorganizations, litigation, conducting shareholder meetings, and liquidations (collectively, nonroutine expenses)), from exceeding 0.80% of the Fund’s average daily net assets from Aug. 1, 2015 through July 31, 2016.* These waivers and reimbursements may only be terminated by agreement of DMC and the Fund.
Delaware Investments Fund Services Company (DIFSC), an affiliate of DMC, provides fund accounting and financial administration oversight services to the Fund. For these services, DIFSC’s fees are calculated based on the aggregate daily net assets of the Delaware Investments® Family of Funds at the following annual rate: 0.0050% of the first $30 billion; 0.0045% of the next $10 billion; 0.0040% of the next $10 billion; and 0.0025% of aggregate average daily net assets in excess of $50 billion. The fees payable to DIFSC under the service agreement described above are allocated among all funds in the Delaware Investments Family of Funds on a relative net asset value (NAV) basis. For the year ended July 31, 2016, the Fund was charged $17,600 for these services. This amount is included on the “Statement of operations” under “Accounting and administration expenses.”
DIFSC is also the transfer agent and dividend disbursing agent of the Fund. For these services, DIFSC’s fees are calculated based on the aggregate daily net assets of the retail funds within the Delaware Investments Family of Funds at the following annual rate: 0.025% of the first $20 billion; 0.020% of the next $5 billion; 0.015% of the next $5 billion; and 0.013% on average daily net assets in excess of $30 billion. The fees payable to DIFSC under the service agreement described above are allocated among all retail funds in the Delaware Investments Family of Funds on a relative NAV basis. This amount is included on the “Statement of operations” under “Dividend disbursing and transfer agent fees and expenses.” For the year ended July 31, 2016, the Fund was charged $77,100 for these services. Pursuant to a sub-transfer agency agreement between DIFSC and BNY Mellon Investment Servicing (US) Inc. (BNYMIS), BNYMIS provides certain sub-transfer agency services to the Fund. Sub-transfer agency fees are paid by the Fund and are also included on the “Statement of operations” under “Dividend disbursing and transfer agent fees and expenses.”
Pursuant to a distribution agreement and distribution plan, the Fund pays DDLP, the distributor and an affiliate of DMC, annual 12b-1 fees of 0.25% of the average daily net assets of the Class A shares, 1.00% of the average daily net assets of the Class C shares, and 0.50% of the average daily net assets of the Class R shares. The Board has adopted a formula for calculating 12b-1 fees for the Fund’s Class A shares that went into effect on June 1, 1992. The Fund’s Class A shares are currently subject to a blended 12b-1 fees equal to the sum of: (i) 0.10% of the average daily net assets representing shares that were acquired prior to June 1, 1992, and (ii) 0.25% of the average daily net assets representing shares that were acquired on or after June 1, 1992. All Class A shareholders currently bear 12b-1 fees at the same rate, the blended rate based on the formula described above. This method of calculating Class A 12b-1 fees may be discontinued at the sole discretion of the Board. Institutional Class shares pay no 12b-1 fees.
As provided in the investment management agreement, the Fund bears a portion of the cost of certain resources shared with DMC, including the cost of internal personnel of DMC and/or its affiliates that provide legal, tax, and regulatory reporting services to the Fund. For the year ended July 31, 2016, the Fund was charged $7,897 for internal legal, tax, and regulatory services provided by DMC and/or its affiliates’ employees. This amount is included on the “Statement of operations” under “Legal fees.”
For the year ended July 31, 2016, DDLP earned $10,695 for commissions on sales of the Fund’s Class A shares. For the year ended July 31, 2016, DDLP received gross CDSC commissions of $9 and $3,177 on redemptions of the Fund’s Class A and Class C shares, respectively, and these commissions were entirely used to offset upfront commissions previously paid by DDLP to broker/dealers on sales of those shares.
Trustees’ fees include expenses accrued by the Fund for each Trustee’s retainer and meeting fees. Certain officers of DMC, DIFSC, and DDLP are officers and/or Trustees of the Trust. These officers and Trustees are paid no compensation by the Fund.
Cross trades for the year ended July 31, 2016, were executed by the Fund pursuant to procedures adopted by the Board designed to ensure compliance with Rule 17a-7 under the 1940 Act. Cross trading is the buying or selling of portfolio securities between funds of investment companies, or between a fund of an investment company and another entity, that are or could be considered affiliates by virtue of having a common investment advisor (or affiliated investment advisors), common directors/trustees and/or common officers. At its regularly scheduled meetings, the Board reviews such transactions for compliance with the procedures adopted by the Board. Pursuant to these procedures, for the year ended July 31, 2016, the Fund engaged in securities purchases of $1,190,119 and securities sales of $27,406,826, which resulted in net realized losses of $(728,128).
* The aggregate contractual waiver period covering this report is from Nov. 28, 2014 through Nov. 28, 2016.
| | |
| Notes to financial statements | | |
| Delaware High-Yield Opportunities Fund | | |
3. Investments
For the year ended July 31, 2016, the Fund made purchases and sales of investment securities other than short-term investments as follows:
| | | | |
Purchases | | $ | 390,612,348 | |
Sales | | | 487,684,814 | |
At July 31, 2016, the cost and unrealized appreciation (depreciation) of investments for federal income tax purposes were as follows:
| | | | |
Cost of investments | | $ | 325,558,765 | |
| | | | |
Aggregate unrealized appreciation of investments | | $ | 10,597,283 | |
Aggregate unrealized depreciation of investments | | | (3,818,052 | ) |
| | | | |
Net unrealized appreciation of investments | | $ | 6,779,231 | |
| | | | |
U.S. GAAP defines fair value as the price that the Fund would receive to sell an asset or pay to transfer a liability in an orderly transaction between market participants at the measurement date under current market conditions. A three-level hierarchy for fair value measurements has been established based upon the transparency of inputs to the valuation of an asset or liability. Inputs may be observable or unobservable and refer broadly to the assumptions that market participants would use in pricing the asset or liability. Observable inputs reflect the assumptions market participants would use in pricing the asset or liability based on market data obtained from sources independent of the reporting entity. Unobservable inputs reflect the reporting entity’s own assumptions about the assumptions that market participants would use in pricing the asset or liability based on the best information available under the circumstances. The Fund’s investment in its entirety is assigned a level based upon the observability of the inputs which are significant to the overall valuation. The three-level hierarchy of inputs is summarized below.
| | |
| Level 1 – | | Inputs are quoted prices in active markets for identical investments. (Examples: equity securities, open-end investment companies, futures contracts, exchange-traded options contracts) |
| |
| Level 2 – | | Other observable inputs, including, but not limited to: quoted prices for similar assets or liabilities in markets that are active, quoted prices for identical or similar assets or liabilities in markets that are not active, inputs other than quoted prices that are observable for the assets or liabilities (such as interest rates, yield curves, volatilities, prepayment speeds, loss severities, credit risks, and default rates), or other market-corroborated inputs. (Examples: debt securities, government securities, swap contracts, foreign currency exchange contracts, foreign securities utilizing international fair value pricing, broker-quoted securities, fair valued securities) |
| |
| Level 3 – | | Significant unobservable inputs, including the Fund’s own assumptions used to determine the fair value of investments. (Examples: broker-quoted securities, fair valued securities) |
Level 3 investments are valued using significant unobservable inputs. The Fund may also use an income-based valuation approach in which the anticipated future cash flows of the investment are discounted to calculate fair value. Discounts may also be applied due to the nature or duration of any restrictions on the disposition of the investments. Valuations may also be based upon current market prices of securities that are comparable in coupon, rating, maturity, and industry. The derived value of a
Level 3 investment may not represent the value which is received upon disposition and this could impact the results of operations.
The following table summarizes the valuation of the Fund’s investments by fair value hierarchy levels as of July 31, 2016:
| | | | | | | | | | | | | | | | |
Securities | | Level 1 | | | Level 2 | | | Level 3 | | | Total | |
Corporate Debt | | $ | — | | | $ | 295,707,268 | | | $ | — | | | $ | 295,707,268 | |
Senior Secured Loans | | | — | | | | 22,173,712 | | | | — | | | | 22,173,712 | |
Common Stock | | | — | | | | — | | | | — | | | | — | |
Preferred Stock1 | | | 1,855,660 | | | | 3,694,356 | | | | — | | | | 5,550,016 | |
Short-Term Investments | | | — | | | | 8,907,000 | | | | — | | | | 8,907,000 | |
| | | | | | | | | | | | | | | | |
| | | | |
Total Value of Securities | | $ | 1,855,660 | | | $ | 330,482,336 | | | $ | — | | | $ | 332,337,996 | |
| | | | | | | | | | | | | | | | |
The security that has been valued at zero on the “Schedule of investments” is considered to be a Level 3 investment in the table.
1Security type is valued across multiple levels. Level 1 investments represent exchange-traded investments, and Level 2 investments represent investments with observable input or matrix-priced investments. The amounts attributed to Level 1 investments, and Level 2 investments represent the following percentages of the total market value of this security type:
| | | | | | | | | | | | | | | | |
| | | Level 1 | | | | | Level 2 | | | | | Total | |
Preferred Stock | | | 33.44 | % | | | | | 66.56 | % | | | | | 100.00 | % |
During the year ended July 31, 2016, there were no transfers between Level 1 investments, Level 2 investments, or Level 3 investments that had a significant impact to the Fund. The Fund’s policy is to recognize transfers between levels at the beginning of the reporting period.
A reconciliation of Level 3 investments is presented when the Fund has a significant amount of Level 3 investments at the beginning, interim, or end of the period in relation to net assets. Management has determined not to provide additional disclosure on Level 3 inputs since the Level 3 investments are not considered significant to the Fund’s net assets at the end of the year.
| | |
| Notes to financial statements | | |
| Delaware High-Yield Opportunities Fund | | |
4. Dividend and Distribution Information
Income and long-term capital gain distributions are determined in accordance with federal income tax regulations, which may differ from U.S. GAAP. Additionally, distributions from net short-term gains on sales of investment securities are treated as ordinary income for federal income tax purposes. The tax character of dividends and distributions paid during the years ended July 31, 2016 and 2015 was as follows:
| | | | | | | | | | | | |
| | | Year ended | |
| | | 7/31/16 | | | | | | 7/31/15 | |
Ordinary income | | $ | 21,447,806 | | | | | | | $ | 42,713,627 | |
Long-term capital gains | | | — | | | | | | | | 110,336 | |
Return of Capital | | | 288,747 | | | | | | | | — | |
| | | | | | | | | | | | |
Total | | $ | 21,736,553 | | | | | | | $ | 42,823,963 | |
| | | | | | | | | | | | |
5. Components of Net Assets on a Tax Basis
As of July 31, 2016, the components of net assets on a tax basis were as follows:
| | | | |
Shares of beneficial interest | | $ | 410,613,048 | |
Distributions payable | | | (458,880 | ) |
Troubled debt litigation | | | (1,836,309 | ) |
Capital loss carryforwards | | | (82,185,222 | ) |
Unrealized appreciation of investments | | | 6,779,231 | |
| | | | |
Net assets | | $ | 332,911,868 | |
| | | | |
The differences between book basis and tax basis components of net assets are primarily attributable to tax deferral of losses on wash sales, tax treatment of trust preferred securities, and market discount and premium on debt instruments.
For financial reporting purposes, capital accounts are adjusted to reflect the tax character of permanent book/tax differences. Reclassifications are primarily due to tax treatment of market discount and premium on debt instruments. Results of operations and net assets were not affected by these reclassifications. For the year ended July 31, 2016, the Fund recorded the following reclassifications:
| | | | |
Distributions in excess of net investment income | | $ | (271,763 | ) |
Accumulated net realized loss | | | 271,763 | |
For federal income tax purposes, capital loss carryforwards may be carried forward and applied against future capital gains. Capital loss carryforwards of $12,611,587 remaining at July 31, 2016 will expire in 2017.
On Dec. 22, 2010, the Regulated Investment Company Modernization Act of 2010 (Act) was enacted, which changed various technical rules governing the tax treatment of regulated investment companies. The changes were generally effective for taxable years beginning after the date of enactment. Under the Act, the Fund is permitted to carry forward capital losses incurred in taxable years beginning after the date of enactment for an unlimited period. However, any losses incurred during those future taxable years will be required to be utilized prior to the losses incurred in pre-enactment taxable years, which carry an expiration date. As a result of this ordering rule, pre-enactment capital loss carryforwards may be more likely to expire unused. Additionally, post-enactment capital loss carryforwards will retain their
character as either short-term or long-term capital losses rather than being considered all short-term as permitted under previous regulation.
Losses incurred that will be carried forward under the Act are as follows:
| | | | | | | | |
| | | Loss carryforward character | |
| | | Short-term | | | | Long-term | |
| | $32,537,332 | | | | | $37,036,303 | |
6. Capital Shares
Transactions in capital shares were as follows:
| | | | | | | | | | | | |
| | | Year ended | |
| | | 7/31/16 | | | | | | 7/31/15 | |
Shares sold: | | | | | | | | | | | | |
Class A | | | 3,019,815 | | | | | | | | 11,660,844 | |
Class C | | | 1,192,571 | | | | | | | | 1,220,719 | |
Class R | | | 667,983 | | | | | | | | 996,496 | |
Institutional Class | | | 6,793,889 | | | | | | | | 17,318,634 | |
| | | |
Shares issued upon reinvestment of dividends and distributions: | | | | | | | | | | | | |
Class A | | | 2,710,084 | | | | | | | | 4,300,182 | |
Class B | | | — | | | | | | | | 2,400 | |
Class C | | | 671,195 | | | | | | | | 1,092,070 | |
Class R | | | 149,986 | | | | | | | | 240,345 | |
Institutional Class | | | 1,880,382 | | | | | | | | 3,867,146 | |
| | | | | | | | | | | | |
| | | 17,085,905 | | | | | | | | 40,698,836 | |
| | | | | | | | | | | | |
| | | |
Shares redeemed: | | | | | | | | | | | | |
Class A | | | (19,499,391 | ) | | | | | | | (30,363,748 | ) |
Class B | | | — | | | | | | | | (307,835 | ) |
Class C | | | (6,109,682 | ) | | | | | | | (5,872,858 | ) |
Class R | | | (1,765,897 | ) | | | | | | | (1,724,216 | ) |
Institutional Class | | | (18,185,078 | ) | | | | | | | (37,177,221 | ) |
| | | | | | | | | | | | |
| | | (45,560,048 | ) | | | | | | | (75,445,878 | ) |
| | | | | | | | | | | | |
Net decrease | | | (28,474,143 | ) | | | | | | | (34,747,042 | ) |
| | | | | | | | | | | | |
For the year ended July 31, 2015, 72,252 Class B shares were converted to 72,109 Class A shares valued at $311,512. The amounts are included in Class B redemptions and Class A subscriptions in the table above and the “Statements of changes in net assets.”
| | |
| Notes to financial statements | | |
| Delaware High-Yield Opportunities Fund | | |
6. Capital Shares (continued)
Certain shareholders may exchange shares of one class of shares for another class of shares in the same Fund. For the year ended July 31, 2016 and 2015, the Fund had the following exchange transactions. These exchange transactions are included as subscriptions and redemptions in the table on the previous page and the “Statements of changes in net assets.”
| | | | | | | | | | | | | | | | | | | | | | | | | | | | | | | | | | | |
| | | Exchange Redemptions | | | | Exchange
Subscriptions | | | | |
| | | | | | | |
| | | | | | | | | | | Institutional | | | | |
| | | Class A | | | | Class C | | | | Class | | | | |
Year ended | | Shares | | | | Shares | | | | Shares | | | | Value |
7/31/16 | | | | 108,834 | | | | | | | | | | 21,495 | | | | | | | | | | 130,773 | | | | | | | | | $ | 476,062 | |
7/31/15 | | | | 3,409 | | | | | | | | | | — | | | | | | | | | | 3,413 | | | | | | | | | | 13,890 | |
7. Line of Credit
The Fund, along with certain other funds in the Delaware Investments® Family of Funds (Participants), was a participant in a $275,000,000 revolving line of credit intended to be used for temporary or emergency purposes as an additional source of liquidity to fund redemptions of investor shares. Under the agreement, the Participants were charged an annual commitment fee of 0.08%, which was allocated across the Participants on the basis of each Participant’s allocation of the entire facility. The Participants were permitted to borrow up to a maximum of one third of their net assets under the agreement. Each Participant was individually, and not jointly, liable for its particular advances, if any, under the line of credit. The line of credit available under the agreement expired on Nov. 9, 2015.
On Nov. 9, 2015, the Fund, along with the other Participants, entered into an amendment to the agreement for a $155,000,000 revolving line of credit. The line of credit is to be used as described above and operates in substantially the same manner as the original agreement, with the exception of the annual commitment fee. Under the amendment to the agreement, the Participants are charged an annual commitment fee of 0.10%, which is allocated across the Participants on the basis of each Participant’s allocation of the entire facility. The line of credit available under the agreement expires on Nov. 7, 2016.
The Fund had no amounts outstanding as of July 31, 2016, or at any time during the year then ended.
8. Offsetting
In December 2011, the Financial Accounting Standards Board (FASB) issued guidance that expanded disclosure requirements on the offsetting of certain assets and liabilities. The disclosures are required for investments and derivative financial instruments subject to master netting or similar agreements which are eligible for offset on the “Statement of assets and liabilities” and require an entity to disclose both gross and net information about such investments and transactions in the financial statements. In January 2013, the FASB issued guidance that clarified which investments and transactions are subject to the offsetting disclosure requirements. The scope of the disclosure requirements for offsetting is limited to derivative instruments, repurchase agreements and reverse repurchase agreements, and securities borrowing.
In order to better define its contractual rights and to secure rights that will help the Fund mitigate its counterparty risk, the Fund entered into an International Swaps and Derivatives Association, Inc. Master Agreement (ISDA Master Agreement) or a similar agreement with certain of its derivative contract counterparties. An ISDA Master Agreement is a bilateral agreement between the Fund and a counterparty that governs over-the-counter (OTC) derivatives and foreign exchange contracts and typically contains, among other things, collateral posting items and netting provisions in the event of a default and/or termination event. Under an ISDA Master Agreement, the Fund may, under certain circumstances, offset with the counterparty certain derivative financial instruments’ payables and/or receivables with collateral held and/or posted and create one single net payment. The provisions of the ISDA Master Agreement typically permit a single net payment in the event of default (close-out), including the bankruptcy or insolvency of the counterparty. However, bankruptcy or insolvency laws of a particular jurisdiction may impose restrictions on or prohibitions against the right of offset in bankruptcy, insolvency, or other events.
At July 31, 2016, the Fund had the following assets and liabilities subject to offsetting provisions:
Master Repurchase Agreements
| | | | | | | | | | | | | | | | | | | | | | | | | |
| | | | | Fair Value of | | Cash | | Net | | |
| | | Repurchase | | Non-Cash | | Collateral | | Collateral | | |
Counterparty | | Agreements | | Collateral Received | | Received | | Received | | Net Exposure(a) |
Bank of America | | | | | | | | | | | | | | | | | | | | | | | | | |
Merrill Lynch | | | $ | 2,526,775 | | | | $ | (2,526,775 | ) | | | $ | — | | | | $ | (2,526,775 | ) | | | $ | — | |
Bank of Montreal | | | | 4,211,292 | | | | | (4,211,292 | ) | | | | — | | | | | (4,211,292 | ) | | | | — | |
BNP Paribas | | | | 2,168,933 | | | | | (2,168,933 | ) | | | | — | | | | | (2,168,933 | ) | | | | — | |
| | | | | | | | | | | | | | | | | | | | | | | | | |
Total | | | $ | 8,907,000 | | | | $ | (8,907,000 | ) | | | $ | — | | | | $ | (8,907,000 | ) | | | $ | — | |
| | | | | | | | | | | | | | | | | | | | | | | | | |
(a)Net exposure represents the receivable (payable) that would be due from (to) the counterparty in the event of default.
9. Securities Lending
The Fund, along with other funds in the Delaware Investments® Family of Funds, may lend its securities pursuant to a security lending agreement (Lending Agreement) with The Bank of New York Mellon (BNY Mellon). At the time a security is loaned, the borrower must post collateral equal to the required percentage of the market value of the loaned security, including any accrued interest. The required percentage is: (1) 102% with respect to U.S. securities and foreign securities that are denominated and payable in U.S. dollars; and (2) 105% with respect to foreign securities. With respect to each loan, if on any business day the aggregate market value of securities collateral plus cash collateral held is less than the aggregate market value of the securities that are the subject of such loan, the borrower will be notified to provide additional collateral by the end of the following business day, which, together with the collateral already held, will be not less than the applicable initial collateral requirements for such security loan. If the aggregate market value of securities collateral and cash collateral held with respect to a security loan exceeds the applicable initial collateral requirement, upon the request of the borrower, BNY Mellon must return enough collateral to the borrower by the end of the following business day to reduce the value of the remaining collateral to the applicable initial collateral requirement for such security loan.
| | |
| Notes to financial statements | | |
| Delaware High-Yield Opportunities Fund | | |
9. Securities Lending (continued)
As a result of the foregoing, the value of the collateral held with respect to a loaned security on any particular day may be more or less than the value of the security on loan.
Prior to Dec. 29, 2015, cash collateral received was generally invested in the Delaware Investments Collateral Fund No. 1 (Collective Trust), a pooled account established by BNY Mellon for the use of funds managed by DMC that participate in BNY Mellon’s securities lending program. The Collective Trust sought to maintain a NAV per unit of $1.00.
On Dec. 29, 2015, the assets in the Collective Trust were transferred to a series of individual separate accounts, each corresponding to a Fund. The investment guidelines permit each separate account to hold certain securities that would be considered eligible securities for a money market fund. Cash collateral received is generally invested in government securities; certain obligations issued by government sponsored enterprises; repurchase agreements collateralized by U.S. Treasury securities; obligations issued by the central government of any Organization for Economic Cooperation and Development (OECD) country or its agencies, instrumentalities, or establishments; obligations of supranational organizations; commercial paper, notes, bonds, and other debt obligations; certificates of deposit, time deposits, and other bank obligations; and asset-backed securities.
In the event of default or bankruptcy by the lending agent, realization and/or retention of the collateral may be subject to legal proceedings. In the event the borrower fails to return loaned securities and the collateral received is insufficient to cover the value of the loaned securities and provided such collateral shortfall is not the result of investment losses, the lending agent has agreed to pay the amount of the shortfall to the Fund or, at the discretion of the lending agent, replace the loaned securities. The Fund continues to record dividends or interest, as applicable, on the securities loaned and is subject to changes in value of the securities loaned that may occur during the term of the loan. The Fund has the right under the Lending Agreement to recover the securities from the borrower on demand. With respect to security loans collateralized by non-cash collateral, the Fund receives loan premiums paid by the borrower. With respect to security loans collateralized by cash collateral, the earnings from the collateral investments are shared among the Fund, the security lending agent, and the borrower. The Fund records security lending income net of allocations to the security lending agent and the borrower.
The Fund may incur investment losses as a result of investing securities lending collateral. This could occur if an investment in the collateral investment account defaulted or became impaired. Under those circumstances, the value of a Fund’s cash collateral account may be less than the amount the Fund would be required to return to the borrowers of the securities and the Fund would be required to make up for this shortfall.
During the year ended July 31, 2016, the Fund had no securities out on loan.
10. Credit and Market Risk
The Fund invests in high yield fixed income securities, which are securities rated lower than BBB-by Standard & Poor’s Financial Services LLC and Baa3 by Moody’s Investors Service Inc., or similarly rated by another nationally recognized statistical rating organization. Investments in these higher yielding securities are generally accompanied by a greater degree of credit risk than higher rated securities. Additionally, lower rated securities may be more susceptible to adverse economic and competitive industry conditions than investment grade securities.
The Fund invests in bank loans and other securities that may subject it to direct indebtedness risk, the risk that the Fund will not receive payment of principal, interest, and other amounts due in connection with these investments and will depend primarily on the financial condition of the borrower. Loans that are fully secured offer the Fund more protection than unsecured loans in the event of nonpayment of scheduled interest or principal, although there is no assurance that the liquidation of collateral from a secured loan would satisfy the corporate borrower’s obligation, or that the collateral can be liquidated. Some loans or claims may be in default at the time of purchase. Certain of the loans and the other direct indebtedness acquired by the Fund may involve revolving credit facilities or other standby financing commitments that obligate the Fund to pay additional cash on a certain date or on demand. These commitments may require the Fund to increase its investment in a company at a time when the Fund might not otherwise decide to do so (including at a time when the company’s financial condition makes it unlikely that such amounts will be repaid). To the extent that the Fund is committed to advance additional funds, it will at all times hold and maintain cash or other high grade debt obligations in an amount sufficient to meet such commitments.
As the Fund may be required to rely upon another lending institution to collect and pass on to the Fund amounts payable with respect to the loan and to enforce the Fund’s rights under the loan and other direct indebtedness, an insolvency, bankruptcy, or reorganization of the lending institution may delay or prevent the Fund from receiving such amounts. The highly leveraged nature of many loans may make them especially vulnerable to adverse changes in economic or market conditions. Investments in such loans and other direct indebtedness may involve additional risk to the Fund.
The Fund invests in certain obligations that may have liquidity protection designed to ensure that the receipt of payments due on the underlying security is timely. Such protection may be provided through guarantees, insurance policies, or letters of credit obtained by the issuer or sponsor through third parties, through various means of structuring the transaction or through a combination of such approaches. The Fund will not pay any additional fees for such credit support, although the existence of credit support may increase the price of the security.
The Fund may invest up to 15% of its net assets in illiquid securities, which may include securities with contractual restrictions on resale, securities exempt from registration under Rule 144A promulgated under the Securities Act of 1933, as amended, and other securities which may not be readily marketable. The relative illiquidity of these securities may impair the Fund from disposing of them in a timely manner and at a fair price when it is necessary or desirable to do so. While maintaining oversight, the Board has delegated to DMC, the day-to-day functions of determining whether individual securities are liquid for purposes of the Fund’s limitation on investments in illiquid securities. Securities eligible for resale pursuant to Rule 144A, which are determined to be liquid, are not subject to the Fund’s 15% limit on
| | |
| Notes to financial statements | | |
| Delaware High-Yield Opportunities Fund | | |
10. Credit and Market Risk (continued)
investments in illiquid securities. Rule 144A and illiquid securities have been identified on the “Schedule of investments.” When monitoring compliance with the Fund’s illiquid limit, certain holdings that are common to multiple clients of the investment manager may be aggregated and considered illiquid in the aggregate solely for monitoring purposes. For purposes of determining illiquidity for financial reporting purposes, only the holdings of this Fund will be considered.
11. Contractual Obligations
The Fund enters into contracts in the normal course of business that contain a variety of indemnifications. The Fund’s maximum exposure under these arrangements is unknown. However, the Fund has not had prior claims or losses pursuant to these contracts. Management has reviewed the Fund’s existing contracts and expects the risk of loss to be remote.
12. General Motors Term Loan Litigation
The Fund received notice of a litigation proceeding related to a General Motors Corporation (G.M.) term loan participation previously held by the Fund in 2009. We believe the matter subject to the litigation notice will likely lead to a recovery from the Fund of certain amounts received by the Fund because a U.S. Court of Appeals has ruled that the Fund and similarly situated investors were unsecured creditors rather than secured lenders of G.M. as a result of an erroneous Uniform Commercial Code filing made by a third party. The Fund received the full principal on the loans in 2009 after the G.M. bankruptcy. However, based upon the court ruling the estate is seeking to recover such amounts arguing that, as unsecured creditors, the Fund should not have received payment in full. Based upon currently available information related to the litigation and the Fund’s potential exposure, the Fund recorded a liability of $2,623,299 and an asset of $786,990 based on the expected recoveries to unsecured creditors as of July 31, 2016 that resulted in a net decrease in the Fund’s NAV to reflect this likely recovery.
13. Subsequent Events
Management has determined that no material events or transactions occurred subsequent to July 31, 2016 that would require recognition or disclosure in the Fund’s financial statements.
Report of independent
registered public accounting firm
To the Board of Trustees of Delaware Group® Income Funds
and the Shareholders of Delaware High-Yield Opportunities Fund:
In our opinion, the accompanying statement of assets and liabilities, including the schedule of investments, and the related statements of operations and of changes in net assets and the financial highlights present fairly, in all material respects, the financial position of Delaware High-Yield Opportunities Fund (one of the series constituting Delaware Group® Income Funds, hereinafter referred to as the “Fund”) at July 31, 2016, the results of its operations for the year then ended, the changes in its net assets for each of the two years in the period then ended and the financial highlights for each of the five years in the period then ended, in conformity with accounting principles generally accepted in the United States of America. These financial statements and financial highlights (hereafter referred to as “financial statements”) are the responsibility of the Fund’s management. Our responsibility is to express an opinion on these financial statements based on our audits. We conducted our audits of these financial statements in accordance with the standards of the Public Company Accounting Oversight Board (United States). Those standards require that we plan and perform the audit to obtain reasonable assurance about whether the financial statements are free of material misstatement. An audit includes examining, on a test basis, evidence supporting the amounts and disclosures in the financial statements, assessing the accounting principles used and significant estimates made by management, and evaluating the overall financial statement presentation. We believe that our audits, which included confirmation of securities at July 31, 2016 by correspondence with the custodian and brokers, provide a reasonable basis for our opinion.
PricewaterhouseCoopers LLP
Philadelphia, Pennsylvania
September 19, 2016
Other Fund information (Unaudited)
Delaware High-Yield Opportunities Fund
Tax Information
The information set forth below is for the Fund’s fiscal year as required by federal income tax laws. Shareholders, however, must report distributions on a calendar year basis for income tax purposes, which may include distributions for portions of two fiscal years of the Fund. Accordingly, the information needed by shareholders for income tax purposes will be sent to them in January of each year. Please consult your tax advisor for proper treatment of this information.
All disclosures are based on financial information available as of the date of this annual report and, accordingly are subject to change. For any and all items requiring reporting, it is the intention of the Fund to report the maximum amount permitted under the Internal Revenue Code and the regulations thereunder.
For the fiscal year ended July 31, 2016, the Fund reports distributions paid during the year as follows:
| | | | |
(A) Ordinary Income Distribution (Tax Basis)* | | | 98.67 | % |
(B) Return of Capital (Tax Basis) | | | 1.33 | % |
Total Distributions (Tax Basis) | | | 100.00 | % |
(C) Qualifying dividends1 | | | 0.24 | % |
(A) and (B) are based on a percentage of the Fund’s total distributions.
(C) is based on a percentage of the Fund’s ordinary income distributions.
1Qualifying dividends represent dividends which qualify for the corporate dividends received deduction.
*For the fiscal year ended July 31, 2016, certain dividends paid by the Fund may be subject to a maximum tax rate of 20%. The percentage of dividends paid by the Fund from ordinary income reported as qualified income is 0.24%. Complete information will be computed and reported in conjunction with your 2016 Form 1099-DIV.
For the fiscal year ended July 31, 2016, certain interest income paid by the Fund, has been determined to be Qualified Interest Income and Short-Term Capital Gains, and may be subject to relief from U.S. withholding foreign shareholders, as provided by the American Jobs Creation Act of 2004; the Tax Relief, Unemployment Insurance Reauthorization, and Job Creation Act of 2010; and as extended by the American Taxpayer Relief Act of 2012. For the fiscal year ended July 31, 2016, the Fund has reported maximum distributions of Qualified Interest Income of $21,743,269.
This page intentionally left blank.
| | |
| Board of trustees / directors and officers addendum | | |
| Delaware Investments® Family of Funds | | |
A mutual fund is governed by a Board of Trustees/Directors (“Trustees”), which has oversight responsibility for the management of a fund’s business affairs. Trustees establish procedures and oversee and review the performance of the investment manager, the distributor, and others who perform services for the fund. The independent fund trustees, in particular, are advocates
| | | | |
Name, Address, and Birth Date | | Position(s) Held with Fund(s) | | Length of Time Served |
Interested Trustee | | |
Shawn K. Lytle1, 3 | | President, | | Trustee since |
2005 Market Street | | Chief Executive Officer, | | September 2015 |
Philadelphia, PA 19103 | | and Trustee | | |
February 1970 | | | | President and |
| | | | Chief Executive Officer |
| | | | since August 2015 |
| | | | |
Independent Trustees | | |
Thomas L. Bennett | | Chairman and Trustee | | Trustee since |
2005 Market Street | | | | March 2005 |
Philadelphia, PA 19103 | | | | |
October 1947 | | | | Chairman since |
| | | | | March 2015 |
Ann D. Borowiec | | Trustee | | Since March 2015 |
2005 Market Street | | | | |
Philadelphia, PA 19103 | | | | |
November 1958 | | | | |
| | | | |
| | | | |
| | | | | |
Joseph W. Chow | | Trustee | | Since January 2013 |
2005 Market Street | | | | |
Philadelphia, PA 19103 | | | | |
January 1953 | | | | |
| | | | |
| | | | | |
| 1 | Shawn K. Lytle is considered to be an “Interested Trustee” because he is an executive officer of the Fund’s (s’) investment advisor. |
for shareholder interests. Each trustee has served in that capacity since he or she was elected to or appointed to the Board of Trustees, and will continue to serve until his or her retirement or the election of a new trustee in his or her place. The following is a list of the Trustees and Officers with certain background and related information.
| | | | |
Principal Occupation(s) During the Past Five Years | | Number of Portfolios in Fund Complex Overseen by Trustee or Officer | | Other Directorships Held by Trustee or Officer |
| | | | |
Shawn K. Lytle has served as | | 62 | | Trustee — UBS |
President of | | | | Relationship Funds, |
Delaware Investments2 | | | | SMA Relationship |
since June 2015 and was the | | | | Trust, and UBS Funds |
Regional Head of Americas for | | | | (May 2010–April 2015) |
UBS Global Asset | | | | |
Management from | | | | |
2010 through 2015. | | | | |
| | | | |
Private Investor | | 62 | | Director — |
(March 2004–Present) | | | | Bryn Mawr Bank Corp. (BMTC) |
| | | | (2007–2011) |
| | | | |
| | | | | |
Chief Executive Officer | | 62 | | None |
Private Wealth Management | | | | |
(2011–2013) and | | | | |
Market Manager, | | | | |
New Jersey Private | | | | |
Bank (2005–2011) — | | | | |
J.P. Morgan Chase & Co. | | | | |
Executive Vice President | | 62 | | Director and Audit Committee |
| (Emerging Economies | | | | Member — Hercules |
| Strategies, Risks, and | | | | Technology Growth |
Corporate Administration) | | | | Capital, Inc. |
State Street Corporation | | | | (2004–2014) |
(July 2004–March 2011) | | | | |
| 2 | Delaware Investments is the marketing name for Delaware Management Holdings, Inc. and its subsidiaries, including the Fund’s (s’) investment advisor, principal underwriter, and its transfer agent. |
| | |
| Board of trustees / directors and officers addendum | | |
| Delaware Investments® Family of Funds | | |
| | | | |
Name, Address, and Birth Date | | Position(s) Held with Fund(s) | | Length of Time Served |
Independent Trustees (continued) | | |
John A. Fry | | Trustee | | Since January 2001 |
2005 Market Street | | | | |
Philadelphia, PA 19103 | | | | |
May 1960 | | | | |
| | | | |
| | | | |
| | | | |
| | | | | |
Lucinda S. Landreth | | Trustee | | Since March 2005 |
2005 Market Street | | | | |
Philadelphia, PA 19103 | | | | |
June 1947 | | | | |
| | | | | |
Frances A. Sevilla-Sacasa | | Trustee | | Since September 2011 |
2005 Market Street | | | | |
Philadelphia, PA 19103 | | | | |
January 1956 | | | | |
| | | | |
| | | | |
| | | | |
| | | | |
| | | | |
| | | | |
| | | | |
| | | | |
| | | | |
| | | | |
| | | | |
| | | | |
| | | | | |
| | | | |
Principal Occupation(s) During the Past Five Years | | Number of Portfolios in Fund Complex Overseen by Trustee or Officer | | Other Directorships Held by Trustee or Officer |
| | | | |
President — | | 62 | | Director, Audit Committee, |
Drexel University | | | | and Governance Committee |
(August 2010–Present) | | | | Member — Community |
| | | | Health Systems |
President — | | | | |
Franklin & Marshall College | | | | Director — Drexel |
(July 2002–July 2010) | | | | Morgan & Co. |
Private Investor | | 62 | | None |
(2004–Present) | | | | |
| | | | |
| | | | |
| | | | | |
Chief Executive Officer — | | 62 | | Trust Manager and |
Banco Itaú | | | | Audit Committee |
International | | | | Member — Camden |
(April 2012–Present) | | | | Property Trust |
| | |
Executive Advisor to Dean | | | | |
(August 2011–March 2012)and Interim Dean | | | | |
(January 2011–July 2011) — | | | | |
University of Miami School of | | | | |
Business Administration | | | | |
| | |
President — U.S. Trust, | | | | |
Bank of America Private | | | | |
Wealth Management | | | | |
(Private Banking) | | | | |
(July 2007–December 2008) | | | | |
| | |
| Board of trustees / directors and officers addendum | | |
| Delaware Investments® Family of Funds | | |
| | | | |
Name, Address, and Birth Date | | Position(s) Held with Fund(s) | | Length of Time Served |
Independent Trustees (continued) | | |
Thomas K. Whitford | | Trustee | | Since January 2013 |
2005 Market Street | | | | |
Philadelphia, PA 19103 | | | | |
March 1956 | | | | |
| | | | |
| | | | |
| | | | |
| | | | |
| | | | |
| | | | | |
Janet L. Yeomans | | Trustee | | Since April 1999 |
2005 Market Street | | | | |
Philadelphia, PA 19103 | | | | |
July 1948 | | | | |
| | | | |
| | | | |
| | | | |
| | | | |
| | | | | |
| | | | |
Principal Occupation(s) During the Past Five Years | | Number of Portfolios in Fund Complex Overseen by Trustee or Officer | | Other Directorships Held by Trustee or Officer |
| | | | |
Vice Chairman | | 62 | | Director — HSBC Finance |
(2010–April 2013), | | | | Corporation and HSBC |
Chief Administrative | | | | North America Holdings Inc. |
Officer (2008–2010), and Executive Vice | | | | Director — |
President and Chief | | | | HSBC Bank |
Administrative Officer | | | | |
(2007–2009) — | | | | |
PNC Financial | | | | |
Services Group | | | | |
Vice President and Treasurer | | 62 | | Director, Audit and |
(January 2006–July 2012) | | | | Compliance Committee Chair, |
Vice President — | | | | Investment Committee |
Mergers & Acquisitions | | | | Member, and Governance |
(January 2003–January 2006), | | | | Committee Member — |
and Vice President | | | | Okabena Company |
and Treasurer | | | | |
(July 1995–January 2003) | | | | |
3M Company | | | | |
| | |
| Board of trustees / directors and officers addendum | | |
| Delaware Investments® Family of Funds | | |
| | | | |
Name, Address, and Birth Date | | Position(s) Held with Fund(s) | | Length of Time Served |
Officers | | |
David F. Connor | | Senior Vice President, | | Senior Vice President |
2005 Market Street | | General Counsel, | | since May 2013; |
Philadelphia, PA 19103 | | and Secretary | | General Counsel |
December 1963 | | | | since May 2015; |
| | | | Secretary since |
| | | | October 2005 |
| | | | |
| | | | |
| | | | |
| | | | | |
Daniel V. Geatens | | Vice President | | Treasurer since October 2007 |
2005 Market Street | | and Treasurer | | |
Philadelphia, PA 19103 | | | | |
October 1972 | | | | |
| | | | |
| | | | |
| | | | |
| | | | | |
Richard Salus | | Senior Vice President | | Chief Financial Officer |
2005 Market Street | | and Chief Financial Officer | | since November 2006 |
Philadelphia, PA 19103 | | | | |
October 1963 | | | | |
| | | | |
| | | | | |
The Statement of Additional Information for the Fund(s) includes additional information about the Trustees and Officers and is available, without charge, upon request by calling 800 523-1918.
| | | | |
Principal Occupation(s) During the Past Five Years | | Number of Portfolios in Fund Complex Overseen by Trustee or Officer | | Other Directorships Held by Trustee or Officer |
| | | | |
David F. Connor has served as | | 62 | | None3 |
Senior Vice President of the Fund(s) and the investment advisor since 2013, General Counsel of the Fund(s) and the investment advisor since 2015, and Secretary of the Fund(s) and the investment advisor since 2005. | | | | |
Daniel V. Geatens has served | | 62 | | None3 |
as Vice President and | | | | |
Treasurer of the Fund(s) since 2007 and Vice President and Director of Financial | | | | |
Administration of the investment advisor since 2010. | | | | |
Richard Salus has served as | | 62 | | None3 |
Senior Vice President and Chief Financial Officer of the Fund(s) and the investment advisor since 2006. | | | | |
| 3 | Shawn K. Lytle, David F. Connor, Daniel V. Geatens, and Richard Salus serve in similar capacities for the six portfolios of the Optimum Fund Trust, which have the same investment advisor, principal underwriter, and transfer agent as the registrant. |
About the organization
| | | | | | |
| Board of trustees | | | | | | |
Shawn K. Lytle President and Chief Executive Officer Delaware Investments ® Family of Funds Philadelphia, PA Thomas L. Bennett Chairman of the Board Delaware Investments Family of Funds Private Investor Rosemont, PA | | Ann D. Borowiec Former Chief Executive Officer Private Wealth Management J.P. Morgan Chase & Co. New York, NY Joseph W. Chow Former Executive Vice President State Street Corporation Boston, MA | | John A. Fry President Drexel University Philadelphia, PA Lucinda S. Landreth Former Chief Investment Officer Assurant, Inc. New York, NY | | Frances A. Sevilla-Sacasa Chief Executive Officer Banco Itaú International Miami, FL Thomas K. Whitford Former Vice Chairman PNC Financial Services Group Pittsburgh, PA Janet L. Yeomans Former Vice President and Treasurer 3M Company St. Paul, MN |
| | | |
| Affiliated officers | | | | | | |
| | | |
David F. Connor Senior Vice President, General Counsel, and Secretary Delaware Investments Family of Funds Philadelphia, PA | | Daniel V. Geatens Vice President and Treasurer Delaware Investments Family of Funds Philadelphia, PA | | Richard Salus Senior Vice President and Chief Financial Officer Delaware Investments Family of Funds Philadelphia, PA | | |
This annual report is for the information of Delaware High-Yield Opportunities Fund shareholders, but it may be used with prospective investors when preceded or accompanied by the Delaware Investments Fund fact sheet for the most recently completed calendar quarter. These documents are available at delawareinvestments.com/literature.
Delaware Investments is the marketing name of Delaware Management Holdings, Inc. and its subsidiaries.
The Fund files its complete schedule of portfolio holdings with the Securities and Exchange Commission (SEC) for the first and third quarters of each fiscal year on Form N-Q. The Fund’s Forms N-Q, as well as a description of the policies and procedures that the Fund uses to determine how to vote proxies (if any) relating to portfolio securities are available without charge (i) upon request, by calling 800 523-1918; and (ii) on the SEC’s website at sec.gov. In addition, a description of the policies and procedures that the Fund uses to determine how to vote proxies (if any) relating to portfolio securities and the Schedule of Investments included in the Fund’s most recent Form N-Q are available without charge on the Fund’s website at delawareinvestments.com/literature. The Fund’s Forms N-Q may be reviewed and copied at the SEC’s Public Reference Room in Washington, D.C.; information on the operation of the Public Reference Room may be obtained by calling 800 SEC-0330.
Information (if any) regarding how the Fund voted proxies relating to portfolio securities during the most recently disclosed 12-month period ended June 30 is available without charge (i) through the Fund’s website at delawareinvestments.com/proxy; and (ii) on the SEC’s website at sec.gov.
Annual report
Fixed income mutual fund
Delaware Diversified Floating Rate Fund
July 31, 2016
Carefully consider the Fund’s investment objectives, risk factors, charges, and expenses before investing. This and other information can be found in the Fund’s prospectus and its summary prospectus, which may be obtained by visiting delawareinvestments.com/literature or calling 800 523-1918. Investors should read the prospectus and the summary prospectus carefully before investing.
You can obtain shareholder reports and prospectuses online instead of in the mail.
Visit delawareinvestments.com/edelivery.
Experience Delaware Investments
Delaware Investments is committed to the pursuit of consistently superior asset management and unparalleled client service. We believe in our investment processes, which seek to deliver consistent results, and in convenient services that help add value for our clients.
If you are interested in learning more about creating an investment plan, contact your financial advisor.
You can learn more about Delaware Investments or obtain a prospectus for Delaware Diversified Floating Rate Fund at delawareinvestments.com/literature.
Manage your investments online
| ● | | 24-hour access to your account information |
| ● | | Check your account balance and recent transactions |
| ● | | Request statements or literature |
| ● | | Make purchases and redemptions |
Delaware Management Holdings, Inc. and its subsidiaries (collectively known by the marketing name of Delaware Investments) are wholly owned subsidiaries of Macquarie Group Limited, a global provider of banking, financial, advisory, investment and funds management services.
Neither Delaware Investments nor its affiliates referred to in this document are authorized deposit-taking institutions for the purpose of the Banking Act 1959 (Commonwealth of Australia). The obligations of these entities do not represent deposits or other liabilities of Macquarie Bank Limited (MBL), a subsidiary of Macquarie Group Limited and an affiliate of Delaware Investments. MBL does not guarantee or otherwise provide assurance in respect of the obligations of these entities, unless noted otherwise. The Fund is governed by U.S. laws and regulations.
Unless otherwise noted, views expressed herein are current as of July 31, 2016, and subject to change for events occurring after such date.
The Fund is not FDIC insured and is not guaranteed. It is possible to lose the principal amount invested.
Mutual fund advisory services provided by Delaware Management Company, a series of Delaware Management Business Trust, which is a registered investment advisor. Delaware Investments, a member of Macquarie Group, refers to Delaware Management Holdings, Inc. and its subsidiaries, including the Fund’s distributor, Delaware Distributors, L.P. Macquarie Group refers to Macquarie Group Limited and its subsidiaries and affiliates worldwide.
© 2016 Delaware Management Holdings, Inc.
All third-party marks cited are the property of their respective owners.
| | |
| Portfolio management review | | |
| Delaware Diversified Floating Rate Fund | | August 9, 2016 |
| | | | | | | | |
Performance preview (for the year ended July 31, 2016) | | | | | | | | |
Delaware Diversified Floating Rate Fund (Institutional Class shares) | | | 1-year return | | | | +0.54% | |
Delaware Diversified Floating Rate Fund (Class A shares) | | | 1-year return | | | | +0.29% | |
BofA Merrill Lynch U.S. Dollar 3-Month Deposit Offered Rate Constant Maturity Index (benchmark) | | | 1-year return | | | | +0.43% | |
Past performance does not guarantee future results.
For complete, annualized performance for Delaware Diversified Floating Rate Fund, please see the table on page 4. Institutional Class shares are available without sales or asset-based distribution charges only to certain eligible accounts. The performance of Class A shares excludes the applicable sales charge and reflects the reinvestment of all distributions. Please see page 7 for a description of the index.
Index performance returns do not reflect any management fees, transaction costs, or expenses. Indices are unmanaged and one cannot invest directly in an index.
The decline in commodity prices that began early in 2015 continued through the first half of the Fund’s fiscal year ended July 31, 2016. Beginning in February 2016, however, commodities started to recover, which appeared to boost investor confidence and increase interest in lower-quality assets. The Chinese currency devaluation in August 2015, coupled with signs of further economic deceleration, led Chinese officials to take additional stimulus measures early in 2016.
The U.S. Federal Reserve finally raised the federal funds rate by 0.25 percentage points in December 2015, the first increase since the global financial crisis began in December 2008. However, other developed world central banks, including the European Central Bank (ECB) and Bank of Japan, continued to flood markets with liquidity, putting the Fed at odds with the accommodative policy of other central banks. This divergence also contributed to a disconnect between asset prices and fundamentals, while raising the stakes for investors searching for yield. Moreover, it hampered the Fed’s attempt to implement its policy.
Another important factor late in the Fund’s fiscal year was the ECB’s Corporate Sector Purchase Program (CSPP) which provided a major non-price-sensitive buyer in the markets. The program
helped to lower risk premiums and overall yields and encouraged many investors to accept greater risks.
Within the Fund
For the fiscal year ended July 31, 2016, Delaware Diversified Floating Rate Fund Institutional Class shares returned +0.54%. The Fund’s Class A shares returned +0.29% at net asset value and -2.50% at maximum offer price. These figures reflect all distributions reinvested. During the same period, the Fund’s benchmark, the BofA Merrill Lynch U.S. Dollar 3-Month Deposit Offered Rate Constant Maturity Index, returned +0.43%. For complete, annualized performance of Delaware Diversified Floating Rate Fund, please see the table on page 4.
Lower-quality assets — specifically bank loans, which tend to yield a bit more than investment grade — contributed to the Fund’s performance overall. The Fund picked up yield incrementally by moving down in quality. The Fund’s allocation to bank loans was positive, and the sector benefited from increased demand as investors searched for income. Contributors to performance included loans issued by Protection 1, a security services provider, and Kraton Polymers, a chemical producer.
| | |
| Portfolio management review | | |
| Delaware Diversified Floating Rate Fund | | |
Structured products also performed well during the fiscal year. The Fund’s allocation to asset-backed securities (ABS) outperformed the benchmark. We increased exposure to this sector over the fiscal year as we found it to be an important source of high-quality assets and liquidity.
The Fund also benefited from exposure to AAA-rated collateralized loan obligations (CLOs), which outperformed the Fund’s investment grade floating rate assets while slightly trailing its bank-loan exposure.
Assessing results by credit quality, BB-rated securities were the strongest-performing asset class while B-rated securities detracted from overall returns. The strongest-performing assets were high-quality, high yield bank loans, which formed a “sweet spot” as investors sought bank-loan exposure for its yield pickup, but stuck to higher-quality assets within that segment.
The Fund also benefited from its underweight commodity positioning in late 2015. This was before the energy sector experienced a sharp rally.
The largest detractor from Fund performance was energy securities. Commodity prices remained quite volatile during the fiscal year. The Fund owned some below-investment-grade energy holdings that hurt performance in 2015, including natural gas producer Chesapeake Energy and offshore drilling services company Ocean Rig. At fiscal year end, we no longer held these names in the Fund.
After oil prices bottomed out last winter, the Fund’s underweight in energy and assets issued by other commodity companies was a negative as below-investment-grade credits in that sector rallied. This included a lack of exposure to the metals and mining industry; however, a holding in the sector, iron-ore producer FMG Resources, hurt performance during the period. We exited the
Fund’s position in FMG Resources during the fiscal year.
Outside of the commodities area, satellite services company Intelsat and diversified media and entertainment firm iHeartCommunications also detracted from relative performance. As of the end of the fiscal year, we no longer held these names in the Fund.
After the Fed altered expectations regarding interest rate hikes, the London interbank offered rate (LIBOR) rose, resulting in additional income for holdings without LIBOR floors. Their coupons were reset higher, translating into additional yield for investors.
Managing a low-duration portfolio in a low yield environment has historically been an effective strategy in our attempt to provide protection against an increase in interest rates. This strategy has allowed us to source some yield in an environment where yield is a little more difficult to come by and to do that without, in our view, undue exposure to interest rate risk.
We have the flexibility to move up and down the quality spectrum and across asset classes. Because we’re in a slow-growth environment, and central banks’ traditional strategies haven’t worked well, we continue to be very cautious in moving down in capital structures, particularly among bank loans. Instead, we have maintained higher-quality holdings within the bank loan space. Since liquidity is likewise a primary concern, we find high-quality asset-backed floating-rate securities appealing. Also worth noting: In this low-yield environment, as risk premiums increase and the prices of investment grade bonds or bank loans move lower, many investors don’t have the income stream or cushion that would normally exist in a moderate or high yield environment.
Within investment grade securities, we continue to allocate capital to the banking sector, particularly domestic issuers. The U.S. regulatory environment
appears favorable to bond investors and U.S. bank balance sheets are generally quite strong.
We will continue to seek diversification, balancing some lower-quality risks with higher-quality assets in structured product and investment grade utilities.
Another reason to maintain cautious positioning is the uncertainty associated with the global wave of populism — in rhetoric and voter behavior — that led to Britain’s vote to leave the European Union (Brexit) and that has found its way to the United States during the presidential election. In our view, until we get this uncertainty behind us,
we will likely be in a relatively benign economic environment, where confidence isn’t strong enough for companies to invest in their businesses wholeheartedly.
A note on derivatives
The Fund used interest rate swaps to hedge fixed rate bonds back to a floating rate. With the drop in interest rates during the fiscal year, interest rate swaps cost the Fund more than 0.50 percentage points of return. However, these swaps are used as a risk management tool rather than for speculative purposes.
| | |
| Performance summary | | |
| Delaware Diversified Floating Rate Fund | | July 31, 2016 |
The performance data quoted represent past performance; past performance does not guarantee future results. Investment return and principal value will fluctuate so your shares, when redeemed, may be worth more or less than their original cost. Please obtain the performance data current for the most recent month end by calling 800 523-1918 or visiting our website at delawareinvestments.com/performance. Current performance may be lower or higher than the performance data quoted.
| | | | | | | | | | | | | | | | |
| Fund and benchmark performance1,2 | | Average annual total returns through July 31, 2016 | |
| | | | |
| | | 1 year | | | 3 years | | | 5 years | | | Lifetime | |
Class A (Est. Feb. 26, 2010) | | | | | | | | | | | | | | | | |
Excluding sales charge | | | +0.29% | | | | +0.77% | | | | +1.43% | | | | +1.76% | |
Including sales charge | | | -2.50% | | | | -0.15% | | | | +0.87% | | | | +1.32% | |
Class C (Est. Feb. 26, 2010) | | | | | | | | | | | | | | | | |
Excluding sales charge | | | -0.46% | | | | +0.02% | | | | +0.67% | | | | +1.01% | |
Including sales charge | | | -1.45% | | | | +0.02% | | | | +0.67% | | | | +1.01% | |
Class R (Est. Feb. 26, 2010) | | | | | | | | | | | | | | | | |
Excluding sales charge | | | +0.03% | | | | +0.52% | | | | +1.17% | | | | +1.50% | |
Including sales charge | | | +0.03% | | | | +0.52% | | | | +1.17% | | | | +1.50% | |
Institutional Class (Est. Feb. 26, 2010) | | | | | | | | | | | | | | | | |
Excluding sales charge | | | +0.54% | | | | +1.02% | | | | +1.68% | | | | +2.02% | |
Including sales charge | | | +0.54% | | | | +1.02% | | | | +1.68% | | | | +2.02% | |
BofA Merrill Lynch U.S. Dollar 3-Month Deposit Offered Rate Constant Maturity Index* | | | +0.43% | | | | +0.31% | | | | +0.34% | | | | +0.34% | |
*The benchmark lifetime return is for Class A share comparison only and is calculated using the last business day in the month of the Fund’s Class A inception date. The benchmark was formerly known as the BofA Merrill Lynch U.S. Dollar 3-Month LIBOR Constant Maturity Index.
1 Returns reflect the reinvestment of all distributions and are presented both with and without the applicable sales charges described below. Returns do not reflect the deduction of taxes the shareholder would pay on Fund distributions or redemptions of Fund shares.
Expense limitations were in effect for certain classes during some or all of the periods shown in the “Fund and benchmark performance” table. Expenses for each class are listed on the “Fund expense ratios” table on page 6. Performance would have been lower had expense limitations not been in effect.
Institutional Class shares are available without sales or asset-based distribution charges only to certain eligible accounts.
Class A shares are sold with a maximum front-end sales charge of 2.75%, and have an annual distribution and service fee of 0.25% of average daily net assets. Performance for Class A shares, excluding sales charges, assumes that no front-end sales charge applied.
Class C shares are sold with a contingent deferred sales charge of 1.00% if redeemed during the first 12 months. They are also subject to an annual distribution and service fee of 1.00% of average daily net assets. Performance for Class C shares,
excluding sales charges, assumes either that contingent deferred sales charges did not apply or that the investment was not redeemed.
Class R shares are available only for certain retirement plan products. They are sold without a sales charge and have an annual distribution and service fee of 0.50% of average daily net assets.
Fixed income securities and bond funds can lose value, and investors can lose principal, as interest rates rise. They also may be affected by economic conditions that hinder an issuer’s ability to make interest and principal payments on its debt.
The Fund may also be subject to prepayment risk, the risk that the principal of a fixed income security that is held by the Fund may be prepaid prior to maturity, potentially forcing the Fund to reinvest that money at a lower interest rate.
High yielding, non-investment-grade bonds (junk bonds) involve higher risk than investment grade bonds. The high yield secondary market is particularly susceptible to liquidity problems when institutional investors, such as mutual funds and certain other financial institutions, temporarily stop buying bonds for regulatory, financial, or other reasons. In addition, a less liquid secondary market makes it more difficult for the Fund to obtain precise valuations of the high yield securities in its portfolio.
International investments entail risks not ordinarily associated with U.S. investments including fluctuation in currency values, differences in accounting principles, or economic or political instability in other nations.
Investing in emerging markets can be riskier than investing in established foreign markets due to increased volatility and lower trading volume.
The Fund may invest in derivatives, which may involve additional expenses and are subject to risk, including the risk that an underlying security or securities index moves in the opposite direction
from what the portfolio manager anticipated. A derivative transaction depends upon the counterparties’ ability to fulfill their contractual obligations.
Investments in mortgage-backed securities (MBS) may involve risks. MBS represent an ownership interest in a pool of mortgage loans. The individual mortgage loans are packaged or “pooled” together for sale to investors. These mortgage loans may have either fixed or adjustable interest rates.
Investments in collateralized loan obligations (CLOs) may involve risks. CLOs are securities backed by a pool of debt, often low-rated corporate loans. Investors receive scheduled debt payments from the underlying loans but assume most of the risk in the event that borrowers default.
Because the Fund may invest in bank loans and other direct indebtedness, it is subject to the risk that the Fund will not receive payment of principal, interest, and other amounts due in connection with these investments, which primarily depend on the financial condition of the borrower and the lending institution.
Per Standard & Poor’s credit rating agency, bonds rated below AAA are more susceptible to the adverse effects of changes in circumstances and economic conditions than those in higher-rated categories, but the obligor’s capacity to meet its financial commitment on the obligation is still strong. Bonds rated BBB exhibit adequate protection parameters, although adverse economic conditions or changing circumstances are more likely to lead to a weakened capacity of the obligor to meet its financial commitments. Bonds rated BB, B, and CCC are regarded as having significant speculative characteristics, with BB indicating the least degree of speculation of the three.
| | |
| Performance summary | | |
| Delaware Diversified Floating Rate Fund | | |
2 The Fund’s expense ratios, as described in the most recent prospectus, are disclosed in the following “Fund expense ratios” table.
| | | | | | | | |
| Fund expense ratios | | Class A | | Class C | | Class R | | Institutional Class |
Total annual operating expenses | | 0.95% | | 1.70% | | 1.20% | | 0.70% |
(without fee waivers) | | | | | | | | |
Net expenses | | 0.95% | | 1.70% | | 1.20% | | 0.70% |
(including fee waivers, if any) | | | | | | | | |
Type of waiver | | n/a | | n/a | | n/a | | n/a |
Performance of a $10,000 investment1
Average annual total returns from Feb. 26, 2010 (Fund’s inception) through July 31, 2016
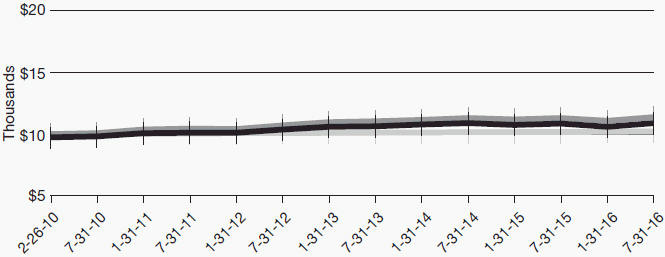
| | | | | | | | | | |
| For period beginning Feb. 26, 2010, through July 31, 2016 | | Starting value | | | Ending value | |
 Delaware Diversified Floating Rate Fund — Institutional Class shares Delaware Diversified Floating Rate Fund — Institutional Class shares
| | | $10,000 | | | | $11,371 | |
 Delaware Diversified Floating Rate Fund — Class A shares Delaware Diversified Floating Rate Fund — Class A shares
| | | $9,725 | | | | $10,881 | |
 BofA Merrill Lynch U.S. Dollar 3-Month Deposit Offered Rate Constant Maturity Index BofA Merrill Lynch U.S. Dollar 3-Month Deposit Offered Rate Constant Maturity Index
| | | $10,000 | | | | $10,219 | |
1 The “Performance of a $10,000 investment” graph assumes $10,000 invested in Institutional Class and Class A shares of the Fund on Feb. 26, 2010, and includes the effect of a 2.75% front-end sales charge (for Class A shares) and the reinvestment of all distributions. The graph does not reflect the deduction of taxes the shareholders would pay on Fund distributions or redemptions of Fund shares. Expense limitations were in effect for some or all of the periods shown. Performance would have been lower had expense limitations not been in effect. Expenses are listed in the “Fund expense ratios” table on page 6. Please note additional details on pages 4 through 7.
The graph also assumes $10,000 invested in the BofA Merrill Lynch U.S. Dollar 3-Month Deposit Offered Rate Constant Maturity Index as of Feb. 26, 2010. The BofA Merrill Lynch U.S. Dollar
3-Month Deposit Offered Rate Constant Maturity Index (formerly the BofA Merrill Lynch U.S. Dollar 3-Month LIBOR Constant Maturity Index) represents the London interbank offered rate (LIBOR) with a constant 3-month average maturity. LIBOR, published by the British Bankers’ Association, is a composite of the rates of interest at which banks borrow from one another in the London market, and it is a widely used benchmark for short-term interest rates. Index performance returns do not reflect any management fees, transaction costs, or expenses. Indices are unmanaged and one cannot invest directly in an index. Past performance is not a guarantee of future results.
Performance of other Fund classes will vary due to different charges and expenses.
| | |
| Performance summary | | |
| Delaware Diversified Floating Rate Fund | | |
| | | | | | |
| | | Nasdaq symbols | | CUSIPs | | |
Class A | | DDFAX | | 245908660 | | |
Class C | | DDFCX | | 245908652 | | |
Class R | | DDFFX | | 245908645 | | |
Institutional Class | | DDFLX | | 245908637 | | |
This page intentionally left blank.
| | |
| Disclosure of Fund expenses | | |
| For the six-month period from February 1, 2016 to July 31, 2016 (Unaudited) | | |
As a shareholder of the Fund, you incur two types of costs: (1) transaction costs, including sales charges (loads) on purchase payments, reinvested dividends, or other distributions; redemption fees; and exchange fees; and (2) ongoing costs, including management fees; distribution and/or service (12b-1) fees; and other Fund expenses. This example is intended to help you understand your ongoing costs (in dollars) of investing in the Fund and to compare these costs with the ongoing costs of investing in other mutual funds.
The example is based on an investment of $1,000 invested at the beginning of the period and held for the entire six-month period from Feb. 1, 2016 to July 31, 2016.
Actual expenses
The first section of the table shown, “Actual Fund return,” provides information about actual account values and actual expenses. You may use the information in this section of the table, together with the amount you invested, to estimate the expenses that you paid over the period. Simply divide your account value by $1,000 (for example, an $8,600 account value divided by $1,000 = 8.6), then multiply the result by the number in the first section under the heading entitled “Expenses Paid During Period” to estimate the expenses you paid on your account during this period.
Hypothetical example for comparison purposes
The second section of the table shown, “Hypothetical 5% return,” provides information about hypothetical account values and hypothetical expenses based on the Fund’s actual expense ratio and an assumed rate of return of 5% per year before expenses, which is not the Fund’s actual return. The hypothetical account values and expenses may not be used to estimate the actual ending account balance or expenses you paid for the period. You may use this information to compare the ongoing costs of investing in the Fund and other funds. To do so, compare this 5% hypothetical example with the 5% hypothetical examples that appear in the shareholder reports of the other funds.
Please note that the expenses shown in the table are meant to highlight your ongoing costs only and do not reflect any transactional costs, such as sales charges (loads), redemption fees, or exchange fees. Therefore, the second section of the table is useful in comparing ongoing costs only, and will not help you determine the relative total costs of owning different funds. In addition, if these transactional costs were included, your costs would have been higher. The Fund’s expenses shown in the table reflect fee waivers in effect. The expenses shown in the table assume reinvestment of all dividends and distributions.
Delaware Diversified Floating Rate Fund
Expense analysis of an investment of $1,000
| | | | | | | | | | | | | | | | |
| | | Beginning Account Value 2/1/16 | | Ending Account Value 7/31/16 | | | Annualized Expense Ratio | | | Expenses Paid During Period 2/1/16 to 7/31/16* | |
Actual Fund return† | | | | | | | | | | | | | | | | |
Class A | | $ | 1,000.00 | | | $ | 1,025.00 | | | | 0.99% | | | | $4.98 | |
Class C | | | 1,000.00 | | | | 1,021.20 | | | | 1.74% | | | | 8.74 | |
Class R | | | 1,000.00 | | | | 1,023.70 | | | | 1.24% | | | | 6.24 | |
Institutional Class | | | 1,000.00 | | | | 1,026.30 | | | | 0.74% | | | | 3.73 | |
Hypothetical 5% return (5% return before expenses) | | | | | | | | | |
Class A | | $ | 1,000.00 | | | $ | 1,019.94 | | | | 0.99% | | | | $4.97 | |
Class C | | | 1,000.00 | | | | 1,016.21 | | | | 1.74% | | | | 8.72 | |
Class R | | | 1,000.00 | | | | 1,018.70 | | | | 1.24% | | | | 6.22 | |
Institutional Class | | | 1,000.00 | | | | 1,021.18 | | | | 0.74% | | | | 3.72 | |
| * | “Expenses Paid During Period” are equal to the Fund’s annualized expense ratio, multiplied by the average account value over the period, multiplied by 182/366 (to reflect the one-half year period). |
| † | Because actual returns reflect only the most recent six-month period, the returns shown may differ significantly from fiscal year returns. |
| | |
| Security type / sector allocation | | |
| Delaware Diversified Floating Rate Fund | | As of July 31, 2016 (Unaudited) |
Sector designations may be different than the sector designations presented in other fund materials. The sector designations may represent the investment manager’s internal sector classifications.
| | | | | |
| Security type / sector | | Percentage of net assets |
Agency Collateralized Mortgage Obligations | | | | 1.81 | % |
Agency Mortgage-Backed Security | | | | 0.01 | % |
Collateralized Debt Obligations | | | | 3.69 | % |
Convertible Bonds | | | | 0.48 | % |
Corporate Bonds | | | | 44.76 | % |
Banking | | | | 15.09 | % |
Basic Industry | | | | 0.56 | % |
Capital Goods | | | | 2.55 | % |
Communications. | | | | 4.45 | % |
Consumer Cyclical | | | | 2.96 | % |
Consumer Non-Cyclical | | | | 4.47 | % |
Electric | | | | 2.68 | % |
Energy | | | | 5.13 | % |
Finance Companies. | | | | 2.12 | % |
Insurance | | | | 0.42 | % |
Natural Gas | | | | 1.99 | % |
Real Estate | | | | 1.30 | % |
Technology | | | | 0.65 | % |
Transportation | | | | 0.30 | % |
Utilities | | | | 0.09 | % |
Municipal Bonds | | | | 2.07 | % |
Non-Agency Asset-Backed Securities | | | | 8.42 | % |
Senior Secured Loans | | | | 30.81 | % |
Sovereign Bonds | | | | 0.55 | % |
Supranational Banks | | | | 2.05 | % |
U.S. Treasury Obligations | | | | 1.79 | % |
Convertible Preferred Stock | | | | 0.02 | % |
Preferred Stock | | | | 1.69 | % |
Short-Term Investments | | | | 3.48 | % |
Total Value of Securities | | | | 101.63 | % |
Liabilities Net of Receivables and Other Assets | | | | (1.63 | %) |
Total Net Assets | | | | 100.00 | % |
| | |
| Schedule of investments | | |
| Delaware Diversified Floating Rate Fund | | July 31, 2016 |
| | | | | | | | |
| | | Principal amount° | | | Value (U.S. $) | |
| |
Agency Collateralized Mortgage Obligations – 1.81% | | | | | | | | |
| |
Fannie Mae Connecticut Avenue Securities | | | | | | | | |
Series 2015-C03 1M1 1.988% 7/25/25 • | | | 680,642 | | | $ | 682,550 | |
Series 2015-C03 2M1 1.988% 7/25/25 • | | | 675,200 | | | | 678,447 | |
Series 2015-C04 2M1 2.188% 4/25/28 • | | | 348,558 | | | | 351,413 | |
Series 2016-C03 1M1 2.488% 10/25/28 • | | | 256,590 | | | | 260,091 | |
Series 2016-C04 1M1 1.943% 1/25/29 • | | | 130,000 | | | | 130,337 | |
Fannie Mae REMICs | | | | | | | | |
Series 2004-36 FA 0.888% 5/25/34 • | | | 40,689 | | | | 40,719 | |
Series 2005-66 FD 0.788% 7/25/35 • | | | 49,199 | | | | 49,059 | |
Series 2005-106 QF 0.998% 12/25/35 • | | | 306,034 | | | | 307,802 | |
Series 2006-105 FB 0.908% 11/25/36 • | | | 30,672 | | | | 30,676 | |
Series 2007-109 NF 1.038% 12/25/37 • | | | 22,856 | | | | 22,986 | |
Freddie Mac REMICs | | | | | | | | |
Series 3067 FA 0.831% 11/15/35 • | | | 80,493 | | | | 80,374 | |
Series 3239 EF 0.831% 11/15/36 • | | | 58,184 | | | | 58,111 | |
Series 3241 FM 0.861% 11/15/36 • | | | 6,107 | | | | 6,102 | |
Series 3780 LF 0.881% 3/15/29 • | | | 6,628 | | | | 6,634 | |
Freddie Mac Structured Agency Credit Risk Debt Notes | | | | | | | | |
Series 2015-DNA3 M1 1.838% 4/25/28 • | | | 789,362 | | | | 790,910 | |
Series 2016-DNA3 M1 1.588% 12/25/28 • | | | 828,996 | | | | 830,290 | |
Series 2016-HQA2 M1 1.688% 11/25/28 • | | | 1,014,109 | | | | 1,017,019 | |
| | | | | | | | |
Total Agency Collateralized Mortgage Obligations (cost $5,322,261) | | | | | | | 5,343,520 | |
| | | | | | | | |
| | | | | | | | |
| |
Agency Mortgage-Backed Security – 0.01% | | | | | | | | |
| |
Freddie Mac ARM | | | | | | | | |
2.97% 2/1/35 • | | | 12,885 | | | | 13,646 | |
| | | | | | | | |
Total Agency Mortgage-Backed Security (cost $13,610) | | | | | | | 13,646 | |
| | | | | | | | |
| | | | | | | | |
| |
Collateralized Debt Obligations – 3.69% | | | | | | | | |
| |
Cedar Funding V CLO | | | | | | | | |
Series 2016-5A A1L 144A 2.243% 7/17/28 #• | | | 1,270,000 | | | | 1,268,060 | |
CIFC Funding | | | | | | | | |
Series 2014-2A A1L 144A 2.141% 5/24/26 #• | | | 1,000,000 | | | | 996,242 | |
Flagship VII CLO | | | | | | | | |
Series 2013-7A A1 144A 2.166% 1/20/26 #• | | | 1,000,000 | | | | 993,875 | |
JFIN CLO | | | | | | | | |
Series 2015-2A AX 144A 2.129% 10/19/26 #• | | | 535,000 | | | | 532,846 | |
KKR Financial CLO | | | | | | | | |
Series 2013-1A A1 144A 1.83% 7/15/25 #• | | | 1,395,000 | | | | 1,377,180 | |
MAPS CLO Fund II | | | | | | | | |
Series 2007-2A A1 144A 0.936% 7/20/22 #• | | | 481,030 | | | | 475,877 | |
Mountain View Funding CLO | | | | | | | | |
Series 2007-3A A1 144A 0.894% 4/16/21 #• | | | 275,812 | | | | 275,151 | |
| | |
| Schedule of investments | | |
| Delaware Diversified Floating Rate Fund | | |
| | | | | | | | |
| | | Principal amount° | | | Value (U.S. $) | |
| |
Collateralized Debt Obligations (continued) | | | | | | | | |
| |
NYLIM Flatiron CLO | | | | | | | | |
Series 2006-1A A2A 144A 0.852% 8/8/20 #• | | | 14,962 | | | $ | 14,937 | |
OCP CLO | | | | | | | | |
Series 2013-4A A1A 144A 2.115% 10/24/25 #• | | | 1,500,000 | | | | 1,487,808 | |
Shackleton CLO | | | | | | | | |
Series 2014-5A A 144A 2.132% 5/7/26 #• | | | 420,000 | | | | 417,264 | |
Series 2015-VIII 144A 2.206% 10/20/27 #• | | | 410,000 | | | | 409,383 | |
Telos CLO | | | | | | | | |
Series 2013-4A A 144A 1.979% 7/17/24 #• | | | 2,000,000 | | | | 1,986,900 | |
Venture XXI CLO | | | | | | | | |
144A 2.17% 7/15/27 #• | | | 685,000 | | | | 683,400 | |
| | | | | | | | |
Total Collateralized Debt Obligations (cost $10,898,248) | | | | | | | 10,918,923 | |
| | | | | | | | |
| | | | | | | | |
| |
Convertible Bonds – 0.48% | | | | | | | | |
| |
Alaska Communications Systems Group 6.25% exercise price $10.28, maturity date 5/1/18 @ | | | 61,000 | | | | 59,399 | |
Atlas Air Worldwide Holdings 2.25% exercise price $74.05, maturity date 6/1/22 | | | 16,000 | | | | 15,870 | |
BioMarin Pharmaceutical 1.50% exercise price $94.15, maturity date 10/15/20 | | | 20,000 | | | | 26,550 | |
Blackstone Mortgage Trust 5.25% exercise price $28.36, maturity date 12/1/18 | | | 90,000 | | | | 97,256 | |
Brookdale Senior Living 2.75% exercise price $29.33, maturity date 6/15/18 | | | 40,000 | | | | 40,275 | |
Cemex 3.72% exercise price $11.45, maturity date 3/15/20 | | | 82,000 | | | | 84,050 | |
Chart Industries 2.00% exercise price $69.03, maturity date 8/1/18 @ | | | 42,000 | | | | 40,897 | |
Clearwire Communications 144A 8.25% exercise price $19.90, maturity date 12/1/40 # | | | 32,000 | | | | 33,280 | |
GAIN Capital Holdings 4.125% exercise price $12.00, maturity date 12/1/18 @ | | | 60,000 | | | | 57,300 | |
General Cable 4.50% exercise price $32.36, maturity date 11/15/29 @f | | | 137,000 | | | | 92,475 | |
HealthSouth 2.00% exercise price $37.59, maturity date 12/1/43 | | | 46,000 | | | | 56,407 | |
Helix Energy Solutions Group 3.25% exercise price $25.02, maturity date 3/15/32 | | | 89,000 | | | | 82,547 | |
Jefferies Group 3.875% exercise price $44.19, maturity date 11/1/29 | | | 91,000 | | | | 93,048 | |
Knowles 144A 3.25% exercise price $18.43, maturity date 11/1/21 # | | | 13,000 | | | | 13,325 | |
Meritor 4.00% exercise price $26.73, maturity date 2/15/27 f | | | 57,000 | | | | 55,468 | |
| | | | | | | | |
| | | Principal amount° | | | Value (U.S. $) | |
| |
Convertible Bonds (continued) | | | | | | | | |
| |
Micron Technology 3.00% exercise price $29.16, maturity date 11/15/43 | | | 25,000 | | | $ | 20,281 | |
Nuance Communications 2.75% exercise price $32.30, maturity date 11/1/31 | | | 97,000 | | | | 97,849 | |
NuVasive 144A 2.25% exercise price $59.82, maturity date 3/15/21 # | | | 14,000 | | | | 17,168 | |
PROS Holdings 2.00% exercise price $33.79, maturity date 12/1/19 | | | 105,000 | | | | 98,241 | |
Spectrum Pharmaceuticals 2.75% exercise price $10.53, maturity date 12/15/18 @ | | | 83,000 | | | | 80,614 | |
Spirit Realty Capital 3.75% exercise price $13.10, maturity date 5/15/21 @ | | | 46,000 | | | | 53,561 | |
Synchronoss Technologies 0.75% exercise price $53.17, maturity date 8/15/19 | | | 47,000 | | | | 48,968 | |
Titan Machinery 3.75% exercise price $43.17, maturity date 5/1/19 @ | | | 24,000 | | | | 20,715 | |
Vector Group 1.75% exercise price $24.64, maturity date 4/15/20 • | | | 82,000 | | | | 90,969 | |
VEREIT 3.75% exercise price $14.99, maturity date 12/15/20 @ | | | 47,000 | | | | 47,676 | |
| | | | | | | | |
Total Convertible Bonds (cost $1,447,117) | | | | | | | 1,424,189 | |
| | | | | | | | |
| | | | | | | | |
| |
Corporate Bonds – 44.76% | | | | | | | | |
| |
Banking – 15.09% | | | | | | | | |
Australia & New Zealand Banking Group 144A 1.045% 1/10/17 #• | | | 770,000 | | | | 770,460 | |
Banco Nacional de Costa Rica 144A 5.875% 4/25/21 # | | | 200,000 | | | | 209,000 | |
Bank Nederlandse Gemeenten 144A 0.743% 7/14/17 #• | | | 266,000 | | | | 266,066 | |
Bank of America | | | | | | | | |
0.933% 10/14/16 • | | | 575,000 | | | | 574,983 | |
1.096% 11/14/16 • | | | 4,090,000 | | | | 4,094,507 | |
4.45% 3/3/26 | | | 65,000 | | | | 69,944 | |
Bank of New York Mellon 1.136% 9/11/19 • | | | 2,600,000 | | | | 2,593,508 | |
BB&T 1.513% 6/15/18 • | | | 2,586,000 | | | | 2,599,900 | |
BBVA Bancomer 144A 7.25% 4/22/20 # | | | 200,000 | | | | 222,300 | |
Branch Banking & Trust | | | | | | | | |
0.954% 5/23/17 • | | | 1,405,000 | | | | 1,403,602 | |
0.976% 9/13/16 • | | | 775,000 | | | | 774,933 | |
Citizens Bank 2.55% 5/13/21 | | | 250,000 | | | | 255,432 | |
Citizens Financial Group 4.30% 12/3/25 | | | 345,000 | | | | 366,904 | |
CoBank 1.253% 6/15/22 • | | | 75,000 | | | | 71,711 | |
Compass Bank 3.875% 4/10/25 | | | 400,000 | | | | 386,728 | |
Credit Suisse Group Funding Guernsey 3.125% 12/10/20 | | | 450,000 | | | | 451,926 | |
| | |
| Schedule of investments | | |
| Delaware Diversified Floating Rate Fund | | |
| | | | | | | | |
| | | Principal amount° | | | Value (U.S. $) | |
| |
Corporate Bonds (continued) | | | | | | | | |
| |
Banking (continued) | | | | | | | | |
Export-Import Bank of Korea | | | | | | | | |
1.423% 1/14/17 • | | | 2,250,000 | | | $ | 2,252,378 | |
2.125% 2/11/21 | | | 200,000 | | | | 202,690 | |
Fifth Third Bank 2.25% 6/14/21 | | | 645,000 | | | | 658,337 | |
Goldman Sachs Group 2.274% 11/29/23 • | | | 2,260,000 | | | | 2,265,738 | |
Industrial & Commercial Bank of China 2.635% 5/26/21 | | | 250,000 | | | | 252,829 | |
JPMorgan Chase | | | | | | | | |
2.25% 1/23/20 | | | 2,540,000 | | | | 2,591,478 | |
2.75% 6/23/20 | | | 435,000 | | | | 450,298 | |
4.25% 10/1/27 | | | 640,000 | | | | 691,267 | |
KeyBank | | | | | | | | |
2.35% 3/8/19 | | | 250,000 | | | | 255,287 | |
3.18% 5/22/22 | | | 480,000 | | | | 496,510 | |
KFW 0.787% 12/29/17 • | | | 1,860,000 | | | | 1,859,537 | |
Morgan Stanley 1.874% 1/27/20 • | | | 3,305,000 | | | | 3,319,383 | |
Oesterreichische Kontrollbank 0.81% 8/10/17 • | | | 1,955,000 | | | | 1,956,969 | |
PNC Bank 2.45% 11/5/20 | | | 250,000 | | | | 258,465 | |
Regions Bank 2.25% 9/14/18 | | | 1,950,000 | | | | 1,964,032 | |
Santander UK 1.511% 8/24/18 • | | | 3,135,000 | | | | 3,107,437 | |
State Street 2.55% 8/18/20 | | | 370,000 | | | | 385,092 | |
SVB Financial Group 3.50% 1/29/25 | | | 460,000 | | | | 460,093 | |
UBS Group Funding Jersey | | | | | | | | |
144A 3.00% 4/15/21 # | | | 540,000 | | | | 556,454 | |
144A 4.125% 9/24/25 # | | | 250,000 | | | | 264,400 | |
USB Capital IX 3.50% 10/29/49 @• | | | 440,000 | | | | 378,950 | |
Wells Fargo 1.432% 1/30/20 • | | | 4,420,000 | | | | 4,419,907 | |
Zions Bancorporation 4.50% 6/13/23 | | | 420,000 | | | | 439,613 | |
| | | | | | | | |
| | | | | | | 44,599,048 | |
| | | | | | | | |
Basic Industry – 0.56% | | | | | | | | |
Bahia Sul Holdings 144A 5.75% 7/14/26 # | | | 240,000 | | | | 236,700 | |
Dow Chemical 8.55% 5/15/19 | | | 140,000 | | | | 166,821 | |
Georgia-Pacific 8.00% 1/15/24 | | | 400,000 | | | | 537,854 | |
OCP 144A 4.50% 10/22/25 # | | | 325,000 | | | | 327,538 | |
Southern Copper 5.375% 4/16/20 | | | 135,000 | | | | 147,588 | |
Suzano Trading 144A 5.875% 1/23/21 # | | | 100,000 | | | | 105,410 | |
Vale Overseas 5.875% 6/10/21 | | | 135,000 | | | | 140,063 | |
| | | | | | | | |
| | | | | | | 1,661,974 | |
| | | | | | | | |
Capital Goods – 2.55% | | | | | | | | |
Ardagh Packaging Finance 144A 3.876% 5/15/21 #• | | | 1,110,000 | | | | 1,125,262 | |
Cemex 144A 7.25% 1/15/21 # | | | 965,000 | | | | 1,051,753 | |
Fortive 144A 3.15% 6/15/26 # | | | 400,000 | | | | 424,066 | |
Fortune Brands Home & Security 3.00% 6/15/20 | | | 220,000 | | | | 226,914 | |
| | | | | | | | |
| | | Principal amount° | | | Value (U.S. $) | |
| |
Corporate Bonds (continued) | | | | | | | | |
| |
Capital Goods (continued) | | | | | | | | |
Masco 3.50% 4/1/21 | | | 95,000 | | | $ | 99,159 | |
Reynolds Group Issuer 8.25% 2/15/21 | | | 740,000 | | | | 770,599 | |
Rockwell Collins 1.003% 12/15/16 • | | | 3,520,000 | | | | 3,522,763 | |
Union Andina de Cementos 144A 5.875% 10/30/21 # | | | 295,000 | | | | 308,275 | |
| | | | | | | | |
| | | | | | | 7,528,791 | |
| | | | | | | | |
Communications – 4.45% | | | | | | | | |
21st Century Fox America 4.50% 2/15/21 | | | 395,000 | | | | 442,064 | |
AT&T 1.561% 6/30/20 • | | | 2,130,000 | | | | 2,128,835 | |
CenturyLink 5.80% 3/15/22 | | | 225,000 | | | | 230,906 | |
Cisco Systems 1.173% 3/1/19 • | | | 1,875,000 | | | | 1,883,734 | |
Colombia Telecomunicaciones 144A 5.375% 9/27/22 # | | | 200,000 | | | | 195,500 | |
Columbus International 144A 7.375% 3/30/21 # | | | 390,000 | | | | 417,674 | |
Crown Castle Towers 144A 4.883% 8/15/20 # | | | 685,000 | | | | 748,415 | |
Digicel Group 144A 8.25% 9/30/20 # | | | 395,000 | | | | 362,413 | |
GTP Acquisition Partners I 144A 2.35% 6/15/20 # | | | 185,000 | | | | 184,358 | |
Historic TW 6.875% 6/15/18 | | | 400,000 | | | | 440,442 | |
Millicom International Cellular 144A 6.00% 3/15/25 # | | | 290,000 | | | | 300,244 | |
NBCUniversal Enterprise 144A 1.365% 4/15/18 #• | | | 2,910,000 | | | | 2,928,025 | |
SBA Tower Trust | | | | | | | | |
144A 2.24% 4/16/18 # | | | 220,000 | | | | 220,440 | |
144A 2.898% 10/15/19 # | | | 475,000 | | | | 480,929 | |
Sky 144A 3.75% 9/16/24 # | | | 430,000 | | | | 457,313 | |
Sprint Communications 6.00% 12/1/16 | | | 245,000 | | | | 247,756 | |
Verizon Communications 1.75% 8/15/21 | | | 1,485,000 | | | | 1,486,485 | |
| | | | | | | | |
| | | | | | | 13,155,533 | |
| | | | | | | | |
Consumer Cyclical – 2.96% | | | | | | | | |
CDK Global 4.50% 10/15/24 | | | 270,000 | | | | 273,876 | |
CVS Health 2.125% 6/1/21 | | | 1,000,000 | | | | 1,020,427 | |
General Motors Financial 4.375% 9/25/21 | | | 1,500,000 | | | | 1,608,589 | |
INVISTA Finance 144A 4.25% 10/15/19 # | | | 550,000 | | | | 548,579 | |
PACCAR Financial 1.28% 12/6/18 • | | | 2,000,000 | | | | 2,010,470 | |
Starwood Hotels & Resorts Worldwide 3.75% 3/15/25 @ | | | 315,000 | | | | 334,210 | |
Volkswagen International Finance 144A | | | | | | | | |
1.066% 11/18/16 #• | | | 1,795,000 | | | | 1,794,822 | |
Walgreens Boots Alliance 2.60% 6/1/21 | | | 1,145,000 | | | | 1,174,415 | |
| | | | | | | | |
| | | | | | | 8,765,388 | |
| | | | | | | | |
Consumer Non-Cyclical – 4.47% | | | | | | | | |
Anheuser-Busch InBev Finance 2.65% 2/1/21 | | | 1,000,000 | | | | 1,036,929 | |
Arcor SAIC 144A 6.00% 7/6/23 # | | | 85,000 | | | | 89,019 | |
Becton Dickinson 6.375% 8/1/19 | | | 805,000 | | | | 919,461 | |
Constellation Brands 4.25% 5/1/23 | | | 110,000 | | | | 117,150 | |
JB y Cia 144A 3.75% 5/13/25 # | | | 300,000 | | | | 310,827 | |
| | |
| Schedule of investments | | |
| Delaware Diversified Floating Rate Fund | | |
| | | | | | | | |
| | | Principal amount° | | | Value (U.S. $) | |
| |
Corporate Bonds (continued) | | | | | | | | |
| |
Consumer Non-Cyclical (continued) | | | | | | | | |
JBS Investments 144A 7.75% 10/28/20 # | | | 280,000 | | | $ | 298,200 | |
Kroger 1.209% 10/17/16 • | | | 900,000 | | | | 900,468 | |
Medicines 144A 2.75% 7/15/23 # | | | 16,000 | | | | 16,830 | |
Merck 0.986% 5/18/18 • | | | 670,000 | | | | 672,826 | |
Molson Coors Brewing 2.10% 7/15/21 | | | 490,000 | | | | 497,081 | |
Mylan | | | | | | | | |
144A 3.15% 6/15/21 # | | | 860,000 | | | | 887,929 | |
144A 3.95% 6/15/26 # | | | 510,000 | | | | 532,153 | |
PepsiCo 1.019% 10/13/17 • | | | 2,010,000 | | | | 2,017,160 | |
Pernod Ricard 144A 4.45% 1/15/22 # | | | 1,025,000 | | | | 1,134,450 | |
Pfizer 0.953% 6/15/18 • | | | 1,510,000 | | | | 1,514,017 | |
Siemens Financieringsmaatschappij 144A | | | | | | | | |
0.942% 5/25/18 #• | | | 1,600,000 | | | | 1,601,541 | |
Teva Pharmaceutical Finance Netherlands III | | | | | | | | |
2.20% 7/21/21 | | | 425,000 | | | | 427,641 | |
2.80% 7/21/23 | | | 225,000 | | | | 229,264 | |
| | | | | | | | |
| | | | | | | 13,202,946 | |
| | | | | | | | |
Electric – 2.68% | | | | | | | | |
AES Gener 144A 5.00% 7/14/25 # | | | 275,000 | | | | 294,097 | |
Ameren Illinois 9.75% 11/15/18 | | | 165,000 | | | | 195,244 | |
Electricite de France 144A 1.156% 1/20/17 #• | | | 2,460,000 | | | | 2,462,079 | |
Emera 6.75% 6/15/76 • | | | 200,000 | | | | 216,603 | |
Enel 144A 8.75% 9/24/73 #• | | | 260,000 | | | | 301,925 | |
Entergy 4.00% 7/15/22 | | | 500,000 | | | | 543,013 | |
ITC Holdings 3.25% 6/30/26 | | | 335,000 | | | | 342,474 | |
National Rural Utilities Cooperative Finance | | | | | | | | |
4.75% 4/30/43 • | | | 1,110,000 | | | | 1,116,162 | |
NV Energy 6.25% 11/15/20 | | | 390,000 | | | | 463,226 | |
Pennsylvania Electric 5.20% 4/1/20 | | | 625,000 | | | | 679,377 | |
Southern 2.35% 7/1/21 | | | 1,270,000 | | | | 1,298,688 | |
| | | | | | | | |
| | | | | | | 7,912,888 | |
| | | | | | | | |
Energy – 5.13% | | | | | | | | |
Chevron 1.211% 3/3/22 • | | | 2,200,000 | | | | 2,153,327 | |
Cia Brasileira de Aluminio 144A 6.75% 4/5/21 # | | | 105,000 | | | | 111,431 | |
CNOOC Finance 2015 Australia 2.625% 5/5/20 | | | 200,000 | | | | 204,077 | |
ConocoPhillips 1.526% 5/15/22 • | | | 2,050,000 | | | | 1,985,417 | |
Devon Energy 1.193% 12/15/16 • | | | 2,465,000 | | | | 2,452,465 | |
Ecopetrol 5.875% 9/18/23 | | | 185,000 | | | | 193,787 | |
EnLink Midstream Partners 2.70% 4/1/19 | | | 165,000 | | | | 161,743 | |
Pertamina Persero 144A 5.25% 5/23/21 # | | | 200,000 | | | | 217,324 | |
Petrobras Global Finance | | | | | | | | |
6.25% 3/17/24 | | | 20,000 | | | | 18,800 | |
| | | | | | | | |
| | | Principal amount° | | | Value (U.S. $) | |
| |
Corporate Bonds (continued) | | | | | | | | |
| |
Energy (continued) | | | | | | | | |
Petrobras Global Finance | | | | | | | | |
8.375% 5/23/21 | | | 230,000 | | | $ | 243,743 | |
Petroleos Mexicanos | | | | | | | | |
3.50% 7/23/20 | | | 185,000 | | | | 186,619 | |
144A 6.375% 2/4/21 # | | | 75,000 | | | | 82,480 | |
144A 6.875% 8/4/26 # | | | 105,000 | | | | 118,125 | |
Petronas Global Sukuk 144A 2.707% 3/18/20 # | | | 320,000 | | | | 325,338 | |
Regency Energy Partners 5.875% 3/1/22 | | | 515,000 | | | | 562,335 | |
Shell International Finance 1.08% 5/11/20 • | | | 2,105,000 | | | | 2,079,875 | |
Statoil 1.092% 11/8/18 • | | | 2,640,000 | | | | 2,627,412 | |
Total Capital International 0.997% 6/19/19 • | | | 645,000 | | | | 635,818 | |
Woodside Finance 144A 8.75% 3/1/19 # | | | 540,000 | | | | 627,960 | |
YPF 144A 8.50% 3/23/21 # | | | 160,000 | | | | 172,000 | |
| | | | | | | | |
| | | | | | | 15,160,076 | |
| | | | | | | | |
Finance Companies – 2.12% | | | | | | | | |
AerCap Ireland Capital 3.95% 2/1/22 | | | 790,000 | | | | 829,247 | |
Aviation Capital Group 144A 6.75% 4/6/21 # | | | 430,000 | | | | 502,992 | |
Blackhawk Network Holdings 144A 1.50% 1/15/22 # | | | 1,000 | | | | 1,025 | |
General Electric Capital | | | | | | | | |
1.148% 5/5/26 • | | | 1,690,000 | | | | 1,599,904 | |
1.285% 1/9/20 • | | | 1,435,000 | | | | 1,442,482 | |
1.653% 3/15/23 • | | | 1,050,000 | | | | 1,059,417 | |
144A 3.80% 6/18/19 # | | | 250,000 | | | | 267,922 | |
6.00% 8/7/19 | | | 215,000 | | | | 245,680 | |
SMBC Aviation Capital Finance 144A 2.65% 7/15/21 # | | | 215,000 | | | | 216,524 | |
SUAM Finance 144A 4.875% 4/17/24 # | | | 100,000 | | | | 104,750 | |
| | | | | | | | |
| | | | | | | 6,269,943 | |
| | | | | | | | |
Insurance – 0.42% | | | | | | | | |
MetLife 5.25% 12/29/49 • | | | 375,000 | | | | 376,238 | |
Prudential Financial | | | | | | | | |
5.375% 5/15/45 • | | | 295,000 | | | | 307,169 | |
5.625% 6/15/43 • | | | 365,000 | | | | 391,280 | |
XLIT 6.50% 10/29/49 • | | | 250,000 | | | | 173,125 | |
| | | | | | | | |
| | | | | | | 1,247,812 | |
| | | | | | | | |
Natural Gas – 1.99% | | | | | | | | |
Enbridge | | | | | | | | |
1.136% 6/2/17 • | | | 1,800,000 | | | | 1,777,433 | |
1.296% 10/1/16 • | | | 2,700,000 | | | | 2,692,413 | |
Enterprise Products Operating 7.034% 1/15/68 • | | | 80,000 | | | | 84,413 | |
Laclede Group 1.376% 8/15/17 • | | | 1,320,000 | | | | 1,316,070 | |
| | | | | | | | |
| | | | | | | 5,870,329 | |
| | | | | | | | |
| | |
| Schedule of investments | | |
| Delaware Diversified Floating Rate Fund | | |
| | | | | | | | |
| | | Principal amount° | | | Value (U.S. $) | |
| |
Corporate Bonds (continued) | | | | | | | | |
| |
Real Estate – 1.30% | | | | | | | | |
Corporate Office Properties | | | | | | | | |
3.60% 5/15/23 | | | 225,000 | | | $ | 223,912 | |
5.25% 2/15/24 | | | 575,000 | | | | 624,382 | |
Crown Castle International 5.25% 1/15/23 | | | 175,000 | | | | 200,972 | |
Education Realty Operating Partnership 4.60% 12/1/24 | | | 465,000 | | | | 488,670 | |
Hospitality Properties Trust 4.50% 3/15/25 | | | 460,000 | | | | 468,294 | |
Host Hotels & Resorts 3.75% 10/15/23 | | | 1,100,000 | | | | 1,124,225 | |
Kimco Realty 3.40% 11/1/22 | | | 70,000 | | | | 73,777 | |
PLA Administradora Industrial 144A 5.25% 11/10/22 # | | | 205,000 | | | | 212,380 | |
WP Carey 4.60% 4/1/24 | | | 400,000 | | | | 416,683 | |
| | | | | | | | |
| | | | | | | 3,833,295 | |
| | | | | | | | |
Technology – 0.65% | | | | | | | | |
National Semiconductor 6.60% 6/15/17 | | | 310,000 | | | | 325,284 | |
ON Semiconductor 1.00% 12/1/20 | | | 23,000 | | | | 21,706 | |
Oracle 2.40% 9/15/23 | | | 655,000 | | | | 662,126 | |
Samsung Electronics America 144A 1.75% 4/10/17 # | | | 500,000 | | | | 501,771 | |
Tencent Holdings 144A 3.375% 5/2/19 # | | | 365,000 | | | | 378,877 | |
Verint Systems 1.50% 6/1/21 | | | 28,000 | | | | 26,425 | |
| | | | | | | | |
| | | | | | | 1,916,189 | |
| | | | | | | | |
Transportation – 0.30% | | | | | | | | |
Air Canada 2015-1 Class A Pass Through Trust 144A | | | | | | | | |
3.60% 3/15/27 #¿ | | | 231,327 | | | | 239,423 | |
American Airlines 2014-1 Class A Pass Through Trust | | | | | | | | |
3.70% 10/1/26 ¿ | | | 232,915 | | | | 245,143 | |
Aviation Capital Group 144A 2.875% 9/17/18 # | | | 90,000 | | | | 91,462 | |
United Airlines 2014-1 Class A Pass Through Trust | | | | | | | | |
4.00% 4/11/26 ¿ | | | 188,546 | | | | 203,040 | |
United Airlines 2014-2 Class A Pass Through Trust | | | | | | | | |
3.75% 9/3/26 ¿ | | | 106,799 | | | | 113,875 | |
| | | | | | | | |
| | | | | | | 892,943 | |
| | | | | | | | |
Utilities – 0.09% | | | | | | | | |
CMS Energy 6.25% 2/1/20 | | | 240,000 | | | | 275,391 | |
| | | | | | | | |
| | | | | | | 275,391 | |
| | | | | | | | |
Total Corporate Bonds (cost $131,411,311) | | | | | | | 132,292,546 | |
| | | | | | | | |
| | | | | | | | |
| |
Municipal Bonds – 2.07% | | | | | | | | |
| |
Missouri Higher Education Loan Authority | | | | | | | | |
Series 2010-2 A-1 1.479% 8/27/29 • | | | 27,464 | | | | 27,082 | |
New Mexico Educational Assistance Foundation (Libor Floating) | | | | | | | | |
Series 2010-1 A-3 1.835% 12/1/38 • | | | 120,000 | | | | 120,113 | |
| | | | | | | | |
| | | Principal amount° | | | Value (U.S. $) | |
| |
Municipal Bonds (continued) | | | | | | | | |
| |
North Texas Higher Education Authority Student Loan Revenue (Libor Floating) | | | | | | | | |
Series 2010-1 A-2 1.546% 7/1/30 • | | | 55,000 | | | $ | 55,007 | |
Series 2011-1 A 1.746% 4/1/40 • | | | 193,844 | | | | 192,165 | |
Oklahoma Student Loan Authority (Libor-Indexed) | | | | | | | | |
Series 2010-A A-2A 1.835% 9/1/37 • | | | 95,000 | | | | 94,558 | |
Series 2011-1 A-1 1.823% 6/1/40 • | | | 463,968 | | | | 457,765 | |
Pennsylvania Turnpike Commission | | | | | | | | |
Series B-1 1.42% 12/1/21 • | | | 1,160,000 | | | | 1,155,789 | |
State of California | | | | | | | | |
Series D 1.047% 12/1/28 • | | | 2,000,000 | | | | 2,001,880 | |
University of California | | | | | | | | |
Series Y-1 0.994% 7/1/41 • | | | 2,000,000 | | | | 2,000,480 | |
| | | | | | | | |
Total Municipal Bonds (cost $6,115,251) | | | | | | | 6,104,839 | |
| | | | | | | | |
| | | | | | | | |
| |
Non-Agency Asset-Backed Securities – 8.42% | | | | | | | | |
| |
American Express Credit Account Master Trust | | | | | | | | |
Series 2013-1 A 0.901% 2/16/21 • | | | 500,000 | | | | 501,550 | |
Series 2014-1 A 0.851% 12/15/21 • | | | 2,000,000 | | | | 2,001,119 | |
Bank of America Credit Card Trust | | | | | | | | |
Series 2014-A3 A 0.771% 1/15/20 • | | | 500,000 | | | | 500,529 | |
Chase Issuance Trust | | | | | | | | |
Series 2013-A6 A6 0.901% 7/15/20 • | | | 1,625,000 | | | | 1,630,118 | |
Series 2014-A5 A5 0.851% 4/15/21 • | | | 3,595,000 | | | | 3,594,111 | |
Chesapeake Funding | | | | | | | | |
Series 2014-1A A 144A 0.89% 3/7/26 #• | | | 116,640 | | | | 116,285 | |
Citibank Credit Card Issuance Trust | | | | | | | | |
Series 2013-A4 A4 0.908% 7/24/20 • | | | 1,500,000 | | | | 1,504,936 | |
Series 2013-A7 A7 0.904% 9/10/20 • | | | 1,700,000 | | | | 1,704,729 | |
Discover Card Execution Note Trust | | | | | | | | |
Series 2013-A1 A1 0.781% 8/17/20 • | | | 675,000 | | | | 675,466 | |
Series 2014-A1 A1 0.911% 7/15/21 • | | | 1,300,000 | | | | 1,302,604 | |
Series 2015-A1 A1 0.831% 8/17/20 • | | | 1,500,000 | | | | 1,500,766 | |
Ford Credit Floorplan Master Owner Trust A | | | | | | | | |
Series 2014-1 A2 0.881% 2/15/19 • | | | 2,000,000 | | | | 2,000,933 | |
Golden Credit Card Trust | | | | | | | | |
Series 2015-1A A 144A 0.921% 2/15/20 #• | | | 300,000 | | | | 299,495 | |
Hertz Fleet Lease Funding | | | | | | | | |
Series 2014-1 A 144A 0.874% 4/10/28 #• | | | 108,806 | | | | 108,766 | |
Nissan Auto Receivables 2016-b Owner Trust | | | | | | | | |
Series 2016-B A2B 0.781% 4/15/19 • | | | 2,000,000 | | | | 2,002,581 | |
PFS Financing | | | | | | | | |
Series 2015-AA A 144A 1.101% 4/15/20 #• | | | 500,000 | | | | 495,617 | |
| | |
| Schedule of investments | | |
| Delaware Diversified Floating Rate Fund | | |
| | | | | | | | |
| | | Principal amount° | | | Value (U.S. $) | |
| |
Non-Agency Asset-Backed Securities (continued) | | | | | | | | |
| |
Toyota Auto Receivables 2016-a Owner Trust | | | | | | | | |
Series 2016-A A2B 0.801% 7/16/18 • | | | 1,750,000 | | | $ | 1,751,477 | |
Trade MAPS 1 | | | | | | | | |
Series 2013-1A A 144A 1.174% 12/10/18 #• | | | 3,200,000 | | | | 3,190,158 | |
| | | | | | | | |
Total Non-Agency Asset-Backed Securities
(cost $24,884,841) | | | | | | | 24,881,240 | |
| | | | | | | | |
| | | | | | | | |
| |
Senior Secured Loans – 30.81%« | | | | | | | | |
| |
Accudyne Industries Borrower 1st Lien 4.00% 12/13/19 | | | 889,227 | | | | 828,093 | |
Air Medical Group Holdings Tranche B 1st Lien 4.25% 4/28/22 | | | 1,064,250 | | | | 1,047,177 | |
Albertson’s Tranche B4 1st Lien 5.50% 8/25/21 | | | 1,095,450 | | | | 1,101,526 | |
Amaya Holdings 1st Lien 5.00% 8/1/21 | | | 1,256,729 | | | | 1,245,172 | |
American Airlines Tranche B1 1st Lien 3.50% 5/23/19 | | | 433,659 | | | | 434,123 | |
Applied Systems Tranche 2nd Lien 7.50% 1/23/22 @ | | | 1,283,900 | | | | 1,290,320 | |
Arnhold & S Bleichroeder Holdings Tranche B 1st Lien 4.75% 12/1/22 | | | 726,350 | | | | 718,027 | |
ATI Holdings Acquisition Tranche 1st Lien 5.50% 5/10/23 | | | 620,000 | | | | 624,650 | |
Avago Technologies Cayman Finance Tranche B 1st Lien 4.25% 2/1/23 | | | 1,696,909 | | | | 1,702,919 | |
BJ’s Wholesale Club 2nd Lien 8.50% 3/31/20 | | | 925,570 | | | | 920,653 | |
Blue Ribbon Tranche 1st Lien 5.00% 11/13/21 | | | 1,521,819 | | | | 1,531,330 | |
Builders FirstSource Tranche B 1st Lien 6.00% 7/31/22 | | | 1,798,768 | | | | 1,807,987 | |
Calpine Tranche B 1st Lien 4.00% 1/15/23 | | | 751,225 | | | | 752,432 | |
Charter Communications Operating Tranche F | | | | | | | | |
3.00% 1/3/21 | | | 935,445 | | | | 936,615 | |
3.00% 7/1/20 | | | 503,795 | | | | 504,622 | |
Charter Communications Operating Tranche H 1st Lien 3.25% 8/24/21 | | | 173,565 | | | | 174,202 | |
Charter Communications Tranche I 1st Lien 3.50% 1/24/23 | | | 521,693 | | | | 524,813 | |
CityCenter Holdings Tranche B 1st Lien 4.25% 10/16/20 | | | 593,844 | | | | 597,865 | |
Colouroz (Flint Group) 1st Lien 4.50% 9/7/21 | | | 526,951 | | | | 522,341 | |
Colouroz (Flint Group) Tranche C 1st Lien 4.50% 9/7/21 | | | 87,111 | | | | 86,458 | |
CommScope Tranche B 1st Lien 3.75% 12/29/22 | | | 624,283 | | | | 627,697 | |
Communications Sales & Leasing Tranche B 1st Lien 5.00% 10/24/22 | | | 717,750 | | | | 718,535 | |
Community Health Systems Tranche F 1st Lien 3.924% 12/31/18 | | | 756,700 | | | | 751,077 | |
Community Health Systems Tranche H 1st Lien 4.00% 1/27/21 | | | 227,700 | | | | 225,190 | |
DAE Aviation Holdings 1st Lien 5.25% 7/7/22 | | | 580,613 | | | | 582,790 | |
DaVita Healthcare Partners Tranche B 1st Lien 3.50% 6/24/21 | | | 1,406,300 | | | | 1,414,210 | |
| | | | | | | | |
| | | Principal amount° | | | Value (U.S. $) | |
| |
Senior Secured Loans« (continued) | | | | | | | | |
| |
Dell International Tranche B 1st Lien 4.00% 6/2/23 | | | 1,025,000 | | | $ | 1,026,388 | |
Dynegy Finance IV Tranche 1st Lien 5.00% 6/27/23 | | | 660,000 | | | | 660,894 | |
Emdeon 1st Lien 3.75% 11/2/18 | | | 2,011,181 | | | | 2,015,895 | |
Examworks Group Tranche 1st Lien 4.75% 7/28/23 | | | 825,000 | | | | 827,407 | |
First Data Tranche B 1st Lien | | | | | | | | |
4.238% 7/10/22 | | | 911,000 | | | | 915,271 | |
4.488% 3/24/21 | | | 1,342,625 | | | | 1,350,405 | |
Flint Group 2nd Lien 8.25% 9/7/22 @ | | | 250,000 | | | | 235,000 | |
FMG Resources August 2006 Pty 1st Lien 4.25% 6/30/19 | | | 1,384,106 | | | | 1,358,478 | |
Frank Russell Tranche B 1st Lien 6.75% 6/1/23 | | | 1,973,000 | | | | 1,863,252 | |
Gardner Denver 1st Lien 4.25% 7/30/20 | | | 1,411,755 | | | | 1,346,021 | |
Gates Global 1st Lien 4.25% 7/6/21 | | | 1,127,643 | | | | 1,107,345 | |
GCP Applied Technologies Tranche B 1st Lien 5.25% 2/3/22 | | | 463,838 | | | | 466,302 | |
Green Energy Partners/Stonewall Tranche B 1st Lien 6.50% 11/13/21 | | | 568,000 | | | | 550,960 | |
HCA Tranche B6 1st Lien 3.746% 3/17/23 | | | 201,495 | | | | 203,353 | |
Hilton Worldwide Finance Tranche B2 1st Lien 3.50% 10/26/20 | | | 1,960,548 | | | | 1,967,900 | |
Houghton International 1st Lien 4.25% 12/20/19 | | | 1,112,244 | | | | 1,113,634 | |
Hyperion Insurance Group Tranche B 1st Lien 5.50% 4/29/22 | | | 799,875 | | | | 771,879 | |
IASIS Healthcare Tranche B 1st Lien 4.50% 5/3/18 | | | 852,585 | | | | 852,762 | |
Immucor Tranche B2 1st Lien 5.00% 8/17/18 | | | 364,057 | | | | 353,742 | |
Ineos U.S. Finance Tranche B 1st Lien | | | | | | | | |
3.75% 12/15/20 | | | 539,814 | | | | 538,577 | |
4.25% 3/31/22 | | | 804,807 | | | | 805,122 | |
JC Penney Tranche B 1st Lien 5.25% 6/23/23 | | | 469,224 | | | | 470,690 | |
Keurig Green Mountain Tranche B 1st Lien 5.25% 3/3/23 | | | 1,055,533 | | | | 1,064,980 | |
KIK Custom Products 1st Lien 6.00% 8/26/22 @ | | | 1,382,734 | | | | 1,378,701 | |
Kinetic Concepts Tranche E1 1st Lien 5.00% 5/4/18 | | | 369,128 | | | | 369,397 | |
KRATON Polymers Tranche B 1st Lien 6.00% 1/6/22 | | | 1,050,000 | | | | 1,045,406 | |
Landry’s Tranche B 1st Lien 4.00% 4/24/18 | | | 650,836 | | | | 652,768 | |
Level 3 Financing Tranche B 1st Lien 4.00% 1/15/20 | | | 2,365,000 | | | | 2,378,303 | |
LTS Buyer 1st Lien 4.00% 4/13/20 | | | 169,750 | | | | 170,153 | |
LTS Buyer 2nd Lien 8.00% 4/1/21 | | | 1,488,075 | | | | 1,491,795 | |
Marina District Finance Tranche B 1st Lien 6.50% 8/15/18 | | | 715,843 | | | | 717,037 | |
Mauser Holdings 2nd Lien 8.75% 7/31/22 | | | 123,000 | | | | 120,156 | |
MGM Growth Properties Operating Partnership Tranche B 1st Lien 4.00% 4/25/23 | | | 753,113 | | | | 759,467 | |
Micron Technology Tranche B 1st Lien 6.64% 4/26/22 | | | 250,000 | | | | 253,125 | |
Mohegan Tribal Gaming Authority Tranche B 1st Lien 5.50% 6/15/18 | | | 1,332,965 | | | | 1,333,173 | |
MPH Acquisition Holdings 5.00% 6/7/23 | | | 1,040,000 | | | | 1,050,726 | |
| | |
| Schedule of investments | | |
| Delaware Diversified Floating Rate Fund | | |
| | | | | | | | |
| | | Principal amount° | | | Value (U.S. $) | |
| |
Senior Secured Loans« (continued) | | | | | | | | |
| |
NBTY Tranche B 1st Lien 5.00% 5/5/23 | | | 1,353,000 | | | $ | 1,346,024 | |
Neiman Marcus Group 1st Lien 4.25% 10/25/20 | | | 234,399 | | | | 221,200 | |
Neptune Finco Tranche B 1st Lien 5.00% 10/9/22 | | | 623,438 | | | | 629,126 | |
Numericable U.S. Tranche 1st Lien 4.752% 1/31/23 | | | 219,449 | | | | 219,997 | |
Numericable U.S. Tranche B 1st Lien 5.002% 1/15/24 | | | 1,625,925 | | | | 1,629,990 | |
NXP Tranche B1 1st Lien 3.75% 12/7/20 | | | 629,177 | | | | 634,191 | |
ON Semiconductor Tranche B 1st Lien 5.25% 3/31/23 | | | 820,000 | | | | 830,250 | |
Panda Hummel Tranche B1 1st Lien 7.00% 10/27/22 | | | 295,000 | | | | 283,938 | |
Panda Liberty Tranche B 1st Lien 7.50% 8/21/20 | | | 1,054,233 | | | | 1,030,512 | |
PET Acquisition Merger Sub Tranche B1 1st Lien 5.00% 1/26/23 | | | 1,179,075 | | | | 1,185,918 | |
PQ 1st Lien 5.75% 11/4/22 | | | 1,458,000 | | | | 1,470,887 | |
Prime Security Services Borrower 1st Lien 4.75% 5/2/22 | | | 675,000 | | | | 680,836 | |
Prime Security Services Borrower 2nd Lien 9.75% 7/1/22 | | | 934,615 | | | | 947,077 | |
Prospect Medical Holdings Tranche B 1st Lien 7.00% 6/30/22 | | | 1,175,000 | | | | 1,168,391 | |
Revlon Consumer Products Tranche B 1st Lien 4.25% 7/22/23 | | | 720,000 | | | | 720,090 | |
Reynolds Group Holdings Tranche 1st Lien 4.25% 1/21/23 | | | 415,000 | | | | 416,113 | |
Reynolds Group Holdings Tranche B 1st Lien 4.50% 12/1/18 | | | 1,187,596 | | | | 1,191,493 | |
Sable International Finance Tranche B1 1st Lien 5.50% 12/31/22 | | | 1,060,000 | | | | 1,067,619 | |
Sable International Finance Tranche B2 1st Lien 5.83% 12/31/22 | | | 865,000 | | | | 871,218 | |
SAM Finance Tranche B 1st Lien 4.25% 12/17/20 | | | 580,079 | | | | 577,994 | |
Scientific Games International 1st Lien 6.00% 10/18/20 | | | 374,041 | | | | 374,352 | |
Seminole Tribe of Florida Tranche B 3.00% 4/29/20 | | | 772,500 | | | | 775,011 | |
SIG Combibloc PurchaseCo Tranche B 1st Lien 4.25% 3/13/22 | | | 256,750 | | | | 257,690 | |
Sinclair Television Group Tranche B1 1st Lien 3.50% 7/31/21 | | | 683,100 | | | | 684,523 | |
Solera Tranche B 1st Lien 5.75% 3/3/23 | | | 962,588 | | | | 971,697 | |
Spectrum Brands 1st Lien 3.50% 6/23/22 | | | 433,618 | | | | 436,091 | |
Stardust Finance Holdings 2nd Lien 10.50% 3/13/23 | | | 295,000 | | | | 292,419 | |
Stardust Finance Holdings Tranche B 1st Lien 6.50% 3/13/22 @ | | | 963,995 | | | | 960,380 | |
Station Casinos Tranche B 1st Lien 3.75% 6/8/23 | | | 305,000 | | | | 305,105 | |
Summit Materials Tranche B 1st Lien 4.00% 7/17/22 | | | 579,150 | | | | 581,065 | |
SUPERVALU 1st Lien 5.50% 3/21/19 | | | 410,495 | | | | 410,866 | |
Telenet Financing Usd Tranche B 1st Lien 4.25% 6/30/24 | | | 255,000 | | | | 255,956 | |
T-Mobile USA Tranche B 1st Lien 3.50% 11/9/22 | | | 1,109,425 | | | | 1,117,573 | |
TransDigm Tranche 1st Lien 3.75% 6/9/23 | | | 400,535 | | | | 398,783 | |
| | | | | | | | |
| | | Principal amount° | | | Value (U.S. $) | |
| |
Senior Secured Loans« (continued) | | | | | | | | |
| |
TransDigm Tranche E 1st Lien 3.75% 5/14/22 | | | 198,041 | | | $ | 197,669 | |
TransDigm Tranche F 1st Lien 3.75% 6/9/23 | | | 360,481 | | | | 358,904 | |
Tribune Media Tranche B 1st Lien 3.75% 12/27/20 | | | 579,150 | | | | 581,684 | |
Univar USA Tranche B 1st Lien 4.25% 7/1/22 | | | 185,598 | | | | 185,621 | |
Univision Communications 1st Lien 4.00% 3/1/20 | | | 957,414 | | | | 958,097 | |
Univision Communications Tranche C4 1st Lien 4.00% 3/1/20 | | | 1,397,745 | | | | 1,399,057 | |
Usagm Holdco Tranche 1st Lien 5.50% 7/28/22 | | | 1,180,728 | | | | 1,178,699 | |
Usagm Holdco Tranche DD 1st Lien 5.50% 7/28/22 | | | 234,272 | | | | 233,832 | |
USI Tranche B 1st Lien 4.25% 12/27/19 | | | 675,644 | | | | 674,800 | |
Valeant Pharmaceuticals International 1st Lien 4.75% 12/11/19 | | | 965,871 | | | | 956,816 | |
Valeant Pharmaceuticals International Tranche A3 3.75% 10/20/18 | | | 525,263 | | | | 517,515 | |
Western Digital Tranche B 1st Lien 6.25% 4/29/23 | | | 630,000 | | | | 637,403 | |
WideOpen West Finance Tranche B 1st Lien 4.50% 4/1/19 | | | 1,190,004 | | | | 1,193,599 | |
Windstream Services Tranche B6 1st Lien 5.75% 3/29/21 | | | 670,895 | | | | 676,765 | |
Wireco Worldgroup Tranche 1st Lien 6.50% 7/22/23 | | | 600,000 | | | | 602,813 | |
Zekelman Industries Tranche 1st Lien 6.00% 6/14/21 | | | 510,000 | | | | 513,188 | |
| | | | | | | | |
Total Senior Secured Loans (cost $90,218,285) | | | | | | | 91,068,125 | |
| | | | | | | | |
| | | | | | | | |
| |
Sovereign Bonds – 0.55%D | | | | | | | | |
| |
Argentina – 0.05% | | | | | | | | |
Provincia De Buenos Aires 144A 5.75% 6/15/19 # | | | 150,000 | | | | 153,938 | |
| | | | | | | | |
| | | | | | | 153,938 | |
| | | | | | | | |
Croatia – 0.07% | | | | | | | | |
Croatia Government International Bond 144A | | | | | | | | |
6.375% 3/24/21 # | | | 200,000 | | | | 220,880 | |
| | | | | | | | |
| | | | | | | 220,880 | |
| | | | | | | | |
Guatemala – 0.07% | | | | | | | | |
Guatemala Government Bond 144A 4.50% 5/3/26 # | | | 200,000 | | | | 211,250 | |
| | | | | | | | |
| | | | | | | 211,250 | |
| | | | | | | | |
Norway – 0.17% | | | | | | | | |
Kommunalbanken 144A 0.816% 2/20/18 #• | | | 500,000 | | | | 499,312 | |
| | | | | | | | |
| | | | | | | 499,312 | |
| | | | | | | | |
Qatar – 0.11% | | | | | | | | |
Qatar Government International Bond 144A | | | | | | | | |
2.375% 6/2/21 # | | | 315,000 | | | | 318,008 | |
| | | | | | | | |
| | | | | | | 318,008 | |
| | | | | | | | |
| | |
| Schedule of investments | | |
| Delaware Diversified Floating Rate Fund | | |
| | | | | | | | |
| | | Principal amount° | | | Value (U.S. $) | |
| |
Sovereign BondsD (continued) | | | | | | | | |
| |
Sri Lanka – 0.08% | | | | | | | | |
Sri Lanka Government International Bond 144A | | | | | | | | |
5.75% 1/18/22 # | | | 225,000 | | | $ | 232,961 | |
| | | | | | | | |
| | | | | | | 232,961 | |
| | | | | | | | |
Total Sovereign Bonds (cost $1,601,211) | | | | | | | 1,636,349 | |
| | | | | | | | |
| | | | | | | | |
| |
Supranational Banks – 2.05% | | | | | | | | |
| |
Inter-American Development Bank 0.90% 10/15/20 • | | | 2,680,000 | | | | 2,679,110 | |
International Bank For Reconstruction & Development | | | | | | | | |
0.795% 12/16/17 • | | | 1,515,000 | | | | 1,516,844 | |
International Finance 0.725% 1/9/19 • | | | 1,855,000 | | | | 1,853,970 | |
| | | | | | | | |
Total Supranational Banks (cost $6,035,640) | | | | | | | 6,049,924 | |
| | | | | | | | |
| | | | | | | | |
| |
U.S. Treasury Obligations – 1.79% | | | | | | | | |
| |
U.S. Treasury Notes | | | | | | | | |
0.475% 4/30/18 • | | | 4,830,000 | | | | 4,836,593 | |
1.625% 5/15/26 | | | 455,000 | | | | 461,825 | |
| | | | | | | | |
Total U.S. Treasury Obligations (cost $5,057,307) | | | | | | | 5,298,418 | |
| | | | | | | | |
| | | | | | | | |
| | |
| | | Number of shares | | | | |
| |
Convertible Preferred Stock – 0.02% | | | | | | | | |
| |
Maiden Holdings 7.25% exercise price $15.05, expiration date 9/15/16 | | | 874 | | | | 44,889 | |
| | | | | | | | |
Total Convertible Preferred Stock (cost $43,349) | | | | | | | 44,889 | |
| | | | | | | | |
| | | | | | | | |
| |
Preferred Stock – 1.69% | | | | | | | | |
| |
General Electric 5.00% • | | | 864,000 | | | | 932,040 | |
Integrys Energy Group 6.00% @• | | | 14,900 | | | | 402,784 | |
PNC Preferred Funding Trust II 144A 1.875% #• | | | 2,500,000 | | | | 2,291,000 | |
USB Realty 144A 1.827% #@• | | | 1,600,000 | | | | 1,372,000 | |
| | | | | | | | |
Total Preferred Stock (cost $5,061,823) | | | | | | | 4,997,824 | |
| | | | | | | | |
| | | | | | | | |
| | | Principal amount° | | | Value (U.S. $) | |
| |
Short-Term Investments – 3.48% | | | | | | | | |
| |
Discount Notes – 1.80% ≠ | | | | | | | | |
Federal Home Loan Bank | | | | | | | | |
0.163% 8/3/16 | | | 689,915 | | | $ | 689,908 | |
0.195% 8/5/16 | | | 701,896 | | | | 701,878 | |
0.241% 8/10/16 | | | 1,209,703 | | | | 1,209,649 | |
0.271% 8/29/16 | | | 559,262 | | | | 559,185 | |
0.282% 8/26/16 | | | 1,359,742 | | | | 1,359,575 | |
0.318% 9/7/16 | | | 393,441 | | | | 393,344 | |
0.322% 9/19/16 | | | 198,621 | | | | 198,556 | |
0.375% 9/21/16 | | | 97,832 | | | | 97,792 | |
0.376% 9/23/16 | | | 119,337 | | | | 119,294 | |
| | | | | | | | |
| | | | | | | 5,329,181 | |
| | | | | | | | |
Repurchase Agreements – 1.68% | | | | | | | | |
Bank of America Merrill Lynch | | | | | | | | |
0.29%, dated 7/29/16, to be repurchased on 8/1/16, repurchase price $1,408,810 (collateralized by U.S. government obligations 3.375% 5/15/44; market value $1,436,952) | | | 1,408,776 | | | | 1,408,776 | |
Bank of Montreal | | | | | | | | |
0.26%, dated 7/29/16, to be repurchased on 8/1/16, repurchase price $2,348,010 (collateralized by U.S. government obligations 0.125%-3.125% 2/15/19-11/15/45; market value $2,394,919) | | | 2,347,959 | | | | 2,347,959 | |
BNP Paribas | | | | | | | | |
0.33%, dated 7/29/16, to be repurchased on 8/1/16, repurchase price $1,209,298 (collateralized by U.S. government obligations 0.00%-4.250% 8/31/19-11/15/40; market value $1,233,450) | | | 1,209,265 | | | | 1,209,265 | |
| | | | | | | | |
| | | | | | | 4,966,000 | |
| | | | | | | | |
Total Short-Term Investments (cost $10,294,863) | | | | | | | 10,295,181 | |
| | | | | | | | |
Total Value of Securities – 101.63% | | | | | | | | |
(cost $298,405,117) | | | | | | $ | 300,369,613 | |
| | | | | | | | |
| # | Security exempt from registration under Rule 144A of the Securities Act of 1933, as amended. At July 31, 2016, the aggregate value of Rule 144A securities was $47,099,596, which represents 15.94% of the Fund’s net assets. See Note 11 in “Notes to financial statements.” |
| @ | Illiquid security. At July 31, 2016, the aggregate value of illiquid securities was $6,804,982, which represents 2.30% of the Fund’s net assets. See Note 11 in “Notes to financial statements.” |
| ¿ | Pass Through Agreement. Security represents the contractual right to receive a proportionate amount of underlying payments due to the counterparty pursuant to various agreements related to the rescheduling of obligations and the exchange of certain notes. |
| ≠ | The rate shown is the effective yield at the time of purchase. |
| | |
| Schedule of investments | | |
| Delaware Diversified Floating Rate Fund | | |
| ° | Principal amount shown is stated in U.S. dollars unless noted that the security is denominated in another currency. |
| • | Variable rate security. The rate shown is the rate as of July 31, 2016. Interest rates reset periodically. |
| D | Securities have been classified by country of origin. |
| « | Senior secured loans generally pay interest at rates which are periodically redetermined by reference to a base lending rate plus a premium. These base lending rates are generally: (i) the prime rate offered by one or more U.S. banks, (ii) the lending rate offered by one or more European banks such as the London Interbank Offered Rate (LIBOR), and (iii) the certificate of deposit rate. Senior secured loans may be subject to restrictions on resale. Stated rate in effect at July 31, 2016. |
| f | Step coupon bond. Coupon increases or decreases periodically based on a predetermined schedule. Stated rate in effect at July 31, 2016. |
The following swap contracts were outstanding at July 31, 2016:1
Swap Contracts
Interest Rate Swap Contracts2
| | | | | | | | | | | | | | | | | | | | |
Counterparty & Swap Referenced Obligation | | Notional Value3 | | | Fixed
Interest Rate
Received
(Paid) | | | Variable
Interest Rate
Received
(Paid) | | | Termination
Date | | | Unrealized
Appreciation
(Depreciation)4 | |
CME - BAML 10 yr | | | 4,905,000 | | | | 1.687% | | | | (0.759%) | | | | 4/5/26 | | | $ | (150,631) | |
CME - HSBC 7 yr | | | 7,855,000 | | | | 1.416% | | | | (0.759%) | | | | 4/6/23 | | | | (122,726) | |
CME - MSC 3 yr | | | 14,250,000 | | | | 0.978% | | | | (0.759%) | | | | 4/6/19 | | | | (21,278) | |
CME - MSC 5 yr | | | 14,830,000 | | | | 1.199% | | | | (0.759%) | | | | 4/6/21 | | | | (106,948) | |
| | | | | | | | | | | | | | | | | | | | |
| | | | | | | | | | | | | | | | | | $ | (401,583) | |
| | | | | | | | | | | | | | | | | | | | |
The use of swap contracts involves elements of market risk and risks in excess of the amounts disclosed in the financial statements. The notional values presented above represent the Fund’s total exposure in such contracts, whereas only the net unrealized appreciation (depreciation) is reflected in the Fund’s net assets.
| 1 | See Note 8 in “Notes to financial statements.” |
| 2 | An interest rate swap agreement is an exchange of interest rates between counterparties. Periodic payments/(receipts) on such contracts are accrued daily and recorded as unrealized appreciation (depreciation) on swap contracts. Upon periodic payment (receipt) or termination of the contract, such amounts are recorded as realized gains (losses) on swap contracts. |
| 3 | Notional value shown is stated in U.S. dollars unless noted that the swap is denominated in another currency. |
| 4 | Unrealized appreciation (depreciation) does not include periodic interest payments on swap contracts accrued daily in the amount of $(143,184). |
Summary of abbreviations:
ARM – Adjustable Rate Mortgage
BAML – Bank of America Merrill Lynch
CLO – Collateralized Loan Obligation
CME – Chicago Mercantile Exchange Inc.
HSBC – Hong Kong Shanghai Bank
MSC – Morgan Stanley Capital
REMIC – Real Estate Mortgage Investment Conduit
UBS – Union Bank of Switzerland
yr – Year
See accompanying notes, which are an integral part of the financial statements.
| | |
| Statement of assets and liabilities | | |
| Delaware Diversified Floating Rate Fund | | July 31, 2016 |
| | | | |
Assets: | | | | |
Investments, at value1 | | $ | 290,074,432 | |
Short-term investments, at value2 | | | 10,295,181 | |
Cash | | | 1,973,455 | |
Cash collateral due from brokers | | | 435,155 | |
Dividends and interest receivable | | | 1,084,604 | |
Receivable for fund shares sold | | | 670,816 | |
Receivable for securities sold | | | 218,642 | |
Swap payments receivable | | | 19,609 | |
| | | | |
Total assets | | | 304,771,894 | |
| | | | |
Liabilities: | | | | |
Payable for securities purchased | | | 7,532,736 | |
Payable for fund shares redeemed | | | 659,638 | |
Swap payments payable | | | 162,793 | |
Income distribution payable | | | 135,628 | |
Investment management fees payable to affiliates | | | 124,871 | |
Distribution fees payable to affiliates | | | 56,827 | |
Variation margin due to broker on centrally cleared interest rate swap contracts | | | 117,548 | |
Dividend disbursing and transfer agent fees and expenses payable to affiliates | | | 5,091 | |
Accounting and Administration expenses payable to affiliates | | | 1,178 | |
Trustees’ fees and expenses payable | | | 709 | |
Audit and tax fees payable | | | 3,831 | |
Legal fees payable to affiliates | | | 428 | |
Reports and statements to shareholders payable to affiliates | | | 123 | |
Unrealized depreciation on interest rate swap contracts | | | 284,035 | |
Other accrued expenses | | | 133,442 | |
| | | | |
Total liabilities | | | 9,218,878 | |
| | | | |
Total Net Assets | | $ | 295,553,016 | |
| | | | |
| |
Net Assets Consist of: | | | | |
Paid-in capital | | $ | 310,636,130 | |
Distributions in excess of net investment income | | | (714,968 | ) |
Accumulated net realized loss on investments | | | (15,784,551 | ) |
Net unrealized appreciation of investments | | | 1,964,496 | |
Net unrealized depreciation of swap contracts | | | (548,091 | ) |
| | | | |
Total Net Assets | | $ | 295,553,016 | |
| | | | |
| | | | |
Net Asset Value | | | | |
Class A: | | | | |
Net assets | | $ | 57,985,068 | |
Shares of beneficial interest outstanding, unlimited authorization, no par | | | 6,995,063 | |
Net asset value per share | | $ | 8.29 | |
Sales charge | | | 2.75 | % |
Offering price per share, equal to net asset value per share/(1 – sales charge) | | $ | 8.52 | |
| |
Class C: | | | | |
Net assets | | $ | 51,400,122 | |
Shares of beneficial interest outstanding, unlimited authorization, no par | | | 6,202,269 | |
Net asset value per share | | $ | 8.29 | |
| |
Class R: | | | | |
Net assets | | $ | 493,476 | |
Shares of beneficial interest outstanding, unlimited authorization, no par | | | 59,555 | |
Net asset value per share | | $ | 8.29 | |
| |
Institutional Class: | | | | |
Net assets | | $ | 185,674,350 | |
Shares of beneficial interest outstanding, unlimited authorization, no par | | | 22,404,247 | |
Net asset value per share | | $ | 8.29 | |
| |
1 Investments, at cost | | $ | 288,110,254 | |
2 Short-term investments, at cost | | | 10,294,863 | |
See accompanying notes, which are an integral part of the financial statements.
| | |
| Statement of operations | | |
Delaware Diversified Floating Rate Fund | | Year ended July 31, 2016 |
| | | | |
Investment Income: | | | | |
Interest | | $ | 10,489,059 | |
Dividends | | | 51,089 | |
| | | | |
| | | 10,540,148 | |
| | | | |
Expenses: | | | | |
Management fees | | | 1,730,626 | |
Distribution expenses – Class A | | | 177,890 | |
Distribution expenses – Class C | | | 608,636 | |
Distribution expenses – Class R | | | 2,581 | |
Dividend disbursing and transfer agent fees and expenses | | | 321,693 | |
Accounting and administration expenses | | | 112,375 | |
Registration fees | | | 81,638 | |
Audit and tax fees | | | 53,781 | |
Legal fees | | | 30,711 | |
Custodian fees | | | 29,004 | |
Reports and statements to shareholders | | | 17,790 | |
Trustees’ fees and expenses | | | 17,216 | |
Other | | | 50,993 | |
| | | | |
| | | 3,234,934 | |
Less expense paid indirectly | | | (211 | ) |
| | | | |
Total operating expenses | | | 3,234,723 | |
| | | | |
Net Investment Income | | | 7,305,425 | |
| | | | |
| |
Net Realized and Unrealized Gain (Loss): | | | | |
Net realized gain (loss) on: | | | | |
Investments | | | (8,718,287 | ) |
Foreign currencies | | | 7,673 | |
Foreign currency exchange contracts | | | 18,168 | |
Futures contracts | | | (105,618 | ) |
Swap contracts | | | (4,428,256 | ) |
| | | | |
Net realized loss | | | (13,226,320 | ) |
| | | | |
Net change in unrealized appreciation (depreciation) of: | | | | |
Investments | | | 3,570,892 | |
Foreign currencies | | | (3,409 | ) |
Futures contracts | | | 61,365 | |
Swap contracts | | | 1,168,425 | |
| | | | |
Net change in unrealized appreciation (depreciation) | | | 4,797,273 | |
| | | | |
Net Realized and Unrealized Loss | | | (8,429,047 | ) |
| | | | |
Net Decrease in Net Assets Resulting from Operations | | $ | (1,123,622 | ) |
| | | | |
See accompanying notes, which are an integral part of the financial statements.
This page intentionally left blank.
| | |
| Statements of changes in net assets | | |
| Delaware Diversified Floating Rate Fund | | |
| | | | | | | | |
| | | Year ended | |
| | | 7/31/16 | | | 7/31/15 | |
Increase (Decrease) in Net Assets from Operations: | | | | | | | | |
Net investment income | | $ | 7,305,425 | | | $ | 9,423,640 | |
Net realized loss | | | (13,226,320 | ) | | | (4,631,989 | ) |
Net change in unrealized appreciation (depreciation) | | | 4,797,273 | | | | (6,996,583 | ) |
| | | | | | | | |
Net decrease in net assets resulting from operations | | | (1,123,622 | ) | | | (2,204,932 | ) |
| | | | | | | | |
| | |
Dividends and Distributions to Shareholders from: | | | | | | | | |
Net investment income: | | | | | | | | |
Class A | | | (1,115,437 | ) | | | (2,260,196 | ) |
Class C | | | (490,673 | ) | | | (1,070,663 | ) |
Class R | | | (6,519 | ) | | | (12,653 | ) |
Institutional Class | | | (3,812,302 | ) | | | (5,699,190 | ) |
| | |
Return of capital: | | | | | | | | |
Class A | | | (203,324 | ) | | | (114,985 | ) |
Class C | | | (180,280 | ) | | | (95,413 | ) |
Class R | | | (1,731 | ) | | | (750 | ) |
Institutional Class | | | (651,222 | ) | | | (302,081 | ) |
| | | | | | | | |
| | | (6,461,488 | ) | | | (9,555,931 | ) |
| | | | | | | | |
| | |
Capital Share Transactions: | | | | | | | | |
Proceeds from shares sold: | | | | | | | | |
Class A | | | 10,978,370 | | | | 31,511,057 | |
Class C | | | 3,925,377 | | | | 8,236,933 | |
Class R | | | 34,265 | | | | 19,790 | |
Institutional Class | | | 133,445,745 | | | | 121,472,944 | |
| | |
Net asset value of shares issued upon reinvestment of dividends and distributions: | | | | | | | | |
Class A | | | 1,222,620 | | | | 2,172,416 | |
Class C | | | 624,878 | | | | 1,067,196 | |
Class R | | | 8,250 | | | | 13,441 | |
Institutional Class | | | 3,297,673 | | | | 4,159,632 | |
| | | | | | | | |
| | | 153,537,178 | | | | 168,653,409 | |
| | | | | | | | |
| | | | | | | | |
| | | Year ended | |
| | | 7/31/16 | | | 7/31/15 | |
Capital Share Transactions (continued): | | | | | | | | |
Cost of shares redeemed: | | | | | | | | |
Class A | | $ | (40,123,305 | ) | | $ | (101,926,129 | ) |
Class C | | | (24,433,394 | ) | | | (35,376,411 | ) |
Class R | | | (109,897 | ) | | | (290,065 | ) |
Institutional Class | | | (175,754,126 | ) | | | (158,222,362 | ) |
| | | | | | | | |
| | | (240,420,722 | ) | | | (295,814,967 | ) |
| | | | | | | | |
Decrease in net assets derived from capital share transactions | | | (86,883,544 | ) | | | (127,161,558 | ) |
| | | | | | | | |
Net Decrease in Net Assets | | | (94,468,654 | ) | | | (138,922,421 | ) |
| | |
Net Assets: | | | | | | | | |
Beginning of year | | | 390,021,670 | | | | 528,944,091 | |
| | | | | | | | |
End of year | | $ | 295,553,016 | | | $ | 390,021,670 | |
| | | | | | | | |
Distributions in excess of net investment income | | $ | (714,968 | ) | | $ | (755,763 | ) |
| | | | | | | | |
See accompanying notes, which are an integral part of the financial statements.
| | |
| Financial highlights | | |
| Delaware Diversified Floating Rate Fund Class A | | |
Selected data for each share of the Fund outstanding throughout each period were as follows:
|
Net asset value, beginning of period |
|
Income (loss) from investment operations: |
Net investment income1 |
Net realized and unrealized gain (loss) |
Total from investment operations. |
|
Less dividends and distributions from: |
Net investment income |
Return of capital |
Total dividends and distributions |
|
Net asset value, end of period |
|
Total return2 |
|
Ratios and supplemental data: |
Net assets, end of period (000 omitted) |
Ratio of expenses to average net assets |
Ratio of expenses to average net assets prior to fees waived |
Ratio of net investment income to average net assets |
Ratio of net investment income to average net assets prior to fees waived |
Portfolio turnover |
| 1 | The average shares outstanding method has been applied for per share information. |
| 2 | Total investment return is based on the change in net asset value of a share during the period and assumes reinvestment of dividends and distributions at net asset value and does not reflect the impact of a sales charge. Total investment return during some of the periods shown reflects waivers by the manager and/or distributor. Performance would have been lower had the waivers not been in effect. |
See accompanying notes, which are an integral part of the financial statements.
| | | | | | | | | | | | | | | | | | | | |
| | | Year ended | |
| | | 7/31/16 | | | 7/31/15 | | | 7/31/14 | | | 7/31/13 | | | 7/31/12 | |
| |
| | | | | |
| | $ | 8.420 | | | $ | 8.630 | | | $ | 8.600 | | | $ | 8.570 | | | $ | 8.590 | |
| | | | | |
| | | | | | | | | | | | | | | | | | | | |
| | | 0.172 | | | | 0.177 | | | | 0.163 | | | | 0.163 | | | | 0.193 | |
| | | (0.150 | ) | | | (0.208 | ) | | | 0.042 | | | | 0.060 | | | | (0.005 | ) |
| | | | | | | | | | | | | | | | | | | | |
| | | 0.022 | | | | (0.031 | ) | | | 0.205 | | | | 0.223 | | | | 0.188 | |
| | | | | | | | | | | | | | | | | | | | |
| | | | | |
| | | | | | | | | | | | | | | | | | | | |
| | | (0.123 | ) | | | (0.168 | ) | | | (0.145 | ) | | | (0.175 | ) | | | (0.208 | ) |
| | | (0.029 | ) | | | (0.011 | ) | | | (0.030 | ) | | | (0.018 | ) | | | — | |
| | | | | | | | | | | | | | | | | | | | |
| | | (0.152 | ) | | | (0.179 | ) | | | (0.175 | ) | | | (0.193 | ) | | | (0.208 | ) |
| | | | | | | | | | | | | | | | | | | | |
| | | | | |
| | $ | 8.290 | | | $ | 8.420 | | | $ | 8.630 | | | $ | 8.600 | | | $ | 8.570 | |
| | | | | | | | | | | | | | | | | | | | |
| | | | | |
| | | 0.29% | | | | (0.35%) | | | | 2.40% | | | | 2.61% | | | | 2.24% | |
| | | | | |
| | | | | | | | | | | | | | | | | | | | |
| | $ | 57,985 | | | $ | 87,398 | | | $ | 158,691 | | | $ | 194,795 | | | $ | 49,009 | |
| | | 0.96% | | | | 0.96% | | | | 0.95% | | | | 1.01% | | | | 1.05% | |
| | | 0.96% | | | | 0.96% | | | | 0.96% | | | | 1.06% | | | | 1.12% | |
| | | 2.09% | | | | 2.08% | | | | 1.89% | | | | 1.88% | | | | 2.28% | |
| | | 2.09% | | | | 2.08% | | | | 1.88% | | | | 1.83% | | | | 2.21% | |
| | | 90% | | | | 86% | | | | 96% | | | | 112% | | | | 97% | |
| | |
| Financial highlights | | |
| Delaware Diversified Floating Rate Fund Class C | | |
Selected data for each share of the Fund outstanding throughout each period were as follows:
|
Net asset value, beginning of period |
|
Income (loss) from investment operations: |
Net investment income1 |
Net realized and unrealized gain (loss) |
Total from investment operations. |
|
Less dividends and distributions from: |
Net investment income |
Return of capital |
Total dividends and distributions |
|
Net asset value, end of period |
|
Total return2 |
|
Ratios and supplemental data: |
Net assets, end of period (000 omitted) |
Ratio of expenses to average net assets |
Ratio of expenses to average net assets prior to fees waived |
Ratio of net investment income to average net assets |
Ratio of net investment income to average net assets prior to fees waived |
Portfolio turnover |
| 1 | The average shares outstanding method has been applied for per share information. |
| 2 | Total investment return is based on the change in net asset value of a share during the period and assumes reinvestment of dividends and distributions at net asset value and does not reflect the impact of a sales charge. Total investment return during some of the periods shown reflects a waiver by the manager. Performance would have been lower had the waiver not been in effect. |
See accompanying notes, which are an integral part of the financial statements.
| | | | | | | | | | | | | | | | | | | | |
| | | Year ended | |
| | | 7/31/16 | | | 7/31/15 | | | 7/31/14 | | | 7/31/13 | | | 7/31/12 | |
| |
| | | | | |
| | $ | 8.420 | | | $ | 8.630 | | | $ | 8.600 | | | $ | 8.570 | | | $ | 8.590 | |
| | | | | |
| | | | | | | | | | | | | | | | | | | | |
| | | 0.110 | | | | 0.113 | | | | 0.098 | | | | 0.098 | | | | 0.130 | |
| | | (0.150 | ) | | | (0.208 | ) | | | 0.042 | | | | 0.060 | | | | (0.006 | ) |
| | | | | | | | | | | | | | | | | | | | |
| | | (0.040 | ) | | | (0.095 | ) | | | 0.140 | | | | 0.158 | | | | 0.124 | |
| | | | | | | | | | | | | | | | | | | | |
| | | | | |
| | | | | | | | | | | | | | | | | | | | |
| | | (0.061 | ) | | | (0.104 | ) | | | (0.080 | ) | | | (0.110 | ) | | | (0.144 | ) |
| | | (0.029 | ) | | | (0.011 | ) | | | (0.030 | ) | | | (0.018 | ) | | | — | |
| | | | | | | | | | | | | | | | | | | | |
| | | (0.090 | ) | | | (0.115 | ) | | | (0.110 | ) | | | (0.128 | ) | | | (0.144 | ) |
| | | | | | | | | | | | | | | | | | | | |
| | | | | |
| | $ | 8.290 | | | $ | 8.420 | | | $ | 8.630 | | | $ | 8.600 | | | $ | 8.570 | |
| | | | | | | | | | | | | | | | | | | | |
| | | | | |
| | | (0.46%) | | | | (1.10%) | | | | 1.64% | | | | 1.85% | | | | 1.47% | |
| | | | | |
| | | | | | | | | | | | | | | | | | | | |
| | $ | 51,400 | | | $ | 72,505 | | | $ | 100,779 | | | $ | 83,619 | | | $ | 25,495 | |
| | | 1.71% | | | | 1.71% | | | | 1.70% | | | | 1.76% | | | | 1.80% | |
| | | 1.71% | | | | 1.71% | | | | 1.70% | | | | 1.76% | | | | 1.82% | |
| | | 1.34% | | | | 1.33% | | | | 1.14% | | | | 1.13% | | | | 1.53% | |
| | | 1.34% | | | | 1.33% | | | | 1.14% | | | | 1.13% | | | | 1.51% | |
| | | 90% | | | | 86% | | | | 96% | | | | 112% | | | | 97% | |
| | |
| Financial highlights | | |
| Delaware Diversified Floating Rate Fund Class R | | |
Selected data for each share of the Fund outstanding throughout each period were as follows:
|
Net asset value, beginning of period |
|
Income (loss) from investment operations: |
Net investment income1 |
Net realized and unrealized gain (loss) |
Total from investment operations. |
|
Less dividends and distributions from: |
Net investment income |
Return of capital |
Total dividends and distributions |
|
Net asset value, end of period |
|
Total return2 |
|
Ratios and supplemental data: |
Net assets, end of period (000 omitted) |
Ratio of expenses to average net assets |
Ratio of expenses to average net assets prior to fees waived |
Ratio of net investment income to average net assets |
Ratio of net investment income to average net assets prior to fees waived |
Portfolio turnover |
| 1 | The average shares outstanding method has been applied for per share information. |
| 2 | Total investment return is based on the change in net asset value of a share during the period and assumes reinvestment of dividends and distributions at net asset value. Total investment return during some of the periods shown reflects waivers by the manager and/or distributor. Performance would have been lower had the waivers not been in effect. |
See accompanying notes, which are an integral part of the financial statements.
| | | | | | | | | | | | | | | | | | | | |
| | | Year ended | |
| | | 7/31/16 | | | 7/31/15 | | | 7/31/14 | | | 7/31/13 | | | 7/31/12 | |
| |
| | | | | |
| | $ | 8.420 | | | $ | 8.630 | | | $ | 8.600 | | | $ | 8.570 | | | $ | 8.590 | |
| | | | | |
| | | | | | | | | | | | | | | | | | | | |
| | | 0.152 | | | | 0.156 | | | | 0.142 | | | | 0.141 | | | | 0.173 | |
| | | (0.151 | ) | | | (0.208 | ) | | | 0.041 | | | | 0.060 | | | | (0.011 | ) |
| | | | | | | | | | | | | | | | | | | | |
| | | 0.001 | | | | (0.052 | ) | | | 0.183 | | | | 0.201 | | | | 0.162 | |
| | | | | | | | | | | | | | | | | | | | |
| | | | | |
| | | | | | | | | | | | | | | | | | | | |
| | | (0.102 | ) | | | (0.147 | ) | | | (0.123 | ) | | | (0.153 | ) | | | (0.182 | ) |
| | | (0.029 | ) | | | (0.011 | ) | | | (0.030 | ) | | | (0.018 | ) | | | — | |
| | | | | | | | | | | | | | | | | | | | |
| | | (0.131 | ) | | | (0.158 | ) | | | (0.153 | ) | | | (0.171 | ) | | | (0.182 | ) |
| | | | | | | | | | | | | | | | | | | | |
| | | | | |
| | $ | 8.290 | | | $ | 8.420 | | | $ | 8.630 | | | $ | 8.600 | | | $ | 8.570 | |
| | | | | | | | | | | | | | | | | | | | |
| | | | | |
| | | 0.03% | | | | (0.61%) | | | | 2.15% | | | | 2.36% | | | | 1.93% | |
| | | | | |
| | | | | | | | | | | | | | | | | | | | |
| | $ | 494 | | | $ | 570 | | | $ | 845 | | | $ | 44 | | | $ | 5 | |
| | | 1.21% | | | | 1.21% | | | | 1.20% | | | | 1.26% | | | | 1.30% | |
| | | 1.21% | | | | 1.21% | | | | 1.20% | | | | 1.36% | | | | 1.42% | |
| | | 1.84% | | | | 1.83% | | | | 1.64% | | | | 1.63% | | | | 2.03% | |
| | | 1.84% | | | | 1.83% | | | | 1.64% | | | | 1.53% | | | | 1.91% | |
| | | 90% | | | | 86% | | | | 96% | | | | 112% | | | | 97% | |
| | |
| Financial highlights | | |
| Delaware Diversified Floating Rate Fund Institutional Class | | |
Selected data for each share of the Fund outstanding throughout each period were as follows:
|
Net asset value, beginning of period |
|
Income (loss) from investment operations: |
Net investment income1 |
Net realized and unrealized gain (loss) |
Total from investment operations. |
|
Less dividends and distributions from: |
Net investment income |
Return of capital |
Total dividends and distributions |
|
Net asset value, end of period |
|
Total return2 |
|
Ratios and supplemental data: |
Net assets, end of period (000 omitted) |
Ratio of expenses to average net assets |
Ratio of expenses to average net assets prior to fees waived |
Ratio of net investment income to average net assets |
Ratio of net investment income to average net assets prior to fees waived |
Portfolio turnover |
| 1 | The average shares outstanding method has been applied for per share information. |
| 2 | Total investment return is based on the change in net asset value of a share during the period and assumes reinvestment of dividends and distributions at net asset value. Total investment return during some of the periods shown reflects a waiver by the manager. Performance would have been lower had the waiver not been in effect. |
See accompanying notes, which are an integral part of the financial statements.
| | | | | | | | | | | | | | | | | | | | |
| | | Year ended | |
| | | 7/31/16 | | | 7/31/15 | | | 7/31/14 | | | 7/31/13 | | | 7/31/12 | |
| |
| | | | | |
| | $ | 8.420 | | | $ | 8.630 | | | $ | 8.600 | | | $ | 8.570 | | | $ | 8.590 | |
| | | | | |
| | | | | | | | | | | | | | | | | | | | |
| | | 0.193 | | | | 0.198 | | | | 0.184 | | | | 0.184 | | | | 0.214 | |
| | | (0.151 | ) | | | (0.208 | ) | | | 0.042 | | | | 0.061 | | | | (0.005 | ) |
| | | | | | | | | | | | | | | | | | | | |
| | | 0.042 | | | | (0.010 | ) | | | 0.226 | | | | 0.245 | | | | 0.209 | |
| | | | | | | | | | | | | | | | | | | | |
| | | | | |
| | | | | | | | | | | | | | | | | | | | |
| | | (0.143 | ) | | | (0.189 | ) | | | (0.166 | ) | | | (0.197 | ) | | | (0.229 | ) |
| | | (0.029 | ) | | | (0.011 | ) | | | (0.030 | ) | | | (0.018 | ) | | | — | |
| | | | | | | | | | | | | | | | | | | | |
| | | (0.172 | ) | | | (0.200 | ) | | | (0.196 | ) | | | (0.215 | ) | | | (0.229 | ) |
| | | | | | | | | | | | | | | | | | | | |
| | | | | |
| | $ | 8.290 | | | $ | 8.420 | | | $ | 8.630 | | | $ | 8.600 | | | $ | 8.570 | |
| | | | | | | | | | | | | | | | | | | | |
| | | | | |
| | | 0.54% | | | | (0.11%) | | | | 2.66% | | | | 2.87% | | | | 2.49% | |
| | | | | |
| | | | | | | | | | | | | | | | | | | | |
| | $ | 185,674 | | | $ | 229,549 | | | $ | 268,629 | | | $ | 139,097 | | | $ | 31,663 | |
| | | 0.71% | | | | 0.71% | | | | 0.70% | | | | 0.76% | | | | 0.80% | |
| | | 0.71% | | | | 0.71% | | | | 0.70% | | | | 0.76% | | | | 0.82% | |
| | | 2.34% | | | | 2.33% | | | | 2.14% | | | | 2.13% | | | | 2.53% | |
| | | 2.34% | | | | 2.33% | | | | 2.14% | | | | 2.13% | | | | 2.51% | |
| | | 90% | | | | 86% | | | | 96% | | | | 112% | | | | 97% | |
| | |
| Notes to financial statements |
| Delaware Diversified Floating Rate Fund | | July 31, 2016 |
Delaware Group® Income Funds (Trust) is organized as a Delaware statutory trust and offers four series: Delaware Corporate Bond Fund, Delaware Diversified Floating Rate Fund, Delaware Extended Duration Bond Fund, and Delaware High-Yield Opportunities Fund. These financial statements and the related notes pertain to Delaware Diversified Floating Rate Fund (Fund). The Trust is an open-end investment company. The Fund is considered diversified under the Investment Company Act of 1940 (1940 Act), as amended, and offers Class A, Class C, Class R, and Institutional Class shares. Class A shares are sold with a maximum front-end sales charge of 2.75%. Class A share purchases of $1,000,000 or more will incur a limited contingent deferred sales charge (CDSC) of 0.75% if redeemed during the first year, provided that Delaware Distributors, L.P. (DDLP) paid a financial advisor a commission on the purchase of those shares. Class C shares are sold with a CDSC of 1.00%, if redeemed during the first 12 months. Class R and Institutional Class shares are not subject to a sales charge and are offered for sale exclusively to certain eligible investors.
The investment objective of the Fund is to seek total return.
1. Significant Accounting Policies
The following accounting policies are in accordance with U.S. generally accepted accounting principles (U.S. GAAP) and are consistently followed by the Fund.
Security Valuation – Equity securities, except those traded on the Nasdaq Stock Market LLC (Nasdaq), are valued at the last quoted sales price as of the time of the regular close of the New York Stock Exchange on the valuation date. Equity securities traded on the Nasdaq are valued in accordance with the Nasdaq Official Closing Price, which may not be the last sales price. If, on a particular day, an equity security does not trade, the mean between the bid and ask prices will be used, which approximates fair value. Debt securities, credit default swap (CDS) contracts, and interest rate swap contracts are valued based upon valuations provided by an independent pricing service or broker/counterparty and reviewed by management. To the extent current market prices are not available, the pricing service may take into account developments related to the specific security, as well as transactions in comparable securities. U.S. government and agency securities are valued at the mean between the bid and ask prices, which approximates fair value. Valuations for fixed income securities utilize matrix systems, which reflect such factors as security prices, yields, maturities, and ratings, and are supplemented by dealer and exchange quotations. For asset-backed securities, collateralized mortgage obligations, commercial mortgage securities, and U.S. government agency mortgage securities, pricing vendors utilize matrix pricing which considers prepayment speed; attributes of the collateral; yield or price of bonds of comparable quality, coupon, maturity, and type as well as broker/dealer-supplied prices. Swap prices are derived using daily swap curves and models that incorporate a number of market data factors, such as discounted cash flows, trades, and values of the underlying reference instruments. Foreign currency exchange contracts and foreign cross currency exchange contracts are valued at the mean between the bid and ask prices, which approximates fair value. Interpolated values are derived when the settlement date of the contract is an interim date for which quotations are not available. Futures contracts and options on futures contracts are valued at the daily quoted settlement prices. Generally, other securities and assets for which market quotations are not readily available are valued at fair value as determined in good faith under the direction of the Trust’s Board of Trustees (Board). In determining whether market quotations are readily available or fair
valuation will be used, various factors will be taken into consideration, such as market closures or suspension of trading in a security.
Federal and Foreign Income Taxes – No provision for federal income taxes has been made as the Fund intends to continue to qualify for federal income tax purposes as a regulated investment company under Subchapter M of the Internal Revenue Code of 1986, as amended, and make the requisite distributions to shareholders. The Fund evaluates tax positions taken or expected to be taken in the course of preparing the Fund’s tax returns to determine whether the tax positions are “more-likely-than-not” of being sustained by the applicable tax authority. Tax positions not deemed to meet the “more-likely-than-not” threshold are recorded as a tax benefit or expense in the current year. Management has analyzed the Fund’s tax positions taken for all open federal income tax years (July 31, 2013–July 31, 2016) and has concluded that no provision for federal income tax is required in the Fund’s financial statements. In regard to foreign taxes only, the Fund has open tax years in certain foreign countries in which it invests that may date back to the inception of the Fund.
Class Accounting – Investment income and common expenses are allocated to the various classes of the Fund on the basis of “settled shares” of each class in relation to the net assets of the Fund. Realized and unrealized gain (loss) on investments are allocated to the various classes of the Fund on the basis of daily net assets of each class. Distribution expenses relating to a specific class are charged directly to that class.
Repurchase Agreements – The Fund may purchase certain U.S. government securities subject to the counterparty’s agreement to repurchase them at an agreed upon date and price. The counterparty will be required on a daily basis to maintain the value of the collateral subject to the agreement at not less than the repurchase price (including accrued interest). The agreements are conditioned upon the collateral being deposited under the Federal Reserve book-entry system with the Fund’s custodian or a third-party sub-custodian. In the event of default or bankruptcy by the other party to the agreement, retention of the collateral may be subject to legal proceedings. All open repurchase agreements as of the date of this report were entered into on July 29, 2016 and matured on the next business day.
Foreign Currency Transactions – Transactions denominated in foreign currencies are recorded at the prevailing exchange rates on the valuation date in accordance with the Fund’s prospectus. The value of all assets and liabilities denominated in foreign currencies is translated daily into U.S. dollars at the exchange rate of such currencies against the U.S. dollar. Transaction gains or losses resulting from changes in exchange rates during the reporting period or upon settlement of the foreign currency transaction are reported in operations for the current period. The Fund generally bifurcates that portion of realized gains and losses on investments in debt securities which is due to changes in foreign exchange rates from that which is due to changes in market prices of debt securities. That portion of gains (losses) attributable to changes in foreign exchange rates is included on the “Statement of operations” under “Net realized gain (loss) on foreign currencies.” The Fund reports certain foreign currency related transactions as components of realized gains (losses) for financial reporting purposes, whereas such components are treated as ordinary income (loss) for federal income tax purposes.
Use of Estimates – The Fund is an investment company, whose financial statements are prepared in conformity with U.S. GAAP. Therefore, the Fund follows the accounting and reporting guidelines for investment companies. The preparation of financial statements in conformity with U.S. GAAP requires
| | |
| Notes to financial statements | | |
| Delaware Diversified Floating Rate Fund | | |
1. Significant Accounting Policies (continued)
management to make estimates and assumptions that affect the fair value of investments, the reported amounts of assets and liabilities and disclosure of contingent assets and liabilities at the date of the financial statements, and the reported amounts of revenues and expenses during the reporting period. Actual results could differ from those estimates and the differences could be material.
Other — Expenses directly attributable to the Fund are charged directly to the Fund. Other expenses common to various funds within the Delaware Investments® Family of Funds are generally allocated among such funds on the basis of average net assets. Management fees and some other expenses are paid monthly. Security transactions are recorded on the date the securities are purchased or sold (trade date) for financial reporting purposes. Costs used in calculating realized gains and losses on the sale of investment securities are those of the specific securities sold. Dividend income is recorded on the ex-dividend date and interest income is recorded on the accrual basis. Discounts and premiums on debt securities are accreted or amortized to interest income, respectively, over the lives of the respective securities using the effective interest method. Realized gains (losses) on paydowns of asset- and mortgage-backed securities are classified as interest income. The Fund declares dividends daily from net investment income and pays the dividends monthly and declares and pays distributions from net realized gain on investments, if any, annually. The Fund may distribute more frequently, if necessary for tax purposes. Dividends and distributions, if any, are recorded on the ex-dividend date.
The Fund may receive earnings credits from its custodian when positive cash balances are maintained, which may be used to offset custody fees. There were no such earnings credits for the year ended July 31, 2016.
The Fund receives earnings credits from its transfer agent when positive cash balances are maintained, which may be used to offset transfer agent fees. If the amount earned is greater than $1.00, the expense paid under this arrangement is included on the “Statement of operations” under “Dividend disbursing and transfer agent fees and expenses” with the corresponding expense offset shown under “Less expense paid indirectly.” For the year ended July 31, 2016, the Fund earned $211 under this agreement.
2. Investment Management, Administration Agreements, and Other Transactions with Affiliates
In accordance with the terms of its investment management agreement, the Fund pays Delaware Management Company (DMC), a series of Delaware Management Business Trust and the investment manager, an annual fee which is calculated daily at the rate of 0.50% on the first $500 million of average daily net assets of the Fund, 0.475% on the next $500 million, 0.45% on the next $1.5 billion, and 0.425% on average daily net assets in excess of $2.5 billion.
Delaware Investments Fund Services Company (DIFSC), an affiliate of DMC, provides fund accounting and financial administration oversight services to the Fund. For these services, DIFSC’s fees are calculated based on the aggregate daily net assets of the Delaware Investments Family of Funds at the following annual rate: 0.0050% of the first $30 billion; 0.0045% of the next $10 billion; 0.0040% of the next $10 billion; and 0.0025% of aggregate average daily net assets in excess of $50 billion. The fees payable to DIFSC under the service agreement described above are allocated among all funds in the Delaware Investments Family of Funds on a relative net asset value basis. For the year ended
July 31, 2016, the Fund was charged $16,457 for these services. This amount is included on the “Statement of operations” under “Accounting and administration expenses.”
DIFSC is also the transfer agent and dividend disbursing agent of the Fund. For these services, DIFSC’s fees are calculated based on the aggregate daily net assets of the retail funds within the Delaware Investments® Family of Funds at the following annual rate: 0.025% of the first $20 billion; 0.020% of the next $5 billion; 0.015% of the next $5 billion; and 0.013% on average daily net assets in excess of $30 billion. The fees payable to DIFSC under the service agreement described above are allocated among all retail funds in the Delaware Investments Family of Funds on a relative net asset value basis. This amount is included on the “Statement of operations” under “Dividend disbursing and transfer agent fees and expenses.” For the year ended July 31, 2016, the Fund was charged $72,124 for these services. Pursuant to a sub-transfer agency agreement between DIFSC and BNY Mellon Investment Servicing (US) Inc. (BNYMIS), BNYMIS provides certain sub-transfer agency services to the Fund. Sub-transfer agency fees are paid by the Fund and are also included on the “Statement of operations” under “Dividend disbursing and transfer agent fees and expenses.”
Pursuant to a distribution agreement and distribution plan, the Fund pays DDLP, the distributor and an affiliate of DMC, an annual distribution and service fee of 0.25%, 1.00%, and 0.50% of the average daily net assets of the Class A, Class C, and Class R shares, respectively. Institutional Class shares pay no distribution and service fees.
As provided in the investment management agreement, the Fund bears a portion of the cost of resources shared with DMC, including the cost of internal personnel of DMC and/or its affiliates that provide legal, tax, and regulatory reporting services to the Fund. For the year ended July 31, 2016, the Fund was charged $7,874 for internal legal, tax, and regulatory reporting services provided by DMC and/or its affiliates��� employees. This amount is included on the “Statement of operations” under “Legal fees.”
For the year ended July 31, 2016, DDLP earned $1,572 for commissions on sales of the Fund’s Class A shares. For the year ended July 31, 2016, DDLP received gross CDSC commissions of $4,584 on redemption of the Fund’s Class C shares, and these commissions were entirely used to offset upfront commissions previously paid by DDLP to broker/dealers on sales of those shares.
Trustees’ fees include expenses accrued by the Fund for each Trustee’s retainer and meeting fees. Certain officers of DMC, DIFSC, and DDLP are officers and/or Trustees of the Trust. These officers and Trustees are paid no compensation by the Fund.
Cross trades for the year ended July 31, 2016, were executed by the Fund pursuant to procedures adopted by the Board designed to ensure compliance with Rule 17a-7 under the 1940 Act. Cross trading is the buying or selling of portfolio securities between funds of investment companies, or between a fund of an investment company and another entity, that are or could be considered affiliates by virtue of having a common investment advisor (or affiliated investment advisors), common directors/trustees and/or common officers. At its regularly scheduled meetings, the Board reviews such transactions for compliance with the procedures adopted by the Board. Pursuant to these procedures, for the year ended July 31, 2016, the Fund engaged in securities sales of $16,283, which resulted in no net realized gains (losses). The Fund did not engage in any purchases for the period.
| | |
| Notes to financial statements | | |
| Delaware Diversified Floating Rate Fund | | |
3. Investments
For the year ended July 31, 2016, the Fund made purchases and sales of investment securities other than short-term investments as follows:
| | | | |
Purchases other than U.S. government securities | | $ | 237,977,011 | |
Purchases of U.S. government securities | | | 60,631,532 | |
Sales other than U.S. government securities | | | 330,212,290 | |
Sales of U.S. government securities | | | 55,693,616 | |
At July 31, 2016, the cost and unrealized appreciation (depreciation) of investments for federal income tax purposes for the Fund were as follows:
| | | | |
Cost of investments | | $ | 298,761,122 | |
| | | | |
Aggregate unrealized appreciation of investments | | $ | 3,173,663 | |
Aggregate unrealized depreciation of investments | | | (1,565,172 | ) |
| | | | |
Net unrealized appreciation of investments | | $ | 1,608,491 | |
| | | | |
U.S. GAAP defines fair value as the price that the Fund would receive to sell an asset or pay to transfer a liability in an orderly transaction between market participants at the measurement date under current market conditions. A three-level hierarchy for fair value measurements has been established based upon the transparency of inputs to the valuation of an asset or liability. Inputs may be observable or unobservable and refer broadly to the assumptions that market participants would use in pricing the asset or liability. Observable inputs reflect the assumptions market participants would use in pricing the asset or liability based on market data obtained from sources independent of the reporting entity. Unobservable inputs reflect the reporting entity’s own assumptions about the assumptions that market participants would use in pricing the asset or liability based on the best information available under the circumstances. The Fund’s investment in its entirety is assigned a level based upon the observability of the inputs which are significant to the overall valuation. The three-level hierarchy of inputs is summarized below.
| | |
| Level 1 – | | Inputs are quoted prices in active markets for identical investments. (Examples: equity securities, open-end investment companies, futures contracts, exchange-traded options contracts) |
| |
| Level 2 – | | Other observable inputs, including, but not limited to: quoted prices for similar assets or liabilities in markets that are active, quoted prices for identical or similar assets or liabilities in markets that are not active, inputs other than quoted prices that are observable for the assets or liabilities (such as interest rates, yield curves, volatilities, prepayment speeds, loss severities, credit risks and default rates) or other market-corroborated inputs. (Examples: debt securities, government securities, swap contracts, foreign currency exchange contracts, foreign securities utilizing international fair value pricing, broker-quoted securities, fair valued securities) |
| |
| Level 3 – | | Significant unobservable inputs, including the Fund’s own assumptions used to determine the fair value of investments. (Examples: broker-quoted securities, fair valued securities) |
Level 3 investments are valued using significant unobservable inputs. The Fund may also use an income-based valuation approach in which the anticipated future cash flows of the investment are
discounted to calculate fair value. Discounts may also be applied due to the nature or duration of any restrictions on the disposition of the investments. Valuations may also be based upon current market prices of securities that are comparable in coupon, rating, maturity, and industry. The derived value of a Level 3 investment may not represent the value which is received upon disposition and this could impact the results of operations.
The following table summarizes the valuation of the Fund’s investments by fair value hierarchy levels as of July 31, 2016:
| | | | | | | | | | | | | | | | |
Securities | | Level 1 | | | Level 2 | | | Level 3 | | | Total | |
Agency, Asset- & Mortgage-Backed Securities | | $ | — | | | $ | 30,238,406 | | | $ | — | | | $ | 30,238,406 | |
Corporate Debt | | | — | | | | 144,635,658 | | | | — | | | | 144,635,658 | |
Municipal Bonds | | | — | | | | 6,104,839 | | | | — | | | | 6,104,839 | |
Senior Secured Loans1 | | | — | | | | 89,899,734 | | | | 1,168,391 | | | | 91,068,125 | |
Foreign Debt | | | — | | | | 7,686,273 | | | | — | | | | 7,686,273 | |
U.S. Treasury Obligations | | | — | | | | 5,298,418 | | | | — | | | | 5,298,418 | |
Convertible Preferred Stock | | | 44,889 | | | | — | | | | — | | | | 44,889 | |
Preferred Stock | | | — | | | | 4,997,824 | | | | — | | | | 4,997,824 | |
Short-Term Investments | | | — | | | | 10,295,181 | | | | — | | | | 10,295,181 | |
| | | | | | | | | | | | | | | | |
| | | | |
Total Value of Securities | | $ | 44,889 | | | $ | 299,156,333 | | | $ | 1,168,391 | | | $ | 300,369,613 | |
| | | | | | | | | | | | | | | | |
Swap Contracts | | | — | | | | (401,583 | ) | | | — | | | | (401,583 | ) |
1Security type is valued across multiple levels. Level 2 investments represent investments with observable inputs or matrix-priced investments and Level 3 investments represent investments with significant unobservable inputs. The amounts attributed to Level 2 investments and Level 3 investments represent the following percentages of the total market value of this security type:
| | | | | | | | | | | | | | | | | | | | |
| | | Level 1 | | | | Level 2 | | | | | Level 3 | | | | | Total | |
Senior Secured Loans | | — | | | | | 98.72 | % | | | | | 1.28 | % | | | | | 100.00 | % |
During the year ended July 31, 2016, there were no transfers between Level 1 investments, Level 2 investments, or Level 3 investments that had a significant impact to the Fund. The Fund’s policy is to recognize transfers between levels at the beginning of the reporting period.
A reconciliation of Level 3 investments is presented when the Fund has a significant amount of Level 3 investments at the beginning, interim, or end of the period in relation to net assets. Management has determined not to provide additional disclosure on Level 3 inputs since the Level 3 investments are not considered significant to the Fund’s net assets at the end of the year.
| | |
| Notes to financial statements | | |
| Delaware Diversified Floating Rate Fund | | |
4. Dividend and Distribution Information
Income and long-term capital gain distributions are determined in accordance with federal income tax regulations, which may differ from U.S. GAAP. Additionally, distributions from net gains on foreign currency transactions and net short-term gains on sales of investment securities are treated as ordinary income for federal income tax purposes. The tax character of dividends and distributions paid during the years ended July 31, 2016 and 2015 was as follows:
| | | | | | | | | | | | |
| | | Year ended | |
| | | 7/31/16 | | | | | | 7/31/15 | |
Ordinary income | | $ | 5,424,931 | | | | | | | $ | 9,042,702 | |
Return of capital | | | 1,036,557 | | | | | | | | 513,229 | |
| | | | | | | | | | | | |
Total | | $ | 6,461,488 | | | | | | | $ | 9,555,931 | |
| | | | | | | | | | | | |
5. Components of Net Assets on a Tax Basis
As of July 31, 2016, the components of net assets on a tax basis were as follows:
| | | | |
Shares of beneficial interest | | $ | 310,636,130 | |
Dividends payable | | | (135,628 | ) |
Qualified late year loss deferrals | | | (628,763 | ) |
Other temporary differences | | | (6,834 | ) |
Capital loss carryforwards | | | (15,518,798 | ) |
Unrealized depreciation on investments, foreign currencies, and derivatives | | | 1,206,909 | |
| | | | |
Net assets | | $ | 295,553,016 | |
| | | | |
The differences between book basis and tax basis components of net assets are primarily attributable to tax deferral of losses on wash sales, tax treatment of CDS contracts, tax treatment of contingent payment on debt instruments, tax deferral of losses on straddles and tax treatment of market discount and premium on debt instruments.
Qualified late year currency and specified losses represent losses realized from Nov. 1, 2015 through July 31, 2016, that in accordance with federal income tax regulations, the Fund has elected to defer and treat as having arisen in the following fiscal year.
For financial reporting purposes, capital accounts are adjusted to reflect the tax character of permanent book/tax differences. Reclassifications are primarily due to tax treatment of gain (loss) on foreign currency transactions, contingent payment debt instruments, market discount and premium on certain debt instruments, paydowns of mortgage- and asset-backed securities, and tax treatment of CDS contracts. Results of operations and net assets were not affected by these reclassifications. For the year ended July 31, 2016, the Fund recorded the following reclassifications:
| | | | |
Distributions in excess of net investment income | | $ | (1,839,699 | ) |
Accumulated net realized loss | | | 1,839,699 | |
On Dec. 22, 2010, the Regulated Investment Company Modernization Act of 2010 (Act) was enacted, which changed various technical rules governing the tax treatment of regulated investment companies. The changes were generally effective for taxable years beginning after the date of enactment. Under the Act, the Fund is permitted to carry forward capital losses incurred in taxable years beginning after the date of enactment for an unlimited period. Additionally, post-enactment capital loss carryforwards will
retain their character as either short-term or long-term capital losses rather than being considered all short-term as permitted under previous regulation.
Losses incurred that will be carried forward under the Act are as follows:
| | | | | | | | |
| | | Loss carryforward character | |
| | | Short-term | | | Long-term | |
| | | $(6,176,235 | ) | | | $(9,342,563 | ) |
6. Capital Shares
Transactions in capital shares were as follows:
| | | | | | | | | | | | |
| | | Year ended | |
| | | 7/31/16 | | | | | | 7/31/15 | |
Shares sold: | | | | | | | | | | | | |
Class A | | | 1,326,626 | | | | | | | | 3,697,805 | |
Class C | | | 473,458 | | | | | | | | 967,543 | |
Class R | | | 4,132 | | | | | | | | 2,319 | |
Institutional Class | | | 16,148,745 | | | | | | | | 14,255,949 | |
| | | |
Shares issued upon reinvestment of dividends and distributions: | | | | | | | | | | | | |
Class A | | | 148,041 | | | | | | | | 255,211 | |
Class C | | | 75,642 | | | | | | | | 125,474 | |
Class R | | | 1,012 | | | | | | | | 1,580 | |
Institutional Class | | | 399,646 | | | | | | | | 489,149 | |
| | | | | | | | | | | | |
| | | 18,577,302 | | | | | | | | 19,795,030 | |
| | | | | | | | | | | | |
| | | |
Shares redeemed: | | | | | | | | | | | | |
Class A | | | (4,861,568 | ) | | | | | | | (11,962,584 | ) |
Class C | | | (2,961,723 | ) | | | | | | | (4,161,456 | ) |
Class R | | | (13,303 | ) | | | | | | | (34,196 | ) |
Institutional Class | | | (21,419,000 | ) | | | | | | | (18,612,883 | ) |
| | | | | | | | | | | | |
| | | (29,255,594 | ) | | | | | | | (34,771,119 | ) |
| | | | | | | | | | | | |
Net decrease | | | (10,678,292 | ) | | | | | | | (14,976,089 | ) |
| | | | | | | | | | | | |
| | |
| Notes to financial statements | | |
| Delaware Diversified Floating Rate Fund | | |
6. Capital Shares (continued)
Certain shareholders may exchange shares of one class of shares for another class in the same Fund. For the years ended July 31, 2016 and July 31, 2015, the Fund had the following exchange transactions. These exchange transactions are included as subscriptions and redemptions in the table on the previous page and the “Statements of changes in net assets.”
| | | | | | | | | | | | |
| | | Exchange Redemptions | | Exchange Subscriptions |
| | | | | | | Institutional | | | | Institutional | | |
| | | Class A | | Class C | | Class | | Class A | | Class | | |
Year Ended | | Shares | | Shares | | Shares | | Shares | | Shares | | Value |
7/31/16 | | 24,148 | | 1,642 | | — | | — | | 25,838 | | $213,398 |
7/31/15 | | 1,649 | | 7,956 | | 74,977 | | 77,319 | | 7,249 | | 717,181 |
7. Line of Credit
The Fund, along with certain other funds in the Delaware Investments® Family of Funds (Participants), was a participant in a $275,000,000 revolving line of credit intended to be used for temporary or emergency purposes as an additional source of liquidity to fund redemptions of investor shares. Under the agreement, the Participants were charged an annual commitment fee of 0.08%, which was allocated across the Participants on the basis of each Participant’s allocation of the entire facility. The Participants were permitted to borrow up to a maximum of one third of their net assets under the agreement. Each Participant was individually, and not jointly, liable for its particular advances, if any, under the line of credit. The line of credit under the agreement expired on Nov. 9, 2015.
On Nov. 9, 2015, the Fund, along with the other Participants, entered into an amendment to the agreement for a $155,000,000 revolving line of credit. The line of credit is to be used as described above and operates in substantially the same manner as the original agreement, with the exception of the annual commitment fee. Under the amendment to the agreement, the Participants are charged an annual commitment fee of 0.10%, which is allocated across the Participants on the basis of each Participant’s allocation of the entire facility. The line of credit available under the agreement expires on Nov. 7, 2016.
The Fund had no amounts outstanding as of July 31, 2016 or at any time during the year then ended.
8. Derivatives
U.S. GAAP requires disclosures that enable investors to understand: (1) how and why an entity uses derivatives; (2) how they are accounted for; and (3) how they affect an entity’s results of operations and financial position.
Foreign Currency Exchange Contracts – The Fund may enter into foreign currency exchange contracts and foreign cross currency exchange contracts as a way of managing foreign exchange rate risk. The Fund may enter into these contracts to fix the U.S. dollar value of a security that it has agreed to buy or sell for the period between the date the trade was entered into and the date the security is delivered and paid for. The Fund may also use these contracts to hedge the U.S. dollar value of securities it already owns that are denominated in foreign currencies. In addition, the Fund may enter into these contracts to facilitate or expedite the settlement of portfolio transactions. The change in value is recorded as an unrealized gain or loss. When the contract is closed, a realized gain or loss is recorded
equal to the difference between the value of the contract at the time it was opened and the value at the time it was closed.
The use of foreign currency exchange contracts and foreign cross currency exchange contracts does not eliminate fluctuations in the underlying prices of the securities, but does establish a rate of exchange that can be achieved in the future. Although foreign currency exchange contracts and foreign cross currency exchange contracts limit the risk of loss due to an unfavorable change in the value of the hedged currency, they also limit any potential gain that might result should the value of the currency change favorably. In addition, the Fund could be exposed to risks if the counterparties to the contracts are unable to meet the terms of their contracts. The Fund’s maximum risk of loss from counterparty credit risk is the value of its currency exchanged with the counterparty. The risk is generally mitigated by having a netting arrangement between the Fund and the counterparty and by the posting of collateral by the counterparty to the Fund to cover the Fund’s exposure to the counterparty.
During the year ended July 31, 2016, the Fund entered into foreign currency exchange contracts and cross currency exchange contracts to hedge the U.S. dollar value of securities it already owned that were denominated in foreign currencies.
Futures Contracts – A futures contract is an agreement in which the writer (or seller) of the contract agrees to deliver to the buyer an amount of cash or securities equal to a specific dollar amount times the difference between the value of a specific security or index at the close of the last trading day of the contract and the price at which the agreement is made. The Fund may use futures in the normal course of pursuing its investment objective. The Fund may invest in futures contracts to hedge its existing portfolio securities against fluctuations in fair value caused by changes in interest rates or market conditions. Upon entering into a futures contract, the Fund deposits cash or pledges U.S. government securities to a broker, equal to the minimum “initial margin” requirements of the exchange on which the contract is traded. Subsequent payments are received from the broker or paid to the broker each day, based on the daily fluctuation in the market value of the contract. These receipts or payments are known as “variation margin” and are recorded daily by the Fund as unrealized gains or losses until the contracts are closed. When the contracts are closed, the Fund records a realized gain or loss equal to the difference between the value of the contract at the time it was opened and the value at the time it was closed. Risks of entering into futures contracts include potential imperfect correlation between the futures contracts and the underlying securities and the possibility of an illiquid secondary market for these instruments. When investing in futures, there is reduced counterparty credit risk to the Fund because futures are exchange-traded and the exchange’s clearinghouse, as counterparty to all exchange-traded futures, guarantees against default. At July 31, 2016, the Fund had no open futures contracts.
During the year ended July 31, 2016, the Fund used futures contracts to hedge its existing portfolio securities against fluctuations in value caused by changes in interest rates or market conditions.
Swap Contracts – The Fund may enter into interest rate swap contracts and CDS contracts in the normal course of pursuing its investment objective. The Fund may use interest rate swaps to adjust the Fund’s sensitivity to interest rates or to hedge against changes in interest rates. The Fund may enter into CDS contracts in order to hedge against a credit event, to enhance total return or to gain exposure to certain securities or markets. The Fund will not be permitted to enter into any swap transactions unless,
| | |
| Notes to financial statements | | |
| Delaware Diversified Floating Rate Fund | | |
8. Derivatives (continued)
at the time of entering into such transactions, the unsecured long-term debt of the actual counterparty, combined with any credit enhancements, is rated at least BBB- by Standard & Poor’s Financial Services LLC (S&P) or Baa3 by Moody’s Investors Service Inc. (Moody’s) or is determined to be of equivalent credit quality by DMC.
Interest Rate Swaps. An interest rate swap contract is an exchange of interest rates between counterparties. In one instance, an interest rate swap involves payments received by the Fund from another party based on a variable or floating interest rate, in return for making payments based on a fixed interest rate. An interest rate swap can also work in reverse with the Fund receiving payments based on a fixed interest rate and making payments based on a variable or floating interest rate. Interest rate swaps may be used to adjust the Fund’s sensitivity to interest rates or to hedge against changes in interest rates. Periodic payments on such contracts are accrued daily and recorded as unrealized appreciation/(depreciation) on swap contracts. Upon periodic payment/(receipt) or termination of the contract, such amounts are recorded as realized gains or losses on swap contracts. The Fund’s maximum risk of loss from counterparty credit risk is the discounted net value of the cash flows to be received from/paid to the counterparty over the interest rate swap contract’s remaining life, to the extent that the amount is positive. This risk is mitigated by (1) for bilateral swap contacts, having a netting arrangement between the Fund and the counterparty and by the posting of collateral by the counterparty to the Fund to cover the Fund’s exposure to the counterparty, and (2) for cleared swaps, trading these instruments through a central counterparty.
During the year ended July 31, 2016, the Fund used interest rate swap contracts to manage the Fund’s sensitivity to interest rates or to hedge against changes in interest rates.
Credit Default Swaps. A CDS contract is a risk-transfer instrument through which one party (purchaser of protection) transfers to another party (seller of protection) the financial risk of a credit event (as defined in the CDS agreement), as it relates to a particular reference security or basket of securities (such as an index). In exchange for the protection offered by the seller of protection, the purchaser of protection agrees to pay the seller of protection a periodic amount at a stated rate that is applied to the notional amount of the CDS contract. In addition, an upfront payment may be made or received by the Fund in connection with an unwinding or assignment of a CDS contract. Upon the occurrence of a credit event, the seller of protection would pay the par (or other agreed-upon) value of the reference security (or basket of securities) to the counterparty. Credit events generally include, among others, bankruptcy, failure to pay, and obligation default.
During the year ended July 31, 2016, the Fund entered into CDS contracts as a purchaser of protection. Periodic payments (receipts) on such contracts are accrued daily and recorded as unrealized losses (gains) on swap contracts. Upon payment (receipt), such amounts are recorded as realized losses (gains) on swap contracts. Upfront payments made or received in connection with CDS contracts are amortized over the expected life of the CDS contracts as unrealized losses (gains) on swap contracts. The change in value of CDS contracts is recorded daily as unrealized appreciation or depreciation. A realized gain or loss is recorded upon a credit event (as defined in the CDS agreement) or the maturity or termination of the agreement. For the year ended July 31, 2016, the Fund did not enter into any CDS
contracts as a seller of protection. Initial margin and variation margin are posted to central counterparties for CDS basket trades, as determined by the applicable central counterparty.
CDS contracts may involve greater risks than if the Fund had invested in the reference obligation directly. CDS contracts are subject to general market risk, liquidity risk, counterparty risk and credit risk. The Fund’s maximum risk of loss from counterparty credit risk, either as the seller of protection or the buyer of protection, is the fair value of the contract. This risk is mitigated by (1) for bilateral swap contacts, having a netting arrangement between the Fund and the counterparty and by the posting of collateral by the counterparty to the Fund to cover the Fund’s exposure to the counterparty, or (2) for cleared swaps, trading these instruments through a central counterparty. At July 31, 2016, the Fund had no open CDS contracts.
During the year ended July 31, 2016, the Fund used CDS contracts to hedge against credit events.
Swaps Generally. The value of open swaps may differ from that which would be realized in the event the Fund terminated its position in the contract on a given day. Risks of entering into these contracts include the potential inability of the counterparty to meet the terms of the contracts. This type of risk is generally limited to the amount of favorable movement in the value of the underlying security, instrument or basket of instruments, if any, at the day of default. Risks also arise from potential losses from adverse market movements and such losses could exceed the unrealized amounts shown on the “Schedule of investments.”
| | |
| Notes to financial statements | | |
| Delaware Diversified Floating Rate Fund | | |
8. Derivatives (continued)
Fair values of derivative instruments as of July 31, 2016 were as follows:
| | | | | | | | |
| | | Liability Derivatives | |
| | | Fair Value | |
| Statements of Assets and | | Interest Rate | | | | |
Liabilities Location | | Contracts | | | Total | |
Variation margin due to broker on centrally cleared interest rate swap contracts | | $ | (117,548 | ) | | $ | (117,548) | |
Unrealized depreciation on interest rate swap contracts . | | | (284,035 | ) | | | (284,035 | ) |
| | | | | | | | |
Total | | $ | (401,583 | ) | | $ | (401,583) | |
| | | | | | | | |
The effect of derivative instruments in the “Statement of operations” for the year ended July 31, 2016 was as follows:
| | | | | | | | | | | | | | | | |
| | | Net Realized Gain (Loss) on: | |
| | | Foreign | | | | | | | | | | |
| | | Currency | | | | | | | | | | |
| | | Exchange | | | Futures | | | Swap | | | | |
| | | Contracts | | | Contracts | | | Contracts | | | Total | |
Currency contracts | | $ | 18,168 | | | $ | — | | | $ | — | | | $ | 18,168 | |
Interest rate contracts | | | — | | | | (105,618 | ) | | | (842,782 | ) | | | (948,400 | ) |
Credit contracts | | | — | | | | — | | | | (3,585,474 | ) | | | (3,585,474 | ) |
| | | | | | | | | | | | | | | | |
Total | | $ | 18,168 | | | $ | (105,618 | ) | | $ | (4,428,256 | ) | | $ | (4,515,706 | ) |
| | | | | | | | | | | | | | | | |
| | | | | | | | | | | | |
| | | Net Change in Unrealized Appreciation (Depreciation) of: | |
| | | Futures | | | Swap | | | | |
| | | Contracts | | | Contracts | | | Total | |
Interest rate contracts | | $ | 61,365 | | | $ | 106,537 | | | $ | 167,902 | |
Credit contracts | | | — | | | | 1,061,888 | | | | 1,061,888 | |
| | | | | | | | | | | | |
Total | | $ | 61,365 | | | $ | 1,168,425 | | | $ | 1,229,790 | |
| | | | | | | | | | | | |
Derivatives Generally. The table below summarizes the average balance of derivative holdings by the Fund during the year ended July 31, 2016.
| | | | | | | | |
| | | Long Derivative | | | Short Derivative | |
| | | Volume | | | Volume | |
Foreign currency exchange contracts (average cost) | | USD | — | | | USD | 44 | |
Futures contracts (average notional value) | | USD | — | | | USD | 3,306,367 | |
CDS contracts (average notional value)* | | USD | 5,519,372 | | | USD | — | |
| | EUR | 1,477,610 | | | EUR | — | |
Interest rate swap contracts (average notional value)** | | USD | 55,943,048 | | | USD | — | |
*Long represents buying protection and short represents selling protection.
** Long represents receiving fixed interest payments and short represents paying fixed interest payments.
9. Offsetting
In December 2011, the Financial Accounting Standards Board (FASB) issued guidance that expanded disclosure requirements on the offsetting of certain assets and liabilities. The disclosures are required for investments and derivative financial instruments subject to master netting or similar agreements which are eligible for offset on the “Statement of assets and liabilities” and require an entity to disclose both gross and net information about such investments and transactions in the financial statements. In January 2013, the FASB issued guidance that clarified which investments and transactions are subject to the offsetting disclosure requirements. The scope of the disclosure requirements for offsetting is limited to derivative instruments, repurchase agreements and reverse repurchase agreements, and securities borrowing.
In order to better define its contractual rights and to secure rights that will help the Fund mitigate its counterparty risk, the Fund entered into an International Swaps and Derivatives Association, Inc. Master Agreement (ISDA Master Agreement) or a similar agreement with certain of its derivative contract counterparties. An ISDA Master Agreement is a bilateral agreement between the Fund and a counterparty that governs over-the-counter (OTC) derivatives and foreign exchange contracts and typically contains, among other things, collateral posting items and provisions in the event of a default and/or termination event. Under an ISDA Master Agreement, the Fund may, under certain circumstances, offset with the counterparty certain derivative financial instruments’ payables and/or receivables with collateral held and/or posted and create one single net payment. The provisions of the ISDA Master Agreement typically permit a single net payment in the event of default (close-out) including the bankruptcy or insolvency of the counterparty. However, bankruptcy or insolvency laws of a particular jurisdiction may impose restrictions on or prohibitions against the right of offset in bankruptcy, insolvency or other events.
For financial reporting purposes, the Fund does not offset derivative assets and derivative liabilities that are subject to netting arrangements on the “Statement of assets and liabilities.”
At July 31, 2016, the Fund had the following assets and liabilities subject to offsetting provisions:
Master Repurchase Agreements.
| | | | | | | | | | | | | | | | | | | | |
| | | | | Fair Value of | | | | |
| | | | | Non-Cash | | Cash Collateral | | |
Counterparty | | Repurchase Agreements | | Collateral Received | | Received | | Net Amount(a) |
Bank of America Merrill Lynch | | | $ | 1,408,776 | | | | | $(1,408,776 | ) | | | $ | — | | | | $ | — | |
Bank of Montreal | | | | 2,347,959 | | | | | (2,347,959 | ) | | | | — | | | | | — | |
BNP Paribas | | | | 1,209,265 | | | | | (1,209,265 | ) | | | | — | | | | | — | |
| | | | | | | | | | | | | | | | | | | | |
Total | | | $ | 4,966,000 | | | | | $(4,966,000 | ) | | | $ | — | | | | $ | — | |
| | | | | | | | | | | | | | | | | | | | |
(a)Net exposure represents the receivable (payable) that would be due from (to) the counterparty in the event of default.
10. Securities Lending
The Fund, along with other funds in the Delaware Investments® Family of Funds, may lend its securities pursuant to a security lending agreement (Lending Agreement) with The Bank of New York Mellon (BNY
| | |
| Notes to financial statements | | |
| Delaware Diversified Floating Rate Fund | | |
10. Securities Lending (continued)
Mellon). At the time a security is loaned, the borrower must post collateral equal to the required percentage of the market value of the loaned security, including any accrued interest. The required percentage is: (1) 102% with respect to U.S. securities and foreign securities that are denominated and payable in U.S. dollars; and (2) 105% with respect to foreign securities. With respect to each loan, if on any business day the aggregate market value of securities collateral plus cash collateral held is less than the aggregate market value of the securities which are the subject of such loan, the borrower will be notified to provide additional collateral by the end of the following business day which, together with the collateral already held, will be not less than the applicable initial collateral requirements for such security loan. If the aggregate market value of securities collateral and cash collateral held with respect to a security loan exceeds the applicable initial collateral requirement, upon the request of the borrower, BNY Mellon must return enough collateral to the borrower by the end of the following business day to reduce the value of the remaining collateral to the applicable initial collateral requirement for such security loan. As a result of the foregoing, the value of the collateral held with respect to a loaned security on any particular day may be more or less than the value of the security on loan.
Prior to Dec. 29, 2015, cash collateral received was generally invested in the Delaware Investments Collateral Fund No. 1 (Collective Trust), a pooled account established by BNY Mellon for the use of funds managed by DMC that participate in BNY Mellon’s securities lending program. The Collective Trust sought to maintain a net asset value per unit of $1.00.
On Dec. 29, 2015, the assets in the Collective Trust were transferred to a series of individual separate accounts, each corresponding to a Fund. The investment guidelines permit each separate account to hold certain securities that would be considered eligible securities for a money market fund. Cash collateral received is generally invested in government securities; certain obligations issued by government sponsored enterprises; repurchase agreements collateralized by U.S. Treasury securities; obligations issued by the central government of any Organization for Economic Cooperation and Development (OECD) country or its agencies, instrumentalities, or establishments; obligations of supranational organizations; commercial paper, notes, bonds, and other debt obligations; certificates of deposit, time deposits, and other bank obligations; and asset-backed securities.
In the event of default or bankruptcy by the lending agent, realization and/or retention of the collateral may be subject to legal proceedings. In the event the borrower fails to return loaned securities and the collateral received is insufficient to cover the value of the loaned securities and provided such collateral shortfall is not the result of investment losses, the lending agent has agreed to pay the amount of the shortfall to the Fund or, at the discretion of the lending agent, replace the loaned securities. The Fund continues to record dividends or interest, as applicable, on the securities loaned and is subject to changes in value of the securities loaned that may occur during the term of the loan. The Fund has the right under the Lending Agreement to recover the securities from the borrower on demand. With respect to security loans collateralized by non-cash collateral, the Fund receives loan premiums paid by the borrower. With respect to security loans collateralized by cash collateral, the earnings from the collateral investments are shared among the Fund, the security lending agent, and the borrower. The Fund records security lending income net of allocations to the security lending agent and the borrower.
The Fund may incur investment losses as a result of investing securities lending collateral. This could occur if an investment in the collateral investment account defaulted or became impaired. Under those circumstances, the value of a Fund’s cash collateral account may be less than the amount the Fund would be required to return to the borrowers of the securities and the Fund would be required to make up for this shortfall.
During the year ended July 31, 2016, the Fund had no securities out on loan.
11. Credit and Market Risk
Some countries in which the Fund may invest require governmental approval for the repatriation of investment income, capital, or the proceeds of sales of securities by foreign investors. In addition, if there is deterioration in a country’s balance of payments or for other reasons, a country may impose temporary restrictions on foreign capital remittances abroad.
The securities exchanges of certain foreign markets are substantially smaller, less liquid and more volatile than the major securities markets in the United States. Consequently, acquisition and disposition of securities by the Fund may be inhibited. In addition, a significant portion of the aggregate market value of equity securities listed on the major securities exchanges in emerging markets is held by a smaller number of investors. This may limit the number of shares available for acquisition or disposition by the Fund.
The Fund invests a portion of its assets in high yield fixed income securities, which are securities rated lower than BBB- by S&P and Baa3 by Moody’s, or similarly rated by another nationally recognized statistical rating organization. Investments in these higher yielding securities are generally accompanied by a greater degree of credit risk than higher rated securities. Additionally, lower rated securities may be more susceptible to adverse economic and competitive industry conditions than investment grade securities.
The Fund invests in fixed income securities whose value is derived from an underlying pool of mortgages or consumer loans. The value of these securities is sensitive to changes in economic conditions, including delinquencies and/or defaults, and may be adversely affected by shifts in the market’s perception of the issuers and changes in interest rates. Investors receive principal and interest payments as the underlying mortgages and consumer loans are paid back. Some of these securities are collateralized mortgage obligations (CMOs). CMOs are debt securities issued by U.S. government agencies or by financial institutions and other mortgage lenders, which are collateralized by a pool of mortgages held under an indenture. Prepayment of mortgages may shorten the stated maturity of the obligations and can result in a loss of premium, if any has been paid. Certain of these securities may be stripped (securities which provide only the principal or interest feature of the underlying security). The yield to maturity on an interest-only CMO is extremely sensitive not only to changes in prevailing interest rates, but also to the rate of principal payments (including prepayments) on the related underlying mortgage assets. A rapid rate of principal payments may have a material adverse effect on the Fund’s yield to maturity. If the underlying mortgage assets experience greater-than-anticipated prepayments of principal, the Fund may fail to fully recoup its initial investment in these securities even if the securities are rated in the highest rating categories.
| | |
| Notes to financial statements | | |
| Delaware Diversified Floating Rate Fund | | |
11. Credit and Market Risk (continued)
The Fund invests in certain obligations that may have liquidity protection designed to ensure that the receipt of payments due on the underlying security is timely. Such protection may be provided through guarantees, insurance policies or letters of credit obtained by the issuer or sponsor through third parties, through various means of structuring the transaction or through a combination of such approaches. The Fund will not pay any additional fees for such credit support, although the existence of credit support may increase the price of the security.
The Fund invests in bank loans and other securities that may subject it to direct indebtedness risk, the risk that the Fund will not receive payment of principal, interest, and other amounts due in connection with these investments and will depend primarily on the financial condition of the borrower. Loans that are fully secured offer the Fund more protection than unsecured loans in the event of nonpayment of scheduled interest or principal, although there is no assurance that the liquidation of collateral from a secured loan would satisfy the corporate borrower’s obligation, or that the collateral can be liquidated. Some loans or claims may be in default at the time of purchase. Certain of the loans and the other direct indebtedness acquired by the Fund may involve revolving credit facilities or other standby financing commitments that obligate the Fund to pay additional cash on a certain date or on demand. These commitments may require the Fund to increase its investment in a company at a time when the Fund might not otherwise decide to do so (including at a time when the company’s financial condition makes it unlikely that such amounts will be repaid). To the extent that the Fund is committed to advance additional funds, it will at all times hold and maintain cash or other high grade debt obligations in an amount sufficient to meet such commitments. As the Fund may be required to rely upon another lending institution to collect and pass on to the Fund amounts payable with respect to the loan and to enforce the Fund’s rights under the loan and other direct indebtedness, an insolvency, bankruptcy, or reorganization of the lending institution may delay or prevent the Fund from receiving such amounts. The highly leveraged nature of many loans may make them especially vulnerable to adverse changes in economic or market conditions. Investments in such loans and other direct indebtedness may involve additional risk to the Fund.
The Fund may invest up to 15% of its net assets in illiquid securities, which may include securities with contractual restrictions on resale, securities exempt from registration under Rule 144A, promulgated under the Securities Act of 1933, as amended, and other securities which may not be readily marketable. The relative illiquidity of these securities may impair the Fund from disposing of them in a timely manner and at a fair price when it is necessary or desirable to do so. While maintaining oversight, the Fund’s Board has delegated to DMC the day-to-day functions of determining whether individual securities are liquid for purposes of the Fund’s limitation on investments in illiquid securities. Securities eligible for resale pursuant to Rule 144A, which are determined to be liquid, are not subject to the Fund’s 15% limit on investments in illiquid securities. Rule 144A and illiquid securities have been identified on the “Schedule of investments.” When monitoring compliance with the Fund’s illiquid limit, certain holdings that are common to multiple clients of the investment manager may be aggregated and considered illiquid in the aggregate solely for monitoring purposes. For purposes of determining illiquidity for financial reporting purposes, only the holdings of this Fund will be considered.
12. Contractual Obligations
The Fund enters into contracts in the normal course of business that contain a variety of indemnifications. The Fund’s maximum exposure under these arrangements is unknown. However, the Fund has not had prior claims or losses pursuant to these contracts. Management has reviewed the Fund’s existing contracts and expects the risk of loss to be remote.
13. Subsequent Events
Management has determined that no material events or transactions occurred subsequent to July 31, 2016 that would require recognition or disclosure in the Fund’s financial statements.
Report of independent
registered public accounting firm
To the Board of Trustees of Delaware Group® Income Funds
and the Shareholders of Delaware Diversified Floating Rate Fund:
In our opinion, the accompanying statement of assets and liabilities, including the schedule of investments, and the related statements of operations and of changes in net assets and the financial highlights present fairly, in all material respects, the financial position of Delaware Diversified Floating Rate Fund (one of the series constituting Delaware Group® Income Funds, hereinafter referred to as the “Fund”) at July 31, 2016, the results of its operations for the year then ended, the changes in its net assets for each of the two years in the period then ended and the financial highlights for each of the five years in the period then ended, in conformity with accounting principles generally accepted in the United States of America. These financial statements and financial highlights (hereafter referred to as “financial statements”) are the responsibility of the Fund’s management. Our responsibility is to express an opinion on these financial statements based on our audits. We conducted our audits of these financial statements in accordance with the standards of the Public Company Accounting Oversight Board (United States). Those standards require that we plan and perform the audit to obtain reasonable assurance about whether the financial statements are free of material misstatement. An audit includes examining, on a test basis, evidence supporting the amounts and disclosures in the financial statements, assessing the accounting principles used and significant estimates made by management, and evaluating the overall financial statement presentation. We believe that our audits, which included confirmation of securities at July 31, 2016 by correspondence with the custodian and brokers, provide a reasonable basis for our opinion.
PricewaterhouseCoopers LLP
Philadelphia, Pennsylvania
September 19, 2016
Other Fund information (Unaudited)
Delaware Diversified Floating Rate Fund
Tax Information
The information set forth below is for the Fund’s fiscal year as required by federal income tax laws. Shareholders, however, must report distributions on a calendar year basis for income tax purposes, which may include distributions for portions of two fiscal years of the Fund. Accordingly, the information needed by shareholders for income tax purposes will be sent to them in January of each year. Please consult your tax advisor for proper treatment of this information.
All disclosures are based on financial information available as of the date of this annual report and, accordingly are subject to change. For any and all items requiring reporting, it is the intention of the Fund to report the maximum amount permitted under the Internal Revenue Code and the regulations thereunder.
For the fiscal year ended July 31, 2016, the Fund reports distributions paid during the year as follows:
| | | | |
(A) Ordinary Income Distribution (Tax Basis)* | | | 83.96 | % |
(B) Return of Capital (Tax Basis) | | | 16.04 | % |
Total Distributions (Tax Basis) | | | 100.00 | % |
(C) Qualifying dividends1 | | | 0.64 | % |
(A) and (B) are based on a percentage of the Fund’s total distributions.
(C) is based on a percentage of the Fund’s ordinary income distributions.
1 Qualifying dividends represent dividends which qualify for the corporate dividends received deduction.
*For the fiscal year ended July 31, 2016, certain dividends paid by the Fund may be subject to a maximum tax rate of 20%. The percentage of dividends paid by the Fund from ordinary income reported as qualified income is 0.82%. Complete information will be compiled and reported in conjunction with your 2016 Form 1099-DIV.
| | |
| Board of trustees / directors and officers addendum | | |
| Delaware Investments® Family of Funds | | |
A mutual fund is governed by a Board of Trustees/Directors (“Trustees”), which has oversight responsibility for the management of a fund’s business affairs. Trustees establish procedures and oversee and review the performance of the investment manager, the distributor, and others who perform services for the fund. The independent fund trustees, in particular, are advocates
| | | | |
Name, Address, and Birth Date | | Position(s) Held with Fund(s) | | Length of Time Served |
Interested Trustee | | |
Shawn K. Lytle1, 3 | | President, | | Trustee since |
2005 Market Street | | Chief Executive Officer, | | September 2015 |
Philadelphia, PA 19103 | | and Trustee | | |
February 1970 | | | | President and |
| | | | Chief Executive Officer |
| | | | since August 2015 |
| | | | |
| | | | |
Independent Trustees | | |
Thomas L. Bennett | | Chairman and Trustee | | Trustee since |
2005 Market Street | | | | March 2005 |
Philadelphia, PA 19103 | | | | |
October 1947 | | | | Chairman since |
| | | | | March 2015 |
Ann D. Borowiec | | Trustee | | Since March 2015 |
2005 Market Street | | | | |
Philadelphia, PA 19103 | | | | |
November 1958 | | | | |
| | | | |
| | | | |
| | | | | |
Joseph W. Chow | | Trustee | | Since January 2013 |
2005 Market Street | | | | |
Philadelphia, PA 19103 | | | | |
January 1953 | | | | |
| | | | |
| | | | | |
| 1 | Shawn K. Lytle is considered to be an “Interested Trustee“ because he is an executive officer of the Fund’s(s’) investment advisor. |
for shareholder interests. Each trustee has served in that capacity since he or she was elected to or appointed to the Board of Trustees, and will continue to serve until his or her retirement or the election of a new trustee in his or her place. The following is a list of the Trustees and Officers with certain background and related information.
| | | | |
Principal Occupation(s) During the Past Five Years | | Number of Portfolios in Fund Complex Overseen by Trustee or Officer | | Other Directorships Held by Trustee or Officer |
| | | | |
Shawn K. Lytle has served as | | 62 | | Trustee — UBS |
President of | | | | Relationship Funds, |
Delaware Investments2 | | | | SMA Relationship |
since June 2015 and was the | | | | Trust, and UBS Funds |
Regional Head of Americas for | | | | (May 2010–April 2015) |
UBS Global Asset | | | | |
Management from | | | | |
2010 through 2015. | | | | |
| | | | |
Private Investor | | 62 | | Director — |
(March 2004–Present) | | | | Bryn Mawr Bank Corp. (BMTC) |
| | | | (2007–2011) |
| | | | |
| | | | | |
Chief Executive Officer | | 62 | | None |
Private Wealth Management | | | | |
(2011–2013) and | | | | |
Market Manager, | | | | |
New Jersey Private | | | | |
Bank (2005–2011) — | | | | |
J.P. Morgan Chase & Co. | | | | |
Executive Vice President | | 62 | | Director and Audit Committee |
(Emerging Economies | | | | Member — Hercules |
Strategies, Risks, and | | | | Technology Growth |
Corporate Administration) | | | | Capital, Inc. |
State Street Corporation | | | | (2004–2014) |
(July 2004–March 2011) | | | | |
| 2 | Delaware Investments is the marketing name for Delaware Management Holdings, Inc. and its subsidiaries, including the Fund’s(s’) investment advisor, principal underwriter, and its transfer agent. |
| | |
| Board of trustees / directors and officers addendum | | |
| Delaware Investments® Family of Funds | | |
| | | | |
Name, Address, and Birth Date | | Position(s) Held with Fund(s) | | Length of Time Served |
Independent Trustees (continued) | | |
John A. Fry | | Trustee | | Since January 2001 |
2005 Market Street | | | | |
Philadelphia, PA 19103 | | | | |
May 1960 | | | | |
| | | | |
| | | | |
| | | | |
| | | | | |
Lucinda S. Landreth | | Trustee | | Since March 2005 |
2005 Market Street | | | | |
Philadelphia, PA 19103 | | | | |
June 1947 | | | | |
| | | | | |
Frances A. Sevilla-Sacasa | | Trustee | | Since September 2011 |
2005 Market Street | | | | |
Philadelphia, PA 19103 | | | | |
January 1956 | | | | |
| | | | |
| | | | |
| | | | |
| | | | |
| | | | |
| | | | |
| | | | |
| | | | |
| | | | |
| | | | |
| | | | |
| | | | |
| | | | | |
| | | | |
Principal Occupation(s) During the Past Five Years | | Number of Portfolios in Fund Complex Overseen by Trustee or Officer | | Other Directorships Held by Trustee or Officer |
| | | | |
President — | | 62 | | Director, Audit Committee, |
Drexel University | | | | and Governance Committee |
(August 2010–Present) | | | | Member — Community |
| | | | Health Systems |
President — | | | | |
Franklin & Marshall College | | | | Director — Drexel |
(July 2002–July 2010) | | | | Morgan & Co. |
Private Investor | | 62 | | None |
(2004–Present) | | | | |
| | | | |
| | | | | |
Chief Executive Officer — | | 62 | | Trust Manager and |
Banco Itaú | | | | Audit Committee |
International | | | | Member — Camden |
(April 2012–Present) | | | | Property Trust |
| | |
Executive Advisor to Dean | | | | |
(August 2011–March 2012)and Interim Dean | | | | |
(January 2011–July 2011) — | | | | |
University of Miami School of | | | | |
Business Administration | | | | |
| | |
President — U.S. Trust, | | | | |
Bank of America Private | | | | |
Wealth Management | | | | |
(Private Banking) | | | | |
(July 2007–December 2008) | | | | |
| | |
| Board of trustees / directors and officers addendum | | |
| Delaware Investments® Family of Funds | | |
| | | | |
Name, Address, and Birth Date | | Position(s) Held with Fund(s) | | Length of Time Served |
Independent Trustees (continued) | | |
Thomas K. Whitford | | Trustee | | Since January 2013 |
2005 Market Street | | | | |
Philadelphia, PA 19103 | | | | |
March 1956 | | | | |
| | | | |
| | | | |
| | | | |
| | | | |
| | | | | |
Janet L. Yeomans | | Trustee | | Since April 1999 |
2005 Market Street | | | | |
Philadelphia, PA 19103 | | | | |
July 1948 | | | | |
| | | | |
| | | | |
| | | | |
| | | | |
| | | | | |
| | | | |
Principal Occupation(s) During the Past Five Years | | Number of Portfolios in Fund Complex Overseen by Trustee or Officer | | Other Directorships Held by Trustee or Officer |
| | | | |
Vice Chairman | | 62 | | Director — HSBC Finance |
(2010–April 2013), | | | | Corporation and HSBC |
Chief Administrative | | | | North America Holdings Inc. |
Officer (2008–2010), and Executive Vice | | | | Director — |
President and Chief | | | | HSBC Bank |
Administrative Officer | | | | |
(2007–2009) — | | | | |
PNC Financial | | | | |
Services Group | | | | |
Vice President and Treasurer | | 62 | | Director, Audit and |
(January 2006–July 2012) | | | | Compliance Committee Chair, |
Vice President — | | | | Investment Committee |
Mergers & Acquisitions | | | | Member, and Governance |
(January 2003–January 2006), | | | | Committee Member — |
and Vice President | | | | Okabena Company |
and Treasurer | | | | |
(July 1995–January 2003) | | | | |
3M Company | | | | |
| | |
| Board of trustees / directors and officers addendum | | |
| Delaware Investments® Family of Funds | | |
| | | | |
Name, Address, and Birth Date | | Position(s) Held with Fund(s) | | Length of Time Served |
Officers | | |
David F. Connor | | Senior Vice President, | | Senior Vice President |
2005 Market Street | | General Counsel, | | since May 2013; |
Philadelphia, PA 19103 | | and Secretary | | General Counsel |
December 1963 | | | | since May 2015; |
| | | | Secretary since |
| | | | October 2005 |
| | | | |
| | | | |
| | | | |
| | | | |
| | | | | |
Daniel V. Geatens | | Vice President | | Treasurer since October 2007 |
2005 Market Street | | and Treasurer | | |
Philadelphia, PA 19103 | | | | |
October 1972 | | | | |
| | | | |
| | | | |
| | | | |
| | | | | |
Richard Salus | | Senior Vice President | | Chief Financial Officer |
2005 Market Street | | and Chief Financial Officer | | since November 2006 |
Philadelphia, PA 19103 | | | | |
October 1963 | | | | |
| | | | |
| | | | | |
The Statement of Additional Information for the Fund(s) includes additional information about the Trustees and Officers and is available, without charge, upon request by calling 800 523-1918.
| | | | |
Principal Occupation(s) During the Past Five Years | | Number of Portfolios in Fund Complex Overseen by Trustee or Officer | | Other Directorships Held by Trustee or Officer |
| | | | |
David F. Connor has served as | | 62 | | None3 |
Senior Vice President of the Fund(s) and the investment advisor since 2013, General Counsel of the Fund(s) and the investment advisor since 2015, and Secretary of the Fund(s) and the investment advisor since 2005. | | | | |
Daniel V. Geatens has served | | 62 | | None3 |
as Vice President and | | | | |
Treasurer of the Fund(s) since 2007 and Vice President and Director of Financial | | | | |
Administration of the investment advisor since 2010. | | | | |
Richard Salus has served as | | 62 | | None3 |
Senior Vice President and Chief Financial Officer of the Fund(s) and the investment advisor since 2006. | | | | |
| 3 | Shawn K. Lytle, David F. Connor, Daniel V. Geatens, and Richard Salus serve in similar capacities for the six portfolios of the Optimum Fund Trust, which have the same investment advisor, principal underwriter, and transfer agent as the registrant. |
About the organization
| | | | | | |
| Board of trustees | | | | | | |
Shawn K. Lytle President and Chief Executive Officer Delaware Investments® Family of Funds Philadelphia, PA Thomas L. Bennett Chairman of the Board Delaware Investments Family of Funds Private Investor Rosemont, PA | | Ann D. Borowiec Former Chief Executive Officer Private Wealth Management J.P. Morgan Chase & Co. New York, NY Joseph W. Chow Former Executive Vice President State Street Corporation Boston, MA | | John A. Fry President Drexel University Philadelphia, PA Lucinda S. Landreth Former Chief Investment Officer Assurant, Inc. New York, NY | | Frances A. Sevilla-Sacasa Chief Executive Officer Banco Itaú International Miami, FL Thomas K. Whitford Former Vice Chairman PNC Financial Services Group Pittsburgh, PA Janet L. Yeomans Former Vice President and Treasurer 3M Company St. Paul, MN |
| | | |
| Affiliated officers | | | | | | |
| | | |
David F. Connor Senior Vice President, General Counsel, and Secretary Delaware Investments Family of Funds Philadelphia, PA | | Daniel V. Geatens Vice President and Treasurer Delaware Investments Family of Funds Philadelphia, PA | | Richard Salus Senior Vice President and Chief Financial Officer Delaware Investments Family of Funds Philadelphia, PA | | |
This annual report is for the information of Delaware Diversified Floating Rate Fund shareholders, but it may be used with prospective investors when preceded or accompanied by the Delaware Investments Fund fact sheet for the most recently completed calendar quarter. These documents are available at delawareinvestments.com/literature.
Delaware Investments is the marketing name of Delaware Management Holdings, Inc. and its subsidiaries.
The Fund files its complete schedule of portfolio holdings with the Securities and Exchange Commission (SEC) for the first and third quarters of each fiscal year on Form N-Q. The Fund’s Forms N-Q, as well as a description of the policies and procedures that the Fund uses to determine how to vote proxies (if any) relating to portfolio securities are available without charge (i) upon request, by calling 800 523-1918; and (ii) on the SEC’s website at sec.gov. In addition, a description of the policies and procedures that the Fund uses to determine how to vote proxies (if any) relating to portfolio securities and the Schedule of Investments included in the Fund’s most recent Form N-Q are available without charge on the Fund’s website at delawareinvestments.com/literature. The Fund’s Forms N-Q may be reviewed and copied at the SEC’s Public Reference Room in Washington, D.C.; information on the operation of the Public Reference Room may be obtained by calling 800 SEC-0330.
Information (if any) regarding how the Fund voted proxies relating to portfolio securities during the most recently disclosed 12-month period ended June 30 is available without charge (i) through the Fund’s website at delawareinvestments.com/proxy; and (ii) on the SEC’s website at sec.gov.
Item 2. Code of Ethics
The registrant has adopted a code of ethics that applies to the registrant’s principal executive officer, principal financial officer, principal accounting officer or controller, or persons performing similar functions, regardless of whether these individuals are employed by the registrant or a third party. A copy of the registrant’s Code of Business Ethics has been posted on the Delaware Investments Internet Web site at www.delawareinvestments.com. Any amendments to the Code of Business Ethics, and information on any waiver from its provisions granted by the registrant, will also be posted on this Web site within five business days of such amendment or waiver and will remain on the Web site for at least 12 months.
Item 3. Audit Committee Financial Expert
The registrant’s Board of Trustees/Directors has determined that certain members of the registrant’s Audit Committee are audit committee financial experts, as defined below. For purposes of this item, an “audit committee financial expert” is a person who has the following attributes:
a. An understanding of generally accepted accounting principles and financial statements;
b. The ability to assess the general application of such principles in connection with the accounting for estimates, accruals, and reserves;
c. Experience preparing, auditing, analyzing, or evaluating financial statements that present a breadth and level of complexity of accounting issues that are generally comparable to the breadth and complexity of issues that can reasonably be expected to be raised by the registrant’s financial statements, or experience actively supervising one or more persons engaged in such activities;
d. An understanding of internal controls and procedures for financial reporting; and
e. An understanding of audit committee functions.
An “audit committee financial expert” shall have acquired such attributes through:
a. Education and experience as a principal financial officer, principal accounting officer, controller, public accountant, or auditor or experience in one or more positions that involve the performance of similar functions;
b. Experience actively supervising a principal financial officer, principal accounting officer, controller, public accountant, auditor, or person performing similar functions;
c. Experience overseeing or assessing the performance of companies or public accountants with respect to the preparation, auditing, or evaluation of financial statements; or
d. Other relevant experience.
The registrant’s Board of Trustees/Directors has also determined that each member of the registrant’s Audit Committee is independent. In order to be “independent” for purposes of this item, the Audit Committee member may not: (i) other than in his or her capacity as a member of the Board of Trustees/Directors or any committee thereof, accept directly or indirectly any consulting, advisory or other compensatory fee from the issuer; or (ii) be an “interested person” of the registrant as defined in Section 2(a)(19) of the Investment Company Act of 1940.
The names of the audit committee financial experts on the registrant’s Audit Committee are set forth below:
Item 4. Principal Accountant Fees and Services
PricewaterhouseCoopers LLP (“PwC”), the Independent Accountant to the series portfolios of Delaware Group Income Funds (“Funds”), has advised the Audit Committee of the Board of Trustees of the Funds (“Audit Committee”) that, as of the date of the filing of this Annual Report on Form N-CSR, it is in discussions with the staff of the Securities and Exchange Commission (“SEC Staff”), or the SEC, regarding the interpretation and application of Rule 2-01(c)(1)(ii)(A) of Regulation S-X, or the Loan Rule.
The Loan Rule prohibits accounting firms, such as PwC, from having certain financial relationships with their audit clients and affiliated entities. Specifically, the Loan Rule provides, in relevant part, that an accounting firm generally would not be independent if it receives a loan from a lender that is a “record or beneficial owner of more than ten percent of the audit client’s equity securities.” Under the SEC Staff’s interpretation of the Loan Rule, based on information provided to us by PwC, some of PwC’s relationships with its lenders who also own shares of one or more funds within the Delaware Investments Family of Funds investment company complex implicate the Loan Rule, calling into question PwC’s independence with respect to the Funds. PwC believes that, in light of the facts of these lending relationships, its ability to exercise objective judgment with respect to the audit of the Funds has not been impaired.
The Audit Committee has considered the lending relationships described by PwC and has concluded that (1) the lending relationships did not affect PwC’s application of objective judgment in conducting its audits and issuing reports on the Funds’ financial statements; and (2) a reasonable investor with knowledge of the lending relationships described by PwC would reach the same conclusion. In making this determination, the Audit Committee considered, among other things, PwC’s description of the relevant lending relationships and PwC’s representation that its objectivity was not impaired in conducting its audit of the Funds’ financial statements. In connection with this determination, PwC advised the Audit Committee that it believes PwC is independent and it continues to have discussions with the SEC Staff.
If the SEC were ultimately to determine that PwC was not independent with respect to the Funds for certain time periods, the Funds’ filings with the SEC that contain the Funds’ financial statements for such periods would be non-compliant with the applicable securities laws. If the SEC determines that PwC was not independent, among other things, the Funds could be required to have independent audits conducted on the Funds’ previously audited financial statements by another registered public accounting firm for the affected periods. The time involved to conduct such independent audits may impair the Funds’ ability to issue shares. Any of the foregoing possible outcomes potentially could have a material adverse effect on the Funds.
The aggregate fees billed for services provided to the registrant by its independent auditors for the audit of the registrant’s annual financial statements and for services normally provided by the independent auditors in connection with statutory and regulatory filings or engagements were $167,427 for the fiscal year ended July 31, 2016.
The aggregate fees billed for services provided to the registrant by its independent auditors for the audit of the registrant’s annual financial statements and for services normally provided by the independent auditors in connection with statutory and regulatory filings or engagements were $161,000 for the fiscal year ended July 31, 2015.
The aggregate fees billed by the registrant’s independent auditors for services relating to the performance of the audit of the registrant’s financial statements and not reported under paragraph (a) of this Item were $0 for the fiscal year ended July 31, 2016.
The aggregate fees billed by the registrant’s independent auditors for services relating to the performance of the audit of the registrant’s financial statements and not reported under paragraph (a) of this Item were $0 for the fiscal year ended July 31, 2015.
The aggregate fees billed by the registrant’s independent auditors for tax-related services provided to the registrant’s investment adviser and other service providers under common control with the adviser and that relate directly to the operations or financial reporting of the registrant were $0 for the registrant’s fiscal year ended July 31, 2016.
The aggregate fees billed by the registrant’s independent auditors for tax-related services provided to the registrant’s investment adviser and other service providers under common control with the adviser and that relate directly to the operations or financial reporting of the registrant were $0 for the registrant’s fiscal year ended July 31, 2015.
The aggregate fees billed for all services provided by the independent auditors to the registrant other than those set forth in paragraphs (a), (b) and (c) of this Item were $0 for the fiscal year ended July 31, 2016.
The aggregate fees billed for all services provided by the independent auditors to the registrant other than those set forth in paragraphs (a), (b) and (c) of this Item were $0 for the fiscal year ended July 31, 2015.
(e) The registrant’s Audit Committee has established pre-approval policies and procedures as permitted by Rule 2-01(c)(7)(i)(B) of Regulation S-X (the “Pre-Approval Policy”) with respect to services provided by the registrant’s independent auditors. Pursuant to the Pre-Approval Policy, the Audit Committee has pre-approved the services set forth in the table below with respect to the registrant up to the specified fee limits. Certain fee limits are based on aggregate fees to the registrant and other registrants within the Delaware Investments Family of Funds.
Under the Pre-Approval Policy, the Audit Committee has also pre-approved the services set forth in the table below with respect to the registrant’s investment adviser and other entities controlling, controlled by or under common control with the investment adviser that provide ongoing services to the registrant (the “Control Affiliates”) up to the specified fee limit. This fee limit is based on aggregate fees to the investment adviser and its Control Affiliates.
The Pre-Approval Policy requires the registrant’s independent auditors to report to the Audit Committee at each of its regular meetings regarding all services initiated since the last such report was rendered, including those services authorized by the Pre-Approval Policy.
(f) Not applicable.
(g) The aggregate non-audit fees billed by the registrant’s independent auditors for services rendered to the registrant and to its investment adviser and other service providers under common control with the adviser were $10,036,000 and $7,530,526 for the registrant’s fiscal years ended July 31, 2016 and July 31, 2015, respectively.
(h) In connection with its selection of the independent auditors, the registrant’s Audit Committee has considered the independent auditors’ provision of non-audit services to the registrant’s investment adviser and other service providers under common control with the adviser that were not required to be pre-approved pursuant to Rule 2-01(c)(7)(ii) of Regulation S-X. The Audit Committee has determined that the independent auditors’ provision of these services is compatible with maintaining the auditors’ independence.
Item 5. Audit Committee of Listed Registrants
Not applicable.
Item 6. Investments
(a) Included as part of report to shareholders filed under Item 1 of this Form N-CSR.
(b) Divestment of securities in accordance with Section 13(c) of the Investment Company Act of 1940.
Not applicable.
Item 7. Disclosure of Proxy Voting Policies and Procedures for Closed-End Management Investment Companies
Not applicable.
Item 8. Portfolio Managers of Closed-End Management Investment Companies
Not applicable.
Item 9. Purchases of Equity Securities by Closed-End Management Investment Company and Affiliated Purchasers
Not applicable.
Item 10. Submission of Matters to a Vote of Security Holders
Not applicable.
Item 11. Controls and Procedures
The registrant’s principal executive officer and principal financial officer have evaluated the registrant’s disclosure controls and procedures within 90 days of the filing of this report and have concluded that they are effective in providing reasonable assurance that the information required to be disclosed by the registrant in its reports or statements filed under the Securities Exchange Act of 1934 is recorded, processed, summarized and reported within the time periods specified in the rules and forms of the Securities and Exchange Commission.
There were no significant changes in the registrant’s internal control over financial reporting that occurred during the second fiscal quarter of the period covered by the report to stockholders included herein (i.e., the registrant’s fourth fiscal quarter) that have materially affected, or are reasonably likely to materially affect, the registrant’s internal control over financial reporting.
Item 12. Exhibits
Not applicable.
(2) Certifications of Principal Executive Officer and Principal Financial Officer pursuant to Rule 30a-2 under the Investment Company Act of 1940 are attached hereto as Exhibit 99.CERT.
(3) Written solicitations to purchase securities pursuant to Rule 23c-1 under the Securities Exchange Act of 1934.
Not applicable.
(b) Certifications pursuant to Section 906 of the Sarbanes-Oxley Act of 2002 are furnished herewith as Exhibit 99.906CERT.
Pursuant to the requirements of the Securities Exchange Act of 1934 and the Investment Company Act of 1940, the registrant has duly caused this report to be signed on its behalf, by the undersigned, thereunto duly authorized.
Pursuant to the requirements of the Securities Exchange Act of 1934 and the Investment Company Act of 1940, this report has been signed below by the following persons on behalf of the registrant and in the capacities and on the dates indicated.