Exhibit 99.1
Fixed Income Road Show London, England May 2007 Beth Acton Chief Financial Officer |
Safe Harbor Statement Any statements in this news release that are not historical facts are forward-looking statements as defined in the Private Securities Litigation Reform Act of 1995. Words such as "anticipates," "believes," "feels," "expects," "estimates," "seeks," "strives," "plans," "intends," "outlook," "forecast," "position," "target," "mission," "assume," "achievable," "potential," "strategy," "goal," "aspiration," "outcome," "continue," "remain," "maintain," "trend," "objective" and variations of such words and similar expressions, or future or conditional verbs such as "will," "would," "should," "could," "might," "can," "may" or similar expressions, as they relate to Comerica or its management, are intended to identify forward-looking statements. These forward-looking statements are predicated on the beliefs and assumptions of Comerica's management based on information known to Comerica's management as of the date of this news release and do not purport to speak as of any other date. Forward-looking statements may include descriptions of plans and objectives of Comerica's management for future or past operations, products or services, and forecasts of Comerica's revenue, earnings or other measures of economic performance, including statements of profitability, business segments and subsidiaries, estimates of credit trends and global stability. Such statements reflect the view of Comerica's management as of this date with respect to future events and are subject to risks and uncertainties. Should one or more of these risks materialize or should underlying beliefs or assumptions prove incorrect, Comerica's actual results could differ materially from those discussed. Factors that could cause or contribute to such differences are changes in the pace of an economic recovery and related changes in employment levels, the effects of war and other armed conflicts or acts of terrorism, the effects of natural disasters including, but not limited to, hurricanes, tornadoes, earthquakes and floods, the disruption of private or public utilities, the implementation of Comerica's strategies and business models, management's ability to maintain and expand customer relationships, management's ability to retain key officers and employees, changes in the accounting treatment of any particular item, the impact of regulatory examinations, declines or other changes in the businesses or industries in which Comerica has a concentration of loans, including, but not limited to, automotive production, the anticipated performance of any new banking centers, the entry of new competitors in Comerica's markets, changes in the level of fee income, changes in applicable laws and regulations, including those concerning taxes, banking, securities and insurance, changes in trade, monetary and fiscal policies, including the interest rate policies of the Board of Governors of the Federal Reserve System, fluctuations in inflation or interest rates, changes in general economic conditions and related credit and market conditions and adverse conditions in the stock market. Comerica cautions that the foregoing list of factors is not exclusive. Forward-looking statements speak only as of the date they are made. Comerica does not undertake to update forward-looking statements to reflect facts, circumstances, assumptions or events that occur after the date the forward-looking statements are made. For any forward- looking statements made in this news release or in any documents, Comerica claims the protection of the safe harbor for forward-looking statements contained in the Private Securities Litigation Reform Act of 1995. |
Comerica: A Brief Overview $57.5 billion in assets Among the top 20 bank holding companies in the U.S. Major markets include Michigan, California, Texas, Arizona and Florida Relocation of corporate headquarters to Dallas, Texas Positive core operating trends in 2006 and first quarter 2007 Approximately $9.9 billion in market capitalization |
Our Strategy To deliver attractive returns to our shareholders over time by: Exporting our expertise to higher growth markets Continued investments to achieve balance amongst our businesses Building and enhancing customer relationships Continuous Improvement of risk management processes Holding ourselves accountable |
Lines of Businesses: At a Glance Retail Bank Wealth & Institutional Management Business Bank 402 banking centers 710,000 Personal Banking customers 93,000 Small Business customers Call centers, ATMs, Web Banking Trust services Private Banking Investment management Brokerage and Insurance Lending & Leasing Treasury Management International Trade Services 40% of avg. total deposits in first quarter 2007 Opening 30 new banking centers in 2007, mainly in growth markets Not a mass market retail bank Targets small businesses, middle market, business owners and the affluent Solid investment performance Open architecture platform Customized, flexible solutions Efficiency gains #1 Commercial lender as a percent of total assets #7 Commercial lender (total loans) Middle Market represents 33% of avg. total loans in first quarter 2007 Loan growth momentum in Texas and Western markets Sound credit standards Sophisticated credit management tools Competitive advantage: Relationship Banking National Platforms Competitive advantage: Relationship Banking National Platforms Competitive advantage: Relationship Banking National Platforms |
By Business Segment Midwest Western Texas Florida Other Markets International Revenue 360 203 86 15 16 25 By Business Segment Business Bank Retail Bank W&IM Revenues 390 208 107 First Quarter 2007 Revenues: $706 Million By Business Segment* By Market Segment* Business Bank $390MM 55% Retail Bank $209MM 30% W&IM $107MM 15% Midwest $360MM 52% Western $204MM 29% Texas $86MM 12% Florida $15MM 2% *Revenues from continuing operations (FTE); reflects office of origination Other Markets $16MM 2% Int'l $25MM 3% |
Accelerating Banking Center Expansion: Growing in the Growth Markets Location of New Banking Centers 2004- 2006 YTD 3/07 Full Year 2007 Market Total California 29 3 14 73 Arizona 4 0 5 5 Texas 17 4 9 72 Florida 3 0 0 9 Michigan 7 2 2 243 Total 60 9 30 402 Since late 2004, opened 69 new banking centers 96% of new banking centers opened in 2006 were in high growth markets Opening about 30 new banking centers in 2007 with over 90% in high growth markets Deposits at new banking centers are ahead of expectations |
MI TX AZ CA FL Banking Centers 261 51 1 42 6 MI TX AZ CA FL Banking Centers 0.46 0.2 0.05 0.25 0.04 Accelerating Banking Center Expansion: Growing in the Growth Markets December 2003 2010 Projected 361 Banking Centers 512 Banking Centers MI TX AZ CA FL Banking Centers 243 72 5 73 9 March 2007 402 Banking Centers |
Small Business Banking Business Bank WIM Personal Banking Average Deposits 0.15 0.38 0.09 0.38 New Banking Centers: Contribution From All Lines of Business Deposits: $737 million Reflects 4Q06 average balances for the 60 banking centers open three years or less Retail Bank - Personal Bkg 38% Retail Bank - Small Busn Bkg 15% Business Bank 38% W&IM 9% Small Business Banking Business Bank WIM Personal Banking 0.28 0.55 0.11 0.06 Loans: $288 million W&IM 11% Retail Bank - Personal Bkg 6% Retail Bank - Small Busn Bkg 28% Business Bank 55% |
Retail Bank: Small Business Opportunities Deposit rich segment Low penetration rates in Texas and Western markets Incubator to grow relationships Partnering Banking Centers and Small Business Bankers Continued focus on cross-selling Debit/credit card rewards programs Wealth Management - business owners Consumer - employees Western Michigan Texas Florida SB Counts 1029163 248916 401390 220000 Number of Small Businesses in Comerica's Markets |
Wealth & Institutional Management: On the Right Path to Growth Driving new business with investment performance, customer satisfaction and sales focus Just getting started ...still ample opportunities within our client base and in growing markets Making gains in efficiency and improving margins in our fee businesses |
2005 2006 YOY% Assets/FTE * $ 87,574 $ 103,391 18.1% Revenues/FTE $287,965 $ 322,526 12.0% New Annualized Fees/FTE $ 9,600 $ 11,005 14.6% Loans & Deposits/FTE * $ 4,363 $ 4,895 12.5% Headcount (Average FTE) 1,426 1,268 -11.1% * At December 31 $ in thousands Data excludes Munder Capital Management, a discontinued operation Efficiency Metrics Wealth & Institutional Management: Making Gains in Efficiency |
Midwest Western Texas Florida Other Markets International 16 14.1 4.9 1.2 0.7 2.1 Middle Market Commercial Real Estate Global Corporate Banking National Dealer Services Specialty Businesses 15.9 6.5 5.2 5.3 6.1 Business Bank: How We Deploy the Model For Balance and Growth First Quarter 2007 Average Loans Outstanding: $39.0B * Specialty Businesses include: Entertainment, Energy, Financial Services Division, Leasing, and Technology and Life Sciences |
The Business Bank's Competitive Edge The marketplace recognizes that our relationship banking model is the cornerstone of our commercial lending business We've built a national platform and proven our ability to export our expertise to new markets We offer the same capabilities of much larger banks but with superior customer service of smaller banks |
What Our Customers Say Small Business National Excellence Award for serving Small Business from Greenwich Associates Private Banking Customers' overall satisfaction rate with their Private Banker at 86% nationally in an internally commissioned survey Retail 92% of our customers responded favorably when asked "How satisfied were you with the service during your last branch visit?" Business Bank 91% of Middle Market customers across all markets expressed they are very satisfied with their Relationship Manager |
How Comerica Delivers Credit Risk Management New and updated policies Nationalized our Special Asset function New, more quantitatively based risk models Credit Loss Forecasting model Migration studies Cost effective tools to enhance efficiency and data integrity Independent Asset Quality Review function |
Solid Credit Quality 1Q06 2Q06 3Q06 4Q06 1Q07 NPA's / Total Loans and ORE 0.0032 0.0037 0.0042 0.0049 0.0049 1Q06 2Q06 3Q06 4Q06 1Q07 Net Credit-Related Charge-offs to Average Total Loans * 0.0019 0.0016 0.0006 0.0019 0.0016 1Q06 2Q06 3Q06 4Q06 1Q07 ALLL / Total Loans 0.0106 0.0104 0.0106 0.0104 0.0104 1Q06 2Q06 3Q06 4Q06 1Q07 Net loan charge-offs to total average loans 3.34 2.78 2.51 2.13 2.14 *Includes net loan charge-offs and net lending related commitment charge-offs ** 7 basis points of this total is related to the sale of the manufactured housing portfolio |
Commercial Real Estate Loan Portfolio 11% year-over-year average loan growth Adhere to conservative lending policies Commercial Real Estate business line net loan charge-offs of $4 million Owner Occupied/Other* Real Estate Construction Commercial Mortgage 1Q07 8959 3495 1468 1Q07: $13.9 billion First quarter 2007 averages in $billions *Included in Commercial Real Estate line of business |
Western Michigan Texas Florida Other Markets 1Q06 Loans Outstanding 2.375065593 0.867218395 0.83611695313148 0.46324098 0.459822755 Single Family Land Development Land Carry Retail Multi-family Office Other 1Q07 Loans Outstanding 1.659804769 0.894891522 0.651269981 0.520017524 0.423929876 0.366656026 0.484894979 Commercial Real Estate Line of Business March 31, 2007 Loan Outstandings: $5.0 billion* By Project Type By Geography Period-end balances in $billions; Geography reflects location of property; additional CRE information can be found in the appendix * Excludes $1.6B in Commercial Real Estate line of business loans not secured by real estate |
Automotive Manufacturer Exposure Declining 12/05 12/06 2/07 Exposure: Dealer $ 6.6 $ 7.4 $ 7.5 Other Automotive: Domestic Ownership $ 3.3 $ 2.9 $ 2.8 Foreign Ownership 1.5 1.3 1.2 Total Other Automotive $ 4.8 $ 4.2 $ 4.0 (4)% Outstandings: Dealer $ 4.8 $ 5.6 $ 5.4 Other Automotive: Domestic Ownership $ 2.0 $ 1.7 $ 1.6 Foreign Ownership 0.7 0.5 0.5 Total Other Automotive $ 2.7 $ 2.2 $ 2.1 (4)% 1Q06 2Q06 3Q06 4Q06 1Q07 NPA's 20 43 49 46 39 1Q06 2Q06 3Q06 4Q06 1Q07 Net Loan Charge-offs 8 3 3 2 7 Period-end in $ billions Exposure includes committed and discretionary facilities (undrawn and outstanding) |
Consumer Loan Portfolio 8% of total outstandings No sub-prime mortgage programs 2% of total nonaccrual loans (12 bps of consumer portfolio) Net loan charge-offs of $2 million Consumer loans-Other Consumer Loans-HELOC Residential Mortgages 20 38 42 1Q07: $4.1 billion First quarter 2007 averages in $billions Consumer Loans - Home Equity $1.6B 38% Consumer Loans - Other $0.8B 20% Residential Mortgage Loans $1.7B 42% |
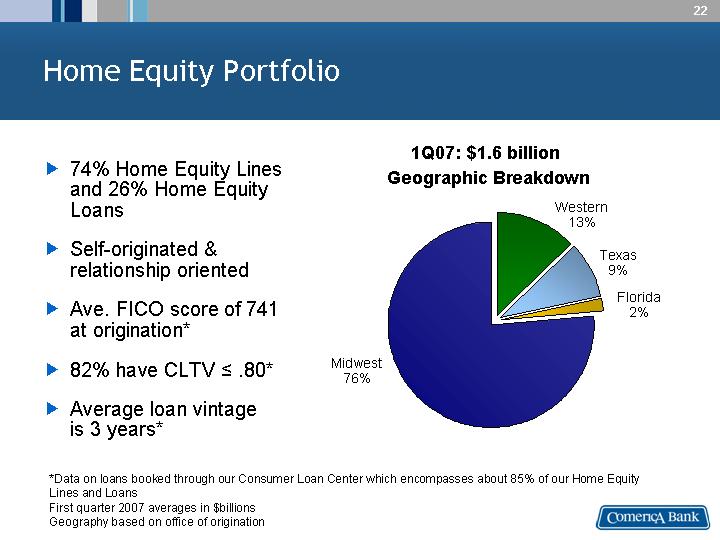
Home Equity Portfolio Florida Midwest Western Texas 2 77 13 9 74% Home Equity Lines and 26% Home Equity Loans Self-originated & relationship oriented Ave. FICO score of 741 at origination* 82% have CLTV ^ .80* Average loan vintage is 3 years* Geographic Breakdown Midwest 76% Texas 9% Western 13% *Data on loans booked through our Consumer Loan Center which encompasses about 85% of our Home Equity Lines and Loans First quarter 2007 averages in $billions Geography based on office of origination Florida 2% 1Q07: $1.6 billion |
Interest Rate and Liquidity Risk Liquidity Risk Management Approach to funding and liquidity management is to assess the maturity profile of our asset base in light of our core deposit experience, and then stagger the wholesale funding maturity profile appropriately to maintain a strong liquidity position. Investment portfolio is maintained primarily for liquidity purposes. Management tools, such as dynamic crisis liquidity scenario modeling, ensure liquidity position is appropriate. Interest Rate Risk Management Short-term interest rate risk as measured through net interest income simulation is modestly asset sensitive. Guideline is to limit the adverse change in net interest income to 5% of the base for a 200 basis point interest rate shock ramped over a four month period. Actual Q1 results were at (4)%, or (2)% for the rate shock ramped over a 12 month period. Long-term interest rate risk as measured through economic value of equity simulations shows a more asset sensitive position over this longer horizon. Guideline is to limit adverse change in economic value to 10% of base market value for a 200 basis point interest rate shock. Actual Q1 results were at (9)%, up from (4)% in Q4, largely due to the issuance of subordinated notes. These positions are regularly monitored in a variety of potential interest rate environments, along with hedging alternatives. |
Funding Composition Q1 2007 Average: $50.7 billion We remain focused on core deposit growth Customers continue to have a preference for short-term time deposits over money market deposits To the extent loan growth exceeds deposit growth, wholesale borrowings are utilized prudently in accordance with our liquidity objectives MM, NOW and Savings Noninterest-Bearing Deposits Time Deposits Medium- and Long-term debt Short-term Borrowings 1Q 2007 Average 16131 12160 13168 6427 2774 |
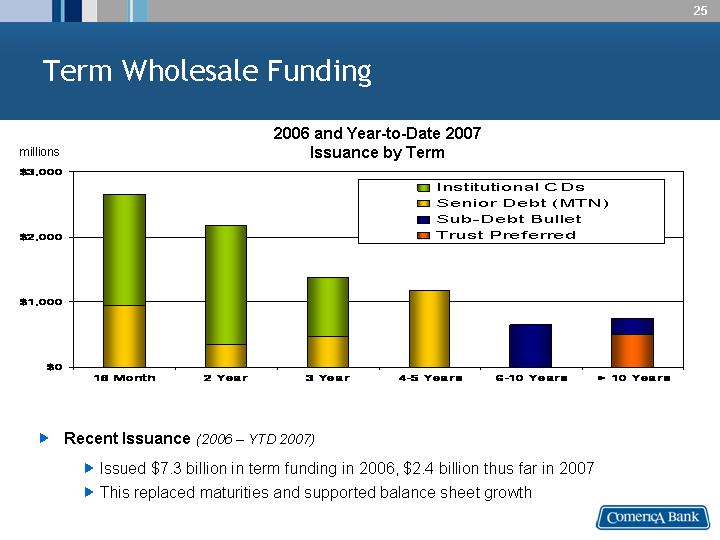
Term Wholesale Funding 18 Month 2 Year 3 Year 4-5 Years 6-10 Years > 10 Years Trust Preferred 0 0 0 0 0 500 Sub-Debt Bullet 0 0 0 0 650 250 Senior Debt (MTN) 950 350 475 1175 0 0 Institutional CDs 1704 1830 900 0 0 0 2006 and Year-to-Date 2007 Issuance by Term Recent Issuance (2006 - YTD 2007) Issued $7.3 billion in term funding in 2006, $2.4 billion thus far in 2007 This replaced maturities and supported balance sheet growth millions |
Term Wholesale Funding 2007 2008 2009 2010 2011 2012 2013 2014 2015 2016 2017 2018 2019 2020 2021+ Trust Preferred 55 0 0 0 0 0 0 0 0 0 0 0 0 0 500 Sub-Debt Bullet 350 350 100 0 0 0 0 250 300 650 500 0 0 0 150 Sub-Debt Callable 0 0 0 0 0 0 150 0 0 0 0 0 0 0 150 Senior Debt (MTN) 750 350 475 300 875 0 0 0 0 0 0 0 0 0 0 Institutional CDs 3050 1175 1455 0 0 0 0 0 0 0 0 0 0 0 0 Term Wholesale Funding Profile by Maturity Expected 2007 Issuance (Q2 - Q4) Replace approximately $4 billion of senior note and institutional CD maturities Additional issues will support growth: Approximately $1.0 billion of senior notes Approximately $0.4 billion of subordinated notes millions |
Strong Debt Ratings |
Capital Management Investment in risk assessment tools More sophisticated credit, operational and market risk analytics Improved view of unexpected loss - the basis for capital adequacy Creates opportunity to optimize capital Common equity is held to cover unexpected losses Risk-based capital guidelines reflect unexpected loss assessment: Guideline as of 3/07 Tier 1 Common* 6.50% to 7.50% 7.49% Tier 1 Capital 7.25% to 8.25% 8.19% Tangible equity to assets ratio remains strong at 9.0% Resulting in a more cost effective capital base over time * Regulatory Tier 1 Capital Ratio excluding preferred and trust preferred securities |
Accelerating Our Strategy of Growth and Balance Comerica 2006 Western/Texas/Florida: Loans 50% Deposits 45% Revenue 44% Net Income 46% Banking Centers 152 Comerica 1997 Western/Texas/Florida: Loans 27% Deposits 27% Revenue 27% Net Income 30% Banking Centers 90 Percent of Total Comerica |
Relocation of Corporate Headquarters to Dallas Opportunity to accelerate growth in Texas Banking Center expansion Increase relationship managers A smooth transition Costs controlled Operations unaffected Maintain leadership position in Michigan |
Solid Earnings Quality Highlights First Quarter 2007 Results * Loan growth figures exclude Financial Services Division; Analysis of 1Q07 compared to 4Q06 Annualized average loan growth of 6%* Western: 15% Texas: 5% Florida: 4% Midwest: (1)% Net interest margin increases 7 basis points to 3.82% Sound credit quality Net credit-related charge-offs as a percentage of average total loans of 16 bps Nonperforming assets of 0.49% of total loans and foreclosed property Expenses well controlled Active capital management: 3.4 million shares repurchased |
2007 Full Year Outlook % Change over 2006 Loan growth (excluding Financial Services Division) Mid to High single-digit West Low double-digit Texas Low double-digit Midwest Flat Net interest margin of about 3.75% to 3.80% Net credit-related charge-offs of about 20 bps (Provision for credit losses modestly in excess of credit-related net charge-offs) Noninterest income Low single-digit* (2006 adjusted base of $820 million) Noninterest expenses Flat (Excluding the provision for credit losses on lending-related commitments) Active capital management Tier 1 common 6.50-7.50% Tier 1 7.25-8.25% This outlook is provided as of April 17, 2007 * excluding Financial Services Division-related lawsuit settlement and loss on the sale of the Mexican bank charter in 2006 |
Comerica: A Sound Investment Focused strategy Unique relationship banking model Investing for growth and balance Banking center expansion in higher growth markets Larger contribution from Wealth & Institutional Management and Retail Bank New and enhanced products and services Effective risk management Strong balance sheet |
Appendix |
Financial Results 1Q07 4Q06 Q - Q% Chg 1Q06 Y - Y% Chg Net Income $190 $299 -37% $194 -3% Diluted EPS from continuing operations Diluted EPS $1.19 $1.19 $1.16 $1.87 3% - -36% $1.26 $1.18 -6% 1% Return on Equity 14.86% 22.63% 15.33% Net Interest Income $502 $502 0% $479 5% Net Interest Margin 3.82% 3.75% 3.80% Provision for Loan Losses $23 $22 5% $(27) N/M Noninterest Income $203 $262 -23% $195 4% Noninterest Expenses $407 $457 -11% $429 -5% $ in millions, except per share data N/M = Not Meaningful Data has been restated to reflect the results of Munder Capital Management as a discontinued operation |
1Q06 2Q06 3Q06 4Q06 1Q07 Net Interest Income 479 500 502 502 502 Net Interest Margin 0.038 0.0382 0.0379 0.0375 0.0382 Warrant Accounting Net Interest Margin Net Interest Margin Rises in First Quarter 2007 Net Interest Margin of 3.82%, up 7 bps Loan yields stable Deposit rates declined slightly Stable Net Interest Income of $502 million Two fewer days in quarter ($11 million) $ in millions |
Midwest Western Texas Florida International Other Markets 1Q07 Avg Loans Outstanding 21.8 14.6 6.5 1.6 2.1 0.7 Midwest Western Texas Florida International Other Markets 1Q06 Average Loans Outstanding 21.3 12.7 5.4 1.4 2.2 0.6 Making Progress: Geographic Loan Growth 1Q07: $47.3 billion* 1Q06: $43.6 billion* *Excludes average Financial Services Division loans of $2.9B in 1Q06 and $1.6B in 1Q07 Geography based on office of origination Western includes: CA, AZ, NV, CO, WA Year-over-Year Average Loan Outstandings up 9%* |
Middle Market CRE Global Corp Bankings National Dealer Specialty Businesses* Personal Banking Small Business Banking Private Banking 1Q06 Avg Loans Outstanding 14.8 6 4.7 4.7 3.8 2.3 3.8 3.5 Middle Market Commercial Real Estate Global Corporate Banking National Dealer Services Specialty Businesses Personal Banking Small Business Banking Private Banking 1Q07 Average Loans Outstanding 15.9 6.5 5.2 5.3 4.5 2.1 4 3.8 Balanced Line of Business Loan Portfolio Year-over-Year Average Loan Outstandings up 9%* * Excludes average Financial Services Division loans of $2.9B in 1Q06 and $1.6B in 1Q07 ** Specialty Businesses include: Entertainment, Energy, Leasing, and Technology and Life Sciences 1Q07: $47.3 billion* 1Q06: $43.6 billion* |
Loan Momentum Continues in Growth Markets 1Q07 4Q06 Q - Q% Chg 1Q06 Y - Y% Chg Midwest $21.8 $21.9 0% $21.3 2% Western > Excluding FSD 16.2 14.6 16.0 14.1 1% 4% 15.6 12.7 4% 15% Texas 6.5 6.4 1% 5.4 20% Florida 1.6 1.6 1% 1.4 19% Other Markets 0.7 0.7 1% 0.6 22% International 2.1 2.0 5% 2.2 -6% TOTAL $48.9 $48.6 1% $46.5 5% > EXCLUDING FSD $47.3 $46.7 1% $43.6 9% Average loans in $billions; % change based on full dollar amounts Geography based on location of loan office Western includes: CA, AZ, NV, CO, WA |
Diverse Line of Business Loan Growth 1Q07 4Q06 Q - Q% Change 1Q06 Y - Y% Change Middle Market $15.9 $15.8 1% $14.8 8% Commercial Real Estate 6.5 6.6 -1% 6.0 9% Global Corporate Banking 5.2 5.0 4% 4.7 10% National Dealer Services 5.3 5.0 5% 4.7 13% Specialty Businesses* > Excluding FSD 6.1 4.5 6.4 4.5 -4% 1% 6.7 3.8 -9% 19% SUBTOTAL - BUSINESS BANK $39.0 $38.8 1% $36.9 6% Small Business Banking 4.0 3.9 2% 3.8 5% Personal Banking 2.1 2.2 -3% 2.3 -8% SUBTOTAL - RETAIL BANK $6.1 $6.1 0% $6.1 0% Private Banking 3.8 3.7 3% 3.5 8% SUBTOTAL - WEALTH & INSTITUTIONAL MANAGEMENT $3.8 $3.7 3% $3.5 8% TOTAL > EXCLUDING FSD $48.9 $47.3 $48.6 $46.7 1% 1% $46.5 $43.6 5% 9% Average loans in $billions; % change based on full dollar amount * Specialty Businesses includes: Entertainment, Energy, FSD, Leasing and TLS |
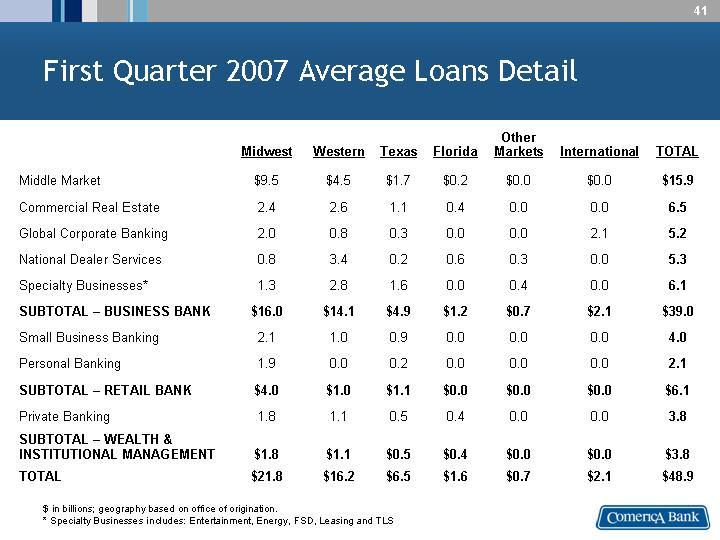
First Quarter 2007 Average Loans Detail Midwest Western Texas Florida Other Markets International TOTAL Middle Market $9.5 $4.5 $1.7 $0.2 $0.0 $0.0 $15.9 Commercial Real Estate 2.4 2.6 1.1 0.4 0.0 0.0 6.5 Global Corporate Banking 2.0 0.8 0.3 0.0 0.0 2.1 5.2 National Dealer Services 0.8 3.4 0.2 0.6 0.3 0.0 5.3 Specialty Businesses* 1.3 2.8 1.6 0.0 0.4 0.0 6.1 SUBTOTAL - BUSINESS BANK $16.0 $14.1 $4.9 $1.2 $0.7 $2.1 $39.0 Small Business Banking 2.1 1.0 0.9 0.0 0.0 0.0 4.0 Personal Banking 1.9 0.0 0.2 0.0 0.0 0.0 2.1 SUBTOTAL - RETAIL BANK $4.0 $1.0 $1.1 $0.0 $0.0 $0.0 $6.1 Private Banking 1.8 1.1 0.5 0.4 0.0 0.0 3.8 SUBTOTAL - WEALTH & INSTITUTIONAL MANAGEMENT $1.8 $1.1 $0.5 $0.4 $0.0 $0.0 $3.8 TOTAL $21.8 $16.2 $6.5 $1.6 $0.7 $2.1 $48.9 $ in billions; geography based on office of origination. * Specialty Businesses includes: Entertainment, Energy, FSD, Leasing and TLS |
Western Midwest Florida Texas Other 3.4 0.8 0.5 0.3 0.3 Franchise Distribution* Toyota / Lexus 22% Honda / Acura 17% Daimler Chrysler 13% Ford 13% General Motors 10% Other Asian 5% Nissan / Infinity 5% Other European 5% Other** 10% 1Q07 Average Loans Outstanding: $5.3 billion Midwest $0.8B 15% Western $3.4B 65% Texas $0.2B 4% Florida $0.6B 10% Geographic Dispersion * Franchise distribution based on March 31, 2007 period-end outstandings ** "Other" includes obligations where a primary franchise is indeterminable (rental car and leasing companies, heavy truck, recreational vehicles, and non-floor plan loans) Diversified National Dealer Services Business Other Markets $0.3B 6% |
Diversified Shared National Credit Portfolio Approx. 995 borrowers 18% of total outstanding Industry diversification mirrors total loan book Approx. 1% of total nonaccrual loans (1 bp of portfolio) No net loan charge-offs Middle Market Commercial Real Estate Global Corporate Banking National Dealer Services Energy Other 3/31/2007 1937 2092 2843 391 1077 535 March 31, 2007: $8.9 billion Period-end outstandings as of March 31, 2007 |
Real Estate Construction Loans: Commercial Real Estate Line of Business Western Michigan Texas Florida Other Markets TOTAL Single Family $1.0 $0.1 $0.2 $0.2 $0.1 $1.6 Land Development 0.4 0.2 0.2 0.1 0.0 0.9 Retail 0.1 0.1 0.1 0.1 0.0 0.4 Multi-family 0.1 0.0 0.1 0.0 0.1 0.3 Office 0.2 0.0 0.0 0.0 0.0 0.2 Land Carry 0.1 0.0 0.0 0.0 0.0 0.1 Commercial 0.1 0.0 0.0 0.0 0.0 0.1 Other 0.0 0.0 0.0 0.0 0.1 0.1 TOTAL $2.0 $0.4 $0.6 $0.4 $0.3 $3.7 First quarter 2007 period-end $ in billions Geography reflects location of property |
Commercial Mortgage Loans: Commercial Real Estate Line of Business Western Michigan Texas Florida Other Markets TOTAL Land Carry $0.2 $0.2 $0.1 $0.1 $0.0 $0.6 Office 0.1 0.1 0.0 0.0 0.0 0.2 Retail 0.0 0.1 0.0 0.0 0.0 0.1 Multi-family 0.0 0.1 0.0 0.0 0.0 0.1 Commercial 0.1 0.0 0.0 0.0 0.0 0.1 Other 0.0 0.0 0.1 0.0 0.1 0.2 TOTAL $0.4 $0.5 $0.2 $0.1 $0.1 $1.3 First quarter 2007 period-end $ in billions Geography reflects location of property |
Line of Business Deposits 1Q07 4Q06 Q - Q% Change 1Q06 Y - Y% Change Middle Market $4.3 $4.3 -1% $4.2 2% Commercial Real Estate 1.0 1.2 -17% 1.1 -11% Global Corporate Banking 3.2 3.1 4% 3.4 -6% National Dealer Services 0.1 0.1 6% 0.1 6% Specialty Businesses1 > Excluding FSD 8.1 3.4 8.4 3.1 -3% 10% 10.1 3.1 -20% 11% SUBTOTAL - BUSINESS BANK >Excluding FSD $16.7 $12.0 $17.1 $11.8 -2% 2% $18.9 $11.9 -12% 1% Small Business Banking 3.9 4.0 -3% 3.8 0% Personal Banking 13.2 13.0 1% 12.9 2% SUBTOTAL - RETAIL BANK $17.1 $17.0 0% $16.7 2% Private Banking 2.3 2.3 -1% 2.5 -5% SUBTOTAL - WEALTH & INSTITUTIONAL MANAGEMENT $2.3 $2.3 -1% $2.5 -5% Finance/Other2 6.5 6.8 N/M 3.1 N/M TOTAL > EXCLUDING FSD $ 42.6 $37.9 $43.2 $37.9 -1% 0% $41.2 $34.2 3% 11% Average deposits in $billions; % change based on full dollar amount N/M = Not Meaningful 1 Specialty Businesses includes: Entertainment, Energy, FSD, Leasing and TLS 2 Finance/Other includes Institutional CD's: 1Q07 - $5.8B; 4Q06 - $5.8B; 1Q06 - $2.6B |
First Quarter 2007 Average Deposits Detail Midwest Western Texas Florida Other Markets International TOTAL Middle Market $0.9 $3.2 $0.2 $0.0 $0.0 $0.0 $4.3 Commercial Real Estate 0.5 0.3 0.1 0.1 0.0 0.0 1.0 Global Corporate Banking 1.6 0.3 0.2 0.0 0.0 1.1 3.2 National Dealer Services 0.0 0.1 0.0 0.0 0.0 0.0 0.1 Specialty Businesses1 0.3 6.9 0.4 0.0 0.5 0.0 8.1 SUBTOTAL - BUSINESS BANK $3.3 $10.8 $0.9 $0.1 $0.5 $1.1 $16.7 Small Business Banking 2.0 0.9 1.0 0.0 0.0 0.0 3.9 Personal Banking 10.7 0.9 1.6 0.0 0.0 0.0 13.2 SUBTOTAL - RETAIL BANK $12.7 $1.8 $2.6 $0.0 $0.0 $0.0 $17.1 Private Banking 0.7 1.1 0.3 0.2 0.0 0.0 2.3 SUBTOTAL - WEALTH & INSTITUTIONAL MANAGEMENT $0.7 $1.1 $0.3 $0.2 $0.0 $0.0 $2.3 Finance/Other2 6.5 0.0 0.0 0.0 0.0 0.0 6.5 TOTAL $23.2 $13.7 $3.8 $0.3 $0.5 $1.1 $42.6 $ in billions 1 Specialty Businesses includes: Entertainment, Energy, FSD, Leasing and TLS 2 Finance/Other includes $5.8B in Institutional CD's; included in Finance Division segment |
Financial Services Division Data 1Q07 4Q06 1Q06 Average Balance Sheet Noninterest-bearing $3.5 $4.0 $4.7 Interest-bearing 1.2 1.3 2.3 Total Deposits $4.7 $5.3 $7.0 Total Loans $1.6 $1.9 $2.9 Noninterest Expenses Customer Services $14 $14 $13 Average Rates FSD Loans (Primarily Low-rate) 0.68% 0.66% 0.43% FSD Interest-bearing Deposits 3.91% 3.94% 3.74% Balance Sheet data in $billions; Noninterest Expense data in $millions 2007 Full Year Outlook: Average noninterest-bearing deposits are expected to remain at first quarter 2007 levels Average loans are expected to fluctuate with the level of noninterest-bearing deposits |
Total cost to be incurred is $15-20 million over three years Comerica remains one of Southeast Michigan's largest employers with approximately 7,300 employees across the state Initial move of Management Policy Committee to occur by end of third quarter of 2007 Relocation of Headquarters is expected to impact about 200 colleagues over three years A Key Step to Accelerating Comerica's Growth: Relocation of Corporate Headquarters to Dallas |
A Key Step to Accelerating Comerica's Growth: Relocation of Corporate Headquarters to Dallas Accelerates growth in all of Comerica's markets Comerica will be closer to its markets Dallas is centrally located and provides greater accessibility to all of our markets Additional resources in these markets will lead to accelerated growth Comerica will be uniquely positioned Comerica will be the largest bank holding company headquartered in Texas, representing an important competitive differentiator Comerica will build on its strong foundation Expect to significantly increase growth in Texas We believe the vibrant and diversified economies in Texas will be helpful as we attract and retain talented colleagues |
Fixed Income Contacts Darlene Persons Director of Investor Relations (313) 222-2840 DPPersons@Comerica.com Paul Burdiss Senior Vice President & Treasurer (313) 222-5522 PEBurdiss@Comerica.com Tony Magdowski Senior Vice President - Global Capital Markets (248) 371-6805 AJMagdowski@Comerica.com |
Click to edit Master title style Click to edit Master text styles Second level Third level Fourth level Fifth level ? ? 52 |