UNITED STATES
SECURITIES AND EXCHANGE COMMISSION
Washington, D.C. 20549
FORM N-CSR
CERTIFIED SHAREHOLDER REPORT OF REGISTERED
MANAGEMENT INVESTMENT COMPANIES
Investment Company Act file number 811-03480
Fidelity Oxford Street Trust
(Exact name of registrant as specified in charter)
245 Summer St., Boston, MA 02210
(Address of principal executive offices) (Zip code)
Cynthia Lo Bessette, Secretary
245 Summer St.
Boston, Massachusetts 02210
(Name and address of agent for service)
Registrant's telephone number, including area code:
617-563-7000
| |
Date of fiscal year end: | July 31 |
|
|
Date of reporting period: | January 31, 2020 |
Item 1.
Reports to Stockholders
Fidelity® Series Commodity Strategy Fund
Semi-Annual Report
January 31, 2020

See the inside front cover for important information about access to your fund’s shareholder reports.

Beginning on January 1, 2021, as permitted by regulations adopted by the Securities and Exchange Commission, paper copies of a fund’s shareholder reports will no longer be sent by mail, unless you specifically request paper copies of the reports from the fund or from your financial intermediary, such as a financial advisor, broker-dealer or bank. Instead, the reports will be made available on a website, and you will be notified by mail each time a report is posted and provided with a website link to access the report.
If you already elected to receive shareholder reports electronically, you will not be affected by this change and you need not take any action. You may elect to receive shareholder reports and other communications from a fund electronically, by contacting your financial intermediary. For Fidelity customers, visit Fidelity's web site or call Fidelity using the contact information listed below.
You may elect to receive all future reports in paper free of charge. If you wish to continue receiving paper copies of your shareholder reports, you may contact your financial intermediary or, if you are a Fidelity customer, visit Fidelity’s website, or call Fidelity at the applicable toll-free number listed below. Your election to receive reports in paper will apply to all funds held with the fund complex/your financial intermediary.
| Account Type | Website | Phone Number |
| Brokerage, Mutual Fund, or Annuity Contracts: | fidelity.com/mailpreferences | 1-800-343-3548 |
| Employer Provided Retirement Accounts: | netbenefits.fidelity.com/preferences (choose 'no' under Required Disclosures to continue to print) | 1-800-343-0860 |
| Advisor Sold Accounts Serviced Through Your Financial Intermediary: | Contact Your Financial Intermediary | Your Financial Intermediary's phone number |
| Advisor Sold Accounts Serviced by Fidelity: | institutional.fidelity.com | 1-877-208-0098 |
Contents
To view a fund's proxy voting guidelines and proxy voting record for the 12-month period ended June 30, visit http://www.fidelity.com/proxyvotingresults or visit the Securities and Exchange Commission's (SEC) web site at http://www.sec.gov.
You may also call 1-800-544-8544 to request a free copy of the proxy voting guidelines.
Standard & Poor's, S&P and S&P 500 are registered service marks of The McGraw-Hill Companies, Inc. and have been licensed for use by Fidelity Distributors Corporation.
Other third-party marks appearing herein are the property of their respective owners.
All other marks appearing herein are registered or unregistered trademarks or service marks of FMR LLC or an affiliated company. © 2020 FMR LLC. All rights reserved.
This report and the financial statements contained herein are submitted for the general information of the shareholders of the Fund. This report is not authorized for distribution to prospective investors in the Fund unless preceded or accompanied by an effective prospectus.
A fund files its complete schedule of portfolio holdings with the SEC for the first and third quarters of each fiscal year on Form N-PORT. Forms N-PORT are available on the SEC’s web site at http://www.sec.gov. A fund's Forms N-PORT may be reviewed and copied at the SEC’s Public Reference Room in Washington, DC. Information regarding the operation of the SEC's Public Reference Room may be obtained by calling 1-800-SEC-0330.
For a complete list of a fund's portfolio holdings, view the most recent holdings listing, semiannual report, or annual report on Fidelity's web site at http://www.fidelity.com, http://www.institutional.fidelity.com, or http://www.401k.com, as applicable.
NOT FDIC INSURED •MAY LOSE VALUE •NO BANK GUARANTEE
Neither the Fund nor Fidelity Distributors Corporation is a bank.
Consolidated Investment Summary (Unaudited)
The information in the following tables is based on the Fund's commodity- linked investments and excludes short-term investment-grade debt securities, cash and cash equivalents.
Commodity Instruments as of January 31, 2020*
| % of fund’s total commodity-linked investments |
| | Commodity Swaps | 87.3% |
| | Commodity Futures | 12.7% |

Commodity Sector Diversification as of January 31, 2020*
| % of fund’s total commodity-linked investments |
| | Agriculture | 30.6% |
| | Energy | 27.1% |
| | Precious Metals | 19.0% |
| | Industrial Metals | 17.5% |
| | Livestock | 5.8% |
* Investments in Commodity Swaps provide exposure to the commodities market via the Bloomberg Commodity Index Total Return, an unmanaged index composed of futures contracts on 23 physical commodities. The Fund does not invest directly in physical commodities.
Consolidated Schedule of Investments January 31, 2020 (Unaudited)
Showing Percentage of Net Assets
| U.S. Treasury Obligations - 10.7% | | | |
| | | Principal Amount | Value |
| U.S. Treasury Bills, yield at date of purchase 1.51% to 1.54% 2/6/20 to 4/30/20 (a)(b) | | | |
| (Cost $878,624,599) | | 880,000,000 | 878,695,014 |
| | | Shares | Value |
|
| Money Market Funds - 86.9% | | | |
| Fidelity Cash Central Fund 1.58% (c) | | | |
| (Cost $7,124,977,130) | | 7,124,041,412 | 7,125,466,220 |
| TOTAL INVESTMENT IN SECURITIES - 97.6% | | | |
| (Cost $8,003,601,729) | | | 8,004,161,234 |
| NET OTHER ASSETS (LIABILITIES) - 2.4% | | | 200,998,096 |
| NET ASSETS - 100% | | | $8,205,159,330 |
| Futures Contracts | | | | | |
| | Number of contracts | Expiration Date | Notional Amount | Value | Unrealized Appreciation/(Depreciation) |
| Purchased | | | | | |
| Commodity Futures Contracts | | | | | |
| CBOT Corn Contracts (United States) | 3,436 | March 2020 | $65,498,750 | $(563,318) | $(563,318) |
| CBOT KC HRW Wheat Contracts (United States) | 709 | March 2020 | 16,501,975 | 609,790 | 609,790 |
| CBOT Soybean Contracts (United States) | 1,352 | March 2020 | 58,981,000 | (2,309,735) | (2,309,735) |
| CBOT Soybean Meal Contracts (United States) | 1,238 | March 2020 | 36,025,800 | (1,233,484) | (1,233,484) |
| CBOT Soybean Oil Contracts (United States) | 1,575 | March 2020 | 28,293,300 | (1,455,634) | (1,455,634) |
| CBOT Wheat Contracts (United States) | 1,252 | March 2020 | 34,664,750 | 2,281,408 | 2,281,408 |
| CME Lean Hogs Contracts (United States) | 727 | April 2020 | 17,913,280 | (3,754,964) | (3,754,964) |
| CME Live Cattle Contracts (United States) | 899 | April 2020 | 43,035,130 | (2,816,706) | (2,816,706) |
| COMEX Copper Contracts (United States) | 1,134 | March 2020 | 71,342,838 | (4,202,275) | (4,202,275) |
| COMEX Gold 100 oz. Contracts (United States) | 983 | April 2020 | 156,384,570 | 2,988,081 | 2,988,081 |
| COMEX Silver Contracts (United States) | 466 | March 2020 | 41,986,560 | 2,448,219 | 2,448,219 |
| ICE Brent Crude Contracts (United Kingdom) | 1,165 | March 2020 | 65,752,560 | (8,227,096) | (8,227,096) |
| ICE Coffee 'C' Contracts (United States) | 669 | March 2020 | 25,752,319 | (2,067,164) | (2,067,164) |
| ICE Cotton No. 2 Contracts (United States) | 484 | March 2020 | 16,335,000 | 160,906 | 160,906 |
| ICE Low Sulphur Gasoil Contracts (United States) | 476 | March 2020 | 23,788,100 | (4,004,432) | (4,004,432) |
| ICE Sugar No. 11 Contracts (United States) | 2,239 | March 2020 | 36,637,205 | 6,799,231 | 6,799,231 |
| LME Aluminum Contracts (United Kingdom) | 1,081 | March 2020 | 46,239,775 | (1,483,620) | (1,483,620) |
| LME Nickel Contracts (United Kingdom) | 373 | March 2020 | 28,674,375 | (1,538,835) | (1,538,835) |
| LME Zinc Contracts (United Kingdom) | 660 | March 2020 | 36,382,500 | (919,880) | (919,880) |
| NYMEX Gasoline RBOB Contracts (United States) | 353 | March 2020 | 22,187,747 | (2,312,263) | (2,312,263) |
| NYMEX Natural Gas Contracts (United States) | 4,200 | Feb. 2020 | 77,322,000 | (14,761,146) | (14,761,146) |
| NYMEX NY Harbor ULSD Contracts (United States) | 280 | March 2020 | 19,151,160 | (3,603,519) | (3,603,519) |
| NYMEX WTI Crude Oil Contracts (United States) | 1,453 | Feb. 2020 | 75,003,560 | (10,098,648) | (10,098,648) |
| TOTAL FUTURES CONTRACTS | | | | | $(50,065,084) |
The notional amount of futures purchased as a percentage of Net Assets is 12.7%
For the period, the average monthly notional amount at value for futures contracts in the aggregate was $1,109,097,301.
Swaps
| Underlying Reference | Pay/Receive Reference | Reference Payment Frequency | Financing Rate | Financing Frequency | Counterparty | Maturity Date | Notional Amount | Value | Upfront Premium Received/(Paid) | Unrealized Appreciation/(Depreciation) |
| Total Return Swaps(1) | | | | | | | | | | |
| Bloomberg Commodity Index Total Return | Receives | At Maturity | 3-month US auction rate T-Bill plus 13 basis points | At Maturity | Barclays Bank PLC | Mar. 2020 | $67,000,000 | $(3,598,593) | $0 | $(3,598,593) |
| Bloomberg Commodity Index Total Return | Receives | At Maturity | 3-month US auction rate T-Bill plus 12 basis points | At Maturity | Canadian Imperial Bank Of Commerce | Feb. 2020 | 124,000,000 | (8,073,601) | 0 | (8,073,601) |
| Bloomberg Commodity Index Total Return | Receives | At Maturity | 3-month US auction rate T-Bill plus 12 basis points | At Maturity | Canadian Imperial Bank Of Commerce | Feb. 2020 | 123,000,000 | (5,745,729) | 0 | (5,745,729) |
| Bloomberg Commodity Index Total Return | Receives | At Maturity | 3-month US auction rate T-Bill plus 12 basis points | At Maturity | Canadian Imperial Bank Of Commerce | Mar. 2020 | 111,000,000 | (5,960,328) | 0 | (5,960,328) |
| Bloomberg Commodity Index Total Return | Receives | At Maturity | 3-month US auction rate T-Bill plus 12 basis points | At Maturity | Canadian Imperial Bank Of Commerce | Mar. 2020 | 104,000,000 | (4,371,217) | 0 | (4,371,217) |
| Bloomberg Commodity Index Total Return | Receives | At Maturity | 3-month US auction rate T-Bill plus 12 basis points | At Maturity | Canadian Imperial Bank Of Commerce | Mar. 2020 | 96,000,000 | (2,842,641) | 0 | (2,842,641) |
| Bloomberg Commodity Index Total Return | Receives | At Maturity | 3-month US auction rate T-Bill plus 12 basis points | At Maturity | Canadian Imperial Bank Of Commerce | Apr. 2020 | 108,000,000 | (5,254,673) | 0 | (5,254,673) |
| Bloomberg Commodity Index Total Return | Receives | At Maturity | 3-month US auction rate T-Bill plus 12 basis points | At Maturity | Canadian Imperial Bank Of Commerce | Apr. 2020 | 62,000,000 | (826,217) | 0 | (826,217) |
| Bloomberg Commodity Index Total Return | Receives | At Maturity | 3-month US auction rate T-Bill plus 12 basis points | At Maturity | Citibank, N.A. | Feb. 2020 | 140,000,000 | (5,637,137) | 0 | (5,637,137) |
| Bloomberg Commodity Index Total Return | Receives | At Maturity | 3-month US auction rate T-Bill plus 12 basis points | At Maturity | Citibank, N.A. | Mar. 2020 | 140,000,000 | (7,823,972) | 0 | (7,823,972) |
| Bloomberg Commodity Index Total Return | Receives | At Maturity | 3-month US auction rate T-Bill plus 12 basis points | At Maturity | Citibank, N.A. | Mar. 2020 | 127,000,000 | (4,130,479) | 0 | (4,130,479) |
| Bloomberg Commodity Index Total Return | Receives | At Maturity | 3-month US auction rate T-Bill plus 12 basis points | At Maturity | Citibank, N.A. | Mar. 2020 | 107,000,000 | (5,156,490) | 0 | (5,156,490) |
| Bloomberg Commodity Index Total Return | Receives | At Maturity | 3-month US auction rate T-Bill plus 13 basis points | At Maturity | Credit Suisse International | Mar. 2020 | 141,000,000 | (5,928,563) | 0 | (5,928,563) |
| Bloomberg Commodity Index Total Return | Receives | At Maturity | 3-month US auction rate T-Bill plus 13 basis points | At Maturity | Credit Suisse International | Mar. 2020 | 102,000,000 | (4,917,516) | 0 | (4,917,516) |
| Bloomberg Commodity Index Total Return | Receives | At Maturity | 3-month US auction rate T-Bill plus 12 basis points | At Maturity | Credit Suisse International | May 2020 | 110,000,000 | (4,755,542) | 0 | (4,755,542) |
| Bloomberg Commodity Index Total Return | Receives | At Maturity | 3-month US auction rate T-Bill plus 11 basis points | At Maturity | Goldman Sachs Bank USA | Feb. 2020 | 148,000,000 | (8,910,127) | 0 | (8,910,127) |
| Bloomberg Commodity Index Total Return | Receives | At Maturity | 3-month US auction rate T-Bill plus 11 basis points | At Maturity | Goldman Sachs Bank USA | Mar. 2020 | 140,000,000 | (9,613,743) | 0 | (9,613,743) |
| Bloomberg Commodity Index Total Return | Receives | At Maturity | 3-month US auction rate T-Bill plus 11 basis points | At Maturity | Goldman Sachs Bank USA | Mar. 2020 | 135,000,000 | (6,031,610) | 0 | (6,031,610) |
| Bloomberg Commodity Index Total Return | Receives | At Maturity | 3-month US auction rate T-Bill plus 11 basis points | At Maturity | Goldman Sachs Bank USA | Mar. 2020 | 86,000,000 | (3,333,834) | 0 | (3,333,834) |
| Bloomberg Commodity Index Total Return | Receives | At Maturity | 3-month US auction rate T-Bill plus 11 basis points | At Maturity | Goldman Sachs Bank USA | Apr. 2020 | 149,000,000 | (8,924,544) | 0 | (8,924,544) |
| Bloomberg Commodity Index Total Return | Receives | At Maturity | 3-month US auction rate T-Bill plus 13 basis points | At Maturity | JPMorgan Chase Bank, N.A. | Feb. 2020 | 116,000,000 | (7,737,977) | 0 | (7,737,977) |
| Bloomberg Commodity Index Total Return | Receives | At Maturity | 3-month US auction rate T-Bill plus 13 basis points | At Maturity | JPMorgan Chase Bank, N.A. | May 2020 | 145,000,000 | (6,268,987) | 0 | (6,268,987) |
| Bloomberg Commodity Index Total Return | Receives | At Maturity | 3-month US auction rate T-Bill plus 13 basis points | At Maturity | JPMorgan Chase Bank, N.A. | May 2020 | 67,000,000 | (1,291,188) | 0 | (1,291,188) |
| Bloomberg Commodity Index Total Return | Receives | At Maturity | 3-month US auction rate T-Bill plus 13 basis points | At Maturity | JPMorgan Chase Bank, N.A. | Feb. 2020 | 100,500,000 | (4,831,633) | 0 | (4,831,633) |
| Bloomberg Commodity Index Total Return | Receives | At Maturity | 3-month US auction rate T-Bill plus 13 basis points | At Maturity | JPMorgan Chase Bank, N.A. | Feb. 2020 | 73,000,000 | (4,396,729) | 0 | (4,396,729) |
| Bloomberg Commodity Index Total Return | Receives | At Maturity | 3-month US auction rate T-Bill plus 9 basis points | At Maturity | Macquarie Bank Ltd. | Feb. 2020 | 138,500,000 | (5,529,278) | 0 | (5,529,278) |
| Bloomberg Commodity Index Total Return | Receives | At Maturity | 3-month US auction rate T-Bill plus 9 basis points | At Maturity | Macquarie Bank Ltd. | Feb. 2020 | 127,000,000 | (9,297,448) | 0 | (9,297,448) |
| Bloomberg Commodity Index Total Return | Receives | At Maturity | 3-month US auction rate T-Bill plus 9 basis points | At Maturity | Macquarie Bank Ltd. | Feb. 2020 | 88,000,000 | (3,956,411) | 0 | (3,956,411) |
| Bloomberg Commodity Index Total Return | Receives | At Maturity | 3-month US auction rate T-Bill plus 9 basis points | At Maturity | Macquarie Bank Ltd. | Mar. 2020 | 145,000,000 | (7,604,968) | 0 | (7,604,968) |
| Bloomberg Commodity Index Total Return | Receives | At Maturity | 3-month US auction rate T-Bill plus 9 basis points | At Maturity | Macquarie Bank Ltd. | Mar. 2020 | 96,000,000 | (3,117,597) | 0 | (3,117,597) |
| Bloomberg Commodity Index Total Return | Receives | At Maturity | 3-month US auction rate T-Bill plus 9 basis points | At Maturity | Macquarie Bank Ltd. | Mar. 2020 | 86,000,000 | (3,331,101) | 0 | (3,331,101) |
| Bloomberg Commodity Index Total Return | Receives | At Maturity | 3-month US auction rate T-Bill plus 9 basis points | At Maturity | Macquarie Bank Ltd. | Apr. 2020 | 139,000,000 | (9,206,038) | 0 | (9,206,038) |
| Bloomberg Commodity Index Total Return | Receives | At Maturity | 3-month US auction rate T-Bill plus 9 basis points | At Maturity | Macquarie Bank Ltd. | Apr. 2020 | 131,000,000 | (7,845,334) | 0 | (7,845,334) |
| Bloomberg Commodity Index Total Return | Receives | At Maturity | 3-month US auction rate T-Bill plus 9 basis points | At Maturity | Macquarie Bank Ltd. | Apr. 2020 | 129,500,000 | (10,692,920) | 0 | (10,692,920) |
| Bloomberg Commodity Index Total Return | Receives | At Maturity | 3-month US auction rate T-Bill plus 9 basis points | At Maturity | Macquarie Bank Ltd. | May 2020 | 111,000,000 | (2,138,768) | 0 | (2,138,768) |
| Bloomberg Commodity Index Total Return | Receives | At Maturity | 3-month US auction rate T-Bill plus 9 basis points | At Maturity | Macquarie Bank Ltd. | May 2020 | 100,000,000 | 0 | 0 | 0 |
| Bloomberg Commodity Index Total Return | Receives | At Maturity | 3-month US auction rate T-Bill plus 10 basis points | At Maturity | Merrill Lynch International | Feb. 2020 | 148,500,000 | (7,892,240) | 0 | (7,892,240) |
| Bloomberg Commodity Index Total Return | Receives | At Maturity | 3-month US auction rate T-Bill plus 10 basis points | At Maturity | Merrill Lynch International | Feb. 2020 | 40,000,000 | (2,665,441) | 0 | (2,665,441) |
| Bloomberg Commodity Index Total Return | Receives | At Maturity | 3-month US auction rate T-Bill plus 12 basis points | At Maturity | Merrill Lynch International | Apr. 2020 | 102,000,000 | (4,962,747) | 0 | (4,962,747) |
| Bloomberg Commodity Index Total Return | Receives | At Maturity | 3-month US auction rate T-Bill plus 12 basis points | At Maturity | Merrill Lynch International | Apr. 2020 | 90,000,000 | (7,433,148) | 0 | (7,433,148) |
| Bloomberg Commodity Index Total Return | Receives | At Maturity | 3-month US auction rate T-Bill plus 11 basis points | At Maturity | Merrill Lynch International | May 2020 | 200,000,000 | 0 | 0 | 0 |
| Bloomberg Commodity Index Total Return | Receives | At Maturity | 3-month US auction rate T-Bill plus 11 basis points | At Maturity | Morgan Stanley Capital Group, Inc. | Feb. 2020 | 95,000,000 | (4,435,130) | 0 | (4,435,130) |
| Bloomberg Commodity Index Total Return | Receives | At Maturity | 3-month US auction rate T-Bill plus 12 basis points | At Maturity | Royal Bank of Canada | Feb. 2020 | 89,000,000 | (4,009,197) | 0 | (4,009,197) |
| Bloomberg Commodity Index Total Return | Receives | At Maturity | 3-month US auction rate T-Bill plus 12 basis points | At Maturity | Royal Bank of Canada | Feb. 2020 | 149,000,000 | (8,529,961) | 0 | (8,529,961) |
| Bloomberg Commodity Index Total Return | Receives | At Maturity | 3-month US auction rate T-Bill plus 12 basis points | At Maturity | Royal Bank of Canada | Feb. 2020 | 100,000,000 | (6,020,368) | 0 | (6,020,368) |
| Bloomberg Commodity Index Total Return | Receives | At Maturity | 3-month US auction rate T-Bill plus 12 basis points | At Maturity | Royal Bank of Canada | Mar. 2020 | 147,000,000 | (6,497,148) | 0 | (6,497,148) |
| Bloomberg Commodity Index Total Return | Receives | At Maturity | 3-month US auction rate T-Bill plus 12 basis points | At Maturity | Royal Bank of Canada | Mar. 2020 | 135,000,000 | (6,340,760) | 0 | (6,340,760) |
| Bloomberg Commodity Index Total Return | Receives | At Maturity | 3-month US auction rate T-Bill plus 12 basis points | At Maturity | Royal Bank of Canada | Mar. 2020 | 96,200,000 | (2,848,563) | 0 | (2,848,563) |
| Bloomberg Commodity Index Total Return | Receives | At Maturity | 3-month US auction rate T-Bill plus 12 basis points | At Maturity | Royal Bank of Canada | Apr. 2020 | 148,000,000 | (9,594,925) | 0 | (9,594,925) |
| Bloomberg Commodity Index Total Return | Receives | At Maturity | 3-month US auction rate T-Bill plus 12 basis points | At Maturity | Royal Bank of Canada | Apr. 2020 | 100,000,000 | 0 | 0 | 0 |
| Bloomberg Commodity Index Total Return | Receives | At Maturity | 3-month US auction rate T-Bill plus 12 basis points | At Maturity | Royal Bank of Canada | May 2020 | 150,000,000 | (1,998,912) | 0 | (1,998,912) |
| Bloomberg Commodity Index Total Return | Receives | At Maturity | 3-month US auction rate T-Bill plus 12 basis points | At Maturity | Royal Bank of Canada | May 2020 | 126,000,000 | (5,447,257) | 0 | (5,447,257) |
| Bloomberg Commodity Index Total Return | Receives | At Maturity | 3-month US auction rate T-Bill plus 11 basis points | At Maturity | Societe Generale | Mar. 2020 | 106,800,000 | (5,550,198) | 0 | (5,550,198) |
| Bloomberg Commodity Index Total Return | Receives | At Maturity | 3-month US auction rate T-Bill plus 11 basis points | At Maturity | Societe Generale | Mar. 2020 | 152,000,000 | (7,137,060) | 0 | (7,137,060) |
| Bloomberg Commodity Index Total Return | Receives | At Maturity | 3-month US auction rate T-Bill plus 11 basis points | At Maturity | Societe Generale | Apr. 2020 | 151,000,000 | (12,470,178) | 0 | (12,470,178) |
| Bloomberg Commodity Index Total Return | Receives | At Maturity | 3-month US auction rate T-Bill plus 11 basis points | At Maturity | Societe Generale | Apr. 2020 | 100,000,000 | (6,625,460) | 0 | (6,625,460) |
| Bloomberg Commodity Index Total Return | Receives | At Maturity | 3-month US auction rate T-Bill plus 11.5 basis points | At Maturity | UBS AG | Feb. 2020 | 100,000,000 | (6,021,644) | 0 | (6,021,644) |
| Bloomberg Commodity Index Total Return | Receives | At Maturity | 3-month US auction rate T-Bill plus 11.5 basis points | At Maturity | UBS AG | Mar. 2020 | 151,000,000 | (10,067,375) | 0 | (10,067,375) |
| Bloomberg Commodity Index Total Return | Receives | At Maturity | 3-month US auction rate T-Bill plus 11.5 basis points | At Maturity | UBS AG | Mar. 2020 | 133,000,000 | (5,943,182) | 0 | (5,943,182) |
| Bloomberg Commodity Index Total Return | Receives | At Maturity | 3-month US auction rate T-Bill plus 11.5 basis points | At Maturity | UBS AG | Mar. 2020 | 121,000,000 | (5,346,800) | 0 | (5,346,800) |
| Bloomberg Commodity Index Total Return | Receives | At Maturity | 3-month US auction rate T-Bill plus 11.5 basis points | At Maturity | UBS AG | Mar. 2020 | 112,000,000 | (7,691,654) | 0 | (7,691,654) |
| Bloomberg Commodity Index Total Return | Receives | At Maturity | 3-month US auction rate T-Bill plus 11.5 basis points | At Maturity | UBS AG | Apr. 2020 | 168,000,000 | (10,891,168) | 0 | (10,891,168) |
| Bloomberg Commodity Index Total Return | Receives | At Maturity | 3-month US auction rate T-Bill plus 11.5 basis points | At Maturity | UBS AG | Apr. 2020 | 40,000,000 | (1,729,244) | 0 | (1,729,244) |
| Bloomberg Commodity Index Total Return | Receives | At Maturity | 3-month US auction rate T-Bill plus 11.5 basis points | At Maturity | UBS AG | May 2020 | 153,000,000 | 0 | 0 | 0 |
|
| TOTAL RETURN SWAPS | | | | | | | | $(357,232,693) | $0 | $(357,232,693) |
|
(1) Each open total return swap is an agreement to receive the total return of the Bloomberg Commodity Index Total Return and pay a floating rate based on the 3-month US auction rate T-Bill plus a specified spread.
For the period, the average monthly notional amount for swaps in the aggregate was $6,735,450,000.
Legend
(a) Security or a portion of the security was pledged to cover margin requirements for futures contracts. At period end, the value of securities pledged amounted to $70,757,330.
(b) Security or a portion of the security has been segregated as collateral for open bi-lateral over-the-counter (OTC) swaps. At period end, the value of securities pledged amounted to $761,453,631.
(c) Affiliated fund that is generally available only to investment companies and other accounts managed by Fidelity Investments. The rate quoted is the annualized seven-day yield of the fund at period end. A complete unaudited listing of the fund's holdings as of its most recent quarter end is available upon request. In addition, each Fidelity Central Fund's financial statements are available on the SEC's website or upon request.
Affiliated Central Funds
Information regarding fiscal year to date income earned by the Fund from investments in Fidelity Central Funds is as follows:
| Fund | Income earned |
| Fidelity Cash Central Fund | $63,483,749 |
| Total | $63,483,749 |
Amounts in the income column in the above table include any capital gain distributions from underlying funds, which are presented in the corresponding line-item in the Consolidated Statement of Operations, if applicable.
Consolidated Subsidiary
| Fund | Value, beginning of period | Purchases | Sales Proceeds | Dividend Income | Realized Gain/Loss | Change in Unrealized appreciation (depreciation) | Value, end of period |
| Geode Series Commodity Return Cayman Ltd. | $654,931,087 | $444,999,962 | $-- | $-- | $-- | $(378,200,354) | $721,730,695 |
Investment Valuation
The following is a summary of the inputs used, as of January 31, 2020, involving the Fund's assets and liabilities carried at fair value. The inputs or methodology used for valuing securities may not be an indication of the risk associated with investing in those securities. For more information on valuation inputs, and their aggregation into the levels used below, please refer to the Investment Valuation section in the accompanying Notes to Consolidated Financial Statements.
| | Valuation Inputs at Reporting Date: |
| Description | Total | Level 1 | Level 2 | Level 3 |
| Investments in Securities: | | | | |
| U.S. Government and Government Agency Obligations | $878,695,014 | $-- | $878,695,014 | $-- |
| Money Market Funds | 7,125,466,220 | 7,125,466,220 | -- | -- |
| Total Investments in Securities: | $8,004,161,234 | $7,125,466,220 | $878,695,014 | $-- |
| Derivative Instruments: | | | | |
| Assets | | | | |
| Futures Contracts | $15,287,635 | $15,287,635 | $-- | $-- |
| Swaps | -- | -- | -- | -- |
| Total Assets | $15,287,635 | $15,287,635 | $-- | $-- |
| Liabilities | | | | |
| Futures Contracts | $(65,352,719) | $(65,352,719) | $-- | $-- |
| Swaps | (357,232,693) | -- | (357,232,693) | -- |
| Total Liabilities | $(422,585,412) | $(65,352,719) | $(357,232,693) | $-- |
| Total Derivative Instruments: | $(407,297,777) | $(50,065,084) | $(357,232,693) | $-- |
Value of Derivative Instruments
The following table is a summary of the Fund's value of derivative instruments by primary risk exposure as of January 31, 2020. For additional information on derivative instruments, please refer to the Derivative Instruments section in the accompanying Notes to Consolidated Financial Statements.
| Primary Risk Exposure / Derivative Type | Value |
| | Asset | Liability |
| Commodity Risk | | |
| Futures Contracts(a) | $15,287,635 | $(65,352,719) |
| Swaps(b) | 0 | (357,232,693) |
| Total Commodity Risk | 15,287,635 | (422,585,412) |
| Total Value of Derivatives | $15,287,635 | $(422,585,412) |
(a) Reflects gross cumulative appreciation (depreciation) on futures contracts as presented in the Consolidated Schedule of Investments. In the Consolidated Statement of Assets and Liabilities, the period end daily variation margin is included in receivable or payable for daily variation margin on futures contracts, and the net cumulative appreciation (depreciation) is included in Total accumulated earnings (loss).
(b) For bi-lateral over-the-counter (OTC) swaps, reflects gross value which is presented in the Consolidated Statement of Assets and Liabilities in the bi-lateral OTC swaps, at value line-items.
The following table is a summary of the Fund's derivatives inclusive of potential netting arrangements.
| Counterparty | Value of Derivative Assets | Value of Derivative Liabilities | Collateral Received(a) | Collateral Pledged(a) | Net(b) |
| Barclays Bank PLC | $-- | $(3,598,593) | $-- | $3,598,593 | $-- |
| Canadian Imperial Bank Of Commerce | -- | (33,074,406) | -- | 33,074,406 | -- |
| Citibank, N.A. | -- | (22,748,078) | -- | 22,748,078 | -- |
| Credit Suisse International | -- | (15,601,621) | -- | 15,601,621 | -- |
| Goldman Sachs Bank USA | -- | (36,813,858) | -- | 36,813,858 | -- |
| JPMorgan Chase Bank, N.A. | -- | (24,526,514) | -- | 24,526,514 | -- |
| Macquarie Bank Ltd. | -- | (62,719,863) | -- | 62,719,863 | -- |
| Merrill Lynch International | -- | (22,953,576) | -- | 22,953,576 | -- |
| Morgan Stanley Capital Group, Inc. | -- | (4,435,130) | -- | 4,435,130 | -- |
| Royal Bank of Canada | -- | (51,287,091) | -- | 51,287,091 | -- |
| Societe Generale | -- | (31,782,896) | -- | 31,782,896 | -- |
| UBS AG | -- | (47,691,067) | -- | 47,691,067 | -- |
| Exchange Traded Futures | 15,287,635 | (65,352,719) | -- | 50,065,084 | -- |
| Total | $15,287,635 | $(422,585,412) | | | |
(a) Reflects collateral received from or pledged to an individual counterparty, excluding any excess or initial collateral amounts.
(b) Net represents the receivable / (payable) that would be due from / (to) the counterparty in an event of default. Netting may be allowed across transactions traded under the same legal agreement with the same legal entity. Please refer to Derivative Instruments - Risk Exposures and the Use of Derivative Instruments section in the accompanying Notes to Consolidated Financial Statements.
See accompanying notes which are an integral part of the consolidated financial statements.
Consolidated Financial Statements
Consolidated Statement of Assets and Liabilities
| | | January 31, 2020 (Unaudited) |
| Assets | | |
Investment in securities, at value — See accompanying schedule:
Unaffiliated issuers (cost $878,624,599) | $878,695,014 | |
| Fidelity Central Funds (cost $7,124,977,130) | 7,125,466,220 | |
| Total Investment in Securities (cost $8,003,601,729) | | $8,004,161,234 |
| Receivable for fund shares sold | | 556,853,996 |
| Distributions receivable from Fidelity Central Funds | | 9,774,344 |
| Prepaid expenses | | 6,250 |
| Total assets | | 8,570,795,824 |
| Liabilities | | |
| Payable for fund shares redeemed | $147,131 | |
| Bi-lateral OTC swaps, at value | 357,232,693 | |
| Payable for daily variation margin on futures contracts | 8,251,764 | |
| Other payables and accrued expenses | 4,906 | |
| Total liabilities | | 365,636,494 |
| Net Assets | | $8,205,159,330 |
| Net Assets consist of: | | |
| Paid in capital | | $8,736,723,925 |
| Total accumulated earnings (loss) | | (531,564,595) |
| Net Assets | | $8,205,159,330 |
| Net Asset Value, offering price and redemption price per share ($8,205,159,330 ÷ 1,860,188,729 shares) | | $4.41 |
See accompanying notes which are an integral part of the consolidated financial statements.
Consolidated Statement of Operations
| | | Six months ended January 31, 2020 (Unaudited) |
| Investment Income | | |
| Interest | | $7,056,404 |
| Income from Fidelity Central Funds | | 63,483,749 |
| Total income | | 70,540,153 |
| Expenses | | |
| Custodian fees and expenses | $4,050 | |
| Independent trustees' fees and expenses | 13,709 | |
| Subsidiary directors' fees | 7,500 | |
| Commitment fees | 8,925 | |
| Total expenses before reductions | 34,184 | |
| Expense reductions | (59) | |
| Total expenses after reductions | | 34,125 |
| Net investment income (loss) | | 70,506,028 |
| Realized and Unrealized Gain (Loss) | | |
| Net realized gain (loss) on: | | |
| Investment securities: | | |
| Unaffiliated issuers | (256) | |
| Futures contracts | 9,937,202 | |
| Swaps | (37,310,735) | |
| Total net realized gain (loss) | | (27,373,789) |
| Change in net unrealized appreciation (depreciation) on: | | |
| Investment securities: | | |
| Unaffiliated issuers | (39,194) | |
| Fidelity Central Funds | (1) | |
| Futures contracts | (56,389,301) | |
| Swaps | (302,641,533) | |
| Total change in net unrealized appreciation (depreciation) | | (359,070,029) |
| Net gain (loss) | | (386,443,818) |
| Net increase (decrease) in net assets resulting from operations | | $(315,937,790) |
See accompanying notes which are an integral part of the consolidated financial statements.
Consolidated Statement of Changes in Net Assets
| | Six months ended January 31, 2020 (Unaudited) | Year ended July 31, 2019 |
| Increase (Decrease) in Net Assets | | |
| Operations | | |
| Net investment income (loss) | $70,506,028 | $108,395,007 |
| Net realized gain (loss) | (27,373,789) | (501,551,214) |
| Change in net unrealized appreciation (depreciation) | (359,070,029) | 83,607,748 |
| Net increase (decrease) in net assets resulting from operations | (315,937,790) | (309,548,459) |
| Distributions to shareholders | (116,607,879) | (280,564,691) |
| Share transactions | | |
| Proceeds from sales of shares | 1,912,807,659 | 3,989,754,986 |
| Reinvestment of distributions | 115,842,978 | 280,564,691 |
| Cost of shares redeemed | (637,571,649) | (603,483,120) |
| Net increase (decrease) in net assets resulting from share transactions | 1,391,078,988 | 3,666,836,557 |
| Total increase (decrease) in net assets | 958,533,319 | 3,076,723,407 |
| Net Assets | | |
| Beginning of period | 7,246,626,011 | 4,169,902,604 |
| End of period | $8,205,159,330 | $7,246,626,011 |
| Other Information | | |
| Shares | | |
| Sold | 419,435,748 | 836,786,869 |
| Issued in reinvestment of distributions | 25,063,755 | 58,101,396 |
| Redeemed | (136,678,189) | (125,284,873) |
| Net increase (decrease) | 307,821,314 | 769,603,392 |
See accompanying notes which are an integral part of the consolidated financial statements.
Consolidated Financial Highlights
Fidelity Series Commodity Strategy Fund
| | Six months ended (Unaudited) January 31, | Years endedJuly 31, | | | | |
| | 2020 | 2019 | 2018 | 2017 | 2016 | 2015 |
| Selected Per–Share Data | | | | | | |
| Net asset value, beginning of period | $4.67 | $5.33 | $5.24 | $5.22 | $5.71 | $8.01 |
| Income from Investment Operations | | | | | | |
| Net investment income (loss)A | .04 | .11 | .08 | .01 | (.01) | (.03) |
| Net realized and unrealized gain (loss) | (.23) | (.41) | .04 | .01 | (.48) | (2.27) |
| Total from investment operations | (.19) | (.30) | .12 | .02 | (.49) | (2.30) |
| Distributions from net investment income | (.07) | (.09) | (.03) | – | – | – |
| Distributions from net realized gain | – | (.27) | – | – | – | – |
| Total distributions | (.07) | (.36) | (.03) | – | – | – |
| Net asset value, end of period | $4.41 | $4.67 | $5.33 | $5.24 | $5.22 | $5.71 |
| Total ReturnB,C | (4.11)% | (5.84)% | 2.27% | .38% | (8.58)% | (28.71)% |
| Ratios to Average Net AssetsD,E | | | | | | |
| Expenses before reductions | - %F,G | .01% | .05% | .56% | .65% | .64% |
| Expenses net of fee waivers, if any | - %F,G | .01% | .05% | .52% | .60% | .60% |
| Expenses net of all reductions | - %F,G | .01% | .05% | .52% | .60% | .60% |
| Net investment income (loss) | 1.83%F | 2.36% | 1.41% | .13% | (.28)% | (.48)% |
| Supplemental Data | | | | | | |
| Net assets, end of period (000 omitted) | $8,205,159 | $7,246,626 | $4,169,903 | $1,805,457 | $1,629,749 | $775,700 |
| Portfolio turnover rateH | 0% | 0% | 0% | 0% | 0% | 237% |
A Calculated based on average shares outstanding during the period.
B Total returns for periods of less than one year are not annualized.
C Total returns would have been lower if certain expenses had not been reduced during the applicable periods shown.
D Fees and expenses of any underlying Fidelity Central Funds are not included in the Fund's expense ratio. The Fund indirectly bears its proportionate share of the expenses of any underlying Fidelity Central Funds.
E Expense ratios reflect operating expenses of the Fund. Expenses before reductions do not reflect amounts reimbursed by the investment adviser or reductions from expense offset arrangements and do not represent the amount paid by the Fund during periods when reimbursements or reductions occur. Expenses net of fee waivers reflect expenses after reimbursement by the investment adviser but prior to reductions from expense offset arrangements. Expenses net of all reductions represent the net expenses paid by the Fund.
F Annualized
G Amount represents less than .005%.
H Amount does not include the portfolio activity of any underlying Fidelity Central Funds.
See accompanying notes which are an integral part of the consolidated financial statements.
Notes to Consolidated Financial Statements (Unaudited)
For the period ended January 31, 2020
1. Organization.
Fidelity Series Commodity Strategy Fund (the Fund) is a fund of Fidelity Oxford Street Trust (the Trust) and is authorized to issue an unlimited number of shares. Shares are offered only to certain other Fidelity funds and Fidelity managed 529 plans. The Trust is registered under the Investment Company Act of 1940, as amended (the 1940 Act), as an open-end management investment company organized as a Massachusetts business trust.
2. Consolidated Subsidiary.
The Fund invests in certain commodity-related investments through Geode Series Commodity Return Cayman Ltd., a wholly owned subsidiary (the "Subsidiary"). As of period end, the Fund held an investment of $721,730,695 in the Subsidiary, representing 8.8% of the Fund's net assets.
The financial statements have been consolidated and include accounts of the Fund and the Subsidiary. Accordingly, all inter-company transactions and balances have been eliminated.
3. Investments in Fidelity Central Funds.
The Fund invests in Fidelity Central Funds, which are open-end investment companies generally available only to other investment companies and accounts managed by Fidelity Management & Research Company LLC (FMR) and its affiliates. The Fund's Consolidated Schedule of Investments lists each of the Fidelity Central Funds held as of period end, if any, as an investment of the Fund, but does not include the underlying holdings of each Fidelity Central Fund. As an Investing Fund, the Fund indirectly bears its proportionate share of the expenses of the underlying Fidelity Central Funds.
The Money Market Central Funds seek preservation of capital and current income and are managed by FMR. Annualized expenses of the Money Market Central Funds as of their most recent shareholder report date ranged from less than .005% to .01%.
A complete unaudited list of holdings for each Fidelity Central Fund is available upon request or at the Securities and Exchange Commission (the SEC) website at www.sec.gov. In addition, the financial statements of the Fidelity Central Funds are available on the SEC website or upon request.
4. Significant Accounting Policies.
The Fund is an investment company and applies the accounting and reporting guidance of the Financial Accounting Standards Board (FASB) Accounting Standards Codification Topic 946 Financial Services – Investments Companies. The consolidated financial statements have been prepared in conformity with accounting principles generally accepted in the United States of America (GAAP), which require management to make certain estimates and assumptions at the date of the consolidated financial statements. Actual results could differ from those estimates. Subsequent events, if any, through the date that the consolidated financial statements were issued have been evaluated in the preparation of the consolidated financial statements. The following summarizes the significant accounting policies of the Fund:
Investment Valuation. Investments are valued as of 4:00 p.m. Eastern time on the last calendar day of the period. The Board of Trustees (the Board) has delegated the day to day responsibility for the valuation of the Fund's investments to the Fair Value Committee (the Committee) established by the Fund's investment adviser. In accordance with valuation policies and procedures approved by the Board, the Fund attempts to obtain prices from one or more third party pricing vendors or brokers to value its investments. When current market prices, quotations or currency exchange rates are not readily available or reliable, investments will be fair valued in good faith by the Committee, in accordance with procedures adopted by the Board. Factors used in determining fair value vary by investment type and may include market or investment specific events, changes in interest rates and credit quality. The frequency with which these procedures are used cannot be predicted and they may be utilized to a significant extent. The Committee oversees the Fund's valuation policies and procedures and reports to the Board on the Committee's activities and fair value determinations. The Board monitors the appropriateness of the procedures used in valuing the Fund's investments and ratifies the fair value determinations of the Committee.
The Fund categorizes the inputs to valuation techniques used to value its investments into a disclosure hierarchy consisting of three levels as shown below:
- Level 1 – quoted prices in active markets for identical investments
- Level 2 – other significant observable inputs (including quoted prices for similar investments, interest rates, prepayment speeds, etc.)
- Level 3 – unobservable inputs (including the Fund's own assumptions based on the best information available)
Valuation techniques used to value the Fund's investments by major category are as follows:
Debt securities, including restricted securities, are valued based on evaluated prices received from third party pricing vendors or from brokers who make markets in such securities. U.S. government and government agency obligations are valued by pricing vendors who utilize matrix pricing which considers yield or price of bonds of comparable quality, coupon, maturity and type or by broker-supplied prices. Swaps are marked-to-market daily based on valuations from third party pricing vendors, registered derivatives clearing organizations (clearinghouses) or broker-supplied valuations. These pricing sources may utilize inputs such as movements in the underlying index, interest rate curves, credit spread curves, default possibilities and recovery rates. When independent prices are unavailable or unreliable, debt securities and swaps may be valued utilizing pricing methodologies which consider similar factors that would be used by third party pricing vendors. Debt securities and swaps are generally categorized as Level 2 in the hierarchy but may be Level 3 depending on the circumstances.
Futures contracts are valued at the settlement price or official closing price established each day by the board of trade or exchange on which they are traded and are categorized as Level 1 in the hierarchy. Investments in open-end mutual funds, including the Fidelity Central Funds, are valued at their closing net asset value (NAV) each business day and are categorized as Level 1 in the hierarchy.
Changes in valuation techniques may result in transfers in or out of an assigned level within the disclosure hierarchy. The aggregate value of investments by input level as of January 31, 2020 is included at the end of the Fund's Consolidated Schedule of Investments.
Investment Transactions and Income. For financial reporting purposes, the Fund's investment holdings and NAV include trades executed through the end of the last business day of the period. The NAV per share for processing shareholder transactions is calculated as of the close of business of the New York Stock Exchange (NYSE), normally 4:00 p.m. Eastern time and includes trades executed through the end of the prior business day. Gains and losses on securities sold are determined on the basis of identified cost. Income and capital gain distributions from Fidelity Central Funds, if any, are recorded on the ex-dividend date. Interest income is accrued as earned and includes coupon interest and amortization of premium and accretion of discount on debt securities as applicable. Investment income is recorded net of foreign taxes withheld where recovery of such taxes is uncertain.
Expenses. Expenses directly attributable to a fund are charged to that fund. Expenses attributable to more than one fund are allocated among the respective funds on the basis of relative net assets or other appropriate methods. Expense estimates are accrued in the period to which they relate and adjustments are made when actual amounts are known.
Income Tax Information and Distributions to Shareholders. Each year, the Fund intends to qualify as a regulated investment company under Subchapter M of the Internal Revenue Code, including distributing substantially all of its taxable income and realized gains. As a result, no provision for U.S. Federal income taxes is required. The Fund files a U.S. federal tax return, in addition to state and local tax returns as required. The Fund's federal income tax returns are subject to examination by the Internal Revenue Service (IRS) for a period of three fiscal years after they are filed. State and local tax returns may be subject to examination for an additional fiscal year depending on the jurisdiction.
The Subsidiary is classified as a controlled foreign corporation under Subchapter N of the Internal Revenue Code. Therefore, the Fund is required to increase its taxable income by its share of the Subsidiary's income. Net investment losses of the Subsidiary cannot be deducted by the Fund in the current period nor carried forward to offset taxable income in future periods.
Distributions are declared and recorded on the ex-dividend date. Income and capital gain distributions are determined in accordance with income tax regulations, which may differ from GAAP.
Capital accounts within the consolidated financial statements are adjusted for permanent book-tax differences. These adjustments have no impact on net assets or the results of operations. Capital accounts are not adjusted for temporary book-tax differences which will reverse in a subsequent period.
Book-tax differences are primarily due to controlled foreign corporations and capital loss carryforwards.
As of period end, the cost and unrealized appreciation (depreciation) in securities, and derivatives if applicable, for federal income tax purposes on an unconsolidated basis were as follows:
| Gross unrealized appreciation | $489,090 |
| Gross unrealized depreciation | (4,133,847,767) |
| Net unrealized appreciation (depreciation) | $(4,133,358,677) |
| Tax cost | $11,872,276,959 |
Capital loss carryforwards are only available to offset future capital gains of the Fund to the extent provided by regulations and may be limited. The capital loss carryforward information presented below, including any applicable limitation, is estimated as of prior fiscal period end and is subject to adjustment.
| No expiration | |
| Short-term | $(85,585,204) |
| Long-term | (28,519,202) |
| Total capital loss carryforward | $(114,104,406) |
5. Derivative Instruments.
Risk Exposures and the Use of Derivative Instruments. The Fund's investment objective allows the Fund to enter into various types of derivative contracts, including futures contracts and swaps. Derivatives are investments whose value is primarily derived from underlying assets, indices or reference rates and may be transacted on an exchange or over-the-counter (OTC). Derivatives may involve a future commitment to buy or sell a specified asset based on specified terms, to exchange future cash flows at periodic intervals based on a notional principal amount, or for one party to make one or more payments upon the occurrence of specified events in exchange for periodic payments from the other party.
The Fund primarily used derivatives to increase returns, to gain exposure to certain types of assets and to manage exposure to certain risks as defined below. The success of any strategy involving derivatives depends on analysis of numerous economic factors, and if the strategies for investment do not work as intended, the Fund may not achieve its objectives.
The Fund's use of derivatives increased or decreased its exposure to the following risk:
| Commodity Risk | Commodity risk is the risk that the value of a commodity will fluctuate as a result of changes in market prices.
|
The Fund is also exposed to additional risks from investing in derivatives, such as liquidity risk and counterparty credit risk. Liquidity risk is the risk that the Fund will be unable to close out the derivative in the open market in a timely manner. Counterparty credit risk is the risk that the counterparty will not be able to fulfill its obligation to the Fund. Derivative counterparty credit risk is managed through formal evaluation of the creditworthiness of all potential counterparties. On certain OTC derivatives such as bi-lateral swaps, the Fund attempts to reduce its exposure to counterparty credit risk by entering into an International Swaps and Derivatives Association, Inc. (ISDA) Master Agreement with each of its counterparties. The ISDA Master Agreement gives the Fund the right to terminate all transactions traded under such agreement upon the deterioration in the credit quality of the counterparty beyond specified levels. The ISDA Master Agreement gives each party the right, upon an event of default by the other party or a termination of the agreement, to close out all transactions traded under such agreement and to net amounts owed under each transaction to one net payable by one party to the other. Upon entering into a swap, the Fund is required to post an initial collateral amount (referred to as "Independent Amount"), as defined in the ISDA Master Agreement. The Fund is required to post additional collateral for the benefit of counterparties to meet the counterparty's unrealized appreciation on outstanding swap contracts and any such posted collateral is identified on the Consolidated Schedule of Investments. To mitigate counterparty credit risk on bi-lateral OTC derivatives, the Fund receives collateral in the form of cash or securities once the Fund's net unrealized appreciation on outstanding derivative contracts under an ISDA Master Agreement exceeds certain applicable thresholds, subject to certain minimum transfer provisions. The collateral received is held in segregated accounts with the Fund's custodian bank in accordance with the collateral agreements entered into between the Fund, the counterparty and the Fund's custodian bank. The Fund could experience delays and costs in gaining access to the collateral even though it is held by the Fund's custodian bank. The Fund's maximum risk of loss from counterparty credit risk related to bi-lateral OTC derivatives is generally the aggregate unrealized appreciation and unpaid counterparty payments in excess of any collateral pledged by the counterparty to the Fund. Exchange-traded futures contracts are not covered by the ISDA Master Agreement; however counterparty credit risk related to exchange-traded futures contracts may be mitigated by the protection provided by the exchange's clearinghouse. A summary of the Fund's derivatives inclusive of potential netting arrangements is presented at the end of the Consolidated Schedule of Investments.
Investing in derivatives may involve greater risks than investing in the underlying assets directly and, to varying degrees, may involve risk of loss in excess of any initial investment and collateral received and amounts recognized in the Consolidated Statement of Assets and Liabilities. In addition, there may be the risk that the change in value of the derivative contract does not correspond to the change in value of the underlying instrument.
Net Realized Gain (Loss) and Change in Net Unrealized Appreciation (Depreciation) on Derivatives. The table below, which reflects the impacts of derivatives on the financial performance of the Fund, summarizes the net realized gain (loss) and change in net unrealized appreciation (depreciation) for derivatives during the period as presented in the Consolidated Statement of Operations.
| Primary Risk Exposure / Derivative Type | Net Realized Gain (Loss) | Change in Net Unrealized Appreciation (Depreciation) |
| Commodity Risk | | |
| Futures Contracts | $9,937,202 | $(56,389,301) |
| Swaps | (37,310,735) | (302,641,533) |
| Total Commodity Risk | $(27,373,533) | $(359,030,834) |
A summary of the value of derivatives by primary risk exposure as of period end is included at the end of the Consolidated Schedule of Investments.
Futures Contracts. A futures contract is an agreement between two parties to buy or sell a specified underlying instrument for a fixed price at a specified future date. The Fund used futures contracts to manage its exposure to the commodities market.
Upon entering into a futures contract, a fund is required to deposit either cash or securities (initial margin) with a clearing broker in an amount equal to a certain percentage of the face value of the contract. Futures contracts are marked-to-market daily and subsequent daily payments are made or received by a fund depending on the daily fluctuations in the value of the futures contracts and are recorded as unrealized appreciation or (depreciation). This receivable and/or payable, if any, is included in daily variation margin on futures contracts in the Consolidated Statement of Assets and Liabilities. Realized gain or (loss) is recorded upon the expiration or closing of a futures contract. The net realized gain (loss) and change in net unrealized appreciation (depreciation) on futures contracts during the period is presented in the Consolidated Statement of Operations.
Any open futures contracts at period end are presented in the Consolidated Schedule of Investments under the caption "Futures Contracts". The notional amount at value reflects each contract's exposure to the underlying instrument or index at period end. Securities deposited to meet initial margin requirements are identified in the Consolidated Schedule of Investments.
Swaps. A swap is a contract between two parties to exchange future cash flows at periodic intervals based on a notional principal amount. A bi-lateral OTC swap is a transaction between a fund and a dealer counterparty where cash flows are exchanged between the two parties for the life of the swap.
Bi-lateral OTC swaps are marked-to-market daily and changes in value are reflected in the Consolidated Statement of Assets and Liabilities in the bi-lateral OTC swaps at value line items. Any unamortized upfront premiums are presented in the Consolidated Schedule of Investments.
Payments are exchanged at specified intervals, accrued daily commencing with the effective date of the contract and recorded as realized gain or (loss). Some swaps may be terminated prior to the effective date and realize a gain or loss upon termination. The net realized gain (loss) and change in net unrealized appreciation (depreciation) on swaps during the period is presented in the Consolidated Statement of Operations.
Any open swaps at period end are included in the Consolidated Schedule of Investments under the caption "Swaps".
Total Return Swaps. Total return swaps are agreements between counterparties to exchange cash flows, one based on a market-linked return of an individual asset or a basket of assets (i.e., an index), and the other on a fixed or floating rate. To the extent the total return of the instrument or index underlying the transaction exceeds or falls short of the offsetting payment obligation, the Fund will receive a payment from or make a payment to the counterparty. The Fund entered into total return swaps to manage its commodities market exposure.
6. Fees and Other Transactions with Affiliates.
Management Fee and Administration Agreement. Geode Capital Management, LLC (the investment adviser) provides the Fund with investment management related services for which the Fund does not pay a management fee. Under the management contract, the investment adviser pays all ordinary operating expenses of the Fund, except custody fees, fees and expenses of the independent Trustees, and certain miscellaneous expenses such as proxy and shareholder meeting expenses.
FMR provides administrative services to the Fund and the investment adviser pays for these services.
The investment adviser also provides investment management services to the Subsidiary. The Subsidiary does not pay the investment adviser a fee for these services. The Subsidiary pays certain other expenses including custody and directors' fees.
Interfund Trades. The Fund may purchase from or sell securities to other Fidelity Funds under procedures adopted by the Board. The procedures have been designed to ensure these interfund trades are executed in accordance with Rule 17a-7 of the 1940 Act.
7. Committed Line of Credit.
The Fund participates with other funds managed by FMR or an affiliate in a $4.25 billion credit facility (the "line of credit") to be utilized for temporary or emergency purposes to fund shareholder redemptions or for other short-term liquidity purposes. The Fund has agreed to pay commitment fees on its pro-rata portion of the line of credit, which amounted to $8,925 and is reflected in Commitment fees on the Consolidated Statement of Operations. During the period, the Fund did not borrow on this line of credit.
8. Expense Reductions.
Through arrangements with the Fund's custodian, credits realized as a result of certain uninvested cash balances were used to reduce the Fund's expenses by $59.
9. Other.
The Fund's organizational documents provide former and current trustees and officers with a limited indemnification against liabilities arising in connection with the performance of their duties to the Fund. In the normal course of business, the Fund may also enter into contracts that provide general indemnifications. The Fund's maximum exposure under these arrangements is unknown as this would be dependent on future claims that may be made against the Fund. The risk of material loss from such claims is considered remote.
At the end of the period, mutual funds and accounts managed by FMR or its affiliates were the owners of record of all of the outstanding shares of the Fund.
Shareholder Expense Example
As a shareholder of the Fund, you incur two types of costs: (1) transaction costs and (2) ongoing costs, including management fees and other Fund expenses. This Example is intended to help you understand your ongoing costs (in dollars) of investing in the Fund and to compare these costs with the ongoing costs of investing in other mutual funds.
The Example is based on an investment of $1,000 invested at the beginning of the period and held for the entire period (August 1, 2019 to January 31, 2020).
Actual Expenses
The first line of the accompanying table provides information about actual account values and actual expenses. You may use the information in this line, together with the amount you invested, to estimate the expenses that you paid over the period. Simply divide your account value by $1,000.00 (for example, an $8,600 account value divided by $1,000.00 = 8.6), then multiply the result by the number in the first line under the heading entitled "Expenses Paid During Period" to estimate the expenses you paid on your account during this period. In addition, the Fund, as a shareholder in the underlying Fidelity Central Funds, will indirectly bear its pro-rata share of the fees and expenses incurred by the underlying Fidelity Central Funds. These fees and expenses are not included in the Fund's annualized expense ratio used to calculate the expense estimate in the table below.
Hypothetical Example for Comparison Purposes
The second line of the accompanying table provides information about hypothetical account values and hypothetical expenses based on the Fund's actual expense ratio and an assumed rate of return of 5% per year before expenses, which is not the Fund's actual return. The hypothetical account values and expenses may not be used to estimate the actual ending account balance or expenses you paid for the period. You may use this information to compare the ongoing costs of investing in the Fund and other funds. To do so, compare this 5% hypothetical example with the 5% hypothetical examples that appear in the shareholder reports of the other funds. In addition, the Fund, as a shareholder in the underlying Fidelity Central Funds, will indirectly bear its pro-rata share of the fees and expenses incurred by the underlying Fidelity Central Funds. These fees and expenses are not included in the Fund's annualized expense ratio used to calculate the expense estimate in the table below.
Please note that the expenses shown in the table are meant to highlight your ongoing costs only and do not reflect any transaction costs. Therefore, the second line of the table is useful in comparing ongoing costs only, and will not help you determine the relative total costs of owning different funds.
| | Annualized Expense Ratio-A | Beginning
Account Value
August 1, 2019 | Ending
Account Value
January 31, 2020 | Expenses Paid
During Period-B
August 1, 2019
to January 31, 2020 |
| Actual | - %-C | $1,000.00 | $958.90 | $--D |
| Hypothetical-E | | $1,000.00 | $1,025.14 | $--D |
A Annualized expense ratio reflects consolidated expenses net of applicable fee waivers.
B Expenses are equal to the Fund's annualized expense ratio, multiplied by the average account value over the period, multiplied by 184/366 (to reflect the one-half year period).
C Amount represents less than .005%.
D Amount represents less than $.005.
E 5% return per year before expenses
Board Approval of Investment Advisory Contracts and Management Fees
Fidelity Series Commodity Strategy Fund
Each year, the Board of Trustees, including the Independent Trustees (together, the Board), votes on the renewal of the management contract (the Advisory Contract) with Geode Capital Management, LLC (Geode) and the administration agreement with Fidelity Management & Research Company (FMR) for the fund. The Board, assisted by the advice of fund counsel and Independent Trustees' counsel, requests and considers a broad range of information relevant to the renewal of the Advisory Contract and administration agreement throughout the year.
The Board meets regularly and, at each of its meetings, covers an extensive agenda of topics and materials and considers factors that are relevant to its annual consideration of the renewal of the fund's Advisory Contract and administration agreement, including the services and support provided to the fund and its shareholders. The Board has established four standing committees (Committees) — Operations, Audit, Fair Valuation, and Governance and Nominating — each composed of and chaired by Independent Trustees with varying backgrounds, to which the Board has assigned specific subject matter responsibilities in order to enhance effective decision-making by the Board. The Operations Committee, of which all of the Independent Trustees are members, meets regularly throughout the year and considers, among other matters, information specifically related to the annual consideration of the renewal of the fund's Advisory Contract and administration agreement. The Board, acting directly and through its Committees, requests and receives information concerning the annual consideration of the renewal of the fund's Advisory Contract and administration agreement. The Board also meets as needed to review matters specifically related to the Board's annual consideration of the renewal of the Advisory Contract and administration agreement. Members of the Board may also meet with trustees of other Fidelity funds through joint ad hoc committees to discuss certain matters relevant to all of the Fidelity funds.
At its September 2019 meeting, the Board unanimously determined to renew the fund's Advisory Contract and administration agreement. In considering whether to renew the Advisory Contract for the fund, the Board considered all factors it believed relevant and reached a determination, with the assistance of fund counsel and Independent Trustees' counsel and through the exercise of its business judgment, that the renewal of the Advisory Contract was in the best interests of the fund and its shareholders and the fact that no fee is payable under the management contract was fair and reasonable.
Approval of Amended and Restated Advisory Contract. At its September 2019 meeting, the Board also unanimously determined to approve an amended and restated management contract with Geode (Amended and Restated Contract) in connection with an upcoming consolidation of certain of Fidelity's advisory businesses. The Board considered that, on or about January 1, 2020, after the expected consolidation of certain advisory entities, FMR expects to redomicile as a Delaware limited liability company. The Board noted that references to FMR in the Amended and Restated Contract would be updated to reflect FMR's new form of organization. The Board also approved amendments to the Advisory Contract that clarify that the fund pays its non-operating expenses, including brokerage commissions and fees and expenses associated with the fund's securities lending program, if applicable. The Board also noted Fidelity's assurance that neither the planned consolidation nor the Amended and Restated Contract will change the investment processes, the level or nature of services provided, the resources and personnel allocated, trading and compliance operations, or any fees or expenses paid by the fund.
Nature, Extent, and Quality of Services Provided. The Board considered staffing as it relates to the fund, including the backgrounds of investment personnel of Geode, and also considered the fund's investment objective, strategies, and related investment philosophy. The Independent Trustees also had discussions with representatives of Geode. The Board considered the structure of the investment personnel compensation program and whether this structure provides appropriate incentives to act in the best interests of the fund.
Resources Dedicated to Investment Management and Support Services. The Board reviewed the general qualifications and capabilities of Geode's investment staff, including its size, education, experience, and resources. The Board considered that Geode's investment professionals have extensive resources, tools and capabilities so as to provide competitive investment results over time, and that those professionals also have access to sophisticated tools that permit them to assess portfolio construction and risk and performance attribution characteristics continuously. The Board also noted the extensive resources devoted by Fidelity to providing non-advisory services to the fund. Additionally, in its deliberations, the Board considered Geode's trading, risk management, compliance, and technology and operations capabilities and resources, which are integral parts of the investment management process.
Administrative Services. The Board considered (i) the nature, extent, quality, and cost of administrative services performed by Fidelity under separate agreements covering administration, transfer agency, pricing and bookkeeping, and securities lending services for the fund; (ii) the nature and extent of the supervision of third party service providers, principally custodians, subcustodians, and pricing vendors; and (iii) the resources devoted to, and the record of compliance with, the fund's compliance policies and procedures.
Investment Performance. The Board considered whether the fund has operated in accordance with its investment objective, as well as its record of compliance with its investment restrictions. The Board reviewed the fund's absolute investment performance, as well as the fund's relative investment performance. In this regard, the Board noted that the fund is designed to offer an investment option for other investment companies and 529 plans managed by Fidelity and ultimately to enhance the performance of those investment companies and 529 plans.
Based on its review, the Board concluded that the nature, extent, and quality of services provided to the fund under the Advisory Contract should continue to benefit the shareholders of the fund.
Competitiveness of Management Fee and Total Expense Ratio. The Board considered that while the fund does not pay a management fee, FMRC pays Geode an asset-based management fee for providing services to the fund. The Board also noted that FMR or an affiliate undertakes to pay all operating expenses of the fund, except transfer agent fees, 12b-1 fees, Independent Trustee fees and expenses, custodian fees and expenses, proxy and shareholder meeting expenses, interest, taxes, brokerage expenses, and extraordinary expenses (such as litigation expenses).
The Board further considered that Geode has contractually agreed to reimburse the fund to the extent that total operating expenses (with certain exceptions), as a percentage of its average net assets, exceed 0.014% through November 30, 2022.
Based on its review, the Board concluded that the management fee received by Geode for providing services to the fund and the fund's total expense ratio were reasonable in light of the services that the fund and its shareholders receive and the other factors considered.
Costs of the Services and Profitability. The Board considered the revenues earned and the expenses incurred by Geode in managing the fund and Fidelity in conducting the business of developing, marketing, distributing, administering and servicing the fund and servicing the fund's shareholders. The Board also considered the level of Fidelity's profits in respect of all the Fidelity funds.
On an annual basis, Geode presents to the Board information about the profitability of its relationship with the fund. In addition, PricewaterhouseCoopers LLP (PwC), auditor to Fidelity and certain Fidelity funds, has been engaged annually by the Board as part of the Board's assessment of Fidelity's profitability analysis. PwC's engagement includes the review and assessment of the methodologies used by Fidelity in determining the revenues and expenses attributable to Fidelity's mutual fund business, and completion of agreed-upon procedures in respect of the mathematical accuracy of the fund profitability information and its conformity to established allocation methodologies. After considering PwC's reports issued under the engagement and information provided by Fidelity, the Board concluded that while other allocation methods may also be reasonable, Fidelity's profitability methodologies are reasonable in all material respects.
The Board also reviewed Fidelity's and Geode's non-fund businesses and potential indirect benefits such businesses may have received as a result of their association with Fidelity's mutual fund business (i.e., fall-out benefits) as well as cases where Fidelity's and Geode's affiliates may benefit from the fund's business. The Board noted that changes to fall-out benefits year-over-year reflect business developments at Fidelity's and Geode's various businesses. The Board considered that a joint ad hoc committee created by it and the boards of other Fidelity funds had recently been established, and meets periodically, to evaluate potential fall-out benefits. The Board noted that the committee was expected to, among other things: (i) discuss the legal framework surrounding potential fall-out benefits; (ii) review the Board's responsibilities and approach to potential fall-out benefits; and (iii) review practices employed by competitor funds regarding the review of potential fall-out benefits. The Board noted that it would consider the committee's findings in connection with future consideration of contract renewals.
The Board concluded that the costs of the services provided by and the profits realized by Geode and Fidelity in connection with the operation of the fund were not relevant to the renewal of the Advisory Contract because the fund pays no advisory fees and FMR or an affiliate bears all expenses of the fund, with limited exceptions.
Economies of Scale. The Board concluded that because the fund pays no advisory fees and FMR or an affiliate bears all expenses of the fund with certain limited exceptions, the realization of economies of scale was not a material factor in the Board's decision to renew the fund's Advisory Contract.
Additional Information Requested by the Board. In order to develop fully the factual basis for consideration of the Fidelity funds' advisory contracts, the Board requested and received additional information on certain topics, including: (i) Fidelity's fund profitability methodology, profitability trends for certain funds, the allocation of various costs to different funds, and the impact of certain factors on fund profitability results; (ii) portfolio manager changes that have occurred during the past year and the amount of the investment that each portfolio manager has made in the Fidelity fund(s) that he or she manages; (iii) Fidelity's compensation structure for portfolio managers, research analysts, and other key personnel, including its effects on fund profitability, the rationale for the compensation structure, and the extent to which current market conditions have affected retention and recruitment; (iv) the arrangements with and compensation paid to certain fund sub-advisers on behalf of the Fidelity funds and the treatment of such compensation within Fidelity's fund profitability methodology; (v) the practices of certain sub-advisers regarding their receipt of research from broker-dealers that execute the funds' portfolio transactions; (vi) the terms of Fidelity's voluntary expense limitation agreements; (vii) the methodology with respect to competitive fund data and peer group classifications; (viii) Fidelity's transfer agent fee, expense, and service structures for different funds and classes relative to competitive trends, and the impact of the increased use of omnibus accounts; (ix) new developments in the retail and institutional marketplaces and the competitive positioning of the funds relative to other investment products and services; (x) the impact on fund profitability of recent changes in total net assets for Fidelity's money market funds, anticipated changes to the competitive landscape for money market funds, and the level of investor comfort with gates, fees, and floating NAVs; (xi) the funds' share class structures and distribution channels; and (xii) explanations regarding the relative total expense ratios of certain funds and classes, total expense competitive trends and methodologies for total expense competitive comparisons, and actions that might be taken by Fidelity to reduce total expense ratios for certain classes. In addition, the Board considered its discussions with Fidelity throughout the year regarding enhanced information security initiatives and the funds' fair valuation policies.
Based on its evaluation of all of the conclusions noted above, and after considering all factors it believed relevant, the Board concluded that the advisory fee arrangements are fair and reasonable, and that the fund's Advisory Contract should be renewed and the fund's Amended and Restated Contract should be approved.

SCR-S-SANN-0320
1.899302.110
Fidelity® Commodity Strategy Fund
Semi-Annual Report
January 31, 2020
See the inside front cover for important information about access to your fund’s shareholder reports.
Beginning on January 1, 2021, as permitted by regulations adopted by the Securities and Exchange Commission, paper copies of a fund’s shareholder reports will no longer be sent by mail, unless you specifically request paper copies of the reports from the fund or from your financial intermediary, such as a financial advisor, broker-dealer or bank. Instead, the reports will be made available on a website, and you will be notified by mail each time a report is posted and provided with a website link to access the report.
If you already elected to receive shareholder reports electronically, you will not be affected by this change and you need not take any action. You may elect to receive shareholder reports and other communications from a fund electronically, by contacting your financial intermediary. For Fidelity customers, visit Fidelity's web site or call Fidelity using the contact information listed below.
You may elect to receive all future reports in paper free of charge. If you wish to continue receiving paper copies of your shareholder reports, you may contact your financial intermediary or, if you are a Fidelity customer, visit Fidelity’s website, or call Fidelity at the applicable toll-free number listed below. Your election to receive reports in paper will apply to all funds held with the fund complex/your financial intermediary.
| Account Type | Website | Phone Number |
| Brokerage, Mutual Fund, or Annuity Contracts: | fidelity.com/mailpreferences | 1-800-343-3548 |
| Employer Provided Retirement Accounts: | netbenefits.fidelity.com/preferences (choose 'no' under Required Disclosures to continue to print) | 1-800-343-0860 |
| Advisor Sold Accounts Serviced Through Your Financial Intermediary: | Contact Your Financial Intermediary | Your Financial Intermediary's phone number |
| Advisor Sold Accounts Serviced by Fidelity: | institutional.fidelity.com | 1-877-208-0098 |
Contents
To view a fund's proxy voting guidelines and proxy voting record for the 12-month period ended June 30, visit http://www.fidelity.com/proxyvotingresults or visit the Securities and Exchange Commission's (SEC) web site at http://www.sec.gov.
You may also call 1-800-544-8544 to request a free copy of the proxy voting guidelines.
Standard & Poor's, S&P and S&P 500 are registered service marks of The McGraw-Hill Companies, Inc. and have been licensed for use by Fidelity Distributors Corporation.
Other third-party marks appearing herein are the property of their respective owners.
All other marks appearing herein are registered or unregistered trademarks or service marks of FMR LLC or an affiliated company. © 2020 FMR LLC. All rights reserved.
This report and the financial statements contained herein are submitted for the general information of the shareholders of the Fund. This report is not authorized for distribution to prospective investors in the Fund unless preceded or accompanied by an effective prospectus.
A fund files its complete schedule of portfolio holdings with the SEC for the first and third quarters of each fiscal year on Form N-PORT. Forms N-PORT are available on the SEC’s web site at http://www.sec.gov. A fund's Forms N-PORT may be reviewed and copied at the SEC’s Public Reference Room in Washington, DC. Information regarding the operation of the SEC's Public Reference Room may be obtained by calling 1-800-SEC-0330.
For a complete list of a fund's portfolio holdings, view the most recent holdings listing, semiannual report, or annual report on Fidelity's web site at http://www.fidelity.com, http://www.institutional.fidelity.com, or http://www.401k.com, as applicable.
NOT FDIC INSURED •MAY LOSE VALUE •NO BANK GUARANTEE
Neither the Fund nor Fidelity Distributors Corporation is a bank.
Consolidated Investment Summary (Unaudited)
The information in the following tables is based on the Fund's commodity- linked investments and excludes short-term investment-grade debt securities, cash and cash equivalents.
Commodity Instruments as of January 31, 2020*
| % of fund’s total commodity-linked investments |
| | Commodity Futures | 100.0% |

Commodity Sector Diversification as of January 31, 2020*
| % of fund’s total commodity-linked investments |
| | Agriculture | 30.4% |
| | Energy | 27.2% |
| | Precious Metals | 19.1% |
| | Industrial Metals | 17.4% |
| | Livestock | 5.9% |

* The Fund does not invest directly in physical commodities.
Consolidated Schedule of Investments January 31, 2020 (Unaudited)
Showing Percentage of Net Assets
| U.S. Treasury Obligations - 11.5% | | | |
| | | Principal Amount | Value |
| U.S. Treasury Bills, yield at date of purchase 1.53% 2/6/20 to 2/20/20(a) | | | |
| (Cost $2,798,343) | | 2,800,000 | 2,798,626 |
| | | Shares | Value |
|
| Money Market Funds - 89.1% | | | |
| Fidelity Cash Central Fund 1.58% (b) | | | |
| (Cost $21,662,256) | | 21,657,925 | 21,662,256 |
| TOTAL INVESTMENT IN SECURITIES - 100.6% | | | |
| (Cost $24,460,599) | | | 24,460,882 |
| NET OTHER ASSETS (LIABILITIES) - (0.6)% | | | (144,397) |
| NET ASSETS - 100% | | | $24,316,485 |
| Futures Contracts | | | | | |
| | Number of contracts | Expiration Date | Notional Amount | Value | Unrealized Appreciation/(Depreciation) |
| Purchased | | | | | |
| Commodity Futures Contracts | | | | | |
| CBOT Corn Contracts (United States) | 80 | March 2020 | $1,525,000 | $(15,964) | $(15,964) |
| CBOT KC HRW Wheat Contracts (United States) | 16 | March 2020 | 372,400 | 12,410 | 12,410 |
| CBOT Soybean Contracts (United States) | 31 | March 2020 | 1,352,375 | (65,104) | (65,104) |
| CBOT Soybean Meal Contracts (United States) | 29 | March 2020 | 843,900 | (30,610) | (30,610) |
| CBOT Soybean Oil Contracts (United States) | 37 | March 2020 | 664,668 | (41,100) | (41,100) |
| CBOT Wheat Contracts (United States) | 29 | March 2020 | 802,938 | 47,635 | 47,635 |
| CME Lean Hogs Contracts (United States) | 17 | April 2020 | 418,880 | (87,561) | (87,561) |
| CME Live Cattle Contracts (United States) | 21 | April 2020 | 1,005,270 | (66,231) | (66,231) |
| COMEX Copper Contracts (United States) | 26 | March 2020 | 1,635,725 | (109,042) | (109,042) |
| COMEX Gold 100 oz. Contracts (United States) | 23 | April 2020 | 3,659,070 | 70,062 | 70,062 |
| COMEX Silver Contracts (United States) | 11 | March 2020 | 991,100 | 53,018 | 53,018 |
| ICE Brent Crude Contracts (United Kingdom) | 27 | March 2020 | 1,523,880 | (191,991) | (191,991) |
| ICE Coffee 'C' Contracts (United States) | 16 | March 2020 | 615,900 | (73,368) | (73,368) |
| ICE Cotton No. 2 Contracts (United States) | 11 | March 2020 | 371,250 | 1,562 | 1,562 |
| ICE Low Sulphur Gasoil Contracts (United States) | 11 | March 2020 | 549,725 | (99,125) | (99,125) |
| ICE Sugar No. 11 Contracts (United States) | 52 | March 2020 | 850,886 | 129,642 | 129,642 |
| LME Aluminum Contracts (United Kingdom) | 25 | March 2020 | 1,069,375 | (39,765) | (39,765) |
| LME Nickel Contracts (United Kingdom) | 9 | March 2020 | 691,875 | (44,199) | (44,199) |
| LME Zinc Contracts (United Kingdom) | 15 | March 2020 | 826,875 | (28,382) | (28,382) |
| NYMEX Gasoline RBOB Contracts (United States) | 8 | March 2020 | 502,824 | (53,737) | (53,737) |
| NYMEX Natural Gas Contracts (United States) | 97 | Feb. 2020 | 1,785,770 | (349,060) | (349,060) |
| NYMEX NY Harbor ULSD Contracts (United States) | 7 | March 2020 | 478,779 | (98,439) | (98,439) |
| NYMEX WTI Crude Oil Contracts (United States) | 34 | Feb. 2020 | 1,755,080 | (250,359) | (250,359) |
| TOTAL FUTURES CONTRACTS | | | | | $(1,329,708) |
The notional amount of futures purchased as a percentage of Net Assets is 99.9%
For the period, the average monthly notional amount at value for futures contracts in the aggregate was $35,415,655.
Legend
(a) Security or a portion of the security was pledged to cover margin requirements for futures contracts. At period end, the value of securities pledged amounted to $1,679,830.
(b) Affiliated fund that is generally available only to investment companies and other accounts managed by Fidelity Investments. The rate quoted is the annualized seven-day yield of the fund at period end. A complete unaudited listing of the fund's holdings as of its most recent quarter end is available upon request. In addition, each Fidelity Central Fund's financial statements are available on the SEC's website or upon request.
Affiliated Central Funds
Information regarding fiscal year to date income earned by the Fund from investments in Fidelity Central Funds is as follows:
| Fund | Income earned |
| Fidelity Cash Central Fund | $2,431,497 |
| Total | $2,431,497 |
Amounts in the income column in the above table include any capital gain distributions from underlying funds, which are presented in the corresponding line-item in the Consolidated Statement of Operations, if applicable.
Consolidated Subsidiary
| Fund | Value, beginning of period | Purchases | Sales Proceeds | Dividend Income | Realized Gain/Loss | Change in Unrealized appreciation (depreciation) | Value, end of period |
| Geode Commodity Strategy Cayman Ltd. | $58,337,894 | $8,999,992 | $64,000,093 | $-- | $(21,461,646) | $21,032,116 | $2,908,263 |
Investment Valuation
The following is a summary of the inputs used, as of January 31, 2020, involving the Fund's assets and liabilities carried at fair value. The inputs or methodology used for valuing securities may not be an indication of the risk associated with investing in those securities. For more information on valuation inputs, and their aggregation into the levels used below, please refer to the Investment Valuation section in the accompanying Notes to Consolidated Financial Statements.
| | Valuation Inputs at Reporting Date: |
| Description | Total | Level 1 | Level 2 | Level 3 |
| Investments in Securities: | | | | |
| U.S. Government and Government Agency Obligations | $2,798,626 | $-- | $2,798,626 | $-- |
| Money Market Funds | 21,662,256 | 21,662,256 | -- | -- |
| Total Investments in Securities: | $24,460,882 | $21,662,256 | $2,798,626 | $-- |
| Derivative Instruments: | | | | |
| Assets | | | | |
| Futures Contracts | $314,329 | $314,329 | $-- | $-- |
| Total Assets | $314,329 | $314,329 | $-- | $-- |
| Liabilities | | | | |
| Futures Contracts | $(1,644,037) | $(1,644,037) | $-- | $-- |
| Total Liabilities | $(1,644,037) | $(1,644,037) | $-- | $-- |
| Total Derivative Instruments: | $(1,329,708) | $(1,329,708) | $-- | $-- |
Value of Derivative Instruments
The following table is a summary of the Fund's value of derivative instruments by primary risk exposure as of January 31, 2020. For additional information on derivative instruments, please refer to the Derivative Instruments section in the accompanying Notes to Consolidated Financial Statements.
| Primary Risk Exposure / Derivative Type | Value |
| | Asset | Liability |
| Commodity Risk | | |
| Futures Contracts(a) | $314,329 | $(1,644,037) |
| Total Commodity Risk | 314,329 | (1,644,037) |
| Total Value of Derivatives | $314,329 | $(1,644,037) |
(a) Reflects gross cumulative appreciation (depreciation) on futures contracts as presented in the Consolidated Schedule of Investments. In the Consolidated Statement of Assets and Liabilities, the period end daily variation margin is included in receivable or payable for daily variation margin on futures contracts, and the net cumulative appreciation (depreciation) is included in Total accumulated earnings (loss).
The following table is a summary of the Fund's derivatives inclusive of potential netting arrangements.
| Counterparty | Value of Derivative Assets | Value of Derivative Liabilities | Collateral Received(a) | Collateral Pledged(a) | Net(b) |
| Exchange Traded Futures | $314,329 | $(1,644,037) | $-- | $1,329,708 | $-- |
| Total | $314,329 | $(1,644,037) | | | |
(a) Reflects collateral received from or pledged to an individual counterparty, excluding any excess or initial collateral amounts.
(b) Net represents the receivable / (payable) that would be due from / (to) the counterparty in an event of default. Netting may be allowed across transactions traded under the same legal agreement with the same legal entity. Please refer to Derivative Instruments - Risk Exposures and the Use of Derivative Instruments section in the accompanying Notes to Consolidated Financial Statements.
See accompanying notes which are an integral part of the consolidated financial statements.
Consolidated Financial Statements
Consolidated Statement of Assets and Liabilities
| | | January 31, 2020 (Unaudited) |
| Assets | | |
Investment in securities, at value — See accompanying schedule:
Unaffiliated issuers (cost $2,798,343) | $2,798,626 | |
| Fidelity Central Funds (cost $21,662,256) | 21,662,256 | |
| Total Investment in Securities (cost $24,460,599) | | $24,460,882 |
| Cash | | 46,967 |
| Receivable for fund shares sold | | 985 |
| Distributions receivable from Fidelity Central Funds | | 30,901 |
| Prepaid expenses | | 6,250 |
| Total assets | | 24,545,985 |
| Liabilities | | |
| Accrued management fee | $8,571 | |
| Payable for daily variation margin on futures contracts | 215,592 | |
| Other affiliated payables | 4,285 | |
| Other payables and accrued expenses | 1,052 | |
| Total liabilities | | 229,500 |
| Net Assets | | $24,316,485 |
| Net Assets consist of: | | |
| Paid in capital | | $28,004,275 |
| Total accumulated earnings (loss) | | (3,687,790) |
| Net Assets | | $24,316,485 |
| Net Asset Value and Maximum Offering Price | | |
| Net Asset Value, offering price and redemption price per share ($24,316,485 ÷ 3,150,276 shares) | | $7.72 |
See accompanying notes which are an integral part of the consolidated financial statements.
Consolidated Statement of Operations
| | | Six months ended January 31, 2020 (Unaudited) |
| Investment Income | | |
| Interest | | $275,025 |
| Income from Fidelity Central Funds | | 2,431,497 |
| Total income | | 2,706,522 |
| Expenses | | |
| Management fee | $502,900 | |
| Transfer agent fees | 251,450 | |
| Custodian fees and expenses | 897 | |
| Independent trustees' fees and expenses | 768 | |
| Subsidiary directors' fees | 7,500 | |
| Total expenses before reductions | 763,515 | |
| Expense reductions | (992) | |
| Total expenses after reductions | | 762,523 |
| Net investment income (loss) | | 1,943,999 |
| Realized and Unrealized Gain (Loss) | | |
| Net realized gain (loss) on: | | |
| Investment securities: | | |
| Unaffiliated issuers | 17,434 | |
| Futures contracts | (172,289) | |
| Swaps | (2,359,472) | |
| Total net realized gain (loss) | | (2,514,327) |
| Change in net unrealized appreciation (depreciation) on: | | |
| Investment securities: | | |
| Unaffiliated issuers | (13,638) | |
| Futures contracts | (2,082,194) | |
| Swaps | 3,878,189 | |
| Total change in net unrealized appreciation (depreciation) | | 1,782,357 |
| Net gain (loss) | | (731,970) |
| Net increase (decrease) in net assets resulting from operations | | $1,212,029 |
See accompanying notes which are an integral part of the consolidated financial statements.
Consolidated Statement of Changes in Net Assets
| | Six months ended January 31, 2020 (Unaudited) | Year ended July 31, 2019 |
| Increase (Decrease) in Net Assets | | |
| Operations | | |
| Net investment income (loss) | $1,943,999 | $7,616,159 |
| Net realized gain (loss) | (2,514,327) | (48,483,434) |
| Change in net unrealized appreciation (depreciation) | 1,782,357 | 9,795,896 |
| Net increase (decrease) in net assets resulting from operations | 1,212,029 | (31,071,379) |
| Distributions to shareholders | (5,794,784) | (36,621,149) |
| Share transactions - net increase (decrease) | (574,779,860) | 181,233,676 |
| Total increase (decrease) in net assets | (579,362,615) | 113,541,148 |
| Net Assets | | |
| Beginning of period | 603,679,100 | 490,137,952 |
| End of period | $24,316,485 | $603,679,100 |
See accompanying notes which are an integral part of the consolidated financial statements.
Consolidated Financial Highlights
Fidelity Commodity Strategy Fund
| | Six months ended (Unaudited) January 31, | Years endedJuly 31, | | |
| | 2020 | 2019 | 2018 | 2017 A |
| Selected Per–Share Data | | | | |
| Net asset value, beginning of period | $8.63 | $10.29 | $10.15 | $10.00 |
| Income from Investment Operations | | | | |
| Net investment income (loss)B | .07 | .16 | .09 | .01 |
| Net realized and unrealized gain (loss) | (.40) | (.78) | .09 | .14 |
| Total from investment operations | (.33) | (.62) | .18 | .15 |
| Distributions from net investment income | (.58) | (.21) | (.02) | – |
| Distributions from net realized gain | – | (.83) | (.02) | – |
| Total distributions | (.58) | (1.04) | (.04) | – |
| Net asset value, end of period | $7.72 | $8.63 | $10.29 | $10.15 |
| Total ReturnC,D | (4.15)% | (6.32)% | 1.76% | 1.50% |
| Ratios to Average Net AssetsE,F | | | | |
| Expenses before reductions | .60%G | .61% | .65% | .65%G |
| Expenses net of fee waivers, if any | .60%G | .60% | .60% | .60%G |
| Expenses net of all reductions | .60%G | .60% | .60% | .60%G |
| Net investment income (loss) | 1.54%G | 1.78% | .83% | .44%G |
| Supplemental Data | | | | |
| Net assets, end of period (000 omitted) | $24,316 | $603,679 | $362,178 | $422,999 |
| Portfolio turnover rateH | 0% | 0% | 0% | 0% |
A For the period May 30, 2017 (commencement of operations) to July 31, 2017.
B Calculated based on average shares outstanding during the period.
C Total returns for periods of less than one year are not annualized.
D Total returns would have been lower if certain expenses had not been reduced during the applicable periods shown.
E Fees and expenses of any underlying Fidelity Central Funds are not included in the Fund's expense ratio. The Fund indirectly bears its proportionate share of the expenses of any underlying Fidelity Central Funds.
F Expense ratios reflect operating expenses of the Fund. Expenses before reductions do not reflect amounts reimbursed by the investment adviser or reductions from expense offset arrangements and do not represent the amount paid by the Fund during periods when reimbursements or reductions occur. Expense ratios before reductions for start-up periods may not be representative of longer-term operating periods. Expenses net of fee waivers reflect expenses after reimbursement by the investment adviser but prior to reductions from expense offset arrangements. Expenses net of all reductions represent the net expenses paid by the Fund.
G Annualized
H Amount does not include the portfolio activity of any underlying Fidelity Central Funds.
See accompanying notes which are an integral part of the consolidated financial statements.
Notes to Consolidated Financial Statements (Unaudited)
For the period ended January 31, 2020
1. Organization.
Fidelity Commodity Strategy Fund (the Fund) is a non-diversified fund of Fidelity Oxford Street Trust (the Trust) and is authorized to issue an unlimited number of shares. The Trust is registered under the Investment Company Act of 1940, as amended (the 1940 Act), as an open-end management investment company organized as a Massachusetts business trust. Effective September 7, 2018, the Fund no longer offered Class F, and all outstanding shares of Class F were exchanged for shares of Fidelity Commodity Strategy.
2. Consolidated Subsidiary.
The Fund invests in certain commodity-related investments through Geode Commodity Strategy Cayman Ltd., a wholly owned subsidiary (the "Subsidiary"). As of period end, the Fund held an investment of $2,908,263 in the Subsidiary, representing 12.0% of the Fund's net assets.
The financial statements have been consolidated and include accounts of the Fund and the Subsidiary. Accordingly, all inter-company transactions and balances have been eliminated.
3. Investments in Fidelity Central Funds.
The Fund invests in Fidelity Central Funds, which are open-end investment companies generally available only to other investment companies and accounts managed by Fidelity Management & Research Company LLC (FMR) and its affiliates. The Fund's Consolidated Schedule of Investments lists each of the Fidelity Central Funds held as of period end, if any, as an investment of the Fund, but does not include the underlying holdings of each Fidelity Central Fund. As an Investing Fund, the Fund indirectly bears its proportionate share of the expenses of the underlying Fidelity Central Funds.
The Money Market Central Funds seek preservation of capital and current income and are managed by FMR. Annualized expenses of the Money Market Central Funds as of their most recent shareholder report date ranged from less than .005% to .01%.
A complete unaudited list of holdings for each Fidelity Central Fund is available upon request or at the Securities and Exchange Commission (the SEC) website at www.sec.gov. In addition, the financial statements of the Fidelity Central Funds are available on the SEC website or upon request.
4. Significant Accounting Policies.
The Fund is an investment company and applies the accounting and reporting guidance of the Financial Accounting Standards Board (FASB) Accounting Standards Codification Topic 946 Financial Services – Investments Companies. The consolidated financial statements have been prepared in conformity with accounting principles generally accepted in the United States of America (GAAP), which require management to make certain estimates and assumptions at the date of the consolidated financial statements. Actual results could differ from those estimates. Subsequent events, if any, through the date that the consolidated financial statements were issued have been evaluated in the preparation of the consolidated financial statements. The following summarizes the significant accounting policies of the Fund:
Investment Valuation. Investments are valued as of 4:00 p.m. Eastern time on the last calendar day of the period. The Board of Trustees (the Board) has delegated the day to day responsibility for the valuation of the Fund's investments to the Fair Value Committee (the Committee) established by the Fund's investment adviser. In accordance with valuation policies and procedures approved by the Board, the Fund attempts to obtain prices from one or more third party pricing vendors or brokers to value its investments. When current market prices, quotations or currency exchange rates are not readily available or reliable, investments will be fair valued in good faith by the Committee, in accordance with procedures adopted by the Board. Factors used in determining fair value vary by investment type and may include market or investment specific events, changes in interest rates and credit quality. The frequency with which these procedures are used cannot be predicted and they may be utilized to a significant extent. The Committee oversees the Fund's valuation policies and procedures and reports to the Board on the Committee's activities and fair value determinations. The Board monitors the appropriateness of the procedures used in valuing the Fund's investments and ratifies the fair value determinations of the Committee.
The Fund categorizes the inputs to valuation techniques used to value its investments into a disclosure hierarchy consisting of three levels as shown below:
- Level 1 – quoted prices in active markets for identical investments
- Level 2 – other significant observable inputs (including quoted prices for similar investments, interest rates, prepayment speeds, etc.)
- Level 3– unobservable inputs (including the Fund's own assumptions based on the best information available)
Valuation techniques used to value the Fund's investments by major category are as follows:
Debt securities, including restricted securities, are valued based on evaluated prices received from third party pricing vendors or from brokers who make markets in such securities. U.S. government and government agency obligations are valued by pricing vendors who utilize matrix pricing which considers yield or price of bonds of comparable quality, coupon, maturity and type or by broker-supplied prices. When independent prices are unavailable or unreliable, debt securities may be valued utilizing pricing methodologies which consider similar factors that would be used by third party pricing vendors. Debt securities are generally categorized as Level 2 in the hierarchy but may be Level 3 depending on the circumstances.
Futures contracts are valued at the settlement price or official closing price established each day by the board of trade or exchange on which they are traded and are categorized as Level 1 in the hierarchy. Investments in open-end mutual funds, including the Fidelity Central Funds, are valued at their closing net asset value (NAV) each business day and are categorized as Level 1 in the hierarchy.
Changes in valuation techniques may result in transfers in or out of an assigned level within the disclosure hierarchy. The aggregate value of investments by input level as of January 31, 2020 is included at the end of the Fund's Consolidated Schedule of Investments.
Investment Transactions and Income. For financial reporting purposes, the Fund's investment holdings and NAV include trades executed through the end of the last business day of the period. The NAV per share for processing shareholder transactions is calculated as of the close of business of the New York Stock Exchange (NYSE), normally 4:00 p.m. Eastern time and includes trades executed through the end of the prior business day. Gains and losses on securities sold are determined on the basis of identified cost. Income and capital gain distributions from Fidelity Central Funds, if any, are recorded on the ex-dividend date. Interest income is accrued as earned and includes coupon interest and amortization of premium and accretion of discount on debt securities as applicable. Investment income is recorded net of foreign taxes withheld where recovery of such taxes is uncertain.
Expenses. Expenses directly attributable to a fund are charged to that fund. Expenses attributable to more than one fund are allocated among the respective funds on the basis of relative net assets or other appropriate methods. Expense estimates are accrued in the period to which they relate and adjustments are made when actual amounts are known.
Income Tax Information and Distributions to Shareholders. Each year, the Fund intends to qualify as a regulated investment company under Subchapter M of the Internal Revenue Code, including distributing substantially all of its taxable income and realized gains. As a result, no provision for U.S. Federal income taxes is required. The Fund files a U.S. federal tax return, in addition to state and local tax returns as required. The Fund's federal income tax returns are subject to examination by the Internal Revenue Service (IRS) for a period of three fiscal years after they are filed. State and local tax returns may be subject to examination for an additional fiscal year depending on the jurisdiction.
The Subsidiary is classified as a controlled foreign corporation under Subchapter N of the Internal Revenue Code. Therefore, the Fund is required to increase its taxable income by its share of the Subsidiary's income. Net investment losses of the Subsidiary cannot be deducted by the Fund in the current period nor carried forward to offset taxable income in future periods.
Distributions are declared and recorded on the ex-dividend date. Income and capital gain distributions are determined in accordance with income tax regulations, which may differ from GAAP.
Capital accounts within the consolidated financial statements are adjusted for permanent book-tax differences. These adjustments have no impact on net assets or the results of operations. Capital accounts are not adjusted for temporary book-tax differences which will reverse in a subsequent period.
Book-tax differences are primarily due to controlled foreign corporations.
As of period end, the cost and unrealized appreciation (depreciation) in securities, and derivatives if applicable, for federal income tax purposes on an unconsolidated basis were as follows:
| Gross unrealized appreciation | $– |
| Gross unrealized depreciation | (50,602,577) |
| Net unrealized appreciation (depreciation) | $(50,602,577) |
| Tax cost | $74,855,287 |
5. Derivative Instruments.
Risk Exposures and the Use of Derivative Instruments. The Fund's investment objective allows the Fund to enter into various types of derivative contracts, including futures contracts and swaps. Derivatives are investments whose value is primarily derived from underlying assets, indices or reference rates and may be transacted on an exchange or over-the-counter (OTC). Derivatives may involve a future commitment to buy or sell a specified asset based on specified terms, to exchange future cash flows at periodic intervals based on a notional principal amount, or for one party to make one or more payments upon the occurrence of specified events in exchange for periodic payments from the other party.
The Fund primarily used derivatives to increase returns, to gain exposure to certain types of assets and to manage exposure to certain risks as defined below. The success of any strategy involving derivatives depends on analysis of numerous economic factors, and if the strategies for investment do not work as intended, the Fund may not achieve its objectives.
The Fund's use of derivatives increased or decreased its exposure to the following risk:
| Commodity Risk | Commodity risk is the risk that the value of a commodity will fluctuate as a result of changes in market prices.
|
The Fund is also exposed to additional risks from investing in derivatives, such as liquidity risk and counterparty credit risk. Liquidity risk is the risk that the Fund will be unable to close out the derivative in the open market in a timely manner. Counterparty credit risk is the risk that the counterparty will not be able to fulfill its obligation to the Fund. Derivative counterparty credit risk is managed through formal evaluation of the creditworthiness of all potential counterparties. On certain OTC derivatives such as bi-lateral swaps, the Fund attempts to reduce its exposure to counterparty credit risk by entering into an International Swaps and Derivatives Association, Inc. (ISDA) Master Agreement with each of its counterparties. The ISDA Master Agreement gives the Fund the right to terminate all transactions traded under such agreement upon the deterioration in the credit quality of the counterparty beyond specified levels. The ISDA Master Agreement gives each party the right, upon an event of default by the other party or a termination of the agreement, to close out all transactions traded under such agreement and to net amounts owed under each transaction to one net payable by one party to the other. Upon entering into a swap, the Fund is required to post an initial collateral amount (referred to as "Independent Amount"), as defined in the ISDA Master Agreement. The Fund is required to post additional collateral for the benefit of counterparties to meet the counterparty's unrealized appreciation on outstanding swap contracts and any such posted collateral is identified on the Consolidated Schedule of Investments. To mitigate counterparty credit risk on bi-lateral OTC derivatives, the Fund receives collateral in the form of cash or securities once the Fund's net unrealized appreciation on outstanding derivative contracts under an ISDA Master Agreement exceeds certain applicable thresholds, subject to certain minimum transfer provisions. The collateral received is held in segregated accounts with the Fund's custodian bank in accordance with the collateral agreements entered into between the Fund, the counterparty and the Fund's custodian bank. The Fund could experience delays and costs in gaining access to the collateral even though it is held by the Fund's custodian bank. The Fund's maximum risk of loss from counterparty credit risk related to bi-lateral OTC derivatives is generally the aggregate unrealized appreciation and unpaid counterparty payments in excess of any collateral pledged by the counterparty to the Fund. Exchange-traded futures contracts are not covered by the ISDA Master Agreement; however counterparty credit risk related to exchange-traded futures contracts may be mitigated by the protection provided by the exchange's clearinghouse. A summary of the Fund's derivatives inclusive of potential netting arrangements is presented at the end of the Consolidated Schedule of Investments.
Investing in derivatives may involve greater risks than investing in the underlying assets directly and, to varying degrees, may involve risk of loss in excess of any initial investment and collateral received and amounts recognized in the Consolidated Statement of Assets and Liabilities. In addition, there may be the risk that the change in value of the derivative contract does not correspond to the change in value of the underlying instrument.
Net Realized Gain (Loss) and Change in Net Unrealized Appreciation (Depreciation) on Derivatives. The table below, which reflects the impacts of derivatives on the financial performance of the Fund, summarizes the net realized gain (loss) and change in net unrealized appreciation (depreciation) for derivatives during the period as presented in the Consolidated Statement of Operations.
| Primary Risk Exposure / Derivative Type | Net Realized Gain (Loss) | Change in Net Unrealized Appreciation (Depreciation) |
| Commodity Risk | | |
| Futures Contracts | $(172,289) | $(2,082,194) |
| Swaps | (2,359,472) | 3,878,189 |
| Total Commodity Risk | $(2,531,761) | $1,795,995 |
A summary of the value of derivatives by primary risk exposure as of period end is included at the end of the Consolidated Schedule of Investments.
Futures Contracts. A futures contract is an agreement between two parties to buy or sell a specified underlying instrument for a fixed price at a specified future date. The Fund used futures contracts to manage its exposure to the commodities market.
Upon entering into a futures contract, a fund is required to deposit either cash or securities (initial margin) with a clearing broker in an amount equal to a certain percentage of the face value of the contract. Futures contracts are marked-to-market daily and subsequent daily payments are made or received by a fund depending on the daily fluctuations in the value of the futures contracts and are recorded as unrealized appreciation or (depreciation). This receivable and/or payable, if any, is included in daily variation margin on futures contracts in the Consolidated Statement of Assets and Liabilities. Realized gain or (loss) is recorded upon the expiration or closing of a futures contract. The net realized gain (loss) and change in net unrealized appreciation (depreciation) on futures contracts during the period is presented in the Consolidated Statement of Operations.
Any open futures contracts at period end are presented in the Consolidated Schedule of Investments under the caption "Futures Contracts". The notional amount at value reflects each contract's exposure to the underlying instrument or index at period end. Securities deposited to meet initial margin requirements are identified in the Consolidated Schedule of Investments.
Swaps. A swap is a contract between two parties to exchange future cash flows at periodic intervals based on a notional principal amount. A bi-lateral OTC swap is a transaction between a fund and a dealer counterparty where cash flows are exchanged between the two parties for the life of the swap.
Bi-lateral OTC swaps are marked-to-market daily and changes in value are reflected in the Consolidated Statement of Assets and Liabilities in the bi-lateral OTC swaps at value line items. Any unamortized upfront premiums are presented in the Consolidated Schedule of Investments.
Payments are exchanged at specified intervals, accrued daily commencing with the effective date of the contract and recorded as realized gain or (loss). Some swaps may be terminated prior to the effective date and realize a gain or loss upon termination. The net realized gain (loss) and change in net unrealized appreciation (depreciation) on swaps during the period is presented in the Consolidated Statement of Operations.
Any open swaps at period end are included in the Consolidated Schedule of Investments under the caption "Swaps". For the period, the average monthly notional amount at value for swaps in the aggregate was $176,933,333.
Total Return Swaps. Total return swaps are agreements between counterparties to exchange cash flows, one based on a market-linked return of an individual asset or a basket of assets (i.e., an index), and the other on a fixed or floating rate. To the extent the total return of the instrument or index underlying the transaction exceeds or falls short of the offsetting payment obligation, the Fund will receive a payment from or make a payment to the counterparty. The Fund entered into total return swaps to manage its commodities market exposure.
6. Fees and Other Transactions with Affiliates.
Management Fee and Administration Agreement. Geode Capital Management, LLC (the investment adviser) provides the Fund with investment management services for which the Fund pays a monthly management fee that is based on an annual rate of .40% of the Fund's average net assets. Under the management contract, the investment adviser pays all operating expenses, except the compensation of the independent Trustees, transfer agent fees and certain miscellaneous expenses such as proxy and shareholder meeting expenses.
FMR provides administrative services to the Fund and the investment adviser pays for these services.
The investment adviser also provides investment management services to the Subsidiary. The Subsidiary does not pay the investment adviser a fee for these services. The Subsidiary pays certain other expenses including custody and directors' fees.
Transfer Agent Fees. Fidelity Investments Institutional Operations Company LLC (FIIOC), an affiliate of FMR, is the transfer, dividend disbursing and shareholder servicing agent for the Fund. FIIOC receives an asset-based fee of .20% the Fund's average net assets. FIIOC pays for typesetting, printing and mailing of shareholder reports, except proxy statements. Effective January 1, 2020, Fidelity Investments Institutional Operations Company, Inc. converted from a Massachusetts corporation to a Massachusetts LLC, and changed its name to “Fidelity Investments Institutional Operations Company LLC”.
Interfund Trades. The Fund may purchase from or sell securities to other Fidelity Funds under procedures adopted by the Board. The procedures have been designed to ensure these interfund trades are executed in accordance with Rule 17a-7 of the 1940 Act.
7. Expense Reductions.
Through arrangements with the Fund's custodian, credits realized as a result of certain uninvested cash balances were used to reduce the Fund's expenses. During the period, custodian credits reduced the Fund's expenses by $992.
8. Distributions to Shareholders.
Distributions to shareholders of each class were as follows:
| | Six months ended
January 31, 2020 | Year ended
July 31, 2019 |
| Distributions to shareholders | | |
| Commodity Strategy | $5,794,784 | $36,621,149 |
9. Share Transactions.
Transactions for each class of shares were as follows:
| | Shares | Shares | Dollars | Dollars |
| | Six months ended January 31, 2020 | Year ended July 31, 2019 | Six months ended January 31, 2020 | Year ended July 31, 2019 |
| Commodity Strategy | | | | |
| Shares sold | 4,474,325 | 36,355,124 | $38,055,930 | $321,342,956 |
| Reinvestment of distributions | 684,396 | 4,084,838 | 5,794,784 | 36,621,149 |
| Shares redeemed | (71,962,542) | (5,668,891) | (618,630,574) | (51,121,814) |
| Net increase (decrease) | (66,803,821) | 34,771,071 | $(574,779,860) | $306,842,291 |
| Class F | | | | |
| Shares sold | – | 150,935 | $– | $1,530,150 |
| Shares redeemed | – | (12,565,821) | – | (127,138,765) |
| Net increase (decrease) | – | (12,414,886) | $– | $(125,608,615) |
10. Other.
The Fund's organizational documents provide former and current trustees and officers with a limited indemnification against liabilities arising in connection with the performance of their duties to the Fund. In the normal course of business, the Fund may also enter into contracts that provide general indemnifications. The Fund's maximum exposure under these arrangements is unknown as this would be dependent on future claims that may be made against the Fund. The risk of material loss from such claims is considered remote.
At the end of the period, mutual funds and accounts managed by FMR or its affiliates were the owners of record of all of the outstanding shares of the Fund.
Shareholder Expense Example
As a shareholder of the Fund, you incur two types of costs: (1) transaction costs and (2) ongoing costs, including management fees and other Fund expenses. This Example is intended to help you understand your ongoing costs (in dollars) of investing in the Fund and to compare these costs with the ongoing costs of investing in other mutual funds.
The Example is based on an investment of $1,000 invested at the beginning of the period and held for the entire period (August 1, 2019 to January 31, 2020).
Actual Expenses
The first line of the accompanying table provides information about actual account values and actual expenses. You may use the information in this line, together with the amount you invested, to estimate the expenses that you paid over the period. Simply divide your account value by $1,000.00 (for example, an $8,600 account value divided by $1,000.00 = 8.6), then multiply the result by the number in the first line under the heading entitled "Expenses Paid During Period" to estimate the expenses you paid on your account during this period. In addition, the Fund, as a shareholder in the underlying Fidelity Central Funds, will indirectly bear its pro-rata share of the fees and expenses incurred by the underlying Fidelity Central Funds. These fees and expenses are not included in the Fund's annualized expense ratio used to calculate the expense estimate in the table below.
Hypothetical Example for Comparison Purposes
The second line of the accompanying table provides information about hypothetical account values and hypothetical expenses based on the Fund's actual expense ratio and an assumed rate of return of 5% per year before expenses, which is not the Fund's actual return. The hypothetical account values and expenses may not be used to estimate the actual ending account balance or expenses you paid for the period. You may use this information to compare the ongoing costs of investing in the Fund and other funds. To do so, compare this 5% hypothetical example with the 5% hypothetical examples that appear in the shareholder reports of the other funds. In addition, the Fund, as a shareholder in the underlying Fidelity Central Funds, will indirectly bear its pro-rata share of the fees and expenses incurred by the underlying Fidelity Central Funds. These fees and expenses are not included in the Fund's annualized expense ratio used to calculate the expense estimate in the table below.
Please note that the expenses shown in the table are meant to highlight your ongoing costs only and do not reflect any transaction costs. Therefore, the second line of the table is useful in comparing ongoing costs only, and will not help you determine the relative total costs of owning different funds.
| | Annualized Expense Ratio-A | Beginning
Account Value
August 1, 2019 | Ending
Account Value
January 31, 2020 | Expenses Paid
During Period-B
August 1, 2019
to January 31, 2020 |
| Commodity Strategy | .60% | | | |
| Actual | | $1,000.00 | $958.50 | $2.95 |
| Hypothetical-C | | $1,000.00 | $1,022.12 | $3.05 |
A Annualized expense ratio reflects consolidated expenses net of applicable fee waivers.
B Expenses are equal to the Fund's annualized expense ratio, multiplied by the average account value over the period, multiplied by 184/366 (to reflect the one-half year period).
C 5% return per year before expenses
Board Approval of Investment Advisory Contracts and Management Fees
Fidelity Commodity Strategy Fund
Each year, the Board of Trustees, including the Independent Trustees (together, the Board), votes on the renewal of the management contract (the Advisory Contract) with Geode Capital Management, LLC (Geode) and the administration agreement with Fidelity Management & Research Company (FMR) for the fund. The Board, assisted by the advice of fund counsel and Independent Trustees' counsel, requests and considers a broad range of information relevant to the renewal of the Advisory Contract and administration agreement throughout the year.
The Board meets regularly and, at each of its meetings, covers an extensive agenda of topics and materials and considers factors that are relevant to its annual consideration of the renewal of the fund's Advisory Contract and administration agreement, including the services and support provided to the fund and its shareholders. The Board has established four standing committees (Committees) — Operations, Audit, Fair Valuation, and Governance and Nominating — each composed of and chaired by Independent Trustees with varying backgrounds, to which the Board has assigned specific subject matter responsibilities in order to enhance effective decision-making by the Board. The Operations Committee, of which all of the Independent Trustees are members, meets regularly throughout the year and considers, among other matters, information specifically related to the annual consideration of the renewal of the fund's Advisory Contract and administration agreement. The Board, acting directly and through its Committees, requests and receives information concerning the annual consideration of the renewal of the fund's Advisory Contract and administration agreement. The Board also meets as needed to review matters specifically related to the Board's annual consideration of the renewal of the Advisory Contract and administration agreement. Members of the Board may also meet with trustees of other Fidelity funds through joint ad hoc committees to discuss certain matters relevant to all of the Fidelity funds.
At its September 2019 meeting, the Board unanimously determined to renew the fund's Advisory Contract and administration agreement. In reaching its determination, the Board considered all factors it believed relevant, including (i) the nature, extent, and quality of the services provided to the fund and its shareholders (including the investment performance of the fund); (ii) the competitiveness of the fund's management fee and total expense ratio relative to peer funds; (iii) the total costs of the services provided by and the profits realized by Geode from its relationships with the fund; and (iv) the extent to which, if any, economies of scale exist and are realized as the fund grows, and whether any economies of scale are appropriately shared with fund shareholders.
In considering whether to renew the Advisory Contract for the fund, the Board reached a determination, with the assistance of fund counsel and Independent Trustees' counsel and through the exercise of its business judgment, that the renewal of the Advisory Contract was in the best interests of the fund and its shareholders and that the compensation payable under the Advisory Contract was fair and reasonable. The Board's decision to renew the Advisory Contract was not based on any single factor, but rather was based on a comprehensive consideration of all the information provided to the Board at its meetings throughout the year. The Board, in reaching its determination to renew the Advisory Contract, was aware that shareholders of the fund have a broad range of investment choices available to them, including a wide choice among funds offered by Fidelity's competitors, and that the fund's shareholders, who have the opportunity to review and weigh the disclosure provided by the fund in its prospectus and other public disclosures, have chosen to invest in this fund, which is part of the Fidelity family of funds.
Approval of Amended and Restated Advisory Contract. At its September 2019 meeting, the Board also unanimously determined to approve an amended and restated management contract with Geode (Amended and Restated Contract) in connection with an upcoming consolidation of certain of Fidelity's advisory businesses. The Board considered that, on or about January 1, 2020, after the expected consolidation of certain advisory entities, FMR expects to redomicile as a Delaware limited liability company. The Board noted that references to FMR in the Amended and Restated Contract would be updated to reflect FMR's new form of organization. The Board also approved amendments to the Advisory Contract that clarify that the fund pays its non-operating expenses, including brokerage commissions and fees and expenses associated with the fund's securities lending program, if applicable. The Board also noted Fidelity's assurance that neither the planned consolidation nor the Amended and Restated Contract will change the investment processes, the level or nature of services provided, the resources and personnel allocated, trading and compliance operations, or any fees or expenses paid by the fund.
Nature, Extent, and Quality of Services Provided. The Board considered staffing as it relates to the fund, including the backgrounds of investment personnel of Geode, and also considered the fund's investment objective, strategies, and related investment philosophy. The Independent Trustees also had discussions with representatives of Geode. The Board considered the structure of the investment personnel compensation program and whether this structure provides appropriate incentives to act in the best interests of the fund.
Resources Dedicated to Investment Management and Support Services. The Board reviewed the general qualifications and capabilities of Geode's investment staff, including its size, education, experience, and resources. The Board considered that Geode's investment professionals have extensive resources, tools and capabilities so as to provide competitive investment results over time, and that those professionals also have access to sophisticated tools that permit them to assess portfolio construction and risk and performance attribution characteristics continuously. The Board also noted the extensive resources devoted by Fidelity to providing non-advisory services to the fund. Additionally, in its deliberations, the Board considered Geode's trading, risk management, compliance, and technology and operations capabilities and resources, which are integral parts of the investment management process.
Administrative Services. The Board considered (i) the nature, extent, quality, and cost of administrative services performed by Fidelity under separate agreements covering administration, transfer agency, pricing and bookkeeping, and securities lending services for the fund; (ii) the nature and extent of the supervision of third party service providers, principally custodians, subcustodians, and pricing vendors; and (iii) the resources devoted to, and the record of compliance with, the fund's compliance policies and procedures.
The Board noted that the growth of fund assets over time across the complex allows Fidelity to reinvest in the development of services designed to enhance the value and convenience of the Fidelity funds as investment vehicles. These services include 24-hour access to account information and market information over the Internet and through telephone representatives, investor education materials and asset allocation tools, and the expanded availability of Fidelity Investor Centers.
Investment Performance. The Board considered whether the fund has operated in accordance with its investment objective, as well as its record of compliance with its investment restrictions and its performance history.
The Board took into account discussions with representatives of Geode about fund investment performance. In this regard the Board noted that as part of regularly scheduled fund reviews and other reports to the Board on fund performance, the Board considers annualized return information for the fund for different time periods, measured against an appropriate securities market index ("benchmark index") and a peer group of funds with similar objectives (peer group), if any. In its evaluation of fund investment performance, at meetings throughout the year, the Board gave particular attention to information indicating underperformance of certain Fidelity funds for specific time periods and discussed with Fidelity the reasons for such underperformance.
In addition to reviewing absolute and relative fund performance, the Independent Trustees periodically consider the appropriateness of fund performance metrics in evaluating the results achieved. In general, the Independent Trustees believe that fund performance should be evaluated based on gross performance (before fees and expenses but after transaction costs) compared to appropriate benchmark indices, over appropriate time periods that may include full market cycles, and on net performance (after fees and expenses) compared to peer groups, as applicable, over the same periods, taking into account relevant factors including the following: general market conditions; expectations for interest rate levels and credit conditions; issuer-specific information including credit quality; and fund cash flows and other factors. Depending on the circumstances, the Independent Trustees may be satisfied with a fund's performance notwithstanding that it lags its benchmark index or peer group for certain periods.
The Independent Trustees recognize that shareholders evaluate performance on a net basis over their own holding periods, for which one-, three-, and five-year periods are often used as a proxy. For this reason, the performance information reviewed by the Board also included net calendar year total return information for the fund and an appropriate benchmark index for the most recent one-year period.
Based on its review, the Board concluded that the nature, extent, and quality of services provided to the fund under the Advisory Contract should continue to benefit the shareholders of the fund.
Competitiveness of Management Fee and Total Expense Ratio. The Board considered the fund's management fee and total expense ratio compared to "mapped groups" of competitive funds and classes created for the purpose of facilitating the Trustees' competitive analysis of management fees and total expenses. Fidelity creates "mapped groups" by combining similar Lipper investment objective categories that have comparable investment mandates. Combining Lipper investment objective categories aids the Board's management fee and total expense ratio comparisons by broadening the competitive group used for comparison.
Management Fee. The Board considered two proprietary management fee comparisons for the 12-month (or shorter) periods shown in basis points (BP) in the chart below. The group of Lipper funds used by the Board for management fee comparisons is referred to below as the "Total Mapped Group." The Total Mapped Group comparison focuses on a fund's standing in terms of gross management fees before expense reimbursements or caps relative to the total universe of funds with comparable investment mandates, regardless of whether their management fee structures also are comparable. Funds with comparable investment mandates offer exposure to similar types of securities. Funds with comparable management fee structures have similar management fee contractual arrangements (
e.g., flat rate charged for advisory services, all-inclusive fee rate,
etc.). "TMG %" represents the percentage of funds in the Total Mapped Group that had management fees that were lower than the fund's. For example, a hypothetical TMG % of 20% would mean that 80% of the funds in the Total Mapped Group had higher, and 20% had lower, management fees than the fund. The fund's actual TMG %s and the number of funds in the Total Mapped Group are in the chart below. The "Asset-Size Peer Group" (ASPG) comparison focuses on a fund's standing relative to a subset of non-Fidelity funds within the Total Mapped Group that are similar in size and management fee structure. For example, if a fund is in the first quartile of the ASPG, the fund's management fee ranks in the least expensive or lowest 25% of funds in the ASPG. The ASPG represents at least 15% of the funds in the Total Mapped Group with comparable asset size and management fee structures, subject to a minimum of 50 funds (or all funds in the Total Mapped Group if fewer than 50). Additional information, such as the ASPG quartile in which the fund's management fee rate ranked, is also included in the chart and was considered by the Board.
Fidelity Commodity Strategy Fund
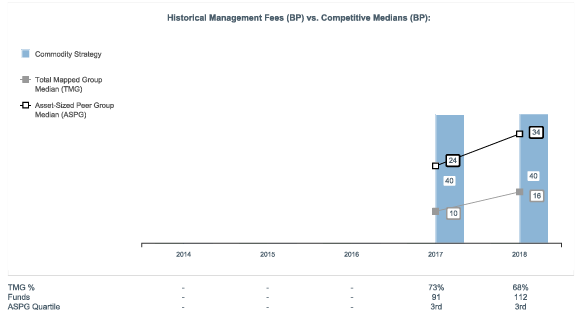
The Board noted that the fund's management fee rate ranked above the median of its Total Mapped Group and above the median of its ASPG for 2018. The Board noted that the fund's management fee rate is higher than many funds in its peer group because of its specialized commodity-linked derivatives strategy, and that the fund's management fee rate is lower than the fees charged by the three most comparable competitor funds in the peer group.
The Board noted that it and the boards of other Fidelity funds formed an ad hoc Committee on Group Fee, which meets periodically, to conduct an in-depth review of the "group fee" component of the management fee of funds with such management fee structures. The Committee's focus included the mechanics of the group fee, the competitive landscape of group fee structures, Fidelity funds with no group fee component (such as the fund) and investment products not included in group fee assets. The Board also considered that, for funds subject to the group fee, FMR agreed to voluntarily waive fees over a specified period of time in amounts designed to account for assets converted from certain funds to certain collective investment trusts.
Based on its review, the Board concluded that the fund's management fee is fair and reasonable in light of the services that the fund receives and the other factors considered.
Total Expense Ratio. In its review of each class's total expense ratio, the Board considered the fund's management fee rate as well as other "fund-level" expenses, such as pricing and bookkeeping fees and custodial, legal, and audit fees, paid by Geode under the fund's management contract. The Board also considered other "class-level" expenses, such as transfer agent fees. The Board also noted that Geode may agree to waive fees or reimburse expenses from time to time, and the extent to which, if any, it has done so for the fund. As part of its review, the Board also considered the current and historical total expense ratios of each class of the fund compared to competitive fund median expenses. Each class of the fund is compared to those funds and classes in the Total Mapped Group (used by the Board for management fee comparisons) that have a similar sales load structure.
The Board noted that the total expense ratio of each class ranked above the competitive median for 2018. The Board considered that, in general, various factors can affect total expense ratios. The Board considered that each class is above the competitive median due to the fund's higher management fee as discussed above. The Board considered that the majority of the funds in the Total Mapped Group are not comparable because the fund has a specialized commodity-linked derivative strategy. The Board noted that the total expense ratio of each class is lower than the expense ratio of the three most comparable competitor classes.
Fees Charged to Other Geode and Fidelity Clients. The Board also considered information, including fee rates, about management services provided by Geode to other clients in the same strategy as the fund. The Board also considered Fidelity fee structures and other information with respect to clients of Fidelity, such as other funds advised or subadvised by Fidelity, pension plan clients, and other institutional clients with similar mandates. The Board noted that a joint ad hoc committee created by it and the boards of other Fidelity funds periodically reviews and compares Fidelity's institutional investment advisory business with its business of providing services to the Fidelity funds and also noted the most recent findings of the committee. The Board noted that the committee's review included a consideration of the differences in services provided, fees charged, and costs incurred, as well as competition in the markets serving the different categories of clients.
Based on its review of total expense ratios and fees charged to other Fidelity clients, the Board concluded that the total expense ratio of each class of the fund was reasonable in light of the services that the fund and its shareholders receive and the other factors considered.
Costs of the Services and Profitability. The Board considered the revenues earned and the expenses incurred by Geode in managing the fund and Fidelity in conducting the business of developing, marketing, distributing, administering and servicing the fund and servicing the fund's shareholders. The Board also considered the level of Fidelity's profits in respect of all the Fidelity funds.
On an annual basis, Geode presents to the Board information about the profitability of its relationship with the fund. In addition, Fidelity calculates profitability information for each fund, as well as aggregate profitability information for groups of Fidelity funds and all Fidelity funds, using a series of detailed revenue and cost allocation methodologies which originate with the books and records of Fidelity on which Fidelity's audited financial statements are based. The Audit Committee of the Board reviews any significant changes from the prior year's methodologies and the full Board approves such changes.
PricewaterhouseCoopers LLP (PwC), auditor to Fidelity and certain Fidelity funds, has been engaged annually by the Board as part of the Board's assessment of Fidelity's profitability analysis. PwC's engagement includes the review and assessment of the methodologies used by Fidelity in determining the revenues and expenses attributable to Fidelity's mutual fund business, and completion of agreed-upon procedures in respect of the mathematical accuracy of the fund profitability information and its conformity to established allocation methodologies. After considering PwC's reports issued under the engagement and information provided by Fidelity, the Board concluded that while other allocation methods may also be reasonable, Fidelity's profitability methodologies are reasonable in all material respects.
The Board also reviewed Fidelity's and Geode's non-fund businesses and potential indirect benefits such businesses may have received as a result of their association with Fidelity's mutual fund business (i.e., fall-out benefits) as well as cases where Fidelity's and Geode's affiliates may benefit from the fund's business. The Board noted that changes to fall-out benefits year-over-year reflect business developments at Fidelity's and Geode's various businesses. The Board considered that a joint ad hoc committee created by it and the boards of other Fidelity funds had recently been established, and meets periodically, to evaluate potential fall-out benefits. The Board noted that the committee was expected to, among other things: (i) discuss the legal framework surrounding potential fall-out benefits; (ii) review the Board's responsibilities and approach to potential fall-out benefits; and (iii) review practices employed by competitor funds regarding the review of potential fall-out benefits. The Board noted that it would consider the committee's findings in connection with future consideration of contract renewals.
The Board considered the costs of the services provided by and the profits realized by Geode and Fidelity in connection with the operation of the fund and was satisfied that the profitability was not excessive.
Economies of Scale. The Board considered whether there have been economies of scale in respect of the management and/or servicing of the fund and other Fidelity funds, whether the Fidelity funds (including the fund) have appropriately benefited from any such economies of scale, and whether there is potential for realization of any further economies of scale. The Board considered the extent to which the fund will benefit from economies of scale as assets grow through increased services to the fund, through waivers or reimbursements, or through fee or expense ratio reductions. The Board also noted that a committee (the Economies of Scale Committee) created by it and the boards of other Fidelity funds periodically analyzes whether Fidelity attains economies of scale in respect of the management and servicing of the Fidelity funds, whether the Fidelity funds have appropriately benefited from such economies of scale, and whether there is potential for realization of any further economies of scale.
The Board concluded, taking into account the analysis of the Economies of Scale Committee, that economies of scale, if any, are being appropriately shared between fund shareholders and Fidelity.
Additional Information Requested by the Board. In order to develop fully the factual basis for consideration of the Fidelity funds' advisory contracts, the Board requested and received additional information on certain topics, including: (i) Fidelity's fund profitability methodology, profitability trends for certain funds, the allocation of various costs to different funds, and the impact of certain factors on fund profitability results; (ii) portfolio manager changes that have occurred during the past year and the amount of the investment that each portfolio manager has made in the Fidelity fund(s) that he or she manages; (iii) Fidelity's compensation structure for portfolio managers, research analysts, and other key personnel, including its effects on fund profitability, the rationale for the compensation structure, and the extent to which current market conditions have affected retention and recruitment; (iv) the arrangements with and compensation paid to certain fund sub-advisers on behalf of the Fidelity funds and the treatment of such compensation within Fidelity's fund profitability methodology; (v) the practices of certain sub-advisers regarding their receipt of research from broker-dealers that execute the funds' portfolio transactions; (vi) the terms of Fidelity's voluntary expense limitation agreements; (vii) the methodology with respect to competitive fund data and peer group classifications; (viii) Fidelity's transfer agent fee, expense, and service structures for different funds and classes relative to competitive trends, and the impact of the increased use of omnibus accounts; (ix) new developments in the retail and institutional marketplaces and the competitive positioning of the funds relative to other investment products and services; (x) the impact on fund profitability of recent changes in total net assets for Fidelity's money market funds, anticipated changes to the competitive landscape for money market funds, and the level of investor comfort with gates, fees, and floating NAVs; (xi) the funds' share class structures and distribution channels; and (xii) explanations regarding the relative total expense ratios of certain funds and classes, total expense competitive trends and methodologies for total expense competitive comparisons, and actions that might be taken by Fidelity to reduce total expense ratios for certain classes. In addition, the Board considered its discussions with Fidelity throughout the year regarding enhanced information security initiatives and the funds' fair valuation policies.
Based on its evaluation of all of the conclusions noted above, and after considering all factors it believed relevant, the Board concluded that the advisory fee arrangements are fair and reasonable, and that the fund's Advisory Contract should be renewed and the fund's Amended and Restated Contract should be approved.
CSZ-SANN-0320
1.9879553.102
Fidelity® SAI Inflation-Focused Fund
Offered exclusively to certain clients of the Adviser or its affiliates - not available for sale to the general public. Fidelity SAI is a product name of Fidelity® funds dedicated to certain programs affiliated with Strategic Advisers LLC.
Semi-Annual Report
January 31, 2020
See the inside front cover for important information about access to your fund’s shareholder reports.
Beginning on January 1, 2021, as permitted by regulations adopted by the Securities and Exchange Commission, paper copies of a fund’s shareholder reports will no longer be sent by mail, unless you specifically request paper copies of the reports from the fund or from your financial intermediary, such as a financial advisor, broker-dealer or bank. Instead, the reports will be made available on a website, and you will be notified by mail each time a report is posted and provided with a website link to access the report.
If you already elected to receive shareholder reports electronically, you will not be affected by this change and you need not take any action. You may elect to receive shareholder reports and other communications from a fund electronically, by contacting your financial intermediary. For Fidelity customers, visit Fidelity's web site or call Fidelity using the contact information listed below.
You may elect to receive all future reports in paper free of charge. If you wish to continue receiving paper copies of your shareholder reports, you may contact your financial intermediary or, if you are a Fidelity customer, visit Fidelity’s website, or call Fidelity at the applicable toll-free number listed below. Your election to receive reports in paper will apply to all funds held with the fund complex/your financial intermediary.
| Account Type | Website | Phone Number |
| Brokerage, Mutual Fund, or Annuity Contracts: | fidelity.com/mailpreferences | 1-800-343-3548 |
| Employer Provided Retirement Accounts: | netbenefits.fidelity.com/preferences (choose 'no' under Required Disclosures to continue to print) | 1-800-343-0860 |
| Advisor Sold Accounts Serviced Through Your Financial Intermediary: | Contact Your Financial Intermediary | Your Financial Intermediary's phone number |
| Advisor Sold Accounts Serviced by Fidelity: | institutional.fidelity.com | 1-877-208-0098 |
Contents
To view a fund's proxy voting guidelines and proxy voting record for the 12-month period ended June 30, visit http://www.fidelity.com/proxyvotingresults or visit the Securities and Exchange Commission's (SEC) web site at http://www.sec.gov.
You may also call 1-800-544-3455 to request a free copy of the proxy voting guidelines.
Standard & Poor's, S&P and S&P 500 are registered service marks of The McGraw-Hill Companies, Inc. and have been licensed for use by Fidelity Distributors Corporation.
Other third-party marks appearing herein are the property of their respective owners.
All other marks appearing herein are registered or unregistered trademarks or service marks of FMR LLC or an affiliated company. © 2020 FMR LLC. All rights reserved.
This report and the financial statements contained herein are submitted for the general information of the shareholders of the Fund. This report is not authorized for distribution to prospective investors in the Fund unless preceded or accompanied by an effective prospectus.
A fund files its complete schedule of portfolio holdings with the SEC for the first and third quarters of each fiscal year on Form N-PORT. Forms N-PORT are available on the SEC’s web site at http://www.sec.gov. A fund's Forms N-PORT may be reviewed and copied at the SEC’s Public Reference Room in Washington, DC. Information regarding the operation of the SEC's Public Reference Room may be obtained by calling 1-800-SEC-0330.
For a complete list of a fund's portfolio holdings, view the most recent holdings listing, semiannual report, or annual report on Fidelity's web site at http://www.fidelity.com, http://www.institutional.fidelity.com, or http://www.401k.com, as applicable.
NOT FDIC INSURED •MAY LOSE VALUE •NO BANK GUARANTEE
Neither the Fund nor Fidelity Distributors Corporation is a bank.
Consolidated Investment Summary (Unaudited)
The information in the following tables is based on the Fund's commodity- linked investments and excludes short-term investment-grade debt securities, cash and cash equivalents.
Commodity Instruments as of January 31, 2020*
| % of fund’s total commodity-linked investments |
| | Commodity Futures | 100.0% |

Commodity Sector Diversification as of January 31, 2020*
| % of fund’s total commodity-linked investments |
| | Energy | 27.5% |
| | Agriculture | 28.3% |
| | Precious Metals | 18.9% |
| | Industrial Metals | 19.1% |
| | Livestock | 6.2% |

* The Fund does not invest directly in physical commodities.
Consolidated Schedule of Investments January 31, 2020 (Unaudited)
Showing Percentage of Net Assets
| U.S. Treasury Inflation-Protected Obligations - 99.6% | | | |
| | | Principal Amount | Value |
| U.S. Treasury Inflation-Indexed Bonds 2.375% 1/15/25 | | 32,531,521 | 36,703,348 |
| U.S. Treasury Inflation-Indexed Notes: | | | |
| 0.125% 4/15/20 (a) | | $63,401,099 | $63,333,531 |
| 0.125% 4/15/21 | | 54,902,871 | 54,784,243 |
| 0.125% 1/15/22 | | 50,788,436 | 50,919,615 |
| 0.125% 4/15/22 | | 53,569,511 | 53,686,663 |
| 0.125% 7/15/22 | | 51,027,295 | 51,467,480 |
| 0.125% 1/15/23 | | 52,373,684 | 52,751,716 |
| 0.125% 7/15/24 | | 51,115,457 | 52,048,263 |
| 0.125% 10/15/24 | | 36,971,566 | 37,676,605 |
| 0.25% 1/15/25 | | 51,252,638 | 52,434,147 |
| 0.375% 7/15/23 | | 52,230,959 | 53,368,327 |
| 0.5% 4/15/24 | | 37,609,942 | 38,652,090 |
| 0.625% 7/15/21 | | 46,064,538 | 46,542,802 |
| 0.625% 4/15/23 | | 52,231,151 | 53,410,738 |
| 0.625% 1/15/24 | | 51,978,166 | 53,636,019 |
| 1.125% 1/15/21 | | 43,426,628 | 43,750,084 |
| 1.25% 7/15/20 | | 37,978,717 | 38,242,658 |
| TOTAL U.S. TREASURY INFLATION-PROTECTED OBLIGATIONS | | | |
| (Cost $818,802,328) | | | 833,408,329 |
| | | Shares | Value |
|
| Money Market Funds - 1.7% | | | |
| Fidelity Cash Central Fund 1.58% (b) | | | |
| (Cost $14,324,482) | | 14,321,618 | 14,324,482 |
| TOTAL INVESTMENT IN SECURITIES - 101.3% | | | |
| (Cost $833,126,810) | | | 847,732,811 |
| NET OTHER ASSETS (LIABILITIES) - (1.3)% | | | (10,549,427) |
| NET ASSETS - 100% | | | $837,183,384 |
| Futures Contracts | | | | | |
| | Number of contracts | Expiration Date | Notional Amount | Value | Unrealized Appreciation/(Depreciation) |
| Purchased | | | | | |
| Commodity Futures Contracts | | | | | |
| CBOT Corn Contracts (United States) | 1,190 | July 2020 | $23,264,500 | $(646,119) | $(646,119) |
| CBOT Corn Contracts (United States) | 536 | May 2020 | 10,358,200 | (28,483) | (28,483) |
| CBOT Corn Contracts (United States) | 596 | Sept. 2020 | 11,554,950 | 80,264 | 80,264 |
| CBOT HRW Wheat Contracts (United States) | 180 | Sept. 2020 | 4,398,750 | 146,965 | 146,965 |
| CBOT KC HRW Wheat Contracts (United States) | 185 | May 2020 | 4,370,625 | (223,055) | (223,055) |
| CBOT Soybean Contracts (United States) | 198 | May 2020 | 8,778,825 | (261,772) | (261,772) |
| CBOT Soybean Contracts (United States) | 690 | Nov. 2020 | 31,472,625 | (1,022,243) | (1,022,243) |
| CBOT Soybean Meal Contracts (United States) | 150 | March 2020 | 4,365,000 | (142,118) | (142,118) |
| CBOT Soybean Meal Contracts (United States) | 429 | May 2020 | 12,711,270 | (260,290) | (260,290) |
| CBOT Soybean Meal Contracts (United States) | 170 | Dec. 2020 | 5,251,893 | (573) | (573) |
| CBOT Soybean Oil Contracts (United States) | 1,150 | May 2020 | 20,907,000 | (967,777) | (967,777) |
| CBOT Soybean Oil Contracts (United States) | 1 | Dec. 2020 | 19,194 | (3) | (3) |
| CBOT Wheat Contracts (United States) | 905 | May 2020 | 25,000,625 | (586,816) | (586,816) |
| CBOT Wheat Contracts (United States) | 329 | Sept. 2020 | 9,195,550 | 423,768 | 423,768 |
| CME Lean Hogs Contracts (United States) | 192 | April 2020 | 4,730,880 | (1,285,064) | (1,285,064) |
| CME Lean Hogs Contracts (United States) | 64 | August 2020 | 1,992,960 | (5,974) | (5,974) |
| CME Lean Hogs Contracts (United States) | 129 | Oct. 2020 | 3,443,010 | (401,768) | (401,768) |
| CME Live Cattle Contracts (United States) | 698 | April 2020 | 33,413,260 | (820,540) | (820,540) |
| CME Live Cattle Contracts (United States) | 169 | June 2020 | 7,542,470 | (391,009) | (391,009) |
| COMEX Copper Contracts (United States) | 694 | May 2020 | 43,695,975 | (1,384,668) | (1,384,668) |
| COMEX Copper Contracts (United States) | 297 | July 2020 | 18,755,550 | (1,904,863) | (1,904,863) |
| COMEX Gold 100 oz. Contracts (United States) | 773 | April 2020 | 122,976,570 | 2,357,643 | 2,357,643 |
| COMEX Silver Contracts (United States) | 367 | March 2020 | 33,066,700 | 1,949,454 | 1,949,454 |
| ICE Brent Crude Contracts (United Kingdom) | 1,033 | April 2020 | 58,302,520 | (7,503,382) | (7,503,382) |
| ICE Coffee 'C' Contracts (United States) | 354 | May 2020 | 13,925,475 | (1,880,625) | (1,880,625) |
| ICE Cotton No. 2 Contracts (United States) | 299 | May 2020 | 10,212,345 | (442,975) | (442,975) |
| ICE Cotton No. 2 Contracts (United States) | 84 | July 2020 | 2,905,980 | (8,089) | (8,089) |
| ICE Low Sulphur Gasoil Contracts (United States) | 377 | May 2020 | 18,812,300 | (774,488) | (774,488) |
| ICE Sugar No. 11 Contracts (United States) | 355 | March 2020 | 5,808,936 | 852,956 | 852,956 |
| ICE Sugar No. 11 Contracts (United States) | 1,850 | May 2020 | 29,733,200 | 140,865 | 140,865 |
| LME Aluminum Contracts (United Kingdom) | 282 | July 2020 | 12,282,863 | (374,920) | (374,920) |
| LME Aluminum Contracts (United Kingdom) | 569 | May 2020 | 24,566,575 | (469,062) | (469,062) |
| LME Nickel Contracts (United Kingdom) | 98 | July 2020 | 7,594,020 | (434,328) | (434,328) |
| LME Nickel Contracts (United Kingdom) | 196 | May 2020 | 15,133,944 | 207,345 | 207,345 |
| LME Zinc Contracts (United Kingdom) | 175 | July 2020 | 9,594,375 | (259,350) | (259,350) |
| LME Zinc Contracts (United Kingdom) | 473 | May 2020 | 26,000,219 | (458,928) | (458,928) |
| NYMEX Gasoline RBOB Contracts (United States) | 175 | August 2020 | 11,617,410 | (1,148,176) | (1,148,176) |
| NYMEX Natural Gas Contracts (United States) | 563 | Feb. 2020 | 10,364,830 | (1,587,690) | (1,587,690) |
| NYMEX Natural Gas Contracts (United States) | 1,480 | April 2020 | 28,741,600 | (2,509,362) | (2,509,362) |
| NYMEX Natural Gas Contracts (United States) | 988 | June 2020 | 20,580,040 | (2,049,242) | (2,049,242) |
| NYMEX NY Harbor ULSD Contracts (United States) | 289 | May 2020 | 19,856,554 | (523,357) | (523,357) |
| NYMEX WTI Crude Oil Contracts (United States) | 254 | Feb. 2020 | 13,119,100 | (1,451,636) | (1,451,636) |
| NYMEX WTI Crude Oil Contracts (United States) | 880 | April 2020 | 45,610,400 | (1,263,620) | (1,263,620) |
| NYMEX WTI Crude Oil Contracts (United States) | 127 | June 2020 | 6,570,980 | 16,184 | 16,184 |
| TOTAL FUTURES CONTRACTS | | | | | $(27,296,921) |
The notional amount of futures purchased as a percentage of Net Assets is 99.5%
For the period, the average monthly notional amount at value for futures contracts in the aggregate was $968,630,181.
Legend
(a) Security or a portion of the security was pledged to cover margin requirements for futures contracts. At period end, the value of securities pledged amounted to $58,295,614.
(b) Affiliated fund that is generally available only to investment companies and other accounts managed by Fidelity Investments. The rate quoted is the annualized seven-day yield of the fund at period end. A complete unaudited listing of the fund's holdings as of its most recent quarter end is available upon request. In addition, each Fidelity Central Fund's financial statements are available on the SEC's website or upon request.
Affiliated Central Funds
Information regarding fiscal year to date income earned by the Fund from investments in Fidelity Central Funds is as follows:
| Fund | Income earned |
| Fidelity Cash Central Fund | $174,237 |
| Total | $174,237 |
Amounts in the income column in the above table include any capital gain distributions from underlying funds, which are presented in the corresponding line-item in the Consolidated Statement of Operations, if applicable.
Consolidated Subsidiary
| Fund | Value, beginning of period | Purchases | Sales Proceeds | Dividend Income | Realized Gain/Loss | Change in Unrealized appreciation (depreciation) | Value, end of period |
| Geode SAI Inflation-Focused Cayman Ltd. | $179,575,822 | $110,899,384 | $112,000,354 | $-- | $(24,569,166) | $(18,182,471) | $135,723,215 |
Investment Valuation
The following is a summary of the inputs used, as of January 31, 2020, involving the Fund's assets and liabilities carried at fair value. The inputs or methodology used for valuing securities may not be an indication of the risk associated with investing in those securities. For more information on valuation inputs, and their aggregation into the levels used below, please refer to the Investment Valuation section in the accompanying Notes to Consolidated Financial Statements.
| | Valuation Inputs at Reporting Date: |
| Description | Total | Level 1 | Level 2 | Level 3 |
| Investments in Securities: | | | | |
| U.S. Government and Government Agency Obligations | $833,408,329 | $-- | $833,408,329 | $-- |
| Money Market Funds | 14,324,482 | 14,324,482 | -- | -- |
| Total Investments in Securities: | $847,732,811 | $14,324,482 | $833,408,329 | $-- |
| Derivative Instruments: | | | | |
| Assets | | | | |
| Futures Contracts | $6,175,444 | $6,175,444 | $-- | $-- |
| Total Assets | $6,175,444 | $6,175,444 | $-- | $-- |
| Liabilities | | | | |
| Futures Contracts | $(33,472,365) | $(33,472,365) | $-- | $-- |
| Total Liabilities | $(33,472,365) | $(33,472,365) | $-- | $-- |
| Total Derivative Instruments: | $(27,296,921) | $(27,296,921) | $-- | $-- |
Value of Derivative Instruments
The following table is a summary of the Fund's value of derivative instruments by primary risk exposure as of January 31, 2020. For additional information on derivative instruments, please refer to the Derivative Instruments section in the accompanying Notes to Consolidated Financial Statements.
| Primary Risk Exposure / Derivative Type | Value |
| | Asset | Liability |
| Commodity Risk | | |
| Futures Contracts(a) | $6,175,444 | $(33,472,365) |
| Total Commodity Risk | 6,175,444 | (33,472,365) |
| Total Value of Derivatives | $6,175,444 | $(33,472,365) |
(a) Reflects gross cumulative appreciation (depreciation) on futures contracts as presented in the Consolidated Schedule of Investments. In the Consolidated Statement of Assets and Liabilities, the period end daily variation margin is included in receivable or payable for daily variation margin on futures contracts, and the net cumulative appreciation (depreciation) is included in Total accumulated earnings (loss).
The following table is a summary of the Fund's derivatives inclusive of potential netting arrangements.
| Counterparty | Value of Derivative Assets | Value of Derivative Liabilities | Collateral Received(a) | Collateral Pledged(a) | Net(b) |
| Exchange Traded Futures | $6,175,444 | $(33,472,365) | $-- | $27,296,921 | $-- |
(a) Reflects collateral received from or pledged to an individual counterparty, excluding any excess or initial collateral amounts.
(b) Net represents the receivable / (payable) that would be due from / (to) the counterparty in an event of default. Netting may be allowed across transactions traded under the same legal agreement with the same legal entity. Please refer to Derivative Instruments - Risk Exposures and the Use of Derivative Instruments section in the accompanying Notes to Consolidated Financial Statements.
See accompanying notes which are an integral part of the consolidated financial statements.
Consolidated Financial Statements
Consolidated Statement of Assets and Liabilities
| | | January 31, 2020 (Unaudited) |
| Assets | | |
Investment in securities, at value — See accompanying schedule:
Unaffiliated issuers (cost $818,792,143) | $833,408,329 | |
| Fidelity Central Funds (cost $14,324,482) | 14,324,482 | |
| Total Investment in Securities (cost $833,116,625) | | $847,732,811 |
| Receivable for fund shares sold | | 1,123,973 |
| Interest receivable | | 367,778 |
| Distributions receivable from Fidelity Central Funds | | 27,511 |
| Prepaid expenses | | 7,519 |
| Total assets | | 849,259,592 |
| Liabilities | | |
| Payable for fund shares redeemed | $1,025,656 | |
| Accrued management fee | 275,798 | |
| Payable for daily variation margin on futures contracts | 10,711,051 | |
| Other payables and accrued expenses | 63,703 | |
| Total liabilities | | 12,076,208 |
| Net Assets | | $837,183,384 |
| Net Assets consist of: | | |
| Paid in capital | | $857,392,095 |
| Total accumulated earnings (loss) | | (20,208,711) |
| Net Assets | | $837,183,384 |
| Net Asset Value, offering price and redemption price per share ($837,183,384 ÷ 85,239,965 shares) | | $9.82 |
See accompanying notes which are an integral part of the consolidated financial statements.
Consolidated Statement of Operations
| | | Six months ended January 31, 2020 (Unaudited) |
| Investment Income | | |
| Interest | | $8,406,379 |
| Income from Fidelity Central Funds | | 174,237 |
| Total income | | 8,580,616 |
| Expenses | | |
| Management fee | $1,901,597 | |
| Custodian fees and expenses | 6,619 | |
| Independent trustees' fees and expenses | 2,015 | |
| Registration fees | 73,037 | |
| Audit | 30,333 | |
| Subsidiary directors' fees | 1,250 | |
| Legal | 1,385 | |
| Miscellaneous | 3,057 | |
| Total expenses before reductions | 2,019,293 | |
| Expense reductions | (3,020) | |
| Total expenses after reductions | | 2,016,273 |
| Net investment income (loss) | | 6,564,343 |
| Realized and Unrealized Gain (Loss) | | |
| Net realized gain (loss) on: | | |
| Investment securities: | | |
| Unaffiliated issuers | 5,254,767 | |
| Futures contracts | (19,343,139) | |
| Total net realized gain (loss) | | (14,088,372) |
| Change in net unrealized appreciation (depreciation) on: | | |
| Investment securities: | | |
| Unaffiliated issuers | 4,797,456 | |
| Futures contracts | (26,845,906) | |
| Total change in net unrealized appreciation (depreciation) | | (22,048,450) |
| Net gain (loss) | | (36,136,822) |
| Net increase (decrease) in net assets resulting from operations | | $(29,572,479) |
See accompanying notes which are an integral part of the consolidated financial statements.
Consolidated Statement of Changes in Net Assets
| | Six months ended January 31, 2020 (Unaudited) | For the period
December 20, 2018 (commencement of operations) to July 31, 2019 |
| Increase (Decrease) in Net Assets | | |
| Operations | | |
| Net investment income (loss) | $6,564,343 | $20,586,893 |
| Net realized gain (loss) | (14,088,372) | (26,842,389) |
| Change in net unrealized appreciation (depreciation) | (22,048,450) | 9,367,715 |
| Net increase (decrease) in net assets resulting from operations | (29,572,479) | 3,112,219 |
| Distributions to shareholders | (20,759,255) | (10,000) |
| Share transactions | | |
| Proceeds from sales of shares | 162,742,871 | 1,345,195,523 |
| Reinvestment of distributions | 12,842,721 | 10,000 |
| Cost of shares redeemed | (518,832,612) | (117,545,604) |
| Net increase (decrease) in net assets resulting from share transactions | (343,247,020) | 1,227,659,919 |
| Total increase (decrease) in net assets | (393,578,754) | 1,230,762,138 |
| Net Assets | | |
| Beginning of period | 1,230,762,138 | – |
| End of period | $837,183,384 | $1,230,762,138 |
| Other Information | | |
| Shares | | |
| Sold | 15,880,885 | 130,314,836 |
| Issued in reinvestment of distributions | 1,241,497 | 1,015 |
| Redeemed | (50,960,430) | (11,237,838) |
| Net increase (decrease) | (33,838,048) | 119,078,013 |
See accompanying notes which are an integral part of the consolidated financial statements.
Consolidated Financial Highlights
Fidelity SAI Inflation-Focused Fund
| | Six months ended (Unaudited) January 31, | Years endedJuly 31, |
| | 2020 | 2019 A |
| Selected Per–Share Data | | |
| Net asset value, beginning of period | $10.34 | $10.00 |
| Income from Investment Operations | | |
| Net investment income (loss)B | .07 | .21 |
| Net realized and unrealized gain (loss) | (.37) | .14C |
| Total from investment operations | (.30) | .35 |
| Distributions from net investment income | (.20) | (.01)D |
| Distributions from net realized gain | (.02) | – |
| Total distributions | (.22) | (.01) |
| Net asset value, end of period | $9.82 | $10.34 |
| Total ReturnE,F | (3.01)% | 3.50% |
| Ratios to Average Net AssetsG,H | | |
| Expenses before reductions | .40%I | .52%I |
| Expenses net of fee waivers, if any | .40%I | .50%I |
| Expenses net of all reductions | .40%I | .50%I |
| Net investment income (loss) | 1.31%I | 3.38%I |
| Supplemental Data | | |
| Net assets, end of period (000 omitted) | $837,183 | $1,230,762 |
| Portfolio turnover rateJ | 41%I | 21%I |
A For the period December 20, 2018 (commencement of operations) to July 31, 2019.
B Calculated based on average shares outstanding during the period.
C The amount shown for a share outstanding does not correspond with the aggregate net gain (loss) on investments for the period due to the timing of sales and repurchases of shares in relation to fluctuating market values of the investments of the Fund.
D The amounts shown reflect certain reclassifications related to book to tax differences that were made in the year shown.
E Total returns for periods of less than one year are not annualized.
F Total returns would have been lower if certain expenses had not been reduced during the applicable periods shown.
G Fees and expenses of any underlying Fidelity Central Funds are not included in the Fund's expense ratio. The Fund indirectly bears its proportionate share of the expenses of any underlying Fidelity Central Funds.
H Expense ratios reflect operating expenses of the Fund. Expenses before reductions do not reflect amounts reimbursed by the investment adviser or reductions from expense offset arrangements and do not represent the amount paid by the Fund during periods when reimbursements or reductions occur. Expense ratios before reductions for start-up periods may not be representative of longer term operating periods. Expenses net of fee waivers reflect expenses after reimbursement by the investment adviser but prior to reductions from expense offset arrangements. Expenses net of all reductions represent the net expenses paid by the Fund.
I Annualized
J Amount does not include the portfolio activity of any underlying Fidelity Central Funds.
See accompanying notes which are an integral part of the consolidated financial statements.
Notes to Consolidated Financial Statements (Unaudited)
For the period ended January 31, 2020
1. Organization.
Fidelity SAI Inflation-Focused Fund (the Fund) is a fund of Fidelity Oxford Street Trust (the Trust) and is authorized to issue an unlimited number of shares. Shares are offered exclusively to certain clients of Strategic Advisers LLC or its affiliates. The Trust is registered under the Investment Company Act of 1940, as amended (the 1940 Act), as an open-end management investment company organized as a Delaware statutory trust.
2. Consolidated Subsidiary.
The Fund invests in certain commodity-related investments through Geode SAI Inflation-Focused Cayman Ltd., a wholly owned subsidiary (the "Subsidiary"). As of period end, the Fund held an investment of $135,723,215 in the Subsidiary, representing 16.2% of the Fund's net assets.
The financial statements have been consolidated and include accounts of the Fund and the Subsidiary. Accordingly, all inter-company transactions and balances have been eliminated.
3. Investments in Fidelity Central Funds.
The Fund invests in Fidelity Central Funds, which are open-end investment companies generally available only to other investment companies and accounts managed by Fidelity Management & Research Company LLC (FMR) and its affiliates. The Fund's Consolidated Schedule of Investments lists each of the Fidelity Central Funds held as of period end, if any, as an investment of the Fund, but does not include the underlying holdings of each Fidelity Central Fund. As an Investing Fund, the Fund indirectly bears its proportionate share of the expenses of the underlying Fidelity Central Funds.
The Money Market Central Funds seek preservation of capital and current income and are managed by FMR. Annualized expenses of the Money Market Central Funds as of their most recent shareholder report date ranged from less than .005% to .01%.
A complete unaudited list of holdings for each Fidelity Central Fund is available upon request or at the Securities and Exchange Commission (the SEC) website at www.sec.gov. In addition, the financial statements of the Fidelity Central Funds are available on the SEC website or upon request.
4. Significant Accounting Policies.
The Fund is an investment company and applies the accounting and reporting guidance of the Financial Accounting Standards Board (FASB) Accounting Standards Codification Topic 946 Financial Services – Investments Companies. The consolidated financial statements have been prepared in conformity with accounting principles generally accepted in the United States of America (GAAP), which require management to make certain estimates and assumptions at the date of the consolidated financial statements. Actual results could differ from those estimates. Subsequent events, if any, through the date that the consolidated financial statements were issued have been evaluated in the preparation of the consolidated financial statements. The following summarizes the significant accounting policies of the Fund:
Investment Valuation. Investments are valued as of 4:00 p.m. Eastern time on the last calendar day of the period. The Board of Trustees (the Board) has delegated the day to day responsibility for the valuation of the Fund's investments to the Fair Value Committee (the Committee) established by the Fund's investment adviser. In accordance with valuation policies and procedures approved by the Board, the Fund attempts to obtain prices from one or more third party pricing vendors or brokers to value its investments. When current market prices, quotations or currency exchange rates are not readily available or reliable, investments will be fair valued in good faith by the Committee, in accordance with procedures adopted by the Board. Factors used in determining fair value vary by investment type and may include market or investment specific events, changes in interest rates and credit quality. The frequency with which these procedures are used cannot be predicted and they may be utilized to a significant extent. The Committee oversees the Fund's valuation policies and procedures and reports to the Board on the Committee's activities and fair value determinations. The Board monitors the appropriateness of the procedures used in valuing the Fund's investments and ratifies the fair value determinations of the Committee.
The Fund categorizes the inputs to valuation techniques used to value its investments into a disclosure hierarchy consisting of three levels as shown below:
- Level 1 – quoted prices in active markets for identical investments
- Level 2 – other significant observable inputs (including quoted prices for similar investments, interest rates, prepayment speeds, etc.)
- Level 3 – unobservable inputs (including the Fund's own assumptions based on the best information available)
Valuation techniques used to value the Fund's investments by major category are as follows:
Debt securities, including restricted securities, are valued based on evaluated prices received from third party pricing vendors or from brokers who make markets in such securities. U.S. government and government agency obligations are valued by pricing vendors who utilize matrix pricing which considers yield or price of bonds of comparable quality, coupon, maturity and type or by broker-supplied prices. When independent prices are unavailable or unreliable, debt securities may be valued utilizing pricing methodologies which consider similar factors that would be used by third party pricing vendors. Debt securities are generally categorized as Level 2 in the hierarchy but may be Level 3 depending on the circumstances.
Futures contracts are valued at the settlement price or official closing price established each day by the board of trade or exchange on which they are traded and are categorized as Level 1 in the hierarchy. Investments in open-end mutual funds, including the Fidelity Central Funds, are valued at their closing net asset value (NAV) each business day and are categorized as Level 1 in the hierarchy.
Changes in valuation techniques may result in transfers in or out of an assigned level within the disclosure hierarchy. The aggregate value of investments by input level as of January 31, 2020 is included at the end of the Fund's Consolidated Schedule of Investments.
Investment Transactions and Income. For financial reporting purposes, the Fund's investment holdings and NAV include trades executed through the end of the last business day of the period. The NAV per share for processing shareholder transactions is calculated as of the close of business of the New York Stock Exchange (NYSE), normally 4:00 p.m. Eastern time and includes trades executed through the end of the prior business day. Gains and losses on securities sold are determined on the basis of identified cost. Income and capital gain distributions from Fidelity Central Funds, if any, are recorded on the ex-dividend date. Interest income is accrued as earned and includes coupon interest and amortization of premium and accretion of discount on debt securities as applicable. The principal amount on inflation-indexed securities is periodically adjusted to the rate of inflation and interest is accrued based on the principal amount. The adjustments to principal due to inflation are reflected as increases or decreases to Interest in the accompanying Consolidated Statement of Operations. Investment income is recorded net of foreign taxes withheld where recovery of such taxes is uncertain.
Expenses. Expenses directly attributable to a fund are charged to that fund. Expenses attributable to more than one fund are allocated among the respective funds on the basis of relative net assets or other appropriate methods. Expense estimates are accrued in the period to which they relate and adjustments are made when actual amounts are known.
Income Tax Information and Distributions to Shareholders. Each year, the Fund intends to qualify as a regulated investment company under Subchapter M of the Internal Revenue Code, including distributing substantially all of its taxable income and realized gains. As a result, no provision for U.S. Federal income taxes is required. The Fund files a U.S. federal tax return, in addition to state and local tax returns as required. The Fund's federal income tax returns are subject to examination by the Internal Revenue Service (IRS) for a period of three fiscal years after they are filed. State and local tax returns may be subject to examination for an additional fiscal year depending on the jurisdiction.
The Subsidiary is classified as a controlled foreign corporation under Subchapter N of the Internal Revenue Code. Therefore, the Fund is required to increase its taxable income by its share of the Subsidiary's income. Net investment losses of the Subsidiary cannot be deducted by the Fund in the current period nor carried forward to offset taxable income in future periods.
Distributions are declared and recorded on the ex-dividend date. Income and capital gain distributions are determined in accordance with income tax regulations, which may differ from GAAP.
Capital accounts within the consolidated financial statements are adjusted for permanent book-tax differences. These adjustments have no impact on net assets or the results of operations. Capital accounts are not adjusted for temporary book-tax differences which will reverse in a subsequent period.
Book-tax differences are primarily due to futures transactions, market discount, controlled foreign corporations, capital loss carryforwards and losses deferred due to wash sales.
As of period end, the cost and unrealized appreciation (depreciation) in securities, and derivatives if applicable, for federal income tax purposes on an unconsolidated basis were as follows:
| Gross unrealized appreciation | $13,188,795 |
| Gross unrealized depreciation | (66,724,937) |
| Net unrealized appreciation (depreciation) | $(53,536,142) |
| Tax cost | $890,608,313 |
Capital loss carryforwards are only available to offset future capital gains of the Fund to the extent provided by regulations and may be limited. The capital loss carryforward information presented below, including any applicable limitation, is estimated as of prior fiscal period end and is subject to adjustment.
| No expiration | |
| Short-term | $(43,287) |
5. Derivative Instruments.
Risk Exposures and the Use of Derivative Instruments. The Fund's investment objective allows the Fund to enter into various types of derivative contracts, including futures contracts. Derivatives are investments whose value is primarily derived from underlying assets, indices or reference rates and may be transacted on an exchange or over-the-counter (OTC). Derivatives may involve a future commitment to buy or sell a specified asset based on specified terms, to exchange future cash flows at periodic intervals based on a notional principal amount, or for one party to make one or more payments upon the occurrence of specified events in exchange for periodic payments from the other party.
The Fund primarily used derivatives to increase returns and to manage exposure to certain risks as defined below. The success of any strategy involving derivatives depends on analysis of numerous economic factors, and if the strategies for investment do not work as intended, the Fund may not achieve its objectives.
The Fund's use of derivatives increased or decreased its exposure to the following risk:
| Commodity Risk | Commodity risk is the risk that the value of a commodity will fluctuate as a result of changes in market prices.
|
The Fund is also exposed to additional risks from investing in derivatives, such as liquidity risk and counterparty credit risk. Liquidity risk is the risk that the Fund will be unable to close out the derivative in the open market in a timely manner. Counterparty credit risk is the risk that the counterparty will not be able to fulfill its obligation to the Fund. Counterparty credit risk related to exchange-traded futures contracts may be mitigated by the protection provided by the exchange's clearinghouse. A summary of the Fund's derivatives inclusive of potential netting arrangements is presented at the end of the Consolidated Schedule of Investments.
Investing in derivatives may involve greater risks than investing in the underlying assets directly and, to varying degrees, may involve risk of loss in excess of any initial investment and collateral received and amounts recognized in the Consolidated Statement of Assets and Liabilities. In addition, there may be the risk that the change in value of the derivative contract does not correspond to the change in value of the underlying instrument.
Futures Contracts. A futures contract is an agreement between two parties to buy or sell a specified underlying instrument for a fixed price at a specified future date. The Fund used futures contracts to manage its exposure to the commodities market.
Upon entering into a futures contract, a fund is required to deposit either cash or securities (initial margin) with a clearing broker in an amount equal to a certain percentage of the face value of the contract. Futures contracts are marked-to-market daily and subsequent daily payments are made or received by a fund depending on the daily fluctuations in the value of the futures contracts and are recorded as unrealized appreciation or (depreciation). This receivable and/or payable, if any, is included in daily variation margin on futures contracts in the Consolidated Statement of Assets and Liabilities. Realized gain or (loss) is recorded upon the expiration or closing of a futures contract. The net realized gain (loss) and change in net unrealized appreciation (depreciation) on futures contracts during the period is presented in the Consolidated Statement of Operations.
Any open futures contracts at period end are presented in the Consolidated Schedule of Investments under the caption "Futures Contracts". The notional amount at value reflects each contract's exposure to the underlying instrument or index at period end. Securities deposited to meet initial margin requirements are identified in the Consolidated Schedule of Investments.
6. Fees and Other Transactions with Affiliates.
Management Fee and Administration Agreement. Geode Capital Management, LLC (the investment adviser) provides the Fund with investment management services for which the Fund pays a monthly management fee that is based on an annual rate of .38% of the Fund's average net assets.
FMR provides administrative services to the Fund and the investment adviser pays for these services.
The investment adviser also provides investment management services to the Subsidiary. The Subsidiary does not pay the investment adviser a fee for these services. The Subsidiary pays certain other expenses including custody and directors' fees.
Interfund Trades. The Fund may purchase from or sell securities to other Fidelity Funds under procedures adopted by the Board. The procedures have been designed to ensure these interfund trades are executed in accordance with Rule 17a-7 of the 1940 Act.
7. Committed Line of Credit.
The Fund participates with other funds managed by FMR or an affiliate in a $4.25 billion credit facility (the "line of credit") to be utilized for temporary or emergency purposes to fund shareholder redemptions or for other short-term liquidity purposes. The Fund has agreed to pay commitment fees on its pro-rata portion of the line of credit, which amounted to $1,270 and is reflected in Miscellaneous expenses on the Statement of Operations. During the period, the Fund did not borrow on this line of credit.
8. Expense Reductions.
Through arrangements with the Fund's custodian, credits realized as a result of certain uninvested cash balances were used to reduce the Fund's expenses by $3,020.
9. Other.
The Fund's organizational documents provide former and current trustees and officers with a limited indemnification against liabilities arising in connection with the performance of their duties to the Fund. In the normal course of business, the Fund may also enter into contracts that provide general indemnifications. The Fund's maximum exposure under these arrangements is unknown as this would be dependent on future claims that may be made against the Fund. The risk of material loss from such claims is considered remote.
Shareholder Expense Example
As a shareholder of the Fund, you incur two types of costs: (1) transaction costs and (2) ongoing costs, including management fees and other Fund expenses. This Example is intended to help you understand your ongoing costs (in dollars) of investing in the Fund and to compare these costs with the ongoing costs of investing in other mutual funds.
The Example is based on an investment of $1,000 invested at the beginning of the period and held for the entire period (August 1, 2019 to January 31, 2020).
Actual Expenses
The first line of the accompanying table provides information about actual account values and actual expenses. You may use the information in this line, together with the amount you invested, to estimate the expenses that you paid over the period. Simply divide your account value by $1,000.00 (for example, an $8,600 account value divided by $1,000.00 = 8.6), then multiply the result by the number in the first line under the heading entitled "Expenses Paid During Period" to estimate the expenses you paid on your account during this period. In addition, the Fund, as a shareholder in the underlying Fidelity Central Funds, will indirectly bear its pro-rata share of the fees and expenses incurred by the underlying Fidelity Central Funds. These fees and expenses are not included in the Fund's annualized expense ratio used to calculate the expense estimate in the table below.
Hypothetical Example for Comparison Purposes
The second line of the accompanying table provides information about hypothetical account values and hypothetical expenses based on the Fund's actual expense ratio and an assumed rate of return of 5% per year before expenses, which is not the Fund's actual return. The hypothetical account values and expenses may not be used to estimate the actual ending account balance or expenses you paid for the period. You may use this information to compare the ongoing costs of investing in the Fund and other funds. To do so, compare this 5% hypothetical example with the 5% hypothetical examples that appear in the shareholder reports of the other funds. In addition, the Fund, as a shareholder in the underlying Fidelity Central Funds, will indirectly bear its pro-rata share of the fees and expenses incurred by the underlying Fidelity Central Funds. These fees and expenses are not included in the Fund's annualized expense ratio used to calculate the expense estimate in the table below.
Please note that the expenses shown in the table are meant to highlight your ongoing costs only and do not reflect any transaction costs. Therefore, the second line of the table is useful in comparing ongoing costs only, and will not help you determine the relative total costs of owning different funds.
| | Annualized Expense Ratio-A | Beginning
Account Value
August 1, 2019 | Ending
Account Value
January 31, 2020 | Expenses Paid
During Period-B
August 1, 2019
to January 31, 2020 |
| Actual | .40% | $1,000.00 | $969.90 | $1.98 |
| Hypothetical-C | | $1,000.00 | $1,023.13 | $2.03 |
A Annualized expense ratio reflects expenses net of applicable fee waivers.
B Expenses are equal to the Fund's annualized expense ratio, multiplied by the average account value over the period, multiplied by 184/366 (to reflect the one-half year period).
C 5% return per year before expenses
Board Approval of Investment Advisory Contracts and Management Fees
Fidelity SAI Inflation-Focused Fund
Each year, the Board of Trustees, including the Independent Trustees (together, the Board), votes on the renewal of the management contract (the Advisory Contract) with Geode Capital Management, LLC (Geode) and the administration agreement with Fidelity Management & Research Company (FMR) for the fund. The Board, assisted by the advice of fund counsel and Independent Trustees' counsel, requests and considers a broad range of information relevant to the renewal of the Advisory Contract and administration agreement throughout the year.
The Board meets regularly and, at each of its meetings, covers an extensive agenda of topics and materials and considers factors that are relevant to its annual consideration of the renewal of the fund's Advisory Contract and administration agreement, including the services and support provided to the fund and its shareholders. The Board has established four standing committees (Committees) — Operations, Audit, Fair Valuation, and Governance and Nominating — each composed of and chaired by Independent Trustees with varying backgrounds, to which the Board has assigned specific subject matter responsibilities in order to enhance effective decision-making by the Board. The Operations Committee, of which all of the Independent Trustees are members, meets regularly throughout the year and considers, among other matters, information specifically related to the annual consideration of the renewal of the fund's Advisory Contract and administration agreement. The Board, acting directly and through its Committees, requests and receives information concerning the annual consideration of the renewal of the fund's Advisory Contract and administration agreement. The Board also meets as needed to review matters specifically related to the Board's annual consideration of the renewal of the Advisory Contract and administration agreement. Members of the Board may also meet with trustees of other Fidelity funds through joint ad hoc committees to discuss certain matters relevant to all of the Fidelity funds.
At its September 2019 meeting, the Board unanimously determined to renew the fund's Advisory Contract and administration agreement. In reaching its determination, the Board considered all factors it believed relevant, including (i) the nature, extent, and quality of the services provided to the fund and its shareholders (including the investment performance of the fund); (ii) the competitiveness of the fund's management fee and total expense ratio relative to peer funds; (iii) the total costs of the services provided by and the profits realized by Geode from its relationships with the fund; and (iv) the extent to which, if any, economies of scale exist and are realized as the fund grows, and whether any economies of scale are appropriately shared with fund shareholders.
In considering whether to renew the Advisory Contract for the fund, the Board reached a determination, with the assistance of fund counsel and Independent Trustees' counsel and through the exercise of its business judgment, that the renewal of the Advisory Contract was in the best interests of the fund and its shareholders and that the compensation payable under the Advisory Contract was fair and reasonable. The Board's decision to renew the Advisory Contract was not based on any single factor, but rather was based on a comprehensive consideration of all the information provided to the Board at its meetings throughout the year. The Board, in reaching its determination to renew the Advisory Contract, was aware that shareholders of the fund have a broad range of investment choices available to them, including a wide choice among funds offered by Fidelity's competitors, and that the fund's shareholders, who have the opportunity to review and weigh the disclosure provided by the fund in its prospectus and other public disclosures, have chosen to invest in this fund, which is part of the Fidelity family of funds.
Approval of Amended and Restated Advisory Contract. At its September 2019 meeting, the Board also unanimously determined to approve an amended and restated management contract with Geode (Amended and Restated Contract) in connection with an upcoming consolidation of certain of Fidelity's advisory businesses. The Board considered that, on or about January 1, 2020, after the expected consolidation of certain advisory entities, FMR expects to redomicile as a Delaware limited liability company. The Board noted that references to FMR in the Amended and Restated Contract would be updated to reflect FMR's new form of organization. The Board also approved amendments to the Advisory Contract that clarify that the fund pays its non-operating expenses, including brokerage commissions and fees and expenses associated with the fund's securities lending program, if applicable. The Board also noted Fidelity's assurance that neither the planned consolidation nor the Amended and Restated Contract will change the investment processes, the level or nature of services provided, the resources and personnel allocated, trading and compliance operations, or any fees or expenses paid by the fund.
Nature, Extent, and Quality of Services Provided. The Board considered staffing as it relates to the fund, including the backgrounds of investment personnel of Geode, and also considered the fund's investment objective, strategies, and related investment philosophy. The Independent Trustees also had discussions with representatives of Geode. The Board considered the structure of the investment personnel compensation program and whether this structure provides appropriate incentives to act in the best interests of the fund. Additionally, the Board considered the portfolio managers' investments, if any, in the funds that they manage.
Resources Dedicated to Investment Management and Support Services. The Board reviewed the general qualifications and capabilities of Geode's investment staff, including its size, education, experience, and resources. The Board considered that Geode's investment professionals have extensive resources, tools and capabilities so as to provide competitive investment results over time, and that those professionals also have access to sophisticated tools that permit them to assess portfolio construction and risk and performance attribution characteristics continuously. The Board also noted the extensive resources devoted by Fidelity to providing non-advisory services to the fund. Additionally, in its deliberations, the Board considered Geode's trading, risk management, compliance, and technology and operations capabilities and resources, which are integral parts of the investment management process.
Shareholder and Administrative Services. The Board considered (i) the nature, extent, quality, and cost of administrative and shareholder services performed by Fidelity under separate agreements covering administration, transfer agency, pricing and bookkeeping, and securities lending services for the fund; (ii) the nature and extent of the supervision of third party service providers, principally custodians, subcustodians, and pricing vendors; and (iii) the resources devoted to, and the record of compliance with, the fund's compliance policies and procedures.
The Board noted that the growth of fund assets over time across the complex allows Fidelity to reinvest in the development of services designed to enhance the value and convenience of the Fidelity funds as investment vehicles. These services include 24-hour access to account information and market information over the Internet and through telephone representatives, investor education materials and asset allocation tools, and the expanded availability of Fidelity Investor Centers.
Investment in a Large Fund Family. The Board considered the benefits to shareholders of investing in a Fidelity fund, including the benefits of investing in a fund that is part of a large family of funds offering a variety of investment disciplines and providing a large variety of mutual fund investor services. The Board noted that Fidelity had taken, or had made recommendations that resulted in the Fidelity funds taking, a number of actions over the previous year that benefited particular funds, including: (i) continuing to dedicate additional resources to Fidelity's investment research process, which includes meetings with management of issuers of securities in which the funds invest, and to the support of the senior management team that oversees asset management; (ii) continuing efforts to enhance Fidelity's global research capabilities; (iii) launching new funds with innovative structures, strategies and pricing and making other enhancements to meet client needs; (iv) launching new share classes of existing funds; (v) eliminating purchase minimums and broadening eligibility requirements for certain funds and share classes; (vi) reducing management fees and total expenses for certain target date funds and index funds; (vii) lowering expense caps for certain existing funds and classes, and converting certain voluntary expense caps to contractual caps, to reduce expenses borne by shareholders; (viii) rationalizing product lines and gaining increased efficiencies from fund mergers, liquidations, and share class consolidations; (ix) continuing to develop, acquire and implement systems and technology to improve services to the funds and shareholders, strengthen information security, and increase efficiency; and (x) continuing to implement enhancements to further strengthen Fidelity's product line to increase investors' probability of success in achieving their investment goals, including retirement income goals.
Investment Performance. The Board considered whether the fund has operated in accordance with its investment objective, as well as its record of compliance with its investment restrictions. As the fund recently commenced operations, the Board did not believe that it was appropriate to assign significant weight to its limited investment performance.
Based on its review, the Board concluded that the nature, extent, and quality of services provided to the fund under the Advisory Contract should continue to benefit the shareholders of the fund.
Competitiveness of Management Fee and Total Expense Ratio. The Board considered the fund's management fee and total expense ratio compared to "mapped groups" of competitive funds and classes created for the purpose of facilitating the Trustees' competitive analysis of management fees and total expenses. Fidelity creates "mapped groups" by combining similar Lipper investment objective categories that have comparable investment mandates. Combining Lipper investment objective categories aids the Board's management fee and total expense ratio comparisons by broadening the competitive group used for comparison.
Management Fee. The Board considered two proprietary management fee comparisons for the period of the fund's operations shown in basis points (BP) in the chart below. The group of Lipper funds used by the Board for management fee comparisons is referred to below as the "Total Mapped Group." The Total Mapped Group comparison focuses on a fund's standing in terms of gross management fees before expense reimbursements or caps relative to the total universe of funds with comparable investment mandates, regardless of whether their management fee structures also are comparable. Funds with comparable investment mandates offer exposure to similar types of securities. Funds with comparable management fee structures have similar management fee contractual arrangements (
e.g., flat rate charged for advisory services, all-inclusive fee rate,
etc.). "TMG %" represents the percentage of funds in the Total Mapped Group that had management fees that were lower than the fund's. For example, a hypothetical TMG % of 20% would mean that 80% of the funds in the Total Mapped Group had higher, and 20% had lower, management fees than the fund. The fund's actual TMG % and the number of funds in the Total Mapped Group are in the chart below. The "Asset-Size Peer Group" (ASPG) comparison focuses on a fund's standing relative to a subset of non-Fidelity funds within the Total Mapped Group that are similar in size and management fee structure. For example, if a fund is in the first quartile of the ASPG, the fund's management fee ranks in the least expensive or lowest 25% of funds in the ASPG. The ASPG represents at least 15% of the funds in the Total Mapped Group with comparable asset size and management fee structures, subject to a minimum of 50 funds (or all funds in the Total Mapped Group if fewer than 50). Additional information, such as the ASPG quartile in which the fund's management fee rate ranked, is also included in the chart and was considered by the Board.
Fidelity SAI Inflation-Focused Fund
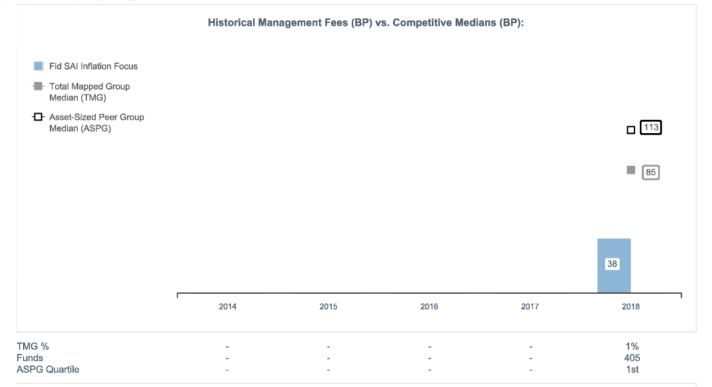
The Board noted that the fund's management fee rate ranked below the median of its Total Mapped Group and below the median of its ASPG for the period.
Based on its review, the Board concluded that the fund's management fee is fair and reasonable in light of the services that the fund receives and the other factors considered.
Total Expense Ratio. In its review of the fund's total expense ratio, the Board considered the fund's management fee rate as well as other fund expenses, such as custodial, legal, and audit fees. The Board also noted that Geode may agree to waive fees or reimburse expenses from time to time, and the extent to which, if any, it has done so for the fund. As part of its review, the Board also considered the current total expense ratio of the fund compared to competitive fund median expenses. The fund is compared to those funds and classes in the Total Mapped Group (used by the Board for management fee comparisons) that have a similar sales load structure.
The Board noted that the fund's total expense ratio ranked below the competitive median for the period.
The Board further considered that FMR has contractually agreed to reimburse the fund to the extent that total operating expenses (with certain exceptions), as a percentage of its average net assets, exceed 0.50% through November 30, 2020.
Fees Charged to Other Geode and Fidelity Clients. The Board also considered information, including fee rates, about management services provided by Geode to other clients, if any, in the same strategy as the fund. The Board also considered Fidelity fee structures and other information with respect to clients of Fidelity, such as other funds advised or subadvised by Fidelity, pension plan clients, and other institutional clients with similar mandates. The Board noted that a joint ad hoc committee created by it and the boards of other Fidelity funds periodically reviews and compares Fidelity's institutional investment advisory business with its business of providing services to the Fidelity funds and also noted the most recent findings of the committee. The Board noted that the committee's review included a consideration of the differences in services provided, fees charged, and costs incurred, as well as competition in the markets serving the different categories of clients.
Based on its review of total expense ratios and fees charged to other Fidelity clients, the Board concluded that the fund's total expense ratio was reasonable in light of the services that the fund and its shareholders receive and the other factors considered.
Costs of the Services and Profitability. The Board noted that, because the fund commenced operations in December 2018, information about the profitability of Geode's and Fidelity's relationships with the fund was not yet available.
The Board considered the level of Fidelity's profits in respect of all the Fidelity funds. On an annual basis, Fidelity presents to the Board information about the profitability of its relationships with the Fidelity funds. Fidelity calculates profitability information for each Fidelity fund, as well as aggregate profitability information for groups of Fidelity funds and all Fidelity funds, using a series of detailed revenue and cost allocation methodologies which originate with the books and records of Fidelity on which Fidelity's audited financial statements are based. The Audit Committee of the Board reviews any significant changes from the prior year's methodologies and the full Board approves such changes.
PricewaterhouseCoopers LLP (PwC), auditor to Fidelity and certain Fidelity funds, has been engaged annually by the Board as part of the Board's assessment of Fidelity's profitability analysis. PwC's engagement includes the review and assessment of the methodologies used by Fidelity in determining the revenues and expenses attributable to Fidelity's mutual fund business, and completion of agreed-upon procedures in respect of the mathematical accuracy of the Fidelity fund profitability information and its conformity to established allocation methodologies. After considering PwC's reports issued under the engagement and information provided by Fidelity, the Board concluded that while other allocation methods may also be reasonable, Fidelity's profitability methodologies are reasonable in all material respects.
The Board also reviewed Fidelity's and Geode's non-fund businesses and potential indirect benefits such businesses may have received as a result of their association with Fidelity's mutual fund business (i.e., fall-out benefits) as well as cases where Fidelity's and Geode's affiliates may benefit from the fund's business. The Board noted that changes to fall-out benefits year-over-year reflect business developments at Fidelity's and Geode's various businesses. The Board considered that a joint ad hoc committee created by it and the boards of other Fidelity funds had recently been established, and meets periodically, to evaluate potential fall-out benefits. The Board noted that the committee was expected to, among other things: (i) discuss the legal framework surrounding potential fall-out benefits; (ii) review the Board's responsibilities and approach to potential fall-out benefits; and (iii) review practices employed by competitor funds regarding the review of potential fall-out benefits. The Board noted that it would consider the committee's findings in connection with future consideration of contract renewals.
The Board considered the costs of the services provided by and the profits realized by Fidelity in connection with the operation of the Fidelity funds and was satisfied that the profitability was not excessive.
Economies of Scale. The Board considered whether there have been economies of scale in respect of the management and/or servicing of the fund and other Fidelity funds, whether the Fidelity funds (including the fund) have appropriately benefited from any such economies of scale, and whether there is potential for realization of any further economies of scale. The Board considered the extent to which the fund will benefit from economies of scale as assets grow through increased services to the fund, through waivers or reimbursements, or through fee or expense ratio reductions. The Board also noted that a committee (the Economies of Scale Committee) created by it and the boards of other Fidelity funds periodically analyzes whether Fidelity attains economies of scale in respect of the management and servicing of the Fidelity funds, whether the Fidelity funds have appropriately benefited from such economies of scale, and whether there is potential for realization of any further economies of scale.
The Board concluded, taking into account the analysis of the Economies of Scale Committee, that economies of scale, if any, are being appropriately shared between fund shareholders and Fidelity.
Additional Information Requested by the Board. In order to develop fully the factual basis for consideration of the Fidelity funds' advisory contracts, the Board requested and received additional information on certain topics, including: (i) Fidelity's fund profitability methodology, profitability trends for certain funds, the allocation of various costs to different funds, and the impact of certain factors on fund profitability results; (ii) portfolio manager changes that have occurred during the past year and the amount of the investment that each portfolio manager has made in the Fidelity fund(s) that he or she manages; (iii) Fidelity's compensation structure for portfolio managers, research analysts, and other key personnel, including its effects on fund profitability, the rationale for the compensation structure, and the extent to which current market conditions have affected retention and recruitment; (iv) the arrangements with and compensation paid to certain fund sub-advisers on behalf of the Fidelity funds and the treatment of such compensation within Fidelity's fund profitability methodology; (v) the practices of certain sub-advisers regarding their receipt of research from broker-dealers that execute the funds' portfolio transactions; (vi) the terms of Fidelity's voluntary expense limitation agreements; (vii) the methodology with respect to competitive fund data and peer group classifications; (viii) Fidelity's transfer agent fee, expense, and service structures for different funds and classes relative to competitive trends, and the impact of the increased use of omnibus accounts; (ix) new developments in the retail and institutional marketplaces and the competitive positioning of the funds relative to other investment products and services; (x) the impact on fund profitability of recent changes in total net assets for Fidelity's money market funds, anticipated changes to the competitive landscape for money market funds, and the level of investor comfort with gates, fees, and floating NAVs; (xi) the funds' share class structures and distribution channels; and (xii) explanations regarding the relative total expense ratios of certain funds and classes, total expense competitive trends and methodologies for total expense competitive comparisons, and actions that might be taken by Fidelity to reduce total expense ratios for certain classes. In addition, the Board considered its discussions with Fidelity throughout the year regarding enhanced information security initiatives and the funds' fair valuation policies.
Based on its evaluation of all of the conclusions noted above, and after considering all factors it believed relevant, the Board concluded that the advisory fee arrangements are fair and reasonable, and that the fund's Advisory Contract should be renewed and the Amended and Restated Contract should be approved.
IFF-SANN-0320
1.9892163.101
Item 2.
Code of Ethics
Not applicable.
Item 3.
Audit Committee Financial Expert
Not applicable.
Item 4.
Principal Accountant Fees and Services
Not applicable.
Item 5.
Audit Committee of Listed Registrants
Not applicable.
Item 6.
Investments
(a)
Not applicable.
(b)
Not applicable
Item 7.
Disclosure of Proxy Voting Policies and Procedures for Closed-End Management Investment Companies
Not applicable.
Item 8.
Portfolio Managers of Closed-End Management Investment Companies
Not applicable.
Item 9.
Purchase of Equity Securities by Closed-End Management Investment Company and Affiliated Purchasers
Not applicable.
Item 10.
Submission of Matters to a Vote of Security Holders
There were no material changes to the procedures by which shareholders may recommend nominees to the Fidelity Oxford Street Trust’s Board of Trustees.
Item 11.
Controls and Procedures
(a)(i) The President and Treasurer and the Chief Financial Officer have concluded that the Fidelity Oxford Street Trust’s (the “Trust”) disclosure controls and procedures (as defined in Rule 30a-3(c) under the Investment Company Act) provide reasonable assurances that material information relating to the Trust is made known to them by the appropriate persons, based on their evaluation of these controls and procedures as of a date within 90 days of the filing date of this report.
(a)(ii) There was no change in the Trust’s internal control over financial reporting (as defined in Rule 30a-3(d) under the Investment Company Act) that occurred during the period covered by this report that has materially affected, or is reasonably likely to materially affect, the Trust’s internal control over financial reporting.
Item 12.
Disclosure of Securities Lending Activities for Closed-End Management
Investment Companies
Not applicable.
Item 13.
Exhibits
| | |
(a) | (1) | Not applicable. |
(a) | (2) | Certification pursuant to Rule 30a-2(a) under the Investment Company Act of 1940 (17 CFR 270.30a-2(a)) is filed and attached hereto as Exhibit 99.CERT. |
(a) | (3) | Not applicable. |
(b) |
| Certification pursuant to Rule 30a-2(b) under the Investment Company Act of 1940 (17 CFR 270.30a-2(b)) is furnished and attached hereto as Exhibit 99.906CERT. |
SIGNATURES
Pursuant to the requirements of the Securities Exchange Act of 1934 and the Investment Company Act of 1940, the registrant has duly caused this report to be signed on its behalf by the undersigned, thereunto duly authorized.
Fidelity Oxford Street Trust
| |
By: | /s/Laura M. Del Prato |
| Laura M. Del Prato |
| President and Treasurer |
|
|
Date: | March 25, 2020 |
Pursuant to the requirements of the Securities Exchange Act of 1934 and the Investment Company Act of 1940, this report has been signed below by the following persons on behalf of the registrant and in the capacities and on the dates indicated.
| |
By: | /s/Laura M. Del Prato |
| Laura M. Del Prato |
| President and Treasurer |
|
|
Date: | March 25, 2020 |
| |
By: | /s/John J. Burke III |
| John J. Burke III |
| Chief Financial Officer |
|
|
Date: | March 25, 2020 |