UNITED STATES
SECURITIES AND EXCHANGE COMMISSION
Washington, D.C. 20549
FORM N-CSR
CERTIFIED SHAREHOLDER REPORT OF REGISTERED MANAGEMENT
INVESTMENT COMPANIES
Investment Company Act file number 811-02201
Cutwater Select Income Fund
(Exact name of registrant as specified in charter)
113 King Street
Armonk, NY 10504
(Address of principal executive offices) (Zip code)
Clifford D. Corso
113 King Street
Armonk, NY 10504
(Name and address of agent for service)
Registrant’s telephone number, including area code: 914-273-4545
Date of fiscal year end: March 31
Date of reporting period: March 31, 2013
Item 1. Reports to Stockholders.
The Report to Shareholders is attached herewith.
CUTWATER SELECT INCOME FUND SHAREHOLDER LETTER – 03/31/13
April 16, 2013
DEAR SHAREHOLDERS:
In the last six months, markets have exhibited mixed results across stocks, corporate bonds, and other fixed income securities as investors responded to central banks’ continued unprecedented efforts to help mitigate the tail risks posed by the prospect of a country leaving the Eurozone, a global economic slowdown, and uncertainty associated with the outcome of the U.S. elections and U.S. fiscal policy. The volatility seen earlier in 2012 declined in September after the European Central Bank announced it would buy an unlimited amount of three year sovereign debt of Eurozone member nations that request assistance. The yields on the sovereign debt of Spain and Italy have since fallen sharply and their refinancing risk has diminished. The Federal Reserve, for its part, announced at its December 12 meeting that it will buy $45 billion of longer-term U.S. Treasury securities per month in addition to the ongoing monthly purchases of $40 billion of agency mortgage-backed securities. The Federal Reserve also stated for the first time it would keep its accommodative policies in place at least as long as the unemployment rate remains above 6.5 percent, provided projected inflation does not exceed 2.5 percent. In addition, Japan recently announced it would also increase its accommodative monetary policies and target inflation of 2 percent in an attempt to stimulate economic growth.
Following President Obama’s re-election, negotiations on the U.S. fiscal cliff accelerated and an agreement was reached in early 2013. The result was elimination of the 2 percent payroll tax holiday and increased tax rates on higher income households. However, the Obama administration and Congress were unable to agree to legislation averting the automatic spending cuts known as sequestration and they are being implemented across the federal government. The implications of these moves are significant but they have had a mixed impact on the market. The ever more accommodative stance of global central banks has been positive for stocks and bonds. The increase in U.S. taxes and the reduction in federal government spending, however, will no doubt be a drag on the American consumer and the overall U.S. economy. Following these actions, financial markets have responded with an increased appetite for stocks and riskier fixed income securities. The performance of higher quality fixed income securities has been more muted, however, given the already ultra-low yield levels.
We believe financial markets’ generally favorable response has been rational and consistent in the context of a reduction of global systemic risk and modest economic growth. There remain several areas of concern over potential negative global political and economic developments that could still create some volatility. On the whole, however, we believe the channel of volatility is moderating and that a reduction in uncertainty over these issues should spur confidence and growth in the near future.
Economic fundamentals in the U.S. continue to slowly improve, consistent with our outlook of below-trend GDP growth in a checkmark-shaped recovery, a view we have held for the past several quarters. The U.S. consumer has continued to remain resilient, although the full impact of the recent tax increases is still unknown at this time. Housing has shown signs of improvement in most markets, which should help growth in 2013. Auto sales have also exhibited strength, with annualized sales exceeding fifteen million units, up from this cycle’s low of approximately nine million units. Consumer confidence has improved despite an unfortunately slow decline in the unemployment rate to the current 7.5 percent.
GDP growth in the fourth quarter decelerated to 0.4 percent from 3.1 percent in the third quarter, reflecting reduced defense spending and declines in the inventory levels of businesses. Full year 2012 GDP growth was 2.2 percent. European growth has slowed, as expected, and may slow even further as many countries experience recession, given increased austerity measures. Ongoing concerns over the substantial U.S. federal deficit and the economic impact of
1
recent tax increases and sequestration, may contribute to future periods of market volatility. However, we remain cautiously optimistic that as uncertainty declines, GDP growth could improve to 2.25-2.50 percent in 2013.
The corporate sector and industrial companies in particular were proactive throughout the crisis, weathered the downturn well, and now have healthy balance sheets and solid profitability. These strong corporate fundamentals have peaked, in our view, with many companies exhibiting challenging year-over-year comparisons from both a revenue and an earnings perspective. This reflects weakness in both domestic and overseas demand and foreign currency impacts. Cash flow and earnings comparisons have also exhibited some softness, but corporate earnings have generally held up well as managements focused on reducing expenses and maintaining financial flexibility. Given low yields and receptive capital markets, we are concerned about corporations increasing leverage to enhance shareholder returns at the expense of fixed income investors, so we must remain vigilant. We are generally constructive in the corporate segment of the fixed income market, however, including leveraged finance, where we expect default rates to remain historically low. Indeed, Moody’s is forecasting that the global speculative-grade default rate will be essentially unchanged from 2.4 percent in March 2013 to 2.5 percent in March 2014, substantially below the long-term average.
Strengthening risk appetite over the six-month period ending March 31, 2013, was evident as the S&P 500 Index rose over 10 percent and high yield bonds posted a strong 6.1 percent return. Investment grade corporate credit had a more modest return during the six month period at 0.73 percent. At the other end of the risk spectrum, Treasury rates were volatile during the period. The ten-year Treasury rate rose from 1.63 percent at the end of September to 2.06 percent in early March and then declined to 1.85 percent at the end of the first quarter. Subsequent to quarter end, Treasury yields have moved lower as investors have gravitated toward U.S. government securities following the bailout of Cyprus and the announcement of a large quantitative easing program in Japan.
As of March 31, 2013, the Fund had a Net Asset Value (NAV) of $21.53 per share. This represents a 1.0 percent increase from $21.31 per share at September 30, 2012. On March 28, 2013, the Fund’s closing price on the New York Stock Exchange was $20.06 per share, representing a 6.83 percent discount to NAV per share, compared with a 3.10 percent discount as of September 28, 2012. The market trading discount was at 6.21 percent as of market close on April 16, 2013.
One of the primary objectives of the Fund is to maintain a high level of income. On March 6, 2013, the Board of Trustees declared a dividend payment of $0.265 per share payable May 1, 2013 to shareholders of record on April 4, 2013. On an annualized basis, including the pending dividend, the Fund has paid a total of $1.06 per share in dividends, representing a 5.24 percent dividend yield based on the market price on April 16, 2013 of $20.23 per share. The dividend is evaluated on a quarterly basis and is based on the income generation capability of the portfolio.
Total Return-Percentage Change (Annualized for periods longer than 1 year)
In Net Asset Value Per Share with All Distributions Reinvested1
| | | | | | | | | | | | | | | | | | | | |
| | | 6 Months
to
03/31/13 | | | 1 Year
to
03/31/13 | | | 3 Years
to
03/31/13 | | | 5 Years
to
03/31/13 | | | 10 Years
to
03/31/13 | |
Cutwater Select Income Fund | | | 3.74 | % | | | 11.43 | % | | | 10.45 | % | | | 9.36 | % | | | 6.17 | %2 |
Barclays U.S. Credit Index3 | | | 0.87 | % | | | 7.01 | % | | | 7.86 | % | | | 7.52 | % | | | 5.96 | % |
1 – This is historical information and should not be construed as indicative of any likely future performance.
2 – Source: BNY Mellon for all periods except 10-year returns, which are from Lipper Inc.
3 – Comprised primarily of U.S. investment grade corporate bonds (Fund’s Benchmark).
2
The Fund’s performance for the 5- and 10-year historical periods (shown above) reflects the 4.79 percent dilution of net asset value resulting from the rights offering during the third quarter of 2009. In addition to the impact from the August 2009 rights offering, the 10-year performance was also reduced by the 4.5 percent dilution of net asset value resulting from the rights offering during the fourth quarter of 2003. After adjusting for the impact of both rights offerings, we estimate the 5-year annualized return to be 10.41 percent, and 10-year annualized return to be 7.09 percent. The returns noted in the table above are actual returns as calculated by BNY Mellon and Lipper and do not adjust for dilution from the rights offerings.
The Fund’s returns for the period were positively impacted by the rally in corporate and other non-government fixed income securities, helping the Fund outperform its benchmark by 2.87 percent. More specifically, performance benefited from the Fund’s allocations to high yield, subordinated bank and finance securities, non-U.S. fixed income securities, and commercial mortgage-backed securities (CMBS). Given the nature of the Fund, security selection has always played a dominant role in generating performance. This remains true for the most recent period. In our view, the returns look strong across the time periods, particularly after adjusting for the dilutive impact of the rights offerings noted above.
Yield represents the major component of return in most fixed income portfolios. Given this Fund’s emphasis on income and the dividend, we generally will not have material exposure to low yielding U.S. Treasuries but will maintain meaningful exposure to corporate bonds. We look through periods of volatility and focus on an investment’s long term creditworthiness to assess whether it will provide an attractive yield to the Fund over time.
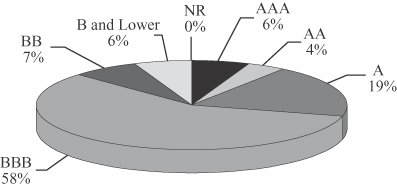
The Fund’s performance will continue to be subject to the impact of trends in long-term interest rates and to trends in yield spreads on corporate bonds. Consistent with our investment discipline, we continue to emphasize diversity and risk management within the bounds of income stability. The pie chart below summarizes the portfolio quality of the Fund’s long-term invested assets as of March 31, 2013:
Percent of Total Investment (Lower of S&P and Moody’s Ratings)
3
We would like to remind shareholders of the opportunities presented by the Fund’s dividend reinvestment plan as detailed in the Fund’s prospectus and referred to in the Shareholder Information section of this report. The dividend reinvestment plan affords shareholders a price advantage by allowing them to purchase shares at Net Asset Value (NAV) or market price, whichever is lower. This means that the reinvestment price is at market price when the Fund is trading at a discount to Net Asset Value, as is currently the situation, or at NAV per share when market trading is at a premium to that value. To participate in the plan, please contact BNY Mellon Investment Servicing (US) Inc. the Fund’s Transfer Agent and Dividend Paying Agent, at 1-866-333-6685. The Fund’s investment adviser, Cutwater Investment Services Corp., may be reached at 866-766-3030.

Cliff Corso
President
Mr. Corso’s comments reflect the investment adviser’s views generally regarding the market and the economy, and are compiled from the investment adviser’s research. These comments reflect opinions as of the date written and are subject to change at any time.
4
REPORT OF INDEPENDENT REGISTERED PUBLIC ACCOUNTING FIRM
To the Shareholders and
Board of Directors of the
Cutwater Select Income Fund
We have audited the accompanying statement of assets and liabilities of Cutwater Select Income Fund, including the schedule of investments, as of March 31, 2013, and the related statement of operations for the year then ended, the statements of changes in net assets for each of the two years in the period then ended and the financial highlights for each of the five years in the period then ended. These financial statements and financial highlights are the responsibility of the Fund’s management. Our responsibility is to express an opinion on these financial statements and financial highlights based on our audits.
We conducted our audits in accordance with the standards of the Public Company Accounting Oversight Board (United States). Those standards require that we plan and perform the audits to obtain reasonable assurance about whether the financial statements and financial highlights are free of material misstatement. The Fund is not required to have, nor were we engaged to perform, an audit of the Fund’s internal control over financial reporting. Our audits included consideration of internal control over financial reporting as a basis for designing audit procedures that are appropriate in the circumstances, but not for the purpose of expressing an opinion on the effectiveness of the Fund’s internal control over financial reporting. Accordingly, we express no such opinion. An audit includes examining on a test basis, evidence supporting the amounts and disclosures in the financial statements. Our procedures included confirmation of securities owned as of March 31, 2013 by correspondence with the custodian. An audit also includes assessing the accounting principles used and significant estimates made by management, as well as evaluating the overall financial statement presentation. We believe that our audits provide a reasonable basis for our opinion.
In our opinion, the financial statements and financial highlights referred to above present fairly, in all material respects, the financial position of Cutwater Select Income Fund as of March 31, 2013, the results of its operations for the year then ended, the changes in its net assets for each of the two years in the period then ended and the financial highlights for each of the five years in the period then ended, in conformity with accounting principles generally accepted in the United States of America.
TAIT, WELLER & BAKER LLP
Philadelphia, Pennsylvania
May 13, 2013
5
SCHEDULE OF INVESTMENTS March 31, 2013
| | | | | | | | | | |
| | | Moody’s/
Standard &
Poor’s
Rating(a) | | Principal
Amount (000’s) | | | Value
(Note 1) | |
CORPORATE DEBT SECURITIES (81.45%) | | | | | | | | | | |
AUTOMOTIVE (1.27%) | | | | | | | | | | |
Ford Holdings Co. Gty., 9.30%, 03/01/30 | | Baa3/BB+ | | $ | 1,000 | | | $ | 1,403,725 | |
Ford Motor Co., Sr. Unsec. Notes, 8.90%, 01/15/32 | | Baa3/BB+ | | | 500 | | | | 659,930 | |
Ford Motor Credit Co. LLC, Sr. Unsec. Notes, 5.875%, 08/02/21 | | Baa3/BB+ | | | 750 | | | | 857,948 | |
| | | | | | | | | | |
| | | | | | | | | 2,921,603 | |
| | | | | | | | | | |
CHEMICALS (3.07%) | | | | | | | | | | |
Braskem Finance, Ltd., Co Gty., 7.00%, 05/07/20, 144A | | Baa3/BBB- | | | 500 | | | | 564,000 | |
Braskem Finance, Ltd., Co Gty., 5.375%, 05/02/22, 144A | | Baa3/BBB- | | | 750 | | | | 777,000 | |
Dow Chemical Co., Sr. Unsec. Notes, 8.55%, 05/15/19 | | Baa2/BBB | | | 500 | | | | 672,084 | |
Incitec Pivot Finance LLC, Co. Gty., 6.00%, 12/10/19, 144A | | Baa3/BBB | | | 405 | | | | 469,975 | |
Sinochem Overseas Capital Co., Ltd., Co. Gty., 4.50%, 11/12/20, 144A | | Baa1/BBB | | | 500 | | | | 540,100 | |
Sinochem Overseas Capital Co., Ltd., Co. Gty., 6.30%, 11/12/40, 144A | | Baa1/BBB | | | 1,500 | | | | 1,720,931 | |
Union Carbide Corp., Sr. Unsec. Notes, 7.75%, 10/01/96 | | Baa2/BBB | | | 2,000 | | | | 2,336,386 | |
| | | | | | | | | | |
| | | | | | | | | 7,080,476 | |
| | | | | | | | | | |
DIVERSIFIED FINANCIAL SERVICES (12.02%) | | | | | | | | | | |
Akbank TAS, Sr. Unsec. Notes, 6.50%, 03/09/18, 144A | | Baa2/NA | | | 1,000 | | | | 1,130,000 | |
Ally Financial, Inc., Co. Gty., 7.50%, 09/15/20 | | B1/B+ | | | 315 | | | | 384,300 | |
Bank of America Corp., Sr. Unsec. Notes, 5.625%, 07/01/20 | | Baa2/A- | | | 190 | | | | 221,723 | |
Bank of America Corp., Sr. Unsec. Notes, 5.875%, 01/05/21 | | Baa2/A- | | | 500 | | | | 590,475 | |
BNP Paribas SA, Jr. Sub. Notes, 5.186%, 06/29/15, 144A(b),(c) | | Ba2/BBB | | | 1,000 | | | | 960,000 | |
CDP Financial, Inc., Co. Gtd., 4.40%, 11/25/19, 144A | | Aaa/AAA | | | 400 | | | | 457,970 | |
Chase Capital II, Ltd. Gtd., Series B, 0.799%, 02/01/27(b),(d) | | Baa2/BBB | | | 70 | | | | 58,450 | |
Citigroup, Inc., Sr. Unsec. Notes, 6.01%, 01/15/15 | | Baa2/A- | | | 891 | | | | 964,799 | |
Citigroup, Inc., Sr. Unsec. Notes, 8.125%, 07/15/39 | | Baa2/A- | | | 125 | | | | 183,228 | |
Citigroup, Inc., Unsec. Notes, 8.50%, 05/22/19 | | Baa2/A- | | | 595 | | | | 792,688 | |
CoBank ACB, Sub. Notes, 7.875%, 04/16/18, 144A | | NA/A- | | | 500 | | | | 634,427 | |
Discover Financial Services, Sr. Unsec. Notes, 10.25%, 07/15/19 | | Ba1/BBB- | | | 200 | | | | 263,531 | |
Export-Import Bank of Korea, Sr. Unsec. Notes, 8.125%, 01/21/14 | | Aa3/A+ | | | 500 | | | | 528,071 | |
General Electric Capital Corp., Jr. Sub. Notes, Series A, 7.125%, 06/15/22(b),(c) | | Baa1/AA- | | | 3,500 | | | | 4,070,728 | |
General Electric Capital Corp., Sr. Unsec. Notes, 5.625%, 05/01/18 | | A1/AA+ | | | 230 | | | | 272,198 | |
General Electric Capital Corp., Sr. Unsec. Notes, 6.875%, 01/10/39 | | A1/AA+ | | | 1,000 | | | | 1,310,231 | |
HSBC USA Capital Funding LP, Ltd. Gtd., 10.176%, 06/30/30, 144A(b),(c) | | Baa2/BBB+ | | | 1,500 | | | | 2,115,000 | |
HSBC USA Trust II, Bank Gtd., 8.38%, 05/15/27, 144A(d) | | NA/BBB+ | | | 2,500 | | | | 2,552,600 | |
JPMorgan Chase & Co., Sr. Unsec. Notes, 4.40%, 07/22/20 | | A2/A | | | 175 | | | | 193,993 | |
JPMorgan Chase & Co., Sr. Unsec. Notes, 4.35%, 08/15/21 | | A2/A | | | 105 | | | | 115,833 | |
JPMorgan Chase Bank NA, Sub. Notes, 6.00%, 10/01/17 | | A1/A | | | 1,000 | | | | 1,177,949 | |
Merrill Lynch & Co., Inc., Sr. Unsec. Notes, 6.875%, 04/25/18 | | Baa2/A- | | | 1,000 | | | | 1,207,020 | |
Morgan Stanley, Sr. Unsec. Notes, 6.25%, 08/28/17 | | Baa1/A- | | | 300 | | | | 349,136 | |
National Agricultural Cooperative Federation, Sr. Unsec. Notes, 5.00%, 09/30/14, 144A | | A1/A | | | 500 | | | | 528,037 | |
Santander US Debt SA Unipersonal, Bank Gtd., 3.724%, 01/20/15, 144A | | Baa2/BBB | | | 100 | | | | 101,087 | |
UBS AG Stamford CT, Bank Notes, 4.875%, 08/04/20 | | A2/A | | | 250 | | | | 289,582 | |
UBS AG Stamford CT, Sub. Notes, 7.625%, 08/17/22 | | NR/BBB- | | | 2,000 | | | | 2,234,922 | |
UBS Preferred Funding Trust V, Jr. Sub. Notes, Series 1, 6.243%, 05/15/16(b),(c) | | Ba2/BBB- | | | 500 | | | | 516,875 | |
Wachovia Capital Trust III, Ltd. Gtd., 5.57%, 04/29/13(b),(c) | | Baa3/BBB+ | | | 3,500 | | | | 3,512,250 | |
| | | | | | | | | | |
| | | | | | | | | 27,717,103 | |
| | | | | | | | | | |
ENERGY (13.82%) | | | | | | | | | | |
Apache Corp., Sr. Unsec. Notes, 7.70%, 03/15/26 | | A3/A- | | | 500 | | | | 672,876 | |
APT Pipelines, Ltd., Co. Gty., 3.875%, 10/11/22, 144A | | Baa2/BBB | | | 2,000 | | | | 1,987,832 | |
Burlington Resources, Inc., Co. Gty., 9.125%, 10/01/21 | | A1/A | | | 850 | | | | 1,228,384 | |
Citgo Petroleum Corp., Sr. Sec. Notes, 11.50%, 07/01/17, 144A(d) | | Ba2/BB+ | | | 1,000 | | | | 1,146,250 | |
CMS Panhandle Holding Co., Sr. Unsec. Notes, 7.00%, 07/15/29 | | Baa3/BBB- | | | 1,000 | | | | 1,127,490 | |
The accompanying notes are an integral part of these financial statements.
6
SCHEDULE OF INVESTMENTS — continued
| | | | | | | | | | |
| | | Moody’s/
Standard &
Poor’s
Rating(a) | | Principal
Amount (000’s) | | | Value
(Note 1) | |
ENERGY (Continued) | | | | | | | | | | |
EL Paso Corp., Sr. Unsec. Notes, 8.05%, 10/15/30 | | Ba2/BB | | $ | 1,000 | | | $ | 1,118,073 | |
Enterprise Products Operating LLC, Co. Gty., Series B, 7.034%, 01/15/68(b),(d) | | Baa2/BBB- | | | 1,000 | | | | 1,160,000 | |
EQT Corp., Sr. Unsec. Notes, 4.875%, 11/15/21 | | Baa3/BBB | | | 1,455 | | | | 1,541,628 | |
Florida Gas Transmission Co. LLC, Sr. Unsec. Notes, 9.19%, 11/01/24, 144A | | Baa2/BBB | | | 120 | | | | 158,440 | |
IFM US Colonial Pipeline 2 LLC, Sr. Sec. Notes, 6.45%, 05/01/21, 144A(d) | | NA/BBB- | | | 1,000 | | | | 1,122,953 | |
KazMunayGas National Co., Sr. Unsec. Notes, 11.75%, 01/23/15, 144A | | Baa3/BBB- | | | 500 | | | | 579,375 | |
KazMunayGas National Co., Sr. Unsec. Notes, 6.375%, 04/09/21, 144A | | Baa3/BBB- | | | 500 | | | | 581,875 | |
Linn Energy LLC/Linn Energy Finance Corp., Co. Gty., 6.25%, 11/01/19, 144A(d) | | B2/B | | | 500 | | | | 511,250 | |
Lukoil International Finance BV, Co. Gty., 6.125%, 11/09/20, 144A | | Baa2/BBB- | | | 1,000 | | | | 1,135,000 | |
Motiva Enterprises LLC, Notes, 5.75%, 01/15/20, 144A | | A2/A | | | 64 | | | | 76,836 | |
Motiva Enterprises LLC, Sr. Unsec. Notes, 6.85%, 01/15/40, 144A | | A2/A | | | 124 | | | | 166,464 | |
Nabors Industries, Inc., Co. Gty., 9.25%, 01/15/19 | | Baa2/BBB | | | 625 | | | | 803,864 | |
Petroleos Mexicanos, Co. Gty., 8.00%, 05/03/19 | | Baa1/BBB | | | 250 | | | | 320,000 | |
Petroleos Mexicanos, Co. Gty., 6.00%, 03/05/20 | | Baa1/BBB | | | 750 | | | | 885,000 | |
Petroleum Co. of Trinidad & Tobago, Ltd., Sr. Unsec. Notes, 9.75%, 08/14/19, 144A | | Baa3/BBB | | | 500 | | | | 653,750 | |
Pride International, Inc., Co. Gty., 8.50%, 06/15/19 | | Baa1/BBB+ | | | 500 | | | | 660,645 | |
Pride International, Inc., Co. Gty., 6.875%, 08/15/20 | | Baa1/BBB+ | | | 500 | | | | 626,845 | |
Reliance Holdings USA, Inc., Co. Gty., 5.40%, 02/14/22, 144A | | Baa2/BBB | | | 1,250 | | | | 1,393,381 | |
Samson Investment Co., Sr. Unsec. Notes, 9.75%, 02/15/20, 144A(d) | | B3/B- | | | 1,000 | | | | 1,062,500 | |
SEACOR Holdings, Inc., Sr. Unsec. Notes, 7.375%, 10/01/19 | | Ba3/BB | | | 1,000 | | | | 1,086,755 | |
Shell International Finance BV, Co. Gty., 4.30%, 09/22/19 | | Aa1/AA | | | 1,000 | | | | 1,158,312 | |
Transocean, Inc., Co. Gty., 7.50%, 04/15/31 | | Baa3/BBB- | | | 500 | | | | 600,573 | |
Valero Energy Corp., Co. Gty., 9.375%, 03/15/19 | | Baa2/BBB | | | 124 | | | | 169,171 | |
Valero Energy Corp., Co. Gty., 8.75%, 06/15/30 | | Baa2/BBB | | | 1,000 | | | | 1,338,091 | |
Valero Energy Corp., Co. Gty., 10.50%, 03/15/39 | | Baa2/BBB | | | 500 | | | | 800,720 | |
Weatherford International, Ltd. Bermuda, Co. Gty., 6.75%, 09/15/40 | | Baa2/BBB- | | | 2,000 | | | | 2,203,454 | |
Western Atlas, Inc., Sr. Unsec. Notes, 8.55%, 06/15/24 | | A2/A | | | 2,539 | | | | 3,686,171 | |
Williams Cos., Inc., Sr. Unsec. Notes, 8.75%, 03/15/32 | | Baa3/BBB- | | | 81 | | | | 109,052 | |
| | | | | | | | | | |
| | | | | | | | | 31,873,010 | |
| | | | | | | | | | |
FOOD AND BEVERAGE (0.57%) | | | | | | | | | | |
Anheuser-Busch InBev Worldwide, Inc., Co. Gty., 7.75%, 01/15/19 | | A3/A | | | 325 | | | | 427,085 | |
Anheuser-Busch InBev Worldwide, Inc., Co. Gty., 8.20%, 01/15/39 | | A3/A | | | 27 | | | | 43,427 | |
Bunge Ltd. Finance Corp., Co. Gty., 8.50%, 06/15/19 | | Baa2/BBB- | | | 125 | | | | 161,125 | |
Delhaize Group SA, Co. Gty., 5.70%, 10/01/40 | | Baa3/BBB- | | | 709 | | | | 691,704 | |
| | | | | | | | | | |
| | | | | | | | | 1,323,341 | |
| | | | | | | | | | |
GAMING, LODGING & LEISURE (0.11%) | | | | | | | | | | |
Royal Caribbean Cruises, Ltd., Sr. Unsec. Notes, 7.00%, 06/15/13 | | Ba1/BB | | | 250 | | | | 252,500 | |
| | | | | | | | | | |
HEALTHCARE (1.01%) | | | | | | | | | | |
Fresenius Medical Care US Finance, Inc., Co. Gty., 5.75%, 02/15/21, 144A | | Ba2/BB+ | | | 750 | | | | 826,874 | |
Fresenius US Finance II, Inc., Co. Gty., 9.00%, 07/15/15, 144A | | Ba1/BB+ | | | 250 | | | | 286,250 | |
Monsanto Co. (Pharmacia Corp.), Sr. Unsec. Notes, 6.50%, 12/01/18 | | A1/AA | | | 500 | | | | 632,548 | |
Mylan, Inc., Co. Gty., 7.875%, 07/15/20, 144A(d) | | Baa3/BBB- | | | 500 | | | | 583,458 | |
| | | | | | | | | | |
| | | | | | | | | 2,329,130 | |
| | | | | | | | | | |
INDUSTRIAL (4.31%) | | | | | | | | | | |
Affinion Group, Inc., Co. Gty., 11.50%, 10/15/15(d) | | Caa2/CCC | | | 460 | | | | 401,350 | |
Alcoa, Inc., Sr. Unsec. Notes, 6.15%, 08/15/20 | | Baa3/BBB- | | | 640 | | | | 696,803 | |
Alcoa, Inc., Sr. Unsec. Notes, 5.95%, 02/01/37 | | Baa3/BBB- | | | 244 | | | | 235,551 | |
Altria Group, Inc., Co. Gty., 9.70%, 11/10/18 | | Baa1/BBB | | | 317 | | | | 441,159 | |
ArcelorMittal, Sr. Unsec. Notes, 6.75%, 02/25/22 | | Ba1/BB+ | | | 1,200 | | | | 1,311,437 | |
ArcelorMittal, Sr. Unsec. Notes, 7.50%, 10/15/39 | | Ba1/BB+ | | | 405 | | | | 416,138 | |
The accompanying notes are an integral part of these financial statements.
7
SCHEDULE OF INVESTMENTS — continued
| | | | | | | | | | |
| | | Moody’s/
Standard &
Poor’s
Rating(a) | | Principal
Amount (000’s) | | | Value
(Note 1) | |
INDUSTRIAL (Continued) | | | | | | | | | | |
Arrow Electronics, Inc., Sr. Unsec. Notes, 6.00%, 04/01/20 | | Baa3/BBB- | | $ | 500 | | | $ | 560,197 | |
BG Energy Capital PLC, Co. Gty., 6.50%, 11/30/72(b),(d) | | Baa1/BBB+ | | | 2,250 | | | | 2,432,250 | |
GXS Worldwide, Inc., Sr. Sec. Notes, 9.75%, 06/15/15(d) | | B2/B | | | 65 | | | | 67,438 | |
Holcim US Finance Sarl & Cie SCS, Co. Gty., 6.00%, 12/30/19, 144A | | Baa2/BBB | | | 1,000 | | | | 1,168,199 | |
Ingersoll-Rand Global Holding Co., Ltd., Co. Gty., 6.875%, 08/15/18 | | Baa1/BBB+ | | | 185 | | | | 223,288 | |
Meccanica Holdings USA, Inc., Co. Gty., 6.25%, 07/15/19, 144A | | Baa3/BB+ | | | 129 | | | | 132,895 | |
Northrop Grumman Space & Mission Systems Corp., Co. Gty., 7.75%, 06/01/29 | | Baa1/BBB+ | | | 500 | | | | 690,098 | |
Waste Management, Inc., Co. Gty., 7.125%, 12/15/17 | | Baa3/BBB | | | 500 | | | | 612,244 | |
Worthington Industries, Inc., Sr. Unsec. Notes, 6.50%, 04/15/20 | | Baa3/BBB | | | 500 | | | | 546,511 | |
| | | | | | | | | | |
| | | | | | | | | 9,935,558 | |
| | | | | | | | | | |
INSURANCE (8.91%) | | | | | | | | | | |
AIG SunAmerica, Inc., Sr. Unsec. Notes, 8.125%, 04/28/23 | | Baa1/A- | | | 750 | | | | 960,494 | |
Allstate Corp., Jr. Sub. Notes, 6.50%, 05/15/57(b),(d) | | Baa1/BBB | | | 2,200 | | | | 2,409,000 | |
American International Group, Inc., Jr. Sub. Debs., 8.175%, 05/15/68(b),(d) | | Baa2/BBB | | | 2,000 | | | | 2,692,500 | |
Farmers Exchange Capital, Sub. Notes, 7.20%, 07/15/48, 144A | | Baa2/A- | | | 3,000 | | | | 3,586,158 | |
Guardian Life Insurance Co. of America, Sub. Notes, 7.375%, 09/30/39, 144A | | A1/AA- | | | 108 | | | | 145,828 | |
Liberty Mutual Group, Inc., Bonds, 7.00%, 03/15/34, 144A | | Baa2/BBB- | | | 250 | | | | 286,764 | |
Liberty Mutual Group, Inc., Co. Gty., 7.00%, 03/07/67, 144A(b) | | Baa3/BB | | | 500 | | | | 515,000 | |
Liberty Mutual Group, Inc., Co. Gty., 10.75%, 06/15/88, 144A(b),(d) | | Baa3/BB | | | 1,000 | | | | 1,545,000 | |
Lincoln National Corp., Jr. Sub. Notes, 6.05%, 04/20/67(b),(d) | | Ba1/BBB | | | 500 | | | | 502,500 | |
Massachusetts Mutual Life Insurance Co., Sub. Notes, 8.875%, 06/01/39, 144A | | A1/AA- | | | 500 | | | | 772,919 | |
MetLife Capital Trust X, Jr. Sub. Notes, 9.25%, 04/08/68, 144A(d) | | Baa2/BBB | | | 500 | | | | 697,500 | |
MetLife, Inc., Jr. Sub. Notes, 10.75%, 08/01/69(d) | | Baa2/BBB | | | 1,000 | | | | 1,552,500 | |
Nationwide Mutual Insurance Co., Sub. Notes, 9.375%, 08/15/39, 144A | | A3/A- | | | 215 | | | | 311,218 | |
New York Life Insurance Co., Sub. Notes, 6.75%, 11/15/39, 144A | | Aa2/AA- | | | 103 | | | | 138,149 | |
Prudential Financial, Inc., Jr. Sub. Notes, 5.875%, 09/15/42(b),(d) | | Baa3/BBB+ | | | 2,500 | | | | 2,662,500 | |
Prudential Financial, Inc., Jr. Sub. Notes, 8.875%, 06/15/68(b),(d) | | Baa3/BBB+ | | | 1,000 | | | | 1,228,740 | |
Travelers Cos., Inc., Jr. Sub. Notes, 6.25%, 03/15/67(b),(d) | | A3/NR | | | 500 | | | | 537,500 | |
| | | | | | | | | | |
| | | | | | | | | 20,544,270 | |
| | | | | | | | | | |
MEDIA (7.86%) | | | | | | | | | | |
CBS Corp., Co. Gty., 8.875%, 05/15/19 | | Baa2/BBB | | | 350 | | | | 467,466 | |
Comcast Corp., Co. Gty., 7.05%, 03/15/33 | | A3/A- | | | 2,000 | | | | 2,641,494 | |
COX Communications, Inc., Sr. Unsec. Notes, 6.80%, 08/01/28 | | Baa2/BBB | | | 1,500 | | | | 1,867,725 | |
Cox Enterprises, Inc., Sr. Unsec. Notes, 7.375%, 07/15/27, 144A | | Baa2/BBB | | | 500 | | | | 655,893 | |
Grupo Televisa SAB, Sr. Unsec. Notes, 6.625%, 01/15/40 | | Baa1/BBB+ | | | 159 | | | | 193,654 | |
Harcourt General, Inc., Sr. Unsec. Notes, 8.875%, 06/01/22 | | WR/BBB+ | | | 2,000 | | | | 2,594,890 | |
Myriad International Holding BV, Co. Gty., 6.375%, 07/28/17, 144A | | Baa3/NA | | | 100 | | | | 112,630 | |
Nara Cable Funding, Ltd., Sr. Sec. Notes, 8.875%, 12/01/18, 144A(d) | | B1/B+ | | | 1,200 | | | | 1,257,000 | |
News America Holdings, Inc., Co. Gty., 7.90%, 12/01/95 | | Baa1/BBB+ | | | 1,400 | | | | 1,767,132 | |
Time Warner Entertainment Co., LP, Co. Gty., 8.375%, 07/15/33 | | Baa2/BBB | | | 1,360 | | | | 1,880,010 | |
Time Warner, Inc., Co. Gty., 9.15%, 02/01/23 | | Baa2/BBB | | | 3,000 | | | | 4,364,862 | |
Viacom, Inc., Co. Gty., 7.875%, 07/30/30 | | Baa2/BBB | | | 250 | | | | 330,536 | |
| | | | | | | | | | |
| | | | | | | | | 18,133,292 | |
| | | | | | | | | | |
MINING (4.36%) | | | | | | | | | | |
Anglo American Capital PLC, Co. Gty., 9.375%, 04/08/14, 144A | | Baa1/BBB+ | | | 339 | | | | 365,976 | |
Anglo American Capital PLC, Co. Gty., 9.375%, 04/08/19, 144A | | Baa1/BBB+ | | | 500 | | | | 668,173 | |
AngloGold Ashanti Holdings PLC, Co. Gty., 5.375%, 04/15/20 | | Baa2/BBB- | | | 310 | | | | 328,128 | |
Barrick North America Finance LLC, Co. Gty., 6.80%, 09/15/18 | | Baa1/BBB+ | | | 500 | | | | 614,481 | |
Coeur d’Alene Mines Corp., Co. Gty., 7.875%, 02/01/21, 144A(d) | | B3/BB- | | | 750 | | | | 792,188 | |
FMG Resources August 2006 Property Ltd., Sr. Unsec. Notes, 6.875%, 04/01/22, 144A(d) | | B1/B+ | | | 1,200 | | | | 1,257,000 | |
The accompanying notes are an integral part of these financial statements.
8
SCHEDULE OF INVESTMENTS — continued
| | | | | | | | | | |
| | | Moody’s/
Standard &
Poor’s
Rating(a) | | Principal
Amount (000’s) | | | Value
(Note 1) | |
MINING (Continued) | | | | | | | | | | |
Freeport-McMoran Corp., Co. Gty., 9.50%, 06/01/31 | | Baa2/BBB | | $ | 250 | | | $ | 347,345 | |
Newcrest Finance Property, Ltd., Co. Gty., 4.45%, 11/15/21, 144A | | Baa2/BBB+ | | | 1,500 | | | | 1,581,285 | |
Rio Tinto Finance USA, Ltd., Co. Gty., 9.00%, 05/01/19 | | A3/A- | | | 85 | | | | 117,099 | |
Teck Resources, Ltd., Co. Gty., 6.00%, 08/15/40(d) | | Baa2/BBB | | | 1,000 | | | | 1,036,997 | |
Teck Resources, Ltd., Co. Gty., 5.20%, 03/01/42(d) | | Baa2/BBB | | | 1,415 | | | | 1,303,993 | |
Vale Overseas, Ltd., Co. Gty., 6.25%, 01/23/17 | | Baa2/A- | | | 500 | | | | 570,472 | |
Xstrata Canada Financial Corp., Co. Gty., 4.95%, 11/15/21, 144A | | Baa2/BBB+ | | | 1,000 | | | | 1,075,494 | |
| | | | | | | | | | |
| | | | | | | | | 10,058,631 | |
| | | | | | | | | | |
PAPER (1.98%) | | | | | | | | | | |
Celulosa Arauco y Constitucion SA, 4.75%, 01/11/22 | | Baa3/BBB- | | | 1,085 | | | | 1,128,425 | |
Smurfit Kappa Treasury Funding, Ltd., Sr. Sec. Notes, 7.50%, 11/20/25 | | Ba2/BB | | | 2,000 | | | | 2,200,000 | |
Westvaco Corp., Co. Gty., 8.20%, 01/15/30 | | Baa3/BBB | | | 1,000 | | | | 1,245,235 | |
| | | | | | | | | | |
| | | | | | | | | 4,573,660 | |
| | | | | | | | | | |
REAL ESTATE INVESTMENT TRUST (REIT) (4.06%) | | | | | | | | | | |
Biomed Realty LP, Co. Gty., 6.125%, 04/15/20 | | Baa3/BBB- | | | 350 | | | | 410,191 | |
Duke Realty LP, Sr. Unsec. Notes, 6.50%, 01/15/18 | | Baa2/BBB- | | | 500 | | | | 591,226 | |
Duke Realty LP, Sr. Unsec. Notes, 8.25%, 08/15/19 | | Baa2/BBB- | | | 500 | | | | 647,546 | |
Federal Realty Investment Trust, Sr. Unsec. Notes, 6.20%, 01/15/17 | | Baa1/BBB+ | | | 290 | | | | 336,399 | |
Goodman Funding Property, Ltd., Co. Gty., 6.375%, 04/15/21, 144A | | Baa2/BBB | | | 1,050 | | | | 1,215,267 | |
Health Care REIT, Inc., Sr. Unsec. Notes, 5.25%, 01/15/22(d) | | Baa2/BBB- | | | 1,500 | | | | 1,692,222 | |
Host Hotels & Resorts LP, Co. Gty., 6.00%, 11/01/20(d) | | Baa3/BBB- | | | 1,000 | | | | 1,107,500 | |
Liberty Property LP, Sr. Unsec. Notes, 7.50%, 01/15/18 | | Baa1/BBB | | | 1,000 | | | | 1,222,361 | |
Simon Property Group LP, Sr. Unsec. Notes, 6.125%, 05/30/18 | | A3/A- | | | 750 | | | | 916,330 | |
WEA Finance, LLC, Co. Gty., 7.125%, 04/15/18, 144A | | A2/A- | | | 500 | | | | 616,852 | |
WEA Finance, LLC, Co. Gty., 6.75%, 09/02/19, 144A | | A2/A- | | | 500 | | | | 618,344 | |
| | | | | | | | | | |
| | | | | | | | | 9,374,238 | |
| | | | | | | | | | |
RETAIL & RESTAURANT (0.33%) | | | | | | | | | | |
Darden Restaurants, Inc., Sr. Unsec. Notes, 7.125%, 02/01/16 | | Baa2/BBB | | | 500 | | | | 566,631 | |
Limited Brands, Inc., Co. Gty., 8.50%, 06/15/19 | | Ba1/BB+ | | | 150 | | | | 184,125 | |
| | | | | | | | | | |
| | | | | | | | | 750,756 | |
| | | | | | | | | | |
TECHNOLOGY (0.08%) | | | | | | | | | | |
Corning, Inc., Sr. Unsec. Notes, 5.75%, 08/15/40 | | A3/BBB+ | | | 60 | | | | 70,362 | |
Mantech International Corp., Co. Gty., 7.25%, 04/15/18(d) | | Ba2/BB+ | | | 100 | | | | 106,000 | |
| | | | | | | | | | |
| | | | | | | | | 176,362 | |
| | | | | | | | | | |
TELECOMMUNICATIONS (9.41%) | | | | | | | | | | |
Cellco Partnership/Verizon Wireless Capital LLC, Sr. Unsec. Notes, 8.50%, 11/15/18 | | A2/A- | | | 229 | | | | 304,752 | |
Centel Capital Corp., Co. Gty., 9.00%, 10/15/19 | | Baa3/BBB- | | | 1,000 | | | | 1,239,151 | |
Deutsche Telekom International Finance BV, Co. Gtd., 8.75%, 06/15/30 | | Baa1/BBB+ | | | 2,000 | | | | 2,832,042 | |
Digicel, Ltd., Sr. Unsec. Notes, 6.00%, 04/15/21, 144A(d) | | B1/NA | | | 500 | | | | 497,500 | |
Frontier Communications Corp., Sr. Unsec. Notes, 8.125%, 10/01/18 | | Ba2/BB- | | | 500 | | | | 570,000 | |
Frontier Communications Corp., Sr. Unsec. Notes, 9.00%, 08/15/31 | | Ba2/BB- | | | 500 | | | | 516,250 | |
GTE Corp., Co. Gty., 6.94%, 04/15/28 | | Baa1/A- | | | 1,500 | | | | 1,923,660 | |
Hearst-Argyle Television, Inc., Sr. Unsec. Notes, 7.00%, 01/15/18 | | WR/NR | | | 1,000 | | | | 865,000 | |
Level 3 Financing, Inc., Co, Gty., 10.00%, 02/01/18(d) | | B3/CCC | | | 610 | | | | 674,050 | |
MetroPCS Wireless, Inc., Co. Gty., 6.25%, 04/01/21, 144A(d) | | B1/BB | | | 935 | | | | 951,363 | |
MetroPCS Wireless, Inc., Co. Gty., 6.625%, 04/01/23, 144A(d) | | B1/BB | | | 625 | | | | 637,500 | |
NII Capital Corp., Co. Gty., 7.625%, 04/01/21(d) | | Caa1/CCC | | | 635 | | | | 457,200 | |
Qwest Corp., Sr. Unsec. Notes, 7.20%, 11/10/26(d) | | Baa3/BBB- | | | 1,000 | | | | 1,007,993 | |
Qwest Corp., Sr. Unsec. Notes, 6.875%, 09/15/33(d) | | Baa3/BBB- | | | 1,100 | | | | 1,093,380 | |
The accompanying notes are an integral part of these financial statements.
9
SCHEDULE OF INVESTMENTS — continued
| | | | | | | | | | |
| | | Moody’s/
Standard &
Poor’s
Rating(a) | | Principal
Amount (000’s) | | | Value
(Note 1) | |
TELECOMMUNICATIONS (Continued) | | | | | | | | | | |
Qwest Corp., Sr. Unsec. Notes, 7.25%, 10/15/35(d) | | Baa3/BBB- | | $ | 500 | | | $ | 512,740 | |
Sprint Capital Corp., Co. Gty., 6.875%, 11/15/28 | | B3/B+ | | | 1,500 | | | | 1,533,750 | |
Sprint Capital Corp., Co. Gty., 8.75%, 03/15/32 | | B3/B+ | | | 1,000 | | | | 1,192,500 | |
Telecom Italia Capital SA, Co. Gty., 6.999%, 06/04/18 | | Baa2/BBB | | | 1,000 | | | | 1,128,526 | |
Telecom Italia Capital SA, Co. Gty., 6.00%, 09/30/34 | | Baa2/BBB | | | 1,000 | | | | 928,360 | |
Telecom Italia Capital SA, Co. Gty., 7.20%, 07/18/36 | | Baa2/BBB | | | 250 | | | | 249,122 | |
Trilogy International Partners LLC/Trilogy International Finance, Inc., Sr. Sec. Notes, 10.25%, 08/15/16, 144A(d) | | Caa1/CCC | | | 100 | | | | 98,000 | |
Verizon Communications, Inc., Sr. Unsec. Notes, 8.75%, 11/01/18 | | A3/A- | | | 180 | | | | 242,069 | |
Verizon Global Funding Corp., Sr. Unsec. Notes, 7.75%, 12/01/30 | | A3/A- | | | 1,646 | | | | 2,248,610 | |
| | | | | | | | | | |
| | | | | | | | | 21,703,518 | |
| | | | | | | | | | |
TRANSPORTATION (3.31%) | | | | | | | | | | |
BNSF Funding Trust I, Co. Gty., 6.613%, 12/15/55(b),(d) | | Baa2/BBB | | | 250 | | | | 286,250 | |
Continental Airlines, Pass Through Certs., Series 1999-1, Class B, 6.795%, 02/02/20 | | Ba1/BB | | | 321 | | | | 335,193 | |
Continental Airlines, Pass Through Certs., Series 2000-1, Class A1, 8.048%, 05/01/22 | | Baa2/BBB | | | 843 | | | | 977,594 | |
Continental Airlines, Pass Through Certs., Series 2000-2, Class A1, 7.707%, 10/02/22 | | Baa3/BBB- | | | 1,217 | | | | 1,369,216 | |
Delta Air Lines, Pass Through Certs, Series 1993, Class A2, 10.50%, 04/30/16 | | WR/NR | | | 343 | | | | 72,057 | |
ERAC USA Finance, Co., Co. Gty., 7.00%, 10/15/37, 144A | | Baa1/BBB+ | | | 1,500 | | | | 1,913,780 | |
Federal Express Corp., Pass Through Certs, Series 1996, Class B2, 7.84%, 01/30/18(d) | | A3/BBB | | | 1,000 | | | | 1,149,490 | |
Norfolk Southern Corp., Sr. Unsec. Notes, 5.75%, 04/01/18 | | Baa1/BBB+ | | | 170 | | | | 203,690 | |
Stena AB, Sr. Unsec. Notes, 7.00%, 12/01/16(d) | | B2/BB | | | 1,325 | | | | 1,325,000 | |
| | | | | | | | | | |
| | | | | | | | | 7,632,270 | |
| | | | | | | | | | |
UTILITIES (4.97%) | | | | | | | | | | |
Avista Corp., 5.95%, 06/01/18 | | A3/A- | | | 500 | | | | 604,423 | |
Dominion Resources, Inc., Sr. Unsec. Notes, Series 07-A, 6.00%, 11/30/17 | | Baa2/A- | | | 500 | | | | 599,735 | |
DPL, Inc., Sr. Unsec. Notes, 7.25%, 10/15/21(d) | | Ba1/BB- | | | 1,000 | | | | 1,060,000 | |
Duquesne Light Holdings, Inc., Sr. Unsec. Notes, 6.40%, 09/15/20, 144A | | Baa3/BBB- | | | 1,000 | | | | 1,215,852 | |
Electricite de France SA, Sub., 5.25%, 01/29/23, 144A(b)(c) | | A3/BBB+ | | | 2,000 | | | | 1,986,880 | |
Hydro-Quebec, 8.25%, 04/15/26 | | Aa2/A+ | | | 1,550 | | | | 2,340,601 | |
MidAmerican Funding LLC, Sr. Sec. Notes, 6.927%, 03/01/29 | | A3/BBB+ | | | 500 | | | | 662,592 | |
NextEra Energy Capital Holding, Inc., Jr. Sub. Notes., Series D, 7.30%, 09/01/67(b),(d) | | Baa2/BBB | | | 500 | | | | 565,000 | |
Ohio Power Co., Sr. Unsec. Notes, 6.00%, 06/01/16 | | Baa1/BBB | | | 500 | | | | 572,472 | |
Ohio Power Co., Sr. Unsec. Notes, 5.375%, 10/01/21 | | Baa1/BBB | | | 1,000 | | | | 1,203,608 | |
Toledo Edison Co., 7.25%, 05/01/20 | | Baa1/BBB | | | 500 | | | | 641,982 | |
| | | | | | | | | | |
| | | | | | | | | 11,453,145 | |
| | | | | | | | | | |
TOTAL CORPORATE DEBT SECURITIES (Cost of $160,120,069) | | | | | | | | | 187,832,863 | |
| | | | | | | | | | |
ASSET BACKED SECURITIES (3.42%) | | | | | | | | | | |
ALM Loan Funding, Series 2012-7A, Class A2, 2.602%, 10/19/24, 144A(b) | | NR/AA | | | 2,000 | | | | 2,016,957 | |
Credit-Based Asset Servicing and Securitization LLC, Series 2006-SC1, Class A, 0.474%, 05/25/36, 144A(b) | | A3/AAA | | | 51 | | | | 44,073 | |
Dominos Pizza Master Issuer LLC, Series 2012-1A, Class A2, 5.216%, 01/25/42, 144A | | Baa1/BBB+ | | | 1,478 | | | | 1,658,107 | |
Dryden XXIV Senior Loan Fund Notes, Class A, CLO, 1.72%, 11/15/23, 144A(b) | | Aaa/AAA | | | 2,500 | | | | 2,511,775 | |
Option One Mortgage Loan Trust, Series 2007-FXD2, Class 2A1, 5.90%, 03/25/37(e) | | A2/AA- | | | 110 | | | | 108,107 | |
Renaissance Home Equity Loan Trust, Series 2006-3, Class AF2, 5.58%, 11/25/36(e) | | Ca/CCC | | | 159 | | | | 93,634 | |
Small Business Administration Participation Certificates, Series 2010-20F, Class 1,
3.88%, 06/01/30 | | Aaa/AA+ | | | 280 | | | | 304,285 | |
Sonic Capital LLC, Series 2011-1A, Class A2, 5.438%, 05/20/41, 144A | | Baa2/BBB | | | 1,018 | | | | 1,142,311 | |
| | | | | | | | | | |
TOTAL ASSET BACKED SECURITIES (Cost of $7,585,736) | | | | | | | | | 7,879,249 | |
| | | | | | | | | | |
The accompanying notes are an integral part of these financial statements.
10
SCHEDULE OF INVESTMENTS — continued
| | | | | | | | | | |
| | | Moody’s/
Standard &
Poor’s
Rating(a) | | Principal
Amount (000’s) | | | Value
(Note 1) | |
COMMERCIAL MORTGAGE-BACKED SECURITIES (6.86%) | | | | | | | | | | |
Banc of America Merrill Lynch Commercial Mortgage, Inc, Series 2006-2, Class AJ, 5.763%, 05/10/45(b) | | NA/BBB- | | $ | 1,000 | | | $ | 1,046,892 | |
Banc of America Merrill Lynch Commercial Mortgage, Inc., Series 2006-2, Class AM, 5.763%, 05/10/45(b) | | NA/A | | | 1,440 | | | | 1,616,576 | |
Citigroup/Deutsche Bank Commercial Mortgage Trust, Series 2006-CD2, Class AM, 5.352%, 01/15/46(b) | | Aa3/A- | | | 2,500 | | | | 2,725,160 | |
Citigroup/Deutsche Bank Commercial Mortgage Trust, Series 2007-CD4, Class A4, 5.322%, 12/11/49 | | Aa3/AAA | | | 285 | | | | 323,954 | |
CW Capital Cobalt, Ltd., Series 2007-C2, Class A3, 5.484%, 04/15/47(b) | | Aaa/NA | | | 500 | | | | 571,100 | |
Developers Diversified Realty Corp., Series 2009-DDR1, Class C, 6.223%, 10/14/22, 144A | | A1/AA+ | | | 2,000 | | | | 2,123,172 | |
FREMF Mortgage Trust, Series 2012-K18, Class B, 4.265%, 01/25/45, 144A(b) | | NA/NA | | | 1,600 | | | | 1,695,662 | |
JPMorgan Chase Commercial Mortgage Securities Corp., Series 2007-LDPX, Class A3, 5.42%, 01/15/49 | | Aaa/NA | | | 160 | | | | 181,927 | |
LB-UBS Commercial Mortgage Trust, Series 2006-C4, Class AM, 5.886%, 06/15/38(b) | | A2/BB | | | 2,000 | | | | 2,235,026 | |
Morgan Stanley Capital I Trust, Series 2006-HQ10, Class AM, 5.36%, 11/12/41 | | A2/NA | | | 2,000 | | �� | | 2,178,076 | |
Morgan Stanley Capital I Trust, Series 2007-IQ16, Class A4, 5.809%, 12/12/49 | | NA/AA+ | | | 750 | | | | 874,782 | |
Morgan Stanley Reremic Trust, Series 2009-GG10, Class A4B, 5.787%, 08/12/45, 144A(b) | | A3/NA | | | 210 | | | | 238,546 | |
| | | | | | | | | | |
TOTAL COMMERCIAL MORTGAGE-BACKED SECURITIES (Cost of $14,157,347) | | | | | | | | | 15,810,873 | |
| | | | | | | | | | |
RESIDENTIAL MORTGAGE-BACKED SECURITIES (0.86%) | | | | | | | | | | |
FHLMC Pool # 170128, 11.50%, 06/01/15 | | Aaa/AA+ | | | 1 | | | | 924 | |
FHLMC Pool # 360019, 10.50%, 12/01/17 | | Aaa/AA+ | | | 2 | | | | 1,990 | |
FHLMC Pool # A15675, 6.00%, 11/01/33 | | Aaa/AA+ | | | 490 | | | | 547,690 | |
FHLMC Pool # G00182, 9.00%, 09/01/22 | | Aaa/AA+ | | | 1 | | | | 954 | |
FNMA Pool # 124012, 12.50%, 10/01/15 | | Aaa/AA+ | | | 2 | | | | 2,353 | |
FNMA Pool # 303022, 8.00%, 09/01/24 | | Aaa/AA+ | | | 17 | | | | 20,194 | |
FNMA Pool # 303136, 8.00%, 01/01/25 | | Aaa/AA+ | | | 8 | | | | 9,649 | |
FNMA Pool # 55192, 10.50%, 09/01/17 | | Aaa/AA+ | | | 5 | | | | 5,378 | |
FNMA Pool # 58991, 11.00%, 02/01/18 | | Aaa/AA+ | | | 3 | | | | 3,305 | |
FNMA Pool # 754791, 6.50%, 12/01/33 | | Aaa/AA+ | | | 569 | | | | 649,654 | |
FNMA Pool # 763852, 5.50%, 02/01/34 | | Aaa/AA+ | | | 449 | | | | 495,318 | |
FNMA Pool # 889554, 6.00%, 04/01/38 | | Aaa/AA+ | | | 160 | | | | 175,024 | |
GNSF Pool # 194228, 9.50%, 11/15/20 | | Aaa/AA+ | | | 18 | | | | 18,457 | |
GNSF Pool # 307527, 9.00%, 06/15/21 | | Aaa/AA+ | | | 18 | | | | 20,940 | |
GNSF Pool # 417239, 7.00%, 02/15/26 | | Aaa/AA+ | | | 21 | | | | 24,957 | |
GNSF Pool # 780374, 7.50%, 12/15/23 | | Aaa/AA+ | | | 11 | | | | 12,362 | |
| | | | | | | | | | |
TOTAL RESIDENTIAL MORTGAGE-BACKED SECURITIES (Cost of $1,663,390) | | | | | | | | | 1,989,149 | |
| | | | | | | | | | |
MUNICIPAL BONDS (1.50%) | | | | | | | | | | |
Municipal Electric Authority of Georgia, Build America Bonds-Taxable-Plant Vogle Units 3&4, Series J, Revenue Bond, 6.637%, 04/01/57 | | A2/A+ | | | 175 | | | | 206,902 | |
San Francisco City & County Public Utilities Commission, Water Revenue, Build America Bonds, 6.00%, 11/01/40 | | Aa3/AA- | | | 145 | | | | 181,112 | |
State of California, Build America Bonds, GO, 7.625%, 03/01/40 | | A1/A | | | 1,500 | | | | 2,169,300 | |
State of Illinois, Build America Bonds, GO, 7.35%, 07/01/35 | | A2/A- | | | 755 | | | | 905,373 | |
| | | | | | | | | | |
TOTAL MUNICIPAL BONDS (Cost of $2,666,191) | | | | | | | | | 3,462,687 | |
| | | | | | | | | | |
U.S. TREASURY SECURITIES (2.61%) | | | | | | | | | | |
U.S. Treasury Note, 1.00%, 10/31/16 | | Aaa/AA+ | | | 3,075 | | | | 3,131,937 | |
U.S. Treasury Note, 1.00%, 03/31/17 | | Aaa/AA+ | | | 670 | | | | 681,673 | |
U.S. Treasury Note, 0.875%, 01/31/18 | | Aaa/AA+ | | | 830 | | | | 835,382 | |
U.S. Treasury Note, 1.375%, 11/30/18 | | Aaa/AA+ | | | 1,000 | | | | 1,025,312 | |
U.S. Treasury Note, 3.125%, 05/15/21 | | Aaa/AA+ | | | 310 | | | | 349,065 | |
| | | | | | | | | | |
TOTAL U.S. TREASURY SECURITIES (Cost of $5,897,262) | | | | | | | | | 6,023,369 | |
| | | | | | | | | | |
The accompanying notes are an integral part of these financial statements.
11
SCHEDULE OF INVESTMENTS — continued
| | | | | | | | | | |
| | | Moody’s/
Standard &
Poor’s
Rating(a) | | Shares | | | Value
(Note 1) | |
COMMON STOCK (0.02%) | | | | | | | | | | |
MEDIA (0.02%) | | | | | | | | | | |
Quad Graphics, Inc. | | | | | 1,617 | | | $ | 38,711 | |
| | | | | | | | | | |
TRANSPORTATION (0.00%) | | | | | | | | | | |
Delta Air Lines, Inc.(f) | | | | | 1 | | | | 9 | |
| | | | | | | | | | |
TOTAL COMMON STOCK (Cost of $74,501) | | | | | | | | | 38,720 | |
| | | | | | | | | | |
PREFERRED STOCK (1.25%) | | | | | | | | | | |
CoBank ACB, Series F, 6.250% | | | | | 20,000 | | | | 2,125,626 | |
Federal Home Loan Mortgage Corp, Series Z, 0.000%(f),(g) | | | | | 53,779 | | | | 181,854 | |
US BANCORP, Series A, 3.500% | | | | | 615 | | | | 574,410 | |
| | | | | | | | | | |
TOTAL PREFERRED STOCK (Cost of $3,868,939) | | | | | | | | | 2,881,890 | |
| | | | | | | | | | |
RIGHTS (0.00%) | | | | | | | | | | |
XO Holdings, Inc., Expire 12/31/99 | | | | | 13 | | | | — | |
| | | | | | | | | | |
TOTAL RIGHTS (Cost $0) | | | | | | | | | — | |
| | | | | | | | | | |
TOTAL INVESTMENTS (97.97%) | | | | | | | | | | |
(Cost $196,033,435) | | | | | | | | | 225,918,800 | |
| | | | | | | | | | |
OTHER ASSETS AND LIABILITIES (2.03%) | | | | | | | | | 4,689,253 | |
| | | | | | | | | | |
NET ASSETS (100.00%) | | | | | | | | $ | 230,608,053 | |
| | | | | | | | | | |
| (a) | Ratings for debt securities are unaudited. All ratings are as of March 31, 2013 and may have changed subsequently. |
| (b) | Variable rate security. Rate disclosed is as of March 31, 2013. |
| (c) | Security is perpetual. Date shown is next call date. |
| (d) | This security is callable. |
| (e) | Multi-Step Coupon. Rate disclosed is as of March 31, 2013. |
| (f) | Non-income producing security. |
| (g) | Dividend was discontinued as of September 7, 2008. |
| 144A | Securities were purchased pursuant to Rule 144A under the Securities Act of 1933 and may not be resold subject to that rule except to qualified institutional buyers. At March 31, 2013, these securities amounted to $63,070,825 or 27.35% of net assets. |
The accompanying notes are an integral part of these financial statements.
12
SCHEDULE OF INVESTMENTS — continued
Legend
Certs. - Certificates
CLO - Collateralized Loan Obligation
Co. Gty. - Company Guaranty
Debs. - Debentures
FHLMC - Federal Home Loan Mortgage Corp.
FNMA - Federal National Mortgage Association
FREMF - Freddie Multi-Family
GNSF - Government National Mortgage Association (Single Family)
GO - General Obligation
Gtd. - Guaranteed
Jr. - Junior
LLC - Limited Liability Company
Ltd. - Limited
NA - Not Available
NR - Not Rated
REIT - Real Estate Investment trust
Sec. - Secured
Sr. - Senior
Sub. - Subordinated
Unsec. - Unsecured
WR - Withdrawn Rating
The accompanying notes are an integral part of these financial statements.
13
STATEMENT OF ASSETS AND LIABILITIES
March 31, 2013
| | | | |
Assets: | | | | |
Investment in securities, at value (amortized cost $196,033,435) (Note 1) | | $ | 225,918,800 | |
Cash | | | 1,446,738 | |
Receivables for Investments Sold | | | 114 | |
Interest receivable | | | 3,384,788 | |
Dividend receivable | | | 36,688 | |
Prepaid expenses | | | 22,677 | |
| | | | |
TOTAL ASSETS | | | 230,809,805 | |
| | | | |
Liabilities: | | | | |
Payable to Investment Adviser | | | 86,806 | |
Accrued expenses payable | | | 114,946 | |
| | | | |
TOTAL LIABILITIES | | | 201,752 | |
| | | | |
Net assets: (equivalent to $21.53 per share based on 10,708,597 shares of capital stock outstanding) | | $ | 230,608,053 | |
| | | | |
NET ASSETS consisted of: | | | | |
Capital stock, $0.01 par value | | $ | 107,086 | |
Capital paid-in | | | 217,372,775 | |
Accumulated net investment income | | | 383,805 | |
Accumulated net realized loss on investments | | | (17,140,978 | ) |
Net unrealized appreciation on investments | | | 29,885,365 | |
| | | | |
| | $ | 230,608,053 | |
| | | | |
The accompanying notes are an integral part of these financial statements.
14
STATEMENT OF OPERATIONS
For the year ended March 31, 2013
| | | | | | | | |
Investment Income: | | | | | | | | |
Interest | | | $ | 12,868,991 | |
Dividends | | | | 89,767 | |
Other income | | | | 49,542 | |
| | | | | | | | |
Total Investment Income | | | | | | | 13,008,300 | |
| | | | | | | | |
Expenses: | | | | | | | | |
Investment advisory fees (Note 4) | | $ | 1,004,805 | | | | | |
Administration fees | | | 193,736 | | | | | |
Transfer agent fees | | | 50,186 | | | | | |
Trustees’ fees (Note 4) | | | 95,533 | | | | | |
Audit fees | | | 25,950 | | | | | |
Legal fees and expenses | | | 84,139 | | | | | |
Reports to shareholders | | | 77,086 | | | | | |
Custodian fees | | | 23,140 | | | | | |
Insurance | | | 33,812 | | | | | |
NYSE fee | | | 31,550 | | | | | |
Miscellaneous | | | 54,899 | | | | | |
| | | | | | | | |
Total Expenses | | | | 1,674,836 | |
| | | | | | | | |
Net Investment Income | | | | 11,333,464 | |
| | | | | | | | |
Realized and unrealized gain (loss) on investments (Note 1): | | | | | | | | |
Net realized gain from security transactions | | | | | | | 4,596,190 | |
| | | | | | | | |
Unrealized appreciation (depreciation) of investments: | | | | | | | | |
Beginning of the period | | | 21,938,662 | | | | | |
End of the period | | | 29,885,365 | | | | | |
| | | | | | | | |
Change in unrealized appreciation of investments | | | | | | | 7,946,703 | |
| | | | | | | | |
Net realized and unrealized gain on investments | | | | | | | 12,542,893 | |
| | | | | | | | |
Net increase in net assets resulting from operations | | | | | | $ | 23,876,357 | |
| | | | | | | | |
The accompanying notes are an integral part of these financial statements.
15
STATEMENTS OF CHANGES IN NET ASSETS
| | | | | | | | |
| | | Year ended
March 31, 2013 | | | Year ended
March 31, 2012 | |
Increase (decrease) in net assets: | | | | | | | | |
Operations: | | | | | | | | |
Net investment income | | $ | 11,333,464 | | | $ | 11,577,713 | |
Net realized gain from security transactions (Note 2) | | | 4,596,190 | | | | 630,879 | |
Change in unrealized appreciation of investments | | | 7,946,703 | | | | 4,163,867 | |
| | | | | | | | |
Net increase in net assets resulting from operations | | | 23,876,357 | | | | 16,372,459 | |
| | | | | | | | |
Distributions: | | | | | | | | |
Distributions to shareholders from net investment income | | | (11,592,057 | ) | | | (12,314,889 | ) |
| | | | | | | | |
Increase in net assets | | | 12,284,300 | | | | 4,057,570 | |
Net Assets: | | | | | | | | |
Beginning of year | | | 218,323,753 | | | | 214,266,183 | |
| | | | | | | | |
End of year | | $ | 230,608,053 | | | $ | 218,323,753 | |
| | | | | | | | |
Accumulated net investment income | | $ | 383,805 | | | $ | 266,040 | |
| | | | | | | | |
The accompanying notes are an integral part of these financial statements.
16
FINANCIAL HIGHLIGHTS
The table below sets forth financial data for a share of capital stock outstanding throughout each year presented.
| | | | | | | | | | | | | | | | | | | | |
| | | Year ended March 31, | |
| | | 2013 | | | 2012 | | | 2011 | | | 2010 | | | 2009 | |
Per Share Operating Performance | | | | | | | | | | | | | | | | | | | | |
Net asset value, beginning of year | | | $20.39 | | | | $20.01 | | | | $19.10 | | | | $15.63 | | | | $19.01 | |
| | | | | | | | | | | | | | | | | | | | |
Net investment income | | | 1.06 | | | | 1.08 | | | | 1.14 | (1) | | | 1.19 | | | | 1.06 | |
Net realized and unrealized gain (loss) on investments | | | 1.16 | | | | 0.45 | | | | 0.92 | | | | 4.31 | | | | (3.29 | ) |
| | | | | | | | | | | | | | | | | | | | |
Total from investment operations | | | 2.22 | | | | 1.53 | | | | 2.06 | | | | 5.50 | | | | (2.23 | ) |
| | | | | | | | | | | | | | | | | | | | |
Capital share transaction: | | | | | | | | | | | | | | | | | | | | |
Dilution of the net asset value from rights offering (Note 6) | | | — | | | | — | | | | — | | | | (0.88 | ) | | | — | |
| | | | | | | | | | | | | | | | | | | | |
Less distributions: | | | | | | | | | | | | | | | | | | | | |
Dividends from net investment income | | | (1.08 | ) | | | (1.15 | ) | | | (1.15 | ) | | | (1.15 | ) | | | (1.15 | ) |
| | | | | | | | | | | | | | | | | | | | |
Total distributions | | | (1.08 | ) | | | (1.15 | ) | | | (1.15 | ) | | | (1.15 | ) | | | (1.15 | ) |
| | | | | | | | | | | | | | | | | | | | |
Net asset value, end of year | | | $21.53 | | | | $20.39 | | | | $20.01 | | | | $19.10 | | | | $15.63 | |
| | | | | | | | | | | | | | | | | | | | |
Per share market price, end of year | | | $20.06 | | | | $19.74 | | | | $18.03 | | | | $17.12 | | | | $13.77 | |
| | | | | | | | | | | | | | | | | | | | |
Total Investment Return(2) | | | | | | | | | | | | | | | | | | | | |
Based on market value | | | 7.24 | % | | | 16.37 | % | | | 12.23 | % | | | 33.60 | % | | | (13.62 | )% |
Ratios/Supplemental Data | | | | | | | | | | | | | | | | | | | | |
Net assets, end of year (in 000’s) | | | $230,608 | | | | $218,324 | | | | $214,266 | | | | $125,253 | | | | $76,720 | |
Ratio of expenses to average net assets | | | 0.74 | % | | | 0.74 | % | | | 0.79 | % | | | 0.85 | % | | | 1.21 | % |
Ratio of net investment income to average net assets | | | 5.03 | % | | | 5.37 | % | | | 5.76 | % | | | 6.16 | % | | | 6.18 | % |
Portfolio turnover rate | | | 20.39 | % | | | 19.60 | % | | | 19.91 | % | | | 15.40 | % | | | 21.46 | % |
Number of shares outstanding at the end of the year (in 000’s) | | | 10,709 | | | | 10,709 | | | | 10,709 | | | | 6,559 | | | | 4,908 | |
| (1) | The selected per share data was calculated using the average shares outstanding method. |
| (2) | Total investment return is calculated assuming a purchase of common shares at the market price on the first day and a sale at the market price on the last day of the period reported. Dividends and distributions, if any, are assumed for purposes of this calculation to be reinvested at prices obtained under the Fund’s dividend reinvestment plan. Total investment return does not reflect brokerage commissions. The total investment return, if for less than a full year, is not annualized. Past performance is not a guarantee of future results. |
The accompanying notes are an integral part of these financial statements.
17
NOTES TO FINANCIAL STATEMENTS (Unaudited)
Note 1 – Significant Accounting Policies – The Cutwater Select Income Fund (the “Fund”), a Delaware statutory trust, is registered under the Investment Company Act of 1940, as amended (“1940 Act”), as a diversified closed-end, management investment company. The following is a summary of significant accounting policies consistently followed by the Fund in preparation of its financial statements. The policies are in conformity with generally accepted accounting principles within the United States of America (“GAAP”).
| A. | Security Valuation – In valuing the Fund’s net assets, all securities for which representative market quotations are available will be valued at the last quoted sales price on the security’s principal exchange on the day of valuation. If there are no sales of the relevant security on such day, the security will be valued at the bid price at the time of computation. For securities traded in the over-the-counter market, including listed debt and preferred securities, whose primary market is believed to be over-the-counter, the Fund uses recognized industry pricing services – approved by the Board and unaffiliated with the Adviser - and uses broker quotes provided by market makers of securities not valued by these and other recognized pricing sources. |
In the event that market quotations are not readily available, or when such quotations are deemed not to reflect current market value, the securities will be valued at their respective fair value as determined in good faith by the Adviser pursuant to certain procedures and reporting requirements established by the Board of Trustees. The Adviser considers all relevant facts that are reasonably available when determining the fair value of a security, including but not limited to the last sale price or initial purchase price (if a when issued security) and subsequently adjusting the value based on changes in company specific fundamentals, changes in an appropriate securities index, or changes in the value of similar securities which may be further adjusted for any discounts related to security-specific resale restrictions. When possible, observable market inputs such as unadjusted quoted prices of similar securities, observable interest rates, currency rates and yield curves are utilized. At March 31, 2013, there were no securities valued using fair value procedures.
Fair Value Measurements – The Fund has adopted authoritative fair value accounting standards which establish a definition of fair value and set out a hierarchy for measuring fair value. These standards require additional disclosures about the various inputs and valuation techniques used to develop the measurements of fair value, a discussion in changes in valuation techniques and related inputs during the period and expanded disclosure of valuation levels for major security types. These inputs are summarized in the three broad levels listed below:
| | |
• Level 1 – | | Unadjusted quoted prices in active markets for identical assets or liabilities that the Fund has the ability to access. |
| |
• Level 2 – | | Observable inputs other than quoted prices included in level 1 that are observable for the asset or liability, either directly or indirectly. These inputs may include quoted prices for the identical instrument on an inactive market, prices for similar instruments, interest rates, prepayment speeds, credit risk, yield curves, default rates and similar data. |
| |
• Level 3 – | | Unobservable inputs for the asset or liability, to the extent relevant observable inputs are not available, representing the Fund’s own assumptions about the assumptions a market participant would use in valuing the asset or liability, and would be based on the best information available. |
18
NOTES TO FINANCIAL STATEMENTS (Unaudited) — continued
Following is a description of the valuation techniques applied to the Fund’s major categories of assets measured at fair value on a recurring basis as of March 31, 2013.
| | | | | | | | | | | | | | | | |
| | | Total Market
Value at
03/31/13 | | | Level 1
Quoted
Price | | | Level 2
Significant
Observable
Inputs | | | Level 3
Significant
Unobservable
Inputs | |
CORPORATE DEBT SECURITIES | | $ | 187,832,863 | | | $ | — | | | $ | 187,832,863 | | | $ | — | |
ASSET BACKED SECURITIES | | | 7,879,249 | | | | — | | | | 7,879,249 | | | | — | |
COMMERCIAL MORTGAGE-BACKED SECURITIES | | | 15,810,873 | | | | — | | | | 15,810,873 | | | | — | |
RESIDENTIAL MORTGAGE-BACKED SECURITIES | | | 1,989,149 | | | | — | | | | 1,989,149 | | | | — | |
MUNICIPAL BONDS | | | 3,462,687 | | | | — | | | | 3,462,687 | | | | — | |
U.S. TREASURY SECURITIES | | | 6,023,369 | | | | — | | | | 6,023,369 | | | | — | |
COMMON STOCK* | | | 38,720 | | | | 38,720 | | | | — | | | | — | |
PREFERRED STOCK | | | 2,881,890 | | | | 2,881,890 | | | | — | | | | — | |
RIGHTS | | | — | | | | — | | | | — | | | | — | |
TOTAL INVESTMENTS | | $ | 225,918,800 | | | $ | 2,920,610 | | | $ | 222,998,190 | | | $ | — | |
| * | See Schedule of Investments for industry breakout. |
At the end of each calendar quarter, management evaluates the Level 1, 2 and 3 assets and liabilities for changes in liquidity, including but not limited to: whether a broker is willing to execute at the quoted price, the depth and consistency of prices from third party services, and the existence of contemporaneous, observable trades in the market. Additionally, management evaluates Level 1 and 2 assets and liabilities on a quarterly basis for changes in listings or delistings on national exchanges. Due to the inherent uncertainty of determining the fair value of investments that do not have a readily available market value, the fair value of the Fund’s investments may fluctuate from period to period. Additionally, the fair value of investments may differ significantly from the values that would have been used had a ready market existed for such investments and may differ materially from the values the Fund may ultimately realize. Further, such investments may be subject to legal and other restrictions on resale or otherwise less liquid than publicly traded securities. Pursuant to Fund policy, transfers between levels are considered to have occurred at the beginning of the reporting period. For the year ended March 31, 2013, there were no transfers between Level 1, Level 2 and Level 3 for the Fund.
Level 3 investments are categorized as Level 3 with values derived utilizing prices from prior transactions or third party pricing information without adjustment (broker quotes, pricing services and net asset values). A significant change in third party pricing information could result in a significantly lower or higher value in such Level 3 investments. Rights are valued at zero as of March 31, 2013 and are included in the Level 3 investments.
When-Issued Securities – The Fund may enter into commitments to purchase securities on a forward or when-issued basis. When-issued securities are securities purchased for delivery beyond the normal settlement date at a stated price and yield. In the Fund’s case, these securities are subject to settlement within 45 days of the purchase date. The interest rate realized on these securities is fixed as of the purchase date. The Fund does not pay for such securities prior to the settlement date and no interest accrues to the Fund before settlement. These securities are subject to market fluctuation due to changes in market interest rates. The Fund will enter into these commitments with the intent of buying the security but may dispose of such security prior to settlement. At the time the commitment is entered into, the Fund will establish and maintain
19
NOTES TO FINANCIAL STATEMENTS (Unaudited) — continued
a segregated account in an amount sufficient to cover the obligation under the when-issued contract. At the time the Fund makes the commitment to purchase securities on a when-issued basis, it will record the transaction and thereafter reflect the value of such security purchased in determining its NAV. At the time of delivery of the security, its value may be more or less than the fixed purchase price.
| B. | Determination of Gains or Losses on Sale of Securities – Gains or losses on the sale of securities are calculated for financial reporting purposes and for federal tax purposes using the identified cost basis. The identified cost basis for financial reporting purposes differs from that used for federal tax purposes in that the amortized cost of the securities sold is used for financial reporting purposes and the original cost of the securities sold is used for federal tax purposes, except for those instances where tax regulations require the use of amortized cost. |
| C. | Federal Income Taxes – It is the Fund’s policy to continue to comply with the requirements of the Internal Revenue Code applicable to regulated investment companies and to distribute all of its taxable income to its shareholders. Therefore, no federal income tax provision is required. |
| | Management has analyzed the Fund’s tax positions taken on federal income tax returns for all open tax years (tax years March 31, 2010-2012) or expected to be taken on the Fund’s 2013 tax return, and has concluded that no provision for federal income tax is required in the Fund’s financial statements. The Fund’s federal and state income and federal excise tax returns for tax years for which the applicable statutes of limitations have not expired are subject to examination by the Internal Revenue Service and state departments of revenue. |
| D. | Other – Security transactions are accounted for on the trade date. Interest income is accrued daily. Premiums and discounts are amortized using the interest method. Paydown gains and losses on mortgage-backed and asset-backed securities are presented as an adjustment to interest income. Dividend income and distributions to shareholders are recorded on the ex-dividend date. |
| E. | Distributions to Shareholders and Book/Tax Differences – Distributions of net investment income will be made quarterly. Distributions of any net realized capital gains will be made annually. Income and capital gain distributions are determined in accordance with federal income tax regulations, which may differ from GAAP. These differences are primarily due to differing treatments for amortization of market premium and accretion of market discount. |
| | In order to reflect permanent book/tax differences that occurred during the fiscal year ended March 31, 2013, the following capital accounts were adjusted for the following amounts: |
| | | | | | | | | | |
Undistributed
Net Investment Income | | Net Realized
Gain | | Accumulated
Paid-In
Capital |
$376,358 | | | $ | (376,358 | ) | | | $ | — | |
| | Distributions during the fiscal years ended March 31, 2013 and 2012 were characterized as follows for tax purposes: |
| | | | | | | | |
| | | Ordinary Income | | Return of Capital | | Capital Gain | | Total Distribution |
FY 2013 | | $11,592,057 | | $ — | | $ — | | $11,592,057 |
FY 2012 | | $12,314,889 | | $ — | | $ — | | $12,314,889 |
20
NOTES TO FINANCIAL STATEMENTS (Unaudited) — continued
| | At March 31, 2013, the components of distributable earnings on a tax basis were as follows: |
| | | | | | | | |
Total* | | Accumulated
Ordinary Income | | Capital Loss
Carryforward and Other | | Late Year Losses
Deferred | | Net Unrealized
Appreciation |
$13,128,192 | | $912,926 | | $(16,977,733) | | $(104,931) | | $29,297,930 |
| | | | | | | | | |
| | * | Temporary differences include book amortization, book accretion, and late year losses deferred, if any, which will be recognized for the tax year ending March 31, 2013. |
| | The Regulated Investment Company Modernization Act of 2010 (the “Act”) was enacted on December 22, 2010. The Act makes changes to several tax rules impacting the Fund. In general, the provisions of the Act are in effect for the Fund’s fiscal year ended March 31, 2012. Although the Act provides several benefits, including the unlimited carryover of future capital losses, there may be a greater likelihood that all or a portion of the Fund’s pre-enactment capital loss carryovers may expire without being utilized due to the fact that post-enactment capital losses must be utilized before pre-enactment capital loss carryovers may be utilized. Under the Act, new capital losses may now be carried forward indefinitely, and retain the character of the original loss as compared with pre-enactment law, where capital losses could be carried forward for up to eight years, and carried forward as short-term capital losses, irrespective of the character of the original loss. |
| | As of March 31, 2013, the capital loss carryovers available to offset possible future capital gains and the expiration dates from pre-enactment taxable years were as follows: |
| | | | |
Amount | | Expiration Date | |
$ 5,137,124 | | | 2016 | |
10,295,168 | | | 2017 | |
1,545,441 | | | 2018 | |
| | There were no post-enactment capital loss carryovers as of March 31, 2013. |
| | Capital loss carryforwards are subject to usage limitations. During the year ended March 31, 2013, capital loss carryforwards in the amount of $4,226,780 were utilized and $0 were expired off and cannot be used going forward. |
| | Under current laws, certain capital losses realized after October 31 and certain ordinary losses realized after December 31 may be deferred and treated as occurring on the first day of the following fiscal year. For the year ended March 31, 2013, the Fund elected to defer losses in the amount of $104,931. |
| | At March 31, 2013, the following table shows for federal tax purposes the aggregate cost of investments, the net unrealized appreciation of those investments, the aggregate gross unrealized appreciation of all securities with an excess of market value over tax cost and the aggregate gross unrealized depreciation of all securities with an excess of tax cost over market value: |
| | | | | | | | | | | | |
Aggregate
Tax Cost | | Net Unrealized
Appreciation | | | Gross Unrealized
Appreciation | | | Gross Unrealized
(Depreciation) | |
| $196,620,870 | | $ | 29,297,930 | | | $ | 32,488,523 | | | $ | (3,190,593 | ) |
21
NOTES TO FINANCIAL STATEMENTS (Unaudited) — continued
| | The difference between book basis and tax-basis unrealized appreciation is attributable primarily to the differing treatments for wash sales, amortization of market premium and accretion of market discount. |
| F. | Use of Estimates in the Preparation of Financial Statements – The preparation of financial statements in conformity with GAAP requires management to make estimates and assumptions that may affect the reported amounts of assets and liabilities at the date of the financial statements and the reported amounts of revenue and expenses during the reporting period. Actual results could differ from those estimates. |
Note 2 – Portfolio Transactions – The following is a summary of the security transactions, other than short-term investments, for the year ended March 31, 2013:
| | | | | | | | |
| | | Cost of
Purchases | | | Proceeds from Sales
or Maturities | |
U.S. Government Securities | | $ | 1,073,570 | | | $ | 6,214,471 | |
Other Investment Securities | | $ | 43,975,380 | | | $ | 39,859,388 | |
Note 3 – Capital Stock – At March 31, 2013, there were an unlimited number of shares of beneficial interest ($0.01 par value) authorized, with 10,708,597 shares issued and outstanding.
Note 4 – Investment Advisory Contract, Accounting and Administration and Trustee Compensation – Cutwater Investor Services Corp. (“Cutwater”) serves as Investment Adviser to the Fund. Cutwater is entitled to a fee at the annual rate of 0.50% on the first $100 million of the Fund’s month end net assets and 0.40% on the Fund’s month-end net assets in excess of $100 million.
BNY Mellon Investment Servicing (US) Inc. (“BNY Mellon”), a member of The Bank of New York Mellon Corporation, provides accounting and administrative services to the Fund.
The Trustees of the Fund receive an annual retainer, meeting fees and out of pocket expenses for meetings attended. The aggregate remuneration paid to the Trustees by the Fund during the year ended March 31, 2013 was $95,533. Certain officers of the Fund are also directors, officers and/or employees of the investment adviser. None of the Fund’s officers receives compensation from the Fund. As of March 31, 2013, there were no amounts due to the Trustees.
Note 5 – Dividend and Distribution Reinvestment – In accordance with the terms of the Automatic Dividend Investment Plan (the “Plan”), for shareholders who so elect, dividends and distributions are made in the form of previously unissued Fund shares at the net asset value if on the Friday preceding the payment date (the “Valuation Date”) the closing New York Stock Exchange price per share, plus the brokerage commissions applicable to one such share equals or exceeds the net asset value per share. However, if the net asset value is less than 95% of the market price on the Valuation Date, the shares issued will be valued at 95% of the market price. If the net asset value per share exceeds market price plus commissions, the dividend or distribution proceeds are used to purchase Fund shares on the open market for participants in the Plan. During the year ended March 31, 2013 the Fund issued no shares under this Plan.
Note 6 – Rights Offering – On August 7, 2009 the Fund completed its transferable rights offering. In accordance with the terms of the rights offering described in the Fund’s prospectus an additional 1,650,893 shares were issued at a subscription price of $15.77 per share, making the gross proceeds raised by the offering $26,034,583, before offering-related expenses. Dealer/manager fees of $976,297 and offering costs of approximately $550,332 were deducted from the gross proceeds making the net proceeds available for investment by the Fund $24,507,954. The
22
NOTES TO FINANCIAL STATEMENTS (Unaudited) — continued
dilution impact of the offering was $0.88 per share or 4.79% of the $18.34 net asset value per share on August 7, 2009, the expiration and pricing date of the offering.
Note 7 – Subsequent Event – Management has evaluated the impact of all subsequent events on the Fund through the date the financial statements were issued, and has determined that there were no subsequent events requiring recognition or disclosure in the financial statements.
23
SHAREHOLDER INFORMATION (Unaudited)
ADDITIONAL INFORMATION REGARDING THE FUND’S TRUSTEES AND OFFICERS
| | | | | | | | |
Name, Address and Age | | Position Held
With Fund | | Principal Occupation
During the Past 5 Years | | Number of
Funds Overseen
By Trustee | | Term of Office
and
Length of Time Served |
| | | | |
W. Thacher Brown* 113 King Street Armonk, NY 10504 Born: December 1947 | | Trustee | | Retired; Former President of MBIA Asset Management LLC, from July 1998 to September 2004; and Former President of 1838 Investment Advisors, LLC from July 1988 to May 2004. | | 1 | | Shall serve until the next annual meeting or until his successor is qualified. Trustee since 1988 |
| | | | |
Ellen D. Harvey 113 King Street Armonk, NY 10504 Born: February 1954 | | Trustee | | Consultant with Lindsay Criswell LLC beginning July 2008. Principal with the Vanguard Group from January 2008 to June 2008; and Senior Vice President with Mercantile Safe-Deposit & Trust from February 2003 to October 2007. | | 1 | | Shall serve until the next annual meeting or until her successor is qualified. Trustee since 2010 |
| | | | |
Thomas E. Spock 113 King Street Armonk, NY 10504 Born: May 1956 | | Trustee | | Partner at Scalar Media Partners, LLC since June 2008. | | 1 | | Shall serve until the next annual meeting or until his successor is qualified. Trustee since 2013 |
| | | | |
Suzanne P. Welsh 113 King Street Armonk, NY 10504 Born: March 1953 | | Trustee | | Vice President for Finance and Treasurer, Swarthmore College since 2002. | | 1 | | Shall serve until the next annual meeting or until her successor is qualified. Trustee since 2008 |
| | | | |
Clifford D. Corso* Cutwater 113 King Street Armonk, NY 10504 Born: October 1961 | | President | | Chief Executive Officer and Chief Investment Officer, Cutwater Investor Services Corp.; Managing Director and Chief Investment Officer, MBIA Insurance Corporation; officer of other affiliated entities of Cutwater Investor Services Corp. | | N/A | | Shall serve until death, resignation, or removal. Officer since 2005 |
| | | | |
Joseph L. Sevely* Cutwater 113 King Street Armonk, NY 10504 Born: January 1960 | | Treasurer | | Director of Cutwater Investor Services Corp.; Director and officer of other affiliated entities of Cutwater Investor Services Corp. | | N/A | | Shall serve until death, resignation, or removal. Officer since 2010 |
24
SHAREHOLDER INFORMATION (Unaudited) — continued
ADDITIONAL INFORMATION REGARDING THE FUND’S TRUSTEES AND OFFICERS
| | | | | | | | |
Name, Address and Age | | Position Held
With Fund | | Principal Occupation
During the Past 5 Years | | Number of
Funds Overseen
By Trustee | | Term of Office
and
Length of Time Served |
| | | | |
Thomas E. Stabile* Cutwater 113 King Street Armonk, NY 10504 Born: March 1974 | | Assistant
Treasurer | | Officer of Cutwater Investor Services Corp. | | N/A | | Shall serve until death, resignation, or removal. Officer since 2010 |
| | | | |
Leonard I. Chubinsky* Cutwater 113 King Street Armonk, NY 10504 Born: December 1948 | | Secretary | | Senior Corporate Counsel of Cutwater Investor Services Corp. and certain of its affiliates. | | N/A | | Shall serve until death, resignation, or removal. Officer since 2005 |
| | | | |
Michelle Houck* Cutwater 113 King Street Armonk, NY 10504 Born: January 1971 | | Vice
President/Chief
Compliance
Officer | | General Counsel and Chief Compliance Officer of Cutwater Investor Services Corp. and other Cutwater affiliated entities; formerly, Assistant General Counsel, Chief Compliance Officer and Principal with Pzena Investment Management from October 2004 to June 20, 2011. | | N/A | | Shall serve until death, resignation, or removal. Officer since 2011 |
| | | | |
Robert T. Claiborne* Cutwater 113 King Street Armonk, NY 10504 Born: August 1955 | | Vice President | | Officer of Cutwater Investor Services Corp. | | N/A | | Shall serve until death, resignation, or removal. Officer since 2006 |
| | | | |
Gautam Khanna* Cutwater 113 King Street Armonk, NY 10504 Born: October 1969 | | Vice President | | Officer of Cutwater Investor Services Corp. | | N/A | | Shall serve until death, resignation, or removal. Officer since 2006 |
| * | Denotes a trustee/officer who is an “interested person” of the Fund as defined under the provisions of the Investment Company Act of 1940. Mr. Brown is an “interested person” because he has an interest in MBIA Inc., the parent of the Fund’s Investment Adviser. Messrs. Corso, Sevely, Stabile, Chubinsky, Claiborne, Khanna and Ms. Houck are “interested persons” by virtue of being employees of the Fund’s Investment Adviser. |
HOW TO GET INFORMATION REGARDING PROXIES
The Fund has adopted the Adviser’s proxy voting policies and procedures to govern the voting of proxies relating to the voting securities of the Fund. You may obtain a copy of these proxy voting procedures, without charge, by calling (800) 765-6242 or on the Securities and Exchange Commission website at www.sec.gov.
25
SHAREHOLDER INFORMATION (Unaudited) — continued
Information regarding how the Fund voted proxies relating to portfolio securities during the most recent 12-month period ended June 30 is available, without charge, by calling (800) 765-6242 or on the SEC’s website at www.sec.gov.
QUARTERLY STATEMENT OF INVESTMENTS
The Fund files a complete statement of investments with the Security and Exchange Commission for the first and third quarters for each fiscal year on Form N-Q. Shareholders may view the filed Form N-Q by visiting the Commission’s website at www.sec.gov. The filed form may also be viewed and copied at the Commission’s Public Reference Room in Washington, D.C. Information on the operation of the Commission’s Public Reference Room may be obtained by calling 1-800-SEC-0330. Additionally, the Fund makes the information on Form N-Q available to shareholders on its website at http://www.cutwater.com/cutwater-select-income-fund-characteristics.aspx.
ADDITIONAL TAX INFORMATION
For corporate shareholders, the percentage of investment income (dividend income and short-term gains, if any) for the Fund that qualify for the dividends-received deductions for the year ended March 31, 2013 was 0.72%.
For the year ended March 31, 2013, certain dividends paid by the Fund may be subject to a maximum tax rate of 15%, as provided by the Jobs and Growth Tax Relief Reconciliation Act of 2003. Of the distributions made by the Fund, 0.72% represents the amount of each distribution which may qualify for the 15% dividend income tax rate. Shareholders should not use this tax information to prepare their tax returns. The information will be included with your Form 1099 DIV which will be sent to you separately in January 2014.
DIVIDEND REINVESTMENT PLAN
The Fund has established a plan for the automatic investment of dividends and distributions pursuant to which dividends and capital gain distributions to shareholders will be paid in or reinvested in additional shares of the Fund. All shareholders of record are eligible to join the Plan. BNY Mellon acts as the agent (the “Agent”) for participants under the Plan.
Shareholders whose shares are registered in their own names may elect to participate in the Plan by completing an authorization form and returning it to the Agent. Shareholders whose shares are held in the name of a broker or nominee should contact such broker or nominee to determine whether or how they may participate in the Plan.
Dividends and distributions are reinvested under the Plan as follows. If the market price per share on the Friday before the payment date for the dividend or distribution (the “Valuation Date’’), plus the brokerage commissions applicable to one such share, equals or exceeds the net asset value per share on that date, the Fund will issue new shares to participants valued at the net asset value or, if the net asset value is less than 95% of the market price on the Valuation Date, then valued at 95% of the market price. If net asset value per share on the Valuation Date exceeds the market price per share on that date, plus the brokerage commissions applicable to one such share, the Agent will buy shares on the open market, on the New York Stock Exchange, for the participants’ accounts. If before the Agent has completed its purchases, the market price exceeds the net asset value of shares, the average per share purchase price paid by the Agent may exceed the net asset value of shares, resulting in the acquisition of fewer shares than if the dividend or distribution has been paid in shares issued by the Fund at net asset value.
There is no charge to participants for reinvesting dividends or distributions payable in either shares or cash. The Agent’s fees for handling of reinvestment of such dividends and distributions will be paid by the Fund. There will be no brokerage charges with respect to shares issued directly by the Fund as a result of dividends or distributions
26
SHAREHOLDER INFORMATION (Unaudited) — continued
payable either in shares or cash. However, each participant will be charged by the Agent a pro rata share of brokerage commissions incurred with respect to Agent’s open market purchases in connection with the reinvestment of dividends or distributions payable only in cash.
For purposes of determining the number of shares to be distributed under the Plan, the net asset value is computed on the Valuation Date and compared to the market value of such shares on such date. The Plan may be terminated by a participant by delivery of written notice of termination to the Agent at the address shown below. Upon termination, the Agent will cause a certificate or certificates for the full shares held for a participant under the Plan and a check for any fractional shares to be delivered to the former participant.
Distributions of investment company taxable income that are invested in additional shares generally are taxable to shareholders as ordinary income. A capital gain distribution that is reinvested in shares is taxable to shareholders as long-term capital gain, regardless of the length of time a shareholder has held the shares or whether such gain was realized by the Fund before the shareholder acquired such shares and was reflected in the price paid for the shares.
Plan information and authorization forms are available from BNY Mellon Investment Servicing (US) Inc., P.O. Box 358035, Pittsburgh, PA 15252-8035.
PRIVACY POLICY
The privacy of your personal financial information is extremely important to us. When you open an account with us, we collect a significant amount of information from you in order to properly invest and administer your account. We take very seriously the obligation to keep that information private and confidential, and we want you to know how we protect that important information.
We collect nonpublic personal information about you from applications or other forms you complete and from your transactions with us or our affiliates. We do not disclose information about you, or our former clients, to our affiliates or to service providers or other third parties, except as permitted by law. We share only the minimum information required to properly administer your accounts, which enables us to send transaction confirmations, monthly or quarterly statements, financials and tax forms. Even within Cutwater and its affiliated entities, only a limited number of people who actually service accounts will ever have access to your personal financial information. Further, we do not share information about our current or former clients with any outside marketing groups or sales entities.
To ensure the highest degree of security and confidentiality, Cutwater and its affiliates maintain various physical, electronic and procedural safeguards to protect your personal information. We also apply special measures for authentication of information you request or submit to us on our Web site - www.cutwater.com.
ANNUAL CERTIFICATION
The Fund’s CEO has submitted to the NYSE the required annual certification, and the Fund also has included the certifications of the Fund’s CEO and CFO required by Section 302 of the Sarbanes-Oxley Act of 2002 in the Fund’s Forms N-CSR filed with the Securities and Exchange Commission for the period of this report.
27
[THIS PAGE INTENTIONALLY LEFT BLANK]
[THIS PAGE INTENTIONALLY LEFT BLANK]
[THIS PAGE INTENTIONALLY LEFT BLANK]
HOW TO GET ASSISTANCE WITH SHARE TRANSFER OR DIVIDENDS
Contact Your Transfer Agent:
BNY Mellon Investment Servicing (US) Inc.
P.O. Box 358035, Pittsburgh, PA 15252-8035, or call 1-866-333-6685
31
T R U S T E E S
W. THACHER BROWN
ELLEN D. HARVEY
THOMAS E. SPOCK
SUZANNE P. WELSH
O F F I C E R S
CLIFFORD D. CORSO
President
JOSEPH L. SEVELY
Treasurer
THOMAS E. STABILE
Assistant Treasurer
LEONARD CHUBINSKY
Secretary
MICHELLE HOUCK
Vice President/Chief Compliance Officer
ROBERT T. CLAIBORNE
Vice President
GAUTAM KHANNA
Vice President
I N V E S T M E N T A D V I S E R
CUTWATER INVESTOR SERVICES CORP.
113 KING STREET
ARMONK, NY 10504
C U S T O D I A N
THE BANK OF NEW YORK MELLON
2 HANSON PLACE
BROOKLYN, NY 11217
T R A N S F E R A G E N T
BNY MELLON INVESTMENT SERVICING (US) INC.
P.O. BOX 358035
Pittsburgh, PA 15252-8035
1-866-333-6685
C O U N S E L
PEPPER HAMILTON LLP
3000 TWO LOGAN SQUARE
EIGHTEENTH & ARCH STREETS
PHILADELPHIA, PA 19103
I N D E P E N D E N T R E G I S T E R E D
P U B L I C A C C O U N T I N G F I R M
TAIT, WELLER & BAKER LLP
1818 MARKET STREET
SUITE 2400
PHILADELPHIA, PA 19103

Cutwater Select Income Fund
Annual Report
March 31, 2013
Item 2. Code of Ethics.
The registrant has adopted a code of ethics (the “Code of Ethics”) that applies to its principal executive officer, principal financial officer, principal accounting officer or controller, or persons performing similar functions (each a “Covered Person”). A copy of the Registrant’s Code of Ethics can be obtained without charge, upon request, by calling the Registrant at 1-800-331-1710. There were no amendments to the Code of Ethics during the reporting period. There were no waivers of a provision of the Code of Ethics granted to a Covered Person during the reporting period.
Item 3. Audit Committee Financial Expert.
The Board of Trustees of the registrant has determined that Suzanne P. Welsh, the Chair of the Board’s Audit Committee, possesses the technical attributes identified in Instruction 2(b) of Item 3 to Form N-CSR to qualify as an “audit committee financial expert,” and has designated Ms. Welsh as the Audit Committee’s financial expert. Ms. Welsh is an “independent” Trustee pursuant to paragraph (a)(2) of Item 3 to Form N-CSR. Under applicable securities laws, a person who is determined to be an audit committee financial expert will not be deemed an “expert” for any purpose, including without limitation for the purposes of Section 11 of the Securities Act of 1933, as a result of being designated or identified as an audit committee financial expert. The designation or identification of a person as an audit committee financial expert does not impose on such person any duties, obligations, or liabilities that are greater than the duties, obligations, and liabilities imposed on such person as a member of the audit committee and Board of Trustees in the absence of such designation or identification.
Item 4. Principal Accountant Fees and Services.
Audit Fees
| | (a) | The aggregate fees billed for each of the last two fiscal years for professional services rendered by the principal accountant for the audit of the registrant’s annual financial statements or services that are normally provided by the accountant in connection with statutory and regulatory filings or engagements for those fiscal years are $20,900 and $20,300 for the fiscal years ended March 31, 2013 and March 31, 2012, respectively. |
Audit-Related Fees
| | (b) | The aggregate fees billed in each of the last two fiscal years for assurance and related services by the principal accountant that are reasonably related to the performance of the audit of the registrant’s financial statements and are not reported under paragraph (a) of this Item are $0 and $0 for the fiscal years ended March 31, 2013 and March 31, 2012, respectively. |
Tax Fees
| | (c) | The aggregate fees billed in each of the last two fiscal years for professional services rendered by the principal accountant for tax compliance, tax advice, and tax planning are $3,400 and $3,300 for the fiscal years ended March 31, 2013 and March 31, 2012, respectively. The tax fees relate to the review of the registrant’s tax filings and annual tax related disclosures in the financial statements. |
All Other Fees
| | (d) | The aggregate fees billed in each of the last two fiscal years for products and services provided by the principal accountant, other than the services reported in paragraphs (a) through (c) of this Item are $0 and $0 for the fiscal years ended March 31, 2013 and March 31, 2012, respectively. |
| | (e)(1) | The registrant’s audit committee has adopted policies and procedures relating to the pre-approval of services provided by the registrant’s principal accountant (the “Pre-Approval Policies”). The Pre-Approval Policies establish a framework intended to assist the audit committee in the proper discharge of its pre-approval responsibilities. As a general matter, the Pre-Approval Policies (i) specify certain types of audit, audit-related, tax, and other services determined to be pre-approved by the audit committee; and (ii) delineate specific procedures governing the mechanics of the pre-approval process, including the approval and monitoring of audit and non-audit service fees. Unless a service is specifically pre-approved under the Pre-Approval Policies, it must be separately pre-approved by the audit committee. |
| | (e)(2) | None of the services described in each of paragraphs (b) through (d) of this Item that were approved by the audit committee pursuant to paragraph (c)(7)(i)(C) of Rule 2-01 of Regulation S-X. |
| | (f) | The percentage of hours expended on the principal accountant’s engagement to audit the registrant’s financial statements for the most recent fiscal year that were attributed to work performed by persons other than the principal accountant’s full-time, permanent employees was less than fifty percent. |
| | (g) | The aggregate non-audit fees billed by the registrant’s accountant for services rendered to the registrant, and rendered to the registrant’s investment adviser (not including any sub-adviser whose role is primarily portfolio management and is subcontracted with or overseen by another investment adviser), and any entity controlling, controlled by, or under common control with the adviser that provides ongoing services to the registrant for each of the last two fiscal years of the registrant was $0 and $0 for the fiscal years ended March 31, 2013 and March 31, 2012, respectively. |
Item 5. Audit Committee of Listed registrants.
The registrant has a separately designated audit committee consisting of all the independent trustees of the registrant. The members of the audit committee are: Ellen D. Harvey, Thomas E. Spock and Suzanne P. Welsh.
Item 6. Investments.
| (a) | Schedule of Investments in securities of unaffiliated issuers as of the close of the reporting period is included as part of the report to shareholders filed under Item 1 of this form. |
Item 7. Disclosure of Proxy Voting Policies and Procedures for Closed-End Management Investment Companies.
The registrant has adopted the proxy voting policies and procedures used by the Investment Adviser. The most current copy of that policy is attached herewith.
PROXY VOTING POLICY
CUTWATER INVESTOR SERVICES CORP.
Introduction
This Proxy Voting Policy (“Policy”) for Cutwater Investor Services Corp. (“CISC”) formerly MBIA Investors Service Corp., reflects our duty as a fiduciary under the Investment Advisers Act of 1940 (the “Advisers Act”) to vote proxies in the best interests of our clients. In addition, the Department of Labor views the fiduciary act of managing ERISA plan assets to include the voting of proxies. Proxy voting decisions must be made solely in the best interests of the pension plan’s participants and beneficiaries. The Department of Labor has interpreted this requirement as prohibiting a fiduciary from subordinating the retirement income interests of participants and beneficiaries to unrelated objectives. The guidelines in this Policy have been formulated to ensure decision-making consistent with these fiduciary responsibilities.
Any general or specific proxy voting guidelines provided by an advisory client or its designated agent in writing will supercede the specific guidelines in this Policy. CISC will disclose to our advisory clients information about this Policy as well as disclose to our clients how they may obtain information on how we voted their proxies. Additionally, CISC will maintain proxy voting records for our advisory clients consistent with the Advisers Act. For those of our clients that are registered investment companies, CISC will disclose this Policy to the shareholders of such funds and make filings with the Securities and Exchange Commission and make available to fund shareholders the specific proxy votes that we cast in shareholder meetings of issuers of portfolio securities in accordance with the rules and regulations under the Investment Company Act of 1940.
Registered investment companies that are advised by CISC as well as certain of our advisory clients: may participate in securities lending programs, which may reduce or eliminate the amount of shares eligible for voting by CISC in accordance with this Policy if such shares are out on loan and cannot be recalled in time for the vote.
Implicit in the initial decision to retain or invest in the security of a corporation is approval of its existing corporate ownership structure, its management, and its operations. Accordingly, proxy proposals that would change the existing status of a corporation will be reviewed carefully and supported only when it seems clear that the proposed changes are likely to benefit the corporation and its shareholders. Notwithstanding this favorable predisposition, management will be assessed on an
ongoing basis both in terms of its business capability and its dedication to the shareholders to ensure that, our continued confidence remains warranted. If it is determined that management is acting on its own behalf instead of for the well being of the corporation, we will vote to support shareholder proposals, unless other mitigating circumstances are present.
Additionally, situations may arise that involve an actual or-perceived conflict of interest. For example, we may manage- assets of a pension plan of a company whose management is soliciting proxies, or a CISC employee may have a close relative who serves as a director or executive of a company that is soliciting proxies. In all cases, the manner in which we vote proxies must be based on our clients’ best interests and not the product of the conflict.
This Policy and its attendant recommendations attempt to generalize a complex subject. It should be clearly understood that specific fact situations, including differing voting practices in jurisdictions outside the United States, might warrant departure from these guidelines. In such instances, the relevant facts will be considered, and if a vote contrary to these guidelines is indicated it will be cast and the reasons therefore recorded in writing.
The provisions of this Policy will be deemed applicable to decisions similar to voting proxies, such as tendering of securities, voting consents to corporate actions, and solicitations with respect to fixed income securities, where CISC may exercise voting authority on behalf of clients.
Section I of the Policy describes proxy proposals that may be characterized as routine and lists examples of the types of proposals we would typically support. Section II of the Policy describes various types of non-routine proposals and provides general voting guidelines. These non-routine proposals are categorized as those involving:
| | — | | Financial/Corporate Issues, and |
Finally, Section III of the Policy describes the procedures to be followed casting: a vote pursuant to these guidelines.
Routine Matters
Routine proxy proposals, amendments, or resolutions are typically proposed by management and meet the following criteria:
| | — | | They do not measurably change the structure, management control, or operation of the corporation. |
| | — | | They are consistent with industry standards as well as the corporate laws of the state of incorporation. |
Voting Recommendation
CISC will normally support the following routine proposals:
| | — | | To increase authorized common shares. |
| | — | | To -increase authorized preferred shares as long as there are not disproportionate voting rights per preferred share. |
| | — | | To elect or re-elect Trustees. |
| | — | | To appoint or elect auditors. |
| | — | | To approve indemnification of Trustees and limitation of Trustees’ liability. |
| | — | | To establish compensation levels. |
| | — | | To establish employee stock purchase or ownership plans. |
| | — | | To set time and location of annual meeting. |
Non-Routine Proposals
Social Issues
Proposals in this category involve issues of social conscience. They are typically proposed by shareholders who believe that the corporation’s internally adopted policies are ill advised or misguided.
Voting Recommendation
If we have determined that management is generally socially responsible, we will generally vote against the following shareholder proposals:
| | — | | To enforce restrictive energy policies. |
| | — | | To place arbitrary restrictions on military contracting. |
| | — | | To bar or place arbitrary restrictions on trade with other countries. |
| | — | | To restrict the marketing of controversial products. |
| | — | | To limit corporate political activities. |
| | — | | To bar or restrict charitable contributions. |
| | — | | To enforce a general policy regarding human rights based on arbitrary parameters. |
| | — | | To enforce a general policy regarding employment practices based -on arbitrary parameters. |
| | — | | To enforce a general policy regarding animal rights based on arbitrary parameters. |
| | — | | To place arbitrary restrictions on environmental practices. |
Financial/Corporate Issues
Proposals in this category are usually offered by management and seek to change a corporation’s legal, business or financial structure.
Voting Recommendation
We will generally vote in favor of the following management proposals provided the position of current shareholders is preserved or enhanced:
| | — | | To change the state of incorporation. |
| | — | | To approve mergers, acquisitions or dissolution. |
| | — | | To institute indenture changes. |
| | — | | To change capitalization. |
Shareholder Rights
Proposals in this category are made regularly both by management and shareholders. They can be generalized as involving issues that transfer or realign board or shareholder voting power.
We typically would oppose any proposal aimed solely at thwarting potential takeover offers by requiring, for example, super-majority approval. At the same time, we believe stability and continuity promote profitability. The guidelines in this area seek to find a middle road, and they are no more than guidelines. Individual proposals may have to be carefully assessed in the context of their particular circumstances.
Voting Recommendation
We will generally vote for the following management proposals:
| | — | | To require majority approval of shareholders in acquisitions of a controlling share in the corporation. |
| | — | | To institute staggered board of Trustees. |
| | — | | To require shareholder approval of not more than 66 70% for a proposed amendment to the corporation’s by-laws. |
| | — | | To eliminate cumulative voting. |
| | — | | To adopt anti-greenmail charter or by-law amendments or to otherwise restrict a company’s ability to make greenmail payments. |
| | — | | To create a dividend reinvestment program. |
| | — | | To eliminate preemptive rights. |
| | — | | To eliminate any other plan or procedure designed primarily to discourage a takeover or other similar action (commonly known as a “poison pill”). |
We will generally vote against the following management proposals:
| | — | | To require greater than 66 2/3% shareholder approval for a proposed amendment to the corporation’s by-laws (“super-majority provisions”). |
| | — | | To require that an arbitrary fair price be offered to all shareholders that is derived from a fixed formula (“fair price amendments”). |
| | — | | To authorize a new class of common stock or preferred stock which may have more votes per share than the existing common stock. |
| | — | | To prohibit replacement of existing members of the board of Trustees. |
| | — | | To eliminate shareholder action by written consent without a shareholder meeting. |
| | — | | To allow only the board of Trustees to call a shareholder meeting or to propose amendments to the articles of incorporation. |
| | — | | To implement any other action or procedure designed primarily to discourage a takeover or other similar action (commonly known. as a “poison pill”). |
| | — | | To limit the ability of shareholders to nominate Trustees. |
We will generally vote for the following shareholder proposals:
| | — | | To rescind share purchases rights or require that they be submitted for shareholder approval, but only if the vote required for approval is not more than 66 2/3%. |
| | — | | To opt out of state anti-takeover laws deemed to be detrimental to the shareholder. |
| | — | | To change the state of incorporation for companies operating under the umbrella of anti-shareholder state corporation laws if another state is chosen with favorable laws in this and other areas. |
| | — | | To eliminate any other plan or procedure designed primarily to discourage a takeover or other similar action. |
| | — | | To permit shareholders to participate in formulating management’s proxy and the opportunity to discuss and evaluate management’s director nominees, and/or to nominate shareholder nominees to the board. |
| | — | | To require that the board’s audit, compensation, and/or nominating committees be comprised exclusively of independent Trustees. |
| | — | | To adopt anti-greenmail charter or by-law amendments or otherwise restrict a company’s ability to make greenmail payments. |
| | — | | To create a dividend reinvestment program. |
| | — | | To recommend that votes to “abstain” not be considered votes “cast” at an annual meeting or special meeting, unless required by state law. |
| | — | | To require that “golden parachutes” be submitted for shareholder ratification. |
We will generally vote against the following shareholder proposals:
| | — | | To restore preemptive rights. |
| | — | | To restore cumulative voting. |
| | — | | To require annual election of Trustees or to specify tenure. |
| | — | | To eliminate a staggered board of Trustees. |
| | — | | To require confidential voting. |
| | — | | To require Trustees to own a minimum amount of company stock in order to qualify as a director or to remain on the board. |
| | — | | To dock director pay for failing to attend board meetings. |
Voting Process
CISC will designate a portfolio manager (the Proxy Voting Portfolio Manager), who is responsible for voting proxies for all advisory accounts and who will generally vote proxies in accordance with these guidelines. In circumstances in which 1) the subject matter of the vote is not covered by these guidelines, 2) a material conflict of interest is present or, 3) we believe it may be necessary, in the best interests of shareholders, to vote contrary to our general guidelines, the Proxy Voting Portfolio Manager will discuss the matter with the President and Chief Investment Officer of CISC, who will be responsible for making the definitive determination as to how the proxy matter will be voted. The President/Chief investment officer may consult with the General Counsel, the CCO, or other investment personnel in making this determination.
Any questions regarding this Policy may be directed to the General Counsel of CISC.
Item 8. Portfolio Managers of Closed-End Management Investment Companies.
| | | | | | |
| (a)(1) | | | | | | Portfolio Manager: |
| | | | | | Robert T. Claiborne, CFA |
| | | | | | Director, Cutwater Asset Management Corp. |
| | | | | | January 2000 - Present |
| | | | | | Responsible for day-to-day management of portfolio |
| | |
| | | | | | Portfolio Manager: |
| | | | | | Gautam Khanna, CPA, CFA |
| | | | | | Managing Director, Cutwater Asset Management Corp. |
| | | | | | May 2003 - Present |
| | | | | | Responsible for day-to-day management of portfolio |
| | |
| (a)(2) | | | (i | ) | | Robert T. Claiborne, CFA |
| | | (ii | ) | | (A) Registered investment companies – 0 as of March 31, 2013 |
| | | | | | (B) Other pooled investment vehicles – 0 as of March 31, 2013 |
| | | | | | (C) Other Accounts – 0 as of March 31, 2013. |
| | | (iii | ) | | None. |
| | | (iv | ) | | N/A. |
| | |
| (a)(2) | | | (i | ) | | Gautam Khanna, CPA, CFA |
| | | | | | |
| | | (ii | ) | | (A) Registered investment companies – 1 as of March 31, 2013. Approximately $71.4 million in total assets as of March 31, 2013. |
| | | | | | (B) Other pooled investment vehicles – 2 as of March 31, 2013. Approximately $89.1 million in total assets as of March 31, 2013. |
| | | | | | (C) Other Accounts – 0 as of March 31, 2013. |
| | | (iii | ) | | None. |
| | | (iv | ) | | No material conflicts of interests are expected to arise with the management of the Cutwater Select Income Fund and the other accounts. |
| | |
| (a)(3) | | | | | | The Portfolio Managers each receive compensation that is composed of an annual cash fixed salary and a variable cash bonus. The cash salary level is adjusted annually. The cash bonus is determined annually and is based on a combination of the overall performance of Cutwater Asset Management Corp. and the individual Portfolio Managers’ contribution to that performance. Compensation is not based on any specific performance criteria of any of the portfolios managed. |
| | |
| (a)(4) | | | | | | Share ownership as of March 31, 2013: Robert T. Claiborne: $10,001 to $50,000 Gautam Khanna: $10,001 to $50,000 |
| | |
| (b) | | | | | | N/A. Filing is an annual report. |
Item 9. Purchases of Equity Securities by Closed-End Management Investment Company and Affiliated Purchasers.
Not applicable.
Item 10. Submission of Matters to a Vote of Security Holders.
There have been no material changes to the procedures by which the shareholders may recommend nominees to the registrant’s board of trustees, where those changes were implemented after the registrant last provided disclosure in response to the requirements of Item 407(c)(2)(iv) of Regulation S-K (17 CFR 229.407) (as required by Item 22(b)(15) of Schedule 14A (17 CFR 240.14a-101)), or this Item.
Item 11. Controls and Procedures.
| | (a) | The registrant’s principal executive and principal financial officers, or persons performing similar functions, have concluded that the registrant’s disclosure controls and procedures (as defined in Rule 30a-3(c) under the Investment Company Act of 1940, as amended (the “1940 Act”) (17 CFR 270.30a-3(c))) are effective, as of a date within 90 days of the filing date of the report that includes the disclosure required by this paragraph, based on their evaluation of these controls and procedures required by Rule 30a-3(b) under the 1940 Act (17 CFR 270.30a-3(b)) and Rules 13a-15(b) or 15d-15(b) under the Securities Exchange Act of 1934, as amended (17 CFR 240.13a-15(b) or 240.15d-15(b)). |
| | (b) | There were no changes in the registrant’s internal control over financial reporting (as defined in Rule 30a-3(d) under the 1940 Act (17 CFR 270.30a-3(d)) that occurred during the registrant’s second fiscal quarter of the period covered by this report that has materially affected, or is reasonably likely to materially affect, the registrant’s internal control over financial reporting. |
Item 12. Exhibits.
| | |
| (a)(1) | | Not applicable. |
| |
| (a)(2) | | Certifications pursuant to Rule 30a-2(a) under the 1940 Act and Section 302 of the Sarbanes-Oxley Act of 2002 are attached hereto. |
| |
| (a)(3) | | Not applicable. |
| |
| (b) | | Certifications pursuant to Rule 30a-2(b) under the 1940 Act and Section 906 of the Sarbanes- Oxley Act of 2002 are attached hereto. |
| |
| (12.other) | | Not applicable. |
SIGNATURES
Pursuant to the requirements of the Securities Exchange Act of 1934 and the Investment Company Act of 1940, the registrant has duly caused this report to be signed on its behalf by the undersigned, thereunto duly authorized.
| | |
| (Registrant) | | Cutwater Select Income Fund |
| | |
| |
| By (Signature and Title)* | | /s/ Clifford D. Corso |
| | Clifford D. Corso, President |
| | (principal executive officer) |
Pursuant to the requirements of the Securities Exchange Act of 1934 and the Investment Company Act of 1940, this report has been signed below by the following persons on behalf of the registrant and in the capacities and on the dates indicated.
| | |
| |
| By (Signature and Title)* | | /s/ Clifford D. Corso |
| | Clifford D. Corso, President |
| | (principal executive officer) |
| | |
| |
| By (Signature and Title)* | | /s/ Joseph L. Sevely |
| | Joseph L. Sevely, Treasurer |
| | (principal financial officer) |
* Print the name and title of each signing officer under his or her signature.