UNITED STATES
SECURITIES AND EXCHANGE COMMISSION
Washington, D.C. 20549
FORM N-CSR
CERTIFIED SHAREHOLDER REPORT OF REGISTERED MANAGEMENT
INVESTMENT COMPANIES
Investment Company Act file number | 811-00523 |
| |
| BNY Mellon Large Cap Securities Fund, Inc. | |
| (Exact name of Registrant as specified in charter) | |
| | |
| c/o BNY Mellon Investment Adviser, Inc. 240 Greenwich Street New York, New York 10286 | |
| (Address of principal executive offices) (Zip code) | |
| | |
| Bennett A. MacDougall, Esq. 240 Greenwich Street New York, New York 10286 | |
| (Name and address of agent for service) | |
|
Registrant's telephone number, including area code: | (212) 922-6400 |
| |
Date of fiscal year end: | 12/31 | |
Date of reporting period: | 12/31/19 | |
| | | | | | | |
FORM N-CSR
Item 1. Reports to Stockholders.
BNY Mellon Large Cap Securities Fund, Inc.
| |
ANNUAL REPORT December 31, 2019 |
| |
Save time. Save paper. View your next shareholder report online as soon as it’s available. Log into www.bnymellonim.com/us and sign up for eCommunications. It’s simple and only takes a few minutes. |
| |
The views expressed in this report reflect those of the portfolio manager(s) only through the end of the period covered and do not necessarily represent the views of BNY Mellon Investment Adviser, Inc. or any other person in the BNY Mellon Investment Adviser, Inc. organization. Any such views are subject to change at any time based upon market or other conditions and BNY Mellon Investment Adviser, Inc. disclaims any responsibility to update such views. These views may not be relied on as investment advice and, because investment decisions for a fund in the BNY Mellon Family of Funds are based on numerous factors, may not be relied on as an indication of trading intent on behalf of any fund in the BNY Mellon Family of Funds. |
| |
Not FDIC-Insured • Not Bank-Guaranteed • May Lose Value |
Contents
THE FUND
FOR MORE INFORMATION
Back Cover
| | | | |
| |
BNY Mellon Large Cap Securities Fund, Inc.
| | The Fund |
A LETTER FROM THE PRESIDENT OF BNY MELLON INVESTMENT ADVISER, INC.
Dear Shareholder:
We are pleased to present this annual report for BNY Mellon Large Cap Securities Fund, Inc. (formerly, The Dreyfus Fund Incorporated), covering the 12-month period from January 1, 2019 through December 31, 2019. For information about how the fund performed during the reporting period, as well as general market perspectives, we provide a Discussion of Fund Performance on the pages that follow.
In January 2019, a pivot in stance from the U.S. Federal Reserve (the “Fed”) helped stimulate a rebound across equity markets that continued into the second quarter of the year. However, escalating trade tensions disrupted equity markets in May. The dip was short-lived, as markets rose once again in June and July of 2019, when a trade deal appeared more likely and the pace of U.S. economic growth remained steady. Nevertheless, concerns continued to emerge over slowing global growth, resulting in bouts of market volatility in August 2019. Stocks rebounded in September and continued an upward path through most of October 2019, bolstered by central bank policy and consistent consumer spending. The rally generally continued through the end of the period, supported in part by an announcement from President Trump that the first phase of a trade deal with China was in process. U.S. equity markets reached new highs during the final months of the period.
In fixed-income markets, the year began with a recovery from the prior months’ volatility. After the Fed’s supportive statements in January 2019, other developed-market central banks followed suit and reiterated their abilities to buttress flagging growth rates by continuing accommodative policies. The Fed cut rates in July, September and October 2019, for a total 75 basis point reduction in the federal funds rate during the 12 months. Rates across much of the Treasury curve saw a slight increase during the month of November, and the long end of the curve rose in December. The yield curve steepened during the latter portion of the period. However, demand for fixed-income instruments during the year was strong, which helped to support positive bond market returns.
We believe that over the near term, the outlook for the U.S. remains positive, but we will monitor relevant data for any signs of a change. As always, we encourage you to discuss the risks and opportunities in today’s investment environment with your financial advisor.
Thank you for your continued confidence and support.
Sincerely,

Renee LaRoche-Morris
President
BNY Mellon Investment Adviser, Inc.
January 15, 2020
2
DISCUSSION OF FUND PERFORMANCE(Unaudited)
For the period from January 1, 2019 through December 31, 2019, as provided by Leigh Todd, Robin Wehbe and Erik Swords, Primary Portfolio Managers
Market and Fund Performance Overview
For the 12-month period ended December 31, 2019, BNY Mellon Large Cap Securities Fund, Inc. (formerly, The Dreyfus Fund Incorporated) produced a total return of 27.06%.1 In comparison, the S&P 500® Index (the “Index”), the fund’s benchmark, provided a total return of 31.46% for the same period.2
A shift in Federal Reserve (“Fed”) policy, steady economic growth and the possibility of a resolution to the U.S./China trade conflict boosted stocks during the reporting period, despite ongoing investor concerns about global economic growth. The fund underperformed the Index largely due to unfavorable security selections in the health care, information technology and communication services sectors.
The Fund’s Investment Approach
The fund seeks long-term capital growth consistent with the preservation of capital. Current income is a secondary goal. To pursue these goals, the fund primarily invests in common stocks issued by U.S. companies. The fund may invest up to 20% of its assets in foreign securities. In choosing stocks, we focus on large-capitalization, U.S. companies with strong positions in their industries and catalysts that can trigger a price increase. We use fundamental analysis to create a broadly diversified portfolio composed of a blend of growth stocks, value stocks and stocks that exhibit characteristics of both investment styles. We attempt to measure a security’s intrinsic value by analyzing “real” data (company financials, economic outlook, etc.) and other factors (management, industry conditions, competition, etc.) and select stocks based on value, growth and financial profile.
Stocks Surge on Supportive Federal Reserve Policy and Reduced Trade Tensions
The reporting period began with wide expectations of interest rate cuts, as the Fed had earlier moved from a tightening policy to one that was “data dependent.” With this shift, stocks rallied late in 2018 and continued to rise early in 2019. In the second quarter, however, stocks generally moved sideways, weighed down at times by concerns about trade tensions and global growth.
Three quarter-point rate cuts in the second half of the period provided an additional boost to equities markets. The Fed announced an initial reduction at its July 2019 meeting and followed up with two additional rate cuts in September and October 2019. These reductions brought the federal funds rate to 1.50%-1.75%, as trade tensions and other geopolitical concerns appeared to be weighing on economic growth. Other major central banks were also supportive.
In the third quarter of 2019, interest rate cuts and the prospect of a U.S.-China trade agreement led investors to anticipate a pickup in global growth. Investors’ concerns about trade tensions and the global economy hindered performance at times, but stocks finished up strong later in the reporting period, when the “Phase 1” U.S.-China trade deal was announced in December 2019.
Stock Selection Hindered Fund Performance
The fund’s performance was hindered by stock selection, particularly in the health care, information technology and communication services sectors. In the health care sector, the fund’s results were hurt by two positions in the health care providers and services industry,CVS Health
3
DISCUSSION OF FUND PERFORMANCE(Unaudited) (continued)
andUnitedHealth Group. The fund sold both holdings due to concerns about regulatory and competitive pressures, but both companies performed better than expected. In the life sciences industry, the fund sold its position inIllumina, a company that makes equipment used in DNA analysis, on a belief that market expectations for the company’s recovery were too high. While flat for the portfolio, the company finished up almost 11% for the year. In addition, a position inBiogen was sold, as the company’s Alzheimer’s drug failed to receive approval by the U.S. Food & Drug Administration (FDA). But the FDA’s decision to allow more flexibility on future applications resulted in the stock finishing down only slightly for the year. In the information technology sector, the fund exited its position in chipmakerXilinx because of slower demand. This slowdown was due in part to the government’s decision to block the relationship with Chinese telecom company Huawei, but the stock finished higher for the year, nonetheless, as investors feel the Huawei expectations are now removed from estimates and the stock has stabilized. In the communication services sector, the fund’s position in Verizon Communications hindered relative returns, as it lagged the broader industry, which gained on strong returns by competitors.
On a more positive note, stock selections in the materials, utilities and consumer staples sectors partially offset losses. In the materials sector, holdings in the chemical industry, including FMC,Ecolab andLinde, proved advantageous, as these companies benefited from an improving U.S. economy. In the utilities sector, a position in NextEra Energy, which is focused on renewable energy sources, contributed positively to relative returns, as it gained approximately 42% during the period. In the consumer staples sector, positions in Walmart and Costco Wholesale boosted relative returns; both companies benefited from strong execution and healthy spending by U.S. consumers.
Positioned for Further Gains
As of the end of the reporting period, we have positioned the fund to benefit from constructive market conditions. Strong wage growth, improving trade relations and supportive Fed policy should keep the U.S. economy in expansion mode for the foreseeable future. In addition, greater stability in trade relationships could encourage greater capital expenditures, providing an additional boost to economic growth. Internationally, purchasing managers’ indexes have begun to bottom out, suggesting that global growth could also show improvement.
January 15, 2020
1 Total return includes reinvestment of dividends and any capital gains paid. Past performance is no guarantee of future results. Share price and investment returns fluctuate such that upon redemption, fund shares may be worth more or less than their original cost.
2 Source: Lipper Inc. — The S&P 500® Index is widely regarded as the best single gauge of large-cap U.S. equities. The index includes 500 leading companies and captures approximately 80% coverage of available market capitalization. Investors cannot invest directly in any index.
Please note: the position in any security highlighted with italicized typeface was sold during the reporting period.
Equities are subject generally to market, market sector, market liquidity, issuer and investment style risks, among other factors, to varying degrees, all of which are more fully described in the fund’s prospectus.
The fund may, but is not required to, use derivative instruments. A small investment in derivatives could have a potentially large impact on the fund’s performance. The use of derivatives involves risks different from, or possibly greater than, the risks associated with investing directly in the underlying assets.
4
FUND PERFORMANCE(Unaudited)
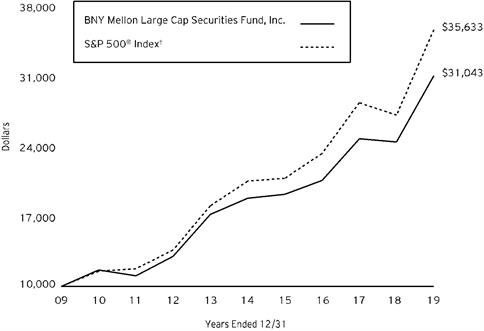
Comparison of change in value of a $10,000 investment in shares of BNY Mellon Large Cap Securities Fund, Inc. with a hypothetical investment of $10,000 in the S&P 500® Index (the “Index”)
† Source: Lipper Inc.
Past performance is not predictive of future performance.
The above graph compares a hypothetical $10,000 investment made in shares of BNY Mellon Large Cap Securities Fund, Inc. on 12/31/09 to a hypothetical investment of $10,000 made in the Index on that date. All dividends and capital gain distributions are reinvested.
The fund’s performance shown in the line graph above takes into account all applicable fees and expenses. The Index is widely regarded as the best single gauge of large-cap U.S. equities. The Index includes 500 leading companies and captures approximately 80% coverage of available market capitalization. Unlike a mutual fund, the Index is not subject to charges, fees and other expenses. Investors cannot invest directly in any index. Further information relating to fund performance, including expense reimbursements, if applicable, is contained in the Financial Highlights section of the prospectus and elsewhere in this report.
| | | | |
Average Annual Total Returns as of 12/31/19 | |
| 1 Year | 5 Years | 10 Years |
Fund | 27.06% | 10.54% | 11.99% |
S&P 500® Index | 31.46% | 11.69% | 13.55% |
The performance data quoted represents past performance, which is no guarantee of future results. Share price and investment return fluctuate and an investor’s shares may be worth more or less than original cost upon redemption. Current performance may be lower or higher than the performance quoted. Go to www.bnymellonim.com/us for the fund’s most recent month-end returns.
The fund’s performance shown in the graph and table does not reflect the deduction of taxes that a shareholder would pay on fund distributions or the redemption of fund shares.
5
UNDERSTANDING YOUR FUND’S EXPENSES(Unaudited)
As a mutual fund investor, you pay ongoing expenses, such as management fees and other expenses. Using the information below, you can estimate how these expenses affect your investment and compare them with the expenses of other funds. You also may pay one-time transaction expenses, including sales charges (loads) and redemption fees, which are not shown in this section and would have resulted in higher total expenses. For more information, see your fund’s prospectus or talk to your financial adviser.
Review your fund’s expenses
The table below shows the expenses you would have paid on a $1,000 investment in BNY Mellon Large Cap Securities Fund, Inc. from July 1, 2019 to December 31, 2019. It also shows how much a $1,000 investment would be worth at the close of the period, assuming actual returns and expenses.
| | | | |
Expenses and Value of a $1,000 Investment | |
Assume actual returns for the six months ended December 31, 2019 | |
| | | |
| | | |
Expense paid per $1,000† | $3.73 | |
Ending value (after expenses) | $1,081.70 | |
COMPARING YOUR FUND’S EXPENSES
WITH THOSE OF OTHER FUNDS(Unaudited)
Using the SEC’s method to compare expenses
The Securities and Exchange Commission (“SEC”) has established guidelines to help investors assess fund expenses. Per these guidelines, the table below shows your fund’s expenses based on a $1,000 investment, assuming a hypothetical 5% annualized return. You can use this information to compare the ongoing expenses (but not transaction expenses or total cost) of investing in the fund with those of other funds. All mutual fund shareholder reports will provide this information to help you make this comparison. Please note that you cannot use this information to estimate your actual ending account balance and expenses paid during the period.
| | | | |
Expenses and Value of a $1,000 Investment | |
Assuming a hypothetical 5% annualized return for the six months ended December 31, 2019 | |
| | | |
| | | |
Expense paid per $1,000† | $3.62 | |
Ending value (after expenses) | $1,021.63 | |
† Expenses are equal to the fund’s annualized expense ratio of .71%, multiplied by the average account value over the period, multiplied by 184/365 (to reflect the one-half year period). |
6
STATEMENT OF INVESTMENTS
December 31, 2019
| | | | | | | | |
| |
Description | | | | Shares | | Value ($) | |
Common Stocks - 98.9% | | | | | |
Banks - 7.1% | | | | | |
JPMorgan Chase & Co. | | | | 310,798 | | 43,325,241 | |
The PNC Financial Services Group | | | | 164,640 | | 26,281,483 | |
U.S. Bancorp | | | | 396,118 | | 23,485,836 | |
| | | | | 93,092,560 | |
Capital Goods - 9.3% | | | | | |
Cummins | | | | 140,096 | | 25,071,580 | |
Honeywell International | | | | 141,025 | | 24,961,425 | |
Raytheon | | | | 146,144 | | 32,113,682 | |
Rockwell Automation | | | | 78,051 | | 15,818,596 | |
Roper Technologies | | | | 69,537 | | 24,632,091 | |
| | | | | 122,597,374 | |
Consumer Services - 2.4% | | | | | |
McDonald's | | | | 159,360 | | 31,491,130 | |
Diversified Financials - 1.7% | | | | | |
Cboe Global Markets | | | | 191,308 | | 22,956,960 | |
Energy - 4.2% | | | | | |
Helmerich & Payne | | | | 554,406 | | 25,186,665 | |
Valero Energy | | | | 318,404 | | 29,818,535 | |
| | | | | 55,005,200 | |
Food & Staples Retailing - 3.5% | | | | | |
Costco Wholesale | | | | 74,132 | | 21,788,877 | |
Walmart | | | | 198,951 | | 23,643,337 | |
| | | | | 45,432,214 | |
Food, Beverage & Tobacco - 2.7% | | | | | |
PepsiCo | | | | 261,886 | | 35,791,960 | |
Health Care Equipment & Services - 8.7% | | | | | |
Abbott Laboratories | | | | 246,820 | | 21,438,785 | |
Anthem | | | | 71,304 | | 21,535,947 | |
Baxter International | | | | 234,446 | | 19,604,375 | |
Boston Scientific | | | | 676,805 | a | 30,605,122 | |
Danaher | | | | 137,647 | | 21,126,062 | |
| | | | | 114,310,291 | |
Insurance - 3.7% | | | | | |
American International Group | | | | 657,503 | | 33,749,629 | |
The Progressive | | | | 214,176 | | 15,504,201 | |
| | | | | 49,253,830 | |
Materials - 2.0% | | | | | |
FMC | | | | 264,680 | | 26,420,358 | |
Media & Entertainment - 4.1% | | | | | |
Alphabet, Cl. C | | | | 40,105 | a | 53,621,187 | |
7
STATEMENT OF INVESTMENTS (continued)
| | | | | | | | |
| |
Description | | | | Shares | | Value ($) | |
Common Stocks - 98.9% (continued) | | | | | |
Pharmaceuticals Biotechnology & Life Sciences - 8.1% | | | | | |
Merck & Co. | | | | 360,622 | | 32,798,571 | |
Pfizer | | | | 721,251 | | 28,258,614 | |
Vertex Pharmaceuticals | | | | 99,215 | a | 21,723,124 | |
Zoetis | | | | 182,076 | | 24,097,759 | |
| | | | | 106,878,068 | |
Retailing - 6.9% | | | | | |
Amazon.com | | | | 34,062 | a | 62,941,126 | |
O'Reilly Automotive | | | | 64,910 | a | 28,447,457 | |
| | | | | 91,388,583 | |
Semiconductors & Semiconductor Equipment - 3.2% | | | | | |
Broadcom | | | | 80,694 | | 25,500,918 | |
Qualcomm | | | | 193,289 | | 17,053,888 | |
| | | | | 42,554,806 | |
Software & Services - 15.4% | | | | | |
Adobe | | | | 53,286 | a | 17,574,256 | |
Microsoft | | | | 535,261 | | 84,410,660 | |
PayPal Holdings | | | | 208,281 | a | 22,529,756 | |
Salesforce.com | | | | 183,860 | a | 29,902,990 | |
Visa, Cl. A | | | | 257,334 | b | 48,353,059 | |
| | | | | 202,770,721 | |
Technology Hardware & Equipment - 5.9% | | | | | |
Apple | | | | 262,555 | | 77,099,276 | |
Telecommunication Services - 3.3% | | | | | |
Verizon Communications | | | | 701,031 | | 43,043,303 | |
Transportation - 2.8% | | | | | |
Union Pacific | | | | 201,811 | | 36,485,411 | |
Utilities - 3.9% | | | | | |
NextEra Energy | | | | 132,347 | | 32,049,149 | |
PPL | | | | 525,105 | | 18,840,767 | |
| | | | | 50,889,916 | |
Total Common Stocks(cost $853,929,798) | | | | 1,301,083,148 | |
8
| | | | | | | | |
| |
Description | | 1-Day
Yield (%) | | Shares | | Value ($) | |
Investment Companies - 1.1% | | | | | |
Registered Investment Companies - 1.1% | | | | | |
Dreyfus Institutional Preferred Government Plus Money Market Fund
(cost $14,709,175) | | 1.60 | | 14,709,175 | c | 14,709,175 | |
Total Investments(cost $868,638,973) | | 100.0% | | 1,315,792,323 | |
Liabilities, Less Cash and Receivables | | (.0%) | | (247,574) | |
Net Assets | | 100.0% | | 1,315,544,749 | |
aNon-income producing security.
bSecurity, or portion thereof, on loan. At December 31, 2019, the value of the fund’s securities on loan was $47,401,721 and the value of the collateral was $48,333,534, consisting of U.S. Government & Agency securities.
cInvestment in affiliated issuer. The investment objective of this investment company is publicly available and can be found within the investment company’s prospectus.
| | |
Portfolio Summary (Unaudited)† | Value (%) |
Information Technology | 24.5 |
Health Care | 16.8 |
Financials | 12.6 |
Industrials | 12.1 |
Consumer Discretionary | 9.3 |
Communication Services | 7.3 |
Consumer Staples | 6.2 |
Energy | 4.2 |
Utilities | 3.9 |
Materials | 2.0 |
Investment Companies | 1.1 |
| | 100.0 |
† Based on net assets.
See notes to financial statements.
9
STATEMENT OF INVESTMENTS IN AFFILIATED ISSUERS
| | | | | | | |
Investment Companies | Value
12/31/18($) | Purchases($) | Sales($) | Value
12/31/19($) | Net
Assets(%) | Dividends/
Distributions($) |
Registered Investment Companies: | | | |
Dreyfus Institutional Preferred Government Plus Money Market Fund | 7,671,509 | 148,001,054 | 140,963,388 | 14,709,175 | 1.1 | 316,452 |
See notes to financial statements.
10
STATEMENT OF ASSETS AND LIABILITIES
December 31, 2019
| | | | | | | |
| | | | | | |
| | | Cost | | Value | |
Assets ($): | | | | |
Investments in securities—See Statement of Investments
(including securities on loan, valued at $47,401,721)—Note 1(c): | | | |
Unaffiliated issuers | 853,929,798 | | 1,301,083,148 | |
Affiliated issuers | | 14,709,175 | | 14,709,175 | |
Dividends, interest and securities lending income receivable | | 1,215,232 | |
Receivable for shares of Common Stock subscribed | | 1,294 | |
Prepaid expenses | | | | | 47,518 | |
| | | | | 1,317,056,367 | |
Liabilities ($): | | | | |
Due to BNY Mellon Investment Adviser, Inc. and affiliates—Note 3(b) | | 761,736 | |
Payable for shares of Common Stock redeemed | | 665,115 | |
Directors’ fees and expenses payable | | 7,500 | |
Other accrued expenses | | | | | 77,267 | |
| | | | | 1,511,618 | |
Net Assets ($) | | | 1,315,544,749 | |
Composition of Net Assets ($): | | | | |
Paid-in capital | | | | | 861,563,287 | |
Total distributable earnings (loss) | | | | | 453,981,462 | |
Net Assets ($) | | | 1,315,544,749 | |
| | | | | |
Shares Outstanding | | |
(500 million shares of $1 par value Common Stock authorized) | 105,843,998 | |
Net Asset Value Per Share ($) | | 12.43 | |
| | | | |
See notes to financial statements. | | | | |
11
STATEMENT OF OPERATIONS
Year Ended December 31, 2019
| | | | | | | |
| | | | | | |
| | | | | | |
Investment Income ($): | | | | |
Income: | | | | |
Cash dividends: | |
Unaffiliated issuers | | | 23,969,847 | |
Affiliated issuers | | | 316,452 | |
Income from securities lending—Note 1(c) | | | 79,467 | |
Total Income | | | 24,365,766 | |
Expenses: | | | | |
Management fee—Note 3(a) | | | 8,137,442 | |
Shareholder servicing costs—Note 3(b) | | | 441,486 | |
Professional fees | | | 111,819 | |
Directors’ fees and expenses—Note 3(c) | | | 94,128 | |
Prospectus and shareholders’ reports | | | 59,669 | |
Registration fees | | | 38,680 | |
Loan commitment fees—Note 2 | | | 29,039 | |
Custodian fees—Note 3(b) | | | 19,920 | |
Chief Compliance Officer fees—Note 3(b) | | | 11,793 | |
Miscellaneous | | | 18,913 | |
Total Expenses | | | 8,962,889 | |
Investment Income—Net | | | 15,402,877 | |
Realized and Unrealized Gain (Loss) on Investments—Note 4 ($): | | |
Net realized gain (loss) on investments and foreign currency transactions | 61,392,266 | |
Net realized gain (loss) on forward foreign currency exchange contracts | (18) | |
Net Realized Gain (Loss) | | | 61,392,248 | |
Net change in unrealized appreciation (depreciation) on investments
and foreign currency transactions | 219,130,530 | |
Net Realized and Unrealized Gain (Loss) on Investments | | | 280,522,778 | |
Net Increase in Net Assets Resulting from Operations | | 295,925,655 | |
| | | | | | |
See notes to financial statements. | | | | | |
12
STATEMENT OF CHANGES IN NET ASSETS
| | | | | | | | | | |
| | | | Year Ended December 31, |
| | | | 2019 | | 2018 | |
Operations ($): | | | | | | | | |
Investment income—net | | | 15,402,877 | | | | 12,252,643 | |
Net realized gain (loss) on investments | | 61,392,248 | | | | 91,098,346 | |
Net change in unrealized appreciation
(depreciation) on investments | | 219,130,530 | | | | (114,232,314) | |
Net Increase (Decrease) in Net Assets
Resulting from Operations | 295,925,655 | | | | (10,881,325) | |
Distributions ($): | |
Distributions to shareholders | | | (86,364,343) | | | | (96,647,738) | |
Capital Stock Transactions ($): | |
Net proceeds from shares sold | | | 5,522,770 | | | | 16,352,496 | |
Distributions reinvested | | | 78,678,888 | | | | 87,924,981 | |
Cost of shares redeemed | | | (110,309,035) | | | | (96,691,524) | |
Increase (Decrease) in Net Assets
from Capital Stock Transactions | (26,107,377) | | | | 7,585,953 | |
Total Increase (Decrease) in Net Assets | 183,453,935 | | | | (99,943,110) | |
Net Assets ($): | |
Beginning of Period | | | 1,132,090,814 | | | | 1,232,033,924 | |
End of Period | | | 1,315,544,749 | | | | 1,132,090,814 | |
Capital Share Transactions (Shares): | |
Shares sold | | | 457,302 | | | | 1,355,634 | |
Shares issued for distributions reinvested | | | 6,494,026 | | | | 8,273,669 | |
Shares redeemed | | | (9,274,685) | | | | (8,176,929) | |
Net Increase (Decrease) in Shares Outstanding | (2,323,357) | | | | 1,452,374 | |
| | | | | | | | | |
See notes to financial statements. | | | | | | | | |
13
FINANCIAL HIGHLIGHTS
The following table describes the performance for the fiscal periods indicated. Total return shows how much your investment in the fund would have increased (or decreased) during each period, assuming you had reinvested all dividends and distributions. These figures have been derived from the fund’s financial statements.
| | | | | | | | | |
| | | |
| | Year Ended December 31, |
| | 2019 | 2018 | 2017 | 2016 | 2015 |
Per Share Data ($): | | | | | | |
Net asset value,
beginning of period | | 10.47 | 11.55 | 10.54 | 10.68 | 11.63 |
Investment Operations: | | | | | | |
Investment income—neta | | .15 | .11 | .09 | .11 | .09 |
Net realized and unrealized
gain (loss) on investments | | 2.65 | (.24) | 1.97 | .67 | .16 |
Total from Investment Operations | | 2.80 | (.13) | 2.06 | .78 | .25 |
Distributions: | | | | | | |
Dividends from
investment income—net | | (.15) | (.12) | (.10) | (.11) | (.09) |
Dividends from net realized
gain on investments | | (.69) | (.83) | (.95) | (.81) | (1.11) |
Total Distributions | | (.84) | (.95) | (1.05) | (.92) | (1.20) |
Net asset value,
end of period | | 12.43 | 10.47 | 11.55 | 10.54 | 10.68 |
Total Return (%) | | 27.06 | (1.20) | 20.12 | 7.23 | 2.08 |
Ratios/Supplemental Data (%): |
Ratio of total expenses
to average net assets | | .72 | .71 | .75 | .76 | .75 |
Ratio of net expenses
to average net assets | | .72 | .71 | .75 | .76 | .75 |
Ratio of net investment
income to average
net assets | | 1.23 | .98 | .82 | 1.01 | .76 |
Portfolio Turnover Rate | | 27.73 | 32.16 | 40.41 | 68.83 | 55.82 |
Net Assets, end of period
($ x 1,000) | | 1,315,545 | 1,132,091 | 1,232,034 | 1,118,858 | 1,454,226 |
a Based on average shares outstanding.
See notes to financial statements.
14
NOTES TO FINANCIAL STATEMENTS
NOTE 1—Significant Accounting Policies:
BNY Mellon Large Cap Securities Fund, Inc. (the “fund”), which is registered under the Investment Company Act of 1940, as amended (the “Act”), is a diversified open-end management investment company. The fund’s investment objective is to seek long-term capital growth consistent with the preservation of capital. BNY Mellon Investment Adviser, Inc. (the “Adviser”), a wholly-owned subsidiary of The Bank of New York Mellon Corporation (“BNY Mellon”), serves as the fund’s investment adviser. BNY Mellon Securities Corporation (the “Distributor”), a wholly-owned subsidiary of the Adviser, is the distributor of the fund’s shares, which are sold to the public without a sales charge.
Effective June 3, 2019, the fund changed its name from The Dreyfus Fund Incorporated to BNY Mellon Large Cap Securities Fund, Inc. In addition, The Dreyfus Corporation, the fund’s investment adviser, changed its name to “BNY Mellon Investment Adviser, Inc.”, MBSC Securities Corporation, the fund’s distributor, changed its name to “BNY Mellon Securities Corporation” and Dreyfus Transfer, Inc., the fund’s transfer agent, changed its name to “BNY Mellon Transfer, Inc.”
The Financial Accounting Standards Board (“FASB”) Accounting Standards Codification (“ASC”) is the exclusive reference of authoritative U.S. generally accepted accounting principles (“GAAP”) recognized by the FASB to be applied by nongovernmental entities. Rules and interpretive releases of the Securities and Exchange Commission (“SEC”) under authority of federal laws are also sources of authoritative GAAP for SEC registrants. The fund is an investment company and applies the accounting and reporting guidance of the FASB ASC Topic 946 Financial Services-Investment Companies. The fund’s financial statements are prepared in accordance with GAAP, which may require the use of management estimates and assumptions. Actual results could differ from those estimates.
The fundenters into contracts that contain a variety of indemnifications. The fund’s maximum exposure under these arrangements is unknown. The fund does not anticipate recognizing any loss related to these arrangements.
(a) Portfolio valuation: The fair value of a financial instrument is the amount that would be received to sell an asset or paid to transfer a liability in an orderly transaction between market participants at the measurement date (i.e., the exit price). GAAP establishes a fair value hierarchy that prioritizes the inputs of valuation techniques used to measure fair value. This hierarchy gives the highest priority to unadjusted quoted prices in
15
NOTES TO FINANCIAL STATEMENTS(continued)
active markets for identical assets or liabilities (Level 1 measurements) and the lowest priority to unobservable inputs (Level 3 measurements).
Additionally, GAAP provides guidance on determining whether the volume and activity in a market has decreased significantly and whether such a decrease in activity results in transactions that are not orderly. GAAP requires enhanced disclosures around valuation inputs and techniques used during annual and interim periods.
Various inputs are used in determining the value of the fund’s investments relating to fair value measurements. These inputs are summarized in the three broad levels listed below:
Level 1—unadjusted quoted prices in active markets for identical investments.
Level 2—other significant observable inputs (including quoted prices for similar investments, interest rates, prepayment speeds, credit risk, etc.).
Level 3—significant unobservable inputs (including the fund’s own assumptions in determining the fair value of investments).
The inputs or methodology used for valuing securities are not necessarily an indication of the risk associated with investing in those securities.
Changes in valuation techniques may result in transfers in or out of an assigned level within the disclosure hierarchy. Valuation techniques used to value the fund’s investments are as follows:
Investments in equity securities are valued at the last sales price on the securities exchange or national securities market on which such securities are primarily traded. Securities listed on the National Market System for which market quotations are available are valued at the official closing price or, if there is no official closing price that day, at the last sales price. For open short positions, asked prices are used for valuation purposes. Bid price is used when no asked price is available. Registered investment companies that are not traded on an exchange are valued at their net asset value. All of the preceding securities are generally categorized within Level 1 of the fair value hierarchy.
Securities not listed on an exchange or the national securities market, or securities for which there were no transactions, are valued at the average of the most recent bid and asked prices. These securities are generally categorized within Level 2 of the fair value hierarchy.
Fair valuing of securities may be determined with the assistance of a pricing service using calculations based on indices of domestic securities
16
and other appropriate indicators, such as prices of relevant American Depository Receipts and futures. Utilizing these techniques may result in transfers between Level 1 and Level 2 of the fair value hierarchy.
When market quotations or official closing prices are not readily available, or are determined not to accurately reflect fair value, such as when the value of a security has been significantly affected by events after the close of the exchange or market on which the security is principally traded (for example, a foreign exchange or market), but before the fund calculates its net asset value, the fund may value these investments at fair value as determined in accordance with the procedures approved by the fund’s Board of Directors (the “Board”). Certain factors may be considered when fair valuing investments such as: fundamental analytical data, the nature and duration of restrictions on disposition, an evaluation of the forces that influence the market in which the securities are purchased and sold, and public trading in similar securities of the issuer or comparable issuers. These securities are either categorized within Level 2 or 3 of the fair value hierarchy depending on the relevant inputs used.
For securities where observable inputs are limited, assumptions about market activity and risk are used and such securities are generally categorized within Level 3 of the fair value hierarchy.
Investments denominated in foreign currencies are translated to U.S. dollars at the prevailing rates of exchange.
The following is a summary of the inputs used as of December 31, 2019in valuing the fund’s investments:
| | | | | |
Assets ($) | Level 1 - Unadjusted Quoted Prices | Level 2 - Other Significant Observable Inputs | Level 3 -Significant Unobservable Inputs | Total |
Investments in Securities:† | | |
Equity Securities—Common Stocks | 1,301,083,148 | - | - | 1,301,083,148 |
Investment Companies | 14,709,175 | - | - | 14,709,175 |
† See Statement of Investments for additional detailed categorizations, if any.
(b) Foreign currency transactions: The fund does not isolate that portion of the results of operations resulting from changes in foreign exchange rates on investments from the fluctuations arising from changes in the market prices of securities held. Such fluctuations are included with the net realized and unrealized gain or loss on investments.
Net realized foreign exchange gains or losses arise from sales of foreign currencies, currency gains or losses realized on securities transactions
17
NOTES TO FINANCIAL STATEMENTS(continued)
between trade and settlement date, and the difference between the amounts of dividends, interest and foreign withholding taxes recorded on the fund’s books and the U.S. dollar equivalent of the amounts actually received or paid. Net unrealized foreign exchange gains and losses arise from changes in the value of assets and liabilities other than investments resulting from changes in exchange rates. Foreign currency gains and losses on foreign currency transactions are also included with net realized and unrealized gain or loss on investments.
(c)Securities transactions and investment income: Securities transactions are recorded on a trade date basis. Realized gains and losses from securities transactions are recorded on the identified cost basis. Dividend income is recognized on the ex-dividend date and interest income, including, where applicable, accretion of discount and amortization of premium on investments, is recognized on the accrual basis.
Pursuant to a securities lending agreement with The Bank of New York Mellon, a subsidiary of BNY Mellon and an affiliate of the Adviser, the fund may lend securities to qualified institutions. It is the fund’s policy that, at origination, all loans are secured by collateral of at least 102% of the value of U.S. securities loaned and 105% of the value of foreign securities loaned. Collateral equivalent to at least 100% of the market value of securities on loan is maintained at all times. Collateral is either in the form of cash, which can be invested in certain money market mutual funds managed by the Adviser, or U.S. Government and Agency securities. The fund is entitled to receive all dividends, interest and distributions on securities loaned, in addition to income earned as a result of the lending transaction. Should a borrower fail to return the securities in a timely manner, The Bank of New York Mellon is required to replace the securities for the benefit of the fund or credit the fund with the market value of the unreturned securities and is subrogated to the fund’s rights against the borrower and the collateral. Additionally, the contractual maturity of security lending transactions are on an overnight and continuous basis. During the period ended December 31, 2019, The Bank of New York Mellon earned $15,073 from the lending of the fund’s portfolio securities, pursuant to the securities lending agreement.
(d) Affiliated issuers: Investments in other investment companies advised by the Adviser are considered “affiliated” under the Act.
(e) Dividends and distributions to shareholders:Dividends and distributions are recorded on the ex-dividend date. Dividends from investment income-net are normally declared and paid quarterly. Dividends from net realized capital gains, if any, are normally declared and paid
18
annually, but the fund may make distributions on a more frequent basis to comply with the distribution requirements of the Internal Revenue Code of 1986, as amended (the “Code”). To the extent that net realized capital gains can be offset by capital loss carryovers, it is the policy of the fund not to distribute such gains. Income and capital gain distributions are determined in accordance with income tax regulations, which may differ from GAAP.
(f) Federal income taxes: It is the policy of the fund to continue to qualify as a regulated investment company, if such qualification is in the best interests of its shareholders, by complying with the applicable provisions of the Code, and to make distributions of taxable income and net realized capital gain sufficient to relieve it from substantially all federal income and excise taxes.
As of and during the period ended December 31, 2019, the fund did not have any liabilities for any uncertain tax positions. The fund recognizes interest and penalties, if any, related to uncertain tax positions as income tax expense in the Statement of Operations. During the period ended December 31, 2019, the fund did not incur any interest or penalties.
Each tax year in the four-year period ended December 31, 2019 remains subject to examination by the Internal Revenue Service and state taxing authorities.
At December 31, 2019, the components of accumulated earnings on a tax basis were as follows: undistributed ordinary income $654,871, undistributed capital gains $6,172,884 and unrealized appreciation $447,153,707.
The tax character of distributions paid to shareholders during the fiscal periods ended December 31, 2019 and December 31, 2018 were as follows: ordinary income $16,115,266 and $13,435,663, and long-term capital gains $70,249,077 and $83,212,075, respectively.
(g) New Accounting Pronouncements: Effective June 1, 2019, the fund adopted Accounting Standards Update 2018-13, Fair Value Measurement (Topic 820): Disclosure Framework—Changes to the Disclosure Requirements for Fair Value Measurement (“ASU 2018-13”). The update provides guidance that eliminates, adds and modifies certain disclosure requirements for fair value measurements. The adoption of ASU 2018-13 had no impact on the operations of the fund for the period ended December 31, 2019.
19
NOTES TO FINANCIAL STATEMENTS(continued)
NOTE 2—Bank Lines of Credit:
The fund participates with other long-term open-end funds managed by the Adviser in a $1.030 billion unsecured credit facility led by Citibank, N.A. (the “Citibank Credit Facility”) and a $300 million unsecured credit facility provided by The Bank of New York Mellon (the “BNYM Credit Facility”), each to be utilized primarily for temporary or emergency purposes, including the financing of redemptions (each, a “Facility”). The Citibank Credit Facility is available in two tranches: (i) Tranche A is in an amount equal to $830 million and is available to all long-term open-ended funds, including the fund, and (ii) Tranche B is in amount equal to $200 million and is available only to BNY Mellon Floating Rate Income Fund, a series of BNY Mellon Investment Funds IV, Inc. In connection therewith, the fund has agreed to pay its pro rata portion of commitment fees for Tranche A of the Citibank Credit Facility and the BNYM Credit Facility. Interest is charged to the fund based on rates determined pursuant to the terms of the respective Facility at the time of borrowing. During the period ended December 31, 2019, the fund did not borrow under the Facilities.
NOTE 3—Management Fee and Other Transactions with Affiliates:
(a)Pursuant to a management agreement (the “Agreement”) with the Adviser, the management fee is payable monthly, based on the following annual percentages of the value of the fund’s average daily net assets: .65% of the first $1.5 billion; .625% of the next $500 million; .60% of the next $500 million; and .55% over $2.5 billion. The effective management fee rate during the period ended December 31, 2019 was .65%.
The Agreement also provides for an expense reimbursement from the Adviser should the fund’s aggregate expenses (excluding taxes and brokerage commissions) exceed 1% of the value of the fund’s average daily net assets for any full fiscal year. During the period ended December 31, 2019, there was no reduction in expenses pursuant to the Agreement.
(b)The fund has an arrangement with the transfer agent whereby the fund may receive earnings credits when positive cash balances are maintained, which are used to offset transfer agency fees. The fund had an arrangement with the custodian to receive earnings credits when positive cash balances were maintained, which were used to offset custody fees. Effective February 1, 2019, the arrangement with the custodian changed whereby the fund will no longer receive earnings credits to offset its custody fees and will receive interest income or overdraft fees going forward. For financial reporting purposes, the fund includes net earnings credits, if any, as an expense offset in the Statement of Operations.
20
The fund compensates BNY Mellon Transfer, Inc., a wholly-owned subsidiary of the Adviser, under a transfer agency agreement for providing transfer agency and cash management services for the fund. The majority of transfer agency fees are comprised of amounts paid on a per account basis, while cash management fees are related to fund subscriptions and redemptions. During the period ended December 31, 2019, the fund was charged $279,537 for transfer agency services. These fees are included in Shareholder servicing costs in the Statement of Operations.
The fund compensates The Bank of New York Mellon under a custody agreement for providing custodial services for the fund. These fees are determined based on net assets, geographic region and transaction activity. During the period ended December 31, 2019, the fund was charged $19,920 pursuant to the custody agreement.
During the period ended December 31, 2019, the fund was charged $11,793 for services performed by the Chief Compliance Officer and his staff. These fees are included in Chief Compliance Officer fees in the Statement of Operations.
The components of “Due to BNY Mellon Investment Adviser, Inc. and affiliates” in the Statement of Assets and Liabilities consist of: management fees of $704,675, custodian fees of $6,800, Chief Compliance Officer fees of $3,261 and transfer agency fees of $47,000.
(c) Each Board member also serves as a Board member of other funds in the BNY Mellon Family of Funds complex. Annual retainer fees and attendance fees are allocated to each fund based on net assets.
NOTE 4—Securities Transactions:
The aggregate amount of purchases and sales of investment securities, excluding short-term securities and forward foreign currency exchange contracts (“forward contracts”), during the period ended December 31, 2019, amounted to $342,393,382 and $447,402,330, respectively.
Derivatives: A derivative is a financial instrument whose performance is derived from the performance of another asset. The fund enters into International Swaps and Derivatives Association, Inc. Master Agreements or similar agreements (collectively, “Master Agreements”) with its OTC derivative contract counterparties in order to, among other things, reduce its credit risk to counterparties. Master Agreements include provisions for general obligations, representations, collateral and events of default or termination. Under a Master Agreement, the fund may offset with the counterparty certain derivative financial instruments’ payables and/or
21
NOTES TO FINANCIAL STATEMENTS(continued)
receivables with collateral held and/or posted and create one single net payment in the event of default or termination.
Each type of derivative instrument that was held by the fund during the period ended December 31, 2019 is discussed below.
Forward Foreign Currency Exchange Contracts: The fund enters into forward contracts in order to hedge its exposure to changes in foreign currency exchange rates on its foreign portfolio holdings, to settle foreign currency transactions or as a part of its investment strategy. When executing forward contracts, the fund is obligated to buy or sell a foreign currency at a specified rate on a certain date in the future. With respect to sales of forward contracts, the fund incurs a loss if the value of the contract increases between the date the forward contract is opened and the date the forward contract is closed. The fund realizes a gain if the value of the contract decreases between those dates. With respect to purchases of forward contracts, the fund incurs a loss if the value of the contract decreases between the date the forward contract is opened and the date the forward contract is closed. The fund realizes a gain if the value of the contract increases between those dates. Any realized or unrealized gains or losses which occurred during the period are reflected in the Statement of Operations. The fund is exposed to foreign currency risk as a result of changes in value of underlying financial instruments. The fund is also exposed to credit risk associated with counterparty nonperformance on these forward contracts, which is generally limited to the unrealized gain on each open contract. This risk may be mitigated by Master Agreements, if any, between the fund and the counterparty and the posting of collateral, if any, by the counterparty to the fund to cover the fund’s exposure to the counterparty. At December 31, 2019, there were no forward contracts outstanding.
The following summarizes the average market value of derivatives outstanding duringthe period ended December 31, 2019:
| | | |
| | Average Market Value ($) |
Forward contracts | | 54 |
| | |
At December 31, 2019, the cost of investments for federal income tax purposes was $868,638,973; accordingly, accumulated net unrealized appreciation on investments was $447,153,350, consisting of $456,419,175 gross unrealized appreciation and $9,265,825 gross unrealized depreciation.
22
REPORT OF INDEPENDENT REGISTERED PUBLIC ACCOUNTING FIRM
To the Shareholders and the Board of Directors of BNY Mellon Large Cap Securities Fund, Inc. (formerly, The Dreyfus Fund Incorporated)
Opinion on the Financial Statements
We have audited the accompanying statement of assets and liabilities of BNY Mellon Large Cap Securities Fund, Inc. (the “Fund”) (formerly, The Dreyfus Fund Incorporated), including the statements of investments and investments in affiliated issuers, as of December 31, 2019, and the related statement of operations for the year then ended, the statements of changes in net assets for each of the two years in the period then ended, the financial highlights for each of the five years in the period then ended and the related notes (collectively referred to as the “financial statements”). In our opinion, the financial statements present fairly, in all material respects, the financial position of the Fund at December 31, 2019, the results of its operations for the year then ended, the changes in its net assets for each of the two years in the period then ended and its financial highlights for each of the five years in the period then ended, in conformity with U.S. generally accepted accounting principles.
Basis for Opinion
These financial statements are the responsibility of the Fund’s management. Our responsibility is to express an opinion on the Fund’s financial statements based on our audits. We are a public accounting firm registered with the Public Company Accounting Oversight Board (United States) (“PCAOB”) and are required to be independent with respect to the Fund in accordance with the U.S. federal securities laws and the applicable rules and regulations of the Securities and Exchange Commission and the PCAOB.
We conducted our audits in accordance with the standards of the PCAOB. Those standards require that we plan and perform the audit to obtain reasonable assurance about whether the financial statements are free of material misstatement, whether due to error or fraud. The Fund is not required to have, nor were we engaged to perform, an audit of the Fund’s internal control over financial reporting. As part of our audits, we are required to obtain an understanding of internal control over financial reporting, but not for the purpose of expressing an opinion on the effectiveness of the Fund’s internal control over financial reporting. Accordingly, we express no such opinion.
Our audits included performing procedures to assess the risks of material misstatement of the financial statements, whether due to error or fraud, and performing procedures that respond to those risks. Such procedures included examining, on a test basis, evidence regarding the amounts and disclosures in the financial statements. Our procedures included confirmation of securities owned as of December 31, 2019, by correspondence with the custodian and others or by other appropriate auditing procedures where replies from others were not received. Our audits also included evaluating the accounting principles used and significant estimates made by management, as well as evaluating the overall presentation of the financial statements. We believe that our audits provide a reasonable basis for our opinion.

We have served as the auditor of one or more investment companies in the BNY Mellon Family of Funds since at least 1957, but we are unable to determine the specific year.
New York, New York
February 26, 2020
23
IMPORTANT TAX INFORMATION(Unaudited)
In accordance with federal tax law, the fund hereby reports 100% of the ordinary dividends paid during the fiscal year ended December 31, 2019 as qualifying for the corporate dividends received deduction. For the fiscal year ended December 31, 2019, certain dividends paid by the fund may be subject to a maximum tax rate of 15%, as provided for by the Jobs and Growth Tax Relief Reconciliation Act of 2003. Of the distributions paid during the fiscal year, $16,115,266 represents the maximum amount that may be considered qualified dividend income. Shareholders will receive notification in early 2020 of the percentage applicable to the preparation of their 2019 income tax returns. Also, the fund hereby reports $.0056 per share as a short-term capital gain distribution and $.1438 per share as a long-term capital gain distribution paid on March 29, 2019 and the fund also reports $.5393 per share as a long-term capital gain distribution paid on December 19, 2019.
24
INFORMATION ABOUT THE RENEWAL OF THE FUND’S MANAGEMENT AGREEMENT (Unaudited)
At a meeting of the fund’s Board of Directors held on July 23-24, 2019, the Board considered the renewalof the fund’s Management Agreement pursuant to which the Adviser provides the fund with investment advisory and administrative services (the “Agreement”). The Board members, a majority of whom are not “interested persons” (as defined in the Investment Company Act of 1940, as amended) of the fund, were assisted in their review by independent legal counsel and met with counsel in executive session separate from representatives of the Adviser. In considering the renewal of the Agreement, the Board considered all factors that it believed to be relevant, including those discussed below. The Board did not identify any one factor as dispositive, and each Board member may have attributed different weights to the factors considered.
Analysis of Nature, Extent, and Quality of Services Provided to the Fund. The Board considered information provided to it at the meeting and in previous presentations from representatives of the Adviser regarding the nature, extent, and quality of the services provided to funds in the BNY Mellon fund complex. The Adviser provided the number of open accounts in the fund, the fund’s asset size and the allocation of fund assets among distribution channels. The Adviser also had previously provided information regarding the diverse intermediary relationships and distribution channels of funds in the BNY Mellon fund complex (such as retail direct or intermediary, in which intermediaries typically are paid by the fund and/or the Adviser) and the Adviser’s corresponding need for broad, deep, and diverse resources to be able to provide ongoing shareholder services to each intermediary or distribution channel, as applicable to the fund.
The Board also considered research support available to, and portfolio management capabilities of, the fund’s portfolio management personnel and that the Adviser also provides oversight of day-to-day fund operations, including fund accounting and administration and assistance in meeting legal and regulatory requirements. The Board also considered the Adviser’s extensive administrative, accounting and compliance infrastructures. The Board also considered portfolio management’s brokerage policies and practices (including policies and practices regarding soft dollars) and the standards applied in seeking best execution.
Comparative Analysis of the Fund’s Performance and Management Fee and Expense Ratio. The Board reviewed reports prepared by Broadridge Financial Solutions, Inc. (“Broadridge”), an independent provider of investment company data, which included information comparing (1) the fund’s performance with the performance of a group of comparable funds (the “Performance Group”) and with a broader group of funds (the “Performance Universe”), all for various periods ended May 31, 2019, and (2) the fund’s actual and contractual management fees and total expenses with those of a group of comparable funds (the “Expense Group”) and with a broader group of funds (the “Expense Universe”), the information for which was derived in part from fund financial statements available to Broadridge as of the date of its analysis. The Adviser previously had furnished the Board with a description of the methodology Broadridge used to
25
INFORMATION ABOUT THE RENEWAL OF THE FUND’S MANAGEMENT AGREEMENT (Unaudited) (continued)
select the Performance Group and Performance Universe and the Expense Group and Expense Universe.
Representatives of the Adviser stated that the usefulness of performance comparisons may be affected by a number of factors, including different investment limitations and policies that may be applicable to the fund and comparison funds. The Board discussed with representatives of the Adviser and/or its affiliates the results of the comparisons and considered that the fund’s total return performance was above the Performance Group and the Performance Universe medians for all periods except the ten-year period when performance was below the Performance Group median. The Adviser also provided a comparison of the fund’s calendar year total returns to the returns of the fund’s benchmark index.
The Board also reviewed the range of actual and contractual management fees and total expenses of the Expense Group and Expense Universe funds and discussed the results of the comparisons. The Board considered that the fund’s contractual management fee was at the Expense Group median and the fund’s actual management fee and total expenses were at the Expense Group medians and below the Expense Universe medians.
Representatives of the Adviser reviewed with the Board the management or investment advisory fees (1) paid by funds advised or administered by the Adviser that are in the same Lipper category as the fund and (2) paid to the Adviser, or the primary employer of the fund’s primary portfolio manager(s) that is affiliated with the Adviser, for advising any separate accounts and/or other types of client portfolios that are considered to have similar investment strategies and policies as the fund (the “Similar Clients”), and explained the nature of the Similar Clients. They discussed differences in fees paid and the relationship of the fees paid in light of any differences in the services provided and other relevant factors. The Board considered the relevance of the fee information provided for the Similar Clients to evaluate the appropriateness of the fund’s management fee.
Analysis of Profitability and Economies of Scale. Representatives of the Adviser reviewed the expenses allocated and profit received by the Adviser and its affiliates and the resulting profitability percentage for managing the fund and the aggregate profitability percentage to the Adviser and its affiliates for managing the funds in the BNY Mellon fund complex, and the method used to determine the expenses and profit. The Board concluded that the profitability results were not unreasonable, given the services rendered and service levels provided by the Adviser. The Board also had been provided with information prepared by an independent consulting firm regarding the Adviser’s approach to allocating costs to, and determining the profitability of, individual funds and the entire BNY Mellon fund complex. The consulting firm also had analyzed where any economies of scale might emerge in connection with the management of a fund.
The Board considered, on the advice of its counsel, the profitability analysis (1) as part of its evaluation of whether the fees under the Agreement, considered in relation to the
26
mix of services provided by the Adviser, including the nature, extent and quality of such services, supported the renewal of the Agreement and (2) in light of the relevant circumstances for the fund and the extent to which economies of scale would be realized if the fund grows and whether fee levels reflect these economies of scale for the benefit of fund shareholders. Representatives of the Adviser stated that a discussion of economies of scale is predicated on a fund having achieved a substantial size with increasing assets and that, if a fund’s assets had been stable or decreasing, the possibility that the Adviser may have realized any economies of scale would be less. Representatives of the Adviser also stated that, as a result of shared and allocated costs among funds in the BNY Mellon fund complex, the extent of economies of scale could depend substantially on the level of assets in the complex as a whole, so that increases and decreases in complex-wide assets can affect potential economies of scale in a manner that is disproportionate to, or even in the opposite direction from, changes in the fund’s asset level. The Board also considered potential benefits to the Adviser from acting as investment adviser and took into consideration the soft dollar arrangements in effect for trading the fund’s investments.
At the conclusion of these discussions, the Board agreed that it had been furnished with sufficient information to make an informed business decision with respect to the renewal of the Agreement. Based on the discussions and considerations as described above, the Board concluded and determined as follows.
· The Board concluded that the nature, extent and quality of the services provided by the Adviser are adequate and appropriate.
· The Board was satisfied with the fund’s performance.
· The Board concluded that the fee paid to the Adviser continued to be appropriate under the circumstances and in light of the factors and the totality of the services provided as discussed above.
· The Board determined that the economies of scale which may accrue to the Adviser and its affiliates in connection with the management of the fund had been adequately considered by the Adviser in connection with the fee rate charged to the fund pursuant to the Agreement and that, to the extent in the future it were determined that material economies of scale had not been shared with the fund, the Board would seek to have those economies of scale shared with the fund.
In evaluating the Agreement, the Board considered these conclusions and determinations and also relied on its previous knowledge, gained through meetings and other interactions with the Adviser and its affiliates, of the Adviser and the services provided to the fund by the Adviser. The Board also relied on information received on a routine and regular basis throughout the year relating to the operations of the fund and the investment management and other services provided under the Agreement, including information on the investment performance of the fund in comparison to similar mutual funds and benchmark performance indices; general market outlook as applicable to the fund; and compliance reports. In addition, the Board’s consideration of
27
INFORMATION ABOUT THE RENEWAL OF THE FUND’S MANAGEMENT AGREEMENT (Unaudited) (continued)
the contractual fee arrangements for this fund had the benefit of a number of years of reviews of the Agreement for the fund, or substantially similar agreements for other BNY Mellon funds that the Board oversees, during which lengthy discussions took place between the Board and representatives of the Adviser. Certain aspects of the arrangements may receive greater scrutiny in some years than in others, and the Board’s conclusions may be based, in part, on their consideration of the fund’s arrangements, or substantially similar arrangements for other BNY Mellon funds that the Board oversees, in prior years. The Board determined to renew the Agreement.
28
BOARD MEMBERS INFORMATION(Unaudited)
INDEPENDENT BOARD MEMBERS
Joseph S. DiMartino (76)
Chairman of the Board (1995)
Principal Occupation During Past 5 Years:
· Corporate Director and Trustee (1995-Present)
Other Public Company Board Memberships During Past 5 Years:
· CBIZ, Inc., a public company providing professional business services, products and solutions,Director (1997-Present)
No. of Portfolios for which Board Member Serves:118
———————
Francine J. Bovich (68)
Board Member (2015)
Principal Occupation During Past 5 Years:
· Trustee, The Bradley Trusts, private trust funds (2011-Present)
Other Public Company Board Membership During Past 5 Years:
· Annaly Capital Management, Inc., a real estate investment trust,Director (2014-Present)
No. of Portfolios for which Board Member Serves:69
———————
J. Charles Cardona (64)
Board Member (2014)
Principal Occupation During Past 5 Years:
· President of the Adviser (2008-2016)
· Chairman of the (2013-2016) and Executive Vice President (1997-2013) of the MBSC Securities Corporation (“MBSC”)
Other Public Company Board Memberships During Past 5 Years:
· BNY Mellon Liquidity Funds, Chairman andDirector (2019-Present)
No. of Portfolios for which Board Member Serves:33
———————
29
BOARD MEMBERS INFORMATION (Unaudited) (continued)
INDEPENDENT BOARD MEMBERS (continued)
Andrew J. Donohue (69)
Board Member (2019)
Principal Occupation During Past 5 Years:
· Of Counsel, Shearman & Sterling LLP (2017-2019)
· Chief of Staff to the Chair of the SEC (2015-2017)
· Managing Director and Investment Company General Counsel of Goldman Sachs (2012-2015)
Other Public Company Board Memberships During Past 5 Years:
· Oppenheimer Funds (58 funds),Director (2017-2019)
No. of Portfolios for which Board Member Serves:55
———————
Isabel P. Dunst (72)
Board Member (2014)
Principal Occupation During Past 5 Years:
· Senior Counsel, Hogan Lovells LLP (2018-2019); Of Counsel (2015-2018); Partner (1990-2014)
No. of Portfolios for which Board Member Serves:33
———————
Nathan Leventhal (76)
Board Member (2009)
Principal Occupation During Past 5 Years:
· President Emeritus of Lincoln Center for the Performing Arts (2001-Present)
· President of the Palm Beach Opera (2016-Present)
· Chairman of the Avery Fisher Artist Program, Lincoln Center (1997-2014)
Other Public Company Board Membership During Past 5 Years:
· Movado Group, Inc., a public company that designs sources, markets and distributes watchesDirector (2003-Present)
No. of Portfolios for which Board Member Serves:47
———————
Robin A. Melvin (56)
Board Member (2014)
Principal Occupation During Past 5 Years:
· Co-chairman, Mentor Illinois, a non-profit organization dedicated to increasing the quantity and quality of mentoring services in Illinois (2014-Present) Board member (2013-Present)
No. of Portfolios for which Board Member Serves:96
———————
30
Roslyn M. Watson (70)
Board Member (2014)
Principal Occupation During Past 5 Years:
· Principal, Watson Ventures, Inc., a real estate investment company (1993-Present)
Other Public Company Board Membership During Past 5 Years:
· American Express Bank, FSB,Director (1993-2018)
No. of Portfolios for which Board Member Serves:55
———————
Benaree Pratt Wiley (73)
Board Member (2009)
Principal Occupation During Past 5 Years:
· Principal, The Wiley Group, a firm specializing in strategy and business development (2005-Present)
Other Public Company Board Membership During Past 5 Years:
· CBIZ, Inc., a public company providng professional business services, products and solutions,Director (2008-Present)
· Blue Cross Blue Shield of Massachusetts,Director (2004-Present)
No. of Portfolios for which Board Member Serves:75
———————
31
BOARD MEMBERS INFORMATION (Unaudited) (continued)
INTERESTED BOARD MEMBER
Gordon J. Davis (78)
Board Member (2012)
Principal Occupation During Past 5 Years:
· Partner in the law firm of Venable LLP (2012-Present)
Other Public Company Board Membership During Past 5 Years:
· Consolidated Edison, Inc., a utility company,Director (1989-2014)
· The Phoenix Companies, Inc., a life insurance company,Director (2000-2014)
No. of Portfolios for which Board Member Serves:53
Gordon J. Davis is deemed to be an “interested person” (as defined under the Act) of the fund as a result of his affiliation with Venable LLP, which provides legal services to the fund.
———————
Once elected all Board Members serve for an indefinite term, but achieve Emeritus status upon reaching age 80. The address of the Board Members and Officers is c/o BNY Mellon Investment Adviser, Inc. 240 Greenwich Street, New York, New York 10286. Additional information about the Board Members is available in the fund’s Statement of Additional Information which can be obtained from the Adviser free of charge by calling this toll free number: 1-800-373-9387.
Clifford L. Alexander, Jr., Emeritus Board Member
Whitney I. Gerard, Emeritus Board Member
George L. Perry, Emeritus Board Member
32
OFFICERS OF THE FUND(Unaudited)
RENEE LAROCHE-MORRIS, President since May 2019.
President and a director of BNY Mellon Investment Adviser, Inc. since January 2018. She is an officer of 62 investment companies (comprised of 118 portfolios) managed by the Adviser. She is 48 years old and has been an employee of BNY Mellon since 2003.
JAMES WINDELS, Treasurer since November 2001.
Director- BNY Mellon Fund Administration, and an officer of 63 investment companies (comprised of 141 portfolios) managed by the Adviser. He is 61 years old and has been an employee of the Adviser since April 1985.
BENNETT A. MACDOUGALL, Chief Legal Officer since October 2015.
Chief Legal Officer of the Adviser and Associate General Counsel and Managing Director of BNY Mellon since June 2015; Director and Associate General Counsel of Deutsche Bank – Asset & Wealth Management Division from June 2005 to June 2015, and as Chief Legal Officer of Deutsche Investment Management Americas Inc. from June 2012 to May 2015. He is an officer of 63 investment companies (comprised of 141 portfolios) managed by the Adviser. He is 48 years old and has been an employee of the Adviser since June 2015.
DAVID DIPETRILLO, Vice President since May 2019.
Head of North America Product, BNY Mellon Investment Management since January 2018, Director of Product Strategy, BNY Mellon Investment Management from January 2016 to December 2017; Head of US Retail Product and Channel Marketing, BNY Mellon Investment Management from January 2014 to December 2015. He is an officer of 62 investment companies (comprised of 118 portfolios) managed by the Adviser. He is 41 years old and has been an employee of BNY Mellon since 2005.
JAMES BITETTO, Vice President since August 2005 and Secretary since February 2018.
Senior Managing Counsel of BNY Mellon since December 2019; Managing Counsel of BNY Mellon from April 2014 to December 2019; Secretary of the Adviser, and an officer of 63 investment companies (comprised of 141 portfolios) managed by the Adviser. He is 53 years old and has been an employee of the Adviser since December 1996.
SONALEE CROSS, Vice President and Assistant Secretary since March 2018.
Counsel of BNY Mellon since October 2016; Associate at Proskauer Rose LLP from April 2016 to September 2016; Attorney at EnTrust Capital from August 2015 to February 2016; Associate at Sidley Austin LLP from September 2013 to August 2015. She is an officer of 63 investment companies (comprised of 141 portfolios) managed by the Adviser. She is 32 years old and has been an employee of the Adviser since October 2016.
DEIRDRE CUNNANE, Vice President and Assistant Secretary since March 2019.
Counsel of BNY Mellon since August 2018; Senior Regulatory Specialist at BNY Mellon Investment Management Services from February 2016 to August 2018; Trustee Associate at BNY Mellon Trust Company (Ireland) Limited from August 2013 to February 2016. She is an officer of 63 investment companies (comprised of 141 portfolios) managed by the Adviser. She is 29 years old and has been an employee of the Adviser since August 2018.
SARAH S. KELLEHER, Vice President and Assistant Secretary since April 2014.
Managing Counsel of BNY Mellon since December 2017, Senior Counsel of BNY Mellon from March 2013 to December 2017. She is an officer of 63 investment companies (comprised of 141 portfolios) managed by the Adviser. She is 44 years old and has been an employee of the Adviser since March 2013.
JEFF PRUSNOFSKY, Vice President and Assistant Secretary since August 2005.
Senior Managing Counsel of BNY Mellon, and an officer of 63 investment companies (comprised of 141 portfolios) managed by the Adviser. He is 54 years old and has been an employee of the Adviser since October 1990.
PETER M. SULLIVAN, Vice President and Assistant Secretary since March 2019.
Managing Counsel of BNY Mellon, and an officer of 63 investment companies (comprised of 141 portfolios) managed by the Adviser. He is 51 years old and has been an employee of the Adviser since April 2004.
33
OFFICERS OF THE FUND (Unaudited)(continued)
NATALYA ZELENSKY, Vice President and Assistant Secretary since March 2017.
Managing Counsel of BNY Mellon since December 2019; Counsel of BNY Mellon from May 2016 to December 2019; Attorney at Wildermuth Endowment Strategy Fund/Wildermuth Advisory, LLC from November 2015 to May 2016 and Assistant General Counsel at RCS Advisory Services from July 2014 to November 2015. She is an officer of 63 investment companies (comprised of 141 portfolios) managed by the Adviser. She is 34 years old and has been an employee of the Adviser since May 2016.
GAVIN C. REILLY, Assistant Treasurer since December 2005.
Tax Manager - BNY Mellon Fund Administration, and an officer of 63 investment companies (comprised of 141 portfolios) managed by the Adviser. He is 51 years old and has been an employee of the Adviser since April 1991.
ROBERT S. ROBOL, Assistant Treasurer since August 2005.
Senior Accounting Manager- BNY Mellon Fund Administration, and an officer of 63 investment companies (comprised of 141 portfolios) managed by the Adviser. He is 55 years old and has been an employee of the Adviser since October 1988.
ROBERT SALVIOLO, Assistant Treasurer since July 2007.
Senior Accounting Manager – BNY Mellon Fund Administration, and an officer of 63 investment companies (comprised of 141 portfolios) managed by the Adviser. He is 52 years old and has been an employee of the Adviser since June 1989.
ROBERT SVAGNA, Assistant Treasurer since December 2002.
Senior Accounting Manager – BNY Mellon Fund Administration, and an officer of 63 investment companies (comprised of 141 portfolios) managed by the Adviser. He is 52 years old and has been an employee of the Adviser since November 1990.
JOSEPH W. CONNOLLY, Chief Compliance Officer since October 2004.
Chief Compliance Officer of the Adviser, the BNY Mellon Family of Funds and BNY Mellon Funds Trust (63 investment companies, comprised of 141 portfolios). He is 62 years old and has served in various capacities with the Adviser since 1980, including manager of the firm’s Fund Accounting Department from 1997 through October 2001.
CARIDAD M. CAROSELLA, Anti-Money Laundering Compliance Officer since January 2016.
Anti-Money Laundering Compliance Officer of the BNY Mellon Family of Funds and BNY Mellon Funds Trust since January 2016; from May 2015 to December 2015, Interim Anti-Money Laundering Compliance Officer of the BNY Mellon Family of Funds and BNY Mellon Funds Trust and the Distributor; from January 2012 to May 2015, AML Surveillance Officer of the Distributor. She is an officer of 56 investment companies (comprised of 134 portfolios) managed by the Adviser. She is 51 years old and has been an employee of the Distributor since 1997.
34
NOTES
35
NOTES
36
NOTES
37
BNY Mellon Large Cap Securities Fund, Inc.
240 Greenwich Street
New York, NY 10286
Adviser
BNY Mellon Investment Adviser, Inc.
240 Greenwich Street
New York, NY 10286
Custodian
The Bank of New York Mellon
240 Greenwich Street
New York, NY 10286
Transfer Agent &
Dividend Disbursing Agent
BNY Mellon Transfer, Inc.
240 Greenwich Street
New York, NY 10286
Distributor
BNY Mellon Securities Corporation
240 Greenwich Street
New York, NY 10286
Telephone Call your financial representative or 1-800-373-9387
Mail The BNY Mellon Family of Funds, 144 Glenn Curtiss Boulevard, Uniondale, NY 11556-0144
E-mailSend your request toinfo@bnymellon.com
InternetInformation can be viewed online or downloaded atwww.bnymellonim.com/us
The fund files its complete schedule of portfolio holdings with the Securities and Exchange Commission (“SEC”) for the first and third quarters of each fiscal year on Form N-PORT. The fund’s Forms N-PORT are available on the SEC’s website atwww.sec.gov.
A description of the policies and procedures that the fund uses to determine how to vote proxies relating to portfolio securities and information regarding how the fund voted these proxies for the most recent 12-month period ended June 30 is available atwww.bnymellonim.com/us and on the SEC’s website at www.sec.gov and without charge, upon request, by calling 1-800-373-9387.
| | |
© 2020 BNY Mellon Securities Corporation
0026AR1219 | 
|
Item 2. Code of Ethics.
The Registrant has adopted a code of ethics that applies to the Registrant's principal executive officer, principal financial officer, principal accounting officer or controller, or persons performing similar functions. There have been no amendments to, or waivers in connection with, the Code of Ethics during the period covered by this Report.
Item 3. Audit Committee Financial Expert.
The Registrant's Board has determined that Joseph S. DiMartino, a member of the Audit Committee of the Board, is an audit committee financial expert as defined by the Securities and Exchange Commission (the "SEC"). Mr. DiMartino is "independent" as defined by the SEC for purposes of audit committee financial expert determinations.
Item 4. Principal Accountant Fees and Services.
(a) Audit Fees. The aggregate fees billed for each of the last two fiscal years (the "Reporting Periods") for professional services rendered by the Registrant's principal accountant (the "Auditor") for the audit of the Registrant's annual financial statements or services that are normally provided by the Auditor in connection with the statutory and regulatory filings or engagements for the Reporting Periods, were $35,222 in 2018 and $36,338 in 2019.
(b) Audit-Related Fees. The aggregate fees billed in the Reporting Periods for assurance and related services by the Auditor that are reasonably related to the performance of the audit of the Registrant's financial statements and are not reported under paragraph (a) of this Item 4 were $6,939 in 2018 and $7,243 in 2019. These services consisted of one or more of the following: (i) agreed upon procedures related to compliance with Internal Revenue Code section 817(h), (ii) security counts required by Rule 17f-2 under the Investment Company Act of 1940, as amended, (iii) advisory services as to the accounting or disclosure treatment of Registrant transactions or events and (iv) advisory services to the accounting or disclosure treatment of the actual or potential impact to the Registrant of final or proposed rules, standards or interpretations by the Securities and Exchange Commission, the Financial Accounting Standards Boards or other regulatory or standard-setting bodies.
The aggregate fees billed in the Reporting Periods for non-audit assurance and related services by the Auditor to the Registrant's investment adviser (not including any sub-investment adviser whose role is primarily portfolio management and is subcontracted with or overseen by another investment adviser), and any entity controlling, controlled by or under common control with the investment adviser that provides ongoing services to the Registrant ("Service Affiliates"), that were reasonably related to the performance of the annual audit of the Service Affiliate, which required pre-approval by the Audit Committee were $0 in 2018 and $0 in 2019.
(c) Tax Fees. The aggregate fees billed in the Reporting Periods for professional services rendered by the Auditor for tax compliance, tax advice, and tax planning ("Tax Services") were $4,482 in 2018 and $3,032 in 2019. These services consisted of: (i) review or preparation of U.S. federal, state, local and excise tax returns; (ii) U.S. federal, state and local tax planning, advice and assistance regarding statutory, regulatory or administrative developments; (iii) tax advice regarding tax qualification matters and/or treatment of various financial instruments held or proposed to be acquired or held, and (iv) determination of Passive Foreign Investment Companies. The aggregate fees billed in the Reporting Periods for Tax Services by the Auditor to Service Affiliates, which required pre-approval by the Audit Committee were $0 in 2018 and $0 in 2019.
(d) All Other Fees. The aggregate fees billed in the Reporting Periods for products and services provided by the Auditor, other than the services reported in paragraphs (a) through (c) of this Item, were $22,653 in 2018 and $14,064 in 2019. These services consisted of a review of the Registrant's anti-money laundering program.
The aggregate fees billed in the Reporting Periods for Non-Audit Services by the Auditor to Service Affiliates, other than the services reported in paragraphs (b) through (c) of this Item, which required pre-approval by the Audit Committee, were $0 in 2018 and $0 in 2019.
(e)(1) Audit Committee Pre-Approval Policies and Procedures. The Registrant's Audit Committee has established policies and procedures (the "Policy") for pre-approval (within specified fee limits) of the Auditor's engagements for non-audit services to the Registrant and Service Affiliates without specific case-by-case consideration. The pre-approved services in the Policy can include pre-approved audit services, pre-approved audit-related services, pre-approved tax services and pre-approved all other services. Pre-approval considerations include whether the proposed services are compatible with maintaining the Auditor's independence. Pre-approvals pursuant to the Policy are considered annually.
(e)(2) Note. None of the services described in paragraphs (b) through (d) of this Item 4 were approved by the Audit Committee pursuant to paragraph (c)(7)(i)(C) of Rule 2-01 of Regulation S-X.
(f) None of the hours expended on the principal accountant's engagement to audit the registrant's financial statements for the most recent fiscal year were attributed to work performed by persons other than the principal accountant's full-time, permanent employees.
Non-Audit Fees. The aggregate non-audit fees billed by the Auditor for services rendered to the Registrant, and rendered to Service Affiliates, for the Reporting Periods were $744,219 in 2018 and $605,259 in 2019.
Auditor Independence. The Registrant's Audit Committee has considered whether the provision of non-audit services that were rendered to Service Affiliates, which were not pre-approved (not requiring pre-approval), is compatible with maintaining the Auditor's independence.
Item 5. Audit Committee of Listed Registrants.
Not applicable.
Item 6. Investments.
(a) Not applicable.
Item 7. Disclosure of Proxy Voting Policies and Procedures for Closed-End Management Investment Companies.
Not applicable.
Item 8. Portfolio Managers of Closed-End Management Investment Companies.
Not applicable.
Item 9. Purchases of Equity Securities by Closed-End Management Investment Companies and Affiliated Purchasers.
Not applicable.
Item 10. Submission of Matters to a Vote of Security Holders.
There have been no material changes to the procedures applicable to Item 10.
Item 11. Controls and Procedures.
(a) The Registrant's principal executive and principal financial officers have concluded, based on their evaluation of the Registrant's disclosure controls and procedures as of a date within 90 days of the filing date of this report, that the Registrant's disclosure controls and procedures are reasonably designed to ensure that information required to be disclosed by the Registrant on Form N-CSR is recorded, processed, summarized and reported within the required time periods and that information required to be disclosed by the Registrant in the reports that it files or submits on Form N-CSR is accumulated and communicated to the Registrant's management, including its principal executive and principal financial officers, as appropriate to allow timely decisions regarding required disclosure.
(b) There were no changes to the Registrant's internal control over financial reporting that occurred during the second fiscal quarter of the period covered by this report that have materially affected, or are reasonably likely to materially affect, the Registrant's internal control over financial reporting.
Item 12. Disclosure of Securities Lending Activities for Closed-End Management Investment Companies.
Not applicable.
Item 13. Exhibits.
(a)(1) Code of ethics referred to in Item 2.
(a)(2) Certifications of principal executive and principal financial officers as required by Rule 30a-2(a) under the Investment Company Act of 1940.
(a)(3) Not applicable.
(b) Certification of principal executive and principal financial officers as required by Rule 30a-2(b) under the Investment Company Act of 1940.
SIGNATURES
Pursuant to the requirements of the Securities Exchange Act of 1934 and the Investment Company Act of 1940, the Registrant has duly caused this Report to be signed on its behalf by the undersigned, thereunto duly authorized.
BNY Mellon Large Cap Securities Fund, Inc.
By: /s/ Renee LaRoche-Morris
Renee LaRoche-Morris
President (Principal Executive Officer)
Date: February 24, 2020
Pursuant to the requirements of the Securities Exchange Act of 1934 and the Investment Company Act of 1940, this Report has been signed below by the following persons on behalf of the Registrant and in the capacities and on the dates indicated.
By: /s/ Renee LaRoche-Morris
Renee LaRoche-Morris
President (Principal Executive Officer)
Date: February 24, 2020
By: /s/ James Windels
James Windels
Treasurer (Principal Financial Officer)
Date: February 24, 2020
EXHIBIT INDEX
(a)(1) Code of ethics referred to in Item 2.
(a)(2) Certifications of principal executive and principal financial officers as required by Rule 30a-2(a) under the Investment Company Act of 1940. (EX-99.CERT)
(b) Certification of principal executive and principal financial officers as required by Rule 30a-2(b) under the Investment Company Act of 1940. (EX-99.906CERT)
