| | | UNITED STATES | |
| | SECURITIES AND EXCHANGE COMMISSION |
| | | Washington, D.C. 20549 | |
| | | | |
| | | FORM N-CSR | |
| | | | |
| CERTIFIED SHAREHOLDER REPORT OF REGISTERED MANAGEMENT |
| | INVESTMENT COMPANIES | |
| | | | |
| Investment Company Act file number | 811-2625 | |
| | | | |
| | | Dreyfus A Bonds Plus, Inc. | |
| | (Exact name of Registrant as specified in charter) |
| | | | |
| | | c/o The Dreyfus Corporation | |
| | | 200 Park Avenue | |
| | New York, New York 10166 | |
| | (Address of principal executive offices) | (Zip code) |
| | | | |
| | | Mark N. Jacobs, Esq. | |
| | | 200 Park Avenue | |
| | New York, New York 10166 | |
| | (Name and address of agent for service) |
| | | | |
| Registrant's telephone number, including area code: | (212) 922-6000 |
| | | | |
| Date of fiscal year end: | 3/31 | | |
| | | | |
| Date of reporting period: | 3/31/04 | | |
FORM N-CSR
Item 1. Reports to Stockholders.
| Dreyfus |
| A Bonds Plus, Inc. |

The views expressed in this report reflect those of the portfolio manager only through the end of the period covered and do not necessarily represent the views of Dreyfus or any other person in the Dreyfus organization. Any such views are subject to change at any time based upon market or other conditions and Dreyfus disclaims any responsibility to update such views.These views may not be relied on as investment advice and, because investment decisions for a Dreyfus fund are based on numerous factors, may not be relied on as an indication of trading intent on behalf of any Dreyfus fund.
Not FDIC-Insured • Not Bank-Guaranteed • May Lose Value
Contents
T H E F U N D
2
| Letter from the Chairman
|
3
| Discussion of Fund Performance
|
6
| Fund Performance
|
7
| Statement of Investments
|
16
| Statement of Financial Futures
|
17
| Statement of Assets and Liabilities
|
18
| Statement of Operations
|
19
| Statement of Changes in Net Assets
|
20
| Financial Highlights
|
21
| Notes to Financial Statements
|
34
| Report of Independent Auditors
|
35
| Important Tax Information
|
36
| Board Members Information
|
38
| Officers of the Fund
|
F O R M O R E I N F O R M AT I O N
|
Back Cover
|
| Dreyfus |
| A Bonds Plus, Inc. |
The Fund

LETTER FROM THE CHAIRMAN
Dear Shareholder:
This annual report for Dreyfus A Bonds Plus, Inc. covers the 12-month period from April 1, 2003, through March 31, 2004. Inside, you’ll find valuable information about how the fund was managed during the reporting period, including a discussion with Gerald E. Thunelius, portfolio manager and Director of the Dreyfus Taxable Fixed Income Team that manages the fund.
Many sectors of the U.S. bond market continued to rally during the reporting period, despite heightened market volatility and the onset of a stronger economic recovery.Although recovering economies historically have given rise to inflationary pressures, which have tended to hinder returns from the more interest-rate-sensitive areas of the bond market, the current cycle has been different to date. Sluggish job growth in the U.S. and a weakening dollar against many foreign currencies have helped forestall potential inflationary factors, benefiting bonds.
Although our analysts and portfolio managers work hard to identify trends that may move the markets, no one can know with complete certainty what lies ahead for the U.S. economy and the bond market. As always, we encourage you to review your investments regularly with your financial advisor, who may be in the best position to suggest ways to position your portfolio for the opportunities and challenges of today’s financial markets.
Thank you for your continued confidence and support.
Sincerely,

Stephen E. Canter
Chairman and Chief Executive Officer The Dreyfus Corporation
April 15, 2004
2

DISCUSSION OF FUND PERFORMANCE
Gerald E. Thunelius, Portfolio Manager Dreyfus Taxable Fixed Income Team
How did Dreyfus A Bonds Plus, Inc. perform relative to its benchmark?
For the 12-month period ended March 31, 2004, the fund achieved a total return of 4.01% and produced aggregate income dividends of $0.534 per share.1 In comparison, the fund’s benchmark, the Lehman Brothers U.S.Aggregate Index (the “Index”), achieved a total return of 5.40% for the same period.2
The fund’s performance was aided by generally favorable market conditions during the reporting period, including a reduction in short-term interest rates in June 2003. The fund’s return trailed that of the Index, primarily because we adopted a relatively defensive investment posture during the reporting period’s second half, when the U.S. economic recovery gained momentum. However, generally weak labor markets and low inflation continued to support bond prices, and the fund’s defensive stance prevented it from participating fully in additional market gains that were achieved during the reporting period.
What is the fund’s investment approach?
The fund seeks to maximize total return, consisting of capital appreciation and current income.The fund invests at least 80% of its assets in bonds that, when purchased, are rated single-A or better, or if unrated, deemed to be of comparable quality by Dreyfus.While the fund may invest in a broad array of bonds, the portfolio has recently concentrated primarily on corporate securities, and we currently expect to maintain that focus for the near term. Of course, portfolio composition is subject to change at any time.
When selecting securities for the fund, we first examine U.S. and global economic conditions and other market factors in an effort to determine what we believe is the likely direction of long- and short-
The Fund 3
DISCUSSION OF FUND PERFORMANCE (continued)
term interest rates. Using a research-driven investment process, we then attempt to identify potentially profitable sectors before they are widely perceived by the market. Finally, we look for underpriced or mispriced securities within those sectors that, in our opinion, appear likely to perform well over time.
What other factors affected the fund’s performance?
During the early part of the reporting period, the fund’s holdings of investment-grade corporate bonds rallied as renewed expectations of stronger economic growth helped the sector continue to recover from previously depressed price levels. Because the fund held a larger percentage of its assets than the Index in corporate bonds, its performance benefited accordingly.At the time, the fund’s holdings of U.S. government securities also contributed positively to the fund’s performance when investors anticipated further reductions in short-term interest rates by the Federal Reserve Board (the “Fed”). Those expectations were realized in late June 2003, when the Fed cut rates to 1%, their lowest level since 1958.
In the summer of 2003, however, evidence of stronger economic growth roiled the more interest-rate-sensitive areas of the bond market, causing one of the worst six-week declines in the bond market’s history. In addition, by the fall of 2003, corporate bond prices had generally risen to levels that, in our opinion, were overvalued. Accordingly, we began to adjust the fund’s positioning to reflect a more defensive posture by reducing the fund’s overweighted position in corporate bonds and increasing the overall credit quality of the fund’s corporate holdings.To protect the fund from potentially higher interest rates, we reduced its average duration — a measure of sensitivity to changing interest rates — and positioned the fund for narrower yield differences among U.S. government securities of various maturities.
Despite the strengthening economy and heightened market volatility, prices of U.S. government securities generally continued to rally during the fourth quarter of 2003 and the opening months of 2004 in
4
response to persistent instability in Iraq, weak U.S. labor markets and the Fed’s repeatedly-stated commitment to an accommodative monetary policy. In addition, yield differences among bonds of various maturities widened as longer-term yields rose and short-term yields remained anchored by the 1% federal funds rate. At the same time, corporate bonds generally benefited from robust investor demand amid a relatively limited supply of newly issued bonds as companies cleaned up their balance sheets. Because of its relatively defensive posture, the fund did not participate fully in the bond market’s strength during the second half of the reporting period.
What is the fund’s current strategy?
At the end of the reporting period and in the days immediately following, we began to see early signs of stronger job growth and renewed inflationary pressures in the U.S. economy. Accordingly, we have continued to maintain what we believe to be a modestly defensive investment posture, including a shorter than average duration and a focus on higher-quality bonds. Among the fund’s holdings of corporate bonds, we have emphasized securities from companies in the health care, media and, to a lesser extent, airline industries, while generally deemphasizing those from financial companies whose businesses may be vulnerable to higher interest rates. In our view, these are prudent strategies while investors continue to adjust to a stronger economy.
April 15, 2004
1
| Total return includes reinvestment of dividends and any capital gains paid. Past performance is no guarantee of future results. Share price, yield and investment return fluctuate such that upon redemption, fund shares may be worth more or less than their original cost.
|
2
| SOURCE: LIPPER INC. — Reflects reinvestment of dividends and, where applicable, capital gain distributions.The Lehman Brothers U.S.Aggregate Index is a widely accepted, unmanaged total return index of corporate, U.S. government and U.S. government agency debt instruments, mortgage-backed securities and asset-backed securities with an average maturity of 1-10 years.
|
The Fund 5
FUND PERFORMANCE
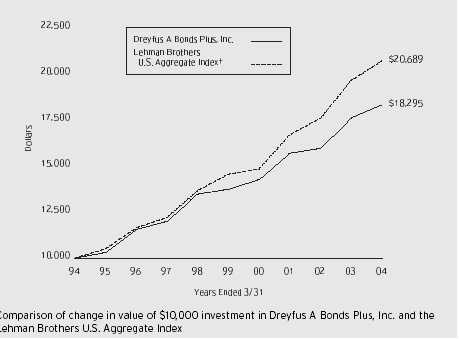
| Average Annual Total Returns as of 3/31/04 | | | | | | |
| | 1 Year | | 5 Years | | 10 Years | |
|
| |
| |
| |
| Fund | 4.01% | | 5.90% | | 6.23% | |
† Source: Lipper Inc.
Past performance is not predictive of future performance.The fund’s performance shown in the graph and table does not reflect the deduction of taxes that a shareholder would pay on fund distributions or the redemption of fund shares. The above graph compares a $10,000 investment made in Dreyfus A Bonds Plus, Inc. on 3/31/94 to a $10,000 investment made in the Lehman Brothers U.S.Aggregate Index (the “Index”) on that date.All dividends and capital gain distributions are reinvested.
The fund’s performance shown in the line graph takes into account all applicable fees and expenses.The Index is a widely accepted, unmanaged total return index of corporate, government and government agency debt instruments, mortgage-backed securities and asset-backed securities with an average maturity of 1-10 years and does not take into account charges, fees and other expenses. Further information relating to fund performance, including expense reimbursements, if applicable, is contained in the Financial Highlights section of the prospectus and elsewhere in this report.
6
| STATEMENT OF INVESTMENTS |
| March 31, 2004 |
| | Principal | | |
| Bonds and Notes—105.9% | Amount a | Value ($) | |
|
|
| |
| Aerospace & Defense—.5% | | | |
| General Dynamics, | | | |
| Sr. Notes, 4.5%, 2010 | 2,308,000 | 2,412,255 | |
| Agriculture—.8% | | | |
| Altria, | | | |
| Notes, 7%, 2013 | 1,450,000 | 1,600,788 | |
| Bunge Ltd. Finance, | | | |
| Notes, 4.375%, 2008 | 2,345,000 b | 2,418,551 | |
| | | 4,019,339 | |
| Airlines—.5% | | | |
| American Airlines, | | | |
| Pass-Through Ctfs.: | | | |
| Ser. AMBC, 3.857%, 2010 | 1,519,161 | 1,526,090 | |
| Ser. 1999-1, 7.024%, 2009 | 948,000 | 963,034 | |
| Continental Airlines, | | | |
| Pass-Through Ctfs., | | | |
| Ser. 1998-1, Cl. A, 6.648%, 2017 | 170,348 | 166,776 | |
| USAir, | | | |
| Enhanced Equipment Notes, | | | |
| Ser. C, 8.93%, 2009 | 904,468 c | 9,045 | |
| | | 2,664,945 | |
| Asset-Backed Ctfs./Credit Cards—1.1% | | | |
| MBNA Master Credit Card Note Trust, | | | |
| Ser. 2002-C1, Cl. C1, 6.8%, 2014 | 4,884,000 | 5,512,833 | |
| Asset-Backed Ctfs./Equipment—.2% | | | |
| Pegasus Aviation Lease Securitization, | | | |
| Ser. 2000-1, Cl. A1, 1.715%, 2015 | 2,302,705 b,d | 1,218,451 | |
| Banking—2.0% | | | |
| Bank of America, | | | |
| Sr. Notes, 4.375%, 2010 | 4,025,000 | 4,153,546 | |
| Dresdner Funding Trust I, | | | |
| Bonds, 8.151%, 2031 | 1,107,000 b | 1,312,270 | |
| Rabobank Capital Funding II, | | | |
| Bonds, 5.26%, 2049 | 1,800,000 b | 1,871,073 | |
| Sovereign Bancorp, | | | |
| Sr. Notes, 10.5%, 2006 | 1,403,000 | 1,671,384 | |
| State Street Institutional Capital, | | | |
| Capital Sec., Ser. A, 7.94%, 2026 | 902,000 b | 1,049,412 | |
| | | 10,057,685 | |
The Fund 7
STATEMENT OF INVESTMENTS (continued)
| | Principal | | | |
| Bonds and Notes (continued) | Amount a | | Value ($) | |
|
| |
| |
| Commercial Mortgage Pass-Through Ctfs.—2.7% | | | | |
| GMAC Commercial Mortgage Securities, | | | | |
| Ser. 2000-C2, Cl. A1, 7.273%, 2033 | 868,984 | | 956,304 | |
| GS Mortgage Securities II, | | | | |
| Ser. 2001-LIBA, Cl. A2, 6.615%, 2016 | 5,687,000 b | | 6,441,850 | |
| LB-UBS Commerical Mortgage Trust, | | | | |
| Ser. 2004-C1, Cl. J, 5.3193%, 2036 | 5,244,000 b | | 5,332,492 | |
| Morgan Stanley Dean Witter Capital I, | | | | |
| Ser. 2000-1345, Cl. B, 7.468%, 2015 | 800,000 b | | 961,314 | |
| | | | 13,691,960 | |
| Commercial Services—.4% | | | | |
| Cendant, | | | | |
| Notes, 7.125%, 2015 | 1,735,000 | | 2,016,521 | |
| Consumer Products—.6% | | | | |
| Kimberly-Clark, | | | | |
| Notes, 5%, 2013 | 3,080,000 | | 3,262,823 | |
| Diversified Financial Services—5.4% | | | | |
| American Express, | | | | |
| Notes, 4.875%, 2013 | 1,294,000 | | 1,346,381 | |
| Boeing Capital: | | | | |
| Bonds, 5.8%, 2013 | 484,000 | | 524,193 | |
| Sr. Notes, 4.75%, 2008 | 1,698,000 | | 1,792,956 | |
| CIT, | | | | |
| Sr. Notes, 4.75%, 2010 | 3,409,000 | | 3,539,367 | |
| Farmers Exchange Capital, | | | | |
| Trust Surplus Note Securities, 7.05%, 2028 | 1,120,000 b | | 1,138,940 | |
| Ford Motor Credit: | | | | |
| Global Landmark Securities, 5.625%, 2008 | 4,100,000 | | 4,235,886 | |
| Notes, 1.31%, 2007 | 1,674,000 d,e | | 1,625,873 | |
| Fund American Cos., | | | | |
| Notes, 5.875%, 2013 | 1,420,000 | | 1,494,040 | |
| General Electric Capital, | | | | |
| Sr. Notes, Ser. A, 4.25%, 2010 | 2,288,000 | | 2,344,845 | |
| GMAC, | | | | |
| Medium-Term Notes, 2.02%, 2007 | 4,094,000 d,e | | 4,064,581 | |
| Goldman Sachs: | | | | |
| Bonds, 5.15%, 2014 | 1,891,000 | | 1,945,582 | |
| Notes, 3.875%, 2009 | 1,535,000 | | 1,569,786 | |
8
| | | Principal | | | |
| Bonds and Notes (continued) | | Amount a | | Value ($) | |
|
|
| |
| |
| Diversified Financial Services (continued) | | | | | |
| Jefferies, | | | | | |
| Sr. Notes, 5.5%, 2016 | | 1,920,000 | | 1,971,521 | |
| | | | | 27,593,951 | |
| Electric Utilities—3.1% | | | | | |
| CenterPoint Energy Houston Electric, | | | | | |
| Notes, Ser. K2, 6.95%, 2033 | | 1,386,000 | | 1,598,080 | |
| Consolidated Edison of New York, | | | | | |
| Debs., 4.875%, 2013 | | 3,715,000 | | 3,867,746 | |
| Pacific Gas & Electric, | | | | | |
| First Mortgage, 4.8%, 2014 | | 1,721,000 | | 1,733,211 | |
| Public Service Co. of Colorado, | | | | | |
| First Mortgage, 4.875%, 2013 | | 2,487,000 | | 2,569,491 | |
| SCANA, | | | | | |
| Sr. Notes, 1.57%, 2006 | | 1,636,000 d | | 1,637,736 | |
| Salt River Project Agricultural Improvement | | | | | |
| & Power, Bonds, 5%, 2012 | | 2,000,000 | | 2,252,260 | |
| TXU Energy, | | | | | |
| Sr. Notes, 7%, 2013 | | 1,925,000 | | 2,210,495 | |
| | | | | 15,869,019 | |
| Food & Beverages—.5% | | | | | |
| Miller Brewing, | | | | | |
| Notes, 4.25%, 2008 | | 1,610,000 b | | 1,667,952 | |
| Pepsi Bottling, | | | | | |
| Sr. Notes, Ser. B, 7%, 2029 | | 575,000 | | 682,817 | |
| | | | | 2,350,769 | |
| Foreign/Governmental—4.2% | | | | | |
| Iceland Rikisbref, | | | | | |
| Notes, 7.25%, 2013 | ISK | 543,415,000 | | 7,608,868 | |
| Poland Government, | | | | | |
| Bonds, Ser. 1013, 5%, 2013 | PLN | 19,200,000 | | 4,395,750 | |
| U.K. Treasury, | | | | | |
| Bonds, 5%, 2014 | GBP | 4,885,000 | | 9,200,281 | |
| | | | | 21,204,899 | |
| Health Care—2.7% | | | | | |
| Abbott Laboratories, | | | | | |
| Notes, 4.35%, 2014 | | 3,585,000 e | | 3,577,776 | |
The Fund 9
STATEMENT OF INVESTMENTS (continued)
| | Principal | | | |
| Bonds and Notes (continued) | Amount a | | Value ($) | |
|
| |
| |
| Health Care (continued) | | | | |
| Bristol-Myers Squibb, | | | | |
| Notes, 5.75%, 2011 | 1,755,000 | | 1,932,270 | |
| HCA, | | | | |
| Notes, 7.125%, 2006 | 1,450,000 | | 1,568,739 | |
| Manor Care, | | | | |
| Notes, 6.25%, 2013 | 1,095,000 | | 1,175,756 | |
| Wyeth, | | | | |
| Notes, 5.5%, 2014 | 5,000,000 | | 5,252,670 | |
| | | | 13,507,211 | |
| Manufacturing—1.0% | | | | |
| General Electric, | | | | |
| Notes, 5%, 2013 | 2,913,000 | | 3,055,580 | |
| Tyco International, | | | | |
| Notes, 5.8%, 2006 | 1,877,000 e | | 1,995,300 | |
| | | | 5,050,880 | |
| Media—1.7% | | | | |
| Clear Channel Communications, | | | | |
| Sr. Notes, 5%, 2012 | 434,000 | | 445,374 | |
| Comcast, | | | | |
| Sr. Notes, 6.5%, 2015 | 2,667,000 | | 2,957,266 | |
| Cox Communications, | | | | |
| Notes, 6.75%, 2011 | 1,587,000 | | 1,808,783 | |
| InterActive, | | | | |
| Notes, 7%, 2013 | 2,151,000 e | | 2,450,963 | |
| Liberty Media, | | | | |
| Sr. Notes, 5.7%, 2013 | 620,000 | | 648,688 | |
| Time Warner, | | | | |
| Notes, 6.875%, 2012 | 420,000 | | 481,397 | |
| | | | 8,792,471 | |
| Mining & Metals—1.0% | | | | |
| Alcoa: | | | | |
| Notes, 4.25%, 2007 | 325,000 | | 342,877 | |
| Notes, 6%, 2012 | 2,517,000 e | | 2,837,442 | |
| Placer Dome, | | | | |
| Debs., Ser. B, 8.5%, 2045 | 1,715,000 | | 2,022,026 | |
| | | | 5,202,345 | |
10
| | Principal | | | |
| Bonds and Notes (continued) | Amount a | | Value ($) | |
|
| |
| |
| Oil & Gas—.3% | | | | |
| ConocoPhillips, | | | | |
| Notes, 4.75%, 2012 | 680,000 | | 702,380 | |
| Petro-Canada, | | | | |
| Notes, 4%, 2013 | 912,000 | | 869,077 | |
| | | | 1,571,457 | |
| Paper & Forest Products—.1% | | | | |
| International Paper, | | | | |
| Notes, 5.85%, 2012 | 370,000 | | 397,960 | |
| Property-Casualty Insurance—.5% | | | | |
| Chubb, | | | | |
| Notes, 6%, 2011 | 445,000 | | 495,320 | |
| Metlife, | | | | |
| Sr. Notes, 5.375%, 2012 | 2,015,000 e | | 2,142,180 | |
| | | | 2,637,500 | |
| Real Estate Investment Trusts—.1% | | | | |
| EOP Operating LP, | | | | |
| Sr. Notes, 7%, 2011 | 435,000 | | 505,214 | |
| Residential Mortgage Pass-Through Ctfs.—1.9% | | | | |
| Argent Securities, | | | | |
| Ser. 2004-W5, Cl. AF4, 4.01%, 2034 | 5,500,000 | | 5,498,487 | |
| Bank of America Mortgage Securities: | | | | |
| Ser. 2004-3, Cl. 3B1, 4.875%, 2019 | 588,748 | | 596,632 | |
| Ser. 2004-3, Cl. 3B2, 4.875%, 2019 | 261,998 | | 262,424 | |
| Countrywide Home Loans, | | | | |
| Ser. 2003-7, Cl. B3, 5.75%, 2033 | 613,060 b | | 567,520 | |
| Residential Asset Securitization Trust, | | | | |
| Ser. 2003-A8, Cl. B4, 4.75%, 2018 | 419,220 b | | 391,358 | |
| Residential Funding Mortgage Securities I, | | | | |
| Ser. 2004-S3, Cl. M1, 4.75%, 2019 | 1,370,500 | | 1,388,702 | |
| Wells Fargo Mortgage Backed Securities Trust: | | | | |
| Ser. 2002-17, Cl. B4, 5.75%, 2017 | 375,255 b | | 380,884 | |
| Ser. 2004-2, Cl. B4, 5%, 2019 | 347,422 b | | 316,697 | |
| Ser. 2004-3, Cl. B4, 4.75%, 2019 | 250,000 b | | 219,082 | |
| | | | 9,621,786 | |
| Retail—.6% | | | | |
| RadioShack, | | | | |
| Notes, 7.375%, 2011 | 2,500,000 | | 2,990,168 | |
The Fund 11
STATEMENT OF INVESTMENTS (continued)
| | Principal | | | |
| Bonds and Notes (continued) | Amount a | | Value ($) | |
|
| |
| |
| State Government—1.1% | | | | |
| Golden State Tobacco Securitization, | | | | |
| Bonds, 5.5%, 2018 | 1,921,000 | | 2,011,325 | |
| State of Connecticut, | | | | |
| Bonds, 5%, 2010 | 1,350,000 | | 1,527,633 | |
| State of Maryland, | | | | |
| Bonds, 5%, 2011 | 1,800,000 | | 2,047,680 | |
| | | | 5,586,638 | |
| Structured Index—5.1% | | | | |
| AB Svensk Exportkredit, | | | | |
| GSNE-ER Indexed Notes, 0%, 2007 | 10,760,000 b,f | | 11,152,740 | |
| HSBC Bank USA Trenched Investment-Grade | | | | |
| Enhanced Return Securities (“TIGERS”): | | | | |
| Medium-Term Notes, | | | | |
| Ser. 2003-2, 3.96%, 2008 | 8,750,000 b,d,g | | 8,557,500 | |
| Medium-Term Notes, | | | | |
| Ser. 2003-3, 3.96%, 2008 | 6,481,000 b,d,g | | 6,479,846 | |
| | | | 26,190,086 | |
| Technology—.8% | | | | |
| Hewlett-Packard, | | | | |
| Notes, 5.75%, 2006 | 2,841,000 | | 3,094,920 | |
| IBM, | | | | |
| Sr. Notes, 4.75%, 2012 | 850,000 | | 880,139 | |
| | | | 3,975,059 | |
| Telecommunications—.6% | | | | |
| Motorola, | | | | |
| Sr. Notes, 8%, 2011 | 630,000 | | 754,086 | |
| Verizon Florida, | | | | |
| Debs., Ser. F, 6.125%, 2013 | 1,622,000 | | 1,772,027 | |
| Verizon Wireless, | | | | |
| Notes, 5.375%, 2006 | 285,000 | | 307,201 | |
| Vodafone, | | | | |
| Notes, 7.875%, 2030 | 140,000 | | 178,049 | |
| | | | 3,011,363 | |
| Transportation—.2% | | | | |
| Puerto Rico Highway & Transportation Authority, | | | | |
| Bonds, 5.5%, 2012 | 790,000 | | 923,131 | |
| Union Pacific, | | | | |
| Debs., 7.125%, 2028 | 285,000 | | 334,226 | |
| | | | 1,257,357 | |
12
| | Principal | | | |
| Bonds and Notes (continued) | Amount a | | Value ($) | |
|
| |
| |
| U.S. Government—33.7% | | | | |
| U.S. Treasury Inflation Protection Securities: | | | | |
| Coupon Strips: | | | | |
| 0%, 10/15/2028 | 750,000 h,i | | 830,126 | |
| 0%, 4/15/2029 | 750,000 h,i | | 831,738 | |
| Principal Strips, | | | | |
| 0%, 4/15/2029 | 10,000,000 i | | 6,812,705 | |
| U.S. Treasury Notes: | | | | |
| 1.625%, 2/28/2006 | 8,000,000 e | | 8,015,008 | |
| 2.625%, 3/15/2009 | 35,818,000 | | 35,571,787 | |
| 3.375%, 11/15/2008 | 17,909,000 | | 18,458,878 | |
| 4%, 2/15/2014 | 100,000,000 e,j | | 101,343,800 | |
| | | | 171,864,042 | |
| U.S. Government Agencies/ | | | | |
| Mortgage-Backed—32.5% | | | | |
| Federal Home Loan Mortgage Corp., | | | | |
| REMIC, Gtd. Multiclass Mortgage Participation Ctfs.: | | | | |
| Ser. 51, Cl. E, 10%, 7/15/2020 | 768,542 | | 769,749 | |
| Ser. 2586, Cl. WE, 4%, 2032 | 8,783,036 | | 8,869,938 | |
| Ser. 2612, Cl. LJ, 4%, 7/15/2022 | 4,069,396 | | 4,164,897 | |
| Ser. 2693, Cl. MH, 4%, 2027 | 7,000,000 | | 7,035,000 | |
| (Interest Only Obligation): | | | | |
| Ser. 1995, Cl. PY, 7%, 10/15/2027 | 2,041,282 h | | 244,801 | |
| Ser. 2770, Cl. YI, 5%, 6/15/2022 | 5,000,000 h | | 646,094 | |
| Federal National Mortgage Association: | | | | |
| 6%, 1/1/2019-4/1/2033 | 6,931,636 | | 7,240,197 | |
| 8%, 12/1/2025 | 111,879 | | 122,437 | |
| REMIC Trust, Gtd. Pass-Through Ctfs.: | | | | |
| Ser. 1988-16, Cl. B, 9.5%, 6/25/2018 | 461,865 | | 515,533 | |
| (Interest Only Obligation), | | | | |
| Ser. 1996-64, Cl. PM, 7%, 1/18/2012 | 1,165,601 h | | 137,611 | |
| Government National Mortgage Association I: | | | | |
| 5.5% | 11,625,000 k | | 11,959,218 | |
| 5.5%, 4/15/2033-2/15/2034 | 29,943,485 | | 30,834,000 | |
| 6%, 3/15/2029-1/15/2034 | 58,641,213 | | 61,286,433 | |
| 7%, 6/15/2008 | 14,852 | | 15,781 | |
| 9.5%, 11/15/2017 | 1,031,613 | | 1,153,148 | |
| Project Loan: | | | | |
| 6.55%, 6/15/2033 | 1,763,013 | | 1,969,877 | |
| 6.625%, 6/1/2033-9/15/2033 | 5,763,564 | | 6,452,840 | |
| 6.75%, 10/15/2033 | 2,134,920 | | 2,410,554 | |
| 6.86%, 4/15/2004 | 12,672,165 | | 14,125,504 | |
The Fund 13
STATEMENT OF INVESTMENTS (continued)
| | | Principal | | |
| Bonds and Notes (continued) | Amount a | Value ($) | |
|
|
| |
| U.S. Government Agencies/Mortgage-Backed (continued) | | | |
| Government National Mortgage Association II, | | | |
| (Interest Only Obligation) | | | |
| Ser. 2003-40, Cl. IE, 5%, 3/20/2028 | 7,955,565 h | 953,938 | |
| U.S. Government Gtd. Development Participation Ctfs., | | | |
| (Gtd. By U.S.Small Business Administration): | | | |
| Ser. 1994-20K, Cl. 1, 8.65%, 11/1/2014 | 1,360,828 | 1,517,539 | |
| Ser. 1994-20L, Cl. 1, 8.4%, 12/1/2014 | 1,946,040 | 2,168,066 | |
| Ser. 1997-20J, Cl. 1, 6.55%, 10/1/2017 | 1,000,256 | 1,099,900 | |
| | | | 165,693,055 | |
| Total Bonds and Notes | | | |
| (cost $ | 531,883,967) | | 539,730,042 | |
|
|
|
| |
| | | | | |
| Preferred Stocks—.4% | Shares | Value ($) | |
|
|
| |
| Telecommunications; | | | |
| Motorola, | | | | |
| Cum. Conv., $3.50 (units) | | | |
| (cost $ | 1,973,450) | 39,469 l | 1,916,615 | |
|
|
|
| |
| | | | | |
| Other—.6% | | | | |
|
|
|
| |
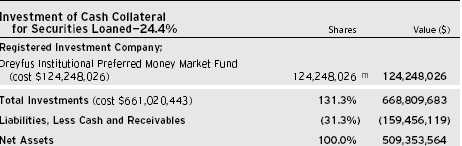
| Registered Investment Companies: | | | |
| Dreyfus Institutional Cash Advantage Fund | 971,667 m | 971,667 | |
| Dreyfus Institutional Cash Advantage Plus Fund | 971,667 m | 971,667 | |
| Dreyfus Institutional Preferred Plus Money Market Fund | 971,666 m | 971,666 | |
| Total Other Investments | | | |
| (cost $ | 2,915,000) | | 2,915,000 | |
14
a Principal amount stated in U.S Dollars unless otherwise noted.
GBP—British Pound ISK—Icelandic Krona PLN—Polish Zloty
b
| Securities exempt from registration under Rule 144A of the Securities Act of 1933.These securities may be resold in transactions exempt from registration, normally to qualified institutional buyers.At March 31, 2004, these securities amounted to $51,477,932 or 10.1% of net assets.
|
c
| Non-income producing—security in default.
|
d
| Variable rate security—interest rate subject to periodic change.
|
e
| All or a portion of these securities are on loan.At March 31, 2004, the total market value of the fund's securities on loan is $117,472,956 and the total market value of the collateral held by the fund is $154,817,348, consisting of cash collateral of $124,248,026 and U.S. Government and agency securities valued at $30,569,322.
|
f
| Security linked to Goldman Sachs Non-Energy—Excess Return Index.
|
g
| Security linked to a portfolio of debt securities.
|
h
| Notional face amount shown.
|
i
| Principal amount for accrual purposes is periodically adjusted based on changes in the Consumer Price Index.
|
j
| Partially or wholly held by a broker as collateral for open financial futures positions.
|
k
| Purchased on a forward commitment basis.
|
l
| Units represent a contract to purchase shares of common stock for $50 on November 16, 2004 and a senior note with a principal amount of $50.
|
m
| Investments in affiliated money market mutual funds.
|
See notes to financial statements.
The Fund 15
| STATEMENT OF FINANCIAL FUTURES |
| March 31, 2004 |
| | | | Market Value | | Unrealized | |
| | | | Covered by | | Appreciation | |
| | Contracts | | Contracts ($) | Expiration | at 3/31/2004 ($) | |
|
| |
|
|
| |
| Financial Futures Long | | | | | | |
| U.S. Treasury 5 Year Notes | 1,365 | | 155,012,813 | June 2004 | 15,887 | |
See notes to financial statements.
16
| STATEMENT OF ASSETS AND LIABILITIES |
| March 31, 2004 |
| | | Cost | Value | |
|
|
|
| |
| Assets ($): | | | | |
| Investments in securities—See Statement of | | | |
| Investments (including securities on loan, | | | |
| valued at $117,472,956)—Note 1(c): | | | |
| Unaffiliated issuers | 533,857,417 | 541,646,657 | |
| Affiliated issuers | 127,163,026 | 127,163,026 | |
| Cash denominated in foreign currencies | 1,666 | 1,617 | |
| Receivable for investment securities sold | | 81,820,276 | |
| Dividends and interest receivable | | 3,945,614 | |
| Receivable for futures variation margin—Note 4 | | 145,430 | |
| Receivable for shares of Common Stock subscribed | | 28,162 | |
| Unrealized appreciation on swaps—Note 4 | | 22,622 | |
| Prepaid expenses | | 10,838 | |
| | | | 754,784,242 | |
|
|
|
| |
| Liabilities ($): | | | |
| Due to The Dreyfus Corporation and affiliates—Note 3(a) | | 342,019 | |
| Cash overdraft due to Custodian | | 958,269 | |
| Liability for securities on loan—Note 1(c) | | 124,248,026 | |
| Payable for investment securities purchased | | 117,941,606 | |
| Payable for shares of Common Stock redeemed | | 1,107,146 | |
| Unrealized depreciation on swaps—Note 4 | | 229,697 | |
| Unrealized depreciation on forward | | | |
| currency exchange contracts—Note 4 | | 218,640 | |
| Payable to broker for swaps opened—Note 4 | | 41,120 | |
| Accrued expenses | | 344,155 | |
| | | | 245,430,678 | |
|
|
|
| |
| Net Assets ( | $) | | 509,353,564 | |
|
|
|
| |
| Composition of Net Assets ($): | | | |
| Paid-in capital | | | 527,715,015 | |
| Accumulated undistributed investment income—net | | 4,186,691 | |
| Accumulated net realized gain (loss) on investments | | (29,936,773) | |
| Accumulated net unrealized appreciation (depreciation) on | | | |
| investments and foreign currency transactions (including | | | |
| $15,887 net unrealized appreciation on financial futures) | | 7,388,631 | |
|
|
| |
| Net Assets ( | $) | | 509,353,564 | |
|
|
|
| |
| Shares Outstanding | | | |
| (100 million shares of $.001 par value Common Stock authorized) | 36,024,834 | |
| Net Asset Value, offering and redemption price per share ($) | | 14.14 | |
| | | | | |
| See notes to financial statements. | | | |
The Fund 17
STATEMENT OF OPERATIONS
Year Ended March 31, 2004
| Investment Income ($): | | | | |
| Interest | | | 21,723,545 | |
| Cash dividends: | | | | |
| Unaffiliated issuers | | | 482,631 | |
| Affiliated issuers | | | 450,436 | |
| Income from securities lending | | | 105,092 | |
| Total Income | | | 22,761,704 | |
| Expenses: | | | | |
| Management fee—Note 3(a) | | | 3,676,503 | |
| Shareholder servicing costs—Note 3(b) | | | 1,261,712 | |
| Custodian fees—Note 3(b) | | | 98,525 | |
| Professional fees | | | 64,300 | |
| Directors' fees and expenses—Note 3(c) | | | 53,634 | |
| Prospectus and shareholders' reports | | | 50,839 | |
| Registration fees | | | 31,365 | |
| Interest expense—Note 2 | | | 8,621 | |
| Miscellaneous | | | 14,197 | |
| Total Expenses | | | 5,259,696 | |
| Investment Income—Net | | | 17,502,008 | |
|
| |
| |
| Realized and Unrealized Gain (Loss) on Investments—Note 4 ($): | | | |
| Net realized gain (loss) on investments and foreign currency transactions: | | | |
| Long transactions | | | 26,517,835 | |
| Short transactions | | | 690,961 | |
| Net realized gain (loss) on options transactions | | | 403,202 | |
| Net realized gain (loss) on financial futures | | | (13,989,107) | |
| Net realized gain (loss) on swap transactions | | | (728,185) | |
| Net realized gain (loss) on forward currency exchange contracts | | (2,514,566) | |
| Net Realized Gain (Loss) | | | 10,380,140 | |
| Net unrealized appreciation (depreciation) on investments | | | |
| and foreign currency transactions (ncluding $ | 103,343 | | | |
| net unrealized appreciation on financial futures) | | (5,183,119) | |
| Net Realized and Unrealized Gain (Loss) on Investments | | 5,197,021 | |
| Net Increase in Net Assets Resulting from Operations | | 22,699,029 | |
| | | | | |
| See notes to financial statements. | | | | |
18
STATEMENT OF CHANGES IN NET ASSETS
| | | | Year Ended March 31, | |
| | | |
| |
| | 2004 | | 2003 | |
|
| |
| |
| Operations ($): | | | | |
| Investment income—net | 17,502,008 | | 27,079,442 | |
| Net realized gain (loss) on investments | 10,380,140 | | 11,155,121 | |
| Net unrealized appreciation | | | | |
| (depreciation) on investments | (5,183,119) | | 19,596,533 | |
| Net Increase (Decrease) in Net Assets | | | | |
| Resulting from Operations | 22,699,029 | | 57,831,096 | |
|
| |
| |
| Dividends to Shareholders from ($): | | | | |
| Investment income—net | (21,648,632) | | (29,666,042) | |
|
| |
| |
| Capital Stock Transactions ($): | | | | |
| Net proceeds from shares sold | 55,047,715 | | 125,627,329 | |
| Dividends reinvested | 19,164,950 | | 26,074,297 | |
| Cost of shares redeemed | (172,869,858) | | (146,146,837) | |
| Increase (Decrease) in Net Assets from | | | | |
| Capital Stock Transactions | (98,657,193) | | 5,554,789 | |
| Total Increase (Decrease) in Net Assets | (97,606,796) | | 33,719,843 | |
|
| |
| |
| Net Assets ($): | | | | |
| Beginning of Period | 606,960,360 | | 573,240,517 | |
| End of Period | 509,353,564 | | 606,960,360 | |
| Undistributed investment income—net | 4,186,691 | | 3,843,004 | |
|
| |
| |
| Capital Share Transactions (Shares): | | | | |
| Shares sold | 3,895,819 | | 9,158,234 | |
| Shares issued for dividends reinvested | 1,362,364 | | 1,905,342 | |
| Shares redeemed | (12,226,347) | | (10,636,852) | |
| Net Increase (Decrease) in Shares Outstanding | (6,968,164) | | 426,724 | |
See notes to financial statements.
The Fund 19
FINANCIAL HIGHLIGHTS
The following table describes the performance for the fiscal periods indicated.Total return shows how much your investment in the fund would have increased (or decreased) during each period, assuming you had reinvested all dividends and dis-tributions.These figures have been derived from the fund’s financial statements.
| | | | Year Ended March 31, | | | |
| | | |
| | | |
| | 2004 | | 2003 | | 2002a | | 2001 | | 2000 | |
|
| |
| |
| |
| |
| |
| Per Share Data ($): | | | | | | | | | | |
| Net asset value, beginning of period | 14.12 | | 13.47 | | 14.10 | | 13.65 | | 13.99 | |
| Investment Operations: | | | | | | | | | | |
| Investment income—net | .44b | | .63b | | .81b | | .84 | | .85 | |
| Net realized and unrealized gain | | | | | | | | | | |
| (loss) on investments | .11 | | .71 | | (.56) | | .47 | | (.34) | |
| Total from Investment Operations | .55 | | 1.34 | | .25 | | 1.31 | | .51 | |
| Distributions: | | | | | | | | | | |
| Dividends from investment income—net | (.53) | | (.69) | | (.88) | | (.86) | | (.85) | |
| Net asset value, end of period | 14.14 | | 14.12 | | 13.47 | | 14.10 | | 13.65 | |
|
| |
| |
| |
| |
| |
| Total Return (%) | 4.01 | | 10.30 | | 1.68 | | 9.94 | | 3.85 | |
|
| |
| |
| |
| |
| |
| Ratios/Supplemental Data (%): | | | | | | | | | | |
| Ratio of expenses to average net assets | .93 | | .93 | | .93 | | .91 | | 1.00 | |
| Ratio of net investment income | | | | | | | | | | |
| to average net assets | 3.09 | | 4.56 | | 5.87 | | 6.29 | | 6.20 | |
| Portfolio Turnover Rate | 803.93c | | 636.05 | | 533.95 | | 718.67 | | 557.83 | |
|
| |
| |
| |
| |
| |
| Net Assets, end of period ($ x 1,000) | 509,354 | | 606,960 | | 573,241 | | 578,293 | | 453,295 | |
a As required, effective April 1, 2001, the fund has adopted the provisions of the AICPA Audit and Accounting Guide for Investment Companies and began amortizing discount or premium on fixed income securities on a scientific basis and including paydown gains and losses in interest income.The effect of these changes for the period ended March 31, 2002 was to decrease net investment income per share by $.04, increase net realized and unrealized gain (loss) on investments per share by $.04 and decrease the ratio of net investment income to average net assets from 6.15% to 5.87%. Per share data and ratios/supplemental data for periods prior to April 1, 2001 have not been restated to reflect these changes in presentation.
|
b
| Based on average shares outstanding at each month end.
|
c
| The portfolio turnover rate excluding mortgage dollar roll transactions was 655.66%.
|
See notes to financial statements.
20
NOTES TO FINANCIAL STATEMENTS
NOTE 1—Significant Accounting Policies:
Dreyfus A Bonds Plus, Inc. (the “fund”) is registered under the Investment Company Act of 1940, as amended (the “Act”), as a diversified open-end management investment company.The fund’s investment objective is to maximize total return, consisting of capital appreciation and current income.The Dreyfus Corporation (the “Manager” or “Dreyfus”) serves as the fund’s investment adviser.The Manager is a wholly-owned subsidiary of Mellon Financial Corporation (“Mellon Financial”). Dreyfus Service Corporation (the “Distributor”), a wholly-owned subsidiary of the Manager, is the distributor of the fund’s shares, which are sold to the public without a sales charge.
The fund’s financial statements are prepared in accordance with accounting principles generally accepted in the United States, which may require the use of management estimates and assumptions.Actual results could differ from those estimates.
The fund enters into contracts that contain a variety of indemnifications. The fund’s maximum exposure under these arrangements is unknown.The fund does not anticipate recognizing any loss related to these arrangements.
(a) Portfolio valuation: Investments in securities (excluding short-term investments, other than U.S. Treasury Bills, financial futures, options, swaps and forward currency exchange contracts) are valued each business day by an independent pricing service (the “Service”) approved by the Board of Directors. Investments for which quoted bid prices are readily available and are representative of the bid side of the market in the judgment of the Service are valued at the mean between the quoted bid prices (as obtained by the Service from dealers in such securities) and asked prices (as calculated by the Service based upon its evaluation of the market for such securities). Other investments (which constitute a majority of the portfolio securities) are carried at fair value as determined by the Service, based on methods which include consideration of: yields or prices of securities of comparable
The Fund 21
NOTES TO FINANCIAL STATEMENTS (continued)
quality, coupon, maturity and type; indications as to values from dealers; and general market conditions. Securities for which there are no such valuations are valued at fair value as determined in good faith under the direction of the Board of Directors. Short-term investments, excluding U.S. Treasury Bills, are carried at amortized cost, which approximates value. Financial futures and options, which are traded on an exchange, are valued at the last sales price on the securities exchange on which such securities are primarily traded or at the last sales price on the national securities market on each business day. Options traded over-the-counter are priced at the mean between the bid prices and asked prices. Swap transactions are valued daily based upon future cash flows and other factors, such as interest rates and underlying securities. Investments denominated in foreign currencies are translated to U.S. dollars at the prevailing rates of exchange. Forward currency exchange contracts are valued at the forward rate.
(b) Foreign currency transactions: The fund does not isolate that portion of the results of operations resulting from changes in foreign exchange rates on investments from the fluctuations arising from changes in market prices of securities held. Such fluctuations are included with the net realized and unrealized gain or loss from investments.
Net realized foreign exchange gains or losses arise from sales and maturities of short-term securities, sales of foreign currencies, currency gains or losses realized on securities transactions and the difference between the amounts of dividends, interest and foreign withholding taxes recorded on the fund’s books and the U.S. dollar equivalent of the amounts actually received or paid. Net unrealized foreign exchange gains and losses arise from changes in the value of assets and liabilities other than investments in securities, resulting from changes in exchange rates. Such gains and losses are included with net realized and unrealized gain or loss on investments.
(c) Securities transactions and investment income: Securities transactions are recorded on a trade date basis. Realized gain and loss from securities transactions are recorded on the identified cost basis.
22
Dividend income is recognized on the ex-dividend date and interest income, including, where applicable, amortization of discount and premium on investments, is recognized on the accrual basis. Under the terms of the custody agreement, the fund receives net earnings credits based on available cash balances left on deposit.
The fund may lend securities to qualified institutions. At origination, all loans are secured by collateral of at least 102% of the value of U.S. securities loaned and 105% of the value of foreign securities loaned. Collateral equivalent to at least 100% of the market value of securities on loan will be maintained at all times. Cash collateral is invested in certain money market mutual funds managed by the Manager as shown in the fund’s Statement of Investments.The fund will be entitled to receive all income on securities loaned, in addition to income earned as a result of the lending transaction. Although each security loaned is fully collateralized, the fund would bear the risk of delay in recovery of, or loss of rights in, the securities loaned should a borrower fail to return the securities in a timely manner.
(d) Affiliated issuers: Issuers in which the fund held investments in other investment companies advised by the Manager are defined as “affiliated” in the Act.
(e) Dividends to shareholders: Dividends are recorded on the ex-dividend date. Dividends from investment income-net are declared and paid monthly. Dividends from net realized capital gain, if any, are normally declared and paid annually, but the fund may make distributions on a more frequent basis to comply with the distribution requirements of the Internal Revenue Code of 1986, as amended (the “Code”).To the extent that net realized capital gain, can be offset by capital loss carryovers, it is the policy of the fund not to distribute such gain. Income and capital gain distributions are determined in accordance with income tax regulations, which may differ from accounting principles generally accepted in the United States.
The Fund 23
NOTES TO FINANCIAL STATEMENTS (continued)
On March 31, 2004, the Board of Directors declared a cash dividend of $.042 per share from undistributed investment income-net, payable on April 1, 2004 (ex-dividend date), to shareholders of record as of the close of business on March 31, 2004.
(f) Federal income taxes: It is the policy of the fund to continue to qualify as a regulated investment company, if such qualification is in the best interests of its shareholders, by complying with the applicable provisions of the Code and to make distributions of taxable income sufficient to relieve it from substantially all federal income and excise taxes.
At March 31, 2004, the components of accumulated earnings on a tax basis were as follows: undistributed ordinary income $4,860,277, accumulated capital losses $26,146,431 and unrealized appreciation $5,770,555. In addition, the fund had $3,153,819 of capital losses realized after October 31, 2003, which were deferred for tax purposes to the first day of the following fiscal year.
The accumulated capital loss carryover is available to be applied against future net securities profits, if any, realized subsequent to March 31, 2004. The amount of this loss which can be utilized in subsequent years is subject to an annual limitation due to the fund’s merger with Dreyfus Strategic Governments Income, Inc. If not applied, $13,098,116 of the carryover expires in fiscal 2008, $10,726,778 expires in fiscal 2010 and $2,321,537 expires in fiscal 2011.
The tax character of distributions paid to shareholders during the fiscal periods ended March 31, 2004 and March 31, 2003 were as follows: ordinary income $21,648,632 and $29,666,042, respectively.
During the period ended March 31, 2004, as a result of permanent book to tax differences, the fund increased accumulated undistributed investment income-net by $4,490,311, decreased accumulated net realized gain (loss) on investments by $4,789,674 and increased paid-in capital by $299,363. Net assets were not affected by this reclassification.
24
NOTE 2—Bank Lines of Credit:
The fund may borrow up to $20 million for leveraging purposes under a short-term unsecured line of credit and participates with other Dreyfus-managed funds in a $100 million unsecured line of credit primarily to be utilized for temporary or emergency purposes, including the financing of redemptions. Interest is charged to the fund based on prevailing market rates in effect at the time of borrowings.
The average daily amount of borrowings outstanding under the leveraging arrangement during the period ended March 31, 2004, was approximately $601,600, with a related weighted average annualized interest rate of 1.43%.
NOTE 3—Management Fee and Other Transactions With Affiliates:
(a) Pursuant to a management agreement (“Agreement”) with the Manager, the management fee is computed at the annual rate of .65 of 1% of the value of the fund’s average daily net assets and is payable monthly.The Agreement provides that if in any full fiscal year the aggregate expenses of the fund, exclusive of taxes, interest on borrowings, brokerage commissions and extraordinary expenses, exceed 1 1 / 2% of the value of the fund’s average daily net assets, the fund may deduct from the payments to be made to the Manager, or the Manager will bear, the amount of such excess expense. During the period ended March 31, 2004, there was no expense reimbursement pursuant to the Agreement.
The components of Due to The Dreyfus Corporation and affiliates consists of: management fees $283,367, shareholder services plan fees $2,391, custodian fees $16,678 and transfer agency per account fees $39,583.
(b) Under the Shareholder Services Plan, the fund reimburses the Distributor an amount not to exceed an annual rate of .25 of 1% of the value of the fund’s average daily net assets for certain allocated
The Fund 25
NOTES TO FINANCIAL STATEMENTS (continued)
expenses of providing personal services and/or maintaining shareholder accounts.The services provided may include personal services relating to shareholder accounts, such as answering shareholder inquiries regarding the fund and providing reports and other information, and services related to the maintenance of shareholder accounts. During the period ended March 31, 2004, the fund was charged $344,910 pursuant to the Shareholder Services Plan.
The fund compensates Dreyfus Transfer, Inc., a wholly-owned subsidiary of the Manager, under a transfer agency agreement for providing personnel and facilities to perform transfer agency services for the fund. During the period ended March 31, 2004, the fund was charged $213,326 pursuant to the transfer agency agreement.
The fund compensates Mellon Bank, N.A., an affiliate of the Manager, under a custody agreement for providing custodial services for the fund. During the period ended March 31, 2004, the fund was charged $98,525 pursuant to the custody agreement.
(c) Each Board member also serves as a Board member of other funds within the Dreyfus complex. Annual retainer fees and attendance fees are allocated to each fund based on net assets.
(d) Pursuant to an exemptive order from the Securities and Exchange Commission, the fund may invest its available cash balances in affiliated money market mutual funds as shown in the fund’s Statement of Investments. Management fees of the underlying money market mutual funds have been waived by the Manager. During the period ended March 31, 2004, the fund derived $450,436 in income from these investments, which is included in dividend income in the fund’s Statement of Operations.
NOTE 4—Securities Transactions:
The following summarizes the aggregate amount of purchases and sales (including paydowns) of investment securities and securities sold short, excluding short-term securities, financial futures, forward cur-
26
rency exchange contracts, options transactions and swap transactions during the period ended March 31, 2004, of which $842,982,470 in purchases and $844,252,072 in sales were from dollar roll transactions:
| | Purchases ($) | | Sales ($) | |
|
| |
| |
| Long transactions | 4,570,901,463 | | 4,623,129,619 | |
| Short sale transactions | 77,852,272 | | 78,543,233 | |
| Total | 4,648,753,735 | | 4,701,672,852 | |
The fund may enter into dollar roll transactions with respect to mortgage-backed securities. In a dollar roll transaction, the fund sells mortgage-backed securities to a financial institution and simultaneously agrees to accept substantially similar (same type, coupon and maturity) securities at a later date, at an agreed upon price.
The fund is engaged in short-selling which obligates the fund to replace the security borrowed by purchasing the security at current market value.The fund would incur a loss if the price of the security increases between the date of the short sale and the date on which the fund replaces the borrowed security.The fund would realize a gain if the price of the security declines between those dates.The fund’s long security positions serve as collateral for the open short positions. At March 31, 2004, there were no securities sold short outstanding.
The following summarizes the fund’s call/put options written for the period ended March 31, 2004:
| | Face Amount | | | | Options Terminated | |
| | | | | |
| |
| | Covered by | | Premiums | | | | Net Realized | |
| Options Written: | Contracts ($) | | Received ($) | | Cost ($) | | Gain ($) | |
|
| |
| |
| |
| |
| Contracts outstanding | | | | | | | | |
| March 31, 2003 | — | | — | | | | | |
| Contracts written | 41,800,000 | | 349,030 | | | | | |
| Contracts expired | 41,800,000 | | 349,030 | | 162,497 | | 186,533 | |
| Contracts outstanding | | | | | | | | |
| March 31, 2004 | — | | — | | | | | |
The fund may purchase and write (sell) put and call options in order to gain exposure to or to protect against changes in the market.
The Fund 27
NOTES TO FINANCIAL STATEMENTS (continued)
As a writer of call options, the fund receives a premium at the outset and then bears the market risk of unfavorable changes in the price of the financial instrument underlying the option. Generally, the fund would incur a gain, to the extent of the premium, if the price of the underlying financial instrument decreases between the date the option is written and the date on which the option is terminated. Generally, the fund would realize a loss, if the price of the financial instrument increases between those dates.
As a writer of put options, the fund receives a premium at the outset and then bears the market risk of unfavorable changes in the price of the financial instrument underlying the option. Generally, the fund would incur a gain, to the extent of the premium, if the price of the underlying financial instrument increases between the date the option is written and the date on which the option is terminated. Generally, the fund would realize a loss, if the price of the financial instrument decreases between those dates.
The fund may invest in financial futures contracts in order to gain exposure to or protect against changes in the market. The fund is exposed to market risk as a result of changes in the value of the underlying financial instruments. Investments in financial futures require the fund to “mark to market” on a daily basis, which reflects the change in the market value of the contracts at the close of each day’s trading. Typically, variation margin payments are received or made to reflect daily unrealized gains or losses.When the contracts are closed, the fund recognizes a realized gain or loss.These investments require initial margin deposits with a broker, which consist of cash or cash equivalents. The amount of these deposits is determined by the exchange or Board of Trade on which the contract is traded and is subject to change. Contracts open at March 31, 2004, are set forth in the Statement of Financial Futures.
The fund enters into forward currency exchange contracts in order to hedge its exposure to changes in foreign currency exchange rates on its foreign portfolio holdings and to settle foreign currency transac-tions.When executing forward currency exchange contracts, the fund
28
is obligated to buy or sell a foreign currency at a specified rate on a certain date in the future. With respect to sales of forward currency exchange contracts, the fund would incur a loss if the value of the contract increases between the date the forward contract is opened and the date the forward contract is closed.The fund realizes a gain if the value of the contract decreases between those dates. With respect to purchases of forward currency exchange contracts, the fund would incur a loss if the value of the contract decreases between the date the forward contract is opened and the date the forward contract is closed. The fund realizes a gain if the value of the contract increases between those dates. The fund is also exposed to credit risk associated with counterparty nonperformance on these forward currency exchange contracts which is typically limited to the unrealized gain on each open contract. The following summarizes open forward currency exchange contracts at March 31, 2004:
| | Foreign | | | | | | | |
| Forward Currency | Currency | | | | | | Unrealized | |
| Exchange Contracts | Amounts | | Proceeds ($) | | Value ($) | | (Depreciation) ($) | |
|
| |
| |
| |
| |
| Sales; | | | | | | | | |
| British Pound, | | | | | | | | |
| expiring 6/30/2004 | 5,000,000 | | 9,016,250 | | 9,146,100 | | (129,850) | |
| Euro, | | | | | | | | |
| expiring 6/30/2004 | 2,293,000 | | 2,779,941 | | 2,815,345 | | (35,404) | |
| Poland Zloty, | | | | | | | | |
| expiring 6/30/2004 | 19,200,000 | | 4,870,006 | | 4,923,392 | | (53,386) | |
| Total | | | | | | | (218,640) | |
The fund may enter into swap agreements to exchange the interest rate on, or return generated by, one nominal instrument for the return generated by another nominal instrument.
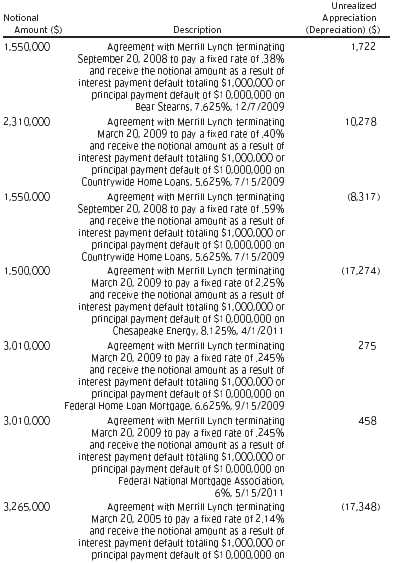
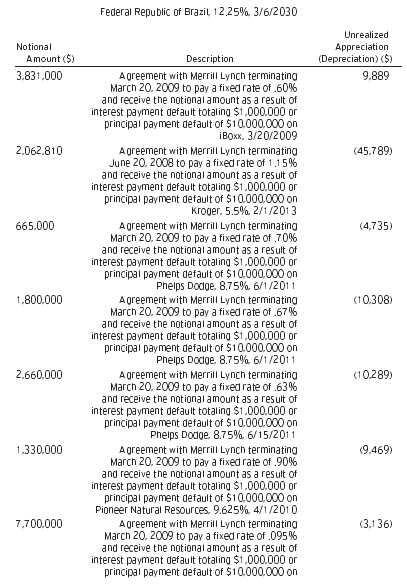
Credit default swaps involve commitments to pay a fixed rate in exchange for payment if a credit event affecting a third party (the referenced company) occurs. Credit events may include a failure to pay interest or principal, bankruptcy, or restructuring. Net periodic interest payments to be received or paid are accrued daily and are recorded in net realized gain (loss) on swap transactions in the Statement of Operations. Credit default swaps are marked-to-market daily and the
The Fund 29
NOTES TO FINANCIAL STATEMENTS (continued)
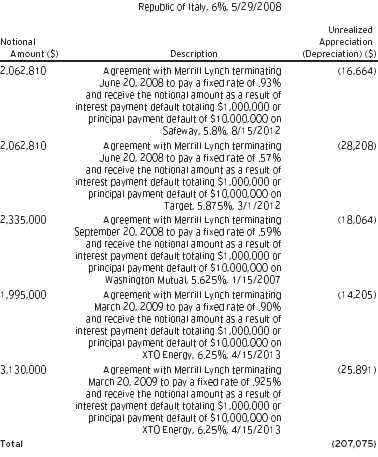
change, if any, is recorded as unrealized appreciation or depreciation in the Statement of Operations.The following summarizes credit default swaps entered into by the fund at March 31, 2004:
30
The Fund 31
NOTES TO FINANCIAL STATEMENTS (continued)
Realized gains and losses on maturity or termination of swaps are presented in the Statement of Operations. Risks may arise upon entering into these agreements from the potential inability of the counterparties to meet the terms of the agreement and are generally limited to the amount of net payments to be received, if any, at the date of default.
At March 31, 2004, the cost of investments for federal income tax purposes was $662,632,341; accordingly, accumulated net unrealized appreciation on investments was $6,177,342, consisting of $12,826,347 gross unrealized appreciation and $6,649,005 gross unrealized depreciation.
32
NOTE 5—Legal Matters:
Two class actions have been filed against Mellon Financial and Mellon Bank, N.A., and Dreyfus and Founders Asset Management LLC (the “Investment Advisers”), and the directors of all or substantially all of the Dreyfus funds, alleging that the Investment Advisers improperly used assets of the Dreyfus funds, in the form of directed brokerage commissions and 12b-1 fees, to pay brokers to promote sales of Dreyfus funds, and that the use of fund assets to make these payments was not properly disclosed to investors.The complaints further allege that the directors breached their fiduciary duties to fund shareholders under the Investment Company Act of 1940 and at common law.The complaints seek unspecified compensatory and punitive damages, rescission of the funds’ contracts with the Investment Advisers, an accounting of all fees paid, and an award of attorneys’ fees and litigation expenses. Dreyfus and the Dreyfus funds believe the allegations to be totally without merit and will defend the actions vigorously.
Additional lawsuits arising out of these circumstances and presenting similar allegations and requests for relief may be filed against the defendants in the future. Neither Dreyfus nor the Dreyfus funds believe that any of the pending actions will have a material adverse affect on the Dreyfus funds or Dreyfus’ ability to perform its contracts with the Dreyfus funds.
The Fund 33
REPORT OF INDEPENDENT AUDITORS
Shareholders and Board of Directors Dreyfus A Bonds Plus, Inc.
We have audited the accompanying statement of assets and liabilities of Dreyfus A Bonds Plus, Inc., including the statements of investments and financial futures, as of March 31, 2004, and the related statement of operations for the year then ended, the statement of changes in net assets for each of the two years in the period then ended, and financial highlights for each of the years indicated therein.These financial statements and financial highlights are the responsibility of the Fund’s management. Our responsibility is to express an opinion on these financial statements and financial highlights based on our audits.
We conducted our audits in accordance with auditing standards generally accepted in the United States. Those standards require that we plan and perform the audit to obtain reasonable assurance about whether the financial statements and financial highlights are free of material misstatement. An audit includes examining, on a test basis, evidence supporting the amounts and disclosures in the financial statements and financial highlights. Our procedures included verification by examination of securities held by the custodian as of March 31, 2004 and confirmation of securities not held by the custodian by correspondence with others.An audit also includes assessing the accounting principles used and significant estimates made by management, as well as evaluating the overall financial statement presentation. We believe that our audits provide a reasonable basis for our opinion.
In our opinion, the financial statements and financial highlights referred to above present fairly, in all material respects, the financial position of Dreyfus A Bonds Plus, Inc. at March 31, 2004, the results of its operations for the year then ended, the changes in its net assets for each of the two years in the period then ended, and the financial highlights for each of the indicated years, in conformity with accounting principles generally accepted in the United States.

| New York, New York |
| May 13, 2004 |
34
IMPORTANT TAX INFORMATION (Unaudited)
For federal tax purposes, the fund hereby designates 2.66% of the ordinary dividends paid during the fiscal year ended March 31, 2004 as qualifying for the corporate dividends received deduction. Shareholders will receive notification in January 2005 of the percentage applicable to the preparation of their 2004 income tax returns.
The Fund 35
BOARD MEMBERS INFORMATION (Unaudited)
| Joseph S. DiMartino (60) |
| Chairman of the Board (1995) |
| Principal Occupation During Past 5 Years: |
| • Corporate Director and Trustee |
| Other Board Memberships and Affiliations: |
| • The Muscular Dystrophy Association, Director |
| • Levcor International, Inc., an apparel fabric processor, Director |
| • Century Business Services, Inc., a provider of outsourcing functions for small and medium size |
| companies, Director |
| • The Newark Group, a provider of a national market of paper recovery facilities, paperboard |
| mills and paperboard converting plants, Director |
| No. of Portfolios for which Board Member Serves: 186 |
| ——————— |
| David P. Feldman (64) |
| Board Member (1994) |
| Principal Occupation During Past 5 Years: |
| • Corporate Director and Trustee |
| Other Board Memberships and Affiliations: |
| • BBH Mutual Funds Group (11 funds), Director |
| • The Jeffrey Company, a private investment company, Director |
| • QMED, a medical device company, Director |
| No. of Portfolios for which Board Member Serves: 51 |
| ——————— |
| James F. Henry (73) |
| Board Member (1976) |
| Principal Occupation During Past 5 Years: |
| • President, CPR Institute for Dispute Resolution, a non-profit organization principally |
| engaged in the development of alternatives to business litigation (Retired 2003) |
| No. of Portfolios for which Board Member Serves: 22 |
| ——————— |
| Rosalind Gersten Jacobs (78) |
| Board Member (1982) |
| Principal Occupation During Past 5 Years: |
| • Merchandise and marketing consultant |
| No. of Portfolios for which Board Member Serves: 33 |
36
| Dr. Paul A. Marks (77) |
| Board Member (1979) |
| Principal Occupation During Past 5 Years: |
| • President and Chief Executive Officer of Memorial Sloan-Kettering Cancer Center |
| (Retired 1999) |
| Other Board Memberships and Affiliations: |
| • Pfizer, Inc., a pharmaceutical company, Director-Emeritus |
| • Atom Pharm, Director |
| • Lazard Freres Company, LLC, Senior Advisor |
| No. of Portfolios for which Board Member Serves: 22 |
| ——————— |
| Dr. Martin Peretz (64) |
| Board Member (1976) |
| Principal Occupation During Past 5 Years: |
| • Editor-in-Chief of The New Republic Magazine |
| • Lecturer in Social Studies at Harvard University |
| • Co-Chairman of TheStreet.com, a financial daily on the web |
| Other Board Memberships and Affiliations: |
| • Academy for Liberal Education, an accrediting agency for colleges and universities certified by |
| the U.S. Department of Education, Director |
| • Digital Learning Group, LLC, an online publisher of college textbooks, Director |
| • Harvard Center for Blood Research,Trustee |
| • Bard College,Trustee |
| • YIVO Institute for Jewish Research,Trustee |
| No. of Portfolios for which Board Member Serves: 22 |
| ——————— |
| Bert W.Wasserman (71) |
| Board Member (1993) |
| Principal Occupation During Past 5 Years: |
| • Financial Consultant |
| Other Board Memberships and Affiliations: |
| • Lillian Vernon Corporation, Director |
| No. of Portfolios for which Board Member Serves: 22 |
Once elected all Board Members serve for an indefinite term.Additional information about the Board Members, including their address, is available in the fund’s Statement of Additional Information which can be obtained from Dreyfus free of charge by calling this toll free number: 1-800-554-4611.
John M. Fraser, Jr., Emeritus Board Member Irving Kristol, Emeritus Board Member
The Fund 37
OFFICERS OF THE FUND (Unaudited)
STEPHEN E. CANTER, President since March 2000.
Chairman of the Board, Chief Executive Officer and Chief Operating Officer of the Manager, and an officer of 96 investment companies (comprised of 185 portfolios) managed by the Manager. Mr. Canter also is a Board member and, where applicable, an Executive Committee Member of the other investment management subsidiaries of Mellon Financial Corporation, each of which is an affiliate of the Manager. He is 58 years old and has been an employee of the Manager since May 1995.
STEPHEN R. BYERS, Executive Vice President since November 2002.
Chief Investment Officer,Vice Chairman and a Director of the Manager, and an officer of 96 investment companies (comprised of 185 portfolios) managed by the Manager. Mr. Byers also is an officer, director or an Executive Committee Member of certain other investment management subsidiaries of Mellon Financial Corporation, each of which is an affiliate of the Manager. He is 50 years old and has been an employee of the Manager since January 2000. Prior to joining the Manager, he served as an Executive Vice President-Capital Markets, Chief Financial Officer and Treasurer at Gruntal & Co., L.L.C.
MARK N. JACOBS, Vice President since March 2000.
Executive Vice President, Secretary and General Counsel of the Manager, and an officer of 97 investment companies (comprised of 201 portfolios) managed by the Manager. He is 58 years old and has been an employee of the Manager since June 1977.
MICHAEL A. ROSENBERG, Secretary since March 2000.
Associate General Counsel of the Manager, and an officer of 94 investment companies (comprised of 194 portfolios) managed by the Manager. He is 44 years old and has been an employee of the Manager since October 1991.
ROBERT R. MULLERY, Assistant Secretary since March 2000.
Associate General Counsel of the Manager, and an officer of 26 investment companies (comprised of 58 portfolios) managed by the Manager. He is 52 years old and has been an employee of the Manager since May 1986.
STEVEN F. NEWMAN, Assistant Secretary since March 2000.
Associate General Counsel and Assistant Secretary of the Manager, and an officer of 97 investment companies (comprised of 201 portfolios) managed by the Manager. He is 54 years old and has been an employee of the Manager since July 1980.
JAMES WINDELS, Treasurer since November 2001.
Director – Mutual Fund Accounting of the Manager, and an officer of 97 investment companies (comprised of 201 portfolios) managed by the Manager. He is 45 years old and has been an employee of the Manager since April 1985.
38
ERIK D. NAVILOFF, Assistant Treasurer since December 2002.
Senior Accounting Manager – Taxable Fixed Income Funds of the Manager, and an officer of 19 investment companies (comprised of 74 portfolios) managed by the Manager. He is 35 years old and has been an employee of the Manager since November 1992.
KENNETH J. SANDGREN, Assistant Treasurer since November 2001.
Mutual Funds Tax Director of the Manager, and an officer of 97 investment companies (comprised of 201 portfolios) managed by the Manager. He is 49 years old and has been an employee of the Manager since June 1993.
WILLIAM GERMENIS, Anti-Money Laundering Compliance Officer since September 2002.
Vice President and Anti-Money Laundering Compliance Officer of the Distributor, and the Anti-Money Laundering Compliance Officer of 92 investment companies (comprised of 196 portfolios) managed by the Manager. He is 33 years old and has been an employee of the Distributor since October 1998.
The Fund 39
NOTES
For More Information
| Dreyfus |
| A Bonds Plus, Inc. |
| 200 Park Avenue |
| New York, NY 10166 |
| |
| Manager |
| The Dreyfus Corporation |
| 200 Park Avenue |
| New York, NY 10166 |
|
| |
| Custodian |
| Mellon Bank, N.A. |
| One Mellon Bank Center |
| Pittsburgh, PA 15258 |
| |
| Transfer Agent & |
| Dividend Disbursing Agent |
| Dreyfus Transfer, Inc. |
| 200 Park Avenue |
| New York, NY 10166 |
| |
| Distributor |
| Dreyfus Service Corporation |
| 200 Park Avenue |
| New York, NY 10166 |
To obtain information:
By telephone
Call 1-800-645-6561
By mail Write to:
The Dreyfus Family of Funds 144 Glenn Curtiss Boulevard Uniondale, NY 11556-0144
By E-mail Send your request to info@dreyfus.com
On the Internet Information can be viewed online or downloaded from: http://www.dreyfus.com
A description of the policies and procedures that the fund uses to determine how to vote proxies relating to portfolio securities is available, without charge, by calling the telephone number listed above, or by visiting the SEC’s website at http://www.sec.gov
© 2004 Dreyfus Service Corporation 0084AR0304
Item 2. Code of Ethics.
The Registrant has adopted a code of ethics that applies to the Registrant's principal executive officer, principal financial officer, principal accounting officer or controller, or persons performing similar functions.
Item 3. Audit Committee Financial Expert.
The Registrant's Board has determined that Bert W. Wasserman, a member of the Audit Committee of the Board, is an audit committee financial expert as defined by the Securities and Exchange Commission (the "SEC"). Mr. Wasserman is "independent" as defined by the SEC for purposes of audit committee financial expert determinations.
Item 4. Principal Accountant Fees and Services
(a) Audit Fees. The aggregate fees billed for each of the last two fiscal years (the "Reporting Periods") for professional services rendered by the Registrant's principal accountant (the "Auditor") for the audit of the Registrant's annual financial statements, or services that are normally provided by the Auditor in connection with the statutory and regulatory filings or engagements for the Reporting Periods, were $26,500 in 2003 and $27,825 in 2004.
(b) Audit-Related Fees. The aggregate fees billed in the Reporting Periods for assurance and related services by the Auditor that are reasonably related to the performance of the audit of the Registrant's financial statements and are not reported under paragraph (a) of this Item 4 were $4,500 in 2003 and $4, 500 in 2004. These services consisted of security counts required by Rule 17f-2 under the Investment Company Act of 1940, as amended.
The aggregate fees billed in the Reporting Periods for non-audit assurance and related services by the Auditor to the Registrant's investment adviser (not including any sub-investment adviser whose role is primarily portfolio management and is subcontracted with or overseen by another investment adviser), and any entity controlling, controlled by or under common control with the investment adviser that provides ongoing services to the Registrant ("Service Affiliates"), that were reasonably related to the performance of the annual audit of the Service Affiliate, which required pre-approval by the Audit Committee were $15,000 in 2003 and $288,500 in 2004.
Note: For the second paragraph in each of (b) through (d) of this Item 4, certain of such services were not pre-approved prior to May 6, 2003, when such services were required to be pre-approved. On and after May 6, 2003, 100% of all services provided by the Auditor were pre-approved as required. For comparative purposes, the fees shown assume that all such services were pre-approved, including services that were not pre-approved prior to the compliance date of the pre-approval requirement.
(c) Tax Fees. The aggregate fees billed in the Reporting Periods for professional services rendered by the Auditor for tax compliance, tax advice and tax planning ("Tax Services") were $5,245 in 2003 and $5,002 in 2004. These services consisted of (i) review or preparation of U.S. federal, state, local and excise tax returns; (ii) U.S. federal, state and local tax planning, advice and assistance regarding statutory, regulatory or administrative developments, (iii) tax advice regarding tax qualification matters and/or treatment of various
financial instruments held or proposed to be acquired or held, and (iv) determination of Passive Foreign Investment Companies.
The aggregate fees billed in the Reporting Periods for Tax Services by the Auditor to Service Affiliates which required pre-approval by the Audit Committee were $-0- in 2003 and $-0- in 2004.
(d) All Other Fees. The aggregate fees billed in the Reporting Periods for products and services provided by the Auditor, other than the services reported in paragraphs (a) through (c) of this Item, were $-0- in 2003 and $668 in 2004. These services consisted of a review of the Registrant's anti-money laundering program.
The aggregate fees billed in the Reporting Periods for Non-Audit Services by the Auditor to Service
Affiliates, other than the services reported in paragraphs (b) and (c) of this Item, which required pre-approval by the Audit Committee were $-0- in 2003 and $-0- in 2004.
Audit Committee Pre-Approval Policies and Procedures. The Registrant's Audit Committee has established policies and procedures (the "Policy") for pre-approval (within specified fee limits) of the Auditor's engagements for non-audit services to the Registrant and Service Affiliates without specific case-by-case consideration. Pre-approval considerations include whether the proposed services are compatible with maintaining the Auditor's independence. Pre-approvals pursuant to the Policy are considered annually.
Non-Audit Fees. The aggregate non-audit fees billed by the Auditor for services rendered to the Registrant, and rendered to Service Affiliates, for the Reporting Periods were $483,587 in 2003 and $639,435 in 2004.
Auditor Independence. The Registrant's Audit Committee has considered whether the provision of non-audit services that were rendered to Service Affiliates which were not pre-approved (not requiring pre-approval) is compatible with maintaining the Auditor's independence.
Item 5. Audit Committee of Listed Registrants.
Not applicable.
Item 6. [Reserved]
Item 7. Disclosure of Proxy Voting Policies and Procedures for Closed-End Management
Investment Companies.
Not applicable.
Item 8. Purchases of Equity Securities by Closed-End Management Investment Companies and Affiliated Purchasers.
Not applicable.
Item 9. Submission of Matters to a Vote of Security Holders.
The Fund has a Nominating Committee, which is responsible for selecting and nominating persons for election or appointment by the Fund’s Board as Board members. The Committee has adopted a Nominating Committee Charter (“Charter”). Pursuant to the Charter, the Committee will consider recommendations for nominees from shareholders submitted to the Secretary of the Fund, c/o The Dreyfus Corporation Legal Department, 200 Park Avenue, 8th Floor West, New York, New York 10166. A nomination submission must include information regarding the recommended nominee as specified in the Charter. This information includes all information
relating to a recommended nominee that is required to be disclosed in solicitations or proxy statements for the election of Board members, as well as information sufficient to evaluate the factors to be considered by the Committee, including character and integrity, business and professional experience, and whether the person has the ability to apply sound and independent business judgment and would act in the interests of the Fund and its shareholders. Nomination submissions are required to be accompanied by a written consent of the individual to stand for election if nominated by the Board and to serve if elected by the shareholders, and such additional information must be provided regarding the recommended nominee as reasonably requested by the Committee.
Item 10. Controls and Procedures.
(a) The Registrant's principal executive and principal financial officers have concluded, based on their evaluation of the Registrant's disclosure controls and procedures as of a date within 90 days of the filing date of this report, that the Registrant's disclosure controls and procedures are reasonably designed to ensure that information required to be disclosed by the Registrant on Form N-CSR is recorded, processed, summarized and reported within the required time periods and that information required to be disclosed by the Registrant in the reports that it files or submits on Form N-CSR is accumulated and communicated to the Registrant's management, including its principal executive and principal financial officers, as appropriate to allow timely decisions regarding required disclosure.
(b) There were no changes to the Registrant's internal control over financial reporting that occurred during the Registrant's most recently ended fiscal half-year that have materially affected, or are reasonably likely to materially affect, the Registrant's internal control over financial reporting.
Item 11. Exhibits.
(a)(1) Code of ethics referred to in Item 2.
(a)(2) Certifications of principal executive and principal financial officers as required by Rule 30a-2(a) under the Investment Company Act of 1940.
(a)(3) Not applicable.
(b) Certification of principal executive and principal financial officers as required by Rule 30a-2(b) under the Investment Company Act of 1940.
SIGNATURES
Pursuant to the requirements of the Securities Exchange Act of 1934 and the Investment Company Act of 1940, the Registrant has duly caused this Report to be signed on its behalf by the undersigned, thereunto duly authorized.
| Dreyfus A Bonds Plus, Inc. |
| | |
| By: | /s/ Stephen E. Canter |
| |
|
| | Stephen E. Canter |
| | President |
| | |
| Date: | May 27, 2004 |
Pursuant to the requirements of the Securities Exchange Act of 1934 and the Investment Company Act of 1940, this Report has been signed below by the following persons on behalf of the Registrant and in the capacities and on the dates indicated.
| By: | /s/ Stephen E. Canter |
| |
|
| | Stephen E. Canter |
| | Chief Executive Officer |
| | |
| Date: | May 27, 2004 |
| | |
| By: | /s/ James Windels |
| |
|
| | James Windels |
| | Chief Financial Officer |
| | |
| Date: | May 27, 2004 |
EXHIBIT INDEX
(a)(1) Code of ethics referred to in Item 2.
(a)(2) Certifications of principal executive and principal financial officers as required by Rule 30a-2(a) under the Investment Company Act of 1940. (EX-99.CERT)
(b) Certification of principal executive and principal financial officers as required by Rule 30a-2(b) under the Investment Company Act of 1940. (EX-99.906CERT)