| | | UNITED STATES |
| | | SECURITIES AND EXCHANGE COMMISSION |
| | | Washington, D.C. 20549 |
| |
| |
| | | FORM N-CSR |
| |
| CERTIFIED SHAREHOLDER REPORT OF REGISTERED MANAGEMENT |
| | | INVESTMENT COMPANIES |
| |
| Investment Company Act file number 811-2625 |
| |
| | | Dreyfus A Bonds Plus, Inc. |
| | | (Exact name of Registrant as specified in charter) |
| |
| |
| | | c/o The Dreyfus Corporation |
| | | 200 Park Avenue |
| | | New York, New York 10166 |
| | | (Address of principal executive offices) (Zip code) |
| |
| | | Mark N. Jacobs, Esq. |
| | | 200 Park Avenue |
| | | New York, New York 10166 |
| | | (Name and address of agent for service) |
| |
| Registrant's telephone number, including area code: (212) 922-6000 |
| |
| Date of fiscal year end: | | 3/31 |
| |
| Date of reporting period: | | 9/30/04 |
FORM N-CSR
Item 1. Reports to Stockholders.
| | Dreyfus
A Bonds Plus, Inc.
|
SEMIANNUAL REPORT September 30, 2004

The views expressed in this report reflect those of the portfolio manager only through the end of the period covered and do not necessarily represent the views of Dreyfus or any other person in the Dreyfus organization. Any such views are subject to change at any time based upon market or other conditions and Dreyfus disclaims any responsibility to update such views.These views may not be relied on as investment advice and, because investment decisions for a Dreyfus fund are based on numerous factors, may not be relied on as an indication of trading intent on behalf of any Dreyfus fund.
Not FDIC-Insured • Not Bank-Guaranteed • May Lose Value
| Contents |
| |
| | | THE FUND |
| |
|
| 2 | | Letter from the Chairman |
| 3 | | Discussion of Fund Performance |
| 6 | | Understanding Your Fund's Expenses |
| 6 | | Comparing Your Fund's Expenses |
| With Those of Other Funds |
| 7 | | Statement of Investments |
| 14 | | Statement of Options Written |
| 15 | | Statement of Assets and Liabilities |
| 16 | | Statement of Operations |
| 17 | | Statement of Changes in Net Assets |
| 18 | | Financial Highlights |
| 19 | | Notes to Financial Statements |
| FOR MORE INFORMATION |
|
| | | Back Cover |
| | Dreyfus
A Bonds Plus, Inc.
|
The Fund

LETTER FROM THE CHAIRMAN
Dear Shareholder:
This semiannual report for Dreyfus A Bonds Plus, Inc. covers the six-month period from April 1, 2004, through September 30, 2004. Inside, you'll find valuable information about how the fund was managed during the reporting period, including a discussion with Gerald E. Thunelius, portfolio manager and Director of the Dreyfus Taxable Fixed Income Team that manages the fund.
The U.S. economy has alternated between signs of strength and weakness, causing heightened volatility in most sectors of the bond market. Although the Federal Reserve Board (the "Fed") raised short-term interest rates three times during the reporting period, bond prices have held up better than many analysts expected, as investors apparently have revised their economic expectations in response to the insurgency in Iraq, higher energy prices and some disappointing labor statistics.
The Fed's move to a less accommodative monetary policy may be signaling the beginning of a new phase in the economic cycle.At times such as these, when market conditions are in a period of transition, we believe it is especially important for investors to stay in close touch with their financial advisors. Your financial advisor can help you rebalance your portfolio in a way that is designed to respond to the challenges and opportunities of today's changing investment environment.
Thank you for your continued confidence and support.
Sincerely,

| Stephen E. Canter |
| Chairman and Chief Executive Officer |
| The Dreyfus Corporation |
| October 15, 2004 |
2

DISCUSSION OF FUND PERFORMANCE
Gerald E. Thunelius, Director and Senior Portfolio Manager Dreyfus Taxable Fixed Income Team
How did Dreyfus A Bonds Plus, Inc. perform relative to its benchmark?
For the six-month period ended September 30, 2004, the fund achieved a total return of 0.51% and produced aggregate income dividends of $0.283 per share. 1 In comparison, the fund's benchmark, the Lehman Brothers U.S. Aggregate Index (the "Index"), achieved a total return of 0.68% for the same period.2
In anticipation of higher interest rates from the Federal Reserve Board (the "Fed"), the fund adopted a generally defensive investment posture, including a positioning designed to benefit from narrower yield differences, or "spreads." Although the Fed began to raise short-term interest rates in June 2004, persistent economic and geopolitical concerns continued to support bond prices. Though this benefited both the fund and the benchmark late in the reporting period, overall, the fund's return lagged that of its benchmark due to fund expenses to which the Index is not subject.
What is the fund's investment approach?
The fund seeks to maximize total return, consisting of capital appreciation and current income.The fund invests at least 80% of its assets in bonds that, when purchased, are rated single-A or better, or if unrated, deemed to be of comparable quality by Dreyfus.
When selecting securities for the fund, we first examine U.S. and global economic conditions and other market factors in an effort to determine what we believe is the likely direction of long- and short-term interest rates. Using a research-driven investment process, we then attempt to identify potentially profitable sectors before they are
The Fund 3
DISCUSSION OF FUND PERFORMANCE (continued)
widely perceived by the market. Finally, we look for underpriced or mispriced securities within those sectors that, in our opinion, appear likely to perform well over time.
What other factors affected the fund's performance?
When the reporting period began, investors' renewed expectations of stronger economic growth already had helped corporate bonds recover from previously depressed price levels. In addition, corporate bond prices were supported by supply-and-demand factors, including robust demand from investors seeking higher yields and a relatively limited supply of newly issued bonds from companies that had strengthened their balance sheets.
At the time, we had repositioned the fund in anticipation of higher interest rates. Like many investors, we expected the Fed to begin raising short-term rates as the economic recovery progressed and inflationary pressures intensified. Accordingly, we maintained the fund's average duration — a measure of sensitivity to changing interest rates — in a range we considered slightly short of neutral, and we positioned the fund for narrower yield spreads.
This positioning helped the fund's performance during the spring of 2004, when surprisingly strong labor statistics and higher energy prices fueled inflation concerns and led to a sharp decline in bond prices. For its part, the Fed fulfilled investors' revised expectations by implementing its first rate-hikes in more than four years. In three moves between June and September, the Fed raised its target for the overnight federal funds rate from 1% to 1.75% .
Despite higher short-term interest rates, however, bonds generally rallied during the summer of 2004 when signs of renewed economic weakness and persistent geopolitical instability suggested that inflation might remain low.The rally helped offset many of the bond market's losses from earlier in the reporting period.
4
On the other hand, the fund benefited from good performance from many of its investments. For example, the fund's holdings of Treasury Inflation Protected Securities ("TIPS"), which are not represented in the Index, fared well as inflation-related concerns and investor demand intensified. Certain individual corporate bond holdings also helped boost the fund's returns. While mortgage-backed securities also contributed positively to performance, the fund's relatively light exposure to the mortgage sector limited its participation in those gains.
What is the fund's current strategy?
As of the end of the reporting period, it appears to us that some areas of the bond market may have become overvalued. Consequently, we have increased the fund's holdings of U.S.Treasury securities, including TIPS, and we have maintained slightly lighter exposure than the benchmark to corporate bonds and mortgage-backed securities. In addition, the fund ended the reporting period with a larger-than-average percentage of its assets invested in cash equivalents. We also have identified a number of opportunities in the sovereign debt of foreign governments, such as the United Kingdom and Canada, that we expect to continue to benefit from changing currency exchange rates. In our view, these are prudent strategies for today's uncertain market environment.
October 15, 2004
1 Total return includes reinvestment of dividends and any capital gains paid. Past performance is no
guarantee of future results. Share price, yield and investment return fluctuate such that upon
redemption, fund shares may be worth more or less than their original cost.
2 SOURCE: LIPPER INC. — Reflects reinvestment of dividends and, where applicable, capital
gain distributions.The Lehman Brothers U.S.Aggregate Index is a widely accepted, unmanaged
total return index of corporate, U.S. government and U.S. government agency debt instruments,
mortgage-backed securities and asset-backed securities with an average maturity of 1-10 years.
|
The Fund 5
UNDERSTANDING YOUR FUND'S EXPENSES (Unaudited)
As a mutual fund investor, you pay ongoing expenses, such as management fees and other expenses. Using the information below, you can estimate how these expenses affect your investment and compare them with the expenses of other funds.You also may pay one-time transaction expenses, including sales charges (loads) and redemption fees, which are not shown in this section and would have resulted in higher total expenses. For more information, see your fund's prospectus or talk to your financial adviser.
Review your fund's expenses
|
The table below shows the expenses you would have paid on a $1,000 investment in Dreyfus A Bonds Plus, Inc. from April 1, 2004 to September 30, 2004. It also shows how much a $1,000 investment would be worth at the close of the period, assuming actual
returns and expenses.
Expenses and Value of a $1,000 Investment
assuming actual returns for the six months ended September 30, 2004
|
| Expenses paid per $1,000 † | | $ 4.70 |
| Ending value (after expenses) | | $994.90 |
COMPARING YOUR FUND'S EXPENSES WITH THOSE OF OTHER FUNDS (Unaudited)
Using the SEC's method to compare expenses
The Securities and Exchange Commission (SEC) has established guidelines to help investors assess fund expenses. Per these guidelines, the table below shows your fund's expenses based on a $1,000 investment, assuming a hypothetical 5% annualized return.You can use this information to compare the ongoing expenses (but not transaction expenses or total cost) of investing in the fund with those of other funds. All mutual fund shareholder reports will provide this information to help you make this comparison. Please note that you cannot use this information to estimate your actual ending account balance and expenses paid during the period.
Expenses and Value of a $1,000 Investment assuming a hypothetical 5% annualized return for the six months ended September 30, 2004
| Expenses paid per $1,000 † | | $ 4.76 |
| Ending value (after expenses) | | $1,020.36 |
† Expenses are equal to the fund's annualized expense ratio of .94%, multiplied by the average account value over the
period, multiplied by 183/365 (to reflect the one-half year period).
|
STATEMENT OF INVESTMENTS
September 30, 2004 (Unaudited)
|
| | | Principal | | | | |
| Bonds and Notes—106.1% | | Amount a | | Value ($) |
| |
| |
|
| Aerospace & Defense—.5% | | | | | | |
| General Dynamics, | | | | | | |
| Sr. Notes, 4.5%, 2010 | | 2,308,000 | | | | 2,360,604 |
| Airlines—.6% | | | | | | |
| American Airlines, | | | | | | |
| Pass-Through Ctfs.: | | | | | | |
| Ser. AMBC, 3.857%, 2010 | | 1,431,429 | | | | 1,412,645 |
| Ser. 1999-1, 7.024%, 2009 | | 948,000 | | | | 932,169 |
| Continental Airlines, | | | | | | |
| Pass-Through Ctfs., | | | | | | |
| Ser. 1998-1, Cl. A, 6.648%, 2017 | | 169,164 | | | | 158,450 |
| USAir, | | | | | | |
| Enhanced Equipment Notes, Ser. C, 8.93%, 2009 | | 904,468 | | b | | 90 |
| | | | | | | 2,503,354 |
| Asset-Backed Ctfs./Credit Cards—1.2% | | | | | | |
| MBNA Master Credit Card Note Trust, | | | | | | |
| Ser. 2002-C1, Cl. C1, 6.8%, 2014 | | 4,884,000 | | | | 5,422,603 |
| Asset-Backed Ctfs./Equipment—.3% | | | | | | |
| Pegasus Aviation Lease Securitization, | | | | | | |
| Ser. 2000-1, Cl. A1, 2.465%, 2015 | | 2,254,706 | | c,d | | 1,141,062 |
| Asset-Backed Ctfs./ Home Equity Loans—.8% | | | | | | |
| Equity One ABS, | | | | | | |
| Ser. 2004-3, Cl. AF3, 4.265%, 2034 | | 3,586,000 | | | | 3,613,080 |
| Auto Manufacturing—1.5% | | | | | | |
| General Motors, | | | | | | |
| Debs., 8.375%, 2033 | | 6,180,000 | | e | | 6,580,266 |
| Banking—3.2% | | | | | | |
| Bank of America, | | | | | | |
| Sr. Notes, 5.375%, 2014 | | 1,891,000 | | | | 1,967,474 |
| Danske Bank, | | | | | | |
| Bonds, 5.914%, 2049 | | 1,638,000 | | c | | 1,726,054 |
| HBOS Capital, | | | | | | |
| Notes, 6.071%, 2049 | | 5,410,000 | | c | | 5,730,304 |
| Rabobank Capital Funding II, | | | | | | |
| Bonds, 5.26%, 2049 | | 1,800,000 | | c | | 1,819,174 |
| Wells Fargo & Co., | | | | | | |
| Sub. Notes, 4.625%, 2014 | | 3,000,000 | | e | | 2,974,356 |
| | | | | | | 14,217,362 |
| Commercial Mortgage Pass-Through Ctfs.—1.4% | | | | | | |
| GMAC Commercial Mortgage Securities, | | | | | | |
| Ser. 2000-C2, Cl. A1, 7.273%, 2033 | | 829,843 | | | | 888,976 |
The Fund 7
STATEMENT OF INVESTMENTS (Unaudited) (continued)
| | | | | Principal | | | | |
| Bonds and Notes (continued) | | | | Amount a | | Value ($) |
| |
| |
| |
|
| Commercial Mortgage Pass-Through Ctfs. (continued) | | | | | | |
| Saxon Asset Securities Trust, | | | | | | | | |
| Ser. 2004-2, Cl. AF2, 4.15%, 2035 | | | | 5,183,000 | | | | 5,218,862 |
| | | | | | | | | 6,107,838 |
| Diversified Financial Services—3.8% | | | | | | | | |
| American Express, | | | | | | | | |
| Notes, 4.875%, 2013 | | | | 1,294,000 | | | | 1,314,286 |
| Citigroup, | | | | | | | | |
| Sub. Notes, 5% 2014 | | | | 3,000,000 | | c | | 3,009,567 |
| Ford Motor Credit: | | | | | | | | |
| Notes, 2.07%, 2007 | | | | 650,000 | | d | | 638,230 |
| Notes, 2.79%, 2007 | | | | 1,500,000 | | d | | 1,499,488 |
| General Electric Capital, | | | | | | | | |
| Notes, Ser. A, 5.875%, 2012 | | | | 2,288,000 | | | | 2,487,420 |
| Morgan Stanley, | | | | | | | | |
| Sub. Notes, 4.75%, 2014 | | | | 8,199,000 | | | | 7,952,194 |
| | | | | | | | | 16,901,185 |
| Electric Utilities—2.1% | | | | | | | | |
| CenterPoint Energy Houston Electric, | | | | | | | | |
| Notes, Ser. K2, 6.95%, 2033 | | | | 1,386,000 | | | | 1,590,478 |
| Jersey Central Power & Light, | | | | | | | | |
| First Mortgage, 5.625%, 2016 | | | | 1,638,000 | | c | | 1,716,196 |
| Pacific Gas & Electric, | | | | | | | | |
| First Mortgage, 4.8%, 2014 | | | | 1,721,000 | | | | 1,711,407 |
| Public Service Co. of Colorado, | | | | | | | | |
| First Mortgage, Ser. 12, 4.875%, 2013 | | | | 2,487,000 | | | | 2,535,171 |
| SCANA, | | | | | | | | |
| Sr. Notes, 2.161%, 2006 | | | | 1,636,000 | | d | | 1,640,043 |
| | | | | | | | | 9,193,295 |
| Food & Beverages—.2% | | | | | | | | |
| Pepsi Bottling, | | | | | | | | |
| Sr. Notes, Ser. B, 7%, 2029 | | | | 575,000 | | e | | 681,795 |
| Foreign/Governmental—9.9% | | | | | | | | |
| Byggingarsjodur Verkamanna: | | | | | | | | |
| Bonds, Ser. 1, 3.75%, 2024 | | ISK | | 60,945,434 | | | | 851,446 |
| Bonds, Ser. 3, 3.75%, 2044 | | ISK | | 43,000,000 | | | | 619,663 |
| Canadian Government, | | | | | | | | |
| Bonds, 4%, 2031 | | CAD | | 1,480,000 f | | 1,801,072 |
| | | | | Principal | | | | |
| Bonds and Notes (continued) | | | | Amount a | | Value ($) |
| |
| |
| |
|
| Foreign/Governmental (continued) | | | | | | | | |
| New Zealand Government, | | | | | | | | |
| Bonds, Ser. 413, 6.5%, 2013 | | NZD | | 12,685,000 | | | | 8,812,377 |
| Poland Government, | | | | | | | | |
| Bonds, Ser. 1013, 5%, 2013 | | PLZ | | 66,000,000 | | | | 16,597,642 |
| Republic of Philippines, | | | | | | | | |
| Bonds, 8.875%, 2015 | | | | 1,100,000 | | | | 1,101,375 |
| Ukraine Government, | | | | | | | | |
| Sr. Notes, 11%, 2007 | | | | 1,824,719 | | | | 1,993,505 |
| United Mexican States: | | | | | | | | |
| Bonds, 8.3%, 2031 | | | | 4,460,000 | | | | 5,084,401 |
| Notes, Ser. A, 6.75%, 2034 | | | | 610,000 | | | | 587,430 |
| Notes, Ser. A , 7.5%, 2033 | | | | 5,675,000 | | | | 5,978,613 |
| | | | | | | | | 43,427,524 |
| Health Care—.7% | | | | | | | | |
| Bristol-Myers Squibb, | | | | | | | | |
| Notes, 5.75%, 2011 | | | | 1,755,000 | | | | 1,884,725 |
| Manor Care, | | | | | | | | |
| Notes, 6.25%, 2013 | | | | 1,095,000 | | | | 1,181,118 |
| | | | | | | | | 3,065,843 |
| Manufacturing—.5% | | | | | | | | |
| Tyco International, | | | | | | | | |
| Notes, 5.8%, 2006 | | | | 2,002,000 | | | | 2,097,359 |
| Media—1.0% | | | | | | | | |
| Comcast Cable Communications: | | | | | | | | |
| Notes, 8.375%, 2013 | | | | 1,227,000 | | | | 1,488,221 |
| Sr. Notes, 6.5%, 2015 | | | | 2,667,000 | | | | 2,886,179 |
| | | | | | | | | 4,374,400 |
| Oil & Gas—.6% | | | | | | | | |
| Kerr-McGee, | | | | | | | | |
| Notes, 6.95%, 2024 | | | | 2,299,000 | | | | 2,456,709 |
| Property-Casualty Insurance—.5% | | | | | | | | |
| Aspen Insurance, | | | | | | | | |
| Sr. Notes, 6%, 2014 | | | | 2,120,000 | | c | | 2,138,298 |
| Real Estate Investment Trusts—.4% | | | | | | |
| EOP Operating, | | | | | | | | |
| Sr. Notes, 7%, 2011 | | | | 435,000 | | e | | 489,352 |
The Fund 9
| | STATEMENT OF INVESTMENTS (Unaudited) (continued)
|
| | | Principal | | | | |
| Bonds and Notes (continued) | | Amount a | | Value ($) |
| |
| |
|
| Real Estate Investment Trusts (continued) | | | | | | |
| iStar Financial, | | | | | | |
| Sr. Notes, Ser. B, 5.7%, 2014 | | 1,500,000 | | | | 1,510,763 |
| | | | | | | 2,000,115 |
| Residential Mortgage Pass-Through Ctfs.—2.1% | | | | | | |
| Argent Securities, | | | | | | |
| Ser. 2004-W5, Cl. AF4, 4.01%, 2034 | | 5,500,000 | | | | 5,353,700 |
| Bank of America Mortgage Securities III: | | | | | | |
| Ser. 2004-3, Cl. B1, 4.875%, 2019 | | 577,434 | | | | 572,166 |
| Ser. 2004-3, Cl. B2, 4.875%, 2019 | | 256,963 | | | | 252,410 |
| Countrywide Home Loans, | | | | | | |
| Ser. 2003-7, Cl. B3, 5.75%, 2033 | | 609,050 | | c | | 560,326 |
| Residential Asset Securitization Trust, | | | | | | |
| Ser. 2003-A8, Cl. B4, 4.75%, 2018 | | 388,705 | | c | | 341,089 |
| Residential Funding Mortgage Securities I, | | | | | | |
| Ser. 2004-S3, Cl. M1, 4.75%, 2019 | | 1,339,562 | | | | 1,325,597 |
| Wells Fargo Mortgage Backed Securities Trust: | | | | | | |
| Ser. 2002-17, Cl. B4, 5.75%, 2017 | | 365,895 | | c | | 369,897 |
| Ser. 2004-2, Cl. B4, 5%, 2019 | | 339,524 | | c | | 303,874 |
| Ser. 2004-3, Cl. B4, 4.75%, 2019 | | 244,393 | | c | | 215,456 |
| | | | | | | 9,294,515 |
| Retail—.7% | | | | | | |
| Yum Brands, | | | | | | |
| Sr. Notes, 8.875%, 2011 | | 2,595,000 | | | | 3,230,669 |
| Structured Index—4.7% | | | | | | |
| AB Svensk Exportkredit, | | | | | | |
| GSNE-ER Indexed Notes, 0%, 2007 | | 5,380,000 | | c,g | | 5,119,070 |
| HSBC Bank USA Trenched Investment-Grade | | | | | | |
| Enhanced Return Securities ("TIGERS"): | | | | | | |
| Medium Term Notes, Ser. 2003-2, 4.76%, 2008 | | 8,750,000 | | c,d,h | | 8,805,125 |
| Medium Term Notes, Ser. 2003-3, 4.76%, 2008 | | 6,481,000 | | c,d,h | | 6,496,840 |
| | | | | | | 20,421,035 |
| Technology—.6% | | | | | | |
| First Data, | | | | | | |
| Notes, 4.85%, 2014 | | 2,555,000 | | | | 2,571,904 |
| Telecommunications—1.1% | | | | | | |
| British Telecommunications, | | | | | | |
| Notes, 8.375%, 2010 | | 1,975,000 | | | | 2,384,528 |
| Sprint Capital, | | | | | | |
| Sr. Notes, 6%, 2007 | | 547,000 | | | | 579,317 |
10
| | | Principal | | | | |
| Bonds and Notes (continued) | | Amount a | | Value ($) |
| |
| |
|
| Telecommunications (continued) | | | | | | |
| Verizon Florida, | | | | | | |
| Debs., Ser. F, 6.125%, 2013 | | 1,622,000 | | | | 1,733,652 |
| | | | | | | 4,697,497 |
| U.S. Government—20.3% | | | | | | |
| U.S. Treasury Bonds, | | | | | | |
| 11.625% 11/15/2004 | | 7,061,000 | | | | 7,147,850 |
| U.S. Treasury Inflation Protected Securities: | | | | | | |
| 3.375%, 4/15/2032 | | 43,511,003 | | i | | 55,011,130 |
| Coupon Strips: | | | | | | |
| 0%, 10/15/2028 | | 750,000 | | i,j | | 836,146 |
| 0%, 4/15/2029 | | 750,000 | | i,j | | 822,935 |
| Principal Strips, | | | | | | |
| 0%, 4/15/2029 | | 10,000,000 | | i | | 6,699,023 |
| U.S. Treasury Notes: | | | | | | |
| 3.375%, 9/15/2009 | | 2,232,000 | | | | 2,233,134 |
| 4.25%, 8/15/2014 | | 7,456,000 | | | | 7,536,376 |
| 4.75%, 5/15/2014 | | 675,000 | | | | 708,751 |
| 7.5%, 2/15/2005 | | 7,910,000 | | | | 8,076,189 |
| | | | | | | 89,071,534 |
| U.S. Government Agencies/Mortgage-Backed—47.4% | | | | |
| Federal Home Loan Mortgage Corp.: | | | | | | |
| 5.5%, 7/1/2034—9/1/2034 | | 582,324 | | | | 597,395 |
| REMIC, Gtd. Multiclass Mortgage Participation Ctfs.: | | | | |
| Ser. 51, Cl. E, 10%, 7/15/2020 | | 665,927 | | | | 666,646 |
| Ser. 2586, Cl. WE, 4%, 12/15/2032 | | 6,027,627 | | | | 6,022,227 |
| Ser. 2693, Cl. MH, 4%, 9/15/2027 | | 7,000,000 | | | | 6,764,262 |
| (Interest Only Obligation): | | | | | | |
| Ser. 1995, Cl. PY, 7%, 10/15/2027 | | 1,597,344 | | j | | 215,768 |
| Ser. 2750, Cl. IK, 5%, 5/15/2026 | | 4,617,400 | | j | | 948,537 |
| Federal National Mortgage Association: | | | | | | |
| 5.5%, 8/1/2034—9/1/2034 | | 17,042,709 | | | | 17,305,055 |
| 6%, 1/1/2019—9/1/2034 | | 5,372,717 | | | | 5,707,281 |
| 8%, 12/1/2025 | | 85,892 | | | | 94,025 |
| REMIC Trust, Gtd. Pass-Through Ctfs.: | | | | | | |
| Ser. 1988-16, Cl. B, 9.5%, 6/25/2018 | | 371,141 | | | | 406,062 |
| Ser. 2004-58, Cl. LJ, 5%, 7/25/2034 | | 2,825,996 | | | | 2,915,892 |
| (Interest Only Obligation) | | | | | | |
| Ser. 1996-64, Cl. PM, 7%, 1/18/2012 | | 893,591 | | j | | 101,789 |
| Government National Mortgage Association I: | | | | | | |
| 5.5% | | 9,815,197 | | k | | 9,983,822 |
| 5.5%, 4/15/2033—9/15/2034 | | 40,765,722 | | | | 41,561,736 |
The Fund 11
STATEMENT OF INVESTMENTS (Unaudited) (continued)
| | | Principal | | |
| Bonds and Notes (continued) | | Amount a | | Value ($) |
| |
| |
|
| U.S. Government Agencies/ | | | | |
| Mortgage-Backed (continued) | | | | |
| Government National Mortgage | | | | |
| Association I (continued): | | | | |
| 6% | | 31,986,000 k | | 33,155,408 |
| 6%, 3/15/2029—1/15/2034 | | 50,088,290 | | 52,028,615 |
| 7%, 6/15/2008 | | 11,086 | | 11,572 |
| 9.5%, 11/15/2017 | | 849,233 | | 953,265 |
| Project Loans: | | | | |
| 6.55%, 6/15/2033 | | 1,753,538 | | 1,826,501 |
| 6.625%, 1/15/2022—8/15/2033 | | 5,714,743 | | 5,964,734 |
| 6.75%, 10/15/2033 | | 2,123,989 | | 2,270,341 |
| 6.86%, 10/15/2004 | | 12,672,165 | | 13,695,838 |
| Government National Mortgage Association II, | | | | |
| (Interest Only Obligation) | | | | |
| Ser. 2003-40, Cl. IE, 5%, 3/20/2028 | | 7,528,287 j | | 869,118 |
| U.S. Government Gtd. Development Participation Ctfs., | | |
| (Gtd. By U.S. Small Business Administration): | | | | |
| Ser. 1994-20K, Cl. 1, 8.65%, 11/1/2014 | | 931,425 | | 1,020,388 |
| Ser. 1994-20L, Cl. 1, 8.4%, 12/1/2014 | | 1,684,737 | | 1,843,525 |
| Ser. 1997-20J, Cl. 1, 6.55%, 10/1/2017 | | 887,410 | | 955,910 |
| | | | | 207,885,712 |
| Total Bonds And Notes | | | | |
| (cost $463,647,877) | | | | 465,455,558 |
| |
| |
|
| | | | | Face Amount | | |
| | | | | Covered by | | |
| Options—.2% | | | | Contracts ($) | | Value ($) |
| |
| |
| |
|
| Call Options; | | | | | | |
| U.K. 10 Year Interest Rate Swaption, | | | | |
| September 2005 @ 5.25% | | | | |
| (cost $520,921) | | GBP | | 16,405,000 | | 622,392 |
| |
| |
| |
|
| Other Investments—0% | | Shares | | Value ($) |
| |
| |
|
| Registered Investment Company; | | | | |
| Dreyfus Institutional Preferred Plus Money Market Fund | | |
| (cost $76,000) | | 76,000 l | | 76,000 |
12
| Investment of Cash Collateral | | | | |
| for Securities Loaned—1.9% | | Shares | | Value ($) |
| |
| |
|
| Registered Investment Company; | | | | |
| Dreyfus Institutional Cash Advantage Fund | | | | |
| (cost $8,373,160) | | 8,373,160 l | | 8,373,160 |
| |
| |
|
| Total Investments (cost $472,617,958) | | 108.2% | | 474,527,110 |
| Liabilities, Less Cash and Receivables | | (8.2%) | | (35,771,678) |
| Net Assets | | 100.0% | | 438,755,432 |
| a Principal amount stated in U.S Dollars unless otherwise noted. |
| CAD—Canadian Dollar |
| GBP—British Pound |
| ISK—Icelandic Krona |
| NZD—New Zealand Dollar |
| PLZ—Polish Zlotty |
| b Non-income producing—security in default. |
| c Securities exempt from registration under Rule 144A of the Securities Act of 1933.These securities may be resold in |
| transactions exempt from registration, normally to qualified institutional buyers.These securities have been determined |
| to be liquid by the Board of Directors.At September 30, 2004, these securities amounted to $39,492,332 or 9.0% |
| of net assets. |
| d Variable rate security—interest rate subject to periodic change. |
| e All or a portion of these securities are on loan.At September 30, 2004, the total market value of the fund's securities |
| on loan is $8,027,648 and the total market value of the collateral held by the fund is $8,373,160. |
| f Principal amount for accrual purposes is periodically adjusted based on changes in the Canadian Consumer Price |
| Index. |
| g Security linked to Goldman Sachs Non-Energy—Excess Return Index. |
| h Security linked to a portfolio of debt securities. |
| i Principal amount for accrual purposes is periodically adjusted based on changes in the Consumer Price Index. |
| j Notional face amount shown. |
| k Purchased on a forward commitment basis. |
| l Investments in affiliated money market mutual funds. |
| Portfolio Summary (Unaudited) † | | | | |
| |
| | | Value (%) | | Value (%) |
| |
| |
|
| U.S. Government & Agencies | | 67.7 | | Short Term/Money Market Investments | | 1.9 |
| Corporate Bonds | | 18.0 | | Options/Forward Currency | | |
| Foreign/Governmental | | 9.9 | | Exchange Contracts/Swaps | | .2 |
| Asset/Mortgage Backed | | 5.8 | | | | |
| Structured Index | | 4.7 | | | | 108.2 |
† Based on net assets
See notes to financial statements.
|
The Fund 13
STATEMENT OF OPTIONS WRITTEN
September 30, 2004 (Unaudited)
| | | Face Amount | | |
| | | Covered by | | |
| | | Contracts ($) | | Value ($) |
| |
| |
|
| Call Options: | | | | |
| British Pound, | | | | |
| September 2005 @ 1.8 GBP | | 16,405,000 | | 437,769 |
| Republic of Philippines, | | | | |
| 8.875%, 3/17/2015, October 2004 @ $100.5 | | 1,100,000 | | 3,850 |
| U.K. 10 Year Interest Rate Swaption, | | | | |
| September 2005 @ 4.60% | | 16,405,000 | | 143,589 |
| United Mexican States, | | | | |
| 7.5%, 4/8/2033, October 2004 @ $106.4 | | 4,460,000 | | 22,746 |
| 8.3%, 8/15/2031, October 2004 @ $115.13 | | 4,460,000 | | 26,314 |
| Put Options; | | | | |
| U.K. 10 Year Interest Rate Swaption, | | | | |
| September 2005 @ 5.85% | | 16,405,000 | | 132,441 |
| (Premiums received $710,996) | | | | 766,709 |
See notes to financial statements.
14
STATEMENT OF ASSETS AND LIABILITIES
September 30, 2004 (Unaudited)
|
| | | Cost | | Value |
| |
| |
|
| Assets ($): | | | | |
| Investments in securities— | | | | |
| See Statement of Investments (including securities | | |
| on loan, valued at $8,027,648)—Note 1(c): | | |
| Unaffiliated issuers | | 464,168,798 | | 466,077,950 |
| Affiliated issuers | | 8,449,160 | | 8,449,160 |
| Cash | | | | 4,864,634 |
| Cash denominated in foreign currencies | | 103,072 | | 113,138 |
| Receivable for investment securities sold | | | | 55,575,362 |
| Dividends and interest receivable | | | | 4,860,483 |
| Receivable for futures variation margin—Note 4 | | 181,562 |
| Paydowns receivable | | | | 7,472 |
| Receivable for shares of Common Stock subscribed | | 3,495 |
| Prepaid expenses | | | | 6,928 |
| | | | | 540,140,184 |
| |
| |
|
| Liabilities ($): | | | | |
| Due to The Dreyfus Corporation and affiliates—Note 3(b) | | 298,150 |
| Payable for investment securities purchased | | 85,495,029 |
| Liability for securities on loan—Note 1(c) | | | | 8,373,160 |
| Bank loan payable—Note 2 | | | | 5,000,000 |
| Payable for shares of Common Stock redeemed | | 788,178 |
| Outstanding options written, at value (premiums | | |
| received $710,996)—See Statement of Options Written | | 766,709 |
| Unrealized depreciation on forward currency exchange contracts—Note 4 | | 448,995 |
| Interest payable—Note 2 | | | | 9,912 |
| Unrealized depreciation on swaps—Note 4 | | | | 6,070 |
| Accrued expenses | | | | 198,549 |
| | | | | 101,384,752 |
| |
| |
|
| Net Assets ($) | | | | 438,755,432 |
| |
| |
|
| Composition of Net Assets ($): | | | | |
| Paid-in capital | | | | 471,092,316 |
| Accumulated undistributed investment income—net | | 2,605,576 |
| Accumulated net realized gain (loss) on investments | | (36,376,379) |
| Accumulated net unrealized appreciation (depreciation) | | |
| on investments and foreign currency transactions | | 1,433,919 |
| |
|
| Net Assets ($) | | | | 438,755,432 |
| |
| |
|
| Shares Outstanding | | | | |
| (100 million shares of $.001 par value Common Stock authorized) | | 31,844,419 |
| Net Asset Value, offering and redemption price per share ($) | | 13.78 |
See notes to financial statements.
The Fund 15
STATEMENT OF OPERATIONS
Six Months Ended September 30, 2004 (Unaudited)
|
| Investment Income ($): | | |
| Interest | | 9,826,359 |
| Cash dividends; | | |
| Affiliated issuers | | 165,983 |
| Income from securities lending | | 47,595 |
| Total Income | | 10,039,937 |
| Expenses: | | |
| Management fee—Note 3(a) | | 1,476,382 |
| Shareholder servicing costs—Note 3(b) | | 505,413 |
| Custodian fees—Note 3(b) | | 46,489 |
| Professional fees | | 30,783 |
| Prospectus and shareholders' reports | | 22,514 |
| Directors' fees and expenses—Note 3(c) | | 21,788 |
| Registration fees | | 15,424 |
| Interest expense—Note 2 | | 11,712 |
| Miscellaneous | | 3,800 |
| Total Expenses | | 2,134,305 |
| Investment Income—Net | | 7,905,632 |
| |
|
| Realized and Unrealized Gain (Loss) on Investments—Note 4 ($): |
| Net realized gain (loss) on investments and foreign currency transactions | | (5,849,050) |
| Net realized gain (loss) on financial futures | | 494,248 |
| Net realized gain (loss) on forward currency exchange contracts | | (727,987) |
| Net realized gain (loss) on options transactions | | (5,763) |
| Net realized gain (loss) on swap transactions | | (351,054) |
| Net Realized Gain (Loss) | | (6,439,606) |
| Net unrealized appreciation (depreciation) on investments, | | |
| foreign currency transactions, options transactions and | | |
| swap transactions [including ($15,887) unrealized | | |
| (depreciation) on financial futures] | | (5,954,712) |
| Net Realized and Unrealized Gain (Loss) on Investments | | (12,394,318) |
| Net (Decrease) in Net Assets Resulting from Operations | | (4,488,686) |
See notes to financial statements.
STATEMENT OF CHANGES IN NET ASSETS
| | | Six Months Ended | | |
| | | September 30, 2004 | | Year Ended |
| | | (Unaudited) | | March 31, 2004 |
| |
| |
|
| Operations ($): | | | | |
| Investment income—net | | 7,905,632 | | 17,502,008 |
| Net realized gain (loss) on investments | | (6,439,606) | | 10,380,140 |
| Net unrealized appreciation | | | | |
| (depreciation) on investments | | (5,954,712) | | (5,183,119) |
| Net Increase (Decrease) in Net Assets | | | | |
| Resulting from Operations | | (4,488,686) | | 22,699,029 |
| |
| |
|
| Dividends to Shareholders from ($): | | | | |
| Investment income—net | | (9,486,747) | | (21,648,632) |
| |
| |
|
| Capital Stock Transactions ($): | | | | |
| Net proceeds from shares sold | | 11,871,153 | | 55,047,715 |
| Dividends reinvested | | 8,387,752 | | 19,164,950 |
| Cost of shares redeemed | | (76,881,604) | | (172,869,858) |
| Increase (Decrease) in Net Assets | | | | |
| from Capital Stock Transactions | | (56,622,699) | | (98,657,193) |
| Total Increase (Decrease) in Net Assets | | (70,598,132) | | (97,606,796) |
| |
| |
|
| Net Assets ($): | | | | |
| Beginning of Period | | 509,353,564 | | 606,960,360 |
| End of Period | | 438,755,432 | | 509,353,564 |
| Undistributed investment income—net | | 2,605,576 | | 4,186,691 |
| |
| |
|
| Capital Share Transactions (Shares): | | | | |
| Shares sold | | 870,971 | | 3,895,819 |
| Shares issued for dividends reinvested | | 615,005 | | 1,362,364 |
| Shares redeemed | | (5,666,391) | | (12,226,347) |
| Net Increase (Decrease) in Shares Outstanding | | (4,180,415) | | (6,968,164) |
See notes to financial statements.
The Fund 17
FINANCIAL HIGHLIGHTS
The following table describes the performance for the fiscal periods indicated.Total return shows how much your investment in the fund would have increased (or decreased) during each period, assuming you had reinvested all dividends and dis-tributions.These figures have been derived from the fund's financial statements.
| Six Months Ended | | | | | | | | | | |
| September 30, 2004 | | | | Year Ended March 31, | | |
| |
| |
| |
|
| | | (Unaudited) | | 2004 | | 2003 | | 2002 a | | 2001 | | 2000 |
| |
| |
| |
| |
| |
| |
|
| Per Share Data ($): | | | | | | | | | | | | |
| Net asset value, | | | | | | | | | | | | |
| beginning of period | | 14.14 | | 14.12 | | 13.47 | | 14.10 | | 13.65 | | 13.99 |
| Investment Operations: | | | | | | | | | | | | |
| Investment income—net | | .24b | | .44b | | .63b | | .81b | | .84 | | .85 |
| Net realized and unrealized | | | | | | | | | | | | |
| gain (loss) on investments | | (.32) | | .11 | | .71 | | (.56) | | .47 | | (.34) |
| Total from Investment Operations (.08) | | .55 | | 1.34 | | .25 | | 1.31 | | .51 |
| Distributions: | | | | | | | | | | | | |
| Dividends from | | | | | | | | | | | | |
| investment income—net | | (.28) | | (.53) | | (.69) | | (.88) | | (.86) | | (.85) |
| Net asset value, end of period | | 13.78 | | 14.14 | | 14.12 | | 13.47 | | 14.10 | | 13.65 |
| |
| |
| |
| |
| |
| |
|
| Total Return (%) | | (.51)c | | 4.01 | | 10.30 | | 1.68 | | 9.94 | | 3.85 |
| |
| |
| |
| |
| |
| |
|
| Ratios/Supplemental Data (%): | | | | | | | | | | |
| Ratio of total expenses | | | | | | | | | | | | |
| to average net assets | | .94d | | .93 | | .93 | | .93 | | .91 | | 1.00 |
| Ratio of net investment income | | | | | | | | | | |
| to average net assets | | 3.48d | | 3.09 | | 4.56 | | 5.87 | | 6.29 | | 6.20 |
| Portfolio Turnover Rate | | 387.24c,e 803.93e | | 636.05 | | 533.95 | | 718.67 | | 557.83 |
| |
| |
| |
| |
| |
|
| Net Assets, end of period | | | | | | | | | | | | |
| ($ x 1,000) | | 438,755 | | 509,354 | | 606,960 | | 573,241 | | 578,293 | | 453,295 |
a As required, effective April 1, 2001, the fund has adopted the provisions of the AICPA Audit and Accounting Guide
for Investment Companies and began amortizing discount or premium on fixed income securities on a scientific basis
and including paydown gains and losses in interest income.The effect of these changes for the period ended March 31,
2002 was to decrease net investment income per share by $.04, increase net realized and unrealized gain (loss) on
investments per share by $.04 and decrease the ratio of net investment income to average net assets from 6.15% to
5.87%. Per share data and ratios/supplemental data for periods prior to April 1, 2001 have not been restated to
reflect these changes in presentation.
b Based on average shares outstanding at each month end.
c Not annualized.
d Annualized.
e The portfolio turnover rates excluding mortgage dollar roll transactions for the six month period ended September 30,
2004 and the year ended March 31, 2004 were 361.05% and 655.66%, respectively.
See notes to financial statements.
|
18
NOTES TO FINANCIAL STATEMENTS (Unaudited)
NOTE 1—Significant Accounting Policies:
Dreyfus A Bonds Plus, Inc. (the "fund") is registered under the Investment Company Act of 1940, as amended (the "Act"), as a diversified open-end management investment company.The fund's investment objective is to maximize total return, consisting of capital appreciation and current income.The Dreyfus Corporation (the "Manager" or "Dreyfus") serves as the fund's investment adviser.The Manager is a wholly-owned subsidiary of Mellon Financial Corporation ("Mellon Financial"). Dreyfus Service Corporation (the "Distributor"), a wholly-owned subsidiary of the Manager, is the distributor of the fund's shares, which are sold to the public without a sales charge.
The fund's financial statements are prepared in accordance with U.S. generally accepted accounting principles, which may require the use of management estimates and assumptions. Actual results could differ from those estimates.
The fund enters into contracts that contain a variety of indemnifications. The fund's maximum exposure under these arrangements is unknown.The fund does not anticipate recognizing any loss related to these arrangements.
(a) Portfolio valuation: Investments in securities (excluding short-term investments (other than U.S. Treasury Bills), financial futures, options, swaps and forward currency exchange contracts) are valued each business day by an independent pricing service (the "Service") approved by the Board of Directors. Investments for which quoted bid prices are readily available and are representative of the bid side of the market in the judgment of the Service are valued at the mean between the quoted bid prices (as obtained by the Service from dealers in such securities) and asked prices (as calculated by the Service based upon its evaluation of the market for such securities). Other investments (which constitute a majority of the portfolio securities) are valued as determined by the Service, based on methods which include consideration of: yields or prices of securities of comparable quality, coupon, maturity and type; indications as to values from dealers; and general
The Fund 19
NOTES TO FINANCIAL STATEMENTS (Unaudited) (continued)
market conditions. Securities for which there are no such valuations are valued at fair value as determined in good faith under the direction of the Board of Directors. Restricted securities, as well as securities or other assets for which recent market quotations are not readily available, that are not valued by a pricing service approved by the Board of Directors, or are determined by the fund not to reflect accurately fair value (such as when an event occurs after the close of the exchange on which the security is principally traded and that is determined by the fund to have changed the value of the security), are valued at fair value as determined in good faith under the direction of the Board of Directors.The factors that may be considered when fair valuing a security include fundamental analytical data, the nature and duration of restrictions on disposition, an evaluation of the forces that influence the market in which the securities are purchased and sold and public trading in similar securities of the issuer or comparable issuers. Short-term investments, excluding U.S.Treasury Bills, are carried at amortized cost, which approximates value. Financial futures and options, which are traded on an exchange, are valued at the last sales price on the securities exchange on which such securities are primarily traded or at the last sales price on the national securities market on each business day. Options traded over-the-counter are priced at the mean between the bid prices and asked prices. Swap transactions are valued daily based upon future cash flows and other factors, such as interest rates and underlying securities. Investments denominated in foreign currencies are translated to U.S. dollars at the prevailing rates of exchange. Forward currency exchange contracts are valued at the forward rate.
(b) Foreign currency transactions: The fund does not isolate that portion of the results of operations resulting from changes in foreign exchange rates on investments from the fluctuations arising from changes in market prices of securities held. Such fluctuations are included with the net realized and unrealized gain or loss from investments.
Net realized foreign exchange gains or losses arise from sales and maturities of short-term securities, sales of foreign currencies, currency gains or losses realized on securities transactions and the differ-
20
ence between the amounts of dividends, interest and foreign withholding taxes recorded on the fund's books and the U.S. dollar equivalent of the amounts actually received or paid. Net unrealized foreign exchange gains and losses arise from changes in the value of assets and liabilities other than investments in securities, resulting from changes in exchange rates. Such gains and losses are included with net realized and unrealized gain or loss on investments.
(c) Securities transactions and investment income: Securities transactions are recorded on a trade date basis. Realized gain and loss from securities transactions are recorded on the identified cost basis. Dividend income is recognized on the ex-dividend date and interest income, including, where applicable, amortization of discount and premium on investments, is recognized on the accrual basis.
The fund has an arrangement with the custodian bank whereby the fund receives earnings credits from the custodian when positive cash balances are maintained, which are used to offset custody fees. For financial reporting purposes, the fund includes net earnings credits, if any, as an expense offset in the Statement of Operations.
Pursuant to a securities lending agreement with Mellon Global Securities Lending, an affiliate of the Manager, the fund may lend securities to qualified institutions. At origination, all loans are secured by collateral of at least 102% of the value of U.S. securities loaned and 105% of the value of foreign securities loaned. Collateral equivalent to at least 100% of the market value of securities on loan will be maintained at all times. Cash collateral is invested in certain money market mutual funds managed by the Manager. The fund will be entitled to receive all income on securities loaned, in addition to income earned as a result of the lending transaction.Although each security loaned is fully collateralized, the fund would bear the risk of delay in recovery of, or loss of rights in, the securities loaned should a borrower fail to return the securities in a timely manner.
(d) Affiliated issuers: Investments in other investment companies advised by the Manager are defined as "affiliated" in the Act.
The Fund 21
NOTES TO FINANCIAL STATEMENTS (Unaudited) (continued)
(e) Dividends to shareholders: Dividends are recorded on the ex-dividend date. Dividends from investment income-net are declared and paid monthly. Dividends from net realized capital gain, if any, are normally declared and paid annually, but the fund may make distributions on a more frequent basis to comply with the distribution requirements of the Internal Revenue Code of 1986, as amended (the "Code").To the extent that net realized capital gain, can be offset by capital loss carryovers, it is the policy of the fund not to distribute such gain. Income and capital gain distributions are determined in accordance with income tax regulations, which may differ from U.S. generally accepted accounting principles.
On September 30, 2004, the Board of Directors declared a cash dividend of $.060 per share from undistributed investment income-net, payable on October 1, 2004 (ex-dividend date), to shareholders of record as of the close of business on September 30, 2004.
(f) Federal income taxes: It is the policy of the fund to continue to qualify as a regulated investment company, if such qualification is in the best interests of its shareholders, by complying with the applicable provisions of the Code and to make distributions of taxable income sufficient to relieve it from substantially all federal income and excise taxes.
The fund has an unused capital loss carryover of $26,146,431 available for federal income tax purposes to be applied against future net securities profits, if any, realized subsequent to March 31, 2004.The amount of this loss which can be utilized in subsequent years is subject to an annual limitation due to the fund's merger with Dreyfus Strategic Governments Income, Inc. If not applied, $13,098,116 of the carryover expires in fiscal 2008, $10,726,778 expires in fiscal 2010 and $2,321,537 expires in fiscal 2011.
The tax character of distributions paid to shareholders during the fiscal year ended March 31, 2004 was as follows: ordinary income $21,648,632. The tax character of current year distributions will be determined at the end of the current fiscal year.
22
NOTE 2—Bank Lines of Credit:
The fund may borrow up to $20 million for leveraging purposes under a short-term unsecured line of credit and participates with other Dreyfus-managed funds in a $100 million unsecured line of credit primarily to be utilized for temporary or emergency purposes, including the financing of redemptions. Interest is charged to the fund based on prevailing market rates in effect at the time of borrowings.
The average daily amount of borrowings outstanding under the leveraging arrangement during the period ended September 30, 2004, was approximately $1,131,100, with a related weighted average annualized interest rate of 2.07% .
NOTE 3—Management Fee and Other Transactions With Affiliates:
(a) Pursuant to a management agreement ("Agreement") with the Manager, the management fee is computed at the annual rate of .65 of 1% of the value of the fund's average daily net assets and is payable monthly. The Agreement provides that if in any full fiscal year the aggregate expenses of the fund, exclusive of taxes, interest on borrowings, brokerage commissions and extraordinary expenses, exceed 1 1 / 2% of the value of the fund's average daily net assets, the fund may deduct from the payments to be made to the Manager, or the Manager will bear, the amount of such excess expense. During the period ended September 30, 2004, there was no expense reimbursement pursuant to the Agreement.
(b) Under the Shareholder Services Plan, the fund reimburses the Distributor an amount not to exceed an annual rate of .25 of 1% of the value of the fund's average daily net assets for certain allocated expenses of providing personal services and/or maintaining shareholder accounts.The services provided may include personal services relating to shareholder accounts, such as answering shareholder inquiries regarding the fund and providing reports and other information, and services related to the maintenance of shareholder accounts.
The Fund 23
NOTES TO FINANCIAL STATEMENTS (Unaudited) (continued)
During the period ended September 30, 2004, the fund was charged $135,618 pursuant to the Shareholder Services Plan.
The fund compensates Dreyfus Transfer, Inc., a wholly-owned subsidiary of the Manager, under a transfer agency agreement for providing personnel and facilities to perform transfer agency services for the fund. During the period ended September 30, 2004, the fund was charged $100,033 pursuant to the transfer agency agreement.
The fund compensates Mellon Bank, N.A., an affiliate of the Manager, under a custody agreement for providing custodial services for the fund. During the period ended September 30, 2004, the fund was charged $46,489 pursuant to the custody agreement.
The components of Due to The Dreyfus Corporation and affiliates in the Statement of Assets and Liabilities consist of: management fees $235,328, custodian fees $22,822 and transfer agency per account fees $40,000.
(c) Each Board member also serves as a Board member of other funds within the Dreyfus complex. Annual retainer fees and attendance fees are allocated to each fund based on net assets.
(d) Pursuant to an exemptive order from the Securities and Exchange Commission, the fund may invest its available cash balances in affiliated money market mutual funds. Management fees of the underlying money market mutual funds have been waived by the Manager.
NOTE 4—Securities Transactions:
The aggregate amount of purchases and sales (including paydowns) of investment securities, excluding short-term securities, financial futures, forward currency exchange contracts, options transactions and swap transactions during the period ended September 30, 2004, amounted to $1,823,207,680 and $1,886,424,306, of which $122,019,712 in purchases and $122,085,625 in sales were from dollar roll transactions.
24
The fund may enter into dollar roll transactions with respect to mortgage-backed securities. In a dollar roll transaction, the fund sells mortgage-backed securities to a financial institution and simultaneously agrees to accept substantially similar (same type, coupon and maturity) securities at a later date, at an agreed upon price.
The following summarizes the fund's call/put options written for the period ended September 30, 2004:
| | | Face Amount | | | | Options Terminated |
| | | | | |
|
| | | Covered by | | Premiums | | Net Realized |
| Options Written: | | Contracts ($) | | Received ($) | | Cost ($) Gain (Loss) ($) |
| |
| |
| |
|
| Contracts outstanding | | | | | | |
| March 31, 2004 | | — | | — | | |
| Contracts written | | 59,235,000 | | 710,996 | | |
| Contracts outstanding | | | | | | |
| September 30, 2004 | | 59,235,000 | | 710,996 | | |
The fund may purchase and write (sell) put and call options in order to gain exposure to or to protect against changes in the market.
As a writer of call options, the fund receives a premium at the outset and then bears the market risk of unfavorable changes in the price of the financial instrument underlying the option. Generally, the fund would incur a gain, to the extent of the premium, if the price of the underlying financial instrument decreases between the date the option is written and the date on which the option is terminated. Generally, the fund would realize a loss, if the price of the financial instrument increases between those dates.
As a writer of put options, the fund receives a premium at the outset and then bears the market risk of unfavorable changes in the price of the financial instrument underlying the option. Generally, the fund would incur a gain, to the extent of the premium, if the price of the underlying financial instrument increases between the date the option is written and the date on which the option is terminated. Generally,
The Fund 25
NOTES TO FINANCIAL STATEMENTS (Unaudited) (continued)
the fund would realize a loss, if the price of the financial instrument decreases between those dates.
The fund may invest in financial futures contracts in order to gain exposure to or protect against changes in the market. The fund is exposed to market risk as a result of changes in the value of the underlying financial instruments. Investments in financial futures require the fund to "mark to market" on a daily basis, which reflects the change in the market value of the contracts at the close of each day's trading. Typically, variation margin payments are received or made to reflect daily unrealized gains or losses.When the contracts are closed, the fund recognizes a realized gain or loss.These investments require initial margin deposits with a broker, which consist of cash or cash equivalents. The amount of these deposits is determined by the exchange or Board of Trade on which the contract is traded and is subject to change. At September 30, 2004, there were no financial futures contracts outstanding.
The fund enters into forward currency exchange contracts in order to hedge its exposure to changes in foreign currency exchange rates on its foreign portfolio holdings and to settle foreign currency transac-tions.When executing forward currency exchange contracts, the fund is obligated to buy or sell a foreign currency at a specified rate on a certain date in the future. With respect to sales of forward currency exchange contracts, the fund would incur a loss if the value of the contract increases between the date the forward contract is opened and the date the forward contract is closed.The fund realizes a gain if the value of the contract decreases between those dates. With respect to purchases of forward currency exchange contracts, the fund would incur a loss if the value of the contract decreases between the date the for-
26
ward contract is opened and the date the forward contract is closed. The fund realizes a gain if the value of the contract increases between those dates. The fund is also exposed to credit risk associated with counterparty nonperformance on these forward currency exchange contracts which is typically limited to the unrealized gain on each open contract. The following summarizes open forward currency exchange contracts at September 30, 2004:
| | | Foreign | | | | | | |
| Forward Currency | | Currency | | | | | | Unrealized |
| Exchange Contracts | | Amounts | | Proceeds ($) | | Value ($) | | (Depreciation) ($) |
| |
| |
| |
| |
|
| Sales: | | | | | | | | |
| Canadian Dollar, | | | | | | | | |
| expiring 12/31/2004 | | 1,480,000 | | 1,164,140 | | 1,171,535 | | (7,395) |
| Euro, | | | | | | | | |
| expiring 1/3/2005 | | 580,000 | | 717,048 | | 720,882 | | (3,834) |
| New Zealand Dollar, | | | | | | | | |
| expiring 1/5/2005 | | 12,690,000 | | 8,420,767 | | 8,498,493 | | (77,726) |
| Poland Zloty, | | | | | | | | |
| expiring 12/20/2004 | | 62,861,073 | | 17,356,787 | | 17,716,827 | | (360,040) |
| Total | | | | | | | | (448,995) |
The fund may enter into swap agreements to exchange the interest rate on, or return generated by, one nominal instrument for the return generated by another nominal instrument.
Credit default swaps involve commitments to pay a fixed interest rate in exchange for payment if a credit event affecting a third party (the referenced company) occurs. Credit events may include a failure to pay interest or principal, bankruptcy, or restructuring. Net periodic interest payments to be received or paid are accrued daily and are recorded in net realized gain (loss) on swap transactions in the Statement of Operations. Credit default swaps are marked-to-market daily and the change, if any, is recorded as unrealized appreciation or depreciation in
The Fund 27
NOTES TO FINANCIAL STATEMENTS (Unaudited) (continued)
the Statement of Operations.The following summarizes credit default swaps entered into by the fund at September 30, 2004:
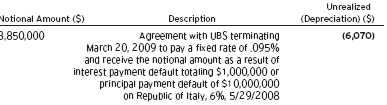
Realized gains and losses on maturity or termination of swaps are presented in the Statement of Operations. Risks may arise upon entering into these agreements from the potential inability of the counterpar-ties to meet the terms of the agreement and are generally limited to the amount of net payments to be received, if any, at the date of default.
At September 30, 2004, accumulated net unrealized appreciation on investments was $1,909,152, consisting of $7,683,538 gross unrealized appreciation and $5,774,386 gross unrealized depreciation.
At September 30, 2004, the cost of investments for federal income tax purposes was substantially the same as the cost for financial reporting purposes (see the Statement of Investments).
NOTE 5—Legal Matters:
Two class actions have been filed against Mellon Financial, Mellon Bank, N.A., Dreyfus, Founders Asset Management and the directors of all or substantially all of the Dreyfus funds, on behalf of a purported class and derivatively on behalf of said funds, alleging violations of the Investment Company Act of 1940, the Investment Advisers Act of 1940, and the common law. The complaints alleged, among other things, (i) that 12b-1 fees and directed brokerage were improperly used
28
to pay brokers to recommend Dreyfus funds over other funds, (ii) that such payments were not disclosed to investors, (iii) that economies of scale and soft-dollar benefits were not passed on to investors, and (iv) that 12b-1 fees charged to certain funds that were closed to new investors were also improper. The complaints sought compensatory and punitive damages, rescission of the advisory contracts and an accounting and restitution of any unlawful fees, as well as an award of attorneys' fees and litigation expenses. On April 22, 2004, the actions were consolidated under the caption In re Dreyfus Mutual Funds Fee Litigation, and a consolidated amended complaint was filed on September 13, 2004.While adding new parties and claims under state and federal law, the allegations in the consolidated amended complaint essentially track the allegations in the prior complaints pertaining to 12b-1 fees, directed brokerage, soft dollars and revenue sharing. Dreyfus and the funds believe the allegations to be totally without merit and intend to defend the action vigorously.
Additional lawsuits arising out of these circumstances and presenting similar allegations and requests for relief may be filed against the defendants in the future. Neither Dreyfus nor the Dreyfus funds believe that any of the pending actions will have a material adverse effect on the Dreyfus funds or Dreyfus' ability to perform its contracts with the Dreyfus funds.
The Fund 29
| For More | | Information |
| |
|
| |
| Dreyfus | | Transfer Agent & |
| A Bonds Plus, Inc. | | Dividend Disbursing Agent |
| 200 Park Avenue | | Dreyfus Transfer, Inc. |
| New York, NY 10166 | | 200 Park Avenue |
| Manager | | New York, NY 10166 |
| The Dreyfus Corporation | | Distributor |
| 200 Park Avenue | | Dreyfus Service Corporation |
| New York, NY 10166 | | 200 Park Avenue |
| Custodian | | New York, NY 10166 |
| Mellon Bank, N.A. | | |
| One Mellon Bank Center | | |
| Pittsburgh, PA 15258 | | |
Telephone 1-800-645-6561
Mail The Dreyfus Family of Funds, 144 Glenn Curtiss Boulevard, Uniondale, NY 11556-0144
E-mail Send your request to info@dreyfus.com
Internet Information can be viewed online or downloaded at: http://www.dreyfus.com
A description of the policies and procedures that the fund uses to determine how to vote
proxies relating to portfolio securities, and information regarding how the fund voted these
proxies for the 12-month period ended June 30, 2004, is available through the fund's
website at http://www.dreyfus.com and on the SEC's website at http://www.sec.gov. The
description of the policies and procedures is also available without charge, upon request,
by calling 1-800-645-6561.
|
Beginning with the fund's fiscal quarter ending December 31, 2004, the fund will file its complete schedule of portfolio holdings with the SEC for the first and third quarters of each fiscal year on Form N-Q. The fund's Forms N-Q will be available on the SEC's website at http://www.sec.gov and may be reviewed and copied at the SEC's Public Reference Room in Washington, DC. Information on the operation of the Public Reference Room may be obtained by calling 1-800-SEC-0330.

© 2004 Dreyfus Service Corporation 0084SA0904
Item 2. Code of Ethics.
Not applicable.
Item 3. Audit Committee Financial Expert.
Not applicable.
Item 4. Principal Accountant Fees and Services.
Not Applicable.
Item 5. Audit Committee of Listed Registrants.
Not applicable.
Item 6. [Reserved]
Item 7. Disclosure of Proxy Voting Policies and Procedures for Closed-End Management Investment Companies.
Not applicable.
Item 8. Purchases of Equity Securities by Closed-End Management Investment Companies and Affiliated Purchasers.
Not applicable.
Item 9. Submission of Matters to a Vote of Security Holders.
Not applicable.
Item 10. Controls and Procedures.
(a) The Registrant's principal executive and principal financial officers have concluded, based on their evaluation of the Registrant's disclosure controls and procedures as of a date within 90 days of the filing date of this report, that the Registrant's disclosure controls and procedures are reasonably designed to ensure that information required to be disclosed by the Registrant on Form N-CSR is recorded, processed, summarized and reported within the required time periods and that information required to be disclosed by the Registrant in the reports that it files or submits on Form N-CSR is accumulated and communicated to the Registrant's management, including its principal executive and principal financial officers, as appropriate to allow timely decisions regarding required disclosure.
(b) There were no changes to the Registrant's internal control over financial reporting that occurred during the Registrant's most recently ended fiscal half-year that have materially affected, or are reasonably likely to materially affect, the Registrant's internal control over financial reporting.
Item 11. Exhibits.
| | (a)(1) not applicable
(a)(2) Certifications of principal executive and principal financial officers as required by Rule 30a-2(a)
under the Investment Company Act of 1940.
(a)(3) Not applicable.
(b) Certification of principal executive and principal financial officers as required by Rule 30a-2(b)
under the Investment Company Act of 1940.
|
SIGNATURES
Pursuant to the requirements of the Securities Exchange Act of 1934 and the Investment Company Act of 1940, the Registrant has duly caused this Report to be signed on its behalf by the undersigned, thereunto duly authorized.
Dreyfus A Bonds Plus, Inc.
| By: | | /s/ Stephen E. Canter |
| |
|
| | | Stephen E. Canter |
| | | President |
| |
| Date: | | |
| November 23, 2004 |
Pursuant to the requirements of the Securities Exchange Act of 1934 and the Investment Company Act of 1940, this Report has been signed below by the following persons on behalf of the Registrant and in the capacities and on the dates indicated.
| By: | | /s/ Stephen E. Canter |
| |
|
| | | Stephen E. Canter |
| | | Chief Executive Officer |
| |
| Date: | | |
| November 23, 2004 |
| |
| |
| By: | | /s/ James Windels |
| |
|
| James Windels |
| | | Chief Financial Officer |
| |
| Date: | | |
| November 23, 2004 |
EXHIBIT INDEX
(a)(2) Certifications of principal executive and principal financial officers as required by Rule 30a-2(a) under the Investment Company Act of 1940. (EX-99.CERT)
(b) Certification of principal executive and principal financial officers as required by Rule 30a-2(b) under the Investment Company Act of 1940. (EX-99.906CERT)