| | | UNITED STATES |
| | | SECURITIES AND EXCHANGE COMMISSION |
| | | Washington, D.C. 20549 |
| |
| |
| | | FORM N-CSR |
| |
| CERTIFIED SHAREHOLDER REPORT OF REGISTERED MANAGEMENT |
| | | INVESTMENT COMPANIES |
| |
| Investment Company Act file number 811-2625 |
| |
| | | Dreyfus A Bonds Plus, Inc. |
| | | (Exact name of Registrant as specified in charter) |
| |
| |
| | | c/o The Dreyfus Corporation |
| | | 200 Park Avenue |
| | | New York, New York 10166 |
| | | (Address of principal executive offices) (Zip code) |
| |
| | | Mark N. Jacobs, Esq. |
| | | 200 Park Avenue |
| | | New York, New York 10166 |
| | | (Name and address of agent for service) |
| |
| Registrant's telephone number, including area code: (212) 922-6000 |
| |
| Date of fiscal year end: | | 3/31 |
| |
| Date of reporting period: | | 3/31/05 |
P:\Edgar Filings\Pending\084\NCSR-ANN-084-5-05\formncsrannual084.DOC
| | | | | FORM N-CSR |
| Item 1. | | Reports to Stockholders. | | |
Save time. Save paper. View your next shareholder report online as soon as it’s available. Log into www.dreyfus.com and sign up for Dreyfus eCommunications. It’s simple and only takes a few minutes.
The views expressed in this report reflect those of the portfolio manager only through the end of the period covered and do not necessarily represent the views of Dreyfus or any other person in the Dreyfus organization. Any such views are subject to change at any time based upon market or other conditions and Dreyfus disclaims any responsibility to update such views.These views may not be relied on as investment advice and, because investment decisions for a Dreyfus fund are based on numerous factors, may not be relied on as an indication of trading intent on behalf of any Dreyfus fund.
Not FDIC-Insured • Not Bank-Guaranteed • May Lose Value
| | | Contents |
| |
| | | THE FUND |
| |
|
| 2 | | Letter from the Chairman |
| 3 | | Discussion of Fund Performance |
| 6 | | Fund Performance |
| 7 | | Understanding Your Fund’s Expenses |
| 7 | | Comparing Your Fund’s Expenses |
| | | With Those of Other Funds |
| 8 | | Statement of Investments |
| 18 | | Statement of Financial Futures |
| 18 | | Statement of Options Written |
| 19 | | Statement of Assets and Liabilities |
| 20 | | Statement of Operations |
| 21 | | Statement of Changes in Net Assets |
| 22 | | Financial Highlights |
| 23 | | Notes to Financial Statements |
| 35 | | Report of Independent Registered |
| | | Public Accounting Firm |
| 36 | | Important Tax Information |
| 37 | | Information About the Review and Approval |
| | | of the Fund’s Management Agreement |
| 41 | | Board Members Information |
| 43 | | Officers of the Fund |
| |
| | | FOR MORE INFORMATION |
| |
|
| | | Back Cover |
| Dreyfus |
| A Bonds Plus, Inc. |

LETTER FROM THE CHAIRMAN
This annual report for Dreyfus A Bonds Plus, Inc. covers the 12-month period from April 1, 2004, through March 31, 2005. Inside, you’ll find valuable information about how the fund was managed during the reporting period, including a discussion with the fund’s portfolio managers, Catherine Powers and Chris Pellegrino.
Rising energy prices, an improving labor market and robust economic growth appear to have rekindled investors’ inflation concerns. Indeed, in its comments accompanying its latest increase in short-term interest rates, the Federal Reserve Board’s Federal Open Market Committee indicated that pricing power is “more evident.”As a result, most sectors of the U.S. bond market recently gave back a portion of the reporting period’s earlier gains.
Nonetheless, most analysts agree that fixed-income securities have held up well compared to previous periods of rising short-term interest rates. Strong demand from domestic and foreign investors have supported prices of U.S. Treasury securities, and stronger balance sheets and better business conditions have bolstered prices of corporate bonds. In our view, the bond market’s surprising strength represents yet another example of how a long-term investment perspective and a steady asset allocation strategy can benefit investors. As always, we encourage you to talk regularly with your financial advisor about the investment strategies that may be appropriate for you.


DISCUSSION OF FUND PERFORMANCE
Catherine Powers and Chris Pellegrino, Portfolio Managers
How did Dreyfus A Bonds Plus, Inc. perform relative to its benchmark?
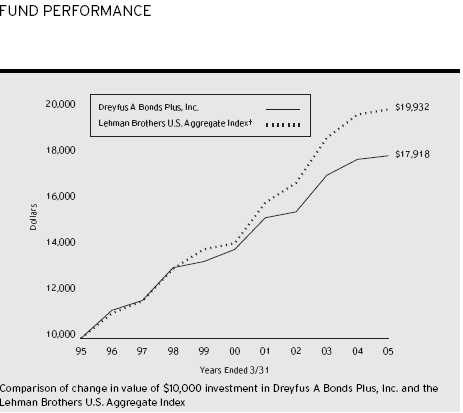
For the 12-month period ended March 31, 2005, the fund achieved a total return of 0.89% and produced aggregate income dividends of $0.585 per share.1 In comparison, the fund’s benchmark, the Lehman Brothers U.S.Aggregate Index (the “Index”), achieved a total return of 1.15% for the same period.2
Despite relatively strong fixed-income performance during much of the reporting period, pronounced weakness at the beginning and end of the reporting period resulted in only mildly positive absolute returns for the fund and its benchmark.The fund produced slightly lower returns than the Index, primarily due to our defensive investment posture during 2004, which prevented the fund from participating fully in market rallies.
On January 31, 2005, Catherine Powers became primary portfolio manager of the fund. Christopher Pellegrino was appointed as an additional portfolio manager. Ms. Powers is also a Senior Portfolio Manager for Active Core Strategies, responsible for high-grade core and core-plus fixed-income strategies, with Standish Mellon Asset Management, LLC — an affiliate of Dreyfus. Mr. Pellegrino also is a Senior Portfolio Manager for Active Core Strategies, responsible for the management of high-grade core strategies, with Standish Mellon. Each manages the portfolio under a dual-employee relationship with Dreyfus, using the proprietary investment processes of Standish Mellon.
What is the fund’s investment approach?
The fund seeks to maximize total return, consisting of capital appreciation and current income.The fund invests at least 80% of its assets in bonds that, when purchased, are rated single-A or better, or if unrated, deemed to be of comparable quality by Dreyfus.
When selecting securities for the fund, we first examine U.S. and global economic conditions and other market factors in an effort to determine what we believe is the likely direction of long- and short-
DISCUSSION OF FUND PERFORMANCE (continued)
|
term interest rates. Using a research-driven investment process, we then attempt to identify potentially profitable sectors before they are widely perceived by the market. Finally, we look for underpriced or mispriced securities within those sectors that, in our opinion, appear likely to perform well over time.
What other factors affected the fund’s performance?
The fund was strongly influenced by investors’ changing expectations for inflation, interest rates and economic growth. In the spring of 2004, stronger labor markets and rising energy prices rekindled inflation concerns and led investors to believe that the Federal Reserve Board (the “Fed”) was likely to raise short-term interest rates sooner than they had previously expected. In fact, in late June 2004, the Fed implemented its first rate hike in approximately four years. Six additional increases followed, driving the federal funds rate from 1% to 2.75% by the reporting period’s end.
Despite rising short-term interest rates, inflationary pressures failed to materialize during the summer and fall of 2004.As a result, longer-term bond yields rose very little or declined, while short-term interest rates rose. Indeed, in February 2005, Fed Chairman Alan Greenspan called the persistently low yields of longer-term bonds a “conundrum.” Corporate bonds participated strongly in the bond market’s rallies, supported by better business conditions and stronger balance sheets.
Subsequently, in March, the Fed commented that “pressures on inflation have picked up in recent months and pricing power is more evident.” Together with surging commodity prices, these remarks contributed to a sharp sell-off in the bond market during the closing weeks of the reporting period. At the same time, the corporate sector was hurt by a disappointing earnings report from General Motors, which sparked concerns that the company’s credit rating might be downgraded below investment grade.
During the first half of the reporting period, the fund was positioned for a widening of yield differences between shorter- and longer-term bonds. However, the opposite ensued, and yield differences between short- and long-term yields flattened. As a result, the fund’s return began to lag that of the Index, and better performance later in the reporting period was not enough to offset earlier weakness.
In fact, the fund’s relative performance improved markedly over the last two months of the reporting period, primarily as the result of a shift in emphasis toward higher-rated corporate bonds issued by companies that, in our judgment, enjoyed strongly positive cash flows and rising earnings. In contrast, we allocated a relatively small percentage of the fund’s assets to high-yield bonds.The fund also benefited later in the reporting period from its holdings of mortgage-backed securities backed by U.S. government agencies, which produced higher returns than U.S.Treasury securities and exhibited relatively low volatility in the rising interest-rate environment. Finally, the fund’s holdings of asset-backed securities, commercial mortgages,Treasury Inflation Protected Securities and non-U.S. government bonds contributed positively to the fund’s performance.
What is the fund’s current strategy?
Because we expect the Fed to continue to raise interest rates, we generally have maintained the fund’s cautious investment posture. As of March 31, 2005, we have lowered the fund’s exposure to mortgage-backed securities to a slightly underweighted position. Within the corporate sector, we have continued to focus on higher-rated bonds from financially sound companies. In addition, we have set the fund’s average duration modestly shorter than that of the benchmark. In our view, these are prudent strategies, as interest rates and inflationary pressures are poised to continue increasing.
| 1 | | Total return includes reinvestment of dividends and any capital gains paid. Past performance is no |
| | | guarantee of future results. Share price, yield and investment return fluctuate such that upon |
| | | redemption, fund shares may be worth more or less than their original cost. Return figure provided |
| | | reflects the absorption of fund expenses by The Dreyfus Corporation pursuant to an agreement in |
| | | effect until July 31, 2005, at which time it may be extended, modified or terminated. Had these |
| | | expenses not been absorbed, the fund’s return would have been lower. |
| 2 | | SOURCE: LIPPER INC. — Reflects reinvestment of dividends and, where applicable, capital |
| | | gain distributions.The Lehman Brothers U.S. Aggregate Index is a widely accepted, unmanaged |
| | | total return index of corporate, U.S. government and U.S. government agency debt instruments, |
| | | mortgage-backed securities and asset-backed securities with an average maturity of 1-10 years. |
| Average Annual Total Returns | | as of 3/31/05 | | | | | | |
| | | | | 1 Year | | 5 Years | | 10 Years |
| |
| |
| |
| |
|
| Fund | | | | 0.89% | | 5.29% | | 6.01% |
| † Source: Lipper Inc. |
| Past performance is not predictive of future performance.The fund’s performance shown in the graph and table does not |
| reflect the deduction of taxes that a shareholder would pay on fund distributions or the redemption of fund shares. |
| The above graph compares a $10,000 investment made in Dreyfus A Bonds Plus, Inc. on 3/31/95 to a $10,000 |
| investment made in the Lehman Brothers U.S. Aggregate Index (the “Index”) on that date. All dividends and capital |
| gain distributions are reinvested. |
| The fund’s performance shown in the line graph takes into account all applicable fees and expenses.The Index is a |
| widely accepted, unmanaged total return index of corporate, government and government agency debt instruments, |
| mortgage-backed securities and asset-backed securities with an average maturity of 1-10 years and does not take |
| into account charges, fees and other expenses. Further information relating to fund performance, including expense |
| reimbursements, if applicable, is contained in the Financial Highlights section of the prospectus and elsewhere |
| in this report. |
U N D E R S TA N D I N G YO U R F U N D ’ S E X P E N S E S ( U n a u d i t e d )
As a mutual fund investor, you pay ongoing expenses, such as management fees and other expenses. Using the information below, you can estimate how these expenses affect your investment and compare them with the expenses of other funds.You also may pay one-time transaction expenses, including sales charges (loads) and redemption fees, which are not shown in this section and would have resulted in higher total expenses. For more information, see your fund’s prospectus or talk to your financial adviser.
Review your fund’s expenses
The table below shows the expenses you would have paid on a $1,000 investment in Dreyfus A Bonds Plus, Inc. from October 1, 2004 to March 31, 2005. It also shows how much a $1,000 investment would be worth at the close of the period, assuming actual returns and expenses.
Expenses and Value of a $1,000 Investment assuming actual returns for the six months ended March 31, 2005
| Expenses paid per $1,000 † | | $ 4.37 |
| Ending value (after expenses) | | $1,014.00 |
| COMPARING YOUR FUND’S EXPENSES |
| WITH THOSE OF OTHER FUNDS (Unaudited) |
Using the SEC’s method to compare expenses
The Securities and Exchange Commission (SEC) has established guidelines to help investors assess fund expenses. Per these guidelines, the table below shows your fund’s expenses based on a $1,000 investment, assuming a hypothetical 5% annualized return. You can use this information to compare the ongoing expenses (but not transaction expenses or total cost) of investing in the fund with those of other funds.All mutual fund shareholder reports will provide this information to help you make this comparison. Please note that you cannot use this information to estimate your actual ending account balance and expenses paid during the period.
Expenses and Value of a $1,000 Investment assuming a hypothetical 5% annualized return for the six months ended March 31, 2005
| Expenses paid per $1,000 † | | $ 4.38 |
| Ending value (after expenses) | | $1,020.59 |
| † Expenses are equal to the fund’s annualized expense ratio of .87%; multiplied by the average account value over the |
| period, multiplied by 182/365 (to reflect the one-half year period). |
STATEMENT OF INVESTMENTS
March 31, 2005
|
| | | Principal | | | | |
| Bonds and Notes—103.2% | | Amount a | | Value ($) |
| |
| |
|
| Agricultural—.4% | | | | | | |
| Altria, | | | | | | |
| Notes, 7%, 2013 | | 1,475,000 | | | | 1,585,293 |
| Airlines—.0% | | | | | | |
| USAir, | | | | | | |
| Enhanced Equipment Notes, Ser. C, 8.93%, 2009 | | 904,468 | | b | | 90 |
| Asset-Backed Ctfs./Automobile Receivables—2.2% | | | | |
| WFS Financial Owner Trust: | | | | | | |
| Ser. 2003-3, Cl. A4, 3.25%, 2011 | | 8,225,000 | | | | 8,112,237 |
| Ser. 2005-2, Cl. B, 4.57%, 2012 | | 575,000 | | | | 572,395 |
| | | | | | | 8,684,632 |
| Asset-Backed Ctfs./Credit Cards—1.4% | | | | | | |
| MBNA Master Credit Card Note Trust, | | | | | | |
| Ser. 2002-C1, Cl. C1, 6.8%, 2014 | | 4,884,000 | | | | 5,318,993 |
| Asset-Backed Ctfs./Home Equity Loans—1.7% | | | | | | |
| ACE Securities, | | | | | | |
| Ser. 2005-HE1, Cl. A2A, 2.97%, 2035 | | 894,725 | | c | | 895,357 |
| Accredited Mortgage Loan Trust, | | | | | | |
| Ser. 2005-1 Cl. A2A, 2.95%, 2035 | | 1,005,545 | | c | | 1,006,249 |
| Ameriquest Mortgage Securities, | | | | | | |
| Ser. 2003-11, Cl. AF6, 5.14%, 2034 | | 925,000 | | | | 929,744 |
| Bear Stearns Asset Backed Securities, | | | | | | |
| Ser. 2005-HE3, Cl. 1A1, 2.93%, 2035 | | 775,000 | | c | | 775,000 |
| Fremont Home Loan Trust, | | | | | | |
| Ser. 2005-1, Cl. 2A1, 2.95%, 2035 | | 1,600,000 | | c | | 1,600,000 |
| Residential Asset Securities, | | | | | | |
| Ser. 2005-EMX1, Cl. AI1, 2.95%, 2035 | | 1,167,822 | | c | | 1,168,542 |
| | | | | | | 6,374,892 |
| Asset-Backed Ctfs./Manufactured Housing—.3% | | | | | | |
| Green Tree Financial, | | | | | | |
| Ser. 1994-7, Cl. M1, 9.25%, 2020 | | 925,000 | | | | 1,003,730 |
| Asset-Backed/Other—3.4% | | | | | | |
| Countrywide, | | | | | | |
| Ser. 2005-2 Cl. 2A1, 2.94%, 2035 | | 1,175,000 | | c | | 1,175,000 |
| Morgan Stanley ABS Capital I, | | | | | | |
| Ser. 2005-WMC2, Cl. A2A, 2.91%, 2035 | | 925,000 | | c | | 925,000 |
| Residential Asset Mortgage Products: | | | | | | |
| Ser. 2005-RS2, Cl. AII1, 2.96%, 2035 | | 1,507,853 | | c | | 1,509,138 |
| Ser. 2005-RS3, Cl. AIA1, 2.95%, 2035 | | 2,150,000 | | c | | 2,150,000 |
| Ser. 2005-RZ1, Cl. A1, 2.95%, 2034 | | 1,100,000 | | c | | 1,100,000 |
| |
| |
| 8 | | | | | | |
| | | Principal | | | | |
| Bonds and Notes (continued) | | Amount a | | Value ($) |
| |
| |
|
| Asset-Backed/Other (continued) | | | | | | |
| Saxon Asset Securities Trust, | | | | | | |
| Ser. 2004-2, Cl. AF2, 4.15%, 2035 | | 5,183,000 | | | | 5,131,076 |
| Specialty Underwriting & Residential Finance, | | | | |
| Ser. 2005-BC1, Cl. A1A, 2.856%, 2035 | | 1,000,000 | | c | | 1,000,078 |
| | | | | 12,990,292 |
| Auto Manufacturing—.1% | | | | | | |
| DaimlerChrysler, | | | | | | |
| Notes, 8.5%, 2031 | | 325,000 | | | | 393,304 |
| Banking—3.3% | | | | | | |
| Chuo Mitsui Trust & Banking, | | | | | | |
| Sub. Notes, 5.506%, 2049 | | 420,000 | | d | | 402,350 |
| HBOS Capital, | | | | | | |
| Notes, 6.071%, 2049 | | 5,410,000 | | d,e | | 5,674,360 |
| Northern Rock, | | | | | | |
| Notes, 5.6%, 2049 | | 975,000 | | d | | 996,442 |
| Rabobank Capital Funding II, | | | | | | |
| Bonds, 5.26%, 2049 | | 2,525,000 | | d | | 2,540,665 |
| US Bank NA, | | | | | | |
| Notes, Ser. BNT1, 2.7825%, 2006 | | 2,350,000 | | c | | 2,350,230 |
| Wells Fargo & Co., | | | | | | |
| Sub. Notes, 6.375%, 2011 | | 540,000 | | | | 586,412 |
| | | | | 12,550,459 |
| Building & Construction—.1% | | | | | | |
| American Standard, | | | | | | |
| Sr. Notes, 7.375%, 2008 | | 500,000 | | | | 535,022 |
| Chemicals—.7% | | | | | | |
| Lubrizol: | | | | | | |
| Debs., 6.5%, 2034 | | 1,100,000 | | e | | 1,152,870 |
| Sr. Notes, 4.625%, 2009 | | 815,000 | | | | 803,645 |
| RPM International, | | | | | | |
| Bonds, 6.25%, 2013 | | 790,000 | | | | 828,487 |
| | | | | | | 2,785,002 |
| Commercial Mortgage | | | | | | |
| Pass-Through Ctfs.—.2% | | | | | | |
| GMAC Commercial Mortgage Securities, | | | | | | |
| Ser. 2000-C2, Cl. A1, 7.273%, 2033 | | 672,837 | | | | 704,765 |
| Commercial Services—.1% | | | | | | |
| Deluxe, | | | | | | |
| Notes, Ser. B, 3.5%, 2007 | | 320,000 | | | | 311,918 |
| |
| |
| | | The Fund | | 9 |
S T A T E M E N T O F I N V E S T M E N T S (continued)
| | | Principal | | |
| Bonds and Notes (continued) | | Amount a | | Value ($) |
| |
| |
|
| Diversified Financial Services—5.3% | | |
| Amvescap, | | | | |
| Notes, 5.375%, 2013 | | 1,000,000 | | 993,853 |
| Boeing Capital, | | | | |
| Sr. Notes, 7.375%, 2010 | | 890,000 | | 1,001,338 |
| Citigroup, | | | | |
| Sub. Notes, 5%, 2014 | | 3,000,000 | | 2,950,803 |
| Countrywide Home Loans, | | | | |
| Notes, Ser. L, 4%, 2011 | | 2,115,000 | | 2,005,035 |
| Ford Motor Credit, | | | | |
| Notes, 7%, 2013 | | 800,000 e | | 776,188 |
| GMAC, | | | | |
| Bonds, 8%, 2031 | | 1,100,000 | | 960,329 |
| Glencore Funding, | | | | |
| Notes, 6%, 2014 | | 1,250,000 d | | 1,190,771 |
| Goldman Sachs, | | | | |
| Notes, 5.7%, 2012 | | 1,150,000 | | 1,185,705 |
| International Lease Finance, | | | | |
| Notes, 4.75%, 2012 | | 1,550,000 | | 1,504,571 |
| Jefferies, | | | | |
| Sr. Notes, 5.5%, 2016 | | 1,200,000 | | 1,177,265 |
| JPMorgan Chase & Co., | | | | |
| Sub. Notes, 5.125%, 2014 | | 1,460,000 | | 1,439,561 |
| Morgan Stanley, | | | | |
| Sub. Notes, 4.75%, 2014 | | 4,294,000 | | 4,095,742 |
| SLM, | | | | |
| Notes, 5.375%, 2013 | | 1,000,000 | | 1,031,284 |
| | | | | 20,312,445 |
| Electric Utilities—1.9% | | | | |
| Consumers Energy, | | | | |
| First Mortgage, 5%, 2012 | | 1,160,000 | | 1,147,272 |
| Dominion Resources, | | | | |
| Sr. Notes, Ser. A, 7.195%, 2014 | | 1,050,000 | | 1,192,879 |
| FirstEnergy, | | | | |
| Notes, Ser. C, 7.375%, 2031 | | 350,000 | | 397,680 |
| FPL Energy National Wind, | | | | |
| Notes, 5.608%, 2024 | | 205,000 d | | 203,230 |
| | | | | Principal | | |
| Bonds and Notes (continued) | | | | Amount a | | Value ($) |
| |
| |
| |
|
| Electric Utilities (continued) | | | | | | |
| Pacific Gas & Electric, | | | | | | �� |
| First Mortgage, 4.8%, 2014 | | | | 1,721,000 | | 1,678,206 |
| Public Service Co. of Colorado, | | | | | | |
| First Mortgage, Ser. 12, 4.875%, 2013 | | | | 2,487,000 | | 2,473,040 |
| Sierra Pacific Power, | | | | | | |
| Mortgage Notes, 6.25%, 2012 | | | | 365,000 | | 372,300 |
| | | | | | | 7,464,607 |
| Environmental Control—.6% | | | | | | |
| Republic Services, | | | | | | |
| Notes, 6.086%, 2035 | | | | 1,225,000 d | | 1,334,559 |
| Waste Management, | | | | | | |
| Sr. Notes, 7%, 2028 | | | | 1,000,000 | | 1,121,058 |
| | | | | | | 2,455,617 |
| Food & Beverages—1.0% | | | | | | |
| Kroger, | | | | | | |
| Sr. Notes, 8%, 2029 | | | | 960,000 | | 1,151,871 |
| Pepsi Bottling, | | | | | | |
| Sr. Notes, Ser. B, 7%, 2029 | | | | 575,000 | | 689,346 |
| Safeway, | | | | | | |
| Notes, 4.8%, 2007 | | | | 1,490,000 | | 1,491,384 |
| Stater Brothers, | | | | | | |
| Sr. Notes, 8.125%, 2012 | | | | 360,000 | | 349,200 |
| | | | | | | 3,681,801 |
| Foreign/Governmental—6.0% | | | | | | |
| Australia Government, | | | | | | |
| Bonds, Ser. 121, 5.25%, 2010 | | AUD | | 9,000,000 | | 6,828,664 |
| Banco Nacional de Desenvolvimento | | | | | | |
| Economico e Social, Notes, 5.832%, 2008 | | | | 1,215,000 c | | 1,197,170 |
| Deutsche Bundesrepublik: | | | | | | |
| Bonds, Ser. 03, 4.5%, 2013 | | EUR | | 1,360,000 | | 1,893,478 |
| Bonds, Ser. 03, 4.75%, 2034 | | EUR | | 2,840,000 | | 4,080,148 |
| Bonds, Ser. 98, 4.125%, 2008 | | EUR | | 1,395,000 | | 1,883,564 |
| Export-Import Bank Of Korea, | | | | | | |
| Sr. Notes, 4.5%, 2009 | | | | 1,075,000 | | 1,058,845 |
| Russia Government, | | | | | | |
| Bonds, 12.75%, 2028 | | | | 1,225,000 | | 2,009,848 |
S T A T E M E N T O F I N V E S T M E N T S (continued)
| | | Principal | | |
| Bonds and Notes (continued) | | Amount a | | Value ($) |
| |
| |
|
| Foreign/Governmental (continued) | | |
| South Africa Government, | | | | |
| Notes, 9.125%, 2009 | | 1,325,000 | | 1,512,156 |
| United Mexican States: | | | | |
| Notes, 6.75%, 2034 | | 2,360,000 e | | 2,309,260 |
| Notes, 9.875%, 2010 | | 520,000 | | 620,100 |
| | | | | 23,393,233 |
| Gaming & Lodging—.3% | | | | |
| MGM Mirage, | | | | |
| Sr. Notes, 6%, 2009 | | 375,000 | | 371,719 |
| Mohegan Tribal Gaming Authority, | | | | |
| Sr. Notes, 6.125%, 2013 | | 620,000 d | | 610,700 |
| | | | | 982,419 |
| Manufacturing—.3% | | | | |
| Bombardier, | | | | |
| Notes, 6.3%, 2014 | | 1,440,000 d,e | | 1,216,800 |
| Media—1.5% | | | | |
| AOL Time Warner, | | | | |
| Notes, 6.75%, 2011 | | 900,000 | | 973,744 |
| British Sky Broadcasting, | | | | |
| Notes, 6.875%, 2009 | | 1,800,000 | | 1,932,683 |
| Clear Channel Communications, | | | | |
| Sr. Notes, 5%, 2012 | | 1,000,000 | | 951,966 |
| Comcast, | | | | |
| Notes, 5.5%, 2011 | | 990,000 | | 1,009,495 |
| News America, | | | | |
| Notes, 5.3%, 2014 | | 1,000,000 d | | 981,436 |
| | | | | 5,849,324 |
| Oil & Gas—.9% | | | | |
| Amerada Hess, | | | | |
| Notes, 7.3%, 2031 | | 1,045,000 | | 1,182,091 |
| Halliburton, | | | | |
| Notes, 5.5%, 2010 | | 565,000 | | 581,980 |
| PC Financial Partnership, | | | | |
| Notes, 5%, 2014 | | 815,000 | | 799,068 |
| XTO Energy, | | | | |
| Sr. Notes, 7.5%, 2012 | | 870,000 | | 997,978 |
| | | | | 3,561,117 |
| Packaging & Containers—.2% | | | | |
| Sealed Air, | | | | |
| Notes, 5.625%, 2013 | | 590,000 d | | 597,731 |
| |
| 12 | | | | |
| | | Principal | | | | |
| Bonds and Notes (continued) | | Amount a | | Value ($) |
| |
| |
|
| Paper & Forest Products—1.0% | | | | | | |
| Celulosa Arauco y Constitucion SA, | | | | | | |
| Notes, 5.125%, 2013 | | 660,000 | | | | 632,444 |
| Georgia-Pacific: | | | | | | |
| Sr. Notes, 8%, 2014 | | 780,000 | | | | 873,600 |
| Sr. Notes, 8.875%, 2010 | | 280,000 | | | | 313,950 |
| International Paper, | | | | | | |
| Notes, 5.3%, 2015 | | 1,000,000 | | | | 998,841 |
| Sappi Papier, | | | | | | |
| Notes, 6.75%, 2012 | | 585,000 | | d | | 635,462 |
| Westvaco, | | | | | | |
| Debs., 7.95%, 2031 | | 465,000 | | | | 582,948 |
| | | | | | | 4,037,245 |
| Property-Casualty Insurance—1.3% | | | | |
| Ace Capital Trust II, | | | | | | |
| Bonds, 9.7%, 2030 | | 400,000 | | | | 548,235 |
| Assurant, | | | | | | |
| Sr. Notes, 6.75%, 2034 | | 725,000 | | | | 789,065 |
| Metlife, | | | | | | |
| Sr. Notes, 5.5%, 2014 | | 2,195,000 | | | | 2,230,763 |
| North Front Pass-Through Trust, | | | | | | |
| Notes, 5.81%, 2024 | | 1,590,000 | | d | | 1,578,606 |
| | | | | | | 5,146,669 |
| Real Estate Investment Trusts—1.8% | | | | |
| Arden Realty, | | | | | | |
| Notes, 5.25%, 2015 | | 675,000 | | | | 654,853 |
| Duke Realty, | | | | | | |
| Sr. Notes, 5.875%, 2012 | | 2,210,000 | | | | 2,287,153 |
| EOP Operating, | | | | | | |
| Sr. Notes, 7%, 2011 | | 1,090,000 | | e | | 1,201,952 |
| ERP Operating, | | | | | | |
| Notes, 5.25%, 2014 | | 1,000,000 | | | | 985,854 |
| Healthcare Realty Trust, | | | | | | |
| Sr. Notes, 5.125%, 2014 | | 875,000 | | | | 842,061 |
| Simon Property, | | | | | | |
| Notes, 4.875%, 2010 | | 1,000,000 | | | | 989,967 |
| | | | | | | 6,961,840 |
| Residential Mortgage | | | | | | |
| Pass-Through Ctfs.—3.4% | | | | | | |
| Countrywide Home Loans, | | | | | | |
| Ser. 2003-7, Cl. B3, 5.75%, 2033 | | 604,870 | | d | | 555,518 |
S T A T E M E N T O F I N V E S T M E N T S (continued)
| | | Principal | | | | |
| Bonds and Notes (continued) | | Amount a | | Value ($) |
| |
| |
|
| Residential Mortgage | | | | | | |
| Pass-Through Ctfs. (continued) | | | | | | |
| First Horizon Alternative Mortgage Securities I, | | | | |
| Ser. 2004-FA1, Cl. A1, 6.25%, 2034 | | 7,997,450 | | | | 8,205,703 |
| MASTR Asset Securitization Trust, | | | | | | |
| Ser. 2005-WMCI, Cl. A3, 2.95%, 2035 | | 1,025,000 | | | | 1,025,000 |
| Residential Funding Mortgage Securities I, | | | | | | |
| Ser. 2004-S3, Cl. M1, 4.75%, 2019 | | 1,307,248 | | | | 1,264,465 |
| Structured Adjustable Rate Mortgage Trust, | | | | |
| Ser. 2005-8XS, Cl. A1, 2.95%, 2035 | | 1,175,000 | | c | | 1,175,000 |
| Washington Mutual, | | | | | | |
| Ser. 2005-AR4, Cl. A4B, 4.684%, 2035 | | 1,025,000 | | c | | 1,016,992 |
| | | | | | | 13,242,678 |
| Retail—.3% | | | | | | |
| May Department Stores, | | | | | | |
| Notes, 3.95%, 2007 | | 1,000,000 | | | | 986,844 |
| Structured Index—1.3% | | | | | | |
| AB Svensk Exportkredit, | | | | | | |
| GSNE-ER Indexed Notes, 0%, 2007 | | 5,380,000 | | d,f | | 5,092,170 |
| Technology—.1% | | | | | | |
| Freescale Semiconductor, | | | | | | |
| Sr. Notes, 6.875%, 2011 | | 305,000 | | | | 315,294 |
| Telecommunications—1.8% | | | | | | |
| Alltel, | | | | | | |
| Notes, 4.656%, 2007 | | 520,000 | | | | 523,422 |
| AT&T Wireless Services, | | | | | | |
| Sr. Notes, 8.75%, 2031 | | 440,000 | | | | 582,241 |
| Deutsche Telekom International Finance, | | | | | | |
| Bonds, 8.75%, 2030 | | 1,130,000 | | c | | 1,482,246 |
| France Telecom, | | | | | | |
| Notes, 8%, 2011 | | 475,000 | | c | | 544,162 |
| SBC Communications, | | | | | | |
| Notes, 5.625%, 2016 | | 580,000 | | | | 583,490 |
| Sprint Capital, | | | | | | |
| Notes, 8.75%, 2032 | | 1,485,000 | | | | 1,932,404 |
| Verizon Global Funding, | | | | | | |
| Notes, 7.75%, 2032 | | 960,000 | | | | 1,171,677 |
| | | | | | | 6,819,642 |
| | | Principal | | |
| Bonds and Notes (continued) | | Amount a | | Value ($) |
| |
| |
|
| Transportation—.3% | | | | |
| Union Pacific, | | | | |
| Notes, 3.875%, 2009 | | 1,000,000 | | 971,775 |
| U.S. Government—25.2% | | | | |
| U.S. Treasury Bonds, | | | | |
| 6.25%, 5/15/2031 | | 12,820,000 | | 15,406,948 |
| U.S. Treasury Inflation Protected Securities, | | | | |
| 3.375%, 1/15/2007 | | 25,954,771 g | | 27,244,182 |
| U.S. Treasury Notes: | | | | |
| 1.625%, 4/30/2005 | | 21,975,000 | | 21,961,156 |
| 3%, 12/31/2006 | | 6,315,000 | | 6,236,757 |
| 3.375%, 9/15/2009 | | 25,155,000 | | 24,387,596 |
| 4.25%, 8/15/2013 | | 2,290,000 | | 2,258,961 |
| | | | | 97,495,600 |
| U.S. Government Agencies/Mortgage-Backed—34.8% | | |
| Federal Home Loan Mortgage Corp.: | | | | |
| REMIC, Gtd. Multiclass Mortgage Participation Ctfs.: | | |
| Ser. 51, Cl. E, 10%, 7/15/2020 | | 548,978 | | 548,786 |
| Ser. 2586, Cl. WE, 4%, 12/15/2032 | | 4,781,628 | | 4,585,843 |
| (Interest Only Obligations) | | | | |
| Ser. 2750, Cl. IK, 5%, 5/15/2026 | | 4,617,400 h | | 876,007 |
| Federal National Mortgage Association: | | | | |
| 4.5% | | 19,750,000 i | | 19,311,748 |
| 5% | | 23,725,000 i | | 23,388,869 |
| 5.5% | | 11,425,000 i | | 11,642,761 |
| 5.5%, 9/1/2034 | | 10,684,499 | | 10,710,688 |
| 6% | | 9,375,000 i | | 9,582,938 |
| 6%, 1/1/2019—9/1/2034 | | 4,340,753 | | 4,458,709 |
| 8%, 12/1/2025 | | 68,824 | | 74,459 |
| REMIC Trust, Gtd. Pass-Through Ctfs.: | | | | |
| Ser. 1988-16, Cl. B, 9.5%, 6/25/2018 | | 317,223 | | 340,679 |
| Ser. 2004-58, Cl. LJ, 5%, 7/25/2034 | | 2,700,959 | | 2,733,020 |
| Government National Mortgage Association I: | | | | |
| 5.5%, 4/15/2033-2/15/2034 | | 13,253,979 | | 13,393,105 |
| 6%, 3/15/2029-12/15/2033 | | 13,672,227 | | 14,069,569 |
| Project Loan: | | | | |
| 6.86%, 4/15/2005 | | 12,672,165 | | 12,644,953 |
| 7%, 6/15/2008 | | 8,293 | | 8,552 |
| 9.5%, 11/15/2017 | | 740,424 | | 810,069 |
| Ser. 2005-29, Cl. A, 4.7%, 12/15/2029 | | 950,000 | | 930,984 |
| Ser. 2005-32, Cl. B, 4.5%, 12/15/2029 | | 1,175,000 | | 1,163,250 |
S T A T E M E N T O F I N V E S T M E N T S (continued)
| | | Principal | | |
| Bonds and Notes (continued) | | Amount a | | Value ($) |
| |
| |
|
| U.S. Government Agencies/Mortgage-Backed (continued) | | |
| U.S. Government Gtd. Development Participation Ctfs.: | | |
| (Gtd. By U.S. Small Business Administration) | | | | |
| Ser. 1994-20K, Cl. 1, 8.65%, 11/1/2014 | | 715,964 | | 764,202 |
| Ser. 1994-20L, Cl. 1, 8.4%, 12/1/2014 | | 1,452,794 | | 1,548,324 |
| Ser. 1997-20J, Cl. 1, 6.55%, 10/1/2017 | | 780,922 | | 817,684 |
| | | | | 134,405,199 |
| Total Bonds and Notes | | | | |
| (cost $403,998,876) | | | | 398,228,442 |
| |
| |
|
| |
| | | Face Amount | | |
| | | Covered by | | |
| Options—.0% | | Contracts ($) | | Value ($) |
| |
| |
|
| Call Options—.0% | | | | |
| U.S. Treasury Notes, 4%, 2/15/2015 | | | | |
| May 2005@ $96.9375 | | 3,900,000 | | 27,300 |
| Put Options—.0% | | | | |
| U.S. Treasury Notes, 4%, 2/15/2015 | | | | |
| June 2005@ $95.328125 | | 4,290,000 | | 39,468 |
| Total Options | | | | |
| (cost $100,364) | | | | 66,768 |
| |
| |
|
| |
| Other Investments—.2% | | Shares | | Value ($) |
| |
| |
|
| Registered Investment Company; | | | | |
| Dreyfus Institutional Preferred | | | | |
| Plus Money Market Fund | | | | |
| (cost $800,000) | | 800,000 j | | 800,000 |
| |
| |
|
| |
| | | Principal | | |
| Short-Term Investments—13.4% | | Amount a | | Value ($) |
| |
| |
|
| U.S. Government Agencies—8.2% | | | | |
| Federal National Mortgage Association, | | | | |
| 2.55%, 4/13/2005 | | 31,850,000 | | 31,822,184 |
| U.S. Treasury Bills—5.2% | | | | |
| 2.26%, 4/14/2005 | | 17,820,000 | | 17,803,427 |
| 2.60%, 4/28/2005 | | 2,115,000 | | 2,110,918 |
| 2.49%, 6/16/2005 | | 50,000 k | | 49,716 |
| | | | | 19,964,061 |
| Total Short-Term Investments | | | | |
| (cost $51,786,080) | | | | 51,786,245 |
| Investment of Cash Collateral | | | | |
| for Securities Loaned—1.5% | | Shares | | Value ($) |
| |
| |
|
| Registered Investment Company; | | | | |
| Dreyfus Institutional Cash Advantage Fund | | | | |
| (cost $5,736,500) | | 5,736,500 j | | 5,736,500 |
| |
| |
|
| Total Investments (cost $462,421,820) | | 118.3% | | 456,617,955 |
| Liabilities, Less Cash and Receivables | | (18.3%) | | (70,553,545) |
| Net Assets | | 100.0% | | 386,064,410 |
| a Principal amount stated in U.S Dollars unless otherwise noted. |
| AUD—Australian Dollar |
| EUR—Euro |
| b Non-income producing—security in default. |
| c Variable rate security—interest rate subject to periodic change. |
| d Securities exempt from registration under Rule 144A of the Securities Act of 1933.These securities may be resold |
| in transactions exempt from registration, normally to qualified institutional buyers. At March 31, 2005, these |
| securities amounted to $23,610,800 or 6.1% of net assets. |
| e All or a portion of these securities are on loan. At March 31, 2005, the total market value of the fund’s securities on |
| loan is $5,570,291 and the total market value of the collateral held by the fund is $5,736,500. |
| f Security linked to Goldman Sachs Non-Energy—Excess Return Index. |
| g Principal amount for accrual purposes is periodically adjusted based on changes in the Consumer Price Index. |
| h Notional face amount shown. |
| i Purchased on a forward commitment basis. |
| j Investments in affiliated money market mutual funds. |
| k Held by a broker as collateral for open financial futures positions. |
| Portfolio Summary † | | | | | | |
| |
| | | Value (%) | | | | Value (%) |
| |
| |
| |
|
| U.S. Government & Agencies | | 60.0 | | Foreign/Governmental | | 6.0 |
| Corporate Bonds | | 23.3 | | Structured Index | | 1.3 |
| Short Term/Money | | | | Futures/Options/Forward Currency |
| Market Investments | | 15.1 | | Exchange Contracts/Swaps | | .1 |
| Asset/Mortgage Backed | | 12.6 | | | | 118.4 |
| |
| † Based on net assets. | | | | | | |
| See notes to financial statements. | | | | | | |
| STATEMENT OF FINANCIAL FUTURES |
| March 31, 2005 |
| | | | | | | | | Unrealized |
| | | | | Market Value | | | | Appreciation |
| | | | | Covered by | | | | (Depreciation) |
| | | Contracts | | Contracts ($) | | Expiration | | at 3/31/2005 ($) |
| |
| |
| |
| |
|
| Financial Futures Long | | | | | | | | |
| U.S. Treasury 10 Year Notes | | 6 | | 655,594 | | June 2005 | | (7,875) |
| U.S. Treasury 30 Year Bonds | | 46 | | 5,123,250 | | June 2005 | | (89,047) |
| Financial Futures Short | | | | | | | | |
| U.S. Treasury 2 Year Notes | | 50 | | 10,344,531 | | June 2005 | | 44,531 |
| U.S. Treasury 5 Year Notes | | 85 | | 9,102,969 | | June 2005 | | 50,898 |
| | | | | | | | | (1,493) |
See notes to financial statements.
|
| STATEMENT OF OPTIONS WRITTEN |
| March 31, 2005 |
| Face Amount | | |
| Covered by | | |
| Contracts ($) | | Value ($) |
| |
|
| U.S. Treasury Notes, 4%, 2/15/2015 | | | | |
| May 2005@ $98.484375 | | 7,800,000 | | 23,478 |
| Put Options; | | | | |
| U.S. Treasury Notes, 4%, 2/15/2015 | | | | |
| June 2005@ $93.53125 | | 8,580,000 | | 29,258 |
| (Premiums received $100,364) | | | | 52,736 |
See notes to financial statements.
|
| STATEMENT OF ASSETS AND LIABILITIES |
| March 31, 2005 |
| | | Cost | | Value |
| |
| |
|
| Assets ($): | | | | |
| Investments in securities—See Statement of | | | | |
| Investments (including securities on loan, | | | | |
| valued at $5,570,291)—Note 1(c): | | | | |
| Unaffiliated issuers | | 455,885,320 | | 450,081,455 |
| Affiliated isuers | | 6,536,500 | | 6,536,500 |
| Cash | | | | 47,370 |
| Cash denominated in foreign currencies | | 144,605 | | 143,783 |
| Receivable for investment securities sold | | | | 23,656,998 |
| Dividends and interest receivable | | | | 3,143,877 |
| Unrealized appreciation on forward currency | | | | |
| exchange contracts—Note 4 | | | | 420,645 |
| Receivable for shares of Common Stock subscribed | | 7,082 |
| Unrealized appreciation on swap contracts—Note 4 | | 3,068 |
| Paydowns receivable | | | | 1,939 |
| | | | | 484,042,717 |
| |
| |
|
| Liabilities ($): | | | | |
| Due to The Dreyfus Corporation and affiliates—Note 3(b) | | 243,415 |
| Payable for investment securities purchased | | | | 90,820,208 |
| Liability for securities on loan—Note 1(c) | | | | 5,736,500 |
| Payable for shares of Common Stock redeemed | | 750,796 |
| Unrealized depreciation on swap contracts—Note 4 | | 90,526 |
| Outstanding options written, at value (premiums | | |
| received $100,364)—See Statement of Options Written | | 52,736 |
| Payable to broker from swap transactions—Note 4 | | 50,329 |
| Unrealized depreciation on forward currency exchange contracts—Note 4 | | 39,845 |
| Payable for futures variation margin—Note 4 | | | | 13,875 |
| Accrued expenses | | | | 180,077 |
| | | | | 97,978,307 |
| |
| |
|
| Net Assets ($) | | | | 386,064,410 |
| |
| |
|
| Composition of Net Assets ($): | | | | |
| Paid-in capital | | | | 421,481,629 |
| Accumulated undistributed investment income—net | | 4,945,498 |
| Accumulated net realized gain (loss) on investments | | (34,924,626) |
| Accumulated net unrealized appreciation (depreciation) on investments, | | |
| foreign currency transactions, options transactions and swap transactions | | |
| [including ($1,493) net unrealized (depreciation) on financial futures] | | (5,438,091) |
| |
|
| Net Assets ($) | | | | 386,064,410 |
| |
| |
|
| Shares Outstanding | | | | |
| (100 million shares of $.001 par value Common Stock authorized) | | 28,233,009 |
| Net Asset Value, offering and redemption price per share ($) | | 13.67 |
See notes to financial statements.
|
STATEMENT OF OPERATIONS
Year Ended March 31, 2005
|
| Investment Income ($): | | |
| Interest | | 18,472,761 |
| Cash dividends; | | |
| Affiliated issuers | | 396,924 |
| Income from securities lending | | 50,678 |
| Total Income | | 18,920,363 |
| Expenses: | | |
| Management fee—Note 3(a) | | 2,839,719 |
| Shareholder servicing costs—Note 3(b) | | 894,598 |
| Custodian fees—Note 3(b) | | 110,591 |
| Professional fees | | 63,973 |
| Directors’ fees and expenses—Note 3(c) | | 40,043 |
| Prospectus and shareholders’ reports | | 39,367 |
| Registration fees | | 24,353 |
| Interest expense—Note 2 | | 23,357 |
| Miscellaneous | | 31,991 |
| Total Expenses | | 4,067,992 |
| Less—reduction in management fee | | |
| due to undertaking—Note 3(a) | | (100,380) |
| Net Expenses | | 3,967,612 |
| Investment Income—Net | | 14,952,751 |
| |
|
| Realized and Unrealized Gain (Loss) on Investments—Note 4 ($): |
| Net realized gain (loss) on investments and foreign currency transactions | | 4,498,563 |
| Net realized gain (loss) on financial futures | | (995,884) |
| Net realized gain (loss) on forward currency exchange contracts | | (3,398,795) |
| Net realized gain (loss) on options transactions | | 146,748 |
| Net realized gain (loss) on swap transactions | | (312,956) |
| Net Realized Gain (Loss) | | (62,324) |
| Net unrealized appreciation (depreciation) on investments, | | |
| foreign currency transactions, options transactions and | | |
| swap transactions [including ($17,380) unrealized | | |
| (depreciation) on financial futures] | | (12,826,722) |
| Net Realized and Unrealized Gain (Loss) on Investments | | (12,889,046) |
| Net Increase in Net Assets Resulting from Operations | | 2,063,705 |
See notes to financial statements.
|
STATEMENT OF CHANGES IN NET ASSETS
| | | | | Year Ended March 31, |
| |
| |
|
| | | 2005 | | 2004 |
| |
| |
|
| Operations ($): | | | | |
| Investment income—net | | 14,952,751 | | 17,502,008 |
| Net realized gain (loss) on investments | | (62,324) | | 10,380,140 |
| Net unrealized appreciation | | | | |
| (depreciation) on investments | | (12,826,722) | | (5,183,119) |
| Net Increase (Decrease) in Net Assets | | | | |
| Resulting from Operations | | 2,063,705 | | 22,699,029 |
| |
| |
|
| Dividends to Shareholders from ($): | | | | |
| Investment income—net | | (18,807,125) | | (21,648,632) |
| |
| |
|
| Capital Stock Transactions ($): | | | | |
| Net proceeds from shares sold | | 26,038,282 | | 55,047,715 |
| Dividends reinvested | | 16,659,064 | | 19,164,950 |
| Cost of shares redeemed | | (149,243,080) | | (172,869,858) |
| Increase (Decrease) in Net Assets | | | | |
| from Capital Stock Transactions | | (106,545,734) | | (98,657,193) |
| Total Increase (Decrease) in Net Assets | | (123,289,154) | | (97,606,796) |
| |
| |
|
| Net Assets ($): | | | | |
| Beginning of Period | | 509,353,564 | | 606,960,360 |
| End of Period | | 386,064,410 | | 509,353,564 |
| Undistributed investment income—net | | 4,945,498 | | 4,186,691 |
| |
| |
|
| Capital Share Transactions (Shares): | | | | |
| Shares sold | | 1,897,239 | | 3,895,819 |
| Shares issued for dividends reinvested | | 1,216,358 | | 1,362,364 |
| Shares redeemed | | (10,905,422) | | (12,226,347) |
| Net Increase (Decrease) in Shares Outstanding | | (7,791,825) | | (6,968,164) |
See notes to financial statements.
|
The following table describes the performance for the fiscal periods indicated. Total return shows how much your investment in the fund would have increased (or decreased) during each period, assuming you had reinvested all dividends and distributions.These figures have been derived from the fund’s financial statements.
| | | | | Year Ended March 31, | | |
| |
| |
| |
|
| | | 2005 | | 2004a | | 2003 | | 2002 b | | 2001 |
| |
| |
| |
| |
| |
|
| Per Share Data ($): | | | | | | | | | | |
| Net asset value, beginning of period | | 14.14 | | 14.12 | | 13.47 | | 14.10 | | 13.65 |
| Investment Operations: | | | | | | | | | | |
| Investment income—net | | .47c | | .44c | | .63c | | .81c | | .84 |
| Net realized and unrealized | | | | | | | | | | |
| gain (loss) on investments | | (.35) | | .11 | | .71 | | (.56) | | .47 |
| Total from Investment Operations | | .12 | | .55 | | 1.34 | | .25 | | 1.31 |
| Distributions: | | | | | | | | | | |
| Dividends from investment income—net | | (.59) | | (.53) | | (.69) | | (.88) | | (.86) |
| Net asset value, end of period | | 13.67 | | 14.14 | | 14.12 | | 13.47 | | 14.10 |
| |
| |
| |
| |
| |
|
| Total Return (%) | | .89 | | 4.01 | | 10.30 | | 1.68 | | 9.94 |
| |
| |
| |
| |
| |
|
| Ratios/Supplemental Data (%): | | | | | | | | | | |
| Ratio of total expenses | | | | | | | | | | |
| to average net assets | | .93 | | .93 | | .93 | | .93 | | .91 |
| Ratio of net expenses | | | | | | | | | | |
| to average net assets | | .91 | | .93 | | .93 | | .93 | | .91 |
| Ratio of net investment income | | | | | | | | | | |
| to average net assets | | 3.42 | | 3.09 | | 4.56 | | 5.87 | | 6.29 |
| Portfolio Turnover Rate | | 648.92d | | 803.93d | | 636.05 | | 533.95 | | 718.67 |
| |
| |
| |
| |
| |
|
| Net Assets, end of period ($ x 1,000) | | 386,064 | | 509,354 | | 606,960 | | 573,241 | | 578,293 |
| a | | As of April 1, 2003, the fund has adopted the method of accounting for interim payments on swap contracts in |
| | | accordance with Financial Accounting Standards Board Statement No. 133.These interim payments are reflected |
| | | within net realized and unrealized gain (loss) on swap contracts, however, prior to April 1, 2003, these interim |
| | | payments were reflected within interest income/expense in the Statement of Operations.The effect of this change for |
| | | the period ended March 31, 2004, was to increase net investment income per share by $.01, decrease net realized |
| | | and unrealized gain (loss) on investments per share by $.01 and increase the ratio of net investment income to |
| | | average net assets from 3.04% to 3.09%. Per share data and ratios/supplemental data for periods prior to April 1, |
| | | 2003 have not been restated to reflect this change in presentation. |
| b | | As required, effective April 1, 2001, the fund has adopted the provisions of the AICPA Audit and Accounting Guide |
| | | for Investment Companies and began accreting discount or amortizing premium on fixed income securities on a |
| | | scientific basis and including paydown gains and losses in interest income.The effect of these changes for the period |
| | | ended March 31, 2002 was to decrease net investment income per share by $.04, increase net realized and |
| | | unrealized gain (loss) on investments per share by $.04 and decrease the ratio of net investment income to average net |
| | | assets from 6.15% to 5.87%. Per share data and ratios/supplemental data for periods prior to April 1, 2001 have |
| | | not been restated to reflect these changes in presentation. |
| c | | Based on average shares outstanding at each month end. |
| d | | The portfolio turnover rates excluding mortgage dollar roll transactions for the years ended March 31, 2005 and |
| | | March 31, 2004, were 585.91% and 655.66%, respectively. |
| See notes to financial statements. |
NOTES TO FINANCIAL STATEMENTS
NOTE 1—Significant Accounting Policies:
Dreyfus A Bonds Plus, Inc. (the “fund”) is registered under the Investment Company Act of 1940, as amended (the “Act”), as a diversified open-end management investment company.The fund’s investment objective is to maximize total return, consisting of capital appreciation and current income. The Dreyfus Corporation (the “Manager” or “Dreyfus”) serves as the fund’s investment adviser. The Manager is a wholly-owned subsidiary of Mellon Financial Corporation (“Mellon Financial”). Dreyfus Service Corporation (the “Distributor”), a wholly-owned subsidiary of the Manager, is the distributor of the fund’s shares, which are sold to the public without a sales charge.
The fund’s financial statements are prepared in accordance with U.S. generally accepted accounting principles, which may require the use of management estimates and assumptions. Actual results could differ from those estimates.
The fund enters into contracts that contain a variety of indemnifications. The fund’s maximum exposure under these arrangements is unknown.The fund does not anticipate recognizing any loss related to these arrangements.
(a) Portfolio valuation: Investments in securities (excluding short-term investments (other than U.S. Treasury Bills), financial futures, options, swaps and forward currency exchange contracts) are valued each business day by an independent pricing service (the “Service”) approved by the Board of Directors. Investments for which quoted bid prices are readily available and are representative of the bid side of the market in the judgment of the Service are valued at the mean between the quoted bid prices (as obtained by the Service from dealers in such securities) and asked prices (as calculated by the Service based upon its evaluation of the market for such securities). Other investments (which constitute a majority of the portfolio securities) are valued as determined by the Service, based on methods which include consideration of: yields or prices of securities of comparable quality, coupon, maturity and type; indications as to values from dealers; and general market conditions.
NOTES TO FINANCIAL STATEMENTS (continued)
|
Securities for which there are no such valuations are valued at fair value as determined in good faith under the direction of the Board of Directors. Restricted securities, as well as securities or other assets for which recent market quotations are not readily available,that are not valued by a pricing service approved by the Board of Directors, or are determined by the fund not to reflect accurately fair value (such as when an event occurs after the close of the exchange on which the security is principally traded and that is determined by the fund to have changed the value of the security), are valued at fair value as determined in good faith under the direction of the Board of Directors.The factors that may be considered when fair valuing a security include fundamental analytical data, the nature and duration of restrictions on disposition, an evaluation of the forces that influence the market in which the securities are purchased and sold and public trading in similar securities of the issuer or comparable issuers. Short-term investments, excluding U.S.Treasury Bills, are carried at amortized cost, which approximates value. Investments in registered investment companies are valued at their net asset value. Financial futures and options, which are traded on an exchange, are valued at the last sales price on the securities exchange on which such securities are primarily traded or at the last sales price on the national securities market on each business day. Options traded over-the-counter are priced at the mean between the bid and asked price. Swap transactions are valued daily based upon future cash flows and other factors, such as interest rates and underlying securities. Investments denominated in foreign currencies are translated to U.S. dollars at the prevailing rates of exchange. Forward currency exchange contracts are valued at the forward rate.
(b) Foreign currency transactions: The fund does not isolate that portion of the results of operations resulting from changes in foreign exchange rates on investments from the fluctuations arising from changes in market prices of securities held. Such fluctuations are included with the net realized and unrealized gain or loss from investments.
Net realized foreign exchange gains or losses arise from sales and maturities of short-term securities, sales of foreign currencies, currency gains or losses realized on securities transactions and the difference between
the amounts of dividends, interest and foreign withholding taxes recorded on the fund’s books and the U.S. dollar equivalent of the amounts actually received or paid. Net unrealized foreign exchange gains and losses arise from changes in the value of assets and liabilities other than investments in securities, resulting from changes in exchange rates. Such gains and losses are included with net realized and unrealized gain or loss on investments.
(c) Securities transactions and investment income: Securities transactions are recorded on a trade date basis. Realized gain and loss from securities transactions are recorded on the identified cost basis. Dividend income is recognized on the ex-dividend date and interest income, including, where applicable, accretion of discount and amortization of premium on investments, is recognized on the accrual basis.
The fund has an arrangement with the custodian bank whereby the fund receives earnings credits from the custodian when positive cash balances are maintained, which are used to offset custody fees. For financial reporting purposes, the fund includes net earnings credits, if any, as an expense offset in the Statement of Operations.
Pursuant to a securities lending agreement with Mellon Bank, N.A., an affiliate of the Manager, the fund may lend securities to qualified institutions.At origination, all loans are secured by collateral of at least 102% of the value of U.S. securities loaned and 105% of the value of foreign securities loaned. Collateral equivalent to at least 100% of the market value of securities on loan will be maintained at all times. Cash collateral is invested in certain money market mutual funds managed by the Manager. The fund will be entitled to receive all income on securities loaned, in addition to income earned as a result of the lending transaction. Although each security loaned is fully collateralized, the fund would bear the risk of delay in recovery of, or loss of rights in, the securities loaned should a borrower fail to return the securities in a timely manner.
(d) Affiliated issuers: Investments in other investment companies advised by the Manager are defined as “affiliated” in the Act.
NOTES TO FINANCIAL STATEMENTS (continued)
|
(e) Dividends to shareholders: Dividends are recorded on the ex-dividend date. Dividends from investment income-net are declared and paid monthly. Dividends from net realized capital gain, if any, are normally declared and paid annually, but the fund may make distributions on a more frequent basis to comply with the distribution requirements of the Internal Revenue Code of 1986, as amended (the “Code”).To the extent that net realized capital gain, can be offset by capital loss carryovers, it is the policy of the fund not to distribute such gain. Income and capital gain distributions are determined in accordance with income tax regulations, which may differ from U.S. generally accepted accounting principles.
On March 31, 2005, the Board of Directors declared a cash dividend of $.047 per share from undistributed investment income-net, payable on April 1, 2005 (ex-dividend date), to shareholders of record as of the close of business on March 31, 2005.
(f) Federal income taxes: It is the policy of the fund to continue to qualify as a regulated investment company, if such qualification is in the best interests of its shareholders, by complying with the applicable provisions of the Code and to make distributions of taxable income sufficient to relieve it from substantially all federal income and excise taxes.
At March 31, 2005, the components of accumulated earnings on a tax basis were as follows: undistributed ordinary income $5,482,758, accumulated capital losses $34,586,759 and unrealized depreciation $6,313,218.
The accumulated capital loss carryover is available to be applied against future net securities profits, if any, realized subsequent to March 31, 2005. If not applied, $13,098,116 of the carryover expires in fiscal 2008, $10,726,778 expires in fiscal 2010, $2,321,537 expires in fiscal 2011 and $8,440,328 expires in fiscal 2013.
The tax character of distributions paid to shareholders during the fiscal periods ended March 31, 2005 and March 31, 2004 were as follows: ordinary income $18,807,125 and $21,648,632, respectively.
During the period ended March 31, 2005, as a result of permanent book to tax differences primarily due to the tax treatment for amortization of premiums, paydown gains and losses on mortgage backed securities, treasury inflation protected securities and foreign currency transactions, the fund increased accumulated undistributed investment income-net by $4,613,181, decreased accumulated net realized gain (loss) on investments by $4,925,529, and increased paid-in capital by $312,348. Net assets were not affected by this reclassification.
NOTE 2—Bank Lines of Credit:
|
The fund may borrow up to $20 million for leveraging purposes under a short-term unsecured line of credit and participates with other Dreyfus-managed funds in a $100 million unsecured line of credit primarily to be utilized for temporary or emergency purposes, including the financing of redemptions. Interest is charged to the fund based on prevailing market rates in effect at the time of borrowings.
The average daily amount of borrowings outstanding under the leveraging arrangement during the period ended March 31, 2005, was approximately $1,065,000, with a related weighted average annualized interest rate of 2.19% ..
| NOTE 3—Management Fee and Other Transactions With |
| Affiliates: |
(a) Pursuant to a management agreement (“Agreement”) with the Manager, the management fee is computed at the annual rate of .65 of 1% of the value of the fund’s average daily net assets and is payable monthly. The Agreement provides that if in any full fiscal year the aggregate expenses of the fund, exclusive of taxes, interest on borrowings, brokerage commissions and extraordinary expenses, exceed 1 1 / 2% of the value of the fund’s average daily net assets, the fund may deduct from the payments to be made to the Manager, or the Manager will bear, the amount of such excess expense.The Manager has undertaken
NOTES TO FINANCIAL STATEMENTS (continued)
|
from January 1, 2005 through July 31, 2005 to waive receipt of .10% of 1% of the value of the fund’s average daily net assets.The reduction in management fee, pursuant to the undertaking, amounted to $100,380 during the period ended March 31, 2005.
(b) Under the Shareholder Services Plan, the fund reimburses the Distributor an amount not to exceed an annual rate of .25 of 1% of the value of the fund’s average daily net assets for certain allocated expenses of providing personal services and/or maintaining shareholder accounts.The services provided may include personal services relating to shareholder accounts, such as answering shareholder inquiries regarding the fund and providing reports and other information, and services related to the maintenance of shareholder accounts. During the period ended March 31, 2005, the fund was charged $260,376 pursuant to the Shareholder Services Plan.
The fund compensates Dreyfus Transfer, Inc., a wholly-owned subsidiary of the Manager, under a transfer agency agreement for providing personnel and facilities to perform transfer agency services for the fund. During the period ended March 31, 2005, the fund was charged $193,694 pursuant to the transfer agency agreement.
The fund compensates Mellon Bank, N.A., an affiliate of the Manager, under a custody agreement for providing custodial services for the fund. During the period ended March 31, 2005, the fund was charged $110,591 pursuant to the custody agreement.
The components of Due to The Dreyfus Corporation and affiliates in the Statement of Assets and Liabilities consist of: management fees $215,350, custodian fees $21,448 and transfer agency per account fees $39,664, which are offset against an expense reimbursement currently in effect in the amount of $33,047.
(c) Each Board member also serves as a Board member of other funds within the Dreyfus complex. Annual retainer fees and attendance fees are allocated to each fund based on net assets.
(d) Pursuant to an exemptive order from the Securities and Exchange Commission, the fund may invest its available cash balances in affiliated money market mutual funds. Management fees of the underlying money market mutual funds have been waived by the Manager.
NOTE 4—Securities Transactions:
The aggregate amount of purchases and sales (including paydowns) of investment securities, excluding short-term securities, financial futures, options transactions, forward currency exchange contracts and swap transactions during the period ended March 31, 2005, amounted to $2,883,137,851 and $3,014,631,088, of which $279,960,611 in purchases and $280,342,613 in sales were from dollar roll transactions.
A mortgage dollar roll transaction involves a sale by the fund of mortgage related securities that it holds with an agreement by the fund to repurchase similar securities at an agreed upon price and date. The securities purchased will bear the same interest rate as those sold, but generally will be collateralized by pools of mortgages with different prepayment histories than those securities sold.
The fund may invest in financial futures contracts in order to gain exposure to or protect against changes in the market.The fund is exposed to market risk as a result of changes in the value of the underlying financial instruments. Investments in financial futures require the fund to “mark to market” on a daily basis, which reflects the change in the market value of the contracts at the close of each day’s trading.Typically, variation margin payments are received or made to reflect daily unrealized gains or losses. When the contracts are closed, the fund recognizes a realized gain or loss. These investments require initial margin deposits with a broker, which consist of cash or cash equivalents.The amount of these deposits is determined by the exchange or Board of Trade on which the contract is traded and is subject to change. Contracts open at March 31, 2005, are set forth in the Statement of Financial Futures.
NOTES TO FINANCIAL STATEMENTS (continued)
|
The following summarizes the fund’s call/put options written for the period ended March 31, 2005:
| | | Face Amount | | | | Options Terminated |
| | | | | |
|
| | | Covered by | | Premiums | | | | Net Realized |
| Options Written: | | Contracts ($) | | Received ($) | | Cost ($) | | Gain (Loss) ($) |
| |
| |
| |
| |
|
| Contracts outstanding | | | | | | | | |
| March 31, 2004 | | — | | — | | | | |
| Contracts written | | 75,615,000 | | 811,360 | | | | |
| Contracts terminated: | | | | | | | | |
| Contracts closed | | 49,215,000 | | 623,420 | | 970,055 | | (346,635) |
| Contracts expired | | 10,020,000 | | 87,576 | | — | | 87,576 |
| Contracts outstanding | | | | | | |
| March 31, 2005 | | 16,380,000 | | 100,364 | | | | |
The fund may purchase and write (sell) put and call options in order to gain exposure to or to protect against changes in the market.
As a writer of call options, the fund receives a premium at the outset and then bears the market risk of unfavorable changes in the price of the financial instrument underlying the option. Generally, the fund would incur a gain, to the extent of the premium, if the price of the underlying financial instrument decreases between the date the option is written and the date on which the option is terminated. Generally, the fund would realize a loss, if the price of the financial instrument increases between those dates.
As a writer of put options, the fund receives a premium at the outset and then bears the market risk of unfavorable changes in the price of the financial instrument underlying the option. Generally, the fund would incur a gain, to the extent of the premium, if the price of the underlying financial instrument increases between the date the option is written and the date on which the option is terminated. Generally, the fund would realize a loss, if the price of the financial instrument decreases between those dates.
The fund enters into forward currency exchange contracts in order to hedge its exposure to changes in foreign currency exchange rates on its foreign portfolio holdings and to settle foreign currency transac-tions.When executing forward currency exchange contracts, the fund is obligated to buy or sell a foreign currency at a specified rate on a
certain date in the future. With respect to sales of forward currency exchange contracts, the fund would incur a loss if the value of the contract increases between the date the forward contract is opened and the date the forward contract is closed.The fund realizes a gain if the value of the contract decreases between those dates. With respect to purchases of forward currency exchange contracts, the fund would incur a loss if the value of the contract decreases between the date the forward contract is opened and the date the forward contract is closed. The fund realizes a gain if the value of the contract increases between those dates. The fund is also exposed to credit risk associated with counterparty nonperformance on these forward currency exchange contracts which is typically limited to the unrealized gain on each open contract. The following summarizes open forward currency exchange contracts at March 31, 2005:
| | | Foreign | | | | | | Unrealized |
| Forward Currency | | Currency | | | | | | Appreciation |
| Exchange Contracts | | Amounts | | Cost ($) | | Value ($) | | (Depreciation) ($) |
| |
| |
| |
| |
|
| Purchases; | | | | | | | | |
| Brazilian Real, | | | | | | | | |
| expiring 8/15/2005 | | 3,530,000 | | 1,264,780 | | 1,234,266 | | (30,514) |
| | | | | Proceeds ($) | | | | |
| Sales: | | | | | | | | |
| Australian Dollar, | | | | | | | | |
| expiring 6/15/2005 | | 8,990,000 | | 7,051,846 | | 6,912,411 | | 139,435 |
| Euro, | | | | | | | | |
| expiring 4/1/2005 | | 3,455,977 | | 4,471,689 | | 4,481,020 | | (9,331) |
| Euro, | | | | | | | | |
| expiring 6/15/2005 | | 6,270,000 | | 8,425,940 | | 8,144,730 | | 281,210 |
| Total | | | | | | | | 380,800 |
The fund may enter into swap agreements to exchange the interest rate on, or return generated by, one nominal instrument for the return generated by another nominal instrument.
As of April 1, 2003, the fund has adopted the method of accounting for interim payments on swap contracts in accordance with Financial Accounting Standards Board Statement No. 133.The fund accrues for the interim payments on swap contracts on a daily basis, with the net amount recorded within unrealized appreciation (depreciation) of swap
NOTES TO FINANCIAL STATEMENTS (continued)
|
contracts in the Statement of Assets and Liabilities. Once the interim payments are settled in cash, the net amount is recorded as realized gain (loss) on swaps, in addition to realized gain (loss) recorded upon the termination of swaps contracts in the Statement of Operations. Prior to April 1, 2003, these interim payments were reflected within interest income in the Statement of Operations. Fluctuations in the value of swap contracts are recorded as a component of net change in unrealized appreciation (depreciation) on investments.
Credit default swaps involve commitments to pay a fixed interest rate in exchange for payment if a credit event affecting a third party (the referenced company) occurs. Credit events may include a failure to pay interest or principal, bankruptcy, or restructuring. For those credit default swaps in which the fund is receiving a fixed rate, the fund is providing credits protection on the underlying instrument.The maximum payouts for these contracts are limited to the notional amount of each swap.The following summarizes credit default swaps entered into by the fund at March 31, 2005:
| | | | | Unrealized |
| | | | | Appreciation |
| Notional Amount ($) | | Description | | (Depreciation) ($) |
| |
| |
|
| 2,060,000 | | Agreement with Citibank terminating | | (35,583) |
| March 20, 2015 to receive a fixed rate |
| of .53% and pay the notional amount |
| as a result of interest payment default |
| | | totaling $1,000,000 or principal payment | | |
| default of $10,000,000 on Washington |
| | | Mutual, 4%, 1/15/2009 | | |
| 2,065,000 | | Agreement with Bear Stearns terminating | | 3,068 |
| February 20, 2006 to pay a fixed rate |
| of .60% and receive the notional amount |
| as a result of interest payment default |
| | | totaling $1,000,000 or principal payment | | |
| default of $10,000,000 on Republic |
| | | of Columbia, 10.375%, 1/28/2033 | | |
| 2,065,000 | | Agreement with Bear Stearns terminating | | (54,943) |
| | | February 20, 2008 to receive a fixed rate | | |
| of 2.07% and pay the notional amount |
| as a result of interest payment default |
| | | totaling $1,000,000 or principal payment | | |
| default of $10,000,000 on Republic |
| | | of Columbia, 10.375%, 1/28/2033 | | |
| Total | | | | (87,458) |
Risks may arise upon entering into these agreements from the potential inability of the counterparties to meet the terms of the agreement and are generally limited to the amount of net payments to be received, if any, at the date of default.
At March 31, 2005, the cost of investments for federal income tax purposes was $462,908,309; accordingly, accumulated net unrealized depreciation on investments was $6,290,354, consisting of $1,082,745 gross unrealized appreciation and $7,373,099 gross unrealized depreciation.
In early 2004, two purported class and derivative actions were filed against Mellon Financial, Mellon Bank, N.A., Dreyfus, Founders Asset Management LLC, and certain directors of the Dreyfus Funds and the Dreyfus Founders Funds (together, the “Funds”) in the United States District Court for the Western District of Pennsylvania. In September 2004, plaintiffs served a Consolidated Amended Complaint (the “Amended Complaint”) on behalf of a purported class of all persons who acquired interests in any of the Funds between January 30, 1999 and November 17, 2003, and derivatively on behalf of the Funds.The Amended Complaint in the newly styled In re Dreyfus Mutual Funds Fee Litigation also named the Distributor, Premier Mutual Fund Services, Inc. and two additional Fund directors as defendants and alleges violations of the Investment Company Act of 1940, the Investment Advisers Act of 1940, the Pennsylvania Unfair Trade Practices and Consumer Protection Law and common-law claims. Plaintiffs seek to recover allegedly improper and excessive Rule 12b-1 and advisory fees allegedly charged to the Funds for marketing and distribution services. More specifically, plaintiffs claim, among other things, that 12b-1 fees and directed brokerage were improperly used to pay brokers to recommend the Funds over other funds, and that such payments were not disclosed to investors. In addition, plaintiffs assert that economies of scale and soft-dollar benefits were not passed on to the Funds. Plaintiffs further allege that 12b-1 fees were improperly charged to certain of the Funds that were closed to new investors.The
NOTES TO FINANCIAL STATEMENTS (continued)
|
Amended Complaint seeks compensatory and punitive damages, rescission of the advisory contracts, and an accounting and restitution of any unlawful fees, as well as an award of attorneys’ fees and litigation expenses. As noted, some of the claims in this litigation are asserted derivatively on behalf of the Funds that have been named as nominal defendants.With respect to such derivative claims, no relief is sought against the Funds. Dreyfus believes the allegations to be totally without merit and intends to defend the action vigorously. None of the trustees of the Trust, nor the funds, were named in the actions. Defendants filed motions to dismiss the Amended Complaint on November 12, 2004, and those motions are pending.
Additional lawsuits arising out of these circumstances and presenting similar allegations and requests for relief may be filed against the defendants in the future. Neither Dreyfus nor the Funds believe that any of the pending actions will have a material adverse effect on the Funds or Dreyfus’ ability to perform its contract with the Funds.
| REPORT OF INDEPENDENT REGISTERED |
| PUBLIC ACCOUNTING FIRM |
| | Shareholders and Board of Directors
Dreyfus A Bonds Plus, Inc.
|
We have audited the accompanying statement of assets and liabilities of Dreyfus A Bonds Plus, Inc., including the statements of investments, financial futures and options written, as of March 31, 2005, and the related statement of operations for the year then ended, the statement of changes in net assets for each of the two years in the period then ended, and financial highlights for each of the years indicated therein. These financial statements and financial highlights are the responsibility of the Fund’s management. Our responsibility is to express an opinion on these financial statements and financial highlights based on our audits.
We conducted our audits in accordance with the standards of the Public Company Accounting Oversight Board (United States).Those standards require that we plan and perform the audit to obtain reasonable assurance about whether the financial statements and financial highlights are free of material misstatement.We were not engaged to perform an audit of the Fund’s internal control over financial reporting. Our audits included consideration of internal control over financial reporting as a basis for designing audit procedures that are appropriate in the circumstances,but not for the purpose of expressing an opinion on the effectiveness of the Fund’s internal control over financial reporting.Accordingly, we express no such opinion.An audit includes examining, on a test basis, evidence supporting the amounts and disclosures in the financial statements and financial highlights, assessing the accounting principles used and significant estimates made by management, and evaluating the overall financial statement presentation. Our procedures included verification by examination of securities held by the custodian as of March 31, 2005 and confirmation of securities not held by the custodian by correspondence with others.We believe that our audits provide a reasonable basis for our opinion.
In our opinion, the financial statements and financial highlights referred to above present fairly, in all material respects, the financial position of Dreyfus A Bonds Plus, Inc. at March 31, 2005, the results of its operations for the year then ended, the changes in its net assets for each of the two years in the period then ended, and the financial highlights for each of the indicated years, in conformity with U.S. generally accepted accounting principles.
| | New York, New York
May 13, 2005
|
IMPORTANT TAX INFORMATION (Unaudited)
For federal tax purposes, the fund hereby designates .50% of the ordinary dividends paid during the fiscal year ended March 31, 2005 as qualifying for the corporate dividends received deduction. Shareholders will receive notification in January 2006 of the percentage applicable to the preparation of their 2005 income tax returns.
| INFORMATION ABOUT THE REVIEW AND APPROVAL |
| OF THE FUND’S MANAGEMENT AGREEMENT (Unaudited) |
At a meeting of the fund’s Board of Directors held on December 9,2004, the Board considered the re-approval, through its annual renewal date of July 31, 2005, of the fund’s Management Agreement, pursuant to which the Manager provides the fund with investment advisory and administrative services.The Board members who are not “interested persons” (as defined in the Act (the “Independent Directors”)) of the fund were assisted in their review by independent legal counsel and met with counsel in executive session separate from representatives of the Manager.
Analysis of Nature, Quality, and Extent of Services Provided to the Fund. The Board members received a presentation from representatives of the Manager regarding services provided to the fund and other funds in the Dreyfus complex, and discussed the nature, quality and extent of the services provided to the fund pursuant to its Management Agreement.The Manager’s representatives reviewed the fund’s distribution of accounts and the relationships the Manager has with various intermediaries and the different needs of each. The Manager’s representatives noted the diversity of distribution of the fund as well as among the funds in the Dreyfus complex, and the Manager’s corresponding need for broad, deep, and diverse resources to be able to provide ongoing shareholder services to each of the fund’s distribution channels. The Board also reviewed the number of shareholder accounts in the fund, as well as the fund’s asset size.
The Board members also considered the Manager’s research and portfolio management capabilities and that the Manager also provides oversight of day-to-day fund operations, including fund accounting and administration and assistance in meeting legal and regulatory requirements. The Board members also considered the Manager’s extensive administrative, accounting and compliance infrastructure.
Comparative Analysis of the Fund’s Performance and Management Fee and Expense Ratio. The Board members reviewed the fund’s performance and expense ratios and placed significant emphasis on comparisons to a group of comparable funds and Lipper averages, and discussed the results of the comparisons. The Board members noted the
| I N FO R M AT I O N A B O U T T H E R E V I E W | | A N D A P P R OVA L |
| O F T H E F U N D ’S M A N A G E M E N T | | A G R E E M E N T ( U n a u d i t e d ) ( c o n t i n u e d ) |
fund’s generally competitive income rankings, as well as its generally improved comparison group rankings for total return for its more recent 3-month and 6-month periods. It was noted that the fund’s total return performance was below the averages of its comparison group and Lipper category, but that the fund’s more recent 3-month and 6-month total return performance showed improvement in its rankings. The Board members noted the Manager’s current efforts in connection with a possible change in the fund’s portfolio management team.The Board members also discussed the fund’s expense ratio, noting it is lower than the average of its comparison group and its Lipper category, and that it ranks in the top half of its comparison group.They reviewed the range of management fees in the comparison group and noted that the Manager intended to implement a voluntary waiver of a portion of the fund’s management fee which would lower the fund’s expense ratio and management fee for the period in which it would be in effect.
Representatives of the Manager reviewed with the Board members the fees paid to the Manager or its affiliates by mutual funds managed by the Manager or its affiliates of which there was one, (the “Similar Fund”) and by separate accounts with similar investment objectives, policies and strategies (the “Separate Accounts” and, collectively with the Similar Fund, the “Similar Accounts”) and explained the nature of each Similar Account and the differences, from the Manager’s perspective, in management of such Similar Accounts as compared to managing and providing other servies to the fund.The Manager’s representatives also reviewed the costs associated with distribution through interme-diaries.The Board analyzed differences in fees paid to the Manager and discussed the relationship of the advisory fees paid in light of the Manager’s performance and the services provided. It was noted that the Similar Fund had the same management fee as the fee borne by the fund, prior to giving effect to the proposed voluntary waiver. The Board members considered the relevance of the fee information provided for the Similar Accounts managed by the Manager to evaluate
the appropriateness and reasonableness of the fund’s advisory fees.The Board acknowledged that differences in fees paid by the Separate Accounts seemed to be consistent with the services provided, as well as the “wrap fee” payable by the customer to the wrap fee sponsor in addition to all fund-level fees and expenses.
Analysis of Profitability and Economies of Scale. The Manager’s representatives reviewed the dollar amount of expenses allocated and profit received by the Manager and the method used to determine such expenses and profit.The Board members evaluated the analysis in light of the relevant circumstances for the fund, including the recent decline in assets and the extent to which economies of scale would be realized as the fund grows and whether fee levels reflect these economies of scale for the benefit of fund investors.The Board members also considered potential benefits to the Manager from acting as investment adviser and noted that there were no soft dollar arrangements with respect to trading the fund’s portfolio.
It was noted that the Board members should consider the Manager’s profitability with respect to the fund as part of their evaluation of whether the fee under the Management Agreement bears a reasonable relationship to the mix of services provided by the Manager, including the nature, quality and extent of such services and that a discussion of economies of scale is predicated on increasing assets and that, if a fund’s assets had been decreasing, the possibility that the Manager may have realized any economies of scale would be less. It also was noted that the profitability percentage for managing the fund was within ranges determined by appropriate court cases to be reasonable given the services rendered and given the fund’s overall performance and generally superior service levels provided. It also was noted that the proposed undertaking to waive a portion of the fund’s management fee had the potential to reduce the profitability for managing the fund over the period of the undertaking.
| I N FO R M AT I O N A B O U T T H E R E V I E W | | A N D A P P R OVA L |
| O F T H E F U N D ’S M A N A G E M E N T | | A G R E E M E N T ( U n a u d i t e d ) ( c o n t i n u e d ) |
At the conclusion of these discussions, each of the Independent Directors expressed the opinion that he or she had been furnished with sufficient information to make an informed business decision with respect to continuation of the fund’s Management Agreement. Based on their discussions and considerations as described above, the Board made the following conclusions and determinations.
- The Board concluded that the nature, quality, and extent of the services provided by the Manager are adequate and appropriate.
- The Board generally was satisfied with the fund’s overall income performance and the recent improvement in short-term total return performance, as well as the Manager’s current efforts in connection with a possible change in the fund’s portfolio man- agement team (which subsequently occurred in January 2005).
- The Board concluded that the fund’s fee paid to the Manager was reasonable in light of comparative performance and expense and advisory fee information, including the Manager’s proposal to implement a partial fee waiver, costs of the services provided and profits to be realized and benefits derived or to be derived by the Manager from its relationship with the fund.
- The Board recognized that economies of scale may be realized as the fund’s assets increase and determined that, to the extent that material economies of scale had not been shared with the fund, the Board would seek to do so.
The Board members considered these conclusions and determinations, along with information received on a routine and regular basis throughout the year, and, without any one factor being dispositive, the Board determined that re-approval of the fund’s Management Agreement was in the best interests of the fund and its shareholders.
BOARD MEMBERS INFORMATION (Unaudited)
| Joseph S. DiMartino (61) |
| Chairman of the Board (1995) |
| Principal Occupation During Past 5 Years: |
| • Corporate Director and Trustee |
Other Board Memberships and Affiliations:
- The Muscular Dystrophy Association, Director
- Levcor International, Inc., an apparel fabric processor, Director
- Century Business Services, Inc., a provider of outsourcing functions for small and medium size companies, Director
- The Newark Group, a provider of a national market of paper recovery facilities, paperboard mills and paperboard converting plants, Director
- Azimuth Trust, an institutional asset management firm, Member of Board of Managers and Advisory Board
No. of Portfolios for which Board Member Serves: 193
| | David P. Feldman (65)
Board Member (1994)
|
Principal Occupation During Past 5 Years:
• Corporate Director and Trustee
Other Board Memberships and Affiliations:
- BBH Mutual Funds Group (11 funds), Director
- The Jeffrey Company, a private investment company, Director
- QMED, a medical device company, Director
| No. of Portfolios for which Board Member Serves: 58 |
| ——————— |
| James F. Henry (74) |
| Board Member (1976) |
Principal Occupation During Past 5 Years:
- President, CPR Institute for Dispute Resolution, a non-profit organization principally engaged in the development of alternatives to business litigation (Retired 2003)
| No. of Portfolios for which Board Member Serves: 22 |
| ——————— |
| Rosalind Gersten Jacobs (79) |
| Board Member (1982) |
Principal Occupation During Past 5 Years:
• Merchandise and marketing consultant
No. of Portfolios for which Board Member Serves: 33
BOARD MEMBERS INFORMATION (Unaudited) (continued)
| | Dr. Paul A. Marks (78)
Board Member (1979)
|
| | Principal Occupation During Past 5 Years:
|
- President and Chief Executive Officer of Memorial Sloan-Kettering Cancer Center (Retired 1999)
| | Other Board Memberships and Affiliations:
|
- Pfizer, Inc., a pharmaceutical company, Director-Emeritus
- Atom Pharm, Director
- Lazard Freres & Company, LLC, Senior Adviser
- Merck, Consultant
| No. of Portfolios for which Board Member Serves: 22 |
| ——————— |
| Dr. Martin Peretz (65) |
| Board Member (1976) |
| | Principal Occupation During Past 5 Years:
|
- Editor-in-Chief of The New Republic Magazine
- Lecturer in Social Studies at Harvard University (1965-2001)
- Co-Chairman of TheStreet.com, a financial daily on the web
| | Other Board Memberships and Affiliations:
|
- Academy for Liberal Education, an accrediting agency for colleges and universities certified by the U.S. Department of Education, Director
- Digital Learning Group, LLC, an online publisher of college textbooks, Director
- Harvard Center for Blood Research,Trustee
- Bard College,Trustee
- YIVO Institute for Jewish Research,Trustee
| No. of Portfolios for which Board Member Serves: 22 |
| ——————— |
| Bert W. Wasserman (72) |
| Board Member (1993) |
| Principal Occupation During Past 5 Years: |
| • Financial Consultant |
| | Other Board Memberships and Affiliations:
• Lillian Vernon Corporation, Director
|
| No. of Portfolios for which Board Member Serves: 22 |
| ——————— |
Once elected all Board Members serve for an indefinite term.The address of the Board Members and Officers is in c/o The Dreyfus Corporation, 200 Park Avenue, New York, New York 10166. Additional information about the Board Members is available in the fund’s Statement of Additional Information which can be obtained from Dreyfus free of charge by calling this toll free number: 1-800-554-4611.
| | John M. Fraser, Jr., Emeritus Board Member
Irving Kristol, Emeritus Board Member
|
OFFICERS OF THE FUND (Unaudited)
| STEPHEN E. CANTER, President since |
| March 2000. |
Chairman of the Board, Chief Executive Officer and Chief Operating Officer of the Manager, and an officer of 90 investment companies (comprised of 185 portfolios) managed by the Manager. Mr. Canter also is a Board member and, where applicable, an Executive Committee Member of the other investment management subsidiaries of Mellon Financial Corporation, each of which is an affiliate of the Manager. He is 59 years old and has been an employee of the Manager since May 1995.
| STEPHEN R. BYERS, Executive Vice |
| President since November 2002. |
Chief Investment Officer,Vice Chairman and a director of the Manager, and an officer of 90 investment companies (comprised of 185 portfolios) managed by the Manager. Mr. Byers also is an officer, director or an Executive Committee Member of certain other investment management subsidiaries of Mellon Financial Corporation, each of which is an affiliate of the Manager. He is 51 years old and has been an employee of the Manager since January 2000.
| MARK N. JACOBS, Vice President since |
| March 2000. |
Executive Vice President, Secretary and General Counsel of the Manager, and an officer of 91investment companies (comprised of 201 portfolios) managed by the Manager. He is 58 years old and has been an employee of the Manager since June 1977.
| MICHAEL A. ROSENBERG, Secretary since |
| March 2000. |
Associate General Counsel of the Manager, and an officer of 88 investment companies (comprised of 194 portfolios) managed by the Manager. He is 45 years old and has been an employee of the Manager since October 1991.
| ROBERT R. MULLERY, Assistant Secretary |
| since March 2000. |
Associate General Counsel of the Manager, and an officer of 24 investment companies (comprised of 58 portfolios) managed by the Manager. He is 53 years old and has been an employee of the Manager since May 1986.
| STEVEN F. NEWMAN, Assistant Secretary |
| since March 2000. |
Associate General Counsel and Assistant Secretary of the Manager, and an officer of 91 investment companies (comprised of 201 portfolios) managed by the Manager. He is 55 years old and has been an employee of the Manager since July 1980.
| JAMES WINDELS, Treasurer since |
| November 2001. |
Director – Mutual Fund Accounting of the Manager, and an officer of 91 investment companies (comprised of 201 portfolios) managed by the Manager. He is 46 years old and has been an employee of the Manager since April 1985.
| ERIK D. NAVILOFF, Assistant Treasurer |
| since December 2002. |
Senior Accounting Manager – Taxable Fixed Income Funds of the Manager, and an officer of 18 investment companies (comprised of 74 portfolios) managed by the Manager. He is 36 years old and has been an employee of the Manager since November 1992.
| KENNETH J. SANDGREN, Assistant |
| Treasurer since November 2001. |
Mutual Funds Tax Director of the Manager, and an officer of 91 investment companies (comprised of 201 portfolios) managed by the Manager. He is 50 years old and has been an employee of the Manager since June 1993.
OFFICERS OF THE FUND (Unaudited) (continued)
| JOSEPH W. CONNOLLY, Chief Compliance |
| Officer since October 2004. |
Chief Compliance Officer of the Manager and The Dreyfus Family of Funds (91 investment companies, comprising 201 portfolios). From November 2001 through March 2004, Mr. Connolly was first Vice-President, Mutual Fund Servicing for Mellon Global Securities Services. In that capacity, Mr. Connolly was responsible for managing Mellon's Custody, Fund Accounting and Fund Administration services to third-party mutual fund clients. He is 47 years old and has served in various capacities with the Manager since 1980, including manager of the firm's Fund Accounting Department from 1997 through October 2001.
| WILLIAM GERMENIS, Anti-Money |
| Laundering Compliance Officer since |
| September 2002. |
Vice President and Anti-Money Laundering Compliance Officer of the Distributor, and the Anti-Money Laundering Compliance Officer of 88 investment companies (comprised of 198 portfolios) managed by the Manager. He is 34 years old and has been an employee of the Distributor since October 1998.
| For More | | Information |
| |
|
| |
| Dreyfus | | Transfer Agent & |
| A Bonds Plus, Inc. | | Dividend Disbursing Agent |
| 200 Park Avenue | | Dreyfus Transfer, Inc. |
| New York, NY 10166 | | 200 Park Avenue |
| Manager | | New York, NY 10166 |
| The Dreyfus Corporation | | Distributor |
| 200 Park Avenue | | Dreyfus Service Corporation |
| New York, NY 10166 | | 200 Park Avenue |
| Custodian | | New York, NY 10166 |
| Mellon Bank, N.A. | | |
| One Mellon Bank Center | | |
| Pittsburgh, PA 15258 | | |
| |
|
| |
| |
| Telephone 1-800-645-6561 | | |
Mail The Dreyfus Family of Funds, 144 Glenn Curtiss Boulevard, Uniondale, NY 11556-0144 E-mail Send your request to info@dreyfus.com Internet Information can be viewed online or downloaded at: http://www.dreyfus.com
The fund files its complete schedule of portfolio holdings with the Securities and Exchange Commission (“SEC”) for the first and third quarters of each fiscal year on Form N-Q. The fund’s Forms N-Q are available on the SEC’s website at http://www.sec.gov and may be reviewed and copied at the SEC’s Public Reference Room in Washington, DC. Information on the operation of the Public Reference Room may be obtained by calling 1-800-SEC-0330.
A description of the policies and procedures that the fund uses to determine how to vote proxies relating to portfolio securities, and information regarding how the fund voted these proxies for the 12-month period ended June 30, 2004, is available through the fund’s website at http://www.dreyfus.com and on the SEC’s website at http://www.sec.gov. The description of the policies and procedures is also available without charge, upon request, by calling 1-800-645-6561.
© 2005 Dreyfus Service Corporation

The Registrant has adopted a code of ethics that applies to the Registrant's principal executive officer, principal financial officer, principal accounting officer or controller, or persons performing similar functions. There have been no amendments to, or waivers in connection with, the Code of Ethics during the period covered by this Report.
| Item 3. | | Audit Committee Financial Expert. |
The Registrant's Board has determined that Bert W. Wasserman a member of the Audit Committee of the Board, is an audit committee financial expert as defined by the Securities and Exchange Commission (the "SEC"). Bert W. Wasserman is "independent" as defined by the SEC for purposes of audit committee financial expert determinations.
| Item 4. | | Principal Accountant Fees and Services |
(a) Audit Fees. The aggregate fees billed for each of the last two fiscal years (the "Reporting Periods") for professional services rendered by the Registrant's principal accountant (the "Auditor") for the audit of the Registrant's annual financial statements, or services that are normally provided by the Auditor in connection with the statutory and regulatory filings or engagements for the Reporting Periods, were $ 27,825 in 2004 and $ 30,163 in 2005.
(b) Audit-Related Fees. The aggregate fees billed in the Reporting Periods for assurance and related services by the Auditor that are reasonably related to the performance of the audit of the Registrant's financial statements and are not reported under paragraph (a) of this Item 4 were $4,500 in 2004 and $ 4,725 in 2005. These services consisted of security counts required by Rule 17f-2 under the Investment Company Act of 1940.
The aggregate fees billed in the Reporting Periods for non-audit assurance and related services by the Auditor to the Registrant's investment adviser (not including any sub-investment adviser whose role is primarily portfolio management and is subcontracted with or overseen by another investment adviser), and any entity controlling, controlled by or under common control with the investment adviser that provides ongoing services to the Registrant ("Service Affiliates"), that were reasonably related to the performance of the annual audit of the Service Affiliate, which required pre-approval by the Audit Committee were $288,500 in 2004 and $0 in 2005.
Note: For the second paragraph in each of (b) through (d) of this Item 4, certain of such services were not pre-approved prior to May 6, 2003, when such services were required to be pre-approved. On and after May 6, 2003, 100% of all services provided by the Auditor were pre-approved as required. For comparative purposes, the fees shown assume that all such services were pre-approved, including services that were not pre-approved prior to the compliance date of the pre-approval requirement.
(c) Tax Fees. The aggregate fees billed in the Reporting Periods for professional services rendered by the Auditor for tax compliance, tax advice and tax planning ("Tax Services") were $5,002 in 2004 and $2,805 in 2005. These services consisted of (i) review or preparation of U.S. federal, state, local and excise tax returns; (ii) U.S. federal, state and local tax planning, advice and assistance regarding statutory, regulatory or
| -2- |
| P:\Edgar Filings\Pending\084\NCSR-ANN-084-5-05\formncsrannual084.DOC |
administrative developments, (iii) tax advice regarding tax qualification matters and/or treatment of various financial instruments held or proposed to be acquired or held, and (iv) determination of Passive Foreign Investment Companies.
The aggregate fees billed in the Reporting Periods for Tax Services by the Auditor to Service Affiliates which required pre-approval by the Audit Committee were $0 in 2004 and $0 in 2005.
(d) All Other Fees. The aggregate fees billed in the Reporting Periods for products and services provided by the Auditor, other than the services reported in paragraphs (a) through (c) of this Item, were $688 in 2004 and $537 in 2005. These services consisted of a review of the Registrant's anti-money laundering program.
The aggregate fees billed in the Reporting Periods for Non-Audit Services by the Auditor to Service Affiliates, other than the services reported in paragraphs (b) through (c) of this Item, which required pre-approval by the Audit Committee were $0 in 2004 and $0 in 2005.
Audit Committee Pre-Approval Policies and Procedures. The Registrant's Audit Committee has established policies and procedures (the "Policy") for pre-approval (within specified fee limits) of the Auditor's engagements for non-audit services to the Registrant and Service Affiliates without specific case-by-case consideration. Pre-approval considerations include whether the proposed services are compatible with maintaining the Auditor's independence. Pre-approvals pursuant to the Policy are considered annually.
Non-Audit Fees. The aggregate non-audit fees billed by the Auditor for services rendered to the Registrant, and rendered to Service Affiliates, for the Reporting Periods were $639,435 in 2004 and $605,451 in 2005.
Auditor Independence. The Registrant's Audit Committee has considered whether the provision of non-audit services that were rendered to Service Affiliates which were not pre-approved (not requiring pre-approval) is compatible with maintaining the Auditor's independence.
| Item 5. | | Audit Committee of Listed Registrants. |
| | | Not applicable. | | [CLOSED-END FUNDS ONLY] |
| Item 6. | | Schedule of Investments. |
| | | Not applicable. | | |
| Item 7. | | Disclosure of Proxy Voting Policies and Procedures for Closed-End Management |
| | | Investment Companies. |
| | | Not applicable. | | [CLOSED-END FUNDS ONLY] |
| Item 8. | | Portfolio Managers of Closed-End Management Investment Companies. |
| | | Not applicable. | | [CLOSED-END FUNDS ONLY, beginning with reports for periods ended |
| | | | | on and after December 31, 2005] |
| Item 9. | | Purchases of Equity Securities by Closed-End Management Investment Companies and |
| | | Affiliated Purchasers. |
| | | Not applicable. | | [CLOSED-END FUNDS ONLY] |
| Item 10. | | Submission of Matters to a Vote of Security Holders. |
| -3- |
| P:\Edgar Filings\Pending\084\NCSR-ANN-084-5-05\formncsrannual084.DOC |
The Registrant has a Nominating Committee (the "Committee"), which is responsible for selecting and nominating persons for election or appointment by the Registrant's Board as Board members. The Committee has adopted a Nominating Committee Charter (the "Charter"). Pursuant to the Charter, the Committee will consider recommendations for nominees from shareholders submitted to the Secretary of the Registrant, c/o The Dreyfus Corporation Legal Department, 200 Park Avenue, 8th Floor West, New York, New York 10166. A nomination submission must include information regarding the recommended nominee as specified in the Charter. This information includes all information relating to a recommended nominee that is required to be disclosed in solicitations or proxy statements for the election of Board members, as well as information sufficient to evaluate the factors to be considered by the Committee, including character and integrity, business and professional experience, and whether the person has the ability to apply sound and independent business judgment and would act in the interests of the Registrant and its shareholders.
Nomination submissions are required to be accompanied by a written consent of the individual to stand for election if nominated by the Board and to serve if elected by the shareholders, and such additional information must be provided regarding the recommended nominee as reasonably requested by the Committee.
| Item 11. | | Controls and Procedures. |
(a) The Registrant's principal executive and principal financial officers have concluded, based on their evaluation of the Registrant's disclosure controls and procedures as of a date within 90 days of the filing date of this report, that the Registrant's disclosure controls and procedures are reasonably designed to ensure that information required to be disclosed by the Registrant on Form N-CSR is recorded, processed, summarized and reported within the required time periods and that information required to be disclosed by the Registrant in the reports that it files or submits on Form N-CSR is accumulated and communicated to the Registrant's management, including its principal executive and principal financial officers, as appropriate to allow timely decisions regarding required disclosure.
(b) There were no changes to the Registrant's internal control over financial reporting that occurred during the second fiscal quarter of the period covered by this report that have materially affected, or are reasonably likely to materially affect, the Registrant's internal control over financial reporting.
(a)(1) Code of ethics referred to in Item 2.
(a)(2) Certifications of principal executive and principal financial officers as required by Rule 30a-2(a) under the Investment Company Act of 1940.
(a)(3) Not applicable.
(b) Certification of principal executive and principal financial officers as required by Rule 30a-2(b) under the Investment Company Act of 1940.
| -4- |
| P:\Edgar Filings\Pending\084\NCSR-ANN-084-5-05\formncsrannual084.DOC |
Pursuant to the requirements of the Securities Exchange Act of 1934 and the Investment Company Act of 1940, the Registrant has duly caused this Report to be signed on its behalf by the undersigned, thereunto duly authorized.
Dreyfus A Bonds Plus, Inc.
| By: | | /s/ Stephen E. Canter |
| | | Stephen E. Canter |
| | | President |
| |
| Date: | | June 1, 2005 |
Pursuant to the requirements of the Securities Exchange Act of 1934 and the Investment Company Act of 1940, this Report has been signed below by the following persons on behalf of the Registrant and in the capacities and on the dates indicated.
| By: | | /s/ Stephen E. Canter |
| | | Stephen E. Canter |
| | | Chief Executive Officer |
| |
| Date: | | June 1, 2005 |
| |
| By: | | /s/ James Windels |
| James Windels |
| | | Chief Financial Officer |
| |
| Date: | | June 1, 2005 |
| | | EXHIBIT INDEX |
| (a)(1) | | Code of ethics referred to in Item 2. |
| (a)(2) | | Certifications of principal executive and principal financial officers as required by Rule 30a- |
| 2(a) under the Investment Company Act of 1940. (EX-99.CERT) |
| (b) | | Certification of principal executive and principal financial officers as required by Rule 30a- |
| 2(b) under the Investment Company Act of 1940. (EX-99.906CERT) |
| -5- |
| P:\Edgar Filings\Pending\084\NCSR-ANN-084-5-05\formncsrannual084.DOC |