UNITED STATES
SECURITIES AND EXCHANGE COMMISSION
Washington, D.C. 20549
FORM N-CSR
CERTIFIED SHAREHOLDER REPORT OF REGISTERED MANAGEMENT
INVESTMENT COMPANIES
Investment Company Act file number 811-2410
Dreyfus Liquid Assets, Inc.
(Exact name of Registrant as specified in charter)
c/o The Dreyfus Corporation
200 Park Avenue
New York, New York 10166
(Address of principal executive offices) (Zip code)
Janette E. Farragher, Esq.
200 Park Avenue
New York, New York 10166
(Name and address of agent for service)
Registrant's telephone number, including area code: (212) 922-6000
Date of fiscal year end: 12/31
Date of reporting period: 12/31/2012
1
FORM N-CSR
Item 1. Reports to Stockholders.
2
Dreyfus
Liquid Assets, Inc.
ANNUAL REPORT December 31, 2012

Save time. Save paper. View your next shareholder report online as soon as it’s available. Log into www.dreyfus.com and sign up for Dreyfus eCommunications. It’s simple and only takes a few minutes.
The views expressed in this report reflect those of the portfolio manager only through the end of the period covered and do not necessarily represent the views of Dreyfus or any other person in the Dreyfus organization. Any such views are subject to change at any time based upon market or other conditions and Dreyfus disclaims any responsibility to update such views.These views may not be relied on as investment advice and, because investment decisions for a Dreyfus fund are based on numerous factors, may not be relied on as an indication of trading intent on behalf of any Dreyfus fund.
|
| Not FDIC-Insured • Not Bank-Guaranteed • May Lose Value |
| | Contents |
| | THE FUND |
| 2 | A Letter from the President |
| 3 | Discussion of Fund Performance |
| 6 | Understanding Your Fund’s Expenses |
| 6 | Comparing Your Fund’s Expenses With Those of Other Funds |
| 7 | Statement of Investments |
| 9 | Statement of Assets and Liabilities |
| 10 | Statement of Operations |
| 11 | Statement of Changes in Net Assets |
| 12 | Financial Highlights |
| 14 | Notes to Financial Statements |
| 22 | Report of Independent Registered Public Accounting Firm |
| 23 | Important Tax Information |
| 24 | Information About the Renewal of the Fund’s Management Agreement |
| 29 | Board Members Information |
| 31 | Officers of the Fund |
| | FOR MORE INFORMATION |
| | Back Cover |
Dreyfus
Liquid Assets, Inc.
The Fund
A LETTER FROM THE PRESIDENT
Dear Shareholder:
We are pleased to present this annual report for Dreyfus Liquid Assets, Inc., covering the 12-month period from January 1, 2012, through December 31, 2012. For information about how the fund performed during the reporting period, as well as general market perspectives, we provide a Discussion of Fund Performance on the pages that follow.
Despite pronounced weakness during the spring of 2012, most financial markets advanced over the reporting period as investors responded to encouraging macroeconomic developments throughout the world. Employment gains in the United States, credible measures to prevent a more severe banking crisis in Europe, and the likelihood of a “soft landing” for China’s economy buoyed investor sentiment, as did aggressively accommodative monetary policies from central banks in the United States, Europe, Japan and China. However, as has been the case since December 2008, short-term interest rates and money market yields remained near historical lows in the United States.
We currently expect the U.S. and global economies to be modestly stronger in 2013, especially during the second half of the year.The U.S. economy seems likely to benefit from greater certainty regarding U.S. tax and fiscal policies, the resumption of postponed spending by businesses, and a continued housing recovery. We encourage you to discuss the implications of our economic analysis with your financial advisor, who can help you align your investments with the year’s challenges and opportunities.
Thank you for your continued confidence and support.
Sincerely,

J. Charles Cardona
President
The Dreyfus Corporation
January 15, 2013
2
DISCUSSION OF FUND PERFORMANCE
For the period of January 1, 2012, through December 31, 2012, as provided by Patricia A. Larkin, Senior Portfolio Manager
Fund and Market Performance Overview
For the 12-month period ended December 31, 2012, Dreyfus Liquid Assets’ Class 1 shares produced an annualized yield of 0.00%, and its Class 2 shares produced an annualized yield of 0.04%. Taking into account the effects of compounding, the fund’s Class 1 and Class 2 shares provided annualized effective yields of 0.00% and 0.04%, respectively, for the same period.1
Yields of money market instruments remained near historical lows throughout the reporting period as the Federal Reserve Board (the “Fed”) left short-term interest rates unchanged despite evidence of more robust economic growth.
The Fund’s Investment Approach
The fund seeks as high a level of current income as is consistent with the preservation of capital.To pursue this goal, the fund invests in a diversified portfolio of high-quality, short-term debt securities, including securities issued or guaranteed by the U.S. government or its agencies or instrumentalities, certificates of deposit, time deposits, bankers’ acceptances, and other short-term securities issued by U.S. banks and foreign branches of U.S. banks, repurchase agreements, including tri-party repurchase agreements, asset-backed securities, commercial paper and other short-term corporate obligations of U.S. issuers.
Normally, the fund invests at least 25% of its net assets in bank obligations.
U.S. Economic Recovery Gained Momentum in 2012
The year 2012 began in the midst of a recovery from steep market declines stemming from adverse macroeconomic developments in the United States, Europe, and China in 2011. By January, investor sentiment was bolstered by better U.S. economic data, including accelerating manufacturing activity, a declining unemployment rate, and improving consumer confidence.
DISCUSSION OF FUND PERFORMANCE (continued)
The recovery appeared to strengthen when the unemployment rate slid to 8.3% with a gain of 243,000 jobs in January and another 233,000 jobs in February. Despite a decrease to 120,000 new jobs created in March, the unemployment rate inched lower to 8.2%. However, due mainly to cuts in government spending, GDP grew at only a 2.0% annualized rate over the first quarter of 2012.
The economic expansion appeared to moderate in April.The unemployment rate fell to 8.1%, but only 77,000 jobs were added. May brought another month of subpar job creation and an uptick in the unemployment rate to 8.2%.The manufacturing sector contracted in June for the first time in three years, but U.S. housing prices climbed for the first time in seven months. For the second quarter of 2012, U.S. economic growth slowed to a 1.3% annualized rate.
The economy added 181,000 jobs in July, but the unemployment rate rose to 8.3% as more people entered the workforce.August saw higher sales and prices in U.S. housing markets, an 8.1% unemployment rate, and higher personal income and expenditures. Corporate earnings proved healthier than many analysts expected. The economic recovery seemed to gain traction in September with the addition of 148,000 new jobs and a sharp drop in the unemployment rate to 7.8%, its lowest level since January 2009. The manufacturing sector rebounded after three months of modest declines, and the service sector posted its 33rd consecutive month of expansion. In the housing market, sales prices reached five-year highs. It later was announced that the U.S. economy grew at a 3.1% annualized rate during the third quarter of 2012.
Manufacturing activity increased at a faster rate in October than in September, and home prices posted modest gains. In November, the unemployment rate remained steady while 146,000 new jobs were added. Home prices rose for the sixth straight month, and pending home sales reached their highest level in more than five years. However, manufacturing activity contracted slightly.
December brought more positive economic news, including the addition of 164,000 jobs to the labor force and a mild rebound in manufacturing activity. However, despite gains in real personal income, real personal consumption and personal savings in November, consumer confidence declined somewhat in December. In addition, retailers reported relatively sluggish sales during the 2012 holiday season.
4
Focusing on Quality and Liquidity
Money market yields remained near zero percent throughout the year, and yield differences along the market’s maturity spectrum stayed relatively narrow. Therefore, we maintained the fund’s weighted average maturity in a position that was roughly in line with market averages, and we continued to focus on well-established issuers that historically have demonstrated good liquidity characteristics, including banks in Australia, Canada and Japan, but relatively few in Europe.
The Fed has maintained an aggressively accommodative monetary policy, including an open-ended quantitative easing program and a stated intention to leave short-term interest rates near current levels until mid-2015.Therefore, as we have for some time, we intend to maintain the fund’s focus on quality and liquidity.
January 15, 2013
An investment in the fund is not insured or guaranteed by the FDIC or any other government agency. Although the fund seeks to preserve the value of your investment at $1.00 per share, it is possible to lose money by investing in the fund.
Short-term corporate and asset-backed securities holdings, while rated in the highest rating category by one or more NRSRO (or unrated, if deemed of comparable quality by Dreyfus), involve credit and liquidity risks and risk of principal loss.
|
| 1 Annualized effective yield is based upon dividends declared daily and reinvested monthly. Past performance is no |
| guarantee of future results.Yields fluctuate.Yields provided for the fund’s Class 1 shares reflect the absorption of |
| certain fund expenses by The Dreyfus Corporation pursuant to an agreement in effect through May 1, 2013, at |
| which time it may be extended, terminated or modified without notice.Yields provided for the fund’s Class 2 shares |
| reflect the absorption of certain fund expenses by The Dreyfus Corporation, so that direct annual fund operating |
| expenses for Class 2 shares (excluding taxes, interest, brokerage commissions, commitment fees on borrowings and |
| extraordinary expenses) do not exceed 0.55%.The Dreyfus Corporation may terminate this undertaking upon at |
| least 90 days’ prior notice to investors. Had these expenses for Class 1 shares and Class 2 shares not been absorbed, |
| fund yields would have been lower, and in some cases, 7-day yields during the reporting period would have been |
| negative absent the expense absorption. |
UNDERSTANDING YOUR FUND’S EXPENSES (Unaudited)
As a mutual fund investor, you pay ongoing expenses, such as management fees and other expenses. Using the information below, you can estimate how these expenses affect your investment and compare them with the expenses of other funds.You also may pay one-time transaction expenses, including sales charges (loads) and redemption fees, which are not shown in this section and would have resulted in higher total expenses. For more information, see your fund’s prospectus or talk to your financial adviser.
Review your fund’s expenses
The table below shows the expenses you would have paid on a $1,000 investment in Dreyfus Liquid Assets, Inc. from July 1, 2012 to December 31, 2012. It also shows how much a $1,000 investment would be worth at the close of the period, assuming actual returns and expenses.
Expenses and Value of a $1,000 Investment
assuming actual returns for the six months ended December 31, 2012
| | |
| | Class 1 Shares | Class 2 Shares |
| Expenses paid per $1,000† | $.90 | $.75 |
| Ending value (after expenses) | $1,000.00 | $1,000.20 |
COMPARING YOUR FUND’S EXPENSES
WITH THOSE OF OTHER FUNDS (Unaudited)
Using the SEC’s method to compare expenses
The Securities and Exchange Commission (SEC) has established guidelines to help investors assess fund expenses. Per these guidelines, the table below shows your fund’s expenses based on a $1,000 investment, assuming a hypothetical 5% annualized return. You can use this information to compare the ongoing expenses (but not transaction expenses or total cost) of investing in the fund with those of other funds.All mutual fund shareholder reports will provide this information to help you make this comparison. Please note that you cannot use this information to estimate your actual ending account balance and expenses paid during the period.
Expenses and Value of a $1,000 Investment
assuming a hypothetical 5% annualized return for the six months ended December 31, 2012
| | |
| | Class 1 Shares | Class 2 Shares |
| Expenses paid per $1,000† | $.92 | $.76 |
| Ending value (after expenses) | $1,024.23 | $1,024.38 |
|
| † Expenses are equal to the fund’s annualized expense ratio of .18% for Class 1 and .15% for Class 2, multiplied by |
| the average account value over the period, multiplied by 184/366 (to reflect the one-half year period). |
6
STATEMENT OF INVESTMENTS
December 31, 2012
| | | |
| | Principal | | |
| Negotiable Bank Certificates of Deposit—3.9% | Amount ($) | | Value ($) |
| Chase Bank USA | | | |
| 0.20%, 2/20/13 | | | |
| (cost $35,000,000) | 35,000,000 | | 35,000,000 |
| |
| Commercial Paper—12.4% | | | |
| Bank of Nova Scotia | | | |
| 0.02%, 1/2/13 | 35,000,000 | | 34,999,980 |
| General Electric Capital Corp. | | | |
| 0.38%, 1/11/13 | 40,000,000 | | 39,995,778 |
| UBS Finance (Delaware) Inc. | | | |
| 0.10%, 1/2/13 | 35,000,000 | | 34,999,903 |
| Total Commercial Paper | | | |
| (cost $109,995,661) | | | 109,995,661 |
| |
| Asset-Backed Commercial Paper—16.8% | | | |
| Atlantis One Funding Corp. | | | |
| 0.23%, 3/5/13 | 35,000,000 | a | 34,985,912 |
| FCAR Owner Trust, Ser. II | | | |
| 0.25%, 3/4/13 | 40,000,000 | | 39,982,778 |
| Metlife Short Term Funding LLC | | | |
| 0.20%, 3/12/13 | 35,000,000 | a | 34,986,389 |
| Northern Pines Funding LLC | | | |
| 0.20%, 1/3/13 | 40,000,000 | | 39,999,556 |
| Total Asset-Backed Commercial Paper | | | |
| (cost $149,954,635) | | | 149,954,635 |
| |
| Time Deposits—1.2% | | | |
| Bank of America N.A. (Grand Cayman) | | | |
| 0.01%, 1/2/13 | | | |
| (cost $11,000,000) | 11,000,000 | | 11,000,000 |
| |
| Repurchase Agreements—65.4% | | | |
| Barclays Capital, Inc. | | | |
| 0.20%, dated 12/31/12, due 1/2/13 in the | | | |
| amount of $87,000,967 (fully collateralized by | | | |
| $71,153,559 U.S. Treasury Notes, 0.25%-2.38%, | | | |
| due 10/31/14-6/15/15, value $72,576,630 and | | | |
| $15,846,446 U.S. Treasury Strips, due 5/15/23, | | | |
| value $16,163,375) | 87,000,000 | | 87,000,000 |
STATEMENT OF INVESTMENTS (continued)
| | | | | |
| | | | Principal | | |
| | Repurchase Agreements (continued) | | Amount ($) | | Value ($) |
| | Credit Suisse Securities LLC | | | | |
| | 0.20%, dated 12/31/12, due 1/2/13 in the | | | | |
| | amount of $135,001,500 (fully collateralized by | | | | |
| $309,425,000 U.S. Treasury Strips, due 2/15/40, | | | | |
| | value $137,700,310) | | 135,000,000 | | 135,000,000 |
| | HSBC USA Inc. | | | | |
| | 0.16%, dated 12/31/12, due 1/2/13 in the | | | | |
| | amount of $200,001,778 (fully collateralized by | | | | |
| $201,268,100 U.S. Treasury Notes, 1.13%-1.50%, | | | | |
| | due 7/31/16-12/31/19, value $204,002,817) | | 200,000,000 | | 200,000,000 |
| | RBC Capital Markets | | | | |
| | 0.15%, dated 12/31/12, due 1/2/13 in the amount of | | | | |
| $160,001,333 (fully collateralized by $76,646,100 | | | | |
| | U.S. Treasury Bills, due 5/23/13, value $76,616,975 | | | | |
| | and $83,046,000 U.S. Treasury Notes, 2.38% due | | | | |
| | 10/31/14, value $86,583,101) | | 160,000,000 | | 160,000,000 |
| | Total Repurchase Agreements | | | | |
| | (cost $582,000,000) | | | | 582,000,000 |
| |
| | Total Investments (cost $887,950,296) | | 99.7 | % | 887,950,296 |
| |
| | Cash and Receivables (Net) | | .3 | % | 2,837,186 |
| |
| | Net Assets | | 100.0 | % | 890,787,482 |
|
| a Securities exempt from registration pursuant to Rule 144A under the Securities Act of 1933.These securities may be |
| resold in transactions exempt from registration, normally to qualified institutional buyers.At December 31, 2012, |
| these securities amounted to $69,972,301 or 7.9% of net assets. |
| | | |
| Portfolio Summary (Unaudited)† | | |
| |
| | Value (%) | | Value (%) |
| Repurchase Agreements | 65.4 | Finance | 4.5 |
| Banking | 13.0 | Asset-Backed/Insurance | 3.9 |
| Asset-Backed/Banking | 8.4 | | |
| Asset-Backed/Single Seller | 4.5 | | 99.7 |
| |
| † Based on net assets. | | | |
| See notes to financial statements. | | | |
8
STATEMENT OF ASSETS AND LIABILITIES
December 31, 2012
| | | |
| | Cost | Value | |
| Assets ($): | | | |
| Investments in securities—See Statement of | | | |
| Investments (including repurchase agreements | | | |
| of $582,000,000)—Note 1(b) | 887,950,296 | 887,950,296 | |
| Cash | | 4,001,026 | |
| Interest receivable | | 10,959 | |
| Receivable for shares of Common Stock subscribed | | 9,225 | |
| Prepaid expenses | | 117,793 | |
| | | 892,089,299 | |
| Liabilities ($): | | | |
| Due to The Dreyfus Corporation and affiliates—Note 2(b) | | 316,350 | |
| Payable for shares of Common Stock redeemed | | 837,988 | |
| Accrued expenses | | 147,479 | |
| | | 1,301,817 | |
| Net Assets ($) | | 890,787,482 | |
| Composition of Net Assets ($): | | | |
| Paid-in capital | | 890,787,665 | |
| Accumulated net realized gain (loss) on investments | | (183 | ) |
| Net Assets ($) | | 890,787,482 | |
| |
| |
| Net Asset Value Per Share | | | |
| | Class 1 | Class 2 | |
| Net Assets ($) | 748,427,421 | 142,360,061 | |
| Shares Outstanding | 748,780,950 | 142,426,760 | |
| Net Asset Value Per Share ($) | 1.00 | 1.00 | |
| |
| See notes to financial statements. | | | |
| | |
| STATEMENT OF OPERATIONS | | |
| Year Ended December 31, 2012 | | |
| |
| |
| |
| |
| Investment Income ($): | | |
| Interest Income | 4,793,011 | |
| Expenses: | | |
| Management fee—Note 2(b) | 11,567,285 | |
| Shareholder servicing costs—Note 2(b) | 3,106,516 | |
| Prospectus and shareholders’ reports | 234,945 | |
| Registration fees | 181,347 | |
| Custodian fees—Note 2 | 147,923 | |
| Directors’ fees and expenses—Note 2(c) | 112,904 | |
| Professional fees | 97,276 | |
| Miscellaneous | 64,121 | |
| Total Expenses | 15,512,317 | |
| Less—reduction in expenses due to undertaking—Note 2(a) | (11,437,508 | ) |
| Less—reduction in fees due to earnings credits—Note 2(b) | (5,054 | ) |
| Net Expenses | 4,069,755 | |
| Investment Income—Net, representing net increase | | |
| in net assets resulting from operations | 723,256 | |
| |
| See notes to financial statements. | | |
10
STATEMENT OF CHANGES IN NET ASSETS
| | | | |
| | Year Ended December 31, | |
| | 2012 | | 2011 | |
| Operations ($): | | | | |
| Investment income—net | 723,256 | | 2,921,114 | |
| Net realized gain (loss) on investments | — | | (183 | ) |
| Net Increase (Decrease) in Net Assets | | | | |
| Resulting from Operations | 723,256 | | 2,920,931 | |
| Dividends to Shareholders from ($): | | | | |
| Investment income—net: | | | | |
| Class 1 Shares | — | | (397 | ) |
| Class 2 Shares | (723,256 | ) | (2,920,717 | ) |
| Total Dividends | (723,256 | ) | (2,921,114 | ) |
| Capital Stock Transactions ($1.00 per share): | | | | |
| Net proceeds from shares sold: | | | | |
| Class 1 Shares | 241,718,055 | | 325,426,719 | |
| Class 2 Shares | 1,248,240,093 | | 3,902,603,312 | |
| Dividends reinvested: | | | | |
| Class 1 Shares | — | | 13 | |
| Class 2 Shares | 207,762 | | 62,025 | |
| Cost of shares redeemed: | | | | |
| Class 1 Shares | (343,455,545 | ) | (541,612,891 | ) |
| Class 2 Shares | (4,985,240,240 | ) | (3,363,019,588 | ) |
| Increase (Decrease) in Net Assets | | | | |
| from Capital Stock Transactions | (3,838,529,875 | ) | 323,459,590 | |
| Total Increase (Decrease) in Net Assets | (3,838,529,875 | ) | 323,459,407 | |
| Net Assets ($): | | | | |
| Beginning of Period | 4,729,317,357 | | 4,405,857,950 | |
| End of Period | 890,787,482 | | 4,729,317,357 | |
| |
| See notes to financial statements. | | | | |
FINANCIAL HIGHLIGHTS
The following tables describe the performance for each share class for the fiscal periods indicated. All information reflects financial results for a single fund share. Total return shows how much your investment in the fund would have increased (or decreased) during each period, assuming you had reinvested all dividends and distributions.These figures have been derived from the fund’s financial statements.
| | | | | | | | | | |
| | | | Year Ended December 31, | | | |
| Class 1 Shares | 2012 | | 2011 | | 2010 | | 2009 | | 2008 | |
| Per Share Data ($): | | | | | | | | | | |
| Net asset value, beginning of period | 1.00 | | 1.00 | | 1.00 | | 1.00 | | 1.00 | |
| Investment Operations: | | | | | | | | | | |
| Investment income—net | — | | .000 | a | .000 | a | .001 | | .026 | |
| Distributions: | | | | | | | | | | |
| Dividends from | | | | | | | | | | |
| investment income—net | — | | (.000 | )a | (.000 | )a | (.001 | ) | (.026 | ) |
| Net asset value, end of period | 1.00 | | 1.00 | | 1.00 | | 1.00 | | 1.00 | |
| Total Return (%) | .00 | b | .00 | b | .00 | b | .14 | c | 2.58 | |
| Ratios/Supplemental Data (%): | | | | | | | | | | |
| Ratio of total expenses | | | | | | | | | | |
| to average net assets | .91 | | .87 | | .87 | | .77 | | .68 | |
| Ratio of net expenses | | | | | | | | | | |
| to average net assets | .19 | | .22 | | .31 | | .52 | | .67 | |
| Ratio of net investment income | | | | | | | | | | |
| to average net assets | — | | .00 | b | .00 | b | .15 | | 2.59 | |
| Net Assets, end of period | | | | | | | | | | |
| ($ x 1,000) | 748,427 | | 850,461 | | 1,066,647 | | 1,323,118 | | 1,617,316 | |
|
| a Amount represents less than $.001 per share. |
| b Amount represents less than .01%. |
| c If payment pursuant to a Capital Support Agreement was not made, total return would have been (1.86%). |
See notes to financial statements.
12
| | | | | | | | | | |
| | | | Year Ended December 31, | | | |
| Class 2 Shares | 2012 | | 2011 | | 2010 | | 2009 | | 2008 | |
| Per Share Data ($): | | | | | | | | | | |
| Net asset value, | | | | | | | | | | |
| beginning of period | 1.00 | | 1.00 | | 1.00 | | 1.00 | | 1.00 | |
| Investment Operations: | | | | | | | | | | |
| Investment income—net | .001 | | .001 | | .002 | | .002 | | .027 | |
| Distributions: | | | | | | | | | | |
| Dividends from | | | | | | | | | | |
| investment income—net | (.001 | ) | (.001 | ) | (.002 | ) | (.002 | ) | (.027 | ) |
| Net asset value, end of period | 1.00 | | 1.00 | | 1.00 | | 1.00 | | 1.00 | |
| Total Return (%) | .05 | | .08 | | .16 | | .23 | a | 2.72 | |
| Ratios/Supplemental Data (%): | | | | | | | | | | |
| Ratio of total expenses | | | | | | | | | | |
| to average net assets | .51 | | .51 | | .52 | | .58 | | .55 | |
| Ratio of net expenses | | | | | | | | | | |
| to average net assets | .16 | | .13 | | .16 | | .42 | | .54 | |
| Ratio of net investment income | | | | | | | | | | |
| to average net assets | .04 | | .08 | | .16 | | .25 | | 2.69 | |
| Net Assets, end of period | | | | | | | | | | |
| ($ x 1,000) | 142,360 | | 3,878,857 | | 3,339,211 | | 3,260,567 | | 3,993,593 | |
|
| a If payment pursuant to a Capital Support Agreement was not made, total return would have been (1.78%). |
| See notes to financial statements. |
NOTES TO FINANCIAL STATEMENTS
NOTE 1—Significant Accounting Policies:
Dreyfus Liquid Assets, Inc. (the “fund”) is registered under the Investment Company Act of 1940, as amended (the “Act”), as a diversified open-end management investment company.The fund’s investment objective is to seek as high a level of current income as is consistent with the preservation of capital.The Dreyfus Corporation (the “Manager” or “Dreyfus”), a wholly-owned subsidiary of The Bank of New York Mellon Corporation (“BNY Mellon”), serves as the fund’s investment adviser.
MBSC Securities Corporation (the “Distributor”), a wholly-owned subsidiary of the Manager, is the distributor of the fund’s shares. The fund is authorized to issue 30 billion shares of $.001 par value Common Stock.The fund currently offers two classes of shares: Class 1 (23.5 billion shares authorized) and Class 2 (6.5 billion shares authorized). Class 1 and Class 2 shares are identical except for the services offered to and the expenses borne by each class, the allocation of certain transfer agency costs and certain voting rights. Class 2 shares are offered only to certain eligible financial institutions. Income, expenses (other than expenses attributable to a specific class), and realized and unrealized gains or losses on investments are allocated to each class of shares based on its relative net assets.
It is the fund’s policy to maintain a continuous net asset value per share of $1.00; the fund has adopted certain investment, portfolio valuation and dividend and distribution policies to enable it to do so.There is no assurance, however, that the fund will be able to maintain a stable net asset value per share of $1.00.
The Financial Accounting Standards Board (“FASB”) Accounting Standards Codification is the exclusive reference of authoritative U.S. generally accepted accounting principles (“GAAP”) recognized by the FASB to be applied by nongovernmental entities. Rules and interpretive releases of the Securities and Exchange Commission (“SEC”) under authority of federal laws are also sources of authoritative GAAP for SEC registrants. The fund’s financial statements are prepared in accordance with GAAP, which may require the use of management estimates and assumptions.Actual results could differ from those estimates.
14
The fund enters into contracts that contain a variety of indemnifications. The fund’s maximum exposure under these arrangements is unknown.The fund does not anticipate recognizing any loss related to these arrangements.
(a) Portfolio valuation: Investments in securities are valued at amortized cost in accordance with Rule 2a-7 under the Act. If amortized cost is determined not to approximate market value, the fair value of the portfolio securities will be determined by procedures established by and under the general supervision of the fund’s Board of Directors.
The fair value of a financial instrument is the amount that would be received to sell an asset or paid to transfer a liability in an orderly transaction between market participants at the measurement date (i.e., the exit price). GAAP establishes a fair value hierarchy that prioritizes the inputs of valuation techniques used to measure fair value.This hierarchy gives the highest priority to unadjusted quoted prices in active markets for identical assets or liabilities (Level 1 measurements) and the lowest priority to unobservable inputs (Level 3 measurements).
Additionally, GAAP provides guidance on determining whether the volume and activity in a market has decreased significantly and whether such a decrease in activity results in transactions that are not orderly. GAAP requires enhanced disclosures around valuation inputs and techniques used during annual and interim periods.
Various inputs are used in determining the value of the fund’s investments relating to fair value measurements.These inputs are summarized in the three broad levels listed below:
Level 1—unadjusted quoted prices in active markets for identical investments.
Level 2—other significant observable inputs (including quoted prices for similar investments, interest rates, prepayment speeds, credit risk, etc.).
Level 3—significant unobservable inputs (including the fund’s own assumptions in determining the fair value of investments).
NOTES TO FINANCIAL STATEMENTS (continued)
The inputs or methodology used for valuing securities are not necessarily an indication of the risk associated with investing in those securities. For example, money market securities are valued using amortized cost, in accordance with rules under the Act. Generally, amortized cost approximates the current fair value of a security, but since the value is not obtained from a quoted price in an active market, such securities are reflected within Level 2 of the fair value hierarchy.
The following is a summary of the inputs used as of December 31, 2012 in valuing the fund’s investments:
| |
| | Short-Term |
| Valuation Inputs | Investments ($)† |
| Level 1—Unadjusted Quoted Prices | — |
| Level 2—Other Significant Observable Inputs | 887,950,296 |
| Level 3—Significant Unobservable Inputs | — |
| Total | 887,950,296 |
| † See Statement of Investments for additional detailed categorizations. | |
At December 31, 2012, there were no transfers between Level 1 and Level 2 of the fair value hierarchy.
(b) Securities transactions and investment income: Securities transactions are recorded on a trade date basis. Realized gains and losses from securities transactions are recorded on the identified cost basis. Interest income, adjusted for accretion of discount and amortization of premium on investments, is earned from settlement date and is recognized on the accrual basis. Cost of investments represents amortized cost.
The fund may enter into repurchase agreements with financial institutions, deemed to be creditworthy by the Manager, subject to the seller’s agreement to repurchase and the fund’s agreement to resell such securities at a mutually agreed upon price. Pursuant to the terms of the repurchase agreement, such securities must have an aggregate market value greater than or equal to the terms of the repurchase price plus accrued interest at all times. If the value of the underlying securities falls below the value of the repurchase price plus accrued interest,
16
the fund will require the seller to deposit additional collateral by the next business day. If the request for additional collateral is not met, or the seller defaults on its repurchase obligation, the fund maintains its right to sell the underlying securities at market value and may claim any resulting loss against the seller.The fund may also jointly enter into one or more repurchase agreements with other Dreyfus managed funds in accordance with an exemptive order granted by the SEC pursuant to Section 17(d) of the Act and Rule 17d-1 thereunder. Any joint repurchase agreements must be collateralized fully by U.S. Government securities.
(c) Dividends to shareholders: It is the policy of the fund to declare dividends daily from investment income-net. Such dividends are paid monthly. Dividends from net realized capital gains, if any, are normally declared and paid annually, but the fund may make distributions on a more frequent basis to comply with the distribution requirements of the Internal Revenue Code of 1986, as amended (the “Code”).To the extent that net realized capital gains can be offset by capital loss carryovers, it is the policy of the fund not to distribute such gains.
(d) Federal income taxes: It is the policy of the fund to continue to qualify as a regulated investment company, if such qualification is in the best interests of its shareholders, by complying with the applicable provisions of the Code, and to make distributions of taxable income sufficient to relieve it from substantially all federal income and excise taxes.
As of and during the period ended December 31, 2012, the fund did not have any liabilities for any uncertain tax positions.The fund recognizes interest and penalties, if any, related to uncertain tax positions as income tax expense in the Statement of Operations. During the period, the fund did not incur any interest or penalties.
Each of the tax years in the four-year period ended December 31, 2012 remains subject to examination by the Internal Revenue Service and state taxing authorities.
NOTES TO FINANCIAL STATEMENTS (continued)
At December 31, 2012, the components of accumulated earnings on a tax basis were substantially the same as for financial reporting purposes.
Under the Regulated Investment Company Modernization Act of 2010 (the “2010 Act”), the fund is permitted to carry forward capital losses incurred in taxable years beginning after December 22, 2010 (“post-enactment losses”) for an unlimited period. Furthermore, post-enactment capital loss carryovers retain their character as either short-term or long-term capital losses rather than short-term as they were under previous statute.The 2010 Act requires post-enactment losses to be utilized before the utilization of losses incurred in taxable years prior to the effective date of the 2010 Act (“pre-enactment losses”).
The accumulated capital loss carryover is available for federal income tax purposes to be applied against future net realized capital gains, if any, realized subsequent to December 31, 2012.The fund has $183 of post-enactment short-term capital losses that can be carried forward for an unlimited period.
The tax character of distributions paid to shareholders during the fiscal periods ended December 31, 2012 and December 31, 2011 were all ordinary income.
At December 31, 2012, the cost of investments for federal income tax purposes was substantially the same as the cost for financial reporting purposes (see the Statement of Investments).
NOTE 2—Management Fee and Other Transactions with Affiliates:
(a) Pursuant to a management agreement (the “Agreement’) with the Manager, the management fee is based on the value of the fund’s average daily net assets and is computed at the following annual rates: .50% of the first $1.5 billion; .48% of the next $500 million; .47% of the next $500 million; and .45% over $2.5 billion. The fee is payable monthly. The Agreement provides that if in any full fiscal year the aggregate expenses, exclusive of taxes, brokerage fees, interest on borrowings and extraordinary expenses, exceed 1% of the value of the fund’s average
18
daily net assets, the Manager will reimburse to the fund, or bear the excess expense over 1%.The Manager has undertaken, from January 1, 2012 through May 1, 2013, to waive receipt of its fees and/or assume the expenses of the fund’s Class 1 shares, so that direct annual fund operating expenses (exclusive of expenses as described above) do not exceed .69% of the value of Class 1’s average daily net assets. The Manager has also undertaken to waive receipt of its fees and/or assume the expenses of the fund’s Class 2 shares, so that direct annual fund operating expenses (exclusive of expenses as described above) do not exceed .55% of the value of Class 2’s average daily net assets. The Manager may terminate this undertaking upon at least 90 days prior notice to investors.
The Manager also voluntarily is limiting Class 1’s management fee to .16% of the value of Class 1’s average daily net assets and, waiving non class specific expenses. The Manager is limiting Class 2’s current direct expenses, including the management fee, to .16% of the value of Class 2’s average daily net assets and, additionally, is waiving non class specific expenses.These expense limitations and waivers are voluntary, not contractual, and may be terminated at any time.The waiver of fees, pursuant to these undertakings, amounted to $3,205,518 for Class 1 shares and $5,691,419 for Class 2 shares during the period ended December 31, 2012.
The Manager has also undertaken to waive receipt of the management fee and/or reimburse operating expenses in order to facilitate a daily yield at or above a certain level which may change from time to time. This undertaking is voluntary and not contractual, and may be terminated at any time.The reduction in expenses, pursuant to this undertaking amounted to $2,480,594 for Class 1 shares and $59,977 for Class 2 shares during the period ended December 31, 2012.
(b) Under the Shareholder Services Plan, Class 1 shares reimburse the Distributor an amount not to exceed an annual rate of .25% of the value of Class 1’s average daily net assets for certain allocated expenses
NOTES TO FINANCIAL STATEMENTS (continued)
of providing personal services and/or maintaining shareholder accounts.The services provided may include personal services relating to shareholder accounts, such as answering shareholder inquiries regarding the fund and providing reports and other information, and services related to the maintenance of shareholder accounts. During the period ended December 31, 2012, Class 1 shares were charged $1,987,289 pursuant to the Shareholder Services Plan.
The fund has arrangements with the transfer agent and the custodian whereby the fund may receive earnings credits when positive cash balances are maintained, which are used to offset transfer agency and custody fees. For financial reporting purposes, the fund includes net earnings credits as an expense offset in the Statement of Operations.
The fund compensates Dreyfus Transfer, Inc., a wholly-owned subsidiary of the Manager, under a transfer agency agreement for providing transfer agency services for the fund and, since May 29, 2012, cash management services related to fund subscriptions and redemptions. During the period ended December 31, 2012, the fund was charged $910,481 for transfer agency services and $18,989 for cash management services. Cash management fees were partially offset by earnings credits of $2,204. These fees are included in Shareholder servicing costs in the Statement of Operations.
The fund compensates The Bank of New York Mellon, a subsidiary of BNY Mellon and an affiliate of Dreyfus, under a custody agreement for providing custodial services for the fund. During the period ended December 31, 2012, the fund was charged $147,923 pursuant to the custody agreement.These fees were partially offset by earnings credits of $1,069.
20
Prior to May 29, 2012, the fund compensated The Bank of New York Mellon under a cash management agreement for performing certain cash management services related to fund subscriptions and redemptions. Subsequent to May 29, 2012,The Bank of NewYork Mellon has continued to provide shareholder redemption draft processing services. During the period ended December 31, 2012, the fund was charged $45,729 pursuant to the cash management agreement, which is included in Shareholder servicing costs in the Statement of Operations.These fees were partially offset by earnings credits of $1,781.
During the period ended December 31, 2012, the fund was charged $8,783 for services performed by the Chief Compliance Officer and his staff.
The components of “Due to The Dreyfus Corporation and affiliates” in the Statement of Assets and Liabilities consist of: management fees $378,078, Shareholder Services Plan fees $158,455, custodian fees $29,996, Chief Compliance Officer fees $3,981 and transfer agency fees $246,178, which are offset against an expense reimbursement currently in effect in the amount of $500,338.
(c) Each Board member also serves as a Board member of other funds within the Dreyfus complex. Annual retainer fees and attendance fees are allocated to each fund based on net assets.
REPORT OF INDEPENDENT REGISTERED
PUBLIC ACCOUNTING FIRM
Shareholders and Board of Directors
Dreyfus Liquid Assets, Inc.
We have audited the accompanying statement of assets and liabilities of Dreyfus Liquid Assets, Inc., including the statement of investments, as of December 31, 2012, and the related statement of operations for the year then ended, the statement of changes in net assets for each of the two years in the period then ended, and the financial highlights for each of the five years in the period then ended.These financial statements and financial highlights are the responsibility of the Fund’s management. Our responsibility is to express an opinion on these financial statements and financial highlights based on our audits.
We conducted our audits in accordance with the standards of the Public Company Accounting Oversight Board (United States).Those standards require that we plan and perform the audit to obtain reasonable assurance about whether the financial statements and financial highlights are free of material misstatement.We were not engaged to perform an audit of the Fund’s internal control over financial reporting. Our audits included consideration of internal control over financial reporting as a basis for designing audit procedures that are appropriate in the circumstances, but not for the purpose of expressing an opinion on the effectiveness of the Fund’s internal control over financial reporting. Accordingly, we express no such opinion.An audit also includes examining, on a test basis, evidence supporting the amounts and disclosures in the financial statements and financial highlights, assessing the accounting principles used and significant estimates made by management, and evaluating the overall financial statement presentation. Our procedures included confirmation of securities owned as of December 31, 2012 by correspondence with the custodian and others. We believe that our audits provide a reasonable basis for our opinion.
In our opinion, the financial statements and financial highlights referred to above present fairly, in all material respects, the financial position of Dreyfus Liquid Assets, Inc. at December 31, 2012, the results of its operations for the year then ended, the changes in its net assets for each of the two years in the period then ended, and the financial highlights for each of the five years in the period then ended, in conformity with U.S. generally accepted accounting principles.
New York, New York
February 27, 2013
22
IMPORTANT TAX INFORMATION (Unaudited)
For federal tax purposes, the fund hereby designates 97.63% of ordinary income dividends paid during the fiscal year ended December 31, 2012 as qualifying “interest related dividends”.
INFORMATION ABOUT THE RENEWAL OF THE
FUND’S MANAGEMENT AGREEMENT (Unaudited)
At a meeting of the fund’s Board of Directors held on July 18 and 19, 2012, the Board considered the renewal of the fund’s Management Agreement pursuant to which Dreyfus provides the fund with investment advisory and administrative services (the “Agreement”). The Board members, none of whom are “interested persons” (as defined in the Investment Company Act of 1940, as amended) of the fund, were assisted in their review by independent legal counsel and met with counsel in executive session separate from Dreyfus representatives. In considering the renewal of the Agreement, the Board considered all factors that it believed to be relevant, including those discussed below. The Board did not identify any one factor as dispositive, and each Board member may have attributed different weights to the factors considered.
Analysis of Nature, Extent, and Quality of Services Provided to the Fund.The Board considered information previously provided to them in presentations from Dreyfus representatives regarding the nature, extent, and quality of the services provided to funds in the Dreyfus fund complex, and Dreyfus representatives confirmed that there had been no material changes in this information. Dreyfus provided the number of open accounts in the fund, the fund’s asset size and the allocation of fund assets among distribution channels. Dreyfus also had previously provided information regarding the diverse intermediary relationships and distribution channels of funds in the Dreyfus fund complex (such as retail direct or intermediary, in which intermediaries typically are paid by the fund and/or Dreyfus) and Dreyfus’ corresponding need for broad, deep, and diverse resources to be able to provide ongoing shareholder services to each intermediary or distribution channel, as applicable to the fund.
The Board also considered research support available to, and portfolio management capabilities of, the fund’s portfolio management personnel and that Dreyfus also provides oversight of day-to-day fund operations, including fund accounting and administration and assistance in meeting legal and regulatory requirements.The Board also considered Dreyfus’ extensive administrative, accounting, and compliance infrastructures.
24
Comparative Analysis of the Fund’s Performance and Management Fee and Expense Ratio. The Board reviewed reports prepared by Lipper, Inc. (“Lipper”), an independent provider of investment company data, which included information comparing (1) the fund’s performance with the performance of a group of comparable funds (the “Performance Group”) and with a broader group of funds (the “Performance Universe”), all for various periods ended May 31, 2012, and (2) the fund’s actual and contractual management fees and total expenses with those of a group of comparable funds (the “Expense Group”) and with a broader group of funds (the “Expense Universe”), the information for which was derived in part from fund financial statements available to Lipper as of the date of its analysis. Dreyfus previously had furnished the Board with a description of the methodology Lipper used to select the Performance Group and Performance Universe and the Expense Group and Expense Universe.
Dreyfus representatives stated that the usefulness of performance comparisons may be affected by a number of factors, including different investment limitations that may be applicable to the fund and comparison funds. The Board discussed the results of the comparisons and noted that the fund’s total return performance was below the Performance Group median for all periods, ranking in the fourth quartile of the Performance Group for all periods, and variously above and below the Performance Universe median. It was noted, however, that when performance was below the median of the Performance Group or the Performance Universe it generally was below the median by only a few basis points. Dreyfus representatives discussed with the Board management’s approach with respect to the fund and the impact on relative fund performance.
The Board also reviewed the range of actual and contractual management fees and total expenses of the Expense Group and Expense Universe funds and discussed the results of the comparisons.The Board noted that the fund’s contractual management fee was above the
INFORMATION ABOUT THE RENEWAL OF THE FUND’S
MANAGEMENT AGREEMENT (Unaudited) (continued)
Expense Group median and the fund’s actual management fee and total expenses were below the Expense Group and Expense Universe medians. The Board also considered the current fee waiver and expense reimbursement arrangement undertaken by Dreyfus.
Dreyfus representatives reviewed with the Board the management or investment advisory fees paid by funds advised or administered by Dreyfus that are in the same Lipper category as the fund (the “Similar Clients”), and explained the nature of the Similar Clients.They discussed differences in fees paid and the relationship of the fees paid in light of any differences in the services provided and other relevant factors.The Board considered the relevance of the fee information provided for the Similar Clients to evaluate the appropriateness and reasonableness of the fund’s management fee.
Analysis of Profitability and Economies of Scale. Dreyfus representatives reviewed the expenses allocated and profit received by Dreyfus and the resulting profitability percentage for managing the fund and the aggregate profitability percentage to Dreyfus of managing the funds in the Dreyfus fund complex, and the method used to determine the expenses and profit. The Board concluded that the profitability results were not unreasonable, given the services rendered and service levels provided by Dreyfus. The Board also noted the fee waiver and expense reimbursement arrangement and its effect on Dreyfus’ prof-itability.The Board also had been provided with information prepared by an independent consulting firm regarding Dreyfus’ approach to allocating costs to, and determining the profitability of, individual funds and the entire Dreyfus fund complex.The consulting firm also had analyzed where any economies of scale might emerge in connection with the management of a fund.
The Board’s counsel stated that the Board should consider the profitability analysis (1) as part of the evaluation of whether the fees under the Agreement bear a reasonable relationship to the mix of services
26
provided by Dreyfus, including the nature, extent and quality of such services, and (2) in light of the relevant circumstances for the fund and the extent to which economies of scale would be realized if the fund grows and whether fee levels reflect these economies of scale for the benefit of fund shareholders. Dreyfus representatives noted that a discussion of economies of scale is predicated on a fund having achieved a substantial size with increasing assets and that, if a fund’s assets had been stable or decreasing, the possibility that Dreyfus may have realized any economies of scale would be less. Dreyfus representatives also noted that, as a result of shared and allocated costs among funds in the Dreyfus fund complex, the extent of economies of scale could depend substantially on the level of assets in the complex as a whole, so that increases and decreases in complex-wide assets can affect potential economies of scale in a manner that is disproportionate to, or even in the opposite direction from, changes in the fund’s asset level. The Board also considered potential benefits to Dreyfus from acting as investment adviser and noted that there were no soft dollar arrangements in effect for trading the fund’s investments.
At the conclusion of these discussions, the Board agreed that it had been furnished with sufficient information to make an informed business decision with respect to the renewal of the Agreement. Based on the discussions and considerations as described above, the Board concluded and determined as follows.
The Board concluded that the nature, extent and quality of the services provided by Dreyfus are adequate and appropriate.
The Board generally was satisfied with the fund’s relative perfor- mance, in light of the considerations described above.
The Board concluded that the fee paid to Dreyfus was reasonable in light of the considerations described above.
INFORMATION ABOUT THE RENEWAL OF THE FUND’S
MANAGEMENT AGREEMENT (Unaudited) (continued)
The Board determined that the economies of scale which may accrue to Dreyfus and its affiliates in connection with the management of the fund had been adequately considered by Dreyfus in connection with the fee rate charged to the fund pursuant to the Agreement and that, to the extent in the future it were determined that material economies of scale had not been shared with the fund, the Board would seek to have those economies of scale shared with the fund.
In evaluating the Agreement, the Board considered these conclusions and determinations and also relied on its previous knowledge, gained through meetings and other interactions with Dreyfus and its affiliates, of the fund and the services provided to the fund by Dreyfus.The Board also relied on information received on a routine and regular basis throughout the year relating to the operations of the fund and the investment management and other services provided under the Agreement, including information on the investment performance of the fund in comparison to similar mutual funds and benchmark performance indices; general market outlook as applicable to the fund; and compliance reports. In addition, it should be noted that the Board’s consideration of the contractual fee arrangements for this fund had the benefit of a number of years of reviews of prior or similar agreements during which lengthy discussions took place between the Board and Dreyfus representatives. Certain aspects of the arrangements may receive greater scrutiny in some years than in others, and the Board’s conclusions may be based, in part, on their consideration of the same or similar arrangements in prior years. The Board determined that renewal of the Agreement was in the best interests of the fund and its shareholders.
28
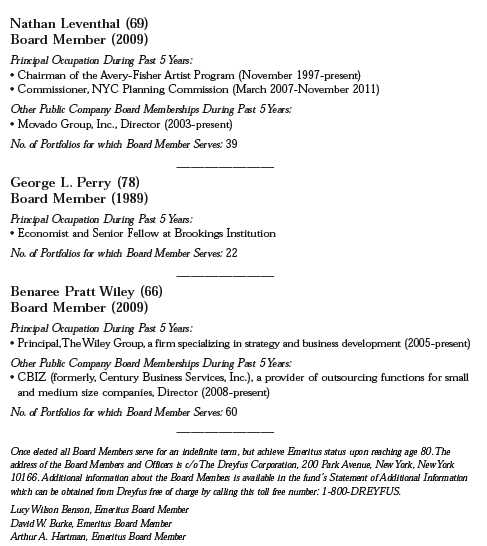
BOARD MEMBERS INFORMATION (Unaudited)
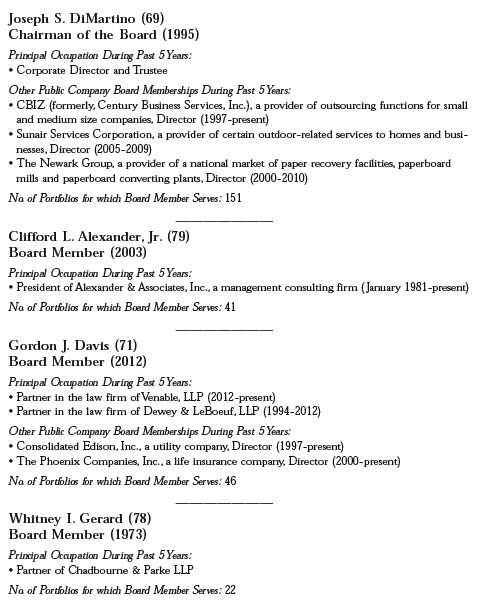
BOARD MEMBERS INFORMATION (Unaudited) (continued)
30
OFFICERS OF THE FUND (Unaudited)
BRADLEY J. SKAPYAK, President since January 2010.
Chief Operating Officer and a director of the Manager since June 2009; from April 2003 to June 2009, Mr. Skapyak was the head of the Investment Accounting and Support Department of the Manager. He is an officer of 69 investment companies (comprised of 150 portfolios) managed by the Manager. He is 54 years old and has been an employee of the Manager since February 1988.
JANETTE E. FARRAGHER, Vice President and Secretary since December 2011.
Assistant General Counsel of BNY Mellon, and an officer of 70 investment companies (comprised of 177 portfolios) managed by the Manager. She is 50 years old and has been an employee of the Manager since February 1984.
KIESHA ASTWOOD, Vice President and Assistant Secretary since January 2010.
Counsel of BNY Mellon, and an officer of 70 investment companies (comprised of 177 portfolios) managed by the Manager. She is 39 years old and has been an employee of the Manager since July 1995.
JAMES BITETTO, Vice President and Assistant Secretary since August 2005.
Senior Counsel of BNY Mellon and Secretary of the Manager, and an officer of 70 investment companies (comprised of 177 portfolios) managed by the Manager. He is 46 years old and has been an employee of the Manager since December 1996.
JONI LACKS CHARATAN, Vice President and Assistant Secretary since August 2005.
Senior Counsel of BNY Mellon, and an officer of 70 investment companies (comprised of 177 portfolios) managed by the Manager. She is 57 years old and has been an employee of the Manager since October 1988.
JOSEPH M. CHIOFFI, Vice President and Assistant Secretary since August 2005.
Senior Counsel of BNY Mellon, and an officer of 70 investment companies (comprised of 177 portfolios) managed by the Manager. He is 51 years old and has been an employee of the Manager since June 2000.
JOHN B. HAMMALIAN, Vice President and Assistant Secretary since August 2005.
Senior Managing Counsel of BNY Mellon, and an officer of 70 investment companies (comprised of 177 portfolios) managed by the Manager. He is 49 years old and has been an employee of the Manager since February 1991.
ROBERT R. MULLERY, Vice President and Assistant Secretary since August 2005.
Managing Counsel of BNY Mellon, and an officer of 70 investment companies (comprised of 177 portfolios) managed by the Manager. He is 60 years old and has been an employee of the Manager since May 1986.
JEFF PRUSNOFSKY, Vice President and Assistant Secretary since August 2005.
Senior Managing Counsel of BNY Mellon, and an officer of 70 investment companies (comprised of 177 portfolios) managed by the Manager. He is 47 years old and has been an employee of the Manager since October 1990.
JAMES WINDELS, Treasurer since November 2001.
Director – Mutual Fund Accounting of the Manager, and an officer of 70 investment companies (comprised of 177 portfolios) managed by the Manager. He is 54 years old and has been an employee of the Manager since April 1985.
OFFICERS OF THE FUND (Unaudited) (continued)
RICHARD CASSARO, Assistant Treasurer since January 2008.
Senior Accounting Manager – Money Market and Municipal Bond Funds of the Manager, and an officer of 70 investment companies (comprised of 177 portfolios) managed by the Manager. He is 53 years old and has been an employee of the Manager since September 1982.
GAVIN C. REILLY, Assistant Treasurer since December 2005.
Tax Manager of the Investment Accounting and Support Department of the Manager, and an officer of 70 investment companies (comprised of 177 portfolios) managed by the Manager. He is 44 years old and has been an employee of the Manager since April 1991.
ROBERT S. ROBOL, Assistant Treasurer since December 2002.
Senior Accounting Manager – Fixed Income Funds of the Manager, and an officer of 70 investment companies (comprised of 177 portfolios) managed by the Manager. He is 48 years old and has been an employee of the Manager since October 1988.
ROBERT SALVIOLO, Assistant Treasurer since July 2007.
Senior Accounting Manager – Equity Funds of the Manager, and an officer of 70 investment companies (comprised of 177 portfolios) managed by the Manager. He is 45 years old and has been an employee of the Manager since June 1989.
ROBERT SVAGNA, Assistant Treasurer since December 2005.
Senior Accounting Manager – Equity Funds of the Manager, and an officer of 70 investment companies (comprised of 177 portfolios) managed by the Manager. He is 45 years old and has been an employee of the Manager since November 1990.
JOSEPH W. CONNOLLY, Chief Compliance Officer since October 2004.
Chief Compliance Officer of the Manager and The Dreyfus Family of Funds (70 investment companies, comprised of 177 portfolios). He is 55 years old and has served in various capacities with the Manager since 1980, including manager of the firm’s Fund Accounting Department from 1997 through October 2001.
MATTHEW D. CONNOLLY, Anti-Money Laundering Compliance Officer since April 2012.
Anti-Money Laundering Compliance Officer of the Distributor since October 2011; from March 2010 to September 2011, Global Head, KYC Reviews and Director, UBS Investment Bank; until March 2010,AML Compliance Officer and Senior Vice President, Citi Global Wealth Management. He is an officer of 66 investment companies (comprised of 173 portfolios) managed by the Manager. He is 40 years old and has been an employee of the Distributor since October 2011.
32
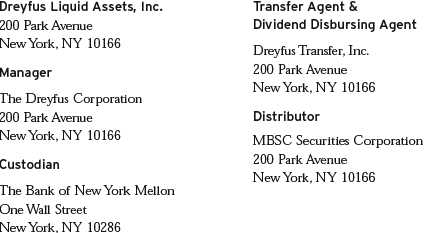
For More Information
Ticker Symbol: DLAXX
Telephone 1-800-DREYFUS
Mail The Dreyfus Family of Funds, 144 Glenn Curtiss Boulevard, Uniondale, NY 11556-0144 E-mail Send your request to info@dreyfus.com Internet Information can be viewed online or downloaded at: http://www.dreyfus.com
The fund will disclose daily, on www.dreyfus.com, the fund’s complete schedule of holdings as of the end of the previous business day. The schedule of holdings will remain on the website until the fund files its Form N-Q or Form N-CSR for the period that includes the date of the posted holdings.
The fund files its complete schedule of portfolio holdings with the Securities and Exchange Commission (“SEC”) for the first and third quarters of each fiscal year on Form N-Q. The fund's Forms N-Q are available on the SEC’s website at http://www.sec.gov and may be reviewed and copied at the SEC’s Public Reference Room in Washington, DC. Information on the operation of the Public Reference Room may be obtained by calling 1-800-SEC-0330.
Information regarding how the fund voted proxies relating to portfolio securities for the most recent 12-month period ended June 30 is available on the SEC’s website at http://www.sec.gov and without charge, upon request, by calling 1-800-DREYFUS.

Item 2. Code of Ethics.
The Registrant has adopted a code of ethics that applies to the Registrant's principal executive officer, principal financial officer, principal accounting officer or controller, or persons performing similar functions. There have been no amendments to, or waivers in connection with, the Code of Ethics during the period covered by this Report.
Item 3. Audit Committee Financial Expert.
The Registrant's Board has determined that Joseph S. DiMartino, a member of the Audit Committee of the Board, is an audit committee financial expert as defined by the Securities and Exchange Commission (the "SEC"). Joseph S. DiMartino is "independent" as defined by the SEC for purposes of audit committee financial expert determinations.
Item 4. Principal Accountant Fees and Services.
(a) Audit Fees. The aggregate fees billed for each of the last two fiscal years (the "Reporting Periods") for professional services rendered by the Registrant's principal accountant (the "Auditor") for the audit of the Registrant's annual financial statements or services that are normally provided by the Auditor in connection with the statutory and regulatory filings or engagements for the Reporting Periods, were $30,312 in 2011 and $30,857 in 2012.
(b) Audit-Related Fees. The aggregate fees billed in the Reporting Periods for assurance and related services by the Auditor that are reasonably related to the performance of the audit of the Registrant's financial statements and are not reported under paragraph (a) of this Item 4 were $12,000 in 2011 and $6,000 in 2012.
These services consisted of one or more of the following: (i) agreed upon procedures related to compliance with Internal Revenue Code section 817(h), (ii) security counts required by Rule 17f-2 under the Investment Company Act of 1940, as amended, (iii) advisory services as to the accounting or disclosure treatment of Registrant transactions or events and (iv) advisory services to the accounting or disclosure treatment of the actual or potential impact to the Registrant of final or proposed rules, standards or interpretations by the Securities and Exchange Commission, the Financial Accounting Standards Boards or other regulatory or standard-setting bodies.
The aggregate fees billed in the Reporting Periods for non-audit assurance and related services by the Auditor to the Registrant's investment adviser (not including any sub-investment adviser whose role is primarily portfolio management and is subcontracted with or overseen by another investment adviser), and any entity controlling, controlled by or under common control with the investment adviser that provides ongoing services to the Registrant ("Service Affiliates"), that were reasonably related to the performance of the annual audit of the Service Affiliate, which required pre-approval by the Audit Committee were $ 0 in 2011 and $0 in 2012.
(c) Tax Fees. The aggregate fees billed in the Reporting Periods for professional services rendered by the Auditor for tax compliance, tax advice, and tax planning ("Tax Services") were $3,508 in 2011 and $3,334 in 2012. These services consisted of: (i) review or preparation of U.S. federal, state, local and excise tax returns; (ii) U.S. federal, state and local tax planning, advice and assistance regarding statutory, regulatory or administrative developments; (iii) tax advice regarding tax qualification matters and/or treatment of various financial instruments held or proposed to be acquired or held. The aggregate fees billed in the Reporting Periods for Tax Services by the Auditor to Service Affiliates, which required pre-approval by the Audit Committee were $0 in 2011 and $0 in 2012.
(d) All Other Fees. The aggregate fees billed in the Reporting Periods for products and services provided by the Auditor, other than the services reported in paragraphs (a) through (c) of this Item, were $1,383 in 2011
3
and $4,238 in 2012. [These services consisted of a review of the Registrant's anti-money laundering program].
The aggregate fees billed in the Reporting Periods for Non-Audit Services by the Auditor to Service Affiliates, other than the services reported in paragraphs (b) through (c) of this Item, which required pre-approval by the Audit Committee, were $0 in 2011 and $200,000 in 2012.
(e)(1) Audit Committee Pre-Approval Policies and Procedures. The Registrant's Audit Committee has established policies and procedures (the "Policy") for pre-approval (within specified fee limits) of the Auditor's engagements for non-audit services to the Registrant and Service Affiliates without specific case-by-case consideration. The pre-approved services in the Policy can include pre-approved audit services, pre-approved audit-related services, pre-approved tax services and pre-approved all other services. Pre-approval considerations include whether the proposed services are compatible with maintaining the Auditor's independence. Pre-approvals pursuant to the Policy are considered annually.
(e)(2) Note: None of the services described in paragraphs (b) through (d) of this Item 4 were approved by the Audit Committee pursuant to paragraph (c)(7)(i)(C) of Rule 2-01 of Regulation S-X.
(f) None of the hours expended on the principal accountant's engagement to audit the registrant's financial statements for the most recent fiscal year were attributed to work performed by persons other than the principal account's full-time, permanent employees.
Non-Audit Fees. The aggregate non-audit fees billed by the Auditor for services rendered to the Registrant, and rendered to Service Affiliates, for the Reporting Periods were $21,812,128 in 2011 and $49,204,697 in 2012.
Auditor Independence. The Registrant's Audit Committee has considered whether the provision of non-audit services that were rendered to Service Affiliates, which were not pre-approved (not requiring pre-approval), is compatible with maintaining the Auditor's independence.
Item 5. Audit Committee of Listed Registrants.
Not applicable. [CLOSED-END FUNDS ONLY]
Item 6. Investments.
(a) Not applicable.
Item 7. Disclosure of Proxy Voting Policies and Procedures for Closed-End Management Investment Companies.
Not applicable. [CLOSED-END FUNDS ONLY]
Item 8. Portfolio Managers of Closed-End Management Investment Companies.
Not applicable. [CLOSED-END FUNDS ONLY, beginning with reports for periods ended on and after December 31, 2005]
4
Item 9. Purchases of Equity Securities by Closed-End Management Investment Companies and Affiliated Purchasers.
Not applicable. [CLOSED-END FUNDS ONLY]
Item 10. Submission of Matters to a Vote of Security Holders.
There have been no material changes to the procedures applicable to Item 10.
Item 11. Controls and Procedures.
(a) The Registrant's principal executive and principal financial officers have concluded, based on their evaluation of the Registrant's disclosure controls and procedures as of a date within 90 days of the filing date of this report, that the Registrant's disclosure controls and procedures are reasonably designed to ensure that information required to be disclosed by the Registrant on Form N-CSR is recorded, processed, summarized and reported within the required time periods and that information required to be disclosed by the Registrant in the reports that it files or submits on Form N-CSR is accumulated and communicated to the Registrant's management, including its principal executive and principal financial officers, as appropriate to allow timely decisions regarding required disclosure.
(b) There were no changes to the Registrant's internal control over financial reporting that occurred during the second fiscal quarter of the period covered by this report that have materially affected, or are reasonably likely to materially affect, the Registrant's internal control over financial reporting.
Item 12. Exhibits.
(a)(1) Code of ethics referred to in Item 2.
(a)(2) Certifications of principal executive and principal financial officers as required by Rule 30a-2(a) under the Investment Company Act of 1940.
(a)(3) Not applicable.
(b) Certification of principal executive and principal financial officers as required by Rule 30a-2(b) under the Investment Company Act of 1940.
5
SIGNATURES
Pursuant to the requirements of the Securities Exchange Act of 1934 and the Investment Company Act of 1940, the Registrant has duly caused this Report to be signed on its behalf by the undersigned, thereunto duly authorized.
Dreyfus Liquid Assets, Inc.
| |
| By: | /s/ Bradley J. Skapyak |
| | Bradley J. Skapyak, |
| | President |
| |
| Date: | February 26, 2013 |
Pursuant to the requirements of the Securities Exchange Act of 1934 and the Investment Company Act of 1940, this Report has been signed below by the following persons on behalf of the Registrant and in the capacities and on the dates indicated.
| |
| By: | /s/ Bradley J. Skapyak |
| | Bradley J. Skapyak, |
| | President |
| |
| Date: | February 26, 2013 |
| |
| By: | /s/ James Windels |
| James Windels, |
| | Treasurer |
| |
| Date: | February 26, 2013 |
EXHIBIT INDEX
(a)(1) Code of ethics referred to in Item 2.
(a)(2) Certifications of principal executive and principal financial officers as required by Rule 30a-2(a) under the Investment Company Act of 1940. (EX-99.CERT)
(b) Certification of principal executive and principal financial officers as required by Rule 30a-2(b) under the Investment Company Act of 1940. (EX-99.906CERT)
6
Exhibit (a)(1)
[INSERT CODE OF ETHICS]
7
Exhibit A
Persons Covered by the Code of Ethics
| | |
| Bradley J. Skapyak | President | (Principal Executive Officer) |
| | | (Principal Financial and |
| James Windels | Treasurer | Accounting Officer) |
| |
| Revised as of January 1, 2010 | | |
8