| UNITED STATES SECURITIES AND EXCHANGE COMMISSION Washington, D.C. 20549 |
| FORM N-CSR |
| CERTIFIED SHAREHOLDER REPORT OF REGISTERED MANAGEMENT INVESTMENT COMPANIES |
Investment Company Act file number 811- 2192
| The Dreyfus Third Century Fund, Inc. (Exact name of Registrant as specified in charter) |
| c/o The Dreyfus Corporation 200 Park Avenue New York, New York 10166 (Address of principal executive offices) (Zip code) |
| Michael A. Rosenberg, Esq. 200 Park Avenue New York, New York 10166 (Name and address of agent for service) |
| Registrant's telephone number, including area code: | (212) 922-6000 | |||
| Date of fiscal year end: | 5/31 | |||
| Date of reporting period: | 5/31/2009 | |||
| FORM N-CSR |
Item 1. Reports to Stockholders.
Save time. Save paper. View your next shareholder report online as soon as it’s available. Log into www.dreyfus.com and sign up for Dreyfus eCommunications. It’s simple and only takes a few minutes.
The views expressed in this report reflect those of the portfolio manager only through the end of the period covered and do not necessarily represent the views of Dreyfus or any other person in the Dreyfus organization. Any such views are subject to change at any time based upon market or other conditions and Dreyfus disclaims any responsibility to update such views.These views may not be relied on as investment advice and, because investment decisions for a Dreyfus fund are based on numerous factors, may not be relied on as an indication of trading intent on behalf of any Dreyfus fund.
Not FDIC-Insured • Not Bank-Guaranteed • May Lose Value
| Contents | |
| THE FUND | |
| 2 | A Letter from the CEO |
| 3 | Discussion of Fund Performance |
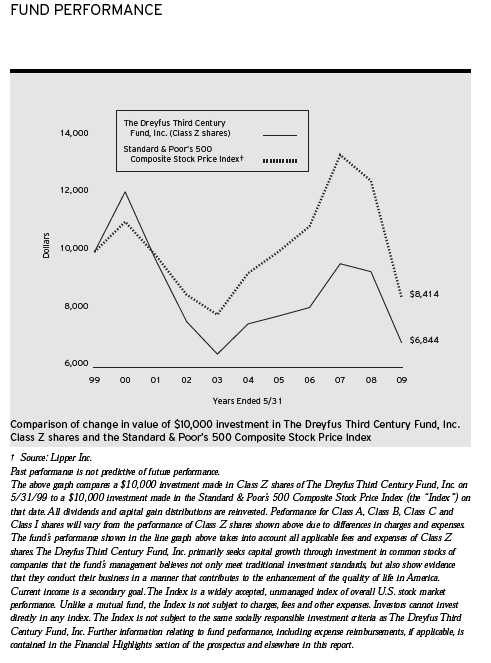
| 6 | Fund Performance |
| 8 | Understanding Your Fund’s Expenses |
| 8 | Comparing Your Fund’s Expenses With Those of Other Funds |
| 9 | Statement of Investments |
| 13 | Statement of Assets and Liabilities |
| 14 | Statement of Operations |
| 15 | Statement of Changes in Net Assets |
| 17 | Financial Highlights |
| 22 | Notes to Financial Statements |
| 32 | Report of Independent Registered Public Accounting Firm |
| 33 | Important Tax Information |
| 34 | Board Members Information |
| 36 | Officers of the Fund |
| FOR MORE INFORMATION | |
| Back Cover | |
| The Fund |
| The Dreyfus Third Century Fund, Inc. |

| LETTER FROM THE CEO Dear Shareholder: |
We present to you this annual report for The Dreyfus Third Century Fund, Inc., covering the 12-month period from June 1, 2008, through May 31, 2009.
The U.S. equities market went on a wild ride over the reporting period, with stocks plummeting in the fall of 2008 and rebounding strongly in the spring of 2009. In supporting the recent rally, investors apparently shrugged off more bad economic news: the unemployment rate surged to a 25-year high, and a 6.3% annualized contraction over the fourth quarter of 2008 was followed by a 5.7% revised estimate of economic contraction during the first quarter of 2009.Yet, the market rebound between March 7 and May 31 proved to be one of the more robust in the history of the U.S. stock market.
These enormous swings leave investors to wonder if the equities market is forecasting sustainable economic improvement, or could this be a bear market rally where stocks reach such depressed levels that even the slightest hint of good news lifts prices. We generally have remained cautious in the absence of real economic progress, but the market’s gyrations illustrate an important feature of many market rallies—when they snap back, the rebounds are often quick and sharp, potentially leaving investors on the sidelines.That’s why we encourage you to speak regularly with your financial consultant, who can discuss with you the potential benefits of adhering to a long-term investment strategy tailored to your current investment needs and future goals. For information about how the fund performed during the reporting period, as well as market perspectives, we have provided a Discussion of Fund Performance given by the fund’s Portfolio Manager.
Thank you for your continued confidence and support.

| Jonathan R. Baum Chairman and Chief Executive Officer The Dreyfus Corporation June 15, 2009 |
2

DISCUSSION OF FUND PERFORMANCE
For the period of June 1, 2008, through May 31, 2009, as provided by Jocelin A. Reed, Portfolio Manager
Fund and Market Performance Overview
For the 12-month period ended May 31, 2009, The Dreyfus Third Century Fund’s Class A shares produced a total return of –26.73%, Class B shares returned –27.50%, Class C shares returned –27.38%, Class I shares returned –26.47% and Class Z shares returned –26.56%.1 In comparison, the fund’s benchmark, the Standard & Poor’s 500 Composite Stock Price Index (“S&P 500 Index”), provided a total return of –32.55% for the same period.2
During the reporting period, U.S. markets suffered steep declines amid a deepening economic recession and expanding financial crisis. Stock prices fell in concert with shrinking corporate revenues and mounting uncertainty regarding the recession’s depth and duration. While these conditions took a toll on the fund’s performance, underweighted exposure to the hard-hit financial sector and strong stock selections in the technology and industrials sectors, enabled the fund to outperform its benchmark.
The Fund’s Investment Approach
The fund seeks to provide capital growth, with current income as a secondary goal.To pursue these goals, the fund invests primarily in the common stocks of companies that, in our opinion, meet traditional investment standards while simultaneously conducting their businesses in a manner that contributes to the enhancement of the quality of life in America. Our strategy combines a disciplined investment process that consists of computer modeling techniques, fundamental analysis and risk management with a social investment process. In selecting stocks, we begin by using quantitative research to identify and rank stocks within an industry or sector. Next, based on fundamental analysis, we designate the most attractive of the higher-ranked securities as potential purchase candidates.We then evaluate potential purchase candidates by industry or sector to determine whether the company meets the fund’s socially responsible investment criteria.
The Fund 3
| DISCUSSION OF FUND PERFORMANCE (continued) |
We next select investments from those companies that we consider to be the most attractive based on financial considerations. If there is more than one company to choose from, we can select stocks of companies that we consider to have records that exhibit positive accomplishments in the fund’s areas of social concern.
The fund normally focuses on large-cap growth stocks; however, we may emphasize different types of growth-oriented stocks and different market capitalizations within the large-capitalization range as market conditions warrant.The fund also may invest in value-oriented stocks, midcap stocks and small-cap stocks.
Limited Exposure to Hard-Hit Financials
Every market sector represented in the fund’s benchmark experienced double-digit declines during the reporting period, with the financials sector suffering the greatest drop due to the effects of the financial crisis. Several major financial institutions were driven into bankruptcy, nationalized or sold to rivals, and the sector as a whole declined by nearly half despite a rebound late in the reporting period.
Approximately six months before the reporting period began, the fund began shifting assets out of financial stocks in recognition of rising volatility in earnings and stock prices. During the reporting period, the fund averaged roughly half the benchmark’s weighting in financial stocks, thereby limiting losses in the market’s most troubled area.The fund further enhanced its relative performance by focusing on financial companies with relatively stable earnings and revenue estimates, such as Wells Fargo & Co. and Northern Trust.
Mixed Performance in Other Sectors
We allocated a greater percentage of assets to the information technology sector than the benchmark, a move that bolstered the fund’s relative per-formance.We generally emphasized technology companies with healthy balance sheets and strong cash flow ratios, such as International Business Machines and Microsoft. Among industrial stocks, the fund benefited from good security selections, such as United Technologies and First Solar, while avoiding General Electric, which was hurt by its Capital Finance division.
However, not every sector contributed positively to the fund’s relative returns. Most notably, media holdings, such as News Corp., were hurt
4
by sharp reductions in advertising revenues. The fund also slightly underperformed its benchmark in the telecommunications, consumer durables and energy sectors.
Seeking Growth and Earnings Stability
As of May 31, 2009, we are encouraged by the stock market’s recent rally, which we believe indicates a return to stability in the financial markets. We have maintained a mildly growth-oriented bias through overweighted exposure to the technology sector and underweighted exposure to the financials and energy sectors. In our judgment, the fund is well positioned for an eventual economic recovery.
Poised to Benefit from Trends in Environmental Regulation
The fund’s socially responsible investment criteria have long led us to emphasize companies with attractive environmental profiles. United Technologies is distinguished by the diversity of its environmental product and service initiatives, from increased energy efficiency in its Carrier HVAC systems to the advanced design of aircraft engines in its Pratt & Whitney division. 3M was recently commended by the Environmental Protection Agency for reducing its greenhouse gas emissions by 60% from 2002 through 2007, and the company has developed products to help its customers reduce their carbon footprints as well. Emerson Electric is a leader in the development of energy efficient building-wide power control systems. Such companies appear particularly likely to benefit from growing momentum toward stronger federal regulation of greenhouse gas emissions.
For further information regarding the fund’s approach to socially responsible investing, please consult the fund’s prospectus.
June 15, 2009
Please note, the position in any security highlighted with italicized typeface was sold during the reporting period.
| 1 | Total return includes reinvestment of dividends and any capital gains paid, and does not take into consideration the maximum initial sales charge in the case of Class A shares, or the applicable contingent deferred sales charges imposed on redemptions in the case of Class B and Class C shares. Had these charges been reflected, returns would have been lower. Past performance is no guarantee of future results. Share price and investment return fluctuate such that upon redemption, fund shares may be worth more or less than their original cost. |
| 2 | SOURCE: LIPPER INC. — Reflects reinvestment of dividends and, where applicable, capital gain distributions.The Standard & Poor’s 500 Composite Stock Price Index is a widely accepted, unmanaged index of U.S. stock market performance. |
The Fund 5
6
| Average Annual Total Returns as of 5/31/09 | ||||||||
| Inception | ||||||||
| Date | 1 Year | 5 Years | 10 Years | |||||
| Class A shares | ||||||||
| with maximum sales charge (5.75%) | 8/31/99 | –30.92% | –3.23% | –4.52%†††† | ||||
| without sales charge | 8/31/99 | –26.73% | –2.08% | –3.95%†††† | ||||
| Class B shares | ||||||||
| with applicable redemption charge † | 8/31/99 | –30.40% | –3.31% | –4.38%††, †††† | ||||
| without redemption | 8/31/99 | –27.50% | –2.91% | –4.38%††, †††† | ||||
| Class C shares | ||||||||
| with applicable redemption charge ††† | 8/31/99 | –28.11% | –2.82% | –4.67%†††† | ||||
| without redemption | 8/31/99 | –27.38% | –2.82% | –4.67%†††† | ||||
| Class I shares | 8/31/99 | –26.47% | –1.79% | –3.65%†††† | ||||
| Class Z shares | 3/29/72 | –26.56% | –1.83% | –3.72% | ||||
Past performance is not predictive of future performance.The fund’s performance shown in the graph and table does not reflect the deduction of taxes that a shareholder would pay on fund distributions or the redemption of fund shares.
| † | The maximum contingent deferred sales charge for Class B shares is 4%.After six years Class B shares convert to | |
| Class A shares. | ||
| †† | Assumes the conversion of Class B shares to Class A shares at the end of the sixth year following the date of purchase. | |
| ††† | The maximum contingent deferred sales charge for Class C shares is 1% for shares redeemed within one year of | |
| the date of purchase. | ||
| †††† | The total return performance figures presented for Class A, Class B, Class C and Class I shares of the fund | |
| represent the performance of the fund’s Class Z shares for periods prior to August 31, 1999 (the inception date for | ||
| Class A, Class B, Class C and Class I shares), adjusted to reflect the applicable sales load for that class. |
The Fund 7
UNDERSTANDING YOUR FUND’S EXPENSES (Unaudited)
As a mutual fund investor, you pay ongoing expenses, such as management fees and other expenses. Using the information below, you can estimate how these expenses affect your investment and compare them with the expenses of other funds.You also may pay one-time transaction expenses, including sales charges (loads) and redemption fees, which are not shown in this section and would have resulted in higher total expenses. For more information, see your fund’s prospectus or talk to your financial adviser.
Review your fund’s expenses
The table below shows the expenses you would have paid on a $1,000 investment in Dreyfus Third Century Fund, Inc. from December 1, 2008 to May 31, 2009. It also shows how much a $1,000 investment would be worth at the close of the period, assuming actual returns and expenses.
| Expenses and Value of a $1,000 Investment | ||||||||||
| assuming actual returns for the six months ended May 31, 2009 | ||||||||||
| Class A | Class B | Class C | Class I | Class Z | ||||||
| Expenses paid per $1,000† | $ 7.25 | $ 12.47 | $ 11.59 | $ 5.15 | $ 6.15 | |||||
| Ending value (after expenses) | $1,107.60 | $1,102.00 | $1,103.20 | $1,109.70 | $1,109.40 | |||||
COMPARING YOUR FUND’S EXPENSES WITH THOSE OF OTHER FUNDS (Unaudited)
Using the SEC’s method to compare expenses
The Securities and Exchange Commission (SEC) has established guidelines to help investors assess fund expenses. Per these guidelines, the table below shows your fund’s expenses based on a $1,000 investment, assuming a hypothetical 5% annualized return. You can use this information to compare the ongoing expenses (but not transaction expenses or total cost) of investing in the fund with those of other funds.All mutual fund shareholder reports will provide this information to help you make this comparison. Please note that you cannot use this information to estimate your actual ending account balance and expenses paid during the period.
| Expenses and Value of a $1,000 Investment | ||||||||||
| assuming a hypothetical 5% annualized return for the six months ended May 31, 2009 | ||||||||||
| Class A | Class B | Class C | Class I | Class Z | ||||||
| Expenses paid per $1,000† | $ 6.94 | $ 11.94 | $ 11.10 | $ 4.94 | $ 5.89 | |||||
| Ending value (after expenses) | $1,018.05 | $1,013.06 | $1,013.91 | $1,020.04 | $1,019.10 | |||||
† Expenses are equal to the fund’s annualized expense ratio of 1.38% for Class A, 2.38% for Class B, 2.21% for Class C, .98% for Class I and 1.17% for Class Z, multiplied by the average account value over the period, multiplied by 182/365 (to reflect the one-half year period).
8
| STATEMENT OF INVESTMENTS May 31, 2009 |
| Common Stocks—99.2% | Shares | Value ($) | ||
| Consumer Discretionary—9.9% | ||||
| Choice Hotels International | 66,750 a | 1,821,607 | ||
| Coach | 107,250 | 2,817,457 | ||
| DeVry | 30,200 | 1,315,814 | ||
| DreamWorks Animation SKG, Cl. A | 65,700 b | 1,830,402 | ||
| Gap | 204,600 | 3,652,110 | ||
| McDonald’s | 47,700 | 2,813,823 | ||
| NIKE, Cl. B | 63,350 | 3,614,117 | ||
| TJX Cos. | 92,800 | 2,738,528 | ||
| Walt Disney | 91,050 | 2,205,231 | ||
| Weight Watchers International | 34,400 | 805,992 | ||
| 23,615,081 | ||||
| Consumer Staples—11.2% | ||||
| Bare Escentuals | 53,000 b | 463,750 | ||
| Costco Wholesale | 87,850 | 4,262,482 | ||
| Hansen Natural | 56,950 a,b | 2,088,926 | ||
| Kimberly-Clark | 72,900 | 3,782,781 | ||
| PepsiCo | 151,750 | 7,898,587 | ||
| Procter & Gamble | 121,850 | 6,328,889 | ||
| SYSCO | 77,250 | 1,850,910 | ||
| 26,676,325 | ||||
| Energy—11.1% | ||||
| Apache | 21,750 | 1,832,655 | ||
| Cimarex Energy | 66,400 a | 2,165,968 | ||
| EnCana | 27,300 | 1,513,239 | ||
| ENSCO International | 58,150 | 2,261,453 | ||
| Nexen | 114,000 a | 2,835,180 | ||
| Noble | 121,300 | 4,169,081 | ||
| Schlumberger | 38,400 | 2,197,632 | ||
| SEACOR Holdings | 32,400 a,b | 2,475,684 | ||
| Southwestern Energy | 82,950 b | 3,605,836 | ||
| Talisman Energy | 214,400 | 3,492,576 | ||
| 26,549,304 |
The Fund 9
| STATEMENT OF INVESTMENTS (continued) |
| Common Stocks (continued) | Shares | Value ($) | ||
| Financial—6.5% | ||||
| Chubb | 49,800 | 1,974,570 | ||
| Cincinnati Financial | 83,600 | 1,890,196 | ||
| Cullen/Frost Bankers | 21,200 a | 1,037,740 | ||
| Eaton Vance | 89,200 a | 2,417,320 | ||
| Goldman Sachs Group | 8,300 | 1,199,931 | ||
| JPMorgan Chase & Co. | 62,000 | 2,287,800 | ||
| Travelers Cos. | 52,550 | 2,136,683 | ||
| Wells Fargo & Co. | 94,700 | 2,414,850 | ||
| 15,359,090 | ||||
| Health Care—13.8% | ||||
| Aetna | 86,350 | 2,312,453 | ||
| Alcon | 18,050 | 1,958,425 | ||
| Amgen | 93,250 b | 4,656,905 | ||
| AstraZeneca, ADR | 52,350 a | 2,184,042 | ||
| Becton, Dickinson & Co. | 69,950 | 4,734,216 | ||
| Genzyme | 79,600 b | 4,707,544 | ||
| Johnson & Johnson | 95,850 | 5,287,086 | ||
| Novartis, ADR | 28,100 | 1,124,562 | ||
| WellPoint | 94,600 b | 4,405,522 | ||
| Zimmer Holdings | 35,800 b | 1,594,890 | ||
| 32,965,645 | ||||
| Industrial—12.9% | ||||
| 3M | 58,150 | 3,320,365 | ||
| Danaher | 32,250 a | 1,946,287 | ||
| Donaldson | 28,150 a | 948,373 | ||
| Dun & Bradstreet | 22,750 | 1,860,722 | ||
| Emerson Electric | 149,000 | 4,781,410 | ||
| Equifax | 47,250 | 1,286,145 | ||
| Fluor | 30,300 | 1,423,494 | ||
| Herman Miller | 105,750 | 1,504,823 | ||
| Nordson | 30,000 a | 1,152,000 | ||
| Rockwell Collins | 80,900 | 3,431,778 | ||
| Ryder System | 25,700 | 724,226 | ||
| United Technologies | 120,850 | 6,357,919 | ||
| Wabtec | 27,600 a | 984,768 | ||
| Woodward Governor | 53,250 | 1,093,223 | ||
| 30,815,533 |
10
| Common Stocks (continued) | Shares | Value ($) | ||
| Information Technology—26.9% | ||||
| Accenture, Cl. A | 105,200 | 3,148,636 | ||
| Apple | 57,050 b | 7,747,961 | ||
| Cisco Systems | 303,400 b | 5,612,900 | ||
| EMC | 209,000 b | 2,455,750 | ||
| Google, Cl. A | 11,150 b | 4,652,115 | ||
| Intel | 143,900 | 2,262,108 | ||
| International Business Machines | 99,200 | 10,542,976 | ||
| Microsoft | 486,350 | 10,159,852 | ||
| Molex | 92,000 | 1,405,760 | ||
| National Semiconductor | 131,700 a | 1,827,996 | ||
| Oracle | 107,200 | 2,100,048 | ||
| QUALCOMM | 126,300 | 5,505,417 | ||
| STMicroelectronics (New York Shares) | 102,300 a | 752,928 | ||
| Symantec | 95,750 b | 1,492,743 | ||
| Texas Instruments | 235,050 | 4,559,970 | ||
| 64,227,160 | ||||
| Materials—3.6% | ||||
| Air Products & Chemicals | 44,300 | 2,869,754 | ||
| Ecolab | 24,350 | 909,473 | ||
| Nucor | 44,400 | 1,949,604 | ||
| Praxair | 39,900 | 2,920,680 | ||
| 8,649,511 | ||||
| Telecommunication Services—.7% | ||||
| Windstream | 191,850 | 1,613,459 | ||
| Utilities—2.6% | ||||
| Pinnacle West Capital | 61,400 | 1,697,710 | ||
| Sempra Energy | 78,050 | 3,565,324 | ||
| WGL Holdings | 32,700 a | 971,844 | ||
| 6,234,878 | ||||
| Total Common Stocks | ||||
| (cost $269,894,647) | 236,705,986 | |||
| Other Investment—.8% | ||||
| Registered Investment Company; | ||||
| Dreyfus Institutional Preferred | ||||
| Plus Money Market Fund | ||||
| (cost $1,805,000) | 1,805,000 c | 1,805,000 | ||
The Fund 11
| STATEMENT OF INVESTMENTS (continued) |
| Investment of Cash Collateral | ||||
| for Securities Loaned—6.8% | Shares | Value ($) | ||
| Registered Investment Company; | ||||
| Dreyfus Institutional Cash | ||||
| Advantage Plus Fund | ||||
| (cost $16,158,044) | 16,158,044 c | 16,158,044 | ||
| Total Investments (cost $287,857,691) | 106.8% | 254,669,030 | ||
| Liabilities, Less Cash and Receivables | (6.8%) | (16,187,848) | ||
| Net Assets | 100.0% | 238,481,182 | ||
| ADR—American Depositary Receipts |
| a | All or a portion of these securities are on loan.At May 31, 2009, the total market value of the fund’s securities on loan is $16,105,743 and the total market value of the collateral held by the fund is $16,158,044. |
| b | Non-income producing security. |
| c | Investment in affiliated money market mutual fund. |
| Portfolio Summary (Unaudited)† | ||||||
| Value (%) | Value (%) | |||||
| Information Technology | 26.9 | Money Market Investments | 7.6 | |||
| Health Care | 13.8 | Financial | 6.5 | |||
| Industrial | 12.9 | Materials | 3.6 | |||
| Consumer Staples | 11.2 | Utilities | 2.6 | |||
| Energy | 11.1 | Telecommunication Services | .7 | |||
| Consumer Discretionary | 9.9 | 106.8 | ||||
| † Based on net assets. | ||||||
| See notes to financial statements. | ||||||
12
| STATEMENT OF ASSETS AND LIABILITIES May 31, 2009 |
| Cost | Value | |||||||||
| Assets ($): | ||||||||||
| Investments in securities—See Statement of Investments (including | ||||||||||
| securities on loan, valued at $16,105,743)—Note 1(b): | ||||||||||
| Unaffiliated issuers | 269,894,647 | 236,705,986 | ||||||||
| Affiliated issuers | 17,963,044 | 17,963,044 | ||||||||
| Dividends and interest receivable | 450,837 | |||||||||
| Receivable for shares of Common Stock subscribed | 21,227 | |||||||||
| Prepaid expenses | 10,021 | |||||||||
| 255,151,115 | ||||||||||
| Liabilities ($): | ||||||||||
| Due to The Dreyfus Corporation and affiliates—Note 3(c) | 200,061 | |||||||||
| Cash overdraft due to Custodian | 11,806 | |||||||||
| Liability for securities on loan—Note 1(b) | 16,158,044 | |||||||||
| Payable for shares of Common Stock redeemed | 170,282 | |||||||||
| Accrued expenses | 129,740 | |||||||||
| 16,669,933 | ||||||||||
| Net Assets ($) | 238,481,182 | |||||||||
| Composition of Net Assets ($): | ||||||||||
| Paid-in capital | 381,766,119 | |||||||||
| Accumulated undistributed investment income—net | 1,802,961 | |||||||||
| Accumulated net realized gain (loss) on investments | (111,899,237) | |||||||||
| Accumulated net unrealized appreciation | ||||||||||
| (depreciation) on investments | (33,188,661) | |||||||||
| Net Assets ($) | 238,481,182 | |||||||||
| Net Asset Value Per Share | ||||||||||
| Class A | Class B | Class C | Class I | Class Z | ||||||
| Net Assets ($) | 42,532,002 | 866,605 | 1,787,763 | 1,047,653 | 192,247,159 | |||||
| Shares Outstanding | 6,005,578 | 131,469 | 269,540 | 144,902 | 26,621,110 | |||||
| Net Asset Value | ||||||||||
| Per Share ($) | 7.08 | 6.59 | 6.63 | 7.23 | 7.22 | |||||
| See notes to financial statements. | ||||||||||
The Fund 13
| STATEMENT OF OPERATIONS | ||
| Year Ended May 31, 2009 | ||
| Investment Income ($): | ||
| Income: | ||
| Cash dividends (net of $35,792 foreign taxes withheld at source): | ||
| Unaffiliated issuers | 4,560,718 | |
| Affiliated issuers | 44,575 | |
| Income from securities lending | 100,051 | |
| Interest | 1,153 | |
| Total Income | 4,706,497 | |
| Expenses: | ||
| Management fee—Note 3(a) | 1,898,710 | |
| Shareholder servicing costs—Note 3(c) | 668,999 | |
| Professional fees | 101,135 | |
| Custodian fees—Note 3(c) | 82,736 | |
| Registration fees | 74,971 | |
| Distribution fees—Note 3(b) | 24,386 | |
| Prospectus and shareholders’ reports | 23,600 | |
| Loan commitment fees—Note 2 | 9,691 | |
| Directors’ fees and expenses—Note 3(d) | 6,030 | |
| Miscellaneous | 29,556 | |
| Total Expenses | 2,919,814 | |
| Less—reduction in fees due to earnings credits—Note 1(b) | (24,348) | |
| Net Expenses | 2,895,466 | |
| Investment Income—Net | 1,811,031 | |
| Realized and Unrealized Gain (Loss) on Investments—Note 4 ($): | ||
| Net realized gain (loss) on investments | (13,415,673) | |
| Net unrealized appreciation (depreciation) on investments | (82,486,020) | |
| Net Realized and Unrealized Gain (Loss) on Investments | (95,901,693) | |
| Net (Decrease) in Net Assets Resulting from Operations | (94,090,662) | |
| See notes to financial statements. | ||
14
STATEMENT OF CHANGES IN NET ASSETS
| Year Ended May 31, | ||||
| 2009a | 2008b | |||
| Operations ($): | ||||
| Investment income—net | 1,811,031 | 1,176,113 | ||
| Net realized gain (loss) on investments | (13,415,673) | 3,473,092 | ||
| Net unrealized appreciation | ||||
| (depreciation) on investments | (82,486,020) | (14,981,335) | ||
| Net Increase (Decrease) in Net Assets | ||||
| Resulting from Operations | (94,090,662) | (10,332,130) | ||
| Dividends to Shareholders from ($): | ||||
| Investment income—net: | ||||
| Class A Shares | (257,011) | (36,376) | ||
| Class I Shares | (7,671) | (5,119) | ||
| Class Z Shares | (897,210) | (1,346,361) | ||
| Total Dividends | (1,161,892) | (1,387,856) | ||
| Capital Stock Transactions ($): | ||||
| Net proceeds from shares sold: | ||||
| Class A Shares | 51,570,509 | 4,066,286 | ||
| Class B Shares | 6,255 | — | ||
| Class C Shares | 527,760 | 383,682 | ||
| Class I Shares | 684,796 | 593,606 | ||
| Class T Shares | 120,510 | 164,064 | ||
| Class Z Shares | 4,443,423 | 6,234,131 | ||
| Dividends reinvested: | ||||
| Class A Shares | 254,046 | 34,399 | ||
| Class I Shares | 4,256 | 2,409 | ||
| Class Z Shares | 855,787 | 1,284,193 | ||
| Cost of shares redeemed: | ||||
| Class A Shares | (9,078,299) | (3,906,245) | ||
| Class B Shares | (801,496) | (2,400,670) | ||
| Class C Shares | (537,173) | (1,244,672) | ||
| Class I Shares | (413,969) | (86,863) | ||
| Class T Shares | (408,144) | (142,608) | ||
| Class Z Shares | (26,086,506) | (40,317,311) | ||
| Increase (Decrease) in Net Assets | ||||
| from Capital Stock Transactions | 21,141,755 | (35,335,599) | ||
| Total Increase (Decrease) in Net Assets | (74,110,799) | (47,055,585) | ||
| Net Assets ($): | ||||
| Beginning of Period | 312,591,981 | 359,647,566 | ||
| End of Period | 238,481,182 | 312,591,981 | ||
| Undistributed investment income—net | 1,802,961 | 1,153,822 |
The Fund 15
STATEMENT OF CHANGES IN NET ASSETS (continued)
| Year Ended May 31, | ||||
| 2009a | 2008b | |||
| Capital Share Transactions: | ||||
| Class Ac,d | ||||
| Shares sold | 5,874,789 | 419,644 | ||
| Shares issued for dividends reinvested | 39,695 | 3,424 | ||
| Shares redeemed | (1,458,773) | (406,464) | ||
| Net Increase (Decrease) in Shares Outstanding | 4,455,711 | 16,604 | ||
| Class Bc | ||||
| Shares sold | 1,025 | — | ||
| Shares redeemed | (111,914) | (261,746) | ||
| Net Increase (Decrease) in Shares Outstanding | (110,889) | (261,746) | ||
| Class C | ||||
| Shares sold | 84,911 | 41,838 | ||
| Shares redeemed | (87,864) | (142,524) | ||
| Net Increase (Decrease) in Shares Outstanding | (2,953) | (100,686) | ||
| Class I | ||||
| Shares sold | 83,891 | 60,810 | ||
| Shares issued for dividends reinvested | 653 | 237 | ||
| Shares redeemed | (61,484) | (8,818) | ||
| Net Increase (Decrease) in Shares Outstanding | 23,060 | 52,229 | ||
| Class Td | ||||
| Shares sold | 18,438 | 17,577 | ||
| Shares redeemed | (63,136) | (15,858) | ||
| Net Increase (Decrease) in Shares Outstanding | (44,698) | 1,719 | ||
| Class Z | ||||
| Shares sold | 629,144 | 636,259 | ||
| Shares issued for dividends reinvested | 131,239 | 126,281 | ||
| Shares redeemed | (3,604,329) | (4,104,254) | ||
| Net Increase (Decrease) in Shares Outstanding | (2,843,946) | (3,341,714) |
| a | Effective close of business on February 4, 2009, the fund no longer offers Class T shares. |
| b | Effective June 1, 2007, Class R shares were redesignated as Class I shares. |
| c | During the period ended May 31, 2009, 55,475 Class B shares representing $387,350, were automatically converted to 51,759 Class A shares and during the period ended May 31, 2008, 197,069 Class B shares representing $1,808,227 were automatically converted to 184,889 Class A shares. |
| d | On the close of business on February 4, 2009, 24,951 Class T shares representing $148,706 were automatically converted to 24,024 Class A shares. |
| See notes to financial statements. |
16
FINANCIAL HIGHLIGHTS
The following tables describe the performance for each share class for the fiscal periods indicated.All information (except portfolio turnover rate) reflects financial results for a single fund share.Total return shows how much your investment in the fund would have increased (or decreased) during each period, assuming you had reinvested all dividends and distributions.These figures have been derived from the fund’s financial statements.
| Year Ended May 31, | ||||||||||
| Class A Shares | 2009 | 2008 | 2007 | 2006 | 2005 | |||||
| Per Share Data ($): | ||||||||||
| Net asset value, beginning of period | 9.72 | 10.05 | 8.48 | 8.19 | 7.93 | |||||
| Investment Operations: | ||||||||||
| Investment income (loss)—neta | .05 | .01 | .02 | (.02) | .00b | |||||
| Net realized and unrealized | ||||||||||
| gain (loss) on investments | (2.65) | (.32) | 1.55 | .31 | .26 | |||||
| Total from Investment Operations | (2.60) | (.31) | 1.57 | .29 | .26 | |||||
| Distributions: | ||||||||||
| Dividends from investment income—net | (.04) | (.02) | — | — | — | |||||
| Net asset value, end of period | 7.08 | 9.72 | 10.05 | 8.48 | 8.19 | |||||
| Total Return (%)c | (26.73) | (3.06) | 18.52 | 3.54 | 3.28 | |||||
| Ratios/Supplemental Data (%): | ||||||||||
| Ratio of total expenses | ||||||||||
| to average net assets | 1.31 | 1.35 | 1.29 | 1.25 | 1.35 | |||||
| Ratio of net expenses | ||||||||||
| to average net assets | 1.30 | 1.35d | 1.29 | 1.25 | 1.35d | |||||
| Ratio of net investment income | ||||||||||
| (loss) to average net assets | .70 | .06 | .18 | (.24) | .05 | |||||
| Portfolio Turnover Rate | 40.27 | 21.97 | 22.75 | 78.54 | 67.21 | |||||
| Net Assets, end of period ($ x 1,000) | 42,532 | 15,066 | 15,411 | 11,573 | 11,230 | |||||
| a | Based on average shares outstanding at each month end. |
| b | Amount represents less than $.01 per share. |
| c | Exclusive of sales charge. |
| d | Expense waivers and/or reimbursements amounted to less than .01%. |
| See notes to financial statements. |
The Fund 17
| FINANCIAL HIGHLIGHTS (continued) |
| Year Ended May 31, | ||||||||||
| Class B Shares | 2009 | 2008 | 2007 | 2006 | 2005 | |||||
| Per Share Data ($): | ||||||||||
| Net asset value, beginning of period | 9.09 | 9.45 | 8.04 | 7.83 | 7.64 | |||||
| Investment Operations: | ||||||||||
| Investment (loss)—neta | (.03) | (.06) | (.06) | (.09) | (.06) | |||||
| Net realized and unrealized | ||||||||||
| gain (loss) on investments | (2.47) | (.30) | 1.47 | .30 | .25 | |||||
| Total from Investment Operations | (2.50) | (.36) | 1.41 | .21 | .19 | |||||
| Net asset value, end of period | 6.59 | 9.09 | 9.45 | 8.04 | 7.83 | |||||
| Total Return (%)b | (27.50) | (3.81) | 17.54 | 2.68 | 2.49 | |||||
| Ratios/Supplemental Data (%): | ||||||||||
| Ratio of total expenses | ||||||||||
| to average net assets | 2.28 | 2.12 | 2.18 | 2.06 | 2.09 | |||||
| Ratio of net expenses | ||||||||||
| to average net assets | 2.27 | 2.12c | 2.18 | 2.06 | 2.09c | |||||
| Ratio of net investment (loss) | ||||||||||
| to average net assets | (.49) | (.74) | (.77) | (1.09) | (.74) | |||||
| Portfolio Turnover Rate | 40.27 | 21.97 | 22.75 | 78.54 | 67.21 | |||||
| Net Assets, end of period ($ x 1,000) | 867 | 2,202 | 4,762 | 9,415 | 15,503 | |||||
| a | Based on average shares outstanding at each month end. |
| b | Exclusive of sales charge. |
| c | Expense waivers and/or reimbursements amounted to less than .01%. |
| See notes to financial statements. |
18
| Year Ended May 31, | ||||||||||
| Class C Shares | 2009 | 2008 | 2007 | 2006 | 2005 | |||||
| Per Share Data ($): | ||||||||||
| Net asset value, beginning of period | 9.13 | 9.48 | 8.06 | 7.84 | 7.65 | |||||
| Investment Operations: | ||||||||||
| Investment (loss)—neta | (.02) | (.06) | (.05) | (.08) | (.05) | |||||
| Net realized and unrealized | ||||||||||
| gain (loss) on investments | (2.48) | (.29) | 1.47 | .30 | .24 | |||||
| Total from Investment Operations | (2.50) | (.35) | 1.42 | .22 | .19 | |||||
| Net asset value, end of period | 6.63 | 9.13 | 9.48 | 8.06 | 7.84 | |||||
| Total Return (%)b | (27.38) | (3.69) | 17.62 | 2.81 | 2.48 | |||||
| Ratios/Supplemental Data (%): | ||||||||||
| Ratio of total expenses | ||||||||||
| to average net assets | 2.14 | 2.01 | 2.00 | 2.02 | 2.07 | |||||
| Ratio of net expenses | ||||||||||
| to average net assets | 2.14c | 2.00 | 2.00 | 2.02 | 2.07c | |||||
| Ratio of net investment (loss) | ||||||||||
| to average net assets | (.29) | (.60) | (.53) | (1.03) | (.72) | |||||
| Portfolio Turnover Rate | 40.27 | 21.97 | 22.75 | 78.54 | 67.21 | |||||
| Net Assets, end of period ($ x 1,000) | 1,788 | 2,487 | 3,538 | 2,745 | 3,156 | |||||
| a | Based on average shares outstanding at each month end. |
| b | Exclusive of sales charge. |
| c | Expense waivers and/or reimbursements amounted to less than .01%. |
| See notes to financial statements. |
The Fund 19
| FINANCIAL HIGHLIGHTS (continued) |
| Year Ended May 31, | ||||||||||
| Class I Shares | 2009 | 2008a | 2007 | 2006 | 2005 | |||||
| Per Share Data ($): | ||||||||||
| Net asset value, beginning of period | 9.90 | 10.23 | 8.60 | 8.28 | 8.06 | |||||
| Investment Operations: | ||||||||||
| Investment income—netb | .07 | .05 | .05 | .06 | .06 | |||||
| Net realized and unrealized | ||||||||||
| gain (loss) on investments | (2.69) | (.32) | 1.58 | .31 | .16 | |||||
| Total from Investment Operations | (2.62) | (.27) | 1.63 | .37 | .22 | |||||
| Distributions: | ||||||||||
| Dividends from investment income—net | (.05) | (.06) | — | (.05) | — | |||||
| Net asset value, end of period | 7.23 | 9.90 | 10.23 | 8.60 | 8.28 | |||||
| Total Return (%) | (26.47) | (2.65) | 18.95 | 4.45 | 2.73 | |||||
| Ratios/Supplemental Data (%): | ||||||||||
| Ratio of total expenses | ||||||||||
| to average net assets | .95 | .94 | .87 | .84 | .83 | |||||
| Ratio of net expenses | ||||||||||
| to average net assets | .95c | .94c | .87 | .84 | .83c | |||||
| Ratio of net investment income | ||||||||||
| to average net assets | .92 | .51 | .58 | .66 | .80 | |||||
| Portfolio Turnover Rate | 40.27 | 21.97 | 22.75 | 78.54 | 67.21 | |||||
| Net Assets, end of period ($ x 1,000) | 1,048 | 1,206 | 712 | 653 | 977 | |||||
| a | Effective June 1, 2007, Class R shares were redesignated as Class I shares. |
| b | Based on average shares outstanding at each month end. |
| c | Expense waivers and/or reimbursements amounted to less than .01%. |
| See notes to financial statements. |
20
| Year Ended May 31, | ||||||||||
| Class Z Shares | 2009 | 2008 | 2007 | 2006 | 2005 | |||||
| Per Share Data ($): | ||||||||||
| Net asset value, beginning of period | 9.88 | 10.21 | 8.59 | 8.31 | 8.02 | |||||
| Investment Operations: | ||||||||||
| Investment income (loss)—neta | .05 | .04 | .04 | (.00)b | .03 | |||||
| Net realized and unrealized | ||||||||||
| gain (loss) on investments | (2.68) | (.33) | 1.58 | .31 | .26 | |||||
| Total from Investment Operations | (2.63) | (.29) | 1.62 | .31 | .29 | |||||
| Distributions: | ||||||||||
| Dividends from investment income—net | (.03) | (.04) | — | (.03) | — | |||||
| Net asset value, end of period | 7.22 | 9.88 | 10.21 | 8.59 | 8.31 | |||||
| Total Return (%) | (26.56) | (2.82) | 18.86 | 3.74 | 3.62 | |||||
| Ratios/Supplemental Data (%): | ||||||||||
| Ratio of total expenses | ||||||||||
| to average net assets | 1.11 | 1.01 | 1.02 | 1.04 | 1.02 | |||||
| Ratio of net expenses | ||||||||||
| to average net assets | 1.10 | 1.00 | 1.02 | 1.04 | 1.02c | |||||
| Ratio of net investment income | ||||||||||
| (loss) to average net assets | .73 | .40 | .43 | (.05) | .34 | |||||
| Portfolio Turnover Rate | 40.27 | 21.97 | 22.75 | 78.54 | 67.21 | |||||
| Net Assets, end of period ($ x 1,000) | 192,247 | 291,213 | 334,808 | 331,203 | 399,440 | |||||
| a | Based on average shares outstanding at each month end. |
| b | Amount represents less than $.01 per share. |
| c | Expense waivers and/or reimbursements amounted to less than .01%. |
| See notes to financial statements. |
The Fund 21
NOTES TO FINANCIAL STATEMENTS
NOTE 1—Significant Accounting Policies:
The Dreyfus Third Century Fund, Inc. (the “fund”) is registered under the Investment Company Act of 1940, as amended (the “Act”), as a diversified open-end management investment company. The fund’s investment objective is to provide capital growth. The Dreyfus Corporation (the “Manager” or “Dreyfus”), a wholly-owned subsidiary of The Bank of New York Mellon Corporation (“BNY Mellon”), serves as the fund’s investment adviser.
At a meeting of the Board of Directors held on July 16, 2008, the Board approved, effective December 1, 2008, a proposal to change the name of the fund from “The Dreyfus Premier Third Century Fund, Inc.” to “The Dreyfus Third Century Fund, Inc.”
Effective July 1, 2008, BNY Mellon reorganized and consolidated a number of its banking and trust company subsidiaries.As a result of the reorganization, any services previously provided to the fund by Mellon Bank, N.A. or Mellon Trust of New England, N.A. are now provided by The Bank of NewYork Mellon (formerly,The Bank of NewYork).
MBSC Securities Corporation (the “Distributor”), a wholly-owned subsidiary of the Manager, is the distributor of the fund’s shares. The fund is authorized to issue 100 million shares of $.001 par value Common Stock in each of the following classes of shares: Class A, Class B, Class C and Class I and 200 million shares of $.001 par value Common Stock of Class Z. Class A, Class B and Class C shares are sold primarily to retail investors through financial intermediaries and bear a distribution fee and/or shareholder services fee. Class Z shares are not available for new accounts and bear a shareholder services fee. Class A shares are subject to a sales charge imposed at the time of purchase. Class B shares are subject to a contingent deferred sales charge (“CDSC”) imposed on Class B share redemptions made within six years of purchase and automatically convert to Class A shares after six years.The fund does not offer Class B shares, except in connection with dividend reinvestment and permitted exchanges of Class B shares. Class
22
C shares are subject to a CDSC imposed on Class C shares redeemed within one year of purchase. Class I shares are sold at net asset value per share only to institutional investors. Other differences between the classes include the services offered to and the expenses borne by each class, the allocation of certain transfer agency costs and certain voting rights. Income, expenses (other than expenses attributable to a specific class), and realized and unrealized gains or losses on investments are allocated to each class of shares based on its relative net assets.
Effective December 3, 2008, investments for new accounts were no longer permitted in Class T shares of the fund, except that participants in certain group retirement plans were able to open a new account in Class T shares of the fund, provided that the fund was established as an investment option under the plans before December 3, 2008. On February 4, 2009, the fund issued to each holder of its Class T shares, in exchange for said shares, Class A shares of the fund having an aggregate net asset value equal to the aggregate net asset value of the shareholder’s Class T shares. Subsequent investments in the fund’s Class A shares made by prior holders of the fund’s Class T shares who received Class A shares of the fund in exchange for their Class T shares are subject to the front-end sales load schedule that was in effect for Class T shares at the time of the exchange. Otherwise, all other Class A share attributes will be in effect. Effective close of business on February 4, 2009, the fund no longer offers Class T shares.
The fund’s financial statements are prepared in accordance with U.S. generally accepted accounting principles, which may require the use of management estimates and assumptions. Actual results could differ from those estimates.
The fund enters into contracts that contain a variety of indemnifications. The fund’s maximum exposure under these arrangements is unknown.The fund does not anticipate recognizing any loss related to these arrangements.
The Fund 23
| NOTES TO FINANCIAL STATEMENTS (continued) |
(a) Portfolio valuation: Investments in securities are valued at the last sales price on the securities exchange or national securities market on which such securities are primarily traded. Securities listed on the National Market System for which market quotations are available are valued at the official closing price or, if there is no official closing price that day, at the last sales price. Securities not listed on an exchange or the national securities market, or securities for which there were no transactions, are valued at the average of the most recent bid and asked prices, except for open short positions, where the asked price is used for valuation purposes. Bid price is used when no asked price is available. Registered investment companies that are not traded on an exchange are valued at their net asset value.When market quotations or official closing prices are not readily available, or are determined not to reflect accurately fair value, such as when the value of a security has been significantly affected by events after the close of the exchange or market on which the security is principally traded (for example, a foreign exchange or market), but before the fund calculates its net asset value, the fund may value these investments at fair value as determined in accordance with the procedures approved by the Board of Directors. Fair valuing of securities may be determined with the assistance of a pricing service using calculations based on indices of domestic securities and other appropriate indicators, such as prices of relevant ADRs and futures contracts. For other securities that are fair valued by the Board of Directors, certain factors may be considered such as: fundamental analytical data, the nature and duration of restrictions on disposition, an evaluation of the forces that influence the market in which the securities are purchased and sold, and public trading in similar securities of the issuer or comparable issuers. Financial futures are valued at the last sales price.
The fund adopted Statement of Financial Accounting Standards No. 157 “FairValue Measurements” (“FAS 157”). FAS 157 establishes an authoritative definition of fair value, sets out a framework for measuring fair value, and requires additional disclosures about fair value measurements.
24
Various inputs are used in determining the value of the fund’s investments relating to FAS 157.These inputs are summarized in the three broad levels listed below.
| Level 1—quoted prices in active markets for identical investments. |
| Level 2—other significant observable inputs (including quoted |
| prices for similar securities, interest rates, prepayment speeds, |
| credit risk, etc.). |
| Level 3—significant unobservable inputs (including the fund’s own |
| assumptions in determining the fair value of investments). |
The inputs or methodology used for valuing securities are not necessar ily an indication of the risk associated with investing in those securities
The following is a summary of the inputs used as of May 31, 2009 valuing the fund’s investments:
| Level 2—Other | Level 3— | |||||||
| Level 1— | Significant | Significant | ||||||
| Quoted | Observable Unobservable | |||||||
| Prices | Inputs | Inputs | Total | |||||
| Assets ($) | ||||||||
| Investments in | ||||||||
| Securities | 254,669,030 | — | — | 254,669,030 | ||||
| Other Financial | ||||||||
| Instruments† | — | — | — | — | ||||
| Liabilities ($) | ||||||||
| Other Financial | ||||||||
| Instruments† | — | — | — | — | ||||
† Other financial instruments include derivative instruments, such as futures, forward currency exchange contracts, swap contracts and options contracts.Amounts shown represent unrealized appreciation (depreciation), or in the case of options, market value at period end.
In April 2009, the Financial Accounting Standards Board (“FASB”) issued FASB Staff Position No. 157-4,“Determining Fair Value When the Volume and Level of Activity for the Asset or Liability Have Significantly Decreased and Identifying Transactions That Are Not Orderly” (“FSP 157-4”). FSP 157-4 provides additional guidance for estimating fair value in accordance with FAS 157, when the volume
The Fund 25
| NOTES TO FINANCIAL STATEMENTS (continued) |
and level of activity for the asset or liability have significantly decreased as well as guidance on identifying circumstances that indicate a transaction is not orderly. FSP 157-4 is effective for fiscal years and interim periods ending after June 15, 2009. Management is currently evaluating the impact the adoption of FSP 157-4 will have on the fund’s financial statement disclosures.
(b) Securities transactions and investment income: Securities transactions are recorded on a trade date basis. Realized gains and losses from securities transactions are recorded on the identified cost basis. Dividend income is recognized on the ex-dividend date and interest income, including, where applicable, accretion of discount and amortization of premium on investments, is recognized on the accrual basis.
The fund has arrangements with the custodian and cash management bank whereby the fund may receive earnings credits when positive cash balances are maintained, which are used to offset custody and cash management fees. For financial reporting purposes, the fund includes net earnings credits as an expense offset in the Statement of Operations.
Pursuant to a securities lending agreement with The Bank of New York Mellon, a subsidiary of BNY Mellon and an affiliate of Dreyfus, the fund may lend securities to qualified institutions. It is the fund’s policy that, at origination, all loans are secured by collateral of at least 102% of the value of U.S. securities loaned and 105% of the value of foreign securities loaned. Collateral equivalent to at least 100% of the market value of securities on loan is maintained at all times. Collateral is either in the form of cash, which can be invested in certain money market mutual funds managed by the Manager, U.S. Government and Agency securities or letters of credit.The fund is entitled to receive all income on securities loaned, in addition to income earned as a result of the lending transaction. Although each security loaned is fully collateralized, the fund bears the risk of delay in recovery of, or loss of rights in, the securities loaned should a borrower fail to return the securities in a timely manner. During the period ended May 31, 2009, The Bank of New York Mellon earned $42,879 from lending fund portfolio securities, pursuant to the securities lending agreement.
26
(c) Affiliated issuers: Investments in other investment companies advised by the Manager are defined as “affiliated” in the Act.
(d) Dividends to shareholders: Dividends are recorded on the ex-dividend date. Dividends from investment income-net and dividends from net realized capital gains, if any, are normally declared and paid annually, but the fund may make distributions on a more frequent basis to comply with the distribution requirements of the Internal Revenue Code of 1986, as amended (the “Code”).To the extent that net realized capital gains can be offset by capital loss carryovers, it is the policy of the fund not to distribute such gains. Income and capital gain distributions are determined in accordance with income tax regulations, which may differ from U.S. generally accepted accounting principles.
(e) Federal income taxes: It is the policy of the fund to continue to qualify as a regulated investment company, if such qualification is in the best interests of its shareholders, by complying with the applicable provisions of the Code, and to make distributions of taxable income sufficient to relieve it from substantially all federal income and excise taxes.
As of and during the period ended May 31, 2009, the fund did not have any liabilities for any uncertain tax positions.The fund recognizes interest and penalties, if any, related to uncertain tax positions as income tax expense in the Statement of Operations. During the period, the fund did not incur any interest or penalties.
Each of the tax years in the four-year period ended May 31, 2009 remains subject to examination by the Internal Revenue Service and state taxing authorities.
At May 31, 2009, the components of accumulated earnings on a tax basis were as follows: undistributed ordinary income $1,802,961, accumulated capital losses $94,824,157 and unrealized depreciation $33,203,455. In addition, the fund had $17,060,286 of capital losses realized after October 31, 2008, which were deferred for tax purposes to the first day of the following fiscal year.
The Fund 27
| NOTES TO FINANCIAL STATEMENTS (continued) |
The accumulated capital loss carryover is available for federal income tax purposes to be applied against future net securities profits, if any, realized subsequent to May 31, 2009. If not applied, the carryover expires in fiscal 2011.
The tax character of distributions paid to shareholders during the fiscal periods ended May 31, 2009 and May 31, 2008 were as follows: ordinary income $1,161,892 and $1,387,856, respectively.
NOTE 2—Bank Lines of Credit:
Prior to October 15, 2008, the fund participated with other Dreyfus-managed funds in a $350 million unsecured credit facility led by Citibank, N.A. Effective October 15, 2008, the fund participates with other Dreyfus-managed funds in a $145 million unsecured credit facility with Citibank, N.A. and a $300 million unsecured credit facility provided by The Bank of New York Mellon (each, a “Facility”), each to be utilized primarily for temporary or emergency purposes, including the financing of redemptions. In connection therewith, the fund has agreed to pay its pro rata portion of Facility fees for each Facility. Interest is charged to the fund based on rates determined pursuant to the terms of the respective Facility at the time of the borrowing. During the period ended May 31, 2009, the fund did not borrow under the Facilities.
NOTE 3—Management Fee and Other Transactions With Affiliates:
(a) Pursuant to the management agreement (“Agreement”) with the Manager, the management fee is computed at an annual rate of .75% of the value of the fund’s average daily net assets and is payable monthly. Pursuant to the Agreement, if in any full fiscal year the aggregate expenses allocable to Class Z, exclusive of taxes, brokerage fees, interest on borrowings, commitment fees and extraordinary expenses, exceed 1 1 / 2% of the value of the average daily net assets of Class Z, the fund may deduct from the fees paid to the Manager, or the Manager will bear such excess expense. During the period ended May 31, 2009, there was no expense reimbursement pursuant to the Agreement.
28
During the period ended May 31, 2009, the Distributor retained $233 and $100 from commissions earned on sales of the fund’s Class A and Class T shares, respectively, and $1,372 and $207 from CDSCs on redemptions of the fund’s Class B and Class C shares, respectively.
(b) Under the Distribution Plan (the “Plan”) adopted pursuant to Rule 12b-1 under the Act, Class B and Class C shares pay and Class T shares paid the Distributor for distributing their shares at the annual rates of .75% of the value of the average daily net assets of Class B and Class C shares and .25% of the value of the average daily net assets of Class T shares. During the period ended May 31, 2009, Class B, Class C and Class T shares were charged $9,334, $14,559 and $493, respectively, pursuant to the Plan.
(c) Under the Shareholder Services Plan, Class A, Class B and Class C shares pay and Class T shares paid the Distributor at an annual rate of .25% of the value of their average daily net assets for the provision of certain services. The services provided may include personal services relating to shareholder accounts, such as answering shareholder inquiries regarding Class A, Class B, Class C and Class T shares and providing reports and other information, and services related to the maintenance of shareholder accounts. The Distributor may make payments to Service Agents (a securities dealer, financial institution or other industry professional) in respect of these services. The Distributor determines the amounts to be paid to Service Agents. During the period ended May 31, 2009, Class A, Class B, Class C and Class T shares were charged $98,373, $3,111, $4,853 and $493, respectively, pursuant to the Shareholder Services Plan.
Under the Shareholder Services Plan, Class Z shares reimburse the Distributor an amount not to exceed an annual rate of .25% of the value of Class Z shares’ average daily net assets for certain allocated expenses of providing personal services and/or maintaining shareholder accounts.The services provided may include personal services relating to shareholder accounts, such as answering shareholder inquiries regarding Class Z shares and providing reports and other information, and services related to the maintenance of shareholder accounts.
The Fund 29
| NOTES TO FINANCIAL STATEMENTS (continued) |
During the period ended May 31, 2009, Class Z shares were charged $216,232 pursuant to the Shareholder Services Plan.
The fund compensates Dreyfus Transfer, Inc., a wholly-owned subsidiary of the Manager, under a transfer agency agreement for providing personnel and facilities to perform transfer agency services for the fund. During the period ended May 31, 2009, the fund was charged $166,798 pursuant to the transfer agency agreement.
The fund compensates The Bank of New York Mellon under a cash management agreement for performing cash management services related to fund subscriptions and redemptions. During the period ended May 31, 2009, the fund was charged $24,087 pursuant to the cash management agreement.These fees were offset by earnings credits pursuant to the cash management agreement.
The fund also compensates The Bank of New York Mellon under a custody agreement for providing custodial services for the fund. During the period ended May 31, 2009, the fund was charged $82,736 pursuant to the custody agreement.
During the period ended May 31, 2009, the fund was charged $5,814 for services performed by the Chief Compliance Officer.
The components of “Due to The Dreyfus Corporation and affiliates” in the Statement of Assets and Liabilities consist of: management fees $145,148, Rule 12b-1 distribution plan fees $1,610, shareholder services plan fees $16,433, custodian fees $6,000, chief compliance officer fees $1,150 and transfer agency per account fees $29,720.
(d) Each Board member also serves as a Board member of other funds within the Dreyfus complex. Annual retainer fees and attendance fees are allocated to each fund based on net assets.
30
NOTE 4—Securities Transactions:
The aggregate amount of purchases and sales of investment securities, excluding short-term securities, during the period ended May 31, 2009, amounted to $128,657,876 and $102,186,364, respectively.
The fund adopted FASB Statement of Financial Accounting Standards No. 161 “Disclosures about Derivative Instruments and Hedging Activities” (“FAS 161”). FAS 161 requires qualitative disclosures about objectives and strategies for using derivatives, quantitative disclosures about fair value amounts of gains and losses on derivative instruments and disclosures about credit-risk-related contingent features in derivative agreements. Since the fund held no derivatives during the period ended May 31, 2009, FAS 161 disclosures did not impact the notes to the financial statements.
At May 31,2009,the cost of investments for federal income tax purposes was $287,872,485; accordingly, accumulated net unrealized depreciation on investments was $33,203,455, consisting of $8,498,448 gross unrealized appreciation and $41,701,903 gross unrealized depreciation.
The Fund 31
REPORT OF INDEPENDENT REGISTERED PUBLIC ACCOUNTING FIRM
| Shareholders and Board of Directors The Dreyfus Third Century Fund, Inc. |
We have audited the accompanying statement of assets and liabilities of The Dreyfus Third Century Fund, Inc. (formerly,The Dreyfus Premier Third Century Fund, Inc.), including the statement of investments, as of May 31, 2009 and the related statement of operations for the year then ended, the statement of changes in net assets for each of the two years in the period then ended and financial highlights for each of the years indicated therein. These financial statements and financial highlights are the responsibility of the Fund’s management. Our responsibility is to express an opinion on these financial statements and financial highlights based on our audits.
We conducted our audits in accordance with the standards of the Public Company Accounting Oversight Board (United States).Those standards require that we plan and perform the audit to obtain reasonable assurance about whether the financial statements and financial highlights are free of material misstatement.We were not engaged to perform an audit of the Fund’s internal control over financial reporting. Our audits included consideration of internal control over financial reporting as a basis for designing audit procedures that are appropriate in the circumstances, but not for the purpose of expressing an opinion on the effectiveness of the Fund’s internal control over financial reporting.Accordingly, we express no such opinion. An audit also includes examining, on a test basis, evidence supporting the amounts and disclosures in the financial statements and financial highlights, assessing the accounting principles used and significant estimates made by management, and evaluating the overall financial statement presentation. Our procedures included confirmation of securities owned as of May 31, 2009 by correspondence with the custodian and others.We believe that our audits provide a reasonable basis for our opinion.
In our opinion, the financial statements and financial highlights referred to above present fairly, in all material respects, the financial position of The Dreyfus Third Century Fund, Inc. at May 31, 2009, the results of its operations for the year then ended, the changes in its net assets for each of the two years in the period then ended, and the financial highlights for each of the indicated years, in conformity with U.S. generally accepted accounting principles.
| New York, New York July 17, 2009 |
32
IMPORTANT TAX INFORMATION (Unaudited)
For federal tax purposes the fund hereby designates 100% of the ordinary dividends paid during the fiscal year ended May 31, 2009 as qualifying for the corporate dividends received deduction. Also certain dividends paid by the fund may be subject to a maximum tax rate of 15%, as provided for by the Jobs and Growth Tax Relief Reconciliation Act of 2003. Of the distributions paid during the fiscal year, $1,161,892 represents the maximum amount that may be considered qualified dividend income. Shareholders will receive notification in early 2010 of the percentage applicable to the preparation of their 2009 income tax returns.
The Fund 33


Item 2. Code of Ethics.
The Registrant has adopted a code of ethics that applies to the Registrant's principal executive officer, principal financial officer, principal accounting officer or controller, or persons performing similar functions. There have been no amendments to, or waivers in connection with, the Code of Ethics during the period covered by this Report.
Item 3. Audit Committee Financial Expert.
The Registrant's Board has determined that Joseph S. DiMartino, a member of the Audit Committee of the Board, is an audit committee financial expert as defined by the Securities and Exchange Commission (the "SEC"). Mr. DiMartino is "independent" as defined by the SEC for purposes of audit committee financial expert determinations.
Item 4. Principal Accountant Fees and Services.
(a) Audit Fees. The aggregate fees billed for each of the last two fiscal years (the "Reporting Periods") for professional services rendered by the Registrant's principal accountant (the "Auditor") for the audit of the Registrant's annual financial statements or services that are normally provided by the Auditor in connection with the statutory and regulatory filings or engagements for the Reporting Periods, were $27,386 in 2008 and $27,935 in 2009.
(b) Audit-Related Fees. The aggregate fees billed in the Reporting Periods for assurance and related services by the Auditor that are reasonably related to the performance of the audit of the Registrant's financial statements and are not reported under paragraph (a) of this Item 4 were $0 in 2008 and $5,276 in 2009.
The aggregate fees billed in the Reporting Periods for non-audit assurance and related services by the Auditor to the Registrant's investment adviser (not including any sub-investment adviser whose role is primarily portfolio management and is subcontracted with or overseen by another investment adviser), and any entity controlling, controlled by or under common control with the investment adviser that provides ongoing services to the Registrant ("Service Affiliates"), that were reasonably related to the performance of the annual audit of the Service Affiliate, which required pre-approval by the Audit Committee were $0 in 2008 and $0 in 2009.
(c) Tax Fees. The aggregate fees billed in the Reporting Periods for professional services rendered by the Auditor for tax compliance, tax advice, and tax planning ("Tax Services") were $2,848 in 2008 and $3,234 in 2009. These services consisted of: (i) review or preparation of U.S. federal, state, local and excise tax returns; (ii) U.S. federal, state and local tax planning, advice and assistance regarding statutory, regulatory or administrative developments; (iii) tax advice regarding tax qualification matters and/or treatment of various financial instruments held or proposed to be acquired or held. The aggregate fees billed in the Reporting Periods for Tax Services by the Auditor to Service Affiliates, which required pre-approval by the Audit Committee were $0 in 2008 and $0 in 2009.
(d) All Other Fees. The aggregate fees billed in the Reporting Periods for products and services provided by the Auditor, other than the services reported in paragraphs (a) through (c) of this Item, were $126 in 2008 and $70 in 2009. These services consisted of a review of the Registrant's anti-money laundering program.
The aggregate fees billed in the Reporting Periods for Non-Audit Services by the Auditor to Service Affiliates, other than the services reported in paragraphs (b) through (c) of this Item, which required pre-approval by the Audit Committee, were $0 in 2008 and $0 in 2009.
Note: In each of (b) through (d) of this Item 4, 100% of all services provided by the Auditor were pre-approved as required.
Audit Committee Pre-Approval Policies and Procedures. The Registrant's Audit Committee has established policies and procedures (the "Policy") for pre-approval (within specified fee limits) of the Auditor's engagements for non-audit services to the Registrant and Service Affiliates without specific case-by-case consideration. Pre-approval considerations include whether the proposed services are compatible with maintaining the Auditor's independence. Pre-approvals pursuant to the Policy are considered annually.
Non-Audit Fees. The aggregate non-audit fees billed by the Auditor for services rendered to the Registrant, and rendered to Service Affiliates, for the Reporting Periods were $2,596,025 in 2008 and $20,898,574 in 2009.
Auditor Independence. The Registrant's Audit Committee has considered whether the provision of non-audit services that were rendered to Service Affiliates, which were not pre-approved (not requiring pre-approval), is compatible with maintaining the Auditor's independence.
| Item 5. | Audit Committee of Listed Registrants. | |
| Not applicable. [CLOSED-END FUNDS ONLY] | ||
| Item 6. | Investments. | |
| (a) | Not applicable. | |
| Item 7. | Disclosure of Proxy Voting Policies and Procedures for Closed-End Management | |
| Investment Companies. | ||
| Not applicable. [CLOSED-END FUNDS ONLY] | ||
| Item 8. | Portfolio Managers of Closed-End Management Investment Companies. | |
| Not applicable. [CLOSED-END FUNDS ONLY, beginning with reports for periods ended | ||
| on and after December 31, 2005] | ||
| Item 9. | Purchases of Equity Securities by Closed-End Management Investment Companies and | |
| Affiliated Purchasers. | ||
| Not applicable. [CLOSED-END FUNDS ONLY] | ||
| Item 10. | Submission of Matters to a Vote of Security Holders. | |
| There have been no material changes to the procedures applicable to Item 10. | ||
| Item 11. | Controls and Procedures. | |
(a) The Registrant's principal executive and principal financial officers have concluded, based on their evaluation of the Registrant's disclosure controls and procedures as of a date within 90 days of the filing date of this report, that the Registrant's disclosure controls and procedures are reasonably designed to ensure that information required to be disclosed by the Registrant on Form N-CSR is recorded, processed, summarized and reported within the required time periods and that information required to be disclosed by the Registrant
in the reports that it files or submits on Form N-CSR is accumulated and communicated to the Registrant's management, including its principal executive and principal financial officers, as appropriate to allow timely decisions regarding required disclosure.
(b) There were no changes to the Registrant's internal control over financial reporting that occurred during the second fiscal quarter of the period covered by this report that have materially affected, or are reasonably likely to materially affect, the Registrant's internal control over financial reporting.
Item 12. Exhibits.
(a)(1) Code of ethics referred to in Item 2.
(a)(2) Certifications of principal executive and principal financial officers as required by Rule 30a-2(a) under the Investment Company Act of 1940.
(a)(3) Not applicable.
(b) Certification of principal executive and principal financial officers as required by Rule 30a-2(b) under the Investment Company Act of 1940.
| SIGNATURES |
Pursuant to the requirements of the Securities Exchange Act of 1934 and the Investment Company Act of 1940, the Registrant has duly caused this Report to be signed on its behalf by the undersigned, thereunto duly authorized.
| The Dreyfus Third Century Fund, Inc. By: /s/ J. David Officer J. David Officer, President Date: July 23, 2009 |
Pursuant to the requirements of the Securities Exchange Act of 1934 and the Investment Company Act of 1940, this Report has been signed below by the following persons on behalf of the Registrant and in the capacities and on the dates indicated.
| By: /s/ J. David Officer J. David Officer, President Date: July 23, 2009 By: /s/ James Windels James Windels, Treasurer Date: July 23, 2009 |
EXHIBIT INDEX
(a)(1) Code of ethics referred to in Item 2.
(a)(2) Certifications of principal executive and principal financial officers as required by Rule 30a-2(a) under the Investment Company Act of 1940. (EX-99.CERT)
(b) Certification of principal executive and principal financial officers as required by Rule 30a-2(b) under the Investment Company Act of 1940. (EX-99.906CERT)