UNITED STATES
SECURITIES AND EXCHANGE COMMISSION
Washington, D.C. 20549
FORM N-CSR
CERTIFIED SHAREHOLDER REPORT OF REGISTERED MANAGEMENT
INVESTMENT COMPANIES
Investment Company Act file number | 811-2192 | |||||
|
| |||||
| THE DREYFUS THIRD CENTURY FUND, INC. |
| ||||
| (Exact name of Registrant as specified in charter) |
| ||||
|
|
| ||||
|
c/o The Dreyfus Corporation 200 Park Avenue New York, New York 10166 |
| ||||
| (Address of principal executive offices) (Zip code) |
| ||||
|
|
| ||||
| Michael A. Rosenberg, Esq. 200 Park Avenue New York, New York 10166 |
| ||||
| (Name and address of agent for service) |
| ||||
| ||||||
Registrant's telephone number, including area code: | (212) 922-6000 | |||||
|
| |||||
Date of fiscal year end:
| 05/31 |
| ||||
Date of reporting period: | 05/31/11 |
| ||||
| The Dreyfus |
| Third Century Fund, Inc. |
ANNUAL REPORT May 31, 2011
Save time. Save paper. View your next shareholder report online as soon as it’s available. Log into www.dreyfus.com and sign up for Dreyfus eCommunications. It’s simple and only takes a few minutes.
The views expressed in this report reflect those of the portfolio manager only through the end of the period covered and do not necessarily represent the views of Dreyfus or any other person in the Dreyfus organization. Any such views are subject to change at any time based upon market or other conditions and Dreyfus disclaims any responsibility to update such views.These views may not be relied on as investment advice and, because investment decisions for a Dreyfus fund are based on numerous factors, may not be relied on as an indication of trading intent on behalf of any Dreyfus fund.
| Not FDIC-Insured • Not Bank-Guaranteed • May Lose Value |
Contents | |
THE FUND | |
| 2 | A Letter from the Chairman and CEO |
| 3 | Discussion of Fund Performance |
| 6 | Fund Performance |
| 8 | Understanding Your Fund’s Expenses |
| 8 | Comparing Your Fund’s Expenses With Those of Other Funds |
| 9 | Statement of Investments |
| 13 | Statement of Assets and Liabilities |
| 14 | Statement of Operations |
| 15 | Statement of Changes in Net Assets |
| 17 | Financial Highlights |
| 22 | Notes to Financial Statements |
| 32 | Report of Independent Registered Public Accounting Firm |
| 33 | Important Tax Information |
| 34 | Board Members Information |
| 36 | Officers of the Fund |
FOR MORE INFORMATION | |
Back Cover |
The Dreyfus
Third Century Fund, Inc.
The Fund

A LETTER FROM THE CHAIRMAN AND CEO
Dear Shareholder:
We are pleased to present this annual report for The Dreyfus Third Century Fund, Inc., covering the 12-month period from June 1, 2010, through May 31, 2011. For information about how the fund performed during the reporting period, as well as general market perspectives, we provide a Discussion of Fund Performance on the pages that follow.
The U.S. economy appears to have hit a soft patch in the spring of 2011 after accelerating over the second half of 2010. Disappointing labor, housing and manufacturing data have come at a time of higher energy prices and some tightening of monetary policy in global markets. In our view, the current slowdown should be relatively brief as the world recovers from the supply shocks created by weather impacts on food production, the decline in Libyan oil exports and supply-chain disruptions stemming from Japan’s natural and nuclear disasters. The U.S. stock market produced mostly positive results in this choppy economic environment due to better-than-expected corporate earnings and robust ongoing industrial demand from the emerging markets.
We remain optimistic as the U.S. economy moves through the middle stages of its cycle. Indeed, global macroeconomic policy generally has remained stimulative despite the recent efforts of some central banks to forestall inflationary pressures. We continue to expect sustainable economic growth, a rising but volatile uptrend in inflation and an improving U.S. labor market in the months ahead.As always, to determine how these forces may affect your investments, we urge you to talk regularly with your financial advisor.
Thank you for your continued confidence and support.

Jonathan R. Baum
Chairman and Chief Executive Officer
The Dreyfus Corporation
June 15, 2011
2

DISCUSSION OF FUND PERFORMANCE
For the period of June 1, 2010, through May 31, 2011, as provided by Jocelin A. Reed, CFA, Portfolio Manager
Fund and Market Performance Overview
For the 12-month period ended May 31, 2011, The Dreyfus Third Century Fund’s Class A shares, Class B shares, Class C shares, Class I shares and Class Z shares produced total returns of 27.18%, 25.88%, 26.45%, 27.87% and 27.61%, respectively.1 In comparison, the fund’s benchmark, the Standard & Poor’s 500 Composite Stock Price Index (“S&P 500 Index”), provided a total return of 25.95% for the same period.2
Despite periodic bouts of market volatility, stocks generally rallied in a recovering economy.The fund produced returns that were higher than or similar to its benchmark, mainly due to successful stock selections in the financials, health care and information technology sectors.
The Fund’s Investment Approach
The fund seeks capital growth, with current income as a secondary goal. To pursue these goals, the fund invests primarily in the common stocks of companies that, in our opinion, meet traditional investment standards while conducting their businesses in a manner that contributes to the enhancement of the quality of life in America. Our strategy combines computer modeling techniques, fundamental analysis and risk management with a social investment process.
In selecting stocks, we begin with quantitative research to rank stocks within an industry or sector. Next, using fundamental analysis, we designate the most attractive securities as potential purchase candidates. We then evaluate potential purchase candidates to determine whether they meet the fund’s socially responsible investment criteria.We next select those companies we consider to be the most attractive based on financial considerations. If there is more than one company to choose from, we can select stocks of companies that exhibit positive records in the fund’s areas of social concern.
The fund normally focuses on large-cap growth stocks; however, it also may invest in value-oriented, midcap and small-cap stocks.
| The Fund | 3 |
DISCUSSION OF FUND PERFORMANCE (continued)
Improved Economic Confidence Fueled Market Rallies
The reporting period began amid a sovereign debt crisis in Europe and a sluggish recovery in the United States, which weighed on investor sentiment. By September 2010, however, the announcement of a new round of quantitative easing of U.S. monetary policy helped convince investors that the economy was unlikely to slip back into recession. A more optimistic outlook was reinforced by improvements in U.S. employment and consumer spending, better-than-expected economic data in Europe, higher corporate earnings and the passage of fiscally stimulative U.S. tax legislation.
The stock market rally was interrupted in February 2011, when political unrest in the Middle East led to sharply higher crude oil prices, and again in March, when devastating natural and nuclear disasters in Japan threatened one of the world’s largest economies. Although stocks soon bounced back from these unexpected shocks, disappointing U.S. economic data later in the spring dampened investor sentiment, and stocks gave back some of their previous gains.
Stock Selection Strategy Effective Across Markets
Our security selection strategy proved especially successful in the financials sector, where underweighted exposure to major U.S. banks helped the fund avoid their relative weakness. Instead, we favored capital markets participants such as The Nasdaq OMX Group,Waddell & Reed Financial,T. Rowe Price Group and Franklin Resources, which benefited from rallying equity markets. Among consumer finance companies, Discover Financial Services gained value after it avoided troubled loans and took advantage of international growth opportunities. In the health care sector, we favored smaller biotechnology companies over large pharmaceutical developers. Winners included Biogen Idec, which saw good results from trials of a new drug. Health insurers Humana and Aetna advanced after cutting costs and gaining subscribers. Successful stock selections in the information technology sector included companies with strong earnings momentum, including Accenture, International Business Machines and Apple.
On a negative note, our sector allocation strategy hurt relative performance, primarily due to underweighted exposure to the energy sector. Stock selections in the energy sector also disappointed when natural gas
4
prices rose at a slower pace than oil prices, hurting Nexen and EnCana. Mildly underweighted exposure to machinery stocks in the industrials sector also detracted from relative results.
Positioned for a More Selective Market Environment
Although a number of headwinds remain, we currently expect the economic recovery to persist. However, we believe that investors are likely to become more selective, favoring companies that can produce consistent revenues and earnings in a slow-growth economy. In our judgment, our bottom-up security selection process may be particularly well suited to such an environment.
Technology Companies Respond to Security Concerns
Our search for socially responsible businesses led us to a number of information technology companies with diverse workforces and sound environmental policies. In addition, with the advent of “cloud computing” in which data and applications are managed remotely, technology providers have paid greater attention to the security of users’ information, including protecting sensitive financial information from hackers. Fund holdings such as Microsoft, International Business Machines, Accenture, Apple and Google are confronting the challenges of protecting the end user information and privacy in unique ways. We believe these issues will pose both significant risks and opportunities for technology companies for years to come.
June 15, 2011
| Equity funds are subject generally to market, market sector, market liquidity, issuer and investment | |
| style risks, among other factors, to varying degrees, all of which are more fully described in the | |
| fund’s prospectus. | |
| 1 | Total return includes reinvestment of dividends and any capital gains paid, and does not take into |
| consideration the maximum initial sales charge in the case of Class A shares, or the applicable | |
| contingent deferred sales charges imposed on redemptions in the case of Class B and Class C | |
| shares. Had these charges been reflected, returns would have been lower. Past performance is no | |
| guarantee of future results. Share price and investment return fluctuate such that upon redemption, | |
| fund shares may be worth more or less than their original cost. | |
| 2 | SOURCE: LIPPER INC. — Reflects reinvestment of dividends and, where applicable, capital |
| gain distributions.The Standard & Poor’s 500 Composite Stock Price Index is a widely accepted, | |
| unmanaged index of U.S. stock market performance. Investors cannot invest directly in any index. |
| The Fund | 5 |
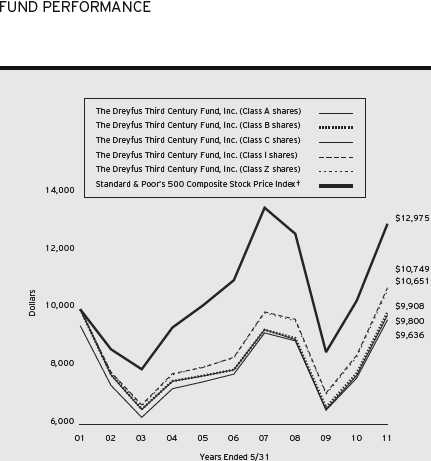
| Comparison of change in value of $10,000 investment in The Dreyfus Third Century Fund, Inc. |
| Class A shares, Class B shares, Class C shares, Class I shares and Class Z shares and the |
| Standard & Poor’s 500 Composite Stock Price Index |
| † Source: Lipper Inc. |
| Past performance is not predictive of future performance. |
| The above graph compares a $10,000 investment made in each of the Class A, Class B, Class C, Class I and Class Z |
| shares of The Dreyfus Third Century Fund, Inc. on 5/31/01 to a $10,000 investment made in the Standard & Poor’s |
| 500 Composite Stock Price Index (the “Index”) on that date.All dividends and capital gain distributions are reinvested. |
| The fund’s performance shown in the line graph above takes into account the maximum initial sales charge on Class A |
| shares and all other applicable fees and expenses on all classes. |
| The Dreyfus Third Century Fund, Inc. primarily seeks capital growth through investment in common stocks of companies |
| that the fund’s management believes not only meet traditional investment standards, but also show evidence that they |
| conduct their business in a manner that contributes to the enhancement of the quality of life in America. Current income |
| is a secondary goal. Performance for Class B shares assumes the conversion to Class A shares at the end of the sixth year |
| following the date of purchase.The Index is a widely accepted, unmanaged index of overall U.S. stock market |
| performance. Unlike a mutual fund, the Index is not subject to charges, fees and other expenses. Investors cannot invest |
| directly in any index.The Index is not subject to the same socially responsible investment criteria as The Dreyfus Third |
| Century Fund, Inc. Further information relating to fund performance, including expense reimbursements, if applicable, is |
| contained in the Financial Highlights section of the prospectus and elsewhere in this report. |
6
| Average Annual Total Returns as of 5/31/11 | |||
| 1 Year | 5 Years | 10 Years | |
| Class A shares | |||
| with maximum sales charge (5.75%) | 19.87% | 3.56% | –0.20% |
| without sales charge | 27.18% | 4.80% | 0.39% |
| Class B shares | |||
| with applicable redemption charge † | 21.88% | 3.44% | –0.09% |
| without redemption | 25.88% | 3.78% | –0.09% |
| Class C shares | |||
| with applicable redemption charge †† | 25.45% | 4.03% | –0.37% |
| without redemption | 26.45% | 4.03% | –0.37% |
| Class I shares | 27.87% | 5.22% | 0.73% |
| Class Z shares | 27.61% | 5.09% | 0.63% |
| Standard & Poor’s 500 | |||
| Composite Stock Price Index | 25.95% | 3.32% | 2.64% |
Past performance is not predictive of future performance.The fund’s performance shown in the graph and table does not reflect the deduction of taxes that a shareholder would pay on fund distributions or the redemption of fund shares.
| † | The maximum contingent deferred sales charge for Class B shares is 4%.After six years Class B shares convert to |
| Class A shares. | |
| †† | The maximum contingent deferred sales charge for Class C shares is 1% for shares redeemed within one year of the |
| date of purchase. |
| The Fund | 7 |
UNDERSTANDING YOUR FUND’S EXPENSES (Unaudited)
As a mutual fund investor, you pay ongoing expenses, such as management fees and other expenses. Using the information below, you can estimate how these expenses affect your investment and compare them with the expenses of other funds.You also may pay one-time transaction expenses, including sales charges (loads) and redemption fees, which are not shown in this section and would have resulted in higher total expenses. For more information, see your fund’s prospectus or talk to your financial adviser.
Review your fund’s expenses
The table below shows the expenses you would have paid on a $1,000 investment in The Dreyfus Third Century Fund, Inc. from December 1, 2010 to May 31, 2011. It also shows how much a $1,000 investment would be worth at the close of the period, assuming actual returns and expenses.
Expenses and Value of a $1,000 Investment
assuming actual returns for the six months ended May 31, 2011
| Class A | Class B | Class C | Class I | Class Z | |
| Expenses paid per $1,000† | $ 7.83 | $ 13.69 | $ 10.76 | $ 4.84 | $ 5.58 |
| Ending value (after expenses) | $1,151.90 | $1,145.60 | $1,147.50 | $1,154.80 | $1,153.70 |
COMPARING YOUR FUND’S EXPENSES
WITH THOSE OF OTHER FUNDS (Unaudited)
Using the SEC’s method to compare expenses
The Securities and Exchange Commission (SEC) has established guidelines to help investors assess fund expenses. Per these guidelines, the table below shows your fund’s expenses based on a $1,000 investment, assuming a hypothetical 5% annualized return. You can use this information to compare the ongoing expenses (but not transaction expenses or total cost) of investing in the fund with those of other funds.All mutual fund shareholder reports will provide this information to help you make this comparison. Please note that you cannot use this information to estimate your actual ending account balance and expenses paid during the period.
Expenses and Value of a $1,000 Investment
assuming a hypothetical 5% annualized return for the six months ended May 31, 2011
| Class A | Class B | Class C | Class I | Class Z | |
| Expenses paid per $1,000† | $ 7.34 | $ 12.84 | $ 10.10 | $ 4.53 | $ 5.24 |
| Ending value (after expenses) | $1,017.65 | $1,012.17 | $1,014.91 | $1,020.44 | $1,019.75 |
| † Expenses are equal to the fund’s annualized expense ratio of 1.46% for Class A, 2.56% for Class B, 2.01% for |
| Class C, .90% for Class I and 1.04% for Class Z, multiplied by the average account value over the period, |
| multiplied by 182/365 (to reflect the one-half year period). |
8
STATEMENT OF INVESTMENTS
May 31, 2011
| Common Stocks—99.1% | Shares | Value ($) |
| Consumer Discretionary—10.9% | ||
| Best Buy | 72,300 | 2,296,248 |
| Discovery Communications, Cl. A | 30,000 a | 1,306,800 |
| Gap | 179,150 | 3,475,510 |
| Limited Brands | 76,200 | 3,044,952 |
| McDonald’s | 29,075 | 2,370,775 |
| McGraw-Hill | 76,100 | 3,231,967 |
| Starbucks | 125,100 | 4,602,429 |
| Target | 43,900 | 2,174,367 |
| TJX | 81,325 | 4,311,851 |
| Weight Watchers International | 29,950 | 2,403,188 |
| 29,218,087 | ||
| Consumer Staples—10.3% | ||
| Church & Dwight | 45,050 | 3,788,705 |
| Costco Wholesale | 76,775 | 6,332,402 |
| Hershey | 53,600 | 2,987,128 |
| Kimberly-Clark | 22,325 | 1,524,797 |
| PepsiCo | 29,850 | 2,122,932 |
| Procter & Gamble | 106,450 | 7,132,150 |
| Whole Foods Market | 61,600 | 3,767,456 |
| 27,655,570 | ||
| Energy—6.8% | ||
| Devon Energy | 53,200 | 4,472,524 |
| EnCana | 79,800 | 2,721,180 |
| Exterran Holdings | 111,000 a | 2,392,050 |
| Forest Oil | 94,000 a | 2,810,600 |
| ION Geophysical | 213,800 a,b | 2,157,242 |
| Nexen | 99,775 | 2,304,802 |
| Venoco | 85,277 a | 1,253,572 |
| 18,111,970 | ||
| Financial—13.7% | ||
| Berkshire Hathaway, Cl. B | 37,300 a | 2,949,311 |
| Comerica | 78,900 | 2,849,079 |
| Discover Financial Services | 101,375 | 2,416,780 |
| First Horizon National | 191,679 | 2,014,546 |
| Franklin Resources | 23,100 | 2,993,298 |
| The Fund | 9 |
STATEMENT OF INVESTMENTS (continued)
| Common Stocks (continued) | Shares | Value ($) |
| Financial (continued) | ||
| International Bancshares | 131,400 | 2,242,998 |
| Investment Technology Group | 86,850 a | 1,314,909 |
| KeyCorp | 179,500 | 1,520,365 |
| Nasdaq OMX Group | 82,600 a | 2,107,952 |
| PNC Financial Services Group | 73,200 | 4,569,144 |
| State Street | 42,800 | 1,958,956 |
| T. Rowe Price Group | 48,700 | 3,082,710 |
| Travelers | 45,975 | 2,854,128 |
| Waddell & Reed Financial, Cl. A | 95,200 | 3,674,720 |
| 36,548,896 | ||
| Health Care—12.6% | ||
| Aetna | 95,900 | 4,188,912 |
| Amgen | 34,425 a | 2,084,089 |
| AstraZeneca, ADR | 45,775 b | 2,398,610 |
| Becton Dickinson & Co. | 33,750 | 2,954,812 |
| Biogen Idec | 40,900 a | 3,874,457 |
| Bristol-Myers Squibb | 150,300 | 4,322,628 |
| Gilead Sciences | 65,250 a | 2,723,535 |
| Humana | 45,550 | 3,668,142 |
| Kinetic Concepts | 48,650 a | 2,886,891 |
| Life Technologies | 57,900 a | 3,009,063 |
| Novartis, ADR | 24,525 | 1,582,353 |
| 33,693,492 | ||
| Industrial—10.5% | ||
| 3M | 29,775 | 2,810,165 |
| Brink’s | 44,400 | 1,320,900 |
| Caterpillar | 37,900 | 4,009,820 |
| Cummins | 17,600 | 1,852,224 |
| Donaldson | 24,575 | 1,467,373 |
| Eaton | 50,800 | 2,624,836 |
| Emerson Electric | 91,225 | 4,976,324 |
| General Electric | 196,900 | 3,867,116 |
| Ryder System | 41,650 | 2,290,750 |
| United Technologies | 32,450 | 2,848,137 |
| 28,067,645 |
10
| Common Stocks (continued) | Shares | Value ($) |
| Information Technology—22.6% | ||
| Accenture, Cl. A | 66,000 | 3,787,740 |
| Apple | 15,175 a | 5,278,320 |
| Avnet | 48,450 a | 1,753,890 |
| CA | 81,500 | 1,907,100 |
| Cisco Systems | 151,425 | 2,543,940 |
| EMC | 183,025 a | 5,210,722 |
| First Solar | 10,500 a,b | 1,304,625 |
| Google, Cl. A | 9,800 a | 5,184,396 |
| Intel | 185,100 | 4,166,601 |
| International Business Machines | 50,650 | 8,556,305 |
| Microsoft | 347,100 | 8,680,971 |
| Oracle | 114,675 | 3,924,179 |
| QUALCOMM | 76,700 | 4,493,853 |
| Symantec | 83,750 a | 1,637,313 |
| Western Union | 98,175 | 2,018,478 |
| 60,448,433 | ||
| Materials—6.3% | ||
| Alcoa | 315,200 | 5,298,512 |
| Domtar | 31,500 | 3,228,120 |
| Ecolab | 81,000 | 4,445,280 |
| Schnitzer Steel Industries, Cl. A | 32,750 | 1,935,525 |
| Sigma-Aldrich | 26,600 | 1,869,714 |
| 16,777,151 | ||
| Telecommunication | ||
| Services—3.0% | ||
| Metropcs Communications | 234,200 a | 4,192,180 |
| Verizon Communications | 103,700 | 3,829,641 |
| 8,021,821 | ||
| Utilities—2.4% | ||
| Consolidated Edison | 39,100 | 2,074,646 |
| Sempra Energy | 60,775 | 3,352,957 |
| WGL Holdings | 28,625 | 1,123,531 |
| 6,551,134 | ||
| Total Common Stocks | ||
| (cost $218,810,606) | 265,094,199 |
| The Fund | 11 |
STATEMENT OF INVESTMENTS (continued)
| Other Investment—.8% | Shares | Value ($) |
| Registered Investment Company; | ||
| Dreyfus Institutional Preferred | ||
| Plus Money Market Fund | ||
| (cost $2,099,000) | 2,099,000 c | 2,099,000 |
| Investment of Cash Collateral | ||
| for Securities Loaned—1.5% | ||
| Registered Investment Company; | ||
| Dreyfus Institutional Cash | ||
| Advantage Plus Fund | ||
| (cost $4,091,062) | 4,091,062 c | 4,091,062 |
| Total Investments (cost $225,000,668) | 101.4% | 271,284,261 |
| Liabilities, Less Cash and Receivables | (1.4%) | (3,842,829) |
| Net Assets | 100.0% | 267,441,432 |
ADR—American Depository Receipts
| a Non-income producing security. |
| b Securities, or portion thereof, on loan.At May 31, 2011, the value of the fund’s securities on loan was $4,079,847 |
| and the value of the collateral held by the fund was $4,091,062. |
| c Investment in affiliated money market mutual fund. |
| Portfolio Summary (Unaudited)† | |||
| Value (%) | Value (%) | ||
| Information Technology | 22.6 | Energy | 6.8 |
| Financial | 13.7 | Materials | 6.3 |
| Health Care | 12.6 | Telecommunication Services | 3.0 |
| Consumer Discretionary | 10.9 | Utilities | 2.4 |
| Industrial | 10.5 | Money Market Investments | 2.3 |
| Consumer Staples | 10.3 | 101.4 | |
| † Based on net assets. | |||
| See notes to financial statements. | |||
12
| STATEMENT OF ASSETS AND LIABILITIES |
| May 31, 2011 |
| Cost | Value | ||||
| Assets ($): | |||||
| Investments in securities—See Statement of Investments (including | |||||
| securities on loan, valued at $4,079,847)—Note 1(b): | |||||
| Unaffiliated issuers | 218,810,606 | 265,094,199 | |||
| Affiliated issuers | 6,190,062 | 6,190,062 | |||
| Cash | 382,792 | ||||
| Dividends and interest receivable | 364,013 | ||||
| Receivable for shares of Common Stock subscribed | 86,764 | ||||
| Prepaid expenses | 30,630 | ||||
| 272,148,460 | |||||
| Liabilities ($): | |||||
| Due to The Dreyfus Corporation and affiliates—Note 3(c) | 235,295 | ||||
| Liability for securities on loan—Note 1(b) | 4,091,062 | ||||
| Payable for shares of Common Stock redeemed | 252,582 | ||||
| Accrued expenses | 128,089 | ||||
| 4,707,028 | |||||
| Net Assets ($) | 267,441,432 | ||||
| Composition of Net Assets ($): | |||||
| Paid-in capital | 240,065,018 | ||||
| Accumulated undistributed investment income—net | 1,604,985 | ||||
| Accumulated net realized gain (loss) on investments | (20,512,164) | ||||
| Accumulated net unrealized appreciation | |||||
| (depreciation) on investments | 46,283,593 | ||||
| Net Assets ($) | 267,441,432 | ||||
| Net Asset Value Per Share | |||||
| Class A | Class B | Class C | Class I | Class Z | |
| Net Assets ($) | 15,153,754 | 249,622 | 2,943,835 | 2,043,467 | 247,050,754 |
| Shares Outstanding | 1,428,355 | 25,795 | 300,263 | 189,689 | 22,955,775 |
| Net Asset Value | |||||
| Per Share ($) | 10.61 | 9.68 | 9.80 | 10.77 | 10.76 |
| See notes to financial statements. | |||||
| The Fund | 13 |
| STATEMENT OF OPERATIONS |
| Year Ended May 31, 2011 |
| Investment Income ($): | |
| Income: | |
| Cash dividends (net of $32,733 foreign taxes withheld at source): | |
| Unaffiliated issuers | 4,175,384 |
| Affiliated issuers | 5,204 |
| Income from securities lending—Note 1(b) | 63,400 |
| Interest | 2 |
| Total Income | 4,243,990 |
| Expenses: | |
| Management fee—Note 3(a) | 1,859,300 |
| Shareholder servicing costs—Note 3(c) | 579,500 |
| Professional fees | 70,468 |
| Registration fees | 48,390 |
| Distribution fees—Note 3(b) | 24,240 |
| Custodian fees—Note 3(c) | 18,539 |
| Prospectus and shareholders’ reports | 16,782 |
| Directors’ fees and expenses—Note 3(d) | 4,601 |
| Loan commitment fees—Note 2 | 1,526 |
| Miscellaneous | 12,133 |
| Total Expenses | 2,635,479 |
| Less—reduction in fees due to earnings credits—Note 3(c) | (1,433) |
| Net Expenses | 2,634,046 |
| Investment Income—Net | 1,609,944 |
| Realized and Unrealized Gain (Loss) on Investments—Note 4 ($): | |
| Net realized gain (loss) on investments | 19,513,092 |
| Net unrealized appreciation (depreciation) on investments | 39,275,919 |
| Net Realized and Unrealized Gain (Loss) on Investments | 58,789,011 |
| Net Increase in Net Assets Resulting from Operations | 60,398,955 |
| See notes to financial statements. | |
14
STATEMENT OF CHANGES IN NET ASSETS
| Year Ended May 31, | ||
| 2011 | 2010 | |
| Operations ($): | ||
| Investment income—net | 1,609,944 | 1,356,415 |
| Net realized gain (loss) on investments | 19,513,092 | (3,460,830) |
| Net unrealized appreciation | ||
| (depreciation) on investments | 39,275,919 | 40,196,335 |
| Net Increase (Decrease) in Net Assets | ||
| Resulting from Operations | 60,398,955 | 38,091,920 |
| Dividends to Shareholders from ($): | ||
| Investment income—net: | ||
| Class A Shares | (29,083) | — |
| Class C Shares | — | (6,429) |
| Class I Shares | (11,988) | (14,624) |
| Class Z Shares | (1,318,966) | (1,783,245) |
| Total Dividends | (1,360,037) | (1,804,298) |
| Capital Stock Transactions ($): | ||
| Net proceeds from shares sold: | ||
| Class A Shares | 1,669,152 | 2,201,851 |
| Class B Shares | — | 3,000 |
| Class C Shares | 992,245 | 1,020,042 |
| Class I Shares | 375,106 | 921,301 |
| Class Z Shares | 4,584,224 | 5,255,557 |
| Dividends reinvested: | ||
| Class A Shares | 27,372 | — |
| Class C Shares | — | 4,948 |
| Class I Shares | 3,945 | 6,031 |
| Class Z Shares | 1,251,951 | 1,694,984 |
| Cost of shares redeemed: | ||
| Class A Shares | (3,095,043) | (33,689,494) |
| Class B Shares | (277,661) | (565,443) |
| Class C Shares | (1,367,136) | (543,780) |
| Class I Shares | (397,735) | (505,144) |
| Class Z Shares | (24,062,734) | (21,873,829) |
| Increase (Decrease) in Net Assets | ||
| from Capital Stock Transactions | (20,296,314) | (46,069,976) |
| Total Increase (Decrease) in Net Assets | 38,742,604 | (9,782,354) |
| Net Assets ($): | ||
| Beginning of Period | 228,698,828 | 238,481,182 |
| End of Period | 267,441,432 | 228,698,828 |
| Undistributed investment income—net | 1,604,985 | 1,355,078 |
| The Fund | 15 |
STATEMENT OF CHANGES IN NET ASSETS (continued)
| Year Ended May 31, | ||
| 2011 | 2010 | |
| Capital Share Transactions: | ||
| Class Aa | ||
| Shares sold | 168,893 | 271,695 |
| Shares issued for dividends reinvested | 2,851 | — |
| Shares redeemed | (329,302) | (4,691,360) |
| Net Increase (Decrease) in Shares Outstanding | (157,558) | (4,419,665) |
| Class Ba | ||
| Shares sold | — | 395 |
| Shares redeemed | (31,784) | (74,285) |
| Net Increase (Decrease) in Shares Outstanding | (31,784) | (73,890) |
| Class C | ||
| Shares sold | 108,697 | 142,155 |
| Shares issued for dividends reinvested | — | 629 |
| Shares redeemed | (150,482) | (70,276) |
| Net Increase (Decrease) in Shares Outstanding | (41,785) | 72,508 |
| Class I | ||
| Shares sold | 40,354 | 108,410 |
| Shares issued for dividends reinvested | 406 | 703 |
| Shares redeemed | (45,741) | (59,345) |
| Net Increase (Decrease) in Shares Outstanding | (4,981) | 49,768 |
| Class Z | ||
| Shares sold | 469,674 | 623,371 |
| Shares issued for dividends reinvested | 128,798 | 198,029 |
| Shares redeemed | (2,498,016) | (2,587,191) |
| Net Increase (Decrease) in Shares Outstanding | (1,899,544) | (1,765,791) |
| a During the period ended May 31, 2011, 19,854 Class B shares representing $175,391 were automatically |
| converted to 18,188 Class A shares and during the period ended May 31, 2010, 48,561 Class B shares |
| representing $369,025 were automatically converted to 44,963 Class A shares. |
See notes to financial statements.
16
FINANCIAL HIGHLIGHTS
The following tables describe the performance for each share class for the fiscal periods indicated.All information (except portfolio turnover rate) reflects financial results for a single fund share.Total return shows how much your investment in the fund would have increased (or decreased) during each period, assuming you had reinvested all dividends and distributions.These figures have been derived from the fund’s financial statements.
| Year Ended May 31, | |||||
| Class A Shares | 2011 | 2010 | 2009 | 2008 | 2007 |
| Per Share Data ($): | |||||
| Net asset value, beginning of period | 8.36 | 7.08 | 9.72 | 10.05 | 8.48 |
| Investment Operations: | |||||
| Investment income—neta | .03 | .03 | .05 | .01 | .02 |
| Net realized and unrealized | |||||
| gain (loss) on investments | 2.24 | 1.25 | (2.65) | (.32) | 1.55 |
| Total from Investment Operations | 2.27 | 1.28 | (2.60) | (.31) | 1.57 |
| Distributions: | |||||
| Dividends from investment income—net | (.02) | — | (.04) | (.02) | — |
| Net asset value, end of period | 10.61 | 8.36 | 7.08 | 9.72 | 10.05 |
| Total Return (%)b | 27.18 | 18.08 | (26.73) | (3.06) | 18.52 |
| Ratios/Supplemental Data (%): | |||||
| Ratio of total expenses | |||||
| to average net assets | 1.39 | 1.35 | 1.31 | 1.35 | 1.29 |
| Ratio of net expenses | |||||
| to average net assets | 1.39 | 1.35 | 1.30 | 1.35 | 1.29 |
| Ratio of net investment income | |||||
| to average net assets | .32 | .40 | .70 | .06 | .18 |
| Portfolio Turnover Rate | 50.46 | 35.17 | 40.27 | 21.97 | 22.75 |
| Net Assets, end of period ($ x 1,000) | 15,154 | 13,252 | 42,532 | 15,066 | 15,411 |
| a | Based on average shares outstanding at each month end. |
| b | Exclusive of sales charge. |
See notes to financial statements.
| The Fund | 17 |
FINANCIAL HIGHLIGHTS (continued)
| Year Ended May 31, | |||||
| Class B Shares | 2011 | 2010 | 2009 | 2008 | 2007 |
| Per Share Data ($): | |||||
| Net asset value, beginning of period | 7.69 | 6.59 | 9.09 | 9.45 | 8.04 |
| Investment Operations: | |||||
| Investment (loss)—neta | (.06) | (.06) | (.03) | (.06) | (.06) |
| Net realized and unrealized | |||||
| gain (loss) on investments | 2.05 | 1.16 | (2.47) | (.30) | 1.47 |
| Total from Investment Operations | 1.99 | 1.10 | (2.50) | (.36) | 1.41 |
| Net asset value, end of period | 9.68 | 7.69 | 6.59 | 9.09 | 9.45 |
| Total Return (%)b | 25.88 | 16.69 | (27.50) | (3.81) | 17.54 |
| Ratios/Supplemental Data (%): | |||||
| Ratio of total expenses | |||||
| to average net assets | 2.43 | 2.43 | 2.28 | 2.12 | 2.18 |
| Ratio of net expenses | |||||
| to average net assets | 2.43 | 2.43 | 2.27 | 2.12 | 2.18 |
| Ratio of net investment (loss) | |||||
| to average net assets | (.72) | (.74) | (.49) | (.74) | (.77) |
| Portfolio Turnover Rate | 50.46 | 35.17 | 40.27 | 21.97 | 22.75 |
| Net Assets, end of period ($ x 1,000) | 250 | 443 | 867 | 2,202 | 4,762 |
| a | Based on average shares outstanding at each month end. |
| b | Exclusive of sales charge. |
See notes to financial statements.
18
| Year Ended May 31, | |||||
| Class C Shares | 2011 | 2010 | 2009 | 2008 | 2007 |
| Per Share Data ($): | |||||
| Net asset value, beginning of period | 7.75 | 6.63 | 9.13 | 9.48 | 8.06 |
| Investment Operations: | |||||
| Investment (loss)—neta | (.03) | (.03) | (.02) | (.06) | (.05) |
| Net realized and unrealized | |||||
| gain (loss) on investments | 2.08 | 1.17 | (2.48) | (.29) | 1.47 |
| Total from Investment Operations | 2.05 | 1.14 | (2.50) | (.35) | 1.42 |
| Distributions: | |||||
| Dividends from investment income—net | — | (.02) | — | — | — |
| Net asset value, end of period | 9.80 | 7.75 | 6.63 | 9.13 | 9.48 |
| Total Return (%)b | 26.45 | 17.16 | (27.38) | (3.69) | 17.62 |
| Ratios/Supplemental Data (%): | |||||
| Ratio of total expenses | |||||
| to average net assets | 2.00 | 2.09 | 2.14 | 2.01 | 2.00 |
| Ratio of net expenses | |||||
| to average net assets | 2.00 | 2.09 | 2.14 | 2.00 | 2.00 |
| Ratio of net investment (loss) | |||||
| to average net assets | (.29) | (.39) | (.29) | (.60) | (.53) |
| Portfolio Turnover Rate | 50.46 | 35.17 | 40.27 | 21.97 | 22.75 |
| Net Assets, end of period ($ x 1,000) | 2,944 | 2,652 | 1,788 | 2,487 | 3,538 |
| a | Based on average shares outstanding at each month end. |
| b | Exclusive of sales charge. |
See notes to financial statements.
| The Fund | 19 |
FINANCIAL HIGHLIGHTS (continued)
| Year Ended May 31, | |||||
| Class I Shares | 2011 | 2010 | 2009 | 2008a | 2007 |
| Per Share Data ($): | |||||
| Net asset value, beginning of period | 8.48 | 7.23 | 9.90 | 10.23 | 8.60 |
| Investment Operations: | |||||
| Investment income—netb | .08 | .06 | .07 | .05 | .05 |
| Net realized and unrealized | |||||
| gain (loss) on investments | 2.28 | 1.27 | (2.69) | (.32) | 1.58 |
| Total from Investment Operations | 2.36 | 1.33 | (2.62) | (.27) | 1.63 |
| Distributions: | |||||
| Dividends from investment income—net | (.07) | (.08) | (.05) | (.06) | — |
| Net asset value, end of period | 10.77 | 8.48 | 7.23 | 9.90 | 10.23 |
| Total Return (%) | 27.87 | 18.43 | (26.47) | (2.65) | 18.95 |
| Ratios/Supplemental Data (%): | |||||
| Ratio of total expenses | |||||
| to average net assets | .89 | 1.01 | .95 | .94 | .87 |
| Ratio of net expenses | |||||
| to average net assets | .89 | 1.01 | .95 | .94 | .87 |
| Ratio of net investment income | |||||
| to average net assets | .83 | .71 | .92 | .51 | .58 |
| Portfolio Turnover Rate | 50.46 | 35.17 | 40.27 | 21.97 | 22.75 |
| Net Assets, end of period ($ x 1,000) | 2,043 | 1,651 | 1,048 | 1,206 | 712 |
| a | Effective June 1, 2007, Class R shares were redesignated as Class I shares. |
| b | Based on average shares outstanding at each month end. |
See notes to financial statements.
20
| Year Ended May 31, | |||||
| Class Z Shares | 2011 | 2010 | 2009 | 2008 | 2007 |
| Per Share Data ($): | |||||
| Net asset value, beginning of period | 8.48 | 7.22 | 9.88 | 10.21 | 8.59 |
| Investment Operations: | |||||
| Investment income—neta | .07 | .05 | .05 | .04 | .04 |
| Net realized and unrealized | |||||
| gain (loss) on investments | 2.27 | 1.28 | (2.68) | (.33) | 1.58 |
| Total from Investment Operations | 2.34 | 1.33 | (2.63) | (.29) | 1.62 |
| Distributions: | |||||
| Dividends from investment income—net | (.06) | (.07) | (.03) | (.04) | — |
| Net asset value, end of period | 10.76 | 8.48 | 7.22 | 9.88 | 10.21 |
| Total Return (%) | 27.61 | 18.40 | (26.56) | (2.82) | 18.86 |
| Ratios/Supplemental Data (%): | |||||
| Ratio of total expenses | |||||
| to average net assets | 1.03 | 1.10 | 1.11 | 1.01 | 1.02 |
| Ratio of net expenses | |||||
| to average net assets | 1.03 | 1.10 | 1.10 | 1.00 | 1.02 |
| Ratio of net investment income | |||||
| to average net assets | .68 | .60 | .73 | .40 | .43 |
| Portfolio Turnover Rate | 50.46 | 35.17 | 40.27 | 21.97 | 22.75 |
| Net Assets, end of period ($ x 1,000) | 247,051 | 210,701 | 192,247 | 291,213 | 334,808 |
| a Based on average shares outstanding at each month end. |
| See notes to financial statements. |
| The Fund | 21 |
NOTES TO FINANCIAL STATEMENTS
NOTE 1—Significant Accounting Policies:
The Dreyfus Third Century Fund, Inc. (the “fund”) is registered under the Investment Company Act of 1940, as amended (the “Act”), as a diversified open-end management investment company. The fund’s investment objective is to provide capital growth. The Dreyfus Corporation (the “Manager” or “Dreyfus”), a wholly-owned subsidiary of The Bank of NewYork Mellon Corporation (“BNY Mellon”), serves as the fund’s investment adviser.
MBSC Securities Corporation (the “Distributor”), a wholly-owned subsidiary of the Manager, is the distributor of the fund’s shares.The fund is authorized to issue 100 million shares of $.001 par value Common Stock in each of the following classes of shares: Class A, Class B, Class C and Class I and 200 million shares of $.001 par value Common Stock of Class Z. Class A shares are subject to a sales charge imposed at the time of purchase. Class B shares are subject to a contingent deferred sales charge (“CDSC”) imposed on Class B share redemptions made within six years of purchase and automatically convert to Class A shares after six years.The fund no longer offers Class B shares, except in connection with dividend reinvestment and permitted exchanges of Class B shares. Class C shares are subject to a CDSC imposed on Class C shares redeemed within one year of purchase. Class I shares are sold at net asset value per share only to institutional investors. Class Z shares generally are not available for new accounts. Other differences between the classes include the services offered to and the expenses borne by each class, the allocation of certain transfer agency costs and certain voting rights. Income, expenses (other than expenses attributable to a specific class), and realized and unrealized gains or losses on investments are allocated to each class of shares based on its relative net assets.
The Financial Accounting Standards Board (“FASB”) Accounting Standards Codification (“ASC”) is the exclusive reference of authoritative U.S. generally accepted accounting principles (“GAAP”) recognized by the FASB to be applied by nongovernmental entities. Rules and interpretive releases of the Securities and Exchange Commission (“SEC”)
22
under authority of federal laws are also sources of authoritative GAAP for SEC registrants. The fund’s financial statements are prepared in accordance with GAAP, which may require the use of management estimates and assumptions.Actual results could differ from those estimates.
The fund enters into contracts that contain a variety of indemnifications. The fund’s maximum exposure under these arrangements is unknown.The fund does not anticipate recognizing any loss related to these arrangements.
(a) Portfolio valuation: Investments in securities are valued at the last sales price on the securities exchange or national securities market on which such securities are primarily traded. Securities listed on the National Market System for which market quotations are available are valued at the official closing price or, if there is no official closing price that day, at the last sales price. Securities not listed on an exchange or the national securities market, or securities for which there were no transactions, are valued at the average of the most recent bid and asked prices, except for open short positions, where the asked price is used for valuation purposes. Bid price is used when no asked price is available. Registered investment companies that are not traded on an exchange are valued at their net asset value.When market quotations or official closing prices are not readily available, or are determined not to reflect accurately fair value, such as when the value of a security has been significantly affected by events after the close of the exchange or market on which the security is principally traded (for example, a foreign exchange or market), but before the fund calculates its net asset value, the fund may value these investments at fair value as determined in accordance with the procedures approved by the Board of Directors. Fair valuing of securities may be determined with the assistance of a pricing service using calculations based on indices of domestic securities and other appropriate indicators, such as prices of relevant ADRs and futures contracts. For other securities that are fair valued by the Board of Directors, certain factors may be considered such as: fundamental analytical data, the nature and duration of
| The Fund | 23 |
NOTES TO FINANCIAL STATEMENTS (continued)
restrictions on disposition, an evaluation of the forces that influence the market in which the securities are purchased and sold, and public trading in similar securities of the issuer or comparable issuers.
The fair value of a financial instrument is the amount that would be received to sell an asset or paid to transfer a liability in an orderly transaction between market participants at the measurement date (i.e. the exit price). GAAP establishes a fair value hierarchy that prioritizes the inputs of valuation techniques used to measure fair value.This hierarchy gives the highest priority to unadjusted quoted prices in active markets for identical assets or liabilities (Level 1 measurements) and the lowest priority to unobservable inputs (Level 3 measurements).
Additionally, GAAP provides guidance on determining whether the volume and activity in a market has decreased significantly and whether such a decrease in activity results in transactions that are not orderly. GAAP requires enhanced disclosures around valuation inputs and techniques used during annual and interim periods.
Various inputs are used in determining the value of the fund’s investments relating to fair value measurements.These inputs are summarized in the three broad levels listed below:
Level 1—unadjusted quoted prices in active markets for identical investments.
Level 2—other significant observable inputs (including quoted prices for similar investments, interest rates, prepayment speeds, credit risk, etc.).
Level 3—significant unobservable inputs (including the fund’s own assumptions in determining the fair value of investments).
The inputs or methodology used for valuing securities are not necessarily an indication of the risk associated with investing in those securities.
24
The following is a summary of the inputs used as of May 31, 2011 in valuing the fund’s investments:
| Level 2—Other | Level 3— | |||
| Level 1— | Significant | Significant | ||
| Unadjusted | Observable | Unobservable | ||
| Quoted Prices | Inputs | Inputs | Total | |
| Assets ($) | ||||
| Investments in Securities: | ||||
| Equity Securities— | ||||
| Domestic† | 256,087,254 | — | — | 256,087,254 |
| Equity Securities— | ||||
| Foreign† | 9,006,945 | — | — | 9,006,945 |
| Mutual Funds | 6,190,062 | — | — | 6,190,062 |
| † See Statement of Investments for additional detailed categorizations. | ||||
In January 2010, FASB issued Accounting Standards Update (“ASU”) No. 2010-06 “Improving Disclosures about FairValue Measurements”. The portions of ASU No. 2010-06 which require reporting entities to prepare new disclosures surrounding amounts and reasons for significant transfers in and out of Level 1 and Level 2 fair value measurements as well as inputs and valuation techniques used to measure fair value for both recurring and nonrecurring fair value measurements that fall in either Level 2 or Level 3 have been adopted by the fund. No significant transfers between Level 1 or Level 2 fair value measurements occurred at May 31, 2011.
In May 2011, FASB issued ASU No. 2011-04 “Amendments to Achieve Common Fair Value Measurement and Disclosure Requirements in GAAP and International Financial Reporting Standards (“IFRS”)”. ASU No. 2011-04 includes common requirements for measurement of and disclosure about fair value between GAAP and IFRS. ASU No. 2011-04 will require reporting entities to disclose the following infor-
| The Fund | 25 |
NOTES TO FINANCIAL STATEMENTS (continued)
mation for fair value measurements categorized within Level 3 of the fair value hierarchy: quantitative information about the unobservable inputs used in the fair value measurement, the valuation processes used by the reporting entity and a narrative description of the sensitivity of the fair value measurement to changes in unobservable inputs and the interrelationships between those unobservable inputs. In addition, ASU No. 2011-04 will require reporting entities to make disclosures about amounts and reasons for all transfers in and out of Level 1 and Level 2 fair value measurements. The new and revised disclosures are effective for interim and annual reporting periods beginning after December 15, 2011. At this time, management is evaluating the implications of ASU No. 2011-04 and its impact on the financial statements.
(b) Securities transactions and investment income: Securities transactions are recorded on a trade date basis. Realized gains and losses from securities transactions are recorded on the identified cost basis. Dividend income is recognized on the ex-dividend date and interest income, including, where applicable, accretion of discount and amortization of premium on investments, is recognized on the accrual basis.
Pursuant to a securities lending agreement with The Bank of New York Mellon, a subsidiary of BNY Mellon and an affiliate of Dreyfus, the fund may lend securities to qualified institutions. It is the fund’s policy that, at origination, all loans are secured by collateral of at least 102% of the value of U.S. securities loaned and 105% of the value of foreign securities loaned. Collateral equivalent to at least 100% of the market value of securities on loan is maintained at all times. Collateral is either in the form of cash, which can be invested in certain money market mutual funds managed by the Manager, U.S. Government and Agency securities or letters of credit.The fund is entitled to receive all income on securities loaned, in addition to income earned as a result of the lending transaction. Although each security loaned is fully collateralized, the fund bears the risk of delay in recovery of, or loss of rights in, the securities loaned should a borrower fail to return the securities in a timely manner. During the period ended May 31, 2011, The Bank of New York Mellon earned $27,171 from lending fund portfolio securities, pursuant to the securities lending agreement.
26
(c) Affiliated issuers: Investments in other investment companies advised by Dreyfus are defined as “affiliated” in the Act.
The fund may invest in shares of certain affiliated investment companies also advised or managed by Dreyfus. Investments in affiliated investment companies for the period ended May 31, 2011 were as follows:
| Affiliated | |||||
| Investment | Value | Value | Net | ||
| Company | 5/31/2010 ($) | Purchases ($) | Sales ($) | 5/31/2011 ($) | Assets (%) |
| Dreyfus | |||||
| Institutional | |||||
| Preferred | |||||
| Plus Money | |||||
| Market Fund | 768,000 | 26,431,000 | 25,100,000 | 2,099,000 | .8 |
| Dreyfus | |||||
| Institutional | |||||
| Cash | |||||
| Advantage | |||||
| Plus Fund | 10,250,418 | 86,849,482 | 93,008,838 | 4,091,062 | 1.5 |
| Total | 11,018,418 | 113,280,482 | 118,108,838 | 6,190,062 | 2.3 |
(d) Dividends to shareholders: Dividends are recorded on the ex-dividend date. Dividends from investment income-net and dividends from net realized capital gains, if any, are normally declared and paid annually, but the fund may make distributions on a more frequent basis to comply with the distribution requirements of the Internal Revenue Code of 1986, as amended (the “Code”).To the extent that net realized capital gains can be offset by capital loss carryovers, it is the policy of the fund not to distribute such gains. Income and capital gain distributions are determined in accordance with income tax regulations, which may differ from GAAP.
(e) Federal income taxes: It is the policy of the fund to continue to qualify as a regulated investment company, if such qualification is in the best interests of its shareholders, by complying with the applicable provisions of the Code, and to make distributions of taxable income sufficient to relieve it from substantially all federal income and excise taxes.
As of and during the period ended May 31, 2011, the fund did not have any liabilities for any uncertain tax positions.The fund recognizes
| The Fund | 27 |
NOTES TO FINANCIAL STATEMENTS (continued)
interest and penalties, if any, related to uncertain tax positions as income tax expense in the Statement of Operations. During the period, the fund did not incur any interest or penalties.
Each of the tax years in the four-year period ended May 31, 2011 remains subject to examination by the Internal Revenue Service and state taxing authorities.
At May 31, 2011, the components of accumulated earnings on a tax basis were as follows: undistributed ordinary income $1,604,985, accumulated capital losses $20,500,114 and unrealized appreciation $46,271,543.
The accumulated capital loss carryover is available for federal income tax purposes to be applied against future net securities profits, if any, realized subsequent to May 31, 2011. If not applied, the carryover expires in fiscal 2018.
The tax character of distributions paid to shareholders during the fiscal periods ended May 31, 2011 and May 31, 2010 were as follows: ordinary income $1,360,037 and $1,804,298, respectively.
During the period ended May 31, 2011, as a result of permanent book to tax differences, primarily due to the tax treatment for expiration of capital loss carryovers, the fund increased accumulated net realized gain (loss) on investments by $75,334,811 and decreased paid-in capital by the same amount. Net assets and net asset value per share were not affected by this reclassification.
NOTE 2—Bank Lines of Credit:
The fund participates with other Dreyfus-managed funds in a $225 million unsecured credit facility led by Citibank, N.A. and a $300 million unsecured credit facility provided by The Bank of New York Mellon (each, a “Facility”), each to be utilized primarily for temporary or emergency purposes, including the financing of redemptions. In connection therewith, the fund has agreed to pay its pro rata portion of commitment fees for each Facility. Interest is charged to the fund
28
based on rates determined pursuant to the terms of the respective Facility at the time of borrowing. During the period ended May 31, 2011, the fund did not borrow under the Facilities.
NOTE 3—Management Fee and Other Transactions With Affiliates:
(a) Pursuant to the management agreement (“Agreement”) with the Manager, the management fee is computed at an annual rate of .75% of the value of the fund’s average daily net assets and is payable monthly. Pursuant to the Agreement, if in any full fiscal year the aggregate expenses allocable to Class Z shares (exclusive of taxes, brokerage fees, interest on borrowings, commitment fees and extraordinary expenses) exceed 1 1 / 2% of the value of the average daily net assets of Class Z shares, the fund may deduct from the fees paid to the Manager, or the Manager will bear such excess expense. During the period ended May 31, 2011, there was no expense reimbursement pursuant to the Agreement.
During the period ended May 31, 2011, the Distributor retained $2,332 from commissions earned on sales of the fund’s Class A shares and $107 and $3,124 from CDSCs on redemptions of the fund’s Class B and Class C shares, respectively.
(b) Under the Distribution Plan (the “Plan”) adopted pursuant to Rule 12b-1 under the Act, Class B and Class C shares pay the Distributor for distributing their shares at the annual rate of .75% of the value of the average daily net assets of Class B and Class C shares. During the period ended May 31, 2011, Class B and Class C shares were charged $2,727 and $21,513, respectively, pursuant to the Plan.
(c) Under the Shareholder Services Plan, Class A, Class B and Class C shares pay the Distributor at an annual rate of .25% of the value of their average daily net assets for the provision of certain services.The services provided may include personal services relating to shareholder accounts, such as answering shareholder inquiries regarding Class A,
| The Fund | 29 |
NOTES TO FINANCIAL STATEMENTS (continued)
Class B and Class C shares and providing reports and other information, and services related to the maintenance of shareholder accounts. The Distributor may make payments to Service Agents (a securities dealer, financial institution or other industry professional) in respect of these services.The Distributor determines the amounts to be paid to Service Agents. During the period ended May 31, 2011, Class A, Class B and Class C shares were charged $34,775, $909 and $7,171, respectively, pursuant to the Shareholder Services Plan.
Under the Shareholder Services Plan, Class Z shares reimburse the Distributor an amount not to exceed an annual rate of .25% of the value of Class Z shares average daily net assets for certain allocated expenses of providing personal services and/or maintaining shareholder accounts.The services provided may include personal services relating to shareholder accounts, such as answering shareholder inquiries regarding Class Z shares and providing reports and other information, and services related to the maintenance of shareholder accounts. During the period ended May 31, 2011, Class Z shares were charged $215,801 pursuant to the Shareholder Services Plan.
The fund compensates DreyfusTransfer, Inc., a wholly-owned subsidiary of the Manager, under a transfer agency agreement for providing personnel and facilities to perform transfer agency services for the fund. During the period ended May 31, 2011, the fund was charged $153,288 pursuant to the transfer agency agreement, which is included in Shareholder servicing costs in the Statement of Operations.
The fund has arrangements with the custodian and cash management bank whereby the fund may receive earnings credits when positive cash balances are maintained, which are used to offset custody and cash management fees. For financial reporting purposes, the fund includes net earnings credits as an expense offset in the Statement of Operations.
The fund compensates The Bank of New York Mellon under a cash management agreement for performing cash management services related to fund subscriptions and redemptions. During the period
30
ended May 31, 2011, the fund was charged $25,091 pursuant to the cash management agreement, which is included in Shareholder servicing costs in the Statement of Operations.These fees were partially offset by earnings credits of $1,433.
The fund also compensates The Bank of New York Mellon under a custody agreement for providing custodial services for the fund. During the period ended May 31, 2011, the fund was charged $18,539 pursuant to the custody agreement.
During the period ended May 31, 2011, the fund was charged $6,387 for services performed by the Chief Compliance Officer.
The components of “Due toThe Dreyfus Corporation and affiliates” in the Statement of Assets and Liabilities consist of: management fees $167,555, Rule 12b-1 distribution plan fees $2,156, shareholder services plan fees $27,207, custodian fees $9,524, chief compliance officer fees $3,006 and transfer agency per account fees $25,847.
(d) Each Board member also serves as a Board member of other funds within the Dreyfus complex. Annual retainer fees and attendance fees are allocated to each fund based on net assets.
NOTE 4—Securities Transactions:
The aggregate amount of purchases and sales of investment securities, excluding short-term securities, during the period ended May 31, 2011, amounted to $123,018,534 and $144,149,835, respectively.
At May 31, 2011, the cost of investments for federal income tax purposes was $225,012,718; accordingly, accumulated net unrealized appreciation on investments was $46,271,543, consisting of $53,662,448 gross unrealized appreciation and $7,390,905 gross unrealized depreciation.
| The Fund | 31 |
REPORT OF INDEPENDENT REGISTERED
PUBLIC ACCOUNTING FIRM
Shareholders and Board of Directors
The Dreyfus Third Century Fund, Inc.
We have audited the accompanying statement of assets and liabilities of The Dreyfus Third Century Fund, Inc., including the statement of investments, as of May 31, 2011 and the related statement of operations for the year then ended, the statement of changes in net assets for each of the two years in the period then ended and financial highlights for each of the years indicated therein. These financial statements and financial highlights are the responsibility of the Fund’s management. Our responsibility is to express an opinion on these financial statements and financial highlights based on our audits.
We conducted our audits in accordance with the standards of the Public Company Accounting Oversight Board (United States).Those standards require that we plan and perform the audit to obtain reasonable assurance about whether the financial statements and financial highlights are free of material misstatement.We were not engaged to perform an audit of the Fund’s internal control over financial reporting. Our audits included consideration of internal control over financial reporting as a basis for designing audit procedures that are appropriate in the circumstances, but not for the purpose of expressing an opinion on the effectiveness of the Fund’s internal control over financial reporting. Accordingly, we express no such opinion.An audit also includes examining, on a test basis, evidence supporting the amounts and disclosures in the financial statements and financial highlights, assessing the accounting principles used and significant estimates made by management, and evaluating the overall financial statement presentation. Our procedures included confirmation of securities owned as of May 31, 2011 by correspondence with the custodian and others.We believe that our audits provide a reasonable basis for our opinion.
In our opinion, the financial statements and financial highlights referred to above present fairly, in all material respects, the financial position of The Dreyfus Third Century Fund, Inc. at May 31, 2011, the results of its operations for the year then ended, the changes in its net assets for each of the two years in the period then ended, and the financial highlights for each of the indicated years, in conformity with U.S. generally accepted accounting principles.

New York, New York
July 26, 2011
32
IMPORTANT TAX INFORMATION (Unaudited)
For federal tax purposes the fund hereby designates 100% of the ordinary dividends paid during the fiscal year ended May 31, 2011 as qualifying for the corporate dividends received deduction. Also certain dividends paid by the fund may be subject to a maximum tax rate of 15%, as provided for by the Jobs and Growth Tax Relief Reconciliation Act of 2003. Of the distributions paid during the fiscal year, $1,360,037 represents the maximum amount that may be considered qualified dividend income. Shareholders will receive notification in early 2012 of the percentage applicable to the preparation of their 2011 income tax returns.
| The Fund | 33 |
BOARD MEMBERS INFORMATION (Unaudited)
| Joseph S. DiMartino (67) |
| Chairman of the Board (1995) |
| Principal Occupation During Past 5Years: |
| • Corporate Director and Trustee |
| Other Public Company Board Memberships During Past 5Years: |
| • CBIZ (formerly, Century Business Services, Inc.), a provider of outsourcing functions for small |
| and medium size companies, Director (1997-present) |
| • Sunair Services Corporation, a provider of certain outdoor-related services to homes and |
| businesses, Director (2005-2009) |
| • The Newark Group, a provider of a national market of paper recovery facilities, paperboard |
| mills and paperboard converting plants, Director (2000-2010) |
| No. of Portfolios for which Board Member Serves: 170 |
| ——————— |
| Clifford L. Alexander, Jr. (77) |
| Board Member (1981) |
| Principal Occupation During Past 5Years: |
| • President of Alexander & Associates, Inc., a management consulting firm ( January 1981-present) |
| No. of Portfolios for which Board Member Serves: 46 |
| ——————— |
| David W. Burke (75) |
| Board Member (2003) |
| Principal Occupation During Past 5Years: |
| • Corporate Director and Trustee |
| No. of Portfolios for which Board Member Serves: 84 |
| ——————— |
| Whitney I. Gerard (76) |
| Board Member (2003) |
| Principal Occupation During Past 5Years: |
| • Partner of Chadbourne & Parke LLP |
| No. of Portfolios for which Board Member Serves: 26 |
34
| Nathan Leventhal (68) |
| Board Member (2009) |
| Principal Occupation During Past 5Years: |
| • Commissioner, NYC Planning Commission (March 2007-present) |
| • Chairman of the Avery-Fisher Artist Program (November 1997-present) |
| Other Public Company Board Memberships During Past 5Years: |
| • Movado Group, Inc., Director (2003-present) |
| No. of Portfolios for which Board Member Serves: 44 |
| ——————— |
| George L. Perry (77) |
| Board Member (2003) |
| Principal Occupation During Past 5Years: |
| • Economist and Senior Fellow at Brookings Institution |
| No. of Portfolios for which Board Member Serves: 26 |
| ——————— |
| Benaree Pratt Wiley (65) |
| Board Member (2009) |
| Principal Occupation During Past 5Years: |
| • Principal,TheWiley Group, a firm specializing in strategy and business development (2005-present) |
| Other Public Company Board Memberships During Past 5Years: |
| • CBIZ (formerly, Century Business Services, Inc.), a provider of outsourcing functions for small |
| and medium size companies, Director (2008-present) |
| No. of Portfolios for which Board Member Serves: 70 |
| ——————— |
Once elected all Board Members serve for an indefinite term, but achieve Emeritus status upon reaching age 80.The address of the Board Members and Officers is in c/o The Dreyfus Corporation, 200 Park Avenue, NewYork, NewYork 10166.Additional information about the Board Members is available in the fund’s Statement of Additional Information which can be obtained from Dreyfus free of charge by calling this toll free number: 1-800-DREYFUS.
Lucy Wilson Benson, Emeritus Board Member
Arthur A. Hartman, Emeritus Board Member
| The Fund | 35 |
OFFICERS OF THE FUND (Unaudited)
36
| The Fund | 37 |
OFFICERS OF THE FUND (Unaudited) (continued)

38
NOTES
For More Information

Telephone Call your financial representative or 1-800-DREYFUS
Mail The Dreyfus Family of Funds, 144 Glenn Curtiss Boulevard, Uniondale, NY 11556-0144
The fund files its complete schedule of portfolio holdings with the Securities and Exchange Commission (“SEC”) for the first and third quarters of each fiscal year on Form N-Q. The fund’s Forms N-Q are available on the SEC’s website at http://www.sec.gov and may be reviewed and copied at the SEC’s Public Reference Room in Washington, DC. Information on the operation of the Public Reference Room may be obtained by calling 1-800-SEC-0330.
A description of the policies and procedures that the fund uses to determine how to vote proxies relating to portfolio securities, and information regarding how the fund voted these proxies for the most recent 12-month period ended June 30 is available at http://www.dreyfus.com and on the SEC’s website at http://www.sec.gov. The description of the policies and procedures is also available without charge, upon request, by calling 1-800-DREYFUS.

Item 2. Code of Ethics.
The Registrant has adopted a code of ethics that applies to the Registrant's principal executive officer, principal financial officer, principal accounting officer or controller, or persons performing similar functions. There have been no amendments to, or waivers in connection with, the Code of Ethics during the period covered by this Report.
Item 3. Audit Committee Financial Expert.
The Registrant's Board has determined that Joseph S. DiMartino, a member of the Audit Committee of the Board, is an audit committee financial expert as defined by the Securities and Exchange Commission (the "SEC"). Mr. DiMartino is "independent" as defined by the SEC for purposes of audit committee financial expert determinations.
Item 4. Principal Accountant Fees and Services.
(a) Audit Fees. The aggregate fees billed for each of the last two fiscal years (the "Reporting Periods") for professional services rendered by the Registrant's principal accountant (the "Auditor") for the audit of the Registrant's annual financial statements or services that are normally provided by the Auditor in connection with the statutory and regulatory filings or engagements for the Reporting Periods, were $27,935 in 2010 and $30,312 in 2011.
(b) Audit-Related Fees. The aggregate fees billed in the Reporting Periods for assurance and related services by the Auditor that are reasonably related to the performance of the audit of the Registrant's financial statements and are not reported under paragraph (a) of this Item 4 were $5,382 in 2010 and $6,000 in 2011. These services consisted of one or more of the following: (i) agreed upon procedures related to compliance with Internal Revenue Code section 817(h), (ii) security counts required by Rule 17f-2 under the Investment Company Act of 1940, as amended, (iii) advisory services as to the accounting or disclosure treatment of Registrant transactions or events and (iv) advisory services to the accounting or disclosure treatment of the actual or potential impact to the Registrant of final or proposed rules, standards or interpretations by the Securities and Exchange Commission, the Financial Accounting Standards Boards or other regulatory or standard-setting bodies.
The aggregate fees billed in the Reporting Periods for non-audit assurance and related services by the Auditor to the Registrant's investment adviser (not including any sub-investment adviser whose role is primarily portfolio management and is subcontracted with or overseen by another investment adviser), and any entity controlling, controlled by or under common control with the investment adviser that provides ongoing services to the Registrant ("Service Affiliates"), that were reasonably related to the performance of the annual audit of the Service Affiliate, which required pre-approval by the Audit Committee were $0 in 2010 and $0 in 2011.
(c) Tax Fees. The aggregate fees billed in the Reporting Periods for professional services rendered by the Auditor for tax compliance, tax advice, and tax planning ("Tax Services") were $3,184 in 2010 and $3,863 in 2011. These services consisted of: (i) review or preparation of U.S. federal, state, local and excise tax returns; (ii) U.S. federal, state and local tax planning, advice and assistance regarding statutory, regulatory or administrative developments; (iii) tax advice regarding tax qualification matters and/or treatment of various financial instruments held or proposed to be acquired or held, and (iv) determination of Passive Foreign Investment Companies. The aggregate fees billed in the Reporting Periods for Tax Services by the Auditor to Service Affiliates, which required pre-approval by the Audit Committee were $0 in 2010 and $0 in 2011.
(d) All Other Fees. The aggregate fees billed in the Reporting Periods for products and services provided by the Auditor, other than the services reported in paragraphs (a) through (c) of this Item, were $0 in 2010 and $170 in 2011. [These services consisted of a review of the Registrant's anti-money laundering program].
The aggregate fees billed in the Reporting Periods for Non-Audit Services by the Auditor to Service Affiliates, other than the services reported in paragraphs (b) through (c) of this Item, which required pre-approval by the Audit Committee, were $0 in 2010 and $0 in 2011.
(e)(1) Audit Committee Pre-Approval Policies and Procedures. The Registrant's Audit Committee has established policies and procedures (the "Policy") for pre-approval (within specified fee limits) of the Auditor's engagements for non-audit services to the Registrant and Service Affiliates without specific case-by-case consideration. The pre-approved services in the Policy can include pre-approved audit services, pre-approved audit-related services, pre-approved tax services and pre-approved all other services. Pre-approval considerations include whether the proposed services are compatible with maintaining the Auditor's independence. Pre-approvals pursuant to the Policy are considered annually.
(e)(2) Note: None of the services described in paragraphs (b) through (d) of this Item 4 were approved by the Audit Committee pursuant to paragraph (c)(7)(i)(C) of Rule 2-01 of Regulation S-X.
(f) None of the hours expended on the principal accountant's engagement to audit the registrant's financial statements for the most recent fiscal year were attributed to work performed by persons other than the principal account's full-time, permanent employees.
Non-Audit Fees. The aggregate non-audit fees billed by the Auditor for services rendered to the Registrant, and rendered to Service Affiliates, for the Reporting Periods were $28,017,293 in 2010 and $19,526,919 in 2011.
Auditor Independence. The Registrant's Audit Committee has considered whether the provision of non-audit services that were rendered to Service Affiliates, which were not pre-approved (not requiring pre-approval), is compatible with maintaining the Auditor's independence.
Item 5. Audit Committee of Listed Registrants.
Not applicable. [CLOSED-END FUNDS ONLY]
Item 6. Investments.
(a) Not applicable.
Item 7. Disclosure of Proxy Voting Policies and Procedures for Closed-End Management Investment Companies.
Not applicable. [CLOSED-END FUNDS ONLY]
Item 8. Portfolio Managers of Closed-End Management Investment Companies.
Not applicable. [CLOSED-END FUNDS ONLY, beginning with reports for periods ended on and after December 31, 2005]
Item 9. Purchases of Equity Securities by Closed-End Management Investment Companies and Affiliated Purchasers.
Not applicable. [CLOSED-END FUNDS ONLY]
Item 10. Submission of Matters to a Vote of Security Holders.
There have been no material changes to the procedures applicable to Item 10.
Item 11. Controls and Procedures.
(a) The Registrant's principal executive and principal financial officers have concluded, based on their evaluation of the Registrant's disclosure controls and procedures as of a date within 90 days of the filing date of this report, that the Registrant's disclosure controls and procedures are reasonably designed to ensure that information required to be disclosed by the Registrant on Form N-CSR is recorded, processed, summarized and reported within the required time periods and that information required to be disclosed by the Registrant in the reports that it files or submits on Form N-CSR is accumulated and communicated to the Registrant's management, including its principal executive and principal financial officers, as appropriate to allow timely decisions regarding required disclosure.
(b) There were no changes to the Registrant's internal control over financial reporting that occurred during the second fiscal quarter of the period covered by this report that have materially affected, or are reasonably likely to materially affect, the Registrant's internal control over financial reporting.
Item 12. Exhibits.
(a)(1) Code of ethics referred to in Item 2.
(a)(2) Certifications of principal executive and principal financial officers as required by Rule 30a-2(a) under the Investment Company Act of 1940.
(a)(3) Not applicable.
(b) Certification of principal executive and principal financial officers as required by Rule 30a-2(b) under the Investment Company Act of 1940.
SIGNATURES
Pursuant to the requirements of the Securities Exchange Act of 1934 and the Investment Company Act of 1940, the Registrant has duly caused this Report to be signed on its behalf by the undersigned, thereunto duly authorized.
The Dreyfus Third Century Fund, Inc.
By: /s/ Bradley J. Skapyak | |
Bradley J. Skapyak, President
| |
Date: | July 25, 2011 |
| |
Pursuant to the requirements of the Securities Exchange Act of 1934 and the Investment Company Act of 1940, this Report has been signed below by the following persons on behalf of the Registrant and in the capacities and on the dates indicated. | |
| |
By: /s/ Bradley J. Skapyak | |
Bradley J. Skapyak, President
| |
Date: | July 25, 2011 |
| |
By: /s/ James Windels | |
James Windels, Treasurer
| |
Date: | July 25, 2011 |
| |
EXHIBIT INDEX
(a)(1) Code of ethics referred to in Item 2.
(a)(2) Certifications of principal executive and principal financial officers as required by Rule 30a-2(a) under the Investment Company Act of 1940. (EX-99.CERT)
(b) Certification of principal executive and principal financial officers as required by Rule 30a-2(b) under the Investment Company Act of 1940. (EX-99.906CERT)