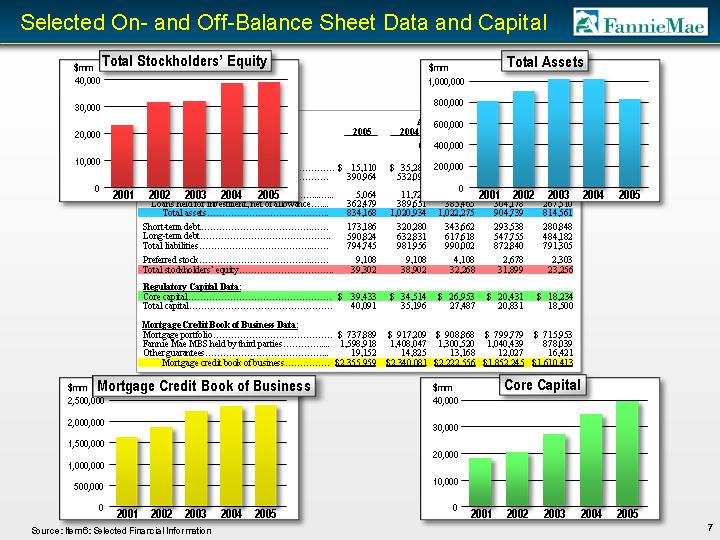
| As of December, 31 2005 2004 2003 2002 2001 (Dollars in millions) Balance Sheet Data: Investments in securities: Trading................................................... $ 15,110 $ 35,287 $ 43,798 $ 14,909 $ (45) Available-for-sale.................................... 390,964 532,095 523,272 520,176 503,381 Mortgage loans: Loans held for sale....................................... 5,064 11,721 13,596 20,192 11,327 Loans held for investment, net of allowance....... 362,479 389,651 385,465 304,178 267,510 Total assets......................................... 834,168 1,020,934 1,022,275 904,739 814,561 Short-term debt........................................... 173,186 320,280 343,662 293,538 280,848 Long-term debt............................................ 590,824 632,831 617,618 547,755 484,182 Total liabilities............................................ 794,745 981,956 990,002 872,840 791,305 Preferred stock............................................ 9,108 9,108 4,108 2,678 2,303 Total stockholders' equity................................ 39,302 38,902 32,268 31,899 23,256 Regulatory Capital Data: Core capital................................................ $ 39,433 $ 34,514 $ 26,953 $ 20,431 $ 18,234 Total capital................................................ 40,091 35,196 27,487 20,831 18,500 Mortgage Credit Book of Business Data: Mortgage portfolio........................................ $ 737,889 $ 917,209 $ 908,868 $ 799,779 $ 715,953 Fannie Mae MBS held by third parties................. 1,598,918 1,408,047 1,300,520 1,040,439 878,039 Other guarantees.......................................... Mortgage credit book of business............... $2,355,959 $2,340,081 $2,222,556 $1,852,245 $1,610,413 19,152 14,825 13,168 12,027 16,421 Selected On- and Off-Balance Sheet Data and Capital 0 200,000 400,000 600,000 800,000 1,000,000 2005 2004 2003 2002 2001 0 10,000 20,000 30,000 40,000 2005 2004 2003 2002 2001 0 500,000 1,000,000 1,500,000 2,000,000 2,500,000 2005 2004 2003 2002 2001 Total Assets Total Stockholders' Equity Core Capital Mortgage Credit Book of Business $mm $mm $mm 0 10,000 20,000 30,000 40,000 2005 2004 2003 2002 2001 $mm 7 Source: Item 6: Selected Financial Information |