UNITED STATES
SECURITIES AND EXCHANGE COMMISSION
WASHINGTON, D. C. 20549
FORM N-CSR
CERTIFIED SHAREHOLDER REPORT OF REGISTERED MANAGEMENT
INVESTMENT COMPANIES
Investment Company Act file number 811-2918
DUPREE MUTUAL FUNDS
(Exact Name of Registrant as Specified in Charter)
125 South Mill Street, Vine Center, Suite 100
Lexington, Kentucky 40507
(Address of Principal Executive Offices) (Zip Code)
Thomas P. Dupree
125 South Mill Street, Vine Center, Suite 100
Lexington, Kentucky 40507
(Name and address of agent for service)
Registrant’s Telephone Number, including Area Code (859) 254-7741
Date of fiscal year end: June 30, 2004
Date of reporting period: July 1, 2003 through June 30, 2004
- 1 -
| Item 1. | Report to Stockholders |
- 2 -
DUPREE MUTUAL FUNDS
June 30, 2004
ANNUAL REPORT
TO SHAREHOLDERS
ABOUT DUPREE MUTUAL FUNDS
In 1941, Dupree & Company, Inc., began business in Harlan, Kentucky as a small securities brokerage firm specializing in tax-exempt municipal bonds.
Over the years the firm, which in 1963 moved its offices to Lexington, Kentucky, grew to become a regional leader in public finance, helping to structure complex and innovative municipal bond financing for some of the largest public projects in the state of Kentucky.
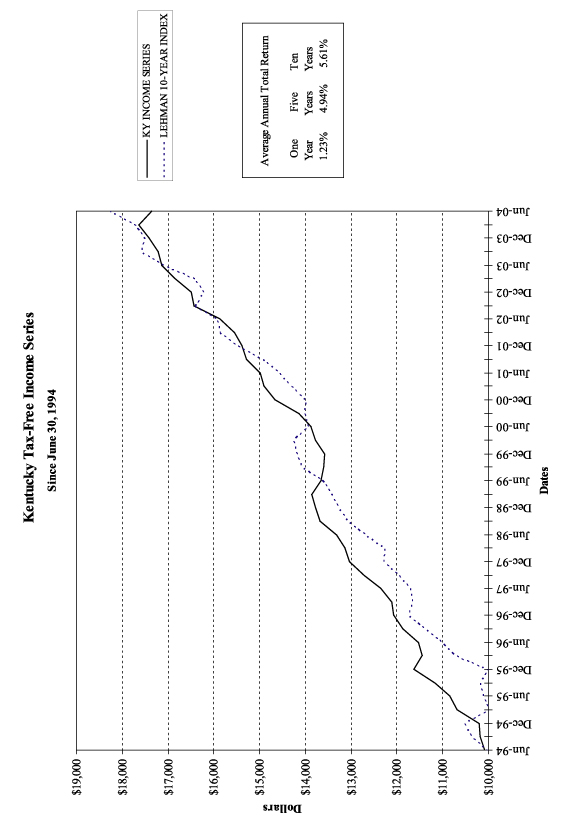
In 1979, Dupree & Company began what is now Dupree Mutual Funds with the Kentucky Tax-Free Income Series and became the fund's investment advisor. The fund was one of the first single-state municipal bond funds in the country, and the first mutual fund to invest solely in Kentucky municipal bonds. Since then, several new offerings have been added to the Dupree Mutual Funds family:
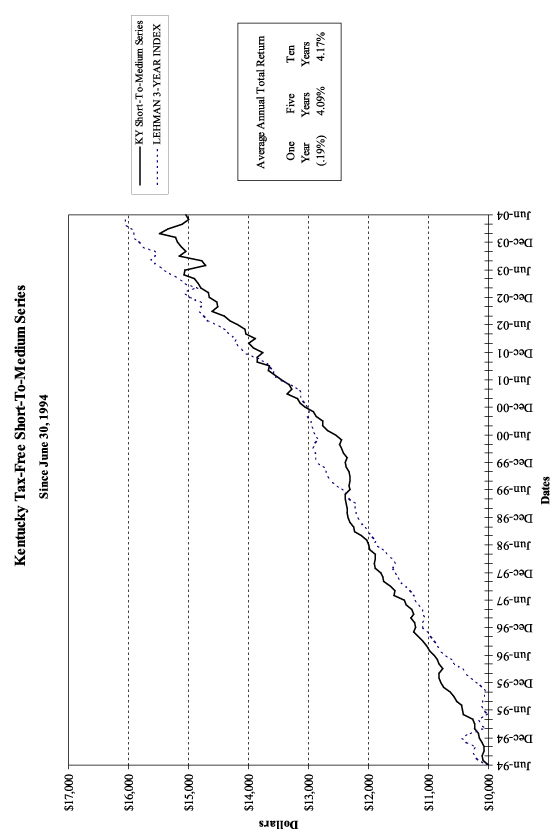
Kentucky Tax-Free Short-to-Medium Series in 1987;
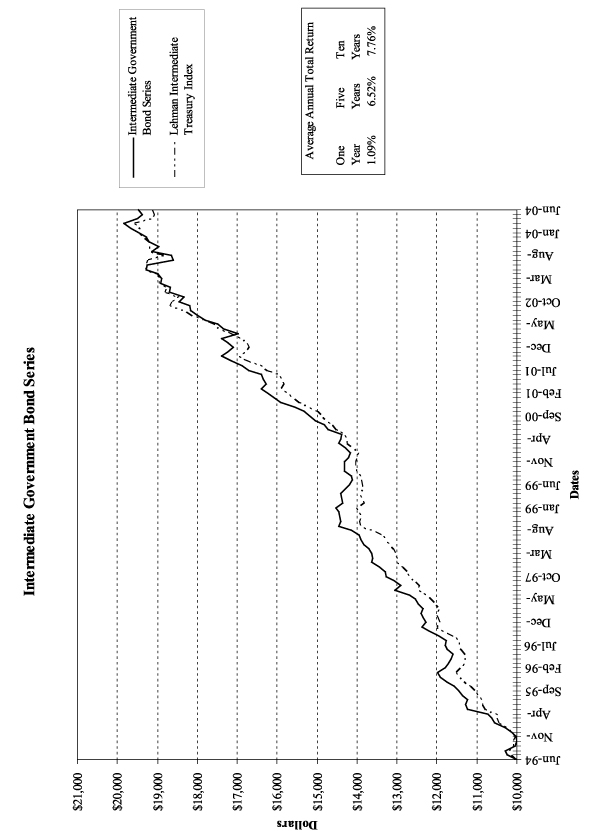
Intermediate Government Bond Series in 1992;
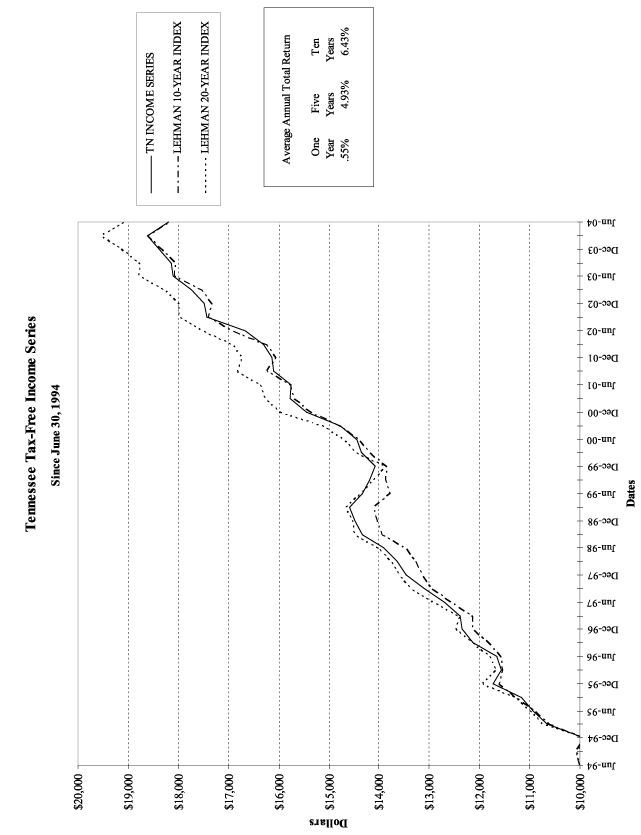
Tennessee Tax-Free Income Series in 1993;
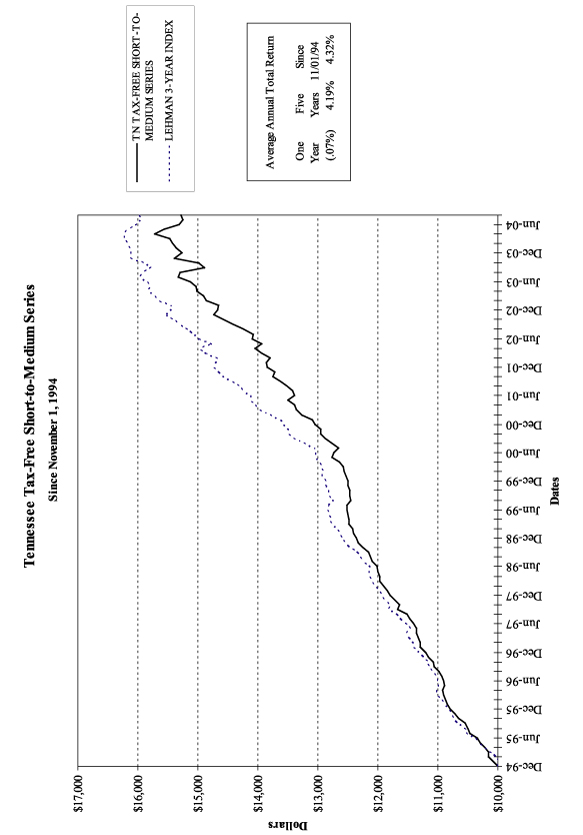
Tennessee Tax-Free Short-to-Medium Series in 1994;
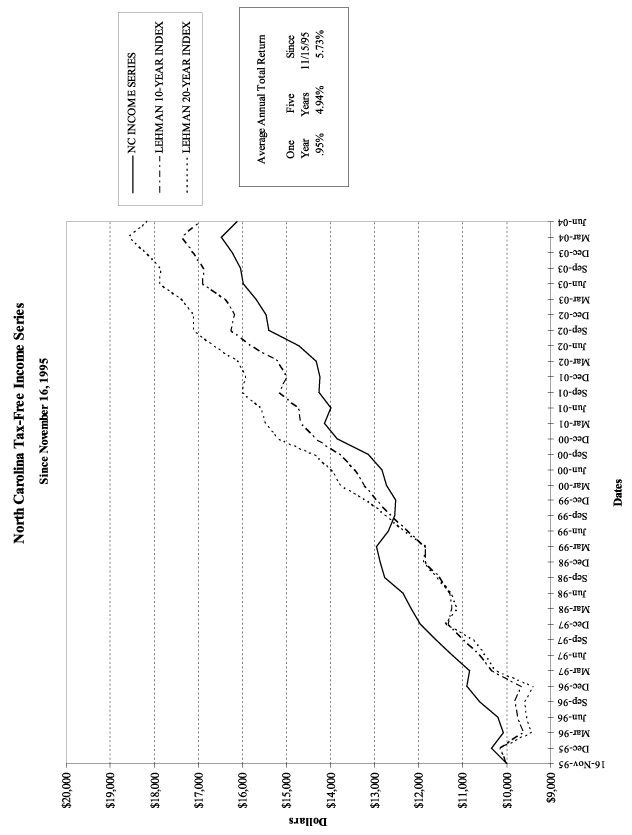
North Carolina Tax-Free Income Series in 1995;
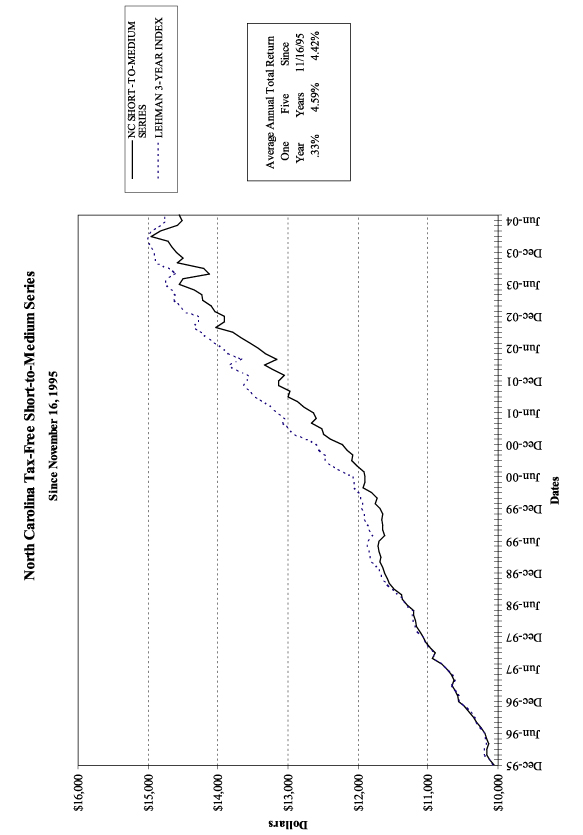
North Carolina Tax-Free Short-to-Medium Series in 1995;
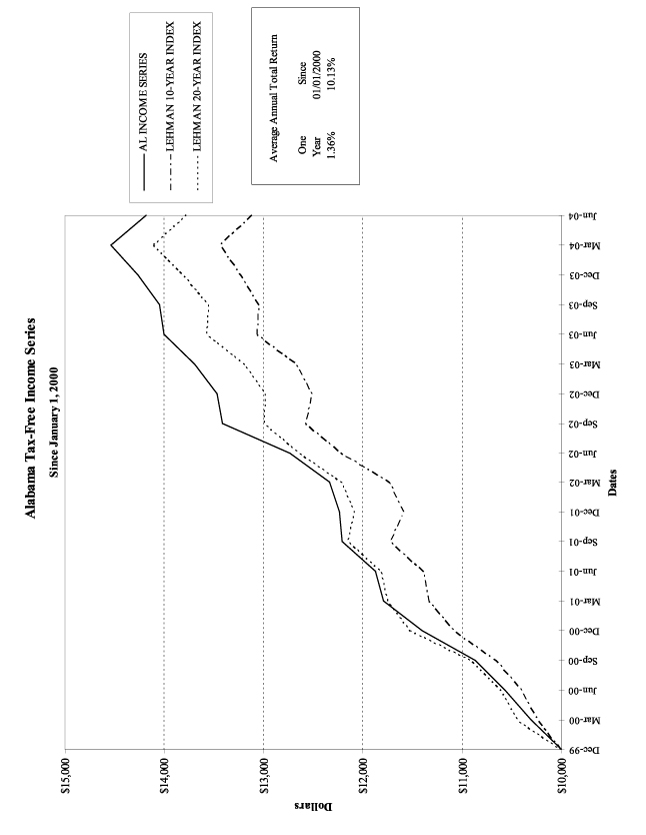
Alabama Tax-Free Income Series in 2000, and
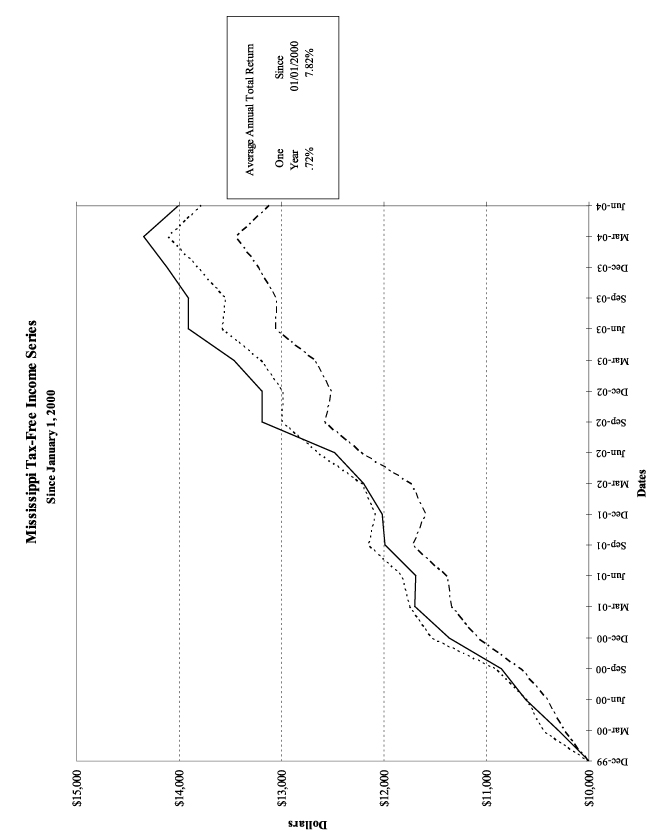
Mississippi Tax-Free Income Series in 2000.
Today, after more than 60 years in business, Dupree continues to be a pioneer in the industry. Our Kentucky, Tennessee, and Mississippi Series are currently the ONLY 100% “no-load” municipal bond funds available in those states. No-load means simply that shares of the funds are offered directly to investors with no front or back-end sales charges, as opposed to load funds which are sold through brokerage firms or other institutions.
At Dupree Mutual Funds, our goal is a simple one: to offer investors a high-quality, low-cost way to invest in municipal and government bonds while providing superior service to our shareholders. We encourage you to let us know how we’re doing.
TABLE OF CONTENTS
Management’s Discussion of Fund Performance:
At least one survey indicates that about 60% of investors do not understand that as interest rates rise, bond prices fall, and vice versa. No rational discussion of a bond fund’s performance can take place, however, without a clear grasp of this fact. Each individual bond has its own fixed rate of interest; a rate that reflects a going market rate for a bond of that quality and maturity at the time that bond was issued. Over a period of, say, a year, the going rate for that particular bond will vary as market conditions for interest rates vary. If, for example, the bond carries a fixed rate of 5.00%, and market conditions dictate a market rate of 5.50% a year later, that bond will sell at about 91% of its face value. If that market rate has gone down to, say, 4.5%, that bond will sell at about 111% of its face value. Of course, the maturity of the bond one year later is shorter by one year and this affects the price as well. But, for purposes of discussion of bond mutual funds it is generally sufficient to understand that bond prices fall as interest rates rise, and rise as interest rates fall, and interest rates are constantly rising and falling.
There are other elements of a bond’s makeup that affect a bond’s market performance, two being the bond’s maturity and call features. Maturity is the date a bond is scheduled to return the bond’s principal. Call features are the date and price at which a bond can be called prior to maturity. If interest rates have risen and a bond is now selling at a discount from face value, that bond will gradually tick up, day by day, toward its face value. The nearer its maturity, the faster it will accrete. Likewise if a bond is callable soon at a low price, say 101, or even par (100), and interest rates drop, raising the price to a premium, that call price may hold down the premium at which that bond will trade. All of these things affect performance of a fund holding bonds of this description.
A last consideration that affects a bond’s market price is the shape of the yield curve. The “yield curve” is the interest rate a bond will sell for in each maturity from one to, say, thirty years in each of those thirty years. Our policy is to buy on a “shoulder” of the yield curve when possible. A yield curve shoulder is that maturity beyond which yields increase more slowly as maturities lengthen than they have been increasing prior to that maturity. Buying on such a shoulder will tend to support the price of a bond as years pass and its maturity becomes shorter. But yield curves are not static and tend to vary in “slope” in changing markets, which also affects performance.
Finally, we tend to buy highly rated bonds of the best quality and hold them. We avoid discounted bonds and prefer premium bonds when we can find them. This helps us minimize (but not eliminate) the effects of new issue and market discount tax rules which, beyond a point, accelerate bond discounts in rising interest rate markets.
This is our long term strategy and is one which we never vary. This strategy has consistently garnered excellent ratings form Morningstar, as well as from Lipper, BusinessWeek, Forbes and other national publications. We do not try to anticipate market direction, instead attempting to buy quality bonds at the best price possible, on a shoulder of the yield curve and hold them in down markets as well as up markets. This has led to another year of better than average performance, relative to other single-state municipal bond funds, a trend that has continued for us for many years.
PERFORMANCE COMPARISON
The following graphs compare the change in value of a $10,000 investment in each series of Dupree Mutual Funds with the change in value of a $10,000 investment in a comparable index. The comparisons are made over ten years or since the inception of the series, if shorter than ten years. Results are for the fiscal years ended June 30.
7
8
9
10
11
12
13
14
15
Notes on Graphs:
Results reflect reinvestment of all dividend and capital gain distributions. For each series, we have chosen an index that approximates the average maturity of the compared series. The investor should understand that an index is a mathematical hypothesis and does not reflect a real market situation. For example, the portfolio of each index is replaced with an entirely different portfolio each year without reflecting transaction costs, an impossibility in reality. On the other hand, the fund’s performance reflects not only these factors but management costs as well. Past performance is not indicative of future results.
The performance tables and the graphs above do not reflect the deduction of taxes that a shareholder would pay on fund distributions or the redemption of fund shares.
DUPREE MUTUAL FUNDS—ALABAMA TAX-FREE INCOME SERIES
SCHEDULE OF PORTFOLIO INVESTMENTS
Alabama Municipal Bonds—100%
June 30, 2004
| | | | | | | | | | | | | |
| Bond Description | | Coupon | | | Maturity
Date | | Rating# | | Par Value | | Market Value |
|
INSURED MUNICIPAL REVENUE BONDS | | | | | | | | | | | | | |
61.57% of Net Assets | | | | | | | | | | | | | |
AL Housing Financial Authority Single Family Mortgage | | 5.050 | % | | 10/01/2013 | | Aaa | | $ | 15,000 | | $ | 15,413 |
Alabama Private Colleges & University Facilities Authority | | 5.900 | | | 09/01/2016 | | Aaa/AAA* | | | 10,000 | | | 10,892 |
AL State Board Education Bishop State Community College | | 4.600 | | | 01/01/2021 | | Aaa | | | 100,000 | | | 98,522 |
Alabama State Docks Department Docks Facilities Reveue | | 5.500 | | | 10/01/2022 | | Aaa/AAA* | | | 110,000 | | | 115,317 |
AL State University Revenue General Tuition & Fee—Series A | | 5.000 | | | 01/01/2019 | | Aaa/AAA* | | | 50,000 | | | 51,607 |
Alabama Water Pollution Control Authority | | 5.500 | | | 08/15/2016 | | Aaa/AAA* | | | 10,000 | | | 10,634 |
AL Water Pollution Control Authority Revolving Fund Loan | | 4.800 | | | 08/15/2018 | | Aaa/AAA* | | | 50,000 | | | 51,022 |
AL Water Pollution Control Authority—Series A | | 4.800 | | | 08/15/2022 | | Aaa/AAA* | | | 170,000 | | | 169,787 |
Alexander City AL Warrants | | 4.700 | | | 05/01/2021 | | AAA* | | | 200,000 | | | 199,986 |
Birmingham AL Special Care Facilities Financing | | 5.000 | | | 06/01/2020 | | Aaa/AAA* | | | 100,000 | | | 101,894 |
Birmingham AL Multifamily Housing Revenue—Beaconview | | 5.600 | | | 07/01/2020 | | Aaa/AAA* | | | 20,000 | | | 20,345 |
Blount County AL Water Authority Revenue | | 5.750 | | | 08/01/2019 | | Aaa/AAA* | | | 125,000 | | | 137,624 |
Central Elmore AL Water & Sewer | | 5.000 | | | 07/01/2021 | | Aaa/AAA* | | | 100,000 | | | 102,432 |
Choctaw County AL Revenue School Warrants | | 4.700 | | | 03/01/2017 | | A* | | | 200,000 | | | 197,730 |
Colbert County Northwest AL Health Care Facility | | 5.750 | | | 06/01/2015 | | Aaa/AAA* | | | 10,000 | | | 10,547 |
Colbert County-Northwest AL Healthcare Authority | | 5.750 | | | 06/01/2020 | | Aaa/AAA* | | | 20,000 | | | 21,080 |
Fairhope AL Utilities Revenue Warrants | | 5.750 | | | 12/01/2021 | | Aaa/AAA* | | | 25,000 | | | 27,316 |
Fort Payne Warrents | | 5.500 | | | 05/01/2016 | | Aaa/AAA* | | | 10,000 | | | 10,743 |
Gasden AL Warrants—Series B | | 4.600 | | | 08/01/2022 | | Aaa | | | 100,000 | | | 97,360 |
Hoover AL Board of Education Capital Outlay Warrants | | 5.250 | | | 02/15/2026 | | Aaa/AAA* | | | 35,000 | | | 35,526 |
Houston County AL Warrants | | 5.650 | | | 10/15/2015 | | Aaa/AAA* | | | 25,000 | | | 27,619 |
Huntsville AL Capital Improvement Warrants—Series C | | 4.500 | | | 11/01/2021 | | Aaa/AAA* | | | 200,000 | | | 194,588 |
Huntsville AL Health Care Authority Series A | | 5.000 | | | 06/01/2023 | | Aaa/AAA* | | | 40,000 | | | 40,102 |
Huntsville AL Health Care Authority Series A | | 5.400 | | | 06/01/2022 | | Aaa/AAA* | | | 50,000 | | | 52,574 |
Huntsville AL Public Building Authority Lease Revenue | | 5.125 | | | 10/01/2022 | | Aaa/AAA* | | | 200,000 | | | 204,946 |
Huntsville AL Public Educational Building—A&M | | 5.600 | | | 06/01/2014 | | A* | | | 20,000 | | | 20,999 |
Huntsville AL Public Educational Building | | 6.050 | | | 06/01/2020 | | A* | | | 150,000 | | | 159,897 |
Jasper AL Waterworks & Sewer Board Water & Sewer Revenue | | 5.100 | | | 06/01/2018 | | Aaa/AAA* | | | 30,000 | | | 31,268 |
Jasper AL Waterworks & Sewer Board Water & Sewer Revenue | | 5.200 | | | 06/01/2021 | | Aaa/AAA* | | | 50,000 | | | 51,702 |
Jefferson County AL Board of Education Capital Outlay | | 5.800 | | | 02/15/2020 | | Aaa/AAA* | | | 10,000 | | | 10,908 |
Jefferson County AL Sewer Revenue Capital Improvement | | 5.000 | | | 02/01/2020 | | Aaa/AAA* | | | 50,000 | | | 51,266 |
Lauderdale County & Florence AL Health Care Authority | | 5.250 | | | 07/01/2019 | | Aaa/AAA* | | | 30,000 | | | 31,334 |
Lee County AL School Warrants | | 5.000 | | | 02/01/2018 | | Aaa/AAA* | | | 100,000 | | | 104,030 |
Limestone County AL Water Authority Water Revenue | | 5.250 | | | 12/01/2020 | | Aaa/AAA* | | | 45,000 | | | 45,903 |
Linden AL Warrants | | 5.250 | | | 06/01/2023 | | AA* | | | 25,000 | | | 25,224 |
Mobile AL Limited Obligation Tax Warrants | | 5.500 | | | 02/15/2023 | | A1 | | | 35,000 | | | 35,467 |
Montgomery AL Waterworks & Sanitary Sewer Board | | 5.000 | | | 09/01/2019 | | Aaa/AAA* | | | 50,000 | | | 51,552 |
Nortwest AL Gas District Gas System Revenue | | 5.900 | | | 05/01/2020 | | Aaa | | | 35,000 | | | 38,602 |
Oxford AL Public Parks & Recreation Board Revenue | | 6.000 | | | 12/01/2021 | | A* | | | 115,000 | | | 123,707 |
Phenix City AL School Warrants | | 5.450 | | | 08/01/2016 | | Aaa/AAA* | | | 10,000 | | | 10,893 |
Roanoke AL Warrants | | 4.450 | | | 05/01/2020 | | AAA* | | | 150,000 | | | 147,480 |
St Clair County Board of Education School Tax Anticipation | | 5.500 | | | 02/01/2016 | | Aaa/AAA* | | | 10,000 | | | 10,797 |
Southeast AL Gas District System Revenue Series A | | 5.500 | | | 06/01/2020 | | Aaa | | | 10,000 | | | 10,660 |
Sylacauga AL Warrants | | 5.500 | | | 06/01/2025 | | Aaa | | | 25,000 | | | 26,174 |
Trussville AL Warrants | | 4.800 | | | 10/01/2021 | | Aaa | | | 85,000 | | | 85,626 |
Tuskegee AL Utilities Board Utilities Revenue | | 5.500 | | | 02/01/2022 | | Aaa/AAA* | | | 70,000 | | | 73,905 |
University of Alabama Revenue—Birmingham | | 6.000 | | | 10/01/2020 | | Aaa/AAA* | | | 25,000 | | | 27,859 |
University of Alabama University Revenue-Huntsville | | 5.750 | | | 12/01/2016 | | Aaa/AAA* | | | 10,000 | | | 10,917 |
University AL University Revenue Hospital—Series A | | 5.400 | | | 09/01/2013 | | Aaa/AAA* | | | 50,000 | | | 54,699 |
| | | | | | | | | | | | |
|
|
| | | | | | | | | | | | | | 3,246,475 |
GENERAL OBLIGATION BONDS | | | | | | | | | | | | | |
22.04% of Net Assets | | | | | | | | | | | | | |
AL State - Series A | | 5.000 | | | 06/01/2019 | | Aa3/AA* | | | 30,000 | | | 30,739 |
AL State Series A | | 5.000 | | | 06/01/2020 | | Aa3/AA* | | | 100,000 | | | 102,048 |
The accompanying notes are an integral part of the financial statements.
1
DUPREE MUTUAL FUNDS—ALABAMA TAX-FREE INCOME SERIES
SCHEDULE OF PORTFOLIO INVESTMENTS
Alabama Municipal Bonds—100%
June 30, 2004
| | | | | | | | | | | | | |
| Bond Description | | Coupon | | | Maturity
Date | | Rating# | | Par Value | | Market Value |
|
Alabama State Series B | | 5.000 | % | | 06/01/2021 | | Aa3/AA* | | $ | 30,000 | | $ | 30,490 |
Alabama State-Series A | | 4.625 | | | 09/01/2022 | | Aa3/AA* | | | 100,000 | | | 97,888 |
Alabama 21st Century Authority Tobacco Settlement Revenue | | 5.750 | | | 12/01/2020 | | A1/A* | | | 50,000 | | | 47,849 |
Alabama 21st Century Authority Tobacco Settlement Revenue | | 5.850 | | | 12/01/2013 | | A1/A* | | | 15,000 | | | 15,323 |
Birmingham AL Warrants | | 4.900 | | | 01/01/2018 | | Aa3/AA* | | | 150,000 | | | 153,189 |
Birmingham AL Capital Improvement Warrants-Series A | | 5.500 | | | 08/01/2025 | | Aa3/AA* | | | 100,000 | | | 104,585 |
Birmingham AL Referral Warrants-Series A | | 5.250 | | | 05/01/2018 | | Aa3/AA* | | | 300,000 | | | 320,421 |
Madison AL Warrants-Series C | | 5.000 | | | 09/01/2018 | | Aaa/AAA* | | | 250,000 | | | 259,655 |
| | | | | | | | | | | | |
|
|
| | | | | | | | | | | | | | 1,162,187 |
PUBLIC FACILITIES REVENUE BONDS | | | | | | | | | | | | | |
4.08% of Net Assets | | | | | | | | | | | | | |
AL State Public Schools & College Authority-Series B | | 5.000 | | | 12/01/2021 | | Aa3/AA* | | | 190,000 | | | 193,785 |
Hoover AL Wts-Series A | | 5.650 | | | 01/01/2014 | | Aa3/AA* | | | 10,000 | | | 11,045 |
Rockford AL Public Building Authority Building Revenue | | 5.750 | | | 09/01/2015 | | NR | | | 10,000 | | | 10,501 |
| | | | | | | | | | | | |
|
|
| | | | | | | | | | | | | | 215,331 |
MUNICIPAL UTILITIES | | | | | | | | | | | | | |
2.47% of Net Assets | | | | | | | | | | | | | |
Birmingham AL Water & Sewer Revenue Warrants-Series A | | 5.125 | | | 01/01/2017 | | Aa3/AA-* | | | 20,000 | | | 20,781 |
Birmingham AL Water & Sewer Revenue Warrants-Series A | | 4.750 | | | 01/01/2021 | | A1/AA-* | | | 100,000 | | | 98,649 |
Douglas AL Water & Fire Protection Authority Water Revenue | | 5.600 | | | 06/01/2015 | | NR | | | 10,000 | | | 10,560 |
| | | | | | | | | | | | |
|
|
| | | | | | | | | | | | | | 129,990 |
UNIVERSITY CONSOLIDATED EDUCATION & HOUSING | | | | | | | | | | | | | |
2.35% of Net Assets | | | | | | | | | | | | | |
Mobile AL Spring Hill College Educational Building | | 5.100 | | | 09/01/2019 | | Aa3 | | | 120,000 | | | 123,956 |
| | | | | | | | | | | | |
|
|
| | | | | | | | | | | | | | 123,956 |
HOSPITALS AND HEALTHCARE | | | | | | | | | | | | | |
2.26% of Net Assets | | | | | | | | | | | | | |
Blount County AL Health Care Authority Tax Anticipation War | | 5.750 | | | 02/15/2019 | | BBB+* | | | 25,000 | | | 26,014 |
Mobile AL Second Medical Clinic Board Revenue Franklin | | 5.050 | | | 03/01/2018 | | Aa3 | | | 50,000 | | | 51,088 |
Montgomery AL Baptist Medical Center Special Care | | 5.375 | | | 09/01/2022 | | Aaa/AAA* | | | 30,000 | | | 30,959 |
Oneonta Eastern Health System Special | | 7.750 | | | 07/01/2021 | | Baa1/BBB* | | | 10,000 | | | 10,941 |
| | | | | | | | | | | | |
|
|
| | | | | | | | | | | | | | 119,002 |
INDUSTRIAL REVENUE BONDS | | | | | | | | | | | | | |
2.03% of Net Assets | | | | | | | | | | | | | |
Auburn AL Industrial Development Board Facilities Revenue | | 5.800 | | | 11/01/2011 | | BBB* | | | 75,000 | | | 81,092 |
Auburn AL Industrial Development Board Facilities Revenue | | 6.200 | | | 11/01/2020 | | BBB* | | | 25,000 | | | 26,104 |
| | | | | | | | | | | | |
|
|
| | | | | | | | | | | | | | 107,196 |
PREREFUNDED BONDS | | | | | | | | | | | | | |
1.67% of Net Assets | | | | | | | | | | | | | |
Helena AL Utilities Board Water & Sewer Revenue | | 5.750 | | | 09/01/2025 | | Aaa/AAA* | | | 25,000 | | | 27,448 |
Jefferson County AL Sewer Revenue Capital Improvement | | 5.000 | | | 02/01/2021 | | Aaa/AAA* | | | 30,000 | | | 32,883 |
Lee County AL Warrants | | 5.500 | | | 02/01/2021 | | Aaa/AAA* | | | 15,000 | | | 16,449 |
Montevallo AL American | | 6.000 | | | 06/01/2013 | | NR | | | 10,000 | | | 11,165 |
| | | | | | | | | | | | |
|
|
| | | | | | | | | | | | | | 87,945 |
LEASE REVENUE BONDS | | | | | | | | | | | | | |
.39% of Net Assets | | | | | | | | | | | | | |
Mountain Brook AL City Board Education Capital Outlay | | 5.200 | | | 02/15/2021 | | Aa2 | | | 20,000 | | | 20,729 |
| | | | | | | | | | | | |
|
|
| | | | | | | | | | | | | | 20,729 |
STATE AND LOCAL MORTGAGE REVENUE BONDS | | | | | | | | | | | | | |
.30% of Net Assets | | | | | | | | | | | | | |
Alabama Housing Financial Authority Single Family Housing | | 6.000 | | | 04/01/2016 | | Aaa | | | 15,000 | | | 15,553 |
| | | | | | | | | | | | |
|
|
| | | | | | | | | | | | | | 15,553 |
| | | | | | | | | | | | |
|
|
Total Investments (cost $5,139,677)(a) - 99.16% of Net Assets | | | | | | | | | | | | $ | 5,228,364 |
| | | | | | | | | | | | |
|
|
The accompanying notes are an integral part of the financial statements.
2
DUPREE MUTUAL FUNDS—ALABAMA TAX-FREE INCOME SERIES
SCHEDULE OF PORTFOLIO INVESTMENTS
Alabama Municipal Bonds—100%
June 30, 2004
| | * | Standard and Poor’s Corporation |
| | All | other ratings by Moody’s Investors Service, Inc. |
| | # | Bond ratings are unaudited. |
| (a) | Cost for financial reporting and federal income tax purposes are substantially the same and differs from market value by net unrealized appreciation of securities as follows: |
| | | | |
Unrealized appreciation | | $ | 129,347 | |
Unrealized depreciation | | | (40,660 | ) |
| | |
|
|
|
Net unrealized appreciation | | $ | 88,687 | |
| | |
|
|
|
The accompanying notes are an integral part of the financial statements.
3
DUPREE MUTUAL FUNDS—ALABAMA TAX-FREE INCOME SERIES
STATEMENT OF ASSETS AND LIABILITIES
JUNE 30, 2004
| | | | | | | |
ASSETS: | | | | | | | |
Investments in securities, at value (Cost: $5,139,677) | | | | | $ | 5,228,364 | |
Cash | | | | | | 43,411 | |
Interest receivable | | | | | | 69,163 | |
Prepaid expenses | | | | | | 1,287 | |
| | | | | |
|
|
|
Total assets | | | | | | 5,342,225 | |
LIABILITIES: | | | | | | | |
Payable for: | | | | | | | |
Distributions | | $ | 57,081 | | | | |
Investment advisory fee | | | 3,497 | | | | |
Transfer agent fee | | | 8,809 | | | | |
Total liabilities | | | | | | 69,387 | |
| | | | | |
|
|
|
NET ASSETS: | | | | | | | |
Capital | | | | | | 5,193,954 | |
Net accumulated realized loss on investment transactions | | | | | | (9,803 | ) |
Net unrealized appreciation in value of investments | | | | | | 88,687 | |
| | | | | |
|
|
|
Net assets at value | | | | | $ | 5,272,838 | |
| | | | | |
|
|
|
NET ASSET VALUE, offering price and redemption price per share ($5,272,838 –:– 460,418 shares outstanding; unlimited number of shares authorized; no par value) | | | | | $ | 11.45 | |
| | | | | |
|
|
|
STATEMENT OF OPERATIONS
For the year ended June 30, 2004
| | | | |
Net investment income: | | | | |
Interest income | | $ | 242,399 | |
| | |
|
|
|
Expenses: | | | | |
Investment advisory fee | | | 25,461 | |
Transfer agent fee | | | 7,638 | |
Custodian and interest expense | | | 5,287 | |
Pricing fees | | | 2,788 | |
Professional fees | | | 2,125 | |
Trustee fees | | | 488 | |
Other expenses | | | 2,688 | |
| | |
|
|
|
Total expenses | | | 46,475 | |
Fees waived by Adviser | | | (20,794 | ) |
Custodian and interest expense reductions | | | (5,287 | ) |
| | |
|
|
|
Net expenses | | | 20,394 | |
| | |
|
|
|
Net investment income | | | 222,005 | |
| | |
|
|
|
Realized and unrealized loss on investments: | | | | |
Net realized loss | | | (1,541 | ) |
Net decrease in unrealized appreciation | | | (158,779 | ) |
| | |
|
|
|
Net realized and unrealized loss on investments | | | (160,320 | ) |
| | |
|
|
|
Net increase in net assets resulting from operations | | $ | 61,685 | |
| | |
|
|
|
The accompanying notes are an integral part of the financial statements.
4
DUPREE MUTUAL FUNDS—ALABAMA TAX-FREE INCOME SERIES
STATEMENTS OF CHANGES IN NET ASSETS
For the years ended June 30, 2004 and 2003
| | | | | | | | |
| | | 2004
| | | 2003
| |
Increase in net assets: | | | | | | | | |
Operations: | | | | | | | | |
Net investment income | | $ | 222,005 | | | $ | 183,177 | |
Net realized loss on investments | | | (1,541 | ) | | | (4,252 | ) |
Net (decrease)/increase in unrealized appreciation | | | (158,779 | ) | | | 171,044 | |
| | |
|
|
| |
|
|
|
Net increase in net assets resulting from operations | | | 61,685 | | | | 349,969 | |
Distributions to shareholders from net investment income | | | (222,005 | ) | | | (183,177 | ) |
Net fund share transactions | | | 817,715 | | | | 2,044,615 | |
| | |
|
|
| |
|
|
|
Total increase | | | 657,395 | | | | 2,211,407 | |
Net assets: | | | | | | | | |
Beginning of year | | | 4,615,443 | | | | 2,404,036 | |
| | |
|
|
| |
|
|
|
End of year | | $ | 5,272,838 | | | $ | 4,615,443 | |
| | |
|
|
| |
|
|
|
FINANCIAL HIGHLIGHTS
Selected data for a share outstanding:
| | | | | | | | | | | | | | | | | | | | |
| | | For the years ended June 30,
| | | The period 1/1/2000 to 6/30/00 (a)
| |
| | | 2004
| | | 2003
| | | 2002
| | | 2001
| | |
Net asset value, beginning of year | | $ | 11.80 | | | $ | 11.22 | | | $ | 10.99 | | | $ | 10.31 | | | $ | 10.00 | |
| | |
|
|
| |
|
|
| |
|
|
| |
|
|
| |
|
|
|
Income from investment operations: | | | | | | | | | | | | | | | | | | | | |
Net investment income | | | 0.51 | | | | 0.52 | | | | 0.56 | | | | 0.56 | | | | 0.26 | |
Net gains/(losses) on securities, both realized and unrealized | | | (0.35 | ) | | | 0.58 | | | | 0.23 | | | | 0.68 | | | | 0.31 | |
| | |
|
|
| |
|
|
| |
|
|
| |
|
|
| |
|
|
|
Total from investment operations | | | 0.16 | | | | 1.10 | | | | 0.79 | | | | 1.24 | | | | 0.57 | |
Less distributions: | | | | | | | | | | | | | | | | | | | | |
Distributions from net investment income | | | (0.51 | ) | | | (0.52 | ) | | | (0.56 | ) | | | (0.56 | ) | | | (0.26 | ) |
| | |
|
|
| |
|
|
| |
|
|
| |
|
|
| |
|
|
|
Net asset value, end of year | | $ | 11.45 | | | $ | 11.80 | | | $ | 11.22 | | | $ | 10.99 | | | $ | 10.31 | |
| | |
|
|
| |
|
|
| |
|
|
| |
|
|
| |
|
|
|
Total return | | | 1.36 | % | | | 9.98 | % | | | 7.32 | % | | | 12.33 | % | | | 5.79 | % (c) |
Net assets, end of year (in thousands) | | $ | 5,273 | | | $ | 4,615 | | | $ | 2,404 | | | $ | 1,297 | | | $ | 222 | |
Ratio of net expenses to average net assets (d) | | | 0.40 | % | | | 0.33 | % | | | 0.28 | % | | | 0.21 | % | | | 0.50 | % (b) |
Ratio of net investment income to average net assets | | | 4.36 | % | | | 4.46 | % | | | 4.99 | % | | | 5.27 | % | | | 5.23 | % (b) |
Portfolio turnover | | | 16.43 | % | | | 6.24 | % | | | 18.15 | % | | | 15.28 | % | | | 0.00 | % |
| (a) | Commencement of operations January 1, 2000 |
| (c) | Total return is not annualized |
| (d) | Percentages are after expenses waived by Adviser and custodian and interest expense reductions. |
Expenses waived by Adviser and custodian and interest expense reductions were:
.41% and .10% for 2004, .50% and .12% for 2003, .53% and .23% for 2002, ..80%, .72% for 2001, and 2.76% and 1.35% for 2000, respectively.
The accompanying notes are an integral part of the financial statements.
5
DUPREE MUTUAL FUNDS—KENTUCKY TAX-FREE INCOME SERIES
SCHEDULE OF PORTFOLIO INVESTMENTS
Kentucky Municipal Bonds—100%
June 30, 2004
| | | | | | | | | | | | | |
| Bond Description | | Coupon | | | Maturity
Date | | Rating# | | Par Value | | Market Value |
|
INSURED MUNICIPAL REVENUE BONDS | | | | | | | | | | | | | |
46.82% of Net Assets | | | | | | | | | | | | | |
Bardstown KY Combined Utilities Revenue | | 5.000 | % | | 12/01/2017 | | Aaa/AAA* | | $ | 1,290,000 | | $ | 1,345,522 |
Bardstown KY Combined Utilities Revenue | | 5.000 | | | 12/01/2018 | | Aaa/A2* | | | 1,510,000 | | | 1,568,966 |
Barren County School District Finance Corporation | | 4.750 | | | 08/01/2022 | | Aaa/Aa3* | | | 3,085,000 | | | 3,084,877 |
Boone County KY Water—Florence | | 5.000 | | | 12/01/2015 | | Aaa/AAA* | | | 1,000,000 | | | 1,060,480 |
Boone-Florence KY Water Supply System Revenue | | 5.000 | | | 12/01/2017 | | Aaa/A2* | | | 1,805,000 | | | 1,891,766 |
Boone-Florence KY Water Supply System Revenue | | 5.000 | | | 12/01/2018 | | Aaa/A2* | | | 1,900,000 | | | 1,982,593 |
Boone-Florence County KY Water Supply System Revenue | | 5.000 | | | 12/01/2020 | | Aaa/AAA* | | | 2,100,000 | | | 2,168,397 |
Boyle County KY Hospital Revenue-Ephraim McDowell Regional | | 5.800 | | | 04/01/2014 | | Aaa/AAA* | | | 1,000,000 | | | 1,020,620 |
Campbell & Kenton Counties Sanitation District Number 1 | | 5.000 | | | 08/01/2017 | | Aaa/AAA* | | | 1,000,000 | | | 1,043,870 |
Carrollton & Henderson KY Public Energy Authority Gas Revenue | | 5.000 | | | 01/01/2007 | | Aaa/AAA* | | | 1,000,000 | | | 1,061,030 |
Eastern Kentucky University Consolidated Educational Building | | 5.000 | | | 05/01/2021 | | AAA* | | | 1,580,000 | | | 1,624,414 |
Fayette County KY School District Finance Corporation | | 5.250 | | | 04/01/2021 | | Aaa/AAA* | | | 2,285,000 | | | 2,400,575 |
Fayette County School District Finance Corporation | | 4.500 | | | 03/01/2022 | | Aaa/AA-* | | | 4,100,000 | | | 3,978,107 |
Greater KY Housing Assistance Corporation-Chenowith Woods | | 6.100 | | | 01/01/2024 | | Aaa/AAA* | | | 985,000 | | | 985,158 |
Greater Ky Housing Assistance Corporation-Northside Apts | | 6.200 | | | 02/01/2025 | | AAA* | | | 4,365,000 | | | 4,365,829 |
Greater KY Housing Assistance Corporation Mortgage Revenue | | 5.450 | | | 05/20/2027 | | Aaa | | | 1,245,000 | | | 1,278,055 |
Jefferson County KY Health Facilities-Jewish Hospital | | 5.650 | | | 01/01/2017 | | Aaa/AAA* | | | 3,450,000 | | | 3,696,399 |
Jefferson County KY Health Facilities Jewish Hospital | | 5.700 | | | 01/01/2021 | | Aaa/AAA* | | | 4,520,000 | | | 4,802,093 |
Jefferson County KY Health Facilities University Medical Center | | 5.500 | | | 07/01/2017 | | Aaa/AAA* | | | 8,675,000 | | | 9,251,280 |
Jefferson County KY School District Finance Corporation | | 5.125 | | | 11/01/2016 | | Aaa/AAA* | | | 1,000,000 | | | 1,087,870 |
Jefferson County Ky School District Finance Corporation | | 5.250 | | | 01/01/2016 | | Aaa/AAA* | | | 1,000,000 | | | 1,062,500 |
Jefferson County School District Finance Corporation | | 5.250 | | | 01/01/2019 | | Aaa/AAA* | | | 2,000,000 | | | 2,093,520 |
Jefferson County KY Health Facilities-Alliant Health System | | 5.125 | | | 10/01/2017 | | Aaa/AAA* | | | 2,940,000 | | | 3,034,668 |
Jefferson County KY School District Finance Corporation | | 3.500 | | | 01/01/2014 | | Aaa/AAA* | | | 3,565,000 | | | 3,376,483 |
Jefferson County KY School District Finance Corporation | | 3.500 | | | 07/01/2015 | | Aaa/AAA* | | | 2,110,000 | | | 1,957,975 |
Jefferson County KY Capital Projects Corporation Revenue | | 5.375 | | | 06/01/2018 | | Aaa/AAA* | | | 1,500,000 | | | 1,597,980 |
Kenton County School District Finance Corporation | | 5.000 | | | 06/01/2021 | | Aaa/Aa3* | | | 4,055,000 | | | 4,150,414 |
Kentucky Economic Development Finance Authority-Ashland Hospital | | 5.000 | | | 02/01/2018 | | Aaa/AAA* | | | 1,500,000 | | | 1,525,500 |
Kentucky Development Finance Authority-St Clair Medical | | 5.875 | | | 09/01/2013 | | Aaa | | | 2,000,000 | | | 2,054,900 |
Kentucky Development Finance Authority-St Claire Medical | | 5.625 | | | 09/01/2021 | | AAA* | | | 2,500,000 | | | 2,566,875 |
Kentucky Development Finance Authority-Methodist Hospital | | 5.625 | | | 02/01/2017 | | AAA* | | | 6,500,000 | | | 6,962,278 |
Kentucky Development Finance Authority-Appalachian Regional | | 5.850 | | | 10/01/2017 | | A/A* | | | 1,000,000 | | | 1,035,390 |
Kentucky Development Authority-South Central Nursing | | 6.000 | | | 07/01/2027 | | Aaa/AAA* | | | 2,765,000 | | | 2,989,767 |
Kentucky Development Finance Authority-Baptist Hospital | | 5.000 | | | 08/15/2015 | | Aaa/AAA* | | | 3,250,000 | | | 3,328,813 |
Kentucky Housing Corporation | | 4.750 | | | 07/01/2017 | | Aaa/AAA* | | | 1,335,000 | | | 1,358,149 |
Kentucky Housing Corporation | | 5.950 | | | 07/01/2017 | | Aaa/AAA* | | | 1,500,000 | | | 1,549,320 |
Kentucky Housing Corporation | | 4.650 | | | 07/01/2023 | | Aaa/AAA* | | | 3,595,000 | | | 3,471,728 |
Kentucky Housing Corporation | | 5.800 | | | 07/01/2013 | | Aaa/AAA* | | | 1,000,000 | | | 1,047,840 |
Kentucky Housing Corporation | | 5.700 | | | 07/01/2017 | | Aaa/AAA* | | | 500,000 | | | 518,420 |
Kentucky Housing Corporation | | 5.500 | | | 01/01/2015 | | Aaa/AAA* | | | 1,000,000 | | | 1,046,900 |
Kentucky Housing Corporation | | 4.400 | | | 01/01/2017 | | Aaa/AAA* | | | 1,000,000 | | | 995,240 |
Kentucky Housing Corporation | | 4.850 | | | 01/01/2024 | | Aaa/AAA* | | | 2,000,000 | | | 1,985,040 |
KY State Property & Building Commission Project #64 | | 5.500 | | | 05/01/2017 | | Aaa/AAA* | | | 8,000,000 | | | 8,895,600 |
KY State Property & Building Commission Project #73 | | 5.000 | | | 11/01/2021 | | Aaa/AAA* | | | 1,000,000 | | | 1,025,280 |
KY State Property & Building Commission Project #72 | | 5.375 | | | 10/01/2016 | | Aaa/AAA* | | | 5,000,000 | | | 5,595,600 |
KY State Property & Building Commission Project #72 | | 5.000 | | | 10/01/2020 | | Aaa/AAA* | | | 11,305,000 | | | 11,601,417 |
KY State Property & Building Commission Project #74 | | 5.000 | | | 02/01/2020 | | Aaa/AAA* | | | 4,000,000 | | | 4,109,040 |
KY State Property & Building Commission Project #74 | | 5.000 | | | 02/01/2022 | | Aaa/AAA* | | | 3,000,000 | | | 3,054,810 |
KY State Property & Building Commission Project #74 | | 5.000 | | | 10/01/2018 | | Aaa/AAA* | | | 15,000,000 | | | 15,993,600 |
KY State Property & Building Commission Project #74 | | 5.000 | | | 02/01/2019 | | Aaa/AAA* | | | 3,000,000 | | | 3,095,370 |
KY State Property & Building Commission Project #73 | | 5.500 | | | 11/01/2017 | | Aaa/AAA* | | | 1,000,000 | | | 1,094,250 |
KY State Property & Building Commission Project #73 | | 5.000 | | | 11/01/2019 | | Aaa/AAA* | | | 1,360,000 | | | 1,406,743 |
KY State Property & Building Commission Project #73 | | 5.000 | | | 11/01/2020 | | Aaa/AAA* | | | 3,255,000 | | | 3,355,449 |
KY State Property & Building Commission Project #77 | | 5.250 | | | 08/01/2015 | | Aaa/AAA* | | | 1,140,000 | | | 1,262,276 |
KY State Property & Building Commission Project #77 | | 5.250 | | | 08/01/2016 | | Aaa/AAA* | | | 1,680,000 | | | 1,857,475 |
KY State Property & Building Commission Project #77 | | 5.250 | | | 08/01/2018 | | Aaa/AAA* | | | 4,325,000 | | | 4,781,893 |
KY State Property & Building Commission Project #79 | | 5.125 | | | 10/01/2016 | | Aaa/AAA* | | | 2,040,000 | | | 2,230,740 |
KY State Property & Building Commission Project #79 | | 5.000 | | | 10/01/2021 | | Aaa/AAA* | | | 5,000,000 | | | 5,137,600 |
KY State Property & Building Commission Project #79 | | 5.000 | | | 10/01/2022 | | Aaa/AAA* | | | 1,500,000 | | | 1,532,220 |
KY State Property & Building Commission Project #79 | | 4.750 | | | 10/01/2023 | | Aaa/AAA* | | | 3,000,000 | | | 2,973,630 |
KY State Property & Building Commission Project #80 | | 5.250 | | | 05/01/2018 | | Aaa/AAA* | | | 2,940,000 | | | 3,209,510 |
The accompanying notes are an integral part of the financial statements.
6
DUPREE MUTUAL FUNDS—KENTUCKY TAX-FREE INCOME SERIES
SCHEDULE OF PORTFOLIO INVESTMENTS
Kentucky Municipal Bonds—100%
June 30, 2004
| | | | | | | | | | | | | |
| Bond Description | | Coupon | | | Maturity
Date | | Rating# | | Par Value | | Market Value |
|
KY State Property & Building Commission Project #81 | | 5.000 | % | | 11/01/2020 | | Aaa/AAA* | | $ | 2,560,000 | | $ | 2,646,682 |
KY State Turnpike Authority Economic Development Road Revenue | | 5.150 | | | 07/01/2019 | | Aaa/AAA* | | | 1,000,000 | | | 1,041,100 |
KY Turnpike Economic Development | | 5.500 | | | 07/01/2010 | | Aaa/AAA* | | | 5,000,000 | | | 5,565,800 |
Letcher County School District Finance Corporation | | 5.000 | | | 06/01/2022 | | Aaa/Aa3* | | | 1,755,000 | | | 1,792,101 |
Letcher County School District Finance Corporation | | 5.000 | | | 06/01/2024 | | Aaa/Aa3* | | | 1,930,000 | | | 1,944,919 |
Lexington Fayette Urban County Government Public Facilities | | 5.125 | | | 10/01/2015 | | Aaa/AAA* | | | 1,770,000 | | | 1,873,085 |
Lexington Fayette Urban County Government Public Facilities | | 5.125 | | | 10/01/2017 | | Aaa/AAA* | | | 1,830,000 | | | 1,929,534 |
Lexington Fayette Urban County Government Public Facilities | | 5.125 | | | 10/01/2018 | | Aaa/AAA* | | | 2,135,000 | | | 2,248,667 |
Lexington Fayette Urban County Government Public Facilities | | 5.125 | | | 10/01/2019 | | Aaa/AAA* | | | 2,415,000 | | | 2,535,195 |
Louisville & Jefferson County KY Metropolitan Sewer | | 5.000 | | | 05/15/2019 | | Aaa/AAA* | | | 2,500,000 | | | 2,578,400 |
Louisville & Jefferson County Metropolitan Sewer | | 4.750 | | | 05/15/2028 | | Aaa/AAA* | | | 10,000,000 | | | 9,559,300 |
Louisville & Jefferson County KY Regional Airport Authority | | 5.500 | | | 07/01/2017 | | Aaa/AAA* | | | 2,655,000 | | | 2,867,267 |
Louisville & Jefferson County Visitors & Convention | | 4.500 | | | 12/01/2023 | | Aaa/AAA* | | | 2,340,000 | | | 2,243,311 |
Louisville & Jefferson Visitors and Convention | | 4.500 | | | 12/01/2024 | | Aaa/AAA* | | | 2,250,000 | | | 2,109,735 |
Louisville & Jefferson County Visitors and Convention Center | | 4.600 | | | 12/01/2025 | | Aaa/AAA* | | | 1,490,000 | | | 1,414,010 |
Louisville KY G.O. Series A | | 5.000 | | | 10/01/2020 | | Aaa/AAA* | | | 7,165,000 | | | 7,374,290 |
Louisville Health Care Facilities | | 6.650 | | | 12/20/2030 | | Aaa | | | 5,125,000 | | | 5,589,735 |
Louisville KY Parking Authority-River City First Mortgage | | 5.000 | | | 12/01/2017 | | Aaa/AAA* | | | 1,000,000 | | | 1,034,370 |
Madison County School District Finance Corporation | | 4.500 | | | 04/01/2016 | | Aaa/AAA* | | | 695,000 | | | 708,059 |
Marshall County School District Finance Corporation | | 5.000 | | | 06/01/2022 | | Aaa/Aa3* | | | 1,400,000 | | | 1,415,218 |
McCracken County School District Finance Corporation | | 4.650 | | | 07/01/2019 | | Aaa/AAA* | | | 1,655,000 | | | 1,668,190 |
McCracken County KY School District Finance Corporation | | 4.700 | | | 07/01/2020 | | Aaa/AAA* | | | 1,725,000 | | | 1,736,437 |
McCracken County School District Finance Corportion | | 5.000 | | | 07/01/2022 | | Aaa/AAA* | | | 4,000,000 | | | 4,073,880 |
McCreary County Courthouse & Public Square Corporation Reve | | 5.400 | | | 09/01/2020 | | AAA* | | | 1,550,000 | | | 1,644,132 |
Nelson County School District Finance Corporation | | 4.500 | | | 04/01/2021 | | Aaa/Aa3* | | | 1,130,000 | | | 1,111,638 |
Nelson County School District Finance Corporation | | 4.500 | | | 04/01/2023 | | Aaa/Aa3* | | | 2,505,000 | | | 2,409,585 |
Northern KY University Certificate of Participation | | 4.900 | | | 12/01/2021 | | Aaa | | | 2,725,000 | | | 2,768,110 |
Northern KY University Certificate of Participation | | 5.000 | | | 12/01/2024 | | Aaa | | | 2,000,000 | | | 2,013,560 |
Northern KY Water District Revenue Series A | | 5.000 | | | 02/01/2020 | | Aaa/A2* | | | 3,080,000 | | | 3,163,961 |
Northern KY Water District Revenue Series A | | 5.000 | | | 02/01/2021 | | Aaa/AAA* | | | 2,635,000 | | | 2,694,973 |
Northern Kentucky Water District | | 4.000 | | | 02/01/2019 | | Aaa | | | 1,275,000 | | | 1,186,604 |
Northern Kentucky Water District | | 4.125 | | | 02/01/2020 | | Aaa | | | 1,325,000 | | | 1,240,028 |
Northern Kentucky Water District | | 4.125 | | | 02/01/2021 | | Aaa | | | 1,380,000 | | | 1,277,231 |
Pike County KY Mortgage Revenue-Phelps Regional Health | | 5.350 | | | 09/20/2012 | | AAA* | | | 210,000 | | | 222,766 |
Radcliff KY Mortgage Revenue-Lincoln Trail Care | | 5.650 | | | 01/20/2019 | | AAA* | | | 3,110,000 | | | 3,280,801 |
Shelby County School District Finance Corporation | | 5.000 | | | 05/01/2022 | | Aaa/Aa3* | | | 1,815,000 | | | 1,854,513 |
Shelbyville KY Certificate of Participation | | 5.150 | | | 07/01/2018 | | Aaa | | | 4,165,000 | | | 4,386,536 |
Spencer County School District Finance Corporation | | 5.000 | | | 07/01/2023 | | Aaa/Aa3 | | | 1,000,000 | | | 1,014,940 |
University of Kentucky Consolidated Educational Buildings | | 5.750 | | | 05/01/2015 | | Aaa/AAA* | | | 1,850,000 | | | 1,955,598 |
University of Kentucky Consolidated Educational Buildings | | 5.000 | | | 05/01/2015 | | Aaa/AAA* | | | 1,305,000 | | | 1,421,106 |
University of Kentucky Housing and Dining | | 4.400 | | | 06/01/2017 | | Aaa/Aa3* | | | 2,815,000 | | | 2,819,026 |
Warren County Ky Hospital Facility Revenue | | 4.625 | | | 04/01/2012 | | Aaa/AAA* | | | 1,500,000 | | | 1,559,580 |
Warren County KY Hospital Facility Revenue | | 5.000 | | | 04/01/2016 | | Aaa/AAA* | | | 1,000,000 | | | 1,038,820 |
Warren County Ky Hospital Facility Revenue | | 5.000 | | | 04/01/2017 | | Aaa/AAA* | | | 1,000,000 | | | 1,032,130 |
| | | | | | | | | | | | |
|
|
| | | | | | | | | | | | | | 287,665,027 |
LEASE REVENUE BONDS | | | | | | | | | | | | | |
20.39% of Net Assets | | | | | | | | | | | | | |
Boone County KY School District Finance Corporation | | 5.500 | | | 09/01/2019 | | Aa3 | | | 1,860,000 | | | 1,990,665 |
Boone County KY School District Finance Corporation | | 5.750 | | | 02/01/2020 | | Aa3 | | | 1,200,000 | | | 1,304,964 |
Boone County KY School District Finance Corporation | | 5.000 | | | 08/01/2019 | | Aa3 | | | 1,040,000 | | | 1,076,816 |
Boone County KY School District Finance Corporation | | 5.000 | | | 02/01/2022 | | Aa3 | | | 3,000,000 | | | 3,043,230 |
Bullitt County KY School District Finance Corporation | | 5.000 | | | 07/01/2021 | | Aa3 | | | 1,000,000 | | | 1,025,510 |
Christian County KY Public Courthouse Lease Revenue | | 5.125 | | | 08/01/2017 | | Aa3 | | | 1,090,000 | | | 1,145,819 |
Christian County KY Public Courthouse Lease Revenue | | 5.125 | | | 08/01/2018 | | Aa3 | | | 1,145,000 | | | 1,197,785 |
Covington Independent School District Finance Corporation | | 5.250 | | | 06/01/2019 | | Aa3 | | | 1,225,000 | | | 1,280,444 |
Danville Multi-City Lease Campbellsville Water & Sewer | | 3.500 | | | 07/01/2012 | | Baa1 | | | 1,950,000 | | | 1,921,862 |
Davies County School District Finance Corporation | | 5.000 | | | 06/01/2021 | | Aa3 | | | 1,155,000 | | | 1,177,580 |
Estill County KY School District Finance Corporation | | 5.875 | | | 08/01/2016 | | Aa3 | | | 1,780,000 | | | 1,951,645 |
Fayette County KY School District Financial Corporation | | 5.375 | | | 01/01/2017 | | AA3/AA-* | | | 1,300,000 | | | 1,377,558 |
Franklin County KY School District Building Revenue | | 4.200 | | | 05/01/2023 | | Aa3 | | | 2,195,000 | | | 1,967,335 |
Franklin County KY School District Building Revenue | | 4.000 | | | 03/01/2017 | | Aa3 | | | 1,690,000 | | | 1,593,366 |
Franklin County KY School District Building Revenue | | 4.500 | | | 03/01/2024 | | Aa3 | | | 2,240,000 | | | 2,074,173 |
Green County Ky School District Finance Corporation | | 5.000 | | | 04/01/2021 | | Aa3 | | | 1,085,000 | | | 1,113,546 |
The accompanying notes are an integral part of the financial statements.
7
DUPREE MUTUAL FUNDS—KENTUCKY TAX-FREE INCOME SERIES
SCHEDULE OF PORTFOLIO INVESTMENTS
Kentucky Municipal Bonds—100%
June 30, 2004
| | | | | | | | | | | | | |
| Bond Description | | Coupon | | | Maturity
Date | | Rating# | | Par Value | | Market Value |
|
Greenup County KY School District Finance Corporation | | 4.650 | % | | 03/01/2021 | | Aa3 | | $ | 1,650,000 | | $ | 1,658,168 |
Hardin County KY School District Finance Corporation | | 6.000 | | | 07/01/2016 | | Aa3 | | | 1,025,000 | | | 1,118,829 |
Harlan KY Independent School District Finance Corporation | | 6.000 | | | 05/01/2015 | | Aa3 | | | 275,000 | | | 290,356 |
Hopkins County KY School District Finance Corporation | | 5.125 | | | 06/01/2019 | | Aa3 | | | 4,120,000 | | | 4,314,258 |
Jessamine County KY School District Finance Corporation | | 5.375 | | | 01/01/2017 | | Aa3/A+* | | | 1,500,000 | | | 1,594,875 |
Kenton County KY School District Finance Corporation | | 5.375 | | | 03/01/2017 | | A+* | | | 4,300,000 | | | 4,545,659 |
KY Area Development Districts Lease City of Ewing | | 5.700 | | | 06/01/2015 | | AA* | | | 1,500,000 | | | 1,609,125 |
Kentucky Area Development Districts Financing Lease-Ewing | | 5.600 | | | 06/01/2022 | | AA* | | | 1,055,000 | | | 1,127,204 |
KY Area Development Districts Financing Trust Lease | | 5.350 | | | 12/01/2022 | | AA* | | | 2,560,000 | | | 2,675,738 |
Kentucky Area Development Districts Financing Lease Program | | 5.400 | | | 12/01/2021 | | AA* | | | 710,000 | | | 752,238 |
Kentucky Area Development Districts Financing Lease | | 5.400 | | | 12/01/2021 | | AA* | | | 1,095,000 | | | 1,155,127 |
KY Infrastructure Authority | | 5.750 | | | 08/01/2013 | | A-* | | | 575,000 | | | 582,705 |
KY Interlocal Transportation Equipment Lease Revenue | | 6.000 | | | 12/01/2020 | | A+* | | | 400,000 | | | 404,268 |
Kentucky Infrastructure Authority | | 5.750 | | | 08/01/2018 | | Aa3/A* | | | 1,500,000 | | | 1,519,305 |
Kentucky Infrastructure Authority | | 6.375 | | | 08/01/2014 | | Aa3/A* | | | 700,000 | | | 745,318 |
Kentucky Infrastructure Authority Series A | | 5.000 | | | 06/01/2019 | | Aa3/AA-* | | | 1,000,000 | | | 1,027,610 |
Kentucky Infrastructure Authority | | 5.375 | | | 02/01/2018 | | Aa3/A* | | | 2,000,000 | | | 2,022,560 |
Kentucky Infrasturcture Authority | | 5.000 | | | 06/01/2017 | | Aa3/A* | | | 1,035,000 | | | 1,069,983 |
KY State Property & Building Commission Project #67 | | 5.375 | | | 09/01/2019 | | Aa3/AA-* | | | 3,475,000 | | | 3,864,096 |
KY State Property & Building Commission Project #68 | | 5.250 | | | 10/01/2018 | | Aa3/A+* | | | 1,500,000 | | | 1,582,635 |
KY State Property & Building Commission Project #68 | | 5.000 | | | 10/01/2019 | | Aa3/AA-* | | | 5,500,000 | | | 5,642,120 |
KY State Property & Building Commission Project #73 | | 5.500 | | | 11/01/2013 | | Aa3/AA-* | | | 1,500,000 | | | 1,656,795 |
Laurel County KY School District Finance Corporation | | 5.600 | | | 03/01/2017 | | Aa3 | | | 1,000,000 | | | 1,089,250 |
Laurel County KY School District Finance Corporation | | 5.750 | | | 06/01/2020 | | Aa3 | | | 1,250,000 | | | 1,374,250 |
Martin County KY School District Finance Corporation | | 5.375 | | | 09/01/2020 | | Aa3 | | | 1,100,000 | | | 1,157,816 |
Montgomery County KY School District Finance Corporation | | 4.375 | | | 04/01/2023 | | Aa3 | | | 3,105,000 | | | 2,866,816 |
Oldham County KY School District Finance Corporation | | 5.000 | | | 12/01/2021 | | Aa3 | | | 2,090,000 | | | 2,138,802 |
Pendleton County KY Multi-County Lease Revenue | | 6.500 | | | 03/01/2019 | | A* | | | 34,500,000 | | | 35,010,945 |
Pendleton County KY Multi-County Lease Revenue | | 6.400 | | | 03/01/2019 | | A* | | | 3,000,000 | | | 3,504,510 |
Pendleton County KY School District Finance Corporation | | 5.125 | | | 06/01/2019 | | Aa3 | | | 1,140,000 | | | 1,194,047 |
Pike County KY School District Finance Corporation | | 5.000 | | | 09/01/2016 | | Aa3 | | | 1,850,000 | | | 1,934,656 |
Pike County KY School District Finance Corporation | | 5.100 | | | 09/01/2020 | | Aa3 | | | 1,000,000 | | | 1,032,290 |
Richmond KY Court Facilities Corporation Revenue | | 5.250 | | | 02/01/2019 | | AA* | | | 1,035,000 | | | 1,070,697 |
Scott County KY School District | | 5.000 | | | 03/01/2021 | | Aa3 | | | 1,240,000 | | | 1,266,610 |
Trigg County KY School District Finance Corporation | | 4.600 | | | 04/01/2018 | | Aa3 | | | 1,700,000 | | | 1,713,617 |
Whitley County KY School Finance | | 4.800 | | | 02/01/2021 | | Aa3 | | | 800,000 | | | 811,632 |
Woodford County KY School District Financing Corporation | | 3.625 | | | 07/01/2017 | | Aa3 | | | 1,250,000 | | | 1,122,613 |
Woodford County KY School District Financing Corporation | | 4.250 | | | 07/01/2023 | | Aa3 | | | 1,970,000 | | | 1,776,645 |
| | | | | | | | | | | | |
|
|
| | | | | | | | | | | | | | 125,266,466 |
PUBLIC FACILITIES REVENUE BONDS | | | | | | | | | | | | | |
7.79% of Net Assets | | | | | | | | | | | | | |
Boone County KY Public Property Corporation - Judicial Facilities | | 5.000 | | | 09/01/2019 | | Aa3 | | | 1,000,000 | | | 1,034,600 |
Boone County KY Public Property Corporation - Judicial Facilities | | 5.125 | | | 09/01/2022 | | Aa3 | | | 1,750,000 | | | 1,802,325 |
Calloway County Public Property Corporation-Courthouse | | 5.625 | | | 03/01/2018 | | A | | | 1,000,000 | | | 1,073,210 |
Danville Ky Multi-City Lease Revenue-Mt Sterling | | 5.000 | | | 09/01/2011 | | NR | | | 545,000 | | | 571,683 |
Florence KY Public Property Corporation Revenue | | 5.250 | | | 03/01/2017 | | A3 | | | 1,060,000 | | | 1,097,831 |
Kenton County KY Public Property Corporation Revenue | | 5.700 | | | 12/01/2015 | | A2 | | | 1,305,000 | | | 1,398,738 |
Kenton County KY Public Property Corporation Revenue | | 5.700 | | | 12/01/2016 | | A2 | | | 1,380,000 | | | 1,477,124 |
Kentucky League of Cities-Middlesboro Series | | 6.200 | | | 08/01/2017 | | A-* | | | 555,000 | | | 568,603 |
KY State Property & Building Commission Project #63 | | 5.100 | | | 11/01/2018 | | Aa3/AA-* | | | 2,000,000 | | | 2,184,940 |
KY State Property & Building Commission Project #67 | | 5.125 | | | 09/01/2018 | | Aa3/AA-* | | | 1,000,000 | | | 1,097,560 |
Mt. Sterling KY Lease Revenue-Kentucky League of Cities | | 6.100 | | | 03/01/2008 | | Aa | | | 1,500,000 | | | 1,524,300 |
Mt. Sterling KY Lease Revenue-Kentucky League of Cities | | 6.150 | | | 03/01/2013 | | Aa | | | 17,860,000 | | | 18,155,047 |
Mt. Sterling KY Lease Revenue-Kentucky League of Cities | | 6.200 | | | 03/01/2018 | | Aa | | | 14,500,000 | | | 14,739,540 |
Oldham County KY Public Facilities Construction Corporation | | 5.250 | | | 06/01/2017 | | A+* | | | 1,060,000 | | | 1,105,135 |
| | | | | | | | | | | | |
|
|
| | | | | | | | | | | | | | 47,830,636 |
ESCROWED TO MATURITY BONDS | | | | | | | | | | | | | |
6.91% of Net Assets | | | | | | | | | | | | | |
Danville KY Multi-City Lease Revenue-Hopkinsville | | 6.875 | | | 06/01/2012 | | Baa1 | | | 2,170,000 | | | 2,474,885 |
Jefferson County KY Health Facilities Services - Alliant Health | | 5.125 | | | 10/01/2018 | | Aaa/AAA* | | | 33,000,000 | | | 34,821,600 |
Jefferson County KY Health Facilities Alliant Health Services | | 5.125 | | | 10/01/2017 | | Aaa/AAA* | | | 4,980,000 | | | 5,164,907 |
| | | | | | | | | | | | |
|
|
| | | | | | | | | | | | | | 42,461,392 |
The accompanying notes are an integral part of the financial statements.
8
DUPREE MUTUAL FUNDS—KENTUCKY TAX-FREE INCOME SERIES
SCHEDULE OF PORTFOLIO INVESTMENTS
Kentucky Municipal Bonds—100%
June 30, 2004
| | | | | | | | | | | | | |
| Bond Description | | Coupon | | | Maturity
Date | | Rating# | | Par Value | | Market Value |
|
HOSPITAL AND HEALTHCARE REVENUE BONDS | | | | | | | | | | | | | |
6.46% of Net Assets | | | | | | | | | | | | | |
Christian County KY Hospital Revenue-Jennie Stuart Medical | | 5.800 | % | | 07/01/2011 | | A-* | | $ | 270,000 | | $ | 285,541 |
Christian County KY Hospital Revenue-Jennie Stuart Medical | | 6.000 | | | 07/01/2017 | | A-* | | | 5,000,000 | | | 5,264,100 |
Christian County KY Hospital Revenue-Jennie Stuart Medical | | 6.000 | | | 07/01/2013 | | A-* | | | 2,870,000 | | | 3,030,175 |
Crittenden County Heathcare Facilities | | 6.300 | | | 01/01/2016 | | NR | | | 2,095,000 | | | 2,175,400 |
Jefferson County KY Health Facilities Jewish Hospital | | 5.700 | | | 01/01/2011 | | A1/AA-* | | | 1,200,000 | | | 1,283,232 |
Kentucky Development Finance Authority Green River | | 6.000 | | | 11/01/2010 | | Aa3 | | | 1,000,000 | | | 1,062,120 |
Kentucky Economic Development Finance Authority Catholic | | 5.500 | | | 09/01/2014 | | Aa3/AA-* | | | 1,375,000 | | | 1,467,909 |
Kentucky Development Finance Authority Hospital-Appalachian | | 5.850 | | | 10/01/2017 | | BB | | | 1,000,000 | | | 938,490 |
Kentucky Development Finance Authority-Catholic Health | | 5.000 | | | 12/01/2018 | | Aa2/AA* | | | 6,950,000 | | | 7,027,771 |
Kentucky Development Finance Authority-Catholic Health | | 5.750 | | | 12/01/2015 | | Aa2/AA* | | | 2,000,000 | | | 2,185,340 |
Kentucky Economic Development Finance Authority Revenue | | 5.250 | | | 09/01/2021 | | Aa2/AA* | | | 2,000,000 | | | 2,027,240 |
Kentucky Economic Development Finance Authority-Norton Health | | 6.125 | | | 10/01/2010 | | BBB+* | | | 7,000,000 | | | 7,440,860 |
Kentucky Economic Development Finance Authority - Catholic | | 5.125 | | | 10/01/2021 | | A1/AA-* | | | 1,000,000 | | | 1,041,060 |
Madison County Ky Industrial Building Revenue - McCready Manor | | 5.500 | | | 06/01/2020 | | AA* | | | 1,785,000 | | | 1,883,532 |
Pike County KY Mortgage Revenue Phelps Regional Health | | 5.650 | | | 09/20/2027 | | AAA* | | | 2,435,000 | | | 2,562,375 |
| | | | | | | | | | | | |
|
|
| | | | | | | | | | | | | | 39,675,145 |
INDUSTRIAL REVENUE AND POLLUTION CONTROL REVENUE BONDS | | | | | | | | | | | | | |
2.88% of Net Assets | | | | | | | | | | | | | |
Ashland KY Pollution Control Revenue-Ashland Oil Project | | 6.650 | | | 08/01/2009 | | Baa2 | | | 8,835,000 | | | 9,068,244 |
Ashland KY Pollution Control Revenue - Ashland Inc | | 5.700 | | | 11/01/2009 | | Baa2 | | | 1,000,000 | | | 1,062,620 |
Campbellsville KY Industrial Revenue-Campbellsville College | | 6.000 | | | 03/01/2017 | | NR | | | 1,920,000 | | | 2,087,213 |
Jefferson County KY Pollution Control Revenue-E I DuPont | | 6.300 | | | 07/01/2012 | | Aa3/AA-* | | | 3,500,000 | | | 3,593,205 |
Kentucky League of Cities-Ashland Series | | 6.250 | | | 08/01/2017 | | A-* | | | 1,550,000 | | | 1,586,704 |
Meade County KY Pollution Control Revenue-Olin Corporation | | 6.000 | | | 07/01/2007 | | NR | | | 270,000 | | | 270,651 |
| | | | | | | | | | | | |
|
|
| | | | | | | | | | | | | | 17,668,637 |
GENERAL OBLIGATION BONDS | | | | | | | | | | | | | |
2.73% of Net Assets | | | | | | | | | | | | | |
Bowling Green Ky General Obligation | | 5.300 | | | 06/01/2018 | | Aa3 | | | 1,000,000 | | | 1,062,740 |
Bowling Green KY General Obligation | | 4.600 | | | 06/01/2018 | | Aa2/AA-* | | | 1,290,000 | | | 1,301,881 |
Hardin County KY General Obligation | | 5.125 | | | 06/01/2019 | | A1 | | | 2,255,000 | | | 2,331,557 |
Jefferson County Series A | | 4.900 | | | 12/01/2018 | | Aa2/AA* | | | 1,605,000 | | | 1,661,657 |
Kentucky Area Development Districts Financing | | 4.700 | | | 06/01/2024 | | AA* | | | 2,625,000 | | | 2,523,071 |
Kentucky State Property & Buildings Commission Project #62 | | 4.625 | | | 09/01/2013 | | Aa3/AA-* | | | 2,750,000 | | | 2,857,030 |
Lexington Fayette Urban County Government Detention Center | | 4.750 | | | 05/01/2018 | | Aa2/AA+* | | | 3,120,000 | | | 3,181,838 |
Louisville KY General Obligation | | 5.000 | | | 11/01/2019 | | Aa3/AA-* | | | 1,775,000 | | | 1,853,100 |
| | | | | | | | | | | | |
|
|
| | | | | | | | | | | | | | 16,772,874 |
PREREFUNDED BONDS | | | | | | | | | | | | | |
2.23% of Net Assets | | | | | | | | | | | | | |
Bullitt County KY School District Finance Corporation | | 6.000 | | | 08/01/2014 | | Aa3 | | | 1,100,000 | | | 1,126,620 |
Elsmere KY Industrial Development Revenue-Courtaulds plc | | 6.750 | | | 04/01/2010 | | NR | | | 2,000,000 | | | 2,119,520 |
Floyd County KY Public Property Revenue-Justice Center | | 6.125 | | | 09/01/2018 | | A+* | | | 1,240,000 | | | 1,347,086 |
Greenup County KY School District Finance Corporation | | 6.100 | | | 09/01/2014 | | Aa3 | | | 1,105,000 | | | 1,136,415 |
Jefferson County Ky Improvement | | 6.000 | | | 04/01/2020 | | Aa2/AA* | | | 1,985,000 | | | 2,238,385 |
Jefferson County KY Capital Projects Corporation Revenue | | 5.600 | | | 04/01/2014 | | Aaa/AAA* | | | 1,000,000 | | | 1,081,350 |
Junction City KY College Revenue-Center College Project | | 5.875 | | | 04/01/2017 | | A2 | | | 1,000,000 | | | 1,110,430 |
Letcher County KY School District Finance Corporation | | 6.700 | | | 10/01/2014 | | Aa3 | | | 1,490,000 | | | 1,541,122 |
Powell County KY School District Finance Corporation | | 5.900 | | | 08/01/2016 | | Aa3 | | | 1,185,000 | | | 1,266,137 |
Union County KY Public Property Corporation | | 6.125 | | | 09/01/2015 | | NR | | | 700,000 | | | 750,869 |
| | | | | | | | | | | | |
|
|
| | | | | | | | | | | | | | 13,717,934 |
STATE AND LOCAL MORTGAGE REVENUE BONDS | | | | | | | | | | | | | |
1.98% of Net Assets | | | | | | | | | | | | | |
Florence KY Housing Facility Revenue | | 6.300 | | | 08/15/2019 | | A/A* | | | 2,615,000 | | | 2,749,620 |
Kentucky Housing Corporation | | 3.900 | | | 07/01/2017 | | Aaa/AAA* | | | 2,055,000 | | | 1,944,318 |
Kentucky Housing Corporation | | 4.550 | | | 07/01/2024 | | Aaa/AAA* | | | 6,000,000 | | | 5,726,820 |
Ky State Property & Building Commission Project #67 | | 5.125 | | | 09/01/2016 | | Aa3/AA-* | | | 1,000,000 | | | 1,098,730 |
Louisville Housing Assistance Mortgage Corp Rivertown Project | | 5.100 | | | 07/01/2024 | | Aa2 | | | 655,000 | | | 640,544 |
| | | | | | | | | | | | |
|
|
| | | | | | | | | | | | | | 12,160,032 |
UNIVERSITY CONSOLIDATED EDUCATION AND BUILDING REVENUE BONDS | | | | | | | | | | | | | |
1.70% of Net Assets | | | | | | | | | | | | | |
Berea Educational Facilities College Project | | 4.000 | | | 06/01/2019 | | Aaa | | | 1,315,000 | | | 1,213,035 |
Berea Educational Facilities Revenue | | 4.125 | | | 06/01/2022 | | Aaa | | | 2,190,000 | | | 1,976,891 |
The accompanying notes are an integral part of the financial statements.
9
DUPREE MUTUAL FUNDS—KENTUCKY TAX-FREE INCOME SERIES
SCHEDULE OF PORTFOLIO INVESTMENTS
Kentucky Municipal Bonds—100%
June 30, 2004
| | | | | | | | | | | | | |
| Bond Description | | Coupon | | | Maturity
Date | | Rating# | | Par Value | | Market Value |
|
Georgetown College Project Series A | | 6.000 | % | | 11/15/2016 | | A | | $ | 1,000,000 | | $ | 1,053,420 |
Georgetown College Project Series A | | 6.250 | | | 11/15/2020 | | A | | | 4,000,000 | | | 4,209,240 |
Jefferson County KY College Project Bellarmine College | | 5.250 | | | 05/01/2019 | | Baa2 | | | 2,000,000 | | | 2,001,820 |
| | | | | | | | | | | | |
|
|
| | | | | | | | | | | | | | 10,454,406 |
CERTIFICATES OF PARTICIPATION BONDS | | | | | | | | | | | | | |
.80% of Net Assets | | | | | | | | | | | | | |
Jeffersontown KY Certificate of Participation | | 6.500 | | | 09/01/2009 | | A3 | | | 1,235,000 | | | 1,269,469 |
Jeffersontown KY Certificate of Participation | | 5.750 | | | 11/01/2015 | | A3 | | | 1,095,000 | | | 1,166,098 |
Shelbyville KY Certificates of Participation | | 5.350 | | | 10/01/2013 | | NR | | | 1,295,000 | | | 1,340,040 |
Shelbyville KY Certificate of Participation | | 5.450 | | | 10/01/2017 | | NR | | | 1,130,000 | | | 1,143,006 |
| | | | | | | | | | | | |
|
|
| | | | | | | | | | | | | | 4,918,613 |
MUNICIPAL UTILITY REVENUE BONDS | | | | | | | | | | | | | |
.29% of Net Assets | | | | | | | | | | | | | |
Cynthiana KY Waterworks & Sewer Revenue | | 6.400 | | | 01/01/2007 | | BBB-* | | | 575,000 | | | 587,736 |
KY Rural Water Financial Corporation Public Project Revenue | | 5.375 | | | 02/01/2020 | | AA* | | | 1,140,000 | | | 1,208,674 |
| | | | | | | | | | | | |
|
|
| | | | | | | | | | | | | | 1,796,410 |
| | | | | | | | | | | | |
|
|
Total Investments (cost $606,383,414)(a)—100.98% of Net Assets | | | | | | | | | | | | $ | 620,387,572 |
| | | | | | | | | | | | |
|
|
| | * | Standard and Poor’s Corporation |
| | All | other ratings by Moody’s Investors Service, Inc. |
| | # | Bond ratings are unaudited. |
| (a) | Represents cost for financial reporting and federal income tax purposes and differs from market value by net unrealized appreciation of securities as follows: |
| | | | |
Unrealized appreciation | | $ | 19,503,827 | |
Unrealized depreciation | | | (5,499,669 | ) |
| | |
|
|
|
Net unrealized appreciation | | $ | 14,004,158 | |
| | |
|
|
|
The accompanying notes are an integral part of the financial statements.
10
DUPREE MUTUAL FUNDS—KENTUCKY TAX-FREE INCOME SERIES
STATEMENT OF ASSETS AND LIABILITIES
JUNE 30, 2004
| | | | | | | |
ASSETS: | | | | | | | |
Investments in securities, at value (Cost: $606,383,414) | | | | | $ | 620,387,572 | |
Cash | | | | | | 3,486,372 | |
Receivable for fund shares sold | | | | | | 7,000 | |
Other receivable | | | | | | 38,721 | |
Receivable from investments sold | | | | | | 250,000 | |
Interest receivable | | | | | | 9,455,116 | |
| | | | | |
|
|
|
Total assets | | | | | | 633,624,781 | |
LIABILITIES: | | | | | | | |
Payable for: | | | | | | | |
Investments purchased | | $ | 12,363,862 | | | | |
Distributions | | | 6,563,956 | | | | |
Investment advisory fee | | | 206,628 | | | | |
Transfer agent fee | | | 60,797 | | | | |
Accrued expenses | | | 72,705 | | | | |
| | |
|
| | | | |
Total liabilities | | | | | | 19,267,948 | |
| | | | | |
|
|
|
NET ASSETS: | | | | | | | |
Capital | | | | | | 602,224,032 | |
Net accumulated realized loss on investment transactions | | | | | | (1,871,357 | ) |
Net unrealized appreciation in value of investments | | | | | | 14,004,158 | |
| | | | | |
|
|
|
Net assets at value | | | | | $ | 614,356,833 | |
| | | | | |
|
|
|
NET ASSETS VALUE, offering price and redemption price per share ($614,356,833–:–82,036,805 shares outstanding; unlimited number of shares authorized; no par value) | | | | | $ | 7.49 | |
| | | | | |
|
|
|
STATEMENT OF OPERATIONS
For the year ended June 30, 2004
| | | | |
Net investment income: | | | | |
Interest income | | $ | 30,560,479 | |
| | |
|
|
|
Expenses: | | | | |
Investment advisory fee | | | 2,534,221 | |
Transfer agent fee | | | 746,305 | |
Professional fees | | | 112,420 | |
Custodian and interest expense | | | 87,520 | |
Trustee fees | | | 59,311 | |
Other expenses | | | 131,225 | |
| | |
|
|
|
Total expenses | | | 3,671,002 | |
Custodian and interest expense reductions | | | (87,520 | ) |
| | |
|
|
|
Net expenses | | | 3,583,482 | |
| | |
|
|
|
Net investment income | | | 26,976,997 | |
| | |
|
|
|
Realized and unrealized gain\(loss) on investments: | | | | |
Net realized gain | | | 483,422 | |
Net decrease in unrealized appreciation | | | (20,739,097 | ) |
| | |
|
|
|
Net realized and unrealized loss on investments | | | (20,255,675 | ) |
| | |
|
|
|
Net increase in net assets resulting from operations | | $ | 6,721,322 | |
| | |
|
|
|
The accompanying notes are an integral part of the financial statements.
11
DUPREE MUTUAL FUNDS—KENTUCKY TAX-FREE INCOME SERIES
STATEMENTS OF CHANGES IN NET ASSETS
For the years ended June 30, 2004 and 2003
| | | | | | | | |
| | | 2004
| | | 2003
| |
Increase in net assets: | | | | | | | | |
Operations: | | | | | | | | |
Net investment income | | $ | 26,976,997 | | | $ | 25,809,346 | |
Net realized gain on investments | | | 483,422 | | | | 818,728 | |
Net (decrease)/increase in unrealized appreciation | | | (20,739,097 | ) | | | 18,537,076 | |
| | |
|
|
| |
|
|
|
Net increase in net assets resulting from operations | | | 6,721,322 | | | | 45,165,150 | |
Distributions to shareholders from net investment income | | | (26,976,997 | ) | | | (25,809,346 | ) |
Net fund share transactions | | | 22,019,390 | | | | 57,880,893 | |
| | |
|
|
| |
|
|
|
Total increase | | | 1,763,715 | | | | 77,236,697 | |
Net assets: | | | | | | | | |
Beginning of year | | | 612,593,118 | | | | 535,356,421 | |
| | |
|
|
| |
|
|
|
End of year | | $ | 614,356,833 | | | $ | 612,593,118 | |
| | |
|
|
| |
|
|
|
FINANCIAL HIGHLIGHTS
Selected data for a share outstanding:
| | | | | | | | | | | | | | | | | | | | |
| | | For the years ended June 30,
| |
| | | 2004
| | | 2003
| | | 2002
| | | 2001
| | | 2000
| |
Net asset value, beginning of year | | $ | 7.73 | | | $ | 7.48 | | | $ | 7.41 | | | $ | 7.22 | | | $ | 7.47 | |
| | |
|
|
| |
|
|
| |
|
|
| |
|
|
| |
|
|
|
Income from investment operations: | | | | | | | | | | | | | | | | | | | | |
Net investment income | | | 0.33 | | | | 0.34 | | | | 0.36 | | | | 0.37 | | | | 0.38 | |
Net gains/(losses) on securities, both realized and unrealized | | | (0.24 | ) | | | 0.25 | | | | 0.07 | | | | 0.19 | | | | (0.25 | ) |
| | |
|
|
| |
|
|
| |
|
|
| |
|
|
| |
|
|
|
Total from investment operations | | | 0.09 | | | | 0.59 | | | | 0.43 | | | | 0.56 | | | | 0.13 | |
Less distributions: | | | | | | | | | | | | | | | | | | | | |
Distributions from net investment income | | | (0.33 | ) | | | (0.34 | ) | | | (0.36 | ) | | | (0.37 | ) | | | (0.38 | ) |
| | |
|
|
| |
|
|
| |
|
|
| |
|
|
| |
|
|
|
Net asset value, end of year | | $ | 7.49 | | | $ | 7.73 | | | $ | 7.48 | | | $ | 7.41 | | | $ | 7.22 | |
| | |
|
|
| |
|
|
| |
|
|
| |
|
|
| |
|
|
|
Total return | | | 1.23 | % | | | 8.04 | % | | | 5.93 | % | | | 7.94 | % | | | 1.78 | % |
Net assets, end of year (in thousands) | | $ | 614,357 | | | $ | 612,593 | | | $ | 535,356 | | | $ | 467,236 | | | $ | 416,957 | |
Ratio of net expenses to average net assets (a) | | | 0.58 | % | | | 0.58 | % | | | 0.59 | % | | | 0.60 | % | | | 0.61 | % |
Ratio of net investment income to average net assets | | | 4.37 | % | | | 4.45 | % | | | 4.84 | % | | | 5.05 | % | | | 5.17 | % |
Portfolio turnover | | | 7.89 | % | | | 10.69 | % | | | 9.99 | % | | | 9.06 | % | | | 15.74 | % |
| (a) | Percentages before custodian and interest expense reductions were: |
.60% for 2004, .60% for 2003, .61% for 2002, .62% for 2001, and .63% for 2000.
The accompanying notes are an integral part of the financial statements.
12
DUPREE MUTUAL FUNDS—KENTUCKY TAX-FREE SHORT-TO-MEDIUM SERIES
SCHEDULE OF PORTFOLIO INVESTMENTS
Kentucky Municipal Bonds—100%
June 30, 2004
| | | | | | | | | | | | | |
| Bond Description | | Coupon | | | Maturity
Date | | Rating# | | Par Value | | Market Value |
|
INSURED MUNICIPAL REVENUE BONDS | | | | | | | | | | | | | |
50.01% of Net Assets | | | | | | | | | | | | | |
Boone-Florence Water Supply System Revenue | | 4.300 | % | | 12/01/2011 | | Aaa/AAA* | | $ | 505,000 | | $ | 524,483 |
Carrollton & Henderson KY Public Energy Authority Gas Revenue | | 5.000 | | | 01/01/2006 | | Aaa/AAA* | | | 1,000,000 | | | 1,043,130 |
Carrollton & Henderson Ky Public Energy Authority Gas Revenue | | 5.000 | | | 01/01/2009 | | Aaa/AAA* | | | 3,650,000 | | | 3,929,809 |
Carrollton & Henderson KY Public Energy Authority Gas Revenue | | 4.200 | | | 01/01/2006 | | Aaa/AAA* | | | 750,000 | | | 773,513 |
Eastern KY University Consolidated Education Building | | 4.300 | | | 05/01/2009 | | Aaa/AAA* | | | 500,000 | | | 525,360 |
Hardin County KY Hospital Revenue Refunding | | 3.500 | | | 10/01/2010 | | Aaa | | | 1,050,000 | | | 1,049,370 |
Jefferson County KY Health Facility University Medical Center | | 5.000 | | | 07/01/2008 | | Aaa/AAA* | | | 300,000 | | | 319,310 |
Jefferson County KY School District Finance Corporation | | 4.900 | | | 01/01/2008 | | Aaa/AAA* | | | 550,000 | | | 586,575 |
Jefferson County KY School District Finance Corporation | | 5.000 | | | 01/01/2009 | | Aaa/AAA* | | | 750,000 | | | 811,095 |
Jefferson County KY School District Finance Corporation | | 3.125 | | | 01/01/2011 | | Aaa/AAA* | | | 2,240,000 | | | 2,158,621 |
Jefferson County KY Capital Project Corporation Lease | | 5.500 | | | 04/01/2005 | | Aaa/AAA* | | | 365,000 | | | 376,439 |
Kentucky Asset/Liability Community General Fund Revenue | | 5.000 | | | 07/15/2009 | | Aaa/AAA* | | | 1,000,000 | | | 1,086,090 |
KY Asset/Liability Community General Fund Project Notes | | 5.000 | | | 07/15/2010 | | Aaa/AAA* | | | 1,000,000 | | | 1,086,130 |
KY Economic Development Finance Authority Baptist Health Systems | | 4.750 | | | 08/15/2005 | | Aaa/AAA* | | | 4,000,000 | | | 4,094,840 |
KY Economic Development Finance Authority Ashland Hospital | | 5.000 | | | 02/01/2005 | | Aaa/AAA* | | | 500,000 | | | 510,490 |
KY Economic Development Finance Authority Ashland Hospital | | 5.000 | | | 02/01/2010 | | Aaa/AAA* | | | 1,000,000 | | | 1,076,000 |
KY Economic Development Finance Authority Appalachian Hospital | | 5.500 | | | 10/01/2007 | | A/A* | | | 1,000,000 | | | 1,063,140 |
KY Economic Development Finance Authority Appalachian Hospital | | 5.700 | | | 10/01/2010 | | A* | | | 1,000,000 | | | 1,070,050 |
KY State Property & Building Commission Project #69 | | 5.500 | | | 08/01/2008 | | Aaa/AAA* | | | 1,140,000 | | | 1,250,170 |
KY State Property & Building Commission Project #69 | | 5.000 | | | 08/01/2008 | | Aaa/AAA* | | | 1,320,000 | | | 1,422,353 |
KY State Property & Building Commission Project #69 | | 5.000 | | | 08/01/2009 | | Aaa/AAA* | | | 1,620,000 | | | 1,755,027 |
KY State Property & Building Commission Project #65 | | 5.750 | | | 02/01/2009 | | Aaa/AAA* | | | 750,000 | | | 835,005 |
KY State Property & Building Commission Project #74 | | 5.375 | | | 02/01/2011 | | Aaa/AAA* | | | 1,005,000 | | | 1,110,595 |
KY State Property & Building Commission Project #73 | | 5.500 | | | 08/01/2007 | | Aaa/AAA* | | | 2,000,000 | | | 2,175,840 |
KY State Property & Building Commission Project #81 | | 5.000 | | | 11/01/2009 | | Aaa/AAA* | | | 1,010,000 | | | 1,099,516 |
KY State Property & Building Commission Project #74 | | 5.375 | | | 02/01/2009 | | Aaa/AAA* | | | 1,000,000 | | | 1,097,870 |
KY Turnpike Authority Economic Development Road Revenue | | 5.500 | | | 07/01/2007 | | Aaa/AAA* | | | 3,000,000 | | | 3,258,810 |
KY State Turnpike Authority Revitaliation Projects | | 5.500 | | | 07/01/2009 | | Aaa/AAA* | | | 3,775,000 | | | 4,175,263 |
KY State Turnpike Authority Revitalization Project Series A | | 5.500 | | | 07/01/2010 | | Aaa/AAA* | | | 1,000,000 | | | 1,113,160 |
Louisville Jefferson County KY Visitors Convention Center | | 5.000 | | | 12/01/2010 | | Aaa/AAA* | | | 1,350,000 | | | 1,468,719 |
Marion County Ky Alliant Health System Revenue | | 4.200 | | | 10/01/2007 | | Aaa/AAA* | | | 325,000 | | | 342,040 |
Northern KY University Certificate of Participation Housing Facilities | | 4.500 | | | 12/01/2004 | | Aaa/AAA* | | | 1,000,000 | | | 1,013,460 |
Northern KY University Certificates of Participation Student Housing | | 5.000 | | | 12/01/2007 | | Aaa/AAA* | | | 1,190,000 | | | 1,284,855 |
Northern KY Water Services District Water District Revenue | | 4.750 | | | 02/01/2011 | | Aaa | | | 1,025,000 | | | 1,080,883 |
University Of KY Consolidated Education Building Series S | | 3.500 | | | 05/01/2010 | | Aaa/AAA* | | | 1,190,000 | | | 1,196,200 |
University Of KY Consolidated Education Building Series S | | 3.500 | | | 05/01/2011 | | Aaa/AAA* | | | 1,040,000 | | | 1,033,084 |
| | | | | | | | | | | | |
|
|
| | | | | | | | | | | | | | 48,797,295 |
LEASE REVENUE BONDS | | | | | | | | | | | | | |
15.89% of Net Assets | | | | | | | | | | | | | |
Harlan County School District Finance Corporation | | 5.000 | | | 09/01/2009 | | Aa3/A+* | | | 500,000 | | | 540,810 |
Jefferson County Ky School District Finance Corporation S:B | | 4.400 | | | 02/01/2008 | | Aa3/AA-* | | | 500,000 | | | 527,100 |
Kenton County KY School District Finance Corporation | | 5.200 | | | 03/01/2005 | | Aa3/AA-* | | | 500,000 | | | 512,810 |
Kentucky Asset/Liability Community General Fund Project Notes | | 5.000 | | | 02/01/2007 | | Aa3/AA-* | | | 500,000 | | | 530,840 |
KY Area Development District Financing City of Ewing | | 5.100 | | | 06/01/2010 | | AA* | | | 1,300,000 | | | 1,409,577 |
KY Infractructure Authority Series A | | 5.000 | | | 06/01/2010 | | Aa3/AA-* | | | 2,000,000 | | | 2,171,340 |
KY Infrastructure Authority Government Agency Program | | 4.000 | | | 08/01/2010 | | A-* | | | 1,000,000 | | | 1,022,210 |
KY Infrastructure Authority Revolving Fund Program | | 5.000 | | | 06/01/2006 | | Aa3/AA-* | | | 415,000 | | | 437,838 |
KY State Property & Building Commission Project #71 | | 5.500 | | | 08/01/2008 | | Aa3/AA-* | | | 10,000 | | | 10,971 |
KY State Property & Building Commission Project #60 | | 5.500 | | | 10/01/2008 | | Aa3/AA-* | | | 500,000 | | | 549,530 |
KY State Property & Building Commission Project #73 | | 3.700 | | | 11/01/2008 | | Aa3/AA-* | | | 1,000,000 | | | 1,025,770 |
KY State Property & Building Commission Project #73 | | 5.250 | | | 11/01/2009 | | Aa3/AA-* | | | 1,790,000 | | | 1,959,424 |
KY State Property & Building Commission Project #73 | | 5.250 | | | 11/01/2010 | | Aa3/A+* | | | 3,000,000 | | | 3,301,230 |
Laurel County School District Finance Corporation | | 4.600 | | | 03/01/2010 | | Aa3 | | | 1,000,000 | | | 1,061,200 |
Madison County School District Finance Corporation Revenue | | 3.500 | | | 05/01/2013 | | Aa3/AA* | | | 470,000 | | | 448,244 |
| | | | | | | | | | | | |
|
|
| | | | | | | | | | | | | | 15,508,894 |
HOSPITAL AND HEALTHCARE REVENUE BONDS | | | | | | | | | | | | | |
8.97% of Net Assets | | | | | | | | | | | | | |
Kentucky Economic Development Finance Authority Catholic Health | | 4.250 | | | 10/01/2009 | | A1/AA-* | | | 255,000 | | | 262,979 |
Kentucky Economic Development Finance Authority Catholic Health | | 4.500 | | | 10/01/2011 | | A1/AA-* | | | 1,000,000 | | | 1,029,880 |
Kentucky Economic Development Finance Authority Catholic Health | | 5.500 | | | 12/01/2006 | | Aa2/AA* | | | 1,790,000 | | | 1,916,571 |
Kentucky Economic Development Finance Authority Catholic Health | | 5.500 | | | 12/01/2010 | | Aa2/AA* | | | 2,100,000 | | | 2,292,843 |
The accompanying notes are an integral part of the financial statements.
13
DUPREE MUTUAL FUNDS—KENTUCKY TAX-FREE SHORT-TO-MEDIUM SERIES
SCHEDULE OF PORTFOLIO INVESTMENTS
Kentucky Municipal Bonds—100%
June 30, 2004
| | | | | | | | | | | | | |
| Bond Description | | Coupon | | | Maturity
Date | | Rating# | | Par Value | | Market Value |
|
Kentucky Economic Development Finance Authority Catholic Health | | 5.750 | % | | 12/01/2015 | | Aa2/AA* | | $ | 2,000,000 | | $ | 2,185,340 |
Kentucky Economic Development Finance Authority Norton Health | | 6.125 | | | 10/01/2010 | | BBB+* | | | 1,000,000 | | | 1,062,980 |
| | | | | | | | | | | | |
|
|
| | | | | | | | | | | | | | 8,750,593 |
ESCROWED TO MATURITY BONDS | | | | | | | | | | | | | |
6.72% of Net Assets | | | | | | | | | | | | | |
Jefferson County KY Capital Projects Corporation Revenue | | 6.375 | | | 12/01/2007 | | NR | | | 1,500,000 | | | 1,678,335 |
KY State Property & Building Commission Project #71 | | 5.500 | | | 08/01/2008 | | Aaa/AAA* | | | 4,440,000 | | | 4,881,647 |
| | | | | | | | | | | | |
|
|
| | | | | | | | | | | | | | 6,559,982 |
MUNICIPAL UTILITY REVENUE BONDS | | | | | | | | | | | | | |
4.65% of Net Assets | | | | | | | | | | | | | |
Danville KY Mulit-City Lease Water & Sewer Lease Revenue | | 2.300 | | | 07/01/2007 | | Baa1 | | | 1,040,000 | | | 1,041,799 |
Lexington-Fayette Urban County Government Ky Sewer System B | | 5.000 | | | 07/01/2007 | | Aa3/AA* | | | 1,290,000 | | | 1,382,338 |
Louisville KY Waterworks Board Water System Revenue Refunding | | 4.250 | | | 11/15/2007 | | Aa1/AA* | | | 1,000,000 | | | 1,053,290 |
Louisville KY Waterworks Board Water System Revenue | | 4.500 | | | 11/15/2010 | | Aa1/AA* | | | 1,000,000 | | | 1,059,010 |
| | | | | | | | | | | | |
|
|
| | | | | | | | | | | | | | 4,536,437 |
GENERAL OBLIGATION BONDS | | | | | | | | | | | | | |
4.18% of Net Assets | | | | | | | | | | | | | |
Jefferson Co General Obligation | | 5.500 | | | 08/15/2010 | | Aa2/AA* | | | 2,635,000 | | | 2,943,163 |
Lexington-Fayette Urban County Government General Obligation | | 3.125 | | | 02/01/2011 | | Aa2/AA+* | | | 1,165,000 | | | 1,131,448 |
| | | | | | | | | | | | |
|
|
| | | | | | | | | | | | | | 4,074,611 |
INDUSTRIAL REVENUE AND POLLUTION CONTROL REVENUE BONDS | | | | | | | | | | | | | |
2.39% of Net Assets | | | | | | | | | | | | | |
Ashland KY Pollution Control Revenue Ashland Oil Project | | 6.650 | | | 08/01/2009 | | Baa2 | | | 1,500,000 | | | 1,539,600 |
Ashland KY Pollution Control Revenue Ashland Inc Project | | 5.700 | | | 11/01/2009 | | Baa2 | | | 500,000 | | | 531,310 |
Meade County KY Pollution Control Revenue-Olin Corporation | | 6.000 | | | 07/01/2007 | | NR | | | 265,000 | | | 265,639 |
| | | | | | | | | | | | |
|
|
| | | | | | | | | | | | | | 2,336,549 |
PREREFUNDED BONDS | | | | | | | | | | | | | |
1.70% of Net Assets | | | | | | | | | | | | | |
Ky State Property & Building Commission Revenue Project#59 | | 5.600 | | | 11/01/2007 | | Aa3/AA* | | | 1,550,000 | | | 1,660,438 |
| | | | | | | | | | | | |
|
|
| | | | | | | | | | | | | | 1,660,438 |
UNIVERSITY CONSOLIDATED EDUCATION AND BUILDING REVENUE BONDS | | | | | | | | | | | | | |
1.04% of Net Assets | | | | | | | | | | | | | |
Murray State University Revenue Series G Second Series | | 5.600 | | | 05/01/2006 | | A2/A* | | | 1,000,000 | | | 1,021,070 |
| | | | | | | | | | | | |
|
|
| | | | | | | | | | | | | | 1,021,070 |
CERTIFICATES OF PARTICIPATION BONDS | | | | | | | | | | | | | |
.72% of Net Assets | | | | | | | | | | | | | |
Shelbyville Certificates of Participation Refinancing | | 4.900 | | | 10/01/2007 | | NR | | | 665,000 | | | 700,046 |
| | | | | | | | | | | | |
|
|
| | | | | | | | | | | | | | 700,046 |
| | | | | | | | | | | | |
|
|
Total Investments (cost $92,468,017)(a) - 96.27% of Net Assets | | | | | | | | | | | | $ | 93,945,915 |
| | | | | | | | | | | | |
|
|
| | * | Standard and Poor’s Corporation |
| | All | other ratings by Moody’s Investors Service, Inc. |
| | # | Bond ratings are unaudited. |
| (a) | Represents cost for financial reporting and federal income tax purposes and differs from market value by net unrealized appreciation of securities as follows: |
| | | | |
Unrealized appreciation | | $ | 1,937,107 | |
Unrealized depreciation | | | (459,209 | ) |
| | |
|
|
|
Net unrealized appreciation | | $ | 1,477,898 | |
| | |
|
|
|
The accompanying notes are an integral part of the financial statements.
14
DUPREE MUTUAL FUNDS—KENTUCKY TAX-FREE SHORT-TO-MEDIUM SERIES
STATEMENT OF ASSETS AND LIABILITIES
JUNE 30, 2004
| | | | | | | |
ASSETS: | | | | | | | |
Investments in securities, at value (Cost: $92,468,017) | | | | | $ | 93,945,915 | |
Cash | | | | | | 267,327 | |
Receivable for fund shares sold | | | | | | 465,150 | |
Receivable from investments sold | | | | | | 1,790,000 | |
Interest receivable | | | | | | 1,430,921 | |
| | | | | |
|
|
|
Total assets | | | | | | 97,899,313 | |
LIABILITIES: | | | | | | | |
Payable for: | | | | | | | |
Distributions | | $ | 266,925 | | | | |
Fund shares redeemed | | | 8,612 | | | | |
Investment advisory fee | | | 39,761 | | | | |
Transfer agent fee | | | 10,067 | | | | |
Other fees | | | 2,520 | | | | |
| | |
|
| | | | |
Total liabilities | | | | | | 327,885 | |
| | | | | |
|
|
|
NET ASSETS: | | | | | | | |
Capital | | | | | | 97,210,782 | |
Net accumulated realized loss on investment transactions | | | | | | (1,117,252 | ) |
Net unrealized appreciation in value of investments | | | | | | 1,477,898 | |
| | | | | |
|
|
|
Net assets at value | | | | | $ | 97,571,428 | |
| | | | | |
|
|
|
NET ASSET VALUE, offering price and redemption price per share ($97,571,428 –:– 18,517,260 shares outstanding; unlimited number of shares authorized; no par value) | | | | | $ | 5.27 | |
| | | | | |
|
|
|
STATEMENT OF OPERATIONS
For the year ended June 30, 2004
| | | | |
Net investment income: | | | | |
Interest income | | $ | 3,758,628 | |
| | |
|
|
|
Expenses: | | | | |
Investment advisory fee | | | 510,792 | |
Transfer agent fee | | | 128,938 | |
Professional fees | | | 21,053 | |
Custodian and interest expense | | | 29,039 | |
Trustee fees | | | 9,844 | |
Other expenses | | | 33,084 | |
| | |
|
|
|
Total expenses | | | 732,750 | |
Custodian and interest expense reductions | | | (29,039 | ) |
| | |
|
|
|
Net expenses | | | 703,711 | |
| | |
|
|
|
Net investment income | | | 3,054,917 | |
| | |
|
|
|
Realized and unrealized loss on investments: | | | | |
Net realized loss | | | (373,931 | ) |
Net decrease in unrealized appreciation | | | (2,916,307 | ) |
| | |
|
|
|
Net realized and unrealized loss on investments | | | (3,290,238 | ) |
| | |
|
|
|
Net decrease in net assets resulting from operations | | $ | (235,321 | ) |
| | |
|
|
|
The accompanying notes are an integral part of the financial statements.
15
DUPREE MUTUAL FUNDS—KENTUCKY TAX-FREE SHORT-TO-MEDIUM SERIES
STATEMENTS OF CHANGES IN NET ASSETS
For the years ended June 30, 2004 and 2003
| | | | | | | | |
| | | 2004
| | | 2003
| |
Increase in net assets: | | | | | | | | |
Operations: | | | | | | | | |
Net investment income | | $ | 3,054,917 | | | $ | 3,128,791 | |
Net realized (loss)/gain on investments | | | (373,931 | ) | | | 112,593 | |
Net (decrease)/increase in unrealized appreciation | | | (2,916,307 | ) | | | 2,113,506 | |
| | |
|
|
| |
|
|
|
Net (decrease)/increase in net assets resulting from operations | | | (235,321 | ) | | | 5,354,890 | |
Distributions to shareholders from net investment income | | | (3,054,917 | ) | | | (3,128,791 | ) |
Net fund share transactions | | | 1,332,326 | | | | 17,221,036 | |
| | |
|
|
| |
|
|
|
Total (decrease)/increase | | | (1,957,912 | ) | | | 19,447,135 | |
Net assets: | | | | | | | | |
Beginning of year | | | 99,529,340 | | | | 80,082,205 | |
| | |
|
|
| |
|
|
|
End of year | | $ | 97,571,428 | | | $ | 99,529,340 | |
| | |
|
|
| |
|
|
|
FINANCIAL HIGHLIGHTS
Selected data for a share outstanding:
| | | | | | | | | | | | | | | | | | | | |
| | | For the years ended June 30,
| |
| | | 2004
| | | 2003
| | | 2002
| | | 2001
| | | 2000
| |
Net asset value, beginning of year | | $ | 5.44 | | | $ | 5.30 | | | $ | 5.22 | | | $ | 5.09 | | | $ | 5.20 | |
| | |
|
|
| |
|
|
| |
|
|
| |
|
|
| |
|
|
|
Income from investment operations: | | | | | | | | | | | | | | | | | | | | |
Net investment income | | | 0.16 | | | | 0.19 | | | | 0.20 | | | | 0.23 | | | | 0.21 | |
Net gains/(losses) on securities, both realized and unrealized | | | (0.17 | ) | | | 0.14 | | | | 0.08 | | | | 0.13 | | | | (0.11 | ) |
| | |
|
|
| |
|
|
| |
|
|
| |
|
|
| |
|
|
|
Total from investment operations | | | (0.01 | ) | | | 0.33 | | | | 0.28 | | | | 0.36 | | | | 0.10 | |
Less distributions: | | | | | | | | | | | | | | | | | | | | |
Distributions from net investment income | | | (0.16 | ) | | | (0.19 | ) | | | (0.20 | ) | | | (0.23 | ) | | | (0.21 | ) |
| | |
|
|
| |
|
|
| |
|
|
| |
|
|
| |
|
|
|
Net asset value, end of year | | $ | 5.27 | | | $ | 5.44 | | | $ | 5.30 | | | $ | 5.22 | | | $ | 5.09 | |
| | |
|
|
| |
|
|
| |
|
|
| |
|
|
| |
|
|
|
Total return | | | (0.19 | %) | | | 6.23 | % | | | 5.50 | % | | | 7.18 | % | | | 1.95 | % |
Net assets, end of year (in thousands) | | $ | 97,571 | | | $ | 99,529 | | | $ | 80,082 | | | $ | 55,555 | | | $ | 51,205 | |
Ratio of net expenses to average net assets (a) | | | 0.68 | % | | | 0.69 | % | | | 0.69 | % | | | 0.70 | % | | | 0.69 | % |
Ratio of net investment income to average net assets | | | 2.98 | % | | | 3.43 | % | | | 3.82 | % | | | 4.42 | % | | | 4.06 | % |
Portfolio turnover | | | 18.63 | % | | | 22.30 | % | | | 8.04 | % | | | 22.40 | % | | | 30.57 | % |
| (a) | Percentages before custodian and interest expense reductions were: |
.72% for 2004, .71% for 2003, .71% for 2002, .72% for 2001, and .71% for 2000.
The accompanying notes are an integral part of the financial statements.
16
DUPREE MUTUAL FUNDS—MISSISSIPPI TAX-FREE INCOME SERIES
SCHEDULE OF PORTFOLIO INVESTMENTS
Mississippi Municipal Bonds—100%
June 30, 2004
| | | | | | | | | | | | | |
| Bond Description | | Coupon | | | Maturity
Date | | Rating# | | Par Value | | Market Value |
|
INSURED MUNICIPAL REVENUE BONDS | | | | | | | | | | | | | |
68.95% of Net Assets | | | | | | | | | | | | | |
De Soto County MS School District | | 4.500 | % | | 04/04/2016 | | Aaa | | $ | 30,000 | | $ | 30,366 |
Gautier MS Utility District Utility System Revenue | | 5.125 | | | 03/01/2018 | | Aaa | | | 75,000 | | | 78,007 |
Hinds County MS Revenue Refunding-MS Methodist Hospital | | 5.600 | | | 05/01/2012 | | Aaa/AAA* | | | 30,000 | | | 32,967 |
Jackson MS Public School District Limited Tax Notes | | 5.375 | | | 10/01/2020 | | Aaa | | | 20,000 | | | 20,987 |
Jackson MS Water & Sewer System Revenue | | 5.250 | | | 09/01/2020 | | Aaa/AAA* | | | 50,000 | | | 52,154 |
Madison County MS School District—Series A | | 5.250 | | | 09/01/2020 | | Aaa/AAA* | | | 25,000 | | | 26,077 |
Medical Center Educational Building Corporation MS Revenue | | 5.500 | | | 12/01/2023 | | AAA* | | | 20,000 | | | 21,728 |
MS Development—Madison County Road & Bridge Project | | 5.250 | | | 06/01/2023 | | Aaa | | | 50,000 | | | 51,432 |
MS Development Bank Special Obligation Madison County | | 5.250 | | | 06/01/2024 | | Aaa | | | 50,000 | | | 51,250 |
MS Development Bank Special Obligation Flowood Revenue Project | | 5.625 | | | 11/01/2019 | | Aaa/AAA* | | | 10,000 | | | 10,787 |
MS Development Bank Special Obligation Natchez Convention Center | | 5.800 | | | 07/01/2019 | | Aaa/AAA* | | | 25,000 | | | 27,787 |
MS Development Bank Special Obligation Gulfport Water Sewer | | 5.625 | | | 07/01/2024 | | Aaa/
AAA* | | | 105,000 | | | 112,766 |
MS Development Bank Special Obligation Gulfport Combined Water | | 5.500 | | | 07/01/2015 | | Aaa/AAA* | | | 10,000 | | | 11,121 |
MS Development Bank Special Obligation Desoto County | | 5.900 | | | 07/01/2021 | | AAA | | | 5,000 | | | 5,521 |
MS Development Bank Special Obligation Rankin County | | 5.400 | | | 07/01/2014 | | Aaa/AAA* | | | 10,000 | | | 10,885 |
MS Development Bank Special Obligation Meridian Community | | 5.500 | | | 07/01/2016 | | AAA* | | | 30,000 | | | 32,632 |
MS Development Bank Special Obligation Multi-Purpose | | 5.000 | | | 07/01/2021 | | AAA* | | | 50,000 | | | 50,886 |
MS Development Bank Special Obligation Wastewater | | 5.375 | | | 02/01/2021 | | Aaa/AAA* | | | 100,000 | | | 105,514 |
MS Development Bank Special Obligation Horn Lake | | 5.000 | | | 10/01/2020 | | AAA* | | | 50,000 | | | 51,187 |
MS Development Bank Special Obligation Desoto County | | 5.000 | | | 11/01/2022 | | Aaa/AAA* | | | 25,000 | | | 25,266 |
MS Development Bank Special Obligation Lee County School | | 4.500 | | | 09/01/2021 | | Aaa | | | 100,000 | | | 96,173 |
MS Development Bank Special Obligation Capital Projects | | 5.875 | | | 07/01/2024 | | Aaa/AAA* | | | 75,000 | | | 84,359 |
MS Development Bank Special Obligation Combination | | 5.000 | | | 07/01/2018 | | Aaa/AAA* | | | 100,000 | | | 103,443 |
MS Home Corporation Housing Revenue | | 4.750 | | | 12/01/2018 | | A* | | | 125,000 | | | 123,454 |
MS Hospital Equipment & Facilities Singing River Hospital | | 5.500 | | | 03/01/2023 | | Aaa/AAA* | | | 120,000 | | | 121,633 |
MS Hospital Equipment and Facilities Forrest County | | 5.500 | | | 01/01/2024 | | Aaa/AAA* | | | 45,000 | | | 46,621 |
Ms Development Bank Special Obligation Culkin Water District | | 5.800 | | | 07/01/2018 | | Aaa/AAA* | | | 25,000 | | | 27,450 |
MS State University Educational Building Corporate Revenue | | 5.500 | | | 08/01/2014 | | Aaa | | | 75,000 | | | 82,364 |
MS State University Educational Building Corporate Revenue | | 4.000 | | | 08/01/2015 | | Aaa | | | 65,000 | | | 63,517 |
Natchez MS Water & Sewer System Revenue | | 5.700 | | | 08/01/2017 | | Aaa/AAA* | | | 150,000 | | | 162,254 |
Olive Branch MS Public Improvement | | 4.125 | | | 06/01/2022 | | Aaa | | | 100,000 | | | 90,379 |
Olive Branch MS Water & Sewer Revenue | | 4.500 | | | 03/01/2014 | | Aaa | | | 30,000 | | | 31,088 |
Southern MS Education Building Corporation Revenue | | 5.100 | | | 03/01/2020 | | Aaa/AAA* | | | 70,000 | | | 72,099 |
Southern MS University Educational Building Corporation | | 5.750 | | | 03/01/2021 | | Aaa | | | 10,000 | | | 10,920 |
Stone County MS School District | | 4.000 | | | 06/01/2016 | | Aaa/AAA* | | | 100,000 | | | 97,678 |
Tupelo MS Public School District | | 5.375 | | | 11/01/2015 | | Aaa/AAA* | | | 20,000 | | | 21,713 |
University MS Educational Building—Stadium A | | 5.500 | | | 12/01/2017 | | Aaa/AAA* | | | 5,000 | | | 5,381 |
Walnut Grove Correctional Authority Certificates of Partcipitation | | 6.000 | | | 11/01/2019 | | Aaa/AAA* | | | 90,000 | | | 103,738 |
Winston County MS Urban Renewal Revenue | | 5.150 | | | 12/01/2017 | | AAA* | | | 15,000 | | | 15,796 |
| | | | | | | | | | | | |
|
|
| | | | | | | | | | | | | | 2,169,380 |
GENERAL OBLIGATION BONDS | | | | | | | | | | | | | |
12.90% of Net Assets | | | | | | | | | | | | | |
Biloxi MS Tax Increment—LTD Obligation—Series A | | 5.900 | | | 10/01/2019 | | A* | | | 35,000 | | | 35,852 |
Hinds County MS School District | | 4.750 | | | 03/01/2015 | | NR | | | 50,000 | | | 51,372 |
Horn Lake Special Assessment Improvement Bonds-Desoto | | 5.400 | | | 04/15/2020 | | A-* | | | 25,000 | | | 26,069 |
Jackson MS Redevelopment Authority Urban Renewal Revenue | | 5.600 | | | 11/01/2021 | | A2 | | | 20,000 | | | 21,302 |
MS Development Bank Special Obligation Public Improvement | | 4.750 | | | 12/01/2019 | | NR/BBB+* | | | 145,000 | | | 138,429 |
Mississippi State | | 5.100 | | | 11/15/2012 | | Aa3/AA* | | | 10,000 | | | 11,008 |
Mississippi State General Obligation Series A | | 5.500 | | | 12/01/2015 | | Aa3/AA* | | | 100,000 | | | 111,880 |
Richland MS Tax Increment | | 5.600 | | | 06/01/2013 | | NR | | | 10,000 | | | 10,889 |
| | | | | | | | | | | | |
|
|
| | | | | | | | | | | | | | 406,801 |
PREREFUNDED BONDS | | | | | | | | | | | | | |
9.89% of Net Assets | | | | | | | | | | | | | |
MS Development Bank Special Obligation Adams County Juvenile | | 5.900 | | | 07/01/2017 | | A* | | | 10,000 | | | 11,259 |
MS State Capital Improvements | | 5.000 | | | 11/01/2018 | | AA* | | | 125,000 | | | 136,356 |
MS State Capital Improvements | | 5.000 | | | 11/01/2020 | | Aa3/AA* | | | 50,000 | | | 54,543 |
The accompanying notes are an integral part of the financial statements.
17
DUPREE MUTUAL FUNDS—MISSISSIPPI TAX-FREE INCOME SERIES
SCHEDULE OF PORTFOLIO INVESTMENTS
Mississippi Municipal Bonds—100%
June 30, 2004
| | | | | | | | | | | | | |
| Bond Description | | Coupon | | | Maturity
Date | | Rating# | | Par Value | | Market Value |
|
Mississippi State Capital Improvements | | 5.000 | % | | 11/01/2021 | | Aa3/AA* | | $ | 100,000 | | $ | 109,085 |
| | | | | | | | | | | | |
|
|
| | | | | | | | | | | | | | 311,243 |
MUNICIPAL UTILITY REVENUE BONDS | | | | | | | | | | | | | |
1.99% of Net Assets | | | | | | | | | | | | | |
MS Development Bank Special Obligation-Bay St Louis | | 5.375 | | | 07/01/2014 | | A* | | | 10,000 | | | 10,636 |
MS Development Bank Special Obligation Okolona Electric | | 5.350 | | | 07/01/2021 | | A* | | | 50,000 | | | 51,890 |
| | | | | | | | | | | | |
|
|
| | | | | | | | | | | | | | 62,526 |
ESCROWED TO MATURITY BONDS | | | | | | | | | | | | | |
1.80% of Net Assets | | | | | | | | | | | | | |
Harrison County MS Wastewater Management District | | 5.000 | | | 02/01/2015 | | Aaa/AAA* | | | 25,000 | | | 26,938 |
MS Gulf Coast Regional Wastewater Treatment Facilities | | 7.000 | | | 07/01/2012 | | AAA* | | | 25,000 | | | 29,604 |
| | | | | | | | | | | | |
|
|
| | | | | | | | | | | | | | 56,542 |
PUBLIC FACILITIES REVENUE BONDS | | | | | | | | | | | | | |
1.65% of Net Assets | | | | | | | | | | | | | |
Mississippi Development Bank Special Obligation — Southaven | | 6.200 | | | 03/01/2020 | | A* | | | 10,000 | | | 11,044 |
Vicksburg Warren MS School District | | 4.700 | | | 02/01/2017 | | AA-* | | | 40,000 | | | 40,764 |
| | | | | | | | | | | | |
|
|
| | | | | | | | | | | | | | 51,808 |
CERTIFICATES OF PARTICIPATION BONDS | | | | | | | | | | | | | |
1.32% of Net Assets | | | | | | | | | | | | | |
Monroe County MS Certificates of Participation Jail Project | | 5.050 | | | 04/01/2020 | | Aaa | | | 40,000 | | | 41,239 |
| | | | | | | | | | | | |
|
|
| | | | | | | | | | | | | | 41,239 |
Total Investments (cost $3,012,184)(a) — 98.5% of Net Assets | | | | | | | | | | | | $ | 3,099,539 |
| | | | | | | | | | | | |
|
|
| | * | Standard and Poor’s Corporation |
| | All | other ratings by Moody’s Investors Service, Inc. |
| | # | Bond ratings are unaudited. |
| (a) | Represents cost for financial reporting and federal income tax purposes and differs from market value by net unrealized appreciation of securities as follows: |
| | | | |
Unrealized appreciation | | $ | 109,451 | |
Unrealized depreciation | | | (22,096 | ) |
| | |
|
|
|
Net unrealized appreciation | | $ | 87,355 | |
| | |
|
|
|
The accompanying notes are an integral part of the financial statements.
18
DUPREE MUTUAL FUNDS—MISSISSIPPI TAX-FREE INCOME SERIES
STATEMENT OF ASSETS AND LIABILITIES
JUNE 30, 2004
| | | | | | |
ASSETS: | | | | | | |
Investments in securities, at value (Cost: $3,012,184) | | | | | $ | 3,099,539 |
Cash | | | | | | 32,940 |
Interest receivable | | | | | | 49,044 |
Receivable from Adviser | | | | | | 3,059 |
Prepaid expenses | | | | | | 1,303 |
| | | | | |
|
|
Total assets | | | | | | 3,185,885 |
LIABILITIES: | | | | | | |
Payable for: | | | | | | |
Distributions | | $ | 30,357 | | | |
Fund shares redeemed | | | 604 | | | |
Transfer agent fee | | | 8,591 | | | |
| | |
|
| | | |
Total liabilities | | | | | | 39,552 |
| | | | | |
|
|
NET ASSETS: | | | | | | |
Capital | | | | | | 3,058,916 |
Net accumulated realized gain on investment transactions | | | | | | 62 |
Net unrealized appreciation in value of investments | | | | | | 87,355 |
| | | | | |
|
|
Net assets at value | | | | | $ | 3,146,333 |
| | | | | |
|
|
NET ASSET VALUE, offering price and redemption price per share ($3,146,333 –:– 277,524 shares outstanding; unlimited number of shares authorized; no par value) | | | | | $ | 11.34 |
| | | | | |
|
|
STATEMENT OF OPERATIONS
For the year ended June 30, 2004
| | | | |
Net investment income: | | | | |
Interest income | | $ | 133,743 | |
| | |
|
|
|
Expenses: | | | | |
Investment advisory fee | | | 14,648 | |
Transfer agent fee | | | 4,394 | |
Custodian and interest expense | | | 4,930 | |
Professional fees | | | 1,877 | |
Pricing fees | | | 2,295 | |
Trustee fees | | | 278 | |
Other expenses | | | 1,750 | |
| | |
|
|
|
Total expenses | | | 30,172 | |
Fees waived by Adviser | | | (13,509 | ) |
Custodian and interest expense reductions | | | (4,930 | ) |
| | |
|
|
|
Net expenses | | | 11,733 | |
| | |
|
|
|
Net investment income | | | 122,010 | |
| | |
|
|
|
Realized and unrealized loss on investments: | | | | |
Net decrease in unrealized appreciation | | | (102,922 | ) |
| | |
|
|
|
Net realized and unrealized loss on investments | | | (102,922 | ) |
| | |
|
|
|
Net increase in net assets resulting from operations | | $ | 19,088 | |
| | |
|
|
|
The accompanying notes are an integral part of the financial statements.
19
DUPREE MUTUAL FUNDS—MISSISSIPPI TAX-FREE INCOME SERIES
STATEMENTS OF CHANGES IN NET ASSETS
For the years ended June 30, 2004 and 2003
| | | | | | | | |
| | | 2004
| | | 2003
| |
Increase in net assets: | | | | | | | | |
Operations: | | | | | | | | |
Net investment income | | $ | 122,010 | | | $ | 103,755 | |
Net realized gain on investments | | | — | | | | 753 | |
Net (decrease)/increase in unrealized appreciation | | | (102,922 | ) | | | 145,662 | |
| | |
|
|
| |
|
|
|
Net increase in net assets resulting from operations | | | 19,088 | | | | 250,170 | |
Distributions to shareholders from net investment income | | | (122,010 | ) | | | (103,755 | ) |
Distributions to shareholders from capital gain | | | (691 | ) | | | (91 | ) |
Net fund share transactions | | | 522,051 | | | | 752,982 | |
| | |
|
|
| |
|
|
|
Total increase | | | 418,438 | | | | 899,306 | |
Net assets: | | | | | | | | |
Beginning of year | | | 2,727,895 | | | | 1,828,589 | |
| | |
|
|
| |
|
|
|
End of year | | $ | 3,146,333 | | | $ | 2,727,895 | |
| | |
|
|
| |
|
|
|
FINANCIAL HIGHLIGHTS
Selected data for a share outstanding:
| | | | | | | | | | | | | | | | | | | | |
| | | For the years ended June 30,
| | | | | | The period
1/1/2000 to 6/30/00 (a)
| |
| | | 2004
| | | 2003
| | | 2002
| | | 2001
| | |
Net asset value, beginning of year | | $ | 11.74 | | | $ | 11.00 | | | $ | 10.83 | | | $ | 10.35 | | | $ | 10.00 | |
| | |
|
|
| |
|
|
| |
|
|
| |
|
|
| |
|
|
|
Income from investment operations: | | | | | | | | | | | | | | | | | | | | |
Net investment income | | | 0.48 | | | | 0.50 | | | | 0.54 | | | | 0.55 | | | | 0.27 | |
Net gains on securities, both realized and unrealized | | | (0.40 | ) | | | 0.74 | | | | 0.17 | | | | 0.48 | | | | 0.35 | |
| | |
|
|
| |
|
|
| |
|
|
| |
|
|
| |
|
|
|
Total from investment operations | | | 0.08 | | | | 1.24 | | | | 0.71 | | | | 1.03 | | | | 0.62 | |
Less distributions: | | | | | | | | | | | | | | | | | | | | |
Distributions from net investment income | | | (0.48 | ) | | | (0.50 | ) | | | (0.54 | ) | | | (0.55 | ) | | | (0.27 | ) |
| | |
|
|
| |
|
|
| |
|
|
| |
|
|
| |
|
|
|
Net asset value, end of year | | $ | 11.34 | | | $ | 11.74 | | | $ | 11.00 | | | $ | 10.83 | | | $ | 10.35 | |
| | |
|
|
| |
|
|
| |
|
|
| |
|
|
| |
|
|
|
Total return | | | 0.72 | % | | | 11.53 | % | | | 6.67 | % | | | 10.19 | % | | | 6.24 | % (c) |
Net assets, end of year (in thousands) | | $ | 3,146 | | | $ | 2,728 | | | $ | 1,829 | | | $ | 816 | | | $ | 238 | |
Ratio of net expenses to average net assets (d) | | | 0.40 | % | | | 0.33 | % | | | 0.27 | % | | | 0.21 | % | | | 0.50 | % (b) |
Ratio of net investment income to average net assets | | | 4.16 | % | | | 4.37 | % | | | 4.87 | % | | | 5.18 | % | | | 5.31 | % (b) |
Portfolio turnover | | | 0.18 | % | | | 2.36 | % | | | 3.40 | % | | | 0.00 | % | | | 0.00 | % |
| (a) | Commencement of operations January 1, 2000 |
| (c) | Total return is not annualized |
| (d) | Percentages are after expenses waived by Adviser and custodian and interest expense reductions. |
Expenses waived by Adviser and custodian expense reductions were:
.46% and .17% for 2004, .55% and .20% for 2003, .60% and .37% for 2002, ..92%, 1.02% for 2001, and 2.85% and 1.39% for 2000, respectively.
The accompanying notes are an integral part of the financial statements.
20
DUPREE MUTUAL FUNDS—NORTH CAROLINA TAX-FREE INCOME SERIES
SCHEDULE OF PORTFOLIO INVESTMENTS
North Carolina Municipal Bonds—100%
June 30, 2004
| | | | | | | | | | | | | |
| Bond Description | | Coupon | | | Maturity
Date | | Rating# | | Par Value | | Market Value |
|
INSURED MUNICIPAL BONDS | | | | | | | | | | | | | |
55.82% of Net Assets | | | | | | | | | | | | | |
Catawba County NC Catawba Memorial Hospital Revenue | | 5.000 | % | | 10/01/2017 | | Aaa/AAA* | | $ | 500,000 | | $ | 518,115 |
Cumberland County NC Certificates of Participation Civic Center | | 5.000 | | | 12/01/2018 | | Aaa/AAA* | | | 500,000 | | | 519,715 |
Cumberland County NC Hospital Facilities Revenue | | 5.250 | | | 10/01/2019 | | Aa/AA* | | | 1,000,000 | | | 1,034,030 |
Dare County NC Utility System Revenue | | 5.250 | | | 06/01/2018 | | Aaa/AAA* | | | 250,000 | | | 274,118 |
Dare County NC Certificates of Participation | | 5.125 | | | 06/01/2018 | | Aaa/AAA* | | | 500,000 | | | 527,240 |
Elizabeth City NC Housing Developement Mortgage Revenue | | 6.125 | | | 04/01/2023 | | Aa | | | 140,000 | | | 143,447 |
Gaston County NC Certificates of Participation Public Facilities | | 5.250 | | | 12/01/2016 | | Aaa/AAA* | | | 850,000 | | | 903,100 |
Gastonia NC Combined Utilities Systems Revenue | | 5.625 | | | 05/01/2019 | | Aaa/AAA* | | | 500,000 | | | 543,400 |
Greenville NC Housing Developement Corp Series A | | 5.800 | | | 07/01/2024 | | Aaa/AAA* | | | 35,000 | | | 35,537 |
Harnett County NC Certificate of Participation | | 5.000 | | | 12/01/2018 | | Aaa/AAA* | | | 1,000,000 | | | 1,039,560 |
Lenoir NC Housing Authority Mortgage Revenue | | 5.700 | | | 08/20/2024 | | AAA* | | | 100,000 | | | 102,812 |
New Hanover County NC Certificates of Participation | | 5.000 | | | 12/01/2017 | | Aaa/AAA* | | | 250,000 | | | 262,310 |
New Hanover County NC Hospital Revenue | | 5.750 | | | 10/01/2026 | | Aaa/AAA* | | | 100,000 | | | 104,868 |
New Hanover County NC Hospital Revenue | | 5.000 | | | 10/01/2019 | | Aaa/AAA* | | | 1,110,000 | | | 1,145,320 |
New Hanover County NC Certificates of Participation | | 5.000 | | | 12/01/2022 | | Aaa/AAA* | | | 1,000,000 | | | 1,025,640 |
NC Educational Facilities Finance Agency St Augustines | | 5.250 | | | 10/01/2018 | | AA* | | | 600,000 | | | 613,086 |
NC Educational Facilities Finance Agency St Augustines | | 5.250 | | | 10/01/2028 | | AA* | | | 630,000 | | | 625,672 |
NC Eastern Municipal Power Agency Power System Revenue | | 5.500 | | | 01/01/2017 | | Aaa/AAA* | | | 150,000 | | | 150,600 |
NC Eastern Municipal Power Agency Power System Revenue | | 5.700 | | | 01/01/2015 | | Aaa/AAA* | | | 345,000 | | | 375,719 |
NC Eastern Municipal Power Agency Power System Refunding | | 5.375 | | | 01/01/2024 | | Aaa/AAA* | | | 1,000,000 | | | 1,045,550 |
NC Eastern Municipal Power Agency Power System Revenue | | 6.000 | | | 01/01/2018 | | Aaa/AAA* | | | 1,000,000 | | | 1,158,260 |
NC Central University Housing System Revenue | | 5.800 | | | 11/01/2018 | | Aaa/AAA* | | | 50,000 | | | 55,098 |
NC Central University Housing System Revenue | | 5.800 | | | 11/01/2020 | | Aaa/AAA* | | | 60,000 | | | 66,088 |
NC Municipal Power Agency No 1 Catawba Electric Revenue | | 5.250 | | | 01/01/2019 | | Aaa/AAA* | | | 1,000,000 | | | 1,051,050 |
NC Medical Care Community Hospital Revenue-High Point | | 5.000 | | | 10/01/2019 | | Aaa/AAA* | | | 500,000 | | | 518,115 |
NC Medial Care Community Hospital Northeast Medical Center | | 4.600 | | | 11/01/2020 | | Aaa/AAA* | | | 350,000 | | | 345,625 |
NC Medical Care Community Hospital Revenue-Rex Hospital | | 5.000 | | | 06/01/2017 | | Aaa/AAA* | | | 500,000 | | | 518,915 |
NC Medical Care Community Hospital Revenue-St Joseph | | 5.100 | | | 10/01/2014 | | Aaa/AAA* | | | 5,000 | | | 5,141 |
NC Medical Care Community Hospital Revenue-Stanly Hospital | | 5.375 | | | 10/01/2014 | | Aaa/AAA* | | | 50,000 | | | 53,421 |
NC Medical Care Community Hospital Revenue-Wilson Memorial | | 5.625 | | | 11/01/2018 | | Aaa/AAA* | | | 80,000 | | | 85,878 |
NC Municipal Power Agency No 1 Catawba Electric Revenue | | 5.125 | | | 01/01/2017 | | Aaa/AAA* | | | 500,000 | | | 521,955 |
NC Municipal Power Agency No 1 Catawba Electric Revenue | | 5.125 | | | 01/01/2017 | | Aaa/AAA* | | | 700,000 | | | 735,371 |
Pitt County NC Certificates of Participation Public Facilities | | 5.850 | | | 04/01/2017 | | Aaa/AAA* | | | 100,000 | | | 109,677 |
Pitt County NC Certificates of Participation Public Facilities | | 5.500 | | | 04/01/2020 | | Aaa/AAA* | | | 500,000 | | | 534,700 |
Raleigh Durham NC Airport Authority | | 5.250 | | | 11/01/2018 | | Aaa | | | 1,000,000 | | | 1,053,050 |
Raleigh/Durham NC Airport Revenue | | 5.000 | | | 11/01/2020 | | Aaa | | | 1,000,000 | | | 1,022,040 |
Randolph County NC Certificates of Participation | | 5.750 | | | 06/01/2022 | | Aaa/AAA* | | | 500,000 | | | 563,330 |
Union County NC Enterprise System | | 4.100 | | | 06/01/2021 | | Aaa/AAA* | | | 1,185,000 | | | 1,090,887 |
University of NC at Chapel Hill Hospital Revenue | | 5.250 | | | 02/15/2017 | | Aaa/AAA* | | | 500,000 | | | 542,420 |
University of NC at Wilmington Dorm & Dining System Revenue | | 5.400 | | | 01/01/2018 | | Aaa/AAA* | | | 120,000 | | | 127,588 |
Wilson Combined Enterprise System | | 4.700 | | | 12/01/2022 | | Aaa/AAA* | | | 500,000 | | | 496,930 |
University of NC at Winston-Salem Student Services Revenue | | 5.400 | | | 06/01/2012 | | Aaa/AAA* | | | 10,000 | | | 10,578 |
| | | | | | | | | | | | |
|
|
| | | | | | | | | | | | | | 21,655,956 |
HOSPITAL AND HEALTHCARE REVENUE BONDS | | | | | | | | | | | | | |
14.75% of Net Assets | | | | | | | | | | | | | |
Charlotte/Mecklenburg NC Hospital Authority Revenue Bond | | 5.750 | | | 01/15/2021 | | Aa3/AA* | | | 250,000 | | | 264,310 |
Charlotte/Mecklenburg NC Hospital Authority Revenue Bond | | 5.875 | | | 01/15/2026 | | Aa3/AA* | | | 50,000 | | | 52,297 |
Charlotte/Mecklenburg NC Hospital Authority Revenue Bond | | 5.000 | | | 01/15/2017 | | Aa3/AA* | | | 750,000 | | | 763,080 |
Cumberland County NC Hospital Facilities Revenue | | 5.250 | | | 10/01/2019 | | A3/A-* | | | 1,000,000 | | | 1,017,410 |
NC Medical Care Health Care Facilities Revenue Novant Health | | 5.000 | | | 11/01/2017 | | Aa3/AA-* | | | 1,000,000 | | | 1,026,200 |
NC Medical Care Community Hospital Revenue-Duke Univ Hospital | | 5.250 | | | 06/01/2017 | | Aa3/AA* | | | 900,000 | | | 934,047 |
NC Medical Care Community Hospital Revenue-Duke Univ Hospital | | 5.250 | | | 06/01/2021 | | Aa3/AA* | | | 150,000 | | | 151,902 |
NC Medical Care Community Hospital Revenue-Gaston Memorial | | 5.500 | | | 02/15/2019 | | A1/A+* | | | 150,000 | | | 153,047 |
NC Medical Care Community Hospital Revenue-Pitt County | | 5.250 | | | 12/01/2013 | | Aa3/AA-* | | | 800,000 | | | 847,824 |
The accompanying notes are an integral part of the financial statements.
21
DUPREE MUTUAL FUNDS—NORTH CAROLINA TAX-FREE INCOME SERIES
SCHEDULE OF PORTFOLIO INVESTMENTS
North Carolina Municipal Bonds—100%
June 30, 2004
| | | | | | | | | | | | | |
| Bond Description | | Coupon | | | Maturity
Date | | Rating# | | Par Value | | Market Value |
|
NC Medical Care Community Hospital Revenue-Pitt County | | 5.000 | % | | 12/01/2018 | | Aa3/AA-* | | $ | 500,000 | | $ | 509,595 |
| | | | | | | | | | | | |
|
|
| | | | | | | | | | | | | | 5,719,712 |
CERTIFICATES OF PARTICIPATION BONDS | | | | | | | | | | | | | |
8.77% of Net Assets | | | | | | | | | | | | | |
Cabarrus County NC Certificates of Participation | | 5.000 | | | 04/01/2021 | | Aa3/AA-* | | | 650,000 | | | 661,947 |
Charlotte NC Certificates of Participation Convention Facilities | | 5.500 | | | 12/01/2020 | | Aa2/AA+* | | | 700,000 | | | 747,110 |
Charlotte NC Certificates of Participation Convention Facilities | | 5.250 | | | 06/01/2020 | | Aa2/AA+* | | | 1,000,000 | | | 1,050,800 |
Forsyth County NC Certificates of Participation | | 5.000 | | | 10/01/2018 | | Aa2/AA+* | | | 400,000 | | | 412,984 |
Forsyth County NC Certificates of Participation | | 5.125 | | | 10/01/2017 | | Aa2/AA+* | | | 500,000 | | | 529,750 |
| | | | | | | | | | | | |
|
|
| | | | | | | | | | | | | | 3,402,591 |
PREREFUNDED BONDS | | | | | | | | | | | | | |
9.17% of Net Assets | | | | | | | | | | | | | |
Fayetteville NC Public Works Community Revenue | | 5.100 | | | 03/01/2015 | | Aaa/AAA* | | | 400,000 | | | 431,504 |
Greensboro NC Coliseum Complex Improvement | | 5.700 | | | 12/01/2010 | | A1/AA* | | | 55,000 | | | 60,526 |
Greenville NC Enterprise System Revenue | | 6.000 | | | 09/01/2010 | | A1/A+* | | | 100,000 | | | 102,817 |
NC Eastern Municipal Power Agency Power System | | 6.000 | | | 01/01/2026 | | Aaa/BBB* | | | 15,000 | | | 17,427 |
North Carolina Public Improvement | | 5.250 | | | 03/01/2016 | | Aaa/AAA* | | | 1,000,000 | | | 1,111,460 |
Pitt County NC Memorial Hospital Revenue | | 5.500 | | | 12/01/2015 | | Aaa/AAA* | | | 325,000 | | | 348,299 |
Union County NC Enterprise System Revenue | | 5.500 | | | 06/01/2021 | | Aaa/AAA* | | | 245,000 | | | 265,877 |
University of NC at Chapel Hill Hospital Revenue | | 5.250 | | | 02/15/2019 | | A1/AA* | | | 105,000 | | | 112,531 |
Winston-Salem NC Water & Sewer System Revenue | | 5.125 | | | 06/01/2020 | | Aa2/AAA* | | | 1,000,000 | | | 1,107,580 |
| | | | | | | | | | | | |
|
|
| | | | | | | | | | | | | | 3,558,021 |
GENERAL OBLIGATION BONDS | | | | | | | | | | | | | |
2.70% of Net Assets | | | | | | | | | | | | | |
Cary NC General Obligation Bond | | 5.000 | | | 03/01/2019 | | Aaa/AAA* | | | 1,000,000 | | | 1,048,060 |
| | | | | | | | | | | | |
|
|
| | | | | | | | | | | | | | 1,048,060 |
LEASE REVENUE BONDS | | | | | | | | | | | | | |
2.64% of Net Assets | | | | | | | | | | | | | |
NC Infrastructure Financial Corporation Lease Purchase | | 5.000 | | | 10/01/2021 | | Aa2/AA+* | | | 1,000,000 | | | 1,022,230 |
| | | | | | | | | | | | |
|
|
| | | | | | | | | | | | | | 1,022,230 |
PUBLIC FACILITIES REVENUE BONDS | | | | | | | | | | | | | |
2.00% of Net Assets | | | | | | | | | | | | | |
Cary NC Combined Enterprise System Revenue | | 5.000 | | | 12/01/2022 | | Aa/AA* | | | 700,000 | | | 711,242 |
Shelby NC Combined Enterprise System Revenue | | 5.625 | | | 05/01/2014 | | Baa1/A-* | | | 20,000 | | | 20,907 |
Shelby NC Combined Enterprise System Revenue | | 5.625 | | | 05/01/2014 | | Baa1/A-* | | | 40,000 | | | 41,813 |
| | | | | | | | | | | | |
|
|
| | | | | | | | | | | | | | 773,962 |
MUNICIPAL UTILITY REVENUE BONDS | | | | | | | | | | | | | |
1.42% of Net Assets | | | | | | | | | | | | | |
Charlotte NC Storm Water Revenue Refunding Bond | | 5.250 | | | 06/01/2019 | | Aa1/AA+* | | | 520,000 | | | 550,332 |
| | | | | | | | | | | | |
|
|
| | | | | | | | | | | | | | 550,332 |
STATE AND LOCAL MORTGAGE REVENUE BONDS | | | | | | | | | | | | | |
.99% of Net Assets | | | | | | | | | | | | | |
NC Housing Finance Agency Single Family Revenue Series Y | | 6.300 | | | 09/01/2015 | | Aa/AA* | | | 65,000 | | | 66,485 |
NC Housing Finance Agency Single Family Revenue Series II | | 6.200 | | | 03/01/2016 | | Aa2/AA* | | | 50,000 | | | 52,071 |
NC Housing Finance Agency Single Family Revenue Series KK | | 5.875 | | | 09/01/2017 | | Aa2/AA+* | | | 65,000 | | | 65,709 |
NC Housing Finance Agency Home Ownership Revenue | | 5.125 | | | 07/01/2013 | | Aa2/AA* | | | 95,000 | | | 97,771 |
Vance County NC Housing Mortgage Revenue Henderson Project | | 6.150 | | | 03/01/2022 | | Aa2 | | | 100,000 | | | 100,030 |
| | | | | | | | | | | | |
|
|
| | | | | | | | | | | | | | 382,066 |
| | | | | | | | | | | | |
|
|
Total Investments (cost $36,767,903)(a)—98.26% of Net Assets | | | | | | | | | | | | $ | 38,112,930 |
| | | | | | | | | | | | |
|
|
The accompanying notes are an integral part of the financial statements.
22
DUPREE MUTUAL FUNDS—NORTH CAROLINA TAX-FREE INCOME SERIES
SCHEDULE OF PORTFOLIO INVESTMENTS
North Carolina Municipal Bonds—100%
June 30, 2004
| | * | Standard and Poor’s Corporation |
| | All | other ratings by Moody’s Investors Service, Inc. |
| | # | Bond ratings are unaudited. |
| (a) | Represents cost for financial reporting and federal income tax purposes and differs from market value by net unrealized appreciation of securities as follows: |
| | | | |
Unrealized appreciation | | $ | 1,493,630 | |
Unrealized depreciation | | | (148,603 | ) |
| | |
|
|
|
Net unrealized appreciation | | $ | 1,345,027 | |
| | |
|
|
|
The accompanying notes are an integral part of the financial statements.
23
DUPREE MUTUAL FUNDS—NORTH CAROLINA TAX-FREE INCOME SERIES
STATEMENT OF ASSETS AND LIABILITIES
JUNE 30, 2004
| | | | | | | |
ASSETS: | | | | | | | |
Investments in securities, at value (Cost: $36,767,903) | | | | | $ | 38,112,930 | |
Cash | | | | | | 597,097 | |
Receivable for investments sold | | | | | | 100,000 | |
Interest receivable | | | | | | 433,578 | |
Prepaid expenses | | | | | | 6,374 | |
| | | | | |
|
|
|
Total assets | | | | | | 39,249,979 | |
LIABILITIES: | | | | | | | |
Payable for: | | | | | | | |
Distributions | | $ | 391,824 | | | | |
Fund shares redeemed | | | 44,994 | | | | |
Investment advisory fee | | | 17,490 | | | | |
Transfer agent fee | | | 4,706 | | | | |
| | |
|
| | | | |
Total liabilities | | | | | | 459,014 | |
| | | | | |
|
|
|
NET ASSETS: | | | | | | | |
Capital | | | | | | 38,510,912 | |
Net accumulated realized loss on investment transactions | | | | | | (1,064,974 | ) |
Net unrealized appreciation in value of investments | | | | | | 1,345,027 | |
| | | | | |
|
|
|
Net assets at value | | | | | $ | 38,790,965 | |
| | | | | |
|
|
|
NET ASSET VALUE, offering price and redemption price per share ($38,790,965 –:– 3,597,001 shares outstanding; unlimited number of shares authorized; no par value) | | | | | $ | 10.78 | |
| | | | | |
|
|
|
STATEMENT OF OPERATIONS
For the year ended June 30, 2004
| | | | |
Net investment income: | | | | |
Interest income | | $ | 1,858,483 | |
| | |
|
|
|
Expenses: | | | | |
Investment advisory fee | | | 195,819 | |
Transfer agent fee | | | 52,996 | |
Custodian and interest expense | | | 11,664 | |
Professional fees | | | 6,140 | |
Trustee fees | | | 3,774 | |
Other expenses | | | 12,619 | |
| | |
|
|
|
Total expenses | | | 283,012 | |
Custodian and interest expense reductions | | | (11,664 | ) |
| | |
|
|
|
Net expenses | | | 271,348 | |
| | |
|
|
|
Net investment income | | | 1,587,135 | |
| | |
|
|
|
Realized and unrealized loss on investments: | | | | |
Net realized loss | | | (57,527 | ) |
Net decrease in unrealized appreciation | | | (1,144,007 | ) |
| | |
|
|
|
Net realized and unrealized loss on investments | | | (1,201,534 | ) |
| | |
|
|
|
Net increase in net assets resulting from operations | | $ | 385,601 | |
| | |
|
|
|
The accompanying notes are an integral part of the financial statements.
24
DUPREE MUTUAL FUNDS—NORTH CAROLINA TAX-FREE INCOME SERIES
STATEMENTS OF CHANGES IN NET ASSETS
For the years ended June 30, 2004 and 2003
| | | | | | | | |
| | | 2004
| | | 2003
| |
Increase in net assets: | | | | | | | | |
Operations: | | | | | | | | |
Net investment income | | $ | 1,587,135 | | | $ | 1,550,959 | |
Net realized loss on investments | | | (57,527 | ) | | | (863,370 | ) |
Net (decrease)/increase in unrealized appreciation | | | (1,144,007 | ) | | | 2,292,076 | |
| | |
|
|
| |
|
|
|
Net increase in net assets resulting from operations | | | 385,601 | | | | 2,979,665 | |
Distributions to shareholders from net investment income | | | (1,587,135 | ) | | | (1,550,959 | ) |
Net fund share transactions | | | 324,586 | | | | 5,654,610 | |
| | |
|
|
| |
|
|
|
Total (decrease)/increase | | | (876,948 | ) | | | 7,083,316 | |
Net assets: | | | | | | | | |
Beginning of year | | | 39,667,913 | | | | 32,584,597 | |
| | |
|
|
| |
|
|
|
End of year | | $ | 38,790,965 | | | $ | 39,667,913 | |
| | |
|
|
| |
|
|
|
FINANCIAL HIGHLIGHTS
Selected data for a share outstanding:
| | | | | | | | | | | | | | | | | | | | |
| | | For the years ended June 30,
| |
| | | 2004
| | | 2003
| | | 2002
| | | 2001
| | | 2000
| |
Net asset value, beginning of year | | $ | 11.12 | | | $ | 10.68 | | | $ | 10.63 | | | $ | 10.21 | | | $ | 10.61 | |
| | |
|
|
| |
|
|
| |
|
|
| |
|
|
| |
|
|
|
Income from investment operations: | | | | | | | | | | | | | | | | | | | | |
Net investment income | | | 0.44 | | | | 0.47 | | | | 0.49 | | | | 0.50 | | | | 0.51 | |
Net gains/(losses) on securities, both realized and unrealized | | | (0.34 | ) | | | 0.44 | | | | 0.05 | | | | 0.42 | | | | (0.40 | ) |
| | |
|
|
| |
|
|
| |
|
|
| |
|
|
| |
|
|
|
Total from investment operations | | | 0.10 | | | | 0.91 | | | | 0.54 | | | | 0.92 | | | | 0.11 | |
Less distributions: | | | | | | | | | | | | | | | | | | | | |
Distributions from capital gains | | | 0.00 | | | | 0.00 | | | | 0.00 | | | | 0.00 | | | | (0.01 | ) |
Distributions from net investment income | | | (0.44 | ) | | | (0.47 | ) | | | (0.49 | ) | | | (0.50 | ) | | | (0.50 | ) |
| | |
|
|
| |
|
|
| |
|
|
| |
|
|
| |
|
|
|
Net asset value, end of year | | $ | 10.78 | | | $ | 11.12 | | | $ | 10.68 | | | $ | 10.63 | | | $ | 10.21 | |
| | |
|
|
| |
|
|
| |
|
|
| |
|
|
| |
|
|
|
Total return | | | 0.95 | % | | | 8.70 | % | | | 5.19 | % | | | 9.09 | % | | | 1.07 | % |
Net assets, end of year (in thousands) | | $ | 38,791 | | | $ | 39,668 | | | $ | 32,585 | | | $ | 25,945 | | | $ | 21,660 | |
Ratio of net expenses to average net assets (a) | | | 0.69 | % | | | 0.68 | % | | | 0.57 | % | | | 0.55 | % | | | 0.55 | % |
Ratio of net investment income to average net assets | | | 4.05 | % | | | 4.29 | % | | | 4.60 | % | | | 4.71 | % | | | 4.92 | % |
Portfolio turnover | | | 10.51 | % | | | 7.99 | % | | | 6.60 | % | | | 19.71 | % | | | 16.14 | % |
| (a) | Percentages are after expenses waived by Adviser and custodian and interest expense reductions. |
Expenses waived by Adviser and custodian and interest expense reductions were:
0% and .03% for 2004, .02% and .03% for 2003, .14% and .03% for 2002, .16% and .03% for 2001, and .17% and .03% for 2000, respectively.
The accompanying notes are an integral part of the financial statements.
25
DUPREE MUTUAL FUNDS—NORTH CAROLINA TAX-FREE SHORT-TO-MEDIUM SERIES
SCHEDULE OF PORTFOLIO INVESTMENTS
North Carolina Municipal Bonds—100%
June 30, 2004
| | | | | | | | | | | | | |
| Bond Description | | Coupon | | | Maturity
Date | | Rating# | | Par Value | | Market Value |
|
INSURED MUNICIPAL REVENUE BONDS | | | | | | | | | | | | | |
49.00% of Net Assets | | | | | | | | | | | | | |
Asheville NC Certificates of Participation Series:A | | 4.600 | % | | 06/01/2005 | | Aaa/AAA* | | $ | 50,000 | | $ | 51,424 |
Carteret County NC General Obligation | | 5.400 | | | 05/01/2009 | | Aaa/AAA* | | | 100,000 | | | 107,903 |
Centennial Authority NC Hotel Tax Revenue Bond Arena Project | | 5.000 | | | 09/01/2012 | | Aaa/AAA* | | | 100,000 | | | 107,345 |
Charlotee NC Certificates of Participation Series A | | 5.000 | | | 08/01/2012 | | Aaa/AAA* | | | 1,000,000 | | | 1,085,730 |
Coastal Regualtion Solid Waste Management Authority NC | | 4.250 | | | 06/01/2005 | | Aaa/AAA* | | | 125,000 | | | 128,149 |
Cumberland County NC Hospital Facility Revenue | | 5.000 | | | 10/01/2006 | | A3/AA* | | | 150,000 | | | 158,294 |
Duplin County NC Certificates of Participation | | 3.000 | | | 09/01/2009 | | Aaa/AAA* | | | 225,000 | | | 223,076 |
Greenville NC Certificates of Participation Public Facilities | | 4.600 | | | 06/01/2011 | | Aaa/AAA* | | | 100,000 | | | 104,829 |
Harnett County Nc Certificates of Participation | | 5.250 | | | 12/01/2009 | | Aaa/AAA* | | | 240,000 | | | 264,295 |
Harnett County NC Certificates of Participation | | 4.250 | | | 12/01/2011 | | Aaa/AAA* | | | 150,000 | | | 156,096 |
Haywood County NC Certificates of Participation | | 4.000 | | | 10/01/2009 | | Aaa/AAA* | | | 400,000 | | | 415,932 |
Johnston County NC Certificates of Participation Judicial Annex | | 5.200 | | | 09/01/2007 | | Aaa/AAA* | | | 100,000 | | | 107,492 |
Johnston County NC Finance Corporation School & Museum Project | | 4.650 | | | 08/01/2008 | | Aaa/AAA* | | | 200,000 | | | 212,834 |
New Hanover County NC Regional Medical Center Hospital Revnue | | 4.250 | | | 10/01/2009 | | Aaa/AAA* | | | 100,000 | | | 104,739 |
North Carolina Medical Care Community Hospital Chatham Memorial | | 3.625 | | | 10/01/2010 | | AA* | | | 100,000 | | | 98,646 |
NC Capital Facility Finance Agency Johnson & Wales University | | 5.000 | | | 04/01/2009 | | Aaa/AAA* | | | 200,000 | | | 216,480 |
North Carolina Eastern Municipal Power Agency Power System Revenue | | 6.125 | | | 01/01/2009 | | A/A* | | | 120,000 | | | 131,916 |
NC Municipal Power Agency Number 1-Catawba Electric | | 6.000 | | | 01/01/2008 | | Aaa/AAA* | | | 250,000 | | | 276,250 |
North Carolina Municipal Power Agency No.1 Catawba Electric | | 6.000 | | | 01/01/2010 | | Aaa/AAA* | | | 200,000 | | | 225,790 |
NC Municipal Power Agency No.1 Catawba Electric Revenue | | 5.250 | | | 01/01/2009 | | Aaa/AAA* | | | 500,000 | | | 544,195 |
North Carolina Medical Care Community Hospital-Scotland Memorial | | 5.375 | | | 10/01/2011 | | AA* | | | 60,000 | | | 61,676 |
NC Medical Care Community Hospital Wilson Memorial Hospital | | 4.900 | | | 11/01/2007 | | Aaa/AAA* | | | 75,000 | | | 80,501 |
North Carolina Medical Care Community Hospital Wayne Memorial | | 4.250 | | | 10/01/2006 | | Aaa | | | 100,000 | | | 104,455 |
North Carolina Medical Community Hospital Wayne Memorial | | 4.750 | | | 10/01/2011 | | Aaa | | | 350,000 | | | 368,589 |
North Carolina Medical Care Community Hospital Rex Healthcare | | 5.250 | | | 06/01/2008 | | Aaa/AAA* | | | 450,000 | | | 490,293 |
NC Municipal Power Agency No 1 Catawba Electric | | 5.100 | | | 01/01/2007 | | Aaa/AAA* | | | 125,000 | | | 132,498 |
North Carolina Municipal Power Agency Catawba Electric | | 6.000 | | | 01/01/2007 | | Aaa/AAA* | | | 200,000 | | | 216,828 |
Piedmont Triad NC Airport Authority Revenue Bonds Series A | | 5.250 | | | 07/01/2011 | | Aaa/AAA* | | | 200,000 | | | 217,904 |
Pitt County NC Certificates of Participation School Facilities | | 4.750 | | | 04/01/2010 | | Aaa/AAA* | | | 100,000 | | | 107,049 |
Raleigh Durham NC Airport Authority Revenue Series A | | 5.500 | | | 11/01/2007 | | Aaa/AAA* | | | 500,000 | | | 543,350 |
Randolph County NC Certificates of Participation | | 5.200 | | | 06/01/2008 | | Aaa/AAA* | | | 145,000 | | | 157,324 |
University NC System Pool Revenue Series B | | 5.000 | | | 10/01/2009 | | Aaa/AAA* | | | 200,000 | | | 216,110 |
Wilson County NC General Obligation | | 5.000 | | | 06/01/2010 | | Aaa/AAA* | | | 250,000 | | | 273,238 |
| | | | | | | | | | | | |
|
|
| | | | | | | | | | | | | | 7,691,230 |
GENERAL OBLIGATION BONDS | | | | | | | | | | | | | |
14.75% of Net Assets | | | | | | | | | | | | | |
Caldwell County NC General Obligation | | 6.000 | | | 02/01/2005 | | A1/A* | | | 50,000 | | | 50,440 |
Cary NC General Obligation | | 4.250 | | | 03/01/2008 | | Aaa/AAA* | | | 400,000 | | | 421,652 |
Durham NC Certificates of Participation | | 5.100 | | | 06/01/2005 | | Aa1/AA+* | | | 100,000 | | | 103,311 |
Forsyth County NC Public Improvement General Obligation S:A | | 4.500 | | | 03/01/2009 | | Aaa/AAA* | | | 250,000 | | | 266,553 |
Hickory NC General Obligation | | 4.300 | | | 05/01/2006 | | Aa3/AA-* | | | 80,000 | | | 83,342 |
New Hanover County NC General Obligation | | 5.300 | | | 11/01/2006 | | Aa2/AA-* | | | 150,000 | | | 160,739 |
NC State General Obligation Series A | | 4.750 | | | 04/01/2006 | | Aaa/AAA* | | | 200,000 | | | 209,490 |
North Carolina State General Obligation Series A | | 4.750 | | | 04/01/2008 | | Aa1/AAA* | | | 100,000 | | | 107,191 |
North Carolina State General Obligation Series A | | 4.750 | | | 04/01/2010 | | Aaa/AAA* | | | 100,000 | | | 106,250 |
North Carolina State Public Improvement General Obligation | | 4.500 | | | 03/01/2010 | | Aaa/AAA* | | | 150,000 | | | 159,630 |
North Carolina State Public School Building General Obligation | | 4.600 | | | 04/01/2010 | | Aaa/AAA* | | | 50,000 | | | 53,140 |
North Carolina Public School Building General Obligation | | 4.600 | | | 04/01/2011 | | Aaa/AAA* | | | 115,000 | | | 121,568 |
Wake County NC General Obligation Unlimited | | 4.500 | | | 03/01/2009 | | Aaa/AAA* | | | 250,000 | | | 261,798 |
Wake County NC General Obligation | | 4.600 | | | 03/01/2011 | | Aaa/AAA* | | | 200,000 | | | 210,048 |
| | | | | | | | | | | | |
|
|
| | | | | | | | | | | | | | 2,315,152 |
CERTIFICATES OF PARTICIPATION BONDS | | | | | | | | | | | | | |
12.94% of Net Assets | | | | | | | | | | | | | |
Cabarrus County NC Certificates of Participation | | 4.250 | | | 04/01/2007 | | Aa3/AA-* | | | 55,000 | | | 57,498 |
Cabarrus County NC Certificates of Participation | | 4.500 | | | 04/01/2009 | | Aa3/AA-* | | | 100,000 | | | 105,685 |
Charlotte NC Certificates of Participation Series D | | 5.750 | | | 06/01/2006 | | Aa1/AA+* | | | 100,000 | | | 106,849 |
Charlotte NC Certificates of Participation Series D | | 5.750 | | | 06/01/2007 | | Aa1/AA+* | | | 100,000 | | | 108,739 |
Charlotte NC Certificates of Participation Series D | | 5.750 | | | 06/01/2008 | | Aa1/AA+* | | | 100,000 | | | 110,367 |
Charlotte NC Certificates of Participation Series B | | 5.000 | | | 06/01/2007 | | Aa1/AA+* | | | 500,000 | | | 534,385 |
Charlotte NC Certificates of Participation Series B | | 5.000 | | | 06/01/2009 | | Aa1/AA+* | | | 100,000 | | | 107,894 |
Durham County Nc Certificates of Participation | | 4.750 | | | 05/01/2009 | | Aa1/AA+* | | | 210,000 | | | 224,469 |
The accompanying notes are an integral part of the financial statements.
26
DUPREE MUTUAL FUNDS—NORTH CAROLINA TAX-FREE SHORT-TO-MEDIUM SERIES
SCHEDULE OF PORTFOLIO INVESTMENTS
North Carolina Municipal Bonds—100%
June 30, 2004
| | | | | | | | | | | | | |
| Bond Description | | Coupon | | | Maturity
Date | | Rating# | | Par Value | | Market Value |
|
Durham County NC Certificates of Participation Series B | | 4.950 | % | | 12/01/2005 | | Aa1/AA+* | | $ | 130,000 | | $ | 135,730 |
Durham NC Certificates of Participation Series B | | 5.000 | | | 06/01/2008 | | Aa1/AA+* | | | 100,000 | | | 107,046 |
Durham NC Certificates of Participation | | 5.000 | | | 04/01/2010 | | Aa1/AA+* | | | 300,000 | | | 324,549 |
Forsyth County NC Certificates of Participation | | 5.000 | | | 10/01/2009 | | Aa1/AA+* | | | 100,000 | | | 108,383 |
| | | | | | | | | | | | |
|
|
| | | | | | | | | | | | | | 2,031,594 |
HOSPITAL AND HEALTHCARE REVENUE BONDS | | | | | | | | | | | | | |
11.75% of Net Assets | | | | | | | | | | | | | |
Charlotte-Mecklenburg Hospital Authority NC Health Care System | | 5.400 | | | 01/15/2007 | | Aa3/AA* | | | 200,000 | | | 212,470 |
Cumberland County NC Hospital Facility Revenue | | 4.500 | | | 10/01/2007 | | A3/A-* | | | 200,000 | | | 210,492 |
NC Community Health Care Facility Duke Hospital | | 4.100 | | | 06/01/2005 | | Aa3/AA* | | | 100,000 | | | 102,354 |
NC Medical Care Community Health Care Facility Duke University | | 4.500 | | | 06/01/2007 | | Aa3/AA* | | | 200,000 | | | 209,922 |
North Carolina Medical Care Community Hospital Novant Health | | 5.000 | | | 11/01/2008 | | Aa3/AA-* | | | 300,000 | | | 324,339 |
North Carolina Medical Care Community Hospital Pitt Memorial | | 4.400 | | | 12/01/2011 | | Aa3/AA-* | | | 275,000 | | | 282,703 |
NC Medical Care Community Hospital Gaston Memorial | | 5.250 | | | 02/15/2007 | | A1/A+* | | | 325,000 | | | 343,658 |
North Carolina Medical Care Community Hospital St Joseph | | 4.300 | | | 10/01/2007 | | Aa3/AA* | | | 150,000 | | | 157,659 |
| | | | | | | | | | | | |
|
|
| | | | | | | | | | | | | | 1,843,597 |
LEASE REVENUE BONDS | | | | | | | | | | | | | |
6.66% of Net Assets | | | | | | | | | | | | | |
Greensboro Nc Enterprise System Revenue Combination Series A | | 4.800 | | | 06/01/2012 | | Aa3/AA-* | | | 75,000 | | | 78,997 |
Greensboro NC Enterprise System Revenue Series A | | 5.000 | | | 06/01/2011 | | Aa3/AA+* | | | 500,000 | | | 542,840 |
Raleigh NC Combination Enterprise System Revenue | | 5.000 | | | 03/01/2009 | | Aa1/AAA* | | | 150,000 | | | 160,928 |
Winston Salem NC Certificates of Participation Series A | | 3.950 | | | 06/01/2009 | | Aa1/AA+* | | | 100,000 | | | 103,386 |
Winston-Salem NC Water & Sewer System Revenue | | 4.500 | | | 06/01/2011 | | Aa/AAA* | | | 150,000 | | | 158,765 |
| | | | | | | | | | | | |
|
|
| | | | | | | | | | | | | | 1,044,916 |
UNIVERSITY CONSOLIDATED EDUCATION AND BUILDING REVENUE BONDS | | | | | | | | | | | | | |
5.04% of Net Assets | | | | | | | | | | | | | |
North Carolina Raleigh State University Revenue Bonds | | 5.000 | | | 10/01/2011 | | Aa3/AA* | | | 530,000 | | | 578,023 |
University Of North Carolina Revenue Refunding Series B | | 5.000 | | | 12/01/2010 | | Aa1/AA+* | | | 195,000 | | | 212,382 |
| | | | | | | | | | | | |
|
|
| | | | | | | | | | | | | | 790,405 |
ESCROWED TO MATURITY BONDS | | | | | | | | | | | | | |
1.25% of Net Assets | | | | | | | | | | | | | |
North Carolina Municipal Power Agency No 1 Catawba Electric | | 10.500 | | | 01/01/2010 | | Aaa/AAA* | | | 160,000 | | | 196,179 |
| | | | | | | | | | | | |
|
|
| | | | | | | | | | | | | | 196,179 |
MUNICIPAL UTILITY REVENUE BONDS | | | | | | | | | | | | | |
.67% of Net Assets | | | | | | | | | | | | | |
Orange County Water & Sewer Authority Revnue | | 4.350 | | | 07/01/2010 | | Aa1/AA* | | | 100,000 | | | 105,452 |
| | | | | | | | | | | | |
|
|
| | | | | | | | | | | | | | 105,452 |
Total Investments (cost $15,838,535)(a)—102.06% of Net Assets | | | | | | | | | | | | $ | 16,018,525 |
| | | | | | | | | | | | |
|
|
| | * | Standard and Poor’s Corporation |
| | All | other ratings by Moody’s Investors Service, Inc. |
| | # | Bond ratings are unaudited. |
| (a) | Represents cost for financial reporting and federal income tax purposes and differs from market value by net unrealized appreciation of securities as follows: |
| | | | |
Unrealized appreciation | | $ | 285,433 | |
Unrealized depreciation | | | (105,443 | ) |
| | |
|
|
|
Net unrealized appreciation | | $ | 179,990 | |
| | |
|
|
|
The accompanying notes are an integral part of the financial statements.
27
DUPREE MUTUAL FUNDS—NORTH CAROLINA TAX-FREE SHORT-TO-MEDIUM SERIES
STATEMENT OF ASSETS AND LIABILITIES
JUNE 30, 2004
| | | | | | | |
ASSETS: | | | | | | | |
Investments in securities, at value (Cost: $15,838,535) | | | | | $ | 16,018,525 | |
Interest receivable | | | | | | 195,649 | |
| | | | | |
|
|
|
Total assets | | | | | | 16,214,174 | |
LIABILITIES: | | | | | | | |
Payable for: | | | | | | | |
Distributions | | $ | 42,902 | | | | |
Due custodian | | | 1,426 | | | | |
Fund shares redeemed | | | 86,179 | | | | |
Investment advisory fee | | | 3,417 | | | | |
Transfer agent fee | | | 1,920 | | | | |
Other | | | 4,067 | | | | |
Borrowings under line of credit | | | 379,000 | | | | |
| | |
|
| | | | |
Total liabilities | | | | | | 518,911 | |
| | | | | |
|
|
|
NET ASSETS: | | | | | | | |
Capital | | | | | | 15,558,587 | |
Net accumulated realized loss on investment transactions | | | | | | (43,314 | ) |
Net unrealized appreciation in value of investments | | | | | | 179,990 | |
| | | | | |
|
|
|
Net assets at value | | | | | $ | 15,695,263 | |
| | | | | |
|
|
|
NET ASSET VALUE, offering price and redemption price per share ($15,695,263–:–1,485,410 shares outstanding; unlimited number of shares authorized; no par value) | | | | | $ | 10.57 | |
| | | | | |
|
|
|
STATEMENT OF OPERATIONS
For the year ended June 30, 2004
| | | | |
Net investment income: | | | | |
Interest income | | $ | 532,556 | |
| | |
|
|
|
Expenses: | | | | |
Investment advisory fee | | | 77,222 | |
Transfer agent fee | | | 23,167 | |
Professional fees | | | 7,785 | |
Custodian and interest expense | | | 8,261 | |
Trustee fees | | | 1,466 | |
Other expenses | | | 7,652 | |
| | |
|
|
|
Total expenses | | | 125,553 | |
Expenses waived by Adviser | | | (38,376 | ) |
Custodian and interest expense reductions | | | (8,261 | ) |
| | |
|
|
|
Net expenses | | | 78,916 | |
| | |
|
|
|
Net investment income | | | 453,640 | |
| | |
|
|
|
Realized and unrealized loss on investments: | | | | |
Net realized loss | | | (15,173 | ) |
Net decrease in unrealized appreciation | | | (394,565 | ) |
| | |
|
|
|
Net realized and unrealized loss on investments | | | (409,738 | ) |
| | |
|
|
|
Net increase in net assets resulting from operations | | $ | 43,902 | |
| | |
|
|
|
The accompanying notes are an integral part of the financial statements.
28
DUPREE MUTUAL FUNDS—NORTH CAROLINA TAX-FREE SHORT-TO-MEDIUM SERIES
STATEMENTS OF CHANGES IN NET ASSETS
For the years ended June 30, 2004 and 2003
| | | | | | | | |
| | | 2004
| | | 2003
| |
Increase in net assets: | | | | | | | | |
Operations: | | | | | | | | |
Net investment income | | $ | 453,640 | | | $ | 348,919 | |
Net realized (loss)/gain on investments | | | (15,173 | ) | | | 2,510 | |
Net (decrease)/increase in unrealized appreciation | | | (394,565 | ) | | | 347,088 | |
| | |
|
|
| |
|
|
|
Net increase in net assets resulting from operations | | | 43,902 | | | | 698,517 | |
Distributions to shareholders from net investment income | | | (453,640 | ) | | | (348,919 | ) |
Net fund share transactions | | | 2,234,399 | | | | 4,261,235 | |
| | |
|
|
| |
|
|
|
Total increase | | | 1,824,661 | | | | 4,610,833 | |
Net assets: | | | | | | | | |
Beginning of year | | | 13,870,602 | | | | 9,259,769 | |
| | |
|
|
| |
|
|
|
End of year | | $ | 15,695,263 | | | $ | 13,870,602 | |
| | |
|
|
| |
|
|
|
FINANCIAL HIGHLIGHTS
Selected data for a share outstanding:
| | | | | | | | | | | | | | | | | | | | |
| | | For the years ended June 30,
| |
| | | 2004
| | | 2003
| | | 2002
| | | 2001
| | | 2000
| |
Net asset value, beginning of year | | $ | 10.85 | | | $ | 10.47 | | | $ | 10.25 | | | $ | 9.94 | | | $ | 10.09 | |
| | |
|
|
| |
|
|
| |
|
|
| |
|
|
| |
|
|
|
Income from investment operations: | | | | | | | | | | | | | | | | | | | | |
Net investment income | | | 0.32 | | | | 0.35 | | | | 0.38 | | | | 0.40 | | | | 0.39 | |
Net gains/(losses) on securities, both realized and unrealized | | | (0.28 | ) | | | 0.38 | | | | 0.22 | | | | 0.31 | | | | (0.15 | ) |
| | |
|
|
| |
|
|
| |
|
|
| |
|
|
| |
|
|
|
Total from investment operations | | | 0.04 | | | | 0.73 | | | | 0.60 | | | | 0.71 | | | | 0.24 | |
Less distributions: | | | | | | | | | | | | | | | | | | | | |
Distributions from net investment income | | | (0.32 | ) | | | (0.35 | ) | | | (0.38 | ) | | | (0.40 | ) | | | (0.39 | ) |
| | |
|
|
| |
|
|
| |
|
|
| |
|
|
| |
|
|
|
Net asset value, end of year | | $ | 10.57 | | | $ | 10.85 | | | $ | 10.47 | | | $ | 10.25 | | | $ | 9.94 | |
| | |
|
|
| |
|
|
| |
|
|
| |
|
|
| |
|
|
|
Total return | | | 0.33 | % | | | 7.10 | % | | | 5.99 | % | | | 7.24 | % | | | 2.47 | % |
Net assets, end of year (in thousands) | | $ | 15,695 | | | $ | 13,871 | | | $ | 9,260 | | | $ | 4,875 | | | $ | 4,246 | |
Ratio of net expenses to average net assets (a) | | | 0.51 | % | | | 0.50 | % | | | 0.48 | % | | | 0.48 | % | | | 0.48 | % |
Ratio of net investment income to average net assets | | | 2.94 | % | | | 3.28 | % | | | 3.69 | % | | | 3.93 | % | | | 3.94 | % |
Portfolio turnover | | | 8.37 | % | | | 19.12 | % | | | 13.65 | % | | | 7.29 | % | | | 25.85 | % |
| (a) | Percentages are after expenses waived by Adviser and custodian and interest expense reductions. |
Expenses waived by Adviser and custodian and interest expense reductions were:
.25% and .05% for 2004, .26% and .04% for 2003, .31% and .07% for 2002, ..30%,.11% for 2001, and .32% and .11% for 2000, respectively.
The accompanying notes are an integral part of the financial statements.
29
DUPREE MUTUAL FUNDS—TENNESEE TAX-FREE INCOME SERIES
SCHEDULE OF PORTFOLIO INVESTMENTS
Tennesee Municipal Bonds—100%
June 30, 2004
| | | | | | | | | | | | | |
| Bond Description | | Coupon | | | Maturity Date | | Rating# | | Par Value | | Market Value |
|
INSURED MUNICIPAL REVENUE BONDS | | | | | | | | | | | | | |
39.07% of Net Assets | | | | | | | | | | | | | |
Clarksville TN Water Sewer & Gas Revenue | | 5.650 | % | | 02/01/2017 | | Aaa | | $ | 200,000 | | $ | 217,316 |
Franklin TN Industrial Development Board Landings Apartment | | 5.550 | | | 10/01/2008 | | Aaa/AAA* | | | 50,000 | | | 53,712 |
Franklin TN Industrial Development Board Landings Apartment | | 5.900 | | | 10/01/2016 | | Aaa/AAA* | | | 800,000 | | | 836,040 |
Giles County TN | | 4.500 | | | 02/01/2018 | | Aaa | | | 1,000,000 | | | 1,001,370 |
Greater Tennessee Housing Assistance Refunding | | 7.250 | | | 07/01/2024 | | Aaa/AAA* | | | 5,000 | | | 5,006 |
Hawkins County TN Refunding General Obligation | | 4.750 | | | 05/01/2017 | | AAA* | | | 200,000 | | | 204,851 |
Jackson TN Hospital Revenue Refunding & Improvement | | 5.625 | | | 04/01/2015 | | Aaa/AAA* | | | 310,000 | | | 324,930 |
Johnson City TN Health & Educational Facilities | | 6.500 | | | 07/01/2014 | | Aaa/AAA* | | | 1,000,000 | | | 1,181,790 |
Kingsport TN Water & Sewer System | | 4.350 | | | 06/01/2017 | | Aaa | | | 710,000 | | | 707,890 |
Kingsport TN Industrial Development Board Multifamily | | 5.400 | | | 04/20/2021 | | AAA* | | | 500,000 | | | 520,740 |
Knox County TN Health Educational & Housing Facilities Baptist | | 5.500 | | | 04/15/2017 | | Baa/AAA* | | | 1,315,000 | | | 1,390,047 |
Knox County TN Health Educational & Housing Facilities Ft Sanders | | 6.250 | | | 01/01/2013 | | Aaa/AAA* | | | 10,000 | | | 11,545 |
Knox County TN Health Educational & Housing Facilities | | 5.000 | | | 01/01/2022 | | AAA* | | | 1,000,000 | | | 1,006,190 |
Knox County TN Utility District Water & Sewer | | 5.625 | | | 12/01/2019 | | Aaa | | | 400,000 | | | 434,619 |
Knoxville TN Gas Revenue—Series K | | 4.750 | | | 03/01/2020 | | Aaa/AAA* | | | 1,500,000 | | | 1,506,600 |
Knoxville TN Wastewater System Revenue—Series A | | 4.750 | | | 04/01/2021 | | Aaa/AAA | | | 1,150,000 | | | 1,145,964 |
Metropolitan Nashville & Davidson County TN Adventist System | | 5.750 | | | 11/15/2025 | | Aaa/AAA | | | 1,150,000 | | | 1,199,496 |
Metropolitan Nashville & Davidson County TN Stadium Project | | 5.750 | | | 07/01/2014 | | Aaa/AAA | | | 100,000 | | | 107,834 |
Metropolitan Nashville & Davidson County TN Stadium Project | | 5.875 | | | 07/01/2021 | | Aaa/AAA | | | 350,000 | | | 376,765 |
Metropolitan Nashville & Davidson County TN Water & Sewer | | 5.000 | | | 01/01/2017 | | Aaa/AAA | | | 1,000,000 | | | 1,038,750 |
Montgomery County TN | | 4.750 | | | 05/01/2016 | | Aaa | | | 1,850,000 | | | 1,929,976 |
Montgomery County TN | | 4.750 | | | 05/01/2020 | | Aaa | | | 1,000,000 | | | 1,003,970 |
North Anderson TN Utility District Waterworks Revenue | | 5.600 | | | 01/01/2015 | | Aaa/AAA* | | | 100,000 | | | 104,093 |
Oak Ridge TN Industrial Development Board Refunding Revenue | | 5.250 | | | 08/20/2018 | | Aaa | | | 265,000 | | | 271,601 |
Overton County TN Refunding—Schools | | 5.000 | | | 04/01/2018 | | Aaa | | | 1,000,000 | | | 1,047,040 |
Robertson County TN | | 4.500 | | | 06/01/2015 | | Aaa | | | 1,750,000 | | | 1,806,525 |
Sevier County TN Public Buildings Auth Solid Waste Facility | | 5.600 | | | 09/01/2015 | | Aaa/AAA* | | | 100,000 | | | 103,687 |
Shelby County TN Health Educational & Housing Heritage Place | | 6.900 | | | 07/01/2014 | | Aaa/AAA* | | | 145,000 | | | 148,876 |
Shelby County TN Health Educational & Housing Methodist | | 5.300 | | | 08/01/2015 | | Aaa/AAA* | | | 650,000 | | | 679,686 |
Shelby County TN Health Educational & Housing Methodist | | 5.375 | | | 04/01/2013 | | Aaa/AAA* | | | 690,000 | | | 746,463 |
Shelby County TN Health Educational & Housing Methodist | | 5.000 | | | 04/01/2018 | | Aaa/AAA* | | | 500,000 | | | 516,590 |
Sullivan County TN Health Educational & Housing Facilities | | 5.000 | | | 09/01/2016 | | AA* | | | 1,000,000 | | | 1,023,570 |
Sullivan County TN Health Educational & Housing Wellmont | | 5.000 | | | 09/01/2017 | | AA* | | | 2,500,000 | | | 2,534,700 |
Sullivan County TN Health Educational & Housing Facilities | | 4.500 | | | 09/01/2019 | | AA* | | | 1,000,000 | | | 940,110 |
TN Housing Development Agency Homeownership Program | | 5.900 | | | 07/01/2017 | | Aaa/AAA* | | | 30,000 | | | 30,401 |
TN Housing Development Agency Mortgage Finance Program | | 6.200 | | | 07/01/2018 | | Aaa/AAA* | | | 320,000 | | | 330,595 |
Wilson County TN Referendum | | 5.000 | | | 04/01/2018 | | Aaa | | | 1,000,000 | | | 1,053,790 |
| | | | | | | | | | | | |
|
|
| | | | | | | | | | | | | | 27,543,128 |
HOSPITAL AND HEALTHCARE REVENUE BONDS | | | | | | | | | | | | | |
17.31% of Net Assets | | | | | | | | | | | | | |
Chattanooga TN Health Educational & Housing Revenue | | 5.000 | | | 12/01/2018 | | Aa3/AA-* | | | 1,000,000 | | | 1,009,130 |
Knox County TN Health—Fort Sanders Alliance | | 5.250 | | | 01/01/2015 | | Aaa/AAA* | | | 2,175,000 | | | 2,334,819 |
Knox County TN Health Educational & Housing Facilities | | 5.750 | | | 04/01/2019 | | Baa1 | | | 1,000,000 | | | 1,028,020 |
Metropolitan Nashville & Davidson County TN Adventist System | | 6.250 | | | 11/15/2015 | | A3/A* | | | 1,100,000 | | | 1,201,728 |
Metropolitan Nashville & Davidson County TN Modal | | 5.500 | | | 05/01/2023 | | AA* | | | 2,255,000 | | | 2,310,360 |
Metropolitan Nashville & Davidson County TN Open Arms | | 5.100 | | | 08/01/2016 | | AA* | | | 2,500,000 | | | 2,559,975 |
Metropolitan Nashville & Davidson County TN Open Arms | | 5.100 | | | 08/01/2019 | | AA* | | | 1,660,000 | | | 1,681,281 |
Sumner County TN Health Educational & Housing Sumner Health | | 7.500 | | | 11/01/2014 | | A-* | | | 75,000 | | | 77,381 |
| | | | | | | | | | | | |
|
|
| | | | | | | | | | | | | | 12,202,694 |
GENERAL OBLIGATION BONDS | | | | | | | | | | | | | |
13.59% of Net Assets | | | | | | | | | | | | | |
Franklin TN School District Limited Tax Refunding | | 4.625 | | | 06/01/2018 | | Aa2 | | | 1,000,000 | | | 1,019,510 |
Johnson City TN General Obligation | | 5.500 | | | 05/01/2020 | | Aaa/AAA* | | | 300,000 | | | 319,389 |
Memphis TN General Obligation | | 5.250 | | | 04/01/2016 | | Aa2/AA* | | | 610,000 | | | 648,345 |
Memphis TN Referendum—General Improvement | | 5.000 | | | 11/01/2015 | | Aa2/AA* | | | 1,250,000 | | | 1,344,063 |
Memphis TN General Improvement | | 5.000 | | | 11/01/2021 | | Aa2/AA* | | | 1,500,000 | | | 1,535,835 |
Memphis TN General Improvement | | 5.000 | | | 05/01/2020 | | Aa2/AA* | | | 2,000,000 | | | 2,057,420 |
Metropolitan Nashville & Davidson County TN General Obligation | | 5.125 | | | 11/15/2019 | | Aa2/AA* | | | 500,000 | | | 518,765 |
Metropolitan Nashville & Davidson County TN General Obligation | | 5.875 | | | 05/15/2026 | | Aa/AA* | | | 100,000 | | | 106,657 |
Shelby County TN General Obligation | | 5.625 | | | 04/01/2014 | | Aa3/AA+* | | | 60,000 | | | 62,405 |
Shelby County TN—Series A | | 4.600 | | | 11/01/2022 | | Aa2/AA+* | | | 500,000 | | | 492,660 |
Williamson County TN Refunding General Obligation | | 5.000 | | | 03/01/2020 | | Aa1 | | | 645,000 | | | 675,721 |
The accompanying notes are an integral part of the financial statements.
30
DUPREE MUTUAL FUNDS—TENNESEE TAX-FREE INCOME SERIES
SCHEDULE OF PORTFOLIO INVESTMENTS
Tennesee Municipal Bonds—100%
June 30, 2004
| | | | | | | | | | | | | |
| Bond Description | | Coupon | | | Maturity Date | | Rating# | | Par Value | | Market Value |
|
Wilson County TN General Obligation Refunding | | 5.100 | % | | 05/01/2016 | | Aaa | | $ | 745,000 | | $ | 799,303 |
| | | | | | | | | | | | |
|
|
| | | | | | | | | | | | | | 9,580,073 |
STATE AND LOCAL MORTGAGE REVENUE | | | | | | | | | | | | | |
9.41% of Net Assets | | | | | | | | | | | | | |
Hamilton County TN Multifamily Housing Revenue | | 6.700 | | | 03/01/2021 | | A* | | | 450,000 | | | 423,320 |
Memphis TN Health Education & Housing Board River Trace II | | 6.250 | | | 10/01/2013 | | Aaa | | | 50,000 | | | 51,259 |
Shelby County TN Health Educational & Housing Cameron Kirby | | 5.900 | | | 07/01/2018 | | BBB-* | | | 800,000 | | | 730,240 |
Shelby County TN Health Educational & Housing Cameron Kirby | | 6.000 | | | 07/01/2028 | | BBB-* | | | 500,000 | | | 443,850 |
TN Housing Development Agency Homeownership Program | | 5.850 | | | 01/01/2011 | | Aa2/AA* | | | 200,000 | | | 205,150 |
TN Housing Development Agency Homeownership Program | | 5.500 | | | 07/01/2020 | | Aa2/AA* | | | 1,055,000 | | | 1,092,558 |
TN Housing Development Agency Series 2001 | | 5.250 | | | 01/01/2020 | | Aa2/AA* | | | 635,000 | | | 651,447 |
TN Housing Development Agency Mortgage Financing Series A | | 5.200 | | | 07/01/2023 | | Aa2/AA* | | | 3,000,000 | | | 3,036,540 |
| | | | | | | | | | | | |
|
|
| | | | | | | | | | | | | | 6,634,364 |
MUNICIPAL UTILITY REVENUE BONDS | | | | | | | | | | | | | |
8.25% of Net Assets | | | | | | | | | | | | | |
Chattanooga TN Electric System Revenue | | 5.250 | | | 09/01/2021 | | AA* | | | 1,500,000 | | | 1,553,370 |
Clarksville TN Water Sewer & Gas Revenue | | 5.250 | | | 02/01/2018 | | Aaa | | | 1,000,000 | | | 1,051,720 |
Knoxville TN Gas System Revenue Bond Series J | | 5.000 | | | 03/01/2017 | | Aa3/AA* | | | 700,000 | | | 722,953 |
Knoxville TN Waste Water System Revenue | | 5.100 | | | 04/01/2018 | | Aa3/AA* | | | 435,000 | | | 449,042 |
Metropoliton Nashville & Davidson County TN Electric System | | 5.125 | | | 05/15/2016 | | Aa3/AA* | | | 700,000 | | | 734,482 |
Metropolitan Nashville & Davidson County TN Electric System | | 5.125 | | | 05/15/2021 | | Aa/AA* | | | 1,085,000 | | | 1,118,841 |
Metropolitan Nashville & Davidson County TN Water & Sewer | | 5.500 | | | 01/01/2016 | | Aa3/A+* | | | 185,000 | | | 185,688 |
| | | | | | | | | | | | |
|
|
| | | | | | | | | | | | | | 5,816,096 |
PREREFUNDED BONDS | | | | | | | | | | | | | |
6.62% of Net Assets | | | | | | | | | | | | | |
Cookeville TN Industrial Development Board General Hospital | | 5.625 | | | 10/01/2016 | | A- | | | 200,000 | | | 219,148 |
Jackson TN Water & Sewer Revenue | | 7.200 | | | 07/01/2012 | | Aaa/AAA* | | | 5,000 | | | 5,722 |
Johnson City TN Health & Educational Facilities | | 5.125 | | | 07/01/2025 | | AAA* | | | 2,000,000 | | | 2,050,520 |
Marion County TN General Obligation | | 6.000 | | | 04/01/2018 | | Aaa | | | 950,000 | | | 1,071,268 |
Metropolitan Nashville & Davidson County TN Water & Sewer | | 6.500 | | | 12/01/2014 | | Aaa/AAA* | | | 60,000 | | | 72,677 |
Shelby County TN General Obligation | | 5.625 | | | 04/01/2014 | | AA+* | | | 20,000 | | | 20,843 |
TN Local Development Authority Community Provider Pooled Loan Program | | 6.250 | | | 10/01/2009 | | A-* | | | 30,000 | | | 30,971 |
TN Local Development Authority Community Provider Pooled Loan Program | | 6.450 | | | 10/01/2014 | | A-* | | | 40,000 | | | 41,347 |
Williamson County TN General Obligation | | 5.375 | | | 03/01/2019 | | Aa1 | | | 1,000,000 | | | 1,106,990 |
Williamson County TN General Obligation | | 5.600 | | | 09/01/2010 | | Aa | | | 45,000 | | | 46,238 |
| | | | | | | | | | | | |
|
|
| | | | | | | | | | | | | | 4,665,724 |
UNIVERSITY CONSOLIDATED EDUCATION AND BUILDING REVENUE BONDS | | | | | | | | | | | |
2.49% of Net Assets | | | | | | | | | | | | | |
Metropolitan Nashville & Davidson County TN Belmont University | | 6.300 | | | 12/01/2014 | | Baa3 | | | 10,000 | | | 10,293 |
Metropolitan Nashville & Davidson County TN McKendree | | 5.125 | | | 01/01/2020 | | AA* | | | 1,700,000 | | | 1,744,047 |
| | | | | | | | | | | | |
|
|
| | | | | | | | | | | | | | 1,754,340 |
ESCROWED TO MATURITY BONDS | | | | | | | | | | | | | |
1.77% of Net Assets | | | | | | | | | | | | | |
Johnson City TN Health & Educational Revenue | | 5.000 | | | 07/01/2018 | | AAA* | | | 1,000,000 | | | 1,034,550 |
Metropolitan Nashville & Davidson County TN Dandridge Tower | | 6.375 | | | 01/01/2011 | | A* | | | 200,000 | | | 216,364 |
| | | | | | | | | | | | |
|
|
| | | | | | | | | | | | | | 1,250,914 |
INDUSTRIAL REVENUE AND POLLUTION CONTROL REVENUE BONDS | | | | | | | | | | | | | |
0.43% of Net Assets | | | | | | | | | | | | | |
Chattanooga TN Industrial Development Board F L Haney Co | | 7.200 | | | 08/15/2010 | | AAA* | | | 20,000 | | | 24,182 |
Chattanooga TN Industrial Development Board F L Haney Co | | 7.200 | | | 02/15/2009 | | AAA* | | | 25,000 | | | 29,337 |
Chattanooga TN Industrial Development Board F L Haney Co | | 7.200 | | | 08/15/2009 | | AAA* | | | 25,000 | | | 29,730 |
Chattanooga TN Industrial Development Board F L Haney Co | | 7.200 | | | 02/15/2010 | | AAA* | | | 100,000 | | | 119,188 |
Maury County TN Pollution Control Revenue Saturn Corporation Project | | 6.500 | | | 09/01/2024 | | Baa1/BBB* | | | 100,000 | | | 102,530 |
| | | | | | | | | | | | |
|
|
| | | | | | | | | | | | | | 304,967 |
LEASE REVENUE BONDS | | | | | | | | | | | | | |
0.61% of Net Assets | | | | | | | | | | | | | |
Memphis/Shelby County TN Special Facilities Revenue FedEx | | 5.050 | | | 09/01/2012 | | Baa/BBB* | | | 250,000 | | | 259,470 |
| | | | | | | | | | | | |
|
|
| | | | | | | | | | | | | | 259,470 |
| | | | | | | | | | | | |
|
|
Total Investments (cost $69,083,262)(a)—99.55% of Net Assets | | | | | | | | | | | | $ | 70,011,770 |
| | | | | | | | | | | | |
|
|
The accompanying notes are an integral part of the financial statements.
31
DUPREE MUTUAL FUNDS—TENNESEE TAX-FREE INCOME SERIES
SCHEDULE OF PORTFOLIO INVESTMENTS
Tennesee Municipal Bonds—100%
June 30, 2004
| | * | Standard and Poor’s Corporation |
| | All | other ratings by Moody’s Investors Service, Inc. |
| | # | Bond ratings are unaudited. |
| (a) | Represents cost for financial reporting and federal income tax purposes and differs from market value by net unrealized appreciation of securities as follows: |
| | | | |
Unrealized appreciation | | $ | 1,731,965 | |
Unrealized depreciation | | | (803,457 | ) |
| | |
|
|
|
Net unrealized appreciation | | $ | 928,508 | |
| | |
|
|
|
The accompanying notes are an integral part of the financial statements.
32
DUPREE MUTUAL FUNDS—TENNESSEE TAX-FREE INCOME SERIES
STATEMENT OF ASSETS AND LIABILITIES
JUNE 30, 2004
| | | | | | | |
ASSETS: | | | | | | | |
Investments in securities, at value (Cost: $69,083,262) | | | | | $ | 70,011,770 | |
Cash | | | | | | 54,251 | |
Receivable from investments sold | | | | | | 5,000 | |
Prepaid expenses | | | | | | 12,072 | |
Interest receivable | | | | | | 1,142,675 | |
| | | | | |
|
|
|
Total assets | | | | | | 71,225,768 | |
LIABILITIES: | | | | | | | |
Payable for: | | | | | | | |
Distributions | | $ | 690,167 | | | | |
Investment advisory fee | | | 28,806 | | | | |
Transfer agent fee | | | 7,405 | | | | |
Total liabilities | | | | | | 726,378 | |
| | | | | |
|
|
|
NET ASSETS: | | | | | | | |
Capital | | | | | | 70,736,336 | |
Net accumulated realized loss on investment transactions | | | | | | (1,165,454 | ) |
Net unrealized appreciation in value of investments | | | | | | 928,508 | |
| | | | | |
|
|
|
Net assets at value | | | | | $ | 70,499,390 | |
| | | | | |
|
|
|
NET ASSET VALUE, offering price and redemption price per share ($70,499,390 –:– 6,486,766 shares outstanding; unlimited number of shares authorized; no par value) | | | | | $ | 10.87 | |
| | | | | |
|
|
|
STATEMENT OF OPERATIONS
For the year ended June 30, 2004
| | | | |
Net investment income: | | | | |
Interest income | | $ | 3,142,344 | |
| | |
|
|
|
Expenses: | | | | |
Investment advisory fee | | | 331,799 | |
Transfer agent fee | | | 85,632 | |
Professional fees | | | 9,290 | |
Custodian and interest expense | | | 15,462 | |
Trustee fees | | | 6,282 | |
Other expenses | | | 12,952 | |
| | |
|
|
|
Total expenses | | | 461,417 | |
Custodian and interest expense reductions | | | (15,462 | ) |
| | |
|
|
|
Net expenses | | | 445,955 | |
| | |
|
|
|
Net investment income | | | 2,696,389 | |
| | |
|
|
|
Realized and unrealized loss on investments: | | | | |
Net realized loss | | | (251,994 | ) |
Net decrease in unrealized appreciation | | | (2,205,607 | ) |
| | |
|
|
|
Net realized and unrealized loss on investments | | | (2,457,601 | ) |
| | |
|
|
|
Net increase in net assets resulting from operations | | $ | 238,788 | |
| | |
|
|
|
The accompanying notes are an integral part of the financial statements.
33
DUPREE MUTUAL FUNDS—TENNESSEE TAX-FREE INCOME SERIES
STATEMENTS OF CHANGES IN NET ASSETS
For the years ended June 30, 2004 and 2003
| | | | | | | | |
| | | 2004
| | | 2003
| |
Increase in net assets: | | | | | | | | |
Operations: | | | | | | | | |
Net investment income | | $ | 2,696,389 | | | $ | 2,359,370 | |
Net realized loss on investments | | | (251,994 | ) | | | (22,866 | ) |
Net (decrease)/increase in unrealized appreciation | | | (2,205,607 | ) | | | 2,154,371 | |
| | |
|
|
| |
|
|
|
Net increase in net assets resulting from operations | | | 238,788 | | | | 4,490,875 | |
Distributions to shareholders from net investment income | | | (2,696,389 | ) | | | (2,359,370 | ) |
Net fund share transactions | | | 14,141,127 | | | | 8,157,141 | |
| | |
|
|
| |
|
|
|
Total increase | | | 11,683,526 | | | | 10,288,646 | |
Net assets: | | | | | | | | |
Beginning of year | | | 58,815,864 | | | | 48,527,218 | |
| | |
|
|
| |
|
|
|
End of year | | $ | 70,499,390 | | | $ | 58,815,864 | |
| | |
|
|
| |
|
|
|
FINANCIAL HIGHLIGHTS
Selected data for a share outstanding:
| | | | | | | | | | | | | | | | | | | | |
| | | For the years ended June 30,
| |
| | | 2004
| | | 2003
| | | 2002
| | | 2001
| | | 2000
| |
Net asset value, beginning of year | | $ | 11.26 | | | $ | 10.82 | | | $ | 10.72 | | | $ | 10.32 | | | $ | 10.77 | |
| | |
|
|
| |
|
|
| |
|
|
| |
|
|
| |
|
|
|
Income from investment operations: | | | | | | | | | | | | | | | | | | | | |
Net investment income | | | 0.45 | | | | 0.48 | | | | 0.52 | | | | 0.52 | | | | 0.53 | |
Net gains/(losses) on securities, both realized and unrealized | | | (0.39 | ) | | | 0.44 | | | | 0.10 | | | | 0.40 | | | | (0.45 | ) |
| | |
|
|
| |
|
|
| |
|
|
| |
|
|
| |
|
|
|
Total from investment operations | | | 0.06 | | | | 0.92 | | | | 0.62 | | | | 0.92 | | | | 0.08 | |
Less distributions: | | | | | | | | | | | | | | | | | | | | |
Distributions from net investment income | | | (0.45 | ) | | | (0.48 | ) | | | (0.52 | ) | | | (0.52 | ) | | | (0.53 | ) |
| | |
|
|
| |
|
|
| |
|
|
| |
|
|
| |
|
|
|
Net asset value, end of year | | $ | 10.87 | | | $ | 11.26 | | | $ | 10.82 | | | $ | 10.72 | | | $ | 10.32 | |
| | |
|
|
| |
|
|
| |
|
|
| |
|
|
| |
|
|
|
Total return | | | 0.55 | % | | | 8.65 | % | | | 5.85 | % | | | 9.08 | % | | | 0.84 | % |
Net assets, end of year (in thousands) | | $ | 70,499 | | | $ | 58,816 | | | $ | 48,527 | | | $ | 45,035 | | | $ | 40,524 | |
Ratio of net expenses to average net assets (a) | | | 0.67 | % | | | 0.65 | % | | | 0.54 | % | | | 0.54 | % | | | 0.54 | % |
Ratio of net investment income to average net assets | | | 4.05 | % | | | 4.32 | % | | | 4.77 | % | | | 4.90 | % | | | 5.09 | % |
Portfolio turnover | | | 16.11 | % | | | 8.36 | % | | | 11.85 | % | | | 22.31 | % | | | 8.80 | % |
| (a) | Percentages are after expenses waived by Adviser and custodian and interest expense reductions. |
Expenses waived by Adviser and custodian and interest expense reductions were:
0% and .03% for 2004, .01% and .02% for 2003, .16% and .02% for 2002, .15%, .02% for 2001, and .13% and .02% for 2000, respectively.
The accompanying notes are an integral part of the financial statements.
34
DUPREE MUTUAL FUNDS—TENNESEE TAX-FREE SHORT-TO-MEDIUM SERIES
SCHEDULE OF PORTFOLIO INVESTMENTS
Tennesee Municipal Bonds—100%
June 30, 2004
| | | | | | | | | | | | | |
| Bond Description | | Coupon | | | Maturity
Date | | Rating# | | Par Value | | Market Value |
|
INSURED MUNICIPAL REVENUE BONDS | | | | | | | | | | | | | |
56.67% of Net Assets | | | | | | | | | | | | | |
Chattanooga-Hamilton County TN Hospital Authority Erlanger | | 5.625 | % | | 10/01/2009 | | Aaa/AAA* | | $ | 715,000 | | $ | 791,619 |
Chattanooga-Hamilton County TN Hospital Authority Erlanger | | 4.250 | | | 10/01/2006 | | Aaa/AAA* | | | 50,000 | | | 52,127 |
Columbia Tn Waterworks Revenue | | 5.000 | | | 12/01/2008 | | Aaa/AAA* | | | 100,000 | | | 108,089 |
Gatlinburg TN General Obligation | | 5.000 | | | 05/01/2008 | | Aaa/AAA* | | | 100,000 | | | 106,623 |
Hardeman County TN Corrctional Facility Revenue | | 7.000 | | | 08/01/2005 | | A/A* | | | 240,000 | | | 251,837 |
Hawkins County TN General Obligation | | 4.500 | | | 05/01/2008 | | Aaa/AAA* | | | 315,000 | | | 333,982 |
Johnson City TN General Obligation | | 5.250 | | | 06/01/2008 | | Aaa/AAA* | | | 125,000 | | | 136,143 |
Knox County TN Health Education & Housing Facilities Board | | 5.500 | | | 04/15/2011 | | Baa/AAA* | | | 300,000 | | | 323,544 |
Knox County TN Health Education & Housing Baptist Health System | | 5.000 | | | 04/15/2006 | | Aaa/AAA* | | | 100,000 | | | 104,997 |
Marshall County TN General Obligation | | 4.450 | | | 12/01/2010 | | Aaa/AAA* | | | 270,000 | | | 287,337 |
Maury County TN General Obligation Bond | | 5.000 | | | 04/01/2009 | | Aaa/AAA* | | | 750,000 | | | 812,834 |
Memphis-Shelby County TN Sports Arena Project Series A | | 3.800 | | | 11/01/2008 | | Aaa/AAA* | | | 250,000 | | | 257,963 |
Memphis-Shelby Tn Sports Authority Memphis Arena Project | | 5.500 | | | 11/01/2012 | | Aaa/AAA* | | | 500,000 | | | 560,215 |
Memphis-Shelby County TN Sports Authority Memphis Arena | | 5.000 | | | 11/01/2008 | | Aaa/AAA* | | | 150,000 | | | 162,044 |
Memphis TN Electric System Revenue Series A | | 5.000 | | | 12/01/2009 | | Aaa/AAA* | | | 200,000 | | | 216,946 |
Memphis TN Sanitation Sewer Revenue | | 5.000 | | | 10/01/2008 | | Aaa/AAA* | | | 350,000 | | | 377,591 |
Metropolitan Government of Nashville & Davidson County Housing | | 5.500 | | | 01/01/2007 | | Aaa/AAA* | | | 400,000 | | | 419,988 |
Montgomery County TN General Obligation | | 5.250 | | | 05/01/2007 | | Aaa | | | 400,000 | | | 430,032 |
Municipal Energy Acquisition Corporation TN Gas Revenue | | 4.125 | | | 03/01/2008 | | Aaa/AAA* | | | 250,000 | | | 261,200 |
Municipal Energy Acquisition Gas Corporation Revenue | | 4.125 | | | 03/01/2009 | | Aaa/AAA* | | | 200,000 | | | 208,750 |
Oak Ridge TN General Obligation Unlimited | | 4.500 | | | 04/01/2007 | | Aaa/AAA* | | | 220,000 | | | 231,686 |
Shelby County TN Methodist Hospital Healthcare Revenue | | 5.500 | | | 04/01/2008 | | Aaa/AAA* | | | 250,000 | | | 272,663 |
Shelby County TN Health Education & Housing Facility Rhodes College | | 4.500 | | | 08/01/2008 | | Aaa/AAA* | | | 100,000 | | | 105,528 |
Shelby County TN Health Education & Housing Facility Rhodes College | | 4.500 | | | 08/01/2009 | | Aaa/AAA* | | | 100,000 | | | 105,818 |
Shelby County TN Health Education & Housing Facility Rhodes College | | 4.350 | | | 08/01/2006 | | Aaa/AAA* | | | 100,000 | | | 104,400 |
Sullivan County TN Wellmont Hospital Health System Project | | 3.000 | | | 09/01/2009 | | Aa/AA* | | | 475,000 | | | 460,997 |
Sullivan County TN Health Educational & Housing Facility Board | | 5.000 | | | 09/01/2011 | | AA* | | | 335,000 | | | 355,897 |
Tennergy Corporation TN Gas Revenue | | 5.000 | | | 06/01/2008 | | Aaa/AAA* | | | 500,000 | | | 539,390 |
Tennergy Corporation TN Gas Revenue | | 5.000 | | | 06/01/2009 | | Aaa/AAA* | | | 650,000 | | | 703,151 |
Tennergy Corporation TN Gas Revenue | | 4.125 | | | 06/01/2009 | | Aaa/AAA* | | | 100,000 | | | 104,468 |
Tennessee Energy Acquisition Corporation Gas Revenue | | 4.400 | | | 09/01/2006 | | Aaa/AAA* | | | 100,000 | | | 104,655 |
TN Energy Acquisition Corporation Gas Revenue Series A | | 5.000 | | | 09/01/2007 | | Aaa/AAA* | | | 610,000 | | | 654,237 |
Tennessee Energy Acquisition Corporation Gas Revenue | | 5.000 | | | 09/01/2007 | | Aaa/AAA* | | | 300,000 | | | 321,756 |
TN Energy Acquisition Corporation Gas Revenue Series B | | 4.500 | | | 09/01/2008 | | Aaa/AAA* | | | 295,000 | | | 311,974 |
TN State General Obligation Series A | | 5.250 | | | 02/01/2008 | | Aaa/AAA* | | | 140,000 | | | 151,920 |
Wilson County TN General Obligation | | 5.000 | | | 04/01/2013 | | Aaa/AAA* | | | 720,000 | | | 779,314 |
| | | | | | | | | | | | |
|
|
| | | | | | | | | | | | | | 11,511,715 |
GENERAL OBLIGATION BONDS | | | | | | | | | | | | | |
21.79% of Net Assets | | | | | | | | | | | | | |
Chattanooga TN General Obligation Unlimited | | 5.500 | | | 09/01/2010 | | Aa2/AA* | | | 500,000 | | | 557,675 |
Hamilton County TN General Obligation Series A | | 4.550 | | | 08/01/2009 | | Aa1 | | | 100,000 | | | 105,021 |
Shelby County TN Public Improvement & Schools | | 5.000 | | | 04/01/2008 | | Aa2/AA* | | | 1,000,000 | | | 1,077,430 |
Knox County TN Public Improvement General Obligation | | 5.100 | | | 05/01/2008 | | Aa2/AA* | | | 90,000 | | | 97,408 |
Madison County TN General Obligation | | 4.000 | | | 04/01/2014 | | Aa3 | | | 700,000 | | | 695,492 |
Metropolitan Government Nashville & Davidson County TN General Obligation | | 4.250 | | | 11/15/2007 | | Aa2/AA* | | | 100,000 | | | 105,263 |
Metropolitan Government Nashville & Davidson County TN General Obligation | | 5.125 | | | 11/15/2013 | | Aa2/AA* | | | 300,000 | | | 322,239 |
Metropolitan Government Nashville & Davidson County TN General Obligation | | 5.250 | | | 10/15/2009 | | Aa2/AA* | | | 500,000 | | | 547,980 |
Rutherford County TN General Obligation | | 5.000 | | | 04/01/2009 | | Aa2/AA* | | | 250,000 | | | 271,405 |
Rutherford County TN Public Improvement General Obligation | | 4.250 | | | 04/01/2009 | | Aa2/AA* | | | 200,000 | | | 210,084 |
Shelby County TN Public Improvement General Obligation | | 5.500 | | | 04/01/2009 | | Aa3/AA+* | | | 100,000 | | | 110,525 |
Tennessee State General Obligation Series B | | 5.000 | | | 05/01/2009 | | Aa2/AA* | | | 300,000 | | | 325,263 |
| | | | | | | | | | | | |
|
|
| | | | | | | | | | | | | | 4,425,785 |
HOSPITAL AND HEALTHCARE REVENUE BONDS | | | | | | | | | | | | | |
4.69% of Net Assets | | | | | | | | | | | | | |
Chattanooga TN Catholic Health Initiatives Series A | | 5.500 | | | 12/01/2006 | | Aa2/AA* | | | 700,000 | | | 749,154 |
Knox County TN Hospital Facility Revenue Catholic Healthcare | | 4.500 | | | 10/01/2011 | | A1/AA-* | | | 100,000 | | | 102,418 |
Metropolitan Government Nashville & Davidson Counties TN | | 4.300 | | | 08/01/2004 | | AA* | | | 100,000 | | | 100,237 |
| | | | | | | | | | | | |
|
|
| | | | | | | | | | | | | | 951,809 |
UNIVERSITY CONSOLIDATED EDUCATION AND BUILDING REVENUE BONDS | | | | | | | | | | | | | |
4.39% of Net Assets | | | | | | | | | | | | | |
Metropolitan Government Of Nashville & Davidson County Vanderbuilt | | 5.750 | | | 01/01/2008 | | Aa3/AA* | | | 250,000 | | | 274,618 |
TN State School Board Authority Higher Education Facility | | 4.300 | | | 05/01/2008 | | Aa3/AA-* | | | 490,000 | | | 513,623 |
The accompanying notes are an integral part of the financial statements.
35
DUPREE MUTUAL FUNDS—TENNESEE TAX-FREE SHORT-TO-MEDIUM SERIES
SCHEDULE OF PORTFOLIO INVESTMENTS
Tennesee Municipal Bonds—100%
June 30, 2004
| | | | | | | | | | | | | |
| Bond Description | | Coupon | | | Maturity
Date | | Rating# | | Par Value | | Market Value |
|
TN State School Board Authority Higher Education Facility | | 4.800 | % | | 05/01/2014 | | Aa2/AA* | | $ | 100,000 | | $ | 103,823 |
| | | | | | | | | | | | |
|
|
| | | | | | | | | | | | | | 892,064 |
PREREFUNDED BONDS | | | | | | | | | | | | | |
4.01% of Net Assets | | | | | | | | | | | | | |
Lenoir City TN Electric System Refunding & Improvement | | 4.800 | | | 06/01/2011 | | Aaa | | | 100,000 | | | 107,334 |
Marion County TN General Obligation | | 6.000 | | | 04/01/2024 | | Aaa/AAA* | | | 200,000 | | | 225,530 |
Metropolitan Government Nashville & Davidson County Hospital | | 5.125 | | | 11/01/2027 | | Aaa/AAA* | | | 250,000 | | | 273,750 |
Unicoi County TN General Obligation Unlimited | | 5.400 | | | 04/01/2010 | | Aaa/AAA* | | | 200,000 | | | 215,582 |
| | | | | | | | | | | | |
|
|
| | | | | | | | | | | | | | 822,196 |
LEASE REVENUE BONDS | | | | | | | | | | | | | |
2.60% of Net Assets | | | | | | | | | | | | | |
Memphis-Shelby County Airport Special Facilities-Federal Express | | 5.000 | | | 09/01/2009 | | Baa2/BBB* | | | 250,000 | | | 263,108 |
Memphis-Shelby County TN Sports Authority Arena Project | | 4.000 | | | 11/01/2006 | | Aa3/AA-* | | | 255,000 | | | 265,509 |
| | | | | | | | | | | | |
|
|
| | | | | | | | | | | | | | 528,617 |
ESCROWED TO MATURITY BONDS | | | | | | | | | | | | | |
2.55% of Net Assets | | | | | | | | | | | | | |
Metro Government Nashville/Davidson County TN Meharry Medical | | 7.875 | | | 12/01/2004 | | AAA* | | | 15,000 | | | 15,415 |
Shelby County TN Health Education & Housing Methodist Health | | 6.250 | | | 08/01/2009 | | Aaa/AAA* | | | 440,000 | | | 502,735 |
| | | | | | | | | | | | |
|
|
| | | | | | | | | | | | | | 518,150 |
MUNICIPAL UTILITY REVENUE BONDS | | | | | | | | | | | | | |
1.40% of Net Assets | | | | | | | | | | | | | |
Knoxville Tn Gas Revenue System Series J | | 4.750 | | | 03/01/2010 | | Aa3/AA* | | | 170,000 | | | 181,555 |
Memphis TN Electric System Revenue Refunding Jr Lien | | 4.000 | | | 12/01/2009 | | Aa3/AA* | | | 100,000 | | | 103,546 |
| | | | | | | | | | | | |
|
|
| | | | | | | | | | | | | | 285,101 |
STATE AND LOCAL MORTGAGE REVENUE BONDS | | | | | | | | | | | | | |
.59% of Net Assets | | | | | | | | | | | | | |
^Shelby County TN Multi-Family Housing Memphis Series A | | 5.000 | | | 01/01/2009 | | NR | | | 240,000 | | | 120,000 |
| | | | | | | | | | | | |
|
|
| | | | | | | | | | | | | | 120,000 |
| | | | | | | | | | | | |
|
|
Total Investments (cost $20,033,054)(a) - 98.69% of Net Assets | | | | | | | | | | | | $ | 20,055,437 |
| | | | | | | | | | | | |
|
|
| | * | Standard and Poor’s Corporation |
| | All | other ratings by Moody’s Investors Service, Inc. |
| | # | Bond ratings are unaudited. |
| | ^ | Security in default and therefore non-income producing |
| (a) | Represents cost for financial reporting and federal income tax purposes and differs from market value by net unrealized appreciation of securities as follows: |
| | | | |
Unrealized appreciation | | $ | 280,273 | |
Unrealized depreciation | | | (257,890 | ) |
| | |
|
|
|
Net unrealized appreciation | | $ | 22,383 | |
| | |
|
|
|
The accompanying notes are an integral part of the financial statements.
36
DUPREE MUTUAL FUNDS—TENNESSEE TAX-FREE SHORT-TO-MEDIUM SERIES
STATEMENT OF ASSETS AND LIABILITIES
JUNE 30, 2004
| | | | | | | |
ASSETS: | | | | | | | |
Investments in securities, at value (Cost: $20,033,054) | | | | | $ | 20,055,437 | |
Cash | | | | | | 123,340 | |
Interest receivable | | | | | | 221,806 | |
| | | | | |
|
|
|
Total assets | | | | | | 20,400,583 | |
LIABILITIES: | | | | | | | |
Payable for: | | | | | | | |
Distributions | | $ | 51,038 | | | | |
Fund shares redeemed | | | 30,000 | | | | |
Investment advisory fee | | | 4,864 | | | | |
Transfer agent fee | | | 2,443 | | | | |
Other | | | 1,496 | | | | |
| | |
|
| | | | |
Total liabilities | | | | | | 89,841 | |
| | | | | |
|
|
|
NET ASSETS: | | | | | | | |
Capital | | | | | | 20,331,699 | |
Net accumulated realized loss on investment transactions | | | | | | (43,340 | ) |
Net unrealized appreciation in value of investments | | | | | | 22,383 | |
| | | | | |
|
|
|
Net assets at value | | | | | $ | 20,310,742 | |
| | | | | |
|
|
|
NET ASSET VALUE, offering price and redemption price per share ($20,310,742 –:– 1,919,903 shares outstanding; unlimited number of shares authorized; no par value) | | | | | $ | 10.58 | |
| | | | | |
|
|
|
STATEMENT OF OPERATIONS
For the year ended June 30, 2004
| | | | |
Net investment income: | | | | |
Interest income | | $ | 624,390 | |
| | |
|
|
|
Expenses: | | | | |
Investment advisory fee | | | 89,209 | |
Transfer agent fee | | | 26,757 | |
Professional fees | | | 6,746 | |
Custodian and interest expense | | | 6,831 | |
Trustee fees | | | 1,668 | |
Other expenses | | | 6,977 | |
| | |
|
|
|
Total expenses | | | 138,188 | |
Expenses waived by Adviser | | | (40,117 | ) |
Custodian and interest expense reductions | | | (6,831 | ) |
| | |
|
|
|
Net expenses | | | 91,240 | |
| | |
|
|
|
Net investment income | | | 533,150 | |
| | |
|
|
|
Realized and unrealized gain/(loss) on investments: | | | | |
Net realized gain | | | 10,221 | |
Net decrease in unrealized appreciation | | | (615,735 | ) |
| | |
|
|
|
Net realized and unrealized loss on investments | | | (605,514 | ) |
| | |
|
|
|
Net decrease in net assets resulting from operations | | $ | (72,364 | ) |
| | |
|
|
|
The accompanying notes are an integral part of the financial statements.
37
DUPREE MUTUAL FUNDS—TENNESSEE TAX-FREE SHORT-TO-MEDIUM SERIES
STATEMENTS OF CHANGES IN NET ASSETS
For the years ended June 30, 2004 and 2003
| | | | | | | | |
| | | 2004
| | | 2003
| |
Increase in net assets: | | | | | | | | |
Operations: | | | | | | | | |
Net investment income | | $ | 533,150 | | | $ | 442,050 | |
Net realized gain on investments | | | 10,221 | | | | 7,935 | |
Net (decrease)/increase in unrealized appreciation | | | (615,735 | ) | | | 468,165 | |
| | |
|
|
| |
|
|
|
Net (decrease)/increase in net assets resulting from operations | | | (72,364 | ) | | | 918,150 | |
Distributions to shareholders from net investment income | | | (533,150 | ) | | | (442,050 | ) |
Net fund share transactions | | | 4,916,653 | | | | 4,157,746 | |
| | |
|
|
| |
|
|
|
Total increase | | | 4,311,139 | | | | 4,633,846 | |
Net assets: | | | | | | | | |
Beginning of year | | | 15,999,603 | | | | 11,365,757 | |
| | |
|
|
| |
|
|
|
End of year | | $ | 20,310,742 | | | $ | 15,999,603 | |
| | |
|
|
| |
|
|
|
FINANCIAL HIGHLIGHTS
Selected data for a share outstanding:
| | | | | | | | | | | | | | | | | | | | |
| | | For the years ended June 30,
| |
| | | 2004
| | | 2003
| | | 2002
| | | 2001
| | | 2000
| |
Net asset value, beginning of year | | $ | 10.91 | | | $ | 10.50 | | | $ | 10.35 | | | $ | 10.18 | | | $ | 10.33 | |
| | |
|
|
| |
|
|
| |
|
|
| |
|
|
| |
|
|
|
Income from investment operations: | | | | | | | | | | | | | | | | | | | | |
Net investment income | | | 0.32 | | | | 0.35 | | | | 0.40 | | | | 0.42 | | | | 0.41 | |
Net gains/(losses) on securities, both realized and unrealized | | | (0.33 | ) | | | 0.41 | | | | 0.15 | | | | 0.17 | | | | (0.15 | ) |
| | |
|
|
| |
|
|
| |
|
|
| |
|
|
| |
|
|
|
Total from investment operations | | | (0.01 | ) | | | 0.76 | | | | 0.55 | | | | 0.59 | | | | 0.26 | |
Less distributions: | | | | | | | | | | | | | | | | | | | | |
Distributions from net investment income | | | (0.32 | ) | | | (0.35 | ) | | | (0.40 | ) | | | (0.42 | ) | | | (0.41 | ) |
| | |
|
|
| |
|
|
| |
|
|
| |
|
|
| |
|
|
|
Net asset value, end of year | | $ | 10.58 | | | $ | 10.91 | | | $ | 10.50 | | | $ | 10.35 | | | $ | 10.18 | |
| | |
|
|
| |
|
|
| |
|
|
| |
|
|
| |
|
|
|
Total return | | | (0.07 | %) | | | 7.37 | % | | | 5.43 | % | | | 5.85 | % | | | 2.53 | % |
Net assets, end of year (in thousands) | | $ | 20,311 | | | $ | 16,000 | | | $ | 11,366 | | | $ | 7,216 | | | $ | 6,415 | |
Ratio of net expenses to average net assets (a) | | | 0.51 | % | | | 0.50 | % | | | 0.41 | % | | | 0.59 | % | | | 0.60 | % |
Ratio of net investment income to average net assets | | | 2.99 | % | | | 3.29 | % | | | 3.84 | % | | | 4.03 | % | | | 3.96 | % |
Portfolio turnover | | | 5.92 | % | | | 20.27 | % | | | 22.10 | % | | | 48.90 | % | | | 28.67 | % |
| (a) | Percentages are after expenses waived by Adviser and custodian and interest expense reductions. |
Expenses waived by Adviser and custodian and interest expense reductions were:
.22% and .04% for 2004, .23% and .04% for 2003, .35% and .06% for 2002, .17%, .07% for 2001, and .18% and .07% for 2000, respectively.
The accompanying notes are an integral part of the financial statements.
38
DUPREE MUTUAL FUNDS—INTERMEDIATE GOVERNMENT BOND SERIES
SCHEDULE OF PORTFOLIO INVESTMENTS
Government Securities and Agencies—100%
June 30, 2004
| | | | | | | | | | | | | |
| Bond Description | | Coupon | | | Maturity Date | | Rating# | | Par Value
of Shares | | Market Value |
|
FEDERAL HOME LOAN BANK | | | | | | | | | | | | | |
50.03% of Net Assets | | | | | | | | | | | | | |
Medium Term Note | | 7.000 | % | | 08/15/2014 | | Aaa/AAA* | | $ | 500,000 | | $ | 574,605 |
Medium Term Note | | 5.625 | | | 02/12/2018 | | Aaa/AAA* | | | 1,500,000 | | | 1,497,117 |
Medium Term Note | | 5.620 | | | 08/06/2018 | | Aaa/AAA* | | | 3,000,000 | | | 2,996,187 |
Medium Term Note | | 7.560 | | | 09/01/2004 | | Aaa/AAA* | | | 150,000 | | | 151,477 |
Medium Term Note | | 8.170 | | | 12/16/2004 | | Aaa/AAA* | | | 2,000,000 | | | 2,057,395 |
Medium Term Note | | 5.875 | | | 09/19/2017 | | Aaa/AAA* | | | 783,333 | | | 783,511 |
Medium Term Note | | 5.250 | | | 05/21/2018 | | Aaa/AAA* | | | 1,000,000 | | | 982,967 |
| | | | | | | | | | | | |
|
|
| | | | | | | | | | | | | | 9,043,259 |
FEDERAL HOME LOAN MORTGAGE | | | | | | | | | | | | | |
21.87% of Net Assets | | | | | | | | | | | | | |
Medium Term Note | | 4.875 | | | 03/15/2007 | | Aaa/AAA* | | | 1,400,000 | | | 1,450,684 |
Medium Term Note | | 5.125 | | | 11/07/2013 | | Aaa/AAA* | | | 1,000,000 | | | 995,855 |
Medium Term Note | | 5.500 | | | 09/12/2013 | | Aaa/AAA* | | | 1,500,000 | | | 1,505,873 |
| | | | | | | | | | | | |
|
|
| | | | | | | | | | | | | | 3,952,412 |
FEDERAL NATIONAL MORTGAGE ASSOCIATION | | | | | | | | | | | | | |
18.74% of Net Assets | | | | | | | | | | | | | |
Medium Term Note | | 5.750 | | | 11/07/2017 | | Aaa/AAA* | | | 400,000 | | | 406,150 |
Medium Term Note | | 5.300 | | | 08/15/2013 | | Aaa/AAA* | | | 2,000,000 | | | 2,016,950 |
Medium Term Note | | 5.580 | | | 07/21/2023 | | Aaa/AAA* | | | 1,000,000 | | | 963,887 |
| | | | | | | | | | | | |
|
|
| | | | | | | | | | | | | | 3,386,987 |
STUDENT LOAN MARKETING ASSOCIATION | | | | | | | | | | | | | |
6.41% of Net Assets | | | | | | | | | | | | | |
Medium Term Note | | 7.300 | | | 08/01/2012 | | Aaa/AAA* | | | 1,000,000 | | | 1,159,339 |
| | | | | | | | | | | | |
|
|
| | | | | | | | | | | | | | 1,159,339 |
CASH EQUIVALENTS | | | | | | | | | | | | | |
1.76% of Net Assets | | | | | | | | | | | | | |
US Bank U.S. Treasury Money Market Fund | | | | | | | | | | 318,894 | | | 318,894 |
| | | | | | | | | | | | |
|
|
| | | | | | | | | | | | | | 318,894 |
| | | | | | | | | | | | |
|
|
Total Investments (cost $17,525,825) (a)—98.81% of Net Assets | | | | | | | | | | | | $ | 17,860,891 |
| | | | | | | | | | | | |
|
|
| | * | Standard and Poor’s Corporation |
| | All | other ratings by Moody’s Investors Service, Inc. |
| | # | Bond ratings are unaudited. |
| (a) | Represents cost for financial reporting and federal income tax purposes and differs from market value by net unrealized appreciation of securities as follows: |
| | | | |
Unrealized appreciation | | $ | 431,187 | |
Unrealized depreciation | | | (96,121 | ) |
| | |
|
|
|
Net unrealized appreciation | | $ | 335,066 | |
| | |
|
|
|
The accompanying notes are an integral part of the financial statements.
39
DUPREE MUTUAL FUNDS—INTERMEDIATE GOVERNMENT BOND SERIES
STATEMENT OF ASSETS AND LIABILITIES
JUNE 30, 2004
| | | | | | | |
ASSETS: | | | | | | | |
Investments in securities, at value (Cost: $17,525,825) | | | | | $ | 17,860,891 | |
Cash | | | | | | 4,305 | |
Interest receivable | | | | | | 296,763 | |
Prepaid expenses | | | | | | 4,834 | |
| | | | | |
|
|
|
Total assets | | | | | | 18,166,793 | |
LIABILITIES: | | | | | | | |
Payable for: | | | | | | | |
Distributions | | $ | 82,798 | | | | |
Fund shares redeemed | | | 3,500 | | | | |
Investment advisory fee | | | 2,987 | | | | |
Transfer agent fee | | | 2,240 | | | | |
| | |
|
| | | | |
Total liabilities | | | | | | 91,525 | |
| | | | | |
|
|
|
NET ASSETS: | | | | | | | |
Capital | | | | | | 18,114,776 | |
Net accumulated realized loss on investment transactions | | | | | | (374,574 | ) |
Net unrealized appreciation in value of investments | | | | | | 335,066 | |
| | | | | |
|
|
|
Net assets at value | | | | | $ | 18,075,268 | |
| | | | | |
|
|
|
NET ASSET VALUE, offering price and redemption price per share ($18,075,268–:–1,817,613 shares outstanding; unlimited number of shares authorized; no par value) | | | | | $ | 9.94 | |
| | | | | |
|
|
|
STATEMENT OF OPERATIONS
For the year ended June 30, 2004
| | | | |
Net investment income: | | | | |
Interest income | | $ | 1,030,152 | |
| | |
|
|
|
Expenses: | | | | |
Investment advisory fee | | | 36,934 | |
Transfer agent fee | | | 27,704 | |
Custodian and interest expense | | | 5,959 | |
Professional fees | | | 3,093 | |
Trustee fees | | | 1,779 | |
Printing fees | | | 5,000 | |
Postage fees | | | 4,700 | |
Other expenses | | | 3,181 | |
| | |
|
|
|
| | | | | |
Total expenses | | | 88,350 | |
Custodian and interest expense reductions | | | (5,959 | ) |
| | |
|
|
|
Net expenses | | | 82,391 | |
| | |
|
|
|
Net investment income | | | 947,761 | |
| | |
|
|
|
Realized and unrealized loss on investments: | | | | |
Net realized loss | | | (117,848 | ) |
Net decrease in unrealized appreciation | | | (644,245 | ) |
| | |
|
|
|
Net realized and unrealized loss on investments | | | (762,093 | ) |
| | |
|
|
|
Net increase in net assets resulting from operations | | $ | 185,668 | |
| | |
|
|
|
The accompanying notes are an integral part of the financial statements.
40
DUPREE MUTUAL FUNDS—INTERMEDIATE GOVERNMENT BOND SERIES
STATEMENTS OF CHANGES IN NET ASSETS
For the years ended June 30, 2004 and 2003
| | | | | | | | |
| | | 2004
| | | 2003
| |
Increase in net assets: | | | | | | | | |
Operations: | | | | | | | | |
Net investment income | | $ | 947,761 | | | $ | 830,938 | |
Net realized (loss)/gain on investments | | | (117,848 | ) | | | 24,189 | |
Net (decrease)/increase in unrealized appreciation | | | (644,245 | ) | | | 414,578 | |
| | |
|
|
| |
|
|
|
Net increase in net assets resulting from operations | | | 185,668 | | | | 1,269,705 | |
Distributions to shareholders from net investment income | | | (947,761 | ) | | | (830,938 | ) |
Net fund share transactions | | | 79,612 | | | | 4,907,337 | |
| | |
|
|
| |
|
|
|
Total (decrease)/increase | | | (682,481 | ) | | | 5,346,104 | |
Net assets: | | | | | | | | |
Beginning of year | | | 18,757,749 | | | | 13,411,645 | |
| | |
|
|
| |
|
|
|
End of year | | $ | 18,075,268 | | | $ | 18,757,749 | |
| | |
|
|
| |
|
|
|
FINANCIAL HIGHLIGHTS
Selected data for a share outstanding:
| | | | | | | | | | | | | | | | | | | | |
| | | For the years ended June 30,
| |
| | | 2004
| | | 2003
| | | 2002
| | | 2001
| | | 2000
| |
Net asset value, beginning of year | | $ | 10.35 | | | $ | 10.07 | | | $ | 9.83 | | | $ | 9.43 | | | $ | 9.73 | |
| | |
|
|
| |
|
|
| |
|
|
| |
|
|
| |
|
|
|
Income from investment operations: | | | | | | | | | | | | | | | | | | | | |
Net investment income | | | 0.52 | | | | 0.53 | | | | 0.58 | | | | 0.64 | | | | 0.65 | |
Net gains/(losses) on securities, both realized and unrealized | | | (0.41 | ) | | | 0.28 | | | | 0.24 | | | | 0.40 | | | | (0.30 | ) |
| | |
|
|
| |
|
|
| |
|
|
| |
|
|
| |
|
|
|
Total from investment operations | | | 0.11 | | | | 0.81 | | | | 0.82 | | | | 1.04 | | | | 0.35 | |
Less distributions: | | | | | | | | | | | | | | | | | | | | |
Distributions from net investment income | | | (0.52 | ) | | | (0.53 | ) | | | (0.58 | ) | | | (0.64 | ) | | | (0.65 | ) |
| | |
|
|
| |
|
|
| |
|
|
| |
|
|
| |
|
|
|
Net asset value, end of year | | $ | 9.94 | | | $ | 10.35 | | | $ | 10.07 | | | $ | 9.83 | | | $ | 9.43 | |
| | |
|
|
| |
|
|
| |
|
|
| |
|
|
| |
|
|
|
Total return | | | 1.09 | % | | | 8.23 | % | | | 8.54 | % | | | 11.29 | % | | | 3.76 | % |
Net assets, end of year (in thousands) | | $ | 18,075 | | | $ | 18,758 | | | $ | 13,412 | | | $ | 11,057 | | | $ | 10,167 | |
Ratio of net expenses to average net assets (a) | | | 0.45 | % | | | 0.45 | % | | | 0.48 | % | | | 0.42 | % | | | 0.41 | % |
Ratio of net investment income to average net assets | | | 5.12 | % | | | 5.19 | % | | | 5.81 | % | | | 6.56 | % | | | 6.83 | % |
Portfolio turnover | | | 42.35 | % | | | 53.62 | % | | | 75.15 | % | | | 24.94 | % | | | 33.35 | % |
| (a) | Percentages before custodian and interest expense reductions were: |
.48% for 2004, .48% for 2003, .52% for 2002, .46% for 2001, and .45% for 2000.
The accompanying notes are an integral part of the financial statements.
41
DUPREE MUTUAL FUNDS
NOTES TO FINANCIAL STATEMENTS
June 30, 2004
| 1. | Significant Accounting Policies |
Dupree Mutual Funds is registered under the Investment Company Act of 1940, as amended, as a no-load, open-end investment company. The Declaration of Trust of Dupree Mutual Funds (the "Trust") permits the Trustees to create an unlimited number of series of investment portfolios (each a “Fund" and collectively the “Funds”) and with respect to each series to issue an unlimited number of full or fractional shares of a single class. The Trust currently offers nine series:
Alabama Tax-Free Income Series
Kentucky Tax-Free Income Series
Kentucky Tax-Free Short-to-Medium Series
Mississippi Tax-Free Income Series
North Carolina Tax-Free Income Series
North Carolina Tax-Free Short-to-Medium Series
Tennessee Tax-Free Income Series
Tennessee Tax-Free Short-to-Medium Series, and
Intermediate Government Bond Series
The investment strategy of the eight state tax-free funds is to maintain 100% of their investments in Alabama, Kentucky, Mississippi, North Carolina or Tennessee municipal securities.
The Intermediate Government Bond Series' investment strategy is to invest only in obligations of the U.S. Treasury and Agencies of the U.S. Government. The Intermediate Government Bond Series will buy bonds and notes that will maintain an average maturity of no more than ten years.
The following is a summary of significant accounting policies consistently followed by the Funds in the preparation of their financial statements. The policies are in conformity with accounting principles generally accepted in the United States.
Securities held by the Intermediate Government Bond Series are valued using market quotations as provided by an independent pricing service. Securities held by the eight state tax-free funds are valued as determined in good faith in accordance with consistently applied procedures established by and under the general supervision of the Board of Trustees. These procedures involve the use of a matrix pricing model which takes into consideration price quotations or appraisals for these securities, yield, stability, risk, quality, coupon rate, maturity, type of issue, trading characteristics, special circumstances of a security or trading market, and any other factors or market data considered relevant in determining the value.
Security transactions are accounted for on a trade date basis. Gains and losses on securities sold are determined on an identified cost basis.
42
DUPREE MUTUAL FUNDS
NOTES TO FINANCIAL STATEMENTS
June 30, 2004
| 1. | Significant Accounting Policies, continued: |
Interest income, which includes the amortization of premiums and the accretion of discounts, is recorded on the accrual basis.
The Funds may purchase securities with delivery or payment to occur at a later date. At the time the Funds enter into a commitment to purchase a security, the transaction is recorded and the value of the security is reflected in the net asset value. The value of the security may vary with market fluctuations. No interest accrues to the Funds until payment takes place. At the time the funds enter into this type of transaction, they are required to segregate cash or other liquid assets equal to the value of the securities purchased.
Each of the Funds is a separate entity for federal income tax purposes. It is each Funds’ policy to qualify as a regulated investment company by complying with the requirements of the Internal Revenue Code (the “code”) applicable to regulated investment companies, including the distribution of all taxable income to their shareholders. The Funds have met the requirements of the code applicable to regulated investment companies for the year ended June 30, 2004. Therefore, no federal income tax provision is required.
All of the net investment income of the Funds is declared as a dividend to shareholders of record as of the close of business each day. Distributions are payable in cash or in additional shares at the net asset value on the payable date. Distributions are payable:
| | |
| Monthly for: | | Kentucky Tax-Free Short-to-Medium Series, and |
| | | North Carolina Tax-Free Short-to-Medium Series, and |
| | | Tennessee Tax-Free Short-to-Medium Series, and |
| | | Intermediate Government Bond Series, and |
| |
| Quarterly for: | | Alabama Tax-Free Income Series, and |
| | | Kentucky Tax-Free Income Series, and |
| | | Mississippi Tax-Free Income Series, and |
| | | North Carolina Tax-Free Income Series, and |
| | | Tennessee Tax-Free Income Series |
Timing differences relating to shareholder distributions are reflected in the components of net assets and permanent book and tax basis differences relating to shareholder distributions have been reclassified to capital.
The preparation of financial statements in conformity with generally accepted accounting principles in the United States requires management to make estimates and assumptions that affect the reported amounts and disclosures. Actual amounts could differ from those estimates.
| 2. | Investment Advisory Fee and Other Transactions with Affiliates |
Subject to the direction of the Trustees, Dupree & Company, Inc. (the Adviser) is responsible for the management of the Funds' portfolios. Under the terms of the Investment Advisory Agreements for the Alabama, Kentucky, Mississippi, North Carolina and Tennessee Series, the Funds have agreed to pay to the Adviser as compensation for all services rendered, facilities furnished and expenses paid or assumed by it
43
DUPREE MUTUAL FUNDS
NOTES TO FINANCIAL STATEMENTS
June 30, 2004
| 2. | Investment Advisory Fee, continued: |
under the Agreements, a fee at the annual rate of .50 of 1% of the first $100,000,000 average daily net assets of each series determined separately; .45 of 1% of the average daily net assets between $100,000,001 and $150,000,000 of each series determined separately; .40 of 1% of the average daily net assets between $150,000,001 and $500,000,000 of each series determined separately; and .35 of 1% of the average daily net assets in excess of $500,000,000. For the Intermediate Government Bond Series, the Fund has agreed to pay to the Adviser, as compensation for all services rendered, facilities furnished and expenses paid or assumed by it under the Agreement, a fee at the annual rate of .2 of 1% of average daily net assets.
The Adviser may voluntarily waive investment advisory fees payable to it under the Investment Advisory Agreement with each Fund, and assume and pay other operating expenses.
For the year ended June 30, 2004 , investment advisory fees and waived amounts were as follows:
| | | | | | |
| | | Investment
Advisory fees
| | Waived Investment
Advisory fees
|
Alabama Tax-Free Income Series | | $ | 25,461 | | $ | 20,794 |
Kentucky Tax-Free Income Series | | $ | 2,534,221 | | | — |
Kentucky Tax-Free Short-to-Medium Series | | $ | 510,792 | | | — |
Mississippi Tax-Free Income Series | | $ | 14,648 | | $ | 13,509 |
North Carolina Tax-Free Income Series | | $ | 195,819 | | | — |
North Carolina Tax-Free Short-to-Medium Series | | $ | 77,222 | | $ | 38,376 |
Tennessee Tax-Free Income Series | | $ | 331,799 | | | — |
Tennessee Tax-Free Short-to-Medium Series | | $ | 89,209 | | $ | 40,117 |
Intermediate Government Bond Series | | $ | 36,934 | | | — |
In addition, each Fund has entered into a Shareholder Service Agreement with Dupree & Company, Inc, the Funds’ transfer agent. The agreement provides for a fee computed on the average daily net asset value at the annual rate of .15% on the first $20,000,000 of average net assets and .12% of all amounts in excess of $20,000,000 of average net assets.
| 3. | Purchases and Sales of Securities |
During the year ended June 30, 2004, the cost of purchases and the proceeds from sales of securities (excluding short-term securities) for each Series were as follows:
| | | | | | |
| | | Purchases
| | Sales/Calls
|
Alabama Tax-Free Income Series | | $ | 1,114,968 | | $ | 832,101 |
Kentucky Tax-Free Income Series | | | 86,964,509 | | | 47,793,140 |
Kentucky Tax-Free Short-to-Medium Series | | | 19,849,584 | | | 18,607,384 |
Mississippi Tax-Free Income Series | | | 528,846 | | | 5,000 |
North Carolina Tax-Free Income Series | | | 5,333,740 | | | 4,381,265 |
North Carolina Tax-Free Short-to-Medium Series | | | 4,780,576 | | | 1,258,650 |
Tennessee Tax-Free Income Series | | | 25,209,025 | | | 10,378,586 |
Tennessee Tax-Free Short-to-Medium Series | | | 8,115,495 | | | 1,025,902 |
Intermediate Government Bond Series | | | 8,448,433 | | | 7,571,537 |
44
DUPREE MUTUAL FUNDS
NOTES TO FINANCIAL STATEMENTS
June 30, 2004
At June 30, 2004, there were an unlimited number of shares of beneficial interest authorized. Transactions in capital shares were as follows:
| | | | | | | | | | | | | | |
ALABAMA TAX-FREE INCOME SERIES
| | Year Ended June 30, 2004
| | | Year Ended June 30, 2003
| |
| | | SHARES
| | | AMOUNT
| | | SHARES
| | | AMOUNT
| |
Shares sold | | 104,313 | | | $ | 1,219,419 | | | 328,581 | | | $ | 3,807,346 | |
Shares issued for reinvestment of distributions | | 12,749 | | | | 150,214 | | | 11,571 | | | | 133,865 | |
Shares redeemed | | (47,759 | ) | | | (551,918 | ) | | (163,273 | ) | | | (1,896,596 | ) |
Net increase | | 69,303 | | | $ | 817,715 | | | 176,879 | | | $ | 2,044,615 | |
| | |
KENTUCKY TAX-FREE INCOME SERIES
| | Year Ended June 30, 2004
| | | Year Ended June 30, 2003
| |
| | | SHARES
| | | AMOUNT
| | | SHARES
| | | AMOUNT
| |
Shares sold | | 9,378,748 | | | $ | 71,597,853 | | | 11,720,210 | | | $ | 89,295,422 | |
Shares issued for reinvestment of distributions | | 2,018,784 | | | | 15,538,869 | | | 1,964,425 | | | | 14,938,320 | |
Shares redeemed | | (8,570,632 | ) | | | (65,117,332 | ) | | (6,079,468 | ) | | | (46,352,849 | ) |
Net increase | | 2,826,900 | | | $ | 22,019,390 | | | 7,605,167 | | | $ | 57,880,893 | |
| | |
KENTUCKY TAX-FREE SHORT-TO-MEDIUM SERIES
| | Year Ended June 30, 2004
| | | Year ended June 30, 2003
| |
| | | SHARES
| | | AMOUNT
| | | SHARES
| | | AMOUNT
| |
Shares sold | | 6,216,495 | | | $ | 33,439,642 | | | 7,411,589 | | | $ | 39,899,771 | |
Shares issued for reinvestment of distributions | | 409,083 | | | | 2,200,547 | | | 424,021 | | | | 2,279,873 | |
Shares redeemed | | (6,414,262 | ) | | | (34,307,863 | ) | | (4,634,309 | ) | | | (24,958,608 | ) |
Net increase | | 211,316 | | | $ | 1,332,326 | | | 3,201,301 | | | $ | 17,221,036 | |
| | |
MISSISSIPPI TAX-FREE INCOME SERIES
| | Year Ended June 30, 2004
| | | Year ended June 30, 2003
| |
| | | SHARES
| | | AMOUNT
| | | SHARES
| | | AMOUNT
| |
Shares sold | | 80,110 | | | $ | 927,889 | | | 93,314 | | | $ | 1,058,641 | |
Shares issued for reinvestment of distributions | | 7,382 | | | | 86,327 | | | 7,251 | | | | 82,288 | |
Shares redeemed | | (42,367 | ) | | | (492,165 | ) | | (34,432 | ) | | | (387,947 | ) |
Net increase | | 45,125 | | | $ | 522,051 | | | 66,133 | | | $ | 752,982 | |
| | |
NORTH CAROLINA TAX-FREE INCOME SERIES
| | Year Ended June 30, 2004
| | | Year ended June 30, 2003
| |
| | | SHARES
| | | AMOUNT
| | | SHARES
| | | AMOUNT
| |
Shares sold | | 594,702 | | | $ | 6,528,849 | | | 876,078 | | | $ | 9,586,984 | |
Shares issued for reinvestment of distributions | | 101,591 | | | | 1,126,595 | | | 100,608 | | | | 1,099,913 | |
Shares redeemed | | (667,796 | ) | | | (7,330,858 | ) | | (460,582 | ) | | | (5,032,287 | ) |
Net increase | | 28,497 | | | $ | 324,586 | | | 516,104 | | | $ | 5,654,610 | |
45
DUPREE MUTUAL FUNDS
NOTES TO FINANCIAL STATEMENTS
June 30, 2004
| 4. | Capital Shares, continued: |
| | | | | | | | | | | | | | |
NORTH CAROLINA TAX-FREE SHORT-TO-MEDIUM SERIES
| | Year Ended June 30, 2004
| | | Year Ended June 30, 2003
| |
| | | SHARES
| | | AMOUNT
| | | SHARES
| | | AMOUNT
| |
Shares sold | | 917,078 | | | $ | 9,836,113 | | | 789,310 | | | $ | 8,466,380 | |
Shares issued for reinvestment of distributions | | 29,653 | | | | 318,708 | | | 28,451 | | | | 303,768 | |
Shares redeemed | | (739,783 | ) | | | (7,920,422 | ) | | (423,309 | ) | | | (4,508,913 | ) |
Net increase | | 206,948 | | | $ | 2,234,399 | | | 394,452 | | | $ | 4,261,235 | |
| | |
TENNESSEE TAX-FREE INCOME SERIES
| | Year Ended June 30, 2004
| | | Year ended June 30, 2003
| |
| | | SHARES
| | | AMOUNT
| | | SHARES
| | | AMOUNT
| |
Shares sold | | 1,791,653 | | | $ | 19,949,522 | | | 1,173,551 | | | $ | 13,021,792 | |
Shares issued for reinvestment of distributions | | 112,020 | | | | 1,256,050 | | | 109,212 | | | | 1,208,525 | |
Shares redeemed | | (640,653 | ) | | | (7,064,445 | ) | | (545,699 | ) | | | (6,073,176 | ) |
Net increase | | 1,263,020 | | | $ | 14,141,127 | | | 737,064 | | | $ | 8,157,141 | |
| | |
TENNESSEE TAX-FREE SHORT-TO-MEDIUM SERIES
| | Year Ended June 30, 2004
| | | Year ended June 30, 2003
| |
| | | SHARES
| | | AMOUNT
| | | SHARES
| | | AMOUNT
| |
Shares sold | | 976,547 | | | $ | 10,532,099 | | | 871,531 | | | $ | 9,390,997 | |
Shares issued for reinvestment of distributions | | 31,103 | | | | 335,255 | | | 26,035 | | | | 279,910 | |
Shares redeemed | | (554,217 | ) | | | (5,950,701 | ) | | (513,265 | ) | | | (5,513,161 | ) |
Net increase | | 453,433 | | | $ | 4,916,653 | | | 384,301 | | | $ | 4,157,746 | |
| | |
INTERMEDIATE GOVERNMENT BOND SERIES
| | Year Ended June 30, 2004
| | | Year ended June 30, 2003
| |
| | | SHARES
| | | AMOUNT
| | | SHARES
| | | AMOUNT
| |
Shares sold | | 294,606 | | | $ | 2,979,064 | | | 600,753 | | | $ | 6,153,416 | |
Shares issued for reinvestment of distributions | | 62,114 | | | | 627,270 | | | 51,871 | | | | 531,263 | |
Shares redeemed | | (350,592 | ) | | | (3,526,722 | ) | | (173,397 | ) | | | (1,777,342 | ) |
Net increase | | 6,128 | | | $ | 79,612 | | | 479,227 | | | $ | 4,907,337 | |
| 5. | Concentration of credit risk |
The Alabama Tax-Free Income Series, Kentucky Tax-Free Income Series, Kentucky Tax-Free Short-to-Medium Series, Mississippi Tax-Free Income Series, North Carolina Tax-Free Income Series, North Carolina Tax-Free Short-to-Medium Series, Tennessee Tax-Free Income Series, and Tennessee Tax-Free Short-to-Medium Series each invest solely in debt obligations issued by the states of Alabama, Kentucky, Mississippi, North Carolina and Tennessee, respectively, and its respective political subdivision, agencies and public authorities to obtain funds for various public purposes. Each of these funds is more susceptible to economic and political factors adversely affecting issuers of their states respective municipal securities than in a fund that is not concentrated in these issuers to the same extent.
46
DUPREE MUTUAL FUNDS
NOTES TO FINANCIAL STATEMENTS
June 30, 2004
At June 30, 2004, the Alabama Tax-Free Income Series, Kentucky Tax-Free Income Series, Kentucky Tax-Free Short-to-Medium Series, North Carolina Tax-Free Income Series, North Carolina Tax-Free Short-to-Medium Series, Tennessee Tax-Free Income Series, Tennessee Tax-Free Short-to-Medium Series, and Intermediate Government Bond Series have capital loss carryforwards which are available to offset future capital gains, if any.
The capital loss carryforwards expire as follows:
| | | | | | | | | | | | | | | | | | | | | | | | | | | |
| | | 2005
| | 2006
| | 2007
| | 2008
| | 2009
| | 2010
| | 2011
| | 2012
| | Total
|
Alabama Tax-Free Income Series | | $ | — | | $ | — | | $ | — | | $ | — | | $ | — | | $ | 63 | | $ | 1,444 | | $ | 1,430 | | $ | 2,937 |
Kentucky Tax-Free Income Series | | | — | | | — | | | — | | | — | | | 1,871,357 | | | — | | | — | | | — | | | 1,871,357 |
Kentucky Tax-Free Short-to-Medium Series | | | 188,198 | | | 73,155 | | | — | | | 135,232 | | | 312,672 | | | 34,064 | | | — | | | 44,500 | | | 787,821 |
North Carolina Tax-Free Income Series | | | — | | | — | | | — | | | 76,257 | | | — | | | 17,738 | | | — | | | 964,705 | | | 1,058,700 |
North Carolina Tax-Free Short-to-Medium Series | | | — | | | — | | | — | | | 5,915 | | | 22,226 | | | — | | | — | | | 10,514 | | | 38,655 |
Tennessee Tax-Free Income Series | | | — | | | — | | | — | | | 276,976 | | | 523,414 | | | 69,806 | | | 18,314 | | | 175,434 | | | 1,063,944 |
Tennessee Tax-Free Short-to-Medium Series | | | — | | | — | | | — | | | 5,991 | | | 37,349 | | | — | | | — | | | — | | | 43,340 |
Intermediate Government Bond Series | | | — | | | — | | | — | | | 209,853 | | | 46,873 | | | — | | | — | | | 117,848 | | | 374,574 |
The tax basis components of distributable earnings for each of the funds is not materially different than the book basis.
Capital losses incurred after October 31 (“Post-October” losses) within the taxable year are deemed to arise on the first business day of the Funds’ next taxable year. The following Funds incurred and will elect to defer net capital losses during the fiscal 2004 as follows:
| | | | |
| | | Post October Losses
| |
Alabama Tax-Free Income Series | | $ | (5,613 | ) |
Kentucky Tax-Free Short-to-Medium Series | | | (329,431 | ) |
North Carolina Tax-Free Income Series | | | (6,274 | ) |
North Carolina Tax-Free Short-to-Medium Series | | | (4,659 | ) |
Tennessee Tax-Free Income Series | | | (101,510 | ) |
47
DUPREE MUTUAL FUNDS
NOTES TO FINANCIAL STATEMENTS
June 30, 2004
| 6. | Federal Income Taxes, continued: |
At June 30, 2004, the effect of permanent book to tax differences (expiration of capital loss carryforwards) resulted in increases and decreases to the components of net assets as follows:
| | | | | | | |
| | | Accumulated Net Realized Gains/
(Losses)
| | Capital
| |
Kentucky Tax-Free Short-to-Medium Series | | $ | 251,140 | | ($ | 251,140 | ) |
Intermediate Government Bond Series | | $ | 741,733 | | ($ | 741,733 | ) |
The tax character of distributions paid for the years ended June 30, 2004 and 2003 were as follows:
| | | | | | | | | | | | | | | | | | |
| | | 6/30/2004
| | 6/30/2003
|
| | | Tax Exempt
Income
| | Ordinary
Income
| | Long- term
Capital Gain
| | Tax Exempt
Income
| | Ordinary
Income
| | Long- term
Capital Gain
|
Alabama Tax-Free Income Series | | $ | 222,005 | | $ | — | | $ | — | | $ | 183,177 | | $ | — | | $ | — |
Kentucky Tax-Free Income Series | | | 26,976,997 | | | — | | | — | | | 25,809,346 | | | — | | | — |
Kentucky Tax-Free Short-to-Medium Series | | | 3,054,917 | | | — | | | — | | | 3,128,791 | | | — | | | — |
Mississippi Tax-Free Income Series | | | 122,010 | | | — | | | 691 | | | 103,755 | | | — | | | 91 |
North Carolina Tax-Free Income Series | | | 1,587,135 | | | — | | | — | | | 1,550,959 | | | — | | | — |
North Carolina Tax-Free Short-to-Medium Series | | | 453,640 | | | — | | | — | | | 348,919 | | | — | | | — |
Tennessee Tax-Free Income Series | | | 2,696,389 | | | — | | | — | | | 2,359,370 | | | — | | | — |
Tennessee Tax-Free Short-to-Medium Series | | | 533,150 | | | — | | | — | | | 442,050 | | | — | | | — |
Intermediate Government Bond Series | | | — | | | 947,761 | | | | | | — | | | 830,938 | | | |
| 7. | Contingencies and Commitments |
The Funds indemnify the Trust’s officers and Trustees for certain liabilities that might arise from their performance of their duties to the Funds. Additionally, in the normal course of business, the Funds enter into contracts that contain a variety of representations and warranties and which provide general indemnifications. The Funds’ maximum exposure under these arrangements is unknown, as this would involve future claims that may be made against the Funds that have not yet occurred. However, based on experience, the Funds expect the risk of loss to be remote.
| 8. | Line of Credit Agreement and Custodian Agreement |
Under the terms of an agreement with the Funds’ custodian, principal amounts up to 5% of a Fund’s net assets are available on an uncommitted line of credit. The principal amounts borrowed are due on demand and the agreement expires on September 30, 2004. Interest will be payable based on the prime rate of the bank. Securities with a minimum value of three times the loan proceeds will be assigned as collateral until the balance of the note and unpaid interest is paid in full and terminated. Debt covenants, among others, require the Funds to:
| | • | Provide the lender with the Funds’ annual report |
| | • | Comply with all agreements with the lender and with applicable laws and regulations |
| | • | Maintain appropriate insurance coverage |
48
DUPREE MUTUAL FUNDS
NOTES TO FINANCIAL STATEMENTS
June 30, 2004
| 8. | Line of Credit Agreement and Custodian Agreement, continued: |
The North Carolina Tax-Free Short-to-Medium Series had outstanding borrowings of $379,000, at an interest rate of 4.25% as of June 30, 2004. During the year ended June 30, 2004, the weighted average borrowings for each Series were as follows:
| | | |
| | | Weighted
average
borrowings
|
Alabama Tax-Free Income Series | | $ | 11,917 |
Kentucky Tax Free Income Series | | | 27,858 |
Kentucky Tax-Free Short-to-Medium Series | | | 253,730 |
Mississippi Tax-Free Income Series | | | 2,883 |
North Carolina Tax-Free Income Series | | | 59,343 |
North Carolina Tax-Free Short-to-Medium Series | | | 74,361 |
Tennessee Tax-Free Income Series | | | 33,298 |
Tennessee Tax-Free Short-to-Medium Series | | | 28,104 |
Intermediate Government Bond Series | | | 10,744 |
The Funds have a contractual agreement with the custodian whereby the bank will provide certain custodial services for $1.00 per year. Through arrangements with the Funds’ custodian, credits realized as a result of unninvested cash balances were used to reduce each Fund’s expenses. This reduction also includes interest expense incurred on any outstanding borrowings under the line of credit discussed above. During the year, these credits reduced each of the Fund’s expenses by the amount shown on the statements of operation as “custodian and interest expense reductions.”
| 9. | Trustee and officer information (unaudited) |
The Trustees of the Trust consist of seven individuals, five of whom are not “interested persons” of the Trust as defined in the Investment Company Act of 1940. Two of the Trustees are “interested persons” of the Trust’s Investment Adviser and of the Trust within the meaning of Section 2(a)(19) of the Investment Company Act of 1940 by virtue of their officership, directorship and/or employment with Dupree & Company, Inc.
The following table sets forth information as to the Trustees and officers:
Interested Persons:
| | | | | | | | | | |
Name, Address and Age
| | Position(s)
held with
Funds
| | Term of Office
and Length of
Time Served
| | Principal Occupation(s) During Past 5 Years
| | Number of
Portfolios
in Fund
Complex
Overseen
by Trustee
| | Other
Director-ships
Held by Director
|
THOMAS P. DUPREE SR. 125 South Mill Street Lexington, KY 40507 Age: 74 | | President and Trustee | | Annual
Term
25 years
service
as
President
and
Trustee
(Director) | | Chairman of the Board of Dupree & Company, Inc., President of Dupree Investment Advisers, Inc. Director, Office Suites Plus, Inc. | | 9 | | Office Suites Plus |
49
DUPREE MUTUAL FUNDS
NOTES TO FINANCIAL STATEMENTS
June 30, 2004
| 9. | Trustee Information (unaudited), continued: |
Interested Persons:
| | | | | | | | | | |
Name, Address and Age
| | Position(s)
held with
Funds
| | Term of Office
and Length of
Time Served
| | Principal Occupation(s) During Past 5 Years
| | Number of
Portfolios
in Fund
Complex
Overseen
by Trustee
| | Other
Director-
ships Held
by Director
|
WILLIAM T. GRIGGS, II 125 South Mill Street Lexington, KY 40507 Age: 53 | | Vice
President
Assistant,
Secretary
and
Trustee | | Annual
Term
6 years of
service as
Director;
12 years
of service
as Vice
President,
Assistant
Secretary | | President of Dupree & Company, Inc. and Dupree Investment Advisers, Inc. | | 9 | | |
Officers: | | | | | | | | | | |
Michelle M. Dragoo 125 South Mill Street Lexington, KY 40507 Age: 42 | | Vice
President,
Secretary,
Treasurer | | Annual
Term; 6
years of
service as
Vice
President,
4 years of
service as
Secretary,
Treasurer | | Vice President, Secretary, Treasurer of Dupree & Company, Inc. | | N/A | | N/A |
| | | | | |
Alison L. Arnold 125 South Mill Street Lexington, KY 40507 Age: 43 | | Assistant
Vice
President | | Annual
Term: 11
years of
service | | Assistant Vice President of Dupree & Company, Inc. | | N/A | | N/A |
| | | | | |
Non-Interested Persons | | | | | | | | | | |
WILLIAM A. COMBS, JR. 111 Woodland Ave., #510 Lexington, KY 40502 Age: 63 | | Chairman,
Trustee | | Annual
Term
3 years of
service
Chairman;
15 years
of service
Trustee | | Secretary, Treasurer, Director, Dana Motor Cincinnati, Ohio; Secretary-Treasurer, Director Freedom Dodge, Lexington, KY; Secretary, Treasurer, Director Ellerslie Realty Inc., Lexington, KY; Partner, Forkland Development Co., Lexington, KY; Partner, Lexland, Lexington, KY.; Director, First Security Bank, Lexington, KY | | 9 | | First
Security
Bank,
Lexington,
KY |
| | | | | |
LUCY A. BREATHITT 1703 Fairway Drive Lexington, KY 40502 Age: 67 | | Trustee | | Annual
Term
8 years of
service
Trustee | | Alexander Farms, farming; Kentucky Horse Park Foundation Board; Kentucky Horse Park Museum Board, Kentucky State Nature Preserves Commission | | 9 | | |
50
DUPREE MUTUAL FUNDS
NOTES TO FINANCIAL STATEMENTS
June 30, 2004
| 9. | Trustee Information (unaudited), continued: |
Non-Interested Persons, continued:
| | | | | | | | | | |
Name, Address and Age
| | Position(s)
held with
Funds
| | Term of Office
and Length of
Time Served
| | Principal Occupation(s) During Past 5 Years
| | Number of
Portfolios
in Fund
Complex
Overseen
by Trustee
| | Other
Director-ships
Held by
Director
|
C. TIMOTHY CONE 201 West Short Street Lexington, KY 40507 Age: 59 | | Trustee | | Annual
Term
2 years
of
service
Trustee | | President, Gess, Mattingly & Atchison, P.S.C. (law firm) | | 9 | | Advisory
Director
of PNC
Bank,
Kentucky |
| | | | | |
J. WILLIAM HOWERTON 3954 Primrose Place Paducah, KY 42001 Age: 72 | | Trustee | | Annual
Term
4 years
of
service
Trustee | | Judge (retired November 1996) KY Court of Appeals; Lifetime Trustee Paducah Junior College; Self-Employed Mediator, Arbitrator and Special Judge. | | 9 | | |
| | | | | |
WILLIAM S. PATTERSON 367 West Short Street Lexington, KY 40507 Age: 72 | | Trustee | | 25
Years
of
service
Trustee | | President, CEO, Cumberland Surety Co., Lexington, KY, President, Patterson & Co., Frankfort, KY, (real estate development, thoroughbred horse breeding, farming) | | 9 | | |
As of June 30, 2004, none of the non-interested Trustees nor members of their immediate family held any beneficial interest in the Trust’s Investment Adviser, nor were the non-interested Trustees under direct or indirect or common control with the Investment Adviser. Further, the Trust does not have an underwriter.
The Statement of Additional Information (“SAI”) includes additional information about Fund Trustees and is
| available | upon request without charge. Please call (800) 866-0614 to request the SAI. |
A description of the policies and procedures that the Funds use to determine how to vote proxies relating to portfolio securities is available without charge upon request by calling (800) 866-0614, or on the Securities and
| Exchange | Commission’s website at http://www.sec.gov. |
51
Report of Independent Registered Public Accounting Firm
To the Shareholders and
Board of Trustees of Dupree Mutual Funds
We have audited the accompanying statements of assets and liabilities, including the schedules of portfolio investments, of Dupree Mutual Funds (comprised of Alabama Tax-Free Income Series, Kentucky Tax-Free Income Series, Kentucky Tax Free Short-to-Medium Series, Mississippi Tax-Free Income Series, North Carolina Tax-Free Income Series, North Carolina Tax-Free Short-to-Medium Series, Tennessee Tax-Free Income Series, Tennessee Tax-Free Short-to-Medium Series, and Intermediate Government Bond Series) (the “Funds”) as of June 30, 2004, and the related statements of operations for the year then ended, the statements of changes in net assets for each of the two years in the period then ended and the financial highlights for each of the five years or periods in the period then ended. These financial statements and financial highlights are the responsibility of the Funds’ management. Our responsibility is to express an opinion on these financial statements and financial highlights based on our audits.
We conducted our audits in accordance with the standards of the Public Company Accounting Oversight Board (United States). Those standards require that we plan and perform the audits to obtain reasonable assurance about whether the financial statements and financial highlights are free of material misstatement. An audit includes examining, on a test basis, evidence supporting the amounts and disclosures in the financial statements and financial highlights. Our procedures included confirmation of securities owned as of June 30, 2004, by correspondence with the custodian and brokers. An audit also includes assessing the accounting principles used and significant estimates made by management, as well as evaluating the overall financial statement presentation. We believe that our audits provide a reasonable basis for our opinion.
In our opinion, the financial statements and financial highlights referred to above present fairly, in all material respects, the financial position of each of the respective portfolios constituting Dupree Mutual Funds at June 30, 2004, the results of their operations for the year then ended, the changes in their net assets for each of the two years in the period then ended and the financial highlights for each of the five years or periods in the period then ended, in conformity with U.S. generally accepted accounting principles.

Cincinnati, Ohio
August 11, 2004
The registrant has adopted a code of ethics that applies to the principal executive officer, principal financial officer, principal accounting officer and persons performing similar functions. The full text of the Code of Ethics is incorporated by reference from the Form N-CSR filed with the Commission on September 9, 2003.
Item 3. Audit Committee Financial Expert: The board does not have a financial expert serving on the audit committee. The registrant’s audit committee is comprised of all of the non-interested, independent Trustees, who also are a majority of the Board of Trustees. The audit committee believes that the collective experience and expertise of the members in assessing the performance of companies and the evaluation of financial statements is sufficient to assess the issues which can reasonably be expected to be raised by the Trust’s financial statements.
Item 4. Principal Accountant Fees and Services: This information is incorporated by reference in the registrant’s definitive proxy statement to be filed within 120 days of June 30, 2004.
Item 9. Submission of Matters to a Vote of Security Holders: There have been no material changes to the procedures by which shareholders may recommend nominees to the board of directors.
| Item 10. | Controls and Procedures: |
| | (a) | Within 90 days of filing this report the registrant’s principal executive officers have deemed the controls and procedures effective. |
| | (b) | There were no changes in the registrant’s internal controls over financial reporting that occurred during the second fiscal half-year that materially affected, or is reasonably likely to materially affect, the registrant’s internal control over financial reporting. |
| | (a) | (1) Code of Ethics incorporated by reference from Form N-CSR filed with the Commission on September 9, 2003. |
- 3 -
SIGNATURES
Pursuant to the requirements of the Securities Exchange Act of 1934 and the Investment Company Act of 1940, the registrant has duly caused this report to be signed on its behalf by the undersigned, thereunto duly authorized.
| | |
DUPREE MUTUAL FUNDS (Registrant) |
| |
| By | | /s/ THOMAS P. DUPREE, SR. |
| | | Thomas P. Dupree, President |
Date 3rd September, 2004
Pursuant to the requirements of the Securities Exchange Act of 1934 and the Investment Company Act of 1940, this report has been signed below by the following persons on behalf of the registrant and in the capacities and on the dates indicated.
| | |
| |
| By | | /s/ THOMAS P. DUPREE, SR. |
| | | Thomas P. Dupree, Sr., President |
Date 3rd September, 2004
| | |
| |
| By | | /s/ MICHELLE M DRAGOO |
| | | Michelle M. Dragoo, Treasurer |
Date 3rd September, 2004
- 4 -