UNITED STATES
SECURITIES AND EXCHANGE COMMISSION
WASHINGTON, D. C. 20549
FORM N-CSR
CERTIFIED SHAREHOLDER REPORT OF REGISTERED
MANAGEMENT INVESTMENT COMPANIES
Investment Company Act file number 811-2918
DUPREE MUTUAL FUNDS
(Exact Name of Registrant as Specified in Charter)
| | |
125 South Mill Street, Vine Center, Suite 100 Lexington, Kentucky | | 40507 |
| (Address of Principal Executive Offices) | | (Zip Code) |
Thomas P. Dupree
125 South Mill Street, Vine Center, Suite 100
Lexington, Kentucky 40507
(Name and address of agent for service)
Registrant’s Telephone Number, including Area Code (859) 254-7741
Date of fiscal year end: June 30, 2006
Date of reporting period: July 1, 2005 through June 30, 2006
Item 1. Report to Stockholders
DUPREE MUTUAL FUNDS
June 30, 2006
ANNUAL REPORT
TO SHAREHOLDERS
ABOUT DUPREE MUTUAL FUNDS
In 1941, Dupree & Company, Inc., began business in Harlan, Kentucky as a small securities brokerage firm specializing in tax-exempt municipal bonds.
Over the years the firm, which in 1963 moved its offices to Lexington, Kentucky, grew to become a regional leader in public finance, helping to structure complex and innovative municipal bond financing for some of the largest public projects in the Commonwealth of Kentucky.
In 1979, Dupree & Company began what is now Dupree Mutual Funds with the Kentucky Tax-Free Income Series and became the fund’s investment advisor. The fund was one of the first single-state municipal bond funds in the country, and the first mutual fund to invest solely in Kentucky municipal bonds. Since then, several new offerings have been added to the Dupree Mutual Funds family:
Kentucky Tax-Free Short-to-Medium Series in 1987;
Intermediate Government Bond Series in 1992;
Tennessee Tax-Free Income Series in 1993;
Tennessee Tax-Free Short-to-Medium Series in 1994;
North Carolina Tax-Free Income Series in 1995;
North Carolina Tax-Free Short-to-Medium Series in 1995;
Alabama Tax-Free Income Series in 2000, and
Mississippi Tax-Free Income Series in 2000.
Today, after more than 60 years in business, Dupree continues to be a pioneer in the industry. Our Kentucky, Tennessee, and Mississippi Series are currently the ONLY 100% “no-load” municipal bond funds available in those states. No-load means simply that shares of the funds are offered directly to investors with no front or back-end sales charges, as opposed to load funds which are sold through brokerage firms or other institutions.
At Dupree Mutual Funds, our goal is a simple one: to offer investors a high-quality, low-cost way to invest in municipal and government bonds while providing superior service to our shareholders. We encourage you to let us know how we’re doing.
TABLE OF CONTENTS
Financial Statements
| | |
| Management’s Discussion of Fund Performance: | | (Unaudited) |
| Twelve Months Ended June 30, 2006 | | |
The investment objective of our municipal bond funds is to provide as high a level of tax-free income as is consistent with the moderate risk of having a diversified portfolio of high quality bonds. Our eight single state tax-free municipal bond funds do not buy bonds subject to the Alternative Minimum Tax, while also trying to avoid bonds which may become subject to market discount tax rules. We do not try to anticipate market direction; instead, we attempt to buy high quality bonds at the best price possible on the shoulder of the yield curve and hold them in down markets as well as up markets. Similarly, our investment objective for our government bond fund is to provide a high level of stable income derived from securities of the U.S. government and its agencies, without incurring undue risk to principal.
Investors may sometimes fail to understand that as interest rates rise, bond prices fall, and vice versa. No rational discussion of a bond fund’s performance can take place, however, without a clear grasp of this fact. Each individual bond has its own fixed rate of interest; a rate that reflects a going market rate for a bond of that quality and maturity at the time that bond was issued. Over a period of time the going rate for that particular bond will vary as market conditions for interest rates vary. So, for purposes of discussion of bond mutual funds, it is generally sufficient to understand that bond prices fall as interest rates rise, and rise as interest rates fall. Other factors which may influence the performance of a state-specific fund include changes in the ratings assigned to bonds issued by the state or local governments, fluctuations in the specific economies of a given state or changes in revenues received by state or local governments necessary to pay debt service on issued bonds.
The twelve month period ending June 30, 2006 proved to be somewhat of a conundrum to market participants. During this period the Federal Reserve continued to raise short-term interest rates with the fed funds rate rising 200 basis points from 3.25% in June 2005 to 5.25% in June 2006. During this same time period long-term interest rates remained fairly well anchored. This is puzzling, as conventional wisdom would suggest that short-term interest rates and long-term interest rates would move in tandem. Our several Short-to-Medium Series generally underperformed our several Income Series during the period under review due to the substantial actions taken by the Federal Reserve in raising short-term interest rates.
During the past twelve months, we lengthened the average maturities of all three of the Short-to-Medium Series. While the repositioning of the portfolios of the Short-to-Medium Series increased the dividend yield to shareholders it also resulted in some transaction costs that negatively affected the performance of these funds.
i
A discussion of the performance of each of our funds for the twelve month period ending June 30, 2006 follows:
The Kentucky Tax-Free Income Series provided shareholders a positive total return of 0.41% for the one year period ending June 30, 2006. This performance compared favorably with the fund’s comparative index, the 7 year Lehman Brothers Municipal Bond Index, which had a total return of 0.15% for the same period. The Kentucky Short-to-Medium Series also provided shareholders with a positive total return of 0.22% during the period under review compared with a total return of 0.88% for the 3 year Lehman Brothers Municipal Bond Index. The Short-to-Medium Series experienced a net outflow of funds during the period under review which resulted in the liquidation of a number of positions which normally would have been held to maturity thereby negatively impacting the fund’s performance.
Kentucky’s economy performed moderately well during the period under review. General Fund tax revenues increased over the past twelve months and the unemployment rate as of June 2006 was 5.8% versus a 4.6% unemployment rate for the nation as a whole. From March 31, 2005 through March 31, 2006, employment grew by 28,700 jobs, or 1.6 percent, marking the ninth consecutive quarter of job growth. The leisure and hospitality sector added the largest number of new jobs followed by education and health services, trade, transportation and utilities, professional and business services, and construction The Commonwealth of Kentucky maintained its AA- bond credit rating during the period under review.
The Tennessee Tax-Free Income Series provided shareholders with a positive total return of 0.45% for the twelve month period ending June 30, 2006. This performance compared favorably with the fund’s comparative index, the 7 year Lehman Brothers Municipal Bond Index, which had a total return of 0.15% for the same period. The Tennessee Short-to-Medium Series had a total return of -0.10% for the period under review versus a total return of 0.88% for the 3 year Lehman Brothers Municipal Bond Index. The Tennessee Short-to-Medium Series experienced a net outflow of funds during the period under review which resulted in the liquidation of a number of positions that normally would have been held to maturity thereby negatively impacting the fund’s performance.
Tennessee’s economy also performed moderately well during the period under review. The Census Bureau 2005 Estimates of County Population show that the Tennessee population expanded 1.2 percent, or nearly 70,000 individuals, during the past year. As of June 2006, the state’s unemployment rate was 5.6% versus 4.6% for the nation as a whole. Nearly 39,000 jobs were added to Tennessee’s employment base from March 31, 2005 through March 31, 2006, resulting in a 1.4 percent growth rate. The leisure and hospitality, construction, retail, and education and health services sectors contributed to the state’s employment growth. Tennessee maintained its AA general obligation bond credit rating during the period under review.
The North Carolina Tax-Free Income Series provided shareholders with a positive total return of 0.59% for the twelve month period ending June 30, 2006. This
ii
performance compared favorably with the fund’s comparative index, the 7 year Lehman Brothers Municipal Bond Index, which had a total return of 0.15% for the same period. The North Carolina Short-to-Medium Series also provided shareholders with a positive total return of 0.06% for the period under review versus a total return of 0.88% for the 3 year Lehman Brothers Municipal Bond Index. The North Carolina Short-to-Medium Series experienced a net outflow of funds during the period under review which resulted in the liquidation of a number of positions that normally would have been held to maturity thereby negatively impacting the fund’s performance.
North Carolina’s economy expanded at a moderate pace during the period under review. Despite continued layoffs in the textile and apparel sectors, North Carolina unemployment rate as of June 2006 was 4.6% exactly matching the unemployment rate for the nation as a whole. Growth was particularly robust in the residential construction industry with single family permit issuance for the state up more than 10% in first quarter 2006 from a year ago. North Carolina maintained its AAA general obligation bond credit rating during the period under review.
The Alabama Tax-Free Income Series provided shareholders with a positive total return of 0.65% for the twelve month period ending June 30, 2006. This performance compared favorably with the fund’s comparative index, the 7 year Lehman Brothers Municipal Bond Index, which returned 0.15% for the same period.
Alabama’s infrastructure sustained only minor damage from Hurricane Katrina as compared to Mississippi. Alabama’s economy expanded at a moderate pace during the period under review. The state’s unemployment rate as of June 2006 was 3.6% which was below the 4.6% national average. Employment growth in the state has been led by auto-related manufacturing with four major automobile manufacturing plants and more than 300 parts suppliers now located within the state. Alabama maintained its AA general obligation bond credit rating during the period under review.
The Mississippi Tax-Free Income Series had a total return of -1.15% for the twelve month period ending June 30, 2006 compared with a total return of 0.15% for the 10 year Lehman Brothers Municipal Bond Index.
The severe economic dislocation caused by Hurricane Katrina temporarily depressed prices for Mississippi municipal obligations thereby negatively affecting the share price of the fund. Mississippi’s unemployment rate as of June 2006 was 7.1% which is well above the national average. However, going forward it is anticipated that the Mississippi economy should benefit from the significant rebuilding effort concentrated in the coastal areas of the state. In the immediate aftermath of Hurricane Katrina, the state of Mississippi’s general obligation bond credit rating was placed on negative watch; however, in the second quarter of 2006 the national credit rating agencies affirmed the state’s AA general obligation bond credit rating.
iii
It should be noted that the Lehman Brothers Municipal Bond Index is national in scope so it does not necessarily reflect state-specific municipal bond fund performance. Furthermore, an index does not take into account any operating expenses or transaction costs. An investment cannot be made directly in an index.
The Intermediate Government Bond Series had a total return of -0.14% for the twelve month period ending June 30, 2006 compared with a total return of 0.07% for the Lehman Brothers U.S. Government Intermediate Bond Index. The Lehman Brothers U.S. Government Bond Index does not take into account any operating expenses or transaction costs as a real portfolio must.
There seems to be a growing consensus in the market that the Federal Reserve Open Market Committee (FOMC) is nearing an end to increases in the fed funds rate. If, and when this becomes apparent we would expect a gradual rise in bond prices which could last for an extended period of time, especially if subsequently the FOMC begins to reduce the fed funds rate. The result would be some recovery from the price declines of this past year. Of course, political instability in the Middle East and/or volatility in oil prices could upset this outlook in either direction.
Total returns include changes in share price and reinvestment of dividends and capital gains, if any. Performance data quoted represents past performance which is no guarantee of future results. The opinions expressed herein are those of the fund’s portfolio management and are current as of June 30, 2006. They are not guarantees of performance or investment results and should not be taken as investment advice.
iv
The illustrations below provide each Fund’s sector allocation. We hope it will be useful to shareholders as it summarizes key information about each Fund’s investments.
Kentucky Tax-Free Income Series
| | | |
| | | % of
Investments
at market | |
CREDIT QUALITY | | | |
Aaa/AAA | | 77.54 | % |
Aa/AA | | 14.77 | % |
A | | 4.93 | % |
Baa/BBB | | 2.03 | % |
Not Rated | | .73 | % |
| |
COMPOSITION | | | |
Prerefunded | | 5.99 | % |
General Obligation | | 2.46 | % |
Certificates of Participation | | .36 | % |
Lease Revenue | | 8.89 | % |
Municipal Utilities | | 1.87 | % |
Industrial Revenue | | .01 | % |
Hospitals Healthcare | | 4.20 | % |
State and Local Mortgage | | .40 | % |
University Consolidated Education | | .30 | % |
Public Facilities | | .96 | % |
Insured Municipals | | 68.44 | % |
Escrowed to Maturity | | 6.12 | % |
Kentucky Tax-Free Short-to-Medium Series
| | | |
| | | % of
Investments
at market | |
CREDIT QUALITY | | | |
Aaa/AAA | | 56.69 | % |
Aa/AA | | 34.85 | % |
A | | 3.70 | % |
Baa/BBB | | 4.21 | % |
Not Rated | | .55 | % |
| |
COMPOSITION | | | |
Prerefunded | | 1.85 | % |
General Obligation | | 6.10 | % |
Certificates of Participation | | .43 | % |
Lease Revenue | | 22.78 | % |
Municipal Utilities | | 1.67 | % |
Industrial Revenue | | .11 | % |
Hospitals Healthcare | | 10.25 | % |
Insured Municipals | | 53.74 | % |
Escrowed to Maturity | | 3.07 | % |
Alabama Tax-Free Income Series
| | | |
| | | % of
Investments
at market | |
CREDIT QUALITY | | | |
Aaa/AAA | | 73.77 | % |
Aa/AA | | 20.58 | % |
A | | 4.55 | % |
Baa/BBB | | 1.00 | % |
Not Rated | | .10 | % |
| |
COMPOSITION | | | |
Prerefunded | | 2.08 | % |
General Obligation | | 18.94 | % |
Municipal Utilities | | 1.16 | % |
Industrial Revenue | | 1.00 | % |
Hospitals Healthcare | | .77 | % |
University Consolidated Education | | 1.19 | % |
Public Facilities | | 1.96 | % |
Insured Municipals | | 72.90 | % |
Mississippi Tax-Free Income Series
| | | |
| | | % of
Investments
at market | |
CREDIT QUALITY | | | |
Aaa/AAA | | 80.35 | % |
Aa/AA | | 11.25 | % |
A | | 4.15 | % |
Baa/BBB | | 2.97 | % |
Not Rated | | 1.28 | % |
| |
COMPOSITION | | | |
Prerefunded | | 3.84 | % |
General Obligation | | 15.42 | % |
Municipal Utilities | | 1.13 | % |
Public Facilities | | 1.08 | % |
Insured Municipals | | 77.40 | % |
Escrowed to Maturity | | 1.13 | % |
v
The illustrations below provide each Fund’s sector allocation. We hope it will be useful to shareholders as it summarizes key information about each Fund’s investments.
Tennessee Tax-Free Income Series
| | | |
| | | % of
Investments
at market | |
CREDIT QUALITY | | | |
Aaa/AAA | | 58.19 | % |
Aa/AA | | 39.88 | % |
A | | .45 | % |
Baa/BBB | | 1.48 | % |
| |
COMPOSITION | | | |
Prerefunded | | 3.27 | % |
General Obligation | | 18.01 | % |
Lease Revenue | | .30 | % |
Municipal Utilities | | 5.30 | % |
Industrial Revenue | | .22 | % |
Hospitals Healthcare | | 12.29 | % |
State and Local Mortgage | | 4.77 | % |
University Consolidated Education | | 1.98 | % |
Insured Municipals | | 52.45 | % |
Escrowed to Maturity | | 1.41 | % |
Tennessee Tax-Free Short-to-Medium Series
| | | |
| | | % of
Investments
at market | |
CREDIT QUALITY | | | |
Aaa/AAA | | 66.75 | % |
Aa/AA | | 30.85 | % |
A | | .08 | % |
Baa/BBB | | 1.70 | % |
Not Rated | | .62 | % |
| |
COMPOSITION | | | |
Prerefunded | | 2.11 | % |
General Obligation | | 16.75 | % |
Lease Revenue | | 1.72 | % |
Municipal Utilities | | 1.85 | % |
Hospitals Healthcare | | 5.42 | % |
State and Local Mortgage | | .64 | % |
University Consolidated Education | | 2.41 | % |
Insured Municipals | | 69.10 | % |
North Carolina Tax-Free Income Series
| | | |
| | | % of
Investments
at market | |
CREDIT QUALITY | | | |
Aaa/AAA | | 68.83 | % |
Aa/AA | | 25.82 | % |
A | | 5.35 | % |
| |
COMPOSITION | | | |
Prerefunded | | 12.71 | % |
General Obligation | | 2.22 | % |
Certificates of Participation | | 10.19 | % |
Lease Revenue | | 2.16 | % |
Municipal Utilities | | 1.16 | % |
Hospitals Healthcare | | 4.24 | % |
State and Local Mortgage | | .57 | % |
Public Facilities | | 1.52 | % |
Insured Municipals | | 64.52 | % |
Escrowed to Maturity | | .71 | % |
North Carolina Tax-Free Short-to-Medium Series
| | | |
| | | % of
Investments
at market | |
CREDIT QUALITY | | | |
Aaa/AAA | | 71.39 | % |
Aa/AA | | 25.68 | % |
A | | 2.93 | % |
| |
COMPOSITION | | | |
Prerefunded | | 3.46 | % |
General Obligation | | 5.28 | % |
Certificates of Participation | | 8.52 | % |
Lease Revenue | | 6.65 | % |
Hospitals Healthcare | | 6.85 | % |
University Consolidated Education | | 3.88 | % |
Insured Municipals | | 65.36 | % |
Intermediate Government Bond Series
| | | |
| | | % of
Investments
at market | |
CREDIT QUALITY | | | |
Aaa/AAA | | 100.00 | % |
| |
COMPOSITION | | | |
Federal Farm Credit Banks | | 14.29 | % |
Federal Home Loan Banks | | 48.58 | % |
Federal Home Loan Mortgage | | 8.84 | % |
Federal National Mortgage | | 23.07 | % |
Student Loan Mortgage | | 5.22 | % |
vi
PERFORMANCE COMPARISON (Unaudited)
The following graphs compare the change in value of a $10,000 investment in each series of Dupree Mutual Funds with the change in value of a $10,000 investment in a comparable index. The comparisons are made over ten years or since the inception of the series, if shorter than ten years. Results are for the fiscal years ended June 30.
vii
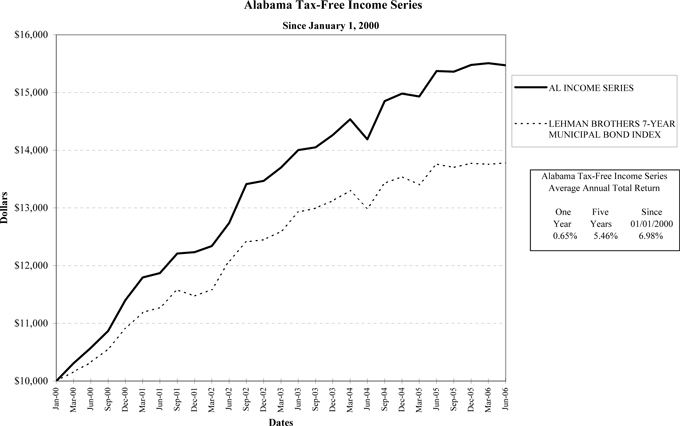
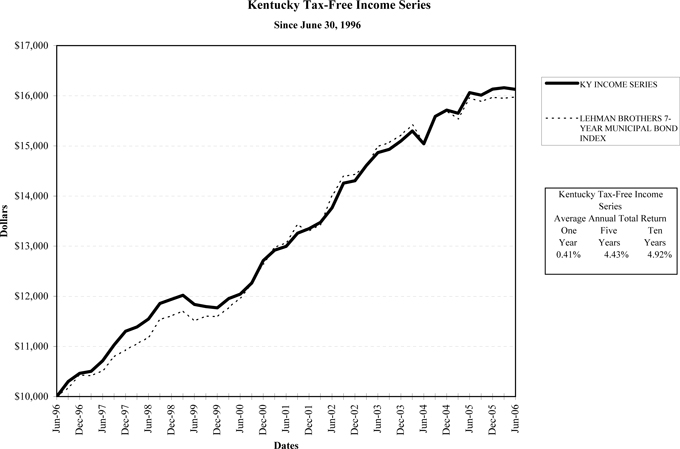
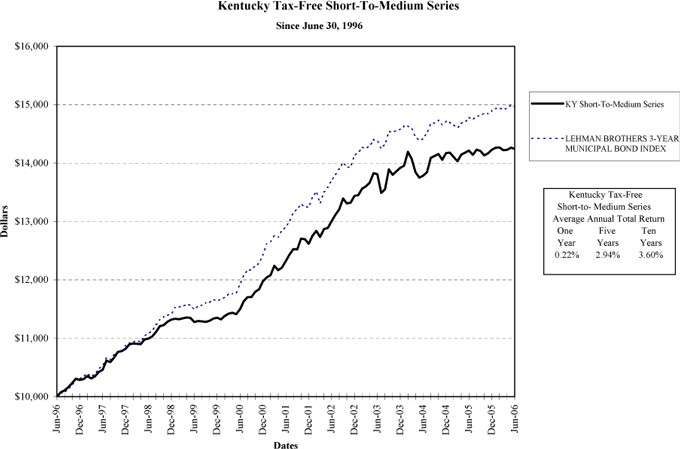
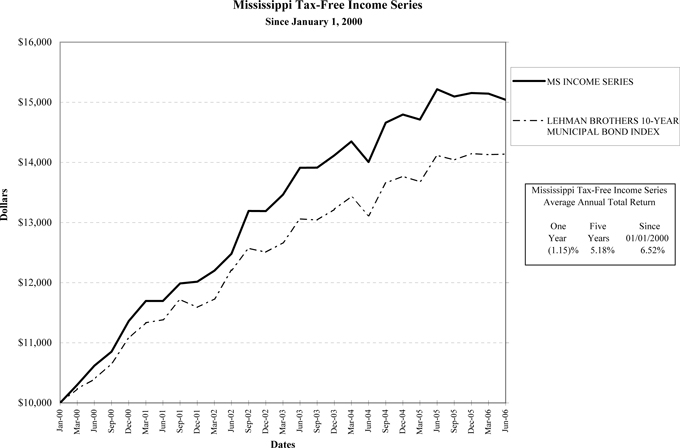
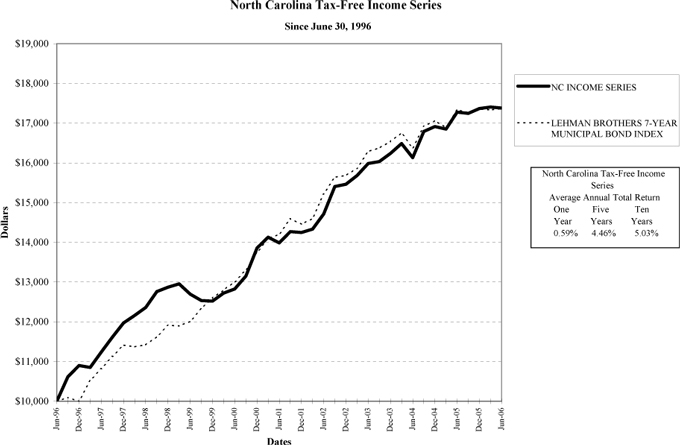
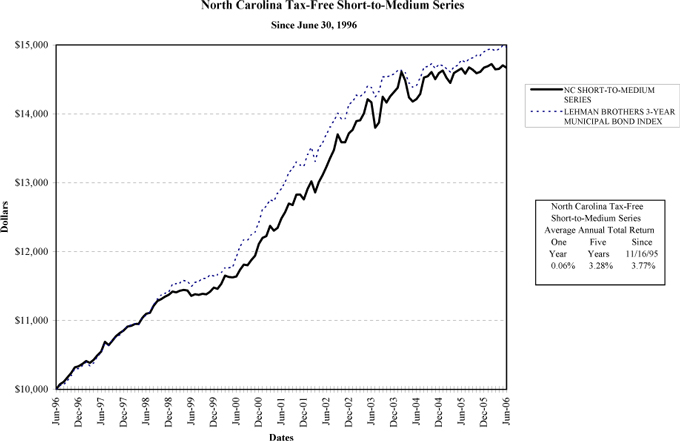
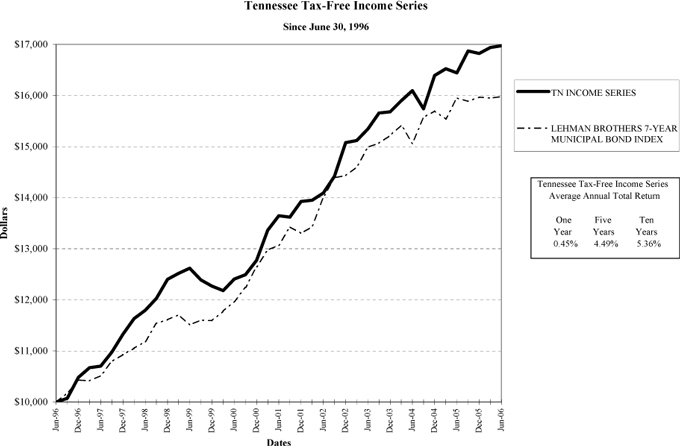
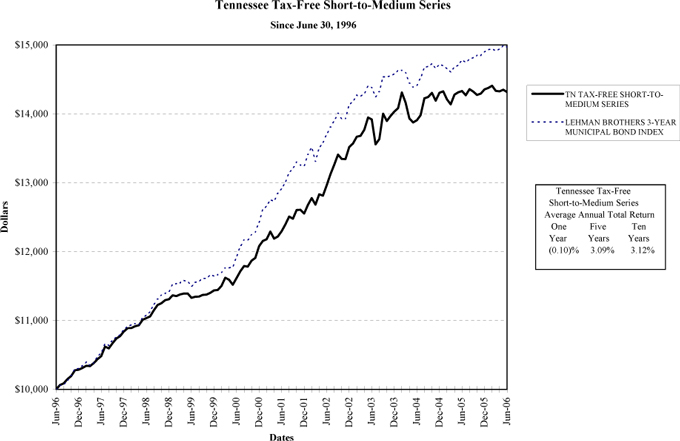
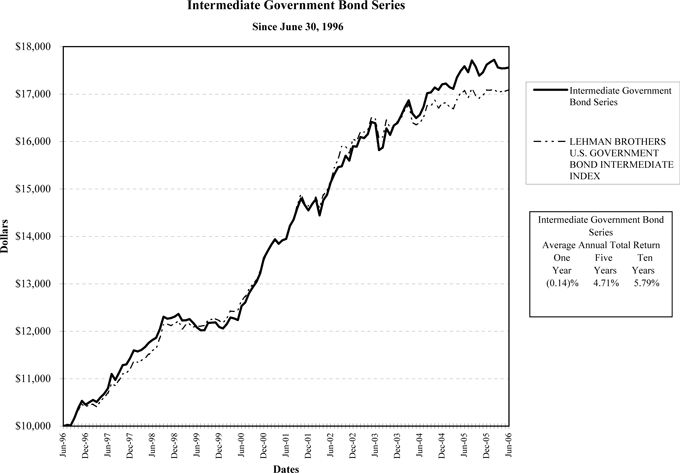
Notes on Graphs:
Results reflect reinvestment of all dividend and capital gain distributions. For each series, we have chosen an index that approximates the average maturity of the compared series. The investor should understand that an index is a mathematical hypothesis and does not reflect a real market situation. For example, the portfolio of each index is replaced with an entirely different portfolio each year without reflecting operating expenses or transaction costs, an impossibility in reality. On the other hand, the fund’s performance reflects not only these factors but management costs as well. Past performance is not indicative of future results.
The performance tables and the graphs above do not reflect the deduction of taxes that a shareholder would pay on fund distributions or the redemption of fund shares.
DUPREE MUTUAL FUNDS - ALABAMA TAX-FREE INCOME SERIES
SCHEDULE OF PORTFOLIO INVESTMENTS
Alabama Municipal Bonds — 100%
June 30, 2006
| | | | | | | | | | | | | |
Bond Description | | Coupon | | | Maturity Date | | Rating# | | Par Value | | Market Value |
INSURED MUNICIPAL REVENUE BONDS | | | | | | | | | | | | | |
71.22% of Net Assets | | | | | | | | | | | | | |
AL Agriculture & Mechanical University Revenue | | 5.000 | % | | 11/01/2025 | | Aaa/AAA*/AAA@ | | $ | 100,000 | | $ | 101,666 |
AL Housing Financial Authority Single Family Mortgage | | 5.050 | | | 10/01/2013 | | Aaa | | | 10,000 | | | 10,149 |
Alabama Private Colleges & University Facilities Authority | | 5.900 | | | 09/01/2016 | | Aaa/AAA*/AAA@ | | | 10,000 | | | 10,243 |
AL State Board Education Bishop State Community College | | 4.600 | | | 01/01/2021 | | Aaa/AAA@ | | | 100,000 | | | 100,334 |
Al State Board of Education Revenue Bonds Calhoun Community | | 5.000 | | | 05/01/2022 | | Aaa/AAA@ | | | 450,000 | | | 465,222 |
Alabama State Docks Department Docks Facilities Revenue | | 5.500 | | | 10/01/2022 | | Aaa/AAA*/AAA@ | | | 110,000 | | | 115,135 |
AL State University Revenue General Tuition & Fee -Series A | | 5.000 | | | 01/01/2019 | | Aaa/AAA*/AAA@ | | | 50,000 | | | 51,824 |
AL Water Pollution Control Authority Revolving Fund Loan | | 5.500 | | | 08/15/2016 | | Aaa/AAA* | | | 10,000 | | | 10,025 |
AL Water Pollution Control Authority Revolving Fund Loan | | 4.800 | | | 08/15/2018 | | Aaa/AAA*/AAA@ | | | 50,000 | | | 51,035 |
AL Water Pollution Control Authority Revolving Fund Loan | | 4.800 | | | 08/15/2022 | | Aaa/AAA*/AAA@ | | | 170,000 | | | 171,914 |
AL Water Pollution Control Authority Revolving Fund Loan | | 5.000 | | | 08/15/2026 | | Aaa/AAA*/AAA@ | | | 130,000 | | | 132,711 |
Alexander City AL Warrants | | 4.700 | | | 05/01/2021 | | Aaa/AAA*/AAA@ | | | 200,000 | | | 201,850 |
Baldwin County AL Water and Sewer Series A General Obligation | | 5.000 | | | 01/01/2025 | | Aaa/AAA* | | | 295,000 | | | 304,231 |
Birmingham AL General Obligation Bonds Series A | | 5.125 | | | 11/01/2022 | | Aaa/AAA*/AAA@ | | | 100,000 | | | 104,560 |
Birmingham AL Special Care Facilities Financing | | 5.000 | | | 06/01/2020 | | Aaa/AAA* | | | 100,000 | | | 102,152 |
Birmingham AL Multifamily Housing Revenue Beaconview | | 5.600 | | | 07/01/2020 | | Aaa/AAA*/AAA@ | | | 20,000 | | | 20,244 |
Blount County AL Water Authority Revenue | | 5.750 | | | 08/01/2019 | | Aaa/AAA*/AAA@ | | | 125,000 | | | 133,839 |
Central Elmore AL Water & Sewer | | 5.000 | | | 07/01/2021 | | Aaa/AAA*/AAA@ | | | 100,000 | | | 103,403 |
Choctaw County AL Revenue School Warrants | | 4.700 | | | 03/01/2017 | | A* | | | 200,000 | | | 196,368 |
Colbert County Northwest AL Health Care Facility | | 5.750 | | | 06/01/2015 | | Aaa/AAA*/AAA@ | | | 10,000 | | | 10,102 |
Colbert County-Northwest AL Healthcare Authority | | 5.750 | | | 06/01/2020 | | Aaa/AAA*/AAA@ | | | 20,000 | | | 20,203 |
Daphne AL Warrants | | 5.000 | | | 04/01/2023 | | Aaa/AAA* | | | 250,000 | | | 259,163 |
East AL Health Care Authority Health Care Facilities Revenue | | 5.200 | | | 09/01/2023 | | AAA*/AAA@ | | | 260,000 | | | 267,834 |
Enterprise AL Water General Obligation | | 5.000 | | | 10/01/2019 | | Aaa/AAA*/AAA@ | | | 55,000 | | | 57,105 |
Enterprise AL Water General Obligation | | 5.000 | | | 10/01/2023 | | Aaa/AAA*/AAA@ | | | 450,000 | | | 463,770 |
Gasden AL Warrants - Series B | | 4.600 | | | 08/01/2022 | | Aaa/AAA@ | | | 100,000 | | | 99,996 |
Hoover AL Board of Education Capital Outlay Warrants | | 5.250 | | | 02/15/2026 | | Aaa/AAA*/AAA@ | | | 35,000 | | | 36,231 |
Huntsville AL Capital Improvement Warrants - Series C | | 4.500 | | | 11/01/2021 | | Aaa/AAA*/AAA@ | | | 200,000 | | | 199,330 |
Huntsville AL Health Care Authority Series A | | 5.000 | | | 06/01/2023 | | Aaa/AAA*/AAA@ | | | 140,000 | | | 142,733 |
Huntsville AL Health Care Authority Series A Revenue | | 5.000 | | | 06/01/2024 | | Aaa/AAA* | | | 100,000 | | | 102,234 |
Huntsville AL Health Care Authority Series A | | 5.400 | | | 06/01/2022 | | Aaa/AAA*/AAA@ | | | 50,000 | | | 53,055 |
Huntsville AL Public Building Authority Lease Revenue | | 5.125 | | | 10/01/2022 | | Aaa/AAA*/AAA@ | | | 200,000 | | | 208,906 |
Huntsville AL Public Educational Building - A&M | | 5.600 | | | 06/01/2014 | | A* | | | 20,000 | | | 20,873 |
Huntsville AL Public Educational Building | | 6.050 | | | 06/01/2020 | | A* | | | 150,000 | | | 157,131 |
Jasper AL Waterworks & Sewer Board Water & Sewer Revenue | | 5.100 | | | 06/01/2018 | | Aaa/AAA*/AAA@ | | | 30,000 | | | 31,321 |
Jasper AL Waterworks & Sewer Board Water & Sewer Revenue | | 5.200 | | | 06/01/2021 | | Aaa/AAA*/AAA@ | | | 50,000 | | | 52,381 |
Jasper AL Waterworks & Sewer Board Water & Sewer Revenue | | 5.125 | | | 06/01/2026 | | Aaa/AAA*/AAA@ | | | 75,000 | | | 77,213 |
Jefferson County AL Sewer Revenue Capital Improvement | | 5.000 | | | 02/01/2020 | | Aaa/AAA*/AAA@ | | | 50,000 | | | 51,395 |
Lauderdale County & Florence AL Health Care Authority | | 5.250 | | | 07/01/2019 | | Aaa/AAA*/AAA@ | | | 30,000 | | | 31,110 |
Lee County AL School Warrants | | 5.000 | | | 02/01/2018 | | Aaa/AAA@ | | | 100,000 | | | 103,625 |
Lee County AL School Warrants Limited Obligation | | 5.000 | | | 02/01/2021 | | Aaa/AAA@ | | | 75,000 | | | 77,330 |
Limestone County AL Water & Sewer Authority Water Revenue | | 5.000 | | | 12/01/2029 | | Aaa | | | 275,000 | | | 280,657 |
Linden AL Warrants | | 5.250 | | | 06/01/2023 | | AA* | | | 25,000 | | | 25,728 |
Madison AL School Warrants - Series B | | 5.000 | | | 02/01/2023 | | Aaa/AAA*/AAA@ | | | 150,000 | | | 154,052 |
Madison AL Refunding Warrants | | 5.000 | | | 04/01/2021 | | Aaa/AAA*/AAA@ | | | 350,000 | | | 364,763 |
Mobile AL Limited Obligation Tax Warrants | | 5.500 | | | 02/15/2023 | | A1 | | | 35,000 | | | 35,873 |
Montgomery AL Waterworks & Sanitary Sewer Board | | 5.000 | | | 09/01/2019 | | Aaa/AAA*/AAA@ | | | 50,000 | | | 51,712 |
Montgomery AL Waterworks & Sanitation Sewer Board Revenue | | 5.000 | | | 03/01/2025 | | Aaa/AAA*/AAA@ | | | 250,000 | | | 257,788 |
Morgan County AL Water and Sewer General Obligation Warrants | | 5.000 | | | 04/01/2028 | | Aaa | | | 100,000 | | | 102,249 |
Muscle Shoals AL Refunded Warrants | | 4.600 | | | 08/01/2024 | | Aaa/AAA*/AAA@ | | | 250,000 | | | 250,323 |
Phenix City AL School Warrants | | 5.450 | | | 08/01/2016 | | Aaa/AAA*/AAA@ | | | 10,000 | | | 10,735 |
Roanoke AL Warrants | | 4.450 | | | 05/01/2020 | | Aaa/AAA*/AAA@ | | | 150,000 | | | 150,834 |
St Clair County AL Board Education School Tax Warrants | | 4.400 | | | 02/01/2022 | | Aaa/AAA*/AAA@ | | | 50,000 | | | 49,058 |
Shelby County AL Board of Education Special Tax School Warrants | | 5.000 | | | 02/01/2025 | | Aaa/AAA* | | | 300,000 | | | 309,207 |
Southeast AL Gas District System Revenue Series A | | 5.500 | | | 06/01/2020 | | Aaa/AAA@ | | | 10,000 | | | 10,718 |
Talladega County AL Industrial Development Revenue | | 4.700 | | | 01/01/2022 | | Aaa/AAA@ | | | 100,000 | | | 101,470 |
Trussville AL Warrants | | 4.800 | | | 10/01/2021 | | Aaa/AAA@ | | | 85,000 | | | 86,400 |
Tuskegee AL Utilities Board Utilities Revenue | | 5.500 | | | 02/01/2022 | | Aaa/AAA* | | | 70,000 | | | 72,066 |
University AL University Revenue Hospital - Series A | | 5.400 | | | 09/01/2013 | | Aaa/AAA*/AAA@ | | | 50,000 | | | 53,144 |
University of Southern AL University Revenue & Capital | | 5.000 | | | 03/15/2021 | | Aaa/AAA@ | | | 370,000 | | | 382,158 |
| | | | | | | | | | | | | |
| | | | | | | | | | | | | 7,658,881 |
GENERAL OBLIGATION BONDS | | | | | | | | | | | | | |
18.51% of Net Assets | | | | | | | | | | | | | |
AL State - Series A | | 5.000 | | | 06/01/2019 | | Aa3/AA* | | | 30,000 | | | 30,880 |
AL State Series A | | 5.000 | | | 06/01/2020 | | Aa3/AA* | | | 100,000 | | | 103,005 |
Alabama State Series B | | 5.000 | | | 06/01/2021 | | Aa3/AA* | | | 30,000 | | | 30,749 |
Alabama State - Series A | | 4.625 | | | 09/01/2022 | | Aa3/AA* | | | 100,000 | | | 100,356 |
Alabama 21st Century Authority Tobacco Settlement Revenue | | 5.750 | | | 12/01/2020 | | Baa1/A-* | | | 50,000 | | | 51,873 |
Alabama 21st Century Authority Tobacco Settlement Revenue | | 5.850 | | | 12/01/2013 | | Baa1/A-* | | | 15,000 | | | 16,112 |
Birmingham AL Warrants | | 4.900 | | | 01/01/2018 | | Aa3/AA*/AA-@ | | | 150,000 | | | 152,702 |
Birmingham AL Warrants | | 4.750 | | | 01/01/2023 | | Aa3/AA*/AA-@ | | | 225,000 | | | 226,296 |
The accompanying notes are an integral part of the financial statements.
1
DUPREE MUTUAL FUNDS - ALABAMA TAX-FREE INCOME SERIES
SCHEDULE OF PORTFOLIO INVESTMENTS
Alabama Municipal Bonds — 100%
June 30, 2006
| | | | | | | | | | | | | |
Bond Description | | Coupon | | | Maturity Date | | Rating# | | Par Value | | Market Value |
Birmingham AL Capital Improvement Warrants - Series A | | 5.500 | % | | 08/01/2025 | | Aa3/AA*/AA-@ | | $ | 100,000 | | $ | 105,597 |
Birmingham AL Referral Warrants - Series A | | 5.250 | | | 05/01/2018 | | Aa3/AA*/AA-@ | | | 300,000 | | | 318,783 |
Madison AL Warrants - Series C | | 5.000 | | | 09/01/2018 | | Aaa/AAA*/AAA@ | | | 250,000 | | | 258,140 |
Montgomery AL Warrants - Series C General Obligation | | 5.000 | | | 01/01/2023 | | Aa2/AA*/AAA@ | | | 580,000 | | | 595,898 |
| | | | | | | | | | | | | |
| | | | | | | | | | | | | 1,990,391 |
PREREFUNDED BONDS | | | | | | | | | | | | | |
2.03% of Net Assets | | | | | | | | | | | | | |
Fairhope AL Utilities Revenue Warrants | | 5.750 | | | 12/01/2021 | | Aaa/AAA* | | | 25,000 | | | 25,703 |
Hoover AL Warrants Series A | | 5.650 | | | 01/01/2014 | | Aa3/AA* | | | 10,000 | | | 10,679 |
Jefferson County AL Board of Education Capital Outlay | | 5.800 | | | 02/15/2020 | | AAA*/AAA@ | | | 10,000 | | | 10,319 |
Montgomery AL BMC Special Care Facilities Financing Authority | | 5.000 | | | 11/15/2029 | | Aaa/AAA* | | | 85,000 | | | 86,978 |
Nortwest AL Gas District Gas System Revenue | | 5.900 | | | 05/01/2020 | | Aaa/AAA@ | | | 35,000 | | | 36,923 |
St Clair County Board of Education School Tax Anticipation | | 5.500 | | | 02/01/2016 | | Aaa/AAA*/AAA@ | | | 10,000 | | | 10,508 |
University of Alabama Revenue - Birmingham | | 6.000 | | | 10/01/2020 | | Aaa/AAA*/AAA@ | | | 25,000 | | | 26,658 |
University of Alabama University Revenue-Huntsville | | 5.750 | | | 12/01/2016 | | Aaa/AAA*/AAA@ | | | 10,000 | | | 10,282 |
| | | | | | | | | | | | | |
| | | | | | | | | | | | | 218,050 |
PUBLIC FACILITIES REVENUE BONDS | | | | | | | | | | | | | |
1.91% of Net Assets | | | | | | | | | | | | | |
AL State Public Schools & College Authority - Series B | | 5.000 | | | 12/01/2021 | | Aa3/AA* | | | 190,000 | | | 195,345 |
Rockford AL Public Building Authority Building Revenue | | 5.750 | | | 09/01/2015 | | NR | | | 10,000 | | | 10,370 |
| | | | | | | | | | | | | |
| | | | | | | | | | | | | 205,715 |
UNIVERSITY CONSOLIDATED EDUCATION & HOUSING | | | | | | | | | | | | | |
1.16% of Net Assets | | | | | | | | | | | | | |
Mobile AL Spring Hill College Educational Building | | 5.100 | | | 09/01/2019 | | Aa3 | | | 120,000 | | | 124,817 |
| | | | | | | | | | | | | |
| | | | | | | | | | | | | 124,817 |
MUNICIPAL UTILITIES | | | | | | | | | | | | | |
1.13% of Net Assets | | | | | | | | | | | | | |
Birmingham AL Water & Sewer Revenue Warrants - Series A | | 5.125 | | | 01/01/2017 | | A2/AA-* | | | 20,000 | | | 20,761 |
Birmingham AL Water & Sewer Revenue Warrants - Series A | | 4.750 | | | 01/01/2021 | | A2/AA-* | | | 100,000 | | | 100,963 |
| | | | | | | | | | | | | |
| | | | | | | | | | | | | 121,724 |
INDUSTRIAL REVENUE BONDS | | | | | | | | | | | | | |
.98% of Net Assets | | | | | | | | | | | | | |
Auburn AL Industrial Development Board Facilities Revenue | | 5.800 | | | 11/01/2011 | | BBB* | | | 75,000 | | | 79,157 |
Auburn AL Industrial Development Board Facilities Revenue | | 6.200 | | | 11/01/2020 | | BBB* | | | 25,000 | | | 26,254 |
| | | | | | | | | | | | | |
| | | | | | | | | | | | | 105,411 |
HOSPITALS AND HEALTHCARE | | | | | | | | | | | | | |
.76% of Net Assets | | | | | | | | | | | | | |
Mobile AL Second Medical Clinic Board Revenue Franklin | | 5.050 | | | 03/01/2018 | | Aa3 | | | 50,000 | | | 50,278 |
Montgomery AL Baptist Medical Center Special Care | | 5.375 | | | 09/01/2022 | | Aaa/AAA* | | | 30,000 | | | 31,024 |
| | | | | | | | | | | | | |
| | | | | | | | | | | | | 81,302 |
| | | | | | | | | | | | | |
Total Investments (cost $10,511,119)(See (a) below for further explanation) - 97.70% of Net Assets | | | | | | | | | | | | $ | 10,506,291 |
| | | | | | | | | | | | | |
| * | Standard and Poor’s Corporation |
| @ | Fitch’s Investors Service |
| | All other ratings by Moody’s Investors Service, Inc. |
| # | Bond ratings are unaudited. |
| (a) | Represents cost for financial reporting and federal income tax purposes and differs from market value by net unrealized appreciation of securities as follows: |
| | | | |
Unrealized appreciation | | $ | 117,112 | |
Unrealized depreciation | | | (121,940 | ) |
| | | | |
Net unrealized appreciation | | $ | (4,828 | ) |
| | | | |
The accompanying notes are an integral part of the financial statements.
2
DUPREE MUTUAL FUNDS - ALABAMA TAX-FREE INCOME SERIES
STATEMENT OF ASSETS AND LIABILITIES
JUNE 30, 2006
| | | | | | |
ASSETS: | | | | | | |
Investments in securities, at value (Cost: $10,511,119) | | | | $ | 10,506,291 | |
Cash | | | | | 136,373 | |
Interest receivable | | | | | 148,787 | |
| | | | | | |
Total assets | | | | | 10,791,451 | |
LIABILITIES: | | | | | | |
Payable for: | | | | | | |
Distributions to shareholders | | 30,495 | | | | |
Investment advisory fee | | 2,609 | | | | |
Transfer agent fee | | 2,002 | | | | |
Trustee fee | | 654 | | | | |
Accrued expenses | | 1,774 | | | | |
Total liabilities | | | | | 37,534 | |
| | | | | | |
NET ASSETS: | | | | | | |
Capital | | | | | 10,765,263 | |
Net accumulated realized loss on investment transactions | | | | | (6,518 | ) |
Net unrealized depreciation in value of investments | | | | | (4,828 | ) |
| | | | | | |
Net assets at value | | | | $ | 10,753,917 | |
| | | | | | |
NET ASSET VALUE, offering price and redemption price per share ($10,753,917 -:- 933,858 shares outstanding; unlimited number of shares authorized; no par value) | | | | $ | 11.52 | |
| | | | | | |
STATEMENT OF OPERATIONS
For the year ended June 30, 2006
| | | | |
Net investment income: | | | | |
Interest income | | $ | 411,617 | |
| | | | |
Expenses: | | | | |
Investment advisory fee | | | 46,424 | |
Transfer agent fee | | | 13,927 | |
Custodian expense | | | 4,800 | |
Pricing fees | | | 4,057 | |
Professional fees | | | 4,413 | |
Trustee fees | | | 857 | |
Other expenses | | | 8,171 | |
| | | | |
Total expenses | | | 82,649 | |
Fees waived by Adviser | | | (34,855 | ) |
Custodian expense reduction | | | (4,800 | ) |
| | | | |
Net expenses | | | 42,994 | |
| | | | |
Net investment income | | | 368,623 | |
| | | | |
Realized and unrealized loss on investments: | | | | |
Net realized loss | | | (2,170 | ) |
Net decrease in unrealized appreciation | | | (320,339 | ) |
| | | | |
Net realized and unrealized loss on investments | | | (322,509 | ) |
| | | | |
Net increase in net assets resulting from operations | | $ | 46,114 | |
| | | | |
The accompanying notes are an integral part of the financial statements.
3
DUPREE MUTUAL FUNDS - ALABAMA TAX-FREE INCOME SERIES
STATEMENTS OF CHANGES IN NET ASSETS
For the years ended June 30, 2006 and 2005
| | | | | | | | |
| | | 2006 | | | 2005 | |
Increase in net assets: | | | | | | | | |
Operations: | | | | | | | | |
Net investment income | | $ | 368,623 | | | $ | 273,588 | |
Net realized (loss)/gain on investments | | | (2,170 | ) | | | 5,456 | |
Net (decrease)/increase in unrealized appreciation | | | (320,339 | ) | | | 226,824 | |
| | | | | | | | |
Net increase in net assets resulting from operations | | | 46,114 | | | | 505,868 | |
Distributions to shareholders from net investment income | | | (368,623 | ) | | | (273,588 | ) |
Net fund share transactions (Note 4) | | | 3,275,939 | | | | 2,295,369 | |
| | | | | | | | |
Total increase | | | 2,953,430 | | | | 2,527,649 | |
Net assets: | | | | | | | | |
Beginning of year | | | 7,800,487 | | | | 5,272,838 | |
| | | | | | | | |
End of year | | $ | 10,753,917 | | | $ | 7,800,487 | |
| | | | | | | | |
FINANCIAL HIGHLIGHTS
Selected data for a share outstanding:
| | | | | | | | | | | | | | | | | | | | |
| | | For the years ended June 30, | |
| | | 2006 | | | 2005 | | | 2004 | | | 2003 | | | 2002 | |
Net asset value, beginning of year | | $ | 11.91 | | | $ | 11.45 | | | $ | 11.80 | | | $ | 11.22 | | | $ | 10.99 | |
| | | | | | | | | | | | | | | | | | | | |
Income from investment operations: | | | | | | | | | | | | | | | | | | | | |
Net investment income | | | 0.47 | | | | 0.48 | | | | 0.51 | | | | 0.52 | | | | 0.56 | |
Net gains/(losses) on securities, both realized and unrealized | | | (0.39 | ) | | | 0.46 | | | | (0.35 | ) | | | 0.58 | | | | 0.23 | |
| | | | | | | | | | | | | | | | | | | | |
Total from investment operations | | | 0.08 | | | | 0.94 | | | | 0.16 | | | | 1.10 | | | | 0.79 | |
Less distributions: | | | | | | | | | | | | | | | | | | | | |
Distributions from net investment income | | | (0.47 | ) | | | (0.48 | ) | | | (0.51 | ) | | | (0.52 | ) | | | (0.56 | ) |
| | | | | | | | | | | | | | | | | | | | |
Net asset value, end of year | | $ | 11.52 | | | $ | 11.91 | | | $ | 11.45 | | | $ | 11.80 | | | $ | 11.22 | |
| | | | | | | | | | | | | | | | | | | | |
Total return | | | 0.65 | % | | | 8.36 | % | | | 1.36 | % | | | 9.98 | % | | | 7.32 | % |
Net assets, end of year (in thousands) | | $ | 10,754 | | | $ | 7,800 | | | $ | 5,273 | | | $ | 4,615 | | | $ | 2,404 | |
Ratio of net expenses to average net assets (a) | | | 0.46 | % | | | 0.46 | % | | | 0.40 | % | | | 0.33 | % | | | 0.28 | % |
Ratio of net investment income to average net assets | | | 3.97 | % | | | 4.08 | % | | | 4.36 | % | | | 4.46 | % | | | 4.99 | % |
Portfolio turnover | | | 7.72 | % | | | 3.96 | % | | | 16.43 | % | | | 6.24 | % | | | 18.15 | % |
| (a) | Percentages are after expenses waived by Adviser and custodian and interest expense reductions. |
Expenses waived by Adviser and custodian and interest expense reductions were:
.38% and .05% for 2006; .36% and .08% for 2005; .41% and .10% for 2004; .50% and .12% for 2003; and .53% and .23% for 2002, respectively.
The accompanying notes are an integral part of the financial statements.
4
DUPREE MUTUAL FUNDS - KENTUCKY TAX-FREE INCOME SERIES
SCHEDULE OF PORTFOLIO INVESTMENTS
Kentucky Municipal Bonds — 100%
June 30, 2006
| | | | | | | | | | | | | |
Bond Description | | Coupon | | | Maturity Date | | Rating# | | Par Value | | Market Value |
INSURED MUNICIPAL REVENUE BONDS | | | | | | | | | | | | | |
68.27% of Net Assets | | | | | | | | | | | | | |
Ballard County School District Finance Corporation | | 5.000 | % | | 06/01/2020 | | Aaa/AAA@ | | $ | 1,240,000 | | $ | 1,286,723 |
Bardstown KY Combined Utilities Revenue | | 5.000 | | | 12/01/2017 | | Aaa/AAA@ | | | 1,290,000 | | | 1,346,696 |
Bardstown KY Combined Utilities Revenue | | 5.000 | | | 12/01/2018 | | Aaa/A2*/AAA@ | | | 1,510,000 | | | 1,573,873 |
Barren County School District Finance Corporation | | 4.750 | | | 08/01/2022 | | Aaa/Aa3*/AAA@ | | | 3,085,000 | | | 3,144,016 |
Boone County Pollution Control Revenue - Dayton Power | | 4.700 | | | 01/01/2028 | | Aaa/AAA*/AAA@ | | | 8,595,000 | | | 8,491,860 |
Boone County School District Finance Corporation | | 5.000 | | | 05/01/2023 | | Aaa/AAA* | | | 4,070,000 | | | 4,189,332 |
Boone County School District Finance Corporation | | 5.000 | | | 05/01/2024 | | Aaa/AAA* | | | 4,265,000 | | | 4,395,722 |
Boone County KY Water - Florence | | 5.000 | | | 12/01/2015 | | Aaa/AAA* | | | 1,000,000 | | | 1,042,900 |
Boone-Florence KY Water Supply System Revenue | | 5.000 | | | 12/01/2017 | | Aaa/AAA* | | | 1,805,000 | | | 1,874,438 |
Boone-Florence KY Water Supply System Revenue | | 5.000 | | | 12/01/2018 | | Aaa/AAA* | | | 1,900,000 | | | 1,970,300 |
Boone-Florence County KY Water Supply System Revenue | | 5.000 | | | 12/01/2020 | | Aaa/AAA* | | | 2,100,000 | | | 2,173,584 |
Bullitt County School District Finance Corporation | | 4.750 | | | 07/01/2022 | | Aaa/AAA@ | | | 2,440,000 | | | 2,485,506 |
Bullitt Co School District Finance Corporation | | 4.500 | | | 10/01/2024 | | Aaa/AAA@ | | | 2,720,000 | | | 2,709,746 |
Cambell & Kenton Counties Sanitation District Number 1 | | 5.000 | | | 08/01/2017 | | Aaa/AAA*/AAA@ | | | 1,000,000 | | | 1,037,630 |
Carrollton & Henderson KY Public Energy Authority Gas Revenue | | 5.000 | | | 01/01/2007 | | Aaa/AAA*/AAA@ | | | 1,000,000 | | | 1,006,910 |
Carter County Detention Center | | 5.125 | | | 05/01/2029 | | Aaa/AAA* | | | 960,000 | | | 1,001,578 |
Easter Kentucky University Consolidated Educational Building | | 5.000 | | | 05/01/2021 | | Aaa/AAA* | | | 1,580,000 | | | 1,635,806 |
Fayette County KY School District Finance Corporation | | 5.250 | | | 04/01/2021 | | Aaa/AAA*/AAA@ | | | 2,285,000 | | | 2,399,936 |
Fayette County School District Finance Corporation | | 5.000 | | | 04/01/2024 | | Aaa/AAA*/AAA@ | | | 6,985,000 | | | 7,219,556 |
Fayette County School District Finance Corporation | | 5.000 | | | 04/01/2025 | | Aaa/AAA*/AAA@ | | | 7,340,000 | | | 7,607,910 |
Fayette County School District Finance Corporation | | 4.500 | | | 03/01/2022 | | Aaa/AA-*/AAA@ | | | 4,100,000 | | | 4,102,091 |
Greater KY Housing Assistance Corporation-Chenowith Woods | | 6.100 | | | 01/01/2024 | | Aaa/AAA*/AAA@ | | | 780,000 | | | 780,398 |
Greater Ky Housing Assistance Corporation-Northside Apts | | 6.200 | | | 02/01/2025 | | AAA* | | | 3,340,000 | | | 3,340,000 |
Greater KY Housing Assistance Corporation Mortgage Revenue | | 5.450 | | | 05/20/2027 | | Aaa | | | 1,245,000 | | | 1,283,832 |
Jefferson County KY Health Facilities-Jewish Hospital | | 5.650 | | | 01/01/2017 | | Aaa/AAA* | | | 3,450,000 | | | 3,550,913 |
Jefferson County KY Health Facilities - Jewish Hospital | | 5.700 | | | 01/01/2021 | | Aaa/AAA* | | | 4,520,000 | | | 4,655,419 |
Jefferson County KY Health Facilities University Medical Center | | 5.500 | | | 07/01/2017 | | Aaa/AAA* | | | 8,675,000 | | | 8,879,817 |
Jefferson County Ky School District Finance Corporation | | 5.250 | | | 01/01/2016 | | Aaa/AAA*/AAA@ | | | 1,000,000 | | | 1,046,800 |
Jefferson County School District Finance Corporation | | 5.250 | | | 01/01/2019 | | Aaa/AAA*/AAA@ | | | 2,000,000 | | | 2,083,220 |
Jefferson County KY Health Facilities-Alliant Health System | | 5.125 | | | 10/01/2017 | | Aaa/AAA*/AAA@ | | | 2,940,000 | | | 3,013,235 |
Jefferson County KY Capital Projects Corporation Revenue | | 5.375 | | | 06/01/2018 | | Aaa/AAA*/AAA@ | | | 1,500,000 | | | 1,548,825 |
Kenton County KY School District Finance Corporation School | | 5.000 | | | 06/01/2021 | | Aaa/Aa3*/AAA@ | | | 4,055,000 | | | 4,199,561 |
Kenton County KY School District Finance Corporation School | | 5.000 | | | 06/01/2023 | | Aaa/AAA@ | | | 4,465,000 | | | 4,615,158 |
Kenton County KY School District Finance Corporation School | | 5.000 | | | 06/01/2024 | | Aaa/AAA@ | | | 4,665,000 | | | 4,815,633 |
Ky Asset Liability Community General Fund | | 5.000 | | | 05/01/2020 | | Aaa/AAA*/AAA@ | | | 2,000,000 | | | 2,083,960 |
KY Asset Liability Commission Project Notes First Series | | 5.000 | | | 05/01/2023 | | Aaa/AAA*/AAA@ | | | 5,600,000 | | | 5,797,792 |
Ky Asset Liability Community General Fund | | 5.000 | | | 05/01/2024 | | Aaa/AAA*/AAA@ | | | 5,880,000 | | | 6,079,038 |
Ky Asset Liability Commission | | 5.000 | | | 05/01/2025 | | Aaa/AAA*/AAA@ | | | 1,000,000 | | | 1,034,580 |
KY Asset Liability Project Notes | | 5.000 | | | 09/01/2015 | | Aaa/AAA*/AAA@ | | | 6,000,000 | | | 6,336,480 |
KY Asset Liability Commission University Of KY Project Note | | 5.000 | | | 10/01/2023 | | Aaa/AAA* | | | 8,075,000 | | | 8,377,247 |
Ky Asset Liability Commission University Of KY Project Note | | 5.000 | | | 10/01/2024 | | Aaa/AAA* | | | 7,405,000 | | | 7,682,169 |
KY Asset Liability Commission University Of KY Project Note | | 5.000 | | | 10/01/2025 | | Aaa/AAA* | | | 3,700,000 | | | 3,835,642 |
Kentucky Economic Development Finance Authority-Ashland Hospital | | 5.000 | | | 02/01/2018 | | Aaa/AAA*/AAA@ | | | 1,500,000 | | | 1,530,990 |
Kentucky Development Finance Authority-St Clair Medical | | 5.875 | | | 09/01/2013 | | AAA* | | | 2,000,000 | | | 2,010,280 |
Kentucky Development Finance Authority-St Claire Medical | | 5.625 | | | 09/01/2021 | | AAA* | | | 2,500,000 | | | 2,512,200 |
Kentucky Development Finance Authority-Methodist Hospital | | 5.625 | | | 02/01/2017 | | AAA* | | | 6,500,000 | | | 6,700,785 |
Kentucky Development Finance Authority-Appalachian Regional | | 5.850 | | | 10/01/2017 | | A* | | | 1,000,000 | | | 1,033,840 |
Kentucky Housing Corporation | | 4.750 | | | 07/01/2017 | | Aaa/AAA* | | | 1,335,000 | | | 1,350,099 |
Kentucky Housing Corporation | | 4.650 | | | 07/01/2023 | | Aaa/AAA* | | | 3,595,000 | | | 3,569,943 |
Kentucky Housing Corporation | | 4.400 | | | 01/01/2017 | | Aaa/AAA* | | | 1,000,000 | | | 995,840 |
Kentucky Housing Corpoartion | | 4.850 | | | 01/01/2024 | | Aaa/AAA* | | | 2,000,000 | | | 2,015,340 |
KY State Property & Building Commission #73 | | 5.000 | | | 11/01/2021 | | Aaa/AAA*/AAA@ | | | 1,000,000 | | | 1,031,120 |
KY State Property & Building Commission #76 | | 5.500 | | | 08/01/2021 | | Aaa/AAA/AAA | | | 500,000 | | | 557,800 |
KY State Property & Building Commission #83 | | 5.000 | | | 10/01/2013 | | Aaa/AAA*/AAA@ | | | 610,000 | | | 645,673 |
KY State Property & Building Commission #83 | | 5.000 | | | 10/01/2017 | | Aaa/AAA*/AAA@ | | | 5,000,000 | | | 5,304,700 |
KY State Property & Building Commission #83 | | 5.000 | | | 10/01/2018 | | Aaa/AAA*/AAA@ | | | 17,750,000 | | | 18,835,590 |
KY State Property & Building Commission #83 | | 5.250 | | | 10/01/2020 | | Aaa/AAA*/AAA@ | | | 24,220,000 | | | 26,327,140 |
KY State Property & Building Commission #73 | | 5.500 | | | 11/01/2017 | | Aaa/AAA*/AAA@ | | | 1,000,000 | | | 1,075,050 |
KY State Property & Building Commission #73 | | 5.000 | | | 11/01/2019 | | Aaa/AAA*/AAA@ | | | 1,360,000 | | | 1,409,939 |
KY State Property & Building Commission #73 | | 5.000 | | | 11/01/2020 | | Aaa/AAA*/AAA@ | | | 3,255,000 | | | 3,381,847 |
KY State Property & Building Commission #73 | | 5.000 | | | 08/01/2019 | | Aaa/AAA*/AAA@ | | | 10,000,000 | | | 10,601,900 |
KY State Property & Building Commission #81 | | 5.000 | | | 08/01/2022 | | Aaa/AAA*/AAA@ | | | 17,500,000 | | | 18,534,600 |
KY State Property & Building Commission #85 | | 5.000 | | | 08/01/2020 | | Aaa/AAA*/AAA@ | | | 5,760,000 | | | 6,007,507 |
KY State Property & Building Commission #85 | | 5.000 | | | 08/01/2022 | | Aaa/AAA*/AAA@ | | | 3,000,000 | | | 3,108,480 |
KY State Property & Building Commission #85 ** | | 5.000 | | | 08/01/2022 | | Aaa/AAA*/AAA@ | | | 5,200,000 | | | 5,388,032 |
KY State Property & Building Commission #85 | | 5.000 | | | 08/01/2023 | | Aaa/AAA*/AAA@ | | | 12,500,000 | | | 12,942,500 |
KY State Property & Building Commission #85 | | 5.000 | | | 08/01/2024 | | Aaa/AAA*/AAA@ | | | 13,300,000 | | | 13,780,928 |
KY State Property & Building Commission #85 | | 5.000 | | | 08/01/2025 | | Aaa/AAA*/AAA@ | | | 5,000,000 | | | 5,184,550 |
KY State Property & Building Commission #79 | | 4.750 | | | 10/01/2023 | | Aaa/AAA*/AAA@ | | | 3,000,000 | | | 3,042,060 |
KY State Property & Building Commission #80 | | 5.250 | | | 05/01/2018 | | Aaa/AAA*/AAA@ | | | 2,940,000 | | | 3,182,579 |
The accompanying notes are an integral part of the financial statements.
5
DUPREE MUTUAL FUNDS - KENTUCKY TAX-FREE INCOME SERIES
SCHEDULE OF PORTFOLIO INVESTMENTS
Kentucky Municipal Bonds — 100%
June 30, 2006
| | | | | | | | | | | | | |
Bond Description | | Coupon | | | Maturity Date | | Rating# | | Par Value | | Market Value |
KY State Property & Building Commission #80 | | 5.250 | % | | 05/01/2020 | | Aaa/AAA*/AAA@ | | $ | 1,000,000 | | $ | 1,085,160 |
KY State Property & Building Commission #81 | | 5.000 | | | 11/01/2017 | | Aaa/AAA*/AAA@ | | | 2,060,000 | | | 2,156,387 |
KY State Property & Building Commission #81 | | 5.000 | | | 11/01/2018 | | Aaa/AAA*/AAA@ | | | 1,720,000 | | | 1,793,857 |
KY State Property & Building Commission #81 | | 5.000 | | | 11/01/2019 | | Aaa/AAA*/AAA@ | | | 2,385,000 | | | 2,478,277 |
KY State Property & Building Commission #81 | | 5.000 | | | 11/01/2020 | | Aaa/AAA*/AAA@ | | | 3,560,000 | | | 3,690,189 |
KY State Property & Building Commission #81 | | 5.000 | | | 11/01/2022 | | Aaa/AAA*/AAA@ | | | 3,930,000 | | | 4,053,834 |
KY State Turnpike Authority Economic Development | | 5.150 | | | 07/01/2019 | | Aaa/AAA*/AAA@ | | | 1,000,000 | | | 1,041,540 |
KY State Turnpike Authority Economic Development | | 5.000 | | | 07/01/2023 | | Aaa/AAA*/AAA@ | | | 4,325,000 | | | 4,480,397 |
KY State Turnpike Authority Economic Development | | 5.000 | | | 07/01/2024 | | Aaa/AAA*/AAA@ | | | 3,770,000 | | | 3,894,184 |
KY State Turnpike Authority Economic Development | | 5.000 | | | 07/01/2025 | | Aaa/AAA*/AAA@ | | | 2,000,000 | | | 2,073,340 |
KY State Turnpike Authority Economic Development | | 5.000 | | | 07/01/2026 | | Aaa/AAA@/AAA* | | | 4,720,000 | | | 4,892,988 |
Knox County General Obligation | | 5.625 | | | 06/01/2036 | | AAA*/AAA@ | | | 2,490,000 | | | 2,699,060 |
Letcher County School District Finance Corporation | | 5.000 | | | 06/01/2022 | | Aaa/Aa3*/AAA@ | | | 1,755,000 | | | 1,811,669 |
Letcher County School District Finance Corporation | | 5.000 | | | 06/01/2024 | | Aaa/Aa3*/AAA@ | | | 1,930,000 | | | 1,989,714 |
Lexington Fayette Urban County Government Public Facilities | | 5.125 | | | 10/01/2015 | | AAa/AAA* | | | 1,770,000 | | | 1,850,553 |
Lexington Fayette Urban County Government Public Facilities | | 5.125 | | | 10/01/2017 | | Aaa/AAA* | | | 1,830,000 | | | 1,909,953 |
Lexington Fayette Urban County Government Public Facilities | | 5.125 | | | 10/01/2018 | | Aaa/AAA* | | | 2,135,000 | | | 2,226,549 |
Lexington Fayette Urban County Government Public Facilities | | 5.125 | | | 10/01/2019 | | Aaa/AAA* | | | 2,415,000 | | | 2,511,769 |
Louisville & Jefferson County Metropolitan Sewer | | 5.000 | | | 05/15/2019 | | Aaa/AAA*/AAA@ | | | 2,500,000 | | | 2,571,475 |
Louisville & Jefferson County Metropolitan Sewer | | 4.750 | | | 05/15/2028 | | Aaa/AAA*/AAA@ | | | 10,425,000 | | | 10,468,368 |
Louisville & Jefferson County Metropolitian Sewer | | 5.000 | | | 05/15/2022 | | Aaa/AAA*/AAA@ | | | 2,855,000 | | | 2,960,464 |
Louisville & Jefferson County Metropolitian Sewer | | 5.000 | | | 05/15/2023 | | Aaa/AAA*/AAA@ | | | 2,990,000 | | | 3,093,813 |
Louisville & Jefferson County Metropolitian Sewer | | 5.000 | | | 05/15/2024 | | Aaa/AAA*/AAA@ | | | 3,135,000 | | | 3,248,487 |
Louisville & Jefferson County Metropolitian Sewer | | 5.000 | | | 05/15/2025 | | Aaa/AAA*/AAA@ | | | 3,285,000 | | | 3,391,795 |
Louisville & Jefferson County Metropolitan Sewer | | 5.000 | | | 05/15/2026 | | Aaa/AAA*/AAA@ | | | 5,000,000 | | | 5,151,500 |
Louisville & Jefferson County Metropolitan Sewer | | 5.000 | | | 05/15/2025 | | Aaa/AAA* | | | 3,270,000 | | | 3,380,591 |
Louisville & Jefferson County Metropolitan Sewer | | 5.000 | | | 05/15/2026 | | Aaa/AAA* | | | 3,230,000 | | | 3,336,622 |
Louisville & Jefferson County KY Regional Airport Authority | | 5.500 | | | 07/01/2017 | | Aaa/AAA*/AAA@ | | | 2,655,000 | | | 2,848,231 |
Louisville & Jefferson County Visitors and Convention Center | | 4.500 | | | 12/01/2023 | | Aaa/AAA*/AAA@ | | | 2,340,000 | | | 2,341,755 |
Louisville & Jefferson County Visitors and Convention Center | | 4.500 | | | 12/01/2024 | | Aaa/AAA*/AAA@ | | | 2,250,000 | | | 2,241,540 |
Louisville & Jefferson County Visitors and Convention Center | | 4.600 | | | 12/01/2025 | | Aaa/AAA*/AAA@ | | | 1,490,000 | | | 1,495,826 |
Louisville & Jefferson County Student Housing | | 5.000 | | | 06/01/2025 | | AAA* | | | 2,030,000 | | | 2,102,309 |
Louisville KY G.O. - Series A | | 5.000 | | | 10/01/2020 | | Aaa/AAA*/AAA@ | | | 7,165,000 | | | 7,421,005 |
Louisville Health Care Facilities | | 6.650 | | | 12/20/2030 | | Aaa | | | 4,957,000 | | | 5,481,203 |
Louisville KY Parking Authority-River City First Mortgage | | 5.000 | | | 12/01/2017 | | Aaa/AAA*/AAA@ | | | 1,000,000 | | | 1,026,750 |
Madison County School District Finance Corporation | | 4.500 | | | 04/01/2016 | | Aaa/AAA*/AAA@ | | | 695,000 | | | 705,474 |
Marshall County School District Finance Corporation | | 5.000 | | | 06/01/2022 | | Aaa/Aa3*/AAA@ | | | 1,400,000 | | | 1,445,206 |
McCracken County School District Finance Corporation | | 4.650 | | | 07/01/2019 | | Aaa/AAA@ | | | 1,655,000 | | | 1,680,984 |
McCracken County School District Finance Corportion | | 4.700 | | | 07/01/2020 | | Aaa/AAA@ | | | 1,725,000 | | | 1,749,305 |
McCracken County School District Finance Corportion | | 5.000 | | | 07/01/2022 | | Aaa/AAA@ | | | 4,000,000 | | | 4,108,400 |
McCreary County Courthouse & Public Square Corporation Revenue | | 5.400 | | | 09/01/2020 | | Aaa/AAA*/AAA@ | | | 1,550,000 | | | 1,652,269 |
Nelson County School District Finance Corporation | | 4.500 | | | 04/01/2021 | | Aaa/Aa3*/AAA@ | | | 1,130,000 | | | 1,131,232 |
Nelson County School District Finance Corporation | | 4.500 | | | 04/01/2023 | | Aaa/Aa3*/AAA@ | | | 2,505,000 | | | 2,498,988 |
Northern KY University Certificate of Participation | | 4.900 | | | 12/01/2021 | | Aaa/AAA* | | | 2,725,000 | | | 2,788,138 |
Northern KY University Certificate of Participation | | 5.000 | | | 12/01/2024 | | Aaa/AAA* | | | 2,000,000 | | | 2,048,420 |
Northern KY Water District Revenue | | 4.750 | | | 02/01/2019 | | Aaa/AAA* | | | 1,000,000 | | | 1,015,150 |
Northern KY Water District Revenue | | 5.000 | | | 02/01/2020 | | Aaa/AAA@ | | | 3,080,000 | | | 3,168,981 |
Northern KY Water District Revenue | | 5.000 | | | 02/01/2021 | | Aaa/AAA@ | | | 2,635,000 | | | 2,712,443 |
Northern KY Water District Revenue | | 4.000 | | | 02/01/2019 | | Aaa | | | 1,275,000 | | | 1,224,867 |
Northern KY Water District Revenue | | 4.125 | | | 02/01/2020 | | Aaa | | | 1,325,000 | | | 1,278,771 |
Northern KY Water District Revenue | | 4.125 | | | 02/01/2021 | | Aaa | | | 1,380,000 | | | 1,326,456 |
Northern KY Water District Revenue | | 4.500 | | | 02/01/2022 | | Aaa | | | 1,385,000 | | | 1,374,225 |
Northern KY Water District Revenue | | 4.500 | | | 02/01/2024 | | Aaa | | | 1,035,000 | | | 1,026,265 |
Pike County KY Mortgage Revenue-Phelps Regional Health | | 5.350 | | | 09/20/2012 | | AAA* | | | 170,000 | | | 175,960 |
Radcliff KY Mortgage Revenue-Lincoln Trail Care | | 5.650 | | | 01/20/2019 | | AAA* | | | 3,110,000 | | | 3,222,084 |
Shelby County School District Finance Corporation | | 5.000 | | | 05/01/2022 | | Aaa/Aa3*/AAA@ | | | 1,815,000 | | | 1,873,044 |
Shelbyville KY Certificate of Participation | | 5.150 | | | 07/01/2018 | | Aaa/AAA@ | | | 4,165,000 | | | 4,334,890 |
Spencer County School District Finance Corporation | | 5.000 | | | 07/01/2023 | | Aaa/AAA@ | | | 1,000,000 | | | 1,031,250 |
University of Kentucky Housing and Dining | | 4.400 | | | 06/01/2017 | | Aaa/AAA@ | | | 2,815,000 | | | 2,833,269 |
Warren County Ky Hospital Facility Revenue | | 4.625 | | | 04/01/2012 | | Aaa/AAA*/AAA@ | | | 1,500,000 | | | 1,529,625 |
Warren County KY Hospital Facility Revenue | | 5.000 | | | 04/01/2016 | | AAA/Aaa*/AAA@ | | | 1,000,000 | | | 1,024,490 |
Warren County Ky Hospital Facility Revenue | | 5.000 | | | 04/01/2017 | | Aaa/AAA*/AAA@ | | | 1,000,000 | | | 1,026,720 |
| | | | | | | | | | | | | |
| | | | | | | | | | | | | 468,985,204 |
LEASE REVENUE BONDS | | | | | | | | | | | | | |
9.25% of Net Assets | | | | | | | | | | | | | |
Boone County Ky School District Finance Corporation | | 5.500 | | | 09/01/2019 | | Aa3 | | | 1,860,000 | | | 1,960,273 |
Boone County KY School District Finance Corporation | | 5.750 | | | 02/01/2020 | | Aa3 | | | 1,200,000 | | | 1,287,348 |
Boone County KY School District Finance Corporation | | 5.000 | | | 08/01/2019 | | Aa3 | | | 1,040,000 | | | 1,080,300 |
Boone County KY School District Finance Corporation | | 5.000 | | | 02/01/2022 | | Aa3 | | | 3,000,000 | | | 3,107,160 |
Bullitt County KY School District Finance Corporation | | 5.000 | | | 07/01/2021 | | Aa3 | | | 1,000,000 | | | 1,041,570 |
Christian County Ky Public Courthouse Lease Revenue | | 5.125 | | | 08/01/2017 | | Aa3 | | | 1,090,000 | | | 1,141,710 |
Christian County Ky Public Courthouse Lease Revenue | | 5.125 | | | 08/01/2018 | | Aa3 | | | 1,145,000 | | | 1,198,861 |
The accompanying notes are an integral part of the financial statements.
6
DUPREE MUTUAL FUNDS - KENTUCKY TAX-FREE INCOME SERIES
SCHEDULE OF PORTFOLIO INVESTMENTS
Kentucky Municipal Bonds—100%
June 30, 2006
| | | | | | | | | | | | | |
Bond Description | | Coupon | | | Maturity Date | | Rating# | | Par Value | | Market Value |
Covington Independent School District Finance Corporation | | 5.250 | % | | 06/01/2019 | | Aa3 | | $ | 1,225,000 | | $ | 1,282,489 |
Danville Multi-City Lease Campbellsville Water & Sewer | | 3.500 | | | 07/01/2012 | | Baa1 | | | 1,950,000 | | | 1,888,302 |
Daviess County KY School District Finance Corporation | | 5.000 | | | 06/01/2021 | | Aa3 | | | 1,155,000 | | | 1,196,961 |
Green County KY School District Finance Corporation | | 5.000 | | | 04/01/2021 | | Aa3 | | | 1,085,000 | | | 1,124,700 |
Greenup County KY School District Finance Corporation | | 4.650 | | | 03/01/2021 | | Aa3 | | | 1,650,000 | | | 1,696,151 |
Hopkins County KY School District Finance Corporation | | 5.125 | | | 06/01/2019 | | Aa3 | | | 4,120,000 | | | 4,321,221 |
Kentucky Area Development Districts Financing Lease-Ewing ^ | | 5.700 | | | 06/01/2015 | | AA* | | | 1,500,000 | | | 1,583,025 |
Kentucky Area Development Districts Financing Lease-Ewing ^ | | 5.600 | | | 06/01/2022 | | AA* | | | 1,055,000 | | | 1,105,735 |
Kentucky Area Development Districts Financing Lease-Ewing ^ | | 5.350 | | | 12/01/2022 | | AA* | | | 2,560,000 | | | 2,665,114 |
Kentucky Area Development Districts Financing Lease-Ewing ^ | | 5.400 | | | 12/01/2021 | | AA* | | | 710,000 | | | 757,322 |
Kentucky Area Development Districts Financing Lease-Ewing ^ | | 5.400 | | | 12/01/2021 | | AA* | | | 1,095,000 | | | 1,164,051 |
Kentucky Area Development Districts Financing Lease-Ewing ^ | | 4.700 | | | 06/01/2024 | | AA* | | | 2,625,000 | | | 2,629,489 |
KY Interlocal Transportation Equipment Lease Revenue | | 6.000 | | | 12/01/2020 | | Aa3/A+* | | | 400,000 | | | 406,220 |
Kentucky Infrastructure Authority | | 5.000 | | | 06/01/2019 | | Aa3/A+*/AA-@ | | | 1,000,000 | | | 1,035,190 |
Kentucky Infrasturcture Authority | | 5.000 | | | 06/01/2017 | | Aa3/AA-* | | | 1,035,000 | | | 1,067,571 |
KY State Property & Building #68 | | 5.250 | | | 10/01/2018 | | Aa3/A+*/AA-@ | | | 1,500,000 | | | 1,573,710 |
KY State Property & Building #68 | | 5.000 | | | 10/01/2019 | | Aa3/A+*/AA-@ | | | 5,500,000 | | | 5,680,235 |
KY State Property & Building #73 | | 5.500 | | | 11/01/2013 | | Aa3/A+*/AA-@ | | | 1,500,000 | | | 1,598,895 |
Lexington-Fayette Urban County Government General Obligation | | 4.750 | | | 05/01/2020 | | Aa2/AA+* | | | 1,000,000 | | | 1,021,150 |
Martin County KY School District Finance Corporation | | 5.375 | | | 09/01/2020 | | Aa3 | | | 1,100,000 | | | 1,168,123 |
Montgomery County School District Finance Corporation | | 4.375 | | | 04/01/2023 | | Aa3 | | | 3,105,000 | | | 3,030,915 |
Oldham County KY School District Finance Corporation | | 5.000 | | | 12/01/2021 | | Aa3 | | | 2,090,000 | | | 2,179,661 |
Pendleton County KY Multi-County Lease Revenue | | 6.400 | | | 03/01/2019 | | A* | | | 3,000,000 | | | 3,476,250 |
Pendleton County KY School District Finance Corporation | | 5.125 | | | 06/01/2019 | | Aa3 | | | 1,140,000 | | | 1,193,341 |
Pike County School District Finance Corporation | | 5.000 | | | 09/01/2016 | | Aa3 | | | 1,850,000 | | | 1,938,874 |
Pike County KY School District Finance Corporation | | 5.100 | | | 09/01/2020 | | Aa3 | | | 1,000,000 | | | 1,042,830 |
Richmond KY Court Facilities Corporation Revenue | | 5.250 | | | 02/01/2019 | | Aa3 | | | 1,035,000 | | | 1,067,468 |
Scott County School District | | 5.000 | | | 03/01/2021 | | Aa3 | | | 1,240,000 | | | 1,289,116 |
Trigg County School District Finance Corporation | | 4.600 | | | 04/01/2018 | | Aa3 | | | 1,700,000 | | | 1,717,969 |
Whitley County School Finance | | 4.800 | | | 02/01/2021 | | Aa3 | | | 800,000 | | | 819,384 |
| | | | | | | | | | | | | |
| | | | | | | | | | | | | 63,538,684 |
ESCROWED TO MATURITY BONDS | | | | | | | | | | | | | |
6.10% of Net Assets | | | | | | | | | | | | | |
Ashland KY Pollution Control Revenue - Ashland Inc | | 5.700 | | | 11/01/2009 | | Ba1 | | | 1,000,000 | | | 1,053,810 |
Danville KY Multi-City Lease Revenue-Hopkinsville | | 6.875 | | | 06/01/2012 | | Baa1 | | | 1,725,000 | | | 1,864,656 |
Jefferson County KY Health Facilities Services - Alliant Health Services | | 5.125 | | | 10/01/2018 | | Aaa/AAA*/AAA@ | | | 33,000,000 | | | 33,890,340 |
Jefferson County KY Health Facilities - Alliant Health Services | | 5.125 | | | 10/01/2017 | | Aaa/AAA*/AAA@ | | | 4,980,000 | | | 5,104,052 |
| | | | | | | | | | | | | |
| | | | | | | | | | | | | 41,912,858 |
PREREFUNDED BONDS | | | | | | | | | | | | | |
5.97% of Net Assets | | | | | | | | | | | | | |
Campbellsville KY Industrial Revenue-Campbellsville College | | 6.000 | | | 03/01/2017 | | NR | | | 1,920,000 | | | 1,953,408 |
Estill County KY School District Finance Corporation | | 5.875 | | | 08/01/2016 | | Aa3 | | | 1,780,000 | | | 1,819,534 |
Fayette County KY School District Financial Corporation | | 5.375 | | | 01/01/2017 | | Aa3/AA-* | | | 1,300,000 | | | 1,339,377 |
Georgetown College Project | | 6.000 | | | 11/15/2016 | | A* | | | 1,000,000 | | | 1,091,690 |
Georgetown College Project | | 6.250 | | | 11/15/2020 | | A* | | | 4,000,000 | | | 4,406,600 |
Jefferson County KY School District Finance Corporation | | 5.125 | | | 11/01/2016 | | Aaa/AAA*/AAA@ | | | 1,000,000 | | | 1,026,330 |
Jefferson County KY College Project Bellarmine College | | 5.250 | | | 05/01/2019 | | Baa2 | | | 2,000,000 | | | 2,088,540 |
Jeffersontown KY Certificate of Participation | | 5.750 | | | 11/01/2015 | | A3 | | | 1,095,000 | | | 1,124,664 |
Kenton County KY Public Property Corporation Revenue | | 5.700 | | | 12/01/2015 | | A2 | | | 1,305,000 | | | 1,331,204 |
Kenton County KY Public Property Corporation Revenue | | 5.700 | | | 12/01/2016 | | A2 | | | 1,380,000 | | | 1,407,365 |
Kentucky Development Authority-South Central Nursing | | 6.000 | | | 07/01/2027 | | Aaa/AAA*/AAA@ | | | 2,095,000 | | | 2,251,308 |
KY State Property & Building #63 | | 5.100 | | | 11/01/2018 | | Aa3/AAA*/AA-@ | | | 2,000,000 | | | 2,081,900 |
KY State Property & Building #67 | | 5.125 | | | 09/01/2018 | | Aa3/AAA*/AA-@ | | | 1,000,000 | | | 1,045,490 |
KY State Property & Building #64 | | 5.500 | | | 05/01/2017 | | Aaa/AAA*/AAA@ | | | 8,000,000 | | | 8,426,960 |
KY State Property & Building #74 | | 5.000 | | | 02/01/2019 | | Aaa/AAA*/AAA@ | | | 3,000,000 | | | 3,148,740 |
KY State Property & Building #67 | | 5.125 | | | 09/01/2016 | | Aa3/AAA*/AA-@ | | | 1,000,000 | | | 1,051,380 |
KY State Property & Building #77 | | 5.250 | | | 08/01/2015 | | AAA/Aaa*/AAA@ | | | 1,140,000 | | | 1,222,764 |
KY State Property & Building #77 | | 5.250 | | | 08/01/2016 | | Aaa/AAA*/AAA@ | | | 1,680,000 | | | 1,801,968 |
Laurel County KY School District Finance Corporation | | 5.600 | | | 03/01/2017 | | Aa3 | | | 1,000,000 | | | 1,032,980 |
Laurel County School District School Building Revenue | | 5.750 | | | 06/01/2020 | | Aa3 | | | 1,250,000 | | | 1,358,075 |
| | | | | | | | | | | | | |
| | | | | | | | | | | | | 41,010,277 |
HOSPITAL AND HEALTHCARE REVENUE BONDS | | | | | | | | | | | | | |
4.19% of Net Assets | | | | | | | | | | | | | |
Jefferson County KY Health Facilities - Jewish Hospital | | 5.700 | | | 01/01/2011 | | A1/AA-* | | | 1,200,000 | | | 1,235,040 |
Kentucky Development Finance Authority Green River | | 6.000 | | | 11/01/2010 | | Aaa | | | 1,000,000 | | | 1,025,050 |
Kentucky Economic Development Finance Authority Catholic | | 5.500 | | | 09/01/2014 | | Aa2/AA*/AA@ | | | 1,375,000 | | | 1,449,360 |
Kentucky Development Finance Authority Hospital-Appalachian | | 5.850 | | | 10/01/2017 | | BB-*/BB+@ | | | 1,000,000 | | | 1,009,260 |
Kentucky Development Finance Authority-Catholic Health | | 5.000 | | | 12/01/2018 | | Aa2/AA*/AA@ | | | 6,950,000 | | | 7,107,626 |
Kentucky Development Financial Authority - Catholic Health | | 5.750 | | | 12/01/2015 | | Aa2/AA*/AA@ | | | 2,000,000 | | | 2,127,120 |
Kentucky Economic Development Finance Authority Revenue | | 5.250 | | | 09/01/2021 | | Aa2/AA*/AA@ | | | 2,000,000 | | | 2,067,440 |
Kentucky Economic Development Finance Authority-Norton Health | | 6.125 | | | 10/01/2010 | | BBB@ | | | 7,000,000 | | | 7,305,830 |
Kentucky Economic Development Finance Authority - Catholic Health | | 5.125 | | | 10/01/2021 | | A1/AA*/AA-@ | | | 1,000,000 | | | 1,033,940 |
The accompanying notes are an integral part of the financial statements.
7
DUPREE MUTUAL FUNDS - KENTUCKY TAX-FREE INCOME SERIES
SCHEDULE OF PORTFOLIO INVESTMENTS
Kentucky Municipal Bonds - 100%
June 30, 2006
| | | | | | | | | | | | | |
Bond Description | | Coupon | | | Maturity Date | | Rating# | | Par Value | | Market Value |
Madison County Ky Industrial Building Revenue - McCready Manor | | 5.500 | % | | 06/01/2020 | | AA-* | | $ | 1,785,000 | | $ | 1,883,728 |
Pike County KY Mortgage Revenue - Phelps Regional Health | | 5.650 | | | 09/20/2027 | | AAA* | | | 2,435,000 | | | 2,528,674 |
| | | | | | | | | | | | | |
| | | | | | | | | | | | | 28,773,068 |
GENERAL OBLIGATION BONDS | | | | | | | | | | | | | |
2.08% of Net Assets | | | | �� | | | | | | | | | |
Bowling Green Ky General Obligation | | 5.300 | | | 06/01/2018 | | Aa3 | | | 1,000,000 | | | 1,057,860 |
Bowling Green KY General Obligation | | 4.600 | | | 06/01/2018 | | Aa2 | | | 1,290,000 | | | 1,310,666 |
Hardin County KY General Obligation | | 5.125 | | | 06/01/2019 | | A1 | | | 2,255,000 | | | 2,343,622 |
Jefferson County - Series A | | 4.900 | | | 12/01/2018 | | Aa2/AA* | | | 1,605,000 | | | 1,663,037 |
KY State Property & Building #62 | | 4.625 | | | 09/01/2013 | | Aa3/A+*/AA-@ | | | 2,750,000 | | | 2,815,203 |
Lexington Fayette Urban County Government Detention Center | | 4.750 | | | 05/01/2018 | | Aa2/AA+* | | | 3,120,000 | | | 3,191,292 |
Louisville KY General Obligation | | 5.000 | | | 11/01/2019 | | Aa2/AA* | | | 1,775,000 | | | 1,866,430 |
| | | | | | | | | | | | | |
| | | | | | | | | | | | | 14,248,110 |
MUNICIPAL UTILITY REVENUE BONDS | | | | | | | | | | | | | |
1.86% of Net Assets | | | | | | | | | | | | | |
Cynthiana KY Waterworks & Sewer Revenue | | 6.400 | | | 01/01/2007 | | BBB-* | | | 575,000 | | | 581,400 |
KY Rural Water Financial Corporation Public Project Revenue | | 5.375 | | | 02/01/2020 | | AA-* | | | 1,140,000 | | | 1,223,551 |
Louisville & Jefferson County Waterworks & Water System ** | | 5.000 | | | 11/15/2031 | | Aa1/AA+* | | | 10,695,000 | | | 10,982,054 |
| | | | | | | | | | | | | |
| | | | | | | | | | | | | 12,787,005 |
PUBLIC FACILITIES REVENUE BONDS | | | | | | | | | | | | | |
.96% of Net Assets | | | | | | | | | | | | | |
Boone County KY Public Property Corporation-AOC Judicial | | 5.000 | | | 09/01/2019 | | Aa3 | | | 1,000,000 | | | 1,044,100 |
Boone County KY Public Property Corporation - Judicial Facilities | | 5.125 | | | 09/01/2022 | | Aa3 | | | 1,750,000 | | | 1,837,955 |
Calloway County Public Property Corporation-Courthouse | | 5.625 | | | 03/01/2018 | | A* | | | 1,000,000 | | | 1,033,900 |
Danville Ky Multi-City Lease Revenue-Mt Sterling | | 5.000 | | | 09/01/2011 | | NR | | | 480,000 | | | 487,056 |
Florence KY Public Property Corporation Revenue | | 5.250 | | | 03/01/2017 | | A3 | | | 1,060,000 | | | 1,081,571 |
Oldham County KY Public Facilities Construction Corporation | | 5.250 | | | 06/01/2017 | | A+* | | | 1,060,000 | | | 1,091,365 |
| | | | | | | | | | | | | |
| | | | | | | | | | | | | 6,575,947 |
STATE AND LOCAL MORTGAGE REVENUE BONDS | | | | | | | | | | | | | |
.40% of Net Assets | | | | | | | | | | | | | |
Florence KY Housing Facility Revenue | | 6.300 | | | 08/15/2019 | | A/A* | | | 2,615,000 | | | 2,743,736 |
| | | | | | | | | | | | | |
| | | | | | | | | | | | | 2,743,736 |
CERTIFICATES OF PARTICIPATION BONDS | | | | | | | | | | | | | |
.36% of Net Assets | | | | | | | | | | | | | |
Shelbyville KY Certificate of Participation | | 5.350 | | | 10/01/2013 | | NR | | | 1,295,000 | | | 1,328,010 |
Shelbyville KY Certificate of Participation | | 5.450 | | | 10/01/2017 | | NR | | | 1,130,000 | | | 1,150,894 |
| | | | | | | | | | | | | |
| | | | | | | | | | | | | 2,478,904 |
UNIVERSITY CONSOLIDATED EDUCATION AND BUILDING REVENUE BONDS | | | | | | | | | | | | | |
.30% of Net Assets | | | | | | | | | | | | | |
Berea Educational Facilities Revenue | | 4.125 | | | 06/01/2022 | | Aaa | | | 2,190,000 | | | 2,073,404 |
| | | | | | | | | | | | | |
| | | | | | | | | | | | | 2,073,404 |
INDUSTRIAL REVENUE AND POLLUTION CONTROL REVENUE BONDS | | | | | | | | | | | | | |
.01% of Net Assets | | | | | | | | | | | | | |
Meade County KY Pollution Control Revenue-Olin Corporation | | 6.000 | | | 07/01/2007 | | NR | | | 90,000 | | | 90,194 |
| | | | | | | | | | | | | |
| | | | | | | | | | | | | 90,194 |
| | | | | | | | | | | | | |
Total Investments (cost $682,051,462)(See (a) below for further explanation) - 99.75% of Net Assets | | | | | | | | | | | | $ | 685,217,391 |
| | | | | | | | | | | | | |
| * | Standard and Poor’s Corporation |
| @ | Fitch’s Investors Service |
| | All other ratings by Moody’s Investors Service, Inc. |
| # | Bond ratings are unaudited. |
| ^ | Certain bonds within the same Kentucky Area Development Districts (KADD) financial pool are in default, however, the bonds held by the Fund are not in default at June 30, 2006. |
| (a) | Represents cost for financial reporting and federal income tax purposes and differs from market value by net unrealized appreciation of securities as follows: |
| | | | |
Unrealized appreciation | | $ | 12,499,441 | |
Unrealized depreciation | | | (9,333,512 | ) |
| | | | |
Net unrealized appreciation | | $ | 3,165,929 | |
| | | | |
The accompanying notes are an integral part of the financial statements.
8
DUPREE MUTUAL FUNDS - KENTUCKY TAX-FREE INCOME SERIES
STATEMENT OF ASSETS AND LIABILITIES
JUNE 30, 2006
| | | | | | | |
ASSETS: | | | | | | | |
Investments in securities, at value (Cost: $682,051,462) | | | | | $ | 685,217,391 | |
Cash | | | | | | 1,750,702 | |
Broker receivable | | | | | | 10,270 | |
Receivable from investments sold | | | | | | 10,408,300 | |
Interest receivable | | | | | | 9,279,484 | |
| | | | | | | |
Total assets | | | | | | 706,666,147 | |
LIABILITIES: | | | | | | | |
Payable for: | | | | | | | |
Investments purchased | | $ | 16,526,935 | | | | |
Distributions to shareholders | | | 2,661,025 | | | | |
Fund shares redeemed | | | 92,921 | | | | |
Investment advisory fee | | | 228,912 | | | | |
Transfer agent fee | | | 68,410 | | | | |
Trustee fee | | | 67,283 | | | | |
Accrued expenses | | | 92,095 | | | | |
| | | | | | | |
Total liabilities | | | | | | 19,737,581 | |
| | | | | | | |
NET ASSETS: | | | | | | | |
Capital | | | | | | 684,020,628 | |
Net accumulated realized loss on investment transactions | | | | | | (257,991 | ) |
Net unrealized appreciation in value of investments | | | | | | 3,165,929 | |
| | | | | | | |
Net assets at value | | | | | $ | 686,928,566 | |
| | | | | | | |
NET ASSET VALUE, offering price and redemption price per share ($686,928,566 -:- 92,778,492 shares outstanding; unlimited number of shares authorized; no par value) | | | | | $ | 7.40 | |
| | | | | | | |
STATEMENT OF OPERATIONS
For the year ended June 30, 2006
| | | | |
Net investment income: | | | | |
Interest income | | $ | 31,633,978 | |
| | | | |
Expenses: | | | | |
Investment advisory fee | | | 2,794,381 | |
Transfer agent fee | | | 835,502 | |
Professional fees | | | 153,069 | |
Custodian expense | | | 66,648 | |
Trustee fees | | | 65,042 | |
Other expenses | | | 171,472 | |
| | | | |
Total expenses | | | 4,086,114 | |
Custodian expense reduction | | | (66,648 | ) |
| | | | |
Net expenses | | | 4,019,466 | |
| | | | |
Net investment income | | | 27,614,512 | |
| | | | |
Realized and unrealized gain/(loss) on investments: | | | | |
Net realized gain | | | 2,316,678 | |
Net decrease in unrealized appreciation | | | (26,775,398 | ) |
| | | | |
Net realized and unrealized loss on investments | | | (24,458,720 | ) |
| | | | |
Net increase in net assets resulting from operations | | $ | 3,155,792 | |
| | | | |
The accompanying notes are an integral part of the financial statements.
9
DUPREE MUTUAL FUNDS - KENTUCKY TAX-FREE INCOME SERIES
STATEMENTS OF CHANGES IN NET ASSETS
For the years ended June 30, 2006 and 2005
| | | | | | | | |
| | | 2006 | | | 2005 | |
Increase in net assets: | | | | | | | | |
Operations: | | | | | | | | |
Net investment income | | $ | 27,614,512 | | | $ | 27,597,283 | |
Net realized gain/(loss) on investments | | | 2,316,678 | | | | (703,313 | ) |
Net (decrease)/increase in unrealized appreciation | | | (26,775,398 | ) | | | 15,937,169 | |
| | | | | | | | |
Net increase in net assets resulting from operations | | | 3,155,792 | | | | 42,831,139 | |
Distributions to shareholders from net investment income | | | (27,614,512 | ) | | | (27,597,283 | ) |
Net fund share transactions (Note 4) | | | 28,091,439 | | | | 53,705,158 | |
| | | | | | | | |
Total increase | | | 3,632,719 | | | | 68,939,014 | |
Net assets: | | | | | | | | |
Beginning of year | | | 683,295,847 | | | | 614,356,833 | |
| | | | | | | | |
End of year | | $ | 686,928,566 | | | $ | 683,295,847 | |
| | | | | | | | |
FINANCIAL HIGHLIGHTS
Selected data for a share outstanding:
| | | | | | | | | | | | | | | | | | | | |
| | | For the years ended June 30, | |
| | | 2006 | | | 2005 | | | 2004 | | | 2003 | | | 2002 | |
Net asset value, beginning of year | | $ | 7.67 | | | $ | 7.49 | | | $ | 7.73 | | | $ | 7.48 | | | $ | 7.41 | |
| | | | | | | | | | | | | | | | | | | | |
Income from investment operations: | | | | | | | | | | | | | | | | | | | | |
Net investment income | | | 0.30 | | | | 0.32 | | | | 0.33 | | | | 0.34 | | | | 0.36 | |
Net gains/(losses) on securities, both realized and unrealized | | | (0.27 | ) | | | 0.18 | | | | (0.24 | ) | | | 0.25 | | | | 0.07 | |
| | | | | | | | | | | | | | | | | | | | |
Total from investment operations | | | 0.03 | | | | 0.50 | | | | 0.09 | | | | 0.59 | | | | 0.43 | |
Less distributions: | | | | | | | | | | | | | | | | | | | | |
Distributions from net investment income | | | (0.30 | ) | | | (0.32 | ) | | | (0.33 | ) | | | (0.34 | ) | | | (0.36 | ) |
| | | | | | | | | | | | | | | | | | | | |
Net asset value, end of year | | $ | 7.40 | | | $ | 7.67 | | | $ | 7.49 | | | $ | 7.73 | | | $ | 7.48 | |
| | | | | | | | | | | | | | | | | | | | |
Total return | | | 0.41 | % | | | 6.79 | % | | | 1.23 | % | | | 8.04 | % | | | 5.93 | % |
Net assets, end of year (in thousands) | | $ | 686,929 | | | $ | 683,296 | | | $ | 614,357 | | | $ | 612,593 | | | $ | 535,356 | |
Ratio of net expenses to average net assets (a) | | | 0.58 | % | | | 0.58 | % | | | 0.58 | % | | | 0.58 | % | | | 0.59 | % |
Ratio of net investment income to average net assets | | | 4.00 | % | | | 4.20 | % | | | 4.37 | % | | | 4.45 | % | | | 4.84 | % |
Portfolio turnover | | | 17.60 | % | | | 19.38 | % | | | 7.89 | % | | | 10.69 | % | | | 9.99 | % |
| (a) | Percentages are after expenses waived by Adviser and custodian and interest expense reductions. |
| | Expenses waived by Adviser and custodian and interest expense reductions were: |
| | 0% and .59% for 2006; 0% and .60% for 2005; 0% and .60% for 2004; 0% and .60% for 2003; and 0% and .61% for 2002, respectively. |
The accompanying notes are an integral part of the financial statements.
10
DUPREE MUTUAL FUNDS - KENTUCKY TAX-FREE SHORT-TO-MEDIUM SERIES
SCHEDULE OF PORTFOLIO INVESTMENTS
Kentucky Municipal Bonds - 100%
June 30, 2006
| | | | | | | | | | | | | |
Bond Description | | Coupon | | | Maturity Date | | Rating# | | Par Value | | Market Value |
INSURED MUNICIPAL REVENUE BONDS | | | | | | | | | | | | | |
52.81% of Net Assets | | | | | | | | | | | | | |
Ballard County KY School District Finance Corporation | | 3.500 | % | | 06/01/2010 | | Aaa/AAA@ | | $ | 1,620,000 | | $ | 1,599,507 |
Boone-Florence Water Supply System Revenue | | 4.300 | | | 12/01/2011 | | Aaa/AAA@ | | | 505,000 | | | 515,262 |
Carrollton & Henderson Ky Public Energy Authority Gas Revenue | | 5.000 | | | 01/01/2009 | | Aaa/AAA*/AAA@ | | | 3,650,000 | | | 3,754,500 |
Eastern KY University Consolidated Education Building | | 4.300 | | | 05/01/2009 | | Aaa/AAA*/AAA@ | | | 500,000 | | | 508,120 |
Hardin County KY Hospital Revenue Refunding | | 3.500 | | | 10/01/2010 | | Aaa/AAA@ | | | 1,050,000 | | | 1,031,216 |
Jefferson County KY Health Facility University Medical Center | | 5.000 | | | 07/01/2008 | | Aaa/AAA*/AAA@ | | | 300,000 | | | 307,053 |
Jefferson County KY School District Finance Corporation | | 4.900 | | | 01/01/2008 | | Aaa/AAA*/AAA@ | | | 550,000 | | | 560,445 |
Jefferson County KY School District Finance Corporation | | 5.000 | | | 01/01/2009 | | Aaa/AAA*/AAA@ | | | 750,000 | | | 771,473 |
Jefferson County School District Finance Corporation | | 3.125 | | | 01/01/2011 | | Aaa/AAA*/AAA@ | | | 2,240,000 | | | 2,142,112 |
KY Asset/Liability Community General Fund Project Notes | | 5.000 | | | 07/15/2010 | | Aaa/AAA*/AAA@ | | | 1,000,000 | | | 1,041,890 |
KY Asset Liability Project Notes | | 5.000 | | | 09/01/2016 | | Aaa/AAA*/AAA@ | | | 2,000,000 | | | 2,097,340 |
KY Asset Liability University of Kentucky Project Notes | | 5.000 | | | 10/01/2016 | | Aaa/AAA*/AAA@ | | | 1,250,000 | | | 1,321,013 |
KY Economic Development Finance Authority Ashland Hospital | | 5.000 | | | 02/01/2010 | | Aaa/AAA*/AAA@ | | | 1,000,000 | | | 1,036,110 |
KY Economic Development Finance Authority Appalachian Hospital | | 5.500 | | | 10/01/2007 | | A* | | | 1,000,000 | | | 1,013,430 |
KY Economic Development Finance Authority Appalachian Hospital | | 5.700 | | | 10/01/2010 | | A* | | | 1,000,000 | | | 1,040,320 |
KY State Property & Building #69 | | 5.500 | | | 08/01/2008 | | Aaa/AAA*/AAA@ | | | 1,140,000 | | | 1,179,159 |
KY State Property & Building #69 | | 5.000 | | | 08/01/2009 | | Aaa/AAA*/AAA@ | | | 1,620,000 | | | 1,676,052 |
KY State Property & Building #65 | | 5.750 | | | 02/01/2009 | | Aaa/AAA*/AAA@ | | | 750,000 | | | 785,858 |
KY State Property & Building #82 | | 5.250 | | | 10/01/2015 | | Aaa/AAA*/AAA@ | | | 2,000,000 | | | 2,161,080 |
KY State Property & Building #82 | | 5.250 | | | 10/01/2017 | | Aaa/AAA*/AAA@ | | | 1,000,000 | | | 1,082,120 |
KY State Property & Building #74 | | 5.375 | | | 02/01/2011 | | Aaa/AAA*/AAA@ | | | 1,005,000 | | | 1,064,928 |
KY State Property & Building #81 | | 5.000 | | | 11/01/2009 | | Aaa/AAA*/AAA@ | | | 1,010,000 | | | 1,045,986 |
KY State Property & Building #74 | | 5.375 | | | 02/01/2009 | | Aaa/AAA*/AAA@ | | | 1,000,000 | | | 1,040,910 |
KY State Turnpike Authority Economic Development | | 5.500 | | | 07/01/2007 | | Aaa/AAA*/AAA@ | | | 3,000,000 | | | 3,056,820 |
KY State Turnpike Authority Revitalization Projects | | 5.500 | | | 07/01/2009 | | Aaa/AAA*/AAA@ | | | 2,000,000 | | | 2,094,460 |
KY State Turnpike Authority Economic Development | | 6.500 | | | 07/01/2007 | | Aaa/AAA*/AAA@ | | | 1,000,000 | | | 1,026,910 |
KY State Turnpike Authority Economic Development | | 5.000 | | | 07/01/2017 | | Aaa/AAA*/AAA@ | | | 2,570,000 | | | 2,704,308 |
Louisville Jefferson County KY Visitors Convention Center | | 5.000 | | | 12/01/2010 | | Aaa/AAA*/AAA@ | | | 1,350,000 | | | 1,409,711 |
Northern KY Water Services District Water District Revenue | | 4.750 | | | 02/01/2011 | | Aaa | | | 1,025,000 | | | 1,051,640 |
University Of KY Consolidated Education Building - Series S | | 3.500 | | | 05/01/2010 | | Aaa/AAA@ | | | 1,190,000 | | | 1,174,804 |
University Of KY Consolidated Education Building - Series S | | 3.500 | | | 05/01/2011 | | Aaa/AAA@ | | | 1,040,000 | | | 1,020,885 |
Warren County School District Finance Corporation | | 4.000 | | | 02/01/2015 | | Aaa | | | 785,000 | | | 771,529 |
Warren County School District Finance Corporation | | 4.000 | | | 02/01/2016 | | Aaa | | | 1,330,000 | | | 1,299,889 |
| | | | | | | | | | | | | |
| | | | | | | | | | | | | 44,386,840 |
LEASE REVENUE BONDS | | | | | | | | | | | | | |
22.38% of Net Assets | | | | | | | | | | | | | |
Harlan County School District Finance Corporation | | 5.000 | | | 09/01/2009 | | Aa3/A+* | | | 500,000 | | | 515,015 |
Jefferson County Ky School District Finance Corporation | | 4.400 | | | 02/01/2008 | | Aa3/AA-* | | | 500,000 | | | 504,560 |
KY Area Development District Financing City of Ewing | | 5.100 | | | 06/01/2010 | | AA* | | | 1,070,000 | | | 1,091,240 |
KY Infrastructure Authority Government Agency Program | | 4.000 | | | 08/01/2010 | | AA* | | | 1,000,000 | | | 1,003,710 |
KY Infractructure Authority | | 5.000 | | | 06/01/2010 | | Aa3/A+*/AA-@ | | | 2,000,000 | | | 2,082,860 |
KY Infrastructure Authority | | 5.250 | | | 08/01/2013 | | AA* | | | 1,185,000 | | | 1,270,273 |
KY State Property & Building #68 | | 5.500 | | | 10/01/2007 | | Aa3/A+*/AA-@ | | | 1,000,000 | | | 1,020,040 |
KY State Property & Building #71 | | 5.500 | | | 08/01/2008 | | Aa3/A+*/AA-@ | | | 10,000 | | | 10,307 |
KY State Property & Building #60 | | 5.500 | | | 10/01/2008 | | Aa3/A+*/AA-@ | | | 500,000 | | | 519,030 |
KY State Property & Building #73 | | 3.700 | | | 11/01/2008 | | Aa3/A+*/AA-@ | | | 1,000,000 | | | 994,200 |
KY State Property & Building #73 | | 5.250 | | | 11/01/2011 | | Aa3/A+*/AA-@ | | | 750,000 | | | 793,868 |
KY State Property & Building #73 | | 5.250 | | | 11/01/2009 | | Aa3/A+*/AA-@ | | | 1,790,000 | | | 1,868,223 |
KY State Property & Building #73 | | 5.250 | | | 11/01/2010 | | Aa3/A+*/AA-@ | | | 3,000,000 | | | 3,157,500 |
Laurel County School District Finance Corporation | | 4.600 | | | 03/01/2010 | | Aa3 | | | 1,000,000 | | | 1,027,110 |
Logan/Todd Regional Water Revenue | | 4.000 | | | 02/01/2007 | | MIG1 | | | 2,500,000 | | | 2,506,400 |
Madison County School District Finance Corporation Revenue | | 3.500 | | | 05/01/2013 | | Aa3 | | | 470,000 | | | 448,714 |
| | | | | | | | | | | | | |
| | | | | | | | | | | | | 18,813,050 |
HOSPITAL AND HEALTHCARE REVENUE BONDS | | | | | | | | | | | | | |
10.07% of Net Assets | | | | | | | | | | | | | |
KY Economic Development Finance Authority - Catholic Health | | 4.250 | | | 10/01/2009 | | A1/AA-*/AA-@ | | | 255,000 | | | 255,829 |
KY Economic Development Finance Authority - Catholic Health | | 4.500 | | | 10/01/2011 | | A1/AA-*/AA-@ | | | 1,000,000 | | | 1,010,190 |
KY Economic Development Finance Authority - Catholic Health | | 5.500 | | | 12/01/2006 | | Aa2/AA*/AA@ | | | 1,790,000 | | | 1,802,262 |
KY Economic Development Finance Authority - Catholic Health | | 5.500 | | | 12/01/2010 | | Aa2/AA*/AA@ | | | 2,100,000 | | | 2,223,753 |
KY Economic Development Finance Authority - Catholic Health | | 5.750 | | | 12/01/2015 | | Aa2/AA | | | 2,000,000 | | | 2,127,120 |
KY Economic Development Finance Authority - Norton Health | | 6.125 | | | 10/01/2010 | | BBB+@ | | | 1,000,000 | | | 1,047,590 |
| | | | | | | | | | | | | |
| | | | | | | | | | | | | 8,466,744 |
GENERAL OBLIGATION BONDS | | | | | | | | | | | | | |
6.00% of Net Assets | | | | | | | | | | | | | |
Jefferson Co General Obligation | | 5.500 | | | 08/15/2010 | | Aa2/AA* | | | 2,635,000 | | | 2,798,212 |
Lexington-Fayette Urban County Government General Obligation | | 3.125 | | | 02/01/2011 | | Aa2/AA+* | | | 1,165,000 | | | 1,117,922 |
Lexington-Fayette Urban County Government General Obligation | | 3.625 | | | 07/01/2010 | | Aa2/AA+* | | | 1,135,000 | | | 1,125,602 |
| | | | | | | | | | | | | |
| | | | | | | | | | | | | 5,041,736 |
The accompanying notes are an integral part of the financial statements.
11
DUPREE MUTUAL FUNDS - KENTUCKY TAX-FREE SHORT-TO-MEDIUM SERIES
SCHEDULE OF PORTFOLIO INVESTMENTS
Kentucky Municipal Bonds - 100%
June 30, 2006
| | | | | | | | | | | | | |
Bond Description | | Coupon | | | Maturity Date | | Rating# | | Par Value | | Market Value |
ESCROWED TO MATURITY BONDS | | | | | | | | | | | | | |
3.02% of Net Assets | | | | | | | | | | | | | |
Ashland KY Pollution Control Revenue - Ashland Inc Project | | 5.700 | % | | 11/01/2009 | | Ba1 | | $ | 500,000 | | $ | 528,990 |
Jefferson County KY Capital Projects Corporation Revenue | | 6.375 | | | 12/01/2007 | | NR | | | 1,500,000 | | | 1,552,395 |
Kentucky State Property & Building Commission Project #71 | | 5.500 | | | 08/01/2008 | | Aaa/AAA*/AAA@ | | | 440,000 | | | 455,743 |
| | | | | | | | | | | | | |
| | | | | | | | | | | | | 2,537,128 |
PREREFUNDED BONDS | | | | | | | | | | | | | |
1.81% of Net Assets | | | | | | | | | | | | | |
Kentucky State Property & Building Commission Project #66 | | 5.700 | | | 05/01/2018 | | Aaa/AAA*/AAA@ | | | 1,430,000 | | | 1,524,480 |
| | | | | | | | | | | | | |
| | | | | | | | | | | | | 1,524,480 |
MUNICIPAL UTILITY REVENUE BONDS | | | | | | | | | | | | | |
1.64% of Net Assets | | | | | | | | | | | | | |
Danville KY Mulit-City Lease Water & Sewer Lease Revenue | | 2.300 | | | 07/01/2007 | | Baa1 | | | 355,000 | | | 351,904 |
Louisville KY Waterworks Board Water System Revenue | | 4.500 | | | 11/15/2010 | | Aa1/AA* | | | 1,000,000 | | | 1,023,880 |
| | | | | | | | | | | | | |
| | | | | | | | | | | | | 1,375,784 |
CERTIFICATES OF PARTICIPATION BONDS | | | | | | | | | | | | | |
.42% of Net Assets | | | | | | | | | | | | | |
Shelbyville Certificates of Participation Refinancing | | 4.900 | | | 10/01/2007 | | NR | | | 350,000 | | | 353,360 |
| | | | | | | | | | | | | |
| | | | | | | | | | | | | 353,360 |
INDUSTRIAL REVENUE AND POLLUTION CONTROL REVENUE BONDS | | | | | | | | | | | | | |
.11% of Net Assets | | | | | | | | | | | | | |
Meade County KY Pollution Control Revenue-Olin Corporation | | 6.000 | | | 07/01/2007 | | NR | | | 95,000 | | | 95,204 |
| | | | | | | | | | | | | |
| | | | | | | | | | | | | 95,204 |
| | | | | | | | | | | | | |
Total Investments (cost $83,136,252)(See (a) below for further explanation) - 98.26% of Net Assets | | | | | | | | | | | | $ | 82,594,326 |
| | | | | | | | | | | | | |
| * | Standard and Poor’s Corporation |
| @ | Fitch’s Investors Service |
| | All other ratings by Moody’s Investors Service, Inc. |
| # | Bond ratings are unaudited. |
| (a) | Represents cost for financial reporting and federal income tax purposes and differs from market value by net unrealized depreciation of securities as follows: |
| | | | |
Unrealized appreciation | | $ | 392,017 | |
Unrealized depreciation | | | (933,943 | ) |
| | | | |
Net unrealized depreciation | | $ | (541,926 | ) |
| | | | |
The accompanying notes are an integral part of the financial statements.
12
DUPREE MUTUAL FUNDS - KENTUCKY TAX-FREE SHORT-TO-MEDIUM SERIES
STATEMENT OF ASSETS AND LIABILITIES
JUNE 30, 2006
| | | | | | | |
ASSETS: | | | | | | | |
Investments in securities, at value (Cost: $83,136,252) | | | | | $ | 82,594,326 | |
Cash | | | | | | 41,403 | |
Receivable from investments sold | | | | | | 430,000 | |
Interest receivable | | | | | | 1,128,198 | |
| | | | | | | |
Total assets | | | | | | 84,193,927 | |
LIABILITIES: | | | | | | | |
Payable for: | | | | | | | |
Distributions to shareholders | | $ | 68,163 | | | | |
Fund shares redeemed | | | 11,776 | | | | |
Investment advisory fee | | | 35,021 | | | | |
Transfer agent fee | | | 8,896 | | | | |
Trustee fee | | | 10,768 | | | | |
Accrued expenses | | | 11,193 | | | | |
| | | | | | | |
Total liabilities | | | | | | 145,817 | |
| | | | | | | |
NET ASSETS: | | | | | | | |
Capital | | | | | | 85,772,607 | |
Net accumulated realized loss on investment transactions | | | | | | (1,182,571 | ) |
Net unrealized depreciation in value of investments | | | | | | (541,926 | ) |
| | | | | | | |
Net assets at value | | | | | $ | 84,048,110 | |
| | | | | | | |
NET ASSET VALUE, offering price and redemption price per share ($84,048,110 -:- 16,364,671 shares outstanding; unlimited number of shares authorized; no par value) | | | | | $ | 5.14 | |
| | | | | | | |
STATEMENT OF OPERATIONS
For the year ended June 30, 2006
| | | | |
Net investment income: | | | | |
Interest income | | $ | 3,291,347 | |
| | | | |
Expenses: | | | | |
Investment advisory fee | | | 453,347 | |
Transfer agent fee | | | 114,803 | |
Professional fees | | | 21,280 | |
Custodian expense | | | 10,903 | |
Trustee fees | | | 8,629 | |
Other expenses | | | 48,349 | |
| | | | |
Total expenses | | | 657,311 | |
Custodian expense reduction | | | (10,903 | ) |
| | | | |
Net expenses | | | 646,408 | |
| | | | |
Net investment income | | | 2,644,939 | |
| | | | |
Realized and unrealized loss on investments: | | | | |
Net realized loss | | | (313,247 | ) |
Net decrease in unrealized appreciation | | | (2,272,100 | ) |
| | | | |
Net realized and unrealized loss on investments | | | (2,585,347 | ) |
| | | | |
Net increase in net assets resulting from operations | | $ | 59,592 | |
| | | | |
The accompanying notes are an integral part of the financial statements.
13
DUPREE MUTUAL FUNDS - KENTUCKY TAX-FREE SHORT-TO-MEDIUM SERIES
STATEMENTS OF CHANGES IN NET ASSETS
For the years ended June 30, 2006 and 2005
| | | | | | | | |
| | | 2006 | | | 2005 | |
Increase in net assets: | | | | | | | | |
Operations: | | | | | | | | |
Net investment income | | $ | 2,644,939 | | | $ | 2,885,070 | |
Net realized loss on investments | | | (313,247 | ) | | | (13,424 | ) |
Net (decrease)/increase in unrealized appreciation | | | (2,272,100 | ) | | | 252,279 | |
| | | | | | | | |
Net increase in net assets resulting from operations | | | 59,592 | | | | 3,123,925 | |
Distributions to shareholders from net investment income | | | (2,644,939 | ) | | | (2,885,070 | ) |
Net fund share transactions (Note 4) | | | (11,307,454 | ) | | | 130,628 | |
| | | | | | | | |
Total (decrease)/increase | | | (13,892,801 | ) | | | 369,483 | |
Net assets: | | | | | | | | |
Beginning of year | | | 97,940,911 | | | | 97,571,428 | |
| | | | | | | | |
End of year | | $ | 84,048,110 | | | $ | 97,940,911 | |
| | | | | | | | |
FINANCIAL HIGHLIGHTS
Selected data for a share outstanding:
| | | | | | | | | | | | | | | | | | | | |
| | | For the years ended June 30, | |
| | | 2006 | | | 2005 | | | 2004 | | | 2003 | | | 2002 | |
Net asset value, beginning of year | | $ | 5.28 | | | $ | 5.27 | | | $ | 5.44 | | | $ | 5.30 | | | $ | 5.22 | |
| | | | | | | | | | | | | | | | | | | | |
Income from investment operations: | | | | | | | | | | | | | | | | | | | | |
Net investment income | | | 0.15 | | | | 0.15 | | | | 0.16 | | | | 0.19 | | | | 0.20 | |
Net gains/(losses) on securities, both realized and unrealized | | | (0.14 | ) | | | 0.01 | | | | (0.17 | ) | | | 0.14 | | | | 0.08 | |
| | | | | | | | | | | | | | | | | | | | |
Total from investment operations | | | 0.01 | | | | 0.16 | | | | (0.01 | ) | | | 0.33 | | | | 0.28 | |
Less distributions: | | | | | | | | | | | | | | | | | | | | |
Distributions from net investment income | | | (0.15 | ) | | | (0.15 | ) | | | (0.16 | ) | | | (0.19 | ) | | | (0.20 | ) |
| | | | | | | | | | | | | | | | | | | | |
Net asset value, end of year | | $ | 5.14 | | | $ | 5.28 | | | $ | 5.27 | | | $ | 5.44 | | | $ | 5.30 | |
| | | | | | | | | | | | | | | | | | | | |
Total return | | | 0.22 | % | | | 3.11 | % | | | (0.19 | )% | | | 6.23 | % | | | 5.50 | % |
Net assets, end of year (in thousands) | | $ | 84,048 | | | $ | 97,941 | | | $ | 97,571 | | | $ | 99,529 | | | $ | 80,082 | |
Ratio of net expenses to average net assets (a) | | | 0.71 | % | | | 0.69 | % | | | 0.68 | % | | | 0.69 | % | | | 0.69 | % |
Ratio of net investment income to average net assets | | | 2.92 | % | | | 2.87 | % | | | 2.98 | % | | | 3.43 | % | | | 3.82 | % |
Portfolio turnover | | | 17.86 | % | | | 9.51 | % | | | 18.63 | % | | | 22.30 | % | | | 8.04 | % |
| (a) | Percentages are after expenses waived by Adviser and custodian and interest expense reductions. |
| | Expenses waived by Adviser and custodian and interest expense reductions were: |
| | 0% and .72% for 2006; 0% and .71% for 2005; 0% and .72% for 2004; 0% and .71% for 2003; and 0% and .71% for 2002, respectively. |
The accompanying notes are an integral part of the financial statements.
14
DUPREE MUTUAL FUNDS - MISSISSIPPI TAX-FREE INCOME SERIES
SCHEDULE OF PORTFOLIO INVESTMENTS
Mississippi Municipal Bonds - 100%
June 30, 2006
| | | | | | | | | | | | | |
Bond Description | | Coupon | | | Maturity Date | | Rating# | | Par Value | | Market Value |
INSURED MUNICIPAL REVENUE BONDS | | | | | | | | | | | | | |
74.23% of Net Assets | | | | | | | | | | | | | |
De Soto County MS School District | | 4.500 | % | | 04/01/2016 | | Aaa/AAA* | | $ | 30,000 | | $ | 30,241 |
Gautier MS Utility District Utility System Revenue | | 5.125 | | | 03/01/2018 | | Aaa/AAA@ | | | 75,000 | | | 78,194 |
Hinds County MS Revenue Refunding-MS Methodist Hospital | | 5.600 | | | 05/01/2012 | | Aaa/AAA*/AAA@ | | | 25,000 | | | 25,993 |
Itawamba Community College District MS Educational Facility | | 5.000 | | | 02/01/2020 | | AAA*/AAA@ | | | 100,000 | | | 103,038 |
Medical Center Educational Building Corporation MS Revenue | | 5.500 | | | 12/01/2023 | | AAA* | | | 100,000 | | | 110,700 |
MS Business Finance Corporation MS Pollution Control Revenue | | 4.600 | | | 04/01/2022 | | Aaa/AAA* | | | 100,000 | | | 100,262 |
MS Development - Madison County Road & Bridge Project | | 5.250 | | | 06/01/2023 | | Aaa | | | 50,000 | | | 51,996 |
MS Development Bank Special Obligation - Madison County | | 5.250 | | | 06/01/2024 | | Aaa | | | 50,000 | | | 52,026 |
MS Development Bank Special Obligation Capital Project | | 5.000 | | | 07/01/2031 | | Aaa/AAA*/AAA@ | | | 75,000 | | | 78,063 |
MS Development Bank Special Obligation - Flowood Revenue Project | | 5.625 | | | 11/01/2019 | | Aaa/AAA*/AAA@ | | | 10,000 | | | 10,223 |
MS Development Bank Special Obligation - Meridian Community | | 5.500 | | | 07/01/2016 | | Aaa/AAA*/AAA@ | | | 30,000 | | | 30,974 |
MS Development Bank Special Obligation Multi-Purpose | | 5.000 | | | 07/01/2021 | | Aaa/AAA* | | | 50,000 | | | 51,266 |
MS Development Bank Special Obligation - Jackson Water/Sewer | | 4.750 | | | 09/01/2019 | | Aaa/AAA*/AAA@ | | | 100,000 | | | 101,686 |
MS Development Bank Special Obligation Wastewater | | 5.375 | | | 02/01/2021 | | Aaa/AAA*/AAA@ | | | 100,000 | | | 105,752 |
MS Development Bank Special Obligation Wastewater | | 5.000 | | | 02/01/2028 | | Aaa/AAA*/AAA@ | | | 200,000 | | | 203,584 |
MS Development Bank Special Obligation - Horn Lake | | 5.000 | | | 10/01/2020 | | AAA* | | | 50,000 | | | 51,319 |
MS Development Bank Special Obligation - Lee County School | | 4.500 | | | 09/01/2021 | | Aaa/AAA@ | | | 100,000 | | | 98,696 |
MS Development Bank Special Obligation - Southaven Water | | 5.000 | | | 03/01/2025 | | AAA*/AAA@ | | | 325,000 | | | 334,737 |
MS Development Bank Special Obligation Capital Projects | | 5.875 | | | 07/01/2024 | | Aaa/AAA*/AAA@ | | | 75,000 | | | 86,720 |
MS Development Bank Special Obligation Capital Projects | | 5.000 | | | 07/01/2024 | | Aaa/AAA*/AAA@ | | | 500,000 | | | 524,300 |
MS Development Bank Special Obligation Combination | | 5.000 | | | 07/01/2018 | | Aaa/AAA*/AAA@ | | | 100,000 | | | 103,278 |
MS Home Corporation Housing Revenue | | 4.750 | | | 12/01/2018 | | A* | | | 125,000 | | | 122,355 |
MS Hospital Equipment and Facilities - Forrest County | | 5.500 | | | 01/01/2024 | | Aaa/AAA@ | | | 45,000 | | | 47,016 |
MS State Refunding Notes Projects | | 5.000 | | | 12/01/2022 | | Aaa/AAA*/AAA@ | | | 200,000 | | | 207,446 |
Ms Development BK Special Obligation -Culkin Water District | | 5.800 | | | 07/01/2018 | | Aaa/AAA*/AAA@ | | | 25,000 | | | 26,290 |
MS State University Educational Building Corporate Revenue | | 5.500 | | | 08/01/2014 | | Aaa/AAA@ | | | 75,000 | | | 79,632 |
MS State University Educational Building Corporate Revenue | | 5.000 | | | 08/01/2024 | | Aaa/AAA*/AAA@ | | | 350,000 | | | 357,935 |
Olive Branch MS Public Improvement | | 4.125 | | | 06/01/2022 | | Aaa/AAA@ | | | 100,000 | | | 93,282 |
Olive Branch MS Water & Sewer Revenue | | 4.500 | | | 03/01/2014 | | Aaa/AAA@ | | | 30,000 | | | 30,605 |
Pearl River County MS Certificate Participation | | 4.500 | | | 04/01/2021 | | Aaa/AAA@ | | | 200,000 | | | 199,560 |
Stone County MS School District | | 4.000 | | | 06/01/2016 | | Aaa/AAA@ | | | 50,000 | | | 48,798 |
University Southern MS Education Building | | 5.000 | | | 03/01/2022 | | Aaa | | | 100,000 | | | 103,403 |
Winston County MS Urban Renewal Revenue | | 5.150 | | | 12/01/2017 | | AAA*/AAA@ | | | 15,000 | | | 15,285 |
| | | | | | | | | | | | | |
| | | | | | | | | | | | | 3,664,655 |
GENERAL OBLIGATION BONDS | | | | | | | | | | | | | |
14.79% of Net Assets | | | | | | | | | | | | | |
Biloxi MS Tax Increment - LTD Obligation | | 5.900 | | | 10/01/2019 | | A* | | | 35,000 | | | 35,879 |
Hinds County MS School District | | 4.750 | | | 03/01/2015 | | NR | | | 50,000 | | | 50,314 |
Jackson MS Redevelopment Authority Urban Renewal | | 5.600 | | | 11/01/2021 | | A2 | | | 20,000 | | | 21,327 |
MS Development Bank Special Obligation Public Improvement | | 4.750 | | | 12/01/2019 | | BBB+* | | | 145,000 | | | 140,791 |
Mississippi State | | 5.100 | | | 11/15/2012 | | Aa3/AA*/AA@ | | | 10,000 | | | 10,544 |
Mississippi State General Obligation | | 5.500 | | | 12/01/2015 | | Aa3/AA*/AA@ | | | 100,000 | | | 109,048 |
MS State Refunded | | 5.250 | | | 11/01/2019 | | Aa3/AA*/AA@ | | | 325,000 | | | 351,598 |
Richland MS Tax Increment | | 5.600 | | | 06/01/2013 | | NR | | | 10,000 | | | 10,467 |
| | | | | | | | | | | | | |
| | | | | | | | | | | | | 729,968 |
PREREFUNDED BONDS | | | | | | | | | | | | | |
3.68% of Net Assets | | | | | | | | | | | | | |
MS Development Bank Special Obligation Adams County Juvenile | | 5.900 | | | 07/01/2017 | | A* | | | 10,000 | | | 10,596 |
MS Development Bank Special Obligation -Natchez Convention Center | | 5.800 | | | 07/01/2019 | | Aaa/AAA*/AAA@ | | | 25,000 | | | 27,866 |
MS Development Bank Special Obligation -Gulfport Combined Water | | 5.500 | | | 07/01/2015 | | Aaa/AAA*/AAA@ | | | 10,000 | | | 10,974 |
MS Development Bank Special Obligation-Bay St Louis | | 5.375 | | | 07/01/2014 | | A* | | | 10,000 | | | 10,165 |
MS Development Bank Special Obligation - Desoto County | | 5.900 | | | 07/01/2021 | | Aaa/AAA*/AAA@ | | | 5,000 | | | 5,462 |
MS Development Bank Special Obligation - Rankin County | | 5.400 | | | 07/01/2014 | | Aaa/AAA*/AAA@ | | | 10,000 | | | 10,581 |
Southern MS Education Building Corporation Revenue | | 5.100 | | | 03/01/2020 | | Aaa/AAA* | | | 70,000 | | | 73,940 |
Southern MS University Educational Building Corporation | | 5.750 | | | 03/01/2021 | | Aaa | | | 10,000 | | | 10,870 |
University MS Educational Building - Stadium A | | 5.500 | | | 12/01/2017 | | Aaa/AAA* | | | 5,000 | | | 5,120 |
Walnut Grove Correctional Authority Certificates of Participation | | 6.000 | | | 11/01/2019 | | Aaa/AAA*/AAA@ | | | 15,000 | | | 16,244 |
| | | | | | | | | | | | | |
| | | | | | | | | | | | | 181,818 |
ESCROWED TO MATURITY BONDS | | | | | | | | | | | | | |
1.10% of Net Assets | | | | | | | | | | | | | |
Harrison County MS Wastewater Management District | | 5.000 | | | 02/01/2015 | | Baa1/Aaa | | | 25,000 | | | 26,484 |
MS Gulf Coast Regional Wastewater Treatment Facilities | | 7.000 | | | 07/01/2012 | | AAA* | | | 25,000 | | | 27,729 |
| | | | | | | | | | | | | |
| | | | | | | | | | | | | 54,213 |
The accompanying notes are an integral part of the financial statements.
15
DUPREE MUTUAL FUNDS - MISSISSIPPI TAX-FREE INCOME SERIES
SCHEDULE OF PORTFOLIO INVESTMENTS
Mississippi Municipal Bonds - 100%
June 30, 2006
| | | | | | | | | | | | | |
Bond Description | | Coupon | | | Maturity Date | | Rating# | | Par Value | | Market Value |
MUNICIPAL UTILITY REVENUE BONDS | | | | | | | | | | | | | |
1.08% of Net Assets | | | | | | | | | | | | | |
MS Development Bank Special Obligation Okolona Electric | | 5.350 | % | | 07/01/2021 | | A* | | $ | 50,000 | | $ | 53,290 |
| | | | | | | | | | | | | |
| | | | | | | | | | | | | 53,290 |
PUBLIC FACILITIES REVENUE BONDS | | | | | | | | | | | | | |
1.03% of Net Assets | | | | | | | | | | | | | |
Mississippi Development Bank Special Obligation - Southaven | | 6.200 | | | 03/01/2020 | | A* | | | 10,000 | | | 10,562 |
Vicksburg Warren MS School District | | 4.700 | | | 02/01/2017 | | AA-* | | | 40,000 | | | 40,384 |
| | | | | | | | | | | | | |
| | | | | | | | | | | | | 50,946 |
| | | | | | | | | | | | | |
Total Investments (cost $4,757,570) (See (a) below for further explanation) - 95.91% of Net Assets | | | | | | | | | | | | $ | 4,734,890 |
| | | | | | | | | | | | | |
| * | Standard and Poor’s Corporation |
| @ | Fitch’s Investors Service |
| | All other ratings by Moody’s Investors Service, Inc. |
| # | Bond ratings are unaudited. |
| (a) | Represents cost for financial reporting and federal income tax purposes and differs from market value by net unrealized depreciation of securities as follows: |
| | | | |
Unrealized appreciation | | $ | 63,812 | |
Unrealized depreciation | | | (86,492 | ) |
| | | | |
Net unrealized depreciation | | $ | (22,680 | ) |
| | | | |
The accompanying notes are an integral part of the financial statements.
16
DUPREE MUTUAL FUNDS - MISSISSIPPI TAX-FREE INCOME SERIES
STATEMENT OF ASSETS AND LIABILITIES
JUNE 30, 2006
| | | | | | |
ASSETS: | | | | | | |
Investments in securities, at value (Cost: $4,757,570) | | | | $ | 4,734,890 | |
Cash | | | | | 180,339 | |
Interest receivable | | | | | 71,816 | |
Receivable from Adviser | | | | | 356 | |
| | | | | | |
Total assets | | | | | 4,987,401 | |
LIABILITIES: | | | | | | |
Payable for: | | | | | | |
Distributions to shareholders | | 14,295 | | | | |
Transfer agent fee | | 1,249 | | | | |
Trustee fee | | 338 | | | | |
Other | | 1,232 | | | | |
| | | | | | |
Total liabilities | | | | | 17,114 | |
| | | | | | |
NET ASSETS: | | | | | | |
Capital | | | | | 4,970,331 | |
Net accumulated realized gain/(loss) on investment transactions | | | | | 22,636 | |
Net unrealized depreciation in value of investments | | | | | (22,680 | ) |
| | | | | | |
Net assets at value | | | | $ | 4,970,287 | |
| | | | | | |
NET ASSET VALUE, offering price and redemption price per share ($4,970,287 -:- 441,669 shares outstanding; unlimited number of shares authorized; no par value) | | | | $ | 11.25 | |
| | | | | | |
STATEMENT OF OPERATIONS
For the year ended June 30, 2006
| | | | |
Net investment income: | | | | |
Interest income | | $ | 208,266 | |
| | | | |
Expenses: | | | | |
Investment advisory fee | | | 23,633 | |
Transfer agent fee | | | 7,090 | |
Custodian expense | | | 4,800 | |
Professional fees | | | 3,144 | |
Pricing fees | | | 3,477 | |
Trustee fees | | | 455 | |
Other expenses | | | 4,793 | |
| | | | |
Total expenses | | | 47,392 | |
Fees waived by Adviser | | | (21,013 | ) |
Custodian expense reduction | | | (4,800 | ) |
| | | | |
Net expenses | | | 21,579 | |
| | | | |
Net investment income | | | 186,687 | |
| | | | |
Realized and unrealized gain/(loss) on investments: | | | | |
Net realized gain | | | 22,573 | |
Net decrease in unrealized appreciation | | | (242,729 | ) |
| | | | |
Net realized and unrealized loss on investments | | | (220,156 | ) |
| | | | |
Net decrease in net assets resulting from operations | | $ | (33,469 | ) |
| | | | |
The accompanying notes are an integral part of the financial statements.
17
DUPREE MUTUAL FUNDS - MISSISSIPPI TAX-FREE INCOME SERIES
STATEMENTS OF CHANGES IN NET ASSETS
For the years ended June 30, 2006 and 2005
| | | | | | | | |
| | | 2006 | | | 2005 | |
Increase in net assets: | | | | | | | | |
Operations: | | | | | | | | |
Net investment income | | $ | 186,687 | | | $ | 160,579 | |
Net realized gain on investments | | | 22,573 | | | | 17,756 | |
Net (decrease)/increase in unrealized appreciation | | | (242,729 | ) | | | 132,698 | |
| | | | | | | | |
Net (decrease)/increase in net assets resulting from operations | | | (33,469 | ) | | | 311,033 | |
Distributions to shareholders from net investment income | | | (186,687 | ) | | | (160,579 | ) |
Distributions to shareholders from capital gains | | | (17,756 | ) | | | 0 | |
Net fund share transactions (Note 4) | | | 422,283 | | | | 1,489,129 | |
| | | | | | | | |
Total increase | | | 184,371 | | | | 1,639,583 | |
Net assets: | | | | | | | | |
Beginning of year | | | 4,785,916 | | | | 3,146,333 | |
| | | | | | | | |
End of year | | $ | 4,970,287 | | | $ | 4,785,916 | |
| | | | | | | | |
FINANCIAL HIGHLIGHTS
Selected data for a share outstanding:
| | | | | | | | | | | | | | | | | | | | |
| | | For the years ended June 30, | |
| | | 2006 | | | 2005 | | | 2004 | | | 2003 | | | 2002 | |
Net asset value, beginning of year | | $ | 11.84 | | | $ | 11.34 | | | $ | 11.74 | | | $ | 11.00 | | | $ | 10.83 | |
| | | | | | | | | | | | | | | | | | | | |
Income from investment operations: | | | | | | | | | | | | | | | | | | | | |
Net investment income | | | 0.46 | | | | 0.47 | | | | 0.48 | | | | 0.50 | | | | 0.54 | |
Net gains/(losses) on securities, both realized and unrealized | | | (0.54 | ) | | | 0.50 | | | | (0.40 | ) | | | 0.74 | | | | 0.17 | |
| | | | | | | | | | | | | | | | | | | | |
Total from investment operations | | | (0.08 | ) | | | 0.97 | | | | 0.08 | | | | 1.24 | | | | 0.71 | |
Less distributions: | | | | | | | | | | | | | | | | | | | | |
Distributions from net investment income | | | (0.46 | ) | | | (0.47 | ) | | | (0.48 | ) | | | (0.50 | ) | | | (0.54 | ) |
Distributions from capital gains | | | (0.05 | ) | | | 0.00 | | | | 0.00 | | | | 0.00 | | | | 0.00 | |
| | | | | | | | | | | | | | | | | | | | |
Net asset value, end of year | | $ | 11.25 | | | $ | 11.84 | | | $ | 11.34 | | | $ | 11.74 | | | $ | 11.00 | |
| | | | | | | | | | | | | | | | | | | | |
Total return | | | (1.15 | )% | | | 8.66 | % | | | 0.72 | % | | | 11.53 | % | | | 6.67 | % |
Net assets, end of year (in thousands) | | $ | 4,970 | | | $ | 4,786 | | | $ | 3,146 | | | $ | 2,728 | | | $ | 1,829 | |
Ratio of net expenses to average net assets (a) | | | 0.46 | % | | | 0.41 | % | | | 0.40 | % | | | 0.33 | % | | | 0.27 | % |
Ratio of net investment income to average net assets | | | 3.95 | % | | | 3.99 | % | | | 4.16 | % | | | 4.37 | % | | | 4.87 | % |
Portfolio turnover | | | 16.33 | % | | | 8.91 | % | | | 0.18 | % | | | 2.36 | % | | | 3.40 | % |
| (a) | Percentages are after expenses waived by Adviser and custodian and interest expense reductions. |
Expenses waived by Adviser and custodian expense reductions were:
.44% and .10% for 2006;.45% and .12% for 2005; .46% and .17% for 2004; .55% and .20% for 2003; and .60% and .37% for 2002, respectively.
The accompanying notes are an integral part of the financial statements.
18
DUPREE MUTUAL FUNDS - NORTH CAROLINA TAX-FREE INCOME SERIES
SCHEDULE OF PORTFOLIO INVESTMENTS
North Carolina Municipal Bonds - 100%
June 30, 2006
| | | | | | | | | | | | | |
Bond Description | | Coupon | | | Maturity Date | | Rating# | | Par Value | | Market Value |
INSURED MUNICIPAL BONDS | | | | | | | | | | | | | |
63.15% of Net Assets | | | | | | | | | | | | | |
Burke County NC Certificates of Participation -Series A | | 5.000 | % | | 04/01/2023 | | Aaa/AAA* | | $ | 1,000,000 | | $ | 1,033,460 |
Catawba County NC Catawba Memorial Hospital Revenue | | 5.000 | | | 10/01/2017 | | Aaa/AAA@ | | | 500,000 | | | 513,915 |
Charlotte NC Airport Revenue -Series A | | 5.250 | | | 07/01/2023 | | Aaa/AAA*/AAA@ | | | 1,000,000 | | | 1,051,300 |
Cumberland County NC Certificates of Participation Civic Center | | 5.000 | | | 12/01/2018 | | Aaa/AAA*/AAA@ | | | 500,000 | | | 514,195 |
Dare County NC Utility System Revenue | | 5.250 | | | 06/01/2018 | | Aaa/AAA*/AAA@ | | | 250,000 | | | 261,483 |
Dare County NC Certificates of Participation | | 5.125 | | | 06/01/2018 | | Aaa/AAA*/AAA@ | | | 500,000 | | | 522,315 |
Davie County NC Public School & Community College Facility | | 5.000 | | | 06/01/2023 | | Aaa/AAA*/AAA@ | | | 1,000,000 | | | 1,033,140 |
Davie County NC Public School & Community College Facility | | 5.000 | | | 06/01/2025 | | Aaa/AAA*/AAA@ | | | 1,690,000 | | | 1,741,934 |
Greenville NC Housing Developement Corp - Series A | | 5.800 | | | 07/01/2024 | | Aaa/AAA*/AAA@ | | | 35,000 | | | 35,352 |
Harnett County NC Certificate of Participation | | 5.000 | | | 12/01/2018 | | Aaa/AAA*/AAA@ | | | 1,475,000 | | | 1,536,124 |
Henderson County NC Certificates of Participation - Series A | | 5.000 | | | 05/01/2025 | | Aaa/AAA*/AAA@ | | | 1,000,000 | | | 1,027,250 |
Iredell County NC Certificates of Participation Public Facilities | | 5.250 | | | 10/01/2020 | | Aaa/AAA@ | | | 1,000,000 | | | 1,063,060 |
Iredell County NC Certificates of Participation School Project | | 5.000 | | | 06/01/2024 | | Aaa/AAA* | | | 1,000,000 | | | 1,031,530 |
Lenoir NC Housing Authority Mortgage Revenue | | 5.700 | | | 08/20/2024 | | AAA* | | | 100,000 | | | 102,324 |
New Hanover County NC Hospital Revenue | | 5.000 | | | 10/01/2019 | | Aaa/AAA*/AAA@ | | | 1,110,000 | | | 1,135,108 |
New Hanover County NC Certificates of Participation | | 5.000 | | | 12/01/2022 | | Aaa/AAA*/AAA@ | | | 1,000,000 | | | 1,041,920 |
NC Educational Facilities Finance Agency St Augustines | | 5.250 | | | 10/01/2018 | | AA* | | | 600,000 | | | 614,394 |
NC Educational Facilities Finance Agency St Augustines | | 5.250 | | | 10/01/2028 | | AA* | | | 630,000 | | | 646,342 |
NC Medical Care Community Hospital Morehead Memorial Hospital | | 5.000 | | | 11/01/2026 | | Aaa/AAA*/AAA@ | | | 2,000,000 | | | 2,045,760 |
NC Eastern Municipal Power Agency Power System Revenue | | 5.500 | | | 01/01/2017 | | Aaa/AAA*/AAA@ | | | 150,000 | | | 150,255 |
NC Eastern Municipal Power Agency Power System Revenue | | 5.700 | | | 01/01/2015 | | Aaa/AAA*/AAA@ | | | 345,000 | | | 355,264 |
NC Eastern Municipal Power Agency Power System Refunding | | 5.375 | | | 01/01/2024 | | Aaa/AAA*/AAA@ | | | 1,000,000 | | | 1,030,760 |
NC Eastern Municipal Power Agency Power System Revenue | | 6.000 | | | 01/01/2018 | | Aaa/AAA*/AAA@ | | | 1,000,000 | | | 1,140,300 |
NC Eastern Municipal Power Agency Power System Revenue | | 5.000 | | | 01/01/2021 | | Aaa/AAA*/AAA@ | | | 1,000,000 | | | 1,034,400 |
NC Municipal Power Agency Number 1 Catawba Electric Revenue | | 5.250 | | | 01/01/2019 | | Aaa/AAA*/AAA@ | | | 1,000,000 | | | 1,051,650 |
NC Medical Care Community Hospital Revenue-High Point | | 5.000 | | | 10/01/2019 | | Aaa/AAA*/AAA@ | | | 500,000 | | | 517,305 |
NC Medial Care Community Hospital Northeast Medical Center | | 4.600 | | | 11/01/2020 | | Aaa/AAA*/AAA@ | | | 350,000 | | | 350,931 |
NC Medical Care Community Hospital Revenue-Rex Hospital | | 5.000 | | | 06/01/2017 | | Aaa/AAA*/AAA@ | | | 500,000 | | | 513,860 |
NC Medical Care Community Hospital Revenue-St Joseph | | 5.100 | | | 10/01/2014 | | Aaa/AAA*/AAA@ | | | 5,000 | | | 5,017 |
NC Medical Care Community Hospital Revenue-Stanly Hospital | | 5.375 | | | 10/01/2014 | | Aaa/AAA | | | 50,000 | | | 51,213 |
NC Medical Care Community Hospital Revenue-Wilson Memorial | | 5.625 | | | 11/01/2018 | | Aaa/AAA* | | | 80,000 | | | 81,911 |
NC Municipal Power Agency No 1 Catawba Electric Revenue | | 5.125 | | | 01/01/2017 | | Aaa/AAA*/AAA@ | | | 500,000 | | | 513,000 |
NC Municipal Power Agency No 1 Catawba Electric Revenue | | 5.125 | | | 01/01/2017 | | Aaa/AAA*/AAA@ | | | 700,000 | | | 724,668 |
Pitt County NC Certificates of Participation School Facilities | | 5.500 | | | 04/01/2020 | | Aaa/AAA*/AAA@ | | | 500,000 | | | 529,630 |
Raleigh Durham NC Airport Authority | | 5.250 | | | 11/01/2018 | | Aaa/AAA@ | | | 1,000,000 | | | 1,048,510 |
Raleigh/Durham NC Airport Revenue | | 5.000 | | | 11/01/2020 | | Aaa/AAA@ | | | 1,000,000 | | | 1,028,960 |
University of NC at Chapel Hill Hospital Revenue | | 5.250 | | | 02/15/2017 | | Aaa/AAA*/AAA@ | | | 500,000 | | | 522,715 |
University of NC System Pool Revenue - Series C | | 5.000 | | | 04/01/2019 | | Aaa/AAA@ | | | 1,000,000 | | | 1,038,980 |
University of NC Wilmington Certificates of Participation | | 5.250 | | | 06/01/2025 | | AAA*/AAA@ | | | 1,000,000 | | | 1,054,560 |
University of NC Wilmington Student Housing Project | | 5.000 | | | 06/01/2025 | | AAA* | | | 580,000 | | | 597,354 |
Wilson Combined Enterprise System | | 4.700 | | | 12/01/2022 | | Aaa/AAA* | | | 500,000 | | | 506,060 |
| | | | | | | | | | | | | |
| | | | | | | | | | | | | 30,798,209 |
PREREFUNDED BONDS | | | | | | | | | | | | | |
12.43% of Net Assets | | | | | | | | | | | | | |
Charlotte NC Certificates of Participation Convention Facilities | | 5.500 | | | 12/01/2020 | | Aa2/AA+* | | | 700,000 | | | 753,004 |
Cumberland County NC Hospital Facilities Revenue | | 5.250 | | | 10/01/2019 | | A3/A-*/A-@ | | | 1,000,000 | | | 1,050,240 |
Cumberland County NC Hospital Facilities Revenue | | 5.250 | | | 10/01/2019 | | AA*/AA@ | | | 1,000,000 | | | 1,051,810 |
Greensboro NC Coliseum Complex Improvement | | 5.700 | | | 12/01/2010 | | A1/A+@ | | | 55,000 | | | 56,516 |
New Hanover County NC Certificates of Participation | | 5.000 | | | 12/01/2017 | | Aaa/AAA*/AAA@ | | | 250,000 | | | 258,945 |
New Hanover County NC Hospital Revenue | | 5.750 | | | 10/01/2026 | | Aaa/AAA* | | | 100,000 | | | 102,690 |
NC Eastern Municipal Power Agency Power System | | 6.000 | | | 01/01/2026 | | Aaa/BBB*/BBB+@ | | | 545,000 | | | 641,569 |
NC Central University Housing System Revenue | | 5.800 | | | 11/01/2018 | | Aaa/AAA*/AAA@ | | | 50,000 | | | 51,334 |
NC Central University Housing System Revenue | | 5.800 | | | 11/01/2020 | | Aaa/AAA*/AAA@ | | | 60,000 | | | 61,601 |
NC Medical Care Community Hospital Revenue Prerefunded Pitt | | 5.250 | | | 12/01/2013 | | A1/A+*/AA-@ | | | 755,000 | | | 786,770 |
NC Medical Care Community Hospital Revenue Prerefunded Pitt | | 5.000 | | | 12/01/2018 | | A1/A+*/AA-@ | | | 475,000 | | | 492,266 |
Pitt County NC Certificates of Participation Public Facilities | | 5.850 | | | 04/01/2017 | | Aaa/AAA*/AAA@ | | | 100,000 | | | 103,466 |
Randolph County NC Certificates of Participation | | 5.750 | | | 06/01/2022 | | Aaa/AAA*/AAA@ | | | 500,000 | | | 531,020 |
University of NC at Wilmington Dorm & Dining System Revenue | | 5.400 | | | 01/01/2018 | | Aaa/AAA*/AAA@ | | | 120,000 | | | 123,325 |
| | | | | | | | | | | | | |
| | | | | | | | | | | | | 6,064,556 |
CERTIFICATES OF PARTICIPATION BONDS | | | | | | | | | | | | | |
9.97% of Net Assets | | | | | | | | | | | | | |
Cabarrus County NC Certificates of Participation | | 5.000 | | | 04/01/2021 | | Aa3/AA-*/AA-@ | | | 650,000 | | | 672,139 |
Charlotte NC Certificates of Participation Convention Facilities | | 5.000 | | | 12/01/2024 | | Aa2/AA+* | | | 1,000,000 | | | 1,032,570 |
Charlotte NC Certificates of Participation Government Facilities | | 5.250 | | | 06/01/2020 | | Aa2/AA+*/AA@ | | | 1,000,000 | | | 1,050,800 |
Forsyth County NC Certificates of Participation | | 5.000 | | | 10/01/2018 | | Aa1/AA+*/AA+@ | | | 5,000 | | | 5,165 |
Forsyth County NC Certificates of Participation | | 5.000 | | | 02/01/2026 | | Aa1/AA+*/AA+@ | | | 550,000 | | | 563,475 |
NC Infrastructure Finance Corporation Certificates of Participation | | 5.000 | | | 02/01/2025 | | Aa2/AA+*/AA@ | | | 1,500,000 | | | 1,538,895 |
| | | | | | | | | | | | | |
| | | | | | | | | | | | | 4,863,044 |
The accompanying notes are an integral part of the financial statements.
19
DUPREE MUTUAL FUNDS - NORTH CAROLINA TAX-FREE INCOME SERIES
SCHEDULE OF PORTFOLIO INVESTMENTS
North Carolina Municipal Bonds - 100%
June 30, 2006
| | | | | | | | | | | | | |
Bond Description | | Coupon | | | Maturity Date | | Rating# | | Par Value | | Market Value |
HOSPITAL AND HEALTHCARE REVENUE BONDS | | | | | | | | | | | | | |
4.15% of Net Assets | | | | | | | | | | | | | |
Charlotte/Mecklenburg NC Hospital Authority Revenue | | 5.000 | % | | 01/15/2017 | | Aa3/AA* | | $ | 750,000 | | $ | 767,760 |
NC Medical Care Health Care Facilities Revenue - Novant Health | | 5.000 | | | 11/01/2017 | | Aa3/AA-*/AA-@ | | | 1,000,000 | | | 1,032,770 |
NC Medical Care Community Hospital Revenue-Gaston Memorial | | 5.500 | | | 02/15/2019 | | A1/A+* | | | 150,000 | | | 153,107 |
NC Medical Care Community Hospital Revenue Unrefunded Balance | | 5.250 | | | 12/01/2013 | | A1 | | | 45,000 | | | 46,524 |
NC Medical Care Community Hospital Revenue Unrefunded Balance | | 5.000 | | | 12/01/2018 | | A1 | | | 25,000 | | | 25,634 |
| | | | | | | | | | | | | |
| | | | | | | | | | | | | 2,025,795 |
GENERAL OBLIGATION BONDS | | | | | | | | | | | | | |
2.18% of Net Assets | | | | | | | | | | | | | |
Cary NC General Obligation | | 5.000 | | | 03/01/2019 | | Aaa/AAA*/AAA@ | | | 1,000,000 | | | 1,061,860 |
| | | | | | | | | | | | | |
| | | | | | | | | | | | | 1,061,860 |
LEASE REVENUE BONDS | | | | | | | | | | | | | |
2.19% of Net Assets | | | | | | | | | | | | | |
NC Infrastructure Financial Corporation Lease Purchase | | 5.000 | | | 10/01/2021 | | Aa2/AA+*/AA@ | | | 1,000,000 | | | 1,033,080 |
| | | | | | | | | | | | | |
| | | | | | | | | | | | | 1,033,080 |
PUBLIC FACILITIES REVENUE BONDS | | | | | | | | | | | | | |
1.48% of Net Assets | | | | | | | | | | | | | |
Cary NC Combined Enterprise System Revenue | | 5.000 | | | 12/01/2022 | | Aa2/AA*/AAA@ | | | 700,000 | | | 724,122 |
| | | | | | | | | | | | | |
| | | | | | | | | | | | | 724,122 |
MUNICIPAL UTILITY REVENUE BONDS | | | | | | | | | | | | | |
1.13% of Net Assets | | | | | | | | | | | | | |
Charlotte NC Storm Water Revenue Refunding | | 5.250 | | | 06/01/2019 | | Aa2/AA+* | | | 520,000 | | | 551,829 |
| | | | | | | | | | | | | |
| | | | | | | | | | | | | 551,829 |
ESCROWED TO MATURITY BONDS | | | | | | | | | | | | | |
.70% of Net Assets | | | | | | | | | | | | | |
Pitt County NC Memorial Hospital Revenue | | 5.500 | | | 12/01/2015 | | Aaa/AA-@ | | | 325,000 | | | 341,305 |
| | | | | | | | | | | | | |
| | | | | | | | | | | | | 341,305 |
STATE AND LOCAL MORTGAGE REVENUE BONDS | | | | | | | | | | | | | |
.56% of Net Assets | | | | | | | | | | | | | |
NC Housing Finance Agency Single Family Revenue - Series Y | | 6.300 | | | 09/01/2015 | | Aa2/AA* | | | 40,000 | | | 40,075 |
NC Housing Finance Agency Single Family Revenue - Series II | | 6.200 | | | 03/01/2016 | | Aa2/AA* | | | 35,000 | | | 35,709 |
NC Housing Finance Agency Single Family Revenue - Series KK | | 5.875 | | | 09/01/2017 | | Aa2/AA* | | | 45,000 | | | 45,756 |
NC Housing Finance Agency Home Ownership Revenue | | 5.125 | | | 07/01/2013 | | Aa2/AA* | | | 55,000 | | | 55,703 |
Vance County NC Housing Mortgage Revenue Henderson Project | | 6.150 | | | 03/01/2022 | | Aa2 | | | 95,000 | | | 95,151 |
| | | | | | | | | | | | | |
| | | | | | | | | | | | | 272,394 |
| | | | | | | | | | | | | |
Total Investments (cost $47,086,945) (See (a) below for further explanation) - 97.94% of Net Assets | | | | | | | | | | | | $ | 47,736,194 |
| | | | | | | | | | | | | |
| * | Standard and Poor’s Corporation |
| @ | Fitch’s Investors Service |
| | All other ratings by Moody’s Investors Service, Inc. |
| # | Bond ratings are unaudited. |
| (a) | Represents cost for financial reporting and federal income tax purposes and differs from market value by net unrealized appreciation of securities as follows: |
| | | | |
Unrealized appreciation | | $ | 1,075,171 | |
Unrealized depreciation | | | (425,922 | ) |
| | | | |
Net unrealized appreciation | | $ | 649,249 | |
| | | | |
The accompanying notes are an integral part of the financial statements.
20
DUPREE MUTUAL FUNDS - NORTH CAROLINA TAX-FREE INCOME SERIES
STATEMENT OF ASSETS AND LIABILITIES
JUNE 30, 2006
| | | | | | | |
ASSETS: | | | | | | | |
Investments in securities, at value (Cost: $47,086,945) | | | | | $ | 47,736,194 | |
Cash | | | | | | 656,042 | |
Interest receivable | | | | | | 567,584 | |
Prepaid expenses | | | | | | 14,187 | |
| | | | | | | |
Total assets | | | | | | 48,974,007 | |
LIABILITIES: | | | | | | | |
Payable for: | | | | | | | |
Distributions to shareholders | | $ | 134,513 | | | | |
Fund shares redeemed | | | 29,513 | | | | |
Investment advisory fee | | | 21,688 | | | | |
Transfer agent fee | | | 5,715 | | | | |
Trustee fee | | | 2,223 | | | | |
Accrued expenses | | | 9,888 | | | | |
| | | | | | | |
Total liabilities | | | | | | 203,540 | |
| | | | | | | |
NET ASSETS: | | | | | | | |
Capital | | | | | | 48,895,608 | |
Net accumulated realized loss on investment transactions | | | | | | (774,390 | ) |
Net unrealized appreciation in value of investments | | | | | | 649,249 | |
| | | | | | | |
Net assets at value | | | | | $ | 48,770,467 | |
| | | | | | | |
NET ASSET VALUE, offering price and redemption price per share ($48,770,467 -:- 4,541,210 shares outstanding; unlimited number of shares authorized; no par value) | | | | | $ | 10.74 | |
| | | | | | | |
STATEMENT OF OPERATIONS
For the year ended June 30, 2006
| | | | |
Net investment income: | | | | |
Interest income | | $ | 2,132,263 | |
| | | | |
Expenses: | | | | |
Investment advisory fee | | | 231,203 | |
Transfer agent fee | | | 61,489 | |
Custodian expense | | | 7,682 | |
Professional fees | | | 9,752 | |
Trustee fees | | | 4,425 | |
Other expenses | | | 27,728 | |
| | | | |
Total expenses | | | 342,279 | |
Custodian expense reduction | | | (7,682 | ) |
| | | | |
Net expenses | | | 334,597 | |
| | | | |
Net investment income | | | 1,797,666 | |
| | | | |
Realized and unrealized gain/(loss) on investments: | | | | |
Net realized gain | | | 261,193 | |
Net decrease in unrealized appreciation | | | (1,795,512 | ) |
| | | | |
Net realized and unrealized loss on investments | | | (1,534,319 | ) |
| | | | |
Net increase in net assets resulting from operations | | $ | 263,347 | |
| | | | |
The accompanying notes are an integral part of the financial statements.
21
DUPREE MUTUAL FUNDS - NORTH CAROLINA TAX-FREE INCOME SERIES
STATEMENTS OF CHANGES IN NET ASSETS
For the years ended June 30, 2006 and 2005
| | | | | | | | |
| | | 2006 | | | 2005 | |
Increase in net assets: | | | | | | | | |
Operations: | | | | | | | | |
Net investment income | | $ | 1,797,666 | | | $ | 1,643,099 | |
Net realized gain on investments | | | 261,193 | | | | 29,391 | |
Net (decrease)/increase in unrealized appreciation | | | (1,795,512 | ) | | | 1,099,737 | |
| | | | | | | | |
Net increase in net assets resulting from operations | | | 263,347 | | | | 2,772,227 | |
Distributions to shareholders from net investment income | | | (1,797,666 | ) | | | (1,643,099 | ) |
Net fund share transactions (Note 4) | | | 5,566,268 | | | | 4,818,425 | |
| | | | | | | | |
Total increase | | | 4,031,949 | | | | 5,947,553 | |
Net assets: | | | | | | | | |
Beginning of year | | | 44,738,518 | | | | 38,790,965 | |
| | | | | | | | |
End of year | | $ | 48,770,467 | | | $ | 44,738,518 | |
| | | | | | | | |
FINANCIAL HIGHLIGHTS
Selected data for a share outstanding:
| | | | | | | | | | | | | | | | | | | | |
| | | For the years ended June 30, | |
| | | 2006 | | | 2005 | | | 2004 | | | 2003 | | | 2002 | |
Net asset value, beginning of year | | $ | 11.10 | | | $ | 10.78 | | | $ | 11.12 | | | $ | 10.68 | | | $ | 10.63 | |
| | | | | | | | | | | | | | | | | | | | |
Income from investment operations: | | | | | | | | | | | | | | | | | | | | |
Net investment income | | | 0.42 | | | | 0.44 | | | | 0.44 | | | | 0.47 | | | | 0.49 | |
Net gains/(losses) on securities, both realized and unrealized | | | (0.36 | ) | | | 0.32 | | | | (0.34 | ) | | | 0.44 | | | | 0.05 | |
| | | | | | | | | | | | | | | | | | | | |
Total from investment operations | | | 0.06 | | | | 0.76 | | | | 0.10 | | | | 0.91 | | | | 0.54 | |
Less distributions: | | | | | | | | | | | | | | | | | | | | |
Distributions from net investment income | | | (0.42 | ) | | | (0.44 | ) | | | (0.44 | ) | | | (0.47 | ) | | | (0.49 | ) |
| | | | | | | | | | | | | | | | | | | | |
Net asset value, end of year | | $ | 10.74 | | | $ | 11.10 | | | $ | 10.78 | | | $ | 11.12 | | | $ | 10.68 | |
| | | | | | | | | | | | | | | | | | | | |
Total return | | | 0.59 | % | | | 7.13 | % | | | 0.95 | % | | | 8.70 | % | | | 5.19 | % |
Net assets, end of year (in thousands) | | $ | 48,770 | | | $ | 44,739 | | | $ | 38,791 | | | $ | 39,668 | | | $ | 32,585 | |
Ratio of net expenses to average net assets (a) | | | 0.72 | % | | | 0.69 | % | | | 0.69 | % | | | 0.68 | % | | | 0.57 | % |
Ratio of net investment income to average net assets | | | 3.89 | % | | | 3.97 | % | | | 4.05 | % | | | 4.29 | % | | | 4.60 | % |
Portfolio turnover | | | 12.73 | % | | | 7.96 | % | | | 10.51 | % | | | 7.99 | % | | | 6.60 | % |
| (a) | Percentages are after expenses waived by Adviser and custodian and interest expense reductions. |
Expenses waived by Adviser and custodian and interest expense reductions were:
0% and .02% for 2006; 0% and .03% for 2005; 0% and .03% for 2004; .02% and .03% for 2003; and .14% and .03% for 2002, respectively.
The accompanying notes are an integral part of the financial statements.
22
DUPREE MUTUAL FUNDS - NORTH CAROLINA TAX-FREE SHORT-TO-MEDIUM SERIES
SCHEDULE OF PORTFOLIO INVESTMENTS
North Carolina Municipal Bonds—100%
June 30, 2006
| | | | | | | | | | | | | |
Bond Description | | Coupon | | | Maturity Date | | Rating# | | Par Value | | Market Value |
INSURED MUNICIPAL REVENUE BONDS | | | | | | | | | | | | | |
63.74% of Net Assets | | | | | | | | | | | | | |
Catawba County Certificates of Participation Public School | | 5.250 | % | | 06/01/2016 | | Aaa/NR*/AAA@ | | $ | 125,000 | | $ | 132,894 |
Centennial Authority NC Hotel Tax Revenue Bond Arena Project | | 5.000 | | | 09/01/2012 | | Aaa/AAA*/AAA@ | | | 100,000 | | | 103,467 |
Charlotte NC Certificates of Participation - Series A | | 5.000 | | | 08/01/2012 | | Aaa/AAA*/AAA@ | | | 1,000,000 | | | 1,055,160 |
Cumberland County NC Hospital Facility Revenue | | 5.000 | | | 10/01/2006 | | A3/AA*/A-@ | | | 150,000 | | | 150,443 |
Davie County NC Community College | | 4.000 | | | 06/01/2013 | | Aaa/AAA* | | | 250,000 | | | 249,393 |
Greenville NC Certificates of Participation Public Facilities | | 4.600 | | | 06/01/2011 | | Aaa/AAA*/AAA@ | | | 100,000 | | | 102,215 |
Harnett County NC Certificates Of Participation | | 5.250 | | | 12/01/2009 | | Aaa/AAA*/AAA@ | | | 240,000 | | | 251,522 |
Harnett County NC Certificates of Participation | | 4.250 | | | 12/01/2011 | | Aaa/AAA*/AAA@ | | | 150,000 | | | 152,465 |
Haywood NC Certificates of Participation Refunding - Series A | | 5.000 | | | 10/01/2016 | | Aaa/AAA*/AAA@ | | | 635,000 | | | 666,458 |
Johnston County NC Certificates of Participation - Judicial Annex | | 5.200 | | | 09/01/2007 | | Aaa/AAA*/AAA@ | | | 100,000 | | | 101,856 |
Johnston County NC Finance Corporation School & Museum Project | | 4.650 | | | 08/01/2008 | | Aaa/AAA*/AAA@ | | | 200,000 | | | 203,532 |
Lee County NC Certificates of Participation | | 5.000 | | | 04/01/2016 | | Aaa/AAA*/AAA@ | | | 215,000 | | | 224,961 |
Lincoln County Certificate of Participation | | 4.500 | | | 06/01/2009 | | Aaa/AAA*/AAA@ | | | 500,000 | | | 510,400 |
New Hanover County NC Regional Medical Center Hospital Revenue | | 4.250 | | | 10/01/2009 | | Aaa/AAA*/AAA@ | | | 100,000 | | | 101,329 |
North Carolina Medical Care Community Hospital - Rowan Medical Center | | 5.250 | | | 09/01/2016 | | Aaa/AAA*/AAA@ | | | 1,100,000 | | | 1,169,718 |
North Carolina Medical Care Community Hospital - Chatham Memorial | | 3.625 | | | 10/01/2010 | | AA*/AA@ | | | 100,000 | | | 97,967 |
NC Capital Facility Finance Agency Johnson & Wales University | | 5.000 | | | 04/01/2009 | | Aaa/AAA*/AAA@ | | | 200,000 | | | 206,258 |
North Carolina Eastern Municipal Power Agency Power System Revenue | | 6.125 | | | 01/01/2009 | | BAA2/A* | | | 120,000 | | | 126,248 |
North Carolina Municipal Power Agency No.1 Catawba Electric | | 6.000 | | | 01/01/2010 | | Aaa/AAA*/AAA@ | | | 200,000 | | | 213,896 |
NC Municipal Power Agency No.1 Catawba Electric Revenue | | 5.250 | | | 01/01/2009 | | Aaa/AAA*/AAA@ | | | 500,000 | | | 517,755 |
North Carolina Medical Care Community Hospital-Scotland Memorial | | 5.375 | | | 10/01/2011 | | AA* | | | 50,000 | | | 50,125 |
NC Medical Care Community Hospital - Wilson Memorial Hospital | | 4.900 | | | 11/01/2007 | | Aaa/AAA* | | | 75,000 | | | 76,208 |
North Carolina Medical Care Community Hospital - Wayne Memorial | | 4.250 | | | 10/01/2006 | | Aaa/AAA@ | | | 100,000 | | | 100,170 |
North Carolina Medical Community Hospital - Wayne Memorial | | 4.750 | | | 10/01/2011 | | Aaa/AAA@ | | | 350,000 | | | 360,077 |
North Carolina Medical Care Community Hospital - Rex Healthcare | | 5.250 | | | 06/01/2008 | | Aaa/AAA*/AAA@ | | | 450,000 | | | 463,464 |
NC Municipal Power Agency No. 1 Catawba Electric | | 5.100 | | | 01/01/2007 | | Aaa/AAA*/AAA@ | | | 125,000 | | | 126,175 |
North Carolina Municipal Power Agency Catawba Electric | | 6.000 | | | 01/01/2007 | | Aaa/AAA*/AAA@ | | | 200,000 | | | 202,170 |
Pitt County NC Certificates of Participation School Facilities | | 4.750 | | | 04/01/2010 | | Aaa/AAA*/AAA@ | | | 100,000 | | | 103,287 |
Randolph County NC Certificates of Participation | | 5.200 | | | 06/01/2008 | | Aaa/AAA*/AAA@ | | | 145,000 | | | 148,827 |
University NC System Pool Revenue - Series B | | 5.000 | | | 10/01/2009 | | Aaa/AAA*/AAA@ | | | 170,000 | | | 176,178 |
Wilson County NC General Obligation | | 5.000 | | | 06/01/2010 | | Aaa/AAA*/AAA@ | | | 250,000 | | | 261,190 |
| | | | | | | | | | | | | |
| | | | | | | | | | | | | 8,405,808 |
CERTIFICATES OF PARTICIPATION BONDS | | | | | | | | | | | | | |
8.31% of Net Assets | | | | | | | | | | | | | |
Cabarrus County NC Certificates of Participation | | 4.250 | | | 04/01/2007 | | Aa3/AA-*/AA-@ | | | 55,000 | | | 55,163 |
Cabarrus County NC Certificates of Participation | | 4.500 | | | 04/01/2009 | | Aa3/AA-*/AA-@ | | | 100,000 | | | 101,782 |
Charlotte NC Certificates of Participation - Series D | | 5.750 | | | 06/01/2007 | | Aa1/AA+* | | | 100,000 | | | 101,768 |
Charlotte NC Certificates of Participation - Series D | | 5.750 | | | 06/01/2008 | | Aa1/AA+* | | | 100,000 | | | 103,704 |
Charlotte NC Certificates of Participation - Series B | | 5.000 | | | 06/01/2009 | | Aa1/AA+* | | | 100,000 | | | 103,339 |
Durham County NC Certificates of Participation | | 4.750 | | | 05/01/2009 | | Aa1/AA+* | | | 210,000 | | | 214,738 |
Durham NC Certificates of Participation | | 5.000 | | | 04/01/2010 | | Aa1/AA+*/AA+@ | | | 300,000 | | | 311,187 |
Forsyth County NC Certificates of Participation | | 5.000 | | | 10/01/2009 | | Aa1/AA+*/AA+@ | | | 100,000 | | | 103,540 |
| | | | | | | | | | | | | |
| | | | | | | | | | | | | 1,095,221 |
HOSPITAL AND HEALTHCARE REVENUE BONDS | | | | | | | | | | | | | |
6.68% of Net Assets | | | | | | | | | | | | | |
Cumberland County NC Hospital Facility Revenue | | 4.500 | | | 10/01/2007 | | A3/A-*/A-@ | | | 200,000 | | | 201,028 |
NC Medical Care Community Health Care Facility - Duke University | | 4.500 | | | 06/01/2007 | | Aa3/AA*/AA@ | | | 200,000 | | | 201,086 |
North Carolina Medical Care Community Hospital - Pitt Memorial | | 4.400 | | | 12/01/2011 | | Aa3/AA-*/AA-@ | | | 275,000 | | | 277,747 |
NC Medical Care Community Hospital - Gaston Memorial | | 5.250 | | | 02/15/2007 | | A1/A+* | | | 50,000 | | | 50,475 |
North Carolina Medical Care Community Hospital - St Joseph | | 4.300 | | | 10/01/2007 | | Aa3/AA/AA@ | | | 150,000 | | | 150,974 |
| | | | | | | | | | | | | |
| | | | | | | | | | | | | 881,310 |
LEASE REVENUE BONDS | | | | | | | | | | | | | |
6.48% of Net Assets | | | | | | | | | | | | | |
Greensboro NC Enterprise System Revenue Combination - Series A | | 4.800 | | | 06/01/2012 | | Aa3/AA+*/AA+@ | | | 75,000 | | | 77,029 |
Greensboro NC Enterprise System Revenue - Series A | | 5.000 | | | 06/01/2011 | | Aa3/AA+*/AA+@ | | | 500,000 | | | 523,705 |
Winston Salem NC Certificates of Participation - Series A | | 3.950 | | | 06/01/2009 | | Aa1/AA+*/AA+@ | | | 100,000 | | | 100,407 |
Winston-Salem NC Water & Sewer System Revenue | | 4.500 | | | 06/01/2011 | | Aa2/AAA*/AA@ | | | 150,000 | | | 153,987 |
| | | | | | | | | | | | | |
| | | | | | | | | | | | | 855,128 |
GENERAL OBLIGATION BONDS | | | | | | | | | | | | | |
5.15% of Net Assets | | | | | | | | | | | | | |
Forsyth County NC Public Improvement General Obligation S:A | | 4.500 | | | 03/01/2009 | | Aaa/AAA*/AAA@ | | | 250,000 | | | 255,155 |
New Hanover County NC General Obligation | | 5.300 | | | 11/01/2006 | | Aa2/AA* | | | 100,000 | | | 100,594 |
North Carolina State Public Improvement General Obligation | | 4.500 | | | 03/01/2010 | | Aa1/AAA*/AAA@ | | | 150,000 | | | 153,713 |
North Carolina State Public School Building General Obligation | | 4.600 | | | 04/01/2010 | | Aa1/AAA*/AAA@ | | | 50,000 | | | 51,351 |
North Carolina Public School Building General Obligation | | 4.600 | | | 04/01/2011 | | Aa1/AAA*/AAA@ | | | 115,000 | | | 118,352 |
| | | | | | | | | | | | | |
| | | | | | | | | | | | | 679,165 |
The accompanying notes are an integral part fo the financial statements.
23
DUPREE MUTUAL FUNDS - NORTH CAROLINA TAX-FREE SHORT-TO-MEDIUM SERIES
SCHEDULE OF PORTFOLIO INVESTMENTS
North Carolina Municipal Bonds - 100%
June 30, 2006
| | | | | | | | | | | | | |
Bond Description | | Coupon | | | Maturity Date | | Rating# | | Par Value | | Market Value |
UNIVERSITY CONSOLIDATED EDUCATION AND BUILDING REVENUE BONDS | | | | | | | | | | | | | |
3.78% of Net Assets | | | | | | | | | | | | | |
North Carolina Raleigh State University Revenue | | 5.000 | % | | 10/01/2011 | | Aa3/AA* | | $ | 280,000 | | $ | 295,028 |
University of North Carolina Revenue Refunding - Series B | | 5.000 | | | 12/01/2010 | | Aa1/AA+*/AA+@ | | | 195,000 | | | 203,867 |
| | | | | | | | | | | | | |
| | | | | | | | | | | | | 498,895 |
PREREFUNDED BONDS | | | | | | | | | | | | | |
3.38% of Net Assets | | | | | | | | | | | | | |
North Carolina State General Obligation - Series A | | 4.750 | | | 04/01/2010 | | Aa1/AAA*/AAA@ | | | 100,000 | | | 102,595 |
Orange County Water & Sewer Authority Revenue | | 4.350 | | | 07/01/2010 | | Aa1/AA+*/AAA@ | | | 100,000 | | | 101,944 |
Piedmont Triad NC Airport Authority Revenue Bonds - Series A | | 5.250 | | | 07/01/2011 | | Aaa/AAA*/AAA@ | | | 200,000 | | | 210,408 |
University NC System Pool Revenue - Series B | | 5.000 | | | 10/01/2009 | | Aaa/AAA*/AAA@ | | | 30,000 | | | 31,011 |
| | | | | | | | | | | | | |
| | | | | | | | | | | | | 445,958 |
| | | | | | | | | | | | | |
Total Investments (cost $12,975,258) (See (a) below for further explanation) - 97.52% of Net Assets | | | | | | | | | | | | $ | 12,861,485 |
| | | | | | | | | | | | | |
| * | Standard and Poor’s Corporation |
| @ | Fitch’s Investors Service |
| | All other ratings by Moody’s Investors Service, Inc. |
| # | Bond ratings are unaudited. |
| (a) | Represents cost for financial reporting and federal income tax purposes and differs from market value by net unrealized depreciation of securities as follows: |
| | | | |
Unrealized appreciation | | $ | 36,698 | |
Unrealized depreciation | | | (150,471 | ) |
| | | | |
Net unrealized depreciation | | $ | (113,773 | ) |
| | | | |
The accompanying notes are an integral part fo the financial statements.
24
DUPREE MUTUAL FUNDS - NORTH CAROLINA TAX-FREE SHORT-TO-MEDIUM SERIES
STATEMENT OF ASSETS AND LIABILITIES
JUNE 30, 2006
| | | | | | | |
ASSETS: | | | | | | | |
Investments in securities, at value (Cost: $12,975,258 ) | | | | | $ | 12,861,485 | |
Cash | | | | | | 192,101 | |
Interest receivable | | | | | | 158,430 | |
Total assets | | | | | | 13,212,016 | |
| | | | | | | |
LIABILITIES: | | | | | | | |
Payable for: | | | | | | | |
Distributions to shareholders | | $ | 8,967 | | | | |
Investment advisory fee | | | 5,362 | | | | |
Transfer agent fee | | | 526 | | | | |
Trustee fee | | | 1,095 | | | | |
Accrued expenses | | | 9,349 | | | | |
| | | | | | | |
Total liabilities | | | | | | 25,299 | |
NET ASSETS: | | | | | | | |
Capital | | | | | | 13,415,900 | |
Net accumulated realized loss on investment transactions | | | | | | (115,410 | ) |
Net unrealized depreciation in value of investments | | | | | | (113,773 | ) |
| | | | | | | |
Net assets at value | | | | | $ | 13,186,717 | |
| | | | | | | |
NET ASSET VALUE, offering price and redemption price per share ($13,186,717 -:- 1,278,741 shares outstanding; unlimited number of shares authorized; no par value) | | | | | $ | 10.31 | |
| | | | | | | |
STATEMENT OF OPERATIONS
For the year ended June 30, 2006
| | | | |
Net investment income: | | | | |
Interest income | | $ | 523,479 | |
| | | | |
Expenses: | | | | |
Investment advisory fee | | | 73,309 | |
Transfer agent fee | | | 21,993 | |
Professional fees | | | 12,413 | |
Custodian expense | | | 4,855 | |
Trustee fees | | | 1,501 | |
Other expenses | | | 6,451 | |
| | | | |
Total expenses | | | 120,522 | |
Expenses waived by Adviser | | | (7,451 | ) |
Custodian expense reduction | | | (4,855 | ) |
| | | | |
Net expenses | | | 108,216 | |
| | | | |
Net investment income | | | 415,263 | |
| | | | |
Realized and unrealized loss on investments: | | | | |
Net realized loss | | | (56,077 | ) |
Net decrease in unrealized appreciation | | | (347,256 | ) |
| | | | |
Net realized and unrealized loss on investments | | | (403,333 | ) |
| | | | |
Net increase in net assets resulting from operations | | $ | 11,930 | |
| | | | |
The accompanying notes are an integral part of the financial statements.
25
DUPREE MUTUAL FUNDS - NORTH CAROLINA TAX-FREE SHORT-TO-MEDIUM SERIES
STATEMENTS OF CHANGES IN NET ASSETS
For the years ended June 30, 2006 and 2005
| | | | | | | | |
| | | 2006 | | | 2005 | |
Increase in net assets: | | | | | | | | |
Operations: | | | | | | | | |
Net investment income | | $ | 415,263 | | | $ | 474,522 | |
Net realized loss on investments | | | (56,077 | ) | | | (16,019 | ) |
Net (decrease)/increase in unrealized appreciation | | | (347,256 | ) | | | 53,493 | |
| | | | | | | | |
Net increase in net assets resulting from operations | | | 11,930 | | | | 511,996 | |
Distributions to shareholders from net investment income | | | (415,263 | ) | | | (474,522 | ) |
Net fund share transactions (Note 4) | | | (3,238,467 | ) | | | 1,095,780 | |
| | | | | | | | |
Total (decrease)/increase | | | (3,641,800 | ) | | | 1,133,254 | |
Net assets: | | | | | | | | |
Beginning of year | | | 16,828,517 | | | | 15,695,263 | |
| | | | | | | | |
End of year | | $ | 13,186,717 | | | $ | 16,828,517 | |
| | | | | | | | |
FINANCIAL HIGHLIGHTS
Selected data for a share outstanding:
| | | | | | | | | | | | | | | | | | | | |
| | | For the years ended June 30, | |
| | | 2006 | | | 2005 | | | 2004 | | | 2003 | | | 2002 | |
Net asset value, beginning of year | | $ | 10.60 | | | $ | 10.57 | | | $ | 10.85 | | | $ | 10.47 | | | $ | 10.25 | |
| | | | | | | | | | | | | | | | | | | | |
Income from investment operations: | | | | | | | | | | | | | | | | | | | | |
Net investment income | | | 0.30 | | | | 0.30 | | | | 0.32 | | | | 0.35 | | | | 0.38 | |
Net gains/(losses) on securities, both realized and unrealized | | | (0.29 | ) | | | 0.03 | | | | (0.28 | ) | | | 0.38 | | | | 0.22 | |
| | | | | | | | | | | | | | | | | | | | |
Total from investment operations | | | 0.01 | | | | 0.33 | | | | 0.04 | | | | 0.73 | | | | 0.60 | |
Less distributions: | | | | | | | | | | | | | | | | | | | | |
Distributions from net investment income | | | (0.30 | ) | | | (0.30 | ) | | | (0.32 | ) | | | (0.35 | ) | | | (0.38 | ) |
| | | | | | | | | | | | | | | | | | | | |
Net asset value, end of year | | $ | 10.31 | | | $ | 10.60 | | | $ | 10.57 | | | $ | 10.85 | | | $ | 10.47 | |
| | | | | | | | | | | | | | | | | | | | |
Total return | | | 0.06 | % | | | 3.14 | % | | | 0.33 | % | | | 7.10 | % | | | 5.99 | % |
Net assets, end of year (in thousands) | | $ | 13,187 | | | $ | 16,829 | | | $ | 15,695 | | | $ | 13,871 | | | $ | 9,260 | |
Ratio of net expenses to average net assets (a) | | | 0.74 | % | | | 0.56 | % | | | 0.51 | % | | | 0.50 | % | | | 0.48 | % |
Ratio of net investment income to average net assets | | | 2.83 | % | | | 2.81 | % | | | 2.94 | % | | | 3.28 | % | | | 3.69 | % |
Portfolio turnover | | | 19.07 | % | | | 5.93 | % | | | 8.37 | % | | | 19.12 | % | | | 13.65 | % |
| (a) | Percentages are after expenses waived by Adviser and custodian and interest expense reductions. |
Expenses waived by Adviser and custodian and interest expense reductions were:
.05% and.03% for 2006; .21% and .03% for 2005; .25% and .05% for 2004; .26% and .04% for 2003; and .31%,.07% for 2002, respectively.
The accompanying notes are an integral part of the financial statements.
26
DUPREE MUTUAL FUNDS - TENNESEE TAX-FREE INCOME SERIES
SCHEDULE OF PORTFOLIO INVESTMENTS
Tennesee Municipal Bonds - 100%
June 30, 2006
| | | | | | | | | | | | | |
Bond Description | | Coupon | | | Maturity Date | | Rating# | | Par Value | | Market Value |
INSURED MUNICIPAL REVENUE BONDS | | | | | | | | | | | | | |
52.01% of Net Assets | | | | | | | | | | | | | |
Blount County TN Public Building Authority General Obligation | | 5.250 | % | | 06/01/2019 | | Aaa | | $ | 1,050,000 | | $ | 1,116,308 |
Clarksville TN Water Sewer & Gas Revenue | | 5.650 | | | 02/01/2017 | | Aaa/AAA@ | | | 200,000 | | | 206,348 |
Columbia TN Broadband Network Revenue & Tax | | 5.000 | | | 03/01/2025 | | Aaa | | | 1,000,000 | | | 1,034,050 |
Columbia TN Refunded - Sewer System | | 5.000 | | | 12/01/2024 | | Aaa | | | 1,235,000 | | | 1,276,187 |
Franklin County TN Health & Educational Facilities Board | | 5.000 | | | 09/01/2025 | | AAA* | | | 1,000,000 | | | 1,031,850 |
Franklin TN Industrial Development Board Landings Apartment | | 5.550 | | | 10/01/2008 | | Aaa/AAA* | | | 50,000 | | | 51,212 |
Franklin TN Industrial Development Board Landings Apartment | | 5.900 | | | 10/01/2016 | | Aaa/AAA*/AAA@ | | | 800,000 | | | 818,304 |
Giles County TN | | 4.500 | | | 02/01/2018 | | Aaa/AAA@ | | | 1,000,000 | | | 1,006,330 |
Greene County TN General Obligation - Series B | | 5.000 | | | 06/01/2024 | | Aaa/AAA@ | | | 505,000 | | | 521,736 |
Harpeth Valley Utilities TN Davidson and Williamson Counties | | 5.000 | | | 09/01/2029 | | Aaa/AAA@ | | | 1,410,000 | | | 1,442,176 |
Hawkins County TN Refunding General Obligation | | 4.750 | | | 05/01/2017 | | Aaa/AAA*/AAA@ | | | 200,000 | | | 204,176 |
Jackson TN Hospital Revenue | | 5.000 | | | 04/01/2028 | | Aaa/AAA*/AAA@ | | | 1,550,000 | | | 1,566,430 |
Jackson TN Hospital Revenue Refunding & Improvement | | 5.625 | | | 04/01/2015 | | Aaa/AAA* | | | 310,000 | | | 313,410 |
Johnson City TN Health & Educational Facilities | | 6.500 | | | 07/01/2014 | | Aaa/AAA*/AAA@ | | | 1,000,000 | | | 1,141,820 |
Kingsport TN Water & Sewer System | | 4.350 | | | 06/01/2017 | | Aaa/AAA@ | | | 710,000 | | | 712,258 |
Kingsport TN Industrial Development Board Multifamily | | 5.400 | | | 04/20/2021 | | AAA* | | | 475,000 | | | 500,465 |
Knox County TN Health Educational & Housing Facilities - Baptist | | 5.500 | | | 04/15/2017 | | Baa3/AAA* | | | 1,315,000 | | | 1,357,396 |
Knox County TN Health Educational & Housing Facilities - Ft Sanders | | 6.250 | | | 01/01/2013 | | Aaa/AAA*/AAA@ | | | 10,000 | | | 11,156 |
Knox County TN Health Educational & Housing Facilities - Covenant Health | | 5.000 | | | 01/01/2022 | | Aaa/AAA*/AAA@ | | | 1,000,000 | | | 1,025,080 |
Knox County TN Utility District Water & Sewer | | 5.625 | | | 12/01/2019 | | Aaa/AAA*/AAA@ | | | 220,000 | | | 227,729 |
Knoxville TN Gas Revenue - Series K | | 4.750 | | | 03/01/2020 | | Aaa/AAA*/AAA@ | | | 1,500,000 | | | 1,516,980 |
Knoxville TN Gas Revenue Refunded System - Series K | | 4.750 | | | 03/01/2022 | | Aaa/AAA*/AAA@ | | | 1,550,000 | | | 1,565,237 |
Knoxville TN Wastewater System Revenue - Series A | | 4.750 | | | 04/01/2021 | | Aaa/AAA*/AAA@ | | | 1,150,000 | | | 1,162,604 |
Marion County TN Schools | | 5.000 | | | 06/01/2025 | | Aaa | | | 1,050,000 | | | 1,084,797 |
Metro Government Nashville & Davidson County TN General Obligation | | 5.000 | | | 01/01/2023 | | Aaa/AAA*/AAA@ | | | 1,000,000 | | | 1,037,140 |
Metro Government Nashville & Davidson County TN General Obligation | | 5.000 | | | 01/01/2024 | | Aaa/AAA*/AAA@ | | | 1,000,000 | | | 1,030,720 |
Metropolitan Nashville & Davidson County TN Water & Sewer | | 5.000 | | | 01/01/2017 | | Aaa/AAA*/AAA@ | | | 1,000,000 | | | 1,026,370 |
Metro Government Nashville & Davidson County TN Water & Sewer | | 4.750 | | | 01/01/2022 | | Aaa/AAA*/AAA@ | | | 1,000,000 | | | 1,010,280 |
Metro Government Nashville & Davidson County TN Sports Authority | | 5.000 | | | 07/01/2021 | | Aaa/AAA*/AAA@ | | | 1,000,000 | | | 1,034,650 |
Montgomery County TN | | 4.750 | | | 05/01/2016 | | Aaa/AAA@ | | | 1,850,000 | | | 1,923,630 |
Montgomery County TN | | 4.750 | | | 05/01/2020 | | Aaa/AAA@ | | | 1,000,000 | | | 1,022,680 |
Oak Ridge TN Industrial Development Board Refunding Revenue | | 5.250 | | | 08/20/2018 | | Aaa | | | 265,000 | | | 270,963 |
Overton County TN Refunding - Schools | | 5.000 | | | 04/01/2018 | | Aaa | | | 1,000,000 | | | 1,050,330 |
Robertson County TN | | 4.500 | | | 06/01/2015 | | Aaa/AAA@ | | | 300,000 | | | 304,989 |
Robertson County TN General Obligation | | 5.000 | | | 04/01/2018 | | Aaa/AAA@ | | | 760,000 | | | 795,021 |
Rutherford County TN Construction Utility District Waterworks | | 5.000 | | | 02/01/2031 | | Aaa/AAA@ | | | 1,435,000 | | | 1,467,847 |
Shelby County TN Health Educational & Housing Methodist | | 5.300 | | | 08/01/2015 | | Aaa/AAA*/AAA@ | | | 550,000 | | | 567,743 |
Shelby County TN Health Educational & Housing Methodist | | 5.375 | | | 04/01/2013 | | Aaa/AAA*/AAA@ | | | 690,000 | | | 713,722 |
Shelby County TN Health Educational & Housing Methodist | | 5.000 | | | 04/01/2018 | | Aaa/AAA*/AAA@ | | | 500,000 | | | 511,135 |
Smith County TN General Obligation | | 5.000 | | | 04/01/2021 | | Aaa/AAA@ | | | 720,000 | | | 754,754 |
Sullivan County TN Health Educational & Housing Facilities | | 5.000 | | | 09/01/2016 | | AA*/AA@ | | | 1,000,000 | | | 1,026,590 |
Sullivan County TN Health Educational & Housing Wellmont | | 5.000 | | | 09/01/2017 | | AA*/AA@ | | | 2,500,000 | | | 2,552,675 |
Sullivan County TN Health Educational & Housing Facilities | | 4.500 | | | 09/01/2019 | | AA*/AA@ | | | 1,000,000 | | | 973,760 |
TN Housing Development Agency Homeownership Program Series | | 5.150 | | | 07/01/2022 | | Aaa/AAA*/AAA@ | | | 750,000 | | | 767,235 |
TN State School Board Authority Refunding Higher Education | | 5.000 | | | 05/01/2024 | | Aaa/AAA*/AAA@ | | | 1,395,000 | | | 1,446,336 |
TN State School Board Authority Refunding Higher Education | | 5.000 | | | 05/01/2025 | | Aaa/AAA*/AAA@ | | | 1,440,000 | | | 1,487,678 |
Washington County TN General Obligation School and Public | | 5.000 | | | 04/01/2016 | | Aaa/AAA@ | | | 1,120,000 | | | 1,181,835 |
Wilson County TN Referendum | | 5.000 | | | 04/01/2018 | | Aaa/AAA@ | | | 1,000,000 | | | 1,051,960 |
| | | | | | | | | | | | | |
| | | | | | | | | | | | | 45,904,082 |
GENERAL OBLIGATION BONDS | | | | | | | | | | | | | |
17.86% of Net Assets | | | | | | | | | | | | | |
Franklin TN School District Limited Tax Refunding | | 4.625 | | | 06/01/2018 | | Aa2 | | | 1,000,000 | | | 1,023,610 |
Franklin TN Water & Sewer Revenue & Tax | | 5.000 | | | 04/01/2024 | | Aaa | | | 750,000 | | | 794,513 |
Johnson City TN General Obligation | | 5.500 | | | 05/01/2020 | | Aaa/AAA* | | | 300,000 | | | 303,942 |
Knoxville TN General Obligation - Series A | | 5.000 | | | 05/01/2020 | | Aa2/AA*/AA+@ | | | 1,430,000 | | | 1,521,177 |
Memphis TN Referendum - General Improvement | | 5.000 | | | 11/01/2015 | | Aa2/AA*/AA-@ | | | 1,250,000 | | | 1,316,625 |
Memphis TN General Improvement | | 5.000 | | | 11/01/2021 | | Aa2/AA*/AA-@ | | | 1,500,000 | | | 1,551,105 |
Memphis TN General Improvement | | 5.000 | | | 05/01/2020 | | Aa2/AA*/AA-@ | | | 2,000,000 | | | 2,067,840 |
Metropolitan Government Nashville & Davidson County TN - Series B | | 5.000 | | | 08/01/2024 | | Aa2/AA*/AA+@ | | | 1,500,000 | | | 1,555,275 |
Shelby County TN - Series A | | 4.600 | | | 11/01/2022 | | Aa2/AA+*/AA@ | | | 500,000 | | | 504,345 |
The accompanying notes are an integral part of the financial statements.
27
DUPREE MUTUAL FUNDS - TENNESEE TAX-FREE INCOME SERIES
SCHEDULE OF PORTFOLIO INVESTMENTS
Tennesee Municipal Bonds — 100%
June 30, 2006
| | | | | | | | | | | | | |
Bond Description | | Coupon | | | Maturity Date | | Rating# | | Par Value | | Market Value |
Williamson County TN Refunding General Obligation | | 5.000 | % | | 03/01/2020 | | Aa1 | | $ | 645,000 | | $ | 684,087 |
Williamson County TN Series A General Obligation | | 4.750 | | | 04/01/2021 | | Aa1 | | | 750,000 | | | 771,758 |
Williamson County TN Series B General Obligation | | 5.000 | | | 05/01/2023 | | Aa1 | | | 1,400,000 | | | 1,452,556 |
Williamson County TN General Obligation | | 5.000 | | | 05/01/2022 | | Aa1 | | | 1,400,000 | | | 1,457,736 |
Wilson County TN General Obligation Refunding | | 5.100 | | | 05/01/2016 | | Aaa/AAA@ | | | 745,000 | | | 762,373 |
| | | | | | | | | | | | | |
| | | | | | | | | | | | | 15,766,942 |
HOSPITAL AND HEALTHCARE REVENUE BONDS | | | | | | | | | | | | | |
12.19% of Net Assets | | | | | | | | | | | | | |
Chattanooga TN Health Educational & Housing Revenue | | 5.000 | | | 12/01/2018 | | Aa2/AA*/AA@ | | | 1,000,000 | | | 1,019,910 |
Knox County TN Health - Fort Sanders Alliance | | 5.250 | | | 01/01/2015 | | Aaa/AAA*/AAA@ | | | 2,175,000 | | | 2,308,132 |
Knox County TN Health Educational & Housing Facilities University | | 5.750 | | | 04/01/2019 | | Baa1/A-@ | | | 1,000,000 | | | 1,040,790 |
Metropolitan Nashville & Davidson County TN Modal | | 5.500 | | | 05/01/2023 | | Aa2/AA* | | | 2,110,000 | | | 2,178,343 |
Metropolitan Nashville & Davidson County TN - Open Arms | | 5.100 | | | 08/01/2016 | | AA* | | | 2,500,000 | | | 2,533,925 |
Metropolitan Nashville & Davidson County TN - Open Arms | | 5.100 | | | 08/01/2019 | | AA* | | | 1,660,000 | | | 1,678,227 |
| | | | | | | | | | | | | |
| | | | | | | | | | | | | 10,759,327 |
MUNICIPAL UTILITY REVENUE BONDS | | | | | | | | | | | | | |
5.26% of Net Assets | | | | | | | | | | | | | |
Chattanooga TN Electric System Revenue | | 5.250 | | | 09/01/2021 | | AA*/AA@ | | | 1,500,000 | | | 1,568,910 |
Clarksville TN Water Sewer & Gas Revenue | | 5.250 | | | 02/01/2018 | | Aaa/AAA@ | | | 1,000,000 | | | 1,029,380 |
Metropoliton Nashville & Davidson County TN Electric System | | 5.125 | | | 05/15/2016 | | Aa3/AA*/AA@ | | | 700,000 | | | 731,472 |
Metropolitan Nashville & Davidson County TN Electric System | | 5.125 | | | 05/15/2021 | | Aa3/AA*/AA@ | | | 1,085,000 | | | 1,125,872 |
Metropolitan Nashville & Davidson County TN Water & Sewer | | 5.500 | | | 01/01/2016 | | Aa3/A+* | | | 185,000 | | | 185,463 |
| | | | | | | | | | | | | |
| | | | | | | | | | | | | 4,641,097 |
STATE AND LOCAL MORTGAGE REVENUE | | | | | | | | | | | | | |
4.73% of Net Assets | | | | | | | | | | | | | |
TN Housing Development Agency Homeownership Program | | 5.850 | | | 01/01/2011 | | Aa2/AA* | | | 200,000 | | | 203,200 |
TN Housing Development Agency Homeownership Program | | 5.500 | | | 07/01/2020 | | Aa2/AA* | | | 535,000 | | | 542,463 |
TN Housing Development Agency Series 2001 - 3B | | 5.250 | | | 01/01/2020 | | Aa2/AA* | | | 345,000 | | | 352,907 |
TN Housing Development Agency Mortgage Financing - Series A | | 5.200 | | | 07/01/2023 | | Aa2/AA* | | | 3,000,000 | | | 3,072,450 |
| | | | | | | | | | | | | |
| | | | | | | | | | | | | 4,171,020 |
PREREFUNDED BONDS | | | | | | | | | | | | | |
3.24% of Net Assets | | | | | | | | | | | | | |
Johnson City TN Health & Educational Facilities | | 5.125 | | | 07/01/2025 | | AAA*/AAA@ | | | 2,000,000 | | | 2,060,080 |
Knoxville TN Gas System Revenue Bond - Series J | | 5.000 | | | 03/01/2017 | | Aa3/AA* | | | 700,000 | | | 728,238 |
Metropolitan Nashville & Davidson County TN Water & Sewer | | 6.500 | | | 12/01/2014 | | Aaa/AAA* | | | 60,000 | | | 69,792 |
| | | | | | | | | | | | | |
| | | | | | | | | | | | | 2,858,110 |
UNIVERSITY CONSOLIDATED EDUCATION AND BUILDING REVENUE BONDS | | | | | | | | | | | | | |
1.96% of Net Assets | | | | | | | | | | | | | |
Metropolitan Nashville & Davidson County TN - McKendree | | 5.125 | | | 01/01/2020 | | AA* | | | 1,700,000 | | | 1,731,348 |
| | | | | | | | | | | | | |
| | | | | | | | | | | | | 1,731,348 |
ESCROWED TO MATURITY BONDS | | | | | | | | | | | | | |
1.41% of Net Assets | | | | | | | | | | | | | |
Jackson TN Water & Sewer Revenue | | 7.200 | | | 07/01/2012 | | Aaa/AAA* | | | 5,000 | | | 5,416 |
Johnson City TN Health & Educational Revenue | | 5.000 | | | 07/01/2018 | | Aaa/AAA*/AAA@ | | | 1,000,000 | | | 1,033,360 |
Metropolitan Nashville & Davidson County TN - Dandridge Tower | | 6.375 | | | 01/01/2011 | | A2 | | | 200,000 | | | 204,218 |
| | | | | | | | | | | | | |
| | | | | | | | | | | | | 1,242,994 |
LEASE REVENUE BONDS | | | | | | | | | | | | | |
0.29% of Net Assets | | | | | | | | | | | | | |
Memphis/Shelby County TN Special Facilities Revenue - FedEx | | 5.050 | | | 09/01/2012 | | Baa2/BBB* | | | 250,000 | | | 259,225 |
| | | | | | | | | | | | | |
| | | | | | | | | | | | | 259,225 |
The accompanying notes are an integral part of the financial statements.
28
DUPREE MUTUAL FUNDS - TENNESEE TAX-FREE INCOME SERIES
SCHEDULE OF PORTFOLIO INVESTMENTS
Tennesee Municipal Bonds — 100%
June 30, 2006
| | | | | | | | | | | | | |
Bond Description | | Coupon | | | Maturity Date | | Rating# | | Par Value | | Market Value |
INDUSTRIAL REVENUE AND POLLUTION CONTROL REVENUE BONDS | | | | | | | | | | | | | |
0.21% of Net Assets | | | | | | | | | | | | | |
Chattanooga TN Industrial Development Board F L Haney Co | | 7.200 | % | | 08/15/2010 | | AAA* | | $ | 20,000 | | $ | 22,621 |
Chattanooga TN Industrial Development Board F L Haney Co | | 7.200 | | | 02/15/2009 | | AAA* | | | 25,000 | | | 27,155 |
Chattanooga TN Industrial Development Board F L Haney Co | | 7.200 | | | 08/15/2009 | | AAA* | | | 25,000 | | | 27,566 |
Chattanooga TN Industrial Development Board F L Haney Co | | 7.200 | | | 02/15/2010 | | AAA* | | | 100,000 | | | 111,619 |
| | | | | | | | | | | | | |
| | | | | | | | | | | | | 188,961 |
| | | | | | | | | | | | | |
Total Investments (cost $87,450,694) (See (a) below for further explanation) - 99.16% of Net Assets | | | | | | | | | | | | $ | 87,523,106 |
| | | | | | | | | | | | | |
| * | Standard and Poor’s Corporation |
| @ | Fitch’s Investors Service |
| | All other ratings by Moody’s Investors Service, Inc. |
| # | Bond ratings are unaudited. |
| (a) | Represents cost for financial reporting and federal income tax purposes and differs from market value by net unrealized appreciation of securities as follows: |
| | | | |
Unrealized appreciation | | $ | 1,066,141 | |
Unrealized depreciation | | | (993,729 | ) |
| | | | |
Net unrealized appreciation | | $ | 72,412 | |
| | | | |
The accompanying notes are an integral part of the financial statements.
29
DUPREE MUTUAL FUNDS - TENNESSEE TAX-FREE INCOME SERIES
STATEMENT OF ASSETS AND LIABILITIES
JUNE 30, 2006
| | | | | | | |
ASSETS: | | | | | | | |
Investments in securities, at value (Cost: $87,450,694) | | | | | $ | 87,523,106 | |
Cash | | | | | | 1,328,612 | |
Receivable from investments sold | | | | | | 226,000 | |
Interest receivable | | | | | | 1,274,539 | |
Prepaid expenses | | | | | | 30,509 | |
| | | | | | | |
Total assets | | | | | | 90,382,766 | |
LIABILITIES: | | | | | | | |
Payable for: | | | | | | | |
Investments purchased | | $ | 1,495,524 | | | | |
Distributions to shareholders | | | 448,471 | | | | |
Fund shares redeemed | | | 99,322 | | | | |
Investment advisory fee | | | 36,118 | | | | |
Transfer agent fee | | | 9,161 | | | | |
Trustee fee | | | 3,974 | | | | |
Accrued expenses | | | 22,570 | | | | |
| | | | | | | |
Total liabilities | | | | | | 2,115,140 | |
| | | | | | | |
NET ASSETS: | | | | | | | |
Capital | | | | | | 89,116,917 | |
Net accumulated realized loss on investment transactions | | | | | | (921,703 | ) |
Net unrealized appreciation in value of investments | | | | | | 72,412 | |
| | | | | | | |
Net assets at value | | | | | $ | 88,267,626 | |
| | | | | | | |
NET ASSET VALUE, offering price and redemption price per share ($88,267,626 -:- 8,141,943 shares outstanding; unlimited number of shares authorized; no par value) | | | | | $ | 10.84 | |
| | | | | | | |
STATEMENT OF OPERATIONS
For the year ended June 30, 2006
| | | | |
Net investment income: | | | | |
Interest income | | $ | 3,849,616 | |
| | | | |
Expenses: | | | | |
Investment advisory fee | | | 426,557 | |
Transfer agent fee | | | 108,374 | |
Professional fees | | | 27,109 | |
Custodian expense | | | 10,500 | |
Trustee fees | | | 8,169 | |
Other expenses | | | 32,412 | |
| | | | |
Total expenses | | | 613,121 | |
Custodian expense reduction | | | (10,500 | ) |
| | | | |
Net expenses | | | 602,621 | |
| | | | |
Net investment income | | | 3,246,995 | |
| | | | |
Realized and unrealized gain/(loss) on investments: | | | | |
Net realized gain | | | 170,910 | |
Net decrease in unrealized appreciation | | | (3,026,240 | ) |
| | | | |
Net realized and unrealized loss on investments | | | (2,855,330 | ) |
| | | | |
Net increase in net assets resulting from operations | | $ | 391,665 | |
| | | | |
The accompanying notes are an integral part of the financial statements.
30
DUPREE MUTUAL FUNDS - TENNESSEE TAX-FREE INCOME SERIES
STATEMENTS OF CHANGES IN NET ASSETS
For the years ended June 30, 2006 and 2005
| | | | | | | | |
| | | 2006 | | | 2005 | |
Increase in net assets: | | | | | | | | |
Operations: | | | | | | | | |
Net investment income | | $ | 3,246,995 | | | $ | 3,042,731 | |
Net realized gain on investments | | | 170,910 | | | | 72,840 | |
Net (decrease)/increase in unrealized appreciation | | | (3,026,240 | ) | | | 2,170,144 | |
| | | | | | | | |
Net increase in net assets resulting from operations | | | 391,665 | | | | 5,285,715 | |
Distributions to shareholders from net investment income | | | (3,246,995 | ) | | | (3,042,731 | ) |
Net fund share transactions (Note 4) | | | 8,483,109 | | | | 9,897,473 | |
| | | | | | | | |
Total increase | | | 5,627,779 | | | | 12,140,457 | |
Net assets: | | | | | | | | |
Beginning of year | | | 82,639,847 | | | | 70,499,390 | |
| | | | | | | | |
End of year | | $ | 88,267,626 | | | $ | 82,639,847 | |
| | | | | | | | |
FINANCIAL HIGHLIGHTS
Selected data for a share outstanding:
| | | | | | | | | | | | | | | | | | | | |
| | | For the years ended June 30, | |
| | | 2006 | | | 2005 | | | 2004 | | | 2003 | | | 2002 | |
Net asset value, beginning of year | | $ | 11.21 | | | $ | 10.87 | | | $ | 11.26 | | | $ | 10.82 | | | $ | 10.72 | |
| | | | | | | | | | | | | | | | | | | | |
Income from investment operations: | | | | | | | | | | | | | | | | | | | | |
Net investment income | | | 0.42 | | | | 0.43 | | | | 0.45 | | | | 0.48 | | | | 0.52 | |
Net gains/(losses) on securities, both realized and unrealized | | | (0.37 | ) | | | 0.34 | | | | (0.39 | ) | | | 0.44 | | | | 0.10 | |
| | | | | | | | | | | | | | | | | | | | |
Total from investment operations | | | 0.05 | | | | 0.77 | | | | 0.06 | | | | 0.92 | | | | 0.62 | |
Less distributions: | | | | | | | | | | | | | | | | | | | | |
Distributions from net investment income | | | (0.42 | ) | | | (0.43 | ) | | | (0.45 | ) | | | (0.48 | ) | | | (0.52 | ) |
| | | | | | | | | | | | | | | | | | | | |
Net asset value, end of year | | $ | 10.84 | | | $ | 11.21 | | | $ | 10.87 | | | $ | 11.26 | | | $ | 10.82 | |
| | | | | | | | | | | | | | | | | | | | |
Total return | | | 0.45 | % | | | 7.21 | % | | | 0.55 | % | | | 8.65 | % | | | 5.85 | % |
Net assets, end of year (in thousands) | | $ | 88,268 | | | $ | 82,640 | | | $ | 70,499 | | | $ | 58,816 | | | $ | 48,527 | |
Ratio of net expenses to average net assets (a) | | | 0.71 | % | | | 0.67 | % | | | 0.67 | % | | | 0.65 | % | | | 0.54 | % |
Ratio of net investment income to average net assets | | | 3.82 | % | | | 3.89 | % | | | 4.05 | % | | | 4.32 | % | | | 4.77 | % |
Portfolio turnover | | | 6.14 | % | | | 9.49 | % | | | 16.11 | % | | | 8.36 | % | | | 11.85 | % |
| (a) | Percentages are after expenses waived by Adviser and custodian and interest expense reductions. |
Expenses waived by Adviser and custodian and interest expense reductions were:
0% and .01% for 2006; 0% and .02% for 2005; 0% and .03% for 2004; .01% and .02% for 2003; and .16% and .02% for 2002, respectively.
The accompanying notes are an integral part of the financial statements.
31
DUPREE MUTUAL FUNDS - TENNESEE TAX-FREE SHORT-TO-MEDIUM SERIES
SCHEDULE OF PORTFOLIO INVESTMENTS
Tennesee Municipal Bonds — 100%
June 30, 2006
| | | | | | | | | | | | | |
Bond Description | | Coupon | | | Maturity Date | | Rating# | | Par Value | | Market Value |
INSURED MUNICIPAL REVENUE BONDS | | | | | | | | | | | | | |
68.30% of Net Assets | | | | | | | | | | | | | |
Chattanooga-Hamilton County TN Hospital Authority Erlanger | | 5.625 | % | | 10/01/2009 | | Aaa/AAA*/AAA@ | | $ | 715,000 | | $ | 753,403 |
Dickson County TN Refunding | | 5.000 | | | 06/01/2015 | | Aaa/AAA@ | | | 140,000 | | | 147,003 |
Hawkins County TN General Obligation | | 4.500 | | | 05/01/2008 | | Aaa/AAA*/AAA@ | | | 315,000 | | | 319,753 |
Johnson City TN General Obligation | | 5.250 | | | 06/01/2008 | | Aaa/AAA*/AAA@ | | | 125,000 | | | 128,134 |
Johnson City TN Refunding | | 4.000 | | | 06/01/2015 | | Aaa | | | 400,000 | | | 392,048 |
Knox County TN Health Education & Housing Facilities Board | | 5.500 | | | 04/15/2011 | | Baa/AAA* | | | 300,000 | | | 309,810 |
Marshall County TN General Obligation | | 4.450 | | | 12/01/2010 | | Aaa/AAA@ | | | 270,000 | | | 276,739 |
Maury County TN School & Public Improvement | | 5.000 | | | 04/01/2016 | | Aaa/AAA@ | | | 1,000,000 | | | 1,054,440 |
Memphis-Shelby Tn Sports Authority Memphis Arena Project | | 5.500 | | | 11/01/2012 | | Aaa/AAA*/AAA@ | | | 500,000 | | | 541,000 |
Memphis-Shelby County TN Sports Authority Memphis Arena | | 5.000 | | | 11/01/2008 | | Aaa/AAA*/AAA@ | | | 150,000 | | | 154,352 |
Memphis TN General Obligation General Improvement | | 5.000 | | | 10/01/2016 | | Aaa/AAA*/AAA@ | | | 450,000 | | | 473,256 |
Memphis TN Electric System Revenue - Series A | | 5.000 | | | 12/01/2015 | | Aaa/AAA*/AAA@ | | | 1,200,000 | | | 1,255,164 |
Memphis TN Sanitation Sewer Revenue | | 5.000 | | | 10/01/2008 | | Aaa/AAA*/AAA@ | | | 350,000 | | | 359,118 |
Metropolitan Government of Nashville & Davidson County Housing | | 5.500 | | | 01/01/2007 | | Aaa* | | | 400,000 | | | 402,104 |
Municipal Energy Acquisition Corporation TN Gas Revenue | | 4.125 | | | 03/01/2008 | | Aaa/AAA*/AAA@ | | | 250,000 | | | 252,095 |
Municipal Energy Acquisition Gas Corporation Revenue | | 4.125 | | | 03/01/2009 | | Aaa/AAA*/AAA@ | | | 200,000 | | | 201,676 |
Shelby County TN Methodist Hospital Healthcare Revenue | | 5.500 | | | 04/01/2008 | | Aaa/AAA*/AAA@ | | | 250,000 | | | 256,868 |
Shelby County TN Health Education & Housing Facility Rhodes | | 4.500 | | | 08/01/2008 | | Aaa/AAA*/AAA@ | | | 100,000 | | | 101,368 |
Shelby County TN Health Education & Housing Facility Rhodes | | 4.500 | | | 08/01/2009 | | Aaa/AAA*/AAA@ | | | 100,000 | | | 102,046 |
Sullivan County TN Health Educational & Housing Facility Board | | 5.000 | | | 09/01/2011 | | AA*/AA@ | | | 335,000 | | | 347,318 |
Tennergy Corporation TN Gas Revenue | | 5.000 | | | 06/01/2008 | | Aaa/AAA*/AAA@ | | | 500,000 | | | 512,575 |
Tennergy Corporation TN Gas Revenue | | 5.000 | | | 06/01/2009 | | Aaa/AAA*/AAA@ | | | 650,000 | | | 670,794 |
TN Energy Acquisition Corporation Gas Revenue - Series A | | 5.000 | | | 09/01/2007 | | Aaa/AAA*/AAA@ | | | 210,000 | | | 213,037 |
TN Energy Acquisition Corporation Gas Revenue - Series B | | 4.500 | | | 09/01/2008 | | Aaa/AAA*/AAA@ | | | 295,000 | | | 298,879 |
Wilson County TN General Obligation | | 5.000 | | | 04/01/2013 | | Aaa/AAA@ | | | 720,000 | | | 760,010 |
| | | | | | | | | | | | | |
| | | | | | | | | | | | | 10,282,990 |
GENERAL OBLIGATION BONDS | | | | | | | | | | | | | |
16.56% of Net Assets | | | | | | | | | | | | | |
Chattanooga TN General Obligation Unlimited | | 5.500 | | | 09/01/2010 | | Aa2/AA*/AA@ | | | 500,000 | | | 531,270 |
Hamilton County TN General Obligation - Series A | | 4.550 | | | 08/01/2009 | | Aa1/AA+@ | | | 100,000 | | | 101,367 |
Knox County TN Public Improvement General Obligation | | 5.100 | | | 05/01/2008 | | Aa2/AA* | | | 90,000 | | | 92,035 |
Madison County TN General Obligation | | 4.000 | | | 04/01/2014 | | Aa3 | | | 700,000 | | | 692,146 |
Metro Government Nashville & Davidson County TN Improvement | | 5.000 | | | 10/15/2008 | | Aa2/AA*/AA+@ | | | 500,000 | | | 511,915 |
Rutherford County TN General Obligation | | 5.000 | | | 04/01/2009 | | Aa2/AA* | | | 250,000 | | | 257,755 |
Rutherford County TN Public Improvement General Obligation | | 4.250 | | | 04/01/2009 | | Aa2/AA* | | | 200,000 | | | 202,320 |
Shelby County TN Public Improvement General Obligation S:A | | 5.500 | | | 04/01/2009 | | Aa2/AA+*/AA@ | | | 100,000 | | | 104,343 |
| | | | | | | | | | | | | |
| | | | | | | | | | | | | 2,493,151 |
HOSPITAL AND HEALTHCARE REVENUE BONDS | | | | | | | | | | | | | |
5.36% of Net Assets | | | | | | | | | | | | | |
Chattanooga TN Catholic Health Initiatives - Series A | | 5.500 | | | 12/01/2006 | | Aa2/AA*/AA@ | | | 700,000 | | | 705,257 |
Knox County TN Hospital Facility Revenue - Catholic Healthcare | | 4.500 | | | 10/01/2011 | | A1/AA-*/AA-@ | | | 100,000 | | | 101,113 |
| | | | | | | | | | | | | |
| | | | | | | | | | | | | 806,370 |
UNIVERSITY CONSOLIDATED EDUCATION AND BUILDING REVENUE BONDS | | | | | | | | | | | | | |
2.38% of Net Assets | | | | | | | | | | | | | |
Metropolitan Government Of Nashville & Davidson County Vanderbilt | | 5.750 | | | 01/01/2008 | | Aa2/AA* | | | 250,000 | | | 256,650 |
Tennessee State School Board Authority Higher Education Facility | | 4.800 | | | 05/01/2014 | | Aa2/AA-* | | | 100,000 | | | 101,948 |
| | | | | | | | | | | | | |
| | | | | | | | | | | | | 358,598 |
PREREFUNDED BONDS | | | | | | | | | | | | | |
2.08% of Net Assets | | | | | | | | | | | | | |
Metropolitan Government Nashville & Davidson County | | 5.125 | | | 11/15/2013 | | Aa2/AA* | | | 300,000 | | | 313,827 |
| | | | | | | | | | | | | |
| | | | | | | | | | | | | 313,827 |
MUNICIPAL UTILITY REVENUE BONDS | | | | | | | | | | | | | |
1.83% of Net Assets | | | | | | | | | | | | | |
Knoxville TN Gas Revenue System - Series J | | 4.750 | | | 03/01/2010 | | Aa3/AA* | | | 170,000 | | | 174,593 |
Memphis TN Electric System Revenue Refunding Jr. Lien | | 4.000 | | | 12/01/2009 | | Aa3/AA*/AA@ | | | 100,000 | | | 100,569 |
| | | | | | | | | | | | | |
| | | | | | | | | | | | | 275,162 |
LEASE REVENUE BONDS | | | | | | | | | | | | | |
1.70% of Net Assets | | | | | | | | | | | | | |
Memphis-Shelby County Airport Special Facilities-Federal Ex | | 5.000 | | | 09/01/2009 | | Baa2/BBB* | | | 250,000 | | | 256,083 |
| | | | | | | | | | | | | |
| | | | | | | | | | | | | 256,083 |
The accompanying notes are an integral part of the financial statements.
32
DUPREE MUTUAL FUNDS - TENNESEE TAX-FREE SHORT-TO-MEDIUM SERIES
SCHEDULE OF PORTFOLIO INVESTMENTS
Tennesee Municipal Bonds — 100%
June 30, 2006
| | | | | | | | | | | | | |
Bond Description | | Coupon | | | Maturity Date | | Rating# | | Par Value | | Market Value |
STATE AND LOCAL MORTGAGE REVENUE BONDS | | | | | | | | | | | | | |
.63% of Net Assets | | | | | | | | | | | | | |
^Shelby County TN Multi-Family Housing Memphis - Series A | | 5.000 | % | | 01/01/2009 | | NR | | $ | 240,000 | | $ | 95,232 |
| | | | | | | | | | | | | |
| | | | | | | | | | | | | 95,232 |
| | | | | | | | | | | | | |
Total Investments (cost $15,198,096) (See (a) below for further explanation) - 98.84% of Net Assets | | | | | | | | | | | | $ | 14,881,413 |
| | | | | | | | | | | | | |
| * | Standard and Poor’s Corporation |
| @ | Fitch’s Investors Service |
| | All other ratings by Moody’s Investors Service, Inc. |
| # | Bond ratings are unaudited. |
| ^ | Security in default and therefore non-income producing. The security is illiquid and is therefore valued at fair value (see note 1) |
At June 30, 2006, fair valued securities represent 0.63% of net assets.
| (a) | Represents cost for financial reporting and federal income tax purposes and differs from market value by net unrealized depreciation of securities as follows: |
| | | | |
Unrealized appreciation | | $ | 23,720 | |
Unrealized depreciation | | | (340,403 | ) |
| | | | |
Net unrealized depreciation | | $ | (316,683 | ) |
| | | | |
The accompanying notes are an integral part of the financial statements.
33
DUPREE MUTUAL FUNDS - TENNESSEE TAX-FREE SHORT-TO-MEDIUM SERIES
STATEMENT OF ASSETS AND LIABILITIES
JUNE 30, 2006
| | | | | | | |
ASSETS: | | | | | | | |
Investments in securities, at value (Cost: $15,198,096) | | | | | $ | 14,881,413 | |
Cash | | | | | | 39,957 | |
Interest receivable | | | | | | 155,785 | |
Total assets | | | | | | 15,077,155 | |
| | | | | | | |
LIABILITIES: | | | | | | | |
Payable for: | | | | | | | |
Distributions to shareholders | | $ | 8,640 | | | | |
Investment advisory fee | | | 6,152 | | | | |
Transfer agent fee | | | 1,854 | | | | |
Trustee fee | | | 1,559 | | | | |
Accrued expenses | | | 2,734 | | | | |
| | | | | | | |
Total liabilities | | | | | | 20,939 | |
| | | | | | | |
NET ASSETS: | | | | | | | |
Capital | | | | | | 15,550,509 | |
Net accumulated realized loss on investment transactions | | | | | | (177,610 | ) |
Net unrealized depreciation in value of investments | | | | | | (316,683 | ) |
| | | | | | | |
Net assets at value | | | | | $ | 15,056,216 | |
| | | | | | | |
NET ASSET VALUE, offering price and redemption price per share ($15,056,216 -:- 1,463,348 shares outstanding; unlimited number of shares authorized; no par value) | | | | | $ | 10.29 | |
| | | | | | | |
STATEMENT OF OPERATIONS
For the year ended June 30, 2006
| | | | |
Net investment income: | | | | |
Interest income | | $ | 615,123 | |
| | | | |
Expenses: | | | | |
Investment advisory fee | | | 86,059 | |
Transfer agent fee | | | 25,817 | |
Professional fees | | | 8,237 | |
Custodian expense | | | 5,319 | |
Trustee fees | | | 1,701 | |
Other expenses | | | 7,084 | |
| | | | |
Total expenses | | | 134,217 | |
Expenses waived by Adviser | | | (6,338 | ) |
Custodian expense reduction | | | (5,319 | ) |
| | | | |
Net expenses | | | 122,560 | |
| | | | |
Net investment income | | | 492,563 | |
| | | | |
Realized and unrealized loss on investments: | | | | |
Net realized loss | | | (73,714 | ) |
Net decrease in unrealized appreciation | | | (436,428 | ) |
| | | | |
Net realized and unrealized loss on investments | | | (510,142 | ) |
| | | | |
Net decrease in net assets resulting from operations | | $ | (17,579 | ) |
| | | | |
The accompanying notes are an integral part of the financial statements.
34
DUPREE MUTUAL FUNDS - TENNESSEE TAX-FREE SHORT-TO-MEDIUM SERIES
STATEMENTS OF CHANGES IN NET ASSETS
For the years ended June 30, 2006 and 2005
| | | | | | | | |
| | | 2006 | | | 2005 | |
Increase in net assets: | | | | | | | | |
Operations: | | | | | | | | |
Net investment income | | $ | 492,563 | | | $ | 566,331 | |
Net realized loss on investments | | | (73,714 | ) | | | (60,556 | ) |
Net (decrease)/increase in unrealized appreciation | | | (436,428 | ) | | | 97,362 | |
| | | | | | | | |
Net (decrease)/increase in net assets resulting from operations | | | (17,579 | ) | | | 603,137 | |
Distributions to shareholders from net investment income | | | (492,563 | ) | | | (566,331 | ) |
Net fund share transactions (Note 4) | | | (3,756,852 | ) | | | (1,024,338 | ) |
| | | | | | | | |
Total decrease | | | (4,266,994 | ) | | | (987,532 | ) |
Net assets: | | | | | | | | |
Beginning of year | | | 19,323,210 | | | | 20,310,742 | |
| | | | | | | | |
End of year | | $ | 15,056,216 | | | $ | 19,323,210 | |
| | | | | | | | |
FINANCIAL HIGHLIGHTS
Selected data for a share outstanding:
| | | | | | | | | | | | | | | | | | | | |
| | | For the years ended June 30, | |
| | | 2006 | | | 2005 | | | 2004 | | | 2003 | | | 2002 | |
Net asset value, beginning of year | | $ | 10.60 | | | $ | 10.58 | | | $ | 10.91 | | | $ | 10.50 | | | $ | 10.35 | |
| | | | | | | | | | | | | | | | | | | | |
Income from investment operations: | | | | | | | | | | | | | | | | | | | | |
Net investment income | | | 0.30 | | | | 0.30 | | | | 0.32 | | | | 0.35 | | | | 0.40 | |
Net gains/(losses) on securities, both realized and unrealized | | | (0.31 | ) | | | 0.02 | | | | (0.33 | ) | | | 0.41 | | | | 0.15 | |
| | | | | | | | | | | | | | | | | | | | |
Total from investment operations | | | (0.01 | ) | | | 0.32 | | | | (0.01 | ) | | | 0.76 | | | | 0.55 | |
Less distributions: | | | | | | | | | | | | | | | | | | | | |
Distributions from net investment income | | | (0.30 | ) | | | (0.30 | ) | | | (0.32 | ) | | | (0.35 | ) | | | (0.40 | ) |
| | | | | | | | | | | | | | | | | | | | |
Net asset value, end of year | | $ | 10.29 | | | $ | 10.60 | | | $ | 10.58 | | | $ | 10.91 | | | $ | 10.50 | |
| | | | | | | | | | | | | | | | | | | | |
Total return | | | (0.10 | )% | | | 3.05 | % | | | (0.07 | )% | | | 7.37 | % | | | 5.43 | % |
Net assets, end of year (in thousands) | | $ | 15,056 | | | $ | 19,323 | | | $ | 20,311 | | | $ | 16,000 | | | $ | 11,366 | |
Ratio of net expenses to average net assets (a) | | | 0.71 | % | | | 0.56 | % | | | 0.51 | % | | | 0.50 | % | | | 0.41 | % |
Ratio of net investment income to average net assets | | | 2.86 | % | | | 2.81 | % | | | 2.99 | % | | | 3.29 | % | | | 3.84 | % |
Portfolio turnover | | | 23.21 | % | | | 13.91 | % | | | 5.92 | % | | | 20.27 | % | | | 22.10 | % |
| (a) | Percentages are after expenses waived by Adviser and custodian and interest expense reductions. |
Expenses waived by Adviser and custodian and interest expense reductions were:
.04% and .03% for 2006; .19% and .04% for 2005; .22% and .04% for 2004; .23% and .04% for 2003; and .35% and .06% for 2002, respectively.
The accompanying notes are an integral part of the financial statements.
35
DUPREE MUTUAL FUNDS - INTERMEDIATE GOVERNMENT BOND SERIES
SCHEDULE OF PORTFOLIO INVESTMENTS
Government Securities and Agencies — 100%
June 30, 2006
| | | | | | | | | | | | | |
Bond Description | | Coupon | | | Maturity Date | | Rating# | | Par Value of Shares | | Market Value |
FEDERAL HOME LOAN BANK | | | | | | | | | | | | | |
47.38% of Net Assets | | | | | | | | | | | | | |
Medium Term Note | | 5.125 | % | | 06/08/2015 | | Aaa/AAA*/AAA@ | | $ | 1,500,000 | | $ | 1,431,154 |
Medium Term Note | | 7.000 | | | 08/15/2014 | | Aaa/AAA | | | 500,000 | | | 548,255 |
Medium Term Note | | 5.625 | | | 02/12/2018 | | Aaa/AAA | | | 1,500,000 | | | 1,439,060 |
Medium Term Note | | 5.620 | | | 08/06/2018 | | AAA/Aaa | | | 3,000,000 | | | 2,868,531 |
Medium Term Note | | 5.220 | | | 12/15/2014 | | Aaa/AAA | | | 1,000,000 | | | 959,710 |
Medium Term Note | | 5.375 | | | 04/22/2015 | | Aaa/AAA*/AAA@ | | | 3,025,000 | | | 2,933,073 |
| | | | | | | | | | | | | |
| | | | | | | | | | | | | 10,179,783 |
FEDERAL NATIONAL MORTGAGE ASSOCIATION | | | | | | | | | | | | | |
22.50% of Net Assets | | | | | | | | | | | | | |
Medium Term Note | | 5.300 | | | 08/15/2013 | | AAA/Aaa | | | 2,000,000 | | | 1,948,870 |
Medium Term Note | | 5.500 | | | 12/09/2014 | | Aaa/AAA | | | 1,000,000 | | | 971,740 |
Medium Term Note | | 5.250 | | | 12/30/2015 | | Aaa/AAA | | | 1,000,000 | | | 956,115 |
Medium Term Note | | 5.210 | | | 06/30/2015 | | Aaa/AAA*/AAA@ | | | 1,000,000 | | | 957,775 |
| | | | | | | | | | | | | |
| | | | | | | | | | | | | 4,834,500 |
FEDERAL FARM CREDIT | | | | | | | | | | | | | |
13.94% of Net Assets | | | | | | | | | | | | | |
Medium Term Note | | 5.300 | | | 06/24/2014 | | Aaa/AAA | | | 2,050,000 | | | 2,021,191 |
Medium Term Note | | 5.625 | | | 10/20/2015 | | Aaa/AAA*/AAA@ | | | 1,000,000 | | | 974,218 |
| | | | | | | | | | | | | |
| | | | | | | | | | | | | 2,995,409 |
FEDERAL HOME LOAN MORTGAGE | | | | | | | | | | | | | |
8.62% of Net Assets | | | | | | | | | | | | | |
Medium Term Note | | 5.000 | | | 03/27/2018 | | Aaa/AAA | | | 500,000 | | | 459,513 |
Medium Term Note | | 4.875 | | | 03/15/2007 | | Aaa/AAA | | | 1,400,000 | | | 1,392,878 |
| | | | | | | | | | | | | |
| | | | | | | | | | | | | 1,852,391 |
STUDENT LOAN MARKETING ASSOCIATION | | | | | | | | | | | | | |
5.09% of Net Assets | | | | | | | | | | | | | |
Medium Term Note | | 7.300 | | | 08/01/2012 | | Aaa/AAA | | | 1,000,000 | | | 1,094,040 |
| | | | | | | | | | | | | |
| | | | | | | | | | | | | 1,094,040 |
CASH EQUIVALENTS | | | | | | | | | | | | | |
1.34% of Net Assets | | | | | | | | | | | | | |
US Bank U.S. Treasury Money Market Fund | | | | | | | | | | 286,945 | | | 286,945 |
| | | | | | | | | | | | | |
| | | | | | | | | | | | | 286,945 |
| | | | | | | | | | | | | |
Total Investments (cost $21,731,406) (See (a) below for further explanation) - 98.87% of Net Assets | | | | | | | | | | | | $ | 21,243,068 |
| | | | | | | | | | | | | |
| * | Standard and Poor’s Corporation |
| @ | Fitch’s Investors Service |
| | All other ratings by Moody’s Investors Service, Inc. |
| # | Bond ratings are unaudited. |
| (a) | Represents cost for financial reporting and federal income tax purposes and differs from market value by net unrealized depreciation of securities as follows: |
| | | | |
Unrealized appreciation | | $ | 108,086 | |
Unrealized depreciation | | | (596,424 | ) |
| | | | |
Net unrealized depreciation | | $ | (488,338 | ) |
| | | | |
The accompanying notes are an integral part of the financial statements.
36
DUPREE MUTUAL FUNDS - INTERMEDIATE GOVERNMENT BOND SERIES
STATEMENT OF ASSETS AND LIABILITIES
JUNE 30, 2006
| | | | | | | |
ASSETS: | | | | | | | |
Investments in securities, at value (Cost: $21,731,406) | | | | | $ | 21,243,068 | |
Cash | | | | | | 3,239 | |
Interest receivable | | | | | | 267,492 | |
Prepaid expenses | | | | | | 13,003 | |
| | | | | | | |
Total assets | | | | | | 21,526,802 | |
LIABILITIES: | | | | | | | |
Payable for: | | | | | | | |
Distributions to shareholders | | $ | 21,341 | | | | |
Fund shares redeemed | | | 8,749 | | | | |
Investment advisory fee | | | 3,544 | | | | |
Transfer agent fee | | | 2,620 | | | | |
Trustee fee | | | 1,041 | | | | |
Accrued expenses | | | 2,064 | | | | |
| | | | | | | |
Total liabilities | | | | | | 39,359 | |
| | | | | | | |
NET ASSETS: | | | | | | | |
Capital | | | | | | 22,407,440 | |
Undistributed net investment income | | | | | | 23,384 | |
Net accumulated realized loss on investment transactions | | | | | | (455,043 | ) |
Net unrealized depreciation in value of investments | | | | | | (488,338 | ) |
| | | | | | | |
Net assets at value | | | | | $ | 21,487,443 | |
| | | | | | | |
NET ASSET VALUE, offering price and redemption price per share ($21,487,443 -:- 2,243,064 shares outstanding; unlimited number of shares authorized; no par value) | | | | | $ | 9.58 | |
| | | | | | | |
STATEMENT OF OPERATIONS
For the year ended June 30, 2006
| | | | |
Net investment income: | | | | |
Interest income | | $ | 1,209,234 | |
| | | | |
Expenses: | | | | |
Investment advisory fee | | | 44,792 | |
Transfer agent fee | | | 32,876 | |
Custodian expense | | | 5,915 | |
Professional fees | | | 4,547 | |
Trustee fees | | | 2,114 | |
Printing fees | | | 5,000 | |
Postage fees | | | 5,000 | |
Other expenses | | | 5,042 | |
| | | | |
Total expenses | | | 105,286 | |
| | | | |
Custodian expense reduction | | | (5,915 | ) |
| | | | |
Net expenses | | | 99,371 | |
| | | | |
Net investment income | | | 1,109,863 | |
| | | | |
Realized and unrealized loss on investments: | | | | |
Net realized loss | | | (53,327 | ) |
Net decrease in unrealized appreciation | | | (1,091,150 | ) |
| | | | |
Net realized and unrealized loss on investments | | | (1,144,477 | ) |
| | | | |
Net decrease in net assets resulting from operations | | $ | (34,614 | ) |
| | | | |
The accompanying notes are an integral part of the financial statements.
37
DUPREE MUTUAL FUNDS - INTERMEDIATE GOVERNMENT BOND SERIES
STATEMENTS OF CHANGES IN NET ASSETS
For the years ended June 30, 2006 and 2005
| | | | | | | | |
| | | 2006 | | | 2005 | |
Increase in net assets: | | | | | | | | |
Operations: | | | | | | | | |
Net investment income | | $ | 1,109,863 | | | $ | 988,425 | |
Net realized loss on investments | | | (53,327 | ) | | | (27,142 | ) |
Net (decrease)/increase in unrealized appreciation | | | (1,091,150 | ) | | | 267,746 | |
| | | | | | | | |
Net (decrease)/increase in net assets resulting from operations | | | (34,614 | ) | | | 1,229,029 | |
Distributions to shareholders from net investment income | | | (1,086,481 | ) | | | (988,425 | ) |
Net fund share transactions (Note 4) | | | 239,381 | | | | 4,053,285 | |
| | | | | | | | |
Total (decrease)/increase | | | (881,714 | ) | | | 4,293,889 | |
Net assets: | | | | | | | | |
Beginning of year | | | 22,369,157 | | | | 18,075,268 | |
| | | | | | | | |
End of year | | $ | 21,487,443 | | | $ | 22,369,157 | |
| | | | | | | | |
Undistributed Net Investment Income | | $ | 23,384 | | | $ | — | |
FINANCIAL HIGHLIGHTS
Selected data for a share outstanding:
| | | | | | | | | | | | | | | | | | | | |
| | | For the years ended June 30, | |
| | | 2006 | | | 2005 | | | 2004 | | | 2003 | | | 2002 | |
Net asset value, beginning of year | | $ | 10.07 | | | $ | 9.94 | | | $ | 10.35 | | | $ | 10.07 | | | $ | 9.83 | |
| | | | | | | | | | | | | | | | | | | | |
Income from investment operations: | | | | | | | | | | | | | | | | | | | | |
Net investment income | | | 0.48 | | | | 0.47 | | | | 0.52 | | | | 0.53 | | | | 0.58 | |
Net gains/(losses) on securities, both realized and unrealized | | | (0.49 | ) | | | 0.13 | | | | (0.41 | ) | | | 0.28 | | | | 0.24 | |
| | | | | | | | | | | | | | | | | | | | |
Total from investment operations | | | (0.01 | ) | | | 0.60 | | | | 0.11 | | | | 0.81 | | | | 0.82 | |
Less distributions: | | | | | | | | | | | | | | | | | | | | |
Distributions from net investment income | | | (0.48 | ) | | | (0.47 | ) | | | (0.52 | ) | | | (0.53 | ) | | | (0.58 | ) |
| | | | | | | | | | | | | | | | | | | | |
Net asset value, end of year | | $ | 9.58 | | | $ | 10.07 | | | $ | 9.94 | | | $ | 10.35 | | | $ | 10.07 | |
| | | | | | | | | | | | | | | | | | | | |
Total return | | | (0.14 | )% | | | 6.17 | % | | | 1.09 | % | | | 8.23 | % | | | 8.54 | % |
Net assets, end of year (in thousands) | | $ | 21,487 | | | $ | 22,369 | | | $ | 18,075 | | | $ | 18,758 | | | $ | 13,412 | |
Ratio of net expenses to average net assets (a) | | | 0.45 | % | | | 0.44 | % | | | 0.45 | % | | | 0.45 | % | | | 0.48 | % |
Ratio of net investment income to average net assets | | | 4.97 | % | | | 4.68 | % | | | 5.12 | % | | | 5.19 | % | | | 5.81 | % |
Portfolio turnover | | | 17.67 | % | | | 28.88 | % | | | 42.35 | % | | | 53.62 | % | | | 75.15 | % |
| (a) | Percentages are after expenses waived by Adviser and custodian and interest expense reductions. |
Expenses waived by Adviser and custodian and interest expense reductions were:
0% and .47% for 2006; 0% and .48% for 2005; 0% and .48% for 2004; 0% and .48% for 2003; and 0% and .52% for 2002, respectively.
The accompanying notes are an integral part of the financial statements.
38
DUPREE MUTUAL FUNDS
NOTES TO FINANCIAL STATEMENTS
June 30, 2006
| 1. | Organization and Significant Accounting Policies |
Dupree Mutual Funds is registered under the Investment Company Act of 1940, as amended, as a no-load, open-end investment company. The Declaration of Trust of Dupree Mutual Funds (the “Trust”) permits the Trustees to create an unlimited number of series of investment portfolios (each a “Fund” and collectively the “Funds”) and with respect to each series to issue an unlimited number of full or fractional shares of a single class. The Trust currently offers nine series:
Alabama Tax-Free Income Series
Kentucky Tax-Free Income Series
Kentucky Tax-Free Short-to-Medium Series
Mississippi Tax-Free Income Series
North Carolina Tax-Free Income Series
North Carolina Tax-Free Short-to-Medium Series
Tennessee Tax-Free Income Series
Tennessee Tax-Free Short-to-Medium Series, and
Intermediate Government Bond Series
The investment strategy of the eight state tax-free funds is to maintain 100% of their investments in Alabama, Kentucky, Mississippi, North Carolina or Tennessee municipal securities.
The Intermediate Government Bond Series’ investment strategy is to invest only in obligations of the U.S. Treasury and Agencies of the U.S. Government. The Intermediate Government Bond Series will buy bonds and notes that will maintain an average maturity of no more than ten years.
The following is a summary of significant accounting policies consistently followed by the Funds in the preparation of their financial statements. The policies are in conformity with accounting principles generally accepted in the United States.
Securities held by the Intermediate Government Bond Series are valued using market quotations as provided by an independent pricing service. Securities held by the eight state tax-free funds are valued as determined in good faith in accordance with consistently applied procedures established by and under the general supervision of the Board of Trustees. These procedures involve the use of a matrix pricing model which takes into consideration price quotations or appraisals for these securities, yield, stability, risk, quality, coupon rate, maturity, type of issue, trading characteristics, special circumstances of a security or trading market, and any other factors or market data considered relevant in determining the value. The procedures also include weekly verification of market quotations provided by two independent pricing services. Shares of open-end mutual funds in which the Funds invest are valued at their respective net asset values as reported by the underlying funds.
Security transactions are accounted for on a trade date basis. Gains and losses on securities sold are determined on an identified cost basis.
39
DUPREE MUTUAL FUNDS
NOTES TO FINANCIAL STATEMENTS
June 30, 2006
| 1. | Significant Accounting Policies, continued: |
Interest income, which includes the amortization of premiums and the accretion of discounts, is recorded on an accrual basis.
| | D. | When-Issued and Delayed Settlement Securities |
The Funds may purchase securities with delivery or payment to occur at a later date. At the time the Funds enter into a commitment to purchase a security, the transaction is recorded and the value of the security is reflected in the net asset value. The value of the security may vary with market fluctuations. No interest accrues to the Funds until the security is delivered and payment takes place. At the time the Funds enter into this type of transaction, they are required to segregate cash or other liquid assets equal to the value of the securities purchased.
Each of the Funds is a separate entity for federal income tax purposes. It is each Funds’ policy to qualify as a regulated investment company by complying with the requirements of the Internal Revenue Code (the “code”) applicable to regulated investment companies, including the distribution of all taxable income to their shareholders. The Funds have met the requirements of the code applicable to regulated investment companies for the year ended June 30, 2006. Therefore, no federal income tax provision is required.
On July 13, 2006, the Financial Accounting Standards Board (FASB) released FASB Interpretation No. 48 “Accounting for Uncertainty in Income Taxes” (FIN 48). FIN 48 provides guidance for how uncertain tax positions should be recognized, measured, presented and disclosed in the financial statements. FIN 48 requires the evaluation of tax positions taken or expected to be taken in the course of preparing the Funds’ tax returns to determine whether the tax positions are “more-likely-than-not” of being sustained by the applicable tax authority. Tax positions not deemed to meet the more-likely-than-not threshold would be recorded as a tax benefit or expense in the current year. Adoption of FIN 48 is required for fiscal years beginning after December 15, 2006 and is to be applied to all open tax years as of the effective date. Management believes that the adoption of FIN 48 will have no impact to the financial statements.
Substantially all of the net investment income of the Funds is declared as a dividend to shareholders of record as of the close of business each day. Distributions are payable in cash or in additional shares at the net asset value on the payable date. Distributions are determined in accordance with income tax regulations. Distributions are payable:
| | |
| Monthly for: | | Kentucky Tax-Free Short-to-Medium Series; |
| | North Carolina Tax-Free Short-to-Medium Series; |
| | Tennessee Tax-Free Short-to-Medium Series; |
| | Intermediate Government Bond Series; and |
| |
| Quarterly for: | | Alabama Tax-Free Income Series; |
| | Kentucky Tax-Free Income Series; |
| | Mississippi Tax-Free Income Series; |
| | North Carolina Tax-Free Income Series; |
| | Tennessee Tax-Free Income Series |
Permanent book and tax basis differences relating to shareholder distributions have been reclassified to capital.
40
DUPREE MUTUAL FUNDS
NOTES TO FINANCIAL STATEMENTS
June 30, 2006
| 1. | Significant Accounting Policies, continued: |
The preparation of financial statements in conformity with generally accepted accounting principles in the United States requires management to make estimates and assumptions that affect the reported amounts and disclosures. Actual amounts could differ from those estimates.
| 2. | Investment Advisory Fee and Other Transactions with Affiliates |
Subject to the direction of the Trustees, Dupree & Company, Inc. (the Adviser) is responsible for the management of the Funds’ portfolios. Under the terms of the Investment Advisory Agreements for the Alabama, Kentucky, Mississippi, North Carolina and Tennessee Series, the Funds have agreed to pay to the Adviser as compensation for all services rendered, facilities furnished and expenses paid or assumed by it under the Agreements, a fee at the annual rate of .50 of 1% of the first $100,000,000 average daily net assets of each series determined separately; .45 of 1% of the average daily net assets between $100,000,001 and $150,000,000 of each series determined separately; .40 of 1% of the average daily net assets between $150,000,001 and $500,000,000 of each series determined separately; and .35 of 1% of the average daily net assets in excess of $500,000,000. For the Intermediate Government Bond Series, the Fund has agreed to pay to the Adviser, as compensation for all services rendered, facilities furnished and expenses paid or assumed by it under the Agreement, a fee at the annual rate of .20 of 1% of average daily net assets.
The Adviser may voluntarily waive investment advisory fees payable to it under the Investment Advisory Agreement with each Fund, and assume and pay other operating expenses. The Adviser will not seek to recoup any waived fees or other operating expenses it has assumed.
For the year ended June 30, 2006, investment advisory fees and waived amounts were as follows:
| | | | | | |
| | | Investment
Advisory fees | | Waived Investment
Advisory fees |
Alabama Tax-Free Income Series | | $ | 46,424 | | $ | 34,855 |
Kentucky Tax-Free Income Series | | $ | 2,794,381 | | | — |
Kentucky Tax-Free Short-to-Medium Series | | $ | 453,347 | | | — |
Mississippi Tax-Free Income Series | | $ | 23,633 | | $ | 21,013 |
North Carolina Tax-Free Income Series | | $ | 231,203 | | | — |
North Carolina Tax-Free Short-to-Medium Series | | $ | 73,309 | | $ | 7,451 |
Tennessee Tax-Free Income Series | | $ | 426,557 | | | — |
Tennessee Tax-Free Short-to-Medium Series | | $ | 86,059 | | $ | 6,338 |
Intermediate Government Bond Series | | $ | 44,792 | | | — |
In addition, each Fund has entered into a Shareholder Service Agreement with Dupree & Company, Inc, the Funds’ transfer agent. The agreement provides for a fee computed on the average daily net asset value at the annual rate of .15 of 1% on the first $20,000,000 of average net assets and .12 of 1% of all amounts in excess of $20,000,000 of average net assets for each Fund.
41
DUPREE MUTUAL FUNDS
NOTES TO FINANCIAL STATEMENTS
June 30, 2006
| 3. | Purchases and Sales of Securities |
During the year ended June 30, 2006, the cost of purchases and the proceeds from sales and maturities of securities (excluding short-term securities) for each of the Funds were as follows:
| | | | | | |
| | | Purchases | | Sales/Calls |
Alabama Tax-Free Income Series | | $ | 3,647,766 | | $ | 705,849 |
Kentucky Tax-Free Income Series | | | 182,848,569 | | | 119,930,839 |
Kentucky Tax-Free Short-to-Medium Series | | | 15,852,612 | | | 25,933,774 |
Mississippi Tax-Free Income Series | | | 1,250,490 | | | 757,802 |
North Carolina Tax-Free Income Series | | | 10,889,882 | | | 5,780,917 |
North Carolina Tax-Free Short-to-Medium Series | | | 2,752,899 | | | 5,706,409 |
Tennessee Tax-Free Income Series | | | 13,995,915 | | | 5,152,602 |
Tennessee Tax-Free Short-to-Medium Series | | | 3,933,943 | | | 7,205,055 |
Intermediate Government Bond Series | | | 4,036,548 | | | 3,850,030 |
At June 30, 2006, there were an unlimited number of shares of beneficial interest authorized. Transactions in capital shares were as follows:
| | | | | | | | | | | | | | |
ALABAMA TAX-FREE INCOME SERIES | | Year Ended June 30, 2006 | | | Year Ended June 30, 2005 | |
| | SHARES | | | AMOUNT | | | SHARES | | | AMOUNT | |
Shares sold | | 342,799 | | | $ | 4,022,275 | | | 257,047 | | | $ | 3,038,742 | |
Shares issued for reinvestment of distributions | | 21,144 | | | | 246,797 | | | 18,821 | | | | 221,221 | |
Shares redeemed | | (84,890 | ) | | | (993,133 | ) | | (81,481 | ) | | | (964,594 | ) |
Net increase | | 279,053 | | | $ | 3,275,939 | | | 194,387 | | | $ | 2,295,369 | |
| | |
KENTUCKY TAX-FREE INCOME SERIES | | Year Ended June 30, 2006 | | | Year Ended June 30, 2005 | |
| | SHARES | | | AMOUNT | | | SHARES | | | AMOUNT | |
Shares sold | | 10,839,447 | | | $ | 81,805,770 | | | 11,236,963 | | | $ | 85,955,642 | |
Shares issued for reinvestment of distributions | | 2,141,082 | | | | 16,060,512 | | | 2,555,754 | | | | 19,449,910 | |
Shares redeemed | | (9,271,622 | ) | | | (69,774,843 | ) | | (6,759,937 | ) | | | (51,700,394 | ) |
Net increase | | 3,708,907 | | | $ | 28,091,439 | | | 7,032,780 | | | $ | 53,705,158 | |
| | |
KENTUCKY TAX-FREE SHORT-TO-MEDIUM SERIES | | Year Ended June 30, 2006 | | | Year ended June 30, 2005 | |
| | SHARES | | | AMOUNT | | | SHARES | | | AMOUNT | |
Shares sold | | 2,763,577 | | | $ | 14,382,688 | | | 4,533,367 | | | $ | 24,090,958 | |
Shares issued for reinvestment of distributions | | 341,936 | | | | 1,778,012 | | | 409,453 | | | | 2,172,815 | |
Shares redeemed | | (5,279,537 | ) | | | (27,468,154 | ) | | (4,921,385 | ) | | | (26,133,145 | ) |
Net increase/(decrease) | | (2,174,025 | ) | | | (11,307,454 | ) | | 21,435 | | | $ | 130,628 | |
42
DUPREE MUTUAL FUNDS
NOTES TO FINANCIAL STATEMENTS
June 30, 2006
| 4. | Capital Shares, continued: |
| | | | | | | | | | | | | | |
MISSISSIPPI TAX-FREE INCOME SERIES | | Year Ended June 30, 2006 | | | Year ended June 30, 2005 | |
| | SHARES | | | AMOUNT | | | SHARES | | | AMOUNT | |
Shares sold | | 94,179 | | | $ | 1,081,515 | | | 133,931 | | | $ | 1,574,161 | |
Shares issued for reinvestment of distributions and capital gain | | 12,595 | | | | 144,512 | | | 12,532 | | | | 146,062 | |
Shares redeemed | | (69,436 | ) | | | (803,744 | ) | | (19,655 | ) | | | (231,094 | ) |
Net increase | | 37,338 | | | $ | 422,283 | | | 126,808 | | | $ | 1,489,129 | |
| | |
NORTH CAROLINA TAX-FREE INCOME SERIES | | Year Ended June 30, 2006 | | | Year ended June 30, 2005 | |
| | SHARES | | | AMOUNT | | | SHARES | | | AMOUNT | |
Shares sold | | 885,785 | | | $ | 9,680,978 | | | 803,105 | | | $ | 8,888,885 | |
Shares issued for reinvestment of distributions | | 115,290 | | | | 1,253,668 | | | 129,319 | | | | 1,422,722 | |
Shares redeemed | | (491,003 | ) | | | (5,368,378 | ) | | (498,287 | ) | | | (5,493,182 | ) |
Net increase | | 510,072 | | | $ | 5,566,268 | | | 434,137 | | | $ | 4,818,425 | |
| | |
NORTH CAROLINA TAX-FREE SHORT-TO-MEDIUM SERIES | | Year Ended June 30, 2006 | | | Year Ended June 30, 2005 | |
| | SHARES | | | AMOUNT | | | SHARES | | | AMOUNT | |
Shares sold | | 243,043 | | | $ | 2,541,633 | | | 494,522 | | | $ | 5,275,289 | |
Shares issued for reinvestment of distributions | | 27,436 | | | | 286,409 | | | 33,493 | | | | 356,511 | |
Shares redeemed | | (579,853 | ) | | | (6,066,509 | ) | | (425,310 | ) | | | (4,536,020 | ) |
Net increase/(decrease) | | (309,374 | ) | | $ | (3,238,467 | ) | | 102,705 | | | $ | 1,095,780 | |
| | |
TENNESSEE TAX-FREE INCOME SERIES | | Year Ended June 30, 2006 | | | Year ended June 30, 2005 | |
| | SHARES | | | AMOUNT | | | SHARES | | | AMOUNT | |
Shares sold | | 1,500,530 | | | $ | 16,536,991 | | | 1,786,902 | | | $ | 19,956,182 | |
Shares issued for reinvestment of distributions | | 128,726 | | | | 1,412,690 | | | 152,080 | | | | 1,688,267 | |
Shares redeemed | | (859,498 | ) | | | (9,466,572 | ) | | (1,053,564 | ) | | | (11,746,976 | ) |
Net increase | | 769,758 | | | $ | 8,483,109 | | | 885,418 | | | $ | 9,897,473 | |
| | |
TENNESSEE TAX-FREE SHORT-TO-MEDIUM SERIES | | Year Ended June 30, 2006 | | | Year ended June 30, 2005 | |
| | SHARES | | | AMOUNT | | | SHARES | | | AMOUNT | |
Shares sold | | 186,108 | | | $ | 1,950,956 | | | 380,688 | | | $ | 4,070,797 | |
Shares issued for reinvestment of distributions | | 35,229 | | | | 367,897 | | | 41,975 | | | | 447,462 | |
Shares redeemed | | (580,700 | ) | | | (6,075,705 | ) | | (519,856 | ) | | | (5,542,597 | ) |
Net decrease | | (359,363 | ) | | $ | (3,756,852 | ) | | (97,193 | ) | | $ | (1,024,338 | ) |
43
DUPREE MUTUAL FUNDS
NOTES TO FINANCIAL STATEMENTS
June 30, 2006
| 4. | Capital Shares, continued: |
| | | | | | | | | | | | | | |
INTERMEDIATE GOVERNMENT BOND SERIES | | Year Ended June 30, 2006 | | | Year ended June 30, 2005 | |
| | SHARES | | | AMOUNT | | | SHARES | | | AMOUNT | |
Shares sold | | 312,018 | | | $ | 3,074,113 | | | 639,505 | | | $ | 6,423,219 | |
Shares issued for reinvestment of distributions | | 83,901 | | | | 822,217 | | | 77,573 | | | | 778,570 | |
Shares redeemed | | (373,577 | ) | | | (3,656,949 | ) | | (313,969 | ) | | | (3,148,504 | ) |
Net increase | | 22,342 | | | $ | 239,381 | | | 403,109 | | | $ | 4,053,285 | |
| 5. | Concentration of credit risk |
The Alabama Tax-Free Income Series, Kentucky Tax-Free Income Series, Kentucky Tax-Free Short-to-Medium Series, Mississippi Tax-Free Income Series, North Carolina Tax-Free Income Series, North Carolina Tax-Free Short-to-Medium Series, Tennessee Tax-Free Income Series, and Tennessee Tax-Free Short-to-Medium Series each invest solely in debt obligations issued by the states of Alabama, Kentucky, Mississippi, North Carolina and Tennessee, respectively, and their respective political subdivisions, agencies and public authorities to obtain funds for various public purposes. Each of these state-specific Funds is more susceptible to economic and political factors adversely affecting issuers of their states’ respective municipal securities than a fund that is not concentrated in these issuers to the same extent.
As of June 30, 2006, the Alabama Tax-Free Income Series, Kentucky Tax-Free Income Series, Kentucky Tax-Free Short-to-Medium Series, North Carolina Tax-Free Income Series, North Carolina Tax-Free Short-to-Medium Series, Tennessee Tax-Free Income Series, Tennessee Tax-Free Short-to-Medium Series, and Intermediate Government Bond Series have capital loss carryforwards which are available to offset future capital gains, if any. As of June 30, 2006 the Mississippi Tax-Free Income Series does not have any capital loss carryforwards.
The capital loss carryforwards expire as follows:
| | | | | | | | | | | | | | | | | | | | | | | | | | | |
| | | 2007 | | 2008 | | 2009 | | 2010 | | 2011 | | 2012 | | 2013 | | 2014 | | Total |
Alabama Tax-Free Income Series | | $ | — | | $ | — | | $ | — | | $ | — | | $ | — | | $ | 886 | | $ | 157 | | $ | — | | $ | 1,043 |
Kentucky Tax-Free Income Series | | | — | | | — | | | — | | | — | | | — | | | — | | | 257,991 | | | — | | | 257,991 |
Kentucky Tax-Free Short-to-Medium Series | | | — | | | 135,232 | | | 312,672 | | | 34,064 | | | — | | | 44,500 | | | 329,431 | | | 74,336 | | | 930,235 |
North Carolina Tax-Free Income Series | | | — | | | — | | | — | | | | | | — | | | 774,390 | | | — | | | — | | | 774,390 |
North Carolina Tax-Free Short-to-Medium Series | | | — | | | 5,915 | | | 22,226 | | | — | | | — | | | 10,514 | | | 4,659 | | | 43,905 | | | 87,219 |
Tennessee Tax-Free Income Series | | | — | | | 106,065 | | | 523,414 | | | 69,806 | | | 18,314 | | | 175,434 | | | 28,669 | | | — | | | 921,703 |
Tennessee Tax-Free Short-to-Medium Series | | | — | | | 5,991 | | | 37,349 | | | — | | | — | | | | | | 797 | | | 61,617 | | | 105,754 |
Intermediate Government Bond Series | | | — | | | 209,853 | | | 46,873 | | | — | | | — | | | 117,848 | | | 2 | | | 64,307 | | | 438,883 |
The tax basis components of distributable earnings for each of the Funds are the same, with the exception of wash sales of $1,253 on the Alabama Tax-Free Income Series.
Capital losses incurred after October 31 (“Post-October” losses) within the taxable year are deemed to arise on the first business day of the Funds’ next taxable year. The following Funds incurred and will elect to defer net
44
DUPREE MUTUAL FUNDS
NOTES TO FINANCIAL STATEMENTS
June 30, 2006
| 6. | Federal Income Taxes, continued: |
capital losses during the fiscal year 2006 as follows:
| | | | |
| | | Post October Losses | |
Alabama Tax-Free Income Series | | $ | (4,222 | ) |
Kentucky Tax-Free Short-to-Medium Series | | | (252,336 | ) |
North Carolina Tax-Free Short-to-Medium Series | | | (28,191 | ) |
Tennessee Tax-Free Short-to-Medium Series | | | (71,856 | ) |
Intermediate Government Bond Series | | | (16,160 | ) |
At June 30, 2006, the effect of permanent book to tax differences (expiration of capital loss carryforwards) resulted in increases and decreases to the components of net assets as follows:
| | | | | | | |
| | | Accumulated Net
Realized Losses | | Capital | |
Kentucky Tax-Free Short-to-Medium Series | | $ | 73,155 | | $ | (73,155 | ) |
The tax character of distributions paid for the years ended June 30, 2006 and 2005 were as follows:
| | | | | | | | | | | | | | | | | | |
| | | 6/30/2006 | | 6/30/2005 |
| | | Tax Exempt
Income | | Ordinary
Income | | Long-term
Capital Gain | | Tax Exempt
Income | | Ordinary
Income | | Long-term
Capital Gain |
Alabama Tax-Free Income Series | | $ | 368,623 | | $ | — | | $ | — | | $ | 273,588 | | $ | — | | $ | — |
Kentucky Tax-Free Income Series | | | 27,614,512 | | | — | | | — | | | 27,597,283 | | | — | | | — |
Kentucky Tax-Free Short-to-Medium Series | | | 2,644,939 | | | — | | | — | | | 2,885,070 | | | — | | | — |
Mississippi Tax-Free Income Series | | | 186,687 | | | — | | | 17,756 | | | 160,579 | | | — | | | — |
North Carolina Tax-Free Income Series | | | 1,797,666 | | | — | | | — | | | 1,643,099 | | | — | | | — |
North Carolina Tax-Free Short-to-Medium Series | | | 415,263 | | | — | | | — | | | 474,522 | | | — | | | — |
Tennessee Tax-Free Income Series | | | 3,246,995 | | | — | | | — | | | 3,042,731 | | | — | | | — |
Tennessee Tax-Free Short-to-Medium Series | | | 492,563 | | | — | | | — | | | 566,331 | | | — | | | — |
Intermediate Government Bond Series | | | — | | | 1,086,481 | | | — | | | — | | | 988,425 | | | — |
| 7. | Contingencies and Commitments |
The Funds indemnify the Trust’s officers and Trustees for certain liabilities that might arise from their performance of their duties to the Funds. Additionally, in the normal course of business, the Funds enter into contracts that contain a variety of representations and warranties and which may provide for indemnification. The Funds’ maximum exposure under these arrangements is unknown, as this would involve predicting future claims that may be made against the Funds, if any, that have not yet occurred. However, based on experience, the Funds do not expect the risk of loss to be material.
| 8. | Line of Credit Agreement and Custodian Agreement |
Under the terms of an agreement with the Funds’ custodian, principal amounts up to 5% of a Fund’s net assets are available on an uncommitted line of credit. The principal amounts borrowed are due on demand. The agreement expires on September 30, 2006 but may be renewed annually. Interest is payable based on the published prime rate of the bank. Securities with a minimum value of three times the loan proceeds will be
45
DUPREE MUTUAL FUNDS
NOTES TO FINANCIAL STATEMENTS
June 30, 2006
| 8. | Line of Credit Agreement and Custodian Agreement, continued: |
assigned as collateral until the balance of the note and unpaid interest is paid in full and terminated.
During the year ended June 30, 2006, the weighted average borrowings for each Series were as follows:
| | | |
| | | Weighted average borrowings |
Alabama Tax-Free Income Series | | $ | 7,696 |
Kentucky Tax Free Income Series | | | 890 |
Kentucky Tax-Free Short-to-Medium Series | | | 31,619 |
Mississippi Tax-Free Income Series | | | 3,247 |
North Carolina Tax-Free Income Series | | | 2,140 |
North Carolina Tax-Free Short-to-Medium Series | | | 9,932 |
Tennessee Tax-Free Income Series | | | 1,378 |
Tennessee Tax-Free Short-to-Medium Series | | | 8,416 |
Intermediate Government Bond Series | | | 3,455 |
The Funds have a contractual agreement with the custodian whereby the bank will provide custodial services for $1.00 per year. Through arrangements with the Funds’ custodian, credits realized as a result of unninvested cash balances were used to reduce each Fund’s expenses. During the year, these credits reduced each of the Funds’ expenses by the amount shown on the statements of operation as “custodian expense reduction.”
46
Report of Independent Registered Public Accounting Firm
To the Shareholders and Board of Directors Trustees of
Dupree Mutual Funds:
We have audited the accompanying statements of assets and liabilities of Dupree Mutual Funds (comprised of Alabama Tax-Free Income Series, Kentucky Tax-Free Income Series, Kentucky Tax Free Short-to-Medium Series, Mississippi Tax-Free Income Series, North Carolina Tax-Free Income Series, North Carolina Tax-Free Short-to-Medium Series, Tennessee Tax-Free Income Series, Tennessee Tax-Free Short-to-Medium Series, and Intermediate Government Bond Series) (the Funds), including the schedules of portfolio investments, as of June 30, 2006, and the related statements of operations for the year then ended, the statements of changes in net assets for each of the two years in the period then ended, and the financial highlights for each of the five years in the period then ended. These financial statements and financial highlights are the responsibility of the Funds’ management. Our responsibility is to express an opinion on these financial statements and financial highlights based on our audits.
We conducted our audits in accordance with the standards of the Public Company Accounting Oversight Board (United States). Those standards require that we plan and perform the audits to obtain reasonable assurance about whether the financial statements and financial highlights are free of material misstatement. An audit includes consideration of internal control over financial reporting as a basis for designing audit procedures that are appropriate in the circumstances, but not for the purpose of expressing an opinion on the effectiveness of the Funds’ internal control over financial reporting. Accordingly, we express no such opinion. An audit also includes examining, on a test basis, evidence supporting the amounts and disclosures in the financial statements and financial highlights, assessing the accounting principles used and significant estimates made by management, and evaluating the overall financial statement presentation. Our procedures included confirmation of securities owned as of June 30, 2006, by correspondence with the custodian and brokers. We believe that our audits provide a reasonable basis for our opinion.
In our opinion, the financial statements and financial highlights referred to above present fairly, in all material respects, the financial position of each of the respective portfolios comprising the Dupree Mutual Funds at June 30, 2006, the results of their operations for the year then ended, the changes in their net assets for each of the two years in the period then ended, and their financial highlights for each of the five years in the period then ended, in conformity with U.S. generally accepted accounting principles.

Cincinnati, Ohio
August 4, 2006
47
DUPREE MUTUAL FUNDS
OTHER UNAUDITED INFORMATION
June 30, 2006
Trustee and officer information
The following table sets forth information as to the Trustees and officers:
| | | | | | | | | | |
Name, Address and Age | | Position(s)
held with
Funds | | Term of Office and
Length of Time
Served | | Principal Occupation(s) During Past 5 Years | | Number
of
Portfolios
in Fund
Complex
Overseen
by
Trustee | | Other Directorships
Held by Trustee |
| | | | | |
Officers: | | | | | | | | | | |
| | | | | |
Thomas P. Dupree Sr. 125 South Mill Street Lexington, KY 40507 Age: 76 | | President | | Annual Term; 27 years service as President | | Chairman of the Board of Dupree & Company, Inc. | | N/A | | Office Suites Plus |
| | | | | |
Gay M. Elste P.O. Box 28 Versailles, KY 40383 Age: 55 | | Compliance
Officer | | Annual Term; 2 years of service | | Attorney at Law, Darsie & Elste. Anstruther Farm, beef cattle farming | | N/A | | N/A |
| | | | | |
Allen E. Grimes, III 125 South Mill Street Lexington, KY 40507 Age: 43 | | Executive
Vice
President | | Annual Term; 1 year of service | | President, Dupree & Company, Inc. Attorney, Dinsmore & Shohl LLP (2001-2004) | | N/A | | N/A |
| | | | | |
Michelle M. Dragoo 125 South Mill Street Lexington, KY 40507 Age: 45 | | Vice
President,
Secretary,
Treasurer | | Annual Term; 8 years of service as Vice President, 6 years of service as Secretary, Treasurer | | Vice President, Secretary, Treasurer of Dupree & Company, Inc. | | N/A | | N/A |
| | | | | |
Alison L. Arnold 125 South Mill Street Lexington, KY 40507 Age: 46 | | Assistant
Secretary | | Annual Term; 13 years of service | | Dupree & Company, Inc. | | N/A | | N/A |
| | | | | |
Trustees: | | | | | | | | | | |
| | | | | |
William A. Combs, Jr. 111 Woodland Ave., #510 Lexington, KY 40502 Age: 66 | | Chairman,
Trustee | | Annual Term 5 years of service as Chairman; 17 years of service as Trustee | | Officer, Director: Mercedes-Benz of Cincinnati, Ohio; Mercedes-Benz of West Chester, Ohio and Freedom Dodge, Lexington, KY | | 9 | | N/A |
| | | | | |
Lucy A. Breathitt 1703 Fairway Drive Lexington, KY 40502 Age: 69 | | Trustee | | Annual Term 10 years of service as Trustee | | Alexander Farms, farming | | 9 | | KY Historical Society Foundation, KY Natural Lands Trust, Bluegrass Conservancy |
| | | | | |
C. Timothy Cone 201 West Short Street Lexington, KY 40507 Age: 61 | | Trustee | | Annual Term 4 years of service as Trustee | | President, Gess, Mattingly & Atchison, P.S.C. (law firm) | | 9 | | N/A |
48
DUPREE MUTUAL FUNDS
OTHER UNAUDITED INFORMATION
June 30, 2006
Trustee and officer information, continued:
| | | | | | | | | | |
Name, Address and Age (continued) | | Position(s)
held with
Funds | | Term of Office
and Length of
Time Served | | Principal Occupation(s) During Past 5 Years | | Number
of
Portfolios
in Fund
Complex
Overseen
by
Trustee | | Other
Directorships
Held by
Director |
| | | | | |
J. William Howerton 3954 Primrose Place Paducah, KY 42001 Age: 74 | | Trustee | | Annual Term 6 years of service as Trustee | | Judge (retired November 1996) KY Court of Appeals; Self-Employed Mediator, Arbitrator and Special Judge. Trustee 4 accounts | | 9 | | Director KY
Lottery
Corporation;
Director
Carson Four
Rivers
Center for
the
Performing
Arts |
| | | | | |
William S. Patterson 367 West Short Street Lexington, KY 40507 Age: 74 | | Trustee | | Annual Term 27 years of service as Trustee | | President, CEO, Cumberland Surety Co., Lexington, KY, President, Patterson & Co., Frankfort, KY, (real estate development, thoroughbred horse breeding and farming) | | 9 | | N/A |
As of June 30, 2006, none of the Trustees nor members of their immediate family held any beneficial interest in the Trust’s Investment Adviser. Further, the Trust does not have an underwriter.
The Statement of Additional Information (“SAI”) includes additional information about Trustees and officers and is available upon request without charge. Please call (800) 866-0614 to request the SAI.
Proxy Voting Information
A description of the policies and procedures that the Funds use to determine how to vote proxies relating to portfolio securities is available without charge upon request by calling (800) 866-0614, or on the Securities and Exchange Commission’s website at http://www.sec.gov. For the year ending June 30, 2006 the Funds exercised no proxy votes due to the fact that the debt instruments in which the Funds invest carry no voting rights.
Quarterly Portfolio Disclosure
The Trust files with the Securities and Exchange Commission a complete listing of portfolio holdings for each Fund as of the end of the first and third quarters of each fiscal year on Form N-Q beginning with September 2004 quarter. The complete listing (i) is available on the commission’s website and (ii) will be made available to shareholders upon request by calling 800-866-0614. Information on the operation of the S.E.C.’s Public Reference Room may be obtained by calling 1-800-SEC-0300.
49
Schedule of Shareholder Expenses
As a shareholder of the Funds, you incur transaction costs including investment advisory fees and other Fund expenses. The following examples are intended to help you understand your ongoing costs (in dollars) of investing in the Funds and to compare these costs with the ongoing costs of investing in other mutual funds.
Actual Expenses
The first line of the table below provides information about actual account values and actual expenses. You may use the information in this line, together with the amount you invested, to estimate the expenses that you paid over the period. Simply divide your account value by $1,000 (for example, an $8,600 account value divided by $1,000 = 8.6), then multiply the result by the number in the first line under the heading entitled “Expenses Paid During the Six Months Ended June 30, 2006” to estimate the expenses you paid on your account during this period.
Hypothetical Example for Comparison Purposes
The second line of the table below provides information about hypothetical account values and hypothetical expenses based on each Fund’s actual expense ratio and an assumed rate of return of 5% per year before expenses which is not the Funds’ actual ending account balance or expenses you paid for the period. You may use this information to compare the ongoing costs of investing in the Funds and other funds. To do so, compare this 5% hypothetical example with the 5% hypothetical examples that appear in the shareholder reports of other funds.
| | | | | | | | | | | | |
| | | Net Expense
Ratio
Annualized
June 30, 2006 | | | Beginning
Account Value
January 1,
2006* | | Ending
Account Value
June 30,
2006** | | Expenses Paid During the Six Months Ended
June 30, 2006 |
Alabama Tax-Free Income Series | | | | | | | | | | | | |
Actual | | .51 | % | | $ | 1,000.00 | | $ | 950.00 | | $ | 2.47 |
Hypothetical | | .51 | | | | 1,000.00 | | | 1,024.70 | | | 2.56 |
Kentucky Tax-Free Income Series | | | | | | | | | | | | |
Actual | | .58 | | | | 1,000.00 | | | 1,000.00 | | | 2.88 |
Hypothetical | | .58 | | | | 1,000.00 | | | 1,024.70 | | | 2.91 |
Kentucky Tax-Free Short-to-Medium Series | | | | | | | | | | | | |
Actual | | .71 | | | | 1,000.00 | | | 1,001.20 | | | 3.52 |
Hypothetical | | .71 | | | | 1,000.00 | | | 1,024.70 | | | 3.56 |
Mississippi Tax-Free Income Series | | | | | | | | | | | | |
Actual | | .45 | | | | 1,000.00 | | | 1,000.00 | | | 2.23 |
Hypothetical | | .45 | | | | 1,000.00 | | | 1,024.70 | | | 2.26 |
North Carolina Tax-Free Income Series | | | | | | | | | | | | |
Actual | | .72 | | | | 1,000.00 | | | 1,000.60 | | | 3.57 |
Hypothetical | | .72 | | | | 1,000.00 | | | 1,024.70 | | | 3.61 |
North Carolina Tax-Free Short-to-Medium Series | | | | | | | | | | | | |
Actual | | .76 | | | | 1,000.00 | | | 999.80 | | | 3.77 |
Hypothetical | | .76 | | | | 1,000.00 | | | 1,024.70 | | | 3.82 |
50
DUPREE MUTUAL FUNDS
OTHER UNAUDITED INFORMATION
June 30, 2006
Schedule of Shareholder Expenses, continued:
| | | | | | | | | | | | |
| | | Net Expense
Ratio
Annualized
June 30, 2006 | | | Beginning
Account Value
January 1,
2006* | | Ending
Account Value
June 30,
2006** | | Expenses Paid During the Six Months Ended June 30, 2006 |
Tennessee Tax-Free Income Series | | | | | | | | | | | | |
Actual | | .71 | % | | $ | 1,000.00 | | $ | 1,000.50 | | $ | 3.52 |
Hypothetical | | .71 | | | | 1,000.00 | | | 1,024.70 | | | 3.56 |
Tennessee Tax-Free Short-to-Medium Series | | | | | | | | | | | | |
Actual | | .74 | | | | 1,000.00 | | | 1,000.70 | | | 3.67 |
Hypothetical | | .74 | | | | 1,000.00 | | | 1,024.70 | | | 3.74 |
Intermediate Government Bond Series | | | | | | | | | | | | |
Actual | | .44 | | | | 1,000.00 | | | 996.70 | | | 2.18 |
Hypothetical | | .44 | | | | 1,000.00 | | | 1,024.70 | | | 2.21 |
| * | The example is based on an investment of $1,000 invested at the beginning of the period. |
| ** | Expenses are equal to the Fund’s annualized expense ratio, multiplied by the average account value over the period multiplied by [number of days in most recent fiscal half-year/365] (to reflect one-half year period). |
51
Item 2. Code of Ethics
The registrant has adopted a code of ethics that applies to the principal executive officer, principal financial officer, principal accounting officer and persons performing similar functions. The full text of the Code of Ethics is incorporated by reference from the registrant’s Post Effective Amendment No. 44. There have been no amendments to or waivers from the Code of Ethics during the reporting period. The Registrant’s Code of Ethics is posted on its web site.
Item 3. Audit Committee Financial Expert: The board does not have a financial expert serving on the audit committee. The registrant’s audit committee is comprised of all Trustees all of who are non-interested and independent. The audit committee believes that the collective experience and expertise of the members in assessing the performance of companies and the evaluation of financial statements is sufficient to assess the issues which can reasonably be expected to be raised by the Trust’s financial statements.
Item 4. Principal Accountant Fees and Services: This information is incorporated by reference in the registrant’s definitive proxy statement to be filed within 120 days after June 30, 2006.
Item 5. Not applicable
Item 6. Included as part of item 1.
Item 7. Not applicable
Item 8. Not applicable.
Item 9. Not applicable
Item 10. There have been no changes to the procedures by which shareholders may recommend nominees to the board of trustees nominating committee.
Item 11. Controls and Procedures:
On August 4, 2006 the Registrant’s President and Treasurer assessed the disclosure controls and procedures to evaluate the effectiveness of the Registrant’s disclosure controls and procedures designed to ensure that information required to be disclosed by the investment company on Form N-CSR is recorded, processed, summarized and reported within the time periods specified in the Securities and Exchange Commission’s rules and forms. Disclosure controls and procedures include, without limitation, controls and procedures designed to ensure that information required to be disclosed by an investment company in the reports that it files on Form N-CSR is accumulated and communicated to the investment company’s management, including its principal executive and principal financial officers or persons performing similar functions, as appropriate to allow timely decisions regarding required disclosure.
Further, on August 4, 2006 the Registrant’s President and Treasurer assessed the internal control over financial reporting to provide reasonable assurance regarding the reliability of financial reporting and the preparation of financial statements for external purposes in accordance with generally accepted accounting principles and includes those policies and procedures that: (1) pertain to the maintenance of records that in reasonable detail accurately and fairly reflect the transactions and dispositions of the assets of the investment company; (2) provide reasonable assurance that transactions are recorded as necessary to permit preparation of financial statements in accordance with generally accepted accounting principles, and that receipts and expenditures of the investment company are being made only in accordance with authorizations of management and trustees of the investment company; and (3) provide reasonable assurance regarding prevention or timely detection of unauthorized acquisition, use, or disposition of the investment company’s assets that could have a material effect on the financial statements.
The Registrant’s President and Treasurer have deemed the disclosure controls and procedures and the internal control over financial reporting effective. There were no changes in the Registrant’s disclosure controls and procedures or internal control over financial reporting that occurred during the fourth quarter of the fiscal year that materially affected or is reasonably likely to materially affect the Registrant’s financial statements.
Item 12. Exhibits
| | (a) | (1) Incorporated by reference from Post Effective Amendment No. 44 |
SIGNATURES
Pursuant to the requirements of the Securities Exchange Act of 1934 and the Investment Company Act of 1940, the registrant has duly caused this report to be signed on its behalf by the undersigned, thereunto duly authorized.
| | |
DUPREE MUTUAL FUNDS |
(Registrant) |
| |
By | | /s/ Thomas P. Dupree, Sr. |
| | Thomas P. Dupree, President |
|
Date 5th September, 2006 |
Pursuant to the requirements of the Securities Exchange Act of 1934 and the Investment Company Act of 1940, this report has been signed below by the following persons on behalf of the registrant and in the capacities and on the dates indicated.
| | |
| By | | /s/ Thomas P. Dupree, Sr. |
| | Thomas P. Dupree, Sr., President |
|
| Date 5th September, 2006 |
| |
| By | | /s/ Michelle M Dragoo |
| | Michelle M. Dragoo, Treasurer |
|
| Date 5th September, 2006 |