U. S.
SECURITIES AND EXCHANGE COMMISSION
WASHINGTON, D. C. 20549
FORM N-CSR
CERTIFIED SHAREHOLDER REPORT OF REGISTERED
MANAGEMENT INVESTMENT COMPANIES
Investment Company Act file number 811-2918
DUPREE MUTUAL FUNDS
(Exact Name of Registrant as Specified in Charter)
125 South Mill Street, Vine Center, Suite 100
Lexington, Kentucky 40507
(Address of Principal Executive Offices) (Zip Code)
Thomas P. Dupree
125 South Mill Street, Vine Center, Suite 100
Lexington, Kentucky 40507
(Name and address of agent for service)
Registrant’s Telephone Number, including Area Code (859) 254-7741
Date of fiscal year end: June 30, 2011
Date of reporting period: July 1, 2010 through June 30, 2011
Item 1. Report to Stockholders

June 30, 2011
ANNUAL REPORT
TO SHAREHOLDERS
ABOUT DUPREE MUTUAL FUNDS
In 1941, Dupree & Company, Inc. began business in Harlan, Kentucky as a small securities brokerage firm specializing in tax-exempt municipal bonds.
Over the years the firm, which in 1963 moved its offices to Lexington, Kentucky, grew to become a regional leader in public finance, helping to structure complex and innovative municipal bond financing for some of the largest public projects in the Commonwealth of Kentucky.
In 1979, Dupree & Company began what is now Dupree Mutual Funds with the Kentucky Tax-Free Income Series and became the Fund’s investment adviser. The Fund was one of the first single-state municipal bond funds in the country, and the first mutual fund to invest solely in Kentucky municipal bonds. Since then, several new offerings have been added to the Dupree Mutual Funds family:
Kentucky Tax-Free Short-to-Medium Series in 1987;
Intermediate Government Bond Series in 1992;
Tennessee Tax-Free Income Series in 1993;
Tennessee Tax-Free Short-to-Medium Series in 1994;
North Carolina Tax-Free Income Series in 1995;
North Carolina Tax-Free Short-to-Medium Series in 1995;
Alabama Tax-Free Income Series in 2000;
Mississippi Tax-Free Income Series in 2000; and
Taxable Municipal Bond Series in 2010.
Today, after more than 60 years in business, Dupree continues to be a pioneer in the industry. Our Kentucky, Tennessee, and Mississippi Series are currently the ONLY 100% “no-load” municipal bond funds available in those states. No-load means simply that shares of the funds are offered directly to investors with no front or back-end sales charges, as opposed to load funds which are sold through brokerage firms or other institutions.
At Dupree Mutual Funds, our goal is a simple one: to offer investors a high-quality, low-cost way to invest in municipal and government bonds while providing superior service to our shareholders. We encourage you to let us know how we’re doing.
TABLE OF CONTENTS
Management’s Discussion of Fund Performance: | (Unaudited) |
Twelve Months Ended June 30, 2011i
The investment objective of our tax-free municipal bond funds is to provide a high level of tax-free income derived from state-specific municipal bonds without incurring undue risk to principal. The investment objectives of our government bond fund and taxable municipal bond fund are to provide a high level of taxable income derived from securities of the U.S. government and its agencies and taxable municipal securities, respectively, without incurring undue risk to principal.
This report covers the 12-month period from June 30, 2010 through June 30, 2011 (the “reporting period”). During the second half of 2010, the economy grew at a moderate pace and continued to recover from the severe recession. Real GDP increased at a 2.6 percent annual rate during the third quarter of 2010 and the economy grew at a 3.1 percent annual rate during the fourth quarter of 2010. However, economic growth slowed markedly during the first quarter of 2011 with real GDP increasing at a 0.4 percent annual rate. Real GDP for the second quarter of 2011 increased at a 1.3 percent (advance estimate) annual rate. The slowdown in real GDP growth in the first half of 2011 reflected a number of factors including, higher food and energy prices that dampened consumer spending, supply chain disruptions associated with the earthquake in Japan, falling house prices, decreased spending at the state and local level, and a persistently weak labor market.
Economic indicators such as retail sales, industrial production, and business investment during the reporting period confirmed that the economy at the state and national levels continued to grow but at a below-trend rate. At the end of the reporting period, many broad economic indicators had still not returned to their prerecession levels. At its June 2011 meeting, the Federal Reserve marked down its forecast for real GDP growth in 2011 to reflect the unexpected weakness experienced during the first half of the year. The growth forecast for 2012 was also marked down; however, the Federal Reserve left its longer-term economic growth projections unchanged.
Key unemployment measures remained elevated during the reporting period. Over 8.5 million jobs have been lost since the recession began. The national unemployment rate was 9.5 percent at the beginning of the reporting period and it ended the reporting period at 9.2 percent. The labor market started showing some temporary signs of improvement during the first quarter of 2011, but then began to soften again during the second quarter of 2011. The Federal Reserve projects that the unemployment rate will remain elevated and in the range of 7.0 to 8.2 percent through 2013.
The Federal Reserve kept the target fed funds rate at 0 to 1/4 percent throughout the reporting period and has continued to reiterate that it intends to maintain exceptionally low levels of the federal funds rate for an “extended period”. At the end of June, the Federal Reserve completed its program of purchasing $600 billion of longer-term Treasury securities that was announced in November. In addition, the Federal Reserve maintained its policy of reinvesting principal payments from its agency debt and agency mortgage-backed securities holdings into longer-term Treasury securities.
Key measures of inflation remained subdued during the second half of 2010, but consumer price inflation increased noticeably during the first part of 2011. Increases in food, commodity, and energy prices accounted for a significant portion of the rise in inflation. The core consumer price index (CPI) increased by 1.6 percent on a year-over-year basis through June. The headline CPI number (which includes food and energy costs) increased by 3.6% on a year-over-year basis through June. The Federal Reserve’s preferred inflation index, the personal consumption expenditure core price index (PCE) increased 1.3 percent on a year-over-year basis through June. Despite the uptick in headline inflation, core inflation levels have remained below levels deemed acceptable by the Federal Reserve and longer-term inflation expectations have also remained stable.
State and local governments remained under significant fiscal pressure during the reporting period. Almost all states have had to close large budget shortfalls for FY 2011 and 2012. Many states are also facing projected budget shortfalls for FY 2013. Lower tax revenue collections at the state and local level have led to budget cuts, debt restructurings, job losses, and reforms to public pensions. States rely primarily on income taxes (personal and corporate) and sales taxes which are still below peak levels.
On a positive note, state tax collections in most states including Alabama, Kentucky, Mississippi, North Carolina, and Tennessee have rebounded. According to data compiled by The Nelson A. Rockefeller Institute of Government, collections at the state level from major tax sources increased by 9.1 percent in nominal terms on a year-over-year basis in the first quarter of 2011. This represented the third consecutive quarter of increasing strength in revenues and five consecutive quarters of rising tax collections at the state level. Preliminary figures for April and May 2011 indicate continuing and growing strength in state tax revenues. However, while state tax collections are improving, it should be noted that they are still below pre-recession levels in most states.
In contrast to states, local governments rely primarily on property taxes. Tax collections at the local level have declined as a sharp decline in housing prices has negatively impacted real property assessments. The decline in property tax collections is likely to
i
(Unaudited)
persist for some time as housing prices are still declining in many jurisdictions. Because there is often a time lag between changes in market value and assessed property values, current property tax levels may not fully reflect home price declines. Localities also rely on state aid and assistance which may be cut. Accordingly, it seems likely that localities will remain under significant fiscal stress in the near-term.
For the first three months of the reporting period municipal bond performance was very strong. The market was supported by robust investor demand, low interest rates, and limited supply of tax-exempt bonds. However, the municipal bond market experienced a significant sell-off during the fourth quarter of 2010. Headline risk (negative media coverage and commentary) in the municipal bond market reached a peak at the end of the year as states and localities struggled with large budget deficits and several prominent market commentators predicted widespread defaults in the municipal bond sector. The sunset of the Build America Bond (BAB) program on December 31, 2010, heavy year-end bond issuance, and ongoing worries about state and local finances led to indiscriminate selling in the municipal bond sector which pushed yields substantially higher and prices lower. Treasury yields also increased dramatically with the 10-year Treasury yield increasing 103 basis points (0.01% = 1 basis point) and the 30-year Treasury yield increasing 88 basis points between November 4 and December 15.
The municipal bond market stabilized during the first quarter of 2011 even though headline risk continued to persist. Several factors led to the firming up of the market: a limited supply of new issue tax-exempt bonds, increased demand by institutional buyers, and a growing realization by market participants that the heavily publicized doomsday scenarios predicting widespread bond defaults were overblown. The rally in the municipal bond market picked up steam in the second quarter of 2011 and was fueled primarily by a limited supply of bonds, a substantial easing of outflows from bond funds, and a strong rally in the Treasury market. Although the municipal bond market experienced a fair amount of volatility during the reporting period, we maintained a long-term perspective and were able to take advantage of opportunities to purchase high- quality bonds at attractive levels.
The Barclays Capital Municipal Bond Index, which tracks investment grade municipal securities across all sectors and maturities, had a total return of 3.475 percent for the twelve month period ended June 30.
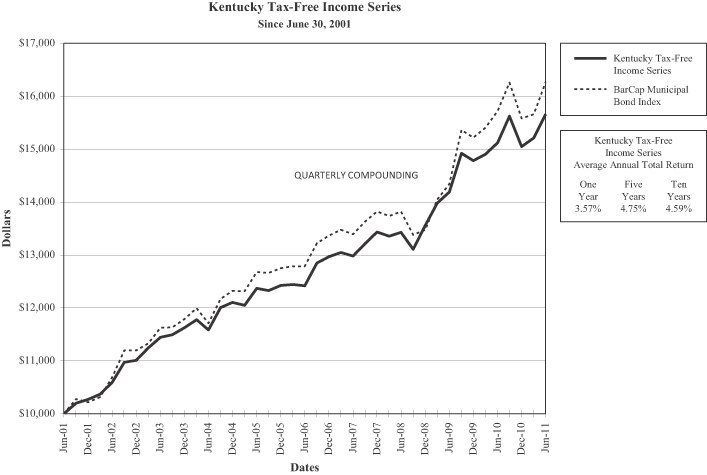
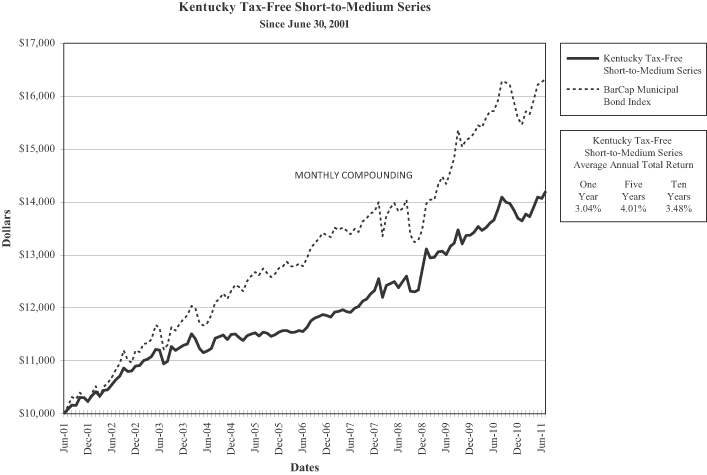
The Kentucky Tax-Free Income Series provided shareholders a total return of 3.57 percent for the twelve months ended June 30, 2011. The Kentucky Tax-Free Short-to-Medium Series provided shareholders with a total return of 3.04 percent during the period under review. The Kentucky Tax-Free Income Series primarily holds bonds with intermediate maturities. The intermediate portion of the municipal curve outperformed the index as a whole, leading to the outperformance of the Kentucky Tax-Free Income Series against the index. The Kentucky Tax-Free Short-to-Medium Series holds bonds on the shorter end of the curve. These shorter bonds underperformed the index as a whole, leading to the relative underperformance of the Kentucky Tax-Free Short-to-Medium Series against the index.
Like most states, Kentucky’s economy is still recovering from the national recession that ended in June 2009. Fortunately, the losses endured by the state were less severe than most states. The loss of household wealth was somewhat muted in Kentucky since the housing market in the state never really experienced a sharp run-up in home values like occurred in many other jurisdictions. The state’s annual average unemployment rate at the end of the reporting period stood at 9.6 percent compared with the national average of 9.2 percent. In 2010, Kentucky had a per capita personal income of $33,348 (preliminary data) which ranked 44th in the nation.
Kentucky’s economy has historically relied on manufacturing, however, this sector has continued to contract as the economy transitions to a more service-related economy. A number of large automobile manufacturers and related automotive parts companies have located plants in the state. Both the recession and the national disaster in Japan led to a temporary disruption in the production of automobiles and automotive components, but the sector has started to rebound. Kentucky’s abundance of coal has continued to provide stable employment and coal severance tax revenues for the state. The state successfully closed substantial budget deficits in FY 2011 and FY 2012. In fact, FY 2011 closed with a $156.8 million budget surplus, and $121.8 million is scheduled to be deposited into the state’s “rainy day fund.”
The state’s appropriation supported debt was rated Aa3 by Moody’s and A+ by Standard & Poor’s as of June 30, 2011. Kentucky had net tax-supported debt per capita of $1,961 as of calendar year-end 2010 which was substantially above the national net tax-supported debt median of $1,066 (Source: Moody’s Investors Services, Special Comment: “2011 State Debt Medians Report”, June 3, 2011).
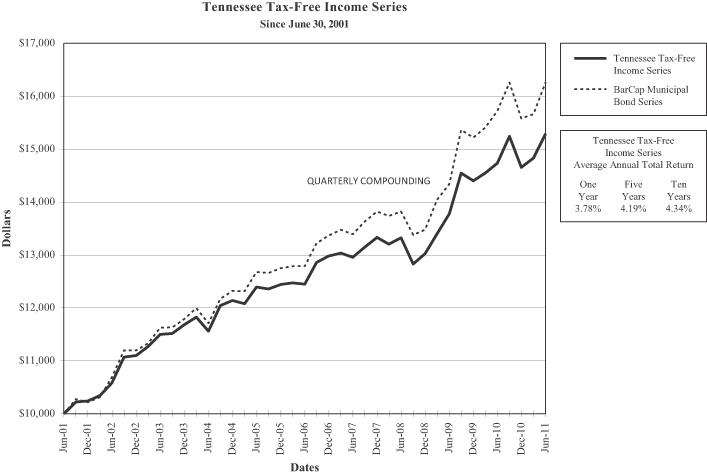
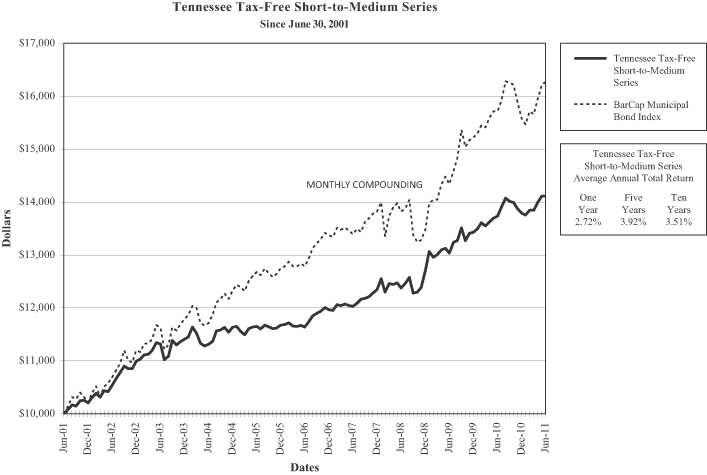
The Tennessee Tax-Free Income Series provided shareholders with a total return of 3.78 percent for the twelve months ended June 30, 2011. The Tennessee Tax-Free Short-to-Medium Series had a total return of 2.72 percent for the period under review. The Tennessee Tax-Free Income Series primarily holds bonds with intermediate maturities. The intermediate portion of the municipal curve outperformed the index as a whole, leading to the outperformance of the Tennessee Tax-Free Income Series against
ii
(Unaudited)
the index. The Tennessee Tax-Free Short-to-Medium Series holds bonds on the shorter end of the curve. These shorter bonds underperformed the index as a whole, leading to the relative underperformance of the Tennessee Tax-Free Short-to-Medium Series against the index.
Tennessee’s economy is on the mend and is slowly but steadily recovering from the national recession. The state experienced a severe contraction in the manufacturing and construction sectors, but both of these sectors have stabilized and are showing signs of growth. The rate of job losses in these two key sectors has slowed down substantially. The education and health services sector has continued to be a bright spot for the state. The state’s unemployment rate at the end of the reporting period was 9.8 percent compared with the national average of 9.2 percent. In 2010, the state had a per capita personal income of $35,307 (preliminary data) which ranked 39th in the nation.
Tennessee relies on a combination of a state sales tax, corporate income taxes, and the Hall income tax for its revenue. The state’s fiscal condition has improved substantially with fifteen consecutive months of year-over-year growth in sales tax revenues. Total tax revenues collected in June 2011 marked the eleventh consecutive month in which total collections exceeded budgeted estimates. However, despite the positive growth trend, tax revenues still remain below pre-recession levels.
Tennessee’s general obligation (G.O.) bonds were rated Aaa by Moody’s and AA+ by Standard & Poor’s as of June 30, 2011. Tennessee had net tax-supported debt per capita of $345 as of calendar year-end 2010 which was substantially below the national net tax-supported debt median of $1,066 (Source: Moody’s Investors Services, Special Comment: 2011 State Debt Medians Report”, June 3, 2011).
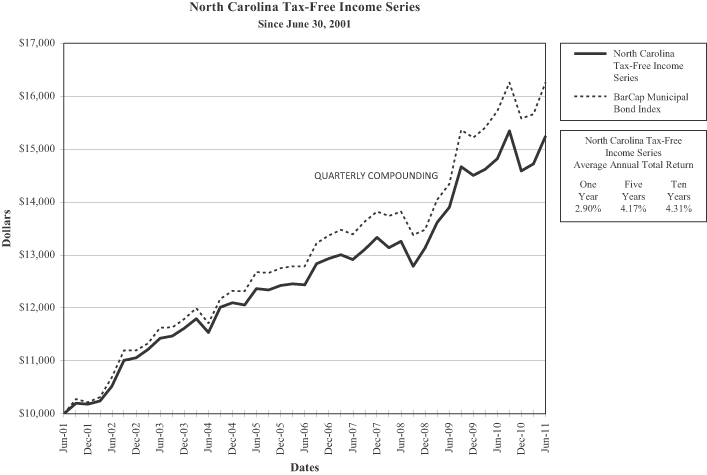
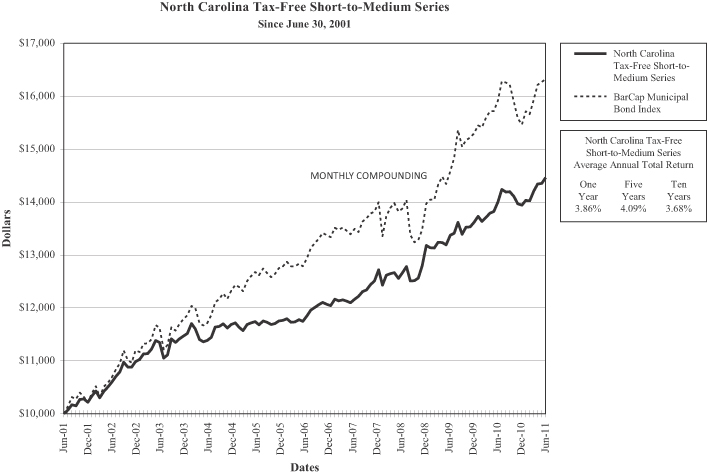
The North Carolina Tax-Free Income Series provided shareholders with a total return of 2.90 percent for the twelve months ended June 30, 2011. The North Carolina Tax-Free Short-to-Medium Series provided shareholders with a total return of 3.86 percent for the period under review. The North Carolina Tax-Free Income Series holds some longer healthcare bonds which underperformed the market last year, leading to the slight underperformance of the North Carolina Tax-Free Income Series against the index. The North Carolina Tax-Free Short-to-Medium Series received significant inflows of new money during the reporting period, most of which was invested in the middle of the period. As the market improved through the second half of reporting period, the bonds purchased rose in value, leading to the outperformance of the fund against the index.
North Carolina’s economy has continued to transition from traditional labor-intensive industries (e.g., textiles, furniture, etc.) to knowledge-based or service-related industries. Ranked by employment size, North Carolina’s four largest industries are: government; healthcare and social assistance; retail trade; and manufacturing. Together, these industries account for more than 55 percent of employment in the state. Employment in the manufacturing sector has continued to decline. The state’s unemployment rate at the end of the reporting period was 9.9 percent compared with the national average of 9.2 percent. In 2010, North Carolina had a per capita personal income of $35,638 (preliminary data) which ranked 35th in the nation. The state recently passed a budget which closed a $2.4 billion budget shortfall for FY 2012.
North Carolina’s G.O. bonds were rated Aaa by Moody’s and AAA by Standard & Poor’s as of June 30, 2011. North Carolina had net tax-supported debt per capita of $782 as of calendar year-end 2010 which was below the national net tax-supported debt median of $1,066 (Source: Moody’s Investors Services, Special Comment: 2011 State Debt Medians Report”, June 3, 2011).
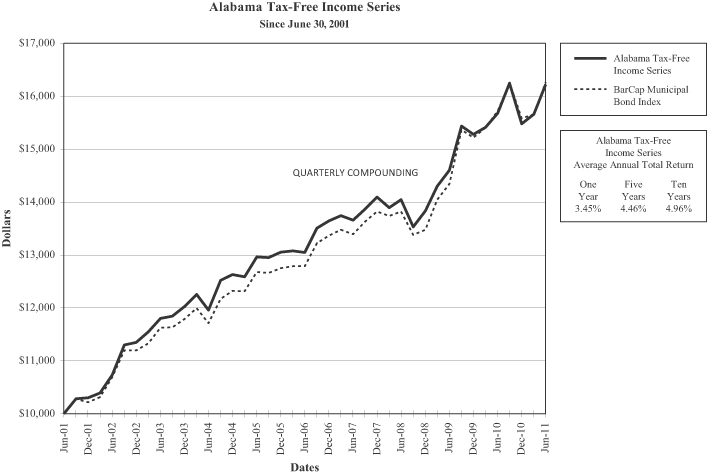
The Alabama Tax-Free Income Series provided shareholders with a total return of 3.45 percent for the twelve months ended June 30, 2011. The Alabama Tax-Free Income Series performed in line with the index during the reporting period.
Alabama’s economy exhibited steady signs of recovery from the national recession during the reporting period. At the beginning of 2010, economic analysts at the University of Alabama predicted a 2.2 percent gain in the state’s GDP but revised their estimate upward to 2.5 percent at midyear. The state’s annual average unemployment rate at the end of the reporting period stood at 9.9 percent compared with the national average of 9.2 percent. In 2010, Alabama had a per capita personal income of $33,945 (preliminary data) which ranked 42nd in the nation.
Alabama is home to a number of large automobile manufacturing plants. The earthquake in Japan negatively impacted car production in the state. However, at the end of the reporting period automobile production levels had mostly recovered. Tourism and aerospace continue to be major industries in the state. International trade produced benefits across the state and the state’s port in Mobile expanded allowing it to become one of the top 10 busiest ports in the United States. The state experienced extensive damage in and around Tuscaloosa in late April which was caused by a tornado which will result in substantial rebuilding costs. Alabama’s G.O. bonds were rated Aa1 by Moody’s and AA by Standard & Poor’s as of June 30, 2011. Alabama had net tax-supported debt per capita of $856 as of calendar year-end 2010 which was lower than the national net tax-supported debt median of $1,066 (Source: Moody’s Investors Services, Special Comment: 2011 State Debt Medians Report”, June 3, 2011).
iii
(Unaudited)
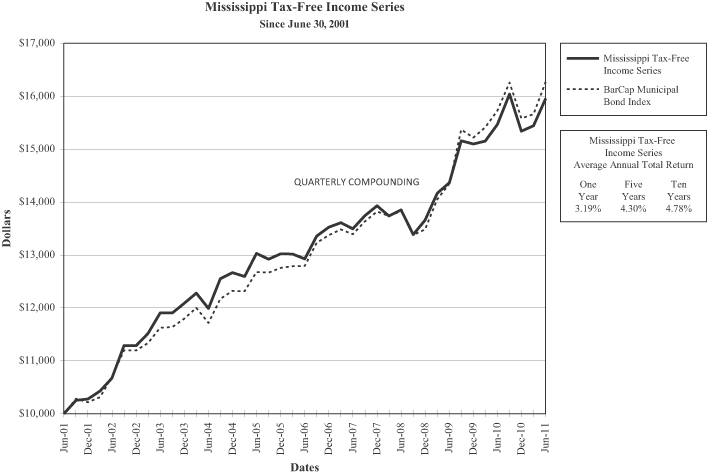
The Mississippi Tax-Free Income Series had a total return of 3.19 percent for the twelve month period ended June 30, 2011. The Mississippi Tax-Free Income Series slightly underperformed the index during the reporting period.
Mississippi’s economy is dominated by manufacturing and service industries which were hit hard by the national recession. Recent economic indicators show that an economic recovery is firmly underway in Mississippi. Retail sales have been rising, job losses are slowing, gaming revenues are improving, and the value of residential building permits issued has stabilized. Several major investment projects and post-Katrina reconstruction are boosting economic activity. Among ongoing projects are a $570 million port upgrade at Gulfport, a $1 billion natural gas pipeline (Spectra Energy and CenterPoint Energy), and a $950 million reconstruction and renovation at Keesler Air Force Base. A new $1.3 billion auto plant (Toyota) in Blue Springs near Tupelo is scheduled to begin production in 2011.
The state’s annual average unemployment rate at the end of the reporting period was 10.3 percent compared with the national average of 9.2 percent. In 2010, Mississippi had a per capita personal income of $31,186 (preliminary data) which ranked last in the nation. The state’s G.O. bonds were rated Aa2 by Moody’s and AA by Standard & Poor’s as of June 30, 2011. Mississippi has net tax-supported debt per capita of $1,534 as of calendar year-end 2010 which was higher than the national net tax-supported debt median of $1,066 (Source: Moody’s Investors Services, Special Comment: 2011 State Debt Medians Report”, June 3, 2011).
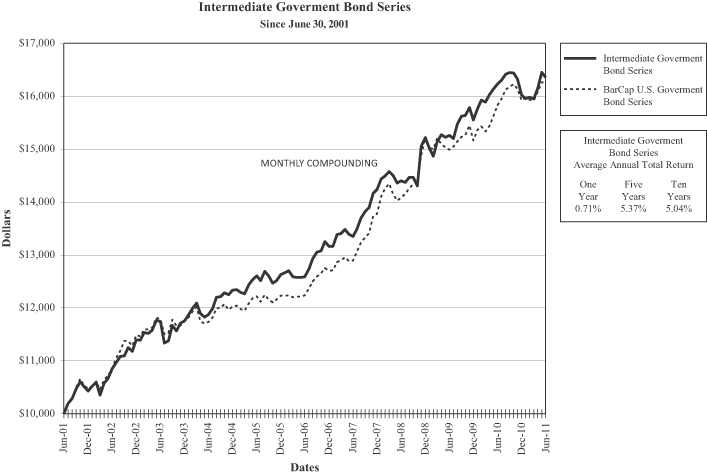
The Intermediate Government Bond Series had a total return of 0.71 percent for the twelve months ended June 30, 2011. The Barclays Capital U.S. Intermediate Government Bond Index had a total return of 2.653 percent for the one year period ended June 30, 2011. The fund slightly underperformed the index during the reporting period. As of 6/30/2011, the Series had a maturity of 9.93 years vs. an average maturity of 4.03 for the index. The bonds in the fund are very concentrated around the 9-10 year maturity mark, while the index tracks a mix of bonds with maturities ranging from 1-10 years. During the reporting period, the best performing part of the government market was 5-7 years, explaining the slight underperformance of the fund against the index.
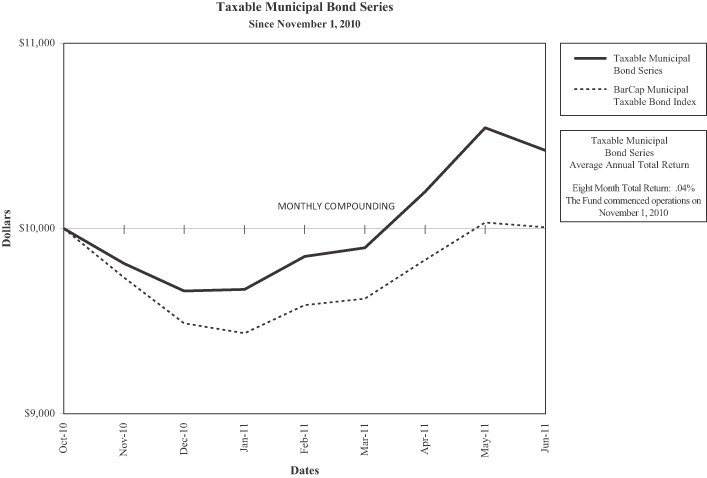
The Taxable Municipal Bond Series had a total return of 0.04 percent for the eight months between fund inception on November 1, 2010 and June 30, 2011. The Barclays Capital Municipal Bond Taxable Index had a total return of 4.275% for the same period. The taxable municipal market declined dramatically in November and December of 2010 due to the non-extension and sunset of the Build America Bond program. The share price of the fund declined more than the index due to the longer average maturity of the Series during that time. Though the fund and the index performed comparably for the remainder of the reporting period, the fund underperformed the index primarily due to the fund’s underperformance in November and December of 2010.
Please note that index information is provided for reference only. No index can perfectly match the investments that make up a fund’s portfolio. In making investment decisions for our portfolios we do not attempt to track indices. The Barclays Capital Municipal Bond index is national in scope and does not necessarily reflect the performance of state-specific municipal bond funds. Indices do not take into account any operating expenses or transaction costs. An investment cannot be made directly in an index.
i Data are from the Bureau of Economic Analysis, the U.S. Department of Labor Bureau of Labor Statistics, and various other sources management deems to be reliable. Some of the quoted data are preliminary in nature and may be subject to revision. Any opinions expressed herein are those of the funds’ portfolio management and are current as of June 30, 2011. They are not guarantees of performance or investment results and should not be taken as investment advice. Past performance is not a guarantee of future performance and you may lose money investing in the funds.
iv
Unaudited
The illustrations below provide each Fund’s sector allocation and
summarize key information about each Fund’s investments.
| | | | |
Kentucky Tax-Free Income Series | |
| CREDIT QUALITY | | % of Net Assets
at Market | |
Aaa/AAA | | | 10.87% | |
Aa/AA | | | 74.98% | |
A | | | 7.48% | |
Baa/BBB | | | 5.53% | |
Not Rated | | | 1.14% | |
| | | | | |
| | | | 100.00% | |
| | | | | |
| COMPOSITION | | | |
| | | % of Net Assets | |
General Obligation | | | 0.13% | |
Prerefunded | | | 4.17% | |
Lease Revenue | | | 9.76% | |
Municipal Utility Revenue | | | 2.75% | |
Hospital and Healthcare Revenue | | | 3.45% | |
State and Local Mortgage Revenue | | | 4.04% | |
University Consolidated Education and Building Revenue | | | 0.89% | |
Turnpikes and Toll Roads Revenue | | | 4.59% | |
Public Facilities Revenue | | | 1.07% | |
Insured Municipal | | | 64.48% | |
Escrowed to Maturity | | | 4.30% | |
Other Assets Less Liabilities | | | 0.37% | |
| | | | | |
| | | | 100.00% | |
| | | | | |
| | | | |
Kentucky Tax-Free Short-to-Medium Series | |
| CREDIT QUALITY | | % of Net Assets
at Market | |
Aaa/AAA | | | 17.58% | |
Aa/AA | | | 77.03% | |
A | | | 3.99% | |
Baa/BBB | | | 1.40% | |
Not Rated | | | 0.00% | |
| | | | | |
| | | | 100.00% | |
| | | | | |
| COMPOSITION | | | |
| | | % of Net Assets | |
Prerefunded | | | 1.38% | |
Certificates of Participation | | | 1.07% | |
Lease Revenue | | | 13.94% | |
Municipal Utility Revenue | | | 3.11% | |
Hospital and Healthcare Revenue | | | 2.49% | |
State and Local Mortgage Revenue | | | 3.17% | |
Turnpikes and Toll Roads Revenue | | | 2.36% | |
Insured Municipal | | | 70.98% | |
Other Assets Less Liabilities | | | 1.50% | |
| | | | | |
| | | | 100.00% | |
| | | | | |
| | | | |
Alabama Tax-Free Income Series | |
| CREDIT QUALITY | | % of Net Assets
at Market | |
Aaa/AAA | | | 6.58% | |
Aa/AA | | | 67.81% | |
A | | | 17.00% | |
Baa/BBB | | | 1.21% | |
Not Rated | | | 7.40% | |
| | | | | |
| | | | 100.00% | |
| | | | | |
| COMPOSITION | | | |
| | | % of Net Assets | |
General Obligation | | | 8.60% | |
Lease Revenue | | | 1.82% | |
Municipal Utility Revenue | | | 4.72% | |
Industrial Revenue | | | 0.48% | |
University Consolidated Education and Building Revenue | | | 5.98% | |
Public Facilities Revenue | | | 0.48% | |
Insured Municipal | | | 72.54% | |
Escrowed to Maturity | | | 1.52% | |
Other Assets Less Liabilities | | | 3.86% | |
| | | | | |
| | | | 100.00% | |
| | | | | |
| | | | |
Mississippi Tax-Free Income Series | |
| CREDIT QUALITY | | % of Net Assets
at Market | |
Aaa/AAA | | | 14.45% | |
Aa/AA | | | 56.13% | |
A | | | 18.30% | |
Baa/BBB | | | 3.23% | |
Not Rated | | | 7.89% | |
| | | | | |
| | | | 100.00% | |
| | | | | |
| COMPOSITION | | | |
| | | % of Net Assets | |
General Obligation | | | 1.58% | |
Prerefunded | | | 0.25% | |
Lease Revenue | | | 3.59% | |
University Consolidated Education and Building Revenue | | | 8.41% | |
Public Facilities Revenue | | | 4.83% | |
Insured Municipal | | | 79.34% | |
Escrowed to Maturity | | | 0.60% | |
Other Assets Less Liabilities | | | 1.40% | |
| | | | | |
| | | | 100.00% | |
| | | | | |
v
Unaudited
The illustrations below provide each Fund’s sector allocation and summarize key information about each Fund’s investments.
| | | | |
Tennessee Tax-Free Income Series | |
| CREDIT QUALITY | | % of Net Assets
at Market | |
Aaa/AAA | | | 2.49% | |
Aa/AA | | | 70.12% | |
A | | | 19.17% | |
Baa/BBB | | | 4.79% | |
Not Rated | | | 3.43% | |
| | | | | |
| | | | 100.00% | |
| | | | | |
| COMPOSITION | | | |
| | | % of Net Assets | |
Prerefunded | | | 2.85% | |
General Obligation | | | 6.92% | |
Lease Revenue | | | 2.36% | |
Municipal Utility Revenue | | | 6.40% | |
Hospital and Healthcare Revenue | | | 6.93% | |
State and Local Mortgage Revenue | | | 7.42% | |
University Consolidated Education and Building Revenue | | | 9.87% | |
Public Facilities Revenue | | | 0.57% | |
Insured Municipal | | | 52.77% | |
Escrowed to Maturity | | | 2.39% | |
Other Assets Less Liabilities | | | 1.52% | |
| | | | | |
| | | | 100.00% | |
| | | | | |
| | | | |
Tennessee Tax-Free Short-to-Medium Series | |
| CREDIT QUALITY | | % of Net Assets
at Market | |
Aaa/AAA | | | 22.37% | |
Aa/AA | | | 65.46% | |
A | | | 9.46% | |
Baa/BBB | | | 2.71% | |
Not Rated | | | 0.00% | |
| | | | | |
| | | | 100.00% | |
| | | | | |
| COMPOSITION | | | |
| | | % of Net Assets | |
| Prerefunded | | 3.35% | |
General Obligation | | | 10.52% | |
Lease Revenue | | | 7.16% | |
Municipal Utility Revenue | | | 3.91% | |
Hospital and Healthcare Revenue | | | 1.02% | |
Public Facilities Revenue | | | 3.58% | |
State and Local Mortgage Revenue | | | 5.62% | |
Insured Municipal | | | 61.65% | |
Other Assets Less Liabilities | | | 3.19% | |
| | | | | |
| | | | 100.00% | |
| | | | | |
| | | | |
North Carolina Tax-Free Income Series | |
| CREDIT QUALITY | | % of Net Assets
at Market | |
Aaa/AAA | | | 4.85% | |
Aa/AA | | | 72.53% | |
A | | | 20.27% | |
Baa/BBB | | | 1.68% | |
Not Rated | | | 0.67% | |
| | | | | |
| | | | 100.00% | |
| | | | | |
| COMPOSITION | | | |
| | | % of Net Assets | |
Prerefunded | | | 1.37% | |
General Obligation | | | 2.88% | |
Certificates of Participation | | | 15.57% | |
Lease Revenue | | | 3.52% | |
Municipal Utility Revenue | | | 5.08% | |
Hospital and Healthcare Revenue | | | 7.84% | |
State and Local Mortgage Revenue | | | 0.13% | |
University Consolidated Education and Building Revenue | | | 5.29% | |
Public Facilities Revenue | | | 6.71% | |
Insured Municipal | | | 50.05% | |
Other Assets Less Liabilities | | | 1.56% | |
| | | | | |
| | | | 100.00% | |
| | | | | |
| | | | |
North Carolina Tax-Free Short-to-Medium Series | |
| CREDIT QUALITY | | % of Net Assets
at Market | |
Aaa/AAA | | | 23.81% | |
Aa/AA | | | 51.48% | |
A | | | 22.79% | |
Baa/BBB | | | 0.05% | |
Not Rated | | | 1.87% | |
| | | | | |
| | | | 100.00% | |
| | | | | |
| COMPOSITION | | | |
| | | % of Net Assets | |
Prerefunded | | | 1.36% | |
General Obligation | | | 1.23% | |
Certificates of Participation | | | 17.87% | |
Lease Revenue | | | 2.47% | |
Municipal Utility Revenue | | | 8.58% | |
Hospital and Healthcare Revenue | | | 3.44% | |
State and Local Mortgage Revenue | | | 1.16% | |
University Consolidated Education and Building Revenue | | | 3.21% | |
Public Facilities Revenue | | | 3.78% | |
Insured Municipal | | | 55.75% | |
Other Assets Less Liabilities | | | 1.15% | |
| | | | | |
| | | | 100.00% | |
| | | | | |
vi
Unaudited
The illustrations below provide each Fund’s sector allocation and summarize key information about each Fund’s investments.
| | | | |
Intermediate Government Bond Series | |
| CREDIT QUALITY | | % of Net Assets
at Market | |
Aaa/AAA | | | 100.00% | |
| | | | | |
| COMPOSITION | | | |
| | | % of Net Assets | |
Federal Farm Credit | | | 59.08% | |
Federal Home Loan Bank | | | 29.38% | |
Federal Home Loan Mortgage | | | 5.40% | |
Student Loan Marketing Association | | | 4.30% | |
Other Assets Less Liabilities | | | 1.84% | |
| | | | | |
| | | | 100.00% | |
| | | | | |
| | | | |
Taxable Municipal Bond Series | |
| CREDIT QUALITY | | % of Net Assets
at Market | |
Aaa/AAA | | | 2.40% | |
Aa/AA | | | 91.53% | |
A | | | 6.07% | |
| | | | | |
| | | | 100.00% | |
| | | | | |
| COMPOSITION | | | |
| | | % of Net Assets | |
General Obligation | | | 18.35% | |
Certificates of Participation | | | 20.85% | |
Lease Revenue | | | 14.74% | |
Municipal Utility Revenue | | | 14.47% | |
University Consolidated Education and Building Revenue | | | 4.30% | |
Turnpike Road Revenue | | | 2.82% | |
Insured Municipal | | | 22.17% | |
Other Assets Less Liabilities | | | 2.30% | |
| | | | | |
| | | | 100.00% | |
| | | | | |
vii
PERFORMANCE COMPARISON (Unaudited)
The following graphs compare the change in value of a $10,000 investment in each series of Dupree Mutual Funds with the change in value of a $10,000 investment in a comparable index. The comparisons are made over 10 years or since inception of the series, if shorter than ten years. Results are for the fiscal years ended June 30.
viii
Unaudited
ix
Unaudited
x
Unaudited
xi
Unaudited
xii
Unaudited
xiii
Unaudited
xiv
Unaudited
xv
Unaudited
xvi
Unaudited
xvii
Unaudited
xviii
Notes on Graphs:
Results reflect reinvestment of all dividend and capital gain distributions. No index can perfectly match the investments that make up a fund’s portfolio. For each series, we have chosen a benchmark that we believe gives the most accurate comparison of how the series performed during the reporting period. The investor should understand that an index is a mathematical hypothesis and does not reflect a real market situation. For example, the portfolio of each index is replaced with an entirely different portfolio each year without reflecting operating expenses or transaction costs, an impossibility in reality. On the other hand, the fund’s performance reflects not only these factors but management costs as well. Past performance is not indicative of future results.
The performance tables and the graphs above do not reflect the deduction of taxes that a shareholder would pay on fund distributions or the redemption of fund shares.
xix
DUPREE MUTUAL FUNDS — ALABAMA TAX-FREE INCOME SERIES | |
SCHEDULE OF PORTFOLIO INVESTMENTS
Alabama Municipal Bonds — 100%
June 30, 2011
| | | | | | | | | | | | | | | | | | |
| Bond Description | | Coupon | | | Maturity Date | | | Rating# | | Par Value | | | Fair Value | |
| | | | | | | | | | | | | | | | | | |
| | | | | | | | | | | | | | | | | | |
| INSURED MUNICIPAL BONDS | | | | | | | | | | | | | | | | | | |
| 72.54% of Net Assets | | | | | | | | | | | | | | | | | | |
AL Drinking Water Finance Authority Revolving Fund Loan | | | 4.750 | % | | | 08/15/2027 | | | NR | | $ | 75,000 | | | $ | 74,745 | |
AL Housing Finance Authority Single Family Mortgage Revenue | | | 5.375 | | | | 10/01/2033 | | | Aaa | | | 195,000 | | | | 200,142 | |
AL Private College & Universities Facilities Authority Revenue | | | 4.750 | | | | 09/01/2026 | | | AA+* | | | 500,000 | | | | 495,170 | |
AL State Board Education Bishop State Community College | | | 4.600 | | | | 01/01/2021 | | | A1 | | | 100,000 | | | | 101,435 | |
AL State Board of Education Revenue Calhoun Community | | | 5.000 | | | | 05/01/2022 | | | A1 | | | 450,000 | | | | 467,055 | |
AL State University Revenue General Tuition & Fee — Series A | | | 5.000 | | | | 01/01/2019 | | | A2/A* | | | 50,000 | | | | 51,193 | |
AL State University Revenue General Tuition and Fee | | | 5.000 | | | | 08/01/2026 | | | A2/A* | | | 150,000 | | | | 153,506 | |
AL State University Revenue General Tuition and Fee | | | 5.250 | | | | 09/01/2034 | | | Aa3/AA+* | | | 75,000 | | | | 77,510 | |
AL Water Pollution Control Authority Revolving Fund Loan | | | 4.800 | | | | 08/15/2018 | | | NR | | | 50,000 | | | | 50,335 | |
AL Water Pollution Control Authority Revolving Fund Loan | | | 4.800 | | | | 08/15/2022 | | | NR | | | 170,000 | | | | 167,115 | |
AL Water Pollution Control Authority Revolving Fund Loan | | | 5.000 | | | | 08/15/2026 | | | NR | | | 130,000 | | | | 126,628 | |
Albertville AL Warrants | | | 5.000 | | | | 02/01/2035 | | | AA+* | | | 110,000 | | | | 114,501 | |
Alexander City AL Warrants | | | 4.700 | | | | 05/01/2021 | | | Baa1/A* | | | 200,000 | | | | 204,080 | |
Auburn AL Capital Improvement School Warrants | | | 5.000 | | | | 08/01/2030 | | | Aa2/AA+* | | | 260,000 | | | | 268,120 | |
Auburn University AL General Fee Revenue — Series A | | | 5.000 | | | | 06/01/2032 | | | Aa2/AA+* | | | 45,000 | | | | 46,121 | |
Auburn University AL General Fee Revenue — Series A | | | 5.000 | | | | 06/01/2027 | | | Aa2/AA+* | | | 300,000 | | | | 315,663 | |
Auburn University AL General Fee Revenue — Series A | | | 5.000 | | | | 06/01/2033 | | | Aa2/AA+* | | | 420,000 | | | | 430,571 | |
Auburn University AL General Fee Revenue — Series A | | | 5.000 | | | | 06/01/2038 | | | Aa2/AA+* | | | 600,000 | | | | 610,422 | |
Baldwin County AL Water and Sewer Series A General Obligation | | | 5.000 | | | | 01/01/2025 | | | Aa1/AA+* | | | 295,000 | | | | 310,647 | |
Bessemer AL Public Educational Building Authority Revenue | | | 5.000 | | | | 07/01/2030 | | | AA+* | | | 250,000 | | | | 260,295 | |
Chatom AL Industrial Board Gulf Opportunity Zone | | | 5.000 | | | | 08/01/2037 | | | Aa3/AA+*/A-@ | | | 150,000 | | | | 151,191 | |
Choctaw County AL Revenue School Warrants | | | 4.700 | | | | 03/01/2017 | | | NR | | | 200,000 | | | | 184,744 | |
Cullman AL Utility Board Water Revenue | | | 4.750 | | | | 09/01/2037 | | | Aa3/AA+* | | | 150,000 | | | | 145,188 | |
Cullman County AL Water Revenue | | | 5.000 | | | | 05/01/2021 | | | Baa1/A+* | | | 125,000 | | | | 131,165 | |
Daphne AL Warrants | | | 5.000 | | | | 04/01/2023 | | | Aa2/AA* | | | 250,000 | | | | 263,140 | |
Elmore County AL Limited Obligation School Warrants | | | 5.000 | | | | 02/01/2022 | | | Aa3/AA+* | | | 190,000 | | | | 200,505 | |
Elmore County AL Public Education Cooperative | | | 5.000 | | | | 08/01/2032 | | | Aa3 | | | 50,000 | | | | 49,356 | |
Enterprise AL Water General Obligation | | | 5.000 | | | | 10/01/2019 | | | NR | | | 55,000 | | | | 57,375 | |
Enterprise AL Water General Obligation | | | 5.000 | | | | 10/01/2023 | | | NR | | | 450,000 | | | | 462,186 | |
Gadsden AL Warrants — Series B | | | 4.600 | | | | 08/01/2022 | | | NR | | | 100,000 | | | | 101,664 | |
Hoover AL Board of Education Capital Outlay Warrants | | | 4.750 | | | | 02/15/2024 | | | Aa2/AA+* | | | 250,000 | | | | 261,323 | |
Huntsville AL Health Care Authority — Series A | | | 5.000 | | | | 06/01/2024 | | | A1/BBB* | | | 100,000 | | | | 100,987 | |
Huntsville AL Public Building Authority Lease Revenue | | | 5.000 | | | | 10/01/2027 | | | Aa1/AA+* | | | 375,000 | | | | 389,779 | |
Huntsville AL Public Building Authority Lease Revenue | | | 5.000 | | | | 10/01/2033 | | | Aa1/AA+* | | | 175,000 | | | | 177,254 | |
Huntsville AL Water Systems Revenue | | | 5.000 | | | | 11/01/2033 | | | Aa1/AAA* | | | 300,000 | | | | 309,615 | |
Jacksonville AL State University Revenue Tuition and Fee | | | 5.125 | | | | 12/01/2033 | | | AA+* | | | 450,000 | | | | 454,541 | |
Lee County AL School Warrants Limited Obligation | | | 5.000 | | | | 02/01/2021 | | | Aa2 | | | 75,000 | | | | 77,257 | |
Limestone County AL Water & Sewer Authority Water Revenue | | | 5.000 | | | | 12/01/2029 | | | A+* | | | 275,000 | | | | 275,322 | |
Linden AL Warrants | | | 5.250 | | | | 06/01/2023 | | | NR | | | 25,000 | | | | 25,209 | |
Lowndes County AL Warrants | | | 5.250 | | | | 02/01/2037 | | | Aa3/AA+* | | | 250,000 | | | | 243,803 | |
Madison County AL Board of Education Capital Outlay Tax | | | 4.950 | | | | 09/01/2025 | | | Aa3/AA+* | | | 100,000 | | | | 105,482 | |
Madison County AL Board of Education Capital Outlay Tax | | | 5.100 | | | | 09/01/2028 | | | Aa3/AA+* | | | 285,000 | | | | 298,384 | |
Madison County AL Board of Education Capital Outlay Tax | | | 5.125 | | | | 09/01/2034 | | | Aa3/AA+* | | | 505,000 | | | | 512,676 | |
Mobile AL Limited Obligation Tax Warrants | | | 5.500 | | | | 02/15/2023 | | | Ba2 | | | 35,000 | | | | 33,407 | |
Mobile AL Public Education Building Authority | | | 5.000 | | | | 03/01/2033 | | | Aa3/AA+*/AA-@ | | | 200,000 | | | | 203,502 | |
Montgomery AL Waterworks & Sanitation Sewer Board Revenue | | | 5.000 | | | | 03/01/2025 | | | Aa2/AAA* | | | 250,000 | | | | 262,533 | |
Montgomery County AL Warrants | | | 5.000 | | | | 03/01/2028 | | | Aa1/AA* | | | 175,000 | | | | 184,151 | |
Montgomery County AL Public Building Authority Revenue | | | 5.000 | | | | 03/01/2031 | | | Aa2/AA-* | | | 175,000 | | | | 178,120 | |
Morgan County AL Water and Sewer General Obligation Warrants | | | 5.000 | | | | 04/01/2028 | | | Aa3 | | | 100,000 | | | | 101,351 | |
Morgan County AL Warrants | | | 5.000 | | | | 04/01/2029 | | | Aa3 | | | 25,000 | | | | 25,267 | |
Muscle Shoals AL Refunded Warrants | | | 4.600 | | | | 08/01/2024 | | | Aa3 | | | 250,000 | | | | 254,305 | |
North Marshall AL Utilities Board Water Revenue | | | 5.100 | | | | 10/01/2030 | | | AA+* | | | 375,000 | | | | 388,530 | |
Opelika AL Water Board Revenue | | | 5.000 | | | | 06/01/2037 | | | Aa3/AA+* | | | 250,000 | | | | 253,940 | |
Phenix City AL Schools Warrants — Series B | | | 5.000 | | | | 08/01/2024 | | | A+* | | | 200,000 | | | | 210,426 | |
Phenix City AL Water & Sewer Revenue | | | 5.000 | | | | 08/15/2034 | | | Aa3/AA+*/AA-@ | | | 40,000 | | | | 40,800 | |
Roanoke AL Warrants | | | 4.450 | | | | 05/01/2020 | | | NR | | | 150,000 | | | | 151,404 | |
The accompanying footnotes are an integral part of the financial statements.
1
DUPREE MUTUAL FUNDS — ALABAMA TAX-FREE INCOME SERIES | |
SCHEDULE OF PORTFOLIO INVESTMENTS
Alabama Municipal Bonds — 100%
June 30, 2011
| | | | | | | | | | | | | | | | | | |
| Bond Description | | Coupon | | | Maturity Date | | | Rating# | | Par Value | | | Fair Value | |
| | | | | | | | | | | | | | | | | | |
St Clair County AL Board Education School Tax Warrants | | | 4.400 | % | | | 02/01/2022 | | | Aa3/AA+* | | $ | 50,000 | | | $ | 50,966 | |
Shelby County AL Board of Education Special Tax School Warrants | | | 5.000 | | | | 02/01/2025 | | | Aa3/A+* | | | 300,000 | | | | 308,391 | |
Talladega County AL Industrial Development Revenue | | | 4.700 | | | | 01/01/2022 | | | Baa3 | | | 100,000 | | | | 91,290 | |
Troy AL Public Educational Building Authority Educational | | | 5.250 | | | | 12/01/2036 | | | Aa3/AA+* | | | 225,000 | | | | 229,853 | |
Trussville AL Warrants | | | 4.800 | | | | 10/01/2021 | | | Aa2 | | | 85,000 | | | | 87,269 | |
Tuscaloosa AL Warrants | | | 5.000 | | | | 01/01/2030 | | | Aa1/AA+* | | | 150,000 | | | | 153,969 | |
Tuscaloosa AL Public Education Building Authority Student | | | 6.375 | | | | 07/01/2028 | | | AA+* | | | 250,000 | | | | 279,958 | |
Tuscaloosa AL Public Education Building Authority Student | | | 6.750 | | | | 07/01/2033 | | | AA+* | | | 475,000 | | | | 529,240 | |
University of AL General Revenue — Series A | | | 5.000 | | | | 07/01/2032 | | | Aa2/AA-*/AA@ | | | 500,000 | | | | 511,535 | |
University of AL General Revenue — Series A | | | 5.000 | | | | 07/01/2034 | | | Aa2/AA-*/AA@ | | | 350,000 | | | | 353,787 | |
University of AL General Revenue — Series A | | | 5.000 | | | | 07/01/2028 | | | Aa2/AA-*/AA@ | | | 325,000 | | | | 338,100 | |
University South AL University Revenues Refunding Tuition | | | 5.000 | | | | 12/01/2029 | | | Aa1/AA+* | | | 105,000 | | | | 108,054 | |
University of Southern AL University Revenues Facilities | | | 5.000 | | | | 08/01/2029 | | | Aa1/AA+* | | | 550,000 | | | | 570,218 | |
| | | | | | | | | | | | | | | | | | |
| | | | | | | | | | | | | | | | | 15,403,766 | |
| GENERAL OBLIGATION BONDS | | | | | | | | | | | | | | | |
| 8.60% of Net Assets | | | | | | | | | | | | | | | |
AL State — Series A | | | 4.625 | | | | 09/01/2022 | | | Aa1/AA* | | | 100,000 | | | | 103,404 | |
Mobile AL Refunding Warrants — Series A | | | 5.000 | | | | 02/15/2027 | | | Aa2/AA-* | | | 335,000 | | | | 352,537 | |
Montgomery AL Warrants — Series A | | | 5.000 | | | | 02/01/2030 | | | Aa1/AA+* | | | 300,000 | | | | 316,251 | |
Montgomery AL Warrants — Series C General Obligation Unlimited | | | 5.000 | | | | 01/01/2023 | | | Aa1/AA+*/AAA@ | | | 580,000 | | | | 620,438 | |
Sumter County AL Limited Obligation School Warrants | | | 5.100 | | | | 02/01/2034 | | | A* | | | 100,000 | | | | 98,414 | |
Tuscaloosa AL Warrants — Series A | | | 5.000 | | | | 10/15/2034 | | | Aa1/AA+* | | | 175,000 | | | | 179,958 | |
Tuscaloosa AL Warrants — Series A | | | 5.125 | | | | 01/01/2039 | | | Aa1/AA+* | | | 150,000 | | | | 154,374 | |
| | | | | | | | | | | | | | | | | | |
| | | | | | | | | | | | | | | | | 1,825,376 | |
| UNIVERSITY CONSOLIDATED EDUCATION AND BUILDING REVENUE BONDS | | | | | |
| 5.98% of Net Assets | | | | | | | | | | | | | | | |
AL State Public School & College Authority Captial Improvement | | | 5.000 | | | | 12/01/2024 | | | Aa1/AA* | | | 250,000 | | | | 269,893 | |
AL State Public School & College Authority Captial Improvement | | | 5.000 | | | | 12/01/2025 | | | Aa1/AA* | | | 640,000 | | | | 685,626 | |
AL State Public Schools & College Authority Refinancing | | | 5.000 | | | | 05/01/2024 | | | Aa1/AA*/AA+@ | | | 125,000 | | | | 136,850 | |
Auburn University AL General Fee Revenue | | | 5.000 | | | | 06/01/2022 | | | Aa2/AA-* | | | 50,000 | | | | 55,186 | |
Mobile AL Spring Hill College Educational Building | | | 5.100 | | | | 09/01/2019 | | | Ba2 | | | 120,000 | | | | 122,299 | |
| | | | | | | | | | | | | | | | | | |
| | | | | | | | | | | | | | | | | 1,269,854 | |
| MUNICIPAL UTILITY REVENUE BONDS | | | | | | | | | | | | | | | |
| 4.72% of Net Assets | | | | | | | | | | | | | | | |
Jasper AL Water Works and Sewer Board Utility Revenue | | | 5.000 | | | | 06/01/2030 | | | A+* | | | 455,000 | | | | 469,182 | |
Muscle Shoals AL Utilities Board Water & Sewer Revenue | | | 5.750 | | | | 12/01/2033 | | | AA-* | | | 430,000 | | | | 459,653 | |
Opelika AL Water Board Revenue | | | 5.250 | | | | 06/01/2036 | | | Aa3/A+* | | | 70,000 | | | | 72,569 | |
| | | | | | | | | | | | | | | | | | |
| | | | | | | | | | | | | | | | | 1,001,404 | |
| LEASE REVENUE BONDS | | | | | | | | | | | | | | | |
| 1.82% of Net Assets | | | | | | | | | | | | | | | |
AL Incentives Financing Authority Special Obligation | | | 5.000 | | | | 09/01/2029 | | | AA+* | | | 125,000 | | | | 129,398 | |
University of Alabama General Revenue — Series A | | | 5.000 | | | | 07/01/2034 | | | Aa2/AA-* | | | 250,000 | | | | 257,740 | |
| | | | | | | | | | | | | | | | | | |
| | | | | | | | | | | | | | | | | 387,138 | |
| ESCROWED TO MATURITY BONDS | | | | | | | | | | | | | | | |
| 1.52% of Net Assets | | | | | | | | | | | | | | | |
West Morgan — East Lawrence Water Authority AL Water Revenue | | | 5.000 | | | | 08/15/2025 | | | Aa3/AA+* | | | 300,000 | | | | 323,802 | |
| | | | | | | | | | | | | | | | | | |
| | | | | | | | | | | | | | | | | 323,802 | |
| PUBLIC FACILITIES REVENUE BONDS | | | | | | | | | | | | | | | |
| .48% of Net Assets | | | | | | | | | | | | | | | |
Rockford AL Public Building Authority Building Revenue | | | 5.750 | | | | 09/01/2015 | | | NR | | | 10,000 | | | | 10,015 | |
Sumter County AL Limited Obligation School Warrants | | | 5.200 | | | | 02/01/2039 | | | A* | | | 95,000 | | | | 92,819 | |
| | | | | | | | | | | | | | | | | | |
| | | | | | | | | | | | | | | | | 102,834 | |
The accompanying footnotes are an integral part of the financial statements.
2
DUPREE MUTUAL FUNDS — ALABAMA TAX-FREE INCOME SERIES | |
SCHEDULE OF PORTFOLIO INVESTMENTS
Alabama Municipal Bonds — 100%
June 30, 2011
| | | | | | | | | | | | | | | | | | |
| Bond Description | | Coupon | | | Maturity Date | | | Rating# | | Par Value | | | Fair Value | |
| | | | | | | | | | | | | | | | | | |
| INDUSTRIAL REVENUE BONDS | | | | | | | | | | | | | | | |
| .48% of Net Assets | | | | | | | | | | | | | | | |
Auburn AL Industrial Development Board Facilities Revenue | | | 5.800 | % | | | 11/01/2011 | | | A+* | | $ | 75,000 | | | $ | 75,793 | |
Auburn AL Industrial Development Board Facilities Revenue | | | 6.200 | | | | 11/01/2020 | | | A+* | | | 25,000 | | | | 25,074 | |
| | | | | | | | | | | | | | | | | | |
| | | | | | | | | | | | | | | | | 100,867 | |
| | | | | | | | | | | | | | | | | | |
Total Investments (cost $20,241,821)(See (a) below for further explanation) 96.14% of Net Assets | | | | | | | | | $ | 20,415,041 | |
| | | | | | | | | | | | | | | | | | |
| | * | | Standard and Poor’s Corporation |
| | @ | | Fitch’s Investors Service |
| | | | (All other ratings by Moody’s Investors Service, Inc.) |
| | # | | Bond ratings are unaudited and not covered by Report of Independent Registered Public Accounting Firm. |
| (a) | | Represents cost for financial reporting and federal income tax purposes and differs from market value by net unrealized appreciation of securities as follows: |
| | | | | | |
| | | | | | |
| | Unrealized appreciation | | $ | 289,479 | |
| | Unrealized depreciation | | | (116,259 | ) |
| | | | | | |
| | Net unrealized appreciation | | $ | 173,220 | |
| | | | | | |
Other Information
The following is a summary of the inputs used, as of June 30, 2011, involving the Fund’s assets and liabilities carried at fair value. The inputs or methodology used for valuing securities may not be an indication of the risk associated with investing in those securities. For more information on valuation inputs, and their aggregation into the levels used in the the table below, please refer to the Security Valuation section in the accompanying Notes to Financial Statements.
| | | | | | |
| | | Valuation Inputs | | Municipal Bonds | |
| | | | | | |
Level 1 | | Quoted Prices | | $ | — | |
Level 2 | | Other Significant Observable Inputs | | | 20,415,041 | |
Level 3 | | Significant Unobservable Inputs | | | — | |
| | | | | | |
| | | | $ | 20,415,041 | |
| | | | | | |
The accompanying footnotes are an integral part of the financial statements.
3
ALABAMA TAX-FREE INCOME SERIES
STATEMENT OF ASSETS AND LIABILITIES
June 30, 2011
| | | | | | | | |
ASSETS: | | | | | | | | |
Investments in securities, at fair value (Cost: $20,241,821) | | | | | | $ | 20,415,041 | |
Cash | | | | | | | 632,770 | |
Interest receivable | | | | | | | 292,698 | |
Prepaid expenses | | | | | | | 407 | |
| | | | | | | | |
Total assets | | | | | | | 21,340,916 | |
LIABILITIES: | | | | | | | | |
Payable for: | | | | | | | | |
Distributions to shareholders | | | 81,923 | | | | | |
Fund shares redeemed | | | 2,294 | | | | | |
Investment advisory fee | | | 6,315 | | | | | |
Transfer agent fee | | | 852 | | | | | |
Accrued expenses | | | 14,982 | | | | | |
| | | | | | | | |
Total liabilities | | | | | | | 106,366 | |
| | | | | | | | |
NET ASSETS: | | | | | | | | |
Capital | | | | | | | 21,098,374 | |
Net accumulated realized loss on investment transactions | | | | | | | (37,044 | ) |
Net unrealized appreciation in value of investments | | | | | | | 173,220 | |
| | | | | | | | |
Net assets at value | | | | | | $ | 21,234,550 | |
| | | | | | | | |
NET ASSET VALUE, offering price and redemption price per share
($21,234,550 ÷ 1,812,126 shares outstanding; unlimited number of shares authorized; no par value) | | | | | | $ | 11.72 | |
| | | | | | | | |
STATEMENT OF OPERATIONS
For the year ended June 30, 2011
| | | | |
Net investment income: | | | | |
Interest income | | $ | 895,128 | |
| | | | |
Expenses: | | | | |
Investment advisory fee | | | 101,210 | |
Transfer agent fee | | | 30,239 | |
Custodian expense | | | 3,190 | |
Professional fees | | | 4,943 | |
Trustee fees | | | 2,540 | |
Other expenses | | | 14,873 | |
| | | | |
Total expenses | | | 156,995 | |
Fees waived by Adviser | | | (36,211 | ) |
Custodian expense reduction | | | (202 | ) |
| | | | |
Net expenses | | | 120,582 | |
| | | | |
Net investment income | | | 774,546 | |
| | | | |
Realized and unrealized gain/(loss) on investments: | | | | |
Net realized gain | | | 29,066 | |
Net change in unrealized appreciation/depreciation | | | (138,138 | ) |
| | | | |
Net realized and unrealized loss on investments | | | (109,072 | ) |
| | | | |
Net increase in net assets resulting from operations | | $ | 665,474 | |
| | | | |
The accompanying notes are an integral part of the financial statements.
4
ALABAMA TAX-FREE INCOME SERIES
STATEMENTS OF CHANGES IN NET ASSETS
For the years ended June 30, 2011 and 2010
| | | | | | | | |
| | | 2011 | | | 2010 | |
Operations: | | | | | | | | |
Net investment income | | $ | 774,546 | | | $ | 656,017 | |
Net realized gain on investments | | | 29,066 | | | | 20,127 | |
Net change in unrealized appreciation/depreciation | | | (138,138 | ) | | | 470,753 | |
| | | | | | | | |
Net increase in net assets resulting from operations | | | 665,474 | | | | 1,146,897 | |
Distributions from net investment income | | | (774,546 | ) | | | (656,017 | ) |
Net fund share transactions (Note 4) | | | 1,490,590 | | | | 5,100,485 | |
| | | | | | | | |
Total increase | | | 1,381,518 | | | | 5,591,365 | |
Net assets: | | | | | | | | |
Beginning of year | | | 19,853,032 | | | | 14,261,667 | |
| | | | | | | | |
End of year | | $ | 21,234,550 | | | $ | 19,853,032 | |
| | | | | | | | |
FINANCIAL HIGHLIGHTS
| | | | | | | | | | | | | | | | | | | | |
| Selected data for a share outstanding: | | For the years ended June 30, | |
| | | 2011 | | | 2010 | | | 2009 | | | 2008 | | | 2007 | |
Net asset value, beginning of year | | | $11.77 | | | | $11.40 | | | | $11.43 | | | | $11.59 | | | | $11.52 | |
| | | | | | | | | | | | | | | | | | | | |
Income from investment operations: | | | | | | | | | | | | | | | | | | | | |
Net investment income | | | 0.45 | | | | 0.46 | | | | 0.46 | | | | 0.46 | | | | 0.47 | |
Net gains/(losses) on securities, both realized and unrealized | | | (0.05 | ) | | | 0.37 | | | | (0.03 | ) | | | (0.14 | ) | | | 0.07 | |
| | | | | | | | | | | | | | | | | | | | |
Total from investment operations | | | 0.40 | | | | 0.83 | | | | 0.43 | | | | 0.32 | | | | 0.54 | |
Less distributions: | | | | | | | | | | | | | | | | | | | | |
Distributions from net investment income | | | (0.45 | ) | | | (0.46 | ) | | | (0.46 | ) | | | (0.46 | ) | | | (0.47 | ) |
Distributions from capital gains | | | — | | | | — | | | | — | | | | (0.02 | ) | | | — | |
| | | | | | | | | | | | | | | | | | | | |
Net asset value, end of year | | | $11.72 | | | | $11.77 | | | | $11.40 | | | | $11.43 | | | | $11.59 | |
| | | | | | | | | | | | | | | | | | | | |
Total return | | | 3.45% | | | | 7.40% | | | | 3.95% | | | | 2.84% | | | | 4.70% | |
Net assets, end of year (in thousands) | | | $21,235 | | | | $19,853 | | | | $14,262 | | | | $13,537 | | | | $11,810 | |
Ratio of net expenses to average net assets (a) | | | 0.60% | | | | 0.47% | | | | 0.45% | | | | 0.45% | | | | 0.43% | |
Ratio of net investment income to average net assets | | | 3.83% | | | | 3.94% | | | | 4.14% | | | | 4.00% | | | | 4.00% | |
Portfolio turnover | | | 4.70% | | | | 15.73% | | | | 14.06% | | | | 8.46% | | | | 5.43% | |
| (a) | | Percentages are after expenses waived by Adviser and Custodian. No recovery of these waivers and reductions will be sought. |
| | | Expenses waived by Adviser and Custodian were: |
| | | .18% and .0% for 2011; .33% and .0% for 2010; .37% and .03% for 2009; .35% and .04% for 2008; and .37% and .04% for 2007, respectively. |
The accompanying notes are an integral part of the financial statements.
5
DUPREE MUTUAL FUNDS — KENTUCKY TAX-FREE INCOME SERIES
SCHEDULE OF PORTFOLIO INVESTMENTS
Kentucky Municipal Bonds — 100%
June 30, 2011
| | | | | | | | | | | | | | | | | | |
| Bond Description | | Coupon | | | Maturity
Date | | | Rating# | | Par Value | | | Fair Value | |
| | | | | | | | | | | | | | | | | | |
| INSURED MUNICIPAL BONDS | | | | | | | | | | | | | | | | | | |
| 64.48% of Net Assets | | | | | | | | | | | | | | | | | | |
Ballard County KY School District Finance Corporation | | | 5.000 | % | | | 06/01/2020 | | | Aa3 | | $ | 1,240,000 | | | $ | 1,325,994 | |
Barren County KY School District Finance Corporation | | | 4.750 | | | | 08/01/2022 | | | Aa3 | | | 3,085,000 | | | | 3,206,858 | |
Boone County KY Pollution Control Revenue — Dayton Power | | | 4.700 | | | | 01/01/2028 | | | Aa3/A* | | | 12,445,000 | | | | 12,485,446 | |
Boone County KY School District Finance Corporation | | | 5.000 | | | | 05/01/2023 | | | Aa3 | | | 4,070,000 | | | | 4,272,564 | |
Boone County KY School District Finance Corporation | | | 5.000 | | | | 05/01/2024 | | | Aa3 | | | 4,265,000 | | | | 4,464,261 | |
Boyle County KY College Improvement — Centre College — A | | | 4.750 | | | | 06/01/2032 | | | A3/A-* | | | 5,330,000 | | | | 5,287,893 | |
Bullitt County KY School District Finance Corporation | | | 4.750 | | | | 07/01/2022 | | | Aa3 | | | 2,440,000 | | | | 2,527,620 | |
Bullitt County KY School District Finance Corporation | | | 4.500 | | | | 10/01/2024 | | | Aa3 | | | 2,720,000 | | | | 2,775,080 | |
Campbell & Kenton Counties Sanitary District No. 1 | | | 5.000 | | | | 08/01/2025 | | | Aa2/AA* | | | 2,395,000 | | | | 2,551,106 | |
Campbell & Kenton Counties Sanitary Sewer | | | 5.000 | | | | 08/01/2026 | | | Aa2/AA* | | | 4,175,000 | | | | 4,447,127 | |
Campbell & Kenton Counties Sanitary Sewer | | | 5.000 | | | | 08/01/2027 | | | Aa2/AA* | | | 4,385,000 | | | | 4,639,023 | |
Campbell & Kenton Counties Sanitary District No. 1 | | | 5.000 | | | | 08/01/2037 | | | Aa2/AA* | | | 5,500,000 | | | | 5,589,155 | |
Campbell & Kenton Counties Sanitary Sewer | | | 5.000 | | | | 08/01/2017 | | | Aa2/AA+* | | | 1,000,000 | | | | 1,014,090 | |
Campbell County KY School District Finance Corporation | | | 4.500 | | | | 08/01/2023 | | | Aa3 | | | 980,000 | | | | 1,010,047 | |
Carter County KY Detention Center | | | 5.125 | | | | 05/01/2029 | | | Aa3 | | | 960,000 | | | | 969,725 | |
Eastern Kentucky University Consolidated Educational Building | | | 5.000 | | | | 05/01/2021 | | | A1/A* | | | 1,580,000 | | | | 1,671,861 | |
Fayette County KY School District Finance Corporation | | | 4.500 | | | | 03/01/2022 | | | Aa2/AA+* | | | 4,100,000 | | | | 4,183,763 | |
Fayette County KY School District Finance Corporation | | | 5.000 | | | | 04/01/2024 | | | Aa2/AA+* | | | 6,985,000 | | | | 7,365,194 | |
Fayette County KY School District Finance Corporation | | | 5.000 | | | | 04/01/2025 | | | Aa2/AA+* | | | 7,340,000 | | | | 7,699,880 | |
Franklin County School Building Revenue | | | 4.750 | | | | 05/01/2027 | | | Aa3 | | | 3,570,000 | | | | 3,655,644 | |
Greater KY Housing Assistance Corporation — Chenowith Woods | | | 6.100 | | | | 01/01/2024 | | | Baa1/BBB* | | | 450,000 | | | | 450,338 | |
Greater KY Housing Assistance Corporation — Northside Apts | | | 6.200 | | | | 02/01/2025 | | | AAA* | | | 3,320,000 | | | | 3,322,722 | |
Greater KY Housing Assistance Corporation Mortgage Revenue | | | 5.450 | | | | 05/20/2027 | | | Aa2 | | | 1,095,000 | | | | 1,113,779 | |
Hardin County School District Finance Corporation | | | 4.750 | | | | 06/01/2027 | | | Aa3 | | | 1,250,000 | | | | 1,286,313 | |
Jefferson County KY Health Facilities — Jewish Hospital | | | 5.650 | | | | 01/01/2017 | | | Baa1/A-* | | | 3,450,000 | | | | 3,455,072 | |
Jefferson County KY Health Facilities — Jewish Hospital | | | 5.700 | | | | 01/01/2021 | | | Baa1/A-* | | | 4,520,000 | | | | 4,522,396 | |
Jefferson County KY Health Facilities University Medical Center | | | 5.500 | | | | 07/01/2017 | | | Baa1/BBB* | | | 8,675,000 | | | | 8,678,036 | |
Jefferson County KY School District Finance Corporation | | | 4.750 | | | | 12/01/2026 | | | Aa2/AA+* | | | 3,770,000 | | | | 3,876,766 | |
Jefferson County KY School District Finance Corporation | | | 4.500 | | | | 07/01/2023 | | | Aa2/AA+* | | | 2,500,000 | | | | 2,581,350 | |
Jefferson County KY School District Finance Corporation | | | 4.625 | | | | 07/01/2025 | | | Aa2/AA+* | | | 7,545,000 | | | | 7,715,592 | |
Jefferson County KY School District Finance Corporation | | | 5.000 | | | | 07/01/2026 | | | Aa2/AA+* | | | 5,025,000 | | | | 5,234,593 | |
Jefferson County KY Health Facilities — Alliant Health | | | 5.125 | | | | 10/01/2017 | | | Baa1/BBB*/A-@ | | | 2,940,000 | | | | 2,945,674 | |
Jefferson County School District Finance Corporation | | | 4.750 | | | | 06/01/2027 | | | Aa2/AA-* | | | 3,000,000 | | | | 3,069,780 | |
Kenton County KY School District Finance Corporation | | | 5.000 | | | | 06/01/2021 | | | Aa3 | | | 4,055,000 | | | | 4,312,695 | |
Kenton County KY School District Finance Corporation | | | 5.000 | | | | 06/01/2023 | | | Aa3 | | | 4,465,000 | | | | 4,693,563 | |
Kenton County KY School District Finance Corporation | | | 5.000 | | | | 06/01/2024 | | | Aa3 | | | 4,665,000 | | | | 4,913,131 | |
KY Asset Liability Commission General Fund | | | 5.000 | | | | 05/01/2020 | | | Aa3/A+*/AA-@ | | | 2,000,000 | | | | 2,132,620 | |
KY Asset Liability Commission Project Notes | | | 5.000 | | | | 05/01/2023 | | | Aa3/A+*/AA-@ | | | 5,600,000 | | | | 5,931,800 | |
KY Asset Liability Commission General Fund | | | 5.000 | | | | 05/01/2024 | | | Aa3/A+*/AA-@ | | | 5,880,000 | | | | 6,208,868 | |
KY Asset Liability Commission | | | 5.000 | | | | 05/01/2025 | | | Aa3/A+*/AA-@ | | | 1,000,000 | | | | 1,050,050 | |
KY Asset Liability Project Notes | | | 5.000 | | | | 09/01/2015 | | | Aa2/AA*/AA-@ | | | 5,000,000 | | | | 5,614,800 | |
KY Asset Liability Commission Federal Highway | | | 5.250 | | | | 09/01/2019 | | | Aa2/AA*/AA-@ | | | 1,765,000 | | | | 2,070,292 | |
KY Asset Liability Commission University of Ky Project Notes | | | 5.000 | | | | 10/01/2024 | | | Aa2/AA-* | | | 5,445,000 | | | | 5,836,604 | |
KY Asset Liability Commission University of Ky Project Notes | | | 5.000 | | | | 10/01/2026 | | | Aa2/AA-* | | | 6,090,000 | | | | 6,413,257 | |
KY Asset Liability Commission University of Ky Project Notes | | | 5.000 | | | | 10/01/2023 | | | Aa2/AA-* | | | 8,075,000 | | | | 8,641,542 | |
KY Asset Liability Commission University of Ky Project Notes | | | 5.000 | | | | 10/01/2024 | | | Aa2/AA-* | | | 7,405,000 | | | | 7,888,176 | |
KY Asset Liability Commission University of Ky Project Notes | | | 5.000 | | | | 10/01/2025 | | | Aa2/AA-* | | | 3,700,000 | | | | 3,923,332 | |
KY Economic Development Finance Authority — Christian Care | | | 5.375 | | | | 11/20/2035 | | | AAA* | | | 1,905,000 | | | | 1,952,111 | |
KY Economic Development Authority — Louisville Arena | | | 5.750 | | | | 12/01/2028 | | | Aa3/AA+* | | | 1,625,000 | | | | 1,700,303 | |
KY Economic Development Authority — Louisville Arena | | | 6.000 | | | | 12/01/2033 | | | Aa3/AA+* | | | 1,000,000 | | | | 1,038,880 | |
KY Housing Corporation | | | 4.750 | | | | 07/01/2017 | | | Aaa/AAA* | | | 1,335,000 | | | | 1,335,534 | |
KY Housing Corporation | | | 4.400 | | | | 01/01/2017 | | | Aaa/AAA* | | | 1,000,000 | | | | 1,021,150 | |
KY Housing Corporation | | | 5.200 | | | | 01/01/2031 | | | Aaa/AAA* | | | 1,000,000 | | | | 1,000,180 | |
KY Housing Corporation | | | 4.650 | | | | 07/01/2023 | | | Aaa/AAA* | | | 3,595,000 | | | | 3,618,080 | |
KY Housing Corporation Country Place Apartments | | | 4.750 | | | | 04/20/2031 | | | AAA* | | | 935,000 | | | | 916,122 | |
KY Housing Corporation | | | 5.750 | | | | 07/01/2039 | | | Aaa/AAA* | | | 875,000 | | | | 904,575 | |
The accompanying footnotes are an integral part of the financial statements.
6
DUPREE MUTUAL FUNDS — KENTUCKY TAX-FREE INCOME SERIES
SCHEDULE OF PORTFOLIO INVESTMENTS
Kentucky Municipal Bonds — 100%
June 30, 2011
| | | | | | | | | | | | | | | | | | |
| Bond Description | | Coupon | | | Maturity
Date | | | Rating# | | Par Value | | | Fair Value | |
| | | | | | | | | | | | | | | | | | |
Ky State Property & Building #93 | | | 5.250 | % | | | 02/01/2025 | | | Aa3/AA+*/AA-@ | | $ | 7,250,000 | | | $ | 7,803,248 | |
KY State Property & Building #93 | | | 4.875 | | | | 02/01/2028 | | | Aa3/AA+*/AA-@ | | | 500,000 | | | | 512,240 | |
KY State Property & Building #93 | | | 5.000 | | | | 02/01/2029 | | | Aa3/AA+*/AA-@ | | | 500,000 | | | | 516,220 | |
KY State Property & Building #93 | | | 5.250 | | | | 02/01/2029 | | | Aa3/AA+*/AA-@ | | | 16,940,000 | | | | 17,848,323 | |
KY State Property & Building #76 | | | 5.500 | | | | 08/01/2021 | | | Aa3/A+*/AA-@ | | | 1,400,000 | | | | 1,619,422 | |
KY State Property & Building #73 | | | 5.000 | | | | 11/01/2021 | | | Aa3/AA+*/AA-@ | | | 1,000,000 | | | | 1,037,440 | |
KY State Property & Building #87 | | | 5.000 | | | | 03/01/2019 | | | Aa3/A+*/AA-@ | | | 3,000,000 | | | | 3,318,780 | |
KY State Property & Building #83 | | | 5.000 | | | | 10/01/2017 | | | Aa3/A+*/AA-@ | | | 5,000,000 | | | | 5,713,000 | |
KY State Property & Building #83 | | | 5.000 | | | | 10/01/2018 | | | Aa3/A+*/AA-@ | | | 17,750,000 | | | | 20,221,333 | |
KY State Property & Building #83 | | | 5.250 | ^ | | | 10/01/2020 | | | Aa3/A+*/AA-@ | | | 24,220,000 | | | | 27,729,478 | |
KY State Property & Building #73 | | | 5.000 | | | | 11/01/2019 | | | Aa3/AA+*/AA-@ | | | 1,360,000 | | | | 1,417,351 | |
KY State Property & Building #73 | | | 5.000 | | | | 11/01/2020 | | | Aa3/AA+*/AA-@ | | | 3,255,000 | | | | 3,384,744 | |
KY State Property & Building #84 | | | 5.000 | | | | 08/01/2019 | | | Aa3/A+*/AA-@ | | | 10,000,000 | | | | 11,288,400 | |
KY State Property & Building #84 | | | 5.000 | | | | 08/01/2021 | | | Aa3/A+*/AA-@ | | | 310,000 | | | | 345,594 | |
KY State Property & Building #84 | | | 5.000 | | | | 08/01/2022 | | | Aa3/A+*/AA-@ | | | 17,500,000 | | | | 19,401,550 | |
KY State Property & Building #87 | | | 5.000 | | | | 03/01/2022 | | | Aa3/A+*/AA-@ | | | 1,665,000 | | | | 1,787,910 | |
KY State Property & Building #87 | | | 5.000 | | | | 03/01/2023 | | | Aa3/A+*/AA-@ | | | 5,175,000 | | | | 5,494,194 | |
KY State Property & Building #87 | | | 5.000 | | | | 03/01/2025 | | | Aa3/A+*/AA-@ | | | 14,835,000 | | | | 15,526,311 | |
KY State Property & Building #87 | | | 5.000 | | | | 03/01/2026 | | | Aa3/A+*/AA-@ | | | 8,230,000 | | | | 8,554,427 | |
KY State Property & Building #87 | | | 5.000 | | | | 03/01/2027 | | | Aa3/A+*/AA-@ | | | 10,290,000 | | | | 10,643,050 | |
KY State Property & Building #88 | | | 4.750 | | | | 11/01/2027 | | | Aa3/A+*/AA-@ | | | 5,800,000 | | | | 5,939,838 | |
KY State Property & Building #89 | | | 5.000 | | | | 11/01/2025 | | | Aa3/AA+*/AA-@ | | | 5,000,000 | | | | 5,253,250 | |
KY State Property & Building #89 | | | 5.000 | | | | 11/01/2026 | | | Aa3/AA+*/AA-@ | | | 13,390,000 | | | | 14,050,930 | |
KY State Property & Building #89 | | | 5.000 | | | | 11/01/2027 | | | Aa3/AA+*/AA-@ | | | 4,900,000 | | | | 5,110,406 | |
KY State Property & Building #80 | | | 5.250 | | | | 05/01/2018 | | | Aa3/A+*/AA-@ | | | 2,940,000 | | | | 3,371,386 | |
KY State Property & Building #80 | | | 5.250 | | | | 05/01/2020 | | | Aa3/A+*/AA-@ | | | 1,000,000 | | | | 1,138,490 | |
KY State Property & Building #81 | | | 5.000 | | | | 11/01/2018 | | | A1/A+*/AA-@ | | | 1,720,000 | | | | 1,837,545 | |
KY State Property & Building #81 | | | 5.000 | | | | 11/01/2019 | | | A1/A+*/AA-@ | | | 2,385,000 | | | | 2,542,362 | |
KY State Property & Building #81 | | | 5.000 | | | | 11/01/2020 | | | A1/A+*/AA-@ | | | 3,560,000 | | | | 3,778,940 | |
KY State Property & Building #81 | | | 5.000 | | | | 11/01/2022 | | | A1/A+*/AA-@ | | | 3,930,000 | | | | 4,137,701 | |
KY State Turnpike Economic Development | | | 5.150 | | | | 07/01/2019 | | | Aa2/AA+*/AA-@ | | | 1,000,000 | | | | 1,000,110 | |
KY State Turnpike Economic Development | | | 5.000 | | | | 07/01/2022 | | | Aa3/AA+*/AA-@ | | | 1,625,000 | | | | 1,739,758 | |
KY State Turnpike Economic Development | | | 5.000 | | | | 07/01/2023 | | | Aa3/AA+*/AA-@ | | | 4,325,000 | | | | 4,635,449 | |
KY State Turnpike Economic Development | | | 5.000 | | | | 07/01/2024 | | | Aa3/AA+*/AA-@ | | | 3,770,000 | | | | 3,972,261 | |
KY State Turnpike Economic Development | | | 5.000 | | | | 07/01/2025 | | | Aa3/AA+*/AA-@ | | | 2,000,000 | | | | 2,096,660 | |
KY State Turnpike Economic Development | | | 5.000 | | | | 07/01/2026 | | | Aa2/AA+*/AA-@ | | | 4,720,000 | | | | 4,953,876 | |
Laurel County KY School District Finance Corporation | | | 4.625 | | | | 08/01/2026 | | | Aa3 | | | 3,150,000 | | | | 3,228,026 | |
Laurel County KY School District Finance Corporation | | | 4.750 | | | | 06/01/2026 | | | Aa3 | | | 1,000,000 | | | | 1,034,890 | |
Letcher County KY School District Finance Corporation | | | 5.000 | | | | 06/01/2022 | | | Aa3 | | | 1,755,000 | | | | 1,834,344 | |
Letcher County KY School District Finance Corporation | | | 5.000 | | | | 06/01/2024 | | | Aa3 | | | 1,930,000 | | | | 2,001,468 | |
Louisville & Jefferson County KY Metropolitan Sewer | | | 5.000 | | | | 05/15/2025 | | | Aa3/AA-*/AA-@ | | | 3,270,000 | | | | 3,442,983 | |
Louisville & Jefferson County KY Metropolitan Sewer | | | 5.000 | | | | 05/15/2026 | | | Aa3/AA-*/AA-@ | | | 3,230,000 | | | | 3,381,842 | |
Louisville & Jefferson County KY Metropolitan Sewer | | | 5.000 | | | | 05/15/2032 | | | Aa3/AA-*/AA-@ | | | 3,220,000 | | | | 3,295,251 | |
Louisville & Jefferson County KY Metropolitan Sewer | | | 5.000 | | | | 05/15/2036 | | | Aa3/AA-*/AA-@ | | | 2,000,000 | | | | 2,027,500 | |
Louisville & Jefferson County KY Metropolitan Sewer | | | 4.750 | | | | 05/15/2028 | | | Aa3/AA-*/AA-@ | | | 10,670,000 | | | | 10,674,588 | |
Louisville & Jefferson County KY Metropolitan Sewer | | | 5.000 | | | | 05/15/2030 | | | Aa3/AA-*/AA-@ | | | 3,005,000 | | | | 3,006,352 | |
Louisville & Jefferson County KY Metropolitan Sewer | | | 5.000 | | | | 05/15/2032 | | | Aa3/AA-*/AA-@ | | | 4,000,000 | | | | 4,056,200 | |
Louisville & Jefferson County KY Metropolitan Sewer | | | 5.500 | | | | 05/15/2034 | | | Aa3/AA-*/AA-@ | | | 7,695,000 | | | | 7,836,203 | |
Louisville & Jefferson County KY Metropolitan Sewer | | | 5.000 | | | | 05/15/2036 | | | Aa3/AA-*/AA-@ | | | 1,330,000 | | | | 1,348,088 | |
Louisville & Jefferson County KY Metropolitan Sewer | | | 5.000 | | | | 05/15/2038 | | | Aa3/AA-*/AA-@ | | | 12,500,000 | | | | 12,601,500 | |
Louisville & Jefferson County KY Metropolitan Sewer | | | 5.000 | | | | 05/15/2024 | | | Aa3/AA-* | | | 7,000,000 | | | | 7,541,100 | |
Louisville & Jefferson County KY Metropolitan Sewer | | | 5.000 | | | | 05/15/2022 | | | Aa3/AA+*/AA-@ | | | 2,855,000 | | | | 3,044,001 | |
Louisville & Jefferson County KY Metropolitan Sewer | | | 5.000 | | | | 05/15/2023 | | | Aa3/AA+*/AA-@ | | | 2,990,000 | | | | 3,180,074 | |
Louisville & Jefferson County KY Metropolitan Sewer | | | 5.000 | | | | 05/15/2024 | | | Aa3/AA+*/AA-@ | | | 3,135,000 | | | | 3,320,216 | |
Louisville & Jefferson County KY Metropolitan Sewer | | | 5.000 | | | | 05/15/2025 | | | Aa3/AA+*/AA-@ | | | 3,285,000 | | | | 3,468,073 | |
Louisville & Jefferson County KY Metropolitan Sewer | | | 5.000 | | | | 05/15/2026 | | | Aa3/AA+*/AA-@ | | | 14,000,000 | | | | 14,661,080 | |
Louisville & Jefferson County KY Metropolitan Sewer | | | 5.000 | | | | 05/15/2025 | | | Aa3/AA+* | | | 5,185,000 | | | | 5,561,379 | |
Louisville & Jefferson County KY Regional Airport Authority | | | 5.500 | | | | 07/01/2017 | | | Aa3/AA+*/A+@ | | | 2,655,000 | | | | 2,681,869 | |
The accompanying footnotes are an integral part of the financial statements.
7
DUPREE MUTUAL FUNDS — KENTUCKY TAX-FREE INCOME SERIES
SCHEDULE OF PORTFOLIO INVESTMENTS
Kentucky Municipal Bonds — 100%
June 30, 2011
| | | | | | | | | | | | | | | | | | |
| Bond Description | | Coupon | | | Maturity
Date | | | Rating# | | Par Value | | | Fair Value | |
| | | | | | | | | | | | | | | | | | |
Louisville & Jefferson County KY Visitors & Convention Center | | | 4.500 | % | | | 12/01/2023 | | | Aa3/AA+* | | $ | 2,340,000 | | | $ | 2,390,638 | |
Louisville & Jefferson County KY Visitors & Convention Center | | | 4.500 | | | | 12/01/2024 | | | Aa3/AA+* | | | 2,250,000 | | | | 2,272,680 | |
Louisville & Jefferson County KY Visitors & Convention Center | | | 4.600 | | | | 12/01/2025 | | | Aa3/AA+* | | | 1,490,000 | | | | 1,501,697 | |
Louisville & Jefferson County KY Student Housing | | | 5.000 | | | | 06/01/2025 | | | NR | | | 2,030,000 | | | | 2,077,746 | |
Marshall County KY School District Finance Corporation | | | 5.000 | | | | 06/01/2022 | | | Aa3 | | | 1,400,000 | | | | 1,458,156 | |
Nelson County KY School District Finance Corporation | | | 4.500 | | | | 04/01/2021 | | | Aa3 | | | 1,130,000 | | | | 1,157,323 | |
Nelson County KY School District Finance Corporation | | | 4.500 | | | | 04/01/2023 | | | Aa3 | | | 2,505,000 | | | | 2,552,244 | |
Northern KY Water District | | | 4.750 | | | | 02/01/2019 | | | Aa3 | | | 1,000,000 | | | | 1,015,330 | |
Northern KY Water District | | | 5.000 | | | | 02/01/2020 | | | Aa3 | | | 3,080,000 | | | | 3,133,500 | |
Northern KY Water District | | | 5.000 | | | | 02/01/2021 | | | Aa3 | | | 2,635,000 | | | | 2,676,106 | |
Northern KY Water District | | | 4.125 | | | | 02/01/2021 | | | Aa3 | | | 1,380,000 | | | | 1,390,529 | |
Northern KY Water District | | | 4.500 | | | | 02/01/2022 | | | Aa3 | | | 1,385,000 | | | | 1,408,891 | |
Northern KY Water District | | | 6.500 | | | | 02/01/2033 | | | Aa3 | | | 1,585,000 | | | | 1,748,144 | |
Northern KY Water District | | | 6.000 | | | | 02/01/2028 | | | Aa3 | | | 1,010,000 | | | | 1,107,415 | |
Northern KY Water District | | | 6.000 | | | | 02/01/2031 | | | Aa3 | | | 1,000,000 | | | | 1,085,050 | |
Owensboro Water Revenue | | | 5.000 | | | | 09/15/2025 | | | Aa3 | | | 545,000 | | | | 580,207 | |
Pike County KY Mortgage Revenue — Phelps Regional Health | | | 5.350 | | | | 09/20/2012 | | | NR | | | 35,000 | | | | 35,000 | |
Shelby County KY School District Finance Corporation | | | 5.000 | | | | 05/01/2022 | | | Aa3 | | | 1,815,000 | | | | 1,891,793 | |
Spencer County KY School District Finance Corporation | | | 5.000 | | | | 07/01/2023 | | | Aa3 | | | 1,000,000 | | | | 1,048,210 | |
Taylor County Detention Facility | | | 4.750 | | | | 09/01/2027 | | | A3 | | | 2,110,000 | | | | 2,129,096 | |
| | | | | | | | | | | | | | | | | | |
| | | | | | | | | | | | | | | | | 578,121,166 | |
| LEASE REVENUE BONDS | | | | | | | | | | | | | | | | | | |
| 9.76% of Net Assets | | | | | | | | | | | | | | | | | | |
Danville KY Multi-City Lease Campbellsville Water & Sewer | | | 3.500 | | | | 07/01/2012 | | | A1 | | | 820,000 | | | | 828,881 | |
Davies County KY School District Finance Corporation | | | 5.000 | | | | 06/01/2021 | | | Aa3 | | | 1,155,000 | | | | 1,210,821 | |
Fayette County School District Finance Corporation | | | 5.000 | | | | 06/01/2031 | | | Aa2/AA* | | | 3,705,000 | | | | 3,857,794 | |
Franklin County Public Properties Justice Center | | | 5.000 | | | | 04/01/2029 | | | Aa3 | | | 2,630,000 | | | | 2,707,559 | |
Hardin County School District Finance Corporation | | | 5.000 | | | | 05/01/2030 | | | Aa3 | | | 450,000 | | | | 464,805 | |
Hardin County School District Finance Corporation | | | 5.000 | | | | 05/01/2031 | | | Aa3 | | | 470,000 | | | | 480,975 | |
Kenton County School District Finance Corporation | | | 5.000 | | | | 02/01/2029 | | | Aa3 | | | 3,270,000 | | | | 3,405,934 | |
KY Area Development Districts Financing Lease — Ewing | | | 4.700 | | | | 06/01/2024 | | | NR | | | 2,625,000 | | | | 2,652,248 | |
KY Asset Liability Project | | | 5.000 | | | | 09/01/2021 | | | Aa2/AA*/AA-@ | | | 1,570,000 | | | | 1,779,611 | |
Kentucky Asset Liability Highway Trust | | | 5.000 | | | | 09/01/2022 | | | Aa2/AA*/AA-@ | | | 3,500,000 | | | | 3,917,305 | |
KY Association of Counties | | | 5.000 | | | | 02/01/2030 | | | A+* | | | 625,000 | | | | 640,106 | |
KY Association of Counties | | | 5.000 | | | | 02/01/2032 | | | A+* | | | 1,000,000 | | | | 1,003,570 | |
KY Association of Counties | | | 5.000 | | | | 02/01/2035 | | | A+* | | | 995,000 | | | | 982,732 | |
KY Infrastructure Authority Wastewater & Drinking Water | | | 5.000 | | | | 02/01/2027 | | | Aaa/AAA*/AAA@ | | | 2,500,000 | | | | 2,748,700 | |
KY Infrastructure Authority Wastewater & Drinking Water | | | 5.000 | | | | 02/01/2028 | | | Aaa/AAA*/AAA@ | | | 2,000,000 | | | | 2,180,460 | |
KY Infrastructure Authority — Series A | | | 5.000 | | | | 06/01/2019 | | | Aa3/A+*/AA-@ | | | 1,000,000 | | | | 1,000,380 | |
KY State Property & Building #68 | | | 5.250 | | | | 10/01/2018 | | | Aa3/A+*/AA-@ | | | 1,500,000 | | | | 1,500,780 | |
KY State Property & Building #68 | | | 5.000 | | | | 10/01/2019 | | | Aa3/A+*/AA-@ | | | 1,500,000 | | | | 1,500,720 | |
KY State Property & Building #100 | | | 5.000 | ** | | | 08/01/2030 | | | Aa3/A+*/AA-@ | | | 5,480,000 | | | | 5,597,327 | |
KY State Property & Building #88 | | | 5.000 | | | | 11/01/2024 | | | Aa3/A+*/AA-@ | | | 1,355,000 | | | | 1,429,322 | |
KY State Property & Building #90 | | | 5.375 | | | | 11/01/2023 | | | Aa3/A+*/AA-@ | | | 1,200,000 | | | | 1,314,312 | |
KY State Property & Building #90 | | | 5.500 | | | | 11/01/2028 | | | Aa3/A+*/AA-@ | | | 24,220,000 | | | | 25,920,244 | |
KY State Property & Building #96 | | | 5.000 | | | | 11/01/2029 | | | Aa3/A+*/AA-@ | | | 5,000,000 | | | | 5,175,350 | |
KY State Property & Building #98 | | | 5.000 | | | | 08/01/2021 | | | Aa3/A+*/AA-@ | | | 2,505,000 | | | | 2,803,471 | |
KY State Property & Building #91 | | | 5.750 | | | | 04/01/2029 | | | A1/A+*/A+@ | | | 210,000 | | | | 226,265 | |
Lexington-Fayette Urban County Government Public Facilities | | | 5.000 | | | | 06/01/2033 | | | Aa3/A+*/AA-@ | | | 5,000,000 | | | | 4,934,250 | |
Montgomery County KY School District Finance Corporation | | | 4.375 | | | | 04/01/2023 | | | Aa3 | | | 3,105,000 | | | | 3,141,142 | |
Pendleton County KY Multi-County Lease Revenue | | | 6.400 | | | | 03/01/2019 | | | A* | | | 3,000,000 | | | | 3,587,250 | |
Shelby County KY School District Finance Corporation | | | 5.000 | | | | 02/01/2028 | | | Aa3 | | | 500,000 | | | | 523,750 | |
| | | | | | | | | | | | | | | | | | |
| | | | | | | | | | | | | | | | | 87,516,064 | |
| TURNPIKES AND TOLL ROAD BONDS | | | | | | | | | | | | | | | | | | |
| 4.59% of Net Assets | | | | | | | | | | | | | | | | | | |
KY State Turnpike Economic Development Road Revenue | | | 5.000 | | | | 07/01/2020 | | | Aa2/AA+*/AA-@ | | | 1,000,000 | | | | 1,129,520 | |
KY State Turnpike Economic Development Road Revenue | | | 5.000 | | | | 07/01/2025 | | | Aa2/AA+*/AA-@ | | | 2,925,000 | | | | 3,127,878 | |
KY State Turnpike Economic Development Road Revenue | | | 5.000 | | | | 07/01/2027 | | | Aa2/AA+*/AA-@ | | | 9,530,000 | | | | 10,053,388 | |
The accompanying footnotes are an integral part of the financial statements.
8
DUPREE MUTUAL FUNDS — KENTUCKY TAX-FREE INCOME SERIES
SCHEDULE OF PORTFOLIO INVESTMENTS
Kentucky Municipal Bonds — 100%
June 30, 2011
| | | | | | | | | | | | | | | | | | |
| Bond Description | | Coupon | | | Maturity
Date | | | Rating# | | Par Value | | | Fair Value | |
| | | | | | | | | | | | | | | | | | |
KY State Turnpike Economic Development Road Revenue | | | 5.000 | % | | | 07/01/2028 | | | Aa2/AA+*/AA-@ | | $ | 2,460,000 | | | $ | 2,578,326 | |
KY State Turnpike Economic Development Road Revenue | | | 5.000 | | | | 07/01/2026 | | | Aa2/AA+*/AA-@ | | | 4,440,000 | | | | 4,735,216 | |
KY State Turnpike Economic Development Road Revenue | | | 5.000 | | | | 07/01/2027 | | | Aa2/AA+*/AA-@ | | | 1,550,000 | | | | 1,645,434 | |
KY State Turnpike Economic Development Road Revenue | | | 5.000 | | | | 07/01/2029 | | | Aa2/AA+*/AA-@ | | | 10,035,000 | | | | 10,506,344 | |
KY State Turnpike Economic Development Road Revenue | | | 5.000 | | | | 07/01/2029 | | | Aa2/AA+*/AA-@ | | | 5,165,000 | | | | 5,469,322 | |
KY State Turnpike Economic Development Road Revenue | | | 5.000 | | | | 07/01/2030 | | | Aa2/AA+*/AA-@ | | | 1,845,000 | | | | 1,935,313 | |
| | | | | | | | | | | | | | | | | | |
| | | | | | | | | | | | | | | | | 41,180,741 | |
| ESCROWED TO MATURITY BONDS | | | | | | | | | | | | | | | | | | |
| 4.30% of Net Assets | | | | | | | | | | | | | | | | | | |
Danville KY Multi-City Lease Revenue — Hopkinsville | | | 6.875 | | | | 06/01/2012 | | | A2 | | | 335,000 | | | | 344,849 | |
Jefferson County KY Health Facilities — Alliant Health | | | 5.125 | | | | 10/01/2017 | | | BBB* | | | 3,980,000 | | | | 4,207,616 | |
Jefferson County KY Health Facilities — Alliant Health | | | 5.125 | | | | 10/01/2018 | | | BBB* | | | 32,000,000 | | | | 34,029,120 | |
| | | | | | | | | | | | | | | | | | |
| | | | | | | | | | | | | | | | | 38,581,585 | |
| PREREFUNDED BONDS | | | | | | | | | | | | | | | | | | |
| 4.17% of Net Assets | | | | | | | | | | | | | | | | | | |
KY State Property & Building #85 | | | 5.000 | | | | 08/01/2024 | | | Aa2/AA+*/AA-@ | | | 8,300,000 | | | | 9,622,273 | |
Bowling Green KY General Obligation | | | 4.600 | | | | 06/01/2018 | | | Aa2 | | | 1,290,000 | | | | 1,338,930 | |
KY State Property & Building #85 | | | 5.000 | | | | 08/01/2020 | | | Aa2/AA+*/AA-@ | | | 5,760,000 | | | | 6,677,626 | |
KY State Property & Building #85 | | | 5.000 | | | | 08/01/2022 | | | Aa2/AA+*/AA-@ | | | 8,200,000 | | | | 9,506,342 | |
KY State Property & Building #85 | | | 5.000 | | | | 08/01/2025 | | | Aa2/AA+*/AA-@ | | | 2,500,000 | | | | 2,898,275 | |
Knox County General Obligation | | | 5.625 | | | | 06/01/2036 | | | NR | | | 2,490,000 | | | | 2,960,486 | |
Louisville KY General Obligation — Series A | | | 5.000 | | | | 10/01/2020 | | | Aa1/AA+* | | | 4,165,000 | | | | 4,399,781 | |
| | | | | | | | | | | | | | | | | | |
| | | | | | | | | | | | | | | | | 37,403,713 | |
| STATE AND LOCAL MORTGAGE REVENUE BONDS | | | | | | | | | | | | | | | | | | |
| 4.04% of Net Assets | | | | | | | | | | | | | | | | | | |
KY Housing Corporation | | | 4.850 | | | | 01/01/2024 | | | Aaa/AAA* | | | 7,380,000 | | | | 7,434,538 | |
KY Housing Corporation | | | 4.950 | | | | 01/01/2033 | | | Aaa/AAA* | | | 5,065,000 | | | | 5,078,321 | |
KY Housing Corporation | | | 4.750 | | | | 07/01/2032 | | | Aaa/AAA* | | | 1,265,000 | | | | 1,232,186 | |
KY Housing Corporation | | | 4.875 | | | | 07/01/2023 | | | Aaa/AAA* | | | 1,535,000 | | | | 1,574,096 | |
KY Housing Corporation | | | 4.750 | | | | 07/01/2035 | | | Aaa/AAA* | | | 4,140,000 | | | | 3,996,259 | |
KY Housing Corporation | | | 5.375 | | | | 07/01/2033 | | | Aaa/AAA* | | | 4,175,000 | | | | 4,254,033 | |
KY Housing Corporation | | | 5.450 | | | | 07/01/2038 | | | Aaa/AAA* | | | 4,005,000 | | | | 4,050,817 | |
KY Housing Corporation | | | 4.900 | | | | 07/01/2028 | | | Aaa/AAA* | | | 2,000,000 | | | | 2,014,460 | |
KY Housing Corporation | | | 4.850 | | | | 07/01/2029 | | | Aaa/AAA* | | | 3,200,000 | | | | 3,232,032 | |
KY Housing Corporation | | | 5.150 | | | | 07/01/2039 | | | Aaa/AAA* | | | 2,745,000 | | | | 2,777,309 | |
KY Housing Corporation | | | 4.625 | | | | 07/01/2033 | | | Aaa/AAA* | | | 595,000 | | | | 576,228 | |
| | | | | | | | | | | | | | | | | | |
| | | | | | | | | | | | | | | | | 36,220,279 | |
| HOSPITAL AND HEALTHCARE REVENUE BONDS | | | | | | | | | | | | | | | | | | |
| 3.45% of Net Assets | | | | | | | | | | | | | | | | | | |
KY Development Finance Authority — Kings Daughters | | | 5.000 | | | | 02/01/2030 | | | A1/A+*/A+@ | | | 4,000,000 | | | | 3,909,880 | |
KY Development Finance Authority — Baptist Heathcare System | | | 5.375 | | | | 08/15/2024 | | | Aa3/AA-@ | | | 1,205,000 | | | | 1,268,600 | |
KY Development Finance Authority — Baptist Healthcare | | | 5.625 | | | | 08/15/2027 | | | Aa3/AA-@ | | | 4,855,000 | | | | 5,129,978 | |
KY Development Finance Authority — Catholic Health | | | 5.000 | | | | 05/01/2029 | | | Aa2/AA*/AA@ | | | 2,500,000 | | | | 2,513,600 | |
KY Development Finance Authority — Catholic Health | | | 5.000 | | | | 05/01/2029 | | | Aa2/AA*/AA@ | | | 2,410,000 | | | | 2,448,873 | |
KY Development Finance Authority — St. Elizabeth | | | 5.125 | | | | 05/01/2029 | | | AA-*/AA-@ | | | 2,750,000 | | | | 2,798,620 | |
KY Development Finance Authority — St. Elizabeth | | | 5.375 | | | | 05/01/2034 | | | AA-*/AA-@ | | | 2,560,000 | | | | 2,593,254 | |
KY Development Finance Authority — Catholic Health | | | 5.125 | | | | 10/01/2021 | | | A1/AA-*/AA-@ | | | 1,000,000 | | | | 1,012,330 | |
Louisville & Jefferson Metropolitan Health — St Mary’s | | | 6.125 | | | | 02/01/2037 | | | Baa1/A-* | | | 1,300,000 | | | | 1,290,783 | |
Louisville & Jefferson Metropolitan Government Health | | | 5.000 | | | | 10/01/2026 | | | A-*/A-@ | | | 595,000 | | | | 564,358 | |
Louisville & Jefferson Co Health System — Norton | | | 5.000 | | | | 10/01/2030 | | | A-*/A-@ | | | 2,000,000 | | | | 1,820,020 | |
Louisville & Jefferson County Metropolitan Health — Norton | | | 5.250 | | | | 10/01/2036 | | | A-*/A-@ | | | 3,460,000 | | | | 3,162,025 | |
Pike County KY Mortgage Revenue — Phelps Regional Health | | | 5.650 | | | | 09/20/2027 | | | NR | | | 2,435,000 | | | | 2,435,000 | |
| | | | | | | | | | | | | | | | | | |
| | | | | | | | | | | | | | | | | 30,947,321 | |
| MUNICIPAL UTILITY REVENUE BONDS | | | | | | | | | | | | | | | | | | |
| 2.75% of Net Assets | | | | | | | | | | | | | | | | | | |
KY Rural Water Financial Corporation Public Project Revenue | | | 5.375 | | | | 02/01/2020 | | | AA-* | | | 1,140,000 | | | | 1,163,860 | |
KY Rural Water Finance Corporation | | | 5.125 | | | | 02/01/2035 | | | AA-* | | | 525,000 | | | | 537,983 | |
The accompanying footnotes are an integral part of the financial statements.
9
DUPREE MUTUAL FUNDS — KENTUCKY TAX-FREE INCOME SERIES
SCHEDULE OF PORTFOLIO INVESTMENTS
Kentucky Municipal Bonds — 100%
June 30, 2011
| | | | | | | | | | | | | | | | | | |
| Bond Description | | Coupon | | | Maturity
Date | | | Rating# | | Par Value | | | Fair Value | |
| | | | | | | | | | | | | | | | | | |
Louisville & Jefferson County Metropolitan Sewer | | | 5.000 | % | | | 05/15/2021 | | | Aa3/AA-* | | $ | 2,865,000 | | | $ | 3,223,211 | |
Louisville & Jefferson County Metropolitan Sewer | | | 5.000 | | | | 05/15/2023 | | | Aa3/AA-* | | | 2,500,000 | | | | 2,749,125 | |
Louisville & Jefferson County Waterworks | | | 5.000 | | | | 11/15/2027 | | | Aaa/AAA* | | | 2,000,000 | | | | 2,132,620 | |
Louisville & Jefferson County KY Waterworks & Water System | | | 5.000 | | | | 11/15/2031 | | | Aaa/AAA* | | | 10,695,000 | | | | 11,196,596 | |
Northern KY Water District | | | 5.000 | | | | 02/01/2033 | | | Aa3 | | | 3,580,000 | | | | 3,670,323 | |
| | | | | | | | | | | | | | | | | | |
| | | | | | | | | | | | | | | | | 24,673,718 | |
| PUBLIC FACILITIES REVENUE BONDS | | | | | | | | | | | | | | | | | | |
| 1.07% of Net Assets | | | | | | | | | | | | | | | | | | |
Boone County KY Public Property Corporation — AOC Judicial | | | 5.000 | | | | 09/01/2019 | | | Aa3 | | | 1,000,000 | | | | 1,042,460 | |
Boone County KY Public Property Corporation — Judicial Facilities | | | 5.125 | | | | 09/01/2022 | | | Aa3 | | | 1,750,000 | | | | 1,829,730 | |
Louisville & Jefferson County KY Parking Authority | | | 5.000 | | | | 12/01/2022 | | | Aa2/AA* | | | 625,000 | | | | 691,875 | |
Louisville & Jefferson County Metropolitan Parking | | | 5.750 | | | | 12/01/2034 | | | Aa2/AA* | | | 2,750,000 | | | | 2,954,683 | |
Wolfe County Public Property | | | 5.000 | | | | 04/01/2030 | | | Aa3 | | | 2,855,000 | | | | 3,046,513 | |
| | | | | | | | | | | | | | | | | | |
| | | | | | | | | | | | | | | | | 9,565,261 | |
| UNIVERSITY CONSOLIDATED EDUCATION AND BUILDING REVENUE BONDS | | | | | | | | | | | |
| .89% of Net Assets | | | | | | | | | | | | | | | | | | |
Berea KY Educational Facilities Revenue | | | 4.125 | | | | 06/01/2022 | | | Aaa | | | 2,190,000 | | | | 2,227,778 | |
KY Housing Corporation | | | 5.000 | | | | 07/01/2033 | | | Aaa/AAA* | | | 2,405,000 | | | | 2,412,407 | |
Louisville & Jefferson County — Papa Johns Stadium | | | 4.750 | | | | 03/01/2028 | | | Aa2/AA-* | | | 3,250,000 | | | | 3,354,748 | |
| | | | | | | | | | | | | | | | | | |
| | | | | | | | | | | | | | | | | 7,994,933 | |
| GENERAL OBLIGATION BONDS | | | | | | | | | | | | | | | | | | |
| .13% of Net Assets | | | | | | | | | | | | | | | | | | |
KY Bond Corporation Finance Program | | | 5.500 | | | | 02/01/2031 | | | A+* | | | 1,115,000 | | | | 1,135,717 | |
| | | | | | | | | | | | | | | | | | |
| | | | | | | | | | | | | | | | | 1,135,717 | |
| | | | | | | | | | | | | | | | | | |
Total Investments (cost $869,751,371)(See (a) below for further explanation) 99.63% of Net Assets | | | | | | | | | $ | 893,340,498 | |
| | | | | | | | | | | | | | | | | | |
| | * | | Standard and Poor’s Corporation |
| | ** | | When-Issued security or extended settlement — see footnote 1(D) |
| | ^ | | Security is segregated — see footnote 1(D) |
| | @ | | Fitch’s Investors Service |
| | | | All other ratings by Moody’s Investors Service, Inc. |
| | # | | Bond ratings are unaudited and not covered by Report of Independent Registered Public Accounting Firm. |
| (a) | | Represents cost for financial reporting and federal income tax purposes and differs from market value by net unrealized appreciation of securities as follows: |
| | | | | | |
| | | | | | |
| | Unrealized appreciation | | $ | 25,999,414 | |
| | Unrealized depreciation | | | (2,410,287 | ) |
| | | | | | |
| | Net unrealized appreciation | | $ | 23,589,127 | |
| | | | | | |
Other Information
The following is a summary of the inputs used, as of June 30, 2011, involving the Fund’s assets and liabilities carried at fair value. The inputs or methodology used for valuing securities may not be an indication of the risk associated with investing in those securities. For more information on valuation inputs, and their aggregation into the levels used the the table below, please refer to the Security Valuation section in the accompanying Notes to Financial Statements.
| | | | | | |
| | | | | | |
| | | Valuation Inputs | | Municipal Bonds | |
Level 1 | | Quoted Prices | | $ | — | |
Level 2 | | Other Significant Observable Inputs | | | 893,340,498 | |
Level 3 | | Significant Unobservable Inputs | | | — | |
| | | | | | |
| | | | $ | 893,340,498 | |
| | | | | | |
The accompanying footnotes are an integral part of the financial statements.
10
KENTUCKY TAX-FREE INCOME SERIES
STATEMENT OF ASSETS AND LIABILITIES
June 30, 2011
| | | | | | | | |
ASSETS: | | | | | | | | |
Investments in securities, at fair value (Cost: $869,751,371) | | | | | | $ | 893,340,498 | |
Cash | | | | | | | 769,569 | |
Receivable for fund shares sold | | | | | | | 25,000 | |
Interest receivable | | | | | | | 12,098,007 | |
| | | | | | | | |
Total assets | | | | | | | 906,233,074 | |
LIABILITIES: | | | | | | | | |
Payable for: | | | | | | | | |
Investments purchased | | | 5,632,563 | | | | | |
Distributions to shareholders | | | 3,373,473 | | | | | |
Fund shares redeemed | | | 81,256 | | | | | |
Investment advisory fee | | | 282,832 | | | | | |
Transfer agent fee | | | 5,903 | | | | | |
Trustee fees | | | 14,994 | | | | | |
Accrued expenses | | | 217,028 | | | | | |
| | | | | | | | |
Total liabilities | | | | | | | 9,608,049 | |
| | | | | | | | |
NET ASSETS: | | | | | | | | |
Capital | | | | | | | 869,927,400 | |
Net accumulated realized gain on investment transactions | | | | | | | 3,108,498 | |
Net unrealized appreciation in value of investments | | | | | | | 23,589,127 | |
| | | | | | | | |
Net assets at value | | | | | | $ | 896,625,025 | |
| | | | | | | | |
NET ASSET VALUE, offering price and redemption price per share ($896,625,025 ÷ 117,445,334 shares outstanding; unlimited number of shares authorized; no par value) | | | | | | $ | 7.63 | |
| | | | | | | | |
STATEMENT OF OPERATIONS
For the year ended June 30, 2011
| | | | |
Net investment income: | | | | |
Interest income | | $ | 38,305,415 | |
| | | | |
Expenses: | | | | |
Investment advisory fee | | | 3,429,968 | |
Transfer agent fee | | | 1,060,816 | |
Custodian expense | | | 138,844 | |
Professional fees | | | 193,351 | |
Trustee fees | | | 110,549 | |
Other expenses | | | 178,048 | |
| | | | |
Total expenses | | | 5,111,576 | |
Custodian expense reduction | | | (8,782 | ) |
| | | | |
Net expenses | | | 5,102,794 | |
| | | | |
Net investment income | | | 33,202,621 | |
| | | | |
Realized and unrealized gain/(loss) on investments: | | | | |
Net realized gain | | | 4,995,471 | |
Net change in unrealized appreciation/depreciation | | | (6,910,375 | ) |
| | | | |
Net realized and unrealized loss on investments | | | (1,914,904 | ) |
| | | | |
Net increase in net assets resulting from operations | | $ | 31,287,717 | |
| | | | |
The accompanying notes are an integral part of the financial statements.
11
KENTUCKY TAX-FREE INCOME SERIES
STATEMENTS OF CHANGES IN NET ASSETS
For the years ended June 30, 2011 and 2010
| | | | | | | | |
| | | 2011 | | | 2010 | |
Operations: | | | | | | | | |
Net investment income | | $ | 33,202,621 | | | $ | 31,722,118 | |
Net realized gain on investments | | | 4,995,471 | | | | 592,049 | |
Net change in unrealized appreciation/depreciation | | | (6,910,375 | ) | | | 20,690,042 | |
| | | | | | | | |
Net increase in net assets resulting from operations | | | 31,287,717 | | | | 53,004,209 | |
Distributions from net investment income | | | (33,202,621 | ) | | | (31,722,118 | ) |
Distributions from capital gains | | | (2,195,987 | ) | | | (1,628,317 | ) |
Net fund share transactions (Note 4) | | | 17,839,034 | | | | 74,320,068 | |
| | | | | | | | |
Total increase | | | 13,728,143 | | | | 93,973,842 | |
Net assets: | | | | | | | | |
Beginning of year | | | 882,896,882 | | | | 788,923,040 | |
| | | | | | | | |
End of year | | $ | 896,625,025 | | | $ | 882,896,882 | |
| | | | | | | | |
FINANCIAL HIGHLIGHTS
| | | | | | | | | | | | | | | | | | | | |
| Selected data for a share outstanding: | | For the years ended June 30, | |
| | | 2011 | | | 2010 | | | 2009 | | | 2008 | | | 2007 | |
Net asset value, beginning of year | | | $7.67 | | | | $7.49 | | | | $7.39 | | | | $7.43 | | | | $7.40 | |
| | | | | | | | | | | | | | | | | | | | |
Income from investment operations: | | | | | | | | | | | | | | | | | | | | |
Net investment income | | | 0.29 | | | | 0.29 | | | | 0.29 | | | | 0.29 | | | | 0.30 | |
Net gains/(losses) on securities, both realized and unrealized | | | (0.02 | ) | | | 0.20 | | | | 0.11 | | | | (0.04 | ) | | | 0.04 | |
| | | | | | | | | | | | | | | | | | | | |
Total from investment operations | | | 0.27 | | | | 0.49 | | | | 0.40 | | | | 0.25 | | | | 0.34 | |
Less distributions: | | | | | | | | | | | | | | | | | | | | |
Distributions from net investment income | | | (0.29 | ) | | | (0.29 | ) | | | (0.29 | ) | | | (0.29 | ) | | | (0.30 | ) |
Distributions from capital gains | | | (0.02 | ) | | | (0.02 | ) | | | (0.01 | ) | | | — | (b) | | | (0.01 | ) |
| | | | | | | | | | | | | | | | | | | | |
Net asset value, end of year | | | $7.63 | | | | $7.67 | | | | $7.49 | | | | $7.39 | | | | $7.43 | |
| | | | | | | | | | | | | | | | | | | | |
Total return | | | 3.57% | | | | 6.58% | | | | 5.65% | | | | 3.47% | | | | 4.51% | |
Net assets, end of year (in thousands) | | | $896,625 | | | | $882,897 | | | | $788,923 | | | | $734,613 | | | | $702,473 | |
Ratio of net expenses to average net assets (a) | | | 0.58% | | | | 0.58% | | | | 0.58% | | | | 0.58% | | | | 0.58% | |
Ratio of net investment income to average net assets | | | 3.78% | | | | 3.81% | | | | 3.99% | | | | 3.94% | | | | 3.94% | |
Portfolio turnover | | | 11.42% | | | | 4.76% | | | | 6.09% | | | | 5.69% | | | | 6.76% | |
| (a) | | Percentages are after custodian reduction for which no recovery will be sought. |
| | | Percentages before custodian reduction were: |
| | | .58% for 2011; .58% for 2010; .58% for 2009; .58% for 2008; and .58% for 2007. |
| (b) | | Rounds to less than $0.01. |
The accompanying notes are an integral part of the financial statements.
12
DUPREE MUTUAL FUNDS — KENTUCKY TAX-FREE SHORT-TO-MEDIUM SERIES | |
SCHEDULE OF PORTFOLIO INVESTMENTS
Kentucky Municipal Bonds — 100%
June 30, 2011
| | | | | | | | | | | | | | | | | | |
| Bond Description | | Coupon | | | Maturity Date | | | Rating# | | Par Value | | | Fair Value | |
| | | | | | | | | | | | | | | | | | |
| INSURED MUNICIPAL BONDS | | | | | | | | | | | | | | | | | | |
| 70.98% of Net Assets | | | | | | | | | | | | | | | | | | |
Boone County School District Finance Corporation | | | 4.000 | % | | | 8/1/2018 | | | Aa3 | | $ | 145,000 | | | $ | 154,558 | |
Bourbon County Public Project | | | 3.800 | | | | 2/1/2019 | | | Aa3 | | | 260,000 | | | | 273,489 | |
Bowling Green General Obligation — Series A | | | 4.000 | | | | 6/1/2016 | | | Aa2 | | | 375,000 | | | | 400,564 | |
Boyle County Centre College | | | 5.000 | | | | 6/1/2018 | | | A3/A-* | | | 200,000 | | | | 224,074 | |
Breathitt County School District Finance Corporation | | | 3.875 | | | | 7/1/2017 | | | Aa3 | | | 280,000 | | | | 301,440 | |
Bullitt County KY School District Finance Corporation | | | 4.000 | | | | 10/1/2014 | | | Aa3 | | | 150,000 | | | | 163,860 | |
Christian County School District Finance Corporation | | | 4.000 | | | | 8/1/2019 | | | Aa3 | | | 720,000 | | | | 748,606 | |
Clay County School District Finance Corporation | | | 3.750 | | | | 6/1/2017 | | | Aa3 | | | 210,000 | | | | 221,831 | |
Fayette County KY School District Finance Corporation | | | 4.000 | | | | 6/1/2019 | | | Aa2/AA+* | | | 140,000 | | | | 148,131 | |
Hardin County School District Finance Corporation | | | 4.000 | | | | 2/1/2019 | | | Aa3 | | | 1,475,000 | | | | 1,524,752 | |
Jefferson County School District Finance Corporation | | | 5.250 | | | | 1/1/2017 | | | Aa2/AA+* | | | 200,000 | | | | 232,352 | |
Jessamine County KY School District | | | 4.100 | | | | 1/1/2018 | | | Aa3 | | | 100,000 | | | | 106,059 | |
Kenton County KY School District Finance Corporation | | | 5.000 | | | | 6/1/2016 | | | Aa3 | | | 250,000 | | | | 273,545 | |
KY Asset Liability Commission | | | 5.000 | | | | 5/1/2016 | | | Aa3/A+*/AA-@ | | | 1,000,000 | | | | 1,112,960 | |
KY Asset Liability Project Notes | | | 5.000 | | | | 9/1/2016 | | | Aa2/AA*/AA-@ | | | 2,000,000 | | | | 2,227,720 | |
KY Asset Liability Project Notes | | | 5.000 | | | | 9/1/2015 | | | Aa2/AA*/AA-@ | | | 275,000 | | | | 314,474 | |
KY Asset Liability Project Notes | | | 4.500 | | | | 9/1/2016 | | | Aa2/AA*/AA-@ | | | 175,000 | | | | 198,776 | |
KY Asset Liability Project Notes | | | 5.000 | ^ | | | 9/1/2017 | | | Aa2/AA*/AA-@ | | | 1,500,000 | | | | 1,740,075 | |
KY Asset Liability | | | 4.300 | | | | 9/1/2019 | | | Aa2/AA*/AA-@ | | | 400,000 | | | | 432,116 | |
KY Asset Liability Commission University of KY Project | | | 5.000 | | | | 10/1/2019 | | | Aa2/AA-* | | | 320,000 | | | | 358,941 | |
KY Asset Liability University of Kentucky Project Notes | | | 5.000 | | | | 10/1/2016 | | | Aa2/AA-* | | | 1,250,000 | | | | 1,416,850 | |
KY Asset Liability Project Notes | | | 4.400 | | | | 10/1/2019 | | | Aa2/AA-* | | | 1,750,000 | | | | 1,852,813 | |
KY Economic Development Finance Authority — Norton Health | | | 6.000 | | | | 10/1/2018 | | | Baa1/BBB* | | | 560,000 | | | | 590,094 | |
KY Rural Water Finance Corporation | | | 3.625 | | | | 2/1/2016 | | | Baa1/AA-* | | | 350,000 | | | | 364,070 | |
KY Rural Water Finance Corporation | | | 4.000 | | | | 2/1/2014 | | | Baa1/AA-* | | | 300,000 | | | | 315,756 | |
KY State Property & Building #84 | | | 5.000 | | | | 8/1/2019 | | | Aa3/A+*/AA-@ | | | 1,000,000 | | | | 1,128,840 | |
Ky State Property & Building #87 | | | 5.000 | | | | 3/1/2017 | | | Aa3/A+*/AA-@ | | | 850,000 | | | | 960,687 | |
KY State Property & Building #87 | | | 5.000 | | | | 3/1/2020 | | | Aa3/A+*/AA-@ | | | 3,000,000 | | | | 3,282,690 | |
KY State Property & Building #82 | | | 5.250 | | | | 10/1/2013 | | | Aa3/AA+*/AA-@ | | | 500,000 | | | | 548,035 | |
KY State Property & Building #82 | | | 5.250 | | | | 10/1/2015 | | | Aa3/AA+*/AA-@ | | | 2,525,000 | | | | 2,891,176 | |
KY State Property & Building #82 | | | 5.250 | | | | 10/1/2017 | | | Aa3/AA+*/AA-@ | | | 1,260,000 | | | | 1,468,883 | |
Ky State Property & Building #85 | | | 5.000 | | | | 8/1/2016 | | | Aa3/AA+*/AA-@ | | | 835,000 | | | | 936,987 | |
KY State Property & Building #88 | | | 5.000 | | | | 11/1/2014 | | | Aa3/A+*/AA-@ | | | 1,000,000 | | | | 1,117,610 | |
KY State Property & Building #88 | | | 5.000 | | | | 11/1/2015 | | | Aa3/A+*/AA-@ | | | 955,000 | | | | 1,085,310 | |
KY State Property & Building #76 | | | 5.500 | | | | 8/1/2018 | | | Aa3/A+*/AA-@ | | | 1,415,000 | | | | 1,648,107 | |
KY State Property & Building #83 | | | 5.000 | | | | 10/1/2016 | | | Aa3/A+*/AA-@ | | | 775,000 | | | | 885,368 | |
KY State Property & Building #83 | | | 5.000 | | | | 10/1/2019 | | | Aa3/A+*/AA-@ | | | 1,750,000 | | | | 1,979,513 | |
KY State Property & Building #89 | | | 5.000 | | | | 11/1/2014 | | | Aa3/AA+*/AA-@ | | | 2,000,000 | | | | 2,234,540 | |
KY State Property & Building #89 | | | 5.000 | | | | 11/1/2015 | | | Aa3/AA+*/AA-@ | | | 2,230,000 | | | | 2,536,313 | |
KY State Turnpike Authority Economic Development | | | 5.250 | | | | 7/1/2014 | | | Aa2/AA+*/AA-@ | | | 500,000 | | | | 562,225 | |
KY State Turnpike Authority Economic Development | | | 5.000 | | | | 7/1/2017 | | | Aa2/AA+*/AA-@ | | | 2,570,000 | | | | 2,920,856 | |
Lexington Fayette Urban County Government Public Property | | | 4.000 | | | | 5/1/2017 | | | Aa2/AA* | | | 180,000 | | | | 197,651 | |
Louisville & Jefferson County Metropolitian Sewer | | | 5.000 | | | | 5/15/2018 | | | Aa3/AA-*/AA-@ | | | 1,220,000 | | | | 1,350,272 | |
Louisville & Jefferson County Metropolitian Sewer | | | 5.000 | | | | 5/15/2016 | | | Aa3/AA+*/AA-@ | | | 500,000 | | | | 560,015 | |
Louisville & Jefferson County Metropolitian Sewer | | | 5.000 | | | | 5/15/2016 | | | Aa3/AA-* | | | 100,000 | | | | 114,768 | |
Madison County KY School District Finance Corporation | | | 3.600 | | | | 2/1/2017 | | | Aa3 | | | 300,000 | | | | 315,675 | |
Oldham County School Building Corporation | | | 4.375 | | | | 6/1/2018 | | | Aa3 | | | 2,570,000 | | | | 2,826,126 | |
Paducah Electric Plant | | | 3.000 | | | | 10/1/2014 | | | Aa3/A@ | | | 750,000 | | | | 788,505 | |
Warren County KY School District Finance Corporation | | | 4.000 | | | | 2/1/2015 | | | Aa3 | | | 785,000 | | | | 849,817 | |
Warren County KY School District Finance Corporation | | | 4.000 | | | | 2/1/2016 | | | Aa3 | | | 1,330,000 | | | | 1,453,916 | |
Western KY University | | | 3.000 | | | | 9/1/2014 | | | Aa3/AA+* | | | 1,000,000 | | | | 1,050,050 | |
| | | | | | | | | | | | | | | | | | |
| | | | | | | | | | | | | | | | | 51,391,841 | |
| LEASE REVENUE BONDS | | | | | | | | | | | | | | | | | | |
| 13.94% of Net Assets | | | | | | | | | | | | | | | | | | |
Bullitt County KY School District Finance Corporation | | | 4.100 | | | | 10/1/2018 | | | Aa3 | | | 165,000 | | | | 172,613 | |
Gallatin County School District Finance Corporation | | | 4.000 | | | | 5/1/2016 | | | Aa3 | | | 175,000 | | | | 193,779 | |
The accompanying footnotes are an integral part of the financial statements.
13
DUPREE MUTUAL FUNDS — KENTUCKY TAX-FREE SHORT-TO-MEDIUM SERIES | |
SCHEDULE OF PORTFOLIO INVESTMENTS
Kentucky Municipal Bonds — 100%
June 30, 2011
| | | | | | | | | | | | | | | | | | |
| Bond Description | | Coupon | | | Maturity Date | | | Rating# | | Par Value | | | Fair Value | |
| | | | | | | | | | | | | | | | | | |
Grant County School District Finance Corporation | | | 3.750 | % | | | 6/1/2017 | | | Aa3 | | $ | 190,000 | | | $ | 206,891 | |
Hazard KY Independent School District Finance Corporation | | | 3.850 | | | | 9/1/2017 | | | Aa3 | | | 200,000 | | | | 214,478 | |
KY Association of Counties | | | 4.250 | | | | 2/1/2017 | | | A+* | | | 500,000 | | | | 541,545 | |
KY Association of Counties Finance | | | 4.000 | | | | 2/1/2018 | | | A+* | | | 115,000 | | | | 121,120 | |
KY Association of Counties Finance | | | 4.250 | | | | 2/1/2019 | | | A+* | | | 255,000 | | | | 270,782 | |
KY Infrastructure Authority — Series A | | | 5.250 | | | | 6/1/2014 | | | Aa3/A+*/AA-@ | | | 1,240,000 | | | | 1,240,694 | |
KY Infrastructure Authority | | | 5.250 | | | | 8/1/2013 | | | AA* | | | 1,185,000 | | | | 1,294,636 | |
KY State Property & Building #94 | | | 5.000 | | | | 5/1/2014 | | | Aa3/A+*/AA-@ | | | 1,000,000 | | | | 1,101,210 | |
KY State Property & Building #94 | | | 5.000 | | | | 5/1/2015 | | | Aa3/A+*/AA-@ | | | 1,245,000 | | | | 1,391,014 | |
KY State Property & Building #94 | | | 5.000 | | | | 5/1/2017 | | | Aa3/A+*/AA-@ | | | 500,000 | | | | 568,630 | |
KY State Property & Building #93 | | | 5.250 | | | | 2/1/2018 | | | Aa3/A+*/AA-@ | | | 295,000 | | | | 337,421 | |
KY State Property & Building | | | 5.000 | | | | 11/1/2015 | | | Aa3/A+*/AA-@ | | | 250,000 | | | | 284,678 | |
KY State Property & Building | | | 5.000 | | | | 11/1/2014 | | | Aa3/A+*/AA-@ | | | 750,000 | | | | 838,208 | |
KY State Property & Building #100 | | | 5.000 | ** | | | 8/1/2017 | | | Aa3/A+*/AA-@ | | | 500,000 | | | | 568,040 | |
KY Property & Building #95 | | | 5.000 | | | | 8/1/2017 | | | Aa3/A+*/AA-@ | | | 200,000 | | | | 227,456 | |
Pulaski County KY Public Property | | | 3.750 | | | | 12/1/2014 | | | Aa3 | | | 480,000 | | | | 520,210 | |
| | | | | | | | | | | | | | | | | | |
| | | | | | | | | | | | | | | | | 10,093,405 | |
| STATE AND LOCAL MORTGAGE REVENUE BONDS | | | | | | | | | | | | | | | | | | |
| 3.17% of Net Assets | | | | | | | | | | | | | | | | | | |
KY Housing Corporation — Series E | | | 4.875 | | | | 7/1/2023 | | | Aaa/AAA* | | | 1,500,000 | | | | 1,538,205 | |
KY Housing Corporation | | | 4.850 | | | | 1/1/2024 | | | Aaa/AAA* | | | 750,000 | | | | 755,543 | |
| | | | | | | | | | | | | | | | | | |
| | | | | | | | | | | | | | | | | 2,293,748 | |
| MUNICIPAL UTILITY REVENUE BONDS | | | | | | | | | | | | | | | | | | |
| 3.11% of Net Assets | | | | | | | | | | | | | | | | | | |
Louisville & Jefferson County Metropolitan Sewer | | | 5.000 | | | | 5/15/2015 | | | AA3/AA-* | | | 1,000,000 | | | | 1,126,030 | |
Louisville & Jefferson County Metropolitan Sewer | | | 5.000 | | | | 5/15/2015 | | | Aa3/AA-* | | | 1,000,000 | | | | 1,124,830 | |
| | | | | | | | | | | | | | | | | | |
| | | | | | | | | | | | | | | | | 2,250,860 | |
| HOSPITAL AND HEALTHCARE REVENUE BONDS | | | | | | | | | | | | | | | | | | |
| 2.49% of Net Assets | | | | | | | | | | | | | | | | | | |
KY Development Finance Authority — Kings Daughters | | | 5.000 | | | | 2/1/2016 | | | A1/A+*/A+@ | | | 1,000,000 | | | | 1,098,110 | |
KY Development Finance Authority — St. Elizabeth | | | 5.000 | | | | 5/1/2015 | | | AA-*/AA-@ | | | 400,000 | | | | 442,680 | |
KY Economic Development Finance Authority — Catholic Health | | | 4.000 | | | | 5/1/2015 | | | Aa2/AA*/AA@ | | | 250,000 | | | | 264,353 | |
| | | | | | | | | | | | | | | | | | |
| | | | | | | | | | | | | | | | | 1,805,143 | |
| TURNPIKES AND TOLL ROAD BONDS | | | | | | | | | | | | | | | | | | |
| 2.36% of Net Assets | | | | | | | | | | | | | | | | | | |
KY State Turnpike Economic Development Road Revenue | | | 5.000 | | | | 7/1/2014 | | | Aa2/AA+*/AA-@ | | | 750,000 | | | | 838,290 | |
KY State Turnpike Economic Development Road Revenue | | | 5.000 | | | | 7/1/2016 | | | Aa2/AA+*/AA-@ | | | 750,000 | | | | 869,385 | |
| | | | | | | | | | | | | | | | | | |
| | | | | | | | | | | | | | | | | 1,707,675 | |
| CERTIFICATES OF PARTICIPATION BONDS | | | | | | | | | | | | | | | | | | |
| 1.07% of Net Assets | | | | | | | | | | | | | | | | | | |
KY Interlocal School Transportation Assistance Equipment | | | 3.750 | | | | 3/1/2015 | | | Aa3 | | | 770,000 | | | | 772,821 | |
| | | | | | | | | | | | | | | | | | |
| | | | | | | | | | | | | | | | | 772,821 | |
| PREREFUNDED BONDS | | | | | | | | | | | | | | | | | | |
| 1.38% of Net Assets | | | | | | | | | | | | | | | | | | |
KY Development Finance Authority — Norton Health | | | 5.850 | | | | 10/1/2015 | | | BBB* | | | 885,000 | | | | 999,245 | |
| | | | | | | | | | | | | | | | | | |
| | | | | | | | | | | | | | | | | 999,245 | |
| | | | | | | | | | | | | | | | | | |
Total Investments (cost $68,380,615)(See (a) below for further explanation) 98.50% of Net Assets | | | | | | | | | $ | 71,314,738 | |
| | | | | | | | | | | | | | | | | | |
| | * | | Standard and Poor’s Corporation |
| | ** | | When-Issued security or extended settlement — see footnote 1(D) |
| | ^ | | Security is segregated — see footnote 1(D) |
| | @ | | Fitch’s Investors Service |
| | | | All other ratings by Moody’s Investors Service, Inc. |
| | # | | Bond ratings are unaudited and not covered by Report of Independent Registered Public Accounting Firm. |
The accompanying footnotes are an integral part of the financial statements.
14
DUPREE MUTUAL FUNDS — KENTUCKY TAX-FREE SHORT-TO-MEDIUM SERIES | |
SCHEDULE OF PORTFOLIO INVESTMENTS
Kentucky Municipal Bonds — 100%
June 30, 2011
| (a) | | Represents cost for financial reporting and federal income tax purposes and differs from market value by net unrealized appreciation of securities as follows: |
| | | | | | |
| | | | | | |
| | Unrealized appreciation | | $ | 2,990,524 | |
| | Unrealized depreciation | | | (56,401 | ) |
| | | | | | |
| | Net unrealized appreciation | | $ | 2,934,123 | |
| | | | | | |
Other Information
The following is a summary of the inputs used, as of June 30, 2011, involving the Fund’s assets and liabilities carried at fair value. The inputs or methodology used for valuing securities may not be an indication of the risk associated with investing in those securities. For more information on valuation inputs, and their aggregation into the levels used the the table below, please refer to the Security Valuation section in the accompanying Notes to Financial Statements.
| | | | | | |
| | | | | | |
| | | Valuation Inputs | | Municipal Bonds | |
Level 1 | | Quoted Prices | | $ | — | |
Level 2 | | Other Significant Observable Inputs | | | 71,314,738 | |
Level 3 | | Significant Unobservable Inputs | | | — | |
| | | | | | |
| | | | $ | 71,314,738 | |
| | | | | | |
The accompanying footnotes are an integral part of the financial statements.
15
KENTUCKY TAX-FREE SHORT-TO-MEDIUM SERIES
STATEMENT OF ASSETS AND LIABILITIES
June 30, 2011
| | | | | | | | |
ASSETS: | | | | | | | | |
Investments in securities, at fair value (Cost: $68,380,615) | | | | | | $ | 71,314,738 | |
Cash | | | | | | | 897,554 | |
Interest receivable | | | | | | | 866,913 | |
Prepaid expenses | | | | | | | 823 | |
| | | | | | | | |
Total assets | | | | | | | 73,080,028 | |
LIABILITIES: | | | | | | | | |
Payable for: | | | | | | | | |
Investments purchased | | | 571,155 | | | | | |
Distributions to shareholders | | | 43,521 | | | | | |
Fund shares redeemed | | | 2,920 | | | | | |
Investment advisory fee | | | 29,778 | | | | | |
Transfer agent fee | | | 7,153 | | | | | |
Accrued expenses | | | 20,043 | | | | | |
| | | | | | | | |
Total liabilities | | | | | | | 674,570 | |
| | | | | | | | |
NET ASSETS: | | | | | | | | |
Capital | | | | | | | 70,502,009 | |
Net accumulated realized loss on investment transactions | | | | | | | (1,030,674 | ) |
Net unrealized appreciation in value of investments | | | | | | | 2,934,123 | |
| | | | | | | | |
Net assets at value | | | | | | $ | 72,405,458 | |
| | | | | | | | |
NET ASSET VALUE, offering price and redemption price per share ($72,405,458 ÷ 13,421,454 shares outstanding; unlimited number of shares authorized; no par value) | | | | | | $ | 5.39 | |
| | | | | | | | |
STATEMENT OF OPERATIONS
For the year ended June 30, 2011
| | | | |
Net investment income: | | | | |
Interest income | | $ | 2,222,521 | |
| | | | |
Expenses: | | | | |
Investment advisory fee | | | 351,989 | |
Transfer agent fee | | | 90,478 | |
Custodian expense | | | 11,111 | |
Professional fees | | | 15,470 | |
Trustee fees | | | 8,863 | |
Other expenses | | | 30,728 | |
| | | | |
Total expenses | | | 508,639 | |
Custodian expense reduction | | | (709 | ) |
| | | | |
Net expenses | | | 507,930 | |
| | | | |
Net investment income | | | 1,714,591 | |
| | | | |
Realized and unrealized gain on investments: | | | | |
Net realized gain | | | 199,821 | |
Net change in unrealized appreciation/depreciation | | | 177,100 | |
| | | | |
Net realized and unrealized gain on investments | | | 376,921 | |
| | | | |
Net increase in net assets resulting from operations | | $ | 2,091,512 | |
| | | | |
The accompanying notes are an integral part of the financial statements.
16
KENTUCKY TAX-FREE SHORT-TO-MEDIUM SERIES
STATEMENTS OF CHANGES IN NET ASSETS
For the years ended June 30, 2011 and 2010
| | | | | | | | |
| | | 2011 | | | 2010 | |
Operations: | | | | | | | | |
Net investment income | | $ | 1,714,591 | | | $ | 1,809,942 | |
Net realized gain on investments | | | 199,821 | | | | 150,390 | |
Net change in unrealized appreciation/depreciation | | | 177,100 | | | | 1,168,163 | |
| | | | | | | | |
Net increase in net assets resulting from operations | | | 2,091,512 | | | | 3,128,495 | |
Distributions from net investment income | | | (1,714,591 | ) | | | (1,809,942 | ) |
Net fund share transactions (Note 4) | | | 2,862,186 | | | | 7,277,772 | |
| | | | | | | | |
Total increase | | | 3,239,107 | | | | 8,596,325 | |
Net assets: | | | | | | | | |
Beginning of year | | | 69,166,351 | | | | 60,570,026 | |
| | | | | | | | |
End of year | | $ | 72,405,458 | | | $ | 69,166,351 | |
| | | | | | | | |
FINANCIAL HIGHLIGHTS
| | | | | | | | | | | | | | | | | | | | |
| Selected data for a share outstanding: | | For the years ended June 30, | |
| | | 2011 | | | 2010 | | | 2009 | | | 2008 | | | 2007 | |
Net asset value, beginning of year | | | $5.36 | | | | $5.25 | | | | $5.16 | | | | $5.13 | | | | $5.14 | |
| | | | | | | | | | | | | | | | | | | | |
Income from investment operations: | | | | | | | | | | | | | | | | | | | | |
Net investment income | | | 0.13 | | | | 0.15 | | | | 0.17 | | | | 0.17 | | | | 0.17 | |
Net gains/(losses) on securities, both realized and unrealized | | | 0.03 | | | | 0.11 | | | | 0.09 | | | | 0.03 | | | | (0.01 | ) |
| | | | | | | | | | | | | | | | | | | | |
Total from investment operations | | | 0.16 | | | | 0.26 | | | | 0.26 | | | | 0.20 | | | | 0.16 | |
Less distributions: | | | | | | | | | | | | | | | | | | | | |
Distributions from net investment income | | | (0.13 | ) | | | (0.15 | ) | | | (0.17 | ) | | | (0.17 | ) | | | (0.17 | ) |
| | | | | | | | | | | | | | | | | | | | |
Net asset value, end of year | | | $5.39 | | | | $5.36 | | | | $5.25 | | | | $5.16 | | | | $5.13 | |
| | | | | | | | | | | | | | | | | | | | |
Total return | | | 3.04% | | | | 4.99% | | | | 5.02% | | | | 3.94% | | | | 3.10% | |
Net assets, end of year (in thousands) | | | $72,405 | | | | $69,166 | | | | $60,570 | | | | $53,955 | | | | $61,302 | |
Ratio of net expenses to average net assets (a) | | | 0.72% | | | | 0.72% | | | | 0.72% | | | | 0.72% | | | | 0.72% | |
Ratio of net investment income to average net assets | | | 2.44% | | | | 2.80% | | | | 3.16% | | | | 3.28% | | | | 3.25% | |
Portfolio turnover | | | 15.37% | | | | 20.26% | | | | 15.64% | | | | 14.17% | | | | 4.87% | |
| (a) | | Percentages are after custodian reduction for which no recovery will be sought. |
| | | Percentages before custodian reduction were: |
| | | .72% for 2011; .72% for 2010; .72% for 2009; .73% for 2008; and .72% for 2007. |
The accompanying notes are an integral part of the financial statements.
17
DUPREE MUTUAL FUNDS — MISSISSIPPI TAX-FREE INCOME SERIES
SCHEDULE OF PORTFOLIO INVESTMENTS
Mississippi Municipal Bonds — 100%
June 30, 2011
| | | | | | | | | | | | | | | | | | |
| Bond Description | | Coupon | | | Maturity
Date | | | Rating# | | Par Value | | | Fair Value | |
| | | | | | | | | | | | | | | | | | |
| INSURED MUNICIPAL BONDS | | | | | | | | | | | | | | | |
| 79.34% of Net Assets | | | | | | | | | | | | | | | | | | |
Hinds County MS Revenue Refunding-MS Methodist Hospital | | | 5.600 | % | | | 05/01/2012 | | | NR | | $ | 5,000 | | | $ | 5,085 | |
Jackson MS Municipal Airport Authority | | | 5.000 | | | | 10/01/2031 | | | A3/A-@ | | | 170,000 | | | | 170,437 | |
Medical Center Educational Building Corporation MS Revenue | | | 5.500 | | | | 12/01/2023 | | | Aa2 | | | 120,000 | | | | 130,262 | |
MS Development Bank Special Obligation Jones County Rest Home | | | 5.250 | | | | 04/01/2028 | | | Aa3/AA+* | | | 120,000 | | | | 123,685 | |
MS Development Bank Special Obligation Capital Project | | | 5.000 | | | | 07/01/2031 | | | NR | | | 75,000 | | | | 66,491 | |
MS Development Bank Special Obligation Meridian Water and Sewer | | | 5.125 | | | | 07/01/2026 | | | A* | | | 50,000 | | | | 50,688 | |
MS Development Bank Special Obligation Southaven Water | | | 5.000 | | | | 03/01/2025 | | | A+* | | | 325,000 | | | | 336,486 | |
MS Development Bank Special Obligation Highway Construction | | | 5.000 | | | | 01/01/2027 | | | Aa3/AA-* | | | 125,000 | | | | 132,168 | |
MS Development Bank Special Obligation Highway — Desoto | | | 4.750 | | | | 01/01/2035 | | | Aa3/AA-* | | | 125,000 | | | | 125,624 | |
MS Development Bank Special Obligation Jackson Water/Sewer | | | 5.000 | | | | 09/01/2025 | | | Aa2/AA+* | | | 100,000 | | | | 104,642 | |
MS Development Bank Special Obligation Jackson Water/Sewer | | | 5.000 | | | | 09/01/2029 | | | Aa2/AA+* | | | 60,000 | | | | 61,318 | |
MS Development Bank Special Obligation Jackson Water & Sewer | | | 5.000 | | | | 09/01/2034 | | | Aa2/AA+* | | | 335,000 | | | | 339,184 | |
MS Development Bank Special Obligation Horn Lake | | | 5.000 | | | | 10/01/2020 | | | A* | | | 50,000 | | | | 50,344 | |
MS Development Bank Special Obligation Rankin Utilities | | | 5.000 | | | | 01/01/2028 | | | Aa3/AA+* | | | 55,000 | | | | 56,754 | |
MS Development Bank Special Obligation Capital Improvement | | | 5.250 | | | | 07/01/2026 | | | Aa3/AA+* | | | 125,000 | | | | 130,150 | |
MS Development Bank Special Obligation Lee County School | | | 4.500 | | | | 09/01/2021 | | | A1 | | | 100,000 | | | | 100,605 | |
MD Development Bank Special Obligation Jackson Public | | | 5.375 | | | | 04/01/2028 | | | Aa2 | | | 70,000 | | | | 75,171 | |
MS Development Bank Special Obligation Hinds Community | | | 5.000 | | | | 10/01/2026 | | | Aa2 | | | 85,000 | | | | 90,673 | |
MS Development Bank Special Obligation Hinds College | | | 5.125 | | | | 10/01/2028 | | | Aa2 | | | 100,000 | | | | 106,604 | |
MS Development Bank Special Obligation Hinds College | | | 5.375 | | | | 10/01/2033 | | | Aa2 | | | 60,000 | | | | 63,285 | |
MS Development Bank Special Obligation Hinds Community | | | 5.000 | | | | 04/01/2036 | | | Aa3/AA+* | | | 100,000 | | | | 100,606 | |
MS Development Bank Special Obligation Capital Projects | | | 5.875 | | | | 07/01/2024 | | | NR | | | 55,000 | | | | 53,803 | |
MS Development Bank Special Obligation Capital Projects | | | 5.000 | | | | 07/01/2024 | | | NR | | | 370,000 | | | | 348,059 | |
MS Development Bank Special Obligation Desoto County | | | 5.000 | | | | 07/01/2032 | | | A* | | | 45,000 | | | | 45,558 | |
MS Development Bank Special Obligation Jackson Water & Sewer | | | 5.000 | | | | 09/01/2032 | | | Aa2/A+* | | | 150,000 | | | | 151,040 | |
MS Home Corporation Single Family Mortgage — Series E-1 | | | 5.050 | | | | 12/01/2028 | | | Aaa | | | 45,000 | | | | 45,873 | |
MS Development Bank Special Obligation Lowndes County | | | 5.000 | | | | 07/01/2022 | | | Aa3/AA+* | | | 80,000 | | | | 84,537 | |
MS Development Bank Special Obligation Lowndes County | | | 5.000 | | | | 07/01/2027 | | | Aa3/AA+* | | | 150,000 | | | | 153,749 | |
MS Development Bank Special Obligation Covington Hospital | | | 5.000 | | | | 07/01/2027 | | | A* | | | 150,000 | | | | 142,851 | |
MS Development Special Obligation Madison County Highway | | | 5.000 | | | | 01/01/2027 | | | Aa3/AA-* | | | 295,000 | | | | 309,207 | |
MS Development Bank Special Obligation Highway Construction | | | 5.000 | | | | 01/01/2027 | | | Aa3/AA-* | | | 175,000 | | | | 184,933 | |
MS Development Bank Special Obligation Highway Construction | | | 4.750 | | | | 01/01/2031 | | | Aa3/AA-* | | | 125,000 | | | | 127,876 | |
MS Development Bank Special Obligation Jones County College | | | 5.100 | | | | 03/01/2028 | | | AA+* | | | 55,000 | | | | 58,362 | |
MS Development Bank Special Obligation Jones County Junior | | | 5.000 | | | | 03/01/2033 | | | AA+* | | | 150,000 | | | | 154,319 | |
MS Development Bank Special Obligation Jones County Junior | | | 5.125 | | | | 03/01/2039 | | | AA+* | | | 45,000 | | | | 46,509 | |
MS State University Educational Building Corporate Revenue | | | 5.000 | | | | 08/01/2024 | | | Aa2/A+*/AA@ | | | 225,000 | | | | 238,619 | |
MS State University Educational Building Corporation | | | 5.000 | | | | 08/01/2028 | | | Aa2/A+*/AA@ | | | 30,000 | | | | 30,880 | |
Olive Branch MS Public Improvement | | | 4.125 | | | | 06/01/2022 | | | Aa2 | | | 100,000 | | | | 101,018 | |
Pearl River County MS Certificate of Participation | | | 4.500 | | | | 04/01/2021 | | | Baa1 | | | 200,000 | | | | 203,464 | |
University Southern MS Education Building — Series A | | | 5.000 | | | | 03/01/2022 | | | Aa2 | | | 100,000 | | | | 106,983 | |
University Southern MS Educational Building Corporation | | | 5.000 | | | | 03/01/2032 | | | Aa2 | | | 50,000 | | | | 50,681 | |
| | | | | | | | | | | | | | | | | | |
| | | | | | | | | | | | | | | | | 5,058,580 | |
| UNIVERSITY CONSOLIDATED EDUCATION AND BUILDING REVENUE BONDS | | | | | | | | | | | |
| 8.41% of Net Assets | | | | | | | | | | | | | | | | | | |
Alcorn State University Educational Building MS Revenue | | | 5.125 | | | | 09/01/2034 | | | Aa2 | | | 95,000 | | | | 96,738 | |
Jackson State University Education Building | | | 5.000 | | | | 03/01/2034 | | | Aa2/AA-* | | | 175,000 | | | | 176,458 | |
MS State University Educational Building Corporate Revenue | | | 5.250 | | | | 08/01/2033 | | | Aa2/AA@ | | | 50,000 | | | | 52,103 | |
University Southern MS Educational Building Corporation | | | 5.125 | | | | 09/01/2029 | | | Aa2/A+* | | | 100,000 | | | | 105,063 | |
University Southern MS Education Building Athletics | | | 5.000 | | | | 03/01/2034 | | | Aa2 | | | 105,000 | | | | 105,920 | |
| | | | | | | | | | | | | | | | | | |
| | | | | | | | | | | | | | | | | 536,281 | |
| PUBLIC FACILITIES REVENUE BONDS | | | | | | | | | | | | | | | |
| 4.83% of Net Assets | | | | | | | | | | | | | | | | | | |
MS Development Bank Special Obligations Department of Correction | | | 5.250 | | | | 08/01/2027 | | | AA-*/AA@ | | | 50,000 | | | | 53,114 | |
MS Development Bank Special Obligations Department of Correction | | | 5.250 | | | | 08/01/2027 | | | AA-*/AA@ | | | 240,000 | | | | 254,947 | |
| | | | | | | | | | | | | | | | | | |
| | | | | | | | | | | | | | | | | 308,061 | |
The accompanying footnotes are an integral part of the financial statements.
18
DUPREE MUTUAL FUNDS — MISSISSIPPI TAX-FREE INCOME SERIES
SCHEDULE OF PORTFOLIO INVESTMENTS
Mississippi Municipal Bonds — 100%
June 30, 2011
| | | | | | | | | | | | | | | | | | |
| Bond Description | | Coupon | | | Maturity
Date | | | Rating# | | Par Value | | | Fair Value | |
| | | | | | | | | | | | | | | | | | |
| LEASE REVENUE BONDS | | | | | | | | | | | | | | | |
| 3.59% of Net Assets | | | | | | | | | | | | | | | | | | |
MS Development Bank Special Obligation Desoto County | | | 5.250 | % | | | 07/01/2031 | | | A* | | $ | 225,000 | | | $ | 229,055 | |
| | | | | | | | | | | | | | | | | | |
| | | | | | | | | | | | | | | | | 229,055 | |
| GENERAL OBLIGATION BONDS | | | | | | | | | | | | | | | |
| 1.58% of Net Assets | | | | | | | | | | | | | | | | | | |
Jackson MS Redevelopment Authority Urban Renewal Revenue | | | 5.600 | | | | 11/01/2021 | | | Aa3 | | | 20,000 | | | | 20,001 | |
MS State General Obligation | | | 5.100 | | | | 11/15/2012 | | | Aa2/AA*/AA+@ | | | 10,000 | | | | 10,611 | |
MS State Refunding — Series A | | | 5.250 | | | | 11/01/2019 | | | Aa2/AA*/AA+@ | | | 50,000 | | | | 59,418 | |
Richland MS Tax Increment | | | 5.600 | | | | 06/01/2013 | | | NR | | | 10,000 | | | | 10,445 | |
| | | | | | | | | | | | | | | | | | |
| | | | | | | | | | | | | | | | | 100,475 | |
| ESCROWED TO MATURITY BONDS | | | | | | | | | | | | | | | |
| .60% of Net Assets | | | | | | | | | | | | | | | | | | |
Harrison County MS Wastewater Management District | | | 5.000 | | | | 02/01/2015 | | | Baa1/AAA* | | | 25,000 | | | | 27,747 | |
MS Gulf Coast Regional Wastewater Treatment Facilities | | | 7.000 | | | | 07/01/2012 | | | NR | | | 10,000 | | | | 10,313 | |
| | | | | | | | | | | | | | | | | | |
| | | | | | | | | | | | | | | | | 38,060 | |
| PREREFUNDED BONDS | | | | | | | | | | | | | | | |
| .25% of Net Assets | | | | | | | | | | | | | | | | | | |
MS Development Bank Special Obligation Gulfport Combined Water | | | 5.500 | | | | 07/01/2015 | | | Aa3/AA+* | | | 10,000 | | | | 10,695 | |
MS Development Bank Special Obligation Desoto County | | | 5.900 | | | | 07/01/2021 | | | A* | | | 5,000 | | | | 5,001 | |
| | | | | | | | | | | | | | | | | | |
| | | | | | | | | | | | | | | | | 15,696 | |
| | | | | | | | | | | | | | | | | | |
Total Investments (cost $6,271,075)(See (a) below for further explanation) 98.59% of Net Assets | | | | | | | | | $ | 6,286,209 | |
| | | | | | | | | | | | | | | | | | |
| | * | | Standard and Poor’s Corporation |
| | @ | | Fitch’s Investors Service |
| | | | All other ratings by Moody’s Investors Service, Inc. |
| | # | | Bond ratings are unaudited and not covered by Report of Independent Registered Public Accounting Firm. |
| (a) | | Represents cost for financial reporting and federal income tax purposes and differs from market value by net unrealized appreciation of securities as follows: |
| | | | | | |
| | | | | | |
| | Unrealized appreciation | | $ | 110,587 | |
| | Unrealized depreciation | | | (95,453 | ) |
| | | | | | |
| | Net unrealized appreciation | | $ | 15,134 | |
| | | | | | |
Other Information
The following is a summary of the inputs used, as of June 30, 2011, involving the Fund’s assets and liabilities carried at fair value. The inputs or methodology used for valuing securities may not be an indication of the risk associated with investing in those securities. For more information on valuation inputs, and their aggregation into the levels used the the table below, please refer to the Security Valuation section in the accompanying Notes to Financial Statements.
| | | | | | |
| | | Valuation Inputs | | Municipal Bonds | |
| | | | | | |
Level 1 | | Quoted Prices | | $ | — | |
Level 2 | | Other Significant Observable Inputs | | | 6,286,209 | |
Level 3 | | Significant Unobservable Inputs | | | — | |
| | | | | | |
| | | | $ | 6,286,209 | |
| | | | | | |
The accompanying footnotes are an integral part of the financial statements.
19
MISSISSIPPI TAX-FREE INCOME SERIES
STATEMENT OF ASSETS AND LIABILITIES
June 30, 2011
| | | | | | | | |
ASSETS: | | | | | | | | |
Investments in securities, at fair value (Cost: $6,271,075) | | | | | | $ | 6,286,209 | |
Cash | | | | | | | 17,843 | |
Interest receivable | | | | | | | 115,491 | |
Prepaid expenses | | | | | | | 19 | |
| | | | | | | | |
Total assets | | | | | | | 6,419,562 | |
LIABILITIES: | | | | | | | | |
Payable for: | | | | | | | | |
Distributions to shareholders | | | 31,821 | | | | | |
Fund shares redeemed | | | 193 | | | | | |
Investment advisory fee | | | 1,694 | | | | | |
Transfer agent fee | | | 1,712 | | | | | |
Accrued expenses | | | 8,075 | | | | | |
| | | | | | | | |
Total liabilities | | | | | | | 43,495 | |
| | | | | | | | |
NET ASSETS: | | | | | | | | |
Capital | | | | | | | 6,344,865 | |
Net accumulated realized gain on investment transactions | | | | | | | 16,068 | |
Net unrealized appreciation in value of investments | | | | | | | 15,134 | |
| | | | | | | | |
Net assets at value | | | | | | $ | 6,376,067 | |
| | | | | | | | |
NET ASSET VALUE, offering price and redemption price per share ($6,376,067 ÷ 562,562 shares outstanding; unlimited number of shares authorized; no par value) | | | | | | $ | 11.33 | |
| | | | | | | | |
STATEMENT OF OPERATIONS
For the year ended June 30, 2011
| | | | |
Net investment income: | | | | |
Interest income | | $ | 278,953 | |
| | | | |
Expenses: | | | | |
Investment advisory fee | | | 31,437 | |
Transfer agent fee | | | 9,431 | |
Custodian expense | | | 1,222 | |
Pricing fees | | | 5,000 | |
Professional fees | | | 1,379 | |
Trustee fees | | | 787 | |
Registration fees | | | 1,006 | |
Other expenses | | | 2,484 | |
| | | | |
Total expenses | | | 52,746 | |
Fees waived by Adviser | | | (16,167 | ) |
Custodian expense reduction | | | (65 | ) |
| | | | |
Net expenses | | | 36,514 | |
| | | | |
Net investment income | | | 242,439 | |
| | | | |
Realized and unrealized gain/(loss) on investments: | | | | |
Net realized gain | | | 49,358 | |
Net change in unrealized appreciation/depreciation | | | (90,754 | ) |
| | | | |
Net realized and unrealized loss on investments | | | (41,396 | ) |
| | | | |
Net increase in net assets resulting from operations | | $ | 201,043 | |
| | | | |
The accompanying notes are an integral part of the financial statements.
20
MISSISSIPPI TAX-FREE INCOME SERIES
STATEMENTS OF CHANGES IN NET ASSETS
For the years ended June 30, 2011 and 2010
| | | | | | | | |
| | | 2011 | | | 2010 | |
Operations: | | | | | | | | |
Net investment income | | $ | 242,439 | | | $ | 218,128 | |
Net realized gain/(loss) on investments | | | 49,358 | | | | (9,789 | ) |
Net change in unrealized appreciation/depreciation | | | (90,754 | ) | | | 184,498 | |
| | | | | | | | |
Net increase in net assets resulting from operations | | | 201,043 | | | | 392,837 | |
Distributions from net investment income | | | (242,439 | ) | | | (218,128 | ) |
Net fund share transactions (Note 4) | | | 96,180 | | | | 1,145,823 | |
| | | | | | | | |
Total increase | | | 54,784 | | | | 1,320,532 | |
Net assets: | | | | | | | | |
Beginning of year | | | 6,321,283 | | | | 5,000,751 | |
| | | | | | | | |
End of year | | $ | 6,376,067 | | | $ | 6,321,283 | |
| | | | | | | | |
FINANCIAL HIGHLIGHTS
| | | | | | | | | | | | | | | | | | | | |
| Selected data for a share outstanding: | | For the years ended June 30, | |
| | | 2011 | | | 2010 | | | 2009 | | | 2008 | | | 2007 | |
Net asset value, beginning of year | | | $11.41 | | | | $11.03 | | | | $11.08 | | | | $11.24 | | | | $11.25 | |
| | | | | | | | | | | | | | | | | | | | |
Income from investment operations: | | | | | | | | | | | | | | | | | | | | |
Net investment income | | | 0.44 | | | | 0.45 | | | | 0.45 | | | | 0.45 | | | | 0.45 | |
Net gains/(losses) on securities, both realized and unrealized | | | (0.08 | ) | | | 0.38 | | | | (0.05 | ) | | | (0.16 | ) | | | 0.04 | |
| | | | | | | | | | | | | | | | | | | | |
Total from investment operations | | | 0.36 | | | | 0.83 | | | | 0.40 | | | | 0.29 | | | | 0.49 | |
Less distributions: | | | | | | | | | | | | | | | | | | | | |
Distributions from net investment income | | | (0.44 | ) | | | (0.45 | ) | | | (0.45 | ) | | | (0.45 | ) | | | (0.45 | ) |
Distributions from capital gains | | | — | | | | — | | | | — | (b) | | | — | (b) | | | (0.05 | ) |
| | | | | | | | | | | | | | | | | | | | |
Net asset value, end of year | | | $11.33 | | | | $11.41 | | | | $11.03 | | | | $11.08 | | | | $11.24 | |
| | | | | | | | | | | | | | | | | | | | |
Total return | | | 3.19% | | | | 7.65% | | | | 3.72% | | | | 2.64% | | | | 4.39% | |
Net assets, end of year (in thousands) | | | $6,376 | | | | $6,321 | | | | $5,001 | | | | $4,447 | | | | $5,103 | |
Ratio of net expenses to average net assets (a) | | | 0.58% | | | | 0.45% | | | | 0.44% | | | | 0.45% | | | | 0.45% | |
Ratio of net investment income to average net assets | | | 3.86% | | | | 3.99% | | | | 4.11% | | | | 4.02% | | | | 3.98% | |
Portfolio turnover | | | 20.53% | | | | 10.04% | | | | 9.30% | | | | 2.79% | | | | 11.57% | |
| (a) | | Percentages are after expenses waived by Adviser and Custodian reduction. No recovery of these waivers and reductions will be sought. |
| | | Expenses waived by Adviser and Custodian reduction were: |
| | | .26% and .0% for 2011; .46% and .0% for 2010; .53% and .08% for 2009; .46% and .10% for 2008; and .43% and .09% for 2007, respectively. |
| (b) | | Rounds to less than $0.01. |
The accompanying notes are an integral part of the financial statements.
21
DUPREE MUTUAL FUNDS — NORTH CAROLINA TAX-FREE INCOME SERIES | |
SCHEDULE OF PORTFOLIO INVESTMENTS
North Carolina Municipal Bonds — 100%
June 30, 2011
| | | | | | | | | | | | | | | | | | |
| Bond Description | | Coupon | | | Maturity
Date | | | Rating# | | Par Value | | | Fair Value | |
| | | | | | | | | | | | | | | | | | |
| INSURED MUNICIPAL BONDS | | | | | | | | | | | | | | | | | | |
| 50.05% of Net Assets | | | | | | | | | | | | | | | | | | |
Asheville NC Water System Revenue | | | 4.750 | % | | | 08/01/2027 | | | Aa2/AA* | | $ | 1,000,000 | | | $ | 1,037,380 | |
Burke County NC Certificates of Participation | | | 5.000 | | | | 04/01/2023 | | | A1/A* | | | 1,000,000 | | | | 1,042,390 | |
Cabarrus County NC Certificates of Participation Installment | | | 5.000 | | | | 06/01/2025 | | | Aa2/AA+*/AA@ | | | 1,000,000 | | | | 1,061,750 | |
Catawba County NC Catawba Memorial Hospital Revenue | | | 5.000 | | | | 10/01/2017 | | | NR | | | 500,000 | | | | 500,535 | |
Charlotte NC Airport Revenue | | | 5.250 | | | | 07/01/2023 | | | A1/A+*/A+@ | | | 1,000,000 | | | | 1,048,590 | |
Charlotte NC Airport Revenue Refunding Charlotte Douglas | | | 5.000 | | | | 07/01/2025 | | | A1/A+*/A+@ | | | 1,000,000 | | | | 1,038,820 | |
Davie County NC Public School & Community College Facility | | | 5.000 | | | | 06/01/2023 | | | Aa3/A+* | | | 1,000,000 | | | | 1,045,580 | |
Davie County NC Public School & Community College Facility | | | 5.000 | | | | 06/01/2025 | | | Aa3/A+* | | | 1,690,000 | | | | 1,741,139 | |
Franklin County NC Certificates of Participation | | | 5.000 | | | | 09/01/2027 | | | Aa3/A+* | | | 750,000 | | | | 770,768 | |
Henderson County NC Certificates of Participation | | | 5.000 | | | | 05/01/2025 | | | Aa3/AA-*/AA-@ | | | 1,000,000 | | | | 1,036,980 | |
Iredell County NC Certificates of Participation School Project | | | 5.000 | | | | 06/01/2024 | | | Aa3/AA-* | | | 1,000,000 | | | | 1,050,150 | |
Johnston NC Memorial Hospital Authority | | | 5.250 | | | | 10/01/2028 | | | Aa3/AA+* | | | 500,000 | | | | 520,110 | |
Lee County NC Certificates of Participation | | | 5.000 | | | | 04/01/2025 | | | Aa3/AA+* | | | 550,000 | | | | 577,688 | |
Montgomery County NC Certificates of Participation — Series A | | | 5.000 | | | | 02/01/2030 | | | A-* | | | 1,680,000 | | | | 1,696,212 | |
Nash County NC Limited Obligation | | | 5.000 | | | | 10/01/2030 | | | Aa3/AA+* | | | 890,000 | | | | 921,266 | |
NC Medical Care Community Hospital Morehead Memorial Hospital | | | 5.000 | | | | 11/01/2026 | | | Aa3/AA+* | | | 2,500,000 | | | | 2,508,450 | |
NC Eastern Municipal Power Agency System Revenue | | | 5.500 | | | | 01/01/2017 | | | Baa1 | | | 45,000 | | | | 45,012 | |
NC Eastern Municipal Power Agency Power System Revenue | | | 6.000 | | | | 01/01/2025 | | | Baa1/BBB*/A-@ | | | 1,000,000 | | | | 1,154,950 | |
NC Eastern Municipal Power Agency Power System Revenue | | | 5.000 | | | | 01/01/2021 | | | A-*/A-@ | | | 1,000,000 | | | | 1,055,580 | |
NC Eastern Municipal Power Agency Power System Revenue | | | 6.000 | | | | 01/01/2018 | | | Baa1 | | | 1,000,000 | | | | 1,174,750 | |
NC Eastern Municipal Power Agency — Series B | | | 6.000 | | | | 01/01/2022 | | | Aa3/AA+*/AA-@ | | | 915,000 | | | | 1,078,428 | |
NC Infrastructure Finance Corporation Certificates of Participation | | | 5.000 | | | | 02/01/2024 | | | Aa1/AA+*/AA+@ | | | 1,000,000 | | | | 1,077,050 | |
NC Medical Care Community Hospital Revenue — Stanly Hospital | | | 5.375 | | | | 10/01/2014 | | | BBB+@ | | | 30,000 | | | | 30,023 | |
Randolph County NC Certificates of Participation | | | 5.000 | | | | 02/01/2027 | | | Aa3 | | | 1,000,000 | | | | 1,022,920 | |
Rockingham County NC Certificates of Participation | | | 5.000 | | | | 04/01/2032 | | | Aa3/AA+* | | | 1,325,000 | | | | 1,340,781 | |
Sampson County NC Certificates of Participation | | | 5.000 | | | | 06/01/2022 | | | Aa3/AA+* | | | 1,250,000 | | | | 1,349,413 | |
Sampson County NC Certificates of Participation | | | 5.000 | | | | 06/01/2026 | | | Aa3/AA+* | | | 1,000,000 | | | | 1,045,770 | |
University NC System Pool Revenue — Series A | | | 5.000 | | | | 10/01/2033 | | | Aa3/A+* | | | 430,000 | | | | 435,113 | |
University of NC Wilmington Certificates of Participation | | | 5.250 | | | | 06/01/2025 | | | A-* | | | 1,000,000 | | | | 1,038,280 | |
University of NC Wilmington Student Housing Project | | | 5.000 | | | | 06/01/2025 | | | A-* | | | 580,000 | | | | 595,741 | |
University of NC System Pool Revenue — Series A | | | 5.000 | | | | 10/01/2026 | | | Aa3 | | | 1,000,000 | | | | 1,058,480 | |
University of NC System Pool Revenue — Series A | | | 5.000 | | | | 10/01/2033 | | | Aa3 | | | 1,000,000 | | | | 1,022,500 | |
Wilmington NC Certificates of Participation | | | 5.000 | | | | 06/01/2032 | | | Aa2/AA*/AA@ | | | 1,500,000 | | | | 1,529,850 | |
Wilmington NC Store Water Revenue | | | 5.000 | | | | 06/01/2028 | | | Aa2/AA* | | | 500,000 | | | | 519,955 | |
Wilson NC Certificate of Participation Public Facilities | | | 5.000 | | | | 05/01/2021 | | | Aa3/AA+*/AA-@ | | | 780,000 | | | | 838,250 | |
Wilson NC Certificate of Participation Public Facilities | | | 5.000 | | | | 05/01/2025 | | | Aa3/AA+*/AA-@ | | | 750,000 | | | | 780,330 | |
Wilson County Certificates of Participation Public Facility | | | 5.000 | | | | 05/01/2029 | | | Aa3/AA+*/AA-@ | | | 1,355,000 | | | | 1,392,141 | |
Wilson Combined Enterprise System | | | 4.700 | | | | 12/01/2022 | | | Aa3/AA@ | | | 500,000 | | | | 509,685 | |
| | | | | | | | | | | | | | | | | | |
| | | | | | | | | | | | | | | | | 37,692,809 | |
| CERTIFICATES OF PARTICIPATION BONDS (UNINSURED) | | | | | | | | | | | | | | | | | | |
| 15.57% of Net Assets | | | | | | | | | | | | | | | | | | |
Cabarrus County NC Certificates of Participation | | | 5.000 | | | | 01/01/2029 | | | Aa2/AA*/AA@ | | | 750,000 | | | | 782,873 | |
Charlotte NC Certificates of Participation Convention Facilities | | | 5.000 | | | | 12/01/2024 | | | Aa2/AA+*/AA@ | | | 1,000,000 | | | | 1,046,710 | |
Charlotte NC Certificiates of Participation Transit Project | | | 5.000 | | | | 06/01/2035 | | | Aa2/AA+*/AA+@ | | | 500,000 | | | | 501,035 | |
Charlotte NC Certificates of Participation | | | 5.000 | | | | 06/01/2026 | | | Aa2/AA+*/AA+@ | | | 1,455,000 | | | | 1,530,456 | |
Charlotte NC Certificates of Participation | | | 5.000 | | | | 06/01/2027 | | | Aa2/AA+*/AA+@ | | | 775,000 | | | | 812,340 | |
Charlotte NC Certificates of Participation Convention Facilities | | | 5.000 | | | | 06/01/2034 | | | Aa2/AA+*/AA@ | | | 750,000 | | | | 754,838 | |
Forsyth County NC Certificates of Participation | | | 5.000 | | | | 10/01/2018 | | | Aa1/AA+*/AA+@ | | | 5,000 | | | | 5,012 | |
Forsyth County NC Certificates of Participation | | | 5.000 | | | | 02/01/2026 | | | Aa1/AA+*/AA+@ | | | 550,000 | | | | 568,370 | |
Mecklenburg County NC Certificates of Participation — Series B | | | 5.000 | | | | 02/01/2026 | | | Aa1/AA+*/AA+@ | | | 1,000,000 | | | | 1,050,860 | |
Mecklenburg County NC Certificates of Participation — Series A | | | 5.000 | | | | 02/01/2028 | | | Aa1/AA+*/AA+@ | | | 415,000 | | | | 434,986 | |
Mooresville NC Certificates of Participation | | | 5.000 | | | | 09/01/2032 | | | AA-* | | | 1,890,000 | | | | 1,899,809 | |
NC Infrastructure Finance Corporation Certificates of Participation | | | 5.000 | | | | 02/01/2025 | | | Aa1/AA+*/AA+@ | | | 1,325,000 | | | | 1,399,174 | |
Wilmington NC Certificates of Participation Series A | | | 5.000 | | | | 06/01/2038 | | | Aa2/AA*/AA@ | | | 250,000 | | | | 254,230 | |
Winston Salem NC Certificates of Participation — Series A | | | 4.750 | | | | 06/01/2031 | | | Aa1/AA+*/AA+@ | | | 670,000 | | | | 687,098 | |
| | | | | | | | | | | | | | | | | | |
| | | | | | | | | | | | | | | | | 11,727,790 | |
The accompanying footnotes are an integral part of the financial statements.
22
DUPREE MUTUAL FUNDS — NORTH CAROLINA TAX-FREE INCOME SERIES | |
SCHEDULE OF PORTFOLIO INVESTMENTS
North Carolina Municipal Bonds — 100%
June 30, 2011
| | | | | | | | | | | | | | | | | | |
| Bond Description | | Coupon | | | Maturity
Date | | | Rating# | | Par Value | | | Fair Value | |
| | | | | | | | | | | | | | | | | | |
| HOSPITAL AND HEALTHCARE REVENUE BONDS | | | | | | | | | | | | | | | | | | |
| 7.84% of Net Assets | | | | | | | | | | | | | | | | | | |
Charlotte Mecklenburg Hospital Authority NC Health Care | | | 5.000 | % | | | 01/15/2027 | | | Aa3/AA-* | | $ | 1,090,000 | | | $ | 1,113,130 | |
Charlotte-Mecklenburg Hospital | | | 5.250 | | | | 01/15/2039 | | | Aa3/AA-* | | | 750,000 | | | | 752,295 | |
NC Medical Care Health Care Facilities Revenue Novant Health | | | 5.000 | | | | 11/01/2017 | | | A1/A+*/AA-@ | | | 1,000,000 | | | | 1,039,020 | |
NC Medical Care Community Hospital Revenue NC Baptist Hospital | | | 5.000 | | | | 06/01/2034 | | | Aa3/AA-* | | | 1,000,000 | | | | 957,860 | |
NC MEdical Care Community Hospital Revenue Baptist Hospital | | | 4.750 | | | | 06/01/2030 | | | Aa3/AA-* | | | 355,000 | | | | 337,949 | |
NC Medical Care Community Health Care Facilities Revenue | | | 5.000 | | | | 06/01/2034 | | | Aa2/AA*/AA@ | | | 1,620,000 | | | | 1,630,449 | |
NC Medical Care Community Hospital Revenue Unrefunded Balance | | | 5.250 | | | | 12/01/2013 | | | A1/A+*/AA-@ | | | 45,000 | | | | 45,700 | |
NC Medical Care Community Hospital Revenue Unrefunded Balance | | | 5.000 | | | | 12/01/2018 | | | A1/A+*/AA-@ | | | 25,000 | | | | 25,015 | |
| | | | | | | | | | | | | | | | | | |
| | | | | | | | | | | | | | | | | 5,901,419 | |
| PUBLIC FACILITIES REVENUE BONDS | | | | | | | | | | | | | | | | | | |
| 6.71% of Net Assets | | | | | | | | | | | | | | | | | | |
Moore County NC | | | 5.000 | | | | 06/01/2031 | | | Aa3/AA-* | | | 2,750,000 | | | | 2,858,185 | |
Raleigh Durham NC Airport Authority | | | 5.000 | | | | 05/01/2029 | | | Aa3/AA-@ | | | 235,000 | | | | 244,518 | |
Raleigh Durham NC Airport Authority | | | 5.000 | | | | 05/01/2036 | | | Aa3/AA-@ | | | 1,480,000 | | | | 1,501,001 | |
Raleigh Durham NC Airport Authority | | | 5.000 | | | | 05/01/2032 | | | Aa3/AA-@ | | | 440,000 | | | | 451,669 | |
| | | | | | | | | | | | | | | | | | |
| | | | | | | | | | | | | | | | | 5,055,373 | |
| UNIVERSITY CONSOLIDATED EDUCATION AND BUILDING REVENUE BONDS | | | | | |
| 5.29% of Net Assets | | | | | | | | | | | | | | | | | | |
NC Capital Facilities Finance Agency Wake Forest University | | | 5.000 | | | | 01/01/2031 | | | Aa3/AA* | | | 500,000 | | | | 524,525 | |
NC Capital Facilities Finance Agency Wake Forest University | | | 5.000 | | | | 01/01/2038 | | | Aa3/AA* | | | 1,250,000 | | | | 1,287,013 | |
NC Capital Facilities Finance Agency Revenue Duke University | | | 5.000 | | | | 10/01/2038 | | | Aa1/AA+* | | | 500,000 | | | | 519,155 | |
Pitt County NC Limited Obligation — Series A | | | 5.000 | | | | 04/01/2035 | | | Aa3/AA-*/AA@ | | | 105,000 | | | | 106,778 | |
University NC Chapel Hill Revenue General Refunding | | | 5.000 | | | | 12/01/2034 | | | Aaa/AA+*/AA+@ | | | 1,000,000 | | | | 1,030,300 | |
University of NC System Pool Revenue General Trust Indenture | | | 5.000 | | | | 10/01/2034 | | | Aa2 | | | 500,000 | | | | 514,605 | |
| | | | | | | | | | | | | | | | | | |
| | | | | | | | | | | | | | | | | 3,982,375 | |
| MUNICIPAL UTILITY REVENUE BONDS | | | | | |
| 5.08% of Net Assets | | | | | | | | | | | | | | | | | | |
NC Municipal Power Agency Number 1 Catawba Electric Revenue | | | 4.750 | | | | 01/01/2030 | | | A2/A*/A@ | | | 290,000 | | | | 293,097 | |
NC Municipal Power Agency Number 1 Catawba Electric Revenue | | | 5.000 | | | | 01/01/2030 | | | A2/A*/A@ | | | 1,445,000 | | | | 1,486,862 | |
Raleigh NC Combined Enterprise System | | | 5.000 | | | | 03/01/2031 | | | Aa1/AAA*/AAA@ | | | 980,000 | | | | 1,005,529 | |
Raleigh NC Combined Enterprise System | | | 5.000 | | | | 03/01/2031 | | | Aa1/AAA*/AAA@ | | | 1,000,000 | | | | 1,041,720 | |
| | | | | | | | | | | | | | | | | | |
| | | | | | | | | | | | | | | | | 3,827,208 | |
| LEASE REVENUE BONDS | | | | | |
| 3.52% of Net Assets | | | | | | | | | | | | | | | | | | |
Charlotte NC Water and Sewer Systems Revenue | | | 4.500 | | | | 07/01/2028 | | | Aaa/AAA*/AAA@ | | | 750,000 | | | | 768,555 | |
Johnston County NC Installment Financing Contract | | | 5.000 | | | | 10/15/2027 | | | Aa3/AA* | | | 570,000 | | | | 607,004 | |
University NC University Revenues UNC Chapel Hill | | | 5.000 | | | | 12/01/2031 | | | Aaa/AA+*/AA+@ | | | 1,215,000 | | | | 1,273,332 | |
| | | | | | | | | | | | | | | | | | |
| | | | | | | | | | | | | | | | | 2,648,892 | |
| GENERAL OBLIGATION BONDS | | | | | |
| 2.88% of Net Assets | | | | | | | | | | | | | | | | | | |
Iredell County NC Community College | | | 5.000 | | | | 04/01/2026 | | | Aa2/AA*/AA+@ | | | 225,000 | | | | 242,881 | |
Iredell County NC Community College | | | 5.000 | | | | 04/01/2027 | | | Aa2/AA*/AA+@ | | | 325,000 | | | | 350,022 | |
Wake County NC Limited Obligation | | | 5.000 | | | | 06/01/2032 | | | Aa1/AA+*/AA+@ | | | 1,500,000 | | | | 1,572,870 | |
| | | | | | | | | | | | | | | | | | |
| | | | | | | | | | | | | | | | | 2,165,773 | |
| PREREFUNDED BONDS | | | | | |
| 1.37% of Net Assets | | | | | | | | | | | | | | | | | | |
NC Eastern Municipal Power Agency Power System — Series A | | | 6.000 | | | | 01/01/2026 | | | Aaa/A-*/A-@ | | | 805,000 | | | | 1,032,074 | |
| | | | | | | | | | | | | | | | | | |
| | | | | | | | | | | | | | | | | 1,032,074 | |
The accompanying notes are an integral part of the financial statements.
23
DUPREE MUTUAL FUNDS — NORTH CAROLINA TAX-FREE INCOME SERIES | |
SCHEDULE OF PORTFOLIO INVESTMENTS
North Carolina Municipal Bonds — 100%
June 30, 2011
| | | | | | | | | | | | | | | | | | |
| Bond Description | | Coupon | | | Maturity
Date | | | Rating# | | Par Value | | | Fair Value | |
| | | | | | | | | | | | | | | | | | |
| STATE AND LOCAL MORTGAGE REVENUE BONDS | | | | | |
| .13% of Net Assets | | | | | | | | | | | | | | | | | | |
NC Housing Finance Agency Single Family Revenue — Series II | | | 6.200 | % | | | 03/01/2016 | | | Aa2/AA* | | $ | 25,000 | | | $ | 25,052 | |
NC Housing Finance Agency Single Family Revenue — Series KK | | | 5.875 | | | | 09/01/2017 | | | Aa2/AA* | | | 40,000 | | | | 40,019 | |
NC Housing Finance Agency Home Ownership Revenue | | | 5.125 | | | | 07/01/2013 | | | Aa2/AA* | | | 30,000 | | | | 30,005 | |
| | | | | | | | | | | | | | | | | | |
| | | | | | | | | | | | | | | | | 95,075 | |
| | | | | | | | | | | | | | | | | | |
Total Investments (cost $73,536,111)(See (a) below for further explanation) 98.43% of Net Assets | | | | | | | | | $ | 74,128,786 | |
| | | | | | | | | | | | | | | | | | |
| | * | | Standard and Poor’s Corporation |
| | @ | | Fitch’s Investors Service |
| | | | All other ratings by Moody’s Investors Service, Inc. |
| | # | | Bond ratings are unaudited and not covered by Report of Independent Public Accounting Firm. |
| (a) | | Represents cost for financial reporting and federal income tax purposes and differs from market value by net unrealized appreciation of securities as follows: |
| | | | | | |
| | | | | | |
| | Unrealized appreciation | | $ | 1,059,006 | |
| | Unrealized depreciation | | | (466,331 | ) |
| | | | | | |
| | Net unrealized appreciation | | $ | 592,675 | |
| | | | | | |
Other Information
The following is a summary of the inputs used, as of June 30, 2011, involving the Fund’s assets and liabilities carried at fair value. The inputs or methodology used for valuing securities may not be an indication of the risk associated with investing in those securities. For more information on valuation inputs, and their aggregation into the levels used the the table below, please refer to the Security Valuation section in the accompanying Notes to Financial Statements.
| | | | | | |
| | | Valuation Inputs | | Municipal Bonds | |
| | | | | | |
Level 1 | | Quoted Prices | | $ | — | |
Level 2 | | Other Significant Observable Inputs | | | 74,128,786 | |
Level 3 | | Significant Unobservable Inputs | | | — | |
| | | | | | |
| | | | $ | 74,128,786 | |
| | | | | | |
The accompanying footnotes are an integral part of the financial statements.
24
NORTH CAROLINA TAX-FREE INCOME SERIES
STATEMENT OF ASSETS AND LIABILITIES
June 30, 2011
| | | | | | | | |
ASSETS: | | | | | | | | |
Investments in securities, at fair value (Cost: $73,536,111) | | | | | | $ | 74,128,786 | |
Cash | | | | | | | 657,626 | |
Interest receivable | | | | | | | 908,776 | |
Prepaid expenses | | | | | | | 1,850 | |
| | | | | | | | |
Total assets | | | | | | | 75,697,038 | |
LIABILITIES: | | | | | | | | |
Payable for: | | | | | | | | |
Distributions to shareholders | | | 215,544 | | | | | |
Fund shares redeemed | | | 111,752 | | | | | |
Investment advisory fee | | | 32,545 | | | | | |
Transfer agent fee | | | 965 | | | | | |
Accrued expenses | | | 24,424 | | | | | |
| | | | | | | | |
Total liabilities | | | | | | | 385,230 | |
| | | | | | | | |
NET ASSETS: | | | | | | | | |
Capital | | | | | | | 74,858,023 | |
Net accumulated realized loss on investment transactions | | | | | | | (138,890 | ) |
Net unrealized appreciation in value of investments | | | | | | | 592,675 | |
| | | | | | | | |
Net assets at value | | | | | | $ | 75,311,808 | |
| | | | | | | | |
NET ASSET VALUE, offering price and redemption price per share ($75,311,808 ÷ 6,897,817 shares outstanding; unlimited number of shares authorized; no par value) | | | | | | $ | 10.92 | |
| | | | | | | | |
STATEMENT OF OPERATIONS
For the year ended June 30, 2011
| | | | |
Net investment income: | | | | |
Interest income | | $ | 3,350,187 | |
| | | | |
Expenses: | | | | |
Investment advisory fee | | | 381,588 | |
Transfer agent fee | | | 97,581 | |
Custodian expense | | | 12,069 | |
Professional fees | | | 16,846 | |
Trustee fees | | | 9,607 | |
Other expenses | | | 19,594 | |
| | | | |
Total expenses | | | 537,285 | |
Custodian expense reduction | | | (736 | ) |
| | | | |
Net expenses | | | 536,549 | |
| | | | |
Net investment income | | | 2,813,638 | |
| | | | |
Realized and unrealized gain/(loss) on investments: | | | | |
Net realized gain | | | 325,856 | |
Net change in unrealized appreciation/depreciation | | | (1,125,078 | ) |
| | | | |
Net realized and unrealized loss on investments | | | (799,222 | ) |
| | | | |
Net increase in net assets resulting from operations | | $ | 2,014,416 | |
| | | | |
The accompanying notes are an integral part of the financial statements.
25
NORTH CAROLINA TAX-FREE INCOME SERIES
STATEMENTS OF CHANGES IN NET ASSETS
For the years ended June 30, 2011 and 2010
| | | | | | | | |
| | | 2011 | | | 2010 | |
Operations: | | | | | | | | |
Net investment income | | $ | 2,813,638 | | | $ | 2,648,834 | |
Net realized gain/(loss) on investments | | | 325,856 | | | | (117,110 | ) |
Net change in unrealized appreciation/depreciation | | | (1,125,078 | ) | | | 2,027,701 | |
| | | | | | | | |
Net increase in net assets resulting from operations | | | 2,014,416 | | | | 4,559,425 | |
Distributions from net investment income | | | (2,813,638 | ) | | | (2,648,834 | ) |
Net fund share transactions (Note 4) | | | (1,004,724 | ) | | | 8,314,549 | |
| | | | | | | | |
Total increase/(decrease) | | | (1,803,946 | ) | | | 10,225,140 | |
Net assets: | | | | | | | | |
Beginning of year | | | 77,115,754 | | | | 66,890,614 | |
| | | | | | | | |
End of year | | $ | 75,311,808 | | | $ | 77,115,754 | |
| | | | | | | | |
FINANCIAL HIGHLIGHTS
| | | | | | | | | | | | | | | | | | | | |
| Selected data for a share outstanding: | | For the years ended June 30, | |
| | | 2011 | | | 2010 | | | 2009 | | | 2008 | | | 2007 | |
Net asset value, beginning of year | | | $11.01 | | | | $10.71 | | | | $10.62 | | | | $10.74 | | | | $10.74 | |
| | | | | | | | | | | | | | | | | | | | |
Income from investment operations: | | | | | | | | | | | | | | | | | | | | |
Net investment income | | | 0.40 | | | | 0.40 | | | | 0.41 | | | | 0.41 | | | | 0.41 | |
Net gains/(losses) on securities, both realized and unrealized | | | (0.09 | ) | | | 0.30 | | | | 0.09 | | | | (0.12 | ) | | | — | (b) |
| | | | | | | | | | | | | | | | | | | | |
Total from investment operations | | | 0.31 | | | | 0.70 | | | | 0.50 | | | | 0.29 | | | | 0.41 | |
Less distributions: | | | | | | | | | | | | | | | | | | | | |
Distributions from net investment income | | | (0.40 | ) | | | (0.40 | ) | | | (0.41 | ) | | | (0.41 | ) | | | (0.41 | ) |
| | | | | | | | | | | | | | | | | | | | |
Net asset value, end of year | | | $10.92 | | | | $11.01 | | | | $10.71 | | | | $10.62 | | | | $10.74 | |
| | | | | | | | | | | | | | | | | | | | |
Total return | | | 2.90% | | | | 6.62% | | | | 4.83% | | | | 2.69% | | | | 3.85% | |
Net assets, end of year (in thousands) | | | $75,312 | | | | $77,116 | | | | $66,891 | | | | $65,300 | | | | $54,994 | |
Ratio of net expenses to average net assets (a) | | | 0.70% | | | | 0.72% | | | | 0.72% | | | | 0.71% | | | | 0.73% | |
Ratio of net investment income to average net assets | | | 3.69% | | | | 3.66% | | | | 3.89% | | | | 3.76% | | | | 3.79% | |
Portfolio turnover | | | 14.16% | | | | 5.92% | | | | 7.82% | | | | 11.03% | | | | 5.20% | |
| (a) | | Percentages are after Custodian reduction for which no recovery will be sought. |
| | | Percentages before Custodian reduction were: |
| | | .70% for 2011; .72% for 2010; .72% for 2009; .72% for 2008; and .74% for 2007. |
| (b) | | Rounds to less than .01. |
The accompanying notes are an integral part of the financial statements.
26
DUPREE MUTUAL FUNDS — NORTH CAROLINA TAX-FREE SHORT-TO-MEDIUM SERIES
SCHEDULE OF PORTFOLIO INVESTMENTS
North Carolina Municipal Bonds — 100%
June 30, 2011
| | | | | | | | | | | | | | | | | | |
| Bond Description | | Coupon | | | Maturity
Date | | | Rating# | | Par Value | | | Fair Value | |
| | | | | | | | | | | | | | | | | | |
| INSURED MUNICIPAL BONDS | | | | | | | | | | | | | | | | | | |
| 55.75% of Net Assets | | | | | | | | | | | | | | | | | | |
Appalachian State University NC Revenue | | | 5.000 | % | | | 07/15/2018 | | | Aa3 | | $ | 75,000 | | | $ | 81,743 | |
Asheville NC Water System Revenue Refunding | | | 5.000 | | | | 08/01/2017 | | | Aa2/AA+* | | | 140,000 | | | | 160,125 | |
Buncombe County NC Certificates of Participation | | | 4.000 | | | | 04/01/2016 | | | Aa2/AA* | | | 125,000 | | | | 138,433 | |
Burke County NC Certificates of Participation | | | 4.250 | | | | 04/01/2016 | | | A1/A* | | | 50,000 | | | | 54,365 | |
Cabarrus County NC Certificates of Participation | | | 5.625 | | | | 02/01/2016 | | | Aa2/AA*/AA@ | | | 125,000 | | | | 146,074 | |
Catawba County NC Certificates of Participation Public School | | | 5.250 | | | | 06/01/2016 | | | Aa2 | | | 125,000 | | | | 137,359 | |
Catawba County NC Certificates of Participation Public School | | | 5.250 | | | | 06/01/2018 | | | Aa2 | | | 125,000 | | | | 134,983 | |
Catawba County NC Certificates of Participation | | | 5.250 | | | | 06/01/2019 | | | Aa2/BBB* | | | 200,000 | | | | 217,598 | |
Craven County NC Certificates of Participation | | | 4.375 | | | | 06/01/2016 | | | Aa3/AA-* | | | 115,000 | | | | 126,939 | |
Dare County NC Certificates of Participation | | | 5.250 | | | | 06/01/2014 | | | Aa3/AA-*/AA-@ | | | 150,000 | | | | 165,780 | |
Davie County NC Community College | | | 4.000 | | | | 06/01/2013 | | | Aa3/A+* | | | 250,000 | | | | 263,583 | |
Edgecombe County NC Schools | | | 4.000 | | | | 02/01/2015 | | | A1/A+* | | | 235,000 | | | | 255,863 | |
Harnett County NC Certificates of Participation — Series A | | | 5.000 | | | | 12/01/2015 | | | Aa3/AA+* | | | 125,000 | | | | 142,775 | |
Harnett County Certificates of Participation | | | 3.500 | | | | 06/01/2016 | | | Aa3/AA+* | | | 250,000 | | | | 268,820 | |
Haywood NC Certificates of Participation Refunding | | | 5.000 | | | | 10/01/2016 | | | A1/A* | | | 635,000 | | | | 685,298 | |
Henderson County NC Certificates of Participation-Series A | | | 5.250 | | | | 05/01/2020 | | | Aa3/AA-*/AA-@ | | | 300,000 | | | | 323,595 | |
Henderson County NC Certificates of Participation | | | 5.000 | | | | 06/01/2014 | | | Aa3/AA-*/AA-@ | | | 50,000 | | | | 54,889 | |
High Point NC Combined Enterprise System Revenue | | | 5.000 | | | | 11/01/2018 | | | Aa2/AA+*/AA+@ | | | 145,000 | | | | 159,706 | |
Iredell County NC Certificates of Participation School Project | | | 5.000 | | | | 06/01/2018 | | | Aa3/AA-* | | | 425,000 | | | | 471,597 | |
Johnston NC Memorial Hospital Authority | | | 4.000 | | | | 10/01/2012 | | | Aa3/AA+* | | | 200,000 | | | | 206,964 | |
Johnston NC Memorial Hospital Authority | | | 4.000 | | | | 04/01/2015 | | | Aa3/AA+* | | | 100,000 | | | | 106,633 | |
Lee County NC Certificates of Participation | | | 5.000 | | | | 04/01/2016 | | | Aa3/AA+* | | | 215,000 | | | | 233,329 | |
Lincoln County NC Certificates of Participation | | | 5.000 | | | | 06/01/2016 | | | Aa3/AA+*/AA@ | | | 200,000 | | | | 227,070 | |
Lincolnton NC Enterprise System Revenue | | | 5.000 | | | | 05/01/2016 | | | NR | | | 385,000 | | | | 409,097 | |
Nash County NC Limited Obligation | | | 3.000 | | | | 10/01/2015 | | | Aa3/AA+* | | | 400,000 | | | | 422,252 | |
Nash County NC Limited Obligation | | | 5.000 | | | | 10/01/2018 | | | Aa3/AA+* | | | 150,000 | | | | 171,729 | |
New Hanover County NC Certificates of Participation | | | 5.000 | | | | 03/01/2017 | | | Aa1/AA* | | | 250,000 | | | | 266,805 | |
NC Medical Care Community Hospital Rowan Medical | | | 5.250 | | | | 09/01/2016 | | | Aa3/AA+* | | | 1,100,000 | | | | 1,199,298 | |
NC Eastern Municipal Power Agency | | | 5.250 | | | | 01/01/2019 | | | Aa3/AA+*/A-@ | | | 550,000 | | | | 614,009 | |
NC Eastern Municipal Power Agency System Revenue | | | 5.000 | | | | 01/01/2020 | | | A-*/A-@ | | | 100,000 | | | | 107,579 | |
NC Municipal Power Agency Number 1 Catawba Electric Revenue | | | 5.250 | | | | 01/01/2019 | | | A2/A*/A@ | | | 400,000 | | | | 418,420 | |
NC Medical Care Community Hospital — Scotland Memorial | | | 5.375 | | | | 10/01/2011 | | | BBB* | | | 10,000 | | | | 10,004 | |
NC Infrastructure Certificates of Participation | | | 5.000 | | | | 06/01/2018 | | | Aa1/AA+*/AA+@ | | | 100,000 | | | | 112,192 | |
NC Infrastructure Finance Certificates of Participation | | | 5.000 | | | | 02/01/2017 | | | Aa1/AA+*/AA+@ | | | 150,000 | | | | 173,498 | |
NC Medical Care — Caromont Health | | | 3.250 | | | | 02/15/2018 | | | Aa3/AA+* | | | 370,000 | | | | 371,528 | |
NC Medical Community Hospital Wayne Memorial | | | 4.750 | | | | 10/01/2011 | | | A2 | | | 350,000 | | | | 350,396 | |
NC Medical Care Community Healthcare Facilities | | | 4.000 | | | | 10/01/2018 | | | Aa3/AA+*/AA-@ | | | 240,000 | | | | 247,452 | |
Onslow County NC Certificates of Participation | | | 5.000 | | | | 06/01/2018 | | | Aa3/A+* | | | 140,000 | | | | 152,247 | |
Pitt County NC Certificates of Participation School Facility | | | 4.000 | | | | 04/01/2015 | | | Aa3/AA-*/AA@ | | | 100,000 | | | | 107,758 | |
Randolph County NC Certificates of Participation | | | 5.000 | | | | 06/01/2016 | | | Aa3/AA+* | | | 170,000 | | | | 188,318 | |
Rockingham NC Certificates of Participation | | | 5.250 | | | | 04/01/2013 | | | Aa3/A+* | | | 125,000 | | | | 130,038 | |
Rutherford County NC Certificates of Participation | | | 5.000 | | | | 12/01/2017 | | | Aa3/AA+* | | | 105,000 | | | | 120,410 | |
Rutherford County NC Certificates of Participation | | | 5.000 | | | | 12/01/2018 | | | Aa3/AA+* | | | 205,000 | | | | 232,872 | |
Rutherford NC Certificates of Participation | | | 4.000 | | | | 12/01/2019 | | | Aa3/AA+* | | | 200,000 | | | | 212,074 | |
Sampson County NC Certificates of Participation | | | 5.000 | | | | 06/01/2014 | | | Aa3/AA+* | | | 50,000 | | | | 55,313 | |
Sampson Area Development Corporation NC Refunding | | | 4.000 | | | | 06/01/2015 | | | AA+* | | | 150,000 | | | | 163,622 | |
Union County NC Certificates of Participation | | | 5.000 | | | | 06/01/2020 | | | Aa2/AA-*/AA@ | | | 250,000 | | | | 272,943 | |
University NC Wilmington Certificates of Participation | | | 4.000 | | | | 06/01/2017 | | | Aa3/AA+* | | | 100,000 | | | | 109,298 | |
University NC Wilmington Certificates of Participation | | | 5.000 | | | | 06/01/2014 | | | A-* | | | 40,000 | | | | 43,851 | |
University NC Wilmington Certificates of Participation | | | 4.250 | | | | 06/01/2017 | | | A-* | | | 300,000 | | | | 321,852 | |
University NC System Pool Revenue Asheville Wilmington | | | 5.000 | | | | 10/01/2016 | | | Aa3/AA+* | | | 230,000 | | | | 265,726 | |
Wilson NC Certificates of Participation | | | 5.000 | | | | 05/01/2016 | | | Aa3/AA+*/AA-@ | | | 200,000 | | | | 228,116 | |
Wilson NC Certificates of Participation | | | 5.000 | | | | 05/01/2018 | | | Aa3/AA+*/AA-@ | | | 60,000 | | | | 67,853 | |
| | | | | | | | | | | | | | | | | | |
| | | | | | | | | | | | | | | | | 12,310,071 | |
The accompanying footnotes are an integral part of the financial statements.
27
DUPREE MUTUAL FUNDS — NORTH CAROLINA TAX-FREE SHORT-TO-MEDIUM SERIES
SCHEDULE OF PORTFOLIO INVESTMENTS
North Carolina Municipal Bonds — 100%
June 30, 2011
| | | | | | | | | | | | | | | | | | |
| Bond Description | | Coupon | | | Maturity
Date | | | Rating# | | Par Value | | | Fair Value | |
| | | | | | | | | | | | | | | | | | |
| CERTIFICATES OF PARTICIPATION BONDS (UNINSURED) | | | | | | | | | | | | | | | | | | |
| 17.87% of Net Assets | | | | | | | | | | | | | | | | | | |
Buncombe County NC Certificates of Participation | | | 5.000 | % | | | 04/01/2018 | | | Aa2/AA* | | $ | 250,000 | | | $ | 273,090 | |
Cabarrus County NC Certificates of Participation | | | 5.000 | | | | 06/01/2014 | | | Aa2/AA*/AA@ | | | 135,000 | | | | 149,589 | |
Cabarrus County NC Certificates of Participation | | | 4.000 | | | | 01/01/2015 | | | Aa2/AA*/AA@ | | | 225,000 | | | | 244,445 | |
Cabarrus County NC Certificates of Participation | | | 5.000 | | | | 01/01/2017 | | | Aa2/AA*/AA@ | | | 150,000 | | | | 171,656 | |
Chapel Hill NC Certificates of Participation Operations Center | | | 5.250 | | | | 06/01/2019 | | | Aa1/AA+* | | | 260,000 | | | | 285,511 | |
Charlotte NC Certificates of Participation | | | 4.000 | | | | 06/01/2012 | | | Aa2/AA+*/AA+@ | | | 50,000 | | | | 51,467 | |
Charlotte NC Certificates of Participation Refunding | | | 5.000 | | | | 12/01/2021 | | | Aa2/AA+*/AA@ | | | 270,000 | | | | 289,067 | |
Charlotte NC Certificates of Participation | | | 4.375 | | | | 12/01/2014 | | | Aa2/AA+* | | | 50,000 | | | | 51,320 | |
Charlotte NC Certificates of Participation Transit Projects | | | 4.000 | | | | 06/01/2016 | | | Aa2/AA+*/AA+@ | | | 100,000 | | | | 108,565 | |
Cumberland County NC Certificates of Participation | | | 5.000 | | | | 12/01/2015 | | | Aa2/AA* | | | 75,000 | | | | 86,114 | |
Cumberland County NC Certificates of Participation | | | 5.000 | | | | 12/01/2017 | | | Aa2/AA* | | | 350,000 | | | | 406,091 | |
Forsyth County NC Certificates of Participation | | | 5.000 | | | | 10/01/2019 | | | Aa1/AA+*/AA+@ | | | 600,000 | | | | 664,488 | |
Montgomery County NC Certificates of Participation | | | 5.000 | | | | 02/01/2017 | | | A-* | | | 125,000 | | | | 140,571 | |
Mooreville NC Certificates of Participation | | | 4.125 | | | | 09/01/2018 | | | AA-* | | | 250,000 | | | | 266,595 | |
NC Infrastructure Finance Corporation Certificates of Participation | | | 5.000 | | | | 02/01/2016 | | | Aa1/AA+*/AA+@ | | | 200,000 | | | | 224,720 | |
NC State Certificates of Participation Wildlife Resources | | | 5.250 | | | | 06/01/2018 | | | Aa1/AA+*/AA+@ | | | 500,000 | | | | 531,705 | |
| | | | | | | | | | | | | | | | | | |
| | | | | | | | | | | | | | | | | 3,944,994 | |
| MUNICIPAL UTILITY REVENUE BONDS | | | | | | | | | | | | | | | | | | |
| 8.58% of Net Assets | | | | | | | | | | | | | | | | | | |
Moore County NC | | | 5.000 | | | | 06/01/2017 | | | Aa3/AA-* | | | 685,000 | | | | 785,154 | |
NC Eastern Municipal Power Agency — Series D | | | 4.000 | | | | 01/01/2016 | | | Baa1/A-*/A-@ | | | 95,000 | | | | 102,165 | |
NC Eastern Municipal Power Agency | | | 5.375 | | | | 01/01/2017 | | | Baa1/A-*/A-@ | | | 200,000 | | | | 209,670 | |
NC Eastern Municipal Power Agency | | | 3.250 | | | | 01/01/2015 | | | Baa1/A-*/A-@ | | | 250,000 | | | | 262,078 | |
NC Eastern Municipal Power Agency | | | 5.000 | | | | 01/01/2016 | | | A-*/A-@ | | | 50,000 | | | | 55,902 | |
NC Municipal Power Agency Number 1 Catawba Electric | | | 5.250 | | | | 01/01/2017 | | | A2/A*/A@ | | | 200,000 | | | | 229,996 | |
NC Municipal Power Agency Number 1 Catawba Electric | | | 4.000 | | | | 01/01/2016 | | | A2/A*/A@ | | | 100,000 | | | | 108,615 | |
NC Municipal Power Agency Number 1 Catawba Electric | | | 5.000 | | | | 01/01/2016 | | | A2/A*/A@ | | | 125,000 | | | | 141,071 | |
| | | | | | | | | | | | | | | | | | |
| | | | | | | | | | | | | | | | | 1,894,651 | |
| PUBLIC FACILITIES REVENUE BONDS | | | | | | | | | | | | | | | | | | |
| 3.78% of Net Assets | | | | | | | | | | | | | | | | | | |
Charlotte NC Airport — Charlotte Douglas International | | | 4.125 | | | | 07/01/2016 | | | A1/A+*/A+@ | | | 100,000 | | | | 109,469 | |
Charlotte NC Airport Revenue Refunding | | | 5.000 | | | | 07/01/2015 | | | A1/A+*/A+@ | | | 350,000 | | | | 392,203 | |
Mecklenburg County NC Certificates of Participation | | | 5.000 | | | | 02/01/2017 | | | Aa1/AA+*/AA+@ | | | 105,000 | | | | 121,387 | |
NC Infrastructure Finance Corporation Certificates of Participation | | | 5.000 | | | | 02/01/2019 | | | Aa1/AA+*/AA+@ | | | 85,000 | | | | 91,707 | |
Raleigh Durham NC Airport Authority — Series B | | | 5.000 | | | | 11/01/2017 | | | Aa3/AA-@ | | | 105,000 | | | | 120,092 | |
| | | | | | | | | | | | | | | | | | |
| | | | | | | | | | | | | | | | | 834,858 | |
| HOSPITAL AND HEALTHCARE REVENUE BONDS | | | | | | | | | | | | | | | | | | |
| 3.44% of Net Assets | | | | | | | | | | | | | | | | | | |
Charlotte-Mecklenburg Hospital | | | 5.000 | | | | 01/15/2019 | | | Aa3/AA-* | | | 200,000 | | | | 216,772 | |
Charlotte-Mecklenburg Hospital | | | 4.375 | | | | 01/15/2019 | | | Aa3/AA-* | | | 150,000 | | | | 159,144 | |
NC Medical Care Community Hospital Pitt Memorial | | | 4.400 | | | | 12/01/2011 | | | A1/A+*/AA-@ | | | 275,000 | | | | 275,366 | |
NC Medical Care Mission Health Combined Group | | | 4.000 | | | | 10/01/2014 | | | Aa3/AA*/AA@ | | | 100,000 | | | | 107,707 | |
| | | | | | | | | | | | | | | | | | |
| | | | | | | | | | | | | | | | | 758,989 | |
| UNIVERSITY CONSOLIDATED EDUCATION AND BUILDING REVENUE BONDS | | | | | | | | | | | |
| 3.21% of Net Assets | | | | | | | | | | | | | | | | | | |
University of NC Ashville Revenue | | | 5.000 | | | | 06/01/2014 | | | A1 | | | 20,000 | | | | 20,728 | |
University NC System Pool Revenue | | | 5.000 | | | | 10/01/2016 | | | Aa2 | | | 250,000 | | | | 291,555 | |
University NC System Pool Revenue | | | 5.000 | | | | 10/01/2015 | | | Aa3 | | | 350,000 | | | | 397,492 | |
| | | | | | | | | | | | | | | | | | |
| | | | | | | | | | | | | | | | | 709,775 | |
| LEASE REVENUE BONDS | | | | | | | | | | | | | | | | | | |
| 2.47% of Net Assets | | | | | | | | | | | | | | | | | | |
NC Municipal Power Agency Number 1 Catawba Electric | | | 5.250 | | | | 01/01/2018 | | | A2/A*/A@ | | | 125,000 | | | | 144,054 | |
NC Infrastructure Finance Corporation — Correctional Facilities | | | 5.000 | | | | 10/01/2017 | | | Aa1/AA+*/AA+@ | | | 150,000 | | | | 161,375 | |
The accompanying footnotes are an integral part of the financial statements.
28
DUPREE MUTUAL FUNDS — NORTH CAROLINA TAX-FREE SHORT-TO-MEDIUM SERIES
SCHEDULE OF PORTFOLIO INVESTMENTS
North Carolina Municipal Bonds — 100%
June 30, 2011
| | | | | | | | | | | | | | | | | | |
| Bond Description | | Coupon | | | Maturity
Date | | | Rating# | | Par Value | | | Fair Value | |
| | | | | | | | | | | | | | | | | | |
NC Infrastructure Correctional Facilities Projects | | | 5.000 | % | | | 10/01/2019 | | | Aa1/AA+*/AA+@ | | $ | 100,000 | | | $ | 106,300 | |
Wake County NC | | | 3.000 | | | | 01/01/2015 | | | Aa1/AA+*/AA+@ | | | 125,000 | | | | 132,873 | |
| | | | | | | | | | | | | | | | | | |
| | | | | | | | | | | | | | | | | 544,602 | |
| PREREFUNDED BONDS | | | | | | | | | | | | | | | | | | |
| 1.36% of Net Assets | | | | | | | | | | | | | | | | | | |
NC State Public Improvement — Series A | | | 5.000 | | | | 03/01/2019 | | | Aaa | | | 235,000 | | | | 269,331 | |
Univresity of NC Ashville Revenue | | | 5.000 | | | | 06/01/2014 | | | A1 | | | 30,000 | | | | 31,254 | |
| | | | | | | | | | | | | | | | | | |
| | | | | | | | | | | | | | | | | 300,585 | |
| GENERAL OBLIGATION BONDS | | | | | | | | | | | | | | | | | | |
| 1.23% of Net Assets | | | | | | | | | | | | | | | | | | |
Cabarrus County NC Public Improvement | | | 5.000 | | | | 03/01/2018 | | | Aa1/AA+*/AA+@ | | | 100,000 | | | | 112,926 | |
Mecklenburg County NC Refunding — Series A | | | 5.000 | | | | 08/01/2014 | | | Aaa/AAA*/AAA@ | | | 125,000 | | | | 140,808 | |
NC State Public Improvement — Series A | | | 5.000 | | | | 03/01/2019 | | | Aaa/AAA* | | | 15,000 | | | | 16,770 | |
| | | | | | | | | | | | | | | | | | |
| | | | | | | | | | | | | | | | | 270,504 | |
| STATE AND LOCAL MORTGAGE REVENUE BONDS | | | | | | | | | | | | | | | | | | |
| 1.16% of Net Assets | | | | | | | | | | | | | | | | | | |
NC Housing Finance Agency Series 31-B | | | 3.850 | | | | 01/01/2017 | | | Aa2/AA* | | | 145,000 | | | | 149,204 | |
NC Housing Financial Agency Home Ownership — Series 16B | | | 4.125 | | | | 07/01/2012 | | | Aa2/AA* | | | 105,000 | | | | 107,786 | |
| | | | | | | | | | | | | | | | | | |
| | | | | | | | | | | | | | | | | 256,990 | |
| | | | | | | | | | | | | | | | | | |
Total Investments (cost $21,175,399)(See (a) below for further explanation) 98.85% of Net Assets | | | | | | | | | $ | 21,826,019 | |
| | | | | | | | | | | | | | | | | | |
| | * | | Standard and Poor’s Corporation |
| | @ | | Fitch’s Investors Service |
| | | | All other ratings by Moody’s Investors Service, Inc. |
| | # | | Bond ratings are unaudited and not covered by Report of Independent Registered Public Accounting Firm. |
| (a) | | Represents cost for financial reporting and federal income tax purposes and differs from market value by net unrealized appreciation of securities as follows: |
| | | | | | |
| | | | | | |
| | Unrealized appreciation | | $ | 633,768 | |
| | Unrealized depreciation | | | 16,852 | |
| | | | | | |
| | Net unrealized appreciation | | $ | 650,620 | |
| | | | | | |
Other Information
The following is a summary of the inputs used, as of June 30, 2011, involving the Fund’s assets and liabilities carried at fair value. The inputs or methodology used for valuing securities may not be an indication of the risk associated with investing in those securities. For more information on valuation inputs, and their aggregation into the levels used the the table below, please refer to the Security Valuation section in the accompanying Notes to Financial Statements.
| | | | | | |
| | | | | | |
| | | Valuation Inputs | | Municipal Bonds | |
Level 1 | | Quoted Prices | | $ | — | |
Level 2 | | Other Significant Observable Inputs | | | 21,826,019 | |
Level 3 | | Significant Unobservable Inputs | | | — | |
| | | | | | |
| | | | $ | 21,826,019 | |
| | | | | | |
The accompanying footnotes are an integral part of the financial statements.
29
NORTH CAROLINA TAX-FREE SHORT-TO-MEDIUM SERIES
STATEMENT OF ASSETS AND LIABILITIES
June 30, 2011
| | | | | | | | |
ASSETS: | | | | | | | | |
Investments in securities, at fair value (Cost: $21,175,399) | | | | | | $ | 21,826,019 | |
Cash | | | | | | | 39,679 | |
Interest receivable | | | | | | | 252,776 | |
| | | | | | | | |
Total assets | | | | | | | 22,118,474 | |
LIABILITIES: | | | | | | | | |
Payable for: | | | | | | | | |
Distributions to shareholders | | | 11,319 | | | | | |
Fund shares redeemed | | | 2,067 | | | | | |
Investment advisory fee | | | 8,998 | | | | | |
Transfer agent fee | | | 162 | | | | | |
Trustee fee | | | 289 | | | | | |
Accrued expenses | | | 16,300 | | | | | |
| | | | | | | | |
Total liabilities | | | | | | | 39,135 | |
| | | | | | | | |
NET ASSETS: | | | | | | | | |
Capital | | | | | | | 21,475,560 | |
Net accumulated realized loss on investment transactions | | | | | | | (46,841 | ) |
Net unrealized appreciation in value of investments | | | | | | | 650,620 | |
| | | | | | | | |
Net assets at value | | | | | | $ | 22,079,339 | |
| | | | | | | | |
NET ASSET VALUE, offering price and redemption price per share ($22,079,339 ÷ 2,019,210 shares outstanding; unlimited number of shares authorized; no par value) | | | | | | $ | 10.93 | |
| | | | | | | | |
STATEMENT OF OPERATIONS
For the year ended June 30, 2011
| | | | |
Net investment income: | | | | |
Interest income | | $ | 602,261 | |
| | | | |
Expenses: | | | | |
Investment advisory fee | | | 94,864 | |
Transfer agent fee | | | 28,320 | |
Custodian expense | | | 2,963 | |
Professional fees | | | 4,083 | |
Trustee fees | | | 2,368 | |
Other expenses | | | 12,873 | |
| | | | |
Total expenses | | | 145,471 | |
Custodian expense reduction | | | (222 | ) |
| | | | |
Net expenses | | | 145,249 | |
| | | | |
Net investment income | | | 457,012 | |
| | | | |
Realized and unrealized gain on investments: | | | | |
Net realized gain | | | 32,681 | |
Net change in unrealized appreciation/depreciation | | | 219,520 | |
| | | | |
Net realized and unrealized gain on investments | | | 252,201 | |
| | | | |
Net increase in net assets resulting from operations | | $ | 709,213 | |
| | | | |
The accompanying notes are an integral part of the financial statements.
30
NORTH CAROLINA TAX-FREE SHORT-TO-MEDIUM SERIES
STATEMENTS OF CHANGES IN NET ASSETS
For the years ended June 30, 2011 and 2010
| | | | | | | | |
| | | 2011 | | | 2010 | |
Operations: | | | | | | | | |
Net investment income | | $ | 457,012 | | | $ | 372,430 | |
Net realized gain on investments | | | 32,681 | | | | 60,038 | |
Net change in unrealized appreciation/depreciation | | | 219,520 | | | | 188,565 | |
| | | | | | | | |
Net increase in net assets resulting from operations | | | 709,213 | | | | 621,033 | |
Distributions from net investment income | | | (457,012 | ) | | | (372,430 | ) |
Net fund share transactions (Note 4) | | | 5,876,130 | | | | 4,040,525 | |
| | | | | | | | |
Total increase | | | 6,128,331 | | | | 4,289,128 | |
Net assets: | | | | | | | | |
Beginning of year | | | 15,951,008 | | | | 11,661,880 | |
| | | | | | | | |
End of year | | $ | 22,079,339 | | | $ | 15,951,008 | |
| | | | | | | | |
FINANCIAL HIGHLIGHTS
| | | | | | | | | | | | | | | | | | | | |
| Selected data for a share outstanding: | | For the years ended June 30, | |
| | | 2011 | | | 2010 | | | 2009 | | | 2008 | | | 2007 | |
Net asset value, beginning of year | | | $10.78 | | | | $10.57 | | | | $10.37 | | | | $10.30 | | | | $10.31 | |
| | | | | | | | | | | | | | | | | | | | |
Income from investment operations: | | | | | | | | | | | | | | | | | | | | |
Net investment income | | | 0.26 | | | | 0.29 | | | | 0.32 | | | | 0.32 | | | | 0.32 | |
Net gains/(losses) on securities, both realized and unrealized | | | 0.15 | | | | 0.21 | | | | 0.20 | | | | 0.07 | | | | (0.01 | ) |
| | | | | | | | | | | | | | | | | | | | |
Total from investment operations | | | 0.41 | | | | 0.50 | | | | 0.52 | | | | 0.39 | | | | 0.31 | |
Less distributions: | | | | | | | | | | | | | | | | | | | | |
Distributions from capital gains | | | — | | | | — | | | | — | | | | — | | | | — | (b) |
Distributions from net investment income | | | (0.26 | ) | | | (0.29 | ) | | | (0.32 | ) | | | (0.32 | ) | | | (0.32 | ) |
| | | | | | | | | | | | | | | | | | | | |
Net asset value, end of year | | | $10.93 | | | | $10.78 | | | | $10.57 | | | | $10.37 | | | | $10.30 | |
| | | | | | | | | | | | | | | | | | | | |
Total return | | | 3.86% | | | | 4.77% | | | | 5.07% | | | | 3.78% | | | | 2.97% | |
Net assets, end of year (in thousands) | | | $22,079 | | | | $15,951 | | | | $11,662 | | | | $11,134 | | | | $11,281 | |
Ratio of net expenses to average net assets (a) | | | 0.77% | | | | 0.82% | | | | 0.81% | | | | 0.82% | | | | 0.81% | |
Ratio of net investment income to average net assets | | | 2.41% | | | | 2.69% | | | | 3.04% | | | | 3.03% | | | | 3.01% | |
Portfolio turnover | | | 5.15% | | | | 17.94% | | | | 10.14% | | | | 23.91% | | | | 13.33% | |
| (a) | | Percentages are after expenses waived by Adviser and Custodian reduction. No recovery of these waivers and reductions will be sought. |
| | | Expenses waived by Adviser and Custodian reduction were: |
| | | 0% and .0% for 2011; 0% and 0% for 2010; .02% and .03% for 2009; 0% and .04% for 2008; and 0% and .04% for 2007, respectively. |
| (b) | | Rounds to less than $0.01. |
The accompanying notes are an integral part of the financial statements.
31
DUPREE MUTUAL FUNDS — TENNESSEE TAX-FREE INCOME SERIES | |
SCHEDULE OF PORTFOLIO INVESTMENTS
Tennessee Municipal Bonds — 100%
June 30, 2011
| | | | | | | | | | | | | | | | | | |
| Bond Description | | Coupon | | | Maturity
Date | | | Rating# | | Par Value | | | Fair Value | |
| | | | | | | | | | | | | | | | | | |
| INSURED MUNICIPAL BONDS | | | | | |
| 52.77% of Net Assets | | | | | | | | | | | | | | | | | | |
Blount County TN Public Building Authority Local Government | | | 5.000 | % | | | 06/01/2025 | | | Aa2/AA-* | | $ | 100,000 | | | $ | 107,640 | |
Blount County TN Public Building Authority Local Government | | | 5.000 | | | | 06/01/2027 | | | Aa2/AA-* | | | 1,500,000 | | | | 1,589,415 | |
Blount County TN Public Building Authority Local Government | | | 4.750 | | | | 06/01/2031 | | | Aa2/AA-* | | | 750,000 | | | | 766,358 | |
Blount County TN Public Building Authority General Obligation | | | 5.250 | | | | 06/01/2019 | | | NR | | | 1,050,000 | | | | 1,083,159 | |
Blount County TN Building Authority Local Government Public | | | 5.000 | | | | 06/01/2032 | | | Aa3 | | | 750,000 | | | | 759,548 | |
Chattanooga TN Industrial Development Board Lease Rent Revenue | | | 5.000 | | | | 10/01/2027 | | | Aa3/AA+*/AA@ | | | 1,000,000 | | | | 1,044,650 | |
Clarksville TN Electric System Revenue | | | 5.000 | | | | 09/01/2032 | | | Aa2 | | | 1,250,000 | | | | 1,274,488 | |
Cleveland TN General Obligation — Series A | | | 5.000 | | | | 06/01/2027 | | | Aa3/A+* | | | 680,000 | | | | 701,488 | |
Columbia TN Refunded — Sewer System | | | 5.000 | | | | 12/01/2024 | | | Aa2 | | | 1,235,000 | | | | 1,310,730 | |
Columbia TN Broadband Network Revenue & Tax | | | 5.000 | | | | 03/01/2025 | | | Aa2 | | | 1,000,000 | | | | 1,049,070 | |
Franklin County TN Health & Educational Facilities Board | | | 5.000 | | | | 09/01/2025 | | | A+* | | | 1,000,000 | | | | 1,042,680 | |
Gallatin TN Water & Sewer Revenue | | | 5.000 | | | | 01/01/2028 | | | Aa3 | | | 2,540,000 | | | | 2,675,255 | |
Giles County TN | | | 4.500 | | | | 02/01/2018 | | | Aa3 | | | 1,000,000 | | | | 1,043,230 | |
Greene County TN General Obligation — Series B | | | 5.000 | | | | 06/01/2024 | | | A1 | | | 505,000 | | | | 526,185 | |
Hallsdale-Powell Utility District Knox County TN Water and Sewer | | | 5.000 | | | | 04/01/2026 | | | AA* | | | 1,000,000 | | | | 1,051,920 | |
Hallsdale-Powell Utility District Knox County TN Water and Sewer | | | 5.000 | | | | 04/01/2031 | | | AA* | | | 740,000 | | | | 763,051 | |
Harpeth Valley Utilities TN Davidson and Williamson Counties | | | 5.000 | | | | 09/01/2029 | | | Aa3 | | | 1,410,000 | | | | 1,443,483 | |
Harpeth Valley Utilities TN Davidson and Williamson Counties | | | 5.000 | | | | 09/01/2032 | | | Aa3 | | | 1,420,000 | | | | 1,448,585 | |
Jackson TN Energy Authority Gas System Revenue | | | 5.000 | | | | 10/01/2028 | | | Aa2 | | | 1,000,000 | | | | 1,030,760 | |
Knox County TN Health Educational & Housing Facilities Ft Sanders | | | 6.250 | | | | 01/01/2013 | | | Baa1/BBB* | | | 10,000 | | | | 10,600 | |
Knox County TN Health Educational & Housing — Covenant Health | | | 5.000 | | | | 01/01/2022 | | | Aa3/AA+*/AA@ | | | 450,000 | | | | 454,667 | |
Knoxville TN Gas Revenue Refunded System — Series K | | | 4.750 | | | | 03/01/2022 | | | Aa2/AA* | | | 800,000 | | | | 813,672 | |
Knoxville TN Wastewater System Revenue — Series A | | | 4.750 | | | | 04/01/2021 | | | Aa2/AA+* | | | 1,150,000 | | | | 1,169,734 | |
Knoxville TN Waste Water System Revenue Improvement — Series A | | | 5.000 | | | | 04/01/2037 | | | Aa2/AA+* | | | 370,000 | | | | 376,423 | |
Manchester TN Refunding General Obligation | | | 5.000 | | | | 06/01/2038 | | | Aa3/AA+* | | | 100,000 | | | | 107,825 | |
Marion County TN Schools | | | 5.000 | | | | 06/01/2025 | | | A1 | | | 1,050,000 | | | | 1,095,948 | |
Metro Nashville & Davidson County TN General Obligation | | | 5.000 | | | | 01/01/2023 | | | Aa1/AA*/AA@ | | | 1,000,000 | | | | 1,058,850 | |
Metro Nashville & Davidson County TN General Obligation | | | 5.000 | �� | | | 01/01/2024 | | | Aa1/AA*/AA@ | | | 1,000,000 | | | | 1,054,440 | |
Metro Nashville & Davidson County TN Multi Family | | | 4.600 | | | | 11/01/2026 | | | NR | | | 850,000 | | | | 849,023 | |
Metro Government Nashville & Davidson County TN Sports Authority | | | 5.000 | | | | 07/01/2021 | | | Aa2/AA+* | | | 1,000,000 | | | | 1,071,580 | |
Metropolitan Government Nashville and Davidson County TN | | | 5.000 | | | | 05/15/2027 | | | Aa1/AA*/AA@ | | | 1,400,000 | | | | 1,496,012 | |
Metropolitan Government Nashville and Davidson County | | | 5.000 | | | | 05/15/2028 | | | Aa1/AA*/AA@ | | | 240,000 | | | | 255,286 | |
Montgomery County TN General Obligation | | | 4.750 | | | | 05/01/2020 | | | Aa2/AA+* | | | 1,000,000 | | | | 1,063,600 | |
Oak Ridge TN Industrial Development Board Refunding Revenue | | | 5.250 | | | | 08/20/2018 | | | Aaa | | | 255,000 | | | | 255,048 | |
Overton County TN Refunding — Schools General Obligation | | | 5.000 | | | | 04/01/2018 | | | Baa1 | | | 1,000,000 | | | | 1,074,150 | |
Pigeon Forge TN Refunding — Series A | | | 4.900 | | | | 06/01/2028 | | | Aa3/AA+* | | | 1,000,000 | | | | 1,036,140 | |
Rutherford County TN Construction Utility District Waterworks | | | 5.000 | | | | 02/01/2031 | | | Aa2/AAA* | | | 1,435,000 | | | | 1,474,534 | |
Shelby County TN Health Educational & Housing Facilities | | | 5.250 | | | | 09/01/2027 | | | Aa3/AA+* | | | 1,000,000 | | | | 1,028,800 | |
Smith County TN General Obligation | | | 5.000 | | | | 04/01/2021 | | | NR | | | 720,000 | | | | 768,427 | |
South Blount County TN Utility District Waterworks Revenue | | | 5.000 | | | | 12/01/2028 | | | Aa3/AA+* | | | 1,125,000 | | | | 1,192,331 | |
TN Housing Development Agency Homeownership Program Series | | | 5.150 | | | | 07/01/2022 | | | Aa1/AA+* | | | 550,000 | | | | 550,011 | |
TN State School Board Authority Refunding Higher Education | | | 5.000 | | | | 05/01/2024 | | | Aa1/AA*/AA+@ | | | 1,395,000 | | | | 1,488,549 | |
TN State School Board Authority Refunding Higher Education | | | 5.000 | | | | 05/01/2025 | | | Aa1/AA*/AA+@ | | | 1,440,000 | | | | 1,526,386 | |
West Wilson Utility District TN Waterworks Revenue | | | 4.750 | | | | 06/01/2028 | | | Aa3 | | | 2,460,000 | | | | 2,565,534 | |
White House Utility District TN Water & Sewer | | | 5.000 | | | | 01/01/2028 | | | Aa3 | | | 1,235,000 | | | | 1,283,708 | |
White House Utility District TN Water & Sewer | | | 5.000 | | | | 01/01/2030 | | | Aa3 | | | 2,505,000 | | | | 2,578,973 | |
| | | | | | | | | | | | | | | | | | |
| | | | | | | | | | | | | | | | | 48,411,946 | |
| UNIVERSITY CONSOLIDATED EDUCATION AND BUILDING REVENUE BONDS | | | | | |
| 9.87% of Net Assets | | | | | | | | | | | | | | | | | | |
Metropolitan Government Nashville & Davidson County TN Housing | | | 5.000 | | | | 10/01/2034 | | | Aa2/AA*/AA+@ | | | 1,000,000 | | | | 1,040,370 | |
Metro Nashville & Davidson County TN McKendree | | | 5.125 | | | | 01/01/2020 | | | AA* | | | 1,700,000 | | | | 1,700,408 | |
Shelby County TN Health Education & Housing Facilities Board | | | 5.000 | | | | 08/01/2030 | | | A1/A+* | | | 500,000 | | | | 513,940 | |
TN State School Board Authority Higher Educational Facilities | | | 5.000 | | | | 05/01/2028 | | | Aa1/AA*/AA@ | | | 1,000,000 | | | | 1,074,090 | |
TN State School Board Authority Higher Educational Facilities | | | 5.125 | | | | 05/01/2033 | | | Aa1/AA*/AA@ | | | 1,300,000 | | | | 1,369,160 | |
TN State School Board Authority Higher Educational Facilities | | | 5.000 | | | | 05/01/2034 | | | Aa1/AA*/AA+@ | | | 500,000 | | | | 522,025 | |
The accompanying footnotes are an integral part of the financial statements.
32
DUPREE MUTUAL FUNDS — TENNESSEE TAX-FREE INCOME SERIES | |
SCHEDULE OF PORTFOLIO INVESTMENTS
Tennessee Municipal Bonds — 100%
June 30, 2011
| | | | | | | | | | | | | | | | | | |
| Bond Description | | Coupon | | | Maturity
Date | | | Rating# | | Par Value | | | Fair Value | |
| | | | | | | | | | | | | | | | | | |
TN State School Board Authority Higher Educational Facilities | | | 4.750 | % | | | 05/01/2030 | | | Aa1/AA*/AA+@ | | $ | 2,750,000 | | | $ | 2,833,628 | |
| | | | | | | | | | | | | | | | | | |
| | | | | | | | | | | | | | | | | 9,053,621 | |
| STATE AND LOCAL MORTGAGE REVENUE | | | | | |
| 7.42% of Net Assets | | | | | | | | | | | | | | | | | | |
TN Housing Development Agency | | | 5.000 | | | | 07/01/2028 | | | Aa1/AA+* | | | 875,000 | | | | 882,193 | |
TN Housing Development Agency | | | 5.400 | | | | 07/01/2035 | | | Aa1/AA+* | | | 655,000 | | | | 666,056 | |
TN Housing Development Agency Homeownership Program 1 | | | 5.000 | | | | 07/01/2029 | | | Aa1/AA+* | | | 815,000 | | | | 825,554 | |
TN Housing Development Agency Homeownership Program 2 | | | 4.700 | | | | 07/01/2027 | | | Aa1/AA+* | | | 1,475,000 | | | | 1,475,000 | |
TN Housing Development Agency Housing Finance Program | | | 4.850 | | | | 01/01/2025 | | | Aa2 | | | 750,000 | | | | 760,928 | |
TN Housing Development Agency Series 2001 — 3B | | | 5.250 | | | | 01/01/2020 | | | Aa1/AA+* | | | 230,000 | | | | 230,007 | |
TN Housing Development Agency Mortgage Financing — Series A | | | 5.200 | | | | 07/01/2023 | | | Aa2/AA* | | | 1,930,000 | | | | 1,964,837 | |
| | | | | | | | | | | | | | | | | | |
| | | | | | | | | | | | | | | | | 6,804,575 | |
| HOSPITAL AND HEALTHCARE REVENUE BONDS | | | | | | | | | | | |
| 6.93% of Net Assets | | | | | | | | | | | | | | | | | | |
Rutherford County TN Health & Education Facilities Board | | | 5.000 | | | | 11/15/2040 | | | Aa1/AA+*/AA+@ | | | 1,500,000 | | | | 1,517,310 | |
Shelby County TN Health Education & Housing Facilities | | | 5.000 | | | | 07/01/2031 | | | Aa2/AAA@ | | | 4,750,000 | | | | 4,844,668 | |
| | | | | | | | | | | | | | | | | | |
| | | | | | | | | | | | | | | | | 6,361,978 | |
| GENERAL OBLIGATION BONDS | | | | | | | | | | | | | | | | | | |
| 6.92% of Net Assets | | | | | | | | | | | | | | | | | | |
Franklin TN Water & Sewer Revenue & Tax | | | 5.000 | | | | 04/01/2024 | | | Aaa | | | 750,000 | | | | 880,095 | |
Knoxville TN General Obligation — Series A | | | 5.000 | | | | 05/01/2020 | | | Aa1/AA+*/AAA@ | | | 500,000 | | | | 588,555 | |
Metropolitan Government Nashville and Davidson County TN | | | 5.000 | | | | 01/01/2025 | | | Aa1/AA*/AA@ | | | 4,025,000 | | | | 4,370,949 | |
Shelby County TN — Series A | | | 4.600 | | | | 11/01/2022 | | | Aa1/AA+*/AA+@ | | | 500,000 | | | | 508,605 | |
| | | | | | | | | | | | | | | | | | |
| | | | | | | | | | | | | | | | | 6,348,204 | |
| MUNICIPAL UTILITY REVENUE BONDS | | | | | | | | | | | | | | | | | | |
| 6.40% of Net Assets | | | | | | | | | | | | | | | | | | |
Citizens Gas Utility District TN Gas Revenue Refunding | | | 5.000 | | | | 05/01/2029 | | | A* | | | 250,000 | | | | 250,463 | |
Clarksville TN Electric System Revenue — Series A | | | 5.000 | | | | 09/01/2028 | | | Aa2/AA-* | | | 1,000,000 | | | | 1,079,260 | |
Clarksville TN Electric System Revenue — Series A | | | 5.000 | | | | 09/01/2033 | | | Aa2/AA-* | | | 2,000,000 | | | | 2,077,380 | |
Knox-Chapman TN Utility District Knox County Water & Sewer | | | 5.250 | | | | 01/01/2036 | | | AA-* | | | 700,000 | | | | 735,805 | |
Metropolitan Government Nashville & Davidson County TN | | | 4.750 | | | | 05/15/2028 | | | AA+*/AA+@ | | | 460,000 | | | | 482,232 | |
West Wilson Utility District TN Waterworks Revenue | | | 5.000 | | | | 06/01/2033 | | | Aa3 | | | 1,170,000 | | | | 1,247,208 | |
| | | | | | | | | | | | | | | | | | |
| | | | | | | | | | | | | | | | | 5,872,348 | |
| PREREFUNDED BONDS | | | | | | | | | | | | | | | | | | |
| 2.85% of Net Assets | | | | | | | | | | | | | | | | | | |
Hawkins County TN Refunding General Obligation | | | 4.750 | | | | 05/01/2017 | | | Aa3 | | | 200,000 | | | | 207,458 | |
Johnson City TN Health & Educational Facilities | | | 5.125 | | | | 07/01/2025 | | | BBB* | | | 2,000,000 | | | | 2,003,260 | |
Kingsport TN Industrial Development Board Multifamily | | | 5.400 | | | | 04/20/2021 | | | NR | | | 365,000 | | | | 402,365 | |
| | | | | | | | | | | | | | | | | | |
| | | | | | | | | | | | | | | | | 2,613,083 | |
| ESCROWED TO MATURITY BONDS | | | | | | | | | | | | | | | | | | |
| 2.39% of Net Assets | | | | | | | | | | | | | | | | | | |
Johnson City TN Health & Educational Facilities | | | 5.000 | | | | 07/01/2018 | | | BBB* | | | 1,000,000 | | | | 1,001,670 | |
Johnson City TN Health & Educational Facilities | | | 6.500 | | | | 07/01/2014 | | | Baa1/BBB*/BBB+@ | | | 1,000,000 | | | | 1,123,660 | |
Metro Nashville & Davidson County TN Water & Sewer | | | 6.500 | | | | 12/01/2014 | | | Aaa/BBB* | | | 60,000 | | | | 71,534 | |
| | | | | | | | | | | | | | | | | | |
| | | | | | | | | | | | | | | | | 2,196,864 | |
| LEASE REVENUE BONDS | | | | | | | | | | | | | | | | | | |
| 2.36% of Net Assets | | | | | | | | | | | | | | | | | | |
Chattanooga TN Electric Revenue — Series A | | | 5.000 | | | | 09/01/2026 | | | AA*/AA+@ | | | 250,000 | | | | 269,040 | |
Memphis/Shelby County TN Special Facilities Revenue FedEx | | | 5.050 | | | | 09/01/2012 | | | Baa2/BBB* | | | 250,000 | | | | 259,945 | |
Memphis-Shelby County Sports Authority | | | 5.250 | | | | 11/01/2027 | | | Aa3/AA-*/A+@ | | | 750,000 | | | | 771,353 | |
TN Housing Development Agency — Series 1B | | | 5.000 | | | | 07/01/2029 | | | Aa1/AA+*/NR@ | | | 865,000 | | | | 866,894 | |
| | | | | | | | | | | | | | | | | | |
| | | | | | | | | | | | | | | | | 2,167,232 | |
The accompanying footnotes are an integral part of the financial statements.
33
DUPREE MUTUAL FUNDS — TENNESSEE TAX-FREE INCOME SERIES | |
SCHEDULE OF PORTFOLIO INVESTMENTS
Tennessee Municipal Bonds — 100%
June 30, 2011
| | | | | | | | | | | | | | | | | | |
| Bond Description | | Coupon | | | Maturity
Date | | | Rating# | | Par Value | | | Fair Value | |
| | | | | | | | | | | | | | | | | | |
| PUBLIC FACILITIES REVENUE BONDS | | | | | | | | | | | | | | | | | | |
| .57% of Net Assets | | | | | | | | | | | | | | | | | | |
Memphis Shelby County TN Sports Authority Memphis Arena | | | 5.250 | % | | | 11/01/2026 | | | Aa3/AA-*/A+@ | | $ | 500,000 | | | $ | 520,850 | |
| | | | | | | | | | | | | | | | | | |
| | | | | | | | | | | | | | | | | 520,850 | |
Total Investments (cost $88,870,534) (See (a) below for further explanation) 98.48% of Net Assets | | | | | | | | | $ | 90,350,701 | |
| | | | | | | | | | | | | | | | | | |
| | * | | Standard and Poor's Corporation |
| | @ | | Fitch's Investors Service |
| | | | All other ratings by Moody's Investors Service, Inc. |
| | # | | Bond ratings are unaudited and not covered by Report of Independent Registered Public Accounting Firm. |
| (a) | | Represents cost for financial reporting and federal income tax purposes and differs from market value by net unrealized appreciation of securities as follows: |
| | | | | | |
| | | | | | |
| | Unrealized appreciation | | $ | 1,730,741 | |
| | Unrealized depreciation | | | (250,574 | ) |
| | | | | | |
| | Net unrealized appreciation | | $ | 1,480,167 | |
| | | | | | |
Other Information
The following is a summary of the inputs used, as of June 30, 2011, involving the Fund's assets and liabilities carried at fair value. The inputs or methodology used for valuing securities may not be an indication of the risk associated with investing in those securities. For more information on valuation inputs, and their aggregation into the levels used the the table below, please refer to the Security Valuation section in the accompanying Notes to Financial Statements.
| | | | | | |
| | | | | | |
| | | Valuation Inputs | | Municipal Bonds | |
Level 1 | | Quoted Prices | | $ | — | |
Level 2 | | Other Significant Observable Inputs | | | 90,350,701 | |
Level 3 | | Significant Unobservable Inputs | | | — | |
| | | | | | |
| | | | $ | 90,350,701 | |
| | | | | | |
The accompanying footnotes are an integral part of the financial statements.
34
TENNESSEE TAX-FREE INCOME SERIES
STATEMENT OF ASSETS AND LIABILITIES
June 30, 2011
| | | | | | | | |
ASSETS: | | | | | | | | |
Investments in securities, at fair value (Cost: $88,870,534) | | | | | | $ | 90,350,701 | |
Cash | | | | | | | 503,470 | |
Interest receivable | | | | | | | 1,357,881 | |
Prepaid expenses | | | | | | | 2,294 | |
| | | | | | | | |
Total assets | | | | | | | 92,214,346 | |
LIABILITIES: | | | | | | | | |
Payable for: | | | | | | | | |
Distributions to shareholders | | | 368,520 | | | | | |
Fund shares redeemed | | | 11,413 | | | | | |
Investment advisory fee | | | 37,524 | | | | | |
Transfer agent fee | | | 632 | | | | | |
Accrued expenses | | | 56,041 | | | | | |
| | | | | | | | |
Total liabilities | | | | | | | 474,130 | |
| | | | | | | | |
NET ASSETS: | | | | | | | | |
Capital | | | | | | | 91,083,696 | |
Net accumulated realized loss on investment transactions | | | | | | | (823,647 | ) |
Net unrealized appreciation in value of investments | | | | | | | 1,480,167 | |
| | | | | | | | |
Net assets at value | | | | | | $ | 91,740,216 | |
| | | | | | | | |
NET ASSET VALUE, offering price and redemption price per share ($91,740,216 ÷ 8,312,958 shares outstanding; unlimited number of shares authorized; no par value) | | | | | | $ | 11.04 | |
| | | | | | | | |
STATEMENT OF OPERATIONS
For the year ended June 30, 2011
| | | | |
Net investment income: | | | | |
Interest income | | $ | 4,101,731 | |
| | | | |
Expenses: | | | | |
Investment advisory fee | | | 468,448 | |
Transfer agent fee | | | 118,426 | |
Custodian expense | | | 14,835 | |
Professional fees | | | 20,719 | |
Trustee fees | | | 11,830 | |
Other expenses | | | 17,339 | |
| | | | |
Total expenses | | | 651,597 | |
Custodian expense reduction | | | (897 | ) |
| | | | |
Net expenses | | | 650,700 | |
| | | | |
Net investment income | | | 3,451,031 | |
| | | | |
Realized and unrealized gain/(loss) on investments: | | | | |
Net realized gain | | | 407,508 | |
Net change in unrealized appreciation/depreciation | | | (613,152 | ) |
| | | | |
Net realized and unrealized loss on investments | | | (205,644 | ) |
| | | | |
Net increase in net assets resulting from operations | | $ | 3,245,387 | |
| | | | |
The accompanying notes are an integral part of the financial statements.
35
TENNESSEE TAX-FREE INCOME SERIES
STATEMENTS OF CHANGES IN NET ASSETS
For the years ended June 30, 2011 and 2010
| | | | | | | | |
| | | 2011 | | | 2010 | |
Operations: | | | | | | | | |
Net investment income | | $ | 3,451,031 | | | $ | 3,415,997 | |
Net realized gain/(loss) on investments | | | 407,508 | | | | (992,378 | ) |
Net change in unrealized appreciation/depreciation | | | (613,152 | ) | | | 3,849,827 | |
| | | | | | | | |
Net increase in net assets resulting from operations | | | 3,245,387 | | | | 6,273,446 | |
Distributions from net investment income | | | (3,451,031 | ) | | | (3,415,997 | ) |
Net fund share transactions (Note 4) | | | (3,013,841 | ) | | | (119,960 | ) |
| | | | | | | | |
Total increase/(decrease) | | | (3,219,485 | ) | | | 2,737,489 | |
Net assets: | | | | | | | | |
Beginning of year | | | 94,959,701 | | | | 92,222,212 | |
| | | | | | | | |
End of year | | $ | 91,740,216 | | | $ | 94,959,701 | |
| | | | | | | | |
FINANCIAL HIGHLIGHTS
| | | | | | | | | | | | | | | | | | | | |
| Selected data for a share outstanding: | | For the years ended June 30, | |
| | | 2011 | | | 2010 | | | 2009 | | | 2008 | | | 2007 | |
Net asset value, beginning of year | | | $11.04 | | | | $10.71 | | | | $10.77 | | | | $10.87 | | | | $10.84 | |
| | | | | | | | | | | | | | | | | | | | |
Income from investment operations: | | | | | | | | | | | | | | | | | | | | |
Net investment income | | | 0.41 | | | | 0.40 | | | | 0.41 | | | | 0.41 | | | | 0.41 | |
Net gains/(losses) on securities, both realized and unrealized | | | 0.00 | (b) | | | 0.33 | | | | (0.06 | ) | | | (0.10 | ) | | | 0.03 | |
| | | | | | | | | | | | | | | | | | | | |
Total from investment operations | | | 0.41 | | | | 0.73 | | | | 0.35 | | | | 0.31 | | | | 0.44 | |
Less distributions: | | | | | | | | | | | | | | | | | | | | |
Distributions from net investment income | | | (0.41 | ) | | | (0.40 | ) | | | (0.41 | ) | | | (0.41 | ) | | | (0.41 | ) |
| | | | | | | | | | | | | | | | | | | | |
Net asset value, end of year | | | $11.04 | | | | $11.04 | | | | $10.71 | | | | $10.77 | | | | $10.87 | |
| | | | | | | | | | | | | | | | | | | | |
Total return | | | 3.78% | | | | 6.92% | | | | 3.40% | | | | 2.87% | | | | 4.05% | |
Net assets, end of year (in thousands) | | | $91,740 | | | | $94,960 | | | | $92,222 | | | | $90,397 | | | | $99,697 | |
Ratio of net expenses to average net assets (a) | | | 0.69% | | | | 0.70% | | | | 0.70% | | | | 0.71% | | | | 0.72% | |
Ratio of net investment income to average net assets | | | 3.68% | | | | 3.67% | | | | 3.90% | | | | 3.74% | | | | 3.70% | |
Portfolio turnover | | | 6.38% | | | | 14.51% | | | | 7.62% | | | | 15.71% | | | | 8.55% | |
| (a) | | Percentages are after Custodian reduction for which no recovery will be sought. |
| | | Percentages before Custodian reduction were: |
| | | .69% for 2011; .70% for 2010; .71% for 2009; .72% for 2008; and .73% for 2007. |
| (b) | | Rounds to less than $.01. |
The accompanying notes are an integral part of the financial statements.
36
DUPREE MUTUAL FUNDS — TENNESSEE TAX-FREE SHORT-TO-MEDIUM SERIES
SCHEDULE OF PORTFOLIO INVESTMENTS
Tennessee Municipal Bonds — 100%
June 30, 2011
| | | | | | | | | | | | | | | | | | |
| Bond Description | | Coupon | | | Maturity
Date | | | Rating# | | Par Value | | | Fair Value | |
| | | | | | | | | | | | | | | | | | |
| INSURED MUNICIPAL BONDS | | | | | | | | | | | | | | | |
| 61.65% of Net Assets | | | | | | | | | | | | | | | | | | |
Cross Anchor TN Utility District | | | 4.250 | % | | | 12/1/2015 | | | AA+* | | $ | 65,000 | | | $ | 71,995 | |
Cross Anchor TN Utility District | | | 4.250 | | | | 12/1/2016 | | | AA+* | | | 65,000 | | | | 72,157 | |
Dickson County TN Refunding | | | 5.000 | | | | 6/1/2015 | | | A1/A+* | | | 140,000 | | | | 148,714 | |
Fayetteville TN Electric System Revenue | | | 3.000 | | | | 6/1/2015 | | | AA+* | | | 105,000 | | | | 109,909 | |
Johnson City TN Refunding | | | 4.000 | | | | 6/1/2015 | | | AA@ | | | 400,000 | | | | 437,280 | |
Johnson City TN Electric Revenue | | | 4.500 | | | | 5/1/2021 | | | Aa2/AA+* | | | 50,000 | | | | 53,993 | |
Johnson City TN Public Building Authority Revenue | | | 4.250 | | | | 9/1/2014 | | | Aa2/AA@ | | | 50,000 | | | | 54,143 | |
Knoxville TN Electric Revenue — Series V | | | 4.750 | | | | 7/1/2021 | | | Aa2/AA+* | | | 150,000 | | | | 154,347 | |
Lawrenceburg TN Refunding Water & Sewer | | | 5.000 | | | | 7/1/2015 | | | Aa3 | | | 125,000 | | | | 141,779 | |
Madison County TN Refunding — School and Public Improvement | | | 5.000 | | | | 4/1/2018 | | | Aa2/AA+* | | | 175,000 | | | | 194,901 | |
Maury County TN School & Public Improvement | | | 5.000 | | | | 4/1/2016 | | | Aa2 | | | 1,000,000 | | | | 1,095,140 | |
Memphis-Shelby TN Sports Authority Memphis Arena Project | | | 5.500 | | | | 11/1/2012 | | | Aa3/AA-*/A+@ | | | 500,000 | | | | 528,195 | |
Memphis-Shelby County TN Sports Authority Memphis Arena | | | 5.000 | | | | 11/1/2017 | | | Aa3/AA-*/A+@ | | | 275,000 | | | | 304,502 | |
Memphis TN General Obligation General Improvement | | | 5.000 | | | | 10/1/2016 | | | Aa2/AA*/AA-@ | | | 450,000 | | | | 500,108 | |
Memphis TN — Series A | | | 5.000 | | | | 4/1/2024 | | | Aa2/AA+*/AA-@ | | | 200,000 | | | | 216,366 | |
Metro Nashville Davidson County Water and Sewer | | | 5.200 | | | | 1/1/2013 | | | Aa2/BBB*/AA-@ | | | 215,000 | | | | 226,214 | |
Metropolitan Government Nashville & Davidson County TN | | | 5.000 | | | | 1/1/2019 | | | Aa1/AA* | | | 160,000 | | | | 174,064 | |
Metropolitan Nashville Airport Authority — Series A | | | 4.500 | | | | 7/1/2014 | | | Aa3/AA+* | | | 250,000 | | | | 271,633 | |
New Market Utility District Jefferson County TN Waterworks | | | 3.500 | | | | 6/1/2015 | | | Aa3/AA+* | | | 100,000 | | | | 107,347 | |
New Market Utilty District Jefferson County TN Waterworks | | | 4.000 | | | | 6/1/2016 | | | Aa3/AA+* | | | 100,000 | | | | 109,128 | |
New Market Utility District Jefferson County Waterworks | | | 4.000 | | | | 6/1/2017 | | | Aa3/AA+* | | | 100,000 | | | | 108,033 | |
Sevier County TN Public Building Authority | | | 4.000 | | | | 3/1/2014 | | | AA+* | | | 100,000 | | | | 107,333 | |
Shelby County TN Refunding — Series A | | | 5.000 | | | | 4/1/2018 | | | Aa1/AA+*/AA+@ | | | 100,000 | | | | 111,558 | |
Shelby County Health Education | | | 5.250 | | | | 9/1/2020 | | | Aa3/AA+* | | | 400,000 | | | | 435,584 | |
Washington County TN Refunding School and Public Improvement | | | 5.000 | | | | 4/1/2015 | | | Aa2 | | | 200,000 | | | | 223,628 | |
Washington County TN Refunding School and Public Improvement | | | 5.000 | | | | 4/1/2016 | | | Aa2 | | | 125,000 | | | | 138,754 | |
| | | | | | | | | | | | | | | | | | |
| | | | | | | | | | | | | | | | | 6,096,805 | |
| GENERAL OBLIGATION BONDS | | | | | | | | | | | | | | | |
| 10.52% of Net Assets | | | | | | | | | | | | | | | | | | |
Claiborne County TN Public Improvement — Series A | | | 5.000 | | | | 4/1/2017 | | | A+* | | | 170,000 | | | | 194,101 | |
Memphis TN Refunding General Improvement | | | 5.000 | | | | 10/1/2017 | | | Aa2/AA*/AA-@ | | | 100,000 | | | | 117,162 | |
Metro Government Nashville & Davidson County TN Refunding | | | 5.000 | | | | 5/15/2019 | | | Aa1/AA*/AA@ | | | 250,000 | | | | 284,530 | |
Metropolitan Government Nashville & Davidson County | | | 5.000 | | | | 1/1/2019 | | | Aa1/AA*/AA@ | | | 200,000 | | | | 229,966 | |
Sevier County TN Public Building Authority | | | 4.000 | | | | 6/1/2014 | | | AA* | | | 200,000 | | | | 214,406 | |
| | | | | | | | | | | | | | | | | | |
| | | | | | | | | | | | | | | | | 1,040,165 | |
| LEASE REVENUE BONDS | | | | | | | | | | | | | | | |
| 7.16% of Net Assets | | | | | | | | | | | | | | | | | | |
Chattanooga TN Electric Revenue — Series A | | | 5.000 | | | | 9/1/2021 | | | AA*/AA+@ | | | 400,000 | | | | 448,272 | |
Memphis-Shelby County TN Airport — Federal Express Corporation | | | 5.050 | | | | 9/1/2012 | | | Baa2/BBB* | | | 250,000 | | | | 259,945 | |
| | | | | | | | | | | | | | | | | | |
| | | | | | | | | | | | | | | | | 708,217 | |
| STATE AND LOCAL MORTGAGE REVENUE BONDS | | | | | | | | | | | | | | | |
| 5.62% of Net Assets | | | | | | | | | | | | | | | | | | |
TN Housing Development Agency Homeownership Program | | | 4.200 | | | | 1/1/2016 | | | Aa1/AA+* | | | 150,000 | | | | 154,229 | |
TN Housing Development Agency — Series 1B | | | 4.800 | | | | 7/1/2024 | | | Aa1/AA+* | | | 295,000 | | | | 299,440 | |
TN Housing Development Agency Homeownership Program — 2 | | | 2.950 | | | | 1/1/2015 | | | Aa1/AA+* | | | 100,000 | | | | 102,515 | |
| | | | | | | | | | | | | | | | | | |
| | | | | | | | | | | | | | | | | 556,184 | |
| MUNICIPAL UTILITY REVENUE BONDS | | | | | | | | | | | | | | | |
| 3.91% of Net Assets | | | | | | | | | | | | | | | | | | |
Harpeth Valley Utilities District | | | 5.000 | | | | 3/1/2014 | | | A1 | | | 250,000 | | | | 258,325 | |
Sevier County TN Utility District Gas System Revenue | | | 2.650 | | | | 6/1/2015 | | | A+* | | | 125,000 | | | | 128,475 | |
| | | | | | | | | | | | | | | | | | |
| | | | | | | | | | | | | | | | | 386,800 | |
The accompanying footnotes are an integral part of the financial statements.
37
DUPREE MUTUAL FUNDS — TENNESSEE TAX-FREE SHORT-TO-MEDIUM SERIES
SCHEDULE OF PORTFOLIO INVESTMENTS
Tennessee Municipal Bonds — 100%
June 30, 2011
| | | | | | | | | | | | | | | | | | |
| Bond Description | | Coupon | | | Maturity
Date | | | Rating# | | Par Value | | | Fair Value | |
| | | | | | | | | | | | | | | | | | |
| PUBLIC FACILITIES REVENUE BONDS | | | | | | | | | | | | | | | |
| 3.58% of Net Assets | | | | | | | | | | | | | | | | | | |
Blount County TN Public Building Authority Series B-19 | | | 3.500 | % | | | 6/1/2015 | | | AA+* | | $ | 200,000 | | | $ | 215,802 | |
Metropolitian Government Nashville Davidson County Convention | | | 5.000 | | | | 7/1/2015 | | | A1/A*/AA-@ | | | 125,000 | | | | 137,936 | |
| | | | | | | | | | | | | | | | | | |
| | | | | | | | | | | | | | | | | 353,738 | |
| PREREFUNDED BONDS | | | | | | | | | | | | | | | |
| 3.35% of Net Assets | | | | | | | | | | | | | | | | | | |
Memphis TN Electric System Revenue — Series A | | | 5.000 | | | | 12/1/2015 | | | Aa2/AA+* | | | 300,000 | | | | 331,578 | |
| | | | | | | | | | | | | | | | | | |
| | | | | | | | | | | | | | | | | 331,578 | |
| HOSPITAL AND HEALTHCARE REVENUE BONDS | | | | | | | | | | | | | | | |
| 1.02% of Net Assets | | | | | | | | | | | | | | | | | | |
Knox County TN Hospital Facility Revenue Catholic Healthcare | | | 4.500 | | | | 10/1/2011 | | | A1/AA-*/AA-@ | | | 100,000 | | | | 100,870 | |
| | | | | | | | | | | | | | | | | | |
| | | | | | | | | | | | | | | | | 100,870 | |
| | | | | | | | | | | | | | | | | | |
Total Investments (cost $9,205,493) (See (a) below for further explanation) 96.82% of Net Assets | | | | | | | | | $ | 9,574,357 | |
| | | | | | | | | | | | | | | | | | |
| | * | | Standard and Poor's Corporation |
| | @ | | Fitch's Investors Service |
| | | | All other ratings by Moody's Investors Service, Inc. |
| | # | | Bond ratings are unaudited and not covered by Report of Independent Registered Public Accounting Firm. |
| (a) | | Represents cost for financial reporting and federal income tax purposes and differs from market value by net unrealized appreciation of securities as follows: |
| | | | | | |
| | | | | | |
| | Unrealized appreciation | | $ | 372,369 | |
| | Unrealized depreciation | | | (3,505 | ) |
| | | | | | |
| | Net unrealized appreciation | | $ | 368,864 | |
| | | | | | |
Other Information
The following is a summary of the inputs used, as of June 30, 2011, involving the Fund's assets and liabilities carried at fair value. The inputs or methodology used for valuing securities may not be an indication of the risk associated with investing in those securities. For more information on valuation inputs, and their aggregation into the levels used the the table below, please refer to the Security Valuation section in the accompanying Notes to Financial Statements.
| | | | | | |
| | | Valuation Inputs | | Municipal Bonds | |
| | | | | | |
Level 1 | | Quoted Prices | | $ | — | |
Level 2 | | Other Significant Observable Inputs | | | 9,574,357 | |
Level 3 | | Significant Unobservable Inputs | | | — | |
| | | | | | |
| | | | $ | 9,574,357 | |
| | | | | | |
The accompanying footnotes are an integral part of the financial statements.
38
TENNESSEE TAX-FREE SHORT-TO-MEDIUM SERIES
STATEMENT OF ASSETS AND LIABILITIES
June 30, 2011
| | | | | | | | |
ASSETS: | | | | | | | | |
Investments in securities, at fair value (Cost: $9,205,493) | | | | | | $ | 9,574,357 | |
Cash | | | | | | | 386,007 | |
Receivable for fund shares sold | | | | | | | 50,000 | |
Defaulted securities receivable | | | | | | | 23,606 | |
Interest receivable | | | | | | | 108,802 | |
| | | | | | | | |
Total assets | | | | | | | 10,142,772 | |
LIABILITIES: | | | | | | | | |
Payable for: | | | | | | | | |
Investments purchased | | | 231,514 | | | | | |
Distributions to shareholders | | | 6,060 | | | | | |
Fund shares redeemed | | | 1,632 | | | | | |
Investment advisory fee | | | 3,935 | | | | | |
Transfer agent fee | | | 72 | | | | | |
Trustee fees | | | 580 | | | | | |
Accrued expenses | | | 9,841 | | | | | |
| | | | | | | | |
Total liabilities | | | | | | | 253,634 | |
| | | | | | | | |
NET ASSETS: | | | | | | | | |
Capital | | | | | | | 9,832,588 | |
Net accumulated realized loss on investment transactions | | | | | | | (312,314 | ) |
Net unrealized appreciation in value of investments | | | | | | | 368,864 | |
| | | | | | | | |
Net assets at value | | | | | | $ | 9,889,138 | |
| | | | | | | | |
NET ASSET VALUE, offering price and redemption price per share ($9,889,138 ÷ 911,253 shares outstanding; unlimited number of shares authorized; no par value) | | | | | | $ | 10.85 | |
| | | | | | | | |
STATEMENT OF OPERATIONS
For the year ended June 30, 2011
| | | | |
Net investment income: | | | | |
Interest income | | $ | 331,766 | |
| | | | |
Expenses: | | | | |
Investment advisory fee | | | 51,852 | |
Transfer agent fee | | | 15,555 | |
Custodian expense | | | 1,639 | |
Professional fees | | | 2,293 | |
Pricing fees | | | 5,000 | |
Trustee fees | | | 1,310 | |
Other expenses | | | 6,840 | |
| | | | |
Total expenses | | | 84,489 | |
Fees waived by Adviser | | | (1,947 | ) |
Custodian expense reduction | | | (97 | ) |
| | | | |
Net expenses | | | 82,445 | |
| | | | |
Net investment income | | | 249,321 | |
| | | | |
Realized and unrealized gain/(loss) on investments: | | | | |
Net realized gain | | | 64,546 | |
Net change in unrealized appreciation/depreciation | | | (57,991 | ) |
| | | | |
Net realized and unrealized gain on investments | | | 6,555 | |
| | | | |
Net increase in net assets resulting from operations | | $ | 255,876 | |
| | | | |
The accompanying notes are an integral part of the financial statements.
39
TENNESSEE TAX-FREE SHORT-TO-MEDIUM SERIES
STATEMENTS OF CHANGES IN NET ASSETS
For the years ended June 30, 2011 and 2010
| | | | | | | | |
| | | 2011 | | | 2010 | |
Operations: | | | | | | | | |
Net investment income | | $ | 249,321 | | | $ | 255,710 | |
Net realized gain on investments | | | 64,546 | | | | 7,938 | |
Net change in unrealized appreciation/depreciation | | | (57,991 | ) | | | 238,347 | |
| | | | | | | | |
Net increase in net assets resulting from operations | | | 255,876 | | | | 501,995 | |
Distributions from net investment income | | | (249,321 | ) | | | (255,710 | ) |
Net fund share transactions (Note 4) | | | (230,591 | ) | | | 792,348 | |
| | | | | | | | |
Total increase/(decrease) | | | (224,036 | ) | | | 1,038,633 | |
Net assets: | | | | | | | | |
Beginning of year | | | 10,113,174 | | | | 9,074,541 | |
| | | | | | | | |
End of year | | $ | 9,889,138 | | | $ | 10,113,174 | |
| | | | | | | | |
FINANCIAL HIGHLIGHTS
| | | | | | | | | | | | | | | | | | | | |
| Selected data for a share outstanding: | | For the years ended June 30, | |
| | | 2011 | | | 2010 | | | 2009 | | | 2008 | | | 2007 | |
Net asset value, beginning of year | | | $10.82 | | | | $10.54 | | | | $10.31 | | | | $10.32 | | | | $10.29 | |
| | | | | | | | | | | | | | | | | | | | |
Income from investment operations: | | | | | | | | | | | | | | | | | | | | |
Net investment income | | | 0.26 | | | | 0.28 | | | | 0.31 | | | | 0.31 | | | | 0.31 | |
Net gains/(losses) on securities, both realized and unrealized | | | 0.03 | | | | 0.28 | | | | 0.23 | | | | (0.01 | ) | | | 0.03 | |
| | | | | | | | | | | | | | | | | | | | |
Total from investment operations | | | 0.29 | | | | 0.56 | | | | 0.54 | | | | 0.30 | | | | 0.34 | |
Less distributions: | | | | | | | | | | | | | | | | | | | | |
Distributions from net investment income | | | (0.26 | ) | | | (0.28 | ) | | | (0.31 | ) | | | (0.31 | ) | | | (0.31 | ) |
| | | | | | | | | | | | | | | | | | | | |
Net asset value, end of year | | | $10.85 | | | | $10.82 | | | | $10.54 | | | | $10.31 | | | | $10.32 | |
| | | | | | | | | | | | | | | | | | | | |
Total return | | | 2.72% | | | | 5.39% | | | | 5.31% | | | | 2.90% | | | | 3.34% | |
Net assets, end of year (in thousands) | | | $9,889 | | | | $10,113 | | | | $9,075 | | | | $10,335 | | | | $10,880 | |
Ratio of net expenses to average net assets (a) | | | 0.80% | | | | 0.81% | | | | 0.82% | | | | 0.81% | | | | 0.79% | |
Ratio of net investment income to average net assets | | | 2.40% | | | | 2.63% | | | | 2.97% | | | | 2.96% | | | | 3.00% | |
Portfolio turnover | | | 18.32% | | | | 16.16% | | | | 15.00% | | | | 22.22% | | | | 0.00% | |
| (a) | | Percentages are after expenses waived by Adviser and Custodian reduction. No recovery of these waivers and reductions will be sought. |
| | | Expenses waived by Adviser and custodian were: |
| | | .02% and .0% for 2011; .02% and .0% for 2010; .0% and .04% for 2009; 0% and .05% for 2008; and 0% and .04% for 2007, respectively. |
The accompanying notes are an integral part of the financial statements.
40
DUPREE MUTUAL FUNDS — INTERMEDIATE GOVERNMENT BOND SERIES | |
SCHEDULE OF PORTFOLIO INVESTMENTS
U.S. Government Securities and Agencies — 100%
June 30, 2011
| | | | | | | | | | | | | | | | | | |
| Bond Description | | Coupon | | | Maturity Date | | | Rating# | | Par Value | | | Fair Value | |
| | | | | | | | | | | | | | | | | | |
| FEDERAL FARM CREDIT | | | | | | | | | | | | | | | | | | |
| 59.08% of Net Assets | | | | | | | | | | | | | | | | | | |
Federal Farm Credit Bank | | | 5.840 | % | | | 07/20/2022 | | | Aaa/AAA*/AAA@ | | $ | 2,850,000 | | | $ | 3,363,346 | |
Federal Farm Credit Bank | | | 5.250 | | | | 05/10/2022 | | | Aaa/AAA*/AAA@ | | | 2,000,000 | | | | 2,256,657 | |
Federal Farm Credit Bank | | | 5.125 | | | | 11/28/2022 | | | Aaa/AAA*/AAA@ | | | 2,000,000 | | | | 2,210,926 | |
Federal Farm Credit Bank | | | 3.850 | | | | 05/20/2021 | | | AAA* | | | 500,000 | | | | 499,941 | |
Federal Farm Credit Bank | | | 5.300 | | | | 06/24/2014 | | | Aaa/AAA*/AAA@ | | | 1,550,000 | | | | 1,746,886 | |
Federal Farm Credit Bank | | | 5.250 | | | | 10/25/2022 | | | Aaa/AAA*/AAA@ | | | 1,500,000 | | | | 1,682,858 | |
Federal Farm Credit Bank | | | 5.875 | | | | 08/16/2021 | | | Aaa/AAA*/AAA@ | | | 1,900,000 | | | | 2,072,619 | |
Federal Farm Credit Bank | | | 5.050 | | | | 12/21/2021 | | | Aaa/AAA*/AAA@ | | | 370,000 | | | | 411,454 | |
Federal Farm Credit Bank | | | 6.200 | | | | 07/26/2022 | | | Aaa/AAA*/AAA@ | | | 500,000 | | | | 526,675 | |
| | | | | | | | | | | | | | | | | | |
| | | | | | | | | | | | | | | | | 14,771,362 | |
| FEDERAL HOME LOAN BANK | | | | | | | | | | | | | | | | | | |
| 29.38% of Net Assets | | | | | | | | | | | | | | | | | | |
Federal Home Loan Bank | | | 7.000 | | | | 08/15/2014 | | | Aaa/AAA* | | | 500,000 | | | | 590,390 | |
Federal Home Loan Bank | | | 5.250 | | | | 12/11/2020 | | | Aaa/AAA*/AAA@ | | | 1,485,000 | | | | 1,681,330 | |
Federal Home Loan Bank | | | 5.000 | | | | 12/10/2021 | | | Aaa/AAA*/AAA@ | | | 500,000 | | | | 553,731 | |
Federal Home Loan Bank | | | 5.750 | | | | 06/10/2022 | | | Aaa/AAA*/AAA@ | | | 2,000,000 | | | | 2,343,283 | |
Federal Home Loan Bank | | | 5.550 | | | | 06/19/2023 | | | Aaa/AAA* | | | 500,000 | | | | 541,175 | |
Federal Home Loan Bank | | | 4.375 | | | | 04/16/2020 | | | AAA* | | | 1,500,000 | | | | 1,535,610 | |
Federal Home Loan Bank | | | 4.250 | | | | 05/04/2020 | | | Aaa/AAA*/AAA@ | | | 100,000 | | | | 100,880 | |
| | | | | | | | | | | | | | | | | | |
| | | | | | | | | | | | | | | | | 7,346,399 | |
| FEDERAL HOME LOAN MORTGAGE | | | | | | | | | | | | | | | | | | |
| 5.40% of Net Assets | | | | | | | | | | | | | | | | | | |
Federal National Mortgage Association | | | 8.100 | | | | 08/12/2019 | | | Aaa/AAA*/AAA@ | | | 1,000,000 | | | | 1,349,707 | |
| | | | | | | | | | | | | | | | | | |
| | | | | | | | | | | | | | | | | 1,349,707 | |
| STUDENT LOAN MARKETING ASSOCIATION | | | | | | | | | | | | | | | | | | |
| 4.30% of Net Assets | | | | | | | | | | | | | | | | | | |
Student Loan Marketing Association | | | 7.300 | | | | 08/01/2012 | | | AAA | | | 1,000,000 | | | | 1,074,498 | |
| | | | | | | | | | | | | | | | | | |
| | | | | | | | | | | | | | | | | 1,074,498 | |
| | | | | | | | | | | | | | | | | | |
Total Investments (cost $24,620,944) (See (a) below for further explanation) 98.16% of Net Assets | | | | | | | | | $ | 24,541,966 | |
| | | | | | | | | | | | | | | | | | |
| | * | | Standard and Poor's Corporation |
| | @ | | Fitch's Investors Service |
| | | | All other ratings by Moody's Investors Service, Inc. |
| | # | | Bond ratings unaudited and not covered by Report of Independent Registered Public Accounting Firm. |
| (a) | | Represents cost for financial reporting and federal income tax purposes and differs from market value by net unrealized depreciation of securities as follows: |
| | | | | | |
| | | | | | |
| | Unrealized appreciation | | $ | 669,830 | |
| | Unrealized depreciation | | | (748,808 | ) |
| | | | | | |
| | Net unrealized depreciation | | $ | (78,978 | ) |
| | | | | | |
Other Information
The following is a summary of the inputs used, as of June 30, 2011, involving the Fund's assets and liabilities carried at fair value. The inputs or methodology used for valuing securities may not be an indication of the risk associated with investing in those securities. For more information on valuation inputs, and their aggregation into the levels used the the table below, please refer to the Security Valuation section in the accompanying Notes to Financial Statements.
| | | | | | |
| | | | | | |
| | | Valuation Inputs | | Government Agencies | |
Level 1 | | Quoted Prices | | $ | — | |
Level 2 | | Other Significant Observable Inputs | | | 24,541,966 | |
Level 3 | | Significant Unobservable Inputs | | | — | |
| | | | | | |
| | | | $ | 24,541,966 | |
| | | | | | |
The accompanying footnotes are an integral part of the financial statements.
41
INTERMEDIATE GOVERNMENT BOND SERIES
STATEMENT OF ASSETS AND LIABILITIES
June 30, 2011
| | | | | | | | |
ASSETS: | | | | | | | | |
Investments in securities, at fair value (Cost: $24,620,944) | | | | | | $ | 24,541,966 | |
Cash | | | | | | | 214,909 | |
Interest receivable | | | | | | | 279,152 | |
Prepaid expenses | | | | | | | 3,386 | |
| | | | | | | | |
Total assets | | | | | | | 25,039,413 | |
LIABILITIES: | | | | | | | | |
Payable for: | | | | | | | | |
Distributions to shareholders | | | 17,169 | | | | | |
Fund shares redeemed | | | 2,473 | | | | | |
Investment advisory fee | | | 4,151 | | | | | |
Transfer agent fee | | | 2,629 | | | | | |
Accrued expenses | | | 9,072 | | | | | |
| | | | | | | | |
Total liabilities | | | | | | | 35,494 | |
| | | | | | | | |
NET ASSETS: | | | | | | | | |
Capital | | | | | | | 25,207,889 | |
Net accumulated realized loss on investment transactions | | | | | | | (124,992 | ) |
Net unrealized depreciation in value of investments | | | | | | | (78,978 | ) |
| | | | | | | | |
Net assets at value | | | | | | $ | 25,003,919 | |
| | | | | | | | |
NET ASSET VALUE, offering price and redemption price per share ($25,003,919 ÷ 2,511,371 shares outstanding; unlimited number of shares authorized; no par value) | | | | | | $ | 9.96 | |
| | | | | | | | |
STATEMENT OF OPERATIONS
For the year ended June 30, 2011
| | | | |
Net investment income: | | | | |
Interest income | | $ | 1,275,223 | |
| | | | |
Expenses: | | | | |
Investment advisory fee | | | 64,717 | |
Transfer agent fee | | | 44,830 | |
Custodian expense | | | 5,217 | |
Professional fees | | | 7,364 | |
Printing | | | 10,000 | |
Trustee fees | | | 4,085 | |
Other expenses | | | 13,656 | |
| | | | |
Total expenses | | | 149,869 | |
Custodian expense reduction | | | (247 | ) |
| | | | |
Net expenses | | | 149,622 | |
| | | | |
Net investment income | | | 1,125,601 | |
| | | | |
Realized and unrealized gain/(loss) on investments: | | | | |
Net realized gain | | | 9,157 | |
Net change in unrealized appreciation/depreciation | | | (1,164,961 | ) |
| | | | |
Net realized and unrealized loss on investments | | | (1,155,804 | ) |
| | | | |
Net decrease in net assets resulting from operations | | $ | (30,203 | ) |
| | | | |
The accompanying notes are an integral part of the financial statements.
42
INTERMEDIATE GOVERNMENT BOND SERIES
STATEMENTS OF CHANGES IN NET ASSETS
For the years ended June 30, 2011 and 2010
| | | | | | | | |
| | | 2011 | | | 2010 | |
Operations: | | | | | | | | |
Net investment income | | $ | 1,125,601 | | | $ | 1,287,448 | |
Net realized gain on investments | | | 9,157 | | | | 69,152 | |
Net change in unrealized appreciation/depreciation | | | (1,164,961 | ) | | | 559,656 | |
| | | | | | | | |
Net increase/(decrease) in net assets resulting from operations | | | (30,203 | ) | | | 1,916,256 | |
Distributions from net investment income | | | (1,125,601 | ) | | | (1,287,448 | ) |
Net fund share transactions (Note 4) | | | (15,893,548 | ) | | | 15,993,839 | |
| | | | | | | | |
Total increase | | | (17,049,352 | ) | | | 16,622,647 | |
Net assets: | | | | | | | | |
Beginning of year | | | 42,053,271 | | | | 25,430,624 | |
| | | | | | | | |
End of year | | $ | 25,003,919 | | | $ | 42,053,271 | |
| | | | | | | | |
FINANCIAL HIGHLIGHTS
| | | | | | | | | | | | | | | | | | | | |
| Selected data for a share outstanding: | | For the years ended June 30, | |
| | | 2011 | | | 2010 | | | 2009 | | | 2008 | | | 2007 | |
Net asset value, beginning of year | | | $10.24 | | | | $10.05 | | | | $9.93 | | | | $9.66 | | | | $9.58 | |
Income from investment operations: | | | | | | | | | | | | | | | | | | | | |
Net investment income | | | 0.35 | | | | 0.44 | | | | 0.46 | | | | 0.48 | | | | 0.49 | |
Net gains/(losses) on securities, both realized and unrealized | | | (0.28 | ) | | | 0.19 | | | | 0.12 | | | | 0.27 | | | | 0.08 | |
| | | | | | | | | | | | | | | | | | | | |
Total from investment operations | | | 0.07 | | | | 0.63 | | | | 0.58 | | | | 0.75 | | | | 0.57 | |
Less distributions: | | | | | | | | | | | | | | | | | | | | |
Distributions from net investment income | | | (0.35 | ) | | | (0.44 | ) | | | (0.46 | ) | | | (0.48 | ) | | | (0.49 | ) |
| | | | | | | | | | | | | | | | | | | | |
Net asset value, end of year | | | $9.96 | | | | $10.24 | | | | $10.05 | | | | $9.93 | | | | $9.66 | |
| | | | | | | | | | | | | | | | | | | | |
Total return | | | 0.71% | | | | 6.38% | | | | 5.99% | | | | 7.88% | | | | (6.04 | )% |
Net assets, end of year (in thousands) | | | $25,004 | | | | $42,053 | | | | $25,431 | | | | $23,132 | | | | $22,553 | |
Ratio of net expenses to average net assets (a) | | | 0.46% | | | | 0.47% | | | | 0.47% | | | | 0.49% | | | | 0.51% | |
Ratio of net investment income to average net assets | | | 3.48% | | | | 4.30% | | | | 4.62% | | | | 4.85% | | | | 5.05% | |
Portfolio turnover | | | 72.86% | | | | 56.38% | | | | 30.35% | | | | 33.21% | | | | 6.40% | |
| (a) | | Percentages are after custodian reduction for which no recovery will be sought. |
| | | Percentages before custodian reduction were: |
| | | .46% for 2011; .47% for 2010; .49% for 2009, .51% for 2008; and .53% for 2007. |
The accompanying notes are an integral part of the financial statements.
43
DUPREE MUTUAL FUNDS — TAXABLE MUNICIPAL BOND FUND | |
SCHEDULE OF PORTFOLIO INVESTMENTS
Taxable Municipal Bonds — 100%
June 30, 2011
| | | | | | | | | | | | | | | | | | |
| Bond Description | | Coupon | | | Maturity
Date | | | Rating# | | Par Value | | | Market Value | |
| | | | | | | | | | | | | | | | | | |
| INSURED MUNICIPAL BONDS | | | | | |
| 22.17% of Net Assets | | | | | | | | | | | | | | | | | | |
Armstrong School District PA Build America — Series A | | | 7.000 | % | | | 03/15/2041 | | | AA+* | | $ | 750,000 | | | $ | 781,523 | |
Ashland KY Independent School District Build America | | | 6.200 | | | | 08/01/2029 | | | Aa2 | | | 100,000 | | | | 103,721 | |
Bexar County TX Revenue Venue Project — Series B | | | 6.980 | | | | 08/15/2032 | | | Aa1/AA+*/A+@ | | | 250,000 | | | | 273,390 | |
Decatur GA Urban Redevelopment Agency Revenue Build America | | | 6.920 | | | | 01/01/2038 | | | Aa2/AA+* | | | 150,000 | | | | 153,030 | |
Lincoln AL Build America Bonds Recovery Zone Economic Development | | | 6.800 | | | | 06/01/2040 | | | AA+* | | | 500,000 | | | | 495,585 | |
Mesa State College CO Auxiliary Facilities Build America | | | 6.746 | | | | 05/15/2042 | | | Aa2/AA-* | | | 100,000 | | | | 102,978 | |
North Fort Bend Water Authority TX Water System Revenue | | | 6.018 | | | | 12/15/2035 | | | Aa3/AA+*/A+@ | | | 250,000 | | | | 254,824 | |
Scottsboro AL Build America | | | 6.400 | | | | 11/01/2040 | | | Aa3/AA+* | | | 250,000 | | | | 245,110 | |
| | | | | | | | | | | | | | | | | | |
| | | | | | | | | | | | | | | | | 2,410,161 | |
| CERTIFICATES OF PARTICIPATION BONDS (UNINSURED) | | | | | |
| 20.85% of Net Assets | | | | | | | | | | | | | | | | | | |
CO State Building Excellent Schools Today Certificates of Participation | | | 7.017 | | | | 03/15/2031 | | | Aa2/AA-* | | | 400,000 | | | | 423,520 | |
Grand Junction CO Certificates of Participation Build America | | | 7.500 | | | | 12/01/2030 | | | A+* | | | 500,000 | | | | 550,310 | |
Pennington County SD Certificates of Participation Build America | | | 7.200 | | | | 06/01/2037 | | | Aa2 | | | 750,000 | | | | 772,658 | |
Sedalia MO Certificates of Participation Build America | | | 7.300 | | | | 06/01/2035 | | | AA+* | | | 500,000 | | | | 519,855 | |
| | | | | | | | | | | | | | | | | | |
| | | | | | | | | | | | | | | | | 2,266,343 | |
| GENERAL OBLIGATION BONDS | | | | | |
| 18.35% of Net Assets | | | | | | | | | | | | | | | | | | |
Carroll TX Independent School District Build America | | | 6.676 | | | | 02/15/2034 | | | Aa2/AA+* | | | 100,000 | | | | 107,300 | |
East Bethel MN Build America Utilities — Series B | | | 7.000 | | | | 02/01/2040 | | | Aa3 | | | 250,000 | | | | 259,698 | |
Edgewood OH City School District Build America | | | 7.500 | | | | 12/01/2037 | | | Aa3/A+* | | | 100,000 | | | | 106,665 | |
Jefferson County TN Build America | | | 6.625 | | | | 06/01/2040 | | | Aa3/A+* | | | 250,000 | | | | 260,125 | |
New York NY Build America | | | 5.968 | | | | 03/01/2036 | | | Aa2/AA*/AA@ | | | 100,000 | | | | 105,431 | |
Pigeon Forge TN Build America Recovery Zone Economic | | | 7.125 | | | | 06/01/2040 | | | AA* | | | 300,000 | | | | 326,187 | |
Sarasota County FL Capital Improvement Revenue Build America | | | 7.016 | | | | 10/01/2040 | | | AA+*/AA+@ | | | 710,000 | | | | 735,574 | |
Talladega County AL Build America Recovery Zone | | | 5.600 | | | | 04/01/2040 | | | Aa3 | | | 100,000 | | | | 94,021 | |
| | | | | | | | | | | | | | | | | | |
| | | | | | | | | | | | | | | | | 1,995,001 | |
| LEASE REVENUE BONDS | | | | | |
| 14.74% of Net Assets | | | | | | | | | | | | | | | | | | |
Buncombe County NC Limited Obligation Build America | | | 6.800 | | | | 06/01/2030 | | | Aa2/AA* | | | 250,000 | | | | 274,503 | |
Downtown Smyrna Development Authority GA | | | 6.900 | | | | 02/01/2035 | | | Aa2/AA+* | | | 250,000 | | | | 259,560 | |
KY State Property & Buildings Build America — Series C | | | 5.921 | | | | 11/01/2030 | | | Aa3/A+*/AA-@ | | | 250,000 | | | | 251,438 | |
Omaha NE Sewer Revenue Build America | | | 6.191 | | | | 12/01/2040 | | | Aa2/AA* | | | 400,000 | | | | 391,548 | |
West Knox Utilities District Knox County TN Water & Sewer | | | 6.900 | | | | 06/01/2040 | | | AA+* | | | 400,000 | | | | 425,208 | |
| | | | | | | | | | | | | | | | | | |
| | | | | | | | | | | | | | | | | 1,602,257 | |
| MUNICIPAL UTILITY REVENUE BONDS | | | | | |
| 14.47% of Net Assets | | | | | | | | | | | | | | | | | | |
Altoona PA Water Authority Sewer Revenue Build America | | | 7.064 | | | | 12/01/2040 | | | AA+* | | | 500,000 | | | | 510,075 | |
Gainesville FL Utilities System Revenue Build America | | | 6.024 | | | | 10/01/2040 | | | Aa2/AA* | | | 250,000 | | | | 252,868 | |
Heber Light & Power Company UT Electric Revenue Build America | | | 7.000 | | | | 12/15/2030 | | | Aa3/AA-@ | | | 500,000 | | | | 495,790 | |
Metropolitan Government Nashville & Davidson County TN Water | | | 6.693 | | | | 07/01/2041 | | | Aa3/AA-* | | | 200,000 | | | | 211,656 | |
York County VA Sewer Revenue Build America | | | 6.607 | | | | 06/01/2040 | | | Aa3 | | | 100,000 | | | | 103,025 | |
| | | | | | | | | | | | | | | | | | |
| | | | | | | | | | | | | | | | | 1,573,414 | |
| UNIVERSITY CONSOLIDATED EDUCATION AND BUILDING REVENUE BONDS | | | | | |
| 4.30% of Net Assets | | | | | | | | | | | | | | | | | | |
Maine Health & Higher Educational Facilities Authority | | | 6.667 | | | | 07/01/2039 | | | Aa2 | | | 100,000 | | | | 110,595 | |
University NC Chapel Hill Hospital Revenue Build America | | | 6.329 | | | | 02/01/2031 | | | Aa3/AA-* | | | 250,000 | | | | 262,793 | |
University NC Wilmington Revenue Build America | | | 5.870 | | | | 01/01/2035 | | | A1 | | | 100,000 | | | | 94,646 | |
| | | | | | | | | | | | | | | | | | |
| | | | | | | | | | | | | | | | | 468,034 | |
The accompanying footnotes are an integral part of the financial statements.
44
DUPREE MUTUAL FUNDS — TAXABLE MUNICIPAL BOND FUND | |
SCHEDULE OF PORTFOLIO INVESTMENTS
Taxable Municipal Bonds — 100%
June 30, 2011
| | | | | | | | | | | | | | | | | | |
| Bond Description | | Coupon | | | Maturity
Date | | | Rating# | | Par Value | | | Market Value | |
| | | | | | | | | | | | | | | | | | |
| TURNPIKE ROAD REVENUE | | | | | |
| 2.82% of Net Assets | | | | | | | | | | | | | | | | | | |
FL State Turnpike Authority Turnpike Revenue Build America | | | 6.800 | % | | | 07/01/2039 | | | Aa1/AA-*/AA-@ | | $ | 300,000 | | | $ | 307,044 | |
| | | | | | | | | | | | | | | | | | |
| | | | | | | | | | | | | | | | | 307,044 | |
| | | | | | | | | | | | | | | | | | |
Total Investments (cost $10,372,583)(See (a) below for further explanation) 97.70% of Net Assets | | | | | | | | | $ | 10,622,254 | |
| | | | | | | | | | | | | | | | | | |
| | * | | Standard and Poor's Corporation |
| | @ | | Fitch's Investors Service |
| | | | (All other ratings by Moody's Investors Service, Inc.) |
| | # | | Bond ratings are unaudited and not covered by Report of Independent Registered Public Accounting Firm. |
| (a) | | Represents cost for financial reporting and federal income tax purposes and differs from market value by net unrealized appreciation of securities as follows |
| | | | | | |
| | | | | | |
| | Unrealized appreciation | | $ | 298,661 | |
| | Unrealized depreciation | | | (48,990 | ) |
| | | | | | |
| | Net unrealized appreciation | | $ | 249,671 | |
| | | | | | |
Other Information
The following is a summary of the inputs used, as of June 30, 2011, involving the Fund's assets and liabilities carried at value. The inputs or methodology used for valuing securities may not be an indication of the risk associated with investing in those securities. For more information on valuation inputs, and their aggregation into the levels used the the table below, please refer to the Security Valuation section in the accompanying Notes to Financial Statements.
| | | | | | |
| | | Valuation Inputs | | Municipal Bonds | |
| | | | | | |
Level 1 | | Quoted Prices | | $ | — | |
Level 2 | | Other Significant Observable Inputs | | | 10,622,254 | |
Level 3 | | Significant Unobservable Inputs | | | — | |
| | | | | | |
| | | | $ | 10,622,254 | |
| | | | | | |
The accompanying footnotes are an integral part of the financial statements.
45
TAXABLE MUNICIPAL BOND SERIES
STATEMENT OF ASSETS AND LIABILITIES
June 30, 2011
| | | | | | | | |
ASSETS: | | | | | | | | |
Investments in securities, at fair value (Cost: $10,372,583) | | | | | | $ | 10,622,254 | |
Cash | | | | | | | 142,948 | |
Interest receivable | | | | | | | 146,142 | |
Prepaid expenses | | | | | | | 4,971 | |
| | | | | | | | |
Total assets | | | | | | | 10,916,315 | |
LIABILITIES: | | | | | | | | |
Payable for: | | | | | | | | |
Distributions to shareholders | | | 39,711 | | | | | |
Investment advisory fee | | | 4,351 | | | | | |
Transfer agent fee | | | 89 | | | | | |
Trustee fee | | | 251 | | | | | |
| | | | | | | | |
Total liabilities | | | | | | | 44,402 | |
| | | | | | | | |
NET ASSETS: | | | | | | | | |
Capital | �� | | | | | | 10,643,352 | |
Net accumulated realized loss on investment transactions | | | | | | | (21,110 | ) |
Net unrealized appreciation in value of investments | | | | | | | 249,671 | |
| | | | | | | | |
Net assets at value | | | | | | $ | 10,871,913 | |
| | | | | | | | |
NET ASSET VALUE, offering price and redemption price per share ($10,871,913 ÷ 1,126,092 shares outstanding; unlimited number of shares authorized; no par value) | | | | | | $ | 9.65 | |
| | | | | | | | |
STATEMENT OF OPERATIONS
For the period ended June 30, 2011*
| | | | |
Net investment income: | | | | |
Interest income | | $ | 518,948 | |
| | | | |
Expenses: | | | | |
Investment advisory fee | | | 40,901 | |
Transfer agent fee | | | 12,188 | |
Custodian expense | | | 1,206 | |
Professional fees | | | 1,715 | |
Pricing | | | 1,000 | |
Trustee fees | | | 1,062 | |
Other expenses | | | 4,657 | |
| | | | |
Total expenses | | | 62,729 | |
Fees waived by Adviser | | | (1,608 | ) |
Custodian expense reduction | | | (110 | ) |
| | | | |
Net expenses | | | 61,011 | |
| | | | |
Net investment income | | | 457,937 | |
| | | | |
Realized and unrealized gain/loss on investments: | | | | |
Net realized loss | | | (21,110 | ) |
Net change in unrealized appreciation/depreciation | | | 249,671 | |
| | | | |
Net realized and unrealized gain on investments | | | 228,561 | |
| | | | |
Net increase in net assets resulting from operations | | $ | 686,498 | |
| | | | |
| * | | Represents the period from commencement of operations (November 1, 2010) through June 30, 2011. |
The accompanying notes are an integral part of the financial statements.
46
TAXABLE MUNICIPAL BOND SERIES
STATEMENT OF CHANGES IN NET ASSETS
For the period ended June 30, 2011*
| | | | |
| | | 2011 | |
Operations: | | | | |
Net investment income | | $ | 457,937 | |
Net realized loss on investments | | | (21,110 | ) |
Net change in unrealized appreciation/depreciation | | | 249,671 | |
| | | | |
Net increase in net assets resulting from operations | | | 686,498 | |
Distributions from net investment income | | | (457,937 | ) |
Net fund share transactions (Note 4) | | | 10,643,352 | |
| | | | |
Total increase | | | 10,871,913 | |
Net assets: | | | | |
Beginning of period | | | — | |
| | | | |
End of period | | $ | 10,871,913 | |
| | | | |
FINANCIAL HIGHLIGHTS
| | | | |
| Selected data for a share outstanding: | | For the period ended
June 30, 2011* | |
Net asset value, beginning of period | | | $10.00 | |
| | | | |
Income from investment operations: | | | | |
Net investment income | | | 0.34 | |
Net gains/(losses) on securities, both realized and unrealized | | | (0.35 | ) |
| | | | |
Total from investment operations | | | (0.01 | ) |
Less distributions: | | | | |
Distributions from net investment income | | | (0.34 | ) |
| | | | |
Net asset value, end of period | | | $9.65 | |
| | | | |
Total return | | | 0.04% | (b) |
Net assets, end of period (in thousands) | | | $10,872 | |
Ratio of net expenses to average net assets (a) | | | 0.49% | (c) |
Ratio of net investment income to average net assets | | | 3.71% | (c) |
Portfolio turnover | | | 89.93% | (c) |
| (a) | | Percentages are after expense waivers and reductions by the Adviser and Custodian. The Adviser and Custodian have agreed not to seek recovery of these waivers and reductions. |
| | | Expenses waived by the Adviser and expense reductions by the Custodian were as follows: |
| | | .01% (c) .0% (c) For the period ended June 30, 2011 |
| | | * Represents the period from commencement of operations (November 1, 2010) through June 30, 2011. |
The accompanying notes are an integral part of the financial statements.
47
NOTES TO FINANCIAL STATEMENTS
June 30, 2011
| 1. | | Organization and Significant Accounting Policies |
Dupree Mutual Funds is registered under the Investment Company Act of 1940, as amended, as a no-load, open-end investment company. The Declaration of Trust of Dupree Mutual Funds (the "Trust") permits the Trustees to create an unlimited number of series of investment portfolios (each a “Fund" and collectively the “Funds”) and with respect to each series to issue an unlimited number of full or fractional shares of a single class. The Trust currently offers ten series:
Alabama Tax-Free Income Series
Kentucky Tax-Free Income Series
Kentucky Tax-Free Short-to-Medium Series
Mississippi Tax-Free Income Series
North Carolina Tax-Free Income Series
North Carolina Tax-Free Short-to-Medium Series
Tennessee Tax-Free Income Series
Tennessee Tax-Free Short-to-Medium Series
Intermediate Government Bond Series
Taxable Municipal Bond Series
The investment strategy of the eight state tax-free funds is to maintain 100% of their investments in Alabama, Kentucky, Mississippi, North Carolina, or Tennessee municipal securities.
The Intermediate Government Bond Series' investment strategy is to invest only in obligations of the U.S. Treasury and Agencies of the U.S. Government. The Intermediate Government Bond Series will buy bonds and notes that will maintain an average maturity of no more than ten years.
The Taxable Municipal Bond Series’ investment strategy is to invest in taxable municipal bonds of investment grade quality.
The following is a summary of significant accounting policies consistently followed by the Funds in the preparation of their financial statements. The policies are in conformity with accounting principles generally accepted in the United States.
Securities held by the Intermediate Government Bond Series and the Taxable Municipal Bond Series are valued using market quotations as provided by an independent pricing service. Securities held by the eight state tax-free funds are valued as determined in good faith in accordance with consistently applied procedures established by and under the general supervision of the Board of Trustees. These procedures involve the use of a matrix pricing model which takes into consideration price quotations or appraisals for these securities, yield, stability, risk, quality, coupon rate, maturity, type of issue, trading characteristics, special circumstances of a security or trading market, and any other factors or market data considered relevant in determining the value. The procedures also include weekly verification of market quotations provided by two independent pricing services. A bond valuation that is not supported by a valuation source requires management to fair value the security in consultation with the Board’s Valuation committee. Shares of open-end mutual funds in which the Funds invest are valued at their respective net asset values as reported by the underlying funds.
48
NOTES TO FINANCIAL STATEMENTS
June 30, 2011
| 1. | | Organization and Significant Accounting Policies, continued |
The Funds have adopted the provisions of Financial Accounting Standards Board (FASB) Accounting Standards Codification (ASC) 820, “Fair Value Measurements and Disclosures”. ASC 820 establishes a hierarchy that prioritizes the inputs to valuation techniques giving the highest priority to readily available unadjusted quoted prices in active markets for identical assets (level 1 measurements) and the lowest priority to unobservable inputs (level 3 measurements) when market prices are not readily available or reliable. The three levels of the hierarchy under ASC 820 are described as follows:
| | |
| Level 1: | | Quoted prices in active markets for identical securities. |
| Level 2: | | Prices determined using other significant observable inputs. Observable inputs are inputs that other market participants may use in pricing a security. These may include quoted prices for similar securities, interest rates, prepayment speeds, credit risk and others. |
| Level 3: | | Price determined using significant unobservable inputs. In situations where quoted prices or observable inputs are unavailable or deemed less relevant (for example, where there is little or not market activity for an investment at the end of the period), unobservable inputs may be used. Unobservable inputs reflect the Fund’s own assumptions about the factors market participants would use in pricing an investment, and would be based on the best information available. |
The aggregate value by input level, as of June 30, 2011, for the Funds’ investments is included at the end of the Funds’ Schedule of Portfolio Investments. There we no significant transfers in and out of level 1, 2 or 3 during the period ending June 30, 2011.
Security transactions are accounted for on a trade date basis. Gains and losses on securities sold are determined on an identified cost basis.
Interest income, which includes the amortization of premiums and the accretion of discounts, is recorded on an accrual basis.
| | D. | When-Issued and Extended Settlement Securities |
The Funds may purchase securities with delivery or payment to occur at a later date. At the time the Funds enter into a commitment to purchase a security, the transaction is recorded and the value of the security is reflected in the net asset value. The value of the security may vary with market fluctuations. No interest accrues to the Funds until the security is delivered and payment takes place. At the time the Funds enter this type of transaction, they are required to segregate cash or other liquid assets equal to the value of the securities purchased.
It is each Fund’s policy to qualify as a regulated investment company by complying with the requirements of the Internal Revenue Code (the “code”) applicable to regulated investment companies, including the distribution of all or substantially all taxable and tax-exempt income to their shareholders. The Funds have met the requirements of the code applicable to regulated investment companies for the year ended June 30, 2011. Therefore, no federal income tax provision is required. Management of the Funds has concluded that there are no uncertain tax provisions that would require recognition in the financial statements. Generally, the tax authorities can examine all the tax returns for the last three years.
Substantially all of the net investment income of the Funds is declared as a dividend to shareholders of record as of the close of business each day. Distributions are payable in cash or in additional shares at the net asset value on the payable date. Distributions are determined in accordance with income tax regulations.
49
NOTES TO FINANCIAL STATEMENTS
June 30, 2011
| 1. | | Organization and Significant Accounting Policies, continued |
Distributions are payable:
| | |
| Monthly for: | | Kentucky Tax-Free Short-to-Medium Series |
| | North Carolina Tax-Free Short-to-Medium Series |
| | Tennessee Tax-Free Short-to-Medium Series |
| | Intermediate Government Bond Series |
| | Taxable Municipal Bond Series |
| |
| Quarterly for: | | Alabama Tax-Free Income Series |
| | Kentucky Tax-Free Income Series |
| | Mississippi Tax-Free Income Series |
| | North Carolina Tax-Free Income Series |
| | Tennessee Tax-Free Income Series |
The preparation of financial statements in conformity with generally accepted accounting principles in the United States requires management to make estimates and assumptions that affect the reported amounts and disclosures. Actual amounts could differ from those estimates.
Subsequent events occurring after the date of this report have been evaluated for potential impact to this report through the date the financial statements were issued. There were no subsequent events to report that would have a material impact on the Funds’ financial statements.
| | I. | New Accounting Pronouncements |
In May 2011, the Financial Accounting Standards Board issued Accounting Standards Update (“ASU”) No. 2011-04 “Amendments to Achieve Common Fair Value Measurement and Disclosure Requirements in the U.S. GAAP and IFRS”. ASU 2011-04 will require reporting entities to disclose the following information for fair value measurements categorized within Level 3 of the fair value hierarchy: quantitative information about the unobservable inputs used in the fair value measurement, the valuation processes used by the reporting entity and a narrative description of the sensitivity of the fair value measurement to changes in unobservable inputs and the interrelationships between those unobservable inputs. In addition, ASU 2011-04 will require reporting entities to make disclosures about amounts and reasons for all transfers in and out of Level 1 and Level 2 fair value measurements. The new and revised disclosures are effective for interim and annual reporting periods beginning after December 15, 2011. Management believes adoption of this pronouncement will not have a material impact on the financial statements.
| 2. | | Investment Advisory Fee and Other Transactions with Affiliates |
| | Subject to the direction of the Trustees, Dupree & Company, Inc. (the Adviser) is responsible for the management of the Funds' portfolios. Under the terms of the Investment Advisory Agreements, for the Alabama, Kentucky, Mississippi, North Carolina, Tennessee, and the Taxable Municipal Bond Series, the Funds have agreed to pay to the Adviser as compensation for all services rendered, facilities furnished and expenses paid or assumed by it under the Agreements, a fee at the annual rate of .50 of 1% of the first $100,000,000 average daily net assets of each Fund determined separately; .45 of 1% of the average daily net assets between $100,000,001 and $150,000,000 of each Fund determined separately; .40 of 1% of the average daily net assets between $150,000,001 and $500,000,000 of each Fund determined separately; .35 of 1% of the average daily net assets between $500,000,001 and 750,000,000; and .30 of 1% of the average daily net assets between $750,000,001 and 1,000,000,000; and .25 of 1% of the average daily net assets in excess of $1,000,000,000. For the Intermediate Government Bond Series, the Fund has agreed to pay to the Adviser, as compensation for all services rendered, facilities furnished and expenses paid or assumed by it under the Agreement, a fee at the annual rate of .20 of 1% of average daily net assets. Prior to March 1, 2011 the Alabama, Kentucky, Mississippi, North Carolina, Tennessee, and the Taxable Municipal Bond Series, paid to the Adviser as compensation for all services rendered, facilities furnished and expenses paid or assumed by it under the Agreements, a fee at the annual rate of .50 of 1% of the first $100,000,000 average daily net assets of each Fund determined separately; .45 of 1% of the average daily net assets between $100,000,001 and $150,000,000 of each Fund determined separately; .40 of 1% of the average daily net assets between $150,000,001 and $500,000,000 of each Fund determined separately; .35 of 1% of the average daily net assets in excess of $500,000,000. |
50
NOTES TO FINANCIAL STATEMENTS
June 30, 2011
| 2. | | Investment Advisory Fee and Other Transactions with Affiliates, continued |
The Adviser may voluntarily waive investment advisory fees payable to it under the Investment Advisory Agreement with each Fund, and assume and pay other operating expenses. The Adviser will not seek to recoup any waived fees or other operating expenses it has assumed.
For the year ended June 30, 2011, fees voluntarily waived by the Adviser were as follows:
| | | | |
| | | Fees waived
by Adviser | |
Alabama Tax-Free Income Series | | $ | 36,211 | |
Mississippi Tax-Free Income Series | | | 16,167 | |
Tennessee Tax-Free Short-to-Medium Series Taxable Municipal Bond Series | |
| 1,947
1,608 |
|
In addition, each Fund has entered into a Shareholder Service Agreement with Dupree & Company, Inc, the Funds’ transfer agent. The agreement provides for a fee computed on the average daily net asset value at the annual rate of .15 of 1% on the first $20,000,000 of average net assets and .12 of 1% of all amounts in excess of $20,000,000 of average net assets for each Fund.
| 3. | | Purchases and Sales of Securities |
During the year ended June 30, 2011, the cost of purchases and the proceeds from sales/calls and maturities of securities (excluding short-term securities and U.S. government obligations, except for the Intermediate Government Bond Series which are all U.S. government obligations) for each of the Funds were as follows:
| | | | | | | | |
| | | Purchases | | | Sales/Calls | |
Alabama Tax-Free Income Series | | $ | 2,220,060 | | | $ | 938,503 | |
Kentucky Tax-Free Income Series | | | 132,745,010 | | | | 99,621,111 | |
Kentucky Tax-Free Short-to-Medium Series | | | 14,101,005 | | | | 10,624,148 | |
Mississippi Tax-Free Income Series | | | 1,433,327 | | | | 1,266,677 | |
North Carolina Tax-Free Income Series | | | 10,677,486 | | | | 11,461,759 | |
North Carolina Tax-Free Short-to-Medium Series | | | 7,060,364 | | | | 960,007 | |
Tennessee Tax-Free Income Series | | | 5,918,061 | | | | 8,991,262 | |
Tennessee Tax-Free Short-to-Medium Series | | | 1,835,762 | | | | 1,972,027 | |
Intermediate Government Bond Series | | | 23,226,828 | | | | 38,478,304 | |
Taxable Municipal Bond Series | | | 15,100,282 | | | | 4,701,450 | |
At June 30, 2011 and 2010, there were an unlimited number of shares of beneficial interest authorized. Transactions in capital shares were as follows:
| | | | | | | | | | | | | | | | |
| ALABAMA TAX-FREE INCOME SERIES | | Year Ended June 30, 2011 | | | Year Ended June 30, 2010 | |
| | | SHARES | | | AMOUNT | | | SHARES | | | AMOUNT | |
Shares sold | | | 295,284 | | | $ | 3,467,858 | | | | 632,945 | | | $ | 7,421,145 | |
Shares reinvested | | | 38,791 | | | | 451,997 | | | | 34,019 | | | | 400,255 | |
Shares redeemed | | | (208,099 | ) | | | (2,429,265 | ) | | | (232,055 | ) | | | (2,720,915 | ) |
Net increase | | | 125,976 | | | $ | 1,490,590 | | | | 434,909 | | | $ | 5,100,485 | |
51
NOTES TO FINANCIAL STATEMENTS
June 30, 2011
| 4. | | Capital Shares, continued |
| | | | | | | | | | | | | | | | |
| KENTUCKY TAX-FREE INCOME SERIES | | Year Ended June 30, 2011 | | | Year Ended June 30, 2010 | |
| | | SHARES | | | AMOUNT | | | SHARES | | | AMOUNT | |
Shares sold | | | 15,874,005 | | | $ | 120,805,735 | | | | 18,393,656 | | | $ | 140,727,307 | |
Shares reinvested | | | 2,782,785 | | | | 21,133,737 | | | | 2,574,104 | | | | 19,772,340 | |
Shares redeemed | | | (16,316,268 | ) | | | (124,100,438 | ) | | | (11,258,407 | ) | | | (86,179,579 | ) |
Net increase | | | 2,340,522 | | | $ | 17,839,034 | | | | 9,709,353 | | | $ | 74,320,068 | |
| | | | | | | | | | | | | | | | |
KENTUCKY TAX-FREE SHORT-TO-MEDIUM SERIES | | Year Ended June 30, 2011 | | | Year Ended June 30, 2010 | |
| | | SHARES | | | AMOUNT | | | SHARES | | | AMOUNT | |
Shares sold | | | 4,446,234 | | | $ | 23,941,652 | | | | 3,750,824 | | | $ | 20,000,950 | |
Shares reinvested | | | 218,910 | | | | 1,177,937 | | | | 237,977 | | | | 1,268,895 | |
Shares redeemed | | | (4,149,834 | ) | | | (22,257,404 | ) | | | (2,624,421 | ) | | | (13,992,073 | ) |
Net increase | | | 515,310 | | | $ | 2,862,184 | | | | 1,364,380 | | | $ | 7,277,772 | |
| | | | | | | | | | | | | | | | |
| MISSISSIPPI TAX-FREE INCOME SERIES | | Year Ended June 30, 2011 | | | Year Ended June 30, 2010 | |
| | | SHARES | | | AMOUNT | | | SHARES | | | AMOUNT | |
Shares sold | | | 94,828 | | | $ | 1,067,255 | | | | 145,044 | | | $ | 1,645,363 | |
Shares reinvested | | | 12,803 | | | | 144,939 | | | | 13,324 | | | | 151,816 | |
Shares redeemed | | | (99,309 | ) | | | (1,116,014 | ) | | | (57,518 | ) | | | (651,356 | ) |
Net increase | | | 8,322 | | | $ | 96,180 | | | | 100,850 | | | $ | 1,145,823 | |
| | | | | | | | | | | | | | | | |
NORTH CAROLINA TAX-FREE INCOME SERIES | | Year Ended June 30, 2011 | | | Year Ended June 30, 2010 | |
| | | SHARES | | | AMOUNT | | | SHARES | | | AMOUNT | |
Shares sold | | | 1,255,466 | | | $ | 13,738,763 | | | | 1,247,273 | | | $ | 13,686,149 | |
Shares reinvested | | | 175,789 | | | | 1,911,216 | | | | 165,572 | | | | 1,826,597 | |
Shares redeemed | | | (1,537,280 | ) | | | (16,654,703 | ) | | | (655,126 | ) | | | (7,198,197 | ) |
Net increase/(decrease) | | | (106,025 | ) | | $ | (1,004,724 | ) | | | 757,719 | | | $ | 8,314,549 | |
| | | | | | | | | | | | | | | | |
NORTH CAROLINA TAX-FREE SHORT-TO-MEDIUM SERIES | | Year Ended June 30, 2011 | | | Year Ended June 30, 2010 | |
| | | SHARES | | | AMOUNT | | | SHARES | | | AMOUNT | |
Shares sold | | | 822,857 | | | $ | 8,957,526 | | | | 532,609 | | | $ | 5,719,346 | |
Shares reinvested | | | 32,281 | | | | 350,979 | | | | 25,104 | | | | 269,407 | |
Shares redeemed | | | (315,093 | ) | | | (3,432,375 | ) | | | (181,532 | ) | | | (1,948,228 | ) |
Net increase | | | 540,045 | | | $ | 5,876,130 | | | | 376,181 | | | $ | 4,040,525 | |
| | | | | | | | | | | | | | | | |
| TENNESSEE TAX-FREE INCOME SERIES | | Year Ended June 30, 2011 | | | Year Ended June 30, 2010 | |
| | | SHARES | | | AMOUNT | | | SHARES | | | AMOUNT | |
Shares sold | | | 991,217 | | | $ | 10,934,026 | | | | 1,194,144 | | | $ | 13,126,856 | |
Shares reinvested | | | 169,356 | | | | 1,860,689 | | | | 163,206 | | | | 1,804,520 | |
Shares redeemed | | | (1,447,207 | ) | | | (15,808,556 | ) | | | (1,371,602 | ) | | | (15,051,336 | ) |
Net decrease | | | (286,634 | ) | | $ | (3,013,841 | ) | | | (14,252 | ) | | $ | (119,960 | ) |
52
NOTES TO FINANCIAL STATEMENTS
June 30, 2011
| 4. | | Capital Shares, continued |
| | | | | | | | | | | | | | | | |
TENNESSEE TAX-FREE SHORT-TO-MEDIUM SERIES | | Year Ended June 30, 2011 | | | Year Ended June 30, 2010 | |
| | | SHARES | | | AMOUNT | | | SHARES | | | AMOUNT | |
Shares sold | | | 261,014 | | | $ | 2,830,609 | | | | 169,926 | | | $ | 1,824,768 | |
Shares reinvested | | | 15,519 | | | | 168,348 | | | | 18,227 | | | | 195,876 | |
Shares redeemed | | | (300,341 | ) | | | (3,229,548 | ) | | | (114,208 | ) | | | (1,228,296 | ) |
Net increase/(decrease) | | | (23,808 | ) | | $ | (230,591 | ) | | | 73,945 | | | $ | 792,348 | |
| | | | | | | | | | | | | | | | |
| INTERMEDIATE GOVERNMENT BOND SERIES | | Year Ended June 30, 2011 | | | Year Ended June 30, 2010 | |
| | | SHARES | | | AMOUNT | | | SHARES | | | AMOUNT | |
Shares sold | | | 198,575 | | | $ | 1,993,251 | | | | 1,900,840 | | | $ | 19,267,112 | |
Shares reinvested | | | 68,351 | | | | 687,043 | | | | 81,074 | | | | 821,663 | |
Shares redeemed | | | (1,863,726 | ) | | | (18,573,842 | ) | | | (404,161 | ) | | | (4,094,936 | ) |
Net increase/(decrease) | | | (1,596,800 | ) | | $ | (15,893,548 | ) | | | 1,577,753 | | | $ | 15,993,839 | |
| | | | | | | | | | | | | | | | |
| | | | | | | | |
| TAXABLE MUNICIPAL BOND SERIES | | Period Ended June 30, 2011* | |
| | | SHARES | | | AMOUNT | |
Shares sold | | | 1,831,276 | | | $ | 17,353,159 | |
Shares reinvested | | | 5,247 | | | | 50,193 | |
Shares redeemed | | | (710,431 | ) | | | (6,760,000 | ) |
Net increase | | | 1,126,092 | | | $ | 10,643,352 | |
| | * | | Represents the period from commencement of operations (November 1, 2010) through June 30, 2011. |
| 5. | | Concentration of credit risk |
The Alabama Tax-Free Income Series, Kentucky Tax-Free Income Series, Kentucky Tax-Free Short-to-Medium Series, Mississippi Tax-Free Income Series, North Carolina Tax-Free Income Series, North Carolina Tax-Free Short-to-Medium Series, Tennessee Tax-Free Income Series, and Tennessee Tax-Free Short-to-Medium Series each invest solely in debt obligations issued by the states of Alabama, Kentucky, Mississippi, North Carolina, and Tennessee, respectively, and their respective political subdivisions, agencies and public authorities to obtain funds for various public purposes. Each of these state-specific Funds is more susceptible to economic and political factors adversely affecting issuers of their states’ respective municipal securities than a fund that is not concentrated in these issuers to the same extent.
As of June 30, 2011, the Alabama Tax-Free Income Series, Kentucky Tax-Free Short-to-Medium Series, North Carolina Tax-Free Income Series, North Carolina Tax-Free Short-to-Medium Series, Tennessee Tax-Free Income Series, Tennessee Tax-Free Short-to-Medium Series, Intermediate Government Bond Series, and the Taxable Municipal Bond Series have capital loss carryforwards which are available to offset future capital gains, if any. As of June 30, 2011, the Kentucky Tax-Free Income Series and the Mississippi Tax-Free Income Series do not have any capital loss carryforwards.
53
NOTES TO FINANCIAL STATEMENTS
June 30, 2011
| 6. | | Federal Income Taxes, continued |
The capital loss carryforwards expire as follows:
| | | | | | | | | | | | | | | | | | | | | | | | | | | | | | | | | | | | |
| | | 2012 | | | 2013 | | | 2014 | | | 2015 | | | 2016 | | | 2017 | | | 2018 | | | 2019 | | | Total | |
Alabama Tax-Free Income Series | | $ | — | | | $ | — | | | $ | — | | | $ | — | | | $ | — | | | $ | 11,719 | | | $ | 25,322 | | | $ | — | | | $ | 37,041 | |
Kentucky Tax-Free Short-to-Medium Series | | | — | | | | 57,784 | | | | 74,336 | | | | 446,645 | | | | 227,932 | | | | 223,976 | | | | — | | | | — | | | | 1,030,673 | |
North Carolina Tax-Free Income Series | | | 21,780 | | | | — | | | | — | | | | — | | | | — | | | | — | | | | 117,110 | | | | — | | | | 138,890 | |
North Carolina Tax-Free Short-to-Medium Series | | | — | | | | — | | | | — | | | | 16,809 | | | | 30,032 | | | | — | | | | — | | | | — | | | | 46,841 | |
Tennessee Tax-Free Income Series | | | — | | | | — | | | | — | | | | — | | | | — | | | | — | | | | 823,648 | | | | — | | | | 823,648 | |
Tennessee Tax-Free Short-to-Medium Series | | | — | | | | — | | | | — | | | | 72,502 | | | | 23,418 | | | | — | | | | — | | | | — | | | | 95,920 | |
Intermediate Government Bond Series | | | 35,846 | | | | 2 | | | | 64,306 | | | | 21,144 | | | | — | | | | — | | | | — | | | | — | | | | 121,298 | |
Taxable Municipal Bond Series | | | — | | | | — | | | | — | | | | — | | | | — | | | | — | | | | — | | | | 21,110 | | | | 21,110 | |
During the year ended June 30, 2011, the following Funds utilized capital loss carryforwards as follows:
| | | | |
| | | Amount | |
Alabama Tax-Free Tax-Free Income Series | | $ | 6,579 | |
Kentucky Tax-Free Short-to-Medium Series | | | 199,821 | |
Mississippi Tax-Free Income Series | | | 26,572 | |
North Carolina Tax-Free Income Series | | | 325,856 | |
North Carolina Tax-Free Short-to-Medium Series | | | 32,681 | |
Tennessee Tax-Free Income Series | | | 407,508 | |
Tennessee Tax-Free Short-to-Medium Series | | | 64,940 | |
Intermediate Government Bond Series | | | 12,850 | |
Capital losses incurred after October 31 (“Post-October” losses) within the taxable year are deemed to arise on the first business day of the Funds’ next taxable year. The following Funds incurred and will elect to defer net capital losses during the fiscal year 2011 as follows:
| | | | |
| | | Post October Losses | |
Intermediate Government Bond Series | | $ | (3,693 | ) |
The tax character of distributions paid for the periods ended June 30, 2011 and 2010 were as follows:
| | | | | | | | | | | | | | | | | | | | | | | | |
| | | 2011 | | | 2010 | |
| | | Tax
Exempt
Income | | | Ordinary
Income | | | Long-Term
Capital
Gain | | | Tax
Exempt
Income | | | Ordinary
Income | | | Long-Term
Capital
Gain | |
Alabama Tax-Free Income Series | | $ | 774,546 | | | $ | — | | | $ | — | | | $ | 656,017 | | | $ | — | | | $ | — | |
Kentucky Tax-Free Income Series | | | 33,202,621 | | | | 3,723 | | | | 2,192,264 | | | | 31,722,118 | | | | — | | | | 1,628,317 | |
Kentucky Tax-Free
Short-to-Medium Series | | | 1,714,591 | | | | — | | | | — | | | | 1,809,942 | | | | — | | | | — | |
Mississippi Tax-Free Income Series | | | 242,439 | | | | — | | | | — | | | | 218,128 | | | | — | | | | — | |
North Carolina Tax-Free Income Series | | | 2,813,638 | | | | — | | | | — | | | | 2,648,834 | | | | — | | | | — | |
North Carolina Tax-Free
Short-to-Medium Series | | | 457,012 | | | | — | | | | — | | | | 372,430 | | | | — | | | | — | |
Tennessee Tax-Free Income Series | | | 3,451,031 | | | | — | | | | — | | | | 3,415,997 | | | | — | | | | — | |
Tennessee Tax-Free
Short-to-Medium Series | | | 249,321 | | | | — | | | | — | | | | 255,710 | | | | — | | | | — | |
Intermediate Government Bond Series | | | — | | | | 1,125,601 | | | | — | | | | — | | | | 1,287,448 | | | | — | |
Taxable Municipal Bond Series | | | — | | | | 457,937 | | | | — | | | | — | | | | — | | | | — | |
54
NOTES TO FINANCIAL STATEMENTS
June 30, 2011
| 6. | | Federal Income Taxes, continued |
At June 30, 2011, the Fund's components of distributable earnings (accumulated losses) on a tax basis were as follows:
| | | | | | | | | | | | | | | | |
| | | Undistributed
Ordinary
Income | | | Undistributed
Tax Exempt
Income | | | Undistributed Net
Long term
Capital Gain | | | Net Unrealized
Appreciation/
Depreciation
Investments | |
Alabama Tax-Free Income | | $ | — | | | $ | 81,923 | | | $ | | | | $ | 173,220 | |
Kentucky Tax-Free Income | | | — | | | | 3,373,479 | | | | 3,108,498 | | | | 23,589,127 | |
Kentucky Tax-Free Short-to-Medium | | | — | | | | 43,521 | | | | — | | | | 2,934,123 | |
Mississippi Tax-Free Income | | | — | | | | 31,821 | | | | 16,068 | | | | 15,134 | |
North Carolina Tax-Free Income | | | — | | | | 215,544 | | | | — | | | | 592,675 | |
North Carolina Tax-Free Short-to-Medium | | | — | | | | 11,319 | | | | — | | | | 650,620 | |
Tennessee Tax-Free Income | | | — | | | | 368,520 | | | | — | | | | 1,480,167 | |
Tennessee Tax-Free Short-to-Medium | | | — | | | | 6,060 | | | | — | | | | 152,470 | |
Intermediate Government Bond | | | 17,169 | | | | — | | | | — | | | | (78,978 | ) |
Taxable Municipal Bond Series | | | 39,711 | | | | — | | | | — | | | | 249,671 | |
| | | | | | | | | | | | |
| | | Accumulated
Capital and
Other Losses | | | Other
Temporary
Differences | | | Total
Accumulated
Earnings | |
Alabama Tax-Free Income | | $ | (37,041 | ) | | $ | (81,923 | ) | | $ | 136,176 | |
Kentucky Tax-Free Income | | | — | | | | (3,373,473 | ) | | | 26,697,631 | |
Kentucky Tax-Free Short-to-Medium | | | (1,030,674 | ) | | | (43,521 | ) | | | 1,903,449 | |
Mississippi Tax-Free Income | | | — | | | | (31,821 | ) | | | 31,202 | |
North Carolina Tax-Free Income | | | (138,890 | ) | | | (215,544 | ) | | | 453,785 | |
North Carolina Tax-Free Short-to-Medium | | | (46,841 | ) | | | (11,319 | ) | | | 603,779 | |
Tennessee Tax-Free Income | | | (823,648 | ) | | | (368,520 | ) | | | 658,519 | |
Tennessee Tax-Free Short-to-Medium | | | (95,920 | ) | | | (6,060 | ) | | | 56,550 | |
Intermediate Government Bond | | | (124,992 | ) | | | (17,169 | ) | | | (203,970 | ) |
Taxable Municipal Bond Series | | | (21,110 | ) | | | (39,711 | ) | | | 228,561 | |
| 7. | | Contingencies and Commitments |
The Funds indemnify the Trust’s officers and Trustees for certain liabilities that might arise from their performance of their duties to the Funds. Additionally, in the normal course of business, the Funds enter into contracts that contain a variety of representations and warranties and which may provide for indemnification. The Funds’ maximum exposure under these arrangements is unknown, as this would involve predicting future claims that may be made against the Funds, if any, that have not yet occurred. However, based on experience, the Funds expect the risk of loss to be immaterial.
| 8. | | Line of Credit Agreement and Custodian Agreement |
Under the terms of an agreement with the Funds’ custodian, principal amounts up to 5% of a Fund’s net assets are available on an uncommitted line of credit. The principal amounts borrowed are due on demand. The agreement expires on September 30, 2011, but may be renewed annually. Interest is payable based on the published prime rate of the bank. Securities with a minimum value of three times the loan proceeds will be assigned as collateral until the balance of the note and unpaid interest is paid in full and terminated.
55
NOTES TO FINANCIAL STATEMENTS
June 30, 2011
| 8. | | Line of Credit Agreement and Custodian Agreement, continued |
At June 30, 2011 the Funds had an unused line of credit amount of $37,995,000. During the year ended June 30, 2011, the average interest rate on borrowings was 3.25% and the daily weighted average borrowings for each Fund were as follows:
| | | | |
| | | Weighted average
borrowings | |
Alabama Tax-Free Income Series | | $ | 2,315 | |
Kentucky Tax Free Income Series | | | 53,539 | |
Kentucky Tax-Free Short-to-Medium Series | | | 8,427 | |
Mississippi Tax-Free Income Series | | | 1,367 | |
North Carolina Tax-Free Income Series | | | 23,868 | |
North Carolina Tax-Free Short-to-Medium Series | | | 1,649 | |
Tennessee Tax-Free Income Series | | | 4,882 | |
Tennessee Tax-Free Short-to-Medium Series | | | 4,893 | |
Intermediate Government Bond Series | | | 2,781 | |
The Funds have a contractual agreement with the custodian whereby the Funds compensate the custodian for custodial services incurred exceeding the credits realized as a result of uninvested cash balances. Credits realized as a result of uninvested cash balances are used to reduce each Fund’s expenses. During the year, these credits reduced each of Funds’ expenses by the amount shown on the Statement of Operation as “Custodian expense reduction.”
56
Report of Independent Registered Public Accounting Firm
To the Shareholders and Board of Trustees of
Dupree Mutual Funds
We have audited the accompanying statements of assets and liabilities, including the schedule of portfolio investments, of Dupree Mutual Funds, comprised of Alabama Tax-Free Income Series, Kentucky Tax-Free Income Series, Kentucky Tax-Free Short-to-Medium Series, Mississippi Tax-Free Income Series, North Carolina Tax-Free Income Series, North Carolina Tax-Free Short-to-Medium Series, Tennessee Tax-Free Income Series, Tennessee Tax-Free Short-to-Medium Series, Intermediate Government Bond Series, and Taxable Municipal Bond Series (collectively, the Funds), as of June 30, 2011, and the related statements of operations for the year or period then ended, and the statements of changes in net assets and financial highlights for each of the years or periods indicated therein. These financial statements and financial highlights are the responsibility of the Funds’ management. Our responsibility is to express an opinion on these financial statements and financial highlights based on our audits.
We conducted our audits in accordance with the standards of the Public Company Accounting Oversight Board (United States). Those standards require that we plan and perform the audits to obtain reasonable assurance about whether the financial statements are free of material misstatement. We were not engaged to perform an audit of the Funds’ internal control over financial reporting. Our audits included consideration of internal control over financial reporting as a basis for designing audit procedures that are appropriate in the circumstances, but not for the purpose of expressing an opinion on the effectiveness of the Funds’ internal control over financial reporting. Accordingly, we express no such opinion. An audit also includes examining, on a test basis, evidence supporting the amounts and disclosures in the financial statements, assessing the accounting principles used and significant estimates made by management, and evaluating the overall financial statement presentation. Our procedures included confirmation of securities owned as of June 30, 2011, by correspondence with the custodian and brokers. We believe that our audits provide a reasonable basis for our opinion.
In our opinion, the financial statements and financial highlights referred to above present fairly, in all material respects, the financial position of each of the respective Funds comprising the Dupree Mutual Funds at June 30, 2011, the results of their operations for the year or period then ended, and the changes in their net assets and financial highlights for each of the years or periods then ended indicated above, in conformity with U.S. generally accepted accounting principles.

Cincinnati, Ohio
August 26, 2011
57
DUPREE MUTUAL FUNDS
OTHER UNAUDITED INFORMATION
June 30, 2011
Trustee and officer information
The following table sets forth information as to the Trustees and officers:
| | | | | | | | | | |
| Name, Address and Age | | Position(s) Held with
Funds | | Term of Office and
Length of Time Served | | Principal Occupation(s)
During Past 5 Years | | Number of
Portfolios in
Fund Complex
Overseen by
Trustee | | Other
Directorships
Held by Trustee |
| Officers: | | | | | | | | | | |
Thomas P. Dupree Sr. 125 South Mill Street Lexington, KY 40507 Age: 80 | | President | | Annual Term;
32 years of service | | Chairman of the Board of Dupree & Company, Inc. | | N/A | | KY Historical Society Foundation |
Gay M. Elste P.O. Box 28 Versailles, KY 40383 Age: 60 | | Compliance Officer | | Annual Term;
7 years of service | | Attorney at Law, Darsie & Elste. Anstruther Farm, beef cattle farming | | N/A | | N/A |
Allen E. Grimes, III 125 South Mill Street Lexington, KY 40507 Age: 48 | | Executive Vice President | | Annual Term;
6 years of service | | President, Dupree & Company, Inc. | | N/A | | International Book Project, Inc. |
Michelle M. Dragoo 125 South Mill Street Lexington, KY 40507 Age: 50 | | Vice President, Secretary, Treasurer | | Annual Term;
13 years of service as Vice President, 11 years of service as Secretary, Treasurer | | Vice President, Secretary, Treasurer of Dupree & Company, Inc. | | N/A | | N/A |
Alison L. Arnold 125 South Mill Street Lexington, KY 40507 Age: 51 | | Assistant Secretary | | Annual Term;
18 years of service | | Dupree & Company, Inc. | | N/A | | N/A |
| Trustees: | | | | | | | | | | |
William A. Combs, Jr. 111 Woodland Ave., #510 Lexington, KY 40502 Age: 71 | | Chairman, Trustee | | Annual Term; 10 years of service as Chairman; 22 years of service as Trustee | | Officer, Director: Mercedes-Benz of Cincinnati, Ohio; Mercedes-Benz of West Chester, Ohio and Freedom Dodge, Lexington, KY | | 10 | | N/A |
James C. Baughman, Jr. 1999 Richmond Road Suite 4 Lexington, KY 40502 Age: 48 | | Trustee | | One Year Term; 4 Years of Service | | President, Secretary, Treasurer, Director Office Suites Plus, Inc. (executive office space rental) | | 10 | | Advisory Board, Community Trust Bank; Treasurer/ Director Office Business Center Association International; Vice President, Director, Preferred Office Network, LLC |
Lucy A. Breathitt 1703 Fairway Drive Lexington, KY 40502 Age: 74 | | Trustee | | Annual Term; 15 years of service | | Alexander Farms, farming | | 10 | | KY Historical Society Foundation, KY Natural Lands Trust, Bluegrass Conservancy |
C. Timothy Cone 201 West Short Street Lexington, KY 40507 Age: 67 | | Trustee | | Annual Term; 9 years of service | | President, Gess, Mattingly & Atchison, P.S.C. (law firm) | | 10 | | N/A |
58
DUPREE MUTUAL FUNDS
OTHER UNAUDITED INFORMATION
June 30, 2011
Trustee and officer information, continued
| | | | | | | | | | |
| Name, Address and Age | | Position(s) Held with
Funds | | Term of Office and
Length of Time Served | | Principal Occupation(s)
During Past 5 Years | | Number of
Portfolios in
Fund Complex
Overseen by
Trustee | | Other
Directorships
Held by Trustee |
J. William Howerton 3954 Primrose Place Paducah, KY 42001 Age: 79 | | Trustee | | Annual Term; 11 years of service | | Judge (retired November 1996) KY Court of Appeals; Self-Employed Mediator (through 2006), Arbitrator and Special Judge; Trustee for charitable organization and individuals. | | 10 | | KY Lottery Corporation (through 2008) |
William S. Patterson 367 West Short Street Lexington, KY 40507 Age: 78 | | Trustee | | Annual Term; 32 years of service | | President, CEO, Cumberland Surety Co., Lexington, KY, President, Patterson & Co., Frankfort, KY, (real estate development, thoroughbred horse breeding and farming) | | 10 | | N/A |
As of June 30, 2011, none of the Trustees nor members of their immediate family held any beneficial interest in the Trust’s Investment Adviser. Further, the Trust does not have an underwriter.
The Statement of Additional Information (“SAI”) includes additional information about Trustees and officers and is available upon request without charge. Please call (800) 866-0614 to request the SAI.
Proxy Voting Information
A description of the policies and procedures that the Funds use to determine how to vote proxies relating to portfolio securities is available without charge upon request by calling (800) 866-0614, or on the Securities and Exchange Commission’s website at http://www.sec.gov. For the year ending June 30, 2011, the Funds exercised no proxy votes due to the fact that the debt instruments in which the Funds invest carry no voting rights.
Quarterly Portfolio Disclosure
The Trust files with the Securities and Exchange Commission a complete listing of portfolio holdings for each Fund as of the end of the first and third quarters of each fiscal year on Form N-Q. The complete listing (i) is available on the commission’s website and (ii) will be made available to shareholders upon request by calling (800) 866-0614. Information on the operation of the S.E.C.’s Public Reference Room may be obtained by calling 1-800-SEC-0300.
59
DUPREE MUTUAL FUNDS
OTHER UNAUDITED INFORMATION
June 30, 2011
Schedule of Shareholder Expenses
As a shareholder of the Funds, you incur transaction costs including investment advisory fees and other Fund expenses. The following examples are intended to help you understand your ongoing costs (in dollars) of investing in the Funds and to compare these costs with the ongoing costs of investing in other mutual funds.
Actual Expenses
The first line of the table below provides information about actual account values and actual expenses. You may use the information in this line, together with the amount you invested, to estimate the expenses that you paid over the period. Simply divide your account value by $1,000 (for example, an $8,600 account value divided by $1,000 = 8.6), then multiply the result by the number in the first line under the heading entitled “Expenses Paid During the Six Months Ended June 30, 2011” to estimate the expenses you paid on your account during this period.
Hypothetical Example for Comparison Purposes
The second line of the table below provides information about hypothetical account values and hypothetical expenses based on each Fund’s actual expense ratio and an assumed rate of return of 5% per year before expenses which is not the Funds’ actual ending account balance or expenses you paid for the period. You may use this information to compare the ongoing costs of investing in the Funds and other funds. To do so, compare this 5% hypothetical example with the 5% hypothetical examples that appear in the shareholder reports of other funds.
| | | | | | | | | | | | | | | | |
| | | Net Expense
Ratio
Annualized
June 30, 2011 | | | Beginning
Account Value
January 1, 2011* | | | Ending
Account Value
June 30, 2011** | | | Expenses Paid During
the Six Months
Ended June 30, 2011 | |
Alabama Tax-Free Income Series | | | | | | | | | | | | | | | | |
| Actual | | | .64 | % | | $ | 1,000.00 | | | $ | 1,023.83 | | | $ | 3.19 | |
| Hypothetical | | | .64 | | | | 1,000.00 | | | | 1,024.79 | | | | 3.19 | |
Kentucky Tax-Free Income Series | | | | | | | | | | | | | | | | |
| Actual | | | .58 | | | | 1,000.00 | | | | 1,021.67 | | | | 2.90 | |
| Hypothetical | | | .58 | | | | 1,000.00 | | | | 1,024.79 | | | | 2.90 | |
Kentucky Tax-Free Short-to-Medium Series | | | | | | | | | | | | | | | | |
| Actual | | | .72 | | | | 1,000.00 | | | | 1,013.59 | | | | 3.59 | |
| Hypothetical | | | .72 | | | | 1,000.00 | | | | 1,024.79 | | | | 3.61 | |
Mississippi Tax-Free Income Series | | | | | | | | | | | | | | | | |
| Actual | | | .64 | | | | 1,000.00 | | | | 1,019.98 | | | | 3.23 | |
| Hypothetical | | | .64 | | | | 1,000.00 | | | | 1,024.79 | | | | 3.24 | |
North Carolina Tax-Free Income Series | | | | | | | | | | | | | | | | |
| Actual | | | .70 | | | | 1,000.00 | | | | 1,022.56 | | | | 3.52 | |
| Hypothetical | | | .70 | | | | 1,000.00 | | | | 1,024.79 | | | | 3.52 | |
North Carolina Tax-Free Short-to-Medium Series | | | | | | | | | | | | | | | | |
| Actual | | | .76 | | | | 1,000.00 | | | | 1,013.84 | | | | 3.78 | |
| Hypothetical | | | .76 | | | | 1,000.00 | | | | 1,024.79 | | | | 3.80 | |
Tennessee Tax-Free Income Series | | | | | | | | | | | | | | | | |
| Actual | | | .69 | | | | 1,000.00 | | | | 1,021.47 | | | | 3.48 | |
| Hypothetical | | | .69 | | | | 1,000.00 | | | | 1,024.79 | | | | 3.48 | |
60
DUPREE MUTUAL FUNDS
OTHER UNAUDITED INFORMATION
June 30, 2011
Schedule of Shareholder Expenses, continued
| | | | | | | | | | | | | | | | |
| | | Net Expense
Ratio
Annualized
June 30, 2011 | | | Beginning
Account Value
January 1, 2011* | | | Ending
Account Value
June 30, 2011** | | | Expenses Paid During
the Six Months
Ended June 30, 2011 | |
Tennessee Tax-Free Short-to-Medium Series | | | | | | | | | | | | | | | | |
| Actual | | | .82 | % | | $ | 1,000.00 | | | $ | 1,011.55 | | | $ | 4.07 | |
| Hypothetical | | | .82 | | | | 1,000.00 | | | | 1,024.79 | | | | 4.10 | |
Intermediate Government Bond Series | | | | | | | | | | | | | | | | |
| Actual | | | .49 | | | | 1,000.00 | | | | 1,010.22 | | | | 2.46 | |
| Hypothetical | | | .49 | | | | 1,000.00 | | | | 1,024.79 | | | | 2.47 | |
Taxable Municipal Bond Series | | | | | | | | | | | | | | | | |
| Actual | | | .74 | | | | 1,000.00 | | | | 1,048.94 | | | | 3.76 | |
| Hypothetical | | | .74 | | | | 1,000.00 | | | | 1,024.79 | | | | 3.72 | |
| * | | The example is based on an investment of $1,000 invested at the beginning of the period. |
| ** | | Expenses are equal to the Fund’s annualized expense ratio, multiplied by the average account value over the period multiplied by [181/365] (to reflect one-half year period). |
61
Item 2. Code of Ethics: The registrant has adopted a code of ethics that applies to the principal executive officer, principal financial officer, principal accounting officer and persons performing similar functions. The full text of the Code of Ethics is attached hereto as Exhibit 12(a)(1). There have been no waivers from the Code of Ethics during the reporting period. The Registrant’s Code of Ethics is posted on its web site. A copy of the Code of Ethics will be provided to any person free of charge upon request by telephoning or writing the Registrant.
Item 3. Audit Committee Financial Expert: Audit Committee Financial Expert: The board does not have a financial expert serving on the audit committee. The registrant’s audit committee is comprised of all Trustees all of who are non-interested and independent. The audit committee believes that the collective experience and expertise of the members in assessing the performance of companies and the evaluation of financial statements is sufficient to assess the issues which can reasonably be expected to be raised by the Trust’s financial statements.
Item 4. Principal Accountant Fees and Services: This information is incorporated by reference in the registrant’s definitive proxy statement to be filed within 120 days after June 30, 2011.
Item 5. Not applicable.
Item 6. Included as part of item 1.
Item 7. Not applicable
Item 8. Not applicable.
Item 9. Not applicable
Item 10. There have been no changes to the procedures by which shareholders may recommend nominees to the board of trustees nominating committee.
Item 11. Controls and Procedures:
On August 26, 2011 the Registrant’s President and Treasurer assessed the disclosure controls and procedures to evaluate the effectiveness of the Registrant’s disclosure controls and procedures designed to ensure that information required to be disclosed by the investment company on Form N-CSR is recorded, processed, summarized and reported within the time periods specified in the Securities and Exchange Commission’s rules and forms. Disclosure controls and procedures include, without limitation, controls and procedures designed to ensure that information required to be disclosed by an investment company in the reports that it files on Form N-CSR is accumulated and communicated to the investment company’s management, including its principal executive and principal financial officers or persons performing similar functions, as appropriate to allow timely decisions regarding required disclosure.
Further, on August 26, 2011 the Registrant’s President and Treasurer assessed the internal control over financial reporting to provide reasonable assurance regarding the reliability of financial reporting and the preparation of financial statements for external purposes in accordance with generally accepted accounting principles and includes those policies and procedures that: (1) pertain to the maintenance of records that in reasonable detail accurately and fairly reflect the transactions and dispositions of the assets of the investment company; (2) provide reasonable assurance that transactions are recorded as necessary to permit preparation of financial statements in accordance with generally accepted accounting principles, and that receipts and expenditures of the investment company are being made only in accordance with authorizations of management and trustees of the investment company; and (3) provide reasonable assurance regarding prevention or timely detection of unauthorized acquisition, use, or disposition of the investment company’s assets that could have a material effect on the financial statements.
The Registrant’s President and Treasurer have deemed the disclosure controls and procedures and the internal control over financial reporting effective. There were no changes in the Registrant’s disclosure
controls and procedures or internal control over financial reporting that occurred during the fourth quarter
of the fiscal year that materially affected or is reasonably likely to materially affect the Registrant’s financial statements.
Item 12. Exhibits
SIGNATURES
Pursuant to the requirements of the Securities Exchange Act of 1934 and the Investment Company Act of 1940, the registrant has duly caused this report to be signed on its behalf by the undersigned thereunto duly authorized.
Dupree Mutual Funds
| | |
| |
By: | | /s/ Michelle M. Dragoo, |
| | Vice President, Secretary, Treasurer |
Date: August 26, 2011
Pursuant to the requirements of the Securities Exchange Act of 1934 and the Investment Company Act of 1940, this report has been signed below by the following persons on behalf of the registrant and in the capacities and on the dates indicated.
Dupree Mutual Funds
| | |
| |
By: | | /s/ Thomas P. Dupree, |
| | Sr., President |
Date: August 26, 2011
| | |
| |
By: | | /s/ Michelle M. Dragoo, |
| | Vice President, Secretary, Treasurer |
Date: August 26, 2011