U. S.
SECURITIES AND EXCHANGE COMMISSION
WASHINGTON, D. C. 20549
FORM N-CSR
CERTIFIED SHAREHOLDER REPORT OF REGISTERED
MANAGEMENT INVESTMENT COMPANIES
Investment Company Act file number 811-2918
(Exact Name of Registrant as Specified in Charter)
|
125 South Mill Street, Bluegrass Corporate Center, Suite 100 Lexington, Kentucky 40507 |
(Address of Principal Executive Offices) (Zip Code)
|
Thomas P. Dupree 125 South Mill Street, Bluegrass Corporate Center, Suite 100 Lexington, Kentucky 40507 |
(Name and address of agent for service)
Registrant’s Telephone Number, including Area Code (859) 254-7741
Date of fiscal year end: June 30, 2013
Date of reporting period: July 1, 2012 through June 30, 2013
Item 1. Report to Stockholders

June 30, 2013
ANNUAL REPORT
TO SHAREHOLDERS
ABOUT DUPREE MUTUAL FUNDS
In 1941, Dupree & Company, Inc. began business in Harlan, Kentucky as a small securities brokerage firm specializing in tax-exempt municipal bonds.
Over the years the firm, which in 1963 moved its offices to Lexington, Kentucky, grew to become a regional leader in public finance, helping to structure complex and innovative municipal bond financing for some of the largest public projects in the Commonwealth of Kentucky.
In 1979, Dupree & Company began what is now Dupree Mutual Funds with the Kentucky Tax-Free Income Series and became the Fund’s investment adviser. The Fund was one of the first single-state municipal bond funds in the country, and the first mutual fund to invest solely in Kentucky municipal bonds. Since then, several new offerings have been added to the Dupree Mutual Funds family:
Kentucky Tax-Free Short-to-Medium Series in 1987;
Intermediate Government Bond Series in 1992;
Tennessee Tax-Free Income Series in 1993;
Tennessee Tax-Free Short-to-Medium Series in 1994;
North Carolina Tax-Free Income Series in 1995;
North Carolina Tax-Free Short-to-Medium Series in 1995;
Alabama Tax-Free Income Series in 2000;
Mississippi Tax-Free Income Series in 2000; and
Taxable Municipal Bond Series in 2010.
Today, after more than 60 years in business, Dupree continues to be a pioneer in the industry. Our Kentucky, Tennessee, and Mississippi Series are currently the ONLY 100% “no-load” municipal bond funds available in those states. No-load means simply that shares of the funds are offered directly to investors with no front or back-end sales charges, as opposed to load funds which are sold through brokerage firms or other institutions.
At Dupree Mutual Funds, our goal is a simple one: to offer investors a high-quality, low-cost way to invest in municipal and government bonds while providing superior service to our shareholders. We encourage you to let us know how we’re doing.
TABLE OF CONTENTS
Management’s Discussion of Fund Performance: | Unaudited |
Twelve Months Ended June 30, 2013i
The investment objective of our tax-free municipal bond funds is to provide a high level of tax-free income derived from state-specific municipal bonds without incurring undue risk to principal. The investment objectives of our government bond fund and taxable municipal bond fund are to provide a high level of taxable income derived from securities of the U.S. government and its agencies and taxable municipal securities, respectively, without incurring undue risk to principal.
This report covers the 12-month period from July 1, 2012 through June 30, 2013 (the “reporting period”). During the first six months of the reporting period the economy grew at a modest pace. Real gross domestic product (GDP) increased at a 3.1 percent annual rate during the third quarter of 2012, but slowed dramatically during the fourth quarter of 2012 with real GDP growing at an anemic 0.4% annual rate. Economic growth picked up somewhat during the first quarter of 2013 with real GDP increasing at a 1.1 percent annual rate. Real GDP for the second quarter of 2013 increased at a 1.7 percent annual rate (advance estimate). Historically, the average growth rate in the United States has been around 3.5 percent. The staff at the Federal Reserve is currently projecting that real GDP will accelerate gradually through 2015, supported by accommodative monetary policy, easing credit conditions, and rising consumer and business sentiment.
In the labor market, the unemployment rate remained elevated during the reporting period. The seasonally adjusted national unemployment rate stood at 7.6 percent at the end of the reporting period. The labor market continued to show signs of improvement during the reporting period, albeit at a gradual pace. The underemployment rate, which includes part-time workers who would prefer a full-time position and people that want to work but have given up looking, ended the reporting period at a four month high at 14.3 percent. The Federal Reserve’s central tendency estimate (which excludes the three highest and three lowest projections) for the unemployment rate is 7.2 to 7.3 percent in 2013; 6.5 to 6.8 percent in 2014; and 5.8 to 6.2 percent in 2015.
Key measures of inflation remained subdued during the reporting period. The Federal Reserve’s preferred inflation index, the personal consumption expenditure core price index (PCE), increased 1.2 percent on a year-over-year basis through June which is substantially below the 2 percent target rate set by the Federal Reserve. The consumer price index (CPI) increased 1.8 percent on a year-over-year basis through June. Excluding food and energy, the core CPI increased 1.6 percent year-over-year, the least since June 2011. Near-term and long-term inflation expectations have remained stable. The Federal Reserve’s central tendency estimate for core PCE is 1.2 to 1.3 percent for 2013; 1.5 to 1.8 percent for 2014; and 1.7 to 2.0 percent for 2015.
Against this backdrop, the Federal Open Market Committee (FOMC) continued to maintain a highly accommodative monetary policy. The FOMC kept the federal funds target rate at 0 to 1/4 percent during the reporting period and through its forward guidance conditionally pledged to keep the target rate at exceptionally low levels through mid-2015. In September, the FOMC announced that it would continue its program to extend the average maturity of its Treasury holdings and would begin purchasing additional agency-guaranteed mortgage-backed securities at a pace of $40 billion per month. In December, the FOMC announced that in addition to continuing its purchases of mortgage-backed securities, it would purchase longer-term Treasury securities at a pace of $45 billion per month. The FOMC also indicated that it expected the fed funds target rate to remain at exceptionally low levels so long as the unemployment rate remains above 6.5 percent, inflation between one and two years ahead is projected to be no more than 1/2 percentage point above the FOMC’s 2 percent longer-run goal, and longer-term inflation expectations continue to be well anchored.
State and local governments continued to successfully address ongoing fiscal challenges during the reporting period. According to data compiled by The Nelson A. Rockefeller Institute of Government (“Rockefeller”), state tax revenue grew by 5.2 percent in the fourth quarter of 2012. This was the twelfth consecutive quarter that states reported growth in collections on a year-over-year basis. Overall, inflation adjusted state tax revenues are now above pre-recession levels. Preliminary data collected by Rockefeller from 47 states suggest that overall tax collections increased approximately 9.3 percent in nominal terms in the first quarter of 2013 compared to the same quarter of 2012. Tax collections in the first quarter were driven primarily by strong growth in personal income tax collections reflecting taxpayer actions to accelerate income due to rising marginal tax rates and a gradually improving economy. However, notwithstanding the positive revenue trend, states and local governments continue to face tough choices in connection with balancing their budgets.
In contrast to states, local governments rely primarily on property taxes. According to data compiled by Rockefeller, local property tax revenues grew by a modest 0.1 percent in the fourth quarter of 2012. Tax collections at the local level continue to be negatively impacted by lower home prices and real property assessments. On a positive note, it should be noted that housing prices appear to have stabilized in many geographic markets and have actually rebounded sharply in some areas that previously experienced large price declines.
i
State, local, and federal government spending and investment continued to fall during the reporting period reflecting efforts to reduce budget deficits, the scaling back of overseas military activities, and the effects of automatic sequestration cuts. The Congressional Budget Office estimates that deficit reduction policies in current law will slow the pace of economic growth by approximately 1.5 percent this year.
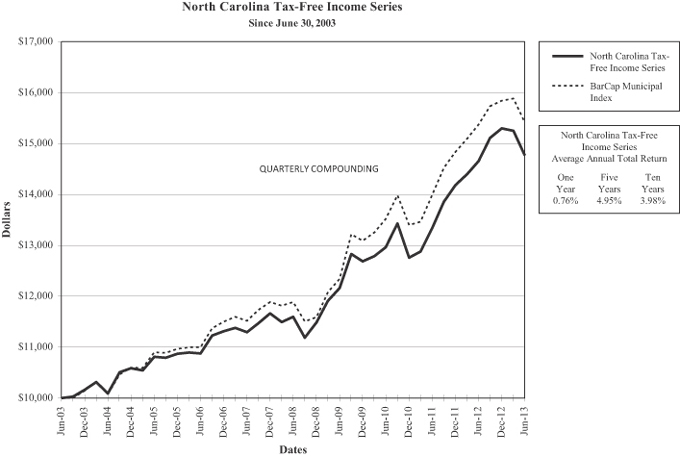
Returns in the municipal bond market were essentially flat for the 12-month period under review. The Barclays Capital Municipal Bond Index, which tracks investment grade municipal securities across all sectors and maturities, had a total return of 0.236 percent for the twelve month period ended June 30, 2013.
During the second half of 2012, the municipal bond market performed relatively well with yields grinding lower (prices higher) all along the yield curve. For example, the yield on a 10-year AAA rated municipal bond at the beginning of the reporting period was approximately 1.85 percent and finished calendar year 2012 at approximately 1.72 percent. Favorable supply and demand patterns and highly accommodative monetary policies by the Fed helped fuel the performance of the municipal bond market during the third and fourth quarters of 2012.
The municipal bond market entered 2013 on strong footing and continued to perform relatively well during the first quarter with yields mostly remaining in a tight trading range. However, the story changed dramatically during the second quarter. Beginning in May of 2013, municipal bond and Treasury yields began slowly moving higher as part of a general correction of historically low interest rates. This rate adjustment quickly escalated in June and resulted in a massive sell-off in bonds that was precipitated when the Fed hinted at its June meeting for the first time that it was considering “tapering” its bond purchase program. The sell-off lasted approximately 6-7 weeks and caused yields in the Treasury and municipal markets to spike (and prices to fall) to levels not seen since 2011. Bond markets eventually stabilized at the very end of the reporting period, but not before wiping out most of the gains of the previous three quarters.
The municipal bond market also continued to experience some “headline risk” during the review period. A good example of this is in Detroit where a state-appointed emergency manager was hired to restructure the city’s debts in an effort to avoid a bankruptcy filing. Notwithstanding a few high profile distressed credit situations like Detroit, the default rate for investment grade municipal bonds during the past twelve months has continued to be below historical averages.
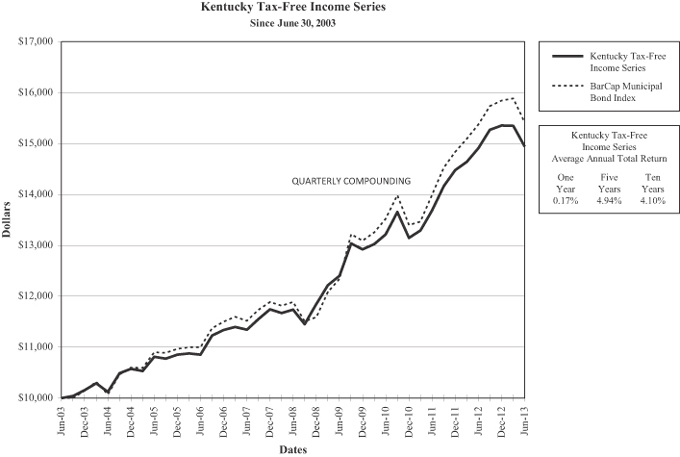
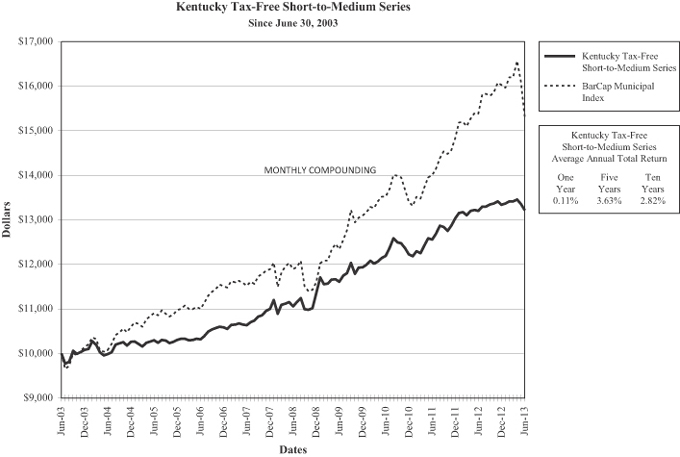
The Kentucky Tax-Free Income Series provided shareholders a total return of 0.17 percent for the twelve months ended June 30, 2013. The Kentucky Tax-Free Short-to-Medium Series provided shareholders with a total return of 0.11 percent during the period under review. Both funds performed in line with the index.
Kentucky’s economy is still recovering from the national recession that ended in June 2009. For the fiscal year that ended June 30, 2013, General Fund receipts were 2.8 percent higher than FY 12 tax collections. This was the third consecutive year of increased tax collections, following two years of decline due to the national recession. Final FY 13 General Fund revenues were $40.5 million, or 0.4 percent, more than the official revenue estimate which projected 2.4 percent growth. The state’s annual average unemployment rate at the end of June stood at 8.1 percent. In 2012, Kentucky had a per capita personal income of $35,041 which ranked 44th in the nation.
The state’s appropriation supported debt was rated Aa3 by Moody’s and A+ by Standard & Poor’s as of June 30, 2013. Kentucky had net tax-supported debt per capita of $1,998 as of calendar year-end 2012, which was substantially above the national net tax-supported debt median of $1,074 (Source: Moody’s Investors Services, 2013 State Debt Medians Report, May 29, 2013).
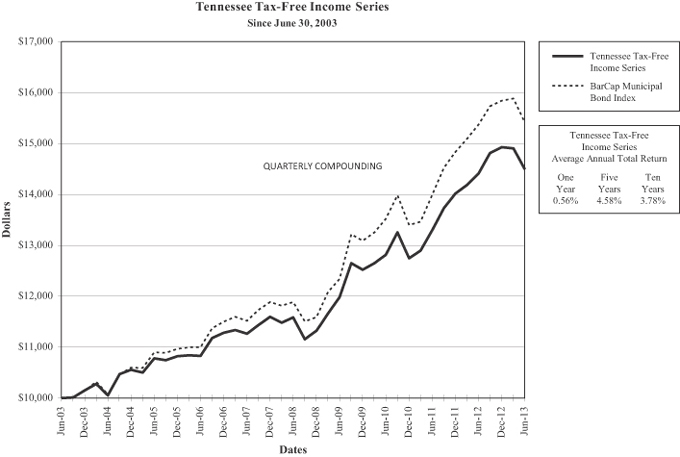
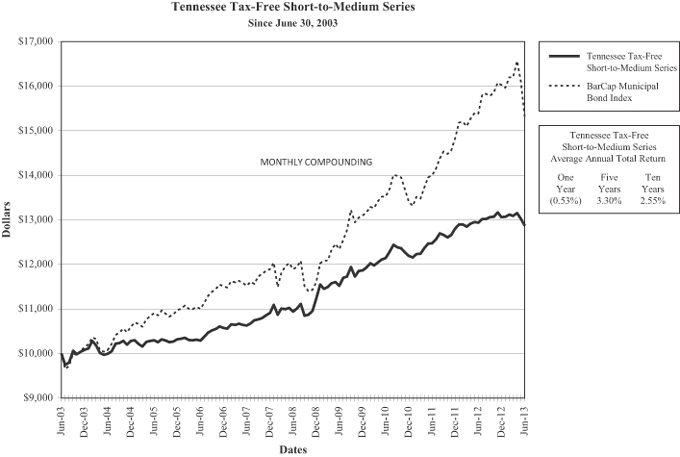
The Tennessee Tax-Free Income Series provided shareholders with a total return of 0.56 percent for the twelve months ended June 30, 2013. The Tennessee Tax-Free Short-to-Medium Series had a total return of -0.53 percent for the period under review. The average maturity of the Tennessee Tax-Free Income Series was slightly longer than the index, and that portion of the curve outperformed the index during the reporting period. The Tennessee Tax-Free Short-to-Medium Series holds bonds significantly shorter than the average maturity and duration of the index, which led to its relative underperformance compared to the index.
Tennessee’s economy has also continued to slowly recover from the national recession. During the recession the state experienced a severe contraction in the manufacturing and construction sectors. However, both of these sectors showed continued signs of stabilization during the period under review. The state’s annual average unemployment rate at the end of June was 8.3 percent. In 2012, the state had a per capita personal income of $37,678 which ranked 34th in the nation.
Tennessee relies on a combination of a state sales tax, corporate income taxes, and the Hall income tax for its revenue. The state’s fiscal condition improved considerably during the period under review. Total state revenue collections through June (the 11th month of the state’s fiscal year) were $322.8 million more than the budgeted estimate. Tax collections in June marked the 11th consecutive month in which total collections have experienced positive growth.
ii
Tennessee’s general obligation (G.O.) bonds were rated Aaa by Moody’s and AA+ by Standard & Poor’s as of June 30, 2013. Tennessee had net tax-supported debt per capita of $343 as of calendar year-end 2012, which was substantially below the national net tax-supported debt median of $1,074 (Source: Moody’s Investors Services, 2013 State Debt Medians Report, May 29, 2013).
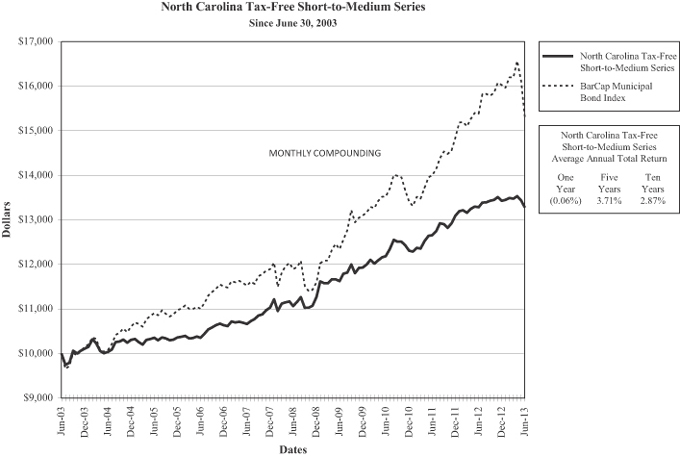
The North Carolina Tax-Free Income Series provided shareholders with a total return of 0.76 percent for the twelve months ended June 30, 2013. The North Carolina Tax-Free Short-to-Medium Series provided shareholders with a total return of -0.06 percent for the period under review. The average maturity of the North Carolina Tax-Free Income Series was slightly longer than the index, and that portion of the curve outperformed the index during the reporting period. The North Carolina Tax-Free Short-to-Medium Series performed in line with the index.
North Carolina’s economy has continued to gradually recover from the national recession. The state experienced modest, but below trend, economic growth throughout 2012. The strongest growth occurred in the fourth quarter of 2012 and the pickup in economic activity continued through the first half of 2013. The real (inflation adjusted) growth rate for 2013 is forecast to increase by 1.9 percent. Business and professional services, mining, educational and health services, and the hospitality and leisure sectors continue to be the biggest contributors to growth. The state continues to have one of the highest unemployment rates in the nation. The state’s average annual unemployment rate at the end of June was 8.8 percent. In 2012, North Carolina had a per capita personal income of $37,049 which ranked 38th in the nation.
North Carolina’s G.O. bonds were rated Aaa by Moody’s and AAA by Standard & Poor’s as of June 30, 2013. North Carolina had net tax-supported debt per capita of $853 as of calendar year-end 2012, which was below the national net tax-supported debt median of $1,074 (Source: Moody’s Investors Services, 2013 State Debt Medians Report, May 29, 2013).
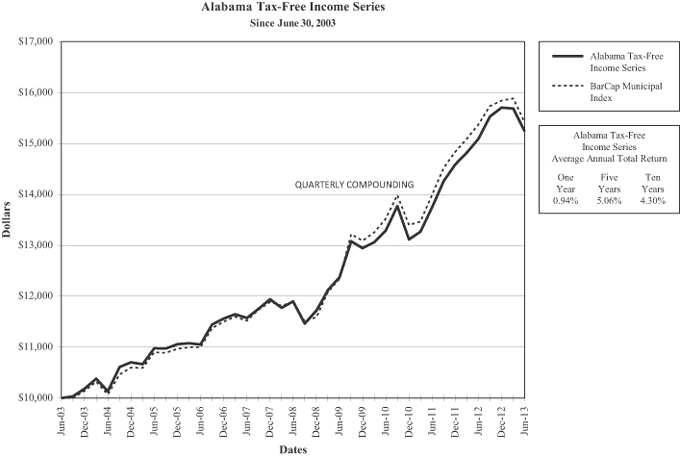
The Alabama Tax-Free Income Series provided shareholders with a total return of 0.94 percent for the twelve months ended June 30, 2013. The average maturity of the Alabama Tax-Free Income Series was slightly longer than the index, and that portion of the curve outperformed the index during the reporting period.
Alabama’s economy fell into recession later than the national recession that began in December 2007. However, the state’s economy was hit hard — 38,500 jobs were lost from 2008 to 2010 and output contracted by 2.1 percent in 2009. The manufacturing sector has continued to contract with many mass-production operations moving overseas. The textile and apparel industries have been particularly hard hit. The automobile industry continues to be an important driver of growth and the state has been successful in growing the economy through foreign direct investment. A key development strategy for the state is the promotion of industry clusters which consist of a geographic concentration of interconnected companies in sectors such as biotechnology, transportation, aerospace, and automotive.
Alabama’s job market contracted more sharply than the national economy but has showed signs of stabilization. The state’s average annual unemployment rate at the end of June stood at 6.8 percent. In 2012, Alabama had a per capita personal income of $35,625 which ranked 42nd in the nation.
Alabama’s G.O. bonds were rated Aa1 by Moody’s and AA by Standard & Poor’s as of June 30, 2013. Alabama had net tax-supported debt per capita of $867 as of calendar year-end 2012, which was lower than the national net tax-supported debt median of $1,074 (Source: Moody’s Investors Services, 2013 State Debt Medians Report, May 29, 2013).
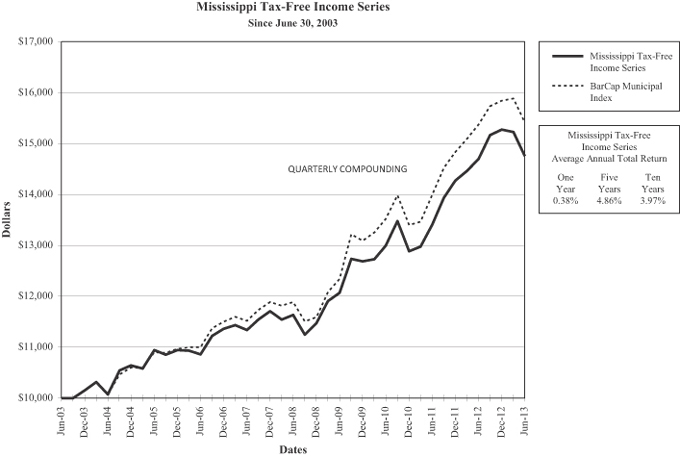
The Mississippi Tax-Free Income Series had a total return of 0.38 percent for the twelve month period ended June 30, 2013. During the reporting period, the Mississippi Tax-Free Income Series performed in line with the index.
Mississippi’s economy is dominated by manufacturing and service industries which were hit hard by the national recession. During the review period, the state’s economy continued to grow (at a 2.2 percent annual rate for all of 2012), but at a slightly slower pace than the national economy. Most economists are forecasting a slower growth rate in 2013 — somewhere in the range of 1.8 percent as the effects of the federal sequester and payroll tax hikes are felt. The state’s average annual unemployment rate at the end of June was 9.1 percent. In 2012, Mississippi had a per capita personal income of $33,073 which was the lowest in the nation.
The state’s G.O. bonds were rated Aa2 by Moody’s and AA by Standard & Poor’s as of June 30, 2013. Mississippi has net tax-supported debt per capita of $1,735 as of calendar year-end 2012, which was higher than the national net tax-supported debt median of $1,074 (Source: Moody’s Investors Services, 2013 State Debt Medians Report, May 29, 2013).
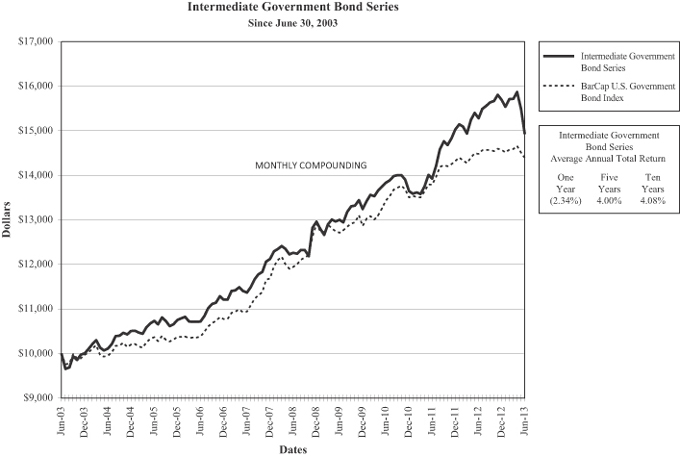
The Intermediate Government Bond Series had a total return of -2.34 percent for the twelve months ended June 30, 2013. The Barclays Capital U.S. Intermediate Government Bond Index had a total return of -0.587 percent for the one year period ended June 30, 2013. The underperformance of the Intermediate Government Bond Series is primarily due to the longer average maturity of the fund as compared to the index. Shorter-dated agency securities outperformed longer bonds similar to those held in the fund during the reporting period.
iii
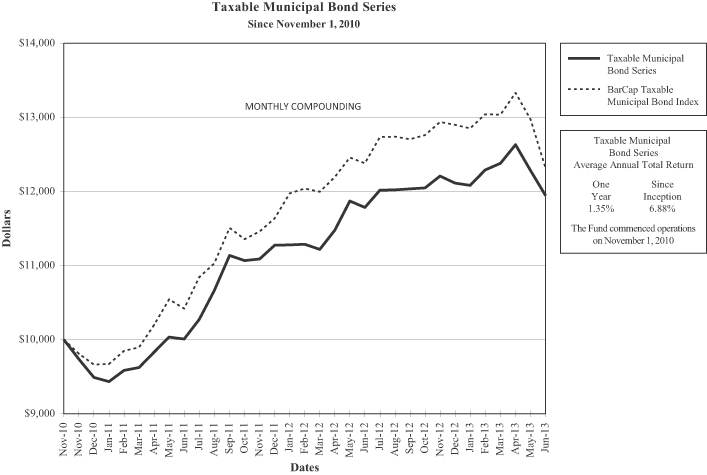
The Taxable Municipal Bond Series had a total return of 1.35 percent for the twelve month period ended June 30, 2013. The Barclays Capital Municipal Bond Taxable Index had a total return of -0.560 percent for the same period. The Taxable Municipal Bond Series outperformed the index during the reporting period. More than 90 percent of the fund’s bonds are rated AA- or better by at least one nationally recognized statistical rating agency, while the index represents the entire credit market including highly rated and lower rated bonds. The fund outperformed the index due to the fund’s relatively high credit quality as compared to the index during the reporting period.
Please note that index information is provided for reference only. No index can perfectly match the investments that make up a fund’s portfolio. In making investment decisions for our portfolios we do not attempt to track indices. The Barclays Capital Municipal Bond index is national in scope and does not necessarily reflect the performance of state-specific municipal bond funds. Indices do not take into account any operating expenses or transaction costs. An investment cannot be made directly in an index.
i Data are from the Bureau of Economic Analysis, the U.S. Department of Labor Bureau of Labor Statistics, and various other sources management deems to be reliable. Some of the quoted data are preliminary in nature and may be subject to revision. Any opinions expressed herein are those of the funds’ portfolio management and are current as of June 30, 2013. They are not guarantees of performance or investment results and should not be taken as investment advice. Past performance is not a guarantee of future performance and you may lose money investing in the funds.
iv
| | | | | | |
| | The illustrations below provide each Fund’s sector allocation and summarize key information about each Fund’s investments. | | | UNAUDITED | |
| | | | |
Kentucky Tax-Free Income Series | |
| CREDIT QUALITY (reflects highest credit rating) | | % of Net Assets
at Fair Value | |
Aaa/AAA | | | 5.07% | |
Aa/AA | | | 85.75% | |
A | | | 7.90% | |
Not Rated | | | 1.28% | |
| | | | | |
| | | | 100.00% | |
| | | | | |
| COMPOSITION | | | |
| | | % of Net Assets | |
Miscellaneous Public Improvement | | | 25.36% | |
Prerefunded | | | 14.36% | |
Municipal Utility Revenue | | | 13.91% | |
Turnpikes and Toll Roads Revenue | | | 11.73% | |
Refunded | | | 9.62% | |
University Consolidated Education and Building Revenue | | | 5.44% | |
Hospital and Healthcare Revenue | | | 5.02% | |
School Improvements | | | 3.87% | |
Escrowed to Maturity | | | 3.45% | |
State and Local Mortgage Revenue | | | 3.43% | |
Public Facilities Revenue | | | 3.04% | |
Airport Revenue | | | 0.42% | |
Other Assets Less Liabilities | | | 0.35% | |
| | | | | |
| | | | 100.00% | |
| | | | | |
| | | | |
Kentucky Tax-Free Short-to-Medium Series | |
| CREDIT QUALITY (reflects highest credit rating) | | % of Net Assets
at Fair Value | |
Aaa/AAA | | | 2.61% | |
Aa/AA | | | 91.25% | |
A | | | 6.14% | |
| | | | | |
| | | | 100.00% | |
| | | | | |
| COMPOSITION | | | |
| | | % of Net Assets | |
Miscellaneous Public Improvement | | | 28.92% | |
Turnpikes and Toll Roads Revenue | | | 15.38% | |
School Improvements | | | 14.29% | |
Refunded | | | 10.87% | |
University Consolidated Education and Building Revenue | | | 9.85% | |
Municipal Utility Revenue | | | 7.49% | |
Hospital and Healthcare Revenue | | | 3.61% | |
Public Facilities Revenue | | | 3.61% | |
State and Local Mortgage Revenue | | | 2.57% | |
Prerefunded | | | 1.72% | |
Other Assets Less Liabilities | | | 1.69% | |
| | | | | |
| | | | 100.00% | |
| | | | | |
| | | | |
Alabama Tax-Free Income Series | |
| CREDIT QUALITY (reflects highest credit rating) | | % of Net Assets
at Fair Value | |
Aaa/AAA | | | 3.16% | |
Aa/AA | | | 83.78% | |
A | | | 7.99% | |
Baa/BBB | | | 0.65% | |
Not Rated | | | 4.42% | |
| | | | | |
| | | | 100.00% | |
| | | | | |
| COMPOSITION | | | |
| | | % of Net Assets | |
School Improvement Revenue | | | 24.26% | |
University Consolidated Education and Building Revenue | | | 23.76% | |
Municipal Utility Revenue | | | 18.49% | |
Miscellaneous Public Improvement | | | 10.33% | |
Public Facilities Revenue | | | 10.01% | |
Prerefunded | | | 8.40% | |
Escrowed to Maturity | | | 1.41% | |
Refunded | | | 1.05% | |
State and Local Mortgage Revenue | | | 0.67% | |
Industrial Revenue | | | 0.10% | |
Other Assets Less Liabilities | | | 1.52% | |
| | | | | |
| | | | 100.00% | |
| | | | | |
| | | | |
Mississippi Tax-Free Income Series | |
| CREDIT QUALITY (reflects highest credit rating) | | % of Net Assets
at Fair Value | |
Aaa/AAA | | | 0.38% | |
Aa/AA | | | 80.45% | |
A | | | 18.84% | |
Not Rated | | | 0.33% | |
| | | | | |
| | | | 100.00% | |
| | | | | |
| COMPOSITION | | | |
| | | % of Net Assets | |
University Consolidated Education and Building Revenue | | | 27.67% | |
Public Facilities Revenue | | | 17.72% | |
Turnpikes and Toll Roads Revenue | | | 14.68% | |
Municipal Utility Revenue | | | 10.99% | |
Miscellaneous Public Improvement | | | 8.28% | |
Prerefunded | | | 4.75% | |
Refunded | | | 4.13% | |
School Improvement Revenue | | | 3.79% | |
Hospital and Healthcare Revenue | | | 3.20% | |
Airport Revenue | | | 2.12% | |
State and Local Mortgage Revenue | | | 0.37% | |
Escrowed to Maturity | | | 0.32% | |
Other Assets Less Liabilities | | | 1.98% | |
| | | | | |
| | | | 100.00% | |
| | | | | |
v
| | | | | | |
| | The illustrations below provide each Fund’s sector allocation and summarize key information about each Fund’s investments. | | | UNAUDITED | |
| | | | |
Tennessee Tax-Free Income Series | |
| CREDIT QUALITY (reflects highest credit rating) | | % of Net Assets
at Fair Value | |
Aaa/AAA | | | 7.40% | |
Aa/AA | | | 81.62% | |
A | | | 8.78% | |
Baa/BBB | | | 0.50% | |
Not Rated | | | 1.70% | |
| | | | | |
| | | | 100.00% | |
| | | | | |
| COMPOSITION | | | |
| | | % of Net Assets | |
Municipal Utility Revenue | | | 35.04% | |
University Consolidated Education and Building Revenue | | | 13.95% | |
Prerefunded | | | 10.67% | |
Public Facilities Revenue | | | 10.52% | |
Hospital and Healthcare Revenue | | | 7.99% | |
Refunded | | | 7.17% | |
State and Local Mortgage Revenue | | | 5.58% | |
School Improvement Revenue | | | 4.38% | |
Miscellaneous Public Improvement | | | 2.08% | |
Escrowed to Maturity | | | 1.19% | |
Industrial Revenue | | | 0.88% | |
Other Assets Less Liabilities | | | 0.55% | |
| | | | | |
| | | | 100.00% | |
| | | | | |
| | | | |
Tennessee Tax-Free Short-to-Medium Series | |
| CREDIT QUALITY (reflects highest credit rating) | | % of Net Assets
at Fair Value | |
Aaa/AAA | | | 3.43% | |
Aa/AA | | | 76.30% | |
A | | | 19.90% | |
Baa/BBB | | | 0.37% | |
| | | | | |
| | | | 100.00% | |
| | | | | |
| COMPOSITION | | | |
| | | % of Net Assets | |
Refunded | | | 18.07% | |
Municipal Utility Revenue | | | 16.73% | |
Miscellaneous Public Improvement | | | 14.03% | |
Prerefunded | | | 13.84% | |
School Improvement Revenue | | | 9.20% | |
Hospital and Healthcare Revenue | | | 6.62% | |
State and Local Mortgage Revenue | | | 6.49% | |
University Consolidated Education and Building Revenue | | | 5.01% | |
Public Facilities Revenue | | | 5.00% | |
Airport Revenue | | | 2.36% | |
Other Assets Less Liabilities | | | 2.65% | |
| | | | | |
| | | | 100.00% | |
| | | | | |
| | | | |
North Carolina Tax-Free Income Series | |
| CREDIT QUALITY (reflects highest credit rating) | | % of Net Assets
at Fair Value | |
Aaa/AAA | | | 3.98% | |
Aa/AA | | | 78.35% | |
A | | | 16.41% | |
Baa/BBB | | | 1.26% | |
| | | | | |
| | | | 100.00% | |
| | | | | |
| COMPOSITION | | | |
| | | % of Net Assets | |
Municipal Utility Revenue | | | 20.52% | |
University Consolidated Education and Building Revenue | | | 16.96% | |
School Improvement Revenue | | | 16.91% | |
Hospital and Healthcare Revenue | | | 9.55% | |
Refunded | | | 9.08% | |
Public Facility Revenue | | | 8.64% | |
Miscellaneous Public Improvement | | | 6.49% | |
Airport Revenue | | | 4.64% | |
Prefunded | | | 4.14% | |
Turnpikes and Toll Roads Revenue | | | 2.15% | |
Other Assets Less Liabilities | | | 0.92% | |
| | | | | |
| | | | 100.00% | |
| | | | | |
| | | | |
North Carolina Tax-Free Short-to-Medium Series | |
| CREDIT QUALITY (reflects highest credit rating) | | % of Net Assets
at Fair Value | |
Aaa/AAA | | | 0.06% | |
Aa/AA | | | 81.17% | |
A | | | 17.21% | |
Not Rated | | | 1.56% | |
| | | | | |
| | | | 100.00% | |
| | | | | |
| COMPOSITION | | | |
| | | % of Net Assets | |
School Improvement Revenue | | | 20.21% | |
Municipal Utility Revenue | | | 19.78% | |
Public Facilities Revenue | | | 12.03% | |
Prerefunded | | | 11.96% | |
Refunded | | | 9.09% | |
Miscellaneous Public Improvement | | | 7.38% | |
University Consolidated Education and Building Revenue | | | 6.67% | |
Hospital and Healthcare Revenue | | | 5.34% | |
Airport Revenue | | | 2.31% | |
Turnpikes and Toll Roads Revenue | | | 1.35% | |
Lease Revenue | | | 1.01% | |
State and Local Mortgage Revenue | | | 0.54% | |
Other Assets Less Liabilities | | | 2.33% | |
| | | | | |
| | | | 100.00% | |
| | | | | |
vi
| | | | | | |
| | The illustrations below provide each Fund’s sector allocation and summarize key information about each Fund’s investments. | | | UNAUDITED | |
| | | | |
Intermediate Government Bond Series | |
| CREDIT QUALITY (reflects highest credit rating) | | % of Net Assets
at Fair Value | |
Aaa/AAA | | | 100.00% | |
| | | | | |
| COMPOSITION | | | |
| | | % of Net Assets | |
Federal Farm Credit | | | 65.80% | |
Federal Home Loan Bank | | | 21.21% | |
Federal National Mortgage Association | | | 5.75% | |
Federal Home Loan Mortgage Corp | | | 3.95% | |
Other Assets Less Liabilities | | | 3.29% | |
| | | | | |
| | | | 100.00% | |
| | | | | |
| | | | |
Taxable Municipal Bond Series | |
| CREDIT QUALITY (reflects highest credit rating) | | % of Net Assets
at Fair Value | |
Aa/AA | | | 91.32% | |
A | | | 8.68% | |
| | | | | |
| | | | 100.00% | |
| | | | | |
| COMPOSITION | | | |
| | | % of Net Assets | |
Public Facilities Revenue | | | 30.24% | |
Municipal Utility Revenue | | | 28.50% | |
School Improvement Revenue | | | 15.45% | |
Miscellaneous Public Improvement | | | 9.36% | |
University Consolidated Education and Building Revenue | | | 6.19% | |
Turnpikes and Toll Roads Revenue | | | 2.14% | |
Refunded | | | 1.81% | |
Hospital and Healthcare Revenue | | | 1.76% | |
State and Local Mortgage Revenue | | | 1.27% | |
Other Assets Less Liabilities | | | 3.28% | |
| | | | | |
| | | | 100.00% | |
| | | | | |
vii
PERFORMANCE COMPARISON (Unaudited)
The following graphs compare the change in value of a $10,000 investment in each series of Dupree Mutual Funds with the change in value of a $10,000 investment in a comparable index. The comparisons are made over 10 years or since the inception of the series, if shorter than ten years. Results are for the fiscal years ended June 30.
viii
ix
x
xi
xii
xiii
xiv
xv
xvi
xvii
xviii
Notes on Graphs:
Results reflect reinvestment of all dividend and capital gain distributions. No index can perfectly match the investments that make up a fund’s portfolio. For each series, we have selected an index that we believe gives the most accurate picture of how the series performed during the reporting period. The investor should understand that an index is a mathematical hypothesis and does not reflect a real market situation. For example, the portfolio of each index is replaced with an entirely different portfolio each year without reflecting operating expenses or transaction costs, an impossibility in reality. On the other hand, the fund’s performance reflects not only these factors but management costs as well. Past performance is not indicative of future results.
The performance tables and the graphs above do not reflect the deduction of taxes that a shareholder would pay on fund distributions or the redemption of fund shares.
Please note that all legacy Lehman Brothers benchmark indices were rebranded as Barclays Capital (“BarCap”) indices in November 2008.
xix
DUPREE MUTUAL FUNDS — ALABAMA TAX-FREE INCOME SERIES
SCHEDULE OF PORTFOLIO INVESTMENTS
Alabama Municipal Bonds — 100% of Net Assets
June 30, 2013
| | | | | | | | | | | | | | | | | | |
| Bond Description | | Coupon | | | Maturity
Date | | | Rating# | | Par Value | | | Fair Value | |
| SCHOOL IMPROVEMENT BONDS | | | | | | | | | | | | | | | | | | |
| 24.26% of Net Assets | | | | | | | | | | | | | | | | | | |
AL State Public Schools & College Authority Capital Improvement | | | 5.000 | % | | | 12/01/2024 | | | Aa1/AA* | | $ | 100,000 | | | $ | 112,147 | |
AL State Public School & College Authority Capital Improvement | | | 5.000 | | | | 12/01/2025 | | | Aa1/AA* | | | 640,000 | | | | 716,877 | |
AL State Public School & College Authority Refinancing Series A | | | 5.000 | | | | 05/01/2024 | | | Aa1/AA*/AA+@ | | | 125,000 | | | | 140,006 | |
Elmore County AL Public Education Cooperative | | | 5.000 | | | | 08/01/2032 | | | Aa3 | | | 50,000 | | | | 52,796 | |
Etowah County AL Board of Education Capital Outlay Warrants | | | 5.000 | | | | 09/01/2037 | | | A+* | | | 200,000 | | | | 209,120 | |
Madison County AL Board of Education Capital Outlay Tax | | | 4.950 | | | | 09/01/2025 | | | Aa3/AA-* | | | 100,000 | | | | 107,934 | |
Madison County AL Board of Education Capital Outlay Tax | | | 5.100 | | | | 09/01/2028 | | | Aa3/AA-* | | | 285,000 | | | | 305,982 | |
Madison County AL Board of Education Capital Outlay Tax | | | 5.125 | | | | 09/01/2034 | | | Aa3/AA-* | | | 505,000 | | | | 530,568 | |
Mobile AL Public Education Building Authority | | | 5.000 | | | | 03/01/2033 | | | A3/AA-*/AA-@ | | | 200,000 | | | | 210,970 | |
Montgomery County AL Warrants | | | 5.000 | | | | 03/01/2028 | | | Aa1/AA* | | | 175,000 | | | | 190,201 | |
Morgan County AL Board of Education Capital Outlay Warrants | | | 5.000 | | | | 03/01/2035 | | | AA-* | | | 800,000 | | | | 842,967 | |
Opelika AL Warrants | | | 5.000 | | | | 11/01/2031 | | | Aa2/AA* | | | 400,000 | | | | 432,236 | |
Phenix City AL School Warrants Series B | | | 5.000 | | | | 08/01/2024 | | | AA-* | | | 80,000 | | | | 82,379 | |
Scottsboro AL Warrants | | | 5.000 | | | | 07/01/2028 | | | A+* | | | 250,000 | | | | 265,403 | |
Shelby County AL Board of Education Capital Outlay Warrants | | | 5.000 | | | | 02/01/2031 | | | Aa2/A* | | | 890,000 | | | | 942,964 | |
Shelby County AL Board of Education Special Tax School Warrats | | | 5.000 | | | | 02/01/2025 | | | Aa3/A+* | | | 300,000 | | | | 315,612 | |
Sumter County AL Limited Obligation School Warrants | | | 5.100 | | | | 02/01/2034 | | | A* | | | 100,000 | | | | 102,337 | |
Sumter County AL Limited Obligation School Warrants | | | 5.200 | | | | 02/01/2039 | | | A* | | | 95,000 | | | | 97,402 | |
Troy AL Public Educational Building Authority Educational | | | 5.250 | | | | 12/01/2036 | | | A2/AA-* | | | 225,000 | | | | 238,016 | |
| | | | | | | | | | | | | | | | | | |
| | | | | | | | | | | | | | | | | 5,895,917 | |
| UNIVERSITY CONSOLIDATED EDUCATION AND BUILDING REVENUE BONDS | | | | | | | | | | | |
| 23.76% of Net Assets | | | | | | | | | | | | | | | | | | |
AL State Private Colleges & Universities Tuskegee University | | | 4.750 | | | | 09/01/2026 | | | AA-* | | | 500,000 | | | | 510,035 | |
AL State Board Education Bishop State Community College | | | 4.600 | | | | 01/01/2021 | | | A1 | | | 100,000 | | | | 100,126 | |
AL State University Revenue General Tuition and Fee | �� | | 5.250 | | | | 09/01/2034 | | | A2/AA-* | | | 75,000 | | | | 80,207 | |
Auburn University AL General Fee Revenue Series A | | | 5.000 | | | | 06/01/2032 | | | Aa2/AA-* | | | 45,000 | | | | 47,839 | |
Auburn University AL General Fee Revenue — Series A | | | 5.000 | | | | 06/01/2027 | | | Aa2/AA-* | | | 300,000 | | | | 329,400 | |
Auburn University AL General Fee Revenue Series A | | | 5.000 | | | | 06/01/2033 | | | Aa2/AA-* | | | 420,000 | | | | 452,651 | |
Auburn University AL General Fee Revenue Series A | | | 5.000 | | | | 06/01/2038 | | | Aa2/AA-* | | | 600,000 | | | | 644,796 | |
Auburn University AL General Fee Revenue | | | 5.000 | | | | 06/01/2022 | | | Aa2/AA-* | | | 50,000 | | | | 56,450 | |
Auburn University General FeeRevenue Series A | | | 5.000 | | | | 06/01/2036 | | | Aa2/AA-* | | | 150,000 | | | | 160,413 | |
Jacksonville AL State University Revenue Tuition and Fee | | | 5.125 | | | | 12/01/2033 | | | AA-* | | | 450,000 | | | | 467,780 | |
Mobile AL Spring Hill CollegeEducational Building | | | 5.100 | | | | 09/01/2019 | | | Baa3 | | | 120,000 | | | | 120,130 | |
Tuscaloosa AL Public Education Building Authority Student Housing | | | 6.375 | | | | 07/01/2028 | | | AA-* | | | 250,000 | | | | 285,593 | |
Tuscaloosa AL Public Education Building Authority Student Housing | | | 6.750 | | | | 07/01/2033 | | | AA-* | | | 495,000 | | | | 561,751 | |
University of AL General Revenue Series A | | | 5.000 | | | | 07/01/2028 | | | Aa2/AA-*/AA+@ | | | 325,000 | | | | 351,644 | |
University of AL General Revenue Series A | | | 5.000 | | | | 07/01/2032 | | | Aa2/AA-*/AA+@ | | | 500,000 | | | | 535,105 | |
University of Alabama GeneralRevenue Series A | | | 5.000 | | | | 07/01/2034 | | | Aa2/AA-* | | | 250,000 | | | | 271,395 | |
University South AL University Revenues Refunding Tuition | | | 5.000 | | | | 12/01/2029 | | | Aa1/AA+* | | | 105,000 | | | | 113,384 | |
University of Southern AL University Revenues Facilities | | | 5.000 | | | | 08/01/2029 | | | Aa1/AA+* | | | 550,000 | | | | 581,581 | |
University of South AL University Revenues Facilities Capital | | | 4.750 | | | | 08/01/2033 | | | Aa1/AA+* | | | 100,000 | | | | 103,235 | |
| | | | | | | | | | | | | | | | | | |
| | | | | | | | | | | | | | | | | 5,773,515 | |
| MUNICIPAL UTILITY REVENUE BONDS | | | | | | | | | | | | | | | | | | |
| 18.49% of Net Assets | | | | | | | | | | | | | | | | | | |
AL Drinking Water Finance Authority Revolving Fund Loan | | | 4.750 | | | | 08/15/2027 | | | NR | | | 75,000 | | | | 75,158 | |
Bessemer AL Governmental Utility Services Water Supply | | | 4.750 | | | | 06/01/2033 | | | A2 | | | 100,000 | | | | 102,587 | |
Birmingham AL Waterworks Board Water Revenue Series A | | | 5.000 | | | | 01/01/2026 | | | Aa2/AA* | | | 80,000 | | | | 86,927 | |
Birmingham AL Waterworks BoardWater Revenue | | | 4.750 | | | | 01/01/2036 | | | Aa2/AA* | | | 215,000 | | | | 218,803 | |
Birmingham AL Waterworks Board Water Revenue Series B | | | 5.000 | | | | 01/01/2038 | | | Aa2/AA* | | | 100,000 | | | | 103,598 | |
Chatom AL Industrial Board Gulf Opportunity Zone | | | 5.000 | | | | 08/01/2037 | | | A3/AA-*/A-@ | | | 150,000 | | | | 157,289 | |
Cullman AL Utility Board Water Revenue | | | 4.750 | | | | 09/01/2037 | | | Aa3/AA-* | | | 650,000 | | | | 671,509 | |
Cullman County AL Water Revenue | | | 5.000 | | | | 05/01/2021 | | | Baa1/A+* | | | 125,000 | | | | 131,118 | |
Fort Payne AL Waterworks Board Water Revenue | | | 4.750 | | | | 07/01/2034 | | | AA-* | | | 100,000 | | | | 104,350 | |
Huntsville AL Water Systems Revenue Bonds | | | 5.000 | | | | 11/01/2033 | | | Aa1/AAA* | | | 300,000 | | | | 325,011 | |
Jasper AL Water Works and Sewer Board Utility Revenue | | | 5.000 | | | | 06/01/2030 | | | A+* | | | 455,000 | | | | 489,393 | |
Limestone County AL Water and Sewer Authority Water Revenue | | | 5.000 | | | | 12/01/2029 | | | A+* | | | 275,000 | | | | 280,272 | |
The accompanying footnotes are an integral part of the financial statements.
1
DUPREE MUTUAL FUNDS — ALABAMA TAX-FREE INCOME SERIES
SCHEDULE OF PORTFOLIO INVESTMENTS
Alabama Municipal Bonds — 100% of Net Assets
June 30, 2013
| | | | | | | | | | | | | | | | | | |
| Bond Description | | Coupon | | | Maturity
Date | | | Rating# | | Par Value | | | Fair Value | |
Muscle Shoals AL Utilities Board Water and Sewer Revenue | | | 5.750 | % | | | 12/01/2033 | | | AA-* | | $ | 430,000 | | | $ | 474,290 | |
North Marshall AL Utilities Board Water Revenue | | | 5.100 | | | | 10/01/2030 | | | AA-* | | | 375,000 | | | | 400,226 | |
Opelika AL Water Board Revenue | | | 5.000 | | | | 06/01/2037 | | | Aa3/AA-* | | | 250,000 | | | | 264,905 | |
Opelika AL Water Board Revenue | | | 5.250 | | | | 06/01/2036 | | | Aa3/A+* | | | 70,000 | | | | 74,116 | |
Phenix City AL Water and Sewer Revenue | | | 5.000 | | | | 08/15/2034 | | | A3/AA-*/AA-@ | | | 275,000 | | | | 290,265 | |
Tallassee AL Water Gas and Sewer Warrants | | | 5.125 | | | | 05/01/2036 | | | A2/AA-* | | | 75,000 | | | | 79,772 | |
Trussville AL Warrants | | | 4.800 | | | | 10/01/2021 | | | Aa2 | | | 85,000 | | | | 85,856 | |
West Morgan East Lawrence AL Water and Sewer Revenue | | | 4.750 | | | | 08/15/2030 | | | AA-* | | | 75,000 | | | | 77,750 | |
| | | | | | | | | | | | | | | | | | |
| | | | | | | | | | | | | | | | | 4,493,195 | |
| MISCELLANEOUS PUBLIC IMPROVEMENT BONDS | | | | | | | | | | | | | | | | | | |
| 10.33% of Net Assets | | | | | | | | | | | | | | | | | | |
AL Incentives Financing Authority Special Obligation | | | 5.000 | | | | 09/01/2029 | | | AA-* | | | 125,000 | | | | 133,606 | |
AL State Incentives Financing Authority Special Obligation Series A | | | 5.000 | | | | 09/01/2037 | | | Aa3/A+* | | | 800,000 | | | | 840,800 | |
Daphne AL Warrants | | | 5.000 | | | | 04/01/2023 | | | Aa2/AA* | | | 250,000 | | | | 273,408 | |
Enterprise AL Warrants General Obligation | | | 5.000 | | | | 10/01/2019 | | | NR | | | 55,000 | | | | 56,941 | |
Enterprise AL Warrants General Obligation | | | 5.000 | | | | 10/01/2023 | | | NR | | | 450,000 | | | | 463,775 | |
Mobile AL Refunding Warrants Series A | | | 5.000 | | | | 02/15/2027 | | | Aa2/AA-* | | | 335,000 | | | | 360,641 | |
Mobile AL Limited Obligation Tax Warrants | | | 5.500 | | | | 02/15/2023 | | | Baa3 | | | 35,000 | | | | 35,049 | |
Tuscaloosa AL Warrants SeriesA | | | 5.000 | | | | 10/15/2034 | | | Aa1/AA+* | | | 175,000 | | | | 186,961 | |
Tuscaloosa AL Warrants — Series A | | | 5.125 | | | | 01/01/2039 | | | Aa1/AA+* | | | 150,000 | | | | 159,794 | |
| | | | | | | | | | | | | | | | | | |
| | | | | | | | | | | | | | | | | 2,510,975 | |
| PUBLIC FACILITIES REVENUE BONDS | | | | | | | | | | | | | | | | | | |
| 10.01% of Net Assets | | | | | | | | | | | | | | | | | | |
AL State — Series A | | | 4.625 | | | | 09/01/2022 | | | Aa1/AA* | | | 100,000 | | | | 102,111 | |
Anniston AL Public Building Authority DHR Project | | | 5.250 | | | | 05/01/2030 | | | AA-* | | | 50,000 | | | | 54,834 | |
Anniston AL Public Building Authority Revenue | | | 5.500 | | | | 05/01/2033 | | | AA-* | | | 200,000 | | | | 216,670 | |
Anniston AL Public Building Authority | | | 5.000 | | | | 03/01/2032 | | | A2/AA-* | | | 400,000 | | | | 423,748 | |
Bessemer AL Public Educational Building Authority Revenue | | | 5.000 | | | | 07/01/2030 | | | AA-* | | | 250,000 | | | | 269,423 | |
Huntsville AL Public BuildingAuthority Lease Revenue | | | 5.000 | | | | 10/01/2027 | | | Aa1/AA+* | | | 375,000 | | | | 407,996 | |
Huntsville AL Public BuildingAuthority Lease Revenue | | | 5.000 | | | | 10/01/2033 | | | Aa1/AA+* | | | 175,000 | | | | 186,895 | |
Lowndes County AL Warrants | | | 5.250 | | | | 02/01/2037 | | | A2/AA-* | | | 250,000 | | | | 260,465 | |
Montgomery AL Warrants — Series A | | | 5.000 | | | | 02/01/2030 | | | NR | | | 300,000 | | | | 324,990 | |
Montgomery County AL Public Building Authority Revenue Bond | | | 5.000 | | | | 03/01/2031 | | | Aa2/AA-* | | | 175,000 | | | | 184,664 | |
| | | | | | | | | | | | | | | | | | |
| | | | | | | | | | | | | | | | | 2,431,796 | |
| PREREFUNDED BONDS | | | | | | | | | | | | | | | | | | |
| 8.40% of Net Assets | | | | | | | | | | | | | | | | | | |
Albertville AL Warrants | | | 5.000 | | | | 02/01/2035 | | | AA-* | | | 110,000 | | | | 129,991 | |
Auburn AL Capital ImprovementSchool Warrants | | | 5.000 | | | | 08/01/2030 | | | Aa2/AA+* | | | 260,000 | | | | 283,800 | |
Baldwin County AL Water and Sewer Series A General Obligation | | | 5.000 | | | | 01/01/2016 | | | Aa1/AA+* | | | 295,000 | | | | 325,087 | |
Huntsville AL Health Care Authority — Series A | | | 5.000 | | | | 06/01/2024 | | | A1/A* | | | 100,000 | | | | 108,328 | |
Montgomery AL Warrants | | | 5.000 | | | | 01/01/2023 | | | Aa2/AA+* | | | 80,000 | | | | 88,243 | |
Montgomery AL Waterworks and Sanitation Sewer Board Revenue | | | 5.000 | | | | 03/01/2025 | | | Aa1/AAA* | | | 250,000 | | | | 268,828 | |
Morgan County AL Water and Sewer General Obligation Warrants | | | 5.000 | | | | 04/01/2028 | | | Aa3 | | | 100,000 | | | | 103,573 | |
Morgan County AL Warrants | | | 5.000 | | | | 04/01/2029 | | | Aa3 | | | 25,000 | | | | 25,893 | |
Oxford AL Warrants Series A | | | 5.000 | | | | 10/01/2036 | | | Aa2 | | | 50,000 | | | | 55,493 | |
Phenix City AL School Warrants Series B | | | 5.000 | | | | 02/01/2017 | | | NR | | | 120,000 | | | | 135,982 | |
Tuscaloosa AL Warrants | | | 5.000 | | | | 01/01/2030 | | | Aa1/AA+* | | | 150,000 | | | | 155,111 | |
University of AL General Revenue Series A | | | 5.000 | | | | 07/01/2034 | | | Aa2/AA-*/AA+@ | | | 350,000 | | | | 359,825 | |
| | | | | | | | | | | | | | | | | | |
| | | | | | | | | | | | | | | | | 2,040,154 | |
| ESCROWED TO MATURITY BONDS | | | | | | | | | | | | | | | | | | |
| 1.41% of Net Assets | | | | | | | | | | | | | | | | | | |
West Morgan — East Lawrence Water Authority AL Water Revenue | | | 5.000 | | | | 08/15/2025 | | | A2/AA-* | | | 300,000 | | | | 342,768 | |
| | | | | | | | | | | | | | | | | | |
| REFUNDING BONDS | | | | | | | | | | | | | | | | | | |
| 1.05% of Net Assets | | | | | | | | | | | | | | | | | | |
Muscle Shoals AL Refunded Warrants | | | 4.600 | | | | 08/01/2024 | | | Aa3 | | | 250,000 | | | | 256,240 | |
| | | | | | | | | | | | | | | | | | |
The accompanying footnotes are an integral part of the financial statements.
2
DUPREE MUTUAL FUNDS — ALABAMA TAX-FREE INCOME SERIES
SCHEDULE OF PORTFOLIO INVESTMENTS
Alabama Municipal Bonds — 100% of Net Assets
June 30, 2013
| | | | | | | | | | | | | | | | | | |
| Bond Description | | Coupon | | | Maturity
Date | | | Rating# | | Par Value | | | Fair Value | |
| STATE AND LOCAL MORTGAGE/HOUSING BONDS | | | | | | | | | | | | | | | | | | |
| .67% of Net Assets | | | | | | | | | | | | | | | | | | |
AL Housing Finance Authority Single Family Mortgage Revenue | | | 5.375 | % | | | 10/01/2033 | | | Aaa | | $ | 155,000 | | | $ | 162,090 | |
| | | | | | | | | | | | | | | | | | |
| INDUSTRIAL REVENUE/POLLUTION CONTROL BONDS | | | | | | | | | | | | | | | | | | |
| .10% of Net Assets | | | | | | | | | | | | | | | | | | |
Auburn AL Industrial Development Board Facilities Revenue | | | 6.200 | | | | 11/01/2020 | | | A* | | | 25,000 | | | | 25,011 | |
| | | | | | | | | | | | | | | | | | |
Total Investments 98.48% of Net Assets (cost $23,276,944)(See (a) below for further explanation) | | | | | | | | | $ | 23,931,661 | |
| | | | | | | | | | | | | | | | | | |
| Other assets in excess of liabilities 1.52% | | | | | | | | | | | | | | | | | 368,214 | |
| | | | | | | | | | | | | | | | | | |
| Net Assets 100% | | | | | | | | | | | | | | | | $ | 24,299,875 | |
| | | | | | | | | | | | | | | | | | |
| | * | | Standard and Poor’s Corporation |
| | @ | | Fitch’s Investors Service |
| | | | (All other ratings by Moody’s Investors Service, Inc.) |
| | # | | Bond ratings are unaudited and not covered by Report of Independent Registered Public Accounting Firm. |
| (a) | | Cost for federal income tax purposes is $23,276,854 and net unrealized appreciation of investments is as follows: |
| | | | | | |
| | Unrealized appreciation | | $ | 899,167 | |
| | Unrealized depreciation | | | (244,360 | ) |
| | | | | | |
| | Net unrealized appreciation | | $ | 654,807 | |
| | | | | | |
Other Information
The following is a summary of the inputs used, as of June 30, 2013 involving the Fund’s investments in securities carried at fair value. The inputs or methodology used for valuing securities may not be an indication of the risk associated with investing in those securities. For more information on valuation inputs, and their aggregation into the levels used in the table below, please refer to the Security Valuation section in the accompanying Notes to Financial Statements.
| | | | | | |
| | | Valuation Inputs | | Municipal Bonds | |
Level 1 | | Quoted Prices | | $ | — | |
Level 2 | | Other Significant Observable Inputs | | | 23,931,661 | |
Level 3 | | Significant Unobservable Inputs | | | — | |
| | | | | | |
| | | | $ | 23,931,661 | |
| | | | | | |
The accompanying footnotes are an integral part of the financial statements.
3
ALABAMA TAX-FREE INCOME SERIES
STATEMENT OF ASSETS AND LIABILITIES
June 30, 2013
| | | | | | | | |
ASSETS: | | | | | | | | |
Investments in securities, at fair value (Cost: $23,276,944) | | | | | | $ | 23,931,661 | |
Cash | | | | | | | 313,648 | |
Interest receivable | | | | | | | 345,586 | |
| | | | | | | | |
Total assets | | | | | | | 24,590,895 | |
LIABILITIES: | | | | | | | | |
Payable for: | | | | | | | | |
Distributions to shareholders | | | 116,422 | | | | | |
Fund shares redeemed | | | 152,348 | | | | | |
Investment advisory fee | | | 8,679 | | | | | |
Transfer agent fee | | | 3,706 | | | | | |
Trustee fees | | | 586 | | | | | |
Accrued expenses | | | 9,279 | | | | | |
| | | | | | | | |
Total liabilities | | | | | | | 291,020 | |
| | | | | | | | |
NET ASSETS: | | | | | | | | |
Capital | | | | | | | 23,615,795 | |
Accumulated net investment income | | | | | | | 90 | |
Net accumulated realized gain on investment transactions | | | | | | | 29,273 | |
Net unrealized appreciation in value of investments | | | | | | | 654,717 | |
| | | | | | | | |
Net assets at value | | | | | | $ | 24,299,875 | |
| | | | | | | | |
NET ASSET VALUE, offering price and redemption price per share
($24,299,875 -:- 2,007,501 shares outstanding; unlimited number of shares authorized; no par value) | | | | | | $ | 12.10 | |
| | | | | | | | |
STATEMENT OF OPERATIONS
For the year ended June 30, 2013
| | | | |
Net investment income: | | | | |
Interest income | | $ | 1,016,240 | |
| | | | |
Expenses: | | | | |
Investment advisory fee | | | 123,872 | |
Transfer agent fee | | | 36,713 | |
Custodian expense | | | 8,007 | |
Professional fees | | | 1,529 | |
Trustee fees | | | 3,196 | |
Other expenses | | | 20,503 | |
| | | | |
Total expenses | | | 193,820 | |
Fees waived by Adviser | | | (19,538 | ) |
Custodian expense reduction | | | (144 | ) |
| | | | |
Net expenses | | | 174,138 | |
| | | | |
Net investment income | | | 842,102 | |
| | | | |
Realized and unrealized gain/(loss) on investments: | | | | |
Net realized gain | | | 30,045 | |
Net change in unrealized appreciation/depreciation | | | (687,104 | ) |
| | | | |
Net realized and unrealized loss on investments | | | (657,059 | ) |
| | | | |
Net increase in net assets resulting from operations | | $ | 185,043 | |
| | | | |
The accompanying notes are an integral part of the financial statements.
4
ALABAMA TAX-FREE INCOME SERIES
STATEMENTS OF CHANGES IN NET ASSETS
For the years ended June 30, 2013 and 2012
| | | | | | | | |
| | | 2013 | | | 2012 | |
Operations: | | | | | | | | |
Net investment income | | $ | 842,102 | | | $ | 781,652 | |
Net realized gain on investments | | | 30,045 | | | | 64,847 | |
Net change in unrealized appreciation/depreciation | | | (687,104 | ) | | | 1,168,601 | |
| | | | | | | | |
Net increase in net assets resulting from operations | | | 185,043 | | | | 2,015,100 | |
Distributions from net investment income | | | (842,439 | ) | | | (781,225 | ) |
Distributions from capital gains | | | (16,538 | ) | | | (12,037 | ) |
Net fund share transactions (Note 4) | | | 2,062,926 | | | | 454,495 | |
| | | | | | | | |
Total increase | | | 1,388,992 | | | | 1,676,333 | |
Net assets: | | | | | | | | |
Beginning of period | | | 22,910,883 | | | | 21,234,550 | |
| | | | | | | | |
End of year | | $ | 24,299,875 | | | $ | 22,910,883 | |
| | | | | | | | |
Accumulated Net Investment Income | | $ | 90 | | | $ | 427 | |
| | | | | | | | |
FINANCIAL HIGHLIGHTS
| | | | | | | | | | | | | | | | | | | | |
| Selected data for a share outstanding: | | For the years ended June 30, | |
| | | 2013 | | | 2012 | | | 2011 | | | 2010 | | | 2009 | |
Net asset value, beginning of period | | | $12.41 | | | | $11.72 | | | | $11.77 | | | | $11.40 | | | | $11.43 | |
| | | | | | | | | | | | | | | | | | | | |
Income from investment operations: | | | | | | | | | | | | | | | | | | | | |
Net investment income | | | 0.43 | | | | 0.44 | | | | 0.45 | | | | 0.46 | | | | 0.46 | |
Net gains/(losses) on securities, both realized and unrealized | | | (0.30 | ) | | | 0.70 | | | | (0.05 | ) | | | 0.37 | | | | (0.03 | ) |
| | | | | | | | | | | | | | | | | | | | |
Total from investment operations | | | 0.13 | | | | 1.14 | | | | 0.40 | | | | 0.83 | | | | 0.43 | |
Less distributions: | | | | | | | | | | | | | | | | | | | | |
Distributions from net investment income | | | (0.43 | ) | | | (0.44 | ) | | | (0.45 | ) | | | (0.46 | ) | | | (0.46 | ) |
Distributions from capital gains | | | (0.01 | ) | | | (0.01 | ) | | | — | | | | — | | | | — | |
| | | | | | | | | | | | | | | | | | | | |
Total distributions | | | (0.44 | ) | | | (0.45 | ) | | | (0.45 | ) | | | (0.46 | ) | | | (0.48 | ) |
| | | | | | | | | | | | | | | | | | | | |
Net asset value, end of period | | | $12.10 | | | | $12.41 | | | | $11.72 | | | | $11.77 | | | | $11.40 | |
| | | | | | | | | | | | | | | | | | | | |
Total return | | | 0.94% | | | | 9.81% | | | | 3.45% | | | | 7.40% | | | | 3.95% | |
Net assets, end of period (in thousands) | | | $24,300 | | | | $22,911 | | | | $21,235 | | | | $19,853 | | | | $14,262 | |
Ratio of net expenses to average net assets (a) | | | 0.70% | | | | 0.68% | | | | 0.60% | | | | 0.47% | | | | 0.45% | |
Ratio of net investment income to average net assets | | | 3.40% | | | | 3.59% | | | | 3.83% | | | | 3.94% | | | | 4.14% | |
Portfolio turnover | | | 6.46% | | | | 7.80% | | | | 4.70% | | | | 15.73% | | | | 14.06% | |
| (a) | | Percentages are after expenses waived by Adviser and Custodian. No recovery of these waivers and reductions will be sought. Expenses waived by Adviser and Custodian were: .08% and 0% for 2013; .10% and 0% for 2012;.18% and 0% for 2011; .33% and 0% for 2010; and .37% and .03% for 2009, respectively. |
The accompanying notes are an integral part of the financial statements.
5
DUPREE MUTUAL FUNDS — KENTUCKY TAX-FREE INCOME SERIES
SCHEDULE OF PORTFOLIO INVESTMENTS
Kentucky Municipal Bonds — 100% of Net Assets
June 30, 2013
| | | | | | | | | | | | | | | | | | |
| Bond Description | | Coupon | | | Maturity
Date | | | Rating# | | Par Value | | | Fair Value | |
| MISCELLANEOUS PUBLIC IMPROVEMENT BONDS | | | | | | | | | | | | | | | | | | |
| 25.36% of Net Assets | | | | | | | | | | | | | | | | | | |
Pendleton County KY Multi-County Lease Revenue | | | 6.400 | % | | | 03/01/2019 | | | B* | | $ | 3,000,000 | | | $ | 3,307,664 | |
Ky State Property & Building #106 | | | 5.000 | | | | 10/01/2033 | | | Aa3/A+*/A+@ | | | 4,870,000 | | | | 5,150,074 | |
KY State Property & Building #106 | | | 5.000 | | | | 10/01/2032 | | | Aa3/A+*/A+@ | | | 6,000,000 | | | | 6,350,160 | |
KY State Property & Building #106 | | | 5.000 | | | | 10/01/2031 | | | Aa3/A+*/A+@ | | | 4,910,000 | | | | 5,221,687 | |
KY State Property & Building #105 | | | 4.750 | | | | 04/01/2033 | | | A1/A+*/A@ | | | 2,310,000 | | | | 2,378,977 | |
KY State Property & Building #105 | | | 4.750 | | | | 04/01/2032 | | | A1/A+*/A@ | | | 2,205,000 | | | | 2,272,627 | |
KY State Property & Building #105 | | | 4.750 | | | | 04/01/2031 | | | A1/A+*/A@ | | | 2,110,000 | | | | 2,179,799 | |
KY State Property & Building #83 | | | 5.000 | | | | 10/01/2017 | | | Aa3/A+*/A+@ | | | 5,000,000 | | | | 5,725,850 | |
KY State Property & Building #91 | | | 5.750 | | | | 04/01/2029 | | | A1/A+*/A@ | | | 210,000 | | | | 231,307 | |
KY State Property & Building #90 | | | 5.500 | | | | 11/01/2028 | | | Aa3/A+*/A+@ | | | 24,805,000 | | | | 27,610,446 | |
KY State Property & Building #90 | | | 5.375 | | | | 11/01/2023 | | | Aa3/A+*/A+@ | | | 1,200,000 | | | | 1,372,116 | |
KY State Property & Building #89 | | | 5.000 | | | | 11/01/2027 | | | Aa3/AA-*/A+@ | | | 4,900,000 | | | | 5,337,227 | |
KY State Property & Building #89 | | | 5.000 | | | | 11/01/2026 | | | Aa3/AA-*/A+@ | | | 13,390,000 | | | | 14,681,332 | |
KY State Property & Building #89 | | | 5.000 | | | | 11/01/2025 | | | Aa3/AA-*/A+@ | | | 5,000,000 | | | | 5,515,950 | |
KY State Property & Building #76 | | | 5.500 | | | | 08/01/2021 | | | Aa3/A+*/A+@ | | | 1,400,000 | | | | 1,676,444 | |
KY State Property & Building #88 | | | 4.750 | | | | 11/01/2027 | | | Aa3/A+*/A+@ | | | 5,800,000 | | | | 6,144,578 | |
KY State Property & Building #88 | | | 5.000 | | | | 11/01/2024 | | | Aa3/A+*/A+@ | | | 1,355,000 | | | | 1,481,828 | |
KY State Property & Building #87 | | | 5.000 | | | | 03/01/2027 | | | Aa3/A+*/A+@ | | | 10,290,000 | | | | 10,941,666 | |
KY State Property & Building #87 | | | 5.000 | | | | 03/01/2026 | | | Aa3/A+*/A+@ | | | 8,230,000 | | | | 8,798,364 | |
KY State Property & Building #87 | | | 5.000 | | | | 03/01/2025 | | | Aa3/A+*/A+@ | | | 14,835,000 | | | | 15,918,400 | |
KY State Property & Building #87 | | | 5.000 | | | | 03/01/2023 | | | Aa3/A+*/A+@ | | | 5,175,000 | | | | 5,598,005 | |
KY State Property & Building #87 | | | 5.000 | | | | 03/01/2022 | | | Aa3/A+*/A+@ | | | 1,665,000 | | | | 1,812,669 | |
KY State Property & Building #87 | | | 5.000 | | | | 03/01/2019 | | | Aa3/A+*/A+@ | | | 3,000,000 | | | | 3,347,760 | |
KY State Property & Building #100 | | | 5.000 | | | | 08/01/2031 | | | Aa3/A+*/A+@ | | | 5,100,000 | | | | 5,463,987 | |
KY State Property & Building #100 | | | 5.000 | | | | 08/01/2030 | | | Aa3/A+*/A+@ | | | 7,980,000 | | | | 8,578,101 | |
KY State Property & Building #100 | | | 5.000 | | | | 08/01/2029 | | | Aa3/A+*/A+@ | | | 2,500,000 | | | | 2,698,175 | |
KY State Property & Building #100 | | | 5.000 | | | | 08/01/2028 | | | Aa3/A+*/A+@ | | | 4,000,000 | | | | 4,366,480 | |
KY State Property & Building #100 | | | 5.000 | | | | 08/01/2027 | | | Aa3/A+*/A+@ | | | 1,710,000 | | | | 1,884,266 | |
KY State Property & Building #100 | | | 5.000 | | | | 08/01/2026 | | | Aa3/A+*/A+@ | | | 2,000,000 | | | | 2,221,660 | |
KY State Property & Building #98 | | | 5.000 | | | | 08/01/2021 | | | Aa3/A+*/A+@ | | | 2,505,000 | | | | 2,911,386 | |
KY State Property & Building #96 | | | 5.000 | | | | 11/01/2029 | | | Aa3/A+*/A+@ | | | 5,000,000 | | | | 5,414,150 | |
KY State Property & Building #93 | | | 5.250 | | | | 02/01/2029 | | | Aa3/AA-*/A+@ | | | 22,640,000 | | | | 24,173,181 | |
KY State Property & Building #93 | | | 5.000 | | | | 02/01/2029 | | | Aa3/AA-*/A+@ | | | 500,000 | | | | 531,245 | |
KY State Property & Building #93 | | | 5.250 | | | | 02/01/2028 | | | Aa3/AA-*/A+@ | | | 10,500,000 | | | | 11,397,750 | |
KY State Property & Building #93 | | | 4.875 | | | | 02/01/2028 | | | Aa3/AA-*/A+@ | | | 500,000 | | | | 527,605 | |
Ky State Property & Building #93 | | | 5.250 | | | | 02/01/2025 | | | Aa3/AA-*/A+@ | | | 7,250,000 | | | | 8,056,200 | |
KY Bond Corporation Finance Program | | | 5.500 | | | | 02/01/2031 | | | AA-* | | | 1,115,000 | | | | 1,209,095 | |
KY Association of Counties | | | 5.000 | | | | 02/01/2035 | | | AA-* | | | 995,000 | | | | 1,042,103 | |
KY Association of Counties | | | 5.000 | | | | 02/01/2032 | | | AA-* | | | 1,000,000 | | | | 1,042,360 | |
KY Association of Counties | | | 5.000 | | | | 02/01/2030 | | | AA-* | | | 625,000 | | | | 653,806 | |
KY Asset Liability Commission | | | 5.000 | | | | 05/01/2025 | | | Aa3/A+*/A+@ | | | 1,000,000 | | | | 1,048,750 | |
KY Asset Liability CommissionGeneral Fund | | | 5.000 | | | | 05/01/2024 | | | Aa3/A+*/A+@ | | | 5,880,000 | | | | 6,181,938 | |
KY Asset Liability CommissionProject Notes | | | 5.000 | | | | 05/01/2023 | | | Aa3/A+*/A+@ | | | 5,600,000 | | | | 5,922,000 | |
KY Asset Liability CommissionGeneral Fund | | | 5.000 | | | | 05/01/2020 | | | Aa3/A+*/A+@ | | | 2,000,000 | | | | 2,127,020 | |
| | | | | | | | | | | | | | | | | | |
| | | | | | | | | | | | | | | | | 240,506,188 | |
| PREREFUNDED BONDS | | | | | | | | | | | | | | | | | | |
| 14.36% of Net Assets | | | | | | | | | | | | | | | | | | |
Ballard County KY School District Finance Corporation | | | 5.000 | | | | 06/01/2020 | | | Aa3 | | | 1,240,000 | | | | 1,292,960 | |
Barren County KY School District Finance Corporation | | | 4.750 | | | | 08/01/2022 | | | Aa3 | | | 3,085,000 | | | | 3,232,062 | |
Boone County KY School District Finance Corporation | | | 5.000 | | | | 05/01/2023 | | | Aa3 | | | 4,070,000 | | | | 4,232,800 | |
Boone County KY School District Finance Corporation | | | 5.000 | | | | 05/01/2024 | | | Aa3 | | | 4,265,000 | | | | 4,435,600 | |
Bullitt County KY School District Finance Corporation | | | 4.750 | | | | 07/01/2022 | | | Aa3 | | | 2,440,000 | | | | 2,549,995 | |
Bullitt County KY School District Finance Corporation | | | 4.500 | | | | 10/01/2024 | | | Aa3 | | | 2,720,000 | | | | 2,863,018 | |
Davies County KY School District Finance Corporation | | | 5.000 | | | | 06/01/2021 | | | Aa3 | | | 1,155,000 | | | | 1,205,439 | |
Eastern Kentucky University Consolidated Educational Building | | | 5.000 | | | | 05/01/2021 | | | Baa1/A* | | | 1,580,000 | | | | 1,642,094 | |
Fayette County KY School District Finance Corporation | | | 5.000 | | | | 04/01/2024 | | | Aa2/AA-* | | | 6,985,000 | | | | 7,528,084 | |
The accompanying footnotes are an integral part of the financial statements.
6
DUPREE MUTUAL FUNDS — KENTUCKY TAX-FREE INCOME SERIES
SCHEDULE OF PORTFOLIO INVESTMENTS
Kentucky Municipal Bonds — 100% of Net Assets
June 30, 2013
| | | | | | | | | | | | | | | | | | |
| Bond Description | | Coupon | | | Maturity
Date | | | Rating# | | Par Value | | | Fair Value | |
Fayette County KY School District Finance Corporation | | | 5.000 | % | | | 04/01/2025 | | | Aa2/AA-* | | $ | 7,340,000 | | | $ | 7,910,685 | |
Jefferson County KY School District Finance Corporation | | | 4.500 | | | | 07/01/2023 | | | Aa2/AA-* | | | 2,500,000 | | | | 2,766,525 | |
Jefferson County KY School District Finance Corporation | | | 4.625 | | | | 07/01/2025 | | | Aa2/AA-* | | | 7,545,000 | | | | 8,377,289 | |
Jefferson County KY School District Finance Corporation | | | 5.000 | | | | 07/01/2026 | | | Aa2/AA-* | | | 5,025,000 | | | | 5,635,136 | |
Kenton County KY School District Finance Corporation | | | 5.000 | | | | 06/01/2021 | | | Aa3 | | | 4,055,000 | | | | 4,232,082 | |
Kenton County KY School District Finance Corporation | | | 5.000 | | | | 06/01/2023 | | | Aa3 | | | 4,465,000 | | | | 4,659,987 | |
Kenton County KY School District Finance Corporation | | | 5.000 | | | | 06/01/2024 | | | Aa3 | | | 4,665,000 | | | | 4,868,721 | |
KY State Property & Building #81 | | | 5.000 | | | | 11/01/2018 | | | A1/A+*/A+@ | | | 1,720,000 | | | | 1,748,242 | |
KY State Property & Building #81 | | | 5.000 | | | | 11/01/2020 | | | A1/A+*/A+@ | | | 3,560,000 | | | | 3,618,455 | |
KY State Property & Building #85 | | | 5.000 | | | | 08/01/2020 | | | Aa3/AA-* | | | 5,760,000 | | | | 6,288,538 | |
KY State Property & Building #85 | | | 5.000 | | | | 08/01/2022 | | | Aa3/AA-* | | | 8,200,000 | | | | 8,952,432 | |
KY State Property & Building #85 | | | 5.000 | | | | 08/01/2024 | | | Aa3/AA-* | | | 8,300,000 | | | | 9,061,608 | |
KY State Property & Building #85 | | | 5.000 | | | | 08/01/2025 | | | Aa3/AA-* | | | 2,500,000 | | | | 2,728,850 | |
Knox County General Obligation | | | 5.625 | | | | 06/01/2036 | | | NR | | | 2,490,000 | | | | 2,785,638 | |
Letcher County KY School District Finance Corporation | | | 5.000 | | | | 06/01/2022 | | | Aa3 | | | 1,755,000 | | | | 1,830,132 | |
Letcher County KY School District Finance Corporation | | | 5.000 | | | | 06/01/2024 | | | Aa3 | | | 1,930,000 | | | | 2,012,623 | |
Louisville & Jefferson CountyMetropolitan Sewer | | | 5.000 | | | | 05/15/2026 | | | Aa3/AA*/AA-@ | | | 14,000,000 | | | | 14,964,460 | |
Louisville & Jefferson CountyKY Metropolitan Sewer District | | | 5.000 | | | | 05/15/2015 | | | Aa3/AA-* | | | 1,880,000 | | | | 2,034,442 | |
Louisville & Jefferson CountyKY Metropolitan Sewer District | | | 5.000 | | | | 05/15/2015 | | | Aa3/AA-* | | | 1,970,000 | | | | 2,131,836 | |
Louisville & Jefferson CountyKY Metropolitan Sewer District | | | 5.000 | | | | 05/15/2015 | | | Aa3/AA-* | | | 2,065,000 | | | | 2,234,640 | |
Louisville & Jefferson CountyKY Metropolitan Sewer District | | | 5.000 | | | | 05/15/2015 | | | Aa3/AA-* | | | 2,165,000 | | | | 2,342,855 | |
Louisville & Jefferson CountyMetropolitan Health — St. Marys | | | 6.125 | | | | 02/01/2037 | | | NR | | | 1,300,000 | | | | 1,571,583 | |
Marshall County KY School District Finance Corporation | | | 5.000 | | | | 06/01/2022 | | | Aa3 | | | 1,400,000 | | | | 1,460,872 | |
Shelby County KY School District Finance Corporation | | | 5.000 | | | | 05/01/2022 | | | Aa3 | | | 1,815,000 | | | | 1,888,072 | |
Spencer County KY School District Finance Corporation | | | 5.000 | | | | 07/01/2023 | | | Aa3 | | | 1,000,000 | | | | 1,047,600 | |
| | | | | | | | | | | | | | | | | | |
| | | | | | | | | | | | | | | | | 136,135,355 | |
| MUNICIPAL UTILITY REVENUE BONDS | | | | | | | | | | | | | | | | | | |
| 13.91% of Net Assets | | | | | | | | | | | | | | | | | | |
Boone County KY Pollution Control Revenue — Dayton Power | | | 4.700 | | | | 01/01/2028 | | | A3/BBB-* | | | 6,195,000 | | | | 6,233,905 | |
Campbell and Kenton CountiesSanitary District No. 1 | | | 5.000 | | | | 08/01/2025 | | | Aa2/AA* | | | 2,395,000 | | | | 2,630,357 | |
Campbell and Kenton Counties Sanitary Sewer | | | 5.000 | | | | 08/01/2026 | | | Aa2/AA* | | | 4,175,000 | | | | 4,524,281 | |
Campbell and Kenton Counties Sanitary Sewer | | | 5.000 | | | | 08/01/2027 | | | Aa2/AA* | | | 4,385,000 | | | | 4,718,479 | |
Campbell and Kenton Counties Sanitary District No. 1 | | | 5.000 | | | | 08/01/2037 | | | Aa2/AA* | | | 11,220,000 | | | | 11,856,062 | |
KY Infrastructure Authority Wastewater and Drinking Water | | | 5.000 | | | | 02/01/2027 | | | Aaa/AAA*/AAA@ | | | 2,500,000 | | | | 2,811,275 | |
KY Infrastructure Authority Wastewater and Drinking Water | | | 5.000 | | | | 02/01/2028 | | | Aaa/AAA*/AAA@ | | | 2,000,000 | | | | 2,229,980 | |
KY Rural Water Financial Corporation Public Project Revenue | | | 5.375 | | | | 02/01/2020 | | | A+* | | | 395,000 | | | | 395,636 | |
Kentucky Rural Water FinancingCorporation | | | 4.500 | | | | 02/01/2023 | | | A+* | | | 1,085,000 | | | | 1,190,343 | |
Kentucky Rural Water FinancingCorporation | | | 4.500 | | | | 02/01/2024 | | | A+* | | | 880,000 | | | | 960,142 | |
KY Rural Water Finance Corporation | | | 5.125 | | | | 02/01/2035 | | | A+* | | | 525,000 | | | | 551,765 | |
Louisville & Jefferson CountyMetropolitan Sewer | | | 5.000 | | | | 05/15/2025 | | | Aa3/AA*/AA-@ | | | 3,270,000 | | | | 3,508,972 | |
Louisville & Jefferson CountyMetropolitan Sewer | | | 5.000 | | | | 05/15/2026 | | | Aa3/AA*/AA-@ | | | 3,230,000 | | | | 3,466,985 | |
Louisville & Jefferson CountyMetropolitan Sewer | | | 5.000 | | | | 05/15/2032 | | | Aa3/AA*/AA-@ | | | 4,590,000 | | | | 4,818,031 | |
Louisville & Jefferson CountyMetropolitan Sewer | | | 5.000 | | | | 05/15/2036 | | | Aa3/AA*/AA-@ | | | 2,000,000 | | | | 2,074,780 | |
Louisville & Jefferson CountyMetropolitan Sewer | | | 5.000 | | | | 05/15/2024 | | | Aa3/AA* | | | 7,000,000 | | | | 7,746,200 | |
Louisville & Jefferson CountyMetropolitan Sewer | | | 5.000 | | | | 05/15/2025 | | | Aa3/AA* | | | 5,185,000 | | | | 5,741,765 | |
Louisville & Jefferson CountyMetropolitan Sewer | | | 5.000 | | | | 05/15/2021 | | | Aa3/AA* | | | 2,865,000 | | | | 3,312,341 | |
Louisville & Jefferson CountyMetropolitan Sewer | | | 5.000 | | | | 05/15/2023 | | | Aa3/AA* | | | 2,500,000 | | | | 2,849,025 | |
Louisville & Jefferson CountyMetropolitan Sewer | | | 5.000 | | | | 05/15/2034 | | | Aa3/AA*/AA-@ | | | 23,380,000 | | | | 25,064,295 | |
Louisville & Jefferson CountyKY Metropolitan Sewer District | | | 5.000 | | | | 05/15/2022 | | | Aa3 | | | 975,000 | | | | 1,032,788 | |
Louisville & Jefferson CountyKY Metropolitan Sewer District | | | 5.000 | | | | 05/15/2023 | | | Aa3 | | | 1,020,000 | | | | 1,079,089 | |
Louisville & Jefferson CountyKY Metropolitan Sewer District | | | 5.000 | | | | 05/15/2024 | | | Aa3 | | | 1,070,000 | | | | 1,129,952 | |
Louisville & Jefferson CountyKY Metropolitan Sewer District | | | 5.000 | | | | 05/01/2025 | | | Aa3 | | | 1,120,000 | | | | 1,176,582 | |
Louisville & Jefferson CountyWaterworks | | | 5.000 | | | | 11/15/2027 | | | Aaa/AAA* | | | 2,000,000 | | | | 2,183,480 | |
Louisville & Jefferson CountyWaterworks | | | 5.000 | | | | 11/15/2031 | | | Aaa/AAA* | | | 10,695,000 | | | | 11,534,664 | |
Northern KY Water District | | | 4.125 | | | | 02/01/2021 | | | Aa3 | | | 1,380,000 | | | | 1,382,346 | |
Northern KY Water District | | | 4.500 | | | | 02/01/2022 | | | Aa3 | | | 1,385,000 | | | | 1,422,797 | |
Northern KY Water District | | | 6.000 | | | | 02/01/2028 | | | Aa3 | | | 1,010,000 | | | | 1,143,896 | |
Northern KY Water District | | | 6.000 | | | | 02/01/2031 | | | Aa3 | | | 1,000,000 | | | | 1,118,110 | |
The accompanying footnotes are an integral part of the financial statements.
7
DUPREE MUTUAL FUNDS — KENTUCKY TAX-FREE INCOME SERIES
SCHEDULE OF PORTFOLIO INVESTMENTS
Kentucky Municipal Bonds — 100% of Net Assets
June 30, 2013
| | | | | | | | | | | | | | | | | | |
| Bond Description | | Coupon | | | Maturity
Date | | | Rating# | | Par Value | | | Fair Value | |
Northern KY Water District | | | 6.500 | % | | | 02/01/2033 | | | Aa3 | | $ | 1,585,000 | | | $ | 1,775,897 | |
Northern KY Water District | | | 5.000 | | | | 02/01/2033 | | | Aa3 | | | 3,580,000 | | | | 3,821,936 | |
Northern KY Water District | | | 5.000 | | | | 02/01/2026 | | | Aa3 | | | 1,000,000 | | | | 1,108,100 | |
Northern Ky Water District | | | 5.000 | | | | 02/01/2027 | | | Aa3 | | | 4,315,000 | | | | 4,731,139 | |
Owensboro Water Revenue | | | 5.000 | | | | 09/15/2025 | | | A1 | | | 545,000 | | | | 596,399 | |
| | | | | | | | | | | | | | | | | | |
| | | | | | | | | | | | | | | | | 131,921,794 | |
| TURNPIKES/TOLLROAD/HIGHWAY BONDS | | | | | | | | | | | | | | | | | | |
| 11.73% of Net Assets | | | | | | | | | | | | | | | | | | |
KY Asset Liability CommissionFederal Highway | | | 5.250 | | | | 09/01/2019 | | | Aa3/AA*/A+@ | | | 1,765,000 | | | | 2,089,848 | |
KY Asset Liability Project | | | 5.000 | | | | 09/01/2021 | | | Aa3/AA*/A+@ | | | 1,570,000 | | | | 1,825,172 | |
Kentucky Asset Liability Highway Trust | | | 5.000 | | | | 09/01/2022 | | | Aa3/AA*/A+@ | | | 3,500,000 | | | | 4,011,945 | |
KY State Turnpike Economic Development Road Revenue | | | 5.000 | | | | 07/01/2022 | | | Aa2/AA+*/A+@ | | | 1,625,000 | | | | 1,739,774 | |
KY State Turnpike Economic Development Road Revenue | | | 5.000 | | | | 07/01/2023 | | | Aa2/AA+*/A+@ | | | 4,325,000 | | | | 4,606,514 | |
KY State Turnpike Economic Development Road Revenue | | | 5.000 | | | | 07/01/2024 | | | Aa2/AA+*/A+@ | | | 3,770,000 | | | | 4,006,153 | |
KY State Turnpike Economic Development Road Revenue | | | 5.000 | | | | 07/01/2025 | | | Aa2/AA+*/A+@ | | | 2,000,000 | | | | 2,122,420 | |
KY State Turnpike Economic Development Road Revenue | | | 5.000 | | | | 07/01/2026 | | | Aa2/AA+*/A+@ | | | 4,720,000 | | | | 5,095,523 | |
KY State Turnpike Economic Development Road Revenue | | | 5.000 | | | | 07/01/2020 | | | Aa2/AA+*/A+@ | | | 1,000,000 | | | | 1,148,980 | |
KY State Turnpike Economic Development Road Revenue | | | 5.000 | | | | 07/01/2025 | | | Aa2/AA+*/A+@ | | | 3,225,000 | | | | 3,605,550 | |
KY State Turnpike Economic Development Road Revenue | | | 5.000 | | | | 07/01/2027 | | | Aa2/AA+*/A+@ | | | 9,530,000 | | | | 10,461,367 | |
KY State Turnpike Economic Development Road Revenue | | | 5.000 | | | | 07/01/2028 | | | Aa2/AA+*/A+@ | | | 2,460,000 | | | | 2,689,592 | |
KY State Turnpike Economic Development Road Revenue | | | 5.000 | | | | 07/01/2026 | | | Aa2/AA+*/A+@ | | | 4,440,000 | | | | 4,953,308 | |
KY State Turnpike Economic Development Road Revenue | | | 5.000 | | | | 07/01/2027 | | | Aa2/AA+*/A+@ | | | 3,080,000 | | | | 3,421,726 | |
KY State Turnpike Economic Development Road Revenue | | | 5.000 | | | | 07/01/2029 | | | Aa2/AA+*/A+@ | | | 10,035,000 | | | | 10,997,959 | |
KY State Turnpike Economic Development Road Revenue | | | 5.000 | | | | 07/01/2025 | | | Aa2/AA+*/A+@ | | | 3,775,000 | | | | 4,271,601 | |
KY State Turnpike Economic Development Road Revenue | | | 5.000 | | | | 07/01/2029 | | | Aa2/AA+*/A+@ | | | 5,165,000 | | | | 5,667,968 | |
KY State Turnpike Economic Development Road Revenue | | | 5.000 | | | | 07/01/2030 | | | Aa2/AA+*/A+@ | | | 1,845,000 | | | | 2,007,249 | |
Kentucky State Turnpike Economic Development | | | 5.000 | | | | 07/01/2024 | | | Aa2/AA+*/A+@ | | | 1,500,000 | | | | 1,740,405 | |
KY State Turnpike Economic Development Road Revenue | | | 5.000 | | | | 07/01/2028 | | | Aa2/AA+*/A+@ | | | 4,930,000 | | | | 5,489,062 | |
KY State Turnpike Economic Developement Road Revenue | | | 5.000 | | | | 07/01/2030 | | | Aa2/AA+*/A+@ | | | 1,465,000 | | | | 1,602,725 | |
KY State Turnpike Economic Development Road Revenue | | | 5.000 | | | | 07/01/2031 | | | Aa2/AA+*/A+@ | | | 9,350,000 | | | | 10,184,207 | |
KY State Turnpike Economic Development Road Revenue | | | 5.000 | | | | 07/01/2029 | | | Aa2/AA+*/A+@ | | | 7,235,000 | | | | 7,973,259 | |
Ky State Turnpike Economic Development Road Revenue | | | 5.000 | | | | 07/01/2032 | | | Aa2/AA+*/A+@ | | | 8,755,000 | | | | 9,515,284 | |
| | | | | | | | | | | | | | | | | | |
| | | | | | | | | | | | | | | | | 111,227,591 | |
| REFUNDED BONDS | | | | | | | | | | | | | | | | | | |
| 9.62% of Net Assets | | | | | | | | | | | | | | | | | | |
KY State Property & Building #80 | | | 5.250 | | | | 05/01/2018 | | | Aa3/A+*/A+@ | | | 2,940,000 | | | | 3,418,603 | |
KY State Property & Building #80 | | | 5.250 | | | | 05/01/2020 | | | Aa3/A+*/A+@ | | | 1,000,000 | | | | 1,182,950 | |
KY State Property & Building #83 | | | 5.000 | | | | 10/01/2018 | | | Aa3/A+*/A+@ | | | 17,750,000 | | | | 20,596,745 | |
KY State Property & Building #83 | | | 5.250 | | | | 10/01/2020 | | | Aa3/A+*/A+@ | | | 24,220,000 | | | | 28,738,968 | |
KY State Property & Building #84 | | | 5.000 | | | | 08/01/2019 | | | Aa3/A+*/A+@ | | | 10,000,000 | | | | 11,643,700 | |
KY State Property & Building #84 | | | 5.000 | | | | 08/01/2021 | | | Aa3/A+*/A+@ | | | 310,000 | | | | 360,040 | |
KY State Property & Building #84 | | | 5.000 | | | | 08/01/2022 | | | Aa3/A+*/A+@ | | | 18,000,000 | | | | 20,907,720 | |
KY State Property & Building #104 | | | 5.000 | | | | 11/01/2021 | | | A1/A+*/A@ | | | 2,085,000 | | | | 2,437,574 | |
KY State Property & Building #104 | | | 5.000 | | | | 11/01/2022 | | | A1/A+*/A@ | | | 1,290,000 | | | | 1,499,922 | |
KY State Property & Building #102 | | | 5.000 | | | | 05/01/2024 | | | Aa3/A+*/A+@ | | | 405,000 | | | | 461,344 | |
| | | | | | | | | | | | | | | | | | |
| | | | | | | | | | | | | | | | | 91,247,566 | |
| UNIVERSITY CONSOLIDATED EDUCATION AND BUILDING REVENUE BONDS | | | | | | | | | | | |
| 5.44% of Net Assets | | | | | | | | | | | | | | | | | | |
Boyle County KY College Improvement — Centre College — A | | | 4.750 | | | | 06/01/2032 | | | A3/AA-* | | | 5,330,000 | | | | 5,452,324 | |
KY Asset Liability CommissionUniversity of KY Project Note | | | 5.000 | | | | 10/01/2023 | | | Aa2/AA-* | | | 8,075,000 | | | | 8,623,696 | |
KY Asset Liability CommissionUniversity of KY Project Note | | | 5.000 | | | | 10/01/2024 | | | Aa2/AA-* | | | 7,405,000 | | | | 7,901,357 | |
KY Asset Liability CommissionUniversity of KY Project Note | | | 5.000 | | | | 10/01/2025 | | | Aa2/AA-* | | | 3,700,000 | | | | 3,943,793 | |
Ky Asset Liability CommissionUniversity of KY Project Note | | | 5.000 | | | | 10/01/2024 | | | Aa2/AA-* | | | 5,445,000 | | | | 6,061,320 | |
KY Asset Liability CommissionUniversity of KY Project Note | | | 5.000 | | | | 10/01/2026 | | | Aa2/AA-* | | | 6,090,000 | | | | 6,719,280 | |
Louisville & Jefferson CountyUniversity of Louisville Housing | | | 5.000 | | | | 06/01/2025 | | | NR | | | 2,030,000 | | | | 2,096,097 | |
Louisville & Jefferson CountyUniveristy of Louisville | | | 4.750 | | | | 03/01/2028 | | | Aa2/AA-* | | | 3,250,000 | | | | 3,480,100 | |
University of Louisville General Receipts | | | 5.000 | | | | 09/01/2029 | | | Aa2/AA-* | | | 2,280,000 | | | | 2,480,617 | |
University of Louisville | | | 5.000 | | | | 09/01/2030 | | | Aa2/AA-* | | | 440,000 | | | | 474,219 | |
The accompanying footnotes are an integral part of the financial statements.
8
DUPREE MUTUAL FUNDS — KENTUCKY TAX-FREE INCOME SERIES
SCHEDULE OF PORTFOLIO INVESTMENTS
Kentucky Municipal Bonds — 100% of Net Assets
June 30, 2013
| | | | | | | | | | | | | | | | | | |
| Bond Description | | Coupon | | | Maturity
Date | | | Rating# | | Par Value | | | Fair Value | |
University of Louisville | | | 5.000 | % | | | 09/01/2031 | | | Aa2/AA-* | | $ | 2,580,000 | | | $ | 2,765,683 | |
Western KY University | | | 5.000 | | | | 05/01/2032 | | | Aa3/A+* | | | 1,500,000 | | | | 1,630,500 | |
| | | | | | | | | | | | | | | | | | |
| | | | | | | | | | | | | | | | | 51,628,986 | |
| HOSPITAL AND HEALTHCARE | | | | | | | | | | | | | | | | | | |
| 5.02% of Net Assets | | | | | | | | | | | | | | | | | | |
KY Development Finance Authority — Kings Daughters | | | 5.000 | | | | 02/01/2030 | | | A1/A*/A+@ | | | 4,000,000 | | | | 4,110,520 | |
KY Development Finance Authority — Baptist Heathcare | | | 5.375 | | | | 08/15/2024 | | | A1/AA-@ | | | 1,205,000 | | | | 1,340,707 | |
KY Development Finance Authority — Baptist Healthcare | | | 5.625 | | | | 08/15/2027 | | | A1/AA-@ | | | 4,855,000 | | | | 5,337,830 | |
KY Development Finance Authority — St. Elizabeth | | | 5.125 | | | | 05/01/2029 | | | AA*/AA-@ | | �� | 2,750,000 | | | | 2,897,895 | |
KY Development Finance Authority — St. Elizabeth | | | 5.375 | | | | 05/01/2034 | | | AA*/AA-@ | | | 2,560,000 | | | | 2,754,048 | |
KY Development Finance Authority — Catholic Health | | | 5.000 | | | | 05/01/2029 | | | Aa3/AA-*/AA-@ | | | 2,500,000 | | | | 2,541,350 | |
KY Development Finance Authority — Catholic Health | | | 5.000 | | | | 05/01/2029 | | | Aa3/AA-*/AA-@ | | | 2,410,000 | | | | 2,511,365 | |
Lexington-Fayette Urban County Government Public Facilities | | | 5.000 | | | | 06/01/2033 | | | Aa3/A+*/A+@ | | | 5,000,000 | | | | 5,198,750 | |
Louisville and Jefferson Metropolitan Government Health | | | 5.000 | | | | 10/01/2026 | | | A-*/A-@ | | | 540,000 | | | | 556,146 | |
Louisville & Jefferson CountyMetropolitan Health — Norton Health | | | 5.000 | | | | 10/01/2030 | | | A-*/A-@ | | | 2,000,000 | | | | 2,043,240 | |
Louisville & Jefferson CountyMetropolitan Health — Norton Health | | | 5.250 | | | | 10/01/2036 | | | A-*/A-@ | | | 3,460,000 | | | | 3,559,752 | |
Louisville and Jefferson County Catholic Health Initiatives | | | 5.000 | | | | 12/01/2030 | | | Aa3/AA-*/AA-@ | | | 1,000,000 | | | | 1,060,530 | |
Louisville & Jefferson CountyCatholic Health Initiatives | | | 5.000 | | | | 12/01/2035 | | | Aa3/AA-*/AA-@ | | | 5,685,000 | | | | 5,870,729 | |
Louisville and Jefferson County Catholic Health Initiatives | | | 5.000 | | | | 12/01/2031 | | | Aa3/AA-*/AA-@ | | | 2,750,000 | | | | 2,899,683 | |
Pike County KY Mortgage Revenue-Phelps Regional Health | | | 5.650 | | | | 09/20/2027 | | | NR | | | 2,370,000 | | | | 2,374,859 | |
Warren County Hospital | | | 5.000 | | | | 04/01/2028 | | | A* | | | 2,475,000 | | | | 2,581,648 | |
| | | | | | | | | | | | | | | | | | |
| | | | | | | | | | | | | | | | | 47,639,052 | |
| SCHOOL IMPROVEMENT BONDS | | | | | | | | | | | | | | | | | | |
| 3.87% of Net Assets | | | | | | | | | | | | | | | | | | |
Campbell County KY School District Finance Corporation | | | 4.500 | | | | 08/01/2023 | | | Aa3 | | | 980,000 | | | | 1,028,990 | |
Fayette County School District Finance Corporation | | | 5.000 | | | | 06/01/2031 | | | Aa3/AA-* | | | 3,705,000 | | | | 3,980,430 | |
Fayette County School DistrictFinance Corporation** | | | 5.000 | | | | 10/01/2033 | | | Aa3/AA-* | | | 4,385,000 | | | | 4,637,181 | |
Franklin County School Building Revenue | | | 4.750 | | | | 05/01/2027 | | | Aa3 | | | 3,570,000 | | | | 3,796,302 | |
Hardin County School DistrictFinance Corporation | | | 4.750 | | | | 06/01/2027 | | | Aa3 | | | 1,250,000 | | | | 1,295,663 | |
Hardin County School DistrictFinance Corporation | | | 5.000 | | | | 05/01/2030 | | | Aa3 | | | 450,000 | | | | 473,819 | |
Hardin County School DistrictFinance Corporation | | | 5.000 | | | | 05/01/2031 | | | Aa3 | | | 470,000 | | | | 493,594 | |
Jefferson County KY School District Finance Corporation | | | 4.750 | | | | 12/01/2026 | | | Aa2/AA-* | | | 3,770,000 | | | | 4,017,312 | |
Jefferson County School District Finance Corporation | | | 4.750 | | | | 06/01/2027 | | | Aa2/AA-* | | | 3,000,000 | | | | 3,204,450 | |
Kenton County School DistrictFinance Corporation | | | 5.000 | | | | 02/01/2029 | | | Aa3 | | | 3,270,000 | | | | 3,452,401 | |
Laurel County KY School District Finance Corporation | | | 4.625 | | | | 08/01/2026 | | | Aa3 | | | 3,150,000 | | | | 3,318,084 | |
Laurel County KY School District Finance Corporation | | | 4.750 | | | | 06/01/2026 | | | Aa3 | | | 1,000,000 | | | | 1,048,060 | |
Scott County School District Finance Corporation | | | 4.500 | | | | 01/01/2025 | | | Aa3 | | | 4,890,000 | | | | 5,448,096 | |
Shelby County KY School District Finance Corporation | | | 5.000 | | | | 02/01/2028 | | | Aa3 | | | 500,000 | | | | 526,350 | |
| | | | | | | | | | | | | | | | | | |
| | | | | | | | | | | | | | | | | 36,720,732 | |
| ESCROWED TO MATURITY BONDS | | | | | | | | | | | | | | | | | | |
| 3.45% of Net Assets | | | | | | | | | | | | | | | | | | |
Jefferson County KY Health Facilities — Alliant Health | | | 5.125 | | | | 10/01/2017 | | | A* | | | 3,980,000 | | | | 4,190,224 | |
Jefferson County KY Health Facilities — Alliant Health | | | 5.125 | | | | 10/01/2018 | | | A* | | | 26,740,000 | | | | 28,521,419 | |
| | | | | | | | | | | | | | | | | | |
| | | | | | | | | | | | | | | | | 32,711,643 | |
| STATE AND LOCAL MORTGAGE/HOUSING BONDS | | | | | | | | | | | | | | | | | | |
| 3.43% of Net Assets | | | | | | | | | | | | | | | | | | |
Greater KY Housing AssistanceCorporation — Chenowith Woods | | | 6.100 | | | | 01/01/2024 | | | Baa1/A* | | | 400,000 | | | | 400,432 | |
KY Economic Development Finance Authority — Christian Care | | | 5.375 | | | | 11/20/2035 | | | AA+* | | | 1,905,000 | | | | 1,972,894 | |
KY Housing Corporation Country Place Apartments | | | 4.750 | | | | 04/20/2031 | | | AA+* | | | 935,000 | | | | 955,682 | |
KY Housing Corporation | | | 4.750 | | | | 07/01/2032 | | | Aaa/AAA* | | | 1,265,000 | | | | 1,279,649 | |
KY Housing Corporation | | | 4.400 | | | | 01/01/2017 | | | Aaa/AAA* | | | 1,000,000 | | | | 1,000,690 | |
KY Housing Corporation | | | 4.850 | | | | 01/01/2024 | | | Aaa/AAA* | | | 7,380,000 | | | | 7,385,535 | |
KY Housing Corporation | | | 4.950 | | | | 01/01/2033 | | | Aaa/AAA* | | | 620,000 | | | | 620,856 | |
KY Housing Corporation | | | 4.900 | | | | 07/01/2028 | | | Aaa/AAA* | | | 2,000,000 | | | | 2,040,800 | |
KY Housing Corporation | | | 5.000 | | | | 07/01/2033 | | | Aaa/AAA* | | | 2,405,000 | | | | 2,464,596 | |
KY Housing Corporation | | | 4.875 | | | | 07/01/2023 | | | Aaa/AAA* | | | 1,535,000 | | | | 1,583,506 | |
KY Housing Corporation | | | 5.375 | | | | 07/01/2033 | | | Aaa/AAA* | | | 2,255,000 | | | | 2,321,725 | |
The accompanying footnotes are an integral part of the financial statements.
9
DUPREE MUTUAL FUNDS — KENTUCKY TAX-FREE INCOME SERIES
SCHEDULE OF PORTFOLIO INVESTMENTS
Kentucky Municipal Bonds — 100% of Net Assets
June 30, 2013
| | | | | | | | | | | | | | | | | | |
| Bond Description | | Coupon | | | Maturity
Date | | | Rating# | | Par Value | | | Fair Value | |
KY Housing Corporation | | | 4.850 | % | | | 07/01/2029 | | | Aaa/AAA* | | $ | 3,200,000 | | | $ | 3,296,576 | |
KY Housing Corporation | | | 5.150 | | | | 07/01/2039 | | | Aaa/AAA* | | | 2,455,000 | | | | 2,550,279 | |
KY Housing Corporation | | | 4.625 | | | | 07/01/2033 | | | Aaa/AAA* | | | 415,000 | | | | 424,001 | |
KY Housing Corporation | | | 4.750 | | | | 07/01/2035 | | | Aaa/AAA* | | | 4,140,000 | | | | 4,204,832 | |
| | | | | | | | | | | | | | | | | | |
| | | | | | | | | | | | | | | | | 32,502,053 | |
| PUBLIC FACILITIES REVENUE BONDS | | | | | | | | | | | | | | | | | | |
| 3.04% of Net Assets | | | | | | | | | | | | | | | | | | |
Bracken County Public Property | | | 5.000 | | | | 08/01/2029 | | | Aa3 | | | 840,000 | | | | 901,152 | |
Franklin County Public Properties Justice Center | | | 5.000 | | | | 04/01/2029 | | | Aa3 | | | 2,630,000 | | | | 2,814,652 | |
Louisville & Jefferson CountyInternational Convention Center | | | 4.500 | | | | 12/01/2023 | | | A2/AA-* | | | 2,340,000 | | | | 2,414,974 | |
Louisville & Jefferson CountyInternational Convention Center | | | 4.500 | | | | 12/01/2024 | | | A2/AA-* | | | 2,250,000 | | | | 2,299,298 | |
Louisville & Jefferson CountyInternational Convention Center | | | 4.600 | | | | 12/01/2025 | | | A2/AA-* | | | 1,490,000 | | | | 1,530,886 | |
Louisville & Jefferson CountyMetropolitan Parking Authority | | | 5.000 | | | | 12/01/2022 | | | Aa2/AA* | | | 625,000 | | | | 708,469 | |
Louisville & Jefferson CountyMetropolitan Parking | | | 5.750 | | | | 12/01/2034 | | | Aa2/AA* | | | 2,750,000 | | | | 3,125,210 | |
Muhlenberg County KY Refunding& Improvement | | | 4.500 | | | | 04/01/2028 | | | A1 | | | 730,000 | | | | 758,543 | |
River City Inc. Parking Authority | | | 4.750 | | | | 06/01/2029 | | | Aa2e/AA* | | | 1,160,000 | | | | 1,236,537 | |
River City Inc. Parking Authority | | | 4.750 | | | | 06/01/2031 | | | Aa2e/AA* | | | 1,270,000 | | | | 1,337,780 | |
River City, Inc. Parking Authority** | | | 4.750 | | | | 06/01/2027 | | | Aa2e/AA* | | | 750,000 | | | | 814,898 | |
River City, Inc. Parking Authority** | | | 4.750 | | | | 06/01/2028 | | | Aa2e/AA* | | | 940,000 | | | | 1,012,427 | |
River City, Inc. Parking Authority** | | | 4.750 | | | | 06/01/2029 | | | Aa2e/AA* | | | 980,000 | | | | 1,044,660 | |
River City, Inc. Parking Authority** | | | 4.750 | | | | 06/01/2030 | | | Aa2e/AA* | | | 1,025,000 | | | | 1,086,572 | |
Taylor County Detention Facility | | | 4.750 | | | | 09/01/2027 | | | Aa3 | | | 2,110,000 | | | | 2,181,445 | |
Warren County Downtown Economic Development Authority | | | 5.000 | | | | 06/01/2038 | | | AA-* | | | 2,345,000 | | | | 2,492,289 | |
Wolfe County Public Property | | | 5.000 | | | | 04/01/2030 | | | Aa3 | | | 2,855,000 | | | | 3,089,167 | |
| | | | | | | | | | | | | | | | | | |
| | | | | | | | | | | | | | | | | 28,848,959 | |
| AIRPORT BONDS | | | | | | | | | | | | | | | | | | |
| .42% of Net Assets | | | | | | | | | | | | | | | | | | |
Lexington Fayette Urban CountyAirport Board | | | 5.000 | | | | 07/01/2030 | | | Aa2/AA* | | | 600,000 | | | | 649,728 | |
Lexington Fayette Urban CountyAirport Board | | | 5.000 | | | | 07/01/2032 | | | Aa2/AA* | | | 1,430,000 | | | | 1,532,803 | |
Lexington Fayette Urban CountyAirport Board | | | 5.000 | | | | 07/01/2033 | | | Aa2/AA* | | | 520,000 | | | | 554,549 | |
Lexington Fayette Urban CountyAirport Board | | | 5.000 | | | | 07/01/2038 | | | Aa2/AA* | | | 1,150,000 | | | | 1,214,872 | |
| | | | | | | | | | | | | | | | | | |
| | | | | | | | | | | | | | | | | 3,951,952 | |
| | | | | | | | | | | | | | | | | | |
Total Investments 99.65% of Net Assets (cost $906,795,270)(See (a) below for further explanation) | | | | | | | | | $ | 945,041,871 | |
| | | | | | | | | | | | | | | | | | |
| Other assets in excess of liabilities .35% | | | | | | | | | | | | | | | | | 3,234,505 | |
| | | | | | | | | | | | | | | | | | |
| Net Assets 100% | | | | | | | | | | | | | | | | $ | 948,276,376 | |
| | | | | | | | | | | | | | | | | | |
| | * | | Standard and Poor’s Corporation |
| | ** | | When-Issued security or extended settlement — see footnote 1(D) |
| | @ | | Fitch’s Investors Service |
| | | | (All other ratings by Moody’s Investors Service, Inc.) |
| | # | | Bond ratings are unaudited and not covered by Report of Independent Registered Public Accounting Firm. |
| (a) | | Cost for federal income tax purposes is $906,765,976 and net unrealized appreciation of investments is as follows: |
| | | | | | |
| | Unrealized appreciation | | $ | 45,075,119 | |
| | Unrealized depreciation | | | (6,799,224 | ) |
| | | | | | |
| | Net unrealized appreciation | | $ | 38,275,895 | |
| | | | | | |
The accompanying footnotes are an integral part of the financial statements.
10
DUPREE MUTUAL FUNDS — KENTUCKY TAX-FREE INCOME SERIES
SCHEDULE OF PORTFOLIO INVESTMENTS
Kentucky Municipal Bonds — 100% of Net Assets
June 30, 2013
Other Information
The following is a summary of the inputs used, as of June 30, 2013 involving the Fund’s investments in securities carried at fair value. The inputs or methodology used for valuing securities may not be an indication of the risk associated with investing in those securities. For more information on valuation inputs, and their aggregation into the levels used in the table below, please refer to the Security Valuation section in the accompanying Notes to Financial Statements.
| | | | | | |
| | | Valuation Inputs | | Municipal Bonds | |
Level 1 | | Quoted Prices | | $ | — | |
Level 2 | | Other Significant Observable Inputs | | | 945,041,871 | |
Level 3 | | Significant Unobservable Inputs | | | — | |
| | | | | | |
| | | | $ | 945,041,871 | |
| | | | | | |
The accompanying footnotes are an integral part of the financial statements.
11
KENTUCKY TAX-FREE INCOME SERIES
STATEMENT OF ASSETS AND LIABILITIES
June 30, 2013
| | | | | | | | |
ASSETS: | | | | | | | | |
Investments in securities, at fair value (Cost: $906,795,270) | | | | | | $ | 945,041,871 | |
Cash | | | | | | | 4,844,736 | |
Receivable for fund shares sold | | | | | | | 83,085 | |
Interest receivable | | | | | | | 12,739,662 | |
| | | | | | | | |
Total assets | | | | | | | 962,709,354 | |
LIABILITIES: | | | | | | | | |
Payable for: | | | | | | | | |
Investments purchased | | | 8,870,136 | | | | | |
Distributions to shareholders | | | 3,713,889 | | | | | |
Fund shares redeemed | | | 1,057,240 | | | | | |
Investment advisory fee | | | 299,503 | | | | | |
Transfer agent fee | | | 97,644 | | | | | |
Trustees fees | | | 48,687 | | | | | |
Accrued expenses | | | 345,879 | | | | | |
| | | | | | | | |
Total liabilities | | | | | | | 14,432,978 | |
| | | | | | | | |
NET ASSETS: | | | | | | | | |
Capital | | | | | | | 909,685,288 | |
Accumulated net investment income | | | | | | | 29,294 | |
Net accumulated realized gain on investment transactions | | | | | | | 315,193 | |
Net unrealized appreciation in value of investments | | | | | | | 38,246,601 | |
| | | | | | | | |
Net assets at value | | | | | | $ | 948,276,376 | |
| | | | | | | | |
NET ASSET VALUE, offering price and redemption price per share
($948,276,376 -:-122,454,795 shares outstanding; unlimited number of shares authorized; no par value) | | | | | | $ | 7.74 | |
| | | | | | | | |
STATEMENT OF OPERATIONS
For the year ended June 30, 2013
| | | | |
Net investment income: | | | | |
Interest income | | $ | 39,112,411 | |
| | | | |
Expenses: | | | | |
Investment advisory fee | | | 3,748,731 | |
Transfer agent fee | | | 1,231,263 | |
Custodian expense | | | 113,689 | |
Professional fees | | | 204,525 | |
Trustees fees | | | 130,669 | |
Other expenses | | | 236,041 | |
| | | | |
Total expenses | | | 5,664,918 | |
Custodian expense reduction | | | (6,191 | ) |
| | | | |
Net expenses | | | 5,658,727 | |
| | | | |
Net investment income | | | 33,453,684 | |
| | | | |
Realized and unrealized gain/(loss) on investments: | | | | |
Net realized gain | | | 382,491 | |
Net change in unrealized appreciation/depreciation | | | (31,045,800 | ) |
| | | | |
Net realized and unrealized loss on investments | | | (30,663,309 | ) |
| | | | |
Net increase in net assets resulting from operations | | $ | 2,790,375 | |
| | | | |
The accompanying notes are an integral part of the financial statements.
12
KENTUCKY TAX-FREE INCOME SERIES
STATEMENTS OF CHANGES IN NET ASSETS
For the years ended June 30, 2013 and 2012
| | | | | | | | |
| | | 2013 | | | 2012 | |
Operations: | | | | | | | | |
Net investment income | | $ | 33,453,684 | | | $ | 34,152,687 | |
Net realized gain on investments | | | 382,491 | | | | 714,806 | |
Net change in unrealized appreciation/depreciation | | | (31,045,800 | ) | | | 45,703,274 | |
| | | | | | | | |
Net increase in net assets resulting from operations | | | 2,790,375 | | | | 80,570,767 | |
Distributions from net investment income | | | (33,471,869 | ) | | | (34,105,208 | ) |
Distributions from capital gains | | | (146,341 | ) | | | (3,744,261 | ) |
Net fund share transactions (Note 4) | | | (10,299,757 | ) | | | 50,057,645 | |
| | | | | | | | |
Total increase | | | (41,127,592 | ) | | | 92,778,943 | |
Net assets: | | | | | | | | |
Beginning of year | | | 989,403,968 | | | | 896,625,025 | |
| | | | | | | | |
End of year | | $ | 948,276,376 | | | $ | 989,403,968 | |
| | | | | | | | |
Accumulated net investment income | | $ | 29,294 | | | $ | 47,479 | |
| | | | | | | | |
FINANCIAL HIGHLIGHTS
| | | | | | | | | | | | | | | | | | | | |
| Selected data for a share outstanding: | | For the years ended June 30, | |
| | | 2013 | | | 2012 | | | 2011 | | | 2010 | | | 2009 | |
Net asset value, beginning of year | | | $7.99 | | | | $7.63 | | | | $7.67 | | | | $7.49 | | | | $7.39 | |
| | | | | | | | | | | | | | | | | | | | |
Income from investment operations: | | | | | | | | | | | | | | | | | | | | |
Net investment income | | | 0.27 | �� | | | 0.28 | | | | 0.29 | | | | 0.29 | | | | 0.29 | |
Net gains/(losses) on securities, both realized and unrealized | | | (0.25 | ) | | | 0.39 | | | | (0.02 | ) | | | 0.20 | | | | 0.11 | |
| | | | | | | | | | | | | | | | | | | | |
Total from investment operations | | | 0.02 | | | | 0.67 | | | | 0.27 | | | | 0.49 | | | | 0.40 | |
Less distributions: | | | | | | | | | | | | | | | | | | | | |
Distributions from net investment income | | | (0.27 | ) | | | (0.28 | ) | | | (0.29 | ) | | | (0.29 | ) | | | (0.29 | ) |
Distributions from capital gains | | | 0.00 | (b) | | | (0.03 | ) | | | (0.02 | ) | | | (0.02 | ) | | | (0.01 | )(b) |
| | | | | | | | | | | | | | | | | | | | |
Total distributions | | | (0.27 | ) | | | (0.31 | ) | | | (0.31 | ) | | | (0.31 | ) | | | (0.30 | ) |
| | | | | | | | | | | | | | | | | | | | |
Net asset value, end of year | | | $7.74 | | | | $7.99 | | | | $7.63 | | | | $7.67 | | | | $7.49 | |
| | | | | | | | | | | | | | | | | | | | |
Total return | | | 0.17% | | | | 8.97% | | | | 3.57% | | | | 6.58% | | | | 5.65% | |
Net assets, end of year (in thousands) | | | $948,276 | | | | $989,404 | | | | $896,625 | | | | $882,897 | | | | $788,923 | |
Ratio of net expenses to average net assets (a) | | | 0.57% | | | | 0.57% | | | | 0.58% | | | | 0.58% | | | | 0.58% | |
Ratio of net investment income to average net assets | | | 3.35% | | | | 3.60% | | | | 3.78% | | | | 3.81% | | | | 3.99% | |
Portfolio turnover | | | 7.02% | | | | 8.39% | | | | 11.42% | | | | 4.76% | | | | 6.09% | |
| (a) | | Percentages are after custodian reduction for which no recovery will be sought. Percentages before custodian reduction were: 57% for 2013; .57% for 2012; .58% for 2011; ..58% for 2010; and .58% for 2009. |
| (b) | | Rounds to less than $0.01. |
The accompanying notes are an integral part of the financial statements.
13
DUPREE MUTUAL FUNDS — KENTUCKY TAX-FREE SHORT-TO-MEDIUM SERIES
SCHEDULE OF PORTFOLIO INVESTMENTS
Kentucky Municipal Bonds — 100% of Net Assets
June 30, 2013
| | | | | | | | | | | | | | | | | | |
| Bond Description | | Coupon | | | Maturity
Date | | | Rating# | | Par Value | | | Fair Value | |
| MISCELLANEOUS PUBLIC IMPROVEMENT BONDS | | | | | | | | | | | | | | | | | | |
| 28.92% of Net Assets | | | | | | | | | | | | | | | | | | |
KY State Property & Building #94 | | | 5.000 | % | | | 05/01/2017 | | | Aa2/A+*/A+@ | | $ | 500,000 | | | $ | 563,685 | |
KY State Property & Building #95 | | | 5.000 | | | | 08/01/2017 | | | Aa3/A+*/A+@ | | | 200,000 | | | | 228,190 | |
KY State Property & Building #100 | | | 5.000 | | | | 08/01/2019 | | | Aa3/A+*/A+@ | | | 1,600,000 | | | | 1,862,000 | |
KY State Property & Building #100 | | | 5.000 | | | | 08/01/2017 | | | Aa3/A+*/A+@ | | | 500,000 | | | | 570,475 | |
KY State Property & Building #87 | | | 5.000 | | | | 03/01/2017 | | | Aa3/A+*/A+@ | | | 850,000 | | | | 959,548 | |
KY State Property & Building #87 | | | 5.000 | | | | 03/01/2018 | | | Aa3/A+*/A+@ | | | 100,000 | | | | 112,620 | |
KY State Property & Building #87 | | | 5.000 | | | | 03/01/2020 | | | Aa3/A+*/A+@ | | | 4,500,000 | | | | 4,957,425 | |
KY State Property & Building #88 | | | 5.000 | | | | 11/01/2014 | | | Aa3/A+*/A+@ | | | 1,000,000 | | | | 1,061,751 | |
KY State Property & Building #88 | | | 5.000 | | | | 11/01/2015 | | | Aa3/A+*/A+@ | | | 955,000 | | | | 1,046,451 | |
KY State Property & Building #89 | | | 5.000 | | | | 11/01/2014 | | | Aa3/AA-*/A+@ | | | 2,000,000 | | | | 2,123,520 | |
KY State Property & Building #89 | | | 5.000 | | | | 11/01/2015 | | | Aa3/AA-*/A+@ | | | 2,230,000 | | | | 2,447,380 | |
KY State Property & Building #89 | | | 3.750 | | | | 11/01/2017 | | | Aa3/AA-*/A+@ | | | 100,000 | | | | 109,069 | |
KY State Property & Building #76 | | | 5.500 | | | | 08/01/2017 | | | Aa3/A+*/A+@ | | | 190,000 | | | | 220,543 | |
KY State Property & Building #76 | | | 5.500 | | | | 08/01/2018 | | | Aa3/A+*/A+@ | | | 1,415,000 | | | | 1,671,639 | |
KY State Property & Building #89 | | | 5.000 | | | | 11/01/2020 | | | Aa3/AA-*/A+@ | | | 200,000 | | | | 228,722 | |
KY State Property & Building #90 | | | 5.000 | | | | 11/01/2015 | | | Aa3/A+*/A+@ | | | 250,000 | | | | 273,818 | |
KY State Property & Building #90 | | | 5.000 | | | | 11/01/2018 | | | Aa3/A+*/A+@ | | | 250,000 | | | | 290,563 | |
KY State Property & Building #90 | | | 5.750 | | | | 11/01/2019 | | | Aa3/A+*/A+@ | | | 200,000 | | | | 238,370 | |
KY State Property & Building #90 | | | 5.000 | | | | 11/01/2020 | | | Aa3/A+*/A+@ | | | 495,000 | | | | 565,013 | |
KY State Property & Building #83 | | | 5.000 | | | | 10/01/2017 | | | Aa3/A+*/A+@ | | | 100,000 | | | | 114,517 | |
KY State Property & Building #93 | | | 5.250 | | | | 02/01/2018 | | | Aa3/A+*/A+@ | | | 510,000 | | | | 588,662 | |
KY State Property & Building #93 | | | 5.250 | | | | 02/01/2021 | | | Aa3/AA-*/A+@ | | | 200,000 | | | | 229,318 | |
KY State Property & Building #85 | | | 5.000 | | | | 08/01/2016 | | | Aa3/AA-*/A+@ | | | 835,000 | | | | 902,510 | |
KY State Property & Building #106 | | | 5.000 | | | | 10/01/2021 | | | Aa3/A+*/A+@ | | | 750,000 | | | | 866,685 | |
KY State Property & Building #99 | | | 5.000 | | | | 11/01/2021 | | | Aa3/A+*/A+@ | | | 1,000,000 | | | | 1,160,160 | |
KY Asset Liability Commission | | | 5.000 | | | | 05/01/2016 | | | Aa3/A+*/A+@ | | | 1,000,000 | | | | 1,074,520 | |
KY Association of Counties | | | 4.250 | | | | 02/01/2017 | | | AA-* | | | 500,000 | | | | 536,280 | |
KY Association of Counties | | | 4.000 | | | | 02/01/2018 | | | AA-* | | | 115,000 | | | | 126,367 | |
KY Association of Counties | | | 4.250 | | | | 02/01/2019 | | | AA-* | | | 255,000 | | | | 284,348 | |
KY Infrastructure Authority | | | 5.250 | | | | 08/01/2013 | | | AA* | | | 435,000 | | | | 436,814 | |
| | | | | | | | | | | | | | | | | | |
| | | | | | | | | | | | | | | | | 25,850,963 | |
| TURNPIKES/TOLLROAD/HIGHWAY BONDS | | | | | | | | | | | | | | | | | | |
| 15.38% of Net Assets | | | | | | | | | | | | | | | | | | |
KY Asset Liability Project Notes | | | 5.000 | | | | 09/01/2016 | | | Aa3/AA*/A+@ | | | 2,000,000 | | | | 2,133,920 | |
KY Asset Liability Project Notes | �� | | 5.000 | | | | 09/01/2015 | | | Aa3/AA*/A+@ | | | 275,000 | | | | 300,102 | |
KY Asset Liability Project Notes | | | 4.500 | | | | 09/01/2016 | | | Aa3/AA*/A+@ | | | 175,000 | | | | 193,571 | |
KY Asset Liability Project Notes | | | 5.000 | | | | 09/01/2017 | | | Aa3/AA*/A+@ | | | 1,500,000 | | | | 1,716,255 | |
KY Asset Liability Projects — Federal Highway | | | 4.200 | | | | 09/01/2018 | | | Aa3/AA*/A+@ | | | 1,500,000 | | | | 1,638,435 | |
KY Asset Liability Project Notes | | | 4.300 | | | | 09/01/2019 | | | Aa3/AA*/A+@ | | | 1,400,000 | | | | 1,527,736 | |
KY Turnpike Authority Economic Development | | | 5.000 | | | | 07/01/2019 | | | Aa2/AA+*/A+@ | | | 2,250,000 | | | | 2,419,155 | |
KY Turnpike Authority Economic Development | | | 5.000 | | | | 07/01/2017 | | | Aa2/AA+*/A+@ | | | 2,570,000 | | | | 2,865,781 | |
KY Turnpike Authority Economic Development Road Revenue | | | 4.125 | | | | 07/01/2019 | | | Aa2/AA+*/A+@ | | | 105,000 | | | | 115,688 | |
KY Turnpike Economic Development | | | 5.000 | | | | 07/01/2016 | | | Aa2/AA+*/A+@ | | | 750,000 | | | | 836,790 | |
| | | | | | | | | | | | | | | | | | |
| | | | | | | | | | | | | | | | | 13,747,433 | |
| SCHOOL IMPROVEMENT BONDS | | | | | | | | | | | | | | | | | | |
| 14.29% of Net Assets | | | | | | | | | | | | | | | | | | |
KY Interlocal School Transportation Assistance Equipment | | | 3.750 | | | | 03/01/2015 | | | Aa3 | | | 770,000 | | | | 770,670 | |
Boone County School District Finance Corporation | | | 4.000 | | | | 08/01/2018 | | | Aa3 | | | 145,000 | | | | 151,885 | |
Breathitt County School District Finance Corporation | | | 3.875 | | | | 07/01/2017 | | | Aa3 | | | 280,000 | | | | 292,995 | |
Bullitt County KY School District Finance Corporation | | | 4.000 | | | | 10/01/2014 | | | Aa3 | | | 150,000 | | | | 156,189 | |
Campbell County School District Finance Corporation | | | 4.375 | | | | 08/01/2019 | | | Aa3 | | | 875,000 | | | | 947,949 | |
Corbin KY Independent School District | | | 4.000 | | | | 02/01/2018 | | | Aa3 | | | 300,000 | | | | 322,419 | |
Daviess Co School District Finance Corporation | | | 4.250 | | | | 08/01/2019 | | | Aa3 | | | 100,000 | | | | 108,345 | |
Fayette County KY School District Finance Corporation | | | 4.000 | | | | 06/01/2019 | | | Aa3/AA-* | | | 140,000 | | | | 147,309 | |
Fayette County School District Finance Corporation | | | 4.375 | | | | 05/01/2021 | | | Aa3/AA-* | | | 200,000 | | | | 215,170 | |
Gallatin County School District Finance Corporation | | | 4.000 | | | | 05/01/2016 | | | Aa3 | | | 175,000 | | | | 188,953 | |
The accompanying footnotes are an integral part of the financial statements.
14
DUPREE MUTUAL FUNDS — KENTUCKY TAX-FREE SHORT-TO-MEDIUM SERIES
SCHEDULE OF PORTFOLIO INVESTMENTS
Kentucky Municipal Bonds — 100% of Net Assets
June 30, 2013
| | | | | | | | | | | | | | | | | | |
| Bond Description | | Coupon | | | Maturity
Date | | | Rating# | | Par Value | | | Fair Value | |
Grant County School District Finance Corporation | | | 3.750 | % | | | 06/01/2017 | | | Aa3 | | $ | 190,000 | | | $ | 203,982 | |
Hardin County School District Finance Corporation | | | 4.000 | | | | 02/01/2019 | | | Aa3 | | | 1,475,000 | | | | 1,523,793 | |
Hazard KY Independent School District Finance Corporation | | | 3.850 | | | | 09/01/2017 | | | Aa3 | | | 200,000 | | | | 209,622 | |
Jefferson County School District Finance Corporation | | | 5.250 | | | | 01/01/2017 | | | Aa2/AA-* | | | 200,000 | | | | 225,904 | |
Jessamine County KY School District | | | 4.100 | | | | 01/01/2018 | | | Aa3 | | | 100,000 | | | | 103,544 | |
Johnson County School District Finance Corporation | | | 3.000 | | | | 12/01/2019 | | | Aa3 | | | 180,000 | | | | 189,355 | |
Laurel County School District Finance Corporation | | | 4.500 | | | | 06/01/2020 | | | Aa3 | | | 350,000 | | | | 383,702 | |
Madison County KY School District Finance Corporation | | | 3.600 | | | | 02/01/2017 | | | Aa3 | | | 300,000 | | | | 310,254 | |
Oldham County School Building Corporation | | | 4.375 | | | | 06/01/2018 | | | Aa3 | | | 2,570,000 | | | | 2,820,704 | |
Pendleton County School District Finance Corporation | | | 4.000 | | | | 02/01/2020 | | | Aa3 | | | 450,000 | | | | 477,981 | |
Warren County KY School District Finance Corporation | | | 4.000 | | | | 02/01/2015 | | | Aa3 | | | 785,000 | | | | 820,945 | |
Warren County KY School District Finance Corporation | | | 4.000 | | | | 02/01/2016 | | | Aa3 | | | 1,330,000 | | | | 1,416,995 | |
Warren Co School District Finance Corporation | | | 4.000 | | | | 04/01/2018 | | | Aa3 | | | 725,000 | | | | 787,053 | |
| | | | | | | | | | | | | | | | | | |
| | | | | | | | | | | | | | | | | 12,775,718 | |
| REFUNDING BONDS | | | | | | | | | | | | | | | | | | |
| 10.87% of Net Assets | | | | | | | | | | | | | | | | | | |
KY State Property & Building #82 | | | 5.250 | | | | 10/01/2015 | | | Aa3/AA-*/A+@ | | | 2,525,000 | | | | 2,776,541 | |
KY State Property & Building #82 | | | 5.250 | | | | 10/01/2017 | | | Aa3/AA-*/A+@ | | | 1,260,000 | | | | 1,449,680 | |
KY State Property & Building #83 | | | 5.000 | | | | 10/01/2016 | | | Aa3/A+*/A+@ | | | 775,000 | | | | 869,876 | |
KY State Property & Building #83 | | | 5.000 | | | | 10/01/2019 | | | Aa3/A+*/A+@ | | | 1,750,000 | | | | 2,041,655 | |
KY State Property & Building #84 | | | 5.000 | | | | 08/01/2019 | | | Aa3/A+*/A+@ | | | 1,000,000 | | | | 1,164,370 | |
KY State Property & Building #101 | | | 5.000 | | | | 10/01/2019 | | | Aa3/A+*/A+@ | | | 1,050,000 | | | | 1,222,977 | |
Lexington Fayette Urban County Government Public Property | | | 4.000 | | | | 05/01/2017 | | | Aa2/AA* | | | 180,000 | | | | 195,655 | |
| | | | | | | | | | | | | | | | | | |
| | | | | | | | | | | | | | | | | 9,720,754 | |
| UNIVERSITY CONSOLIDATED EDUCATION AND BUILDING REVENUE BONDS | | | | | | | | | | | |
| 9.85% of Net Assets | | | | | | | | | | | | | | | | | | |
Boyle County Centre College | | | 5.000 | | | | 06/01/2018 | | | A3/AA-* | | | 200,000 | | | | 224,630 | |
Boyle County College — Center College | | | 5.000 | | | | 06/01/2020 | | | A3/AA-* | | | 150,000 | | | | 166,664 | |
KY Asset Liability University of Kentucky Project Notes | | | 5.000 | | | | 10/01/2016 | | | Aa2/AA-* | | | 1,250,000 | | | | 1,364,888 | |
KY Asset Liability Project Notes | | | 4.400 | | | | 10/01/2019 | | | Aa2/AA-* | | | 1,750,000 | | | | 1,869,105 | |
Ky Asset Liability University of Kentucky Project Notes | | | 4.450 | | | | 10/01/2020 | | | Aa2/AA-* | | | 500,000 | | | | 531,700 | |
KY Asset Liability Commission University of KY Project | | | 5.000 | | | | 10/01/2019 | | | Aa2/AA-* | | | 320,000 | | | | 364,323 | |
KY Asset Liability — University of Kentucky | | | 4.000 | | | | 10/01/2019 | | | Aa2/AA-* | | | 100,000 | | | | 107,357 | |
Louisville & Jefferson County University of Louisville | | | 4.000 | | | | 03/01/2020 | | | Aa2/AA-* | | | 300,000 | | | | 324,135 | |
Northern Ky University General Receipts | | | 4.000 | | | | 09/01/2018 | | | Aa3/A+* | | | 150,000 | | | | 165,141 | |
Western KY University | | | 4.000 | | | | 09/01/2020 | | | Aa3/A+* | | | 290,000 | | | | 307,966 | |
Western KY University | | | 3.000 | | | | 09/01/2014 | | | Aa3/AA-* | | | 1,000,000 | | | | 1,025,080 | |
Western Ky University | | | 4.000 | | | | 09/01/2017 | | | Aa3/AA-* | | | 2,145,000 | | | | 2,352,078 | |
| | | | | | | | | | | | | | | | | | |
| | | | | | | | | | | | | | | | | 8,803,067 | |
| MUNICIPAL UTILITY REVENUE BONDS | | | | | | | | | | | | | | | | | | |
| 7.49% of Net Assets | | | | | | | | | | | | | | | | | | |
Bourbon County Public Project | | | 3.800 | | | | 02/01/2019 | | | A2 | | | 260,000 | | | | 274,932 | |
KY State Rural Water Corporation | | | 3.000 | | | | 02/01/2018 | | | A+* | | | 530,000 | | | | 553,612 | |
KY Rural Water Finance Corporation | | | 3.000 | | | | 08/01/2019 | | | A+* | | | 545,000 | | | | 562,173 | |
Kentucky Rural Water Finance Corporation | | | 3.000 | | | | 02/01/2018 | | | A+* | | | 300,000 | | | | 311,889 | |
Kentucky Rural Water Finance Corporation | | | 3.000 | | | | 02/01/2019 | | | A+* | | | 250,000 | | | | 259,130 | |
KY Rural Water Finance Corporation | | | 3.625 | | | | 02/01/2016 | | | Baa1/A+* | | | 60,000 | | | | 60,683 | |
KY Rural Water Finance Corporation | | | 4.000 | | | | 02/01/2014 | | | Baa1/A+* | | | 130,000 | | | | 131,604 | |
KY State Rural Water Finance Corporation | | | 4.500 | | | | 08/01/2021 | | | Baa1/A+* | | | 100,000 | | | | 108,746 | |
Lawrenceburg Water and Sewer | | | 3.000 | | | | 10/01/2018 | | | A1 | | | 375,000 | | | | 393,049 | |
Louisville & Jefferson County Municipal Sewer | | | 5.000 | | | | 05/15/2018 | | | Aa3/AA*/AA-@ | | | 1,220,000 | | | | 1,347,929 | |
Louisville & Jefferson County Municipal Sewer | | | 5.000 | | | | 05/15/2016 | | | Aa3/AA* | | | 100,000 | | | | 111,875 | |
Louisville & Jefferson County Metropolitan Sewer | | | 5.000 | | | | 05/15/2015 | | | Aa3/AA* | | | 500,000 | | | | 541,075 | |
Louisville & Jefferson County Metropolitan Sewer | | | 5.000 | | | | 05/15/2015 | | | Aa3/AA* | | | 1,000,000 | | | | 1,082,350 | |
Louisville & Jefferson County Metropolitan Sanitary Sewer | | | 5.000 | | | | 05/15/2016 | | | Aa3/AA* | | | 175,000 | | | | 188,347 | |
Paducah Electric Plant | | | 3.000 | | | | 10/01/2014 | | | A3/A-@ | | | 750,000 | | | | 771,090 | |
| | | | | | | | | | | | | | | | | | |
| | | | | | | | | | | | | | | | | 6,698,484 | |
The accompanying footnotes are an integral part of the financial statements.
15
DUPREE MUTUAL FUNDS — KENTUCKY TAX-FREE SHORT-TO-MEDIUM SERIES
SCHEDULE OF PORTFOLIO INVESTMENTS
Kentucky Municipal Bonds — 100% of Net Assets
June 30, 2013
| | | | | | | | | | | | | | | | | | |
| Bond Description | | Coupon | | | Maturity
Date | | | Rating# | | Par Value | | | Fair Value | |
| HOSPITAL AND HEALTHCARE | | | | | | | | | | | | | | | | | | |
| 3.61% of Net Assets | | | | | | | | | | | | | | | | | | |
KY State Asset/Liability Commission General Receipts | | | 4.000 | % | | | 10/01/2018 | | | Aa2/AA-* | | $ | 105,000 | | | $ | 114,022 | |
Ky Asset Liability Commission Revenue University of Kentucky | | | 4.125 | | | | 10/01/2019 | | | Aa2/AA-* | | | 150,000 | | | | 165,138 | |
KY State Asset/Liability Commission University of Kentucky | | | 5.000 | | | | 10/01/2020 | | | Aa2/AA-* | | | 150,000 | | | | 169,917 | |
KY Development Finance Authority — Kings Daughters | | | 5.000 | | | | 02/01/2016 | | | A1/A*/A+@ | | | 1,000,000 | | | | 1,085,170 | |
KY Economic Development — Baptist Healthcare System | | | 4.750 | | | | 08/15/2019 | | | A1/AA-@ | | | 110,000 | | | | 121,845 | |
KY Development Finance Authority — St. Elizabeth | | | 5.000 | | | | 05/01/2015 | | | AA*/AA-@ | | | 400,000 | | | | 429,960 | |
KY Economic Development Finance Authority — Catholic Health | | | 4.000 | | | | 05/01/2015 | | | Aa3/AA-*/AA-@ | | | 250,000 | | | | 256,503 | |
KY Economic Development Finance Authority — Norton Health | | | 6.000 | | | | 10/01/2018 | | | Baa1/A* | | | 560,000 | | | | 570,422 | |
Warren County Hospital | | | 4.000 | | | | 04/01/2020 | | | A* | | | 300,000 | | | | 317,463 | |
| | | | | | | | | | | | | | | | | | |
| | | | | | | | | | | | | | | | | 3,230,440 | |
| PUBLIC FACILITIES REVENUE BONDS | | | | | | | | | | | | | | | | | | |
| 3.61% of Net Assets | | | | | | | | | | | | | | | | | | |
Lexington Fayette Urban County Government | | | 5.000 | | | | 06/01/2021 | | | Aa3/A+*/A+@ | | | 500,000 | | | | 581,545 | |
Adair County Public Properties | | | 4.000 | | | | 12/01/2022 | | | Aa3 | | | 170,000 | | | | 178,794 | |
Lexington-Fayette Urban County Government Public Facilities | | | 4.000 | | | | 10/01/2018 | | | Aa3 | | | 1,540,000 | | | | 1,641,178 | |
Pulaski County KY Public Property | | | 3.750 | | | | 12/01/2014 | | | Aa3 | | | 480,000 | | | | 502,546 | |
Todd County Public Properties — Courthouse Facilities | | | 3.250 | | | | 06/01/2019 | | | Aa3 | | | 100,000 | | | | 105,916 | |
Whitley County Public Properties — Justice Center | | | 3.375 | | | | 09/01/2019 | | | Aa3 | | | 200,000 | | | | 213,018 | |
| | | | | | | | | | | | | | | | | | |
| | | | | | | | | | | | | | | | | 3,222,997 | |
| STATE AND LOCAL MORTGAGE/HOUSING BONDS | | | | | | | | | | | | | | | | | | |
| 2.57% of Net Assets | | | | | | | | | | | | | | | | | | |
KY Housing Corporation | | | 4.850 | | | | 01/01/2024 | | | Aaa/AAA* | | | 750,000 | | | | 750,563 | |
KY Housing Corporation | | | 4.875 | | | | 07/01/2023 | | | Aaa/AAA* | | | 1,500,000 | | | | 1,547,400 | |
| | | | | | | | | | | | | | | | | | |
| | | | | | | | | | | | | | | | | 2,297,963 | |
| PREREFUNDED BONDS | | | | | | | | | | | | | | | | | | |
| 1.72% of Net Assets | | | | | | | | | | | | | | | | | | |
Christian County School District Finance Corporation | | | 4.000 | | | | 08/01/2019 | | | Aa3 | | | 720,000 | | | | 770,184 | |
Clay County School District Finance Corporation | | | 3.750 | | | | 06/01/2017 | | | Aa3 | | | 210,000 | | | | 222,558 | |
Jefferson County School District School Building Revenue | | | 4.250 | | | | 07/01/2017 | | | Aa2/AA-* | | | 175,000 | | | | 192,362 | |
Louisville & Jefferson County Metropolitan Sanitary Sewer | | | 5.000 | | | | 05/15/2015 | | | Aa3/AA-* | | | 325,000 | | | | 352,209 | |
| | | | | | | | | | | | | | | | | | |
| | | | | | | | | | | | | | | | | 1,537,313 | |
| | | | | | | | | | | | | | | | | | |
Total Investments 98.31% of Net Assets (cost $84,827,661)(See (a) below for further explanation) | | | | | | | | | $ | 87,885,132 | |
| | | | | | | | | | | | | | | | | | |
| Other assets in excess of liabilities 1.69% | | | | | | | | | | | | | | | | | 1,517,373 | |
| | | | | | | | | | | | | | | | | | |
| Net Assets 100% | | | | | | | | | | | | | | | | $ | 89,402,505 | |
| | | | | | | | | | | | | | | | | | |
| | * | | Standard and Poor’s Corporation |
| | @ | | Fitch’s Investors Service |
| | | | (All other ratings by Moody’s Investors Service, Inc.) |
| | # | | Bond ratings are unaudited and not covered by Report of Independent Registered Public Accounting Firm. |
| (a) | | Cost for federal income tax purposes is $84,827,661 and net unrealized appreciation of investments is as follows: |
| | | | | | |
| | Unrealized appreciation | | $ | 3,332,846 | |
| | Unrealized depreciation | | | (275,375 | ) |
| | | | | | |
| | Net unrealized appreciation | | $ | 3,057,471 | |
| | | | | | |
The accompanying footnotes are an integral part of the financial statements.
16
DUPREE MUTUAL FUNDS — KENTUCKY TAX-FREE SHORT-TO-MEDIUM SERIES
SCHEDULE OF PORTFOLIO INVESTMENTS
Kentucky Municipal Bonds — 100% of Net Assets
June 30, 2013
Other Information
The following is a summary of the inputs used, as of June 30, 2013 involving the Fund’s investments in securities carried at fair value. The inputs or methodology used for valuing securities may not be an indication of the risk associated with investing in those securities. For more information on valuation inputs, and their aggregation into the levels used in the table below, please refer to the Security Valuation section in the accompanying Notes to Financial Statements.
| | | | | | |
| | | Valuation Inputs | | Municipal Bonds | |
Level 1 | | Quoted Prices | | $ | — | |
Level 2 | | Other Significant Observable Inputs | | | 87,885,132 | |
Level 3 | | Significant Unobservable Inputs | | | — | |
| | | | | | |
| | | | $ | 87,885,132 | |
| | | | | | |
The accompanying footnotes are an integral part of the financial statements.
17
KENTUCKY TAX-FREE SHORT-TO-MEDIUM SERIES
STATEMENT OF ASSETS AND LIABILITIES
June 30, 2013
| | | | | | | | |
ASSETS: | | | | | | | | |
Investments in securities, at fair value (Cost: $84,827,661) | | | | | | $ | 87,885,132 | |
Cash | | | | | | | 334,603 | |
Receivable for fund shares sold | | | | | | | 201,644 | |
Interest receivable | | | | | | | 1,123,663 | |
| | | | | | | | |
Total assets | | | | | | | 89,545,042 | |
LIABILITIES: | | | | | | | | |
Payable for: | | | | | | | | |
Distributions to shareholders | | | 58,073 | | | | | |
Fund shares redeemed | | | 8,334 | | | | | |
Investment advisory fee | | | 37,097 | | | | | |
Transfer agent fee | | | 16,355 | | | | | |
Trustees fees | | | 3,182 | | | | | |
Accrued expenses | | | 19,496 | | | | | |
| | | | | | | | |
Total liabilities | | | | | | | 142,537 | |
| | | | | | | | |
NET ASSETS: | | | | | | | | |
Capital | | | | | | | 87,142,059 | |
Net accumulated realized loss on investment transactions | | | | | | | (797,025 | ) |
Net unrealized appreciation in value of investments | | | | | | | 3,057,471 | |
| | | | | | | | |
Net assets at value | | | | | | $ | 89,402,505 | |
| | | | | | | | |
NET ASSET VALUE, offering price and redemption price per share
($89,402,505 -:- 16,462,258 shares outstanding; unlimited number of shares authorized; no par value) | | | | | | $ | 5.43 | |
| | | | | | | | |
STATEMENT OF OPERATIONS
For the year ended June 30, 2013
| | | | |
Net investment income: | | | | |
Interest income | | $ | 2,592,190 | |
| | | | |
Expenses: | | | | |
Investment advisory fee | | | 456,322 | |
Transfer agent fee | | | 119,326 | |
Custodian expense | | | 17,253 | |
Professional fees | | | 24,544 | |
Trustees fees | | | 11,849 | |
Other expenses | | | 30,628 | |
| | | | |
Total expenses | | | 659,922 | |
Custodian expense reduction | | | (564 | ) |
| | | | |
Net expenses | | | 659,358 | |
| | | | |
Net investment income | | | 1,932,832 | |
| | | | |
Realized and unrealized gain/(loss) on investments: | | | | |
Net realized gain | | | 145,079 | |
Net change in unrealized appreciation/depreciation | | | (1,956,078 | ) |
| | | | |
Net realized and unrealized loss on investments | | | (1,810,999 | ) |
| | | | |
Net increase in net assets resulting from operations | | $ | 121,833 | |
| | | | |
The accompanying notes are an integral part of the financial statements.
18
KENTUCKY TAX-FREE SHORT-TO-MEDIUM SERIES
STATEMENTS OF CHANGES IN NET ASSETS
For the years ended June 30, 2013 and 2012
| | | | | | | | |
| | | 2013 | | | 2012 | |
Operations: | | | | | | | | |
Net investment income | | $ | 1,932,832 | | | $ | 1,911,427 | |
Net realized gain on investments | | | 145,079 | | | | 88,570 | |
Net change in unrealized appreciation/depreciation | | | (1,956,078 | ) | | | 2,079,426 | |
| | | | | | | | |
Net increase in net assets resulting from operations | | | 121,833 | | | | 4,079,423 | |
Distributions from net investment income | | | (1,932,832 | ) | | | (1,911,427 | ) |
Net fund share transactions (Note 4) | | | 1,685,639 | | | | 14,954,411 | |
| | | | | | | | |
Total decrease | | | (125,360 | ) | | | 17,122,407 | |
Net assets: | | | | | | | | |
Beginning of year | | | 89,527,865 | | | | 72,405,458 | |
| | | | | | | | |
End of year | | $ | 89,402,505 | | | $ | 89,527,865 | |
| | | | | | | | |
FINANCIAL HIGHLIGHTS
| | | | | | | | | | | | | | | | | | | | |
| Selected data for a share outstanding: | | For the years ended June 30, | |
| | | 2013 | | | 2012 | | | 2011 | | | 2010 | | | 2009 | |
Net asset value, beginning of year | | | $5.54 | | | | $5.39 | | | | $5.36 | | | | $5.25 | | | | $5.16 | |
| | | | | | | | | | | | | | | | | | | | |
Income from investment operations: | | | | | | | | | | | | | | | | | | | | |
Net investment income | | | 0.12 | | | | 0.12 | | | | 0.13 | | | | 0.15 | | | | 0.17 | |
Net gains/(losses) on securities, both realized and unrealized | | | (0.11 | ) | | | 0.15 | | | | 0.03 | | | | 0.11 | | | | 0.09 | |
| | | | | | | | | | | | | | | | | | | | |
Total from investment operations | | | 0.01 | | | | 0.27 | | | | 0.16 | | | | 0.26 | | | | 0.26 | |
Less distributions: | | | | | | | | | | | | | | | | | | | | |
Distributions from net investment income | | | (0.12 | ) | | | (0.12 | ) | | | (0.13 | ) | | | (0.15 | ) | | | (0.17 | ) |
| | | | | | | | | | | | | | | | | | | | |
Net asset value, end of year | | | $5.43 | | | | $5.54 | | | | $5.39 | | | | $5.36 | | | | $5.25 | |
| | | | | | | | | | | | | | | | | | | | |
Total return | | | 0.11% | | | | 5.10% | | | | 3.04% | | | | 4.99% | | | | 5.02% | |
Net assets, end of year (in thousands) | | | $89,403 | | | | $89,528 | | | | $72,405 | | | | $69,166 | | | | $60,570 | |
Ratio of net expenses to average net assets (a) | | | 0.72% | | | | 0.73% | | | | 0.72% | | | | 0.72% | | | | 0.72% | |
Ratio of net investment income to average net assets | | | 2.12% | | | | 2.22% | | | | 2.44% | | | | 2.80% | | | | 3.16% | |
Portfolio turnover | | | 6.63% | | | | 4.73% | | | | 15.37% | | | | 20.26% | | | | 15.64% | |
| (a) | | Percentages are after custodian reduction for which no recovery will be sought. Percentages before custodian reduction were: .72% for 2013; .73% for 2012; .72% for 2011; .72% for 2010; and .72% for 2009. |
The accompanying notes are an integral part of the financial statements.
19
DUPREE MUTUAL FUNDS — MISSISSIPPI TAX-FREE INCOME SERIES
SCHEDULE OF PORTFOLIO INVESTMENTS
Mississippi Municipal Bonds — 100% of Net Assets
June 30, 2013
| | | | | | | | | | | | | | | | | | |
| Bond Description | | Coupon | | | Maturity
Date | | | Rating# | | Par Value | | | Fair Value | |
| UNIVERSITY CONSOLIDATED EDUCATION AND BUILDING REVENUE BONDS | | | | | | | | | | | |
| 27.67% of Net Assets | | | | | | | | | | | | | | | | | | |
Alcorn State University Educational Building MS Revenue | | | 5.125 | % | | | 09/01/2034 | | | Aa2 | | $ | 95,000 | | | $ | 100,259 | |
Jackson State University Education Building | | | 5.000 | | | | 03/01/2034 | | | Aa2/AA-* | | | 175,000 | | | | 184,629 | |
MS Development Bank Special Obligation Hinds Community | | | 5.000 | | | | 10/01/2026 | | | Aa2 | | | 85,000 | | | | 92,404 | |
MS Development Bank Special Obligation Hinds College | | | 5.125 | | | | 10/01/2028 | | | Aa2 | | | 100,000 | | | | 108,355 | |
MS Development Bank Special Obligation Hinds College | | | 5.375 | | | | 10/01/2033 | | | Aa2 | | | 60,000 | | | | 64,558 | |
MS Development Bank Special Obligation Jones County College | | | 5.100 | | | | 03/01/2028 | | | AA-* | | | 55,000 | | | | 59,964 | |
MS Development Bank Special Obligation Jones County Junior | | | 5.000 | | | | 03/01/2033 | | | AA-* | | | 150,000 | | | | 160,446 | |
MS Development Bank Special Obligation Jones County Junior | | | 5.125 | | | | 03/01/2039 | | | AA-* | | | 45,000 | | | | 47,803 | |
MS Development Bank Special Obligation Hinds Community | | | 5.000 | | | | 04/01/2036 | | | A2/AA-* | | | 250,000 | | | | 266,005 | |
MS State University Educational Building Corporation Revenue | | | 5.000 | | | | 08/01/2024 | | | Aa2/A+*/AA@ | | | 225,000 | | | | 238,610 | |
MS State University Educational Building Corporation Revenue | | | 5.000 | | | | 08/01/2028 | | | Aa2/A+*/AA@ | | | 30,000 | | | | 31,644 | |
MS State University Educational Building Corporation Revenue | | | 5.250 | | | | 08/01/2033 | | | Aa2/AA@ | | | 50,000 | | | | 53,070 | |
MS State University Educational Building Corporation Revenue | | | 5.000 | | | | 08/01/2036 | | | Aa2/AA@ | | | 175,000 | | | | 185,500 | |
Southern Mississippi Educational Building Corporation | | | 5.000 | | | | 03/01/2038 | | | Aa2/AA@ | | | 100,000 | | | | 106,219 | |
University Southern MS Education Building — Series A | | | 5.000 | | | | 03/01/2022 | | | Aa2 | | | 100,000 | | | | 108,345 | |
University Southern MS Educational Building Corporation | | | 5.000 | | | | 03/01/2032 | | | Aa2 | | | 50,000 | | | | 52,511 | |
University Southern MS Education Building Athletics | | | 5.000 | | | | 03/01/2034 | | | Aa2 | | | 105,000 | | | | 111,950 | |
University Southern MS Educational Building Corporation | | | 5.125 | | | | 09/01/2029 | | | Aa2/A+* | | | 100,000 | | | | 107,170 | |
University of Mississippi Educational Building Corporation | | | 5.000 | | | | 10/01/2028 | | | Aa2/AA@ | | | 200,000 | | | | 219,540 | |
| | | | | | | | | | | | | | | | | | |
| | | | | | | | | | | | | | | | | 2,298,982 | |
| PUBLIC FACILITIES REVENUE BONDS | | | | | | | | | | | | | | | | | | |
| 17.72% of Net Assets | | | | | | | | | | | | | | | | | | |
MS State Development Bank Special Obligation Alcorn County | | | 4.750 | | | | 07/01/2031 | | | AA-* | | | 100,000 | | | | 105,390 | |
MS Development Bank Special Obligations Department of Corrections | | | 5.250 | | | | 08/01/2027 | | | AA-*/AA@ | | | 50,000 | | | | 54,663 | |
MS Development Bank Special Obligation Department of Corrections | | | 5.250 | | | | 08/01/2027 | | | AA-*/AA@ | | | 305,000 | | | | 334,640 | |
MS State Development Bank Special Obligation City of JacksonConvention Center | | | 5.000 | | | | 03/01/2027 | | | Aa2/AA-* | | | 125,000 | | | | 140,024 | |
MS State Development Bank Special Obligation Refunding — City of Jackson | | | 5.000 | | | | 03/01/2036 | | | Aa2/AA-* | | | 150,000 | | | | 160,968 | |
MS State Capital Improvement Projects — Series A | | | 5.000 | | | | 10/01/2029 | | | Aa2/AA*/AA+@ | | | 145,000 | | | | 160,366 | |
MS State Capital ImprovementsProjects — Series A | | | 5.000 | | | | 10/01/2036 | | | Aa2/AA*/AA+@ | | | 480,000 | | | | 516,595 | |
| | | | | | | | | | | | | | | | | | |
| | | | | | | | | | | | | | | | | 1,472,646 | |
| TURNPIKES/TOLLROAD/HIGHWAY BONDS | | | | | | | | | | | | | | | | | | |
| 14.68% of Net Assets | | | | | | | | | | | | | | | | | | |
MS Development Bank Special Obligation Highway Construction | | | 5.000 | | | | 01/01/2027 | | | Aa3/AA-* | | | 125,000 | | | | 136,019 | |
MS Development Bank Special Obligation Highway — Desoto | | | 4.750 | | | | 01/01/2035 | | | Aa3/AA-* | | | 225,000 | | | | 233,685 | |
MS Development Bank Special Obligation Highway Construction | | | 5.000 | | | | 01/01/2027 | | | Aa3/AA-* | | | 245,000 | | | | 266,812 | |
MS Development Bank Special Obligation Highway Construction | | | 4.750 | | | | 01/01/2031 | | | Aa3/AA-* | | | 125,000 | | | | 131,838 | |
MS State Development Bank Special Obligation Highway | | | 5.000 | | | | 01/01/2025 | | | Aa3/AA-* | | | 200,000 | | | | 232,544 | |
MS Development Bank Special Obligation Marshall County | | | 5.000 | | | | 01/01/2028 | | | Aa3/AA-* | | | 200,000 | | | | 218,524 | |
| | | | | | | | | | | | | | | | | | |
| | | | | | | | | | | | | | | | | 1,219,422 | |
| MUNICIPAL UTILITY REVENUE BONDS | | | | | | | | | | | | | | | | | | |
| 10.99% of Net Assets | | | | | | | | | | | | | | | | | | |
MS Development Bank Special Obligation Rankin Utilities | | | 5.000 | | | | 01/01/2028 | | | A2/AA-* | | | 55,000 | | | | 57,664 | |
MS Development Bank Special Obligation Desoto County | | | 5.000 | | | | 07/01/2032 | | | A* | | | 45,000 | | | | 46,736 | |
MS Development Bank Special Obligation Southaven Water | | | 5.000 | | | | 03/01/2025 | | | A+* | | | 325,000 | | | | 345,465 | |
MS Development Bank Special Obligation Desoto County | | | 5.250 | | | | 07/01/2031 | | | A* | | | 225,000 | | | | 237,731 | |
MS State Development Bank Special Obligation Refunding — Jackson Water & Sewer | | | 4.500 | | | | 09/01/2034 | | | A1/AA-* | | | 85,000 | | | | 86,333 | |
MS State Development Bank Special Obligation Jackson Water | | | 5.000 | | | | 09/01/2030 | | | A1/AA-* | | | 125,000 | | | | 139,496 | |
| | | | | | | | | | | | | | | | | | |
| | | | | | | | | | | | | | | | | 913,425 | |
| MISCELLANEOUS PUBLIC IMPROVEMENT BONDS | | | | | | | | | | | | | | | | | | |
| 8.28% of Net Assets | | | | | | | | | | | | | | | | | | |
MS Development Bank Special Obligation Capital Project | | | 5.000 | | | | 07/01/2031 | | | NR | | | 5,000 | | | | 5,383 | |
MS Development Bank Special Obligation Capital Projects | | | 5.875 | | | | 07/01/2024 | | | NR | | | 10,000 | | | | 10,734 | |
The accompanying footnotes are an integral part of the financial statements.
20
DUPREE MUTUAL FUNDS — MISSISSIPPI TAX-FREE INCOME SERIES
SCHEDULE OF PORTFOLIO INVESTMENTS
Mississippi Municipal Bonds — 100% of Net Assets
June 30, 2013
| | | | | | | | | | | | | | | | | | |
| Bond Description | | Coupon | | | Maturity
Date | | | Rating# | | Par Value | | | Fair Value | |
MS Development Bank Special Obligation Capital Projects | | | 5.000 | % | | | 07/01/2024 | | | NR | | $ | 10,000 | | | $ | 10,537 | |
MS Development Bank Special Obligation Lowndes County | | | 5.000 | | | | 07/01/2022 | | | A2/AA-* | | | 80,000 | | | | 88,322 | |
MS Development Bank Special Obligation Lowndes County | | | 5.000 | | | | 07/01/2027 | | | A2/AA-* | | | 150,000 | | | | 159,443 | |
MS Development Bank Special Obligation Canton — Series A | | | 5.750 | | | | 10/01/2031 | | | A2 | | | 370,000 | | | | 413,475 | |
| | | | | | | | | | | | | | | | | | |
| | | | | | | | | | | | | | | | | 687,894 | |
| PREREFUNDED BONDS | | | | | | | | | | | | | | | | | | |
| 4.75% of Net Assets | | | | | | | | | | | | | | | | | | |
MS Development Bank Special Obligation Jackson Water/Sewer | | | 5.000 | | | | 09/01/2034 | | | Aa3/AA-* | | | 60,000 | | | | 63,290 | |
MS Development Special Obligation Madison County Highway | | | 5.000 | | | | 01/01/2027 | | | Aa3/AA-* | | | 295,000 | | | | 331,194 | |
| | | | | | | | | | | | | | | | | | |
| | | | | | | | | | | | | | | | | 394,484 | |
| REFUNDING BONDS | | | | | | | | | | | | | | | | | | |
| 4.13% of Net Assets | | | | | | | | | | | | | | | | | | |
MS Development Bank Special Obligation Capital Improvement | | | 5.250 | | | | 07/01/2026 | | | A2/AA-* | | | 125,000 | | | | 136,436 | |
MS State Development Bank Special Obligation Lowndes County | | | 5.125 | | | | 12/01/2027 | | | AA-* | | | 135,000 | | | | 146,656 | |
MS State Refunding — Series A | | | 5.250 | | | | 11/01/2019 | | | Aa2/AA*/AA+@ | | | 50,000 | | | | 59,665 | |
| | | | | | | | | | | | | | | | | | |
| | | | | | | | | | | | | | | | | 342,757 | |
| SCHOOL IMPROVEMENT BONDS | | | | | | | | | | | | | | | | | | |
| 3.79% of Net Assets | | | | | | | | | | | | | | | | | | |
MD Development Bank Special Obligation Jackson Public | | | 5.375 | | | | 04/01/2028 | | | A2 | | | 70,000 | | | | 75,991 | |
MS State Development Bank Special Obligation — Jackson Schools | | | 5.000 | | | | 04/01/2028 | | | A+* | | | 225,000 | | | | 238,905 | |
| | | | | | | | | | | | | | | | | | |
| | | | | | | | | | | | | | | | | 314,896 | |
| HOSPITAL AND HEALTHCARE REVENUE BONDS | | | | | | | | | | | | | | | | | | |
| 3.20% of Net Assets | | | | | | | | | | | | | | | | | | |
Medical Center Educational Building Corporation MS Revenue | | | 5.500 | | | | 12/01/2023 | | | Aa2 | | | 120,000 | | | | 137,159 | |
MS Development Bank Special Obligation Jones County Rest Home | | | 5.250 | | | | 04/01/2028 | | | A2/AA-* | | | 120,000 | | | | 128,754 | |
| | | | | | | | | | | | | | | | | | |
| | | | | | | | | | | | | | | | | 265,913 | |
| AIRPORT BONDS | | | | | | | | | | | | | | | | | | |
| 2.12% of Net Assets | | | | | | | | | | | | | | | | | | |
Jackson MS Municipal Airport Authority | | | 5.000 | | | | 10/01/2031 | | | A3/A-@ | | | 170,000 | | | | 176,231 | |
| | | | | | | | | | | | | | | | | | |
| STATE AND LOCAL MORTGAGE/HOUSING BONDS | | | | | | | | | | | | | | | | | | |
| .37% of Net Assets | | | | | | | | | | | | | | | | | | |
MS Home Corporation Single Family Mortgage — Series E-1 | | | 5.050 | | | | 12/01/2028 | | | Aaa | | | 30,000 | | | | 30,619 | |
| | | | | | | | | | | | | | | | | | |
| ESCROWED TO MATURITY BONDS | | | | | | | | | | | | | | | | | | |
| .32% of Net Assets | | | | | | | | | | | | | | | | | | |
Harrison County MS Wastewater Management District | | | 5.000 | | | | 02/01/2015 | | | AA+* | | | 25,000 | | | | 26,173 | |
| | | | | | | | | | | | | | | | | | |
Total Investments 98.02% of Net Assets (cost $8,012,170)(See (a) below for further explanation) | | | | | | | | | $ | 8,143,442 | |
| | | | | | | | | | | | | | | | | | |
| Other assets in excess of liabilities 1.98% | | | | | | | | | | | | | | | | | 165,086 | |
| | | | | | | | | | | | | | | | | | |
| Net Assets 100% | | | | | | | | | | | | | | | | $ | 8,308,528 | |
| | | | | | | | | | | | | | | | | | |
| | * | | Standard and Poor’s Corporation |
| | @ | | Fitch’s Investors Service |
| | | | (All other ratings by Moody’s Investors Service, Inc.) |
| | # | | Bond ratings are unaudited and not covered by Report of Independent Registered Public Accounting Firm. |
| (a) | | Cost for federal income tax purposes is $8,011,925 and net unrealized appreciation of investments is as follows: |
| | | | | | |
| | Unrealized appreciation | | $ | 254,429 | |
| | Unrealized depreciation | | | (122,912 | ) |
| | | | | | |
| | Net unrealized appreciation | | $ | 131,517 | |
| | | | | | |
The accompanying footnotes are an integral part of the financial statements.
21
DUPREE MUTUAL FUNDS — MISSISSIPPI TAX-FREE INCOME SERIES
SCHEDULE OF PORTFOLIO INVESTMENTS
Mississippi Municipal Bonds — 100% of Net Assets
June 30, 2013
Other Information
The following is a summary of the inputs used, as of June 30, 2013 involving the Fund’s investments in securities carried at fair value. The inputs or methodology used for valuing securities may not be an indication of the risk associated with investing in those securities. For more information on valuation inputs, and their aggregation into the levels used in the table below, please refer to the Security Valuation section in the accompanying Notes to Financial Statements.
| | | | | | |
| | | Valuation Inputs | | Municipal Bonds | |
Level 1 | | Quoted Prices | | $ | — | |
Level 2 | | Other Significant Observable Inputs | | | 8,143,442 | |
Level 3 | | Significant Unobservable Inputs | | | — | |
| | | | | | |
| | | | $ | 8,143,442 | |
| | | | | | |
The accompanying footnotes are an integral part of the financial statements.
22
MISSISSIPPI TAX-FREE INCOME SERIES
STATEMENT OF ASSETS AND LIABILITIES
June 30, 2013
| | | | | | | | |
ASSETS: | | | | | | | | |
Investments in securities, at fair value (Cost: $8,012,170) | | | | | | $ | 8,143,442 | |
Cash | | | | | | | 80,544 | |
Interest receivable | | | | | | | 134,256 | |
| | | | | | | | |
Total assets | | | | | | | 8,358,242 | |
LIABILITIES: | | | | | | | | |
Payable for: | | | | | | | | |
Distributions to shareholders | | | 40,054 | | | | | |
Fund shares redeemed | | | 1,196 | | | | | |
Investment advisory fee | | | 1,855 | | | | | |
Transfer agent fee | | | 2,735 | | | | | |
Trustees fees | | | 309 | | | | | |
Accrued expenses | | | 3,565 | | | | | |
| | | | | | | | |
Total liabilities | | | | | | | 49,714 | |
| | | | | | | | |
NET ASSETS: | | | | | | | | |
Capital | | | | | | | 8,167,157 | |
Accumulated net investment income | | | | | | | 174 | |
Net accumulated realized gain on investment transactions | | | | | | | 9,925 | |
Net unrealized appreciation in value of investments | | | | | | | 131,272 | |
| | | | | | | | |
Net assets at value | | | | | | $ | 8,308,528 | |
| | | | | | | | |
NET ASSET VALUE, offering price and redemption price per share
($8,308,528 -:- 713,396 shares outstanding; unlimited number of shares authorized; no par value) | | | | | | $ | 11.65 | |
| | | | | | | | |
STATEMENT OF OPERATIONS
For the year ended June 30, 2013
| | | | |
Net investment income: | | | | |
Interest income | | $ | 326,347 | |
| | | | |
Expenses: | | | | |
Investment advisory fee | | | 42,039 | |
Transfer agent fee | | | 12,990 | |
Custodian expense | | | 7,301 | |
Pricing fees | | | 4,500 | |
Professional fees | | | 2,196 | |
Other expenses | | | 5,880 | |
| | | | |
Total expenses | | | 74,906 | |
Fees waived by Adviser | | | (19,516 | ) |
Custodian expense reduction | | | (48 | ) |
| | | | |
Net expenses | | | 55,342 | |
| | | | |
Net investment income | | | 271,005 | |
| | | | |
Realized and unrealized gain/(loss) on investments: | | | | |
Net realized gain | | | 32,190 | |
Net change in unrealized appreciation/depreciation | | | (303,574 | ) |
| | | | |
Net realized and unrealized loss on investments | | | (271,384 | ) |
| | | | |
Net decrease in net assets resulting from operations | | $ | (379 | ) |
| | | | |
The accompanying notes are an integral part of the financial statements.
23
MISSISSIPPI TAX-FREE INCOME SERIES
STATEMENTS OF CHANGES IN NET ASSETS
For the years ended June 30, 2013 and 2012
| | | | | | | | |
| | | 2013 | | | 2012 | |
Operations: | | | | | | | | |
Net investment income | | $ | 271,005 | | | $ | 251,938 | |
Net realized gain/(loss) on investments | | | 32,190 | | | | (22,265 | ) |
Net change in unrealized appreciation/depreciation | | | (303,574 | ) | | | 419,712 | |
| | | | | | | | |
Net decrease in net assets resulting from operations | | | (379 | ) | | | 649,385 | |
Distributions from net investment income | | | (287,105 | ) | | | (251,732 | ) |
Net fund share transactions (Note 4) | | | 884,037 | | | | 938,255 | |
| | | | | | | | |
Total increase | | | 596,553 | | | | 1,335,908 | |
Net assets: | | | | | | | | |
Beginning of year | | | 7,711,975 | | | | 6,376,067 | |
| | | | | | | | |
End of year | | $ | 8,308,528 | | | $ | 7,711,975 | |
| | | | | | | | |
Accumulated Net Investment Income | | $ | 174 | | | $ | 16,274 | |
| | | | | | | | |
FINANCIAL HIGHLIGHTS
| | | | | | | | | | | | | | | | | | | | |
| Selected data for a share outstanding: | | For the years ended June 30, | |
| | | 2013 | | | 2012 | | | 2011 | | | 2010 | | | 2009 | |
Net asset value, beginning of year | | | $12.01 | | | | $11.33 | | | | $11.41 | | | | $11.03 | | | | $11.08 | |
| | | | | | | | | | | | | | | | | | | | |
Income from investment operations: | | | | | | | | | | | | | | | | | | | | |
Net investment income | | | 0.39 | | | | 0.42 | | | | 0.44 | | | | 0.45 | | | | 0.45 | |
Net gains/(losses) on securities, both realized and unrealized | | | (0.33 | ) | | | 0.68 | | | | (0.08 | ) | | | 0.38 | | | | (0.05 | ) |
| | | | | | | | | | | | | | | | | | | | |
Total from investment operations | | | 0.06 | | | | 1.10 | | | | 0.36 | | | | 0.83 | | | | 0.40 | |
Less distributions: | | | | | | | | | | | | | | | | | | | | |
Distributions from net investment income | | | (0.42 | ) | | | (0.42 | ) | | | (0.44 | ) | | | (0.45 | ) | | | (0.45 | ) |
Distributions from capital gains | | | — | | | | — | | | | — | | | | — | | | | — | (b) |
| | | | | | | | | | | | | | | | | | | | |
Total distributions | | | (0.42 | ) | | | (0.42 | ) | | | (0.44 | ) | | | (0.45 | ) | | | (0.45 | ) |
| | | | | | | | | | | | | | | | | | | | |
Net asset value, end of period | | | $11.65 | | | | $12.01 | | | | $11.33 | | | | $11.41 | | | | $11.03 | |
| | | | | | | | | | | | | | | | | | | | |
Total return | | | 0.38% | | | | 9.87% | | | | 3.19% | | | | 7.65% | | | | 3.72% | |
Net assets, end of period (in thousands) | | | $8,309 | | | | $7,712 | | | | $6,376 | | | | $6,321 | | | | $5,001 | |
Ratio of net expenses to average net assets (a) | | | 0.66% | | | | 0.65% | | | | 0.58% | | | | 0.45% | | | | 0.44% | |
Ratio of net investment income to average net assets | | | 3.22% | | | | 3.59% | | | | 3.86% | | | | 3.99% | | | | 4.11% | |
Portfolio turnover | | | 13.81% | | | | 9.99% | | | | 20.53% | | | | 10.04% | | | | 9.30% | |
| (a) | | Percentages are after expenses waived by Adviser and Custodian reduction. No recovery of these waivers and reductions will be sought. Expenses waived by Adviser and Custodian reduction were: .23% and 0% for 2013; .27% and 0% for 2012; .26% and 0% for 2011; .46% and 0% for 2010; and .53% and .08% for 2009, respectively. |
| (b) | | Rounds to less than $0.01. |
The accompanying notes are an integral part of the financial statements.
24
DUPREE MUTUAL FUNDS — NORTH CAROLINA TAX-FREE INCOME SERIES
SCHEDULE OF PORTFOLIO INVESTMENTS
North Carolina Municipal Bonds — 100% of Net Assets
June 30, 2013
| | | | | | | | | | | | | | | | | | |
| Bond Description | | Coupon | | | Maturity
Date | | | Rating# | | Par Value | | | Fair Value | |
| MUNICIPAL UTILITY REVENUE BONDS | | | | | | | | | | | | | | | | | | |
| 20.52% of Net Assets | | | | | | | | | | | | | | | | | | |
Asheville NC Water System Revenue Bonds | | | 4.750 | % | | | 08/01/2027 | | | Aa2/AA* | | $ | 1,000,000 | | | $ | 1,074,070 | |
Beaufort NC Limited Obligation | | | 5.000 | | | | 06/01/2025 | | | A1 | | | 500,000 | | | | 555,435 | |
Charlotte NC Water and Sewer Systems Revenue | | | 4.500 | | | | 07/01/2028 | | | Aaa/AAA*/AAA@ | | | 750,000 | | | | 793,658 | |
Mooresville NC Certificates of Participation | | | 5.000 | | | | 09/01/2032 | | | AA-* | | | 1,890,000 | | | | 1,969,286 | |
Moore County NC | | | 5.000 | | | | 06/01/2031 | | | Aa3/AA-* | | | 2,750,000 | | | | 2,945,745 | |
NC Eastern Municipal Power Agency Power System Revenue | | | 5.000 | | | | 01/01/2021 | | | /A-*A-@ | | | 1,000,000 | | | | 1,087,390 | |
NC Eastern Municipal Power Agency Power System Revenue | | | 6.000 | | | | 01/01/2025 | | | Baa1/A*/A-@ | | | 1,000,000 | | | | 1,234,080 | |
NC Eastern Municipal Power Agency Power System Revenue | | | 6.000 | | | | 01/01/2018 | | | Baa1 | | | 1,000,000 | | | | 1,180,610 | |
NC Eastern Municipal Power Agency Series B | | | 6.000 | | | | 01/01/2022 | | | A3/AA-*/AA-@ | | | 915,000 | | | | 1,109,062 | |
NC Municipal Power Agency Number 1 Catawba Electric Revenue | | | 4.750 | | | | 01/01/2030 | | | A2/A*/A@ | | | 290,000 | | | | 302,989 | |
NC Municipal Power Agency Number 1 Catawba Electric Revenue | | | 5.000 | | | | 01/01/2030 | | | A2/A*/A@ | | | 2,545,000 | | | | 2,695,486 | |
NC State Municipal Power Agency #1 Catawba Electric RevenueSeries B | | | 5.000 | | | | 01/01/2031 | | | A2/A*/A@ | | | 900,000 | | | | 967,725 | |
Wilmington NC Store Water Revenue Bonds | | | 5.000 | | | | 06/01/2028 | | | Aa2/AA* | | | 500,000 | | | | 544,100 | |
Wilson NC Certificates of Participation Public Facilities | | | 5.000 | | | | 05/01/2021 | | | A1/AA-* | | | 780,000 | | | | 847,103 | |
Wilson NC Certificates of Participation Public Facilities | | | 5.000 | | | | 05/01/2025 | | | A1/AA-* | | | 750,000 | | | | 796,455 | |
Wilson County Certificates ofParticipation Public Facilities | | | 5.000 | | | | 05/01/2029 | | | A1/AA-* | | | 1,355,000 | | | | 1,414,512 | |
| | | | | | | | | | | | | | | | | | |
| | | | | | | | | | | | | | | | | 19,517,705 | |
| UNIVERSITY CONSOLIDATED EDUCATION AND BUILDING REVENUE BONDS | | | | | | | | | | | |
| 16.96% of Net Assets | | | | | | | | | | | | | | | | | | |
Iredell County NC Community College | | | 5.000 | | | | 04/01/2026 | | | Aa2/AA*/AA+@ | | | 225,000 | | | | 253,523 | |
Iredell County NC Community College | | | 5.000 | | | | 04/01/2027 | | | Aa2/AA*/AA+@ | | | 325,000 | | | | 363,236 | |
NC Capital Facilites Financial Agency Education Wake Forest | | | 5.000 | | | | 01/01/2031 | | | Aa3/AA* | | | 500,000 | | | | 547,500 | |
NC Capital Facilities FinanceAgency Wake Forest University | | | 5.000 | | | | 01/01/2038 | | | Aa3/AA* | | | 1,250,000 | | | | 1,338,663 | |
NC Capital Facilities Financial Agency Revenue Duke University | | | 5.000 | | | | 10/01/2038 | | | Aa1/AA+* | | | 500,000 | | | | 553,895 | |
NC State Capital Facilities Davidson College | | | 5.000 | | | | 03/01/2032 | | | AA+* | | | 810,000 | | | | 899,554 | |
NC State University at Raleigh | | | 5.000 | | | | 10/01/2042 | | | Aa1/AA* | | | 750,000 | | | | 813,870 | |
Pitt County NC Limited Obligation Series A | | | 5.000 | | | | 04/01/2035 | | | Aa3/AA-*/AA@ | | | 105,000 | | | | 111,285 | |
University NC Chapel Hill Revenue Bonds General Refunding | | | 5.000 | | | | 12/01/2034 | | | Aaa/AA+*/AAA@ | | | 1,000,000 | | | | 1,069,670 | |
University NC University Revenues UNC Chapel Hill | | | 5.000 | | | | 12/01/2031 | | | Aaa/AA+*/AAA@ | | | 1,215,000 | | | | 1,336,658 | |
University of NC at CharlotteSeries A | | | 5.000 | | | | 04/01/2029 | | | Aa3/AA-* | | | 1,000,000 | | | | 1,105,900 | |
University of NC at CharlotteSeries A | | | 5.000 | | | | 04/01/2031 | | | Aa3/AA-* | | | 750,000 | | | | 820,568 | |
University of NC Greensboro | | | 5.000 | | | | 04/01/2031 | | | Aa3/A+* | | | 500,000 | | | | 541,215 | |
University NC System Pool Revenue Series A | | | 5.000 | | | | 10/01/2033 | | | Aa3/A+* | | | 430,000 | | | | 459,799 | |
University of NC System Pool Revenue Series A | | | 5.000 | | | | 10/01/2026 | | | A1 | | | 1,000,000 | | | | 1,093,520 | |
University of NC System Pool Revenue Series A | | | 5.000 | | | | 10/01/2033 | | | A1 | | | 1,000,000 | | | | 1,057,140 | |
University of NC System Pool Revenue General Trust Indenture | | | 5.000 | | | | 10/01/2034 | | | Aa2 | | | 1,950,000 | | | | 2,111,870 | |
University of NC Wilmington Certificates of Participation | | | 5.250 | | | | 06/01/2025 | | | A* | | | 1,000,000 | | | | 1,046,540 | |
University of NC Wilmington Student Housing Project | | | 5.000 | | | | 06/01/2025 | | | A* | | | 580,000 | | | | 613,072 | |
| | | | | | | | | | | | | | | | | | |
| | | | | | | | | | | | | | | | | 16,137,476 | |
| SCHOOL IMPROVEMENT BONDS | | | | | | | | | | | | | | | | | | |
| 16.91% of Net Assets | | | | | | | | | | | | | | | | | | |
Burke County NC Certificates of Participation | | | 5.000 | | | | 04/01/2023 | | | A1/A* | | | 1,000,000 | | | | 1,060,430 | |
Cabarrus County NC Certificates of Participation Installment | | | 5.000 | | | | 06/01/2025 | | | Aa2/AA*/AA@ | | | 1,000,000 | | | | 1,123,540 | |
Cabarrus County NC Certificates of Participation | | | 5.000 | | | | 01/01/2029 | | | Aa2/AA*/AA@ | | | 750,000 | | | | 810,210 | |
Davie County NC Public Schooland Community College Facility | | | 5.000 | | | | 06/01/2023 | | | Aa3/A+* | | | 1,000,000 | | | | 1,075,940 | |
Davie County NC Public Schooland Community College Facility | | | 5.000 | | | | 06/01/2025 | | | Aa3/A+* | | | 1,690,000 | | | | 1,802,013 | |
Forsyth County NC Certificatesof Participation | | | 5.000 | | | | 02/01/2026 | | | Aa1/AA+*/AA+@ | | | 550,000 | | | | 574,739 | |
Franklin County NC Certificates of Participation | | | 5.000 | | | | 09/01/2027 | | | Aa3/A+* | | | 750,000 | | | | 805,373 | |
Harnett County NC Certificatesof Participation | | | 5.000 | | | | 06/01/2027 | | | A1/AA-* | | | 300,000 | | | | 322,554 | |
Iredell County NC Certificates of Participation School Project | | | 5.000 | | | | 06/01/2024 | | | Aa3/AA-* | | | 1,000,000 | | | | 1,092,560 | |
Lee County NC Certificates ofParticipation | | | 5.000 | | | | 04/01/2025 | | | Aa3/AA-* | | | 550,000 | | | | 595,106 | |
Mecklenburg County NC Certificates of Participation Series A | | | 5.000 | | | | 02/01/2028 | | | Aa1/AA+*/AA+@ | | | 415,000 | | | | 445,482 | |
Montgomery County NC Certificates of Participation Series A | | | 5.000 | | | | 02/01/2030 | | | A-* | | | 1,680,000 | | | | 1,728,821 | |
Nash County NC Limited Obligation | | | 5.000 | | | | 10/01/2030 | | | Aa3/AA-* | | | 2,045,000 | | | | 2,212,751 | |
The accompanying footnotes are an integral part of the financial statements.
25
DUPREE MUTUAL FUNDS — NORTH CAROLINA TAX-FREE INCOME SERIES
SCHEDULE OF PORTFOLIO INVESTMENTS
North Carolina Municipal Bonds — 100% of Net Assets
June 30, 2013
| | | | | | | | | | | | | | | | | | |
| Bond Description | | Coupon | | | Maturity
Date | | | Rating# | | Par Value | | | Fair Value | |
Sampson County NC Certificatesof Participation | | | 5.000 | % | | | 06/01/2022 | | | A2/AA-* | | $ | 1,250,000 | | | $ | 1,368,563 | |
Sampson County NC Certificatesof Participation | | | 5.000 | | | | 06/01/2026 | | | A2/AA-* | | | 1,000,000 | | | | 1,063,220 | |
| | | | | | | | | | | | | | | | | | |
| | | | | | | | | | | | | | | | | 16,081,301 | |
| HOSPITAL AND HEALTHCARE | | | | | | | | | | | | | | | | | | |
| 9.55% of Net Assets | | | | | | | | | | | | | | | | | | |
Charlotte Mecklenburg NC Hospital Authority Health Care | | | 5.000 | | | | 01/15/2031 | | | Aa3/AA-* | | | 450,000 | | | | 468,968 | |
Charlotte Mecklenburg Hospital Authority NC Health Care | | | 5.000 | | | | 01/15/2027 | | | Aa3/AA-* | | | 1,090,000 | | | | 1,160,054 | |
Charlotte-Mecklenburg Hospital | | | 5.250 | | | | 01/15/2039 | | | Aa3/AA-* | | | 750,000 | | | | 795,825 | |
Johnston NC Memorial HospitalAuthority | | | 5.250 | | | | 10/01/2028 | | | A2/AA-* | | | 500,000 | | | | 530,810 | |
NC Medical Care Community Hospital Revenue-Stanly Hospital | | | 5.375 | | | | 10/01/2014 | | | BBB+@ | | | 10,000 | | | | 10,027 | |
NC Medical Care Community Hospital Revenue NC Baptist Hospital | | | 5.000 | | | | 06/01/2034 | | | A1/AA-* | | | 1,100,000 | | | | 1,137,664 | |
NC Medical Care Commission Hospital Revenue NC Baptist Hospital | | | 5.250 | | | | 06/01/2029 | | | A1/AA-* | | | 645,000 | | | | 695,349 | |
NC Medical Care Community Hospital Revenue Baptist Hospital | | | 4.750 | | | | 06/01/2030 | | | A1/AA-* | | | 405,000 | | | | 415,315 | |
NC Medical Care Community Health Care Facilities Revenue | | | 5.000 | | | | 06/01/2034 | | | Aa2/AA*/AA@ | | | 1,670,000 | | | | 1,769,916 | |
NC State Medical Care Commission Health Care Facilities | | | 5.000 | | | | 07/01/2030 | | | A1/A+*/A+@ | | | 500,000 | | | | 525,925 | |
NC State Medical Care Commission Duke University Health | | | 5.000 | | | | 06/01/2035 | | | Aa2/AA*/AA@ | | | 500,000 | | | | 528,740 | |
NC State Medical Care Commission Wake Forest Baptist Hospital | | | 5.000 | | | | 12/01/2033 | | | A1/AA-* | | | 1,000,000 | | | | 1,046,640 | |
| | | | | | | | | | | | | | | | | | |
| | | | | | | | | | | | | | | | | 9,085,233 | |
| REFUNDING BONDS | | | | | | | | | | | | | | | | | | |
| 9.08% of Net Assets | | | | | | | | | | | | | | | | | | |
Bladen County NC Limited Obligation Refunding | | | 4.500 | | | | 06/01/2036 | | | A1 | | | 750,000 | | | | 759,885 | |
Charolotte NC Certificates ofParticipation | | | 5.000 | | | | 06/01/2033 | | | Aa2/AA+*/AA+@ | | | 340,000 | | | | 360,179 | |
Charlotte NC Certificates of Participation Convention Facilities | | | 5.000 | | | | 12/01/2024 | | | Aa2/AA+*/AA@ | | | 1,000,000 | | | | 1,082,280 | |
Charlotte NC Certificates of Participation | | | 5.000 | | | | 06/01/2026 | | | Aa2/AA+*/AA+@ | | | 1,455,000 | | | | 1,604,792 | |
Charlotte NC Certificates of Participation | | | 5.000 | | | | 06/01/2027 | | | Aa2/AA+*/AA+@ | | | 775,000 | | | | 846,199 | |
Dare County NC Limited Obligation Refunding Series D | | | 5.000 | | | | 06/01/2029 | | | Aa3/AA-*/AA-@ | | | 100,000 | | | | 109,404 | |
Johnston County NC Installment Financing Contract | | | 5.000 | | | | 10/15/2027 | | | Aa3/AA* | | | 570,000 | | | | 623,078 | |
New Hanover County NC LimitedObligation | | | 5.000 | | | | 12/01/2027 | | | Aa1/AA+* | | | 505,000 | | | | 567,943 | |
Pender County Limited Obligation Refunding | | | 4.500 | | | | 06/01/2036 | | | Aa3 | | | 500,000 | | | | 508,075 | |
Pitt County NC Certificates of Participation | | | 5.000 | | | | 04/01/2027 | | | Aa3/AA-*/AA@ | | | 500,000 | | | | 549,400 | |
Thomasville NC Combined Enterprise System Revenue | | | 4.750 | | | | 05/01/2028 | | | A1/AA-* | | | 435,000 | | | | 465,428 | |
Union County NC Limited Obligation Refunding | | | 5.000 | | | | 12/01/2024 | | | Aa2/AA-*/AA@ | | | 125,000 | | | | 146,386 | |
Wilson County NC Limited Obligation | | | 4.500 | | | | 06/01/2036 | | | Aa3 | | | 1,000,000 | | | | 1,018,380 | |
| | | | | | | | | | | | | | | | | | |
| | | | | | | | | | | | | | | | | 8,641,431 | |
| PUBLIC FACILITIES REVENUE BONDS | | | | | | | | | | | | | | | | | | |
| 8.64% of Net Assets | | | | | | | | | | | | | | | | | | |
Charlotte NC Certificiates ofParticipation Transit Project | | | 5.000 | | | | 06/01/2035 | | | Aa2/AA+*/AA+@ | | | 500,000 | | | | 522,475 | |
Charlotte NC Certificates of Participation Convention Facilities | | | 5.000 | | | | 06/01/2034 | | | Aa2/AA+*/AA@ | | | 900,000 | | | | 948,006 | |
Chatham County NC Limited Obligation | | | 4.500 | | | | 06/01/2033 | | | Aa3/AA* | | | 815,000 | | | | 853,892 | |
Forsyth County Limited Tax | | | 5.000 | | | | 04/01/2031 | | | Aa1/AA+*/AA+@ | | | 335,000 | | | | 360,038 | |
Jacksonville Public Facilities Corporation Limited Obligation | | | 5.000 | | | | 04/01/2031 | | | A1/A+@ | | | 265,000 | | | | 281,782 | |
Jacksonville Public Facilities Corporation Limited Obligation | | | 5.000 | | | | 04/01/2032 | | | A1/A+@ | | | 100,000 | | | | 105,731 | |
Mecklenburg County NC Certificates of Participation Series B | | | 5.000 | | | | 02/01/2026 | | | Aa1/AA+*/AA+@ | | | 1,000,000 | | | | 1,092,800 | |
NC Infrastructure Finance Corporation Certificates of Participation | | | 5.000 | | | | 02/01/2025 | | | Aa1/AA+*/AA+@ | | | 200,000 | | | | 211,390 | |
Rockingham County NC Certificates of Participation | | | 5.000 | | | | 04/01/2032 | | | Aa3/AA-* | | | 1,325,000 | | | | 1,364,445 | |
Wake County NC Limited Obligation Bonds Series 209 | | | 5.000 | | | | 06/01/2032 | | | Aa1/AA+*/AA+@ | | | 1,500,000 | | | | 1,663,425 | |
Watauga NC Public Facilities Corporation Limited Obligation | | | 5.000 | | | | 06/01/2027 | | | Aa3/AA-* | | | 750,000 | | | | 819,345 | |
| | | | | | | | | | | | | | | | | | |
| | | | | | | | | | | | | | | | | 8,223,329 | |
| MISCELLANEOUS PUBLIC IMPROVEMENT BONDS | | | | | | | | | | | | | | | | | | |
| 6.49% of Net Assets | | | | | | | | | | | | | | | | | | |
Buncombe County Limited Obligation | | | 5.000 | | | | 06/01/2030 | | | Aa2/AA+* | | | 1,000,000 | | | | 1,099,620 | |
Buncombe County NC Limited Obligation | | | 5.000 | | | | 06/01/2032 | | | Aa2/AA+* | | | 250,000 | | | | 272,520 | |
Charlotte NC Certificates of Participation | | | 5.000 | | | | 12/01/2029 | | | Aa1/AA+* | | | 340,000 | | | | 374,058 | |
NC Infrastructure Finance Corporation Certificates of Participation | | | 5.000 | | | | 02/01/2024 | | | Aa1/AA+*/AA+@ | | | 1,000,000 | | | | 1,104,920 | |
Orange County NC Public Facilities Company Limited Obligation | | | 4.750 | | | | 10/01/2032 | | | Aa2/AA+*/AA+@ | | | 750,000 | | | | 789,563 | |
Wilmington NC Certificates ofParticipation | | | 5.000 | | | | 06/01/2032 | | | Aa2/AA*/AA@ | | | 1,500,000 | | | | 1,565,415 | |
The accompanying footnotes are an integral part of the financial statements.
26
DUPREE MUTUAL FUNDS — NORTH CAROLINA TAX-FREE INCOME SERIES
SCHEDULE OF PORTFOLIO INVESTMENTS
North Carolina Municipal Bonds — 100% of Net Assets
June 30, 2013
| | | | | | | | | | | | | | | | | | |
| Bond Description | | Coupon | | | Maturity
Date | | | Rating# | | Par Value | | | Fair Value | |
Wilmington NC Certificates ofParticipation Series A | | | 5.000 | % | | | 06/01/2038 | | | Aa2/AA*/AA@ | | $ | 250,000 | | | $ | 268,110 | |
Winston Salem NC Certificatesof Participation Series A | | | 4.750 | | | | 06/01/2031 | | | Aa1/AA+*/AA+@ | | | 670,000 | | | | 696,103 | |
| | | | | | | | | | | | | | | | | | |
| | | | | | | | | | | | | | | | | 6,170,309 | |
| AIRPORT BONDS | | | | | | | | | | | | | | | | | | |
| 4.64% of Net Assets | | | | | | | | | | | | | | | | | | |
Charlotte NC Airport Revenue | | | 5.250 | | | | 07/01/2023 | | | Aa3/A+*/A+@ | | | 1,000,000 | | | | 1,036,060 | |
Charlotte NC Airport Revenue Bonds Refunding Charlotte Douglas International | | | 5.000 | | | | 07/01/2025 | | | Aa3/A+*/A+@ | | | 1,000,000 | | | | 1,097,590 | |
Raleigh Durham NC Airport | | | 5.000 | | | | 05/01/2029 | | | Aa3/AA-@ | | | 235,000 | | | | 253,010 | |
Raleigh Durham NC Airport | | | 5.000 | | | | 05/01/2036 | | | Aa3/AA-@ | | | 1,480,000 | | | | 1,564,108 | |
Raleigh Durham NC Airport | | | 5.000 | | | | 05/01/2032 | | | Aa3/AA-@ | | | 440,000 | | | | 467,711 | |
| | | | | | | | | | | | | | | | | | |
| | | | | | | | | | | | | | | | | 4,418,480 | |
| PREREFUNDED BONDS | | | | | | | | | | | | | | | | | | |
| 4.14% of Net Assets | | | | | | | | | | | | | | | | | | |
Henderson County NC Certificates of Participation | | | 5.000 | | | | 05/01/2025 | | | Aa3/AA-*/AA-@ | | | 250,000 | | | | 270,163 | |
NC Medical Care Community Hospital Morehead Memorial Hospital | | | 5.000 | | | | 11/01/2026 | | | A2/AA-* | | | 1,500,000 | | | | 1,620,405 | |
NC Eastern Municipal Power Agency Power System Series A | | | 6.000 | | | | 01/01/2026 | | | A-* | | | 275,000 | | | | 350,779 | |
Raleigh NC Combined Enterprise System | | | 5.000 | | | | 03/01/2031 | | | Aa1/AAA*/AAA@ | | | 500,000 | | | | 555,745 | |
Randolph County NC Certificates of Participation | | | 5.000 | | | | 02/01/2027 | | | Aa3 | | | 1,000,000 | | | | 1,139,620 | |
| | | | | | | | | | | | | | | | | | |
| | | | | | | | | | | | | | | | | 3,936,712 | |
| TURNPIKES/TOLLROAD/HIGHWAY BONDS | | | | | | | | | | | | | | | | | | |
| 2.15% of Net Assets | | | | | | | | | | | | | | | | | | |
NC State Turnpike Monroe Connector System | | | 5.000 | | | | 07/01/2029 | | | Aa2/AA* | | | 500,000 | | | | 546,870 | |
NC State Turnpike Authority Monroe Connector System | | | 5.000 | | | | 07/01/2031 | | | Aa2/AA* | | | 1,385,000 | | | | 1,500,814 | |
| | | | | | | | | | | | | | | | | | |
| | | | | | | | | | | | | | | | | 2,047,684 | |
| | | | | | | | | | | | | | | | | | |
Total Investments 99.08% of Net Assets (cost $91,984,289)(See (a) below for further explanation) | | | | | | | | | $ | 94,259,659 | |
| | | | | | | | | | | | | | | | | | |
| Other assets in excess of liabilities .92% | | | | | | | | | | | | | | | | | 867,043 | |
| | | | | | | | | | | | | | | | | | |
| Net Assets 100% | | | | | | | | | | | | | | | | $ | 95,126,702 | |
| | | | | | | | | | | | | | | | | | |
| | * | | Standard and Poor’s Corporation |
| | @ | | Fitch’s Investors Service |
| | | | (All other ratings by Moody’s Investors Service, Inc.) |
| | # | | Bond ratings are unaudited and not covered by Report of Independent Registered Public Accounting Firm. |
| (a) | | Cost for federal income tax purposes is $91,981,956 and net unrealized appreciation of investments is as follows: |
| | | | | | |
| | Unrealized appreciation | | $ | 3,523,712 | |
| | Unrealized depreciation | | | (1,246,009 | ) |
| | | | | | |
| | Net unrealized appreciation | | $ | 2,277,703 | |
| | | | | | |
Other Information
The following is a summary of the inputs used, as of June 30, 2013 involving the Fund’s investments in securities carried at fair value. The inputs or methodology used for valuing securities may not be an indication of the risk associated with investing in those securities. For more information on valuation inputs, and their aggregation into the levels used in the table below, please refer to the Security Valuation section in the accompanying Notes to Financial Statements.
| | | | | | |
| | | Valuation Inputs | | Municipal Bonds | |
Level 1 | | Quoted Prices | | $ | — | |
Level 2 | | Other Significant Observable Inputs | | | 94,259,659 | |
Level 3 | | Significant Unobservable Inputs | | | — | |
| | | | | | |
| | | | $ | 94,259,659 | |
| | | | | | |
The accompanying footnotes are an integral part of the financial statements.
27
NORTH CAROLINA TAX-FREE INCOME SERIES
STATEMENT OF ASSETS AND LIABILITIES
June 30, 2013
| | | | | | | | |
ASSETS: | | | | | | | | |
Investments in securities, at fair value (Cost: $91,984,289) | | | | | | $ | 94,259,659 | |
Cash | | | | | | | 319,503 | |
Interest receivable | | | | | | | 1,081,098 | |
| | | | | | | | |
Total assets | | | | | | | 95,660,260 | |
LIABILITIES: | | | | | | | | |
Payable for: | | | | | | | | |
Distributions to shareholders | | | 278,725 | | | | | |
Fund shares redeemed | | | 186,354 | | | | | |
Investment advisory fee | | | 41,549 | | | | | |
Transfer agent fee | | | 21,132 | | | | | |
Accrued expenses | | | 5,798 | | | | | |
| | | | | | | | |
Total liabilities | | | | | | | 533,558 | |
| | | | | | | | |
NET ASSETS: | | | | | | | | |
Capital | | | | | | | 92,736,178 | |
Accumulated net investment income | | | | | | | 2,333 | |
Net accumulated realized gain on investment transactions | | | | | | | 112,821 | |
Net unrealized appreciation in value of investments | | | | | | | 2,275,370 | |
| | | | | | | | |
Net assets at value | | | | | | $ | 95,126,702 | |
| | | | | | | | |
NET ASSET VALUE, offering price and redemption price per share
($95,126,702 -:- 8,410,059 shares outstanding; unlimited number of shares authorized; no par value) | | | | | | $ | 11.31 | |
| | | | | | | | |
STATEMENT OF OPERATIONS
For the year ended June 30, 2013
| | | | |
Net investment income: | | | | |
Interest income | | $ | 3,725,881 | |
| | | | |
Expenses: | | | | |
Investment advisory fee | | | 492,008 | |
Transfer agent fee | | | 128,527 | |
Custodian expense | | | 17,733 | |
Professional fees | | | 19,869 | |
Other expenses | | | 42,947 | |
| | | | |
Total expenses | | | 701,084 | |
Custodian expense reduction | | | (548 | ) |
| | | | |
Net expenses | | | 700,536 | |
| | | | |
Net investment income | | | 3,025,345 | |
| | | | |
Realized and unrealized gain on investments: | | | | |
Net realized gain | | | 112,821 | |
Net change in unrealized appreciation/depreciation | | | (2,631,334 | ) |
| | | | |
Net realized and unrealized loss on investments | | | (2,518,513 | ) |
| | | | |
Net increase in net assets resulting from operations | | $ | 506,832 | |
| | | | |
The accompanying notes are an integral part of the financial statements.
28
NORTH CAROLINA TAX-FREE INCOME SERIES
STATEMENTS OF CHANGES IN NET ASSETS
For the years ended June 30, 2013 and 2012
| | | | | | | | |
| | | 2013 | | | 2012 | |
Operations: | | | | | | | | |
Net investment income | | $ | 3,025,345 | | | $ | 2,784,328 | |
Net realized gain on investments | | | 112,821 | | | | 270,575 | |
Net change in unrealized appreciation/depreciation | | | (2,631,334 | ) | | | 4,314,029 | |
| | | | | | | | |
Net increase in net assets resulting from operations | | | 506,832 | | | | 7,368,932 | |
Distributions from net investment income | | | (3,026,417 | ) | | | — | |
Capital gains distributed to shareholders | | | (131,685 | ) | | | (2,780,923 | ) |
Net fund share transactions (Note 4) | | | 9,474,078 | | | | 8,404,077 | |
| | | | | | | | |
Total increase | | | 6,822,808 | | | | 12,992,086 | |
Net assets: | | | | | | | | |
Beginning of year | | | 88,303,894 | | | | 75,311,808 | |
| | | | | | | | |
End of year | | $ | 95,126,702 | | | $ | 88,303,894 | |
| | | | | | | | |
Accumulated Net Investment Income | | $ | 2,333 | | | $ | 3,405 | |
| | | | | | | | |
FINANCIAL HIGHLIGHTS
| | | | | | | | | | | | | | | | | | | | |
| Selected data for a share outstanding: | | For the years ended June 30, | |
| | | 2013 | | | 2012 | | | 2011 | | | 2010 | | | 2009 | |
Net asset value, beginning of year | | | $11.59 | | | | $10.92 | | | | $11.01 | | | | $10.71 | | | | $10.62 | |
| | | | | | | | | | | | | | | | | | | | |
Income from investment operations: | | | | | | | | | | | | | | | | | | | | |
Net investment income | | | 0.36 | | | | 0.39 | | | | 0.40 | | | | 0.40 | | | | 0.41 | |
Net gains/(losses) on securities, both realized and unrealized | | | (0.26 | ) | | | 0.67 | | | | (0.09 | ) | | | 0.30 | | | | 0.09 | |
| | | | | | | | | | | | | | | | | | | | |
Total from investment operations | | | 0.10 | | | | 1.06 | | | | 0.31 | | | | 0.70 | | | | 0.50 | |
Less distributions: | | | | | | | | | | | | | | | | | | | | |
Distributions from net investment income | | | (0.36 | ) | | | (0.39 | ) | | | (0.40 | ) | | | (0.40 | ) | | | (0.41 | ) |
Distributions from capital gains | | | (0.02 | ) | | | — | | | | — | | | | — | | | | — | |
| | | | | | | | | | | | | | | | | | | | |
Total distributions | | | (0.38 | ) | | | (0.39 | ) | | | (0.40 | ) | | | (0.40 | ) | | | (0.41 | ) |
| | | | | | | | | | | | | | | | | | | | |
Net asset value, end of period | | | $11.31 | | | | $11.59 | | | | $10.92 | | | | $11.01 | | | | $10.71 | |
| | | | | | | | | | | | | | | | | | | | |
Total return | | | 0.76% | | | | 9.87% | | | | 2.90% | | | | 6.62% | | | | 4.83% | |
Net assets, end of period (in thousands) | | | $95,127 | | | | $88,304 | | | | $75,312 | | | | $77,116 | | | | $66,891 | |
Ratio of net expenses to average net assets (a) | | | 0.71% | | | | 0.71% | | | | 0.70% | | | | 0.72% | | | | 0.72% | |
Ratio of net investment income to average net assets | | | 3.07% | | | | 3.46% | | | | 3.69% | | | | 3.66% | | | | 3.89% | |
Portfolio turnover | | | 3.59% | | | | 5.94% | | | | 14.16% | | | | 5.92% | | | | 7.82% | |
| (a) | | Percentages are after Custodian reduction for which no recovery will be sought. Percentages before Custodian reduction were: .71 for 2013; .71% for 2012; .70% for 2011; ..72% for 2010; and .72% for 2009. |
The accompanying notes are an integral part of the financial statements.
29
DUPREE MUTUAL FUNDS — NORTH CAROLINA TAX-FREE SHORT-TO-MEDIUM SERIES
SCHEDULE OF PORTFOLIO INVESTMENTS
North Carolina Municipal Bonds — 100% of Net Assets
June 30, 2013
| | | | | | | | | | | | | | | | | | |
| Bond Description | | Coupon | | | Maturity
Date | | | Rating# | | Par Value | | | Fair Value | |
| SCHOOL IMPROVEMENT BONDS | | | | | | | | | | | | | | | | | | |
| 20.21% of Net Assets | | | | | | | | | | | | | | | | | | |
Nash County NC Limited Obligation | | | 3.000 | % | | | 10/01/2015 | | | Aa3/AA-* | | $ | 400,000 | | | $ | 420,204 | |
Nash County NC Limited Obligation | | | 5.000 | | | | 10/01/2018 | | | Aa3/AA-* | | | 150,000 | | | | 174,713 | |
Buncombe County NC Certificates of Participation | | | 4.000 | | | | 04/01/2016 | | | Aa2/AA+* | | | 125,000 | | | | 134,608 | |
Burke County NC Certificates of Participation | | | 5.000 | | | | 04/01/2020 | | | A1/A* | | | 180,000 | | | | 192,362 | |
Burke County NC Certificates of Participation | | | 4.250 | | | | 04/01/2016 | | | A1/A* | | | 50,000 | | | | 53,603 | |
Cabarrus County NC Certificates of Participation | | | 4.250 | | | | 06/01/2017 | | | Aa2/AA*/AA@ | | | 175,000 | | | | 193,417 | |
Cabarrus County NC Certificates of Participation | | | 4.000 | | | | 01/01/2015 | | | Aa2/AA*/AA@ | | | 225,000 | | | | 235,530 | |
Cabarrus County NC Certificates of Participation | | | 5.000 | | | | 01/01/2017 | | | Aa2/AA*/AA@ | | | 150,000 | | | | 168,041 | |
Cabarrus County NC Certificates of Participation | | | 5.000 | | | | 01/01/2019 | | | Aa2/AA*/AA@ | | | 100,000 | | | | 115,800 | |
Cabarrus County NC Certificates of Participation | | | 5.000 | | | | 01/01/2021 | | | Aa2/AA*/AA@ | | | 200,000 | | | | 228,122 | |
Catawba County NC Certificates of Participation | | | 5.250 | | | | 06/01/2019 | | | Aa2/A* | | | 200,000 | | | | 214,928 | |
Harnett County NC Certificates of Participation | | | 5.000 | | | | 12/01/2015 | | | A1/AA-* | | | 125,000 | | | | 137,456 | |
Harnett County NC Certificates of Participation | | | 5.000 | | | | 12/01/2021 | | | A1/AA-* | | | 200,000 | | | | 223,128 | |
Harnett County Certificates of Participation | | | 3.500 | | | | 06/01/2016 | | | A1/AA-* | | | 250,000 | | | | 266,030 | |
Henderson County NC Certificates of Participation | | | 5.000 | | | | 06/01/2014 | | | Aa3/AA-*/AA-@ | | | 50,000 | | | | 52,022 | |
Iredell County NC Certificates of Participation School Project | | | 5.000 | | | | 06/01/2018 | | | Aa3/AA-* | | | 425,000 | | | | 468,435 | |
Lincoln County NC Certificates of Participation | | | 5.000 | | | | 06/01/2016 | | | A1/AA-*/AA-@ | | | 200,000 | | | | 222,268 | |
Montgomery County NC Certificates of Participation | | | 5.000 | | | | 02/01/2017 | | | A-* | | | 125,000 | | | | 138,390 | |
Onslow County NC Certificates of Participation | | | 5.000 | | | | 06/01/2018 | | | Aa3/A+* | | | 140,000 | | | | 153,252 | |
Pitt County NC Certificates of Participation School Facility | | | 4.000 | | | | 04/01/2015 | | | Aa3/AA-*/AA@ | | | 100,000 | | | | 105,413 | |
Rutherford County NC Certificates of Participation | | | 5.000 | | | | 12/01/2017 | | | A1/AA-* | | | 105,000 | | | | 120,627 | |
Rutherford County NC Certificates of Participation | | | 5.000 | | | | 12/01/2018 | | | A1/AA-* | | | 205,000 | | | | 232,593 | |
Rutherford NC Certificates of Participation | | | 4.000 | | | | 12/01/2019 | | | A1/AA-* | | | 200,000 | | | | 216,150 | |
Rutherford County NC Certificates of Participation | | | 5.000 | | | | 12/01/2020 | | | A1/AA-* | | | 100,000 | | | | 112,147 | |
Sampson County NC Certificates of Participation | | | 5.000 | | | | 06/01/2014 | | | A2/AA-* | | | 50,000 | | | | 52,036 | |
Sampson County NC Certificates of Participation | | | 5.000 | | | | 06/01/2020 | | | A2/AA-* | | | 400,000 | | | | 443,640 | |
Edgecombe County NC Schools | | | 4.000 | | | | 02/01/2015 | | | A1/A+* | | | 235,000 | | | | 246,409 | |
| | | | | | | | | | | | | | | | | | |
| | | | | | | | | | | | | | | | | 5,321,324 | |
| MUNICIPAL UTILITY REVENUE BONDS | | | | | | | | | | | | | | | | | | |
| 19.78% of Net Assets | | | | | | | | | | | | | | | | | | |
Monroe NC Certificates of Participation | | | 4.000 | | | | 03/01/2019 | | | Aa3/AA-* | | | 100,000 | | | | 109,384 | |
Mooreville NC Certificates of Participation | | | 4.125 | | | | 09/01/2018 | | | AA-* | | | 250,000 | | | | 270,130 | |
Wilson NC Certificates of Participation | | | 5.000 | | | | 05/01/2016 | | | A1/AA-* | | | 200,000 | | | | 221,464 | |
Wilson NC Certificates of Participation | | | 5.000 | | | | 05/01/2018 | | | A1/AA-* | | | 160,000 | | | | 178,918 | |
Wilson NC Certificates of Participation | | | 5.000 | | | | 05/01/2022 | | | A1/AA-* | | | 350,000 | | | | 378,378 | |
Asheville NC Water System Revenue Refunding | | | 5.000 | | | | 08/01/2017 | | | Aa2/AA* | | | 140,000 | | | | 151,775 | |
Lincolnton NC Enterprise System Revenue | | | 5.000 | | | | 05/01/2016 | | | NR | | | 385,000 | | | | 401,428 | |
Moore County NC | | | 5.000 | | | | 06/01/2017 | | | Aa3/AA-* | | | 685,000 | | | | 774,646 | |
Moore County NC | | | 5.000 | | | | 06/01/2021 | | | Aa3/AA-* | | | 200,000 | | | | 232,852 | |
NC Eastern Municipal Power Agency — Series D | | | 4.000 | | | | 01/01/2016 | | | Baa1/A-*/A-@ | | | 95,000 | | | | 101,699 | |
NC Eastern Municipal Power Agency — Series A | | | 5.000 | | | | 01/01/2016 | | | /A-*A-@ | | | 50,000 | | | | 54,838 | |
NC Eastern Municipal Power Agency | | | 5.000 | | | | 01/01/2020 | | | /A-*A-@ | | | 250,000 | | | | 272,365 | |
NC Eastern Municipal Power Agency | | | 5.250 | | | | 01/01/2019 | | | A3/AA-*/A-@ | | | 550,000 | | | | 626,951 | |
NC Eastern Municipal Power Agency | | | 6.500 | | | | 01/01/2018 | | | Aa3/AA-* | | | 100,000 | | | | 120,313 | |
NC Eastern Municipal Power Agency — Series B | | | 3.250 | | | | 01/01/2015 | | | Baa1/A-*/A-@ | | | 250,000 | | | | 259,548 | |
NC Municipal Power Agency Number 1 Catawba Electric | | | 5.250 | | | | 01/01/2017 | | | A2/A*/A@ | | | 200,000 | | | | 226,052 | |
NC Municipal Power Agency Number 1 Catawba Electric | | | 5.250 | | | | 01/01/2018 | | | A2/A*/A@ | | | 125,000 | | | | 143,828 | |
NC Municipal Power Agency Number 1 Catawba Electric | | | 4.000 | | | | 01/01/2016 | | | A2/A*/A@ | | | 100,000 | | | | 107,155 | |
NC Municipal Power Agency Number 1 Catawba Electric | | | 5.000 | | | | 01/01/2021 | | | A2/A*/A@ | | | 250,000 | | | | 280,198 | |
NC Municipal Power Agency Number 1 Catawba Electric | | | 5.000 | | | | 01/01/2016 | | | A2/A*/A@ | | | 125,000 | | | | 137,029 | |
Onslow NC Water & Sewer | | | 4.250 | | | | 06/01/2022 | | | Baa1/A+* | | | 150,000 | | | | 159,158 | |
| | | | | | | | | | | | | | | | | | |
| | | | | | | | | | | | | | | | | 5,208,109 | |
| PUBLIC FACILITIES REVENUE BONDS | | | | | | | | | | | | | | | | | | |
| 12.03% of Net Assets | | | | | | | | | | | | | | | | | | |
Cabarrus County NC Certificates of Participation | | | 5.625 | | | | 02/01/2016 | | | Aa2/AA*/AA@ | | | 125,000 | | | | 139,140 | |
Cabarrus County NC Certificates of Participation | | | 5.000 | | | | 06/01/2019 | | | Aa2/AA*/AA@ | | | 420,000 | | | | 483,281 | |
The accompanying footnotes are an integral part of the financial statements.
30
DUPREE MUTUAL FUNDS — NORTH CAROLINA TAX-FREE SHORT-TO-MEDIUM SERIES
SCHEDULE OF PORTFOLIO INVESTMENTS
North Carolina Municipal Bonds — 100% of Net Assets
June 30, 2013
| | | | | | | | | | | | | | | | | | |
| Bond Description | | Coupon | | | Maturity
Date | | | Rating# | | Par Value | | | Fair Value | |
Charlotte NC Certificates of Participation Refunding | | | 5.000 | % | | | 12/01/2021 | | | Aa2/AA+*/AA@ | | $ | 270,000 | | | $ | 292,418 | |
Charlotte NC Certificates of Participation Transit Projects | | | 4.000 | | | | 06/01/2016 | | | Aa2/AA+*/AA+@ | | | 100,000 | | | | 105,312 | |
Craven County NC Certificates of Participation | | | 4.375 | | | | 06/01/2016 | | | Aa3/AA-* | | | 115,000 | | | | 125,428 | |
Durham County NC Certificates of Participation — Series A | | | 5.000 | | | | 06/01/2020 | | | Aa1/AA+* | | | 435,000 | | | | 501,786 | |
Durham County NC Certificates of Participation | | | 5.000 | | | | 06/01/2021 | | | Aa1/AA+* | | | 240,000 | | | | 274,267 | |
Forsyth County NC Certificates of Participation | | | 5.000 | | | | 10/01/2019 | | | Aa1/AA+*/AA+@ | | | 600,000 | | | | 656,772 | |
Lee County NC Certificates of Participation | | | 5.000 | | | | 04/01/2018 | | | Aa3/AA-* | | | 225,000 | | | | 252,266 | |
Mecklenburg County NC Certificates of Participation | | | 5.000 | | | | 02/01/2017 | | | Aa1/AA+*/AA+@ | | | 105,000 | | | | 118,392 | |
Rockingham County NC Certificates of Participation | | | 4.000 | | | | 04/01/2019 | | | Aa3/AA-* | | | 100,000 | | | | 108,559 | |
Wilmington NC Certificates of Participation — Series A | | | 4.200 | | | | 06/01/2019 | | | Aa2/AA*/AA@ | | | 100,000 | | | | 110,170 | |
| | | | | | | | | | | | | | | | | | |
| | | | | | | | | | | | | | | | | 3,167,791 | |
| PREREFUNDED BONDS | | | | | | | | | | | | | | | | | | |
| 11.96% of Net Assets | | | | | | | | | | | | | | | | | | |
Appalachian State University NC Revenue Refunding | | | 5.000 | | | | 07/15/2018 | | | Aa3 | | | 35,000 | | | | 38,121 | |
Brunswick County NC Community College — Series B | | | 4.250 | | | | 05/01/2022 | | | Aa2/AA*/AA@ | | | 125,000 | | | | 139,770 | |
Cabarrus County NC Public Improvement | | | 5.000 | | | | 03/01/2018 | | | Aa1/AA+*/AA+@ | | | 100,000 | | | | 111,093 | |
Catawba County NC Certificates of Participation Public Schools | | | 5.250 | | | | 06/01/2016 | | | Aa2 | | | 125,000 | | | | 130,711 | |
Catawba County NC Certificates of Participation Public Schools | | | 5.250 | | | | 06/01/2018 | | | Aa2 | | | 125,000 | | | | 130,711 | |
Chapel Hill NC Certificates of Participation Operations Center | | | 5.250 | | | | 06/01/2019 | | | Aa1/AA+* | | | 260,000 | | | | 282,945 | |
Henderson County NC Certificates of Participation | | | 5.250 | | | | 05/01/2020 | | | Aa3/AA-*/AA-@ | | | 300,000 | | | | 325,509 | |
NC Medical Care Community Hospital Rowan Medical | | | 5.250 | | | | 09/01/2016 | | | A2/AA-* | | | 1,100,000 | | | | 1,163,001 | |
NC Medical Care Community Healthcare Facilities | | | 4.000 | | | | 10/01/2018 | | | A1/AA-*/AA-@ | | | 50,000 | | | | 52,341 | |
NC Medical Care Duke University Health Systems | | | 3.000 | | | | 06/01/2019 | | | Aa2/AA*/AA@ | | | 150,000 | | | | 157,056 | |
Randolph County NC Certificates of Participation | | | 5.000 | | | | 02/01/2021 | | | Aa3 | | | 100,000 | | | | 110,696 | |
Randolph County NC Certificates of Participation | | | 5.000 | | | | 02/01/2018 | | | Aa3 | | | 200,000 | | | | 227,544 | |
Union County NC Certificates of Participation | | | 5.000 | | | | 06/01/2020 | | | Aa2/AA-* | | | 250,000 | | | | 279,523 | |
| | | | | | | | | | | | | | | | | | |
| | | | | | | | | | | | | | | | | 3,149,021 | |
| REFUNDING BONDS | | | | | | | | | | | | | | | | | | |
| 9.09% of Net Assets | | | | | | | | | | | | | | | | | | |
Bertie County Limited Obligatin | | | 4.000 | | | | 06/01/2022 | | | A1/A* | | | 200,000 | | | | 211,854 | |
Dare County NC Limited Obligation — Series D | | | 4.000 | | | | 06/01/2019 | | | Aa3/AA-*/AA-@ | | | 100,000 | | | | 110,122 | |
Pender County NC Limited Obligation | | | 3.000 | | | | 06/01/2019 | | | Aa3 | | | 220,000 | | | | 230,223 | |
Richmond County NC Limited Obligation Refunding | | | 4.000 | | | | 04/01/2019 | | | A1/A* | | | 225,000 | | | | 246,530 | |
Cumberland County NC Certificates of Participation | | | 5.000 | | | | 12/01/2015 | | | Aa2/AA* | | | 75,000 | | | | 82,302 | |
Cumberland County NC Certificates of Participation | | | 5.000 | | | | 12/01/2017 | | | Aa2/AA* | | | 350,000 | | | | 401,930 | |
Cumberland County NC Certificates of Participation Refunding | | | 3.500 | | | | 12/01/2020 | | | Aa2/AA* | | | 185,000 | | | | 197,730 | |
Haywood NC Certificates of Participation Refunding | | | 5.000 | | | | 10/01/2016 | | | A1/A* | | | 635,000 | | | | 647,789 | |
Sampson Area Development Corporation NC Refunding | | | 4.000 | | | | 06/01/2015 | | | AA-* | | | 150,000 | | | | 159,180 | |
Union County NC Limited Obligation | | | 3.000 | | | | 12/01/2018 | | | Aa2/AA-*/AA@ | | | 100,000 | | | | 105,697 | |
| | | | | | | | | | | | | | | | | | |
| | | | | | | | | | | | | | | | | 2,393,357 | |
| MISCELLANEOUS PUBLIC IMPROVEMENT BONDS | | | | | | | | | | | | | | | | | | |
| 7.38% of Net Assets | | | | | | | | | | | | | | | | | | |
NC State Capital Improvement Obligation — Series A | | | 5.000 | | | | 05/01/2021 | | | Aa1/AA+*/AA+@ | | | 500,000 | | | | 586,030 | |
NC State Capital Improvement Obligation | | | 4.000 | | | | 05/01/2020 | | | Aa1/AA+*/AA+@ | | | 120,000 | | | | 130,384 | |
NC State Capital Improvement Obligation | | | 5.000 | | | | 05/01/2022 | | | Aa1/AA+*/AA+@ | | | 100,000 | | | | 114,422 | |
NC Infrastructure Certificates of Participation | | | 5.000 | | | | 06/01/2018 | | | Aa1/AA+*/AA+@ | | | 100,000 | | | | 110,737 | |
NC Infrastructure Finance Certificates of Participation | | | 5.000 | | | | 02/01/2017 | | | Aa1/AA+*/AA+@ | | | 150,000 | | | | 169,299 | |
NC Infrastructure Finance Corporation Certificates of Participation | | | 5.000 | | | | 02/01/2020 | | | Aa1/AA+*/AA+@ | | | 425,000 | | | | 474,606 | |
Salisbury NC Certificates of Participation | | | 5.000 | | | | 03/01/2019 | | | A1/AA-* | | | 145,000 | | | | 166,128 | |
NC State Public Improvement — Series A | | | 5.000 | | | | 03/01/2019 | | | Aaa/AAA* | | | 15,000 | | | | 15,950 | |
NC State Capital Improvement Obligation Annual Appropriation — Series A | | | 5.000 | | | | 05/01/2022 | | | Aa1/AA+*/AA+@ | | | 155,000 | | | | 175,575 | |
| | | | | | | | | | | | | | | | | | |
| | | | | | | | | | | | | | | | | 1,943,131 | |
| UNIVERSITY CONSOLIDATED EDUCATION AND BUILDING REVENUE BONDS | | | | | | | | | | | |
| 6.67% of Net Assets | | | | | | | | | | | | | | | | | | |
University NC Wilmington Certificates of Participation | | | 5.250 | | | | 06/01/2021 | | | A* | | | 100,000 | | | | 106,497 | |
University NC Wilmington Certificates of Participation | | | 5.000 | | | | 06/01/2014 | | | A* | | | 40,000 | | | | 41,564 | |
The accompanying footnotes are an integral part of the financial statements.
31
DUPREE MUTUAL FUNDS — NORTH CAROLINA TAX-FREE SHORT-TO-MEDIUM SERIES
SCHEDULE OF PORTFOLIO INVESTMENTS
North Carolina Municipal Bonds — 100% of Net Assets
June 30, 2013
| | | | | | | | | | | | | | | | | | |
| Bond Description | | Coupon | | | Maturity
Date | | | Rating# | | Par Value | | | Fair Value | |
University NC Wilmington Certificates of Participation | | | 4.250 | % | | | 06/01/2017 | | | A* | | $ | 300,000 | | | $ | 319,698 | |
University NC Wilmington Certificates of Participation | | | 4.375 | | | | 06/01/2019 | | | A* | | | 100,000 | | | | 105,574 | |
University NC Wilmington Certificates of Participation | | | 4.000 | | | | 06/01/2017 | | | A2/AA-* | | | 100,000 | | | | 108,935 | |
Appalachian State University NC Revenue Refunding | | | 5.000 | | | | 07/15/2018 | | | Aa3 | | | 40,000 | | | | 43,124 | |
University of NC — Series A | | | 4.250 | | | | 10/01/2021 | | | A1 | | | 100,000 | | | | 107,955 | |
University NC System Pool Revenue | | | 5.000 | | | | 10/01/2016 | | | Aa2 | | | 250,000 | | | | 282,063 | |
University NC System Pool Revenue | | | 5.000 | | | | 10/01/2015 | | | Aa3 | | | 350,000 | | | | 382,914 | |
University NC System Pool Revenue Asheville Wilmington | | | 5.000 | | | | 10/01/2016 | | | A1/AA-* | | | 230,000 | | | | 258,550 | |
| | | | | | | | | | | | | | | | | | |
| | | | | | | | | | | | | | | | | 1,756,874 | |
| HOSPITAL AND HEALTHCARE REVENUE BONDS | | | | | | | | | | | | | | | | | | |
| 5.34% of Net Assets | | | | | | | | | | | | | | | | | | |
Charlotte-Mecklenburg NC Hospital Authority Healthcare | | | 5.000 | | | | 01/15/2018 | | | Aa3/AA-* | | | 200,000 | | | | 221,314 | |
Charlotte-Mecklenburg Hospital | | | 5.000 | | | | 01/15/2019 | | | Aa3/AA-* | | | 200,000 | | | | 222,552 | |
Charlotte-Mecklenburg Hospital | | | 4.375 | | | | 01/15/2019 | | | Aa3/AA-* | | | 150,000 | | | | 164,657 | |
Johnston NC Memorial Hospital Authority | | | 4.000 | | | | 04/01/2015 | | | A2/AA-* | | | 100,000 | | | | 104,802 | |
Johnston NC Memorial Hospital Authority Mortgage Revenue | | | 5.000 | | | | 10/01/2018 | | | A2/AA-* | | | 180,000 | | | | 202,471 | |
NC Medical Care — Caromont Health | | | 3.250 | | | | 02/15/2018 | | | A1/AA-* | | | 370,000 | | | | 387,508 | |
NC Medical Care Mission Health Combined Group | | | 4.000 | | | | 10/01/2014 | | | Aa3/AA-*/AA-@ | | | 100,000 | | | | 104,126 | |
| | | | | | | | | | | | | | | | | | |
| | | | | | | | | | | | | | | | | 1,407,430 | |
| AIRPORT BONDS | | | | | | | | | | | | | | | | | | |
| 2.31% of Net Assets | | | | | | | | | | | | | | | | | | |
Charlotte NC Airport — Charlotte Douglas International | | | 4.125 | | | | 07/01/2016 | | | Aa3/A+*/A+@ | | | 100,000 | | | | 108,679 | |
Charlotte NC Airport Revenue Refunding | | | 5.000 | | | | 07/01/2015 | | | Aa3/A+*/A+@ | | | 350,000 | | | | 379,229 | |
Raleigh Durham NC Airport Authority — Series B | | | 5.000 | | | | 11/01/2017 | | | Aa3/AA-@ | | | 105,000 | | | | 120,867 | |
| | | | | | | | | | | | | | | | | | |
| | | | | | | | | | | | | | | | | 608,775 | |
| TURNPIKES/TOLLROAD/HIGHWAY BONDS | | | | | | | | | | | | | | | | | | |
| 1.35% of Net Assets | | | | | | | | | | | | | | | | | | |
NC State Grant Anticipation Revenue Vehicle | | | 5.000 | | | | 03/01/2021 | | | Aa3/AA*/A+@ | | | 310,000 | | | | 356,776 | |
| | | | | | | | | | | | | | | | | | |
| | | | | | | | | | | | | | | | | 356,776 | |
| LEASE REVENUE BONDS | | | | | | | | | | | | | | | | | | |
| 1.01% of Net Assets | | | | | | | | | | | | | | | | | | |
Edgecombe County NC Limited Obligation | | | 4.000 | | | | 06/01/2022 | | | A2 | | | 250,000 | | | | 264,818 | |
| | | | | | | | | | | | | | | | | | |
| | | | | | | | | | | | | | | | | 264,818 | |
| STATE AND LOCAL MORTGAGE/HOUSING BONDS | | | | | | | | | | | | | | | | | | |
| .54% of Net Assets | | | | | | | | | | | | | | | | | | |
NC Housing Finance Agency Series 31-B | | | 3.850 | | | | 01/01/2017 | | | Aa2/AA* | | | 135,000 | | | | 141,084 | |
| | | | | | | | | | | | | | | | | | |
Total Investments 97.67% of Net Assets (cost $25,133,387)(See (a) below for further explanation) | | | | | | | | | $ | 25,718,490 | |
| | | | | | | | | | | | | | | | | | |
| Other assets in excess of liabilities 2.33% | | | | | | | | | | | | | | | | | 614,774 | |
| | | | | | | | | | | | | | | | | | |
| Net Assets 100% | | | | | | | | | | | | | | | | $ | 26,333,264 | |
| | | | | | | | | | | | | | | | | | |
| | * | | Standard and Poor’s Corporation |
| | @ | | Fitch’s Investors Service |
| | | | (All other ratings by Moody’s Investors Service, Inc.) |
| | # | | Bond ratings are unaudited and not covered by Report of Independent Registered Public Accounting Firm. |
| (a) | | Cost for federal income tax purposes is $25,133,387 and net unrealized appreciation of investments is as follows: |
| | | | | | |
| | Unrealized appreciation | | $ | 745,618 | |
| | Unrealized depreciation | | | (160,515 | ) |
| | | | | | |
| | Net unrealized appreciation | | $ | 585,103 | |
| | | | | | |
The accompanying footnotes are an integral part of the financial statements.
32
DUPREE MUTUAL FUNDS — NORTH CAROLINA TAX-FREE SHORT-TO-MEDIUM SERIES
SCHEDULE OF PORTFOLIO INVESTMENTS
North Carolina Municipal Bonds — 100% of Net Assets
June 30, 2013
Other Information
The following is a summary of the inputs used, as of June 30, 2013 involving the Fund’s investments in securities carried at fair value. The inputs or methodology used for valuing securities may not be an indication of the risk associated with investing in those securities. For more information on valuation inputs, and their aggregation into the levels used in the table below, please refer to the Security Valuation section in the accompanying Notes to Financial Statements.
| | | | | | |
| | | Valuation Inputs | | Municipal Bonds | |
Level 1 | | Quoted Prices | | $ | — | |
Level 2 | | Other Significant Observable Inputs | | | 25,718,490 | |
Level 3 | | Significant Unobservable Inputs | | | — | |
| | | | | | |
| | | | $ | 25,718,490 | |
| | | | | | |
The accompanying footnotes are an integral part of the financial statements.
33
NORTH CAROLINA TAX-FREE SHORT-TO-MEDIUM SERIES
STATEMENT OF ASSETS AND LIABILITIES
June 30, 2013
| | | | | | | | |
ASSETS: | | | | | | | | |
Investments in securities, at fair value (Cost: $25,133,387) | | | | | | $ | 25,718,490 | |
Cash | | | | | | | 381,147 | |
Interest receivable | | | | | | | 267,405 | |
| | | | | | | | |
Total assets | | | | | | | 26,367,042 | |
LIABILITIES: | | | | | | | | |
Payable for: | | | | | | | | |
Distributions to shareholders | | | 11,964 | | | | | |
Fund shares redeemed | | | 4,462 | | | | | |
Investment advisory fee | | | 10,805 | | | | | |
Transfer agent fee | | | 3,210 | | | | | |
Trustees fees | | | 1,337 | | | | | |
Accrued expenses | | | 2,000 | | | | | |
| | | | | | | | |
Total liabilities | | | | | | | 33,778 | |
| | | | | | | | |
NET ASSETS: | | | | | | | | |
Capital | | | | | | | 25,707,284 | |
Net accumulated realized gain on investment transactions | | | | | | | 40,875 | |
Undistributed net investment income | | | | | | | 2 | |
Net unrealized appreciation in value of investments | | | | | | | 585,103 | |
| | | | | | | | |
Net assets at value | | | | | | $ | 26,333,264 | |
| | | | | | | | |
NET ASSET VALUE, offering price and redemption price per share
($26,333,264 -:- 2,393,304 shares outstanding; unlimited number of shares authorized; no par value) | | | | | | $ | 11.00 | |
| | | | | | | | |
STATEMENT OF OPERATIONS
For the year ended June 30, 2013
| | | | |
Net investment income: | | | | |
Interest income | | $ | 704,520 | |
| | | | |
Expenses: | | | | |
Investment advisory fee | | | 133,150 | |
Transfer agent fee | | | 39,494 | |
Custodian expense | | | 9,038 | |
Professional fees | | | 11,904 | |
Other expenses | | | 13,235 | |
| | | | |
Total expenses | | | 206,821 | |
Custodian expense reduction | | | (156 | ) |
| | | | |
Net expenses | | | 206,665 | |
| | | | |
Net investment income | | | 497,855 | |
| | | | |
Realized and unrealized gain/(loss) on investments: | | | | |
Net realized gain | | | 48,620 | |
Net change in unrealized appreciation/depreciation | | | (572,951 | ) |
| | | | |
Net realized and unrealized loss on investments | | | (524,331 | ) |
| | | | |
Net increase in net assets resulting from operations | | $ | (26,476 | ) |
| | | | |
The accompanying notes are an integral part of the financial statements.
34
NORTH CAROLINA TAX-FREE SHORT-TO-MEDIUM SERIES
STATEMENTS OF CHANGES IN NET ASSETS
For the years ended June 30, 2013 and 2012
| | | | | | | | |
| | | 2013 | | | 2012 | |
Operations: | | | | | | | | |
Net investment income | | $ | 497,855 | | | $ | 495,128 | |
Net realized gain on investments | | | 48,620 | | | | 78,217 | |
Net change in unrealized appreciation/depreciation | | | (572,951 | ) | | | 507,434 | |
| | | | | | | | |
Net increase in net assets resulting from operations | | | (26,476 | ) | | | 1,080,779 | |
Distributions from net investment income | | | (497,853 | ) | | | (495,128 | ) |
Distributions from capital gains | | | (39,121 | ) | | | — | |
Net fund share transactions (Note 4) | | | 2,163,181 | | | | 2,068,543 | |
| | | | | | | | |
Total increase | | | 1,599,731 | | | | 2,654,194 | |
Net assets: | | | | | | | | |
Beginning of year | | | 24,733,533 | | | | 22,079,339 | |
| | | | | | | | |
End of year | | $ | 26,333,264 | | | $ | 24,733,533 | |
| | | | | | | | |
Accumulated Net Investment Income | | $ | 2 | | | $ | — | |
| | | | | | | | |
FINANCIAL HIGHLIGHTS
| | | | | | | | | | | | | | | | | | | | |
| Selected data for a share outstanding: | | For the years ended June 30, | |
| | | 2013 | | | 2012 | | | 2011 | | | 2010 | | | 2009 | |
Net asset value, beginning of year | | | $11.23 | | | | $10.93 | | | | $10.78 | | | | $10.57 | | | | $10.37 | |
| | | | | | | | | | | | | | | | | | | | |
Income from investment operations: | | | | | | | | | | | | | | | | | | | | |
Net investment income | | | 0.21 | | | | 0.24 | | | | 0.26 | | | | 0.29 | | | | 0.32 | |
Net gains/(losses) on securities, both realized and unrealized | | | (0.21 | ) | | | 0.30 | | | | 0.15 | | | | 0.21 | | | | 0.20 | |
| | | | | | | | | | | | | | | | | | | | |
Total from investment operations | | | 0.00 | | | | 0.54 | | | | 0.41 | | | | 0.50 | | | | 0.52 | |
Less distributions: | | | | | | | | | | | | | | | | | | | | |
Distributions from net investment income | | | (0.21 | ) | | | (0.24 | ) | | | (0.26 | ) | | | (0.29 | ) | | | (0.32 | ) |
Distributions from capital gains | | | (0.02 | ) | | | — | | | | — | | | | — | | | | — | |
| | | | | | | | | | | | | | | | | | | | |
Total distributions | | | (0.23 | ) | | | (0.24 | ) | | | (0.26 | ) | | | (0.29 | ) | | | (0.32 | ) |
| | | | | | | | | | | | | | | | | | | | |
Net asset value, end of period | | | $11.00 | | | | $11.23 | | | | $10.93 | | | | $10.78 | | | | $10.57 | |
| | | | | | | | | | | | | | | | | | | | |
Total return | | | (0.06)% | | | | 4.98% | | | | 3.86% | | | | 4.77% | | | | 5.07% | |
Net assets, end of period (in thousands) | | | $26,333 | | | | $24,734 | | | | $22,079 | | | | $15,951 | | | | $11,662 | |
Ratio of net expenses to average net assets (a) | | | 0.78% | | | | 0.78% | | | | 0.77% | | | | 0.82% | | | | 0.81% | |
Ratio of net investment income to average net assets | | | 1.87% | | | | 2.15% | | | | 2.41% | | | | 2.69% | | | | 3.04% | |
Portfolio turnover | | | 10.19% | | | | 12.31% | | | | 5.15% | | | | 17.94% | | | | 10.14% | |
| (a) | | Percentages are after expenses waived by Adviser and Custodian reduction. No recovery of these waivers and reductions will be sought. Expenses waived by Adviser and Custodian reduction were: 0% and 0% for 2013; 0% and 0% for 2012; 0% and 0% for 2011; 0% and 0% for 2010; and .02% and .03% for 2009, respectively. |
The accompanying notes are an integral part of the financial statements.
35
DUPREE MUTUAL FUNDS — TENNESSEE TAX-FREE INCOME SERIES
SCHEDULE OF PORTFOLIO INVESTMENTS
Tennessee Municipal Bonds — 100% of Net Assets
June 30, 2013
| | | | | | | | | | | | | | | | | | |
| Bond Description | | Coupon | | | Maturity
Date | | | Rating# | | Par Value | | | Fair Value | |
| MUNICIPAL UTILITY REVENUE BONDS | | | | | | | | | | | | | | | | | | |
| 35.04% of Net Assets | | | | | | | | | | | | | | | | | | |
Blount County TN Public Building Authority Local Government | | | 5.000 | % | | | 06/01/2032 | | | Aa3 | | $ | 750,000 | | | $ | 789,218 | |
Columbia TN Refunded — Sewer System | | | 5.000 | | | | 12/01/2024 | | | Aa2 | | | 1,235,000 | | | | 1,335,084 | |
Columbia TN Broadband Network Revenue and Tax | | | 5.000 | | | | 03/01/2025 | | | Aa2 | | | 1,000,000 | | | | 1,055,950 | |
Franklin TN Water and Sewer Revenue and Tax Authority | | | 5.000 | | | | 04/01/2024 | | | Aaa | | | 750,000 | | | | 907,755 | |
Metropolitan Government Nashville and Davidson County | | | 5.000 | | | | 10/01/2033 | | | Aa1/AA* | | | 1,000,000 | | | | 1,087,980 | |
Chattanooga TN Electric Revenue — Series A | | | 5.000 | | | | 09/01/2026 | | | AA+*/AA@ | | | 250,000 | | | | 276,010 | |
Citizens Gas Utility District TN Gas Revenue Refunding | | | 5.000 | | | | 05/01/2029 | | | A* | | | 250,000 | | | | 261,043 | |
Clarksville TN Electric System Revenue | | | 5.000 | | | | 09/01/2032 | | | Aa2 | | | 1,250,000 | | | | 1,341,275 | |
Clarksville TN Electric System Revenue — Series A | | | 5.000 | | | | 09/01/2028 | | | Aa2/AA-* | | | 1,000,000 | | | | 1,099,730 | |
Clarksville TN Electric Systems Revenue — Series A | | | 5.000 | | | | 09/01/2032 | | | Aa2/AA-* | | | 480,000 | | | | 515,539 | |
Clarksville TN Electric System Revenue — Series A | | | 5.000 | | | | 09/01/2033 | | | Aa2/AA-* | | | 2,000,000 | | | | 2,136,420 | |
Clarksville TN Water Sewer & Gas Revenue** | | | 5.000 | | | | 02/01/2033 | | | Aa3/AA-@ | | | 500,000 | | | | 532,105 | |
Columbia TN Waterworks Revenue | | | 5.000 | | | | 12/01/2032 | | | Aa3 | | | 885,000 | | | | 937,348 | |
Gallatin TN Water and Sewer Revenue | | | 5.000 | | | | 01/01/2028 | | | Aa3 | | | 2,540,000 | | | | 2,703,068 | |
Hallsdale-Powell Utility District Knox County Water & Sewer | | | 5.000 | | | | 04/01/2026 | | | AA* | | | 1,000,000 | | | | 1,068,700 | |
Hallsdale-Powell Utility District Knox County Water & Sewer | | | 5.000 | | | | 04/01/2031 | | | AA* | | | 740,000 | | | | 775,009 | |
Harpeth Valley Utilities Davidson and Williamson Counties | | | 5.000 | | | | 09/01/2032 | | | Aa3 | | | 1,420,000 | | | | 1,530,036 | |
Jackson TN Energy Authority Gas System Revenue | | | 5.000 | | | | 10/01/2028 | | | Aa2 | | | 1,000,000 | | | | 1,089,370 | |
Knox-Chapman TN Utility District Knox County Water and Sewer | | | 5.250 | | | | 01/01/2036 | | | AA-* | | | 700,000 | | | | 757,680 | |
Knox Chapman TN Utilities Refunding & Impact | | | 4.500 | | | | 01/01/2027 | | | AA-* | | | 1,000,000 | | | | 1,081,130 | |
Metropolitan Government Nashville and Davidson County | | | 4.750 | | | | 05/15/2028 | | | AA+*/AA+@ | | | 460,000 | | | | 491,110 | |
Metropolitan Government Nashville and Davidson County | | | 5.000 | | | | 05/15/2036 | | | AA+*/AA+@ | | | 4,145,000 | | | | 4,483,770 | |
Metropolitan Government Nashville & Davidson County Water & Sewer Revenue | | | 5.000 | | | | 07/01/2031 | | | Aa3/AA-* | | | 500,000 | | | | 546,080 | |
Metropolitan Government Nashville & Davidson County Water & Sewer Revenue | | | 5.000 | | | | 07/01/2033 | | | Aa3/AA-* | | | 575,000 | | | | 624,019 | |
South Blount County TN Utility District Waterworks Revenue | | | 5.000 | | | | 12/01/2028 | | | A2/AA-* | | | 1,125,000 | | | | 1,221,986 | |
Watauga River TN Regional Water Authority Waterworks | | | 5.000 | | | | 07/01/2034 | | | A* | | | 500,000 | | | | 510,910 | |
West Wilson Utility District TN Waterworks Revenue | | | 4.750 | | | | 06/01/2028 | | | Aa3 | | | 2,460,000 | | | | 2,600,466 | |
West Wilson Utility District TN Waterworks Revenue | | | 5.000 | | | | 06/01/2033 | | | Aa3 | | | 1,170,000 | | | | 1,293,926 | |
White House Utility District TN Water and Sewer | | | 5.000 | | | | 01/01/2028 | | | Aa3 | | | 1,235,000 | | | | 1,317,523 | |
White House Utility District TN Water and Sewer | | | 5.000 | | | | 01/01/2030 | | | Aa3 | | | 2,505,000 | | | | 2,660,360 | |
| | | | | | | | | | | | | | | | | | |
| | | | | | | | | | | | | | | | | 37,030,600 | |
| UNIVERSITY CONSOLIDATED EDUCATION AND BUILDING REVENUE BONDS | | | | | | | | | | | |
| 13.95% of Net Assets | | | | | | | | | | | | | | | | | | |
TN State School Board Authority Higher Education Facilities | | | 5.000 | | | | 05/01/2028 | | | Aa1/AA*/AA@ | | | 1,000,000 | | | | 1,081,500 | |
TN State School Board Authority Higher Education Facilities | | | 5.125 | | | | 05/01/2033 | | | Aa1/AA*/AA@ | | | 1,300,000 | | | | 1,411,969 | |
TN State School Board Authority Higher Education Facilities | | | 5.000 | | | | 05/01/2034 | | | Aa1/AA*/AA+@ | | | 500,000 | | | | 540,115 | |
TN State School Board Authority Refunding Higher Education | | | 5.000 | | | | 05/01/2024 | | | Aa1/AA*/AA+@ | | | 1,395,000 | | | | 1,493,096 | |
TN State School Board Authority Refunding Higher Education | | | 5.000 | | | | 05/01/2025 | | | Aa1/AA*/AA+@ | | | 1,440,000 | | | | 1,538,266 | |
TN State School Board Authority Higher Education Facilities | | | 4.750 | | | | 05/01/2030 | | | Aa1/AA*/AA+@ | | | 2,750,000 | | | | 2,896,163 | |
TN State School Board Authority Higher Education Facilities | | | 5.000 | | | | 05/01/2039 | | | Aa1/AA*/AA+@ | | | 500,000 | | | | 533,830 | |
TN State School Bond Authority Higher Education Facilities | | | 5.000 | | | | 05/01/2028 | | | Aa1/AA*/AA+@ | | | 500,000 | | | | 557,795 | |
lle & Davidson County TN Health & Educational Facilities Vanderbilt University — Series D | | | 4.000 | | | | 10/01/2031 | | | Aa2/AA*/AA+@ | | | 1,500,000 | | | | 1,503,390 | |
Metropolitan Government Nashville & Davidson County Vanderbilt University | | | 5.000 | | | | 10/01/2034 | | | Aa2/AA*/AA+@ | | | 1,000,000 | | | | 1,077,770 | |
Metropolitan TN Government Nashville & Davidson County Vanderbilt University | | | 5.000 | | | | 10/01/2028 | | | Aa2/AA*/AA+@ | | | 900,000 | | | | 1,015,794 | |
Metropolitan Government Nashville & Davidson County Vanderbilt | | | 5.000 | | | | 10/01/2030 | | | Aa2/AA*/AA+@ | | | 500,000 | | | | 555,920 | |
Shelby County TN Health Educational Facilities Board Rhodes College | | | 5.000 | | | | 08/01/2030 | | | A1/A+* | | | 500,000 | | | | 533,900 | |
| | | | | | | | | | | | | | | | | | |
| | | | | | | | | | | | | | | | | 14,739,508 | |
| PREREFUNDED BONDS | | | | | | | | | | | | | | | | | | |
| 10.67% of Net Assets | | | | | | | | | | | | | | | | | | |
Franklin County TN Health & Education Facilities Board University South Project | | | 5.000 | | | | 09/01/2025 | | | A+* | | | 1,000,000 | | | | 1,093,560 | |
The accompanying footnotes are an integral part of the financial statements.
36
DUPREE MUTUAL FUNDS — TENNESSEE TAX-FREE INCOME SERIES
SCHEDULE OF PORTFOLIO INVESTMENTS
Tennessee Municipal Bonds — 100% of Net Assets
June 30, 2013
| | | | | | | | | | | | | | | | | | |
| Bond Description | | Coupon | | | Maturity
Date | | | Rating# | | Par Value | | | Fair Value | |
Harpeth Valley Utilities Davidson and Williamson Counties Utilities | | | 5.000 | % | | | 09/01/2029 | | | Aa3 | | $ | 910,000 | | | $ | 959,677 | |
Johnson City TN Health & Education Facilities Escrowed — Series 2000 A | | | 5.125 | | | | 07/01/2025 | | | A* | | | 305,000 | | | | 306,739 | |
Knoxville TN Waste Water System Revenue Improvement — Series A | | | 5.000 | | | | 04/01/2037 | | | Aa2/AA+* | | | 370,000 | | | | 398,634 | |
Metropolitan Government Nashville and Davidson County TN | | | 5.000 | | | | 01/01/2025 | | | Aa1/AA* | | | 4,025,000 | | | | 4,655,919 | |
Metropolitan Government Nashville and Davidson County TN | | | 5.000 | | | | 01/01/2023 | | | Aa1/AA* | | | 560,000 | | | | 597,470 | |
Metropolitan Government Nashville and Davidson County TN | | | 5.000 | | | | 01/01/2024 | | | Aa1/AA* | | | 565,000 | | | | 602,714 | |
Metropolitan Government Nashville and Davidson County TN | | | 5.000 | | | | 05/15/2017 | | | Aa1/A* | | | 205,000 | | | | 234,866 | |
Metropolitan Government Nashville and Davidson County TN | | | 5.000 | | | | 05/15/2017 | | | Aa1/A* | | | 35,000 | | | | 40,099 | |
Rutherford County TN Construction Utility District Waterworks | | | 5.000 | | | | 02/01/2031 | | | Aa2/AAA* | | | 1,435,000 | | | | 1,589,664 | |
TN Housing Development Agency Mortgage Financing — Series A | | | 5.200 | | | | 07/01/2023 | | | Aa2/AA* | | | 800,000 | | | | 800,328 | |
| | | | | | | | | | | | | | | | | | |
| | | | | | | | | | | | | | | | | 11,279,670 | |
| PUBLIC FACILITIES REVENUE BONDS | | | | | | | | | | | | | | | | | | |
| 10.52% of Net Assets | | | | | | | | | | | | | | | | | | |
Blount County TN Public Building Authority Local Government | | | 5.000 | | | | 06/01/2025 | | | Aa2/AA-* | | | 100,000 | | | | 110,437 | |
Blount County TN Public Building Authority Local Government | | | 5.000 | | | | 06/01/2027 | | | Aa2/AA-* | | | 1,500,000 | | | | 1,633,650 | |
Blount County TN Public Building Authority Local Government | | | 4.750 | | | | 06/01/2031 | | | Aa2/AA-* | | | 750,000 | | | | 783,818 | |
Pigeon Forge Industrial Development Board | | | 5.000 | | | | 06/01/2024 | | | AA* | | | 600,000 | | | | 688,170 | |
Pigeon Forge Industrial Development Board | | | 5.000 | | | | 06/01/2027 | | | AA* | | | 1,400,000 | | | | 1,575,140 | |
Pigeon Forge Industrial Development Board TN Public Facilities | | | 5.000 | | | | 06/01/2029 | | | AA* | | | 2,120,000 | | | | 2,341,455 | |
Pigeon Forge Industrial Development Board TN Public Facilities | | | 5.000 | | | | 06/01/2034 | | | AA* | | | 850,000 | | | | 914,991 | |
Memphis Shelby County TN Sports Authority Memphis Arena | | | 5.250 | | | | 11/01/2026 | | | Aa3/AA-*/A+@ | | | 500,000 | | | | 542,250 | |
Memphis-Shelby County Sports Authority | | | 5.250 | | | | 11/01/2027 | | | Aa3/AA-*/A+@ | | | 750,000 | | | | 802,448 | |
Metropolitan Government Nashville & Davidson County TN Convention Center | | | 5.000 | | | | 07/01/2026 | | | A1/A* | | | 630,000 | | | | 680,961 | |
Metropolitan Government Nashville & Davidson County TN | | | 5.000 | | | | 07/01/2021 | | | Aa2/AA-* | | | 1,000,000 | | | | 1,041,470 | |
| | | | | | | | | | | | | | | | | | |
| | | | | | | | | | | | | | | | | 11,114,790 | |
| HOSPITAL AND HEALTHCARE | | | | | | | | | | | | | | | | | | |
| 7.99% of Net Assets | | | | | | | | | | | | | | | | | | |
Rutherford County TN Health & Education Facilities Ascension Health | | | 5.000 | | | | 11/15/2040 | | | Aa2/AA+*/AA+@ | | | 1,500,000 | | | | 1,577,625 | |
Shelby County TN Health Education and Housing Facilities | | | 5.000 | | | | 05/01/2027 | | | A2/A+* | | | 750,000 | | | | 789,930 | |
Shelby County TN Health Education and Housing Facilities | | | 5.000 | | | | 07/01/2031 | | | Aa2/AAA@ | | | 4,750,000 | | | | 5,022,745 | |
Shelby County TN Health Education and Housing Facilities | | | 5.250 | | | | 09/01/2027 | | | A2/AA-* | | | 1,000,000 | | | | 1,050,580 | |
| | | | | | | | | | | | | | | | | | |
| | | | | | | | | | | | | | | | | 8,440,880 | |
| REFUNDING BONDS | | | | | | | | | | | | | | | | | | |
| 7.17% of Net Assets | | | | | | | | | | | | | | | | | | |
Blount County TN Public Building Authority General Obligation | | | 5.250 | | | | 06/01/2019 | | | | | | 250,000 | | | | 256,035 | |
Greene County TN General Obligation — Series B | | | 5.000 | | | | 06/01/2024 | | | A1 | | | 505,000 | | | | 545,880 | |
Manchester TN Refunding General Obligation | | | 5.000 | | | | 06/01/2038 | | | A2/AA-* | | | 100,000 | | | | 107,622 | |
Metropolitan Government Nashville & Davidson County TN | | | 5.000 | | | | 05/15/2027 | | | Aa1/AA* | | | 1,195,000 | | | | 1,308,979 | |
Metropolitan Government Nashville & Davidson County TN | | | 5.000 | | | | 05/15/2028 | | | Aa1/AA* | | | 205,000 | | | | 222,255 | |
Metropolitan Government Nashville & Davidson County TN | | | 5.000 | | | | 07/01/2027 | | | Aa1/AA* | | | 500,000 | | | | 566,025 | |
Montgomery County TN General Obligation | | | 4.750 | | | | 05/01/2020 | | | Aa2/AA+* | | | 1,000,000 | | | | 1,059,090 | |
Pigeon Forge TN Refunding — Series A | | | 4.900 | | | | 06/01/2028 | | | Aa3/AA* | | | 1,000,000 | | | | 1,079,710 | |
Shelby County TN Refunding — Series A | | | 5.000 | | | | 03/01/2026 | | | Aa1/AA+*/AA+@ | | | 1,200,000 | | | | 1,369,272 | |
Chattanooga TN Industrial Development Board Lease Rent Revenue | | | 5.000 | | | | 10/01/2027 | | | A2/AA*/AA@ | | | 1,000,000 | | | | 1,062,470 | |
| | | | | | | | | | | | | | | | | | |
| | | | | | | | | | | | | | | | | 7,577,338 | |
| STATE AND LOCAL MORTGAGE/HOUSING BONDS | | | | | | | | | | | | | | | | | | |
| 5.58% of Net Assets | | | | | | | | | | | | | | | | | | |
Metro Nashville and DavidsonCounty TN Multi-Family Housing | | | 4.600 | | | | 11/01/2026 | | | | | | 775,000 | | | | 766,584 | |
Oak Ridge TN Industrial Development Board Refunding Revenue | | | 5.250 | | | | 08/20/2018 | | | Aaa | | | 255,000 | | | | 255,176 | |
TN Housing Development Agency — Series 1B | | | 5.000 | | | | 07/01/2029 | | | Aa1/AA+* | | | 670,000 | | | | 686,824 | |
TN Housing Development Agency | | | 5.000 | | | | 07/01/2028 | | | Aa1/AA+* | | | 660,000 | | | | 681,516 | |
TN Housing Development Agency | | | 5.400 | | | | 07/01/2035 | | | Aa1/AA+* | | | 485,000 | | | | 505,482 | |
TN Housing Development Agency Homeownership Program 1 | | | 5.000 | | | | 07/01/2029 | | | Aa1/AA+* | | | 720,000 | | | | 744,127 | |
TN Housing Development Agency Homeownership Program 2 | | | 4.700 | | | | 07/01/2027 | | | Aa1/AA+* | | | 1,465,000 | | | | 1,510,136 | |
TN Housing Development Agency Housing Finance Program | | | 4.850 | | | | 01/01/2025 | | | Aa2 | | | 720,000 | | | | 748,598 | |
| | | | | | | | | | | | | | | | | | |
| | | | | | | | | | | | | | | | | 5,898,443 | |
The accompanying footnotes are an integral part of the financial statements.
37
DUPREE MUTUAL FUNDS — TENNESSEE TAX-FREE INCOME SERIES
SCHEDULE OF PORTFOLIO INVESTMENTS
Tennessee Municipal Bonds — 100% of Net Assets
June 30, 2013
| | | | | | | | | | | | | | | | | | |
| Bond Description | | Coupon | | | Maturity
Date | | | Rating# | | Par Value | | | Fair Value | |
| SCHOOL IMPROVEMENT BONDS | | | | | | | | | | | | | | | | | | |
| 4.38% of Net Assets | | | | | | | | | | | | | | | | | | |
Cleveland TN General Obligation — Series A | | | 5.000 | % | | | 06/01/2027 | | | Aa3/A+* | | $ | 680,000 | | | $ | 722,900 | |
Marion County TN Schools | | | 5.000 | | | | 06/01/2025 | | | A1 | | | 1,050,000 | | | | 1,127,270 | |
Overton County TN Refunding Schools General Obligation | | | 5.000 | | | | 04/01/2018 | | | Baa1 | | | 500,000 | | | | 525,145 | |
Rhea County TN | | | 5.000 | | | | 04/01/2029 | | | A1 | | | 1,385,000 | | | | 1,488,515 | |
Smith County TN General Obligation | | | 5.000 | | | | 04/01/2021 | | | | | | 720,000 | | | | 763,762 | |
| | | | | | | | | | | | | | | | | | |
| | | | | | | | | | | | | | | | | 4,627,592 | |
| MISCELLANEOUS PUBLIC IMPROVEMENT BONDS | | | | | | | | | | | | | | | | | | |
| 2.08% of Net Assets | | | | | | | | | | | | | | | | | | |
Memphis TN Refunding and General Impact General Obligation | | | 5.000 | | | | 05/01/2036 | | | Aa2/AA* | | | 850,000 | | | | 913,793 | |
Springfield TN Public Improvement | | | 4.500 | | | | 03/01/2024 | | | A1 | | | 565,000 | | | | 628,664 | |
Memphis Shelby County TN Port Authority Community Development | | | 5.000 | | | | 04/01/2035 | | | Aa3/AA-* | | | 625,000 | | | | 660,743 | |
| | | | | | | | | | | | | | | | | | |
| | | | | | | | | | | | | | | | | 2,203,200 | |
| ESCROWED TO MATURITY BONDS | | | | | | | | | | | | | | | | | | |
| 1.19% of Net Assets | | | | | | | | | | | | | | | | | | |
Johnson City TN Health & Education Facilities Medical Center | | | 5.000 | | | | 07/01/2018 | | | A* | | | 150,000 | | | | 150,116 | |
Johnson City TN Health & Education Facilities Mountain State | | | 6.500 | | | | 07/01/2014 | | | Baa1/A*/BBB+@ | | | 1,000,000 | | | | 1,047,580 | |
Metro Nashville and Davidson County TN Water and Sewer | | | 6.500 | | | | 12/01/2014 | | | A* | | | 60,000 | | | | 65,285 | |
| | | | | | | | | | | | | | | | | | |
| | | | | | | | | | | | | | | | | 1,262,981 | |
| INDUSTRIAL REVENUE BONDS | | | | | | | | | | | | | | | | | | |
| 0.88% of Net Assets | | | | | | | | | | | | | | | | | | |
Industrial Development Board TN Blount County | | | 5.000 | | | | 06/01/2027 | | | Aa3/AA-* | | | 850,000 | | | | 935,085 | |
| | | | | | | | | | | | | | | | | | |
Total Investments 99.45% of Net Assets (cost $102,519,379)(See (a) below for further explanation) | | | | | | $ | 105,110,087 | |
| | | | | | | | | | | | | | | | | | |
| Other assets in excess of liabilities .55% | | | | | | | | | | | | | | | | | 586,290 | |
| | | | | | | | | | | | | | | | | | |
| Net Assets 100% | | | | | | | | | | | | | | | | $ | 105,696,377 | |
| | | | | | | | | | | | | | | | | | |
| | * | | Standard and Poor’s Corporation |
| | ** | | When-Issued security or extended settlement — see footnote 1(D) |
| | @ | | Fitch’s Investors Service |
| | | | (All other ratings by Moody’s Investors Service, Inc.) |
| | # | | Bond ratings are unaudited and not covered by Report of Independent Registered Public Accounting Firm. |
| (a) | | Cost for federal income tax purposes is $102,519,379 and net unrealized appreciation of investments is as follows: |
| | | | | | |
| | Unrealized appreciation | | $ | 3,796,999 | |
| | Unrealized depreciation | | | (1,206,291 | ) |
| | | | | | |
| | Net unrealized appreciation | | $ | 2,590,708 | |
| | | | | | |
Other Information
The following is a summary of the inputs used, as of June 30, 2013 involving the Fund’s investments in securities carried at fair value. The inputs or methodology used for valuing securities may not be an indication of the risk associated with investing in those securities. For more information on valuation inputs, and their aggregation into the levels used in the table below, please refer to the Security Valuation section in the accompanying Notes to Financial Statements.
| | | | | | |
| | | Valuation Inputs | | Municipal Bonds | |
Level 1 | | Quoted Prices | | $ | — | |
Level 2 | | Other Significant Observable Inputs | | | 105,110,087 | |
Level 3 | | Significant Unobservable Inputs | | | — | |
| | | | | | |
| | | | $ | 105,110,087 | |
| | | | | | |
The accompanying footnotes are an integral part of the financial statements.
38
TENNESSEE TAX-FREE INCOME SERIES
STATEMENT OF ASSETS AND LIABILITIES
June 30, 2013
| | | | | | | | |
ASSETS: | | | | | | | | |
Investments in securities, at fair value (Cost: $102,519,379) | | | | | | $ | 105,110,087 | |
Cash | | | | | | | 492,252 | |
Interest receivable | | | | | | | 1,349,477 | |
| | | | | | | | |
Total assets | | | | | | | 106,951,816 | |
LIABILITIES: | | | | | | | | |
Payable for: | | | | | | | | |
Investments purchased | | | 543,888 | | | | | |
Distributions to shareholders | | | 378,775 | | | | | |
Fund shares redeemed | | | 229,849 | | | | | |
Investment advisory fee | | | 43,786 | | | | | |
Transfer agent fee | | | 11,299 | | | | | |
Trustees fees | | | 2,069 | | | | | |
Accrued expenses | | | 45,773 | | | | | |
| | | | | | | | |
Total liabilities | | | | | | | 1,255,439 | |
| | | | | | | | |
NET ASSETS: | | | | | | | | |
Capital | | | | | | | 103,526,231 | |
Net accumulated realized loss on investment transactions | | | | | | | (420,562 | ) |
Net unrealized appreciation in value of investments | | | | | | | 2,590,708 | |
| | | | | | | | |
Net assets at value | | | | | | $ | 105,696,377 | |
| | | | | | | | |
NET ASSET VALUE, offering price and redemption price per share
($105,696,377 -:- 9,377,151 shares outstanding; unlimited number of shares authorized; no par value) | | | $ | 11.27 | |
| | | | | | | | |
STATEMENT OF OPERATIONS
For the year ended June 30, 2013
| | | | |
Net investment income: | | | | |
Interest income | | $ | 4,064,627 | |
| | | | |
Expenses: | | | | |
Investment advisory fee | | | 522,313 | |
Transfer agent fee | | | 138,746 | |
Custodian expense | | | 18,037 | |
Professional fees | | | 21,890 | |
Other expenses | | | 40,709 | |
| | | | |
Total expenses | | | 741,695 | |
Fees waived by Adviser | | | (40,632 | ) |
Custodian expense reduction | | | (629 | ) |
| | | | |
Net expenses | | | 700,434 | |
| | | | |
Net investment income | | | 3,364,193 | |
| | | | |
Realized and unrealized gain on investments: | | | | |
Net realized gain | | | 200,774 | |
Net change in unrealized appreciation/depreciation | | | (3,013,866 | ) |
| | | | |
Net realized and unrealized loss on investments | | | (2,813,092 | ) |
| | | | |
Net increase in net assets resulting from operations | | $ | 551,101 | |
| | | | |
The accompanying notes are an integral part of the financial statements.
39
TENNESSEE TAX-FREE INCOME SERIES
STATEMENTS OF CHANGES IN NET ASSETS
For the years ended June 30, 2013 and 2012
| | | | | | | | |
| | | 2013 | | | 2012 | |
Operations: | | | | | | | | |
Net investment income | | $ | 3,364,193 | | | $ | 3,364,028 | |
Net realized gain on investments | | | 200,774 | | | | 202,311 | |
Net change in unrealized appreciation/depreciation | | | (3,013,866 | ) | | | 4,124,407 | |
| | | | | | | | |
Net increase in net assets resulting from operations | | | 551,101 | | | | 7,690,746 | |
Distributions from net investment income | | | (3,364,193 | ) | | | (3,364,028 | ) |
Net fund share transactions (Note 4) | | | 7,926,230 | | | | 4,516,305 | |
| | | | | | | | |
Total increase | | | 5,113,138 | | | | 8,843,023 | |
Net assets: | | | | | | | | |
Beginning of year | | | 100,583,239 | | | | 91,740,216 | |
| | | | | | | | |
End of year | | $ | 105,696,377 | | | $ | 100,583,239 | |
| | | | | | | | |
FINANCIAL HIGHLIGHTS
| | | | | | | | | | | | | | | | | | | | |
| Selected data for a share outstanding: | | For the years ended June 30, | |
| | | 2013 | | | 2012 | | | 2011 | | | 2010 | | | 2009 | |
Net asset value, beginning of year | | | $11.56 | | | | $11.04 | | | | $11.04 | | | | $10.71 | | | | $10.77 | |
| | | | | | | | | | | | | | | | | | | | |
Income from investment operations: | | | | | | | | | | | | | | | | | | | | |
Net investment income | | | 0.36 | | | | 0.40 | | | | 0.41 | | | | 0.40 | | | | 0.41 | |
Net gains/(losses) on securities, both realized and unrealized | | | (0.29 | ) | | | 0.52 | | | | — | (b) | | | 0.33 | | | | (0.06 | ) |
| | | | | | | | | | | | | | | | | | | | |
Total from investment operations | | | 0.07 | | | | 0.92 | | | | 0.41 | | | | 0.73 | | | | 0.35 | |
Less distributions: | | | | | | | | | | | | | | | | | | | | |
Distributions from net investment income | | | (0.36 | ) | | | (0.40 | ) | | | (0.41 | ) | | | (0.40 | ) | | | (0.41 | ) |
| | | | | | | | | | | | | | | | | | | | |
Net asset value, end of period | | | $11.27 | | | | $11.56 | | | | $11.04 | | | | $11.04 | | | | $10.71 | |
| | | | | | | | | | | | | | | | | | | | |
Total return | | | 0.56% | | | | 8.44% | | | | 3.78% | | | | 6.92% | | | | 3.40% | |
Net assets, end of period (in thousands) | | | $105,696 | �� | | | $100,583 | | | | $91,740 | | | | $94,960 | | | | $92,222 | |
Ratio of net expenses to average net assets (a) | | | 0.65% | | | | 0.70% | | | | 0.69% | | | | 0.70% | | | | 0.70% | |
Ratio of net investment income to average net assets | | | 3.10% | | | | 3.50% | | | | 3.68% | | | | 3.67% | | | | 3.90% | |
Portfolio turnover | | | 7.37% | | | | 8.39% | | | | 6.38% | | | | 14.51% | | | | 7.62% | |
| (a) | | Percentages are after expenses waived by Adviser and Custodian reduction. No recovery of these waivers and reductions will be sought. Expenses waived by Adviser and Custodian reduction were: .04% and 0% for 2013; 0% and 0% for 2012; 0% and 0% for 2011; 0% and 0% for 2010; and 0% and .01% for 2009, respectively. |
| (b) | | Rounds to less than $.01. |
The accompanying notes are an integral part of the financial statements.
40
DUPREE MUTUAL FUNDS — TENNESSEE TAX-FREE SHORT-TO-MEDIUM SERIES
SCHEDULE OF PORTFOLIO INVESTMENTS
Tennessee Municipal Bonds — 100% of Net Assets
June 30, 2013
| | | | | | | | | | | | | | | | | | |
| Bond Description | | Coupon | | | Maturity
Date | | | Rating# | | Par Value | | | Fair Value | |
| REFUNDING BONDS | | | | | | | | | | | | | | | | | | |
| 18.07% of Net Assets | | | | | | | | | | | | | | | | | | |
Blount County TN Public Building Authority — Series B-19 | | | 3.500 | % | | | 06/01/2015 | | | AA+ | | $ | 200,000 | | | $ | 209,940 | |
Johnson City TN Refunding | | | 4.000 | | | | 06/01/2015 | | | AA@ | | | 400,000 | | | | 425,752 | |
Memphis TN General Improvement | | | 5.000 | | | | 04/01/2022 | | | Aa2/AA*/AA-@ | | | 185,000 | | | | 210,719 | |
Memphis TN General Obligation — Series A | | | 5.000 | | | | 05/01/2020 | | | Aa2/AA*/AA-@ | | | 250,000 | | | | 289,953 | |
Metropolitan Government Nashville & Davidson County TN Refunding | | | 5.000 | | | | 05/15/2019 | | | Aa1/AA* | | | 215,000 | | | | 243,348 | |
Polk County TN Refinancing | | | 5.000 | | | | 05/01/2020 | | | A2 | | | 150,000 | | | | 166,499 | |
Rhea County TN | | | 3.000 | | | | 04/01/2018 | | | A1 | | | 200,000 | | | | 210,987 | |
Unicoi County TN Refunding | | | 5.250 | | | | 04/01/2019 | | | A1/A+* | | | 200,000 | | | | 233,878 | |
| | | | | | | | | | | | | | | | | | |
| | | | | | | | | | | | | | | | | 1,991,076 | |
| MUNICIPAL UTILITY REVENUE BONDS | | | | | | | | | | | | | | | | | | |
| 16.73% of Net Assets | | | | | | | | | | | | | | | | | | |
Lawrenceburg TN Refunding Water and Sewer | | | 5.000 | | | | 07/01/2015 | | | A2 | | | 125,000 | | | | 135,465 | |
Castalian Springs — Bethpage TN Waterworks | | | 3.000 | | | | 01/01/2019 | | | A+* | | | 260,000 | | | | 273,497 | |
Chattanooga TN Electric Revenue — Series A | | | 5.000 | | | | 09/01/2021 | | | AA+*/AA@ | | | 400,000 | | | | 454,055 | |
Columbia TN Electric System Revenue | | | 5.000 | | | | 09/01/2021 | | | Aa3 | | | 165,000 | | | | 187,650 | |
Cross Anchor TN Utility District | | | 4.250 | | | | 12/01/2015 | | | AA-* | | | 65,000 | | | | 69,886 | |
Cross Anchor TN Utility District | | | 4.250 | | | | 12/01/2016 | | | AA-* | | | 65,000 | | | | 70,945 | |
Johnson City TN Electric Revenue | | | 4.000 | | | | 05/01/2022 | | | Aa2/AA-* | | | 100,000 | | | | 105,949 | |
Johnson City TN Electric Revenue | | | 4.500 | | | | 05/01/2021 | | | Aa2/AA-* | | | 50,000 | | | | 55,253 | |
Metropolitan Government Nashville & Davidson County Water &Sewer | | | 5.250 | | | | 01/01/2019 | | | Aa2/AA-* | | | 125,000 | | | | 147,231 | |
New Market Utility District Jefferson County Waterworks | | | 4.000 | | | | 06/01/2016 | | | A3/AA-* | | | 100,000 | | | | 107,604 | |
New Market Utility District Jefferson County Waterworks | | | 4.000 | | | | 06/01/2017 | | | A3/AA-* | | | 100,000 | | | | 108,696 | |
Sevier County TN Utility District Gas System Revenue | | | 2.650 | | | | 06/01/2015 | | | A+* | | | 125,000 | | | | 128,029 | |
| | | | | | | | | | | | | | | | | | |
| | | | | | | | | | | | | | | | | 1,844,260 | |
| MISCELLANEOUS PUBLIC IMPROVEMENT BONDS | | | | | | | | | | | | | | | | | | |
| 14.03% of Net Assets | | | | | | | | | | | | | | | | | | |
Blount County TN Public Building Authority | | | 4.000 | | | | 06/01/2020 | | | Aa2/AA-* | | | 150,000 | | | | 164,048 | |
Blount County TN Public Building Authority | | | 5.000 | | | | 06/01/2021 | | | Aa2/AA-* | | | 175,000 | | | | 199,261 | |
Claiborne County TN Public Improvement — Series A | | | 5.000 | | | | 04/01/2017 | | | A+* | | | 170,000 | | | | 191,993 | |
Gallatin County Capital Outlay Notes | | | 4.625 | | | | 01/01/2019 | | | AA-* | | | 100,000 | | | | 114,075 | |
Memphis TN Refunding General Improvement | | | 5.000 | | | | 10/01/2017 | | | Aa2/AA*/AA-@ | | | 100,000 | | | | 115,502 | |
Memphis TN Series A | | | 5.000 | | | | 04/01/2024 | | | Aa2/AA*/AA-@ | | | 200,000 | | | | 220,848 | |
Tennessee State — Series A | | | 4.000 | | | | 05/01/2021 | | | Aaa/AA+*/AAA@ | | | 340,000 | | | | 368,441 | |
Sevier County TN Public Building Authority | | | 5.000 | | | | 06/01/2018 | | | AA-* | | | 150,000 | | | | 172,371 | |
| | | | | | | | | | | | | | | | | | |
| | | | | | | | | | | | | | | | | 1,546,539 | |
| PREREFUNDED BONDS | | | | | | | | | | | | | | | | | | |
| 13.84% of Net Assets | | | | | | | | | | | | | | | | | | |
Maury County TN School and Public Improvement | | | 5.000 | | | | 04/01/2016 | | | Aa2 | | | 750,000 | | | | 776,618 | |
Memphis TN General Obligation General Improvement | | | 5.000 | | | | 10/01/2016 | | | Aa2/AA*/AA-@ | | | 450,000 | | | | 476,716 | |
Metropolitan Government Nashville and Davidson County | | | 5.000 | | | | 01/01/2019 | | | Aa1/AA* | | | 200,000 | | | | 231,350 | |
Metropolitan Government Nashville & Davidson County TN Refunding | | | 5.000 | | | | 05/15/2017 | | | NR | | | 35,000 | | | | 40,128 | |
| | | | | | | | | | | | | | | | | | |
| | | | | | | | | | | | | | | | | 1,524,812 | |
| SCHOOL IMPROVEMENT BONDS | | | | | | | | | | | | | | | | | | |
| 9.20% of Net Assets | | | | | | | | | | | | | | | | | | |
Lincoln County TN | | | 5.250 | | | | 04/01/2019 | | | Aa3 | | | 200,000 | | | | 232,934 | |
Madison County TN Refunding — School and Public Improvement | | | 5.000 | | | | 04/01/2018 | | | Aa2/AA-* | | | 175,000 | | | | 187,800 | |
Robertson County TN School | | | 4.000 | | | | 06/01/2020 | | | Aa3/AA-* | | | 250,000 | | | | 271,500 | |
Robertson County TN School and Public Improvement | | | 4.000 | | | | 06/01/2019 | | | AA-* | | | 100,000 | | | | 111,358 | |
Washington County TN Refunding School and Public Improvement | | | 5.000 | | | | 04/01/2015 | | | Aa2 | | | 200,000 | | | | 210,612 | |
| | | | | | | | | | | | | | | | | | |
| | | | | | | | | | | | | | | | | 1,014,204 | |
| HOSPITAL AND HEALTHCARE | | | | | | | | | | | | | | | | | | |
| 6.62% of Net Assets | | | | | | | | | | | | | | | | | | |
Shelby County TN Health Educational & Housing Facilities | | | 4.250 | | | | 09/01/2020 | | | AA-* | | | 265,000 | | | | 287,740 | |
Shelby County Health Education | | | 5.250 | | | | 09/01/2020 | | | A2/AA-* | | | 400,000 | | | | 441,540 | |
| | | | | | | | | | | | | | | | | | |
| | | | | | | | | | | | | | | | | 729,280 | |
The accompanying footnotes are an integral part of the financial statements.
41
DUPREE MUTUAL FUNDS — TENNESSEE TAX-FREE SHORT-TO-MEDIUM SERIES
SCHEDULE OF PORTFOLIO INVESTMENTS
Tennessee Municipal Bonds — 100% of Net Assets
June 30, 2013
| | | | | | | | | | | | | | | | | | |
| Bond Description | | Coupon | | | Maturity
Date | | | Rating# | | Par Value | | | Fair Value | |
| STATE AND LOCAL MORTGAGE/HOUSING BONDS | | | | | | | | | | | | | | | | | | |
| 6.49% of Net Assets | | | | | | | | | | | | | | | | | | |
TN Housing Development Agency Homeownership Program | | | 4.200 | % | | | 01/01/2016 | | | Aa1/AA+* | | $ | 125,000 | | | $ | 129,810 | |
TN Housing Development Agency — Series 1B | | | 4.800 | | | | 07/01/2024 | | | Aa1/AA+* | | | 230,000 | | | | 238,386 | |
TN Housing Development Agency Homeownership Program — 2 | | | 2.950 | | | | 01/01/2015 | | | Aa1/AA+* | | | 100,000 | | | | 102,637 | |
TN State Housing Development Agency Homeownership Program | | | 1.900 | | | | 07/01/2019 | | | Aa1/AA+* | | | 250,000 | | | | 243,868 | |
| | | | | | | | | | | | | | | | | | |
| | | | | | | | | | | | | | | | | 714,701 | |
| UNIVERSITY CONSOLIDATED EDUCATION AND BUILDING REVENUE BONDS | | | | | | | | | | | |
| 5.01% of Net Assets | | | | | | | | | | | | | | | | | | |
Franklin County TN Health & Education Facilities | | | 4.000 | | | | 09/01/2019 | | | A+* | | | 500,000 | | | | 552,600 | |
| | | | | | | | | | | | | | | | | | |
| | | | | | | | | | | | | | | | | 552,600 | |
| PUBLIC FACILITIES REVENUE BONDS | | | | | | | | | | | |
| 5.00% of Net Assets | | | | | | | | | | | | | | | | | | |
Memphis-Shelby County TN Sports Authority Memphis Arena | | | 5.000 | | | | 11/01/2017 | | | Aa3/AA-*/A+@ | | | 275,000 | | | | 309,625 | |
Metropolitan Government Nashville & Davidson County TN Convention | | | 5.000 | | | | 07/01/2015 | | | A1/A* | | | 125,000 | | | | 134,501 | |
Metropolitan Government Nashville & Davidson County TN Convention | | | 3.750 | | | | 07/01/2018 | | | A1/A* | | | 100,000 | | | | 107,067 | |
| | | | | | | | | | | | | | | | | | |
| | | | | | | | | | | | | | | | | 551,193 | |
| AIRPORT BONDS | | | | | | | | | | | |
| 2.36% of Net Assets | | | | | | | | | | | | | | | | | | |
Metropolitan Nashville Airport Authority — Series A | | | 4.500 | % | | | 07/01/2014 | | | A2/AA-* | | | 250,000 | | | | 259,993 | |
| | | | | | | | | | | | | | | | | | |
Total Investments 97.35% of Net Assets
(cost $10,526,985) (See (a) below for further explanation) | | | | | | | | | $ | 10,728,658 | |
| | | | | | | | | | | | | | | | | | |
Other assets in excess of liabilities 2.65% | | | | | | | | | | | | | | | | | 292,036 | |
| | | | | | | | | | | | | | | | | | |
Net Assets 100% | | | | | | | | | | | | | | | | $ | 11,020,694 | |
| | | | | | | | | | | | | | | | | | |
| | * | | Standard and Poor’s Corporation |
| | @ | | Fitch’s Investors Service (All other ratings by Moody’s Investors Service, Inc.) |
| | # | | Bond ratings are unaudited and not covered by Report of Independent Registered Public Accounting Firm. |
| (a) | | Cost for federal income tax purposes is $10,743,379 and net unrealized depreciation of investments is as follows: |
| | | | | | |
| | | | | | |
| | Unrealized appreciation | | $ | 281,153 | |
| | Unrealized depreciation | | | (295,874 | ) |
| | | | | | |
| | Net unrealized depreciation | | $ | (14,721 | ) |
| | | | | | |
Other Information
The following is a summary of the inputs used, as of June 30, 2013 involving the Fund’s investments in securities carried at fair value. The inputs or methodology used for valuing securities may not be an indication of the risk associated with investing in those securities. For more information on valuation inputs, and their aggregation into the levels used in the table below, please refer to the Security Valuation section in the accompanying Notes to Financial Statements.
| | | | | | |
| | | Valuation Inputs | | Municipal Bonds | |
| | | | | | |
Level 1 | | Quoted Prices | | $ | — | |
Level 2 | | Other Significant Observable Inputs | | | 10,728,658 | |
Level 3 | | Significant Unobservable Inputs | | | — | |
| | | | | | |
| | | | $ | 10,728,658 | |
| | | | | | |
The accompanying footnotes are an integral part of the financial statements.
42
TENNESSEE TAX-FREE SHORT-TO-MEDIUM SERIES
STATEMENT OF ASSETS AND LIABILITIES
June 30, 2013
| | | | | | | | |
ASSETS: | | | | | | | | |
Investments in securities, at fair value (Cost: $10,526,985) | | | | | | $ | 10,728,658 | |
Cash | | | | | | | 171,522 | |
Defaulted securities receivable | | | | | | | 23,606 | |
Interest receivable | | | | | | | 119,150 | |
| | | | | | | | |
Total assets | | | | | | | 11,042,936 | |
LIABILITIES: | | | | | | | | |
Payable for: | | | | | | | | |
Distributions to shareholders | | | 5,685 | | | | | |
Fund shares redeemed | | | 1,075 | | | | | |
Investment advisory fee | | | 4,480 | | | | | |
Transfer agent fee | | | 1,407 | | | | | |
Trustees fees | | | 1,059 | | | | | |
Accrued expenses | | | 8,536 | | | | | |
| | | | | | | | |
Total liabilities | | | | | | | 22,242 | |
| | | | | | | | |
NET ASSETS: | | | | | | | | |
Capital | | | | | | | 11,085,017 | |
Net accumulated realized loss on investment transactions | | | | | | | (265,996 | ) |
Net unrealized appreciation in value of investments | | | | | | | 201,673 | |
| | | | | | | | |
Net assets at value | | | | | | $ | 11,020,694 | |
| | | | | | | | |
NET ASSET VALUE, offering price and redemption price per share | | | | | | | | |
($11,020,694 ÷ 1,024,915 shares outstanding; unlimited number of shares authorized; no par value) | | | | | | $ | 10.75 | |
| | | | | | | | |
STATEMENT OF OPERATIONS
For the year ended June 30, 2013
| | | | |
Net investment income: | | | | |
Interest income | | $ | 331,003 | |
| | | | |
Expenses: | | | | |
Investment advisory fee | | | 60,814 | |
Transfer agent fee | | | 18,899 | |
Custodian expense | | | 8,691 | |
Professional fees | | | 3,499 | |
Other expenses | | | 12,669 | |
| | | | |
Total expenses | | | 104,572 | |
Custodian expense reduction | | | (74 | ) |
| | | | |
Net expenses | | | 104,498 | |
| | | | |
Net investment income | | | 226,505 | |
| | | | |
Realized and unrealized gain/(loss) on investments: | | | | |
Net realized gain | | | 46,406 | |
Net change in unrealized appreciation/depreciation | | | (312,568 | ) |
| | | | |
Net realized and unrealized loss on investments | | | (266,162 | ) |
| | | | |
Net increase in net assets resulting from operations | | $ | (39,657 | ) |
| | | | |
The accompanying notes are an integral part of the financial statements.
43
TENNESSEE TAX-FREE SHORT-TO-MEDIUM SERIES
STATEMENTS OF CHANGES IN NET ASSETS
For the years ended June 30, 2013 and 2012
| | | | | | | | |
| | | 2013 | | | 2012 | |
Operations: | | | | | | | | |
Net investment income | | $ | 226,505 | | | $ | 230,540 | |
Net realized gain/(loss) on investments | | | 46,406 | | | | (88 | ) |
Net change in unrealized appreciation/depreciation | | | (312,568 | ) | | | 145,377 | |
| | | | | | | | |
Net increase in net assets resulting from operations | | | (39,657 | ) | | | 375,829 | |
Distributions from net investment income | | | (226,505 | ) | | | (230,540 | ) |
Net fund share transactions (Note 4) | | | (739,399 | ) | | | 1,991,828 | |
| | | | | | | | |
Total decrease | | | (1,005,561 | ) | | | 2,137,117 | |
Net assets: | | | | | | | | |
Beginning of year | | | 12,026,255 | | | | 9,889,138 | |
| | | | | | | | |
End of year | | $ | 11,020,694 | | | $ | 12,026,255 | |
| | | | | | | | |
FINANCIAL HIGHLIGHTS
| | | | | | | | | | | | | | | | | | | | |
| Selected data for a share outstanding: | | For the years ended June 30, | |
| | | 2013 | | | 2012 | | | 2011 | | | 2010 | | | 2009 | |
Net asset value, beginning of year | | | $11.01 | | | | $10.85 | | | | $10.82 | | | | $10.54 | | | | $10.31 | |
| | | | | | | | | | | | | | | | | | | | |
Income from investment operations: | | | | | | | | | | | | | | | | | | | | |
Net investment income | | | 0.20 | | | | 0.24 | | | | 0.26 | | | | 0.28 | | | | 0.31 | |
Net gains/(losses) on securities, both realized and unrealized | | | (0.26 | ) | | | 0.16 | | | | 0.03 | | | | 0.28 | | | | 0.23 | |
| | | | | | | | | | | | | | | | | | | | |
Total from investment operations | | | (0.06 | ) | | | 0.40 | | | | 0.29 | | | | 0.56 | | | | 0.54 | |
Less distributions: | | | | | | | | | | | | | | | | | | | | |
Distributions from net investment income | | | (0.20 | ) | | | (0.24 | ) | | | (0.26 | ) | | | (0.28 | ) | | | (0.31 | ) |
| | | | | | | | | | | | | | | | | | | | |
Net asset value, end of period | | | $10.75 | | | | $11.01 | | | | $10.85 | | | | $10.82 | | | | $10.54 | |
| | | | | | | | | | | | | | | | | | | | |
Total return | | | (0.53 | )% | | | 3.74% | | | | 2.72% | | | | 5.39% | | | | 5.31% | |
Net assets, end of period (in thousands) | | | $11,021 | | | | $12,026 | | | | $9,889 | | | | $10,113 | | | | $9,075 | |
Ratio of net expenses to average net assets (a) | | | 0.86% | | | | 0.87% | | | | 0.80% | | | | 0.81% | | | | 0.82% | |
Ratio of net investment income to average net assets | | | 1.86% | | | | 2.21% | | | | 2.40% | | | | 2.63% | | | | 2.97% | |
Portfolio turnover | | | 20.56% | | | | 1.86% | | | | 18.32% | | | | 16.16% | | | | 15.00% | |
| (a) | | Percentages are after expenses waived by Adviser and Custodian reduction. No recovery of these waivers and reductions will be sought. Expenses waived by Adviser and custodian were: 0% and 0% for 2013; 0% and 0% for 2012; .02% and 0% for 2011; .02% and 0% for 2010; and 0% and .04% for 2009, respectively. |
The accompanying notes are an integral part of the financial statements.
44
DUPREE MUTUAL FUNDS — INTERMEDIATE GOVERNMENT BOND SERIES | |
SCHEDULE OF PORTFOLIO INVESTMENTS
U.S. Government Securities and Agencies — 100% of Net Assets
June 30, 2013
| | | | | | | | | | | | | | | | | | |
| Bond Description | | Coupon | | | Maturity
Date | | | Rating# | | Par Value | | | Fair Value | |
| | | | | | | | | | | | | | | | | | |
| FEDERAL FARM CREDIT | | | | | | | | | | | | | | | | | | |
| 65.80% of Net Assets | | | | | | | | | | | | | | | | | | |
Federal Farm Credit Bank | | | 5.300 | % | | | 06/24/2014 | | | Aaa/AA+*/AAA@ | | $ | 1,400,000 | | | $ | 1,469,500 | |
Federal Farm Credit Bank | | | 5.250 | | | | 10/25/2022 | | | Aaa/AA+*/AAA@ | | | 1,500,000 | | | | 1,775,663 | |
Federal Farm Credit Bank | | | 5.875 | | | | 08/16/2021 | | | Aaa/AA+*/AAA@ | | | 1,900,000 | | | | 1,911,702 | |
Federal Farm Credit Bank | | | 5.050 | | | | 12/21/2021 | | | Aaa/AA+*/AAA@ | | | 370,000 | | | | 430,690 | |
Federal Farm Credit Bank | | | 5.840 | | | | 07/20/2022 | | | Aaa/AA+*/AAA@ | | | 2,650,000 | | | | 3,213,917 | |
Federal Farm Credit Bank | | | 5.250 | | | | 05/10/2022 | | | Aaa/AA+*/AAA@ | | | 2,000,000 | | | | 2,337,018 | |
Federal Farm Credit Bank | | | 5.125 | | | | 11/28/2022 | | | Aaa/AA+*/AAA@ | | | 2,000,000 | | | | 2,336,986 | |
Federal Farm Credit Bank | | | 2.330 | | | | 08/01/2025 | | | Aaa/AA+*/AAA@ | | | 500,000 | | | | 442,816 | |
Federal Farm Credit Bank | | | 2.980 | | | | 08/21/2026 | | | Aaa/AA+*/AAA@ | | | 750,000 | | | | 705,239 | |
Federal Farm Credit Bank | | | 3.000 | | | | 03/18/2026 | | | Aaa/AA+*/AAA@ | | | 750,000 | | | | 706,715 | |
| | | | | | | | | | | | | | | | | | |
| | | | | | | | | | | | | | | | | 15,330,247 | |
| FEDERAL HOME LOAN BANK | | | | | | | | | | | | | | | | | | |
| 21.21% of Net Assets | | | | | | | | | | | | | | | | | | |
Federal Home Loan Bank | | | 2.665 | | | | 03/08/2024 | | | Aaa/AA+* | | | 250,000 | | | | 238,974 | |
Federal Home Loan Banks | | | 7.000 | | | | 08/15/2014 | | | Aaa/AA+* | | | 500,000 | | | | 537,791 | |
Federal Home Loan Bank | | | 5.250 | | | | 12/11/2020 | | | Aaa/AA+* | | | 985,000 | | | | 1,171,545 | |
Federal Home Loan Bank | | | 5.000 | | | | 12/10/2021 | | | Aaa/AA+* | | | 500,000 | | | | 587,587 | |
Federal Home Loan Bank | | | 5.750 | | | | 06/10/2022 | | | Aaa/AA+* | | | 2,000,000 | | | | 2,449,968 | |
| | | | | | | | | | | | | | | | | | |
| | | | | | | | | | | | | | | | | 4,985,865 | |
| FEDERAL NATIONAL MORTGAGE ASSOCIATION | | | | | | | | | | | | | | | | | | |
| 5.75% of Net Assets | | | | | | | | | | | | | | | | | | |
Federal National Mortgage Association | | | 8.100 | | | | 08/12/2019 | | | Aaa/AA+*/AAA@ | | | 1,000,000 | | | | 1,346,953 | |
| | | | | | | | | | | | | | | | | | |
| FEDERAL HOME LOAN MORTGAGE | | | | | | | | | | | | | | | | | | |
| 3.95% of Net Assets | | | | | | | | | | | | | | | | | | |
Federal Home Loan Mortgage Corporation | | | 2.50 | | | | 11/08/2024 | | | Aaa/AA+*/AAA@ | | | 1,000,000 | | | | 922,928 | |
| | | | | | | | | | | | | | | | | | |
Total Investments 96.71% of Net Assets (cost $22,315,324) (See (a) below for further explanation) | | | | | | | | | $ | 22,585,993 | |
| | | | | | | | | | | | | | | | | | |
Other assets in excess of liabilities 3.29% | | | | | | | | | | | | | | | | | 809,323 | |
| | | | | | | | | | | | | | | | | | |
Net Assets 100% | | | | | | | | | | | | | | | | $ | 23,395,316 | |
| | | | | | | | | | | | | | | | | | |
| | * | | Standard and Poor’s Corporation |
| | @ | | Fitch’s Investors Service All other ratings by Moody’s Investors Service, Inc. |
| | # | | Bond ratings unaudited and not covered by Report of Independent Registered Public Accounting Firm. |
| (a) | | Cost for federal income tax purposes is $22,315,324 and net unrealized appreciation of investments is as follows: |
| | | | | | |
| | | | | | |
| | Unrealized appreciation | | $ | 564,453 | |
| | Unrealized depreciation | | | (293,784 | ) |
| | | | | | |
| | Net unrealized appreciation | | $ | 270,669 | |
| | | | | | |
Other Information
The following is a summary of the inputs used, as of June 30, 2013, involving the Fund’s investments in securities carried at fair value. The inputs or methodology used for valuing securities may not be an indication of the risk associated with investing in those securities. For more information on valuation inputs, and their aggregation into the levels used the table below, please refer to the Security Valuation in the accompanying Notes to Financial Statements.
| | | | | | | | | | |
| | | Valuation Inputs | | Government Agencies | | | Total | |
| | | | | | | | | | |
Level 1 | | Quoted Prices | | $ | — | | | $ | — | |
Level 2 | | Other Significant Observable Inputs | | | 22,585,993 | | | | 22,585,993 | |
Level 3 | | Significant Unobservable Inputs | | | — | | | | — | |
| | | | | | | | | | |
| | | | | | | | $ | 22,585,993 | |
| | | | | | | | | | |
The accompanying footnotes are an integral part of the financial statements.
45
INTERMEDIATE GOVERNMENT BOND SERIES
STATEMENT OF ASSETS AND LIABILITIES
June 30, 2013
| | | | | | | | |
ASSETS: | | | | | | | | |
Investments in securities, at fair value (Cost: $22,315,324) | | | | | | $ | 22,585,993 | |
Cash | | | | | | | 618,376 | |
Interest receivable | | | | | | | 232,360 | |
| | | | | | | | |
Total assets | | | | | | | 23,436,729 | |
LIABILITIES: | | | | | | | | |
Payable for: | | | | | | | | |
Distributions to shareholders | | | 15,085 | | | | | |
Fund shares redeemed | | | 3,057 | | | | | |
Investment advisory fee | | | 3,972 | | | | | |
Transfer agent fee | | | 5,517 | | | | | |
Accrued expenses | | | 13,782 | | | | | |
| | | | | | | | |
Total liabilities | | | | | | | 41,413 | |
| | | | | | | | |
NET ASSETS: | | | | | | | | |
Capital | | | | | | | 23,232,462 | |
Accumulated net investment income | | | | | | | 185 | |
Net accumulated realized loss on investment transactions | | | | | | | (108,000 | ) |
Net unrealized appreciation in value of investments | | | | | | | 270,669 | |
| | | | | | | | |
Net assets at value | | | | | | $ | 23,395,316 | |
| | | | | | | | |
NET ASSET VALUE, offering price and redemption price per share
($23,395,316 -:- 2,326,937 shares outstanding; unlimited number of shares authorized; no par value) | | | $ | 10.05 | |
| | | | | | | | |
STATEMENT OF OPERATIONS
For the year ended June 30, 2013
| | | | |
Net investment income: | | | | |
Interest income | | $ | 835,490 | |
| | | | |
Expenses: | | | | |
Investment advisory fee | | | 51,441 | |
Transfer agent fee | | | 39,486 | |
Custodian expense | | | 8,720 | |
Professional fees | | | 5,264 | |
Printing | | | 10,001 | |
Pricing | | | 8,001 | |
Trustees fees | | | 3,363 | |
Other expenses | | | 12,542 | |
| | | | |
Total expenses | | | 138,818 | |
Fees waived by Adviser | | | (16,510 | ) |
Custodian expense reduction | | | (163 | ) |
| | | | |
Net expenses | | | 122,145 | |
| | | | |
Net investment income | | | 713,345 | |
| | | | |
Realized and unrealized loss on investments: | | | | |
Net realized loss | | | (22,547 | ) |
Net change in unrealized appreciation/depreciation | | | (1,213,820 | ) |
| | | | |
Net realized and unrealized loss on investments | | | (1,236,367 | ) |
| | | | |
Net decrease in net assets resulting from operations | | $ | (523,022 | ) |
| | | | |
The accompanying notes are an integral part of the financial statements.
46
INTERMEDIATE GOVERNMENT BOND SERIES
STATEMENTS OF CHANGES IN NET ASSETS
For the years ended June 30, 2013 and 2012
| | | | | | | | |
| | | 2013 | | | 2012 | |
Operations: | | | | | | | | |
Net investment income | | $ | 713,345 | | | $ | 837,279 | |
Net realized gain/(loss) on investments | | | (22,547 | ) | | | 11,485 | |
Net change in unrealized appreciation/depreciation | | | (1,213,820 | ) | | | 1,563,467 | |
| | | | | | | | |
Net increase/(decrease) in net assets resulting from operations | | | (523,022 | ) | | | 2,412,231 | |
Distributions from net investment income | | | (713,160 | ) | | | (837,279 | ) |
Net fund share transactions (Note 4) | | | (1,198,761 | ) | | | (748,612 | ) |
| | | | | | | | |
Total increase | | | (2,434,943 | ) | | | 826,340 | |
Net assets: | | | | | | | | |
Beginning of year | | | 25,830,259 | | | | 25,003,919 | |
| | | | | | | | |
End of year | | $ | 23,395,316 | | | $ | 25,830,259 | |
| | | | | | | | |
Accumulated Net Investment Income | | $ | 185 | | | $ | — | |
| | | | | | | | |
FINANCIAL HIGHLIGHTS
| | | | | | | | | | | | | | | | | | | | |
| Selected data for a share outstanding: | | For the years ended June 30, | |
| | | 2013 | | | 2012 | | | 2011 | | | 2010 | | | 2009 | |
Net asset value, beginning of year | | | $10.58 | | | | $9.96 | | | | $10.24 | | | | $10.05 | | | | $9.93 | |
| | | | | | | | | | | | | | | | | | | | |
Income from investment operations: | | | | | | | | | | | | | | | | | | | | |
Net investment income | | | 0.30 | | | | 0.34 | | | | 0.35 | | | | 0.44 | | | | 0.46 | |
Net gains/(losses) on securities, both realized and unrealized | | | (0.53 | ) | | | 0.62 | | | | (0.28 | ) | | | 0.19 | | | | 0.12 | |
| | | | | | | | | | | | | | | | | | | | |
Total from investment operations | | | (0.23 | ) | | | 0.96 | | | | 0.07 | | | | 0.63 | | | | 0.58 | |
Less distributions: | | | | | | | | | | | | | | | | | | | | |
Distributions from net investment income | | | (0.30 | ) | | | (0.34 | ) | | | (0.35 | ) | | | (0.44 | ) | | | (0.46 | ) |
| | | | | | | | | | | | | | | | | | | | |
Net asset value, end of year | | | $10.05 | | | | $10.58 | | | | $9.96 | | | | $10.24 | | | | $10.05 | |
| | | | | | | | | | | | | | | | | | | | |
Total return | | | (2.34)% | | | | 9.72% | | | | 0.71% | | | | 6.38% | | | | 5.99% | |
Net assets, end of year (in thousands) | | | $23,395 | | | | $25,830 | | | | $25,004 | | | | $42,053 | | | | $25,431 | |
Ratio of net expenses to average net assets (a) | | | 0.48% | | | | 0.52% | | | | 0.46% | | | | 0.47% | | | | 0.47% | |
Ratio of net investment income to average net assets | | | 2.77% | | | | 3.25% | | | | 3.48% | | | | 4.30% | | | | 4.62% | |
Portfolio turnover | | | 16.02% | | | | 8.94% | | | | 72.86% | | | | 56.38% | | | | 30.35% | |
| (a) | | Percentages are after expenses waived by Adviser and Custodian reduction. No recovery of these waivers and reductions will be sought. Expenses waived by Adviser and Custodian reduction were: .06% and 0% for 2013; 0% and 0% for 2012; 0% and 0% for 2011; 0% and 0% for 2010; and 0% and .02% for 2009, respectively. |
The accompanying notes are an integral part of the financial statements.
47
DUPREE MUTUAL FUNDS — TAXABLE MUNICIPAL BOND SERIES
SCHEDULE OF PORTFOLIO INVESTMENTS
Taxable Municipal Bonds — 100% of Net Assets
June 30, 2013
| | | | | | | | | | | | | | | | | | |
| Bond Description | | Coupon | | | Maturity
Date | | | Rating# | | Par Value | | | Fair Value | |
| | | | | | | | | | | | | | | | | | |
| PUBLIC FACILITIES REVENUE BONDS | | | | | | | | | | | | | | | | | | |
| 30.24% of Net Assets | | | | | | | | | | | | | | | | | | |
Buncombe County NC Limited Obligation Build America | | | 6.800 | % | | | 06/01/2030 | | | Aa2/AA+* | | $ | 250,000 | | | $ | 296,115 | |
Colorado State Certificates of Participation Build America | | | 6.450 | | | | 09/15/2039 | | | Aa2/AA-* | | | 50,000 | | | | 58,362 | |
Rhode Island Convention Center | | | 6.060 | | | | 05/15/2035 | | | Aa3/AA-*/AA-@ | | | 70,000 | | | | 72,409 | |
Dallas Convention Center Hotel Development Corporation | | | 7.088 | | | | 01/01/2042 | | | A1/A+* | | | 280,000 | | | | 331,184 | |
Decatur GA Urban Redevelopment Agency Revenue Build America | | | 6.920 | | | | 01/01/2038 | | | Aa2/AA+* | | | 150,000 | | | | 176,994 | |
Franklin County OH Convention Facilities Build America | | | 6.540 | | | | 12/01/2036 | | | Aa2/AA* | | | 515,000 | | | | 569,096 | |
Franklin County OH Convention Facilities Build America | | | 6.640 | | | | 12/01/2042 | | | Aa2/AA* | | | 130,000 | | | | 142,383 | |
Grand Junction CO Certificates of Participation Build America | | | 7.500 | | | | 12/01/2030 | | | A+* | | | 500,000 | | | | 568,085 | |
Grand Junction CO Certificates of Participation Build America | | | 7.650 | | | | 12/01/2040 | | | A+* | | | 50,000 | | | | 56,122 | |
Las Vegas NV Certificates of Participation | | | 7.800 | | | | 09/01/2039 | | | Aa3/AA-*/AA-@ | | | 60,000 | | | | 68,811 | |
Metro Government Nashville & Davidson County TN Sports Authority | | | 5.231 | | | | 07/01/2033 | | | Aa2/AA-* | | | 100,000 | | | | 100,776 | |
Metropolitan Government Nashville & Davidson County TN Convention Build America | | | 7.431 | | | | 07/01/2043 | | | A1/A* | | | 160,000 | | | | 183,582 | |
Metropolitan Government Nashville and Davidson County TN | | | 6.731 | | | | 07/01/2043 | | | Aa2/A* | | | 125,000 | | | | 145,315 | |
Miami Lakes FL Special Obligation Build America | | | 7.627 | | | | 12/01/2040 | | | Aa3/AA@ | | | 255,000 | | | | 314,879 | |
Pennington County SD Certificates of Participation Build America | | | 7.200 | | | | 06/01/2037 | | | Aa2 | | | 750,000 | | | | 849,270 | |
Sarasota County FL Capital Improvement Revenue Build America | | | 7.016 | | | | 10/01/2040 | | | AA+*/AA+@ | | | 710,000 | | | | 804,004 | |
Talladega County AL Build America Recovery Zone | | | 5.600 | | | | 04/01/2040 | | | A1 | | | 100,000 | | | | 102,475 | |
| | | | | | | | | | | | | | | | | | |
| | | | | | | | | | | | | | | | | 4,839,862 | |
| MUNICIPAL UTILITY REVENUE BONDS | | | | | | | | | | | | | | | | | | |
| 28.50% of Net Assets | | | | | | | | | | | | | | | | | | |
Altoona PA Water Authority Sewer Revenue Build America | | | 7.064 | | | | 12/01/2040 | | | AA-* | | | 500,000 | | | | 565,650 | |
Davie FL Water & Sewer Revenue Build America | | | 6.849 | | | | 10/01/2040 | | | A1/AA-* | | | 40,000 | | | | 45,521 | |
East Bethel MN Build America Utilities | | | 7.000 | | | | 02/01/2040 | | | Aa3 | | | 250,000 | | | | 269,625 | |
Gainesville FL Utilities System Revenue Build America | | | 6.024 | | | | 10/01/2040 | | | Aa2/AA*/AA-@ | | | 250,000 | | | | 279,423 | |
Heber UT Light & Power Build America | | | 7.000 | | | | 12/15/2030 | | | A2/AA-@ | | | 500,000 | | | | 563,970 | |
Louisville & Jefferson County KY Sewer District Build America | | | 5.980 | | | | 05/15/2040 | | | Aa3/AA*/AA-@ | | | 250,000 | | | | 287,213 | |
Louisville & Jefferson County KY Sewer District Build America | | | 6.250 | | | | 05/15/2043 | | | Aa3/AA*/AA-@ | | | 75,000 | | | | 91,974 | |
Metrolpolitan Government Nashville & Davidson County TN Recovery Zone | | | 6.693 | | | | 07/01/2041 | | | Aa3/AA-* | | | 200,000 | | | | 247,928 | |
North Fort Bend Water Authority TX Water System Revenue | | | 6.018 | | | | 12/15/2035 | | | A2/AA-*/A+@ | | | 250,000 | | | | 266,008 | |
Omaha NE Sewer Revenue Build America | | | 6.191 | | | | 12/01/2040 | | | Aa2/AA* | | | 400,000 | | | | 425,152 | |
Pigeon Forge TN Build America Recovery Zone | | | 7.125 | | | | 06/01/2040 | | | AA* | | | 300,000 | | | | 355,242 | |
Sedalia MO Certificates of Participation Build America | | | 7.300 | | | | 06/01/2035 | | | AA-* | | | 500,000 | | | | 534,030 | |
West Knox Utilities District Knox County TN Water and Sewer | | | 6.900 | | | | 06/01/2040 | | | AA+* | | | 400,000 | | | | 463,212 | |
Williamsport PA Municipal Water Authority Build America | | | 6.100 | | | | 01/01/2040 | | | A2/AA-* | | | 60,000 | | | | 61,046 | |
York County VA Sewer Revenue Build America | | | 6.607 | | | | 06/01/2040 | | | Aa3 | | | 100,000 | | | | 106,416 | |
| | | | | | | | | | | | | | | | | | |
| | | | | | | | | | | | | | | | | 4,562,410 | |
| SCHOOL IMPROVEMENT BONDS | | | | | | | | | | | | | | | | | | |
| 15.45% of Net Assets | | | | | | | | | | | | | | | | | | |
Armstrong School District PA Build America | | | 7.000 | | | | 03/15/2041 | | | AA-* | | | 750,000 | | | | 826,298 | |
Ashland KY Independent School District Build America | | | 6.200 | | | | 08/01/2029 | | | Aa3 | | | 100,000 | | | | 109,578 | |
Circleville OH City School District Build America | | | 6.300 | | | | 11/01/2040 | | | Aa2 | | | 100,000 | | | | 99,473 | |
Coffee County TN Public Building Authority Build America | | | 7.200 | | | | 06/01/2044 | | | AA-* | | | 350,000 | | | | 391,899 | |
CO State Building Excellent Schools Today Certificates of Participation | | | 7.017 | | | | 03/15/2031 | | | Aa2/AA-* | | | 400,000 | | | | 463,556 | |
Denver County Public Schools Certificates of Participation | | | 7.017 | | | | 12/15/2037 | | | Aa3/A+* | | | 140,000 | | | | 173,660 | |
Edgewood OH City School District Build America | | | 7.500 | | | | 12/01/2037 | | | Aa3/A+* | | | 100,000 | | | | 112,537 | |
Jefferson County TN Build America | | | 6.625 | | | | 06/01/2040 | | | Aa3/A+* | | | 250,000 | | | | 295,437 | |
| | | | | | | | | | | | | | | | | | |
| | | | | | | | | | | | | | | | | 2,472,438 | |
| MISCELLANEOUS PUBLIC IMPROVEMENT BONDS | | | | | | | | | | | | | | | | | | |
| 9.36% of Net Assets | | | | | | | | | | | | | | | | | | |
Downtown Smyrna Development Authority GA | | | 6.900 | | | | 02/01/2035 | | | Aa2/AA+* | | | 250,000 | | | | 267,945 | |
KY State Property & Buildings Build America | | | 5.921 | | | | 11/01/2030 | | | Aa3/A+*/A+@ | | | 250,000 | | | | 282,535 | |
Lincoln AL Build America Recovery Zone | | | 6.800 | | | | 06/01/2040 | | | AA-* | | | 500,000 | | | | 559,865 | |
New York NY Build America | | | 5.968 | | | | 03/01/2036 | | | Aa2/AA*/AA@ | | | 100,000 | | | | 114,706 | |
Scottsboro AL Build America | | | 6.400 | | | | 11/01/2040 | | | A2/AA-* | | | 250,000 | | | | 272,387 | |
| | | | | | | | | | | | | | | | | | |
| | | | | | | | | | | | | | | | | 1,497,438 | |
The accompanying footnotes are an integral part of the financial statements.
48
DUPREE MUTUAL FUNDS — TAXABLE MUNICIPAL BOND SERIES
SCHEDULE OF PORTFOLIO INVESTMENTS
Taxable Municipal Bonds — 100% of Net Assets
June 30, 2013
| | | | | | | | | | | | | | | | | | |
| Bond Description | | Coupon | | | Maturity
Date | | | Rating# | | Par Value | | | Fair Value | |
| | | | | | | | | | | | | | | | | | |
| UNIVERSITY CONSOLIDATED EDUCATION AND BUILDING REVENUE BONDS | |
| 6.19% of Net Assets | | | | | | | | | | | | | | | | | | |
CO State School of Mines Enterprises Revenue Build America | | | 6.090 | % | | | 12/01/2029 | | | Aa2/AA-* | | $ | 110,000 | | | $ | 120,335 | |
Maine Health and Higher Educational Facilities Authority | | | 6.667 | | | | 07/01/2039 | | | Aa2 | | | 200,000 | | | | 220,692 | |
Mesa State College CO Auxiliary Facilities Build America | | | 6.746 | | | | 05/15/2042 | | | Aa2/AA-* | | | 100,000 | | | | 121,767 | |
OK Development Finance Authority Lease Revenue | | | 5.650 | | | | 06/01/2041 | | | AA*/AA@ | | | 410,000 | | | | 425,072 | |
University NC Wilmington Revenue Build America | | | 5.870 | | | | 01/01/2035 | | | A1 | | | 100,000 | | | | 102,383 | |
| | | | | | | | | | | | | | | | | | |
| | | | | | | | | | | | | | | | | 990,249 | |
| TURNPIKES/TOLLROAD/HIGHWAY BONDS | | | | | | | | | | | | | | | | | | |
| 2.14% of Net Assets | | | | | | | | | | | | | | | | | | |
FL State Turnpike Authority Turnpike Revenue Build America | | | 6.800 | | | | 07/01/2039 | | | Aa3/AA-*/AA-@ | | | 300,000 | | | | 342,579 | |
| | | | | | | | | | | | | | | | | | |
| | | | | | | | | | | | | | | | | 342,579 | |
| REFUNDING BONDS | | | | | | | | | | | | | | | | | | |
| 1.81% of Net Assets | | | | | | | | | | | | | | | | | | |
Bexar County TX Revenue Venue Project Series B | | | 6.980 | | | | 08/15/2032 | | | Aa1/AA+*/A+@ | | | 250,000 | | | | 290,373 | |
| | | | | | | | | | | | | | | | | | |
| | | | | | | | | | | | | | | | | 290,373 | |
| HOSPITAL AND HEALTHCARE | | | | | | | | | | | | | | | | | | |
| 1.76% of Net Assets | | | | | | | | | | | | | | | | | | |
University NC Chapel Hill Hospital Revenue Build America | | | 6.329 | | | | 02/01/2031 | | | Aa3/AA* | | | 250,000 | | | | 281,340 | |
| | | | | | | | | | | | | | | | | | |
| | | | | | | | | | | | | | | | | 281,340 | |
| STATE AND LOCAL MORTGAGE/HOUSING BONDS | | | | | | | | | | | | | | | | | | |
| 1.27% of Net Assets | | | | | | | | | | | | | | | | | | |
Virginia State Housing Development Authority Taxable Rental | | | 5.251 | | | | 01/01/2039 | | | Aa1/AA+* | | | 200,000 | | | | 202,488 | |
| | | | | | | | | | | | | | | | | | |
| | | | | | | | | | | | | | | | | 202,488 | |
| | | | | | | | | | | | | | | | | | |
Total Investments 96.72% of Net Assets (cost $14,401,241) (See (a) below for further explanation) | | | | | | $ | 15,479,177 | |
| | | | | | | | | | | | | | | | | | |
Other assets in excess of liabilities 3.28% | | | | | | | | | | | | | | | | | 527,111 | |
| | | | | | | | | | | | | | | | | | |
Net Assets 100% | | | | | | | | | | | | | | | | $ | 16,006,288 | |
| | | | | | | | | | | | | | | | | | |
| | * | | Standard and Poor’s Corporation |
| | @ | | Fitch’s Investors Service |
| | | | (All other ratings by Moody’s Investors Service, Inc.) |
| | # | | Bond ratings are unaudited and not covered by Report of Independent Registered Public Accounting Firm. |
| (a) | | Cost for federal income tax purposes is $14,401,241 and net unrealized appreciation of investments is as follows: |
| | | | | | |
| | | | | | |
| | Unrealized appreciation | | $ | 1,228,764 | |
| | Unrealized depreciation | | | (150,828 | ) |
| | | | | | |
| | Net unrealized appreciation | | $ | 1,077,936 | |
| | | | | | |
Other Information
The following is a summary of the inputs used, as of June 30, 2013 involving the Fund’s investments in securities carried at fair value. The inputs or methodology used for valuing securities may not be an indication of the risk associated with investing in those securities. For more information on valuation inputs, and their aggregation into the levels used in the table below, please refer to the Security Valuation section in the accompanying Notes to Financial Statements.
| | | | | | |
| | | | | | |
| | | Valuation Inputs | | Municipal Bonds | |
Level 1 | | Quoted Prices | | $ | — | |
Level 2 | | Other Significant Observable Inputs | | | 15,479,177 | |
Level 3 | | Significant Unobservable Inputs | | | — | |
| | | | | | |
| | | | $ | 15,479,177 | |
| | | | | | |
The accompanying footnotes are an integral part of the financial statements.
49
TAXABLE MUNICIPAL BOND SERIES
STATEMENT OF ASSETS AND LIABILITIES
June 30, 2013
| | | | | | | | |
ASSETS: | | | | | | | | |
Investments in securities, at fair value (Cost: $14,401,241) | | | | | | $ | 15,479,177 | |
Cash | | | | | | | 383,947 | |
Interest receivable | | | | | | | 187,546 | |
Prepaid expenses | | | | | | | 2,826 | |
| | | | | | | | |
Total assets | | | | | | | 16,053,496 | |
LIABILITIES: | | | | | | | | |
Payable for: | | | | | | | | |
Distributions to shareholders | | | 37,703 | | | | | |
Investment advisory fee | | | 6,672 | | | | | |
Transfer agent fee | | | 1,946 | | | | | |
Trustees fees | | | 887 | | | | | |
| | | | | | | | |
Total liabilities | | | | | | | 47,208 | |
| | | | | | | | |
NET ASSETS: | | | | | | | | |
Capital | | | | | | | 14,857,862 | |
Accumulated net investment income | | | | | | | 530 | |
Net accumulated realized gain on investment transactions | | | | | | | 69,960 | |
Net unrealized appreciation in value of investments | | | | | | | 1,077,936 | |
| | | | | | | | |
Net assets at value | | | | | | $ | 16,006,288 | |
| | | | | | | | |
NET ASSET VALUE, offering price and redemption price per share
($16,006,288 -:- 1,531,454 shares outstanding; unlimited number of shares authorized; no par value) | | | $ | 10.45 | |
| | | | | | | | |
STATEMENT OF OPERATIONS
For the year ended June 30, 2013
| | | | | | |
Net investment income: | | | | | | |
Interest income | | | | $ | 902,487 | |
| | | | | | |
Expenses: | | | | | | |
Investment advisory fee | | | | | 81,480 | |
Transfer agent fee | | | | | 24,655 | |
Custodian expense | | | | | 6,989 | |
Professional fees | | | | | 1,433 | |
Pricing | | | | | 8,001 | |
Other expenses | | | | | 12,939 | |
| | | | | | |
Total expenses | | | | | 135,497 | |
Fees waived by Adviser | | | | | (508 | ) |
Custodian expense reduction | | | | | (99 | ) |
| | | | | | |
Net expenses | | | | | 134,890 | |
| | | | | | |
Net investment income | | | | | 767,597 | |
| | | | | | |
Realized and unrealized gain/(loss) on investments: | | | | | | |
Net realized gain | | | | | 110,538 | |
Net change in unrealized appreciation/depreciation | | | | | (655,652 | ) |
| | | | | | |
Net realized and unrealized loss on investments | | | | | (545,114 | ) |
| | | | | | |
Net increase in net assets resulting from operations | | | | $ | 222,483 | |
| | | | | | |
The accompanying notes are an integral part of the financial statements.
50
TAXABLE MUNICIPAL BOND SERIES
STATEMENT OF CHANGES IN NET ASSETS
For the years ended June 30, 2013 and 2012
| | | | | | | | |
| | | 2013 | | | 2012 | |
Operations: | | | | | | | | |
Net investment income | | $ | 767,597 | | | $ | 696,880 | |
Net realized gain/(loss) on investments | | | 110,538 | | | | — | |
Net change in unrealized appreciation/depreciation | | | (655,652 | ) | | | 1,483,917 | |
| | | | | | | | |
Net increase in net assets resulting from operations | | | 222,483 | | | | 2,180,797 | |
Distributions from net investment income | | | (767,284 | ) | | | (696,663 | ) |
Distributions from capital gains | | | (19,468 | ) | | | | |
Net fund share transactions (Note 4) | | | 528,225 | | | | 3,686,285 | |
| | | | | | | | |
Total increase/(decrease) | | | (36,044 | ) | | | 5,170,419 | |
Net assets: | | | | | | | | |
Beginning of year | | | 16,042,332 | | | | 10,871,913 | |
| | | | | | | | |
End of year | | $ | 16,006,288 | | | $ | 16,042,332 | |
| | | | | | | | |
Accumulated Net Investment Income | | $ | 530 | | | $ | 217 | |
| | | | | | | | |
FINANCIAL HIGHLIGHTS
| | | | | | | | | | | | |
| Selected data for a share outstanding: | | For the years ended
June 30, | | | For the period ended
June 30, | |
| | | 2013 | | | 2012 | | | 2011* | |
Net asset value, beginning of period | | | $10.82 | | | | $9.65 | | | | $10.00 | |
| | | | | | | | | | | | |
Income from investment operations: | | | | | | | | | | | | |
Net investment income | | | 0.51 | | | | 0.52 | | | | 0.34 | |
Net gains/(losses) on securities, both realized and unrealized | | | (0.36 | ) | | | 1.17 | | | | (0.35 | ) |
| | | | | | | | | | | | |
Total from investment operations | | | 0.15 | | | | 1.69 | | | | (0.01 | ) |
Less distributions: | | | | | | | | | | | | |
Distributions from net investment income | | | (0.51 | ) | | | — | | | | — | |
Distributions from capital gains | | | (0.01 | ) | | | (0.52 | ) | | | (0.34 | ) |
| | | | | | | | | | | | |
Total distributions | | | (0.52 | ) | | | (0.52 | ) | | | (0.34 | ) |
| | | | | | | | | | | | |
Net asset value, end of period | | | $10.45 | | | | $10.82 | | | | $9.65 | |
| | | | | | | | | | | | |
Total return | | | 1.35% | | | | 17.77% | | | | 0.04% | (b) |
Net assets, end of period (in thousands) | | | $16,006 | | | | $16,042 | | | | $10,872 | |
Ratio of net expenses to average net assets (a) | | | 0.83% | | | | 0.85% | | | | 0.49% | (c) |
Ratio of net investment income to average net assets | | | 4.71% | | | | 4.95% | | | | 3.71% | (c) |
Portfolio turnover | | | 9.57% | | | | 0.00% | | | | 89.93% | (b) |
| (a) | | Percentages are after expense waivers and reductions by the Adviser and Custodian. The Adviser and Custodian have agreed not to seek recovery of these waivers and reductions. Expenses waived by the Adviser and expense reductions by the Custodian were as follows: |
| | | | | | | | |
| Adviser | | | Custodian | | | |
| | .01% | (c) | | | 0% | (c) | | For the period ended June 30, 2011* |
| | .01% | | | | 0% | | | For the year ended June 30, 2012 |
| | 0% | | | | 0% | | | For the year ended June 30, 2013 |
| * | | Represents the period from commencement of operations (November 1, 2010) through June 30, 2011. |
The accompanying notes are an integral part of the financial statements.
51
NOTES TO FINANCIAL STATEMENTS
June 30, 2013
| 1. | | Organization and Significant Accounting Policies |
Dupree Mutual Funds is registered under the Investment Company Act of 1940, as amended, as a no-load, open-end investment company. The Declaration of Trust of Dupree Mutual Funds (the “Trust”) permits the Trustees to create an unlimited number of series of investment portfolios (each a “Fund” and collectively the “Funds”) and with respect to each series to issue an unlimited number of full or fractional shares of a single class. The Trust currently offers ten series:
Alabama Tax-Free Income Series
Kentucky Tax-Free Income Series
Kentucky Tax-Free Short-to-Medium Series
Mississippi Tax-Free Income Series
North Carolina Tax-Free Income Series
North Carolina Tax-Free Short-to-Medium Series
Tennessee Tax-Free Income Series
Tennessee Tax-Free Short-to-Medium Series
Intermediate Government Bond Series
Taxable Municipal Bond Series
The investment strategy of the eight state tax-free funds is to maintain 100% of their investments in their respective states of Alabama, Kentucky, Mississippi, North Carolina, or Tennessee municipal securities.
The Intermediate Government Bond Series’ investment strategy is to invest only in obligations of the U.S. Treasury and Agencies of the U.S. Government. The Intermediate Government Bond Series will buy bonds and notes that will maintain an average maturity of no more than ten years.
The Taxable Municipal Bond Series’ investment strategy is to invest in taxable municipal bonds of investment grade quality.
The following is a summary of significant accounting policies consistently followed by the Funds in the preparation of their financial statements. The policies are in conformity with accounting principles generally accepted in the United States.
Securities held by the Intermediate Government Bond Series and the Taxable Municipal Bond Series are valued using market quotations as provided by an independent pricing service. Securities held by the eight state tax-free funds are valued as determined in good faith in accordance with consistently applied procedures established by and under the general supervision of the Board of Trustees. These procedures involve the use of a matrix pricing model which takes into consideration price quotations or appraisals for these securities, yield, stability, risk, quality, coupon rate, maturity, type of issue, trading characteristics, special circumstances of a security or trading market, and any other factors or market data considered relevant in determining the value. The procedures also include weekly verification of market quotations provided by two independent pricing services. A bond valuation that is not supported by a valuation source requires management to fair value the security in consultation with the Board’s Valuation committee. Shares of open-end mutual funds in which the Funds invest are valued at their respective net asset values as reported by the underlying funds.
The Funds have adopted the provisions of Financial Accounting Standards Board (FASB) Accounting Standards Codification (ASC) 820, “Fair Value Measurements and Disclosures”. ASC 820 establishes a hierarchy that prioritizes the inputs to valuation techniques giving the highest priority to readily available unadjusted quoted prices in active markets for identical assets (level 1 measurements) and the lowest priority to unobservable inputs (level 3 measurements) when market prices are not readily available or reliable. The three levels of the hierarchy under ASC 820 are described as follows:
52
NOTES TO FINANCIAL STATEMENTS
June 30, 2013
| 1. | | Organization and Significant Accounting Policies, continued |
| | |
| Level 1: | | Quoted prices in active markets for identical securities. |
| Level 2: | | Prices determined using other significant observable inputs. Observable inputs are inputs that other market participants may use in pricing a security. These may include quoted prices for similar securities, interest rates, prepayment speeds, credit risk and others. |
| Level 3: | | Price determined using significant unobservable inputs. In situations where quoted prices or observable inputs are unavailable or deemed less relevant (for example, where there is little or not market activity for an investment at the end of the period), unobservable inputs may be used. Unobservable inputs reflect the Fund’s own assumptions about the factors market participants would use in pricing an investment, and would be based on the best information available. |
The aggregate value by input level, as of June 30, 2013, for the Funds’ investments is included at the end of the Funds’ Schedules of Portfolio Investments. The Funds recognize transfers at the end of the reporting period. There were no transfers in and out of level 1, 2 or 3 during the year ending June 30, 2013.
Security transactions are accounted for on a trade date basis. Gains and losses on securities sold are determined on an identified cost basis.
Interest income, which includes the amortization of premiums and the accretion of discounts, is recorded on an accrual basis.
| | D. | When-Issued and Extended Settlement Securities |
The Funds may purchase securities with delivery or payment to occur at a later date. At the time the Funds enter into a commitment to purchase a security, the transaction is recorded and the value of the security is reflected in the net asset value. The value of the security may vary with market fluctuations. No interest accrues to the Funds until the security is delivered and payment takes place. At the time the Funds enter this type of transaction, they are required to segregate cash or other liquid assets equal to the value of the securities purchased.
It is each Fund’s policy to qualify as a regulated investment company by complying with the requirements of the Internal Revenue Code (the “code”) applicable to regulated investment companies, including the distribution of all or substantially all taxable and tax-exempt income to their shareholders. The Funds have met the requirements of the code applicable to regulated investment companies for the year ended June 30, 2013. Therefore, no federal income tax provision is required. Management of the Funds has concluded that there are no uncertain tax provisions that would require recognition in the financial statements. Generally, the tax authorities can examine all the tax returns for the last three years.
Substantially all of the net investment income of the Funds is declared as a dividend to shareholders of record as of the close of business each day. Distributions are payable in cash or in additional shares at the net asset value on the payable date. Distributions are determined in accordance with income tax regulations.
Distributions are payable:
| | |
| Monthly for: | | Kentucky Tax-Free Short-to-Medium Series |
| | North Carolina Tax-Free Short-to-Medium Series |
| | Tennessee Tax-Free Short-to-Medium Series |
| | Intermediate Government Bond Series |
| | Taxable Municipal Bond Series |
53
NOTES TO FINANCIAL STATEMENTS
June 30, 2013
| 1. | | Organization and Significant Accounting Policies, continued |
| | |
| Quarterly for: | | Alabama Tax-Free Income Series |
| | Kentucky Tax-Free Income Series |
| | Mississippi Tax-Free Income Series |
| | North Carolina Tax-Free Income Series |
| | Tennessee Tax-Free Income Series |
The preparation of financial statements in conformity with generally accepted accounting principles in the United States requires management to make estimates and assumptions that affect the reported amounts and disclosures. Actual amounts could differ from those estimates.
Subsequent events occurring after the date of this report have been evaluated for potential impact to this report through the date the financial statements were issued. There were no subsequent events to report that would have a material impact on the Funds’ financial statements.
| 2. | | Investment Advisory Fee and Other Transactions with Affiliates |
Subject to the direction of the Trustees, Dupree & Company, Inc. (the Adviser) is responsible for the management of the Funds’ portfolios. Under the terms of the Investment Advisory Agreements, for the Alabama, Kentucky, Mississippi, North Carolina, Tennessee, and the Taxable Municipal Bond Series, the Funds have agreed to pay to the Adviser as compensation for all services rendered, facilities furnished and expenses paid or assumed by it under the Agreements, a fee at the annual rate of .50 of 1% of the first $100,000,000 average daily net assets of each Fund determined separately; .45 of 1% of the average daily net assets between $100,000,001 and $150,000,000 of each Fund determined separately; .40 of 1% of the average daily net assets between $150,000,001 and $500,000,000 of each Fund determined separately; .35 of 1% of the average daily net assets between $500,000,001 and 750,000,000; and .30 of 1% of the average daily net assets between $750,000,001 and 1,000,000,000; and .25 of 1% of the average daily net assets in excess of $1,000,000,000. For the Intermediate Government Bond Series, the Fund has agreed to pay to the Adviser, as compensation for all services rendered, facilities furnished and expenses paid or assumed by it under the Agreement, a fee at the annual rate of .20 of 1% of average daily net assets.
The Adviser may voluntarily waive investment advisory fees payable to it under the Investment Advisory Agreement with each Fund, and assume and pay other operating expenses. The Adviser will not seek to recoup any waived fees or other operating expenses it has assumed.
For the year ended June 30, 2013, fees voluntarily waived by the Adviser were as follows:
| | | | |
| | | Fees waived by Adviser | |
Alabama Tax-Free Income Series | | $ | 19,538 | |
Mississippi Tax-Free Income Series | | | 19,516 | |
Tennessee Tax-Free Income Series | | | 40,632 | |
Intermediate Government Bond Series | | | 16,510 | |
Taxable Municipal Bond Series | | | 508 | |
In addition, each Fund has entered into a Shareholder Service Agreement with Dupree & Company, Inc, the Funds’ transfer agent. The agreement provides for a fee computed on the average daily net asset value at the annual rate of .15 of 1% on the first $20,000,000 of average net assets and .12 of 1% of all amounts in excess of $20,000,000 of average net assets for each Fund.
54
NOTES TO FINANCIAL STATEMENTS
June 30, 2013
| 3. | | Purchases and Sales of Securities |
During the year ended June 30, 2013, the cost of purchases and the proceeds from sales/calls and maturities of securities (excluding short-term securities and U.S. government obligations, except for the Intermediate Government Bond Series which are all U.S. government obligations) for each of the Funds were as follows:
| | | | | | | | |
| | | Purchases | | | Sales/Calls | |
Alabama Tax-Free Income Series | | $ | 3,700,329 | | | $ | 1,576,521 | |
Kentucky Tax-Free Income Series | | | 87,940,592 | | | | 69,234,656 | |
Kentucky Tax-Free Short-to-Medium Series | | | 8,853,223 | | | | 5,953,634 | |
Mississippi Tax-Free Income Series | | | 2,022,012 | | | | 1,135,342 | |
North Carolina Tax-Free Income Series | | | 13,233,951 | | | | 3,472,272 | |
North Carolina Tax-Free Short-to-Medium Series | | | 4,894,813 | | | | 2,657,133 | |
Tennessee Tax-Free Income Series | | | 16,633,424 | | | | 7,826,202 | |
Tennessee Tax-Free Short-to-Medium Series | | | 2,450,434 | | | | 3,196,924 | |
Intermediate Government Bond Series | | | 4,048,900 | | | | 4,908,657 | |
Taxable Municipal Bond Series | | | 1,759,747 | | | | 1,528,571 | |
At June 30, 2013 and 2012, there were an unlimited number of shares of beneficial interest authorized. Transactions in capital shares were as follows:
| | | | | | | | | | | | | | | | |
| ALABAMA TAX-FREE INCOME SERIES | | Year Ended June 30, 2013 | | | Year Ended June 30, 2012 | |
| | | SHARES | | | AMOUNT | | | SHARES | | | AMOUNT | |
Shares sold | | | 382,317 | | | $ | 4,839,667 | | | | 188,379 | | | $ | 2,308,608 | |
Shares reinvested | | | 33,429 | | | | 417,792 | | | | 32,781 | | | | 400,946 | |
Shares redeemed | | | (254,710 | ) | | | (3,194,533 | ) | | | (186,821 | ) | | | (2,255,059 | ) |
Net increase | | | 161,036 | | | $ | 2,062,926 | | | | 34,339 | | | $ | 454,495 | |
| | | | | | | | | | | | | | | | |
| KENTUCKY TAX-FREE INCOME SERIES | | Year Ended June 30, 2013 | | | Year Ended June 30, 2012 | |
| | | SHARES | | | AMOUNT | | | SHARES | | | AMOUNT | |
Shares sold | | | 12,157,634 | | | $ | 98,006,608 | | | | 12,628,466 | | | $ | 99,622,755 | |
Shares reinvested | | | 2,362,521 | | | | 18,873,478 | | | | 2,824,157 | | | | 22,312,335 | |
Shares redeemed | | | (15,844,621 | ) | | | (127,179,843 | ) | | | (9,118,696 | ) | | | (71,877,445 | ) |
Net increase/(decrease) | | | (1,324,466 | ) | | $ | (10,299,757 | ) | | | 6,333,927 | | | $ | 50,057,645 | |
| | | | | | | | | | | | | | | | |
KENTUCKY TAX-FREE
SHORT-TO-MEDIUM SERIES | | Year Ended June 30, 2013 | | | Year Ended June 30, 2012 | |
| | | SHARES | | | AMOUNT | | | SHARES | | | AMOUNT | |
Shares sold | | | 4,306,089 | | | $ | 23,875,791 | | | | 5,461,238 | | | $ | 29,954,333 | |
Shares reinvested | | | 241,397 | | | | 1,337,982 | | | | 237,712 | | | | 1,312,023 | |
Shares redeemed | | | (4,245,020 | ) | | | (23,528,134 | ) | | | (2,960,612 | ) | | | (16,311,945 | ) |
Net increase | | | 302,466 | | | $ | 1,685,639 | | | | 2,738,338 | | | $ | 14,954,411 | |
| | | | | | | | | | | | | | | | |
| MISSISSIPPI TAX-FREE INCOME SERIES | | Year Ended June 30, 2013 | | | Year Ended June 30, 2012 | |
| | | SHARES | | | AMOUNT | | | SHARES | | | AMOUNT | |
Shares sold | | | 162,331 | | | $ | 1,982,073 | | | | 108,782 | | | $ | 1,288,526 | |
Shares reinvested | | | 10,255 | | | | 123,882 | | | | 9,387 | | | | 111,323 | |
Shares redeemed | | | (101,079 | ) | | | (1,221,918 | ) | | | (38,842 | ) | | | (461,594 | ) |
Net increase | | | 71,507 | | | $ | 884,037 | | | | 79,327 | | | $ | 938,255 | |
55
NOTES TO FINANCIAL STATEMENTS
June 30, 2013
| 4. | | Capital Shares, continued |
| | | | | | | | | | | | | | | | |
NORTH CAROLINA TAX-FREE
INCOME SERIES | | Year Ended June 30, 2013 | | | Year Ended June 30, 2012 | |
| | | SHARES | | | AMOUNT | | | SHARES | | | AMOUNT | |
Shares sold | | | 1,987,555 | | | $ | 23,519,667 | | | | 1,601,304 | | | $ | 18,387,740 | |
Shares reinvested | | | 183,206 | | | | 2,145,758 | | | | 160,526 | | | | 1,834,791 | |
Shares redeemed | | | (1,378,402 | ) | | | (16,191,347 | ) | | | (1,041,946 | ) | | | (11,818,454 | ) |
Net increase | | | 792,359 | | | $ | 9,474,078 | | | | 719,884 | | | $ | 8,404,077 | |
| | | | | | | | | | | | | | | | |
NORTH CAROLINA TAX-FREE
SHORT-TO-MEDIUM SERIES | | Year Ended June 30, 2013 | | | Year Ended June 30, 2012 | |
| | | SHARES | | | AMOUNT | | | SHARES | | | AMOUNT | |
Shares sold | | | 701,612 | | | $ | 7,898,764 | | | | 448,118 | | | $ | 5,003,359 | |
Shares reinvested | | | 36,890 | | | | 414,632 | | | | 33,220 | | | | 370,190 | |
Shares redeemed | | | (547,748 | ) | | | (6,150,215 | ) | | | (297,998 | ) | | | (3,305,006 | ) |
Net increase | | | 190,754 | | | $ | 2,163,181 | | | | 183,340 | | | $ | 2,068,543 | |
| | | | | | | | | | | | | | | | |
| TENNESSEE TAX-FREE INCOME SERIES | | Year Ended June 30, 2013 | | | Year Ended June 30, 2012 | |
| | | SHARES | | | AMOUNT | | | SHARES | | | AMOUNT | |
Shares sold | | | 1,604,096 | | | $ | 18,817,879 | | | | 1,125,114 | | | $ | 12,822,015 | |
Shares reinvested | | | 164,725 | | | | 1,914,381 | | | | 164,815 | | | | 1,885,305 | |
Shares redeemed | | | (1,095,123 | ) | | | (12,806,030 | ) | | | (899,434 | ) | | | (10,191,015 | ) |
Net increase | | | 673,698 | | | $ | 7,926,230 | | | | 390,495 | | | $ | 4,516,305 | |
| | | | | | | | | | | | | | | | |
TENNESSEE TAX-FREE
SHORT-TO-MEDIUM SERIES | | Year Ended June 30, 2013 | | | Year Ended June 30, 2012 | |
| | | SHARES | | | AMOUNT | | | SHARES | | | AMOUNT | |
Shares sold | | | 177,861 | | | $ | 1,960,274 | | | | 244,908 | | | $ | 2,694,660 | |
Shares reinvested | | | 13,852 | | | | 152,444 | | | | 14,132 | | | | 155,241 | |
Shares redeemed | | | (259,066 | ) | | | (2,852,117 | ) | | | (78,025 | ) | | | (858,073 | ) |
Net increase/(decrease) | | | (67,353 | ) | | $ | (739,399 | ) | | | 181,015 | | | $ | 1,991,828 | |
| | | | | | | | | | | | | | | | |
| INTERMEDIATE GOVERNMENT BOND SERIES | | Year Ended June 30, 2013 | | | Year Ended June 30, 2012 | |
| | | SHARES | | | AMOUNT | | | SHARES | | | AMOUNT | |
Shares sold | | | 101,835 | | | $ | 1,086,915 | | | | 175,111 | | | $ | 1,813,245 | |
Shares reinvested | | | 51,219 | | | | 544,743 | | | | 59,439 | | | | 623,150 | |
Shares redeemed | | | (266,971 | ) | | | (2,830,419 | ) | | | (305,067 | ) | | | (3,185,007 | ) |
Net decrease | | | (113,917 | ) | | $ | (1,198,761 | ) | | | (70,517 | ) | | $ | (748,612 | ) |
| | | | | | | | | | | | | | | | |
| TAXABLE MUNICIPAL BOND SERIES | | Year Ended June 30, 2013 | | | Year Ended June 30, 2012 | |
| | | SHARES | | | AMOUNT | | | SHARES | | | AMOUNT | |
Shares sold | | | 223,183 | | | $ | 2,421,068 | | | | 340,717 | | | $ | 3,518,945 | |
Shares reinvested | | | 31,550 | | | | 343,461 | | | | 24,087 | | | | 253,910 | |
Shares redeemed | | | (205,941 | ) | | | (2,236,304 | ) | | | (8,234 | ) | | | (86,570 | ) |
Net increase | | | 48,792 | | | $ | 528,225 | | | | 356,570 | | | $ | 3,686,285 | |
56
NOTES TO FINANCIAL STATEMENTS
June 30, 2013
| 5. | | Concentration of Credit Risk |
The Alabama Tax-Free Income Series, Kentucky Tax-Free Income Series, Kentucky Tax-Free Short-to-Medium Series, Mississippi Tax-Free Income Series, North Carolina Tax-Free Income Series, North Carolina Tax-Free Short-to-Medium Series, Tennessee Tax-Free Income Series, and Tennessee Tax-Free Short-to-Medium Series each invest solely in debt obligations issued by the states of Alabama, Kentucky, Mississippi, North Carolina, and Tennessee, respectively, and their respective political subdivisions, agencies and public authorities to obtain funds for various public purposes. Each of these state-specific Funds is more susceptible to economic and political factors adversely affecting issuers of their states’ respective municipal securities than a fund that is not concentrated in these issuers to the same extent.
On December 22, 2010, the Regulated Investment Company Modernization Act of 2010 (the “Act”) was enacted, which changed various technical rules governing the tax treatment of regulated investment companies. The changes are generally effective for taxable years beginning after the date of enactment. One of the more prominent changes addresses capital loss carryforwards. Under the Act, each Fund will be permitted to carry forward capital losses incurred in taxable years beginning after the date of enactment for an unlimited period. However, any losses incurred during those future taxable years will be required to be utilized prior to the losses incurred in pre-enactment taxable years, which carry an expiration date. As a result of this ordering rule, pre-enactment capital loss carryforwards may be more likely to expire unused. Additionally, post-enactment capital loss carryforwards will retain their character as either short-term or long-term capital losses rather than being considered all short-term as permitted under previous regulation.
At June 30, 2013, the Funds capital loss carry-forwards expire as follows:
| | | | | | | | | | | | | | | | | | | | | | | | | | | | |
| | | 2014 | | | 2015 | | | 2016 | | | 2017 | | | 2018 | | | 2019 | | | Total | |
Kentucky Tax-Free Short-to-Medium Series | | $ | | | | $ | 345,116 | | | $ | 227,932 | | | $ | 223,976 | | | $ | — | | | $ | — | | | $ | 797,024 | |
Tennessee Tax-Free Income Series | | | — | | | | — | | | | — | | | | — | | | | 371,142 | | | | — | | | | 371,142 | |
Tennessee Tax-Free Short-to-Medium Series | | | — | | | | 26,184 | | | | 23,418 | | | | — | | | | — | | | | — | | | | 49,602 | |
Intermediate Government Bond Series | | | 51,194 | | | | 21,143 | | | | — | | | | — | | | | — | | | | | | | | 72,337 | |
During the year ended June 30, 2013, the following Funds utilized capital loss carry-forwards as follows:
| | | | |
| | | Amount | |
Kentucky Tax-Free Short-to-Medium Series | | $ | 145,079 | |
Tennessee Tax-Free Income Series | | | 250,195 | |
Tennessee Tax-Free Short-to-Medium Series | | | 46,104 | |
Intermediate Government Bond Series | | | 13,115 | |
Taxable Municipal Bond Series | | | 21,110 | |
Capital losses incurred after October 31 (“Post-October” losses) within the taxable year are deemed to arise on the first business day of the Funds’ next taxable year. The following Funds incurred and will elect to defer net capital losses during the fiscal year 2013 as follows:
| | | | |
| | | Post October Losses | |
Tennessee Tax-Free Income Series | | $ | (49,421 | ) |
Intermediate Government Bond Series | | | (35,662 | ) |
57
NOTES TO FINANCIAL STATEMENTS
June 30, 2013
| 6. | | Federal Income Taxes, continued |
The tax character of distributions paid for the years ended June 30, 2013 and 2012 were as follows:
| | | | | | | | | | | | | | | | | | | | | | | | |
| | | 2013 | | | 2012 | |
| | | Tax
Exempt
Income | | | Ordinary
Income | | | Long-Term
Capital
Gain | | | Tax
Exempt
Income | | | Ordinary
Income | | | Long-Term
Capital
Gain | |
Alabama Tax-Free Income Series | | $ | 842,439 | | | $ | — | | | $ | 16,538 | | | $ | 781,226 | | | $ | — | | | $ | 12,037 | |
Kentucky Tax-Free Income Series | | | 33,471,869 | | | | 37,796 | | | | 108,545 | | | | 34,105,207 | | | | 58,958 | | | | 3,685,303 | |
Kentucky Tax-Free
Short-to-Medium Series | | | 1,932,832 | | | | — | | | | — | | | | 1,911,427 | | | | — | | | | — | |
Mississippi Tax-Free Income Series | | | 287,105 | | | | — | | | | — | | | | 235,664 | | | | — | | | | 16,068 | |
North Carolina Tax-Free Income Series | | | 3,026,417 | | | | — | | | | 131,685 | | | | 2,780,923 | | | | — | | | | — | |
North Carolina Tax-Free
Short-to-Medium Series | | | 497,853 | | | | — | | | | 39,121 | | | | 495,128 | | | | — | | | | — | |
Tennessee Tax-Free Income Series | | | 3,364,193 | | | | — | | | | — | | | | 3,364,028 | | | | — | | | | — | |
Tennessee Tax-Free
Short-to-Medium Series | | | 226,505 | | | | — | | | | — | | | | 230,540 | | | | — | | | | — | |
Intermediate Government Bond Series | | | — | | | | 713,160 | | | | — | | | | — | | | | 837,279 | | | | — | |
Taxable Municipal Bond Series | | | — | | | | 767,284 | | | | 19,468 | | | | — | | | | 696,663 | | | | — | |
At June 30, 2013, the Fund’s components of distributable earnings (accumulated losses) on a tax basis were as follows:
| | | | | | | | | | | | | | | | |
| | | Undistributed
Ordinary
Income | | | Undistributed
Tax Exempt
Income | | | Undistributed Net
Long Term
Capital Gain | | | Net Unrealized
Appreciation/
Depreciation
Investments | |
Alabama Tax-Free Income | | $ | — | | | $ | 116,420 | | | $ | 29,276 | | | $ | 654,807 | |
Kentucky Tax-Free Income | | | — | | | | 3,713,889 | | | | 315,193 | | | | 38,275,895 | |
Kentucky Tax-Free Short-to-Medium | | | — | | | | 58,073 | | | | — | | | | 3,057,471 | |
Mississippi Tax-Free Income | | | — | | | | 39,983 | | | | 9,925 | | | | 131,517 | |
North Carolina Tax-Free Income | | | — | | | | 278,725 | | | | 112,821 | | | | 2,777,703 | |
North Carolina Tax-Free Short-to-Medium | | | — | | | | 11,966 | | | | 40,875 | | | | 585,103 | |
Tennessee Tax-Free Income | | | — | | | | 378,775 | | | | — | | | | 2,590,708 | |
Tennessee Tax-Free Short-to-Medium | | | — | | | | 5,685 | | | | — | | | | (14,721 | ) |
Intermediate Government Bond | | | 15,268 | | | | — | | | | — | | | | 270,669 | |
Taxable Municipal Bond Series | | | 38,233 | | | | — | | | | 69,960 | | | | 1,077,936 | |
| | | | | | | | | | | | |
| | | Accumulated
Capital and
Other Losses | | | Other
Temporary
Differences | | | Total
Accumulated Earnings | |
Alabama Tax-Free Income | | $ | — | | | $ | (116,423 | ) | | $ | 684,080 | |
Kentucky Tax-Free Income | | | — | | | | (3,713,889 | ) | | | 38,591,088 | |
Kentucky Tax-Free Short-to-Medium | | | (797,024 | ) | | | (58,074 | ) | | | 2,260,446 | |
Mississippi Tax-Free Income | | | — | | | | (40,054 | ) | | | 141,371 | |
North Carolina Tax-Free Income | | | — | | | | (278,725 | ) | | | 2,390,524 | |
North Carolina Tax-Free Short-to-Medium | | | — | | | | (11,964 | ) | | | 625,980 | |
Tennessee Tax-Free Income | | | (420,563 | ) | | | (378,774 | ) | | | 2,170,146 | |
Tennessee Tax-Free Short-to-Medium | | | (49,602 | ) | | | (5,685 | ) | | | (64,323 | ) |
Intermediate Government Bond | | | (107,999 | ) | | | (15,084 | ) | | | 162,854 | |
Taxable Municipal Bond Series | | | — | | | | (37,703 | ) | | | 1,148,426 | |
58
NOTES TO FINANCIAL STATEMENTS
June 30, 2013
| 7. | | Contingencies and Commitments |
The Funds indemnify the Trust’s officers and Trustees for certain liabilities that might arise from their performance of their duties to the Funds. Additionally, in the normal course of business, the Funds enter into contracts that contain a variety of representations and warranties and which may provide for indemnification. The Funds’ maximum exposure under these arrangements is unknown, as this would involve predicting future claims that may be made against the Funds, if any, that have not yet occurred. However, based on experience, the Funds do not expect the risk of loss to be material.
| 8. | | Line of Credit Agreement and Custodian Agreement |
Under the terms of an agreement with the Funds’ custodian, principal amounts up to 5% of a Fund’s net assets are available on an uncommitted line of credit. The principal amounts borrowed are due on demand. The agreement expires on August 31, 2013, but may be renewed annually. Interest is payable based on the published prime rate of the bank. Securities with a minimum value of three times the loan proceeds will be assigned as collateral until the balance of the note and unpaid interest is paid in full and terminated.
At June 30, 2013, the Funds had an unused line of credit amount of $25,000,000. During the year ended June 30, 2013, the average interest rate on borrowings was 3.25% and the daily weighted average borrowings for each Fund with borrowings were as follows:
| | | | |
| | | Weighted
Average Borrowings | |
Alabama Tax-Free Income Series | | $ | 1,562 | |
Kentucky Tax Free Income Series | | | 6,677 | |
Kentucky Tax-Free Short-to-Medium Series | | | 13,849 | |
Mississippi Tax-Free Income Series | | | 1,789 | |
North Carolina Tax-Free Income Series | | | 44,729 | |
North Carolina Tax-Free Short-to-Medium Series | | | 6,803 | |
Tennessee Tax-Free Income Series | | | 6,353 | |
Tennessee Tax-Free Short-to-Medium Series | | | 12,734 | |
Taxable Municipal Bond Series | | | 1,104 | |
Intermediate Government Bond Series | | | 4,263 | |
The Funds have a contractual agreement with the custodian whereby the Funds compensate the custodian for custodial services incurred exceeding the credits realized as a result of uninvested cash balances. Credits realized as a result of uninvested cash balances are used to reduce each Fund’s expenses. During the year, these credits reduced each of Funds’ expenses by the amount shown on the Statement of Operations as “Custodian expense reduction.”
59
Report of Independent Registered Public Accounting Firm
To the Board of Trustees and Shareholders of
Dupree Mutual Funds
We have audited the accompanying statements of assets and liabilities, including the schedules of portfolio investments, of Dupree Mutual Funds (comprising, respectively, the Alabama Tax-Free Income, Kentucky Tax-Free Income, Kentucky Tax-Free Short-to-Medium, Mississippi Tax-Free Income, North Carolina Tax-Free Income, North Carolina Tax-Free Short-to-Medium, Tennessee Tax-Free Income, Tennessee Tax-Free Short-to-Medium, Intermediate Government Bond, and Taxable Municipal Bond Series) (collectively, the “Funds”), as of June 30, 2013, and the related statements of operations for the year then ended, the statements of changes in net assets for each of the two years in the period then ended, and the financial highlights for each of the years or periods indicated therein. These financial statements and financial highlights are the responsibility of the Funds’ management. Our responsibility is to express an opinion on these financial statements and financial highlights based on our audits.
We conducted our audits in accordance with the standards of the Public Company Accounting Oversight Board (United States). Those standards require that we plan and perform the audits to obtain reasonable assurance about whether the financial statements and financial highlights are free of material misstatement. We were not engaged to perform an audit of the Funds’ internal control over financial reporting. Our audits included consideration of internal control over financial reporting as a basis for designing audit procedures that are appropriate in the circumstances, but not for the purpose of expressing an opinion on the effectiveness of the Funds’ internal control over financial reporting. Accordingly, we express no such opinion. An audit also includes examining, on a test basis, evidence supporting the amounts and disclosures in the financial statements and financial highlights, assessing the accounting principles used and significant estimates made by management, and evaluating the overall financial statement presentation. Our procedures included confirmation of securities owned as of June 30, 2013, by correspondence with the custodian and brokers. We believe that our audits provide a reasonable basis for our opinion.
In our opinion, the financial statements and financial highlights referred to above present fairly, in all material respects, the financial position of each of the respective portfolios constituting the Dupree Mutual Funds at June 30, 2013, the results of their operations for the year then ended, the changes in their net assets for each of the two years in the period then ended, and the financial highlights for each of the years or periods indicated therein, in conformity with U.S. generally accepted accounting principles.

Cincinnati, Ohio
August 27, 2013
60
OTHER UNAUDITED INFORMATION
June 30, 2013
Trustee and officer information
The following table sets forth information as to the Trustees and officers:
| | | | | | | | | | |
| Name, Address and Age | | Position(s) Held with
Funds | | Term of Office and
Length of Time Served | | Principal Occupation(s)
During Past 5 Years | | Number of
Portfolios in
Fund Complex
Overseen by
Trustee | | Other
Directorships
Held in publicly
traded companies |
| Officers: | | | | | | | | | | |
Thomas P. Dupree Sr. 125 South Mill Street Lexington, KY 40507 Age: 82 | | President | | Annual Term; 34 years of service | | Chairman of the Board of Dupree & Company, Inc. | | N/A | | N/A |
Gay M. Elste P.O. Box 28 Versailles, KY 40383 Age: 62 | | Compliance Officer | | Annual Term;9 years of service | | Attorney at Law, Darsie & Elste. Anstruther Farm, beef cattle farming | | N/A | | N/A |
Allen E. Grimes, III 125 South Mill Street Lexington, KY 40507 Age: 50 | | Executive Vice President | | Annual Term; 8 years of service | | President, Dupree & Company, Inc. | | N/A | | N/A |
Michelle M. Dragoo 125 South Mill Street Lexington, KY 40507 Age: 52 | | Vice President, Secretary, Treasurer | | Annual Term; 15 years of service as Vice President, 13 years of service as Secretary, Treasurer | | Vice President, Secretary, Treasurer of Dupree & Company, Inc. | | N/A | | N/A |
Alison L. Arnold 125 South Mill Street Lexington, KY 40507 Age: 53 | | Assistant Secretary | | Annual Term; 20 years of service | | Dupree & Company, Inc. | | N/A | | N/A |
| Trustees: | | | | | | | | | | |
William A. Combs, Jr. 111 Woodland Ave., #510 Lexington, KY 40502 Age: 73 | | Chairman, Trustee | | Annual Term; 12 years of service as Chairman; 24 years of service as Trustee | | Officer, Director: Mercedes-Benz of Cincinnati, Ohio; Mercedes-Benz of West Chester, Ohio | | 10 | | N/A |
James C. Baughman, Jr. 1999 Richmond Road Suite 4 Lexington, KY 40502 Age: 50 | | Trustee | | One Year Term; 6 Years of Service | | Business consultant, CJN Advisors, LLC (2013 – present); Chief Executive Officer, Secretary, Treasurer, Director Office Suites Plus, Inc. (1998-2013; executive office space rental) | | 10 | | Advisory Board, Community Trust Bank |
Lucy A. Breathitt 1703 Fairway Drive Lexington, KY 40502 Age: 76 | | Trustee | | Annual Term; 17 years of service | | Alexander Farms, farming | | 10 | | N/A |
C. Timothy Cone 201 West Short Street Lexington, KY 40507 Age: 69 | | Trustee | | Annual Term; 11 years of service | | President, Gess, Mattingly & Atchison, P.S.C. (law firm) | | 10 | | N/A |
Ann Rosenstein Giles 343 Waller Avenue Suite 100 Lexington, KY 40504 Age: 61 | | Trustee | | Annual Term; 2 years of service | | Rosenstein Development, LLC (self-employed marketing consultant) | | 10 | | N/A |
Marc A. Mathews 2104 Lakeside Drive Lexington, KY 40502 Age: 55 | | Trustee | | Annual Term; 2 years of service | | Vice President for Finance and Business, Transylvania University 2009 to date; Treasurer, University of Kentucky 2008-2009; Controller, University of Kentucky 2004-2008 | | 10 | | Director, Bank of the Bluegrass |
61
OTHER UNAUDITED INFORMATION
June 30, 2013
Trustee and officer information, continued
As of June 30, 2013, none of the Trustees nor members of their immediate family held any beneficial interest in the Trust’s Investment Adviser. Further, the Trust does not have an underwriter.
The Statement of Additional Information (“SAI”) includes additional information about Trustees and officers and is available upon request without charge. Please call (800) 866-0614 to request the SAI.
Proxy Voting Information
A description of the policies and procedures that the Funds use to determine how to vote proxies relating to portfolio securities is available without charge upon request by calling (800) 866-0614, or on the Securities and Exchange Commission’s website at http://www.sec.gov. For the year ending June 30, 2012, the Funds exercised no proxy votes due to the fact that the debt instruments in which the Funds invest carry no voting rights.
Quarterly Portfolio Disclosure
The Trust files with the Securities and Exchange Commission a complete listing of portfolio holdings for each Fund as of the end of the first and third quarters of each fiscal year on Form N-Q. The complete listing (i) is available on the commission’s website and (ii) will be made available to shareholders upon request by calling (800) 866-0614. Information on the operation of the S.E.C.’s Public Reference Room may be obtained by calling 1-800-SEC-0300.
62
DUPREE MUTUAL FUNDS
OTHER UNAUDITED INFORMATION
June 30, 2013
Schedule of Shareholder Expenses
As a shareholder of the Funds, you incur transaction costs including investment advisory fees and other Fund expenses. The following examples are intended to help you understand your ongoing costs (in dollars) of investing in the Funds and to compare these costs with the ongoing costs of investing in other mutual funds.
Actual Expenses
The first line of the table below provides information about actual account values and actual expenses. You may use the information in this line, together with the amount you invested, to estimate the expenses that you paid over the period. Simply divide your account value by $1,000 (for example, an $8,600 account value divided by $1,000 = 8.6), then multiply the result by the number in the first line under the heading entitled “Expenses Paid During the Six Months Ended June 30, 2013” to estimate the expenses you paid on your account during this period.
Hypothetical Example for Comparison Purposes
The second line of the table below provides information about hypothetical account values and hypothetical expenses based on each Fund’s actual expense ratio and an assumed rate of return of 5% per year before expenses which is not the Funds’ actual ending account balance or expenses you paid for the period. You may use this information to compare the ongoing costs of investing in the Funds and other funds. To do so, compare this 5% hypothetical example with the 5% hypothetical examples that appear in the shareholder reports of other funds.
| | | | | | | | | | | | | | | | |
| | | Net Expense
Ratio
Annualized
June 30, 2013 | | | Beginning
Account Value
January 1, 2013* | | | Ending
Account Value
June 30, 2013** | | | Expenses Paid During
the Six Months
Ended June 30, 2013 | |
Alabama Tax-Free Income Series | | | | | | | | | | | | | | | | |
| Actual | | | .70 | % | | $ | 1,000.00 | | | $ | 970.10 | | | $ | 3.42 | |
| Hypothetical | | | .70 | | | | 1,000.00 | | | | 1,024.79 | | | | 3.51 | |
Kentucky Tax-Free Income Series | | | | | | | | | | | | | | | | |
| Actual | | | .56 | | | | 1,000.00 | | | | 973.00 | | | | 2.75 | |
| Hypothetical | | | .56 | | | | 1,000.00 | | | | 1,024.79 | | | | 2.83 | |
Kentucky Tax-Free Short-to-Medium Series | | | | | | | | | | | | | | | | |
| Actual | | | .72 | | | | 1,000.00 | | | | 990.60 | | | | 3.53 | |
| Hypothetical | | | .72 | | | | 1,000.00 | | | | 1,024.79 | | | | 3.59 | |
Mississippi Tax-Free Income Series | | | | | | | | | | | | | | | | |
| Actual | | | .66 | | | | 1,000.00 | | | | 983.14 | | | | 3.24 | |
| Hypothetical | | | .66 | | | | 1,000.00 | | | | 1,024.79 | | | | 3.31 | |
North Carolina Tax-Free Income Series | | | | | | | | | | | | | | | | |
| Actual | | | .71 | | | | 1,000.00 | | | | 965.4 | | | | 3.46 | |
| Hypothetical | | | .71 | | | | 1,000.00 | | | | 1,024.79 | | | | 3.57 | |
North Carolina Tax-Free Short-to-Medium Series | | | | | | | | | | | | | | | | |
| Actual | | | .77 | | | | 1,000.00 | | | | 988.60 | | | | 3.79 | |
| Hypothetical | | | .77 | | | | 1,000.00 | | | | 1,024.79 | | | | 3.86 | |
Tennessee Tax-Free Income Series | | | | | | | | | | | | | | | | |
| Actual | | | .69 | | | | 1,000.00 | | | | 970.90 | | | | 3.38 | |
| Hypothetical | | | .69 | | | | 1,000.00 | | | | 1,024.79 | | | | 3.47 | |
Tennessee Tax-Free Short-to-Medium Series | | | | | | | | | | | | | | | | |
| Actual | | | .86 | | | | 1,000.00 | | | | 985.30 | | | | 4.22 | |
| Hypothetical | | | .86 | | | | 1,000.00 | | | | 1,024.79 | | | | 4.30 | |
63
OTHER UNAUDITED INFORMATION
June 30, 2013
Schedule of Shareholder Expenses, continued
| | | | | | | | | | | | | | | | |
| | | Net Expense
Ratio
Annualized
June 30, 2013 | | | Beginning
Account Value
January 1, 2013* | | | Ending
Account Value
June 30, 2013** | | | Expenses Paid During
the Six Months
Ended June 30, 2013 | |
Intermediate Government Bond Series | | | | | | | | | | | | | | | | |
| Actual | | | .49 | % | | $ | 1,000.00 | | | $ | 950.90 | | | $ | 2.39 | |
| Hypothetical | | | .49 | | | | 1,000.00 | | | | 1,024.79 | | | | 2.48 | |
Taxable Municipal Bond Series | | | | | | | | | | | | | | | | |
| Actual | | | .90 | | | | 1,000.00 | | | | 986.00 | | | | 4.06 | |
| Hypothetical | | | .90 | | | | 1,000.00 | | | | 1,024.79 | | | | 4.14 | |
| * | | The example is based on an investment of $1,000 invested at the beginning of the period. |
| ** | | Expenses are equal to the Fund’s annualized expense ratio, multiplied by the average account value over the period multiplied by [181/365] (to reflect one-half year period). |
64
Item 2. Code of Ethics: The registrant has adopted a code of ethics that applies to the principal executive officer, principal financial officer, principal accounting officer and persons performing similar functions. There have been no waivers from the Code of Ethics during the reporting period. The Registrant’s Code of Ethics is posted on its web site at http://www.dupree-funds.com. A copy of the Code of Ethics will be provided to any person free of charge upon request by telephoning or writing the Registrant.
Item 3. Audit Committee Financial Expert: Audit Committee Financial Expert: The board does not have a financial expert serving on the audit committee. The registrant’s audit committee is comprised of all Trustees all of who are non-interested and independent. The audit committee believes that the collective experience and expertise of the members in assessing the performance of companies and the evaluation of financial statements is sufficient to assess the issues which can reasonably be expected to be raised by the Trust’s financial statements.
Item 4. Principal Accountant Fees and Services:
(a) Fees for audit services provided to the Registrant were $127,300 and $123,600 for the fiscal years ended June 30, 2013 and 2012, respectively.
(b) Audit Related Fees. The aggregate fees billed in each of the last two fiscal years for audit related-services by the principal accountant that are reasonably related to the performance of the audit of the Registrant’s financial statements are not reported under paragraph (a) of this item were $27,200 and $26,375 for fiscal years ended June 30, 2013 and 2012 respectively.
(c) Tax Fees. Fees for tax services, which consisted of income and excise tax compliance services, were $36,500 and $35,425 for the fiscal years ended June 30, 2013 and 12, respectively
(d) All Other Fees. Fees for all other services totaled $7,300 and $7,100 for the fiscal years ended June 30, 2013 and 12, respectively.
(e) The Registrant’s Audit Committee must pre-approve all audit services and non-audit services that the principal accountant provides to the Registrant. The Audit committee must also pre-approve any engagement of the principal accountant to provide non-audit services to the Registrant’s investment adviser, or any affiliate of the adviser that provides ongoing services to the Registrant, if such non-audit services directly impact the Registrant’s operations and financial reporting.
Item 5. Not applicable.
Item 6. Included as part of item 1.
Item 7. Not applicable
Item 8. Not applicable.
Item 9. Not applicable
Item 10. There have been no changes to the procedures by which shareholders may recommend nominees to the board of trustees nominating committee.
Item 11. Controls and Procedures:
On August 20, 2013 the Registrant’s President and Treasurer assessed the disclosure controls and procedures to evaluate the effectiveness of the Registrant’s disclosure controls and procedures designed to ensure that information required to be disclosed by the investment company on Form N-CSR is recorded, processed, summarized and reported within the time periods specified in the Securities and Exchange Commission’s rules and forms. Disclosure controls and procedures include, without limitation, controls and procedures designed to ensure that information required to be disclosed by an investment company in the reports that it files on Form N-CSR is accumulated and communicated to the investment company’s management, including its principal executive and principal financial officers or persons performing similar functions, as appropriate to allow timely decisions regarding required disclosure.
Further, on August 20, 2013 the Registrant’s President and Treasurer assessed the internal control over financial reporting to provide reasonable assurance regarding the reliability of financial reporting and the preparation of financial statements for external purposes in accordance with generally accepted accounting principles and includes those policies and procedures that: (1) pertain to the maintenance of records that in reasonable detail accurately and fairly reflect the transactions and dispositions of the assets of the investment company; (2) provide reasonable assurance that transactions are recorded as necessary to permit preparation of financial statements in accordance with generally accepted accounting principles, and that receipts and expenditures of the investment company are being made only in accordance with authorizations of management and trustees of the investment company; and (3) provide reasonable assurance regarding prevention or timely detection of unauthorized acquisition, use, or disposition of the investment company’s assets that could have a material effect on the financial statements.
The Registrant’s President and Treasurer have deemed the disclosure controls and procedures and the internal control over financial reporting effective. There were no changes in the Registrant’s disclosure controls and procedures or internal control over financial reporting that occurred during the fourth quarter of the fiscal year that materially affected or is reasonably likely to materially affect the Registrant’s financial statements.
Item 12. Exhibits
(a)
(2) Certifications
(3) Not applicable
SIGNATURES
Pursuant to the requirements of the Securities Exchange Act of 1934 and the Investment Company Act of 1940, the registrant has duly caused this report to be signed on its behalf by the undersigned thereunto duly authorized.
| | |
Dupree Mutual Funds |
| |
By: | | Michelle M. Dragoo, Vice President, Secretary, Treasurer /s/ |
Date: August 20, 2013
Pursuant to the requirements of the Securities Exchange Act of 1934 and the Investment Company Act of 1940, this report has been signed below by the following persons on behalf of the registrant and in the capacities and on the dates indicated.
| | |
By: | | Thomas P. Dupree, Sr., President /s/ |
Date: August 20, 2013
| | |
| |
| By: | | Michelle M. Dragoo, Vice President, Secretary, Treasurer /s/ |
Date: August 20, 2013