UNITED STATES
SECURITIES AND EXCHANGE COMMISSION
WASHINGTON, D.C. 20549
FORM 20-F
(Mark One)
| ¨ | Registration statement pursuant to Section 12(b) or (g) of the Securities Exchange Act of 1934 |
or
| þ | Annual report pursuant to Section 13 or 15(d) of the Securities Exchange Act of 1934, for the fiscal year ended December 31, 2006 |
or
| ¨ | Transition report pursuant to Section 13 or 15(d) of the Securities Exchange Act of 1934 |
or
| ¨ | Shell company report pursuant to Section 13 or 15(d) of the Securities Exchange Act of 1934 |
For the transition period from to .
| | | | | | | | | | |
Commission file numbers: | | Barclays PLC | | 1-09246 | | |
| | | | | | Barclays Bank PLC | | 1-10257 | | |
BARCLAYS PLC
BARCLAYS BANK PLC
(Exact names of registrants as specified in their charters)
ENGLAND
(Jurisdictions of incorporation)
1 CHURCHILL PLACE, LONDON, E14 5HP, ENGLAND
(Address of principal executive offices)
Securities registered pursuant to Section 12(b) of the Act:
| | | | |
| | | Title of each class | | Name of each exchange on which registered |
| Barclays PLC | | 25p ordinary shares | | New York Stock Exchange* |
| | American Depositary Shares, each representing four 25p ordinary shares | | New York Stock Exchange |
| | |
| Barclays Bank PLC | | 7.4% Subordinated Notes 2009 | | New York Stock Exchange |
| | Callable Floating Rate Notes 2035 | | New York Stock Exchange |
| | Non-Cumulative Callable Dollar Preference Shares, Series 2 | | New York Stock Exchange* |
| | American Depositary Shares, Series 2, each representing one Non-Cumulative Callable Dollar Preference Share, Series 2 | | New York Stock Exchange |
| | iPathSM Exchange Traded Notes Linked to GSCI® Total Return Index | | New York Stock Exchange |
| | iPathSM Exchange Traded Notes Linked to Dow Jones – AIG Commodity Index Total ReturnSM | | New York Stock Exchange |
| | iPathSM Exchange Traded Notes Linked to Goldman Sachs Crude Oil Total Return Index | | New York Stock Exchange |
| | iPathSM MSCI India IndexSM ETN | | New York Stock Exchange |
| * | Not for trading, but only in connection with the registration of American Depositary Shares, pursuant to the requirements of the Securities and Exchange Commission. |
Securities registered pursuant to Section 12(g) of the Act: None
Securities for which there is a reporting obligation pursuant to Section 15(d) of the Act: None
Indicate the number of outstanding shares of each of the issuers’ classes of capital or common stock as of the close of the period covered by the annual report.
| | | | |
| Barclays PLC | | 25p ordinary shares | | 6,534,698,021 |
| | £1 staff shares | | 875,000 |
| Barclays Bank PLC | | £1 ordinary shares | | 2,329,960,515 |
| | £1 preference shares | | 1,000 |
| | £100 preference shares | | 75,000 |
| | €100 preference shares | | 240,000 |
| | $0.25 preference shares | | 30,000,000 |
| | $100 preference shares | | 100,000 |
Indicate by check mark if each registrant is a well-known seasoned issuer, as defined in Rule 405 of the Securities Act.
Yesþ No¨
If this report is an annual or transition report, indicate by check mark if each registrant is not required to file reports pursuant to Section 13 or 15(d) of the Securities Exchange Act of 1934.
Yes¨ Noþ
Note – Checking the box above will not relieve any registrant required to file reports pursuant to Section 13 or 15(d) of the Securities Exchange Act of 1934 from their obligations under those Sections.
Indicate by check mark whether the registrants (1) have filed all reports required to be filed by Section 13 or 15(d) of the Securities Exchange Act of 1934 during the preceding 12 months (or for such shorter period that the registrants were required to file such reports) and (2) have been subject to such filing requirements for the past 90 days.
Yesþ No¨
Indicate by check mark whether each registrant is a large accelerated filer, an accelerated filer, or a non-accelerated filer. See definition of “accelerated filer and large accelerated filer” in Rule 12b-2 of the Exchange Act. (Check one):
Large accelerated filerþ Accelerated filer¨ Non-accelerated filer¨
Indicate by check mark which financial statement item the registrants have elected to follow.
Item 17¨ Item 18þ
If this is an annual report, indicated by check mark whether the registrant is a shell company (as defined in Rule 12b-2 of the Exchange Act).
Yes ¨ No þ
(APPLICABLE ONLY TO ISSUERS INVOLVED IN BANKRUPTCY PROCEEDINGS DURING THE PAST FIVE YEARS)
Indicate by check mark whether the registrants have filed all documents and reports required to be filed by Section 12, 13 or 15(d) of the Securities Exchange Act of 1934 subsequent to the distribution of securities under a plan confirmed by a court.
Yes ¨ No ¨
In this document certain non-IFRS (International Financial Reporting Standards) measures, such as profit before business disposals, are reported. Barclays management believes that these non-IFRS measures provide valuable information to readers of its financial statements because they enable the reader to focus more directly on the underlying day-to-day performance of its businesses and provide more detail concerning the elements of performance which the managers of these businesses are most directly able to influence. They also reflect an important aspect of the way in which operating targets are defined and performance is monitored by Barclays management.
This document contains information, including statistical data, about certain of Barclays markets and its competitive position. Except as otherwise indicated, this information is taken or derived from Datastream and other external sources. Barclays cannot guarantee the accuracy of information taken from external sources, or that, in respect of internal estimates, a third party using different methods would obtain the same estimates as Barclays.
Forward-looking statements
This document contains certain forward-looking statements within the meaning of Section 21E of the US Securities Exchange Act of 1934, as amended, and Section 27A of the US Securities Act of 1933, as amended, with respect to certain of the Group’s plans and its current goals and expectations relating to its future financial condition and performance. These forward-looking statements can be identified by the fact that they do not relate only to historical or current facts. Forward-looking statements sometimes use words such as ‘aim’, ‘anticipate’, ‘target’, ‘expect’, ‘estimate’, ‘intend’, ‘plan’, ‘goal’, ‘believe’, or other words of similar meaning. Examples of forward-looking statements include, among others, statements regarding the Group’s future financial position, income growth, impairment charges, business strategy, projected levels of growth in the banking and financial markets, projected costs, estimates of capital expenditures, and plans and objectives for future operations.
By their nature, forward-looking statements involve risk and uncertainty because they relate to future events and circumstances, including, but not limited to, the further development of standards and interpretations under International Financial Reporting Standards (IFRS) applicable to past, current and future periods, evolving practices with regard to the interpretation and application of standards under IFRS, as well as UK domestic and global economic and business conditions, market related risks such as changes in interest rates and exchange rates, the policies and actions of governmental and regulatory authorities, changes in legislation, progress in the integration of Absa into the Group’s business and the achievement of synergy targets related to Absa, the outcome of pending and future litigation, the success of future acquisitions and other strategic transactions and the impact of competition – a number of which factors are beyond the Group’s control. As a result, the Group’s actual future results may differ materially from the plans, goals, and expectations set forth in the Group’s forward-looking statements. Any forward-looking statements made by or on behalf of Barclays speak only as of the date they are made. Barclays does not undertake to update forward-looking statements to reflect any changes in Barclays expectations with regard thereto or any changes in events, conditions or circumstances on which any such statement is based. The reader should, however, consult any additional disclosures that Barclays has made or may make in documents it has filed or may file with the SEC.
| | |
Barclays PLC Annual Report 2006 | | 1 |
| |
Absa Definitions
‘Absa Group Limited’ refers to the consolidated results of the South African group of which the parent company is listed on the Johannesburg Stock Exchange in which Barclays owns a controlling stake.
‘Absa’ refers to the results for Absa Group Limited as consolidated into the results of Barclays PLC; translated into Sterling with adjustments for amortisation of intangible assets, certain Head office adjustments, transfer pricing and minority interests.
‘International Retail and Commercial Banking – Absa’ is the portion of Absa’s results that is reported by Barclays within the International Retail and Commercial Banking business.
Barclays acquired a controlling stake in Absa Group Limited on 27th July 2005. Therefore, unless otherwise indicated, 2005 comparatives reflect results from that date and are not directly comparable to 2006.
‘Absa Capital’ is the portion of Absa’s results that is reported by Barclays within the Barclays Capital business.
Glossary of terms
The cost:income ratio is defined as operating expenses compared to total income net of insurance claims.
The cost:net income ratio is defined as operating expenses compared to total income net of insurance claims less impairment charges.
‘Income’ refers to total income net of insurance claims, unless otherwise specified.
‘Profit before business disposals’ represents profit before tax and disposal of subsidiaries, associates and joint ventures.
Group reporting changes
Barclays announced on 16th June 2006 the impact of certain changes in Group structure and reporting on the 2005 and 2004 results.
Barclays realigned a number of reportable business segments based on the reorganisation of certain portfolios better to reflect the type of client served, the nature of the products offered and the associated risks and rewards. The Group’s policy for the internal cost of funding and the segmental disclosure of risk weighted assets was also revised with effect from 1st January 2006. The reclassifications had no impact on the Group Income Statement or Balance sheet.
| | |
| 2 | | Barclays PLC Annual Report 2006 |
| |
| | |
Barclays PLC Annual Report 2006 | | 3 |
| |
Financial data
Consolidated income statement summary – IFRS
For the year ended 31st December
| | | | | | | | | |
| | | 2006 £m | | | 2005 £m | | | 2004(a) £m | |
Continuing operations | | | | | | | | | |
Net interest income | | 9,143 | | | 8,075 | | | 6,833 | |
Net fee and commission income | | 7,177 | | | 5,705 | | | 4,847 | |
Principal transactions | | 4,576 | | | 3,179 | | | 2,514 | |
Net premiums from insurance contracts | | 1,060 | | | 872 | | | 1,042 | |
Other income | | 214 | | | 147 | | | 131 | |
| | | |
Total income | | 22,170 | | | 17,978 | | | 15,367 | |
Net claims and benefits paid on insurance contracts | | (575 | ) | | (645 | ) | | (1,259 | ) |
| | | |
Total income net of insurance claims | | 21,595 | | | 17,333 | | | 14,108 | |
Impairment charges | | (2,154 | ) | | (1,571 | ) | | (1,093 | ) |
| | | |
Net income | | 19,441 | | | 15,762 | | | 13,015 | |
Operating expenses | | (12,674 | ) | | (10,527 | ) | | (8,536 | ) |
Share of post-tax results of associates and joint ventures | | 46 | | | 45 | | | 56 | |
Profit on disposal of subsidiaries, associates and joint ventures | | 323 | | | – | | | 45 | |
| | | |
Profit before tax | | 7,136 | | | 5,280 | | | 4,580 | |
Tax | | (1,941 | ) | | (1,439 | ) | | (1,279 | ) |
| | | |
Profit after tax | | 5,195 | | | 3,841 | | | 3,301 | |
| | | |
Profit attributable to minority interests | | 624 | | | 394 | | | 47 | |
Profit attributable to equity holders of the parent | | 4,571 | | | 3,447 | | | 3,254 | |
| | | |
| | | 5,195 | | | 3,841 | | | 3,301 | |
| | | | | | |
Selected financial statistics | | | | | | |
| | | |
Basic earnings per share | | 71.9p | | 54.4p | | 51.0p |
Diluted earnings per share | | 69.8p | | 52.6p | | 49.8p |
Dividends per ordinary share | | 31.0p | | 26.6p | | 24.0p |
Dividend payout ratio | | 43.1% | | 48.9% | | 47.1% |
Profit attributable to the equity holders of the parent as a percentage of: | | | | | | |
average shareholders’ equity | | 24.7% | | 21.1% | | 21.7% |
average total assets | | 0.4% | | 0.4% | | 0.5% |
| | | |
Cost:income ratio | | 59% | | 61% | | 61% |
Cost:net income ratio | | 65% | | 67% | | 66% |
Average United States Dollar exchange rate used in preparing the accounts | | 1.84 | | 1.82 | | 1.83 |
Average Euro exchange rate used in preparing the accounts | | 1.47 | | 1.46 | | 1.47 |
Average Rand exchange rate used in preparing the accounts | | 12.47 | | 11.57 | | 11.83 |
The financial information above is extracted from the published accounts for the last two years. This information should be read together with, and is qualified by reference to, the accounts and Notes included in this report.
Note
| (a) | Does not reflect the application of IAS 32, IAS 39 and IFRS 4 which became effective from 1st January 2005. |
| | |
| 4 | | Barclays PLC Annual Report 2006 |
| |
Consolidated profit and loss account summary – UK GAAP
For the year ended 31st December
| | | | | | |
| | | 2003 £m | | | 2002 £m | |
Interest receivable | | 12,427 | | | 12,044 | |
Interest payable | | (5,823 | ) | | (5,839 | ) |
Net interest income | | 6,604 | | | 6,205 | |
Fees and commissions receivable | | 4,896 | | | 4,454 | |
Less: fees and commissions payable | | (633 | ) | | (529 | ) |
Dealing profits | | 1,054 | | | 833 | |
Other operating income | | 490 | | | 364 | |
Operating income | | 12,411 | | | 11,327 | |
Administration expenses – staff costs | | (4,295 | ) | | (3,755 | ) |
Administration expenses – other | | (2,404 | ) | | (2,312 | ) |
Depreciation | | (289 | ) | | (303 | ) |
Goodwill amortisation | | (265 | ) | | (254 | ) |
Operating expenses | | (7,253 | ) | | (6,624 | ) |
Operating profit before provisions | | 5,158 | | | 4,703 | |
Provisions for bad and doubtful debts | | (1,347 | ) | | (1,484 | ) |
Provisions for contingent liabilities and commitments | | 1 | | | (1 | ) |
Provisions | | (1,346 | ) | | (1,485 | ) |
Operating profit | | 3,812 | | | 3,218 | |
Profit/(loss) from joint ventures | | 1 | | | (5 | ) |
Profit/(loss) from associates | | 28 | | | (5 | ) |
Exceptional items | | 4 | | | (3 | ) |
Profit on ordinary activities before tax | | 3,845 | | | 3,205 | |
Tax on profit on ordinary activities | | (1,076 | ) | | (955 | ) |
Profit on ordinary activities after tax | | 2,769 | | | 2,250 | |
Minority interests (including non-equity interests) | | (25 | ) | | (20 | ) |
Profit for the financial year attributable to the members of Barclays PLC | | 2,744 | | | 2,230 | |
Dividends | | (1,340 | ) | | (1,206 | ) |
Profit retained for the financial year | | 1,404 | | | 1,024 | |
Selected financial statistics | | | | | | |
Basic earnings per share | | 42.3p | | | 33.7p | |
Diluted earnings per share | | 42.1p | | | 33.4p | |
Dividends per ordinary share | | 20.50p | | | 18.35p | |
Dividend payout ratio | | 48.5% | | | 54.5% | |
Attributable profit as a percentage of: | | | | | | |
average shareholders’ funds | | 17.0% | | | 14.7% | |
average total assets | | 0.6% | | | 0.5% | |
Average United States Dollar exchange rate used in preparing the accounts | | 1.64 | | | 1.50 | |
Average Euro exchange rate used in preparing the accounts | | 1.45 | | | 1.59 | |
The financial information shown here is extracted from the published UK GAAP accounts for the years 2002 and 2003.
| | |
Barclays PLC Annual Report 2006 | | 5 |
| |
Financial data
Consolidated balance sheet summary – IFRS
As at 31st December
| | | | | | |
| | | 2006 £m | | 2005 £m | | 2004(a) £m |
Assets | | | | | | |
Cash and other short-term funds | | 9,753 | | 5,807 | | 3,525 |
Treasury bills and other eligible bills | | n/a | | n/a | | 6,658 |
Trading and financial assets designated at fair value | | 292,464 | | 251,820 | | n/a |
Derivative financial instruments | | 138,353 | | 136,823 | | n/a |
Debt securities and equity shares | | n/a | | n/a | | 141,710 |
Loans and advances to banks | | 30,926 | | 31,105 | | 80,632 |
Loans and advances to customers | | 282,300 | | 268,896 | | 262,409 |
Available for sale investments | | 51,703 | | 53,497 | | n/a |
Reverse repurchase agreements and cash collateral on securities borrowed | | 174,090 | | 160,398 | | n/a |
Property, plant and equipment | | 2,492 | | 2,754 | | 2,282 |
Other assets | | 14,706 | | 13,257 | | 40,965 |
Total assets | | 996,787 | | 924,357 | | 538,181 |
| | | |
Liabilities | | | | | | |
Deposits and items in the course of collection due to banks | | 81,783 | | 77,468 | | 112,229 |
Customer accounts | | 256,754 | | 238,684 | | 217,492 |
Trading and financial liabilities designated at fair value | | 125,861 | | 104,949 | | n/a |
Liabilities to customers under investment contracts | | 84,637 | | 85,201 | | n/a |
Derivative financial instruments | | 140,697 | | 137,971 | | n/a |
Debt securities in issue | | 111,137 | | 103,328 | | 83,842 |
Repurchase agreements and cash collateral on securities lent | | 136,956 | | 121,178 | | n/a |
Insurance contract liabilities, including unit-linked liabilities | | 3,878 | | 3,767 | | 8,377 |
Subordinated liabilities | | 13,786 | | 12,463 | | 12,277 |
Other liabilities | | 13,908 | | 14,918 | | 87,200 |
Total liabilities | | 969,397 | | 899,927 | | 521,417 |
Shareholders’ equity | | | | | | |
Shareholders’ equity excluding minority interests | | 19,799 | | 17,426 | | 15,870 |
Minority interests | | 7,591 | | 7,004 | | 894 |
Total shareholders’ equity | | 27,390 | | 24,430 | | 16,764 |
Total liabilities and shareholders’ equity | | 996,787 | | 924,357 | | 538,181 |
| | | |
Risk weighted assets and capital ratios | | | | | | |
Risk weighted assets | | 297,833 | | 269,148 | | 218,601 |
Tier 1 ratio(b) | | 7.7% | | 7.0% | | 7.6% |
Risk asset ratio(b) | | 11.7% | | 11.3% | | 11.5% |
Selected financial statistics | | | | | | |
Net asset value per ordinary share | | 303p | | 269p | | 246p |
Year-end United States Dollar exchange rate used in preparing the accounts | | 1.96 | | 1.72 | | 1.92 |
Year-end Euro exchange rate used in preparing the accounts | | 1.49 | | 1.46 | | 1.41 |
Year-end Rand exchange rate used in preparing the accounts | | 13.71 | | 10.87 | | 10.86 |
Note 60 to the accounts provides a reconciliation of profit attributable to equity holders of the parent and shareholders’ equity between the amounts calculated under IFRS and US GAAP.
The financial information above is extracted from the published accounts for the last two years. This information should be read together with, and is qualified by reference to, the accounts and Notes included in this report.
Notes
| (a) | Does not reflect the application of IAS 32, IAS 39 and IFRS 4 which became effective from 1st January 2005. |
| (b) | Capital ratios for 2004 are based on UK GAAP and have not been restated as these remain as reported to the Financial Services Authority (FSA). As at 1st January 2005 the tier 1 ratio was 7.1% and the risk asset ratio was 11.8% reflecting the impact of IFRS including the adoption of IAS 32, IAS 39 and IFRS 4. |
| | |
| 6 | | Barclays PLC Annual Report 2006 |
| |
Consolidated balance sheet summary – UK GAAP
As at 31st December
| | | | |
| | | 2003 £m | | 2002 £m |
Assets | | | | |
Loans and advances to banks and customers | | 288,743 | | 260,572 |
Other assets | | 139,818 | | 129,136 |
| | |
| | 428,561 | | 389,708 |
Infrastructure | | 6,624 | | 6,015 |
| | |
| | 435,185 | | 395,723 |
Retail life-fund assets attributable to policyholders | | 8,077 | | 7,284 |
| | |
Total assets | | 443,262 | | 403,007 |
| | |
Liabilities | | | | |
Deposits by banks, customer accounts and debt securities in issue | | 328,529 | | 304,817 |
Other liabilities | | 77,660 | | 64,067 |
| | |
| | | 406,189 | | 368,884 |
| | |
Capital resources | | | | |
Undated loan capital | | 6,310 | | 6,678 |
Dated loan capital | | 6,029 | | 4,859 |
| | |
Total subordinated liabilities | | 12,339 | | 11,537 |
| | |
Minority interests | | 283 | | 156 |
Shareholders’ equity excluding minority interests | | 16,374 | | 15,146 |
| | |
Total shareholders’ equity | | 16,657 | | 15,302 |
| | |
Total capital resources | | 28,996 | | 26,839 |
| | |
| | 435,185 | | 395,723 |
Retail life-fund liabilities attributable to policyholders | | 8,077 | | 7,284 |
| | |
Total liabilities and shareholders’ equity | | 443,262 | | 403,007 |
| | |
Risk weighted assets and capital ratios | | | | |
Risk weighted assets | | 188,997 | | 172,748 |
Tier 1 ratio | | 7.9% | | 8.2% |
Risk asset ratio | | 12.8% | | 12.8% |
Selected financial statistics | | | | |
Net asset value per ordinary share | | 250p | | 230p |
Year-end United States Dollar exchange rate used in preparing the accounts | | 1.78 | | 1.61 |
Year-end Euro exchange rate used in preparing the accounts | | 1.41 | | 1.54 |
The financial information shown here is extracted from the UK GAAP published accounts for the years 2002 and 2003.
| | |
Barclays PLC Annual Report 2006 | | 7 |
| |
Intentionally Left Blank
| | |
| 8 | | Barclays PLC Annual Report 2006 |
| |
| | |
Barclays PLC Annual Report 2006 | | 9 |
| |
Financial review
Business description
The following section analyses the Group’s performance by business. For management and reporting purposes, Barclays is organised into the following business groupings:
Global Retail and Commercial Banking
| · | | UK Banking, comprising: |
| · | | International Retail and Commercial Banking, comprising |
| – | International Retail and Commercial Banking-excluding Absa |
| – | International Retail and Commercial Banking-Absa, first included with effect from 27th July 2005 |
Investment Banking and Investment Management
| · | | Barclays Global Investors |
| · | | Barclays Wealth-closed life assurance activities |
Head office functions and other operations
UK Banking
UK Banking delivers banking solutions to Barclays UK retail and business banking customers. It offers a range of integrated products and services and access to the expertise of other Group businesses. Customers are served through a variety of channels comprising the branch network, automated teller machines, telephone banking, online banking and relationship managers. UK Banking is managed through two business areas, UK Retail Banking and UK Business Banking.
UK Retail Banking
UK Retail Banking comprises Personal Customers, Home Finance, UK Premier and Local Business (formerly Small Business). This cluster of businesses aims to build broader and deeper relationships with customers. Personal Customers and Home Finance provide a wide range of products and services to retail customers, including current accounts, savings and investment products, mortgages branded Woolwich and general insurance. UK Premier provides banking, investment products and advice to affluent customers. Local Business provides banking services to small businesses.
UK Business Banking
UK Business Banking provides relationship banking to Barclays larger and medium business customers in the UK. Customers are served by a network of relationship and industry sector specialist managers who provide local access to an extensive range of products and services, as well as offering business information and support. Customers are also offered access to the products and expertise of other businesses in the Group, particularly Barclays Capital and Barclaycard. UK Business Banking provides asset financing and leasing solutions through a specialist business.
Barclaycard
Barclaycard is a multi-brand credit card and consumer loans business which also processes card payments for retailers and merchants and issues credit and charge cards to corporate customers and the UK Government. It is one of Europe’s leading credit card businesses and has an increasing presence in the United States.
In the UK, Barclaycard comprises Barclaycard, SkyCard and Monument branded credit cards, Barclays branded loans and FirstPlus secured lending. Barclaycard also manages card operations on behalf of Solution Personal Finance.
Outside the UK, Barclaycard provides credit cards in the United States, Germany, Spain, Italy, Portugal and Africa. In the Nordic region, Barclaycard operates through Entercard, a joint venture with FöreningsSparbanken (Swedbank).
Barclaycard works closely with other parts of the Group, including UK Retail Banking, UK Business Banking and International Retail and Commercial Banking, to leverage their distribution capabilities.
International Retail and Commercial Banking
International Retail and Commercial Banking provides Barclays personal and corporate customers outside the UK with banking services. The products and services offered to customers are tailored to meet the regulatory and commercial environments within each country. For reporting purposes from 2005, the operations have been grouped into two components: International Retail and Commercial Banking-excluding Absa and International Retail and Commercial Banking-Absa.
International Retail and Commercial Banking works closely with all other parts of the Group to leverage synergies from product and service propositions.
International Retail and Commercial Banking-excluding Absa
International Retail and Commercial Banking-excluding Absa provides a range of banking services, including current accounts, savings, investments, mortgages and loans to personal and corporate customers across Spain, Portugal, France, Italy, Africa and the Middle East.
International Retail and Commercial Banking-Absa
International Retail and Commercial Banking-Absa represents Barclays consolidation of Absa, excluding Absa Capital which is included as part of Barclays Capital. Absa Group Limited is one of South Africa’s largest financial services organisations serving personal, commercial and corporate customers predominantly in South Africa. International Retail and Commercial Banking-Absa serves retail customers through a variety of distribution channels and offers a full range of banking services, including current and deposit accounts, mortgages, instalment finance, credit cards, bancassurance products and wealth management services; it also offers customised business solutions for commercial and large corporate customers.
| | |
| 10 | | Barclays PLC Annual Report 2006 |
| |
Barclays Capital
Barclays Capital is a leading global investment bank which provides large corporate, institutional and government clients with solutions to their financing and risk management needs.
Barclays Capital services a wide variety of client needs, from capital raising and managing foreign exchange, interest rate, equity and commodity risks, through to providing technical advice and expertise. Activities are organised into three principal areas: Rates, which includes fixed income, foreign exchange, commodities, emerging markets, money markets, sales, trading and research, prime services and equity products; Credit, which includes primary and secondary activities for loans and bonds for investment grade, high yield and emerging market credit, as well as hybrid capital products, asset based finance, commercial mortgage backed securities, credit derivatives, structured capital markets and large asset leasing; and Private Equity. Barclays Capital includes Absa Capital, the investment banking business of Absa. Barclays Capital works closely with all other parts of the Group to leverage synergies from client relationships and product capabilities.
Barclays Global Investors
Barclays Global Investors (BGI) is one of the world’s largest asset managers and a leading global provider of investment management products and services.
BGI offers structured investment strategies such as indexing, global asset allocation and risk controlled active products including hedge funds and provides related investment services such as securities lending, cash management and portfolio transition services. In addition, BGI is the global leader in assets and products in the exchange traded funds business, with over 190 funds for institutions and individuals trading in fifteen markets globally. BGI’s investment philosophy is founded on managing all dimensions of performance: a consistent focus on controlling risk, return and cost. BGI collaborates with the other Barclays businesses, particularly Barclays Capital and Barclays Wealth, to develop and market products and leverage capabilities to better serve the client base.
Barclays Wealth
Barclays Wealth serves affluent, high net worth and intermediary clients worldwide, providing private banking, asset management, stockbroking, offshore banking, wealth structuring and financial planning services.
Barclays Wealth works closely with all other parts of the Group to leverage synergies from client relationships and product capabilities.
Barclays Wealth-closed life assurance activities
Barclays Wealth-closed life assurance activities comprise the closed life assurance businesses of Barclays and Woolwich in the UK.
Head office functions and other operations
Head office functions and other operations comprise:
| – | Head office and central support functions |
| – | Businesses in transition |
| – | Consolidation adjustments. |
Head office and central support functions comprise the following areas: Executive management, Finance, Treasury, Corporate Affairs, Human Resources, Strategy and Planning, Internal Audit, Legal, Corporate Secretariat, Property, Tax, Compliance and Risk. Costs incurred wholly on behalf of the businesses are recharged to them.
Businesses in transition principally relate to certain lending portfolios that are centrally managed with the objective of maximising recovery from the assets.
Consolidation adjustments largely reflect the elimination of inter-segment transactions.
| | |
Barclays PLC Annual Report 2006 | | 11 |
| |
Financial review
Group financial performance
The Group’s profit before tax in 2006 increased 35% (£1,856m) to £7,136m (2005: £5,280m). Income increased 25% (£4,262m) to £21,595m (2005: £17,333m) whilst operating expenses rose 20% (£2,147m) to £12,674m (2005: £10,527m). Impairment charges rose 37% (£583m) to £2,154 (2005: £1,571m).
Earnings per share rose 32% to 71.9p (2005: 54.4p), diluted earnings per share rose 33% to 69.8p (2005: 52.6p). Dividends per share rose 17% to 31p (2005: 26.6p). Return on average shareholders’ funds was 25% (2005: 21%).
Business performance
InUK Bankingstrong growth in income enabled us to increase our profit before tax 17% to £2,578m. The improvement in the cost:income ratio was four percentage points in headline terms to 52% (2005: 56%).
UK Retail Bankingdelivered a 17% profit before tax increase to £1,213m. This was driven by broadly based income growth of 7%, with particularly strong performances in savings, Local Business and UK Premier and good growth in current accounts. Our mortgage market share and processing capacity also increased strongly leading to a net market share of 4% for the second half of the year. We doubled investment across the business. We focused on upgrading distribution capabilities, transforming the performance of the mortgage business, revitalising product offerings, and improving core operations and processes. The additional investment substantially offset the impact of property gains, leading to broadly flat costs. In 2007 we expect to make further significant investment, including the restructuring of the branch network and the migration of Woolwich customers.
UK Business Bankingdelivered very strong growth in profit before tax of 18% to £1,365m. Strong growth in loans and deposits drove income growth of 11%. Profit before business disposals grew 11%. UK Business Banking maintained its competitive position and also funded significant investment in improving its infrastructure and customer service.
AtBarclaycardprofit before tax fell 40% to £382m. Good income growth of 8%, driven by very strong momentum in Barclaycard International, was more than offset by a further rise in impairment charges, principally in the UK lending portfolios, and by higher costs, mainly as a result of continued investment in Barclaycard US. In the UK, high debt levels and changing attitudes to bankruptcy and debt default contributed to increased impairment charges. As the consumer lending market in the UK changes, Barclaycard is repositioning its business to achieve sustainable, profitable growth. Higher borrowing by UK consumers, lower disposable household incomes and a tougher regulatory environment have seen Barclaycard take a number of actions. The business focused on tighter lending criteria and improved collections throughout 2006 and, as a consequence, believes we have passed the worst in Barclaycard UK impairment in the second half of 2006. There has also been a review of some partnership businesses and lending to higher risk customers. An operational review is also under way, to improve efficiency and enhance Barclaycard’s ability to provide the best service to customers, wherever they are in the world.
We continued to invest in Barclaycard US. Since we bought the business in December 2004, outstandings have grown from US$1.4bn to US$4.0bn, and cards in issue have increased from 1.1 million to 4.2 million. Income grew 73% in 2006. Barclaycard US is on track to become profitable in 2007.
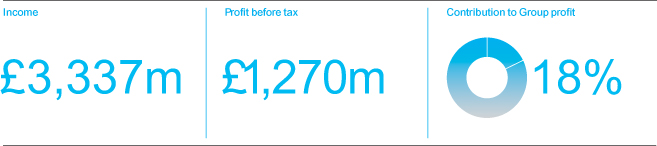
International Retail and Commercial Bankingachieved a step change in profitability to £1,270m (2005: £633m), reflecting the inclusion of Absa for a full year, the impact of corporate development activity and growth in key geographies.
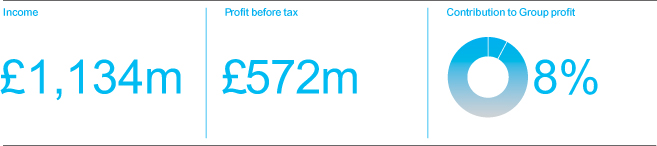
International Retail and Commercial Banking – excluding Absaachieved a profit before tax of £572m (2005: £335m), including a gain of £247m from the disposal of our interest in FirstCaribbean International Bank. Excluding this gain, profit before tax was £325m (2005: £335m). Good organic growth in the businesses across continental Europe was offset by incremental investment in distribution capacity and technology across the businesses in 2006. We expect to double the rate of investment in infrastructure and distribution in 2007.
International Retail and Commercial Banking – Absacontributed £698m profit before tax in the first full year of ownership and is performing well ahead of our acquisition business case. Absa Group Limited achieved year on year growth in profit before tax of 24% in Rand terms, reflecting very strong growth in mortgages, credit cards and commercial property finance. The benefits of Barclays ownership are evident in 46% attributable earnings growth in both Absa Card and Absa Capital (reported in Barclays Capital), with total synergy benefits well ahead of plan.
Barclays Capitalproduced an outstanding performance with profit before tax rising 55% to £2,216m. Income growth of 39% was driven by doing more business with new and existing clients and was broadly based across asset classes and geographies. Growth was particularly strong in areas where we have invested in recent years, including commodities, equity products and credit derivatives. Profit growth was accompanied by improvements in productivity: income and profits grew significantly faster than Daily Value at Risk, risk weighted assets, economic capital, regulatory capital and costs. The ratio of compensation costs to net income improved two percentage points to 49% and the cost:net income ratio improved three percentage points to 64%. We continued to invest for future growth, increasing headcount 3,300 including 1,300 from the acquisition of HomEq, a US mortgage servicing business.
Barclays Global Investorsdelivered excellent results, with profit before tax up 32% to £714m. Income growth of 26% was attributable to increased management fees, particularly in the iShares and active businesses. Assets under management grew US$301bn to US$1.8trn, including net new assets of US$68bn, reflecting very strong inflows in iShares and active assets. The cost:income ratio improved two percentage points to 57%.
| | |
| 12 | | Barclays PLC Annual Report 2006 |
| |
Barclays Wealthprofit before tax rose 28% to £213m.
This reflected broadly based income growth and favourable market conditions, partially offset by a significant increase in investment in people and infrastructure to build a platform for future growth. Total client assets increased 19% to £93bn. The cost:income ratio improved three percentage points to 79%.
InHead office functions and other operationsthe loss before tax decreased £64m to £259m, reflecting the Head office relocation costs incurred in 2005.
Goals
Barclays primary focus is to deliver superior value to its shareholders.
The primary goal remains to achieve top quartile total shareholder return (TSR) relative to a peer group of 11 other UK and international financial services institutions. TSR is defined as the value created for shareholders through share price appreciation, plus reinvested dividend payments. In 2004, we announced a new performance cycle TSR goal for the 2004 to 2007 period.
The TSR peer group is reviewed annually to ensure it aligns with our business mix and the direction and scale of our ambition. The peer group for 2006 was: ABN Amro, BBVA, BNP Paribas, Citigroup, Deutsche Bank, HBOS, HSBC, JP Morgan Chase, Lloyds TSB, Royal Bank of Scotland and UBS. For 2007 the peer group is unchanged.
For the first three years of the new goal period, from 31st December 2003 to 31st December 2006, Barclays was positioned sixth within its peer group, which is second quartile TSR performance.
| | |
Barclays PLC Annual Report 2006 | | 13 |
| |
Intentionally Left Blank
| | |
| 14 | | Barclays PLC Annual Report 2006 |
| |
Overview
| | | | | | | | | | | | | | | | | | | | | | | | | | | |
Analysis of results by business For the year ended 31st December 2006 | |
| | | UK
Banking
£m | | | Barclaycard
£m | | | International
Retail and
Commercial
Banking £m | | | Barclays
Capital
£m | | | Barclays
Global
Investors
£m | | | Barclays
Wealth
£m | | | Barclays
Wealth
– closed life
assurance
activities
£m | | | Head office
functions
and other
operations
£m | | | Group
£m | |
| | | | | | | | | |
Net interest income | | 4,035 | | | 1,843 | | | 1,659 | | | 1,158 | | | 10 | | | 366 | | | (8 | ) | | 80 | | | 9,143 | |
Net fee and commission income | | 1,861 | | | 1,054 | | | 1,303 | | | 952 | | | 1,651 | | | 665 | | | 50 | | | (359 | ) | | 7,177 | |
Principal transactions(a) | | 30 | | | 15 | | | 194 | | | 4,135 | | | 4 | | | – | | | 156 | | | 42 | | | 4,576 | |
| Net premiums from insurance contracts | | 269 | | | 33 | | | 351 | | | – | | | – | | | – | | | 210 | | | 197 | | | 1,060 | |
Other income | | 63 | | | – | | | 74 | | | 22 | | | – | | | 5 | | | 11 | | | 39 | | | 214 | |
| | | | | | | | | |
Total income | | 6,258 | | | 2,945 | | | 3,581 | | | 6,267 | | | 1,665 | | | 1,036 | | | 419 | | | (1 | ) | | 22,170 | |
| Net claims and benefits on insurance contracts | | (35 | ) | | (8 | ) | | (244 | ) | | – | | | – | | | – | | | (288 | ) | | – | | | (575 | ) |
| | | | | | | | | |
| Total income, net of insurance claims | | 6,223 | | | 2,937 | | | 3,337 | | | 6,267 | | | 1,665 | | | 1,036 | | | 131 | | | (1 | ) | | 21,595 | |
Impairment charges | | (461 | ) | | (1,493 | ) | | (167 | ) | | (42 | ) | | – | | | (2 | ) | | – | | | 11 | | | (2,154 | ) |
| | | | | | | | | |
Net income | | 5,762 | | | 1,444 | | | 3,170 | | | 6,225 | | | 1,665 | | | 1,034 | | | 131 | | | 10 | | | 19,441 | |
Operating expenses | | (3,265 | ) | | (1,054 | ) | | (2,196 | ) | | (4,009 | ) | | (951 | ) | | (821 | ) | | (109 | ) | | (269 | ) | | (12,674 | ) |
| Share of post-tax results of associates and joint ventures | | 5 | | | (8 | ) | | 49 | | | – | | | – | | | – | | | – | | | – | | | 46 | |
| Profit on disposal of subsidiaries, associates and joint ventures | | 76 | | | – | | | 247 | | | – | | | – | | | – | | | – | | | – | | | 323 | |
| | | | | | | | | |
Profit before tax | | 2,578 | | | 382 | | | 1,270 | | | 2,216 | | | 714 | | | 213 | | | 22 | | | (259 | ) | | 7,136 | |
| | | | | | | | | |
As at 31st December 2006 | | | | | | | | | | | | | | | | | | | | | | | | | | | |
| | | | | | | | | |
Total assets | | 139,902 | | | 27,628 | | | 68,848 | | | 657,922 | | | 80,515 | | | 7,285 | | | 7,605 | | | 7,082 | | | 996,787 | |
| | | | | | | | | |
Total liabilities | | 159,503 | | | 1,909 | | | 37,567 | | | 632,208 | | | 79,366 | | | 26,817 | | | 7,499 | | | 24,528 | | | 969,397 | |
Note
| (a) | Principal transactions comprise net trading income and net investment income. |
| | |
Barclays PLC Annual Report 2006 | | 15 |
| |
Financial review
Analysis of results by business
UK Banking

UK Banking delivers banking solutions to Barclays UK retail and business banking customers. It offers a range of integrated products and services and access to the expertise of other Group businesses. Customers are served through a variety of channels comprising the branch network, automated teller machines, telephone banking, online banking and relationship managers. UK Banking is managed through two business areas, UK Retail Banking and UK Business Banking.
| | | | | | | | | | | | | | | | |
| | | 2006 £m | | | | | 2005 £m | | | | | 2004(a) £m | |
| | | | | |
Net interest income | | | 4,035 | | | | | | 3,744 | | | | | | 3,348 | |
Net fee and commission income | | | 1,861 | | | | | | 1,720 | | | | | | 1,855 | |
Net trading income | | | 2 | | | | | | – | | | | | | – | |
Net investment income | | | 28 | | | | | | 26 | | | | | | – | |
Principal transactions | | | 30 | | | | | | 26 | | | | | | – | |
Net premiums from insurance contracts | | | 269 | | | | | | 280 | | | | | | 249 | |
Other income | | | 63 | | | | | | 33 | | | | | | 43 | |
| | | | | |
Total income | | | 6,258 | | | | | | 5,803 | | | | | | 5,495 | |
Net claims and benefits on insurance contracts | | | (35 | ) | | | | | (58 | ) | | | | | (46 | ) |
| | | | | |
Total income, net of insurance claims | | | 6,223 | | | | | | 5,745 | | | | | | 5,449 | |
Impairment charges | | | (461 | ) | | | | | (327 | ) | | | | | (188 | ) |
| | | | | |
Net income | | | 5,762 | | | | | | 5,418 | | | | | | 5,261 | |
Operating expenses excluding amortisation of intangible assets | | | (3,263 | ) | | | | | (3,212 | ) | | | | | (3,220 | ) |
Amortisation of intangible assets | | | (2 | ) | | | | | (3 | ) | | | | | (2 | ) |
Operating expenses | | | (3,265 | ) | | | | | (3,215 | ) | | | | | (3,222 | ) |
Share of post-tax results of associates and joint ventures | | | 5 | | | | | | (3 | ) | | | | | 5 | |
Profit on disposal of subsidiaries, associates and joint ventures | | | 76 | | | | | | – | | | | | | 42 | |
| | | | | |
Profit before tax | | | 2,578 | | | | | | 2,200 | | | | | | 2,086 | |
| | | | | |
Cost:income ratio | | | 52 | % | | | | | 56 | % | | | | | 59 | % |
Cost:net income ratio | | | 57 | % | | | | | 59 | % | | | | | 61 | % |
| | | | | |
Risk Tendency | | £ | 515m | | | | | £ | 430m | | | | | £ | 360m | |
| | | | | |
| | | | 2006 | | | | | | 2005 | | | | | | 2004 | |
| | | | | |
Loans and advances to customers | | £ | 123.9bn | | | | | £ | 118.2bn | | | | | £ | 106.7bn | |
Customer accounts | | £ | 142.4bn | | | | | £ | 129.7bn | | | | | £ | 111.1bn | |
Total assets | | £ | 139.9bn | | | | | £ | 130.3bn | | | | | £ | 114.9bn | |
Risk weighted assets | | £ | 84.9bn | | | | | £ | 79.9bn | | | | | £ | 80.5bn | |
Note
| (a) | Does not reflect the application of IAS 32, IAS 39 and IFRS 4 which became effective from 1st January 2005. |
| | |
| 16 | | Barclays PLC Annual Report 2006 |
| |
2006/05
UK Banking profit before tax increased 17% (£378m) to £2,578m (2005: £2,200m) driven principally by good income growth. Profit before business disposals of £76m grew 14% (£302m) to £2,502m (2005: £2,200m).
2005/04
UK Banking profit before tax in 2005 increased 5% (£114m) to £2,200m (2004: £2,086m) driven by good income growth and strong cost management.
The cost:income ratio improved by three percentage points to 56% (2004: 59%).
| | |
Barclays PLC Annual Report 2006 | | 17 |
| |
Financial review
Analysis of results by business
UK Retail Banking

UK Retail Banking comprises Personal Customers, Home Finance, UK Premier and Local Business (formerly Small Business). This cluster of businesses aims to build broader and deeper relationships with customers. Personal Customers and Home Finance provide a wide range of products and services to retail customers, including current accounts, savings and investment products, mortgages branded Woolwich and general insurance. UK Premier provides banking, investment products and advice to affluent customers. Local Business provides banking services to small businesses.
| | | | | | | | | | | | | | | | |
| | | 2006 £m | | | | | 2005 £m | | | | | 2004(a) £m | |
Net interest income | | | 2,333 | | | | | | 2,208 | | | | | | 2,107 | |
Net fee and commission income | | | 1,219 | | | | | | 1,131 | | | | | | 1,149 | |
Net trading income | | | – | | | | | | – | | | | | | – | |
Net investment income | | | – | | | | | | 9 | | | | | | – | |
Principal transactions | | | – | | | | | | 9 | | | | | | – | |
Net premiums from insurance contracts | | | 269 | | | | | | 280 | | | | | | 249 | |
Other income | | | 42 | | | | | | 16 | | | | | | 29 | |
Total income | | | 3,863 | | | | | | 3,644 | | | | | | 3,534 | |
Net claims and benefits on insurance contracts | | | (35 | ) | | | | | (58 | ) | | | | | (46 | ) |
Total income net of insurance claims | | | 3,828 | | | | | | 3,586 | | | | | | 3,488 | |
Impairment charges | | | (209 | ) | | | | | (150 | ) | | | | | (69 | ) |
Net income | | | 3,619 | | | | | | 3,436 | | | | | | 3,419 | |
Operating expenses excluding amortisation of intangible assets | | | (2,407 | ) | | | | | (2,390 | ) | | | | | (2,461 | ) |
Amortisation of intangible assets | | | (1 | ) | | | | | – | | | | | | – | |
Operating expenses | | | (2,408 | ) | | | | | (2,390 | ) | | | | | (2,461 | ) |
Share of post-tax results of associates and joint ventures | | | 2 | | | | | | (6 | ) | | | | | 2 | |
Profit on disposal of subsidiaries, associates and joint ventures | | | – | | | | | | – | | | | | | 42 | |
Profit before tax | | | 1,213 | | | | | | 1,040 | | | | | | 1,002 | |
| | | | | |
Cost:income ratio | | | 63% | | | | | | 67% | | | | | | 71% | |
Cost:net income ratio | | | 67% | | | | | | 70% | | | | | | 72% | |
Risk Tendency | | £ | 225m | | | | | £ | 180m | | | | | £ | 160m | |
| | | | | |
| | | | 2006 | | | | | | 2005 | | | | | | 2004 | |
Loans and advances to customers | | £ | 67.6bn | | | | | £ | 64.8bn | | | | | £ | 66.7bn | |
Customer accounts | | £ | 85.0bn | | | | | £ | 78.8bn | | | | | £ | 73.6bn | |
Total assets | | £ | 74.0bn | | | | | £ | 70.4bn | | | | | £ | 72.7bn | |
Risk weighted assets | | £ | 34.9bn | | | | | £ | 32.8bn | | | | | £ | 38.2bn | |
Note
| (a) | Does not reflect the application of IAS 32, IAS 39 and IFRS 4 which became effective from 1st January 2005. |
| | |
| 18 | | Barclays PLC Annual Report 2006 |
| |
2006/05
UK Retail Banking profit before tax increased 17% (£173m) to £1,213m (2005: £1,040m), driven by good income growth and well controlled costs. There has been substantial additional investment to transform the business.
Income increased 7% (£242m) to £3,828m (2005: £3,586m). Income growth was broadly based. There was strong income growth in Personal Customers retail savings, Local Business and UK Premier and good growth in Personal Customers current account income. Sales volumes increased, with a particularly strong performance from direct channels.
Net interest income increased 6% (£125m) to £2,333m (2005: £2,208m). Growth was driven by a higher contribution from deposits, through a combination of good balance sheet growth and a stable liability margin. Total average customer deposit balances increased 8% to £79.2bn (2005: £73.5bn), supported by new products. Growth of personal savings was above that of the market.
Mortgage volumes improved significantly, driven by a focus on improving capacity, customer service, value and promotion. UK residential mortgage balances ended the year at £61.9bn (2005: £59.6bn). Gross advances were 60% higher at £18.4bn (2005: £11.5bn), with a market share of 5% (2005: 4%). Net lending was £2.4bn, with performance improving during the year, leading to a market share of 4% in the second half of the year. The mortgage margin was reduced by changed assumptions used in the calculation of effective interest rates, a higher proportion of new mortgages and base rate changes. The new business spread was in line with the industry. The loan to value ratio within the residential mortgage book on a current valuation basis was 34% (2005: 35%).
There was good balance growth in non-mortgage loans, where Local Business average balances increased 9% and UK Premier average balances increased 25%.
Net fee and commission income increased 8% (£88m) to £1,219m (2005: £1,131m). There was strong current account income growth in Personal Customers and Local Business. UK Premier delivered strong growth reflecting higher income from banking services, mortgage sales and investment advice.
Net premiums from insurance underwriting activities decreased 4% (£11m) to £269m (2005: £280m). There continued to be lower customer take-up of loan protection insurance. Net claims and benefits on insurance contracts improved to £35m (2005: £58m). Other income increased £26m to £42m (2005: £16m), principally representing the benefit from reinsurance.
Impairment charges increased 39% (£59m) to £209m (2005: £150m). The increase principally reflected balance growth and some deterioration in delinquency rates in the Local Business loan book. Losses from the mortgage portfolio remained negligible, with arrears at low levels.
Operating expenses were steady at £2,408m (2005: £2,390m). Substantially all of the gains from the sale and leaseback of property of £253m have been reinvested in the business to improve customer service and deliver sustainable performance improvements. Around half of the incremental investment was directed at upgrading distribution capabilities, including restructuring and improving the branch network. Further investment was focused on upgrading the contact centres, transforming the performance of the mortgage business, revitalising the retail product range to meet customers’ needs, improving core operations and processes and rationalising the number of operating sites. The level of investment reflected in operating expenses in 2006 was approximately double the level of 2005.
The cost:income ratio improved four percentage points to 63% (2005: 67%).
2005/04
Profit before tax increased 4% (£38m) in 2005 to £1,040m (2004: £1,002m). Profit before tax increased 8% excluding the impact of £42m profit on business disposals in 2004.
Income increased 3% (£98m) to £3,586m (2004: £3,488m). There was good growth in Personal Customer current accounts, Local Business and UK Premier, whilst income from Personal Customers retail savings was weaker. The application of IAS 32 and IAS 39 from 1st January 2005 resulted in the reclassification of certain lending related fees from net fee and commission income to net interest income.
Net interest income increased 5% (£101m) to £2,208m (2004: £2,107m). Growth was driven by higher contributions from Home Finance and Local Business, partly offset by some margin pressure on savings and deposits.
UK residential mortgage balances ended the period at £59.6bn (2004: £61.7bn). Total average customer deposit balances increased 5% to £73.5bn (2004: £69.7bn).
Net fee and commission income decreased 2% (£18m) to £1,131m (2004: £1,149m) with lending related fees impacted by the application of IAS 32 and IAS 39 from 1st January 2005.
Income from principal transactions was £9m (2004: £nil) representing the gain on the sale of the investment in Gresham, an insurance underwriting business.
Net premiums from insurance underwriting activities increased 12% (£31m) to £280m (2004: £249m). In 2004 there was a provision relating to the early termination of contracts. Excluding this provision, there was a slight underlying reduction in net premiums.
Impairment charges increased 117% (£81m) to £150m (2004: £69m). Excluding UK mortgage releases of £10m (2004: £40m), impairment charges increased 47%, reflecting some deterioration in the delinquencies experience and balance growth in overdrafts and Local Business.
Operating expenses decreased 3% (£71m) to £2,390m (2004: £2,461m). The cost:income ratio improved four percentage points to 67% (2004: 71%).
| | |
Barclays PLC Annual Report 2006 | | 19 |
| |
Financial review
Analysis of results by business
UK Business Banking

UK Business Banking provides relationship banking to Barclays larger and medium business customers in the UK. Customers are served by a network of relationship and industry sector specialist managers who provide local access to an extensive range of products and services, as well as offering business information and support. Customers are also offered access to the products and expertise of other businesses in the Group, particularly Barclays Capital and Barclaycard. UK Business Banking provides asset financing and leasing solutions through a specialist business.
| | | | | | | | | | | | | | | | |
| | | 2006 £m | | | | | 2005 £m | | | | | 2004(a) £m | |
Net interest income | | | 1,702 | | | | | | 1,536 | | | | | | 1,241 | |
Net fee and commission income | | | 642 | | | | | | 589 | | | | | | 706 | |
Net trading income | | | 2 | | | | | | – | | | | | | – | |
Net investment income | | | 28 | | | | | | 17 | | | | | | – | |
Principal transactions | | | 30 | | | | | | 17 | | | | | | – | |
Other income | | | 21 | | | | | | 17 | | | | | | 14 | |
Total income | | | 2,395 | | | | | | 2,159 | | | | | | 1,961 | |
Impairment charges | | | (252 | ) | | | | | (177 | ) | | | | | (119 | ) |
Net income | | | 2,143 | | | | | | 1,982 | | | | | | 1,842 | |
Operating expenses excluding amortisation of intangible assets | | | (856 | ) | | | | | (822 | ) | | | | | (759 | ) |
Amortisation of intangible assets | | | (1 | ) | | | | | (3 | ) | | | | | (2 | ) |
Operating expenses | | | (857 | ) | | | | | (825 | ) | | | | | (761 | ) |
Share of post-tax results of associates and joint ventures | | | 3 | | | | | | 3 | | | | | | 3 | |
Profit on disposal of subsidiaries, associates and joint ventures | | | 76 | | | | | | – | | | | | | – | |
Profit before tax | | | 1,365 | | | | | | 1,160 | | | | | | 1,084 | |
Cost:income ratio | | | 36% | | | | | | 38% | | | | | | 39% | |
Cost:net income ratio | | | 40% | | | | | | 42% | | | | | | 41% | |
Risk Tendency | | £ | 290m | | | | | £ | 250m | | | | | £ | 200m | |
| | | | | |
| | | | 2006 | | | | | | 2005 | | | | | | 2004 | |
Loans and advances to customers | | £ | 56.3bn | | | | | £ | 53.4bn | | | | | £ | 40.0bn | |
Customer accounts | | £ | 57.4bn | | | | | £ | 50.9bn | | | | | £ | 37.5bn | |
Total assets | | £ | 65.9bn | | | | | £ | 59.9bn | | | | | £ | 42.2bn | |
Risk weighted assets | | £ | 50.0bn | | | | | £ | 47.1bn | | | | | £ | 42.3bn | |
Note
| (a) | Does not reflect the application of IAS 32, IAS 39 and IFRS 4 which became effective from 1st January 2005. |
| | |
| 20 | | Barclays PLC Annual Report 2006 |
| |
2006/05
UK Business Banking profit before tax increased 18% (£205m) to £1,365m (2005: £1,160m), driven by continued strong income growth. UK Business Banking maintained its market share of primary customer relationships. The 2006 result included a £23m (2005: £13m) contribution from a full year consolidation of Iveco Finance, in which a 51% stake was acquired on 1st June 2005, and a £76m (2005: £nil) contribution from business disposals. Profit before business disposals of £76m increased 11% to £1,289m (2005: £1,160m).
Income increased 11% (£236m) to £2,395m (2005: £2,159m), driven by strong balance sheet growth. The uplift in income was broadly based across income categories.
Net interest income increased 11% (£166m) to £1,702m (2005: £1,536m) driven by strong balance sheet growth. There was strong growth in all business areas and in particular Larger Business. The lending margin improved slightly. Average deposit balances increased 11% to £44.8bn (2005: £40.5bn) with good growth across product categories. The deposit margin was stable.
Net fee and commission income increased 9% (£53m) to £642m (2005: £589m). There was a strong rise in income from foreign exchange and derivatives business transacted through Barclays Capital on behalf of Business Banking customers.
Income from principal transactions was £30m (2005: £17m), primarily reflecting the profit realised on a number of equity investments.
As expected, impairment rates trended upwards during the year towards a more normalised level. Impairment increased 42% (£75m) to £252m (2005: £177m), with the increase mainly reflecting higher charges from Medium Business and balance growth. Impairment charges in Larger Business were stable.
Operating expenses increased 4% (£32m) to £857m (2005: £825m). Cost growth reflected higher volumes, increased expenditure on front line staff and the costs of Iveco Finance for a full year. Operating expenses included a gain of £60m on the sale and leaseback of property, of which approximately half was reinvested in the business, including costs relating to the acceleration of the rationalisation of operating sites and technology infrastructure.
The cost:income ratio improved two percentage points to 36% (2005: 38%).
Profit on disposals of subsidiaries, associates and joint ventures of £76m (2005: £nil) arose from the sales of interests in vehicle leasing and European vendor finance businesses.
2005/04
Profit before tax increased 7% (76m) to £1,160m (2004: £1,084m), driven by strong income growth.
Both Larger Business and Medium Business performed well.
Income increased 10% (£198m) to £2,159m (2004: £1,961m), driven by strong balance sheet growth. The application of IAS 32 and IAS 39 from 1st January 2005 resulted in the reclassification of certain lending related fees from net fee and commission income to net interest income. Excluding the impact of IAS 32 and IAS 39, both net interest income and net fee and commission income continued to grow.
Impairment charges increased 49% (£58m) to £177m (2004: £119m). Excluding the impact of a £57m recovery in 2004, the impairment charge was broadly stable.
Operating expenses increased 8% (£64m) to £825m (2004: £761m), reflecting volume growth, increased expenditure on frontline staff and the costs of Iveco Finance since acquisition.
The cost:income ratio improved one percentage point to 38% (2004: 39%).
| | |
Barclays PLC Annual Report 2006 | | 21 |
| |
Financial review
Analysis of results by business
Barclaycard

Barclaycard is a multi-brand credit card and consumer loans business which also processes card payments for retailers and merchants and issues credit and charge cards to corporate customers and the UK Government. It is one of Europe’s leading credit card businesses and has an increasing presence in the United States.
In the UK, Barclaycard comprises Barclaycard, SkyCard and Monument branded credit cards, Barclays branded loans and FirstPlus secured lending. Barclaycard also manages card operations on behalf of Solution Personal Finance.
Outside the UK, Barclaycard provides credit cards in the United States, Germany, Spain, Italy, Portugal and Africa. In the Nordic region, Barclaycard operates through Entercard, a joint venture with FöreningsSparbanken (Swedbank).
Barclaycard works closely with other parts of the Group, including UK Retail Banking, UK Business Banking and International Retail and Commercial Banking, to leverage their distribution capabilities.
| | | | | | | | | | | | | | | | |
| | | 2006 £m | | | | | 2005 £m | | | | | 2004(a) £m | |
| | | | | |
Net interest income | | | 1,843 | | | | | | 1,726 | | | | | | 1,587 | |
Net fee and commission income | | | 1,054 | | | | | | 972 | | | | | | 790 | |
Net investment income | | | 15 | | | | | | – | | | | | | – | |
Net premiums from insurance contracts | | | 33 | | | | | | 24 | | | | | | 22 | |
Total income | | | 2,945 | | | | | | 2,722 | | | | | | 2,399 | |
Net claims and benefits on insurance contracts | | | (8 | ) | | | | | (7 | ) | | | | | (5 | ) |
Total income net of insurance claims | | | 2,937 | | | | | | 2,715 | | | | | | 2,394 | |
Impairment charges | | | (1,493 | ) | | | | | (1,098 | ) | | | | | (761 | ) |
Net income | | | 1,444 | | | | | | 1,617 | | | | | | 1,633 | |
Operating expenses excluding amortisation of intangible assets | | | (1,037 | ) | | | | | (961 | ) | | | | | (804 | ) |
Amortisation of intangible assets | | | (17 | ) | | | | | (17 | ) | | | | | (3 | ) |
Operating expenses | | | (1,054 | ) | | | | | (978 | ) | | | | | (807 | ) |
Share of post-tax results of associates and joint ventures | | | (8 | ) | | | | | 1 | | | | | | 4 | |
Profit before tax | | | 382 | | | | | | 640 | | | | | | 830 | |
Cost:income ratio | | | 36% | | | | | | 36% | | | | | | 34% | |
Cost:net income ratio | | | 73% | | | | | | 60% | | | | | | 49% | |
Risk Tendency | | £ | 1,410m | | | | | £ | 1,100m | | | | | £ | 860m | |
| | | | | |
| | | | 2006 | | | | | | 2005 | | | | | | 2004 | |
Loans and advances to customers | | | £25.5bn | | | | | | £24.0bn | | �� | | | £ | 22.3bn | |
Total assets | | | £27.6bn | | | | | | £25.8bn | | | | | £ | 23.4bn | |
Risk weighted assets | | | £25.2bn | | | | | | £21.8bn | | | | | £ | 20.2bn | |
Note
| (a) | Does not reflect the application of IAS 32, IAS 39 and IFRS 4 which became effective from 1st January 2005. |
| | |
| 22 | | Barclays PLC Annual Report 2006 |
| |
2006/05
Barclaycard profit before tax decreased 40% (£258m) to £382m (2005: £640m) as good income growth was more than offset by higher impairment charges and increased costs from the continued development of international businesses.
Income increased 8% (£222m) to £2,937m (2005: £2,715m). Growth was driven by very strong momentum in the United States and by strong performances in Barclaycard Business, FirstPlus, SkyCard and continental European markets.
Net interest income increased 7% (£117m) to £1,843m (2005: £1,726m). UK average extended credit card balances fell 7% to £8.0bn (2005: £8.6bn), reflecting the impact of tighter lending criteria. UK average consumer lending balances increased 16% to £11.9bn (2005: £10.3bn) driven by secured lending in FirstPlus. International average extended credit card balances rose 39% to £2.5bn (2005: £1.8bn).
Net fee and commission income increased 8% (£82m) to £1,054m (2005: £972m) as a result of increased contributions from Barclaycard International, SkyCard, FirstPlus and Barclaycard Business. Barclaycard reduced its late and overlimit fee charges in the UK on 1st August 2006 in response to the Office of Fair Trading’s findings.
Investment income of £15m (2005: £nil) represents the gain arising from the sale of part of the stake in MasterCard Inc, following its flotation.
Impairment charges increased 36% (£395m) to £1,493m (2005: £1,098m). The increase was driven by a rise in delinquent balances and increased numbers of bankruptcies and Individual Voluntary Arrangements. As a result of management action in 2005 and 2006 to tighten lending criteria and improve collection processes, the flows of new delinquencies reduced, and levels of arrears balances declined in the second half of 2006 in UK cards and unsecured loans.
Operating expenses increased 8% (£76m) to £1,054m (2005: £978m). This included a £38m gain from the sale and leaseback of property. Excluding this item, operating expenses increased 12% (£114m) to £1,092m. This was largely as a result of continued investment in Barclaycard International, particularly Barclaycard US, and the development of UK partnerships.
Barclaycard International continued its growth strategy in the continental European business delivering solid results. The Entercard joint venture, which is based in Scandinavia, performed ahead of plan. Barclaycard International loss before tax reduced to £30m (2005: loss £37m), including the loss before tax for Barclaycard US of £56m (2005: loss £59m). Barclaycard US continued to perform ahead of expectations, delivering very strong growth in balances and customer numbers and creating a number of new partnerships including US Airways, Barnes & Noble, Travelocity and Jo-Ann Stores.
Barclaycard UK customer numbers declined 1.4 million to 9.8 million (2005: 11.2 million). This reflected the closure of 1.5 million accounts that had been inactive.
2005/04
Barclaycard profit before tax decreased 23% (£190m) to £640m (2004: £830m). Excluding Barclaycard US loss before tax of £59m, profit before tax fell 16% (£131m) to £699m.
Income increased 13% (£321m) to £2,715m (2004: £2,394m) driven by good performances across the diversified UK cards and loans businesses and Barclaycard Business, and by very strong momentum in international cards. Excluding Barclaycard US income of £117m, income increased 9%.
Net interest income increased 9% (£139m) to £1,726m (2004: £1,587m) as a result of growth in average balances.
UK average extended credit balances rose 5% to £8.6bn (2004: £8.2bn) and international average extended credit balances doubled to £1.8bn (2004: £0.9bn). Excluding Barclaycard US average extended credit balances of £0.9bn, international average extended credit balances increased 26%.
Net fee and commission income increased 23% (£182m) to £972m (2004: £790m) as a result of the inclusion of Barclaycard US and increased contributions from Barclaycard Business and FirstPlus. Excluding the impact of IAS 32 and IAS 39, net fee and commission income increased 16%.
Impairment charges increased 44% (£337m) to £1,098m (2004: £761m). The increase was driven by a rise in delinquent balances, lower rates of recovery from customers, the inclusion of Barclaycard US, and an increase in the size of the average loan book. Excluding Barclaycard US impairment charges of £53m, impairment charges increased 38%.
Operating expenses rose 21% (£171m) to £978m (2004: £807m), mostly as a result of the inclusion of Barclaycard US. Excluding Barclaycard US operating expenses of £111m, operating expenses rose 7% reflecting continued investment in the UK and continental European card businesses and the development of the UK Partnerships business.
Barclaycard International performed strongly, with Germany and Spain delivering excellent results. The loss before tax for Barclaycard International was £37m (2004: loss of £6m). Excluding Barclaycard US, Barclaycard International profit before tax was £22m (2004: £8m), with income ahead 22%. The loss before tax for Barclaycard US was £59m (2004: loss of £2m).
| | |
Barclays PLC Annual Report 2006 | | 23 |
| |
Financial review
Analysis of results by business
International Retail and Commercial Banking
International Retail and Commercial Banking provides Barclays personal and corporate customers outside the UK with banking services.
The products and services offered to customers are tailored to meet the regulatory and commercial environments within each country. For reporting purposes from 2005, the operations have been grouped into two components: International Retail and Commercial Banking – excluding Absa and International Retail and Commercial Banking – Absa.
International Retail and Commercial Banking works closely with all other parts of the Group to leverage synergies from product and service propositions.
| | | | | | | | | | | | | | | | |
| | | 2006
£m | | | | | 2005
£m | | | | | 2004(a)
£m | |
Net interest income | | | 1,659 | | | | | | 1,050 | | | | | | 529 | |
Net fee and commission income | | | 1,303 | | | | | | 705 | | | | | | 288 | |
Net trading income | | | 6 | | | | | | 3 | | | | | | – | |
Net investment income | | | 188 | | | | | | 143 | | | | | | 135 | |
Principal transactions | | | 194 | | | | | | 146 | | | | | | 135 | |
Net premiums from insurance contracts | | | 351 | | | | | | 227 | | | | | | 300 | |
Other income | | | 74 | | | | | | 60 | | | | | | 25 | |
Total income | | | 3,581 | | | | | | 2,188 | | | | | | 1,277 | |
Net claims and benefits on insurance contracts | | | (244 | ) | | | | | (205 | ) | | | | | (390 | ) |
Total income net of insurance claims | | | 3,337 | | | | | | 1,983 | | | | | | 887 | |
Impairment charges | | | (167 | ) | | | | | (32 | ) | | | | | (31 | ) |
Net income | | | 3,170 | | | | | | 1,951 | | | | | | 856 | |
Operating expenses excluding amortisation of intangible assets | | | (2,111 | ) | | | | | (1,317 | ) | | | | | (616 | ) |
Amortisation of intangible assets | | | (85 | ) | | | | | (47 | ) | | | | | (1 | ) |
Operating expenses | | | (2,196 | ) | | | | | (1,364 | ) | | | | | (617 | ) |
Share of post-tax results of associates and joint ventures | | | 49 | | | | | | 46 | | | | | | 49 | |
Profit on disposal of subsidiaries, associates and joint ventures | | | 247 | | | | | | – | | | | | | – | |
Profit before tax | | | 1,270 | | | | | | 633 | | | | | | 288 | |
Cost:income ratio | | | 66% | | | | | | 69% | | | | | | 70% | |
Cost:net income ratio | | | 69% | | | | | | 70% | | | | | | 72% | |
Risk Tendency | | £ | 220m | | | | | £ | 175m | | | | | £ | 65m | |
| | | | | |
| | | 2006 | | | | | | 2005 | | | | | | 2004 | |
Loans and advances to customers | | £ | 53.5bn | | | | | £ | 49.3bn | | | | | £ | 20.7bn | |
Customer accounts | | £ | 22.5bn | | | | | £ | 22.6bn | | | | | £ | 10.1bn | |
Total assets | | £ | 68.9bn | | | | | £ | 63.6bn | | | | | £ | 28.5bn | |
Risk weighted assets | | £ | 41.1bn | | | | | £ | 41.2bn | | | | | £ | 19.3bn | |
Note
| (a) | Does not reflect the application of IAS 32, IAS 39 and IFRS 4 which became effective from 1st January 2005. |
| | |
| 24 | | Barclays PLC Annual Report 2006 |
| |
2006/05
International Retail and Commercial Banking profit before tax increased £637m to £1,270m (2005: £633m). The increase reflected the inclusion of a full year’s profit before tax from International Retail and Commercial Banking – Absa of £698m (2005(a): £298m) and a profit of £247m on the disposal of Barclays interest in FirstCaribbean International Bank.
2005/04
International Retail and Commercial Banking profit before tax increased £345m to £633m (2004: £288m). The increase reflected the inclusion of profit before tax from International Retail and Commercial Banking –Absa of £298m(a)and strong organic growth in Africa and Europe.
From 1st January 2005, following the application of IAS 39 and IFRS 4, life assurance products are divided into investment contracts and insurance contracts. Investment income from assets backing insurance contracts, and the corresponding movement in investment contract liabilities, has been presented on a net basis in other income.
In addition, these standards have impacted the reporting of net claims and benefits paid.
Note
(a) For 2005, this reflects the period from 27th July until 31st December 2005.
| | |
Barclays PLC Annual Report 2006 | | 25 |
| |
Financial review
Analysis of results by business
International Retail and Commercial Banking – excluding Absa
International Retail and Commercial Banking – excluding Absa provides a range of banking services, including current accounts, savings, investments, mortgages and loans to personal and corporate customers across Spain, Portugal, France, Italy, Africa and the Middle East.
| | | | | | | | | | | | | | | | |
| | | 2006 £m | | | | | 2005 £m | | | | | 2004(a) £m | |
Net interest income | | | 610 | | | | | | 562 | | | | | | 529 | |
Net fee and commission income | | | 448 | | | | | | 377 | | | | | | 288 | |
Net trading income | | | 17 | | | | | | 31 | | | | | | – | |
Net investment income | | | 66 | | | | | | 88 | | | | | | 135 | |
Principal transactions | | | 83 | | | | | | 119 | | | | | | 135 | |
Net premiums from insurance contracts | | | 111 | | | | | | 129 | | | | | | 300 | |
Other income | | | 20 | | | | | | 23 | | | | | | 25 | |
Total income | | | 1,272 | | | | | | 1,210 | | | | | | 1,277 | |
Net claims and benefits on insurance contracts | | | (138 | ) | | | | | (161 | ) | | | | | (390 | ) |
Total income net of insurance claims | | | 1,134 | | | | | | 1,049 | | | | | | 887 | |
Impairment charges | | | (41 | ) | | | | | (13 | ) | | | | | (31 | ) |
Net income | | | 1,093 | | | | | | 1,036 | | | | | | 856 | |
Operating expenses excluding amortisation of intangible assets | | | (799 | ) | | | | | (734 | ) | | | | | (616 | ) |
Amortisation of intangible assets | | | (9 | ) | | | | | (6 | ) | | | | | (1 | ) |
Operating expenses | | | (808 | ) | | | | | (740 | ) | | | | | (617 | ) |
Share of post-tax results of associates and joint ventures | | | 40 | | | | | | 39 | | | | | | 49 | |
Profit on disposal of subsidiaries, associates and joint ventures | | | 247 | | | | | | – | | | | | | – | |
Profit before tax | | | 572 | | | | | | 335 | | | | | | 288 | |
Cost:income ratio | | | 71% | | | | | | 71% | | | | | | 70% | |
Cost:net income ratio | | | 74% | | | | | | 71% | | | | | | 72% | |
| | | | | |
Risk Tendency | | £ | 75m | | | | | £ | 75m | | | | | £ | 65m | |
| | | | | |
| | | | 2006 | | | | | | 2005 | | | | | | 2004 | |
| | | | | |
Loans and advances to customers | | £ | 29.3bn | | | | | £ | 25.4bn | | | | | £ | 20.7bn | |
Customer accounts | | £ | 11.4bn | | | | | £ | 10.4bn | | | | | £ | 10.1bn | |
Total assets | | £ | 38.5bn | | | | | £ | 34.2bn | | | | | £ | 28.5bn | |
Risk weighted assets | | £ | 20.4bn | | | | | £ | 20.4bn | | | | | £ | 19.3bn | |
Note
| (a) | Does not reflect the application of IAS 32, IAS 39 and IFRS 4 which became effective from 1st January 2005. |
| | |
| 26 | | Barclays PLC Annual Report 2006 |
| |
2006/05
International Retail and Commercial Banking – excluding Absa profit before tax increased 71% (£237m) to £572m (2005: £335m), including a gain on the disposal of the interest in FirstCaribbean International Bank of £247m. Profit before business disposals was £325m (2005: £335m). This reflected good growth in continental Europe offset by a decline in profits in Africa caused by higher impairment, and increased costs reflecting a step change in the rate of organic investment in the business.
Income increased 8% (£85m) to £1,134m (2005: £1,049m). Excluding gains from asset sales of £31m in 2005, income increased 11% (£116m) to £1,134m (2005: £1,018m).
Net interest income increased 9% (£48m) to £610m (2005: £562m), reflecting strong balance sheet growth in continental Europe, Africa and the Middle East, and the development of the corporate business in Spain.
Total average customer loans increased 20% to £27.4bn (2005: £22.9bn). Mortgage balance growth in continental Europe was particularly strong, with average Euro balances up 22%. There was a modest decline in lending margins partly driven by a greater share of mortgage assets as a proportion of the total book in continental Europe. Average customer deposits increased 17% to £10.8bn (2005: £9.2bn), with deposit margins stable.
Net fee and commission income increased 19% (£71m) to £448m (2005: £377m). This reflected a strong performance from the Spanish funds business, where average assets under management increased 11%, together with very strong growth in France, including the first full year contribution of the ING Ferri business which was acquired on 1st July 2005. Net fee and commission income showed solid growth in Africa and the Middle East.
Principal transactions decreased £36m to £83m (2005: £119m). 2005 included £23m from the redemption of preference shares in FirstCaribbean International Bank.
Impairment charges increased £28m to £41m (2005: £13m). This reflected the absence of one-off recoveries of £12m which arose in 2005 in Africa and the Middle East, and strong balance sheet growth across the businesses.
Operating expenses increased 9% (£68m) to £808m (2005: £740m). This included gains from the sale and leaseback of property in Spain of £55m, just under half of which were reinvested in staff restructuring and upgrading infrastructure. Excluding these net gains of £32m, operating expenses increased 14% to £840m (2005: £740m). The increase also included incremental investment expenditure of £25m to expand the distribution network and enhance IT and operational capabilities.
Barclays Spain continued to perform strongly. Profit before tax increased 74% (£68m) to £160m (2005: £921m). Excluding net one-off gains on asset sales of £32m (2005: £8m) and integration costs of £43m (2005: £57m) profit before tax increased 21% (£30m) to £171m (2005: £141m). This was driven by the continued realisation of benefits from Banco Zaragozano, together with good growth in mortgages and assets under management.
Africa and the Middle East profit before tax decreased 9% (£12m) to £126m (2005: £138m) driven by higher impairment charges reflecting one-off recoveries of £12m that arose in 2005 and an increase in investment expenditure.
Profit before tax increased strongly in Portugal reflecting good flows of new customers and increased business volumes. France also performed well as a result of good organic growth and the acquisition of ING Ferri.
The profit on disposal of subsidiaries, associate and joint ventures of £247m (2005: £nil) comprised the gain on the sale of Barclays interest in FirstCaribbean International Bank. The share of post-tax results of FirstCaribbean International Bank included in 2006 was £41m (2005: £37m).
2005/04
International Retail and Commercial Banking – excluding Absa performed strongly, with profit before tax increasing 16% (£47m) to £335m (2004: £288m). The performance was broad-based, featuring stronger profits in all geographies.
Income increased 18% (£162m) to £1,049m (2004: £887m).
Net interest income increased 6% (£33m) to £562m (2004: £529m), reflecting strong balance sheet growth in Europe, Africa and the Middle East, and the development of the corporate businesses in Spain.
Total average customer loans increased 28% to £22.9bn (2004: £17.8bn). Mortgage balance growth in continental Europe was particularly strong with average euro balances up 25%.
Net fee and commission income increased 31% (£89m) to £377m (2004: £288m). This reflected a strong performance from the Spanish funds business, where assets under management increased 15%, together with good growth in France, including the contribution of the ING Ferri business which was acquired on 1st July 2005.
Principal transactions reduced to £119m (2004: £135m), reflecting the change in accounting for insurance business, partly offset by investment realisations during 2005 including a gain of £23m from the redemption of preference shares in FirstCaribbean International Bank.
Impairment charges decreased 58% (£18m) to £13m (2004: £31m).
Operating expenses increased 20% (£123m) to £740m (2004: £617m). The increase was in line with the growth in income, and was due to higher integration costs in Spain, the continued expansion of the business in Africa and the Middle East, investments in the European distribution network, particularly in Portugal and Italy, and the acquisition of the ING Ferri business in France. The cost:income ratio remained stable at 71% (2004: 70%).
Barclays Spain performed very strongly with profit before tax, excluding integration costs, up 19% to £149m (2004: £125m). Including integration costs of £57m (2004: £42m), profit before tax was up 11% to £92m (2004: £83m).
Africa and the Middle East profit before tax increased 10% to £138m (2004: £125m) reflecting continued investment and balance sheet growth across the businesses.
The post-tax profit from associates decreased £10m to £39m (2004: £49m) due to a lower contribution from FirstCaribbean International Bank.
| | |
Barclays PLC Annual Report 2006 | | 27 |
| |
Financial review
Analysis of results by business
International Retail and Commercial Banking – Absa

International Retail and Commercial Banking – Absa represents Barclays consolidation of Absa, excluding Absa Capital which is included as part of Barclays Capital. Absa Group Limited is one of South Africa’s largest financial services organisations serving personal, commercial and corporate customers predominantly in South Africa. International Retail and Commercial Banking – Absa serves retail customers through a variety of distribution channels and offers a full range of banking services, including current and deposit accounts, mortgages, instalment finance, credit cards, bancassurance products and wealth management services; it also offers customised business solutions for commercial and large corporate customers.
| | | | | | | | | | |
| | | 2006 £m | | | | | 2005(a)
£m | |
| | | |
Net interest income | | | 1,049 | | | | | | 488 | |
Net fee and commission income | | | 855 | | | | | | 328 | |
Net trading income | | | (11 | ) | | | | | (28 | ) |
Net investment income | | | 122 | | | | | | 55 | |
Principal transactions | | | 111 | | | | | | 27 | |
Net premiums from insurance contracts | | | 240 | | | | | | 98 | |
Other income | | | 54 | | | | | | 37 | |
Total income | | | 2,309 | | | | | | 978 | |
Net claims and benefits on insurance contracts | | | (106 | ) | | | | | (44 | ) |
Total income net of insurance claims | | | 2,203 | | | | | | 934 | |
Impairment charges | | | (126 | ) | | | | | (19 | ) |
Net income | | | 2,077 | | | | | | 915 | |
Operating expenses excluding amortisation of intangible assets | | | (1,312 | ) | | | | | (583 | ) |
Amortisation of intangible assets | | | (76 | ) | | | | | (41 | ) |
Operating expenses | | | (1,388 | ) | | | | | (624 | ) |
Share of post-tax results of associates and joint ventures | | | 9 | | | | | | 7 | |
Profit before tax | | | 698 | | | | | | 298 | |
| | | |
Cost:income ratio | | | 63% | | | | | | 67% | |
Cost:net income ratio | | | 67% | | | | | | 68% | |
Risk Tendency | | £ | 145m | | | | | £ | 100m | |
| | | |
| | | | 2006 | | | | | | 2005 | |
| | | |
Loans and advances to customers | | £ | 24.2bn | | | | | £ | 23.9bn | |
Customer accounts | | £ | 11.1bn | | | | | £ | 12.2bn | |
Total assets | | £ | 30.4bn | | | | | £ | 29.4bn | |
Risk weighted assets | | £ | 20.7bn | | | | | £ | 20.8bn | |
Note
| (a) | For 2005, this reflects the period from 27th July until 31st December 2005. |
| | |
| 28 | | Barclays PLC Annual Report 2006 |
| |
2006/05
International Retail and Commercial Banking – Absa profit before tax increased 134% to £698m (2005: £298m) reflecting the full year to 31st December 2006 compared with the five months ended 31st December 2005. Barclays acquired a controlling stake in Absa Group Limited on 27th July 2005.
| | |
Barclays PLC Annual Report 2006 | | 29 |
| |
Financial review
Analysis of results by business
Barclays Capital

Barclays Capital is a leading global investment bank which provides large corporate, institutional and government clients with solutions to their financing and risk management needs.
Barclays Capital services a wide variety of client needs, from capital raising and managing foreign exchange, interest rate, equity and commodity risks, through to providing technical advice and expertise. Activities are organised into three principal areas: Rates, which includes fixed income, foreign exchange, commodities, emerging markets, money markets, sales, trading and research, prime services and equity products; Credit, which includes primary and secondary activities for loans and bonds for investment grade, high yield and emerging market credit, as well as hybrid capital products, asset-based finance, commercial mortgage backed securities, credit derivatives, structured capital markets and large asset leasing; and Private Equity. Barclays Capital includes Absa Capital, the investment banking business of Absa. Barclays Capital works closely with all other parts of the Group to leverage synergies from client relationships and product capabilities.
| | | | | | | | | | | | | | | | |
| | | 2006 £m | | | | | 2005 £m | | | | | 2004(a) £m | |
| | | | | |
Net interest income | | | 1,158 | | | | | | 1,065 | | | | | | 1,068 | |
Net fee and commission income | | | 952 | | | | | | 776 | | | | | | 670 | |
Net trading income | | | 3,562 | | | | | | 2,231 | | | | | | 1,463 | |
Net investment income | | | 573 | | | | | | 413 | | | | | | 302 | |
Principal transactions | | | 4,135 | | | | | | 2,644 | | | | | | 1,765 | |
Other income | | | 22 | | | | | | 20 | | | | | | 15 | |
| | | | | |
Total income | | | 6,267 | | | | | | 4,505 | | | | | | 3.518 | |
Impairment charge | | | (42 | ) | | | | | (111 | ) | | | | | (106 | ) |
| | | | | |
Net income | | | 6,225 | | | | | | 4,394 | | | | | | 3,412 | |
Operating expenses excluding amortisation of intangible assets | | | (3,996 | ) | | | | | (2,961 | ) | | | | | (2,270 | ) |
Amortisation of intangible assets | | | (13 | ) | | | | | (2 | ) | | | | | – | |
Operating expenses | | | (4,009 | ) | | | | | (2,963 | ) | | | | | (2,270 | ) |
| | | | | |
Profit before tax | | | 2,216 | | | | | | 1,431 | | | | | | 1,142 | |
| | | | | |
Cost:income ratio | | | 64% | | | | | | 66% | | | | | | 65% | |
Cost:net income ratio | | | 64% | | | | | | 67% | | | | | | 67% | |
Compensation:net income ratio | | | 49% | | | | | | 51% | | | | | | 50% | |
| | | | | |
Risk Tendency | | £ | 95m | | | | | £ | 110m | | | | | £ | 75m | |
Average DVaR | | £ | 37.1m | | | | | £ | 32.0m | | | | | £ | 34.3m | |
| | | | | |
Average net income generated per member of staff (‘000) | | £ | 560 | | | | | £ | 498 | | | | | £ | 490 | |
| | | | | |
| | | 2006 | | | | | 2005 | | | | | 2004 | |
| | | | | |
Total assets | | £ | 657.9bn | | | | | £ | 601.2bn | | | | | £ | 353.2bn | |
Risk weighted assets | | £ | 137.6bn | | | | | £ | 116.7bn | | | | | £ | 90.1bn | |
Corporate lending portfolio | | £ | 40.6bn | | | | | £ | 40.1bn | | | | | £ | 24.3bn | |
Note
| (a) | Does not reflect the application of IAS 32, IAS 39 and IFRS 4 which became effective from 1st January 2005. |
| | |
| 30 | | Barclays PLC Annual Report 2006 |
| |
2006/05
Barclays Capital delivered record profit before tax and net income. Profit before tax increased 55% (£785m) to £2,216m (2005: £1,431m). This was the result of a very strong income performance, driven by higher business volumes, continued growth in client activity and favourable market conditions. Net income increased 42% (£1,831m) to £6,225m (2005: £4,394m). Profit before tax for Absa Capital was £71m (2005(a): £39m). Excluding Absa Capital, profit before tax increased 54%.
Income increased 39% (£1,762m) to £6,267m (2005: £4,505m) as a result of very strong growth across the Rates, Credit and Private Equity businesses. Income increased in all geographic regions with significant contributions outside the UK from the US, continental Europe and Asia. The top line performance reflected returns from past investments and the strength of the global client franchise. Average DVaR increased 16% to £37.1m (2005: £32.0m) significantly below the rate of income growth.
Secondary income, comprising principal transactions (net trading income and net investment income) and net interest income, is mainly generated from providing client financing and risk management solutions. Secondary income increased 43% (£1,584m) to £5,293m (2005: £3,709m).
Net trading income increased 60% (£1,331m) to £3,562m (2005: £2,231m) with very strong contributions across the Rates and Credit businesses, in particular, commodities, fixed income, equities, credit derivatives and emerging markets. The performance was driven by higher volumes of client led activity and favourable market conditions. Net investment income increased 39% (£160m) to £573m (2005: £413m) driven by investment realisations, primarily in Private Equity, offset by reduced contributions from credit products. Net interest income increased 9% (£93m) to £1,158m (2005: £1,065m) driven by a full year contribution from Absa Capital. Corporate lending remained flat at £40.6bn (2005: £40.1bn).
Primary income, which comprises net fee and commission income from advisory and origination activities, grew 23% (£176m) to £952m (2005: £776m). This reflected higher volumes and continued market share gains in a number of key markets, with strong contributions from issuances in bonds, European leveraged loans and convertibles.
Impairment charges of £42m (2005: £111m), including impairment on available for sale assets of £83m (2005: £nil), were 62% lower than prior year reflecting recoveries and the continued benign wholesale credit environment.
Operating expenses increased 35% (£1,046m) to £4,009m (2005: £2,963m), reflecting higher performance related costs, increased levels of activity and continued investment across the business. The cost:net income ratio improved to 64% (2005: 67%) and the compensation to net income ratio improved to 49% (2005: 51%). Performance related pay, discretionary investment spend and short-term contractor resource costs represented 50% of operating expenses (2005: 46%). Amortisation of intangible assets principally relates to mortgage service rights obtained as part of the purchase of HomEq, a US mortgage servicing business acquired on 1st November 2006.
Total headcount increased 3,300 during 2006 to 13,200 (2005: 9,900) and included 1,300 from the acquisition of HomEq. Organic growth was broadly based across all regions and reflected further investments in the front office, systems development and control functions to support continued business expansion.
Note
| (a) | For 2005, this reflects the period from 27th July until 31st December 2005. |
2005/04
Profit before tax increased 25% (£289m) to £1,431m (2004: £1,142m). Net income increased 29% (£982m) to £4,394m (2004: £3,412m).
Income increased 28% (£987m) to £4,505m (2004: £3,518m). Income by asset category and geography was broadly based. Areas of investment in 2004, such as commodities, commercial mortgage backed securities and equity derivatives, performed well, delivering significant income growth. Market risk was well controlled with average DVaR falling 7% to £32.0m (2004: £34.3m) as a result of increased diversification across asset classes.
Secondary income increased 31% (£876m) to £3,709m (2004: £2,833m).
Net trading income increased 52% (£768m) to £2,231m (2004: £1,463m). Net investment income increased 37% (£111m) to £413m (2004: £302m), driven by realisations from credit products. Net interest income was flat at £1,065m (2004: £1,068m), reflecting flattening yield curves and the impact of IAS 32 and IAS 39.
Primary income grew 16% (£106m) to £776m (2004: £670m).
Impairment charges of £111m (2004: £106m) were in line with the prior year reflecting the stable wholesale credit environment.
Operating expenses increased 31% (£693m) to £2,963m (2004: £2,270m), reflecting higher business volumes and the ongoing costs associated with staff hired during 2004 and 2005 as part of the business expansion plan. Performance related costs increased due to the strong profit performance. Investment expenditure, primarily in the front office, continued to be significant although less than 2004 as headcount growth slowed. The cost:net income ratio remained stable at 67%.
| | |
Barclays PLC Annual Report 2006 | | 31 |
| |
Financial review
Analysis of results by business
Barclays Global Investors

Barclays Global Investors (BGI) is one of the world’s largest asset managers and a leading global provider of investment management products and services.
BGI offers structured investment strategies such as indexing, global asset allocation and risk controlled active products including hedge funds and provides related investment services such as securities lending, cash management and portfolio transition services. In addition, BGI is the global leader in assets and products in the exchange traded funds business, with over 190 funds for institutions and individuals trading in 15 markets globally. BGI’s investment philosophy is founded on managing all dimensions of performance: a consistent focus on controlling risk, return and cost. BGI collaborates with the other Barclays businesses, particularly Barclays Capital and Barclays Wealth, to develop and market products and leverage capabilities to better serve the client base.
| | | | | | | | | | | | | | | | |
| | | 2006
£m | | | | | 2005
£m | | | | | 2004(a)
£m | |
| | | | | |
Net interest income | | | 10 | | | | | | 15 | | | | | | 5 | |
Net fee and commission income | | | 1,651 | | | | | | 1,297 | | | | | | 882 | |
Net trading income | | | 2 | | | | | | 2 | | | | | | 3 | |
Net investment income | | | 2 | | | | | | 4 | | | | | | 3 | |
Principal transactions | | | 4 | | | | | | 6 | | | | | | 6 | |
| | | | | |
Total income | | | 1,665 | | | | | | 1,318 | | | | | | 893 | |
Operating expenses excluding amortisation of intangible assets | | | (946 | ) | | | | | (775 | ) | | | | | (555 | ) |
Amortisation of intangible assets | | | (5 | ) | | | | | (4 | ) | | | | | (1 | ) |
Operating expenses | | | (951 | ) | | | | | (779 | ) | | | | | (556 | ) |
Share of post-tax results of associates and joint ventures | | | – | | | | | | 1 | | | | | | (2 | ) |
Profit on disposal of subsidiaries, associates and joint ventures | | | – | | | | | | – | | | | | | 1 | |
| | | | | |
Profit before tax | | | 714 | | | | | | 540 | | | | | | 336 | |
| | | | | |
Cost:income ratio | | | 57% | | | | | | 59% | | | | | | 62% | |
Average income generated per member of staff (‘000) | | £ | 666 | | | | | £ | 628 | | | | | £ | 464 | |
| | | | | |
| | | | 2006 | | | | | | 2005 | | | | | | 2004 | |
| | | | | |
Total assets | | £ | 80.5bn | | | | | £ | 80.9bn | | | | | £ | 1.0bn | |
Risk weighted assets | | £ | 1.4bn | | | | | £ | 1.5bn | | | | | £ | 1.2bn | |
Note
| (a) | Does not reflect the application of IAS 32, IAS 39 and IFRS 4 which became effective from 1st January 2005. |
| | |
| 32 | | Barclays PLC Annual Report 2006 |
| |
2006/05
Barclays Global Investors delivered another year of outstanding results. Profit before tax increased 32% (£174m) to £714m (2005: £540m), reflecting very strong income growth and higher operating margins. The performance was broadly based across products, distribution channels and geographies.
Net fee and commission income increased 27% (£354m) to £1,651m (2005: £1,297m). This growth was attributable to increased management fees, particularly in the iShares and active businesses, and securities lending, offset by lower incentive fees. Incentive fees decreased 9% (£18m) to £186m (2005: £204m). Higher asset values, driven by higher market levels and good net new inflows, contributed to the growth in income.
Operating expenses increased 22% (£172m) to £951m (2005: £779m) as a result of significant investment in key growth initiatives, ongoing investment in product development and infrastructure and higher performance-based expenses. The cost:income ratio improved two percentage points to 57% (2005: 59%).
Total headcount rose 400 to 2,700 (2005: 2,300). Headcount increased in all regions, across product groups and the support functions, reflecting continued investment to support strategic initiatives.
Total assets under management increased 5% (£46bn) to £927bn (2005: £881bn) primarily due to net new inflows of £37bn. The positive market move impact of £98bn was largely offset by £89bn of adverse exchange rate movements. In US$ terms assets under management increased by US$301bn to US$1,814bn (2005: US$1,513bn), comprising US$68bn of net new assets, US$177bn of favourable market movements and US$56bn of positive exchange rate movements.
2005/04
Barclays Global Investors delivered a year of outstanding financial results in 2005. The performance was spread across a diverse range of products, distribution channels and geographies. Profit before tax increased 61% (£204m) to £540m (2004: £336m) reflecting substantial income growth and focused investment spend.
Net fee and commission income increased 47% (£415m) to £1,297m (2004: £882m), driven by significant increases in management, incentive and securities lending revenues.
Investment performance remained very good for the majority of active funds as they outperformed their respective benchmarks.
Operating expenses increased 40% (£223m) to £779m (2004: £556m) as a result of higher performance-based expenses, significant investment in key growth initiatives and ongoing investment in infrastructure required to support business growth. The cost:income ratio improved to 59% (2004: 62%).
Total assets under management increased 24% (£172bn) to £881bn (2004: £709bn). The growth included £48bn of net new assets, £53bn attributable to favourable exchange rate movements and £71bn as a result of market movements. In US$ terms, the increase in assets under management to US$1,513bn from US$1,362bn (2004) included US$88bn of net new assets and US$121bn of market movements, partially offset by adverse exchange rate movements of US$58bn.
| | |
Barclays PLC Annual Report 2006 | | 33 |
| |
Financial review
Analysis of results by business
Barclays Wealth

Barclays Wealth serves affluent, high net worth and intermediary clients worldwide, providing private banking, asset management, stockbroking, offshore banking, wealth structuring and financial planning services.
Barclays Wealth works closely with all other parts of the Group to leverage synergies from client relationships and product capabilities.
| | | | | | | | | | | | | | | | |
| | | 2006 £m | | | | | 2005 £m | | | | | 2004(a)
£m | |
| | | | | |
Net interest income | | | 366 | | | | | | 329 | | | | | | 301 | |
Net fee and commission income | | | 665 | | | | | | 589 | | | | | | 529 | |
Net trading income | | | – | | | | | | – | | | | | | – | |
Net investment income | | | – | | | | | | 5 | | | | | | – | |
Principal transactions | | | – | | | | | | 5 | | | | | | – | |
Other income | | | 5 | | | | | | (1 | ) | | | | | 7 | |
Total income | | | 1,036 | | | | | | 922 | | | | | | 837 | |
Impairment (charges)/releases | | | (2 | ) | | | | | (2 | ) | | | | | 1 | |
Net income | | | 1,034 | | | | | | 920 | | | | | | 838 | |
Operating expenses excluding amortisation of intangible assets | | | (817 | ) | | | | | (752 | ) | | | | | (729 | ) |
Amortisation of intangible assets | | | (4 | ) | | | | | (2 | ) | | | | | (1 | ) |
Operating expenses | | | (821 | ) | | | | | (754 | ) | | | | | (730 | ) |
Profit before tax | | | 213 | | | | | | 166 | | | | | | 108 | |
Cost:income ratio | | | 79% | | | | | | 82% | | | | | | 87% | |
Cost:net income ratio | | | 79% | | | | | | 82% | | | | | | 87% | |
Risk Tendency | | £ | 10m | | | | | £ | 5m | | | | | £ | 5m | |
Average net income per member of staff (‘000) | | £ | 138 | | | | | £ | 128 | | | | | £ | 119 | |
| | | | | |
| | | | 2006 | | | | | | 2005 | | | | | | 2004 | |
Loans and advances to customers | | £ | 5.7bn | | | | | £ | 4.7bn | | | | | £ | 4.1bn | |
Customer accounts | | £ | 25.2bn | | | | | £ | 23.1bn | | | | | £ | 21.3bn | |
Total assets | | £ | 7.3bn | | | | | £ | 6.1bn | | | | | £ | 5.6bn | |
Risk weighted assets | | £ | 5.7bn | | | | | £ | 4.1bn | | | | | £ | 4.0bn | |
Key Facts | | | | | | | | | | | | | | | | |
Total client assets | | £ | 93.0bn | | | | | £ | 78.3bn | | | | | £ | 70.8bn | |
Note
| (a) | Does not reflect the application of IAS 32, IAS 39 and IFRS 4 which became effective from 1st January 2005. |
| | |
| 34 | | Barclays PLC Annual Report 2006 |
| |
2006/05
Barclays Wealth profit before tax showed very strong growth of 28% (£47m) to £213m (2005: £166m). Performance was driven by broadly based income growth and favourable market conditions. This was partially offset by additional volume related costs and a significant increase in investment in people and infrastructure to support future growth.
Income increased 12% (£114m) to £1,036m (2005: £922m).
Net interest income increased 11% (£37m) to £366m (2005: £329m) reflecting growth in both customer deposits and customer lending. Average customer deposits grew 6% (£1.3bn) to £24.7bn (2005: £23.4bn). Average loans to customers grew 16% to £5.1bn (2005: £4.4bn), driven by increased lending to offshore and private banking clients. Asset and liability margins were higher relative to 2005.
Net fee and commission income increased 13% (£76m) to £665m (2005: £589m). This reflected growth in client assets and higher transactional income, including increased sales of investment products to private banking and financial planning clients, and higher stockbroking volumes.
Operating expenses increased 9% (£67m) to £821m (2005: £754m) with greater volume related and investment costs more than offsetting efficiency gains. Investment costs included increased hiring of client-facing staff and improvements to infrastructure with the upgrade of technology and operations platforms. The cost:income ratio improved three percentage points to 79% (2005: 82%).
Total client assets, comprising customer deposits and client investments, increased 19% (£14.7bn) to £93.0bn (2005: £78.3bn) reflecting good net new asset inflows and favourable market conditions. Multi-Manager assets increased 68% (£4.1bn) to £10.1bn (2005: £6.0bn); this growth included transfers of existing client assets.
2005/04
Barclays Wealth profit before tax increased 54% (£58m) to £166m (2004: £108m), driven by broad-based income growth and improved cost efficiency. Income increased 10% (£85m) to £922m (2004: £837m).
Net interest income increased 9% (£28m) to £329m (2004: £301m) reflecting strong growth in loans and deposits. Average customer deposits increased 14% to £23.4bn (2004: £20.6bn), driven by strong growth from offshore and private banking clients. Average loans increased 22% to £4.4bn (2004: £3.6bn), reflecting growth from corporate clients in the offshore business.
Net fee and commission income increased 11% (£60m) to £589m (2004: £529m). The increase was driven principally by sales of investment products to private banking and financial planning clients, stronger equity markets and higher client transaction volumes.
Operating expenses increased 3% (£24m) to £754m (2004: £730m). The cost:income ratio improved five percentage points to 82% (2004: 87%).
Total client assets, increased to £78.3bn. Multi-Manager assets increased to £6.0bn; this growth included existing customer assets.
| | |
Barclays PLC Annual Report 2006 | | 35 |
| |
Financial review
Analysis of results by business
Barclays Wealth – closed life assurance activities
Barclays Wealth – closed life assurance activities comprise the closed life assurance businesses of Barclays and Woolwich in the UK.
| | | | | | | | | | | | | | | | |
| | | 2006
£m | | | | | 2005
£m | | | | | 2004(a)
£m | |
Net interest income | | | (8 | ) | | | | | (14 | ) | | | | | (54 | ) |
Net fee and commission income | | | 50 | | | | | | 44 | | | | | | – | |
Net trading income | | | 2 | | | | | | – | | | | | | – | |
Net investment income | | | 154 | | | | | | 259 | | | | | | 596 | |
Principal transactions | | | 156 | | | | | | 259 | | | | | | 596 | |
Net premiums from insurance contracts | | | 210 | | | | | | 195 | | | | | | 362 | |
Other income | | | 11 | | | | | | 11 | | | | | | 4 | |
Total income | | | 419 | | | | | | 495 | | | | | | 908 | |
Net claims and benefits on insurance contracts | | | (288 | ) | | | | | (375 | ) | | | | | (818 | ) |
Total income net of insurance claims | | | 131 | | | | | | 120 | | | | | | 90 | |
Operating expenses | | | (109 | ) | | | | | (127 | ) | | | | | (143 | ) |
Profit/(loss) before tax | | | 22 | | | | | | (7 | ) | | | | | (53 | ) |
Cost:income ratio | | | 83% | | | | | | 106% | | | | | | 159% | |
| | | | | | |
| | | 2006 | | | | | 2005 | | | | | 2004 | |
Total assets | | £ | 7.6bn | | | | | £ | 7.3bn | | | | | £ | 6.4bn | |
Note
| (a) | Does not reflect the application of IAS 32, IAS 39 and IFRS 4 which became effective from 1st January 2005. |
| | |
| 36 | | Barclays PLC Annual Report 2006 |
| |
2006/05
Barclays Wealth – closed life assurance activities profit before tax was £22m (2005: loss £7m). The improvement was mostly due to lower funding costs and reduced customer redress costs in 2006.
Excluding customer redress costs of £67m (2005; £85m), profit before tax was £89m (2005: £78m).
Income grew 9% (£11m) to £131m (2005: £120m) principally due to reduced funding costs.
Operating expenses decreased to £109m (2005: £127m). Costs relating to redress for customers decreased to £67m (2005: £85m) whilst other operating expenses remained steady at £42m (2005: £42m).
2005/04
Barclays Wealth – closed life assurance activities loss before tax reduced to £7m (2004: loss of £53m), predominantly due to lower funding and redress costs in 2005.
Excluding customer redress costs of £85m (2004: £97m), profit before tax was £78m (2004: £44m).
Total income decreased to £495m (2004: £908m), largely due to the application of IFRS. The decrease was offset by a broadly similar reduction in net claims and benefits.
Operating expenses decreased 11% (£16m) to £127m (2004: £143m). Costs relating to redress for customers decreased to £85m (2004: £97m) and other operating expenses decreased 9% (£4m) to £42m (2004: £46m).
| | |
Barclays PLC Annual Report 2006 | | 37 |
| |
Financial review
Analysis of results by business
Head office functions and other operations
Head office functions and other operations comprise:
| · | | Head office and central support functions |
| · | | Businesses in transition |
| · | | Consolidation adjustments. |
Head office and central support functions comprise the following areas: Executive management, Finance, Treasury, Corporate Affairs, Human Resources, Strategy and Planning, Internal Audit, Legal, Corporate Secretariat, Property, Tax, Compliance and Risk. Costs incurred wholly on behalf of the businesses are recharged to them.
Businesses in transition principally relate to certain lending portfolios that are centrally managed with the objective of maximising recovery from the assets.
Consolidation adjustments largely reflect the elimination of inter-segment transactions.
| | | | | | | | | | | | | | | | |
| | | 2006
£m | | | | | 2005
£m | | | | | 2004(a)
£m | |
Net interest income | | | 80 | | | | | | 160 | | | | | | 49 | |
Net fee and commission income | | | (359 | ) | | | | | (398 | ) | | | | | (167 | ) |
Net trading income | | | 40 | | | | | | 85 | | | | | | 21 | |
Net investment income | | | 2 | | | | | | 8 | | | | | | (9 | ) |
Principal transactions | | | 42 | | | | | | 93 | | | | | | 12 | |
Net premiums from insurance contracts | | | 197 | | | | | | 146 | | | | | | 109 | |
Other income | | | 39 | | | | | | 24 | | | | | | 37 | |
Total income | | | (1 | ) | | | | | 25 | | | | | | 40 | |
Impairment releases/(charges) | | | 11 | | | | | | (1 | ) | | | | | (8 | ) |
Net income | | | 10 | | | | | | 24 | | | | | | 32 | |
Operating expenses excluding amortisation of intangible assets | | | (259 | ) | | | | | (343 | ) | | | | | (177 | ) |
Amortisation of intangible assets | | | (10 | ) | | | | | (4 | ) | | | | | (14 | ) |
Operating expenses | | | (269 | ) | | | | | (347 | ) | | | | | (191 | ) |
Profit on disposal of associates and joint ventures | | | – | | | | | | – | | | | | | 2 | |
Loss before tax | | | (259 | ) | | | | | (323 | ) | | | | | (157 | ) |
Risk Tendency | | £ | 10m | | | | | £ | 25m | | | | | £ | 30m | |
| | | | | |
| | | | 2006 | | | | | | 2005 | | | | | | 2004 | |
Total assets | | £ | 7.1bn | | | | | £ | 9.3bn | | | | | £ | 5.1bn | |
Risk weighted assets | | £ | 1.9bn | | | | | £ | 4.0bn | | | | | £ | 3.3bn | |
Note
| (a) | Does not reflect the application of IAS 32, IAS 39 and IFRS 4 which became effective from 1st January 2005. |
| | |
| 38 | | Barclays PLC Annual Report 2006 |
| |
2006/05
Head office functions and other operations loss before tax decreased £64m to £259m (2005: loss £323m).
Net interest income decreased £80m to £80m (2005: £160m) reflecting a reduction in net interest income in Treasury following the acquisition of Absa Group Limited. Treasury’s net interest income also included the hedge ineffectiveness for the period, which together with other related Treasury adjustments amounted to a gain of £11m (2005: £18m) and the cost of hedging the foreign exchange risk on the Group’s equity investment in Absa, which amounted to £71m (2005: £37m).
Group segmental reporting is performed in accordance with Group accounting policies. This means that inter-segment transactions are recorded in each segment as if undertaken on an arms-length basis. Adjustments necessary to eliminate the inter-segment transactions are included in Head office functions and other operations.
The impact of such inter-segment adjustments reduced £72m to £147m (2005: £219m). These adjustments related to internal fees for structured capital market activities of £87m (2005: £67m) and fees paid to Barclays Capital for capital raising and risk management advice of £16m (2005: £39m), both of which reduce net fees and commission income. In addition the impact of the timing of the recognition of insurance commissions included in Barclaycard and UK Retail Banking reduced to £44m (2005: £113m). This reduction was reflected in a decrease in net fee and commission income of £242m (2005: £258m) and an increase in net premium income of £198m (2005: £145m).
Principal transactions decreased £51m to £42m (2005: £93m). 2005 included hedging related gains in Treasury of £80m. 2006 included £55m (2005: £nil) in respect of the economic hedge of the translation exposure arising from Absa foreign currency earnings.
The impairment charge improved £12m to a release of £11m (2005: £1m charge) as a number of workout situations were resolved.
Operating expenses decreased £78m to £269m (2005: £347m) primarily due to the expenses of the 2005 Head office relocation to Canary Wharf not recurring in 2006 (2005: £105m) and the gains of £26m (2005: £nil) from the sale and leaseback of property offset by increased costs, principally driven by major project expenditure including work related to implementing Basel II.
2005/04
Head office functions and other operations loss before tax increased £166m to £323m (2004: loss £157m), reflecting the elimination of inter-segment transactions and increased operating expenses.
The increase in inter-segment consolidation adjustments of £150m to £219m (2004: £69m) mainly arises from the timing of the recognition of insurance premiums included in Barclaycard and UK Banking amounting to £113m (2004: £nil). In 2004 and prior years, Barclaycard dealt with third-party underwriters but from the start of 2005 this activity was undertaken with the captive insurance operation within UK Banking.
In addition, there were two other significant consolidation adjustments in 2005: internal fees for structured capital markets activities arranged by Barclays Capital of £67m (2004: £63m); and the fees paid to Barclays Capital for capital raising and risk management advice of £39m (2004: £nil). Previously, capital raising fees were amortised over the life of the capital raising and taken as a charge to net interest income. Under IFRS they are recognised as a cost in the year of issue.
Net trading income of £85m (2004: £21m) primarily arose as a result of hedging related transactions in Treasury. The hedge ineffectiveness from 1st January 2005, together with other related Treasury adjustments, amounted to a gain of £18m (2004: £nil) and was reported in net interest income. The cost of hedging the foreign exchange risk on the Group’s investment in Absa amounted to £37m (2004: £nil) and was deducted from net interest income.
Other income primarily comprised property rental income.
Impairment reflected recoveries made on loans previously written off in the transition businesses.
Operating expenses rose £156m to £347m (2004: £191m) and included non-recurring costs relating to the Head office relocation to Canary Wharf of £105m (2004: ��32m) and a charge to write-down capitalised IT related assets held centrally of £60m (2004: £nil).
| | |
Barclays PLC Annual Report 2006 | | 39 |
| |
Financial review
Results by nature of income and expense
Results by nature of income and expense
Net interest income
| | | | | | | | | | | | | |
| | | 2006 £m | | | | | 2005
£m | | | | | 2004(a)
£m | |
Interest income | | 21,805 | | | | | 17,232 | | | | | 13,880 | |
Interest expense | | (12,662 | ) | | | | (9,157 | ) | | | | (7,047 | ) |
Net interest income | | 9,143 | | | | | 8,075 | | | | | 6,833 | |
Net interest income£bn | | | | | | | | | | | | | |
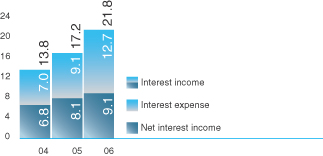
2006/05
Group net interest income increased 13% (£1,068m) to £9,143m (2005: £8,075m). The inclusion of Absa contributed net interest income of £1,138m (2005(b): £516m). Group net interest income excluding Absa grew 6%.
A component of the benefit of free funds included in Group net interest income is the structural hedge which functions to reduce the impact of the volatility of short-term interest rate movements. The contribution of the structural hedge decreased to £26m (2005: £145m), largely due to the impact of relatively higher short-term interest rates and lower medium-term rates.
Interest income includes £98m (2005: £76m) accrued on impaired loans.
2005/04
In 2005, Group net interest income increased 18% (£1,242m) to £8,075m (2004: £6,833m). The inclusion of Absa added net interest income of £516m in the second half of 2005. Group net interest income excluding Absa grew 11% reflecting growth in average balances across all businesses.
The contribution of the structural hedge decreased to £145m (2004: £304m), largely due to the impact of higher short-term interest rates and lower medium-term rates.
Interest income includes £76m accrued on impaired loans, reflecting the application of IAS 32.
Notes
| (a) | Does not include IAS 32, IAS 39 or IFRS 4 which became effective from 1st January 2005. |
| (b) | For 2005, this reflects the period from 27th July until 31st December 2005. |
| | |
| 40 | | Barclays PLC Annual Report 2006 |
| |
Intentionally Left Blank
| | |
Barclays PLC Annual Report 2006 | | 41 |
| |
Financial review
Results by nature of income and expense
Net fee and commission income
| | | | | | | | | |
| | | 2006
£m | | | 2005
£m | | | 2004(a) £m | |
| | | |
Fee and commission income | | 8,005 | | | 6,430 | | | 5,509 | |
Less: fee and commission expense | | (828 | ) | | (725 | ) | | (662 | ) |
| | | |
Net fee and commission income | | 7,177 | | | 5,705 | | | 4,847 | |
2006/05
Net fee and commission income increased 26% (£1,472m) to £7,177m (2005: £5,705m). The inclusion of Absa contributed net fee and commission income of £850m (2005(b): £334m). Group net fee and commission income excluding Absa grew 18%, reflecting growth across all businesses.
Fee and commission income rose 24% (£1,575m) to £8,005m (2005: £6,430m). The inclusion of Absa contributed fee and commission income of £896m (2005(b): £386m). Excluding Absa, fee and commission income grew 18%, driven by a broadly based performance across the Group, particularly within Barclays Global Investors.
Fee and commission expense increased 14% (£103m) to £828m (2005: £725m), reflecting the growth in Barclaycard US. Absa contributed fee and commission expense of £46m (2005(b): £52m).
Total foreign exchange income was £850m (2005: £648m) and consisted of revenues earned from both retail and wholesale activities. Foreign exchange income earned on customer transactions by individual businesses is reported in those respective business units within fee and commission income. The foreign exchange income earned in Barclays Capital and in Treasury is reported within net trading income.
2005/04
In 2005, net fee and commission income increased 18% (£858m) to £5,705m (2004: £4,847m) reflecting good growth across all businesses. The inclusion of Absa increased net fee and commission income by £334m in the second half of 2005. Group net fee and commission income excluding Absa grew 11%. Excluding the application of IAS 32 and IAS 39, net fee and commission income increased 20%.
Fee and commission income rose 17% (£921m) to £6,430m (2004: £5,509m). The inclusion of Absa increased fee and commission income by £386m. Excluding Absa, fee and commission income grew by 10%. The growth was driven by Barclays Global Investors, reflecting strong growth in net new assets, a strong investment performance and higher market levels, and by Barclays Capital, as a result of increased business volumes and higher market share. In addition, Barclaycard fee and commission income increased as a result of higher contributions from Barclaycard Business and FirstPlus and the inclusion of Barclaycard US for the full year. Fee and commission expense increased 10% (£63m) to £725m (2004: £662m), largely reflecting the inclusion of Absa which added £52m.
Total foreign exchange income was £648m (2004: £520m) and consisted of revenues earned from both retail and wholesale activities.
Principal transactions
| | | | | | |
| | | 2006
£m | | 2005
£m | | 2004(a)
£m |
Rates related business | | 2,848 | | 1,732 | | 1,141 |
Credit related business | | 766 | | 589 | | 346 |
| | | |
Net trading income | | 3,614 | | 2,321 | | 1,487 |
| | | | | | |
| | | | |
| Cumulative gain from disposal of available for sale assets/ investment securities | | 307 | | 120 | | 45 |
Dividend income | | 15 | | 22 | | 17 |
| Net income from financial instruments designated at fair value | | 447 | | 389 | | n/a |
| Income from assets backing insurance policies | | n/a | | n/a | | 717 |
Other investment income | | 193 | | 327 | | 248 |
Net investment income | | 962 | | 858 | | 1,027 |
Principal transactions | | 4,576 | | 3,179 | | 2,514 |
2006/05
Most of the Group’s trading income is generated in Barclays Capital.
Net trading income increased 56% (£1,293m) to £3,614m (2005: £2,321m) due to excellent performances in Barclays Capital Rates and Credit businesses, in particular in commodities, fixed income, equities, credit derivatives and emerging markets. This was driven by higher volumes of client – led activity and favourable market conditions. The inclusion of Absa contributed net trading income of £60m (2005(b): £9m). Group net trading income excluding Absa grew 54%.
Net investment income increased 12% (£104m) to £962m (2005: £858m). The inclusion of Absa contributed net investment income of £144m (2005(b): £62m). Group net investment income excluding Absa increased 3%.
The cumulative gain from disposal of available for sale assets increased 156% (£187m) to £307m (2005: £120m) driven by investment realisations, primarily in Private Equity.
Fair value movements on certain assets and liabilities have been reported within net trading income or within net investment income depending on the nature of the transaction. Fair value movements on insurance assets included within net investment income contributed £205m (2005: £317m).
2005/04
In 2005, net trading income increased 56% (£834m) to £2,321m (2004: £1,487m) due to strong performances across Barclays Capital Rates and Credit businesses, in particular from commodities, foreign exchange, fixed income and credit derivatives. This was driven by the continued return on prior-year investments and higher volumes of client-led activity across a broad range of products and geographical regions. Group net trading income excluding £9m of Absa income, grew 55%.
Net investment income decreased 16% (£169m) to £858m (2004: £1,027m). The inclusion of Absa increased net investment income by £62m in the second half of 2005. Group net investment income excluding Absa decreased 22%.
Notes
| (a) | Does not reflect the application of IAS 32, IAS 39 and IFRS 4 which became effective from 1st January 2005. |
| (b) | For 2005, this reflects the period from 27th July until 31st December 2005. |
| | |
| 42 | | Barclays PLC Annual Report 2006 |
| |
Following the application of IAS 39 at 1st January 2005, certain assets and liabilities were designated at fair value. Fair value movements on these items were reported within net trading income or within net investment income depending on the nature of the transaction. Fair value movements on insurance assets included within net investment income contributed £317m.
From 1st January 2005, investment and insurance contracts are separately accounted for in accordance with IAS 39 and IFRS 4. This has resulted in investment income and the corresponding movement in investment contract liabilities being presented on a net basis within other income. In 2004, all contracts were accounted for as insurance contracts and the gross income relating to these contracts was reported as income from assets backing insurance policies.
Other income
| | | | | | | | |
| | | 2006
£m | | | 2005
£m | | | 2004(a)
£m |
| Increase in fair value of assets held in respect of linked liabilities to customers under investment contracts | | 7,417 | | | 9,234 | | | n/a |
| Increase in liabilities to customers under investment contracts | | (7,417 | ) | | (9,234 | ) | | n/a |
Property rentals | | 55 | | | 54 | | | 46 |
Other income | | 159 | | | 93 | | | 85 |
| | | |
Other income | | 214 | | | 147 | | | 131 |
Certain asset management products offered to institutional clients by Barclays Global Investors are recognised as investment contracts. Accordingly the invested assets and the related liabilities to investors are held at fair value and changes in those fair values are reported within other income.
Impairment charges
| | | | | | | | | |
| | | 2006
£m | | | 2005
£m | | | 2004(a)
£m | |
| Impairment charge on loans and advances | | 2,074 | | | 1,574 | | | n/a | |
| Specific provision charge | | n/a | | | n/a | | | 1,310 | |
General provision release | | n/a | | | n/a | | | (206 | ) |
| | | 2,074 | | | 1,574 | | | 1,104 | |
Other credit provisions | | (6 | ) | | (7 | ) | | (11 | ) |
| Impairment charges on loans and advances and other credit provisions | | 2,068 | | | 1,567 | | | 1,093 | |
Impairment on available for sale assets | | 86 | | | 4 | | | n/a | |
| | | |
Impairment charges | | 2,154 | | | 1,571 | | | 1,093 | |
2006/05
Total impairment charges increased 37% (£583m) to £2,154m (2005: £1,571m).
Impairment charges on loans and advances and other credit provisions
Impairment charges on loans and advances and other credit provisions increased 32% (£501m) to £2,068m (2005: £1,567m). Excluding Absa impairment of £126m (2005: £20m), the increase was 26% (£395m) and largely reflected the continued challenging credit environment in UK unsecured retail lending through 2006. The wholesale and corporate sectors remained stable with a low level of defaults.
The Group impairment charges on loans and advances and other credit provisions as a percentage of year-end total loans and advances of £316,561m (2005: £303,451m) increased to 0.65% (2005: 0.52%).
Retail impairment charges on loans and advances and other credit provisions increased to £1,809m (2005: £1,254m), including £99m (2005(b): £10m) in respect of Absa. Retail impairment charges on loans and advances amounted to 1.30% (2005(c): 0.93%) as a percentage of year-end total loans and advances of £139,350m (2005(c): £134,420m), including balances in Absa of £20,090m (2005: £20,836m).
In the UK retail businesses, household cash flows remained under pressure leading to a deterioration in consumer credit quality. High debt levels and changing social attitudes to bankruptcy and debt default contributed to higher levels of insolvency and increased impairment charges. In UK cards and unsecured consumer lending, the flows of new delinquencies and the levels of arrears balances declined in the second half of 2006, reflecting more selective customer recruitment, limit management and improved collections.
In UK Home Finance, delinquencies were flat and amounts charged-off remained low. The weaker external environment led to increased credit delinquency in Local Business, where there were both higher balances on caution status and higher flows into delinquency, which both stabilised towards the year end.
In the wholesale and corporate businesses, impairment charges on loans and advances and other credit provisions decreased to £259m (2005: £313m), including £27m (2005(b): £10m) in respect of Absa. The fall was due mainly to recoveries in Barclays Capital as a result of the benign wholesale credit environment. This was partially offset by an increase in UK Business Banking, reflecting higher charges in Medium Business and growth in lending balances.
The wholesale and corporate impairment charge was 0.15% (2005(c): 0.19%) as a percentage of year-end total loans and advances to banks and to customers of £177,211m (2005(c): £169,031m), including balances in Absa of £9,299m (2005: £9,731m).
In Absa, impairment charges increased to £126m (2005(b): £20m) reflecting a full year of business and normalisation of credit conditions in South Africa following a period of low interest rates.
Impairment on available for sale assets
The total impairment charges in Barclays Capital included losses of £83m (2005: £nil) on an available for sale portfolio where an intention to sell caused the losses to be viewed as other than temporary in nature. These losses in 2006 were primarily due to interest rate movements, rather than credit deterioration, with a corresponding gain arising on offsetting derivatives recognised in net trading income.
Notes
| (a) | Does not reflect the application of IAS 32, IAS 39 and IFRS 4 which became effective from 1st January 2005. |
| (b) | For 2005, this reflects the period from 27th July until 31st December 2005. |
| (c) | Prior year analysis of loans and advances to customers between retail business and wholesale and corporate business has been reclassified to reflect enhanced methodology implemented in the current year (see page 91). |
| | |
Barclays PLC Annual Report 2006 | | 43 |
| |
Financial review
Results by nature of income and expense
Impairment charges (continued)
2005/04
Total impairment charges and other credit provisions increased 44% (£478m) to £1,571m (2004: £1,093). This reflected some large one-off releases and recoveries in 2004, the impact of acquisitions in 2005 and changes in methodology.
In the UK, pressure on household cash flows due to a range of factors and the high level of household indebtedness led to a greater strain on personal budgets. This resulted in a deterioration in consumer credit quality which was evident from higher average delinquency balances and shorter periods between delinquency and charge-off. Smaller business customers also showed some limited deterioration in credit quality. Wholesale and corporate credit conditions remained steady.
As a result of an increase in impairment charges to the retail portfolios, and to a lesser extent in the wholesale and corporate portfolios, the impairment charges for the Group (excluding Absa charges of £20m) for the full year were £1,547m (2004: £1,093m). Impairment charges excluding Absa amounted to 0.57% (2004: 0.48%), as a percentage of period-end total non-trading loans and advances.
Retail impairment charges, excluding Absa charges of £10m, increased to £1,244m (2004: £811m), accounting for just under 80% of the Group’s impairment charges. Excluding Absa, retail impairment charges amounted to 1.10% (2004: 0.72%) of the period-end total non-trading loans and advances. The increase was predominantly in the UK cards and consumer loans portfolios.
In the wholesale and corporate businesses, excluding Absa impairment charges of £10m, impairment charges increased to £303m (2004: £282m). The increase occurred largely in UK Business Banking and reflected the fact that the 2004 results included a large one-off recovery of £57m. Underlying impairment charges excluding this item were broadly flat. Wholesale and corporate impairment charges, excluding Absa, were 0.19% (2004: 0.25%) of period-end total non-trading loans and advances.
Absa’s impairment charge of £20m for the five-month period was low in a benign credit environment and also reflected a reduction in the number and value of non-performing loans and a higher level of releases and recoveries.
Operating expenses
| | | | | | | |
| | | 2006
£m | | | 2005
£m | | 2004(a)
£m |
Staff costs (Note 8) | | 8,169 | | | 6,318 | | 5,227 |
Administrative expenses | | 3,980 | | | 3,443 | | 2,766 |
Depreciation (Note 25) | | 455 | | | 362 | | 297 |
| Impairment loss – intangible assets (Note 24) | | 7 | | | 9 | | 9 |
– property and equipment (Note 25) | | 14 | | | – | | – |
Operating lease rentals | | 345 | | | 316 | | 215 |
Gain on property disposals | | (432 | ) | | – | | – |
Amortisation of intangible assets | | 136 | | | 79 | | 22 |
| | | |
Operating expenses | | 12,674 | | | 10,527 | | 8,536 |
2006/05
Operating expenses increased 20% (£2,147m) to £12,674m (2005: £10,527m). The inclusion of Absa contributed operating expenses of £1,496m (2005(b) 664m). Group operating expenses excluding Absa grew 13%, reflecting a higher level of business activity and an increase in performance related pay.
Administrative expenses increased 16% (£537m) to £3,980m (2005: £3,443m). The inclusion of Absa contributed administrative expenses of £579m (2005(b): £257m). Group administrative expenses excluding Absa grew 7% principally as a result of higher business activity in UK Banking and Barclays Capital.
Operating lease rentals increased 9% (£29m) to £345m (2005: £316m). The inclusion of Absa contributed operating lease rentals of £73m (2005(b): £27m), which more than offset the absence of double occupancy costs incurred in 2005, associated with the Head office relocation to Canary Wharf.
Operating expenses were reduced by gains from the sale of property of £432m (2005: £nil) as the Group took advantage of historically low yields on property to realise gains on some of its freehold portfolio.
Amortisation of intangible assets increased 72% (£57m) to £136m (2005: £79m) primarily reflecting the inclusion of Absa for the full year.
The Group cost:income ratio improved to 59% (2005: 61%). This reflected improved productivity. The Group cost:net income ratio was 65% (2005: 67%).
2005/04
Operating expenses increased 23% (£1,991m) to £10,527m (2004: £8,536m). The inclusion of Absa added operating expenses of £664m to the second half of 2005. Group operating expenses excluding Absa grew 15% reflecting higher business activity.
Administrative expenses increased 24% (£677m) to £3,443m (2004: £2,766m). The inclusion of Absa added administrative expenses of £257m in the second half of 2005. Group administrative expenses excluding Absa grew 15% principally as a result of higher business activity in Barclays Capital and Barclays Global Investors and the inclusion of Barclaycard US for the full year.
Administrative expenses included non-recurring costs relating to the write-down of capitalised IT related assets held centrally of £60m (2004: £nil). Impairment losses of £9m (2004: £9m) reflected a further charge for the impairment of certain capitalised IT related assets following a review of their likely future economic benefit.
Operating lease rentals increased 47% (£101m) to £316m (2004: £215m). The inclusion of Absa added operating lease rentals of £27m in the second half of 2005. Operating lease rentals excluding Absa increased primarily as a consequence of the double occupancy costs associated with the Head office relocation to Canary Wharf.
The Group cost:income ratio remained steady at 61%. This reflected improved productivity in UK Banking, Barclays Global Investors and Barclays Wealth; and a stable performance by International Retail and Commercial Banking, offset by an increase in non-recurring operating expenses in Head office and other functions.
The Group cost:net income ratio was 67% (2004: 66%).
Notes
| (a) | Does not reflect the application of IAS 32, IAS 39 and IFRS 4 which became effective from 1st January 2005. |
| (b) | For 2005, this reflects the period from 27th July until 31st December 2005. |
| | |
| 44 | | Barclays PLC Annual Report 2006 |
| |
Staff costs
| | | | | | |
| | | 2006
£m | | 2005
£m | | 2004
£m |
| | | |
Salaries and accrued incentive payments | | 6,635 | | 5,036 | | 4,098 |
Social security costs | | 502 | | 412 | | 339 |
Pension costs | | 410 | | 347 | | 327 |
Other post-retirement benefits | | 30 | | 27 | | 29 |
Other staff costs | | 592 | | 496 | | 434 |
| | | |
Staff costs | | 8,169 | | 6,318 | | 5,227 |
2006/05
Staff costs increased 29% (£1,851m) to £8,169m (2005: £6,318m). The inclusion of Absa contributed staff costs of £694m (2005(a): £296m). Group staff costs excluding Absa rose 24%.
Salaries and accrued incentive payments rose 32% (£1,599m) to £6,635m (2005: £5,036m), principally due to increased performance related payments and the full year inclusion of Absa. The inclusion of Absa contributed salaries and incentive payments of £615m (2005(a): £276m). Group salaries and accrued incentive payments excluding Absa rose 26%.
2005/04
In 2005, staff costs increased 21% (£1,091m) to £6,318m (2004: £5,227m). The inclusion of Absa added staff costs of £296m during the second half of the year. Excluding the impact of Absa, staff costs increased 15%.
Salaries and accrued incentive payments rose 23% (£938m) to £5,036m (2004: £4,098m), principally due to increased headcount in Barclays Capital and performance related payments primarily in Barclays Capital and Barclays Global Investors and the inclusion of Absa. Excluding Absa salaries and accrued incentive payments of £276m, salaries and accrued incentive payments rose 16% (£662m).
Note
| (a) | For 2005, this reflects the period from 27th July until 31st December 2005. |
Staff numbers
| | | | | | | | | | |
| | | 2006 | | | | 2005 | | | | 2004 |
UK Banking | | 41,100 | | | | 39,800 | | | | 41,700 |
UK Retail Banking | | 33,000 | | | | 32,000 | | | | 34,500 |
UK Business Banking | | 8,100 | | | | 7,800 | | | | 7,200 |
Barclaycard | | 8,600 | | | | 7,800 | | | | 6,700 |
International Retail and | | | | | | | | | | |
Commercial Banking | | 48,000 | | | | 45,400 | | | | 12,100 |
International Retail and Commercial Banking –ex Absa | | 14,100 | | | | 12,700 | | | | 12,100 |
International Retail and Commercial Banking – Absa | | 33,900 | | | | 32,700 | | | | – |
Barclays Capital | | 13,200 | | | | 9,900 | | | | 7,900 |
Barclays Global Investors | | 2,700 | | | | 2,300 | | | | 1,900 |
Barclays Wealth | | 7,800 | | | | 7,200 | | | | 7,200 |
| Head office and other operations | | 1,200 | | | | 900 | | | | 900 |
| Total Group permanent and fixed-term contract staff worldwide | | 122,600 | | | | 113,300 | | | | 78,400 |
Agency staff worldwide | | 9,100 | | | | 7,000 | | | | 4,300 |
| | | | | |
Total including agency staff | | 131,700 | | | | 120,300 | | | | 82,700 |
2006/05
Staff numbers are shown on a full-time equivalent basis. Total Group permanent and contract staff comprised 62,400 (31st December 2005: 59,100) in the UK and 60,200 (31st December 2005: 54,200) internationally.
UK Banking staff numbers increased 1,300 to 41,100 (31st December 2005: 39,800), primarily reflecting the inclusion in UK Retail Banking of mortgage processing staff involved in activities previously outsourced.
Barclaycard staff numbers rose 800 to 8,600 (31st December 2005: 7,800), reflecting growth of 400 in Barclaycard US and increases in operations and customer-facing staff in the UK.
International Retail and Commercial Banking increased staff numbers 2,600 to 48,000 (31st December 2005: 45,400). International Retail and Commercial Banking – excluding Absa increased staff numbers by 1,400 to 14,100 (31st December 2005: 12,700), mainly due to growth in continental Europe and Africa. International Retail and Commercial Banking – Absa increased staff numbers by 1,200 to 33,900 (31st December 2005: 32,700), reflecting continued growth in the business.
Barclays Capital staff numbers increased 3,300 during 2006 to 13,200 (31st December 2005: 9,900) and included 1,300 from the acquisition of HomEq. Organic growth was broadly based across all regions and reflected further investments in the front office, systems development and control functions to support continued business expansion.
Barclays Global Investors increased staff numbers 400 to 2,700 (31st December 2005: 2,300) spread across regions, product groups and support functions, reflecting continued investment to support strategic initiatives.
| | |
Barclays PLC Annual Report 2006 | | 45 |
| |
Financial review
Results by nature of income and expense
Staff numbers (continued)
Barclays Wealth staff numbers rose 600 to 7,800 (31st December 2005: 7,200) to support the continued expansion of the business, including increased hiring of client-facing staff.
Head office functions and other operations staff numbers grew 300 to 1,200 (31st December 2005: 900) primarily reflecting the centralisation of functional activity and the increased regulatory environment and audit demands as a result of the expansion of business areas.
Agency staff numbers rose 2,100 to 9,100 (31st December 2005: 7,000), largely due to an increase in temporary staff at Absa.
2005/04
In 2005, total Group permanent and contract staff comprised 59,100 (31st December 2004: 60,000) in the UK and 54,200 (31st December 2004: 18,400) internationally.
Since 2004 permanent and contract staff numbers increased 34,900, primarily as a result of the acquisition of Absa Group Limited, offset in part by the implementation of restructuring programmes resulting in a decrease of 2,400 staff.
UK Banking staff numbers fell 1,900 to 39,800 (31st December 2004: 41,700), reflecting the cost management programme in UK Retail Banking partially offset by an increase in UK Business Banking frontline staff and the inclusion of 200 Iveco Finance staff.
Barclaycard staff numbers rose 1,100 to 7,800 (31st December 2004: 6,700), reflecting growth of 300 in Barclaycard US, an increase of 200 in other international operations and growth in customer-facing staff in the UK.
International Retail and Commercial Banking increased staff numbers 33,300, primarily due to the inclusion of 32,700 Absa staff. International Retail and Commercial Banking – excluding Absa increased staff numbers by 600 to 12,700 (31st December 2004: 12,100), mainly due to growth in continental Europe, including over 100 from the acquisition of the ING Ferri business in France.
Barclays Capital staff numbers rose 2,000 to 9,900 (31st December 2004: 7,900), reflecting the continued expansion of the business.
Barclays Global Investors increased staff numbers 400 to 2,300 to support strategic initiatives (31st December 2004: 1,900).
Head office functions and other operations staff numbers remained stable at 900 (31st December 2004: 900).
The increase in agency staff worldwide largely reflected the inclusion of 3,300 temporary staff at Absa.
Share of post-tax results of associates and joint ventures
| | | | | | | | |
| | | 2006
£m | | | 2005
£m | | | 2004
£m |
Profit from associates | | 53 | | | 53 | | | 56 |
Loss from joint ventures | | (7 | ) | | (8 | ) | | – |
| Share of post-tax results of associates and joint ventures | | 46 | | | 45 | | | 56 |
2006/05
The share of post-tax results of associates and joint ventures increased 2% (£1m) to £46m (2005: £45m).
Of the £46m share of post-tax results of associates and joint ventures, FirstCaribbean International Bank contributed £41m (2005: £37m).
2005/04
In 2005, the share of post-tax results of associates and joint ventures fell 20% (£11m) to £45m (2004: £56m). A stronger underlying performance by FirstCaribbean in 2005 was more than offset by the impact of a gain in 2004 relating to the sale of shares held in Republic Bank Ltd (Barclays share £28m). Losses from joint ventures primarily related to Intelligent Processing Systems Limited, a cheque processing joint venture in the UK.
Profit on disposal of subsidiaries, associates and joint ventures
| | | | | | |
| | | 2006
£m | | 2005
£m | | 2004
£m |
| Profit on disposal of subsidiaries, associates and joint ventures | | 323 | | – | | 45 |
2006/05
The profit on disposal of subsidiaries, associates and joint ventures includes £247m profit on disposal of FirstCaribbean International Bank and £76m from the sale of interests in vehicle leasing and vendor finance businesses.
2005/04
The profit on disposal in 2004 relates mainly to the disposal of the Group’s shareholding in Edotech, an investment in a management buy-out of the former Barclays in-house statement printing operation.
| | |
| 46 | | Barclays PLC Annual Report 2006 |
| |
Tax
The overall tax charge is explained in the following table:
| | | | | | | | | |
| | | 2006
£m | | | 2005
£m | | | 2004
£m | |
Profit before tax | | 7,136 | | | 5,280 | | | 4,580 | |
| Tax charge at average UK corporation tax rate of 30% | | 2,141 | | | 1,584 | | | 1,374 | |
Prior year adjustments | | 28 | | | (130 | ) | | (26 | ) |
Differing overseas tax rates | | (17 | ) | | (35 | ) | | (110 | ) |
| Non-taxable gains and income (including amounts offset by unrecognised losses) | | (393 | ) | | (129 | ) | | (51 | ) |
Share-based payments | | 27 | | | (12 | ) | | – | |
Deferred tax assets not recognised | | (4 | ) | | (7 | ) | | 24 | |
Other non-allowable expenses | | 159 | | | 168 | | | 68 | |
Overall tax charge | | 1,941 | | | 1,439 | | | 1,279 | |
Effective tax rate | | 27% | | | 27% | | | 28% | |
2006/05
The charge for the period is based upon a UK corporation tax rate of 30% for the calendar year 2006 (2005: 30%). The effective rate of tax for 2006, based on profit before tax, was 27.2% (2005: 27.3%). The effective tax rate differs from 30% as it takes account of the different tax rates which are applied to the profits earned outside the UK, disallowable expenditure, certain non-taxable gains and adjustments to prior year tax provisions. The effective tax rate for 2006 is consistent with the prior period. The tax charge for the year includes £1,234m (2005: £961m) arising in the UK and £707m (2005: £478m) arising overseas.
The profit on disposal of subsidiaries, associates and joint ventures of £323m was substantially offset by losses or exemptions. The effective tax rate on profit before business disposals was 28.5%.
2005/04
In 2005, the charge for the period was based upon a UK corporation tax rate of 30% for the calendar year 2005 (2004: 30%). The effective rate of tax for 2005 was 27% (2004: 28%). This was lower than the standard rate due to the beneficial effects of lower tax on certain overseas income and certain non-taxable gains. The tax charge for the year included £961m (2004: £1,028m) arising in the UK and £478m (2004: £251m) arising overseas.
IFRS compared with US GAAP
The Group also provides results on the basis of accounting principles generally accepted in the United States (US GAAP). The impact on net income and shareholders’ equity of applying US GAAP is set out below. The individual IFRS/US GAAP adjustments are discussed in Note 60.
Profit attributable to equity holders of the parent
(IFRS)/net income (US GAAP)
| | | | | | |
| | | 2006
£m | | 2005
£m | | 2004
£m |
Barclays PLC Group | | | | | | |
| Profit attributable to equity holders of the parent (IFRS)/ Net income (US GAAP) | | | | | | |
IFRS | | 4,571 | | 3,447 | | 3,254 |
US GAAP | | 4,318 | | 2,932 | | 3,032 |
Barclays Bank PLC Group | | | | | | |
| Profit attributable to equity holders of the parent (IFRS)/ Net income (US GAAP) | | | | | | |
IFRS | | 4,914 | | 3,695 | | 3,263 |
US GAAP | | 4,650 | | 3,164 | | 3,137 |
Shareholders’ equity excluding minority interests(IFRS)/shareholders’ equity (US GAAP) | | |
| | | | | 2006
£m | | 2005
£m |
Barclays PLC Group | | | | | | |
| Shareholders’ equity excluding minority interests (IFRS)/ Shareholders’ equity (US GAAP) | | | | | | |
IFRS | | | | 19,799 | | 17,426 |
US GAAP | | | | 20,032 | | 18,461 |
Barclays Bank PLC Group | | | | | | |
| Shareholders’ equity excluding minority interests (IFRS)/ Shareholders’ equity (US GAAP) | | | | | | |
IFRS | | | | 25,421 | | 22,665 |
US GAAP | | | | 25,068 | | 23,114 |
The Group does not manage its business with regard to reported trends on a US GAAP basis. Consequently the level of adjustment from the application of US GAAP in current or past periods is not necessarily indicative of the magnitude or direction of such adjustment in subsequent periods.
| | |
Barclays PLC Annual Report 2006 | | 47 |
| |
Financial review
Average balance sheet
Average balance sheet and net interest income (year ended 31st December)
| | | | | | | | | | | | | | | | | | | | | | | | |
| | | 2006 | | 2005 | | 2004(a) |
| | | Average
balance(b)
£m |
| | Interest
£m |
| | Average
rate
% | | Average
balance(b)
£m |
| | Interest
£m |
| | Average
rate
% | | Average
balance(b)
£m |
| | Interest
£m |
| | Average
rate
% |
Assets | | | | | | | | | | | | | | | | | | | | | | | | |
Treasury bills and other eligible bills: | | | | | | | | | | | | | | | | | | | | | | | | |
– in offices in the United Kingdom | | n/a | | | n/a | | | n/a | | n/a | | | n/a | | | n/a | | 1,786 | | | 68 | | | 3.8 |
– in offices outside the United Kingdom | | n/a | | | n/a | | | n/a | | n/a | | | n/a | | | n/a | | 1,989 | | | 63 | | | 3.2 |
Loans and advances to banks(c): | | | | | | | | | | | | | | | | | | | | | | | | |
– in offices in the United Kingdom | | 18,401 | | | 647 | | | 3.5 | | 14,798 | | | 454 | | | 3.1 | | 18,144 | | | 691 | | | 3.8 |
– in offices outside the United Kingdom | | 12,278 | | | 488 | | | 4.0 | | 11,063 | | | 403 | | | 3.6 | | 9,619 | | | 271 | | | 2.8 |
Loans and advances to customers(c): | | | | | | | | | | | | | | | | | | | | | | | | |
– in offices in the United Kingdom | | 184,392 | | | 11,247 | | | 6.1 | | 172,398 | | | 10,229 | | | 5.9 | | 144,175 | | | 8,810 | | | 6.1 |
– in offices outside the United Kingdom | | 77,615 | | | 4,931 | | | 6.4 | | 50,699 | | | 2,975 | | | 5.9 | | 34,017 | | | 1,270 | | | 3.7 |
Lease receivables: | | | | | | | | | | | | | | | | | | | | | | | | |
– in offices in the United Kingdom | | 5,266 | | | 300 | | | 5.7 | | 6,521 | | | 348 | | | 5.3 | | 4,960 | | | 220 | | | 4.4 |
– in offices outside the United Kingdom | | 6,162 | | | 595 | | | 9.7 | | 1,706 | | | 117 | | | 6.9 | | 369 | | | 21 | | | 5.7 |
Debt securities: | | | | | | | | | | | | | | | | | | | | | | | | |
– in offices in the United Kingdom | | n/a | | | n/a | | | n/a | | n/a | | | n/a | | | n/a | | 51,212 | | | 2,129 | | | 4.2 |
– in offices outside the United Kingdom | | n/a | | | n/a | | | n/a | | n/a | | | n/a | | | n/a | | 11,533 | | | 338 | | | 2.9 |
Financial investments: | | | | | | | | | | | | | | | | | | | | | | | | |
– in offices in the United Kingdom | | 41,125 | | | 1,936 | | | 4.7 | | 43,133 | | | 1,755 | | | 4.1 | | n/a | | | n/a | | | n/a |
– in offices outside the United Kingdom | | 14,191 | | | 830 | | | 5.8 | | 10,349 | | | 467 | | | 4.5 | | n/a | | | n/a | | | n/a |
External trading assets | | | | | | | | | | | | | | | | | | | | | | | | |
– in offices in the United Kingdom | | n/a | | | n/a | | | n/a | | n/a | | | n/a | | | n/a | | 178,659 | | | 4,971 | | | 2.8 |
– in offices outside the United Kingdom | | n/a | | | n/a | | | n/a | | n/a | | | n/a | | | n/a | | 116,645 | | | 2,224 | | | 1.9 |
| Reverse repurchase agreements and cash collateral on securities borrowed | | | | | | | | | | | | | | | | | | | | | | | | |
– in offices in the United Kingdom | | 166,713 | | | 6,136 | | | 3.7 | | 156,292 | | | 4,617 | | | 3.0 | | n/a | | | n/a | | | n/a |
– in offices outside the United Kingdom | | 100,416 | | | 5,040 | | | 5.0 | | 92,407 | | | 2,724 | | | 2.9 | | n/a | | | n/a | | | n/a |
Trading portfolio assets: | | | | | | | | | | | | | | | | | | | | | | | | |
– in offices in the United Kingdom | | 106,148 | | | 4,166 | | | 3.9 | | 81,607 | | | 2,710 | | | 3.3 | | n/a | | | n/a | | | n/a |
– in offices outside the United Kingdom | | 61,370 | | | 2,608 | | | 4.2 | | 57,452 | | | 2,116 | | | 3.7 | | n/a | | | n/a | | | n/a |
Total average interest earning assets | | 794,077 | | | 38,924 | | | 4.9 | | 698,425 | | | 28,915 | | | 4.1 | | 573,108 | | | 21,076 | | | 3.7 |
Impairment allowances/provisions | | (3,565 | ) | | | | | | | (3,105 | ) | | | | | | | (2,907 | ) | | | | | |
Non-interest earning assets | | 310,949 | | | | | | | | 278,328 | | | | | | | | 68,742 | | | | | | |
Total average assets and interest income | | 1,101,461 | | | 38,924 | | | 3.5 | | 973,648 | | | 28,915 | | | 3.0 | | 638,943 | | | 21,076 | | | 3.3 |
| Percentage of total average interest earning assets in offices outside the United Kingdom | | 34.3% | | | | | | | | 32.0% | | | | | | | | 30.4% | | | | | | |
Total average interest earning assets related to: | | | | | | | | | | | | | | | | | | | | | | | | |
Interest income | | | | | 38,924 | | | 4.9 | | | | | 28,915 | | | 4.1 | | | | | 21,076 | | | 3.7 |
Interest expense | | | | | (30,385 | ) | | 3.8 | | | | | (20,965 | ) | | 3.0 | | | | | (14,464 | ) | | 2.5 |
| | | | | | 8,539 | | | 1.1 | | | | | 7,950 | | | 1.0 | | | | | 6,612 | | | 1.2 |
Notes
| (a) | Does not reflect the application of IAS 32, IAS 39 and IFRS 4 which became effective from 1st January 2005. |
| (b) | Average balances are based upon daily averages for most UK banking operations and monthly averages elsewhere. |
| (c) | Loans and advances to customers and banks include all doubtful lendings, including non-accrual lendings. Interest receivable on such lendings has been included to the extent to which either cash payments have been received or interest has been accrued in accordance with the income recognition policy of the Group. |
| | |
| 48 | | Barclays PLC Annual Report 2006 |
| |
Average balance sheet and net interest income (year ended 31st December)
| | | | | | | | | | | | | | | | | | | | | |
| | | 2006 | | 2005 | | 2004(a) | |
| | | Average
balance(b)
£m | | Interest
£m | | Average
rate
% | | Average
balance(b)
£m | | Interest
£m | | Average
rate
% | | Average
balance(b)
£m |
| | Interest
£m |
| | Average
rate % |
|
Liabilities and shareholders’ equity | | | | | | | | | | | | | | | | | | | | | |
Deposits by banks: | | | | | | | | | | | | | | | | | | | | | |
– in offices in the United Kingdom | | 62,236 | | 2, 464 | | 4.0 | | 54,801 | | 1,665 | | 3.0 | | 46,669 | | | 1,225 | | | 2.6 | |
– in offices outside the United Kingdom | | 23,438 | | 1,137 | | 4.9 | | 21,921 | | 705 | | 3.2 | | 16,610 | | | 310 | | | 1.9 | |
Customer accounts: | | | | | | | | | | | | | | | | | | | | | |
demand deposits: | | | | | | | | | | | | | | | | | | | | | |
– in offices in the United Kingdom | | 25,397 | | 680 | | 2.7 | | 22,593 | | 510 | | 2.3 | | 20,829 | | | 310 | | | 1.5 | |
– in offices outside the United Kingdom | | 10,351 | | 254 | | 2.5 | | 6,196 | | 88 | | 1.4 | | 3,317 | | | 31 | | | 0.9 | |
Customer accounts: | | | | | | | | | | | | | | | | | | | | | |
savings deposits: | | | | | | | | | | | | | | | | | | | | | |
– in offices in the United Kingdom | | 57,734 | | 1,691 | | 2.9 | | 52,569 | | 1,570 | | 3.0 | | 47,583 | | | 1,325 | | | 2.8 | |
– in offices outside the United Kingdom | | 3,124 | | 74 | | 2.4 | | 1,904 | | 39 | | 2.0 | | 1,117 | | | 21 | | | 1.9 | |
Customer accounts: | | | | | | | | | | | | | | | | | | | | | |
other time deposits – retail: | | | | | | | | | | | | | | | | | | | | | |
– in offices in the United Kingdom | | 34,865 | | 1,548 | | 4.4 | | 33,932 | | 1,470 | | 4.3 | | 34,518 | | | 1,306 | | | 3.8 | |
– in offices outside the United Kingdom | | 8,946 | | 482 | | 5.4 | | 6,346 | | 260 | | 4.1 | | 4,526 | | | 118 | | | 2.6 | |
Customer accounts: | | | | | | | | | | | | | | | | | | | | | |
other time deposits – wholesale: | | | | | | | | | | | | | | | | | | | | | |
– in offices in the United Kingdom | | 45,930 | | 1,794 | | 3.9 | | 41,745 | | 1,191 | | 2.9 | | 58,035 | | | 1,844 | | | 3.2 | |
– in offices outside the United Kingdom | | 23,442 | | 1,191 | | 5.1 | | 12,545 | | 590 | | 4.7 | | 13,140 | | | 342 | | | 2.6 | |
Debt securities in issue: | | | | | | | | | | | | | | | | | | | | | |
– in offices in the United Kingdom | | 47,216 | | 1,850 | | 3.9 | | 46,583 | | 1,631 | | 3.5 | | 47,132 | | | 1,233 | | | 2.6 | |
– in offices outside the United Kingdom | | 74,125 | | 3,686 | | 5.0 | | 52,696 | | 1,695 | | 3.2 | | 17,218 | | | 336 | | | 2.0 | |
| Dated and undated loan capital and other subordinated liabilities principally | | | | | | | | | | | | | | | | | | | | | |
– in offices in the United Kingdom | | 13,686 | | 777 | | 5.7 | | 11,286 | | 605 | | 5.4 | | 12,740 | | | 692 | | | 5.4 | |
External trading liabilities: | | | | | | | | | | | | | | | | | | | | | |
– in offices in the United Kingdom | | n/a | | n/a | | n/a | | n/a | | n/a | �� | n/a | | 190,036 | | | 5,611 | | | 3.0 | |
– in offices outside the United Kingdom | | n/a | | n/a | | n/a | | n/a | | n/a | | n/a | | 115,032 | | | 1,805 | | | 1.6 | |
| Repurchase agreements and cash collateral on securities lent: | | | | | | | | | | | | | | | | | | | | | |
– in offices in the United Kingdom | | 141,862 | | 5,080 | | 3.6 | | 130,767 | | 3,634 | | 2.8 | | n/a | | | n/a | | | n/a | |
– in offices outside the United Kingdom | | 86,693 | | 4,311 | | 5.0 | | 80,391 | | 2,379 | | 3.0 | | n/a | | | n/a | | | n/a | |
Trading portfolio liabilities: | | | | | | | | | | | | | | | | | | | | | |
– in offices in the United Kingdom | | 49,892 | | 2,014 | | 4.0 | | 44,349 | | 1,737 | | 3.9 | | n/a | | | n/a | | | n/a | |
– in offices outside the United Kingdom | | 39,064 | | 1,352 | | 3.5 | | 36,538 | | 1,196 | | 3.3 | | n/a | | | n/a | | | n/a | |
Internal funding of trading business | | n/a | | n/a | | n/a | | n/a | | n/a | | n/a | | (72,291 | ) | | (2,045 | ) | | (2.8 | ) |
Total average interest bearing liabilities | | 748,001 | | 30,385 | | 4.1 | | 657,162 | | 20,965 | | 3.2 | | 556,211 | | | 14,464 | | | 2.6 | |
Interest free customer deposits: | | | | | | | | | | | | | | | | | | | | | |
– in offices in the United Kingdom | | 27,549 | | | | | | 25,095 | | | | | | 15,522 | | | | | | | |
– in offices outside the United Kingdom | | 2,228 | | | | | | 2,053 | | | | | | 3,190 | | | | | | | |
Other non-interest bearing liabilities | | 297,816 | | | | | | 267,531 | | | | | | 48,614 | | | | | | | |
| Minority and other interests and shareholders’ equity | | 25,867 | | | | | | 21,807 | | | | | | 15,406 | | | | | | | |
Total average liabilities, shareholders’ equity and interest expense | | 1,101,461 | | 30,385 | | 2.8 | | 973,648 | | 20,965 | | 2.2 | | 638,943 | | | 14,464 | | | 2.3 | |
Percentage of total average interest bearing non-capital liabilities in offices outside the United Kingdom | | 36.1% | | | | | | 33.3% | | | | | | 30.7% | | | | | | | |
Notes
| (a) | Does not reflect the application of IAS 32, IAS 39 and IFRS 4 which became effective from 1st January 2005. |
| (b) | Average balances are based upon daily averages for most UK banking operations and monthly averages elsewhere. |
| | |
Barclays PLC Annual Report 2006 | | 49 |
| |
Financial review
Average balance sheet
Changes in net interest income – volume and rate analysis
The following tables allocate changes in net interest income between changes in volume and changes in interest rates for the last two years. Volume and rate variances have been calculated on the movement in the average balances and the change in the interest rates on average interest earning assets and average interest bearing liabilities. Where variances have arisen from changes in both volumes and interest rates, these have been allocated proportionately between the two.
| | | | | | | | | | | | | | | | | | | | | | | | | | |
| | | 2006/2005 Change due
to increase/(decrease) in: | | 2005/2004(a)Change due
to increase/(decrease) in: | | | 2004(a)/2003(b) Change due
to increase/(decrease) in: | |
| | | Total
change
£m |
| | Volume
£m |
| | Rate
£m | | Total
change
£m |
| | Volume
£m |
| | Rate
£m |
| | Total
change
£m |
| | Volume
£m |
| | Rate
£m |
|
Interest receivable | | | | | | | | | | | | | | | | | | | | | | | | | | |
Treasury bills and other eligible bills: | | | | | | | | | | | | | | | | | | | | | | | | | | |
– in offices in the UK | | n/a | | | n/a | | | n/a | | (68 | ) | | (68 | ) | | n/a | | | (53) | | | (80 | ) | | 27 | |
– in offices outside the UK | | n/a | | | n/a | | | n/a | | (63 | ) | | (63 | ) | | n/a | | | (3) | | | 31 | | | (34 | ) |
| | | n/a | | | n/a | | | n/a | | (131 | ) | | (131 | ) | | n/a | | | (56) | | | (49 | ) | | (7 | ) |
Loans and advances to banks: | | | | | | | | | | | | | | | | | | | | | | | | | | |
– in offices in the UK | | 193 | | | 121 | | | 72 | | (237 | ) | | (115 | ) | | (122 | ) | | 117 | | | 160 | | | (43 | ) |
– in offices outside the UK | | 85 | | | 46 | | | 39 | | 132 | | | 45 | | | 87 | | | 163 | | | 149 | | | 14 | |
| | | 278 | | | 167 | | | 111 | | (105 | ) | | (70 | ) | | (35 | ) | | 280 | | | 309 | | | (29 | ) |
Loans and advances to customers: | | | | | | | | | | | | | | | | | | | | | | | | | | |
– in offices in the UK | | 1,018 | | | 726 | | | 292 | | 1,419 | | | 1,681 | | | (262 | ) | | 1,006 | | | 523 | | | 483 | |
– in offices outside the UK | | 1,956 | | | 1,695 | | | 261 | | 1,705 | | | 787 | | | 918 | | | 134 | | | 301 | | | (167 | ) |
| | | 2,974 | | | 2,421 | | | 553 | | 3,124 | | | 2,468 | | | 656 | | | 1,140 | | | 824 | | | 316 | |
Lease receivables: | | | | | | | | | | | | | | | | | | | | | | | | | | |
– in offices in the UK | | (48 | ) | | (70 | ) | | 22 | | 128 | | | 78 | | | 50 | | | 5 | | | 20 | | | (15 | ) |
– in offices outside the UK | | 478 | | | 413 | | | 65 | | 96 | | | 91 | | | 5 | | | 2 | | | 7 | | | (5 | ) |
| | | 430 | | | 343 | | | 87 | | 224 | | | 169 | | | 55 | | | 7 | | | 27 | | | (20 | ) |
Debt securities: | | | | | | | | | | | | | | | | | | | | | | | | | | |
– in offices in the UK | | n/a | | | n/a | | | n/a | | (2,129 | ) | | (2,129 | ) | | n/a | | | (45 | ) | | (285 | ) | | 240 | |
– in offices outside the UK | | n/a | | | n/a | | | n/a | | (338 | ) | | (338 | ) | | n/a | | | 128 | | | 241 | | | (113 | ) |
| | | n/a | | | n/a | | | n/a | | (2,467 | ) | | (2,467 | ) | | n/a | | | 83 | | | (44 | ) | | 127 | |
Financial investments: | | | | | | | | | | | | | | | | | | | | | | | | | | |
– in offices in the UK | | 181 | | | (85 | ) | | 266 | | 1,755 | | | 1,755 | | | n/a | | | n/a | | | n/a | | | n/a | |
– in offices outside the UK | | 363 | | | 202 | | | 161 | | 467 | | | 467 | | | n/a | | | n/a | | | n/a | | | n/a | |
| | | 544 | | | 117 | | | 427 | | 2,222 | | | 2,222 | | | n/a | | | n/a | | | n/a | | | n/a | |
External trading assets: | | | | | | | | | | | | | | | | | | | | | | | | | | |
– in offices in the UK and | | n/a | | | n/a | | | n/a | | (4,971 | ) | | (4,971 | ) | | n/a | | | 1,382 | | | 2,051 | | | (669 | ) |
– outside the UK | | n/a | | | n/a | | | n/a | | (2,224 | ) | | (2,224 | ) | | n/a | | | 812 | | | 654 | | | 158 | |
| | | n/a | | | n/a | | | n/a | | (7,195 | ) | | (7,195 | ) | | n/a | | | 2,194 | | | 2,705 | | | (511 | ) |
Reverse repurchase agreements and cash collateral on securities borrowed: | | | | | | | | | | | | | | | | | | | | | | | | | | |
– in offices in the UK | | 1,519 | | | 324 | | | 1,195 | | 4,617 | | | 4,617 | | | n/a | | | n/a | | | n/a | | | n/a | |
– in offices outside the UK | | 2,316 | | | 254 | | | 2,062 | | 2,724 | | | 2,724 | | | n/a | | | n/a | | | n/a | | | n/a | |
| | | 3,835 | | | 578 | | | 3,257 | | 7,341 | | | 7,341 | | | n/a | | | n/a | | | n/a | | | n/a | |
Trading portfolio assets: | | | | | | | | | | | | | | | | | | | | | | | | | | |
– in offices in the UK | | 1,456 | | | 907 | | | 549 | | 2,710 | | | 2,710 | | | n/a | | | n/a | | | n/a | | | n/a | |
– in offices outside the UK | | 492 | | | 151 | | | 341 | | 2,116 | | | 2,116 | | | n/a | | | n/a | | | n/a | | | n/a | |
| | | 1,948 | | | 1,058 | | | 890 | | 4,826 | | | 4,826 | | | n/a | | | n/a | | | n/a | | | n/a | |
Total interest receivable: | | | | | | | | | | | | | | | | | | | | | | | | | | |
– in offices in the UK | | 4,319 | | | 1,923 | | | 2,396 | | 3,224 | | | 3,558 | | | (334 | ) | | 2,412 | | | 2,389 | | | 23 | |
– in offices outside the UK | | 5,690 | | | 2,761 | | | 2,929 | | 4,615 | | | 3,605 | | | 1,010 | | | 1,236 | | | 1,383 | | | (147 | ) |
| | | 10,009 | | | 4,684 | | | 5,325 | | 7,839 | | | 7,163 | | | 676 | | | 3,648 | | | 3,772 | | | (124 | ) |
Notes
(a) 2004 figures do not reflect the applications of IAS 32, and IAS 39 and IFRS 4 which became effective from 1st January 2005.
(b) 2003 reflects UK GAAP.
| | |
| 50 | | Barclays PLC Annual Report 2006 |
| |
Changes in net interest income – volume and rate analysis
| | | | | | | | | | | | | | | | | | | | | | | | | | |
| | | 2006/2005 Change due
to increase/(decrease) in: | | | 2005/2004(a)Change due
to increase/(decrease) in: | | 2004(a) /2003(b) Change due
to increase/(decrease) in: | |
| | | Total
change
£m |
| | Volume
£m |
| | Rate
£m |
| | Total
change
£m |
| | Volume
£m |
| | Rate
£m | | Total
change
£m |
| | Volume
£m |
| | Rate
£m |
|
| | | | | | | | | |
Interest payable | | | | | | | | | | | | | | | | | | | | | | | | | | |
Deposits by banks: | | | | | | | | | | | | | | | | | | | | | | | | | | |
– in offices in the UK | | 799 | | | 247 | | | 552 | | | 440 | | | 231 | | | 209 | | 232 | | | 146 | | | 86 | |
– in offices outside the UK | | 432 | | | 52 | | | 380 | | | 395 | | | 121 | | | 274 | | 126 | | | 121 | | | 5 | |
| | | 1,231 | | | 299 | | | 932 | | | 835 | | | 352 | | | 483 | | 358 | | | 267 | | | 91 | |
Customer accounts – demand deposits: | | | | | | | | | | | | | | | | | | | | | | | | | | |
– in offices in the UK | | 170 | | | 68 | | | 102 | | | 200 | | | 28 | | | 172 | | 140 | | | 20 | | | 120 | |
– in offices outside the UK | | 166 | | | 80 | | | 86 | | | 57 | | | 36 | | | 21 | | (17 | ) | | (2 | ) | | (15 | ) |
| | | 336 | | | 148 | | | 188 | | | 257 | | | 64 | | | 193 | | 123 | | | 18 | | | 105 | |
Customer accounts – savings deposits: | | | | | | | | | | | | | | | | | | | | | | | | | | |
– in offices in the UK | | 121 | | | 152 | | | (31 | ) | | 245 | | | 145 | | | 100 | | 326 | | | 46 | | | 280 | |
– in offices outside the UK | | 35 | | | 28 | | | 7 | | | 18 | | | 16 | | | 2 | | (5 | ) | | 8 | | | (13 | ) |
| | | 156 | | | 180 | | | (24 | ) | | 263 | | | 161 | | | 102 | | 321 | | | 54 | | | 267 | |
Customer accounts – other time deposits – retail: | | | | | | | | | | | | | | | | | | | | | | | | | | |
– in offices in the UK | | 78 | | | 41 | | | 37 | | | 164 | | | (23 | ) | | 187 | | 135 | | | (24 | ) | | 159 | |
– in offices outside the UK | | 222 | | | 125 | | | 97 | | | 142 | | | 59 | | | 83 | | 15 | | | 22 | | | (7 | ) |
| | | 300 | | | 166 | | | 134 | | | 306 | | | 36 | | | 270 | | 150 | | | (2 | ) | | 152 | |
Customer accounts – other time deposits – wholesale: | | | | | | | | | | | | | | | | | | | | | | | | | | |
– in offices in the UK | | 603 | | | 129 | | | 474 | | | (653 | ) | | (479 | ) | | (174) | | 210 | | | 19 | | | 191 | |
– in offices outside the UK | | 601 | | | 550 | | | 51 | | | 248 | | | (16 | ) | | 264 | | 95 | | | 132 | | | (37 | ) |
| | | 1,204 | | | 679 | | | 525 | | | (405 | ) | | (495 | ) | | 90 | | 305 | | | 151 | | | 154 | |
Debt securities in issue: | | | | | | | | | | | | | | | | | | | | | | | | | | |
– in offices in the UK | | 219 | | | 22 | | | 197 | | | 398 | | | 507 | | | (109) | | 284 | | | (73 | ) | | 357 | |
– in offices outside the UK | | 1,991 | | | 850 | | | 1,141 | | | 1,359 | | | 323 | | | 1,036 | | 92 | | | 256 | | | (164 | ) |
| | | 2,210 | | | 872 | | | 1,338 | | | 1,757 | | | 830 | | | 927 | | 376 | | | 183 | | | 193 | |
Dated and undated loan capital and other subordinated liabilities principally in offices in the UK | | 172 | | | 135 | | | 37 | | | (87 | ) | | (78 | ) | | (9) | | 8 | | | 23 | | | (15 | ) |
External trading liabilities: | | | | | | | | | | | | | | | | | | | | | | | | | | |
– in offices in the UK | | n/a | | | n/a | | | n/a | | | (5,611 | ) | | (5,611 | ) | | n/a | | 1,764 | | | 1,747 | | | 17 | |
– outside the UK | | n/a | | | n/a | | | n/a | | | (1,805 | ) | | (1,805 | ) | | n/a | | 717 | | | 884 | | | (167 | ) |
| | | n/a | | | n/a | | | n/a | | | (7,416 | ) | | (7,416 | ) | | n/a | | 2,481 | | | 2,631 | | | (150 | ) |
Repurchase agreements and cash collateral on securities lent: | | | | | | | | | | | | | | | | | | | | | | | | | | |
– in offices in the UK | | 1,446 | | | 329 | | | 1,117 | | | 3,634 | | | 3,634 | | | n/a | | n/a | | | n/a | | | n/a | |
– in offices outside the UK | | 1,932 | | | 200 | | | 1,732 | | | 2,379 | | | 2,379 | | | n/a | | n/a | | | n/a | | | n/a | |
| | | 3,378 | | | 529 | | | 2,849 | | | 6,013 | | | 6,013 | | | n/a | | n/a | | | n/a | | | n/a | |
Trading portfolio liabilities: | | | | | | | | | | | | | | | | | | | | | | | | | | |
– in offices in the UK | | 277 | | | 222 | | | 55 | | | 1,737 | | | 1,737 | | | n/a | | n/a | | | n/a | | | n/a | |
– in offices outside the UK | | 156 | | | 85 | | | 71 | | | 1,196 | | | 1,196 | | | n/a | | n/a | | | n/a | | | n/a | |
| | | 433 | | | 307 | | | 126 | | | 2,933 | | | 2,933 | | | n/a | | n/a | | | n/a | | | n/a | |
Internal funding of trading businesses | | n/a | | | n/a | | | n/a | | | 2,045 | | | 2,045 | | | n/a | | (414 | ) | | (392 | ) | | (22 | ) |
Total interest payable: | | | | | | | | | | | | | | | | | | | | | | | | | | |
– in offices in the UK | | 3,885 | | | 1,345 | | | 2,540 | | | 2,512 | | | 2,136 | | | 376 | | 2,685 | | | 1,512 | | | 1,173 | |
– in offices outside the UK | | 5,535 | | | 1,970 | | | 3,565 | | | 3,989 | | | 2,309 | | | 1,680 | | 1,023 | | | 1,421 | | | (398 | ) |
| | | 9,420 | | | 3,315 | | | 6,105 | | | 6,501 | | | 4,445 | | | 2,056 | | 3,708 | | | 2,933 | | | 775 | |
Movement in net interest income | | | | | | | | | | | | | | | | | | | | | | | | | | |
Increase/(decrease) in interest receivable | | 10,009 | | | 4,684 | | | 5,325 | | | 7,839 | | | 7,163 | | | 676 | | 3,648 | | | 3,772 | | | (124 | ) |
(Increase)/decrease in interest payable | | (9,420 | ) | | (3,315 | ) | | (6,105 | ) | | (6,501 | ) | | (4,445 | ) | | (2,056) | | (3,708 | ) | | (2,933 | ) | | (775 | ) |
| | | 589 | | | 1,369 | | | (780 | ) | | 1,338 | | | 2,718 | | | (1,380) | | (60 | ) | | 839 | | | (899 | ) |
Notes
(a) 2004 figures do not reflect the applications of IAS 32 and IAS 39 and IFRS 4 which became effective from 1st January 2005.
(b) 2003 reflects UK GAAP.
| | |
Barclays PLC Annual Report 2006 | | 51 |
| |
Financial review
Total assets and risk weighted assets
Total assets and risk weighted assets
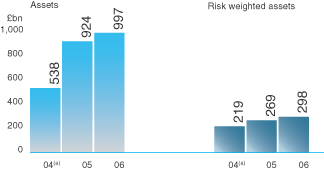
Total assets
| | | | | | | | | | |
| | | 2006
£m | | | | 2005
£m | | | | 2004(a)
£m |
UK Banking | | 139,902 | | | | 130,304 | | | | 114,934 |
UK Retail Banking | | 74,018 | | | | 70,389 | | | | 72,768 |
UK Business Banking | | 65,884 | | | | 59,915 | | | | 42,166 |
Barclaycard | | 27,628 | | | | 25,771 | | | | 23,367 |
IRCB | | 68,848 | | | | 63,556 | | | | 28,505 |
IRCB – ex Absa | | 38,451 | | | | 34,195 | | | | 28,505 |
IRCB – Absa | | 30,397 | | | | 29,361 | | | | – |
Barclays Capital | | 657,922 | | | | 601,193 | | | | 353,246 |
Barclays Global Investors | | 80,515 | | | | 80,900 | | | | 968 |
Barclays Wealth | | 7,285 | | | | 6,094 | | | | 5,616 |
| Barclays Wealth – closed life assurances activities | | 7,605 | | | | 7,276 | | | | 6,425 |
| Head office functions and other operations | | 7,082 | | | | 9,263 | | | | 5,120 |
| | | | | |
Total assets | | 996,787 | | | | 924,357 | | | | 538,181 |
| | | | | |
Risk weighted assets | | | | | | | | | | |
| | | 2006
£m | | | | 2005
£m | | | | 2004(a)
£m |
UK Banking | | 84,903 | | | | 79,929 | | | | 80,467 |
UK Retail Banking | | 34,942 | | | | 32,803 | | | | 38,230 |
UK Business Banking | | 49,961 | | | | 47,126 | | | | 42,237 |
Barclaycard | | 25,203 | | | | 21,752 | | | | 20,188 |
IRCB | | 41,053 | | | | 41,228 | | | | 19,319 |
IRCB – ex Absa | | 20,325�� | | | | 20,394 | | | | 19,319 |
IRCB – Absa | | 20,728 | | | | 20,834 | | | | – |
Barclays Capital | | 137,635 | | | | 116,677 | | | | 90,078 |
Barclays Global Investors | | 1,375 | | | | 1,456 | | | | 1,230 |
Barclays Wealth | | 5,744 | | | | 4,061 | | | | 4,018 |
| Barclays Wealth – closed life assurances activities | | – | | | | – | | | | – |
| Head office functions and other operations | | 1,920 | | | | 4,045 | | | | 3,301 |
Risk weighted assets | | 297,833 | | | | 269,148 | | | | 218,601 |
Note
| (a) | 2004 figures do not reflect the application of IAS32, and IAS39 and IFRS 4 which became effective from 1st January 2005. |
2006/05
Total assets increased 8% to £996.8bn (2005: £924.4bn). Risk weighted assets increased 11% to £297.8bn (2005: £269.1bn). Loans and advances to customers that have been securitised increased £5.8bn to £24.4bn (2005: £18.6bn). The increase in risk weighted assets since 2005 reflects a rise of £18.1bn in the banking book and a rise of £10.9bn in the trading book.
UK Retail Banking total assets increased 5% to £74.0bn (2005:
£70.4bn). This was mainly attributable to growth in mortgage balances. Risk weighted assets increased 6% to £34.9bn (2005: £32.8bn) also primarily reflecting the growth in mortgage balances.
UK Business Banking total assets increased 10% to £65.9bn (2005: £59.9bn) reflecting good growth across short, medium and long term lending products. Risk weighted assets increased 6% to £50.0bn (2005: £47.1bn), reflecting asset growth and increased regulatory netting.
Barclaycard total assets increased 7% to £27.6bn (2005: £25.8bn) driven by growth in lending balances in the international businesses and FirstPlus. Risk weighted assets increased 16% to £25.2bn (2005: £21.8bn), primarily reflecting the increase in total assets and lower securitised balances.
International Retail and Commercial Banking-excluding Absa total assets increased 13% to £38.5bn (2005: £34.2bn) mainly reflecting increases in mortgage and other lending. Risk weighted assets remained flat at £20.3bn (2005: £20.4bn), with balance sheet growth offset by the sale of FirstCaribbean International Bank.
International Retail and Commercial Banking-Absa total assets increased 3% to £30.4bn (2005: £29.4bn). Risk weighted assets remained flat at £20.7bn (2005: £20.8bn). This reflects very strong growth in Rand terms offset by a 21% decline in the value of the Rand. In Rand terms assets grew 31% to ZAR417bn (2005: ZAR319bn) and risk weighted assets grew 25% to ZAR284bn (2005: ZAR227bn) due to strong growth in mortgage lending along with growth in corporate lending.
Barclays Capital total assets increased 9% to £657.9bn (2005: £601.2bn). This reflected continued expansion of the business with growth in reverse repurchase agreements, debt securities and traded equity securities. Risk weighted assets increased 18% to £137.6bn (2005: £116.7bn) in line with risk, driven by the growth in equity derivatives, credit derivatives and fixed income.
Barclays Global Investors total assets remained flat at £80.5bn (2005: £80.9bn). The majority of total assets relates to asset management products with equal and offsetting balances reflected within liabilities to customers. Risk weighted assets decreased 7% to £1.4bn (2005: £1.5bn).
Barclays Wealth total assets increased 20% to £7.3bn (2005: £6.1bn) reflecting strong growth in lending to high net worth, affluent and intermediary clients. Risk weighted assets increased 39% to £5.7bn (2005: £4.1bn) above the rate of balance sheet growth driven by changes in the mix of lending and growth in guarantees.
Head office functions and other operations total assets decreased 24% to £7.1bn (2005: £9.3bn). Risk weighted assets decreased 53% to £1.9bn (2005: £4.0bn).
| | |
| 52 | | Barclays PLC Annual Report 2006 |
| |
2005/04
Total assets increased 72% to £924.4bn (2004: £538.2bn). Risk weighted assets increased 23% to £269.1bn (2004: £218.6bn). Loans and advances to customers that have been securitised increased £14.3bn to £18.6bn (2004: £4.3bn). The increase in risk weighted assets since 2004 reflects a rise of £37.6bn in the banking book and a rise of £12.9bn in the trading book.
UK Retail Banking total assets decreased 3% to £70.4bn (2004: £72.8bn). This was mainly attributable to lower residential mortgage balances. Risk weighted assets decreased 14% to £32.8bn (2004: £38.2bn), reflecting lower mortgage balances and a £4.5bn securitisation of mortgage assets in the second half of 2005, which more than offset strong growth in non-mortgage loans.
UK Business Banking total assets increased 42% to £59.9bn (2004: £42.2bn) due to the impact of the adoption of IAS 32 and IAS 39 and strong growth in lending balances. Risk weighted assets increased 12% to £47.1bn (2004: £42.3bn), the increase being lower than asset growth, mostly as a result of £5bn securitisation of corporate loans in the second half of 2005. The acquisition of a 51% stake in Iveco Finance, completed in June, increased total assets and risk weighted assets by £1.8bn.
Barclaycard total assets increased 10% to £25.8bn (2004: £23.4bn). Risk weighted assets rose by 8% to £21.8bn (2004: £20.2bn), which is less than the increase in assets, reflecting increased securitisation activity during the second half of 2005.
International Retail and Commercial Banking excluding Absa total assets increased 20% to £34.2bn (2004: £28.5bn) reflecting strong volume growth in European mortgages and African corporate lending. Risk weighted assets increased 6% to £20.4bn (2004: £19.3bn), which was lower than the increase in assets, reflecting strong growth in mortgage balances, which carry a 50% weighting, and the securitisation of assets in Spain during the second half of 2005.
International Retail and Commercial Banking – Absa total assets were £29.4bn and risk weighted assets £20.8bn.
Barclays Capital total assets increased 70% to £601.2bn (2004: £353.2bn). £107.5bn of this increase was the result of the adoption of IAS 32 and IAS 39. The underlying growth was mainly attributable to increases in debt securities and reverse repurchase agreements as the business continued to grow, and in derivative financial instruments as a result of business growth and market movements. Risk weighted assets increased 30% to £116.7bn (2004: £90.1bn). Excluding the impact of the transfer of a number of clients from UK Business Banking and Absa Capital from IRCB, effective 1st January 2006, the underlying growth was 20%. This reflected trading book risk weighted assets moving in line with risk rather than the balance sheet and the lower weighting of fully collateralised reverse repurchase agreements.
Barclays Global Investors total assets increased £79.9bn to £80.9bn (2004: £1.0bn) due to the impact of the adoption of IAS 32, IAS 39 and IFRS 4 and growth in asset management products reported on the balance sheet. For the amounts related to asset management products, equal and offsetting balances are reflected within liabilities to customers. Risk weighted assets rose 25% to £1.5bn (2004: £1.2bn) due to growth in the business.
Barclays Wealth total assets increased 9% to £6.1bn (2004: £5.6bn). Risk weighted assets increased 3% to £4.1bn (2004: £4.0bn).
Head office functions and other operations total assets increased 82% to £9.3bn (2004: £5.1bn). The increase included financial instruments acquired for hedging purposes. Risk weighted assets increased 21% to £4bn (2004: £3.3bn), reflecting assets held for hedging purposes.
Note
| (a) | 2004 figures do not reflect the applications of IAS 32, and IAS 39 and IFRS 4 which became effective from 1st January 2005. |
| | |
Barclays PLC Annual Report 2006 | | 53 |
| |
Financial review
Capital management
Capital management
Barclays operates a centralised capital management model, considering both regulatory and economic capital. The capital management strategy is to continue to maximise shareholder value through optimising both the level and mix of capital resources in order to:
| · | | Meet the individual capital ratios required by our regulators plus a prudent buffer. |
| · | | Maintain an AA credit rating. |
| · | | Generate sufficient capital to support asset growth. |
| · | | Manage the currency exposure to its overall Sterling equivalent capital requirement. |
Decisions on the allocation of capital resources are based on a number of factors including return on economic and regulatory capital. This is conducted as part of the strategic planning review.
Capital resources
The Group manages both its debt and equity capital actively. The Group’s authority to buy-back equity shares was renewed at the 2006 AGM to provide additional flexibility in the management of the Group’s capital resources.
| | | | | | |
| | | 2006
£m | | 2005
£m | | 2004(a)
£m |
Barclays PLC Group | | | | | | |
Shareholders’ equity excluding minority interests | | 19,799 | | 17,426 | | 15,870 |
Minority interests | | 7,591 | | 7,004 | | 894 |
Shareholders’ equity | | 27,390 | | 24,430 | | 16,764 |
Subordinated liabilities | | 13,786 | | 12,463 | | 12,277 |
Total capital resources | | 41,176 | | 36,893 | | 29,041 |
2006/05
The authorised share capital of Barclays PLC was £2,500m (2005: £2,500m) comprising 9,996 million (2005: 9,996 million) ordinary shares of 25p each and 1 million (2005: 1 million) staff shares of £1 each. Called up share capital comprises 6,535 million (2005: 6,490 million) ordinary shares of 25p each and 1 million (2005: 1 million) staff shares of £1 each.
Total capital resources increased £4,283m to £41,176m since 31st December 2005.
Shareholders’ equity, excluding minority interests, increased £2,373m since 31st December 2005. The increase reflected profits attributable to equity holders of the parent of £4,571m, increases in share capital and share premium of £179m and other increases in retained reserves of £412m. Offsetting these movements were dividends paid of £1,771m, decreases in the available for sale and cash flow hedging reserves of £93m and £300m respectively, a £594m decrease in the currency translation reserve and a £31m decrease due to changes in treasury and Employee Share Ownership Plan shares.
Subordinated liabilities increased £1,323m since 31st December 2005. The increase reflects capital raisings of £2,493m and interest charges of £11m; offset by exchange rate movements of £575m, redemptions of £366m, fair value adjustments of £214m and amortisation of issue expenses of £26m.
Minority interests increased £587m since 31st December 2005. The increase primarily reflected the issue by Barclays Bank PLC, during April 2006, of 30,000,000 Preference Shares of US$25 each (US$750m; £419m) with a 6.625% dividend. In addition, during April 2006, Absa issued 3,000,000 preference shares of ZAR1,000 per share (£218m).
2005/04
The authorised share capital of Barclays PLC was £2,500m (2004: £2,500m) comprising 9,996 million (2004: 9,996 million) ordinary shares of 25p each and 1 million (2004: 1 million) staff shares of £1 each. Called up share capital comprised 6,490 million (2004: 6,454 million) ordinary shares of 25p each and 1 million (2004: 1 million) staff shares of £1 each.
Total capital resources increased £7,852m to £36,893m since 2004.
Shareholders’ equity, excluding minority interests, increased £1,556m since 2004. The increase primarily reflected the impact of the adoption of IAS 32, IAS 39 and IFRS 4, profits attributable to equity holders of the parent of £3,447m, offset by dividends of £1,581m.
Subordinated liabilities rose £186m reflecting capital raisings of £1,283m, acquisition of Absa Group Limited’s loan capital of £669m, interest charge of £210m and exchange rate movements of £207m; offset by redemptions of £464m, fair value adjustments of £43m and amortisation of issue expenses of £5m, and IFRS adjustments of £1,671m.
Minority interests increased £6,110m since 2004, primarily reflecting: the purchase of Absa Group Limited (£1,351m), the IFRS reclassification of £2,493m of certain capital instruments from loan capital to minority interests and the following issuances of Preference Shares by Barclays Bank PLC during 2005:
| · | | 140,000 Preference Shares of nominal ¤100 each (Principal amount:€1.4bn; £978m) with a 4.75% dividend issued on 15th March 2005. |
| · | | 100,000 Preference Shares of nominal US$100 each (Principal amount: US$1bn; £551m) with a 6.278% dividend issued on 8th June 2005. |
| · | | 75,000 Preference Shares of nominal £100 each (Principal amount: £750m) with a 6% dividend issued on 22nd June 2005. |
Barclays Bank PLC
The capital instruments reclassified under IFRSs and the Preference Shares issued are included within Shareholders’ equity excluding minority interests in the Barclays Bank PLC Group.
| | | | | | |
| | | 2006
£m | | 2005
£m | | 2004(a)
£m |
Barclays Bank PLC Group | | | | | | |
Shareholders’ equity excluding minority interests | | 25,421 | | 22,665 | | 16,638 |
Minority interests | | 1,685 | | 1,578 | | 211 |
Shareholders’ equity | | 27,106 | | 24,243 | | 16,849 |
Undated loan capital | | 5,422 | | 4,397 | | 6,149 |
Dated loan capital | | 8,364 | | 8,066 | | 6,128 |
Total capital resources | | 40,892 | | 36,706 | | 29,126 |
2006/2005
Capital resources for Barclays Bank PLC Group were £284m lower than for Barclays PLC Group (2005: £187m lower).
2005/2004
In 2005, capital resources for Barclays Bank PLC Group were £187m lower than for Barclays PLC Group (2004: £85m higher).
Note
| (a) | 2004 figures do not reflect the applications of IAS 32, and IAS 39 and IFRS 4 which became effective from 1st January 2005. |
| | |
| 54 | | Barclays PLC Annual Report 2006 |
| |
Capital ratios
Capital adequacy and the use of regulatory capital are monitored by the Group, employing techniques based on the guidelines developed by the Basel Committee on Banking Supervision (the Basel Committee) and European Union Directives, as implemented by the Financial Services Authority (FSA) for supervisory purposes.
These techniques include the risk asset ratio calculation, which the FSA regards as a key supervisory tool. The FSA sets ratio requirements for individual banks in the UK at or above the internationally agreed minimum of 8%. The ratio calculation involves the application of designated risk weightings to reflect an estimate of credit, market and other risks associated with broad categories of transactions and counterparties. Regulatory guidelines define three ‘Tiers’ of capital resources. Tier 1 capital, comprising mainly shareholders’ funds and including Reserve Capital Instruments and Tier One Notes, is the highest tier and can be used to meet trading and banking activity requirements. Tier 2 includes perpetual, medium-term and long-term subordinated debt and collectively assessed impairment allowances. Tier 2 capital can also be used to support both trading and banking activities. Tier 3 capital also comprises short-term subordinated debt with a minimum original maturity of two years. The use of tier 3 capital is restricted to trading activities only and it is not eligible to support counterparty or settlement risk. The aggregate of Tiers 2 and 3 capital included in the risk asset ratio calculation may not exceed Tier 1 capital.
| | | | | | | | | | | | | | | | |
| | | IFRS | | | | | | UK GAAP |
| | | 2006 | | | | 2005 | | | | 2004(a) |
| | | Barclays
PLC
Group | | Barclays
Bank PLC
Group | | | | Barclays
PLC
Group | | Barclays
Bank PLC
Group | | | | Barclays
PLC
Group | | Barclays
Bank PLC
Group |
Capital ratios | | % | | % | | | | % | | % | | | | % | | % |
Tier 1 ratio | | 7.7 | | 7.5 | | | | 7.0 | | 6.9 | | | | 7.6 | | 7.6 |
Risk asset ratio | | 11.7 | | 11.5 | | | | 11.3 | | 11.2 | | | | 11.5 | | 11.5 |
Risk weighted assets | | £m | | £m | | | | £m | | £m | | | | £m | | £m |
Banking book on-balance sheet | | 197,979 | | 197,979 | | | | 180,808 | | 180,808 | | | | 148,621 | | 148,621 |
off-balance sheet | | 33,821 | | 33,821 | | | | 31,351 | | 31,351 | | | | 26,741 | | 26,741 |
Associates and joint ventures | | 2,072 | | 2,072 | | | | 3,914 | | 3,914 | | | | 3,020 | | 3,020 |
Total banking book | | 233,872 | | 233,872 | | | | 216,073 | | 216,073 | | | | 178,382 | | 178,382 |
Trading book | | | | | | | | | | | | | | | | |
Market risks | | 30,291 | | 30,291 | | | | 23,216 | | 23,216 | | | | 22,106 | | 22,106 |
Counterparty and settlement risks | | 33,670 | | 33,670 | | | | 29,859 | | 29,859 | | | | 18,113 | | 18,113 |
Total trading book | | 63,961 | | 63,961 | | | | 53,075 | | 53,075 | | | | 40,219 | | 40,219 |
Total risk weighted assets | | 297,833 | | 297,833 | | | | 269,148 | | 269,148 | | | | 218,601 | | 218,601 |
At 31st December 2006, the Barclays PLC Group Tier 1 capital ratio was 7.7% and the Risk asset ratio was 11.7%. From 31st December 2005, total net capital resources rose £4.2bn and risk weighted assets increased £28.7bn.
Tier 1 capital rose £4.1bn, including £2.8bn arising from profits attributable to equity shareholders net of dividends paid. Minority interests within Tier 1 capital increased £1.3bn primarily due to the issuance of £1.2bn of Reserve Capital Instruments and £0.7bn of Preference Shares partially offset by a decrease in regulatory associates of £0.4bn driven by the sale of FirstCaribbean International Bank and exchange rate movements of £0.5bn. Tier 2 capital increased £0.7bn mainly as a result of the issuance of £1.5bn of loan capital partially offset by exchange rate movements of £0.6bn and redemptions of £0.4bn.
Similar movements are reflected in the risk weighted assets and total net capital resources of Barclays Bank PLC Group, however the retention by Barclays PLC of dividends paid by Barclays Bank PLC gave rise to a reduction in the capital of Barclays Bank PLC Group relative to that of Barclays PLC Group, resulting in Tier 1 and total capital ratios of 7.5% and 11.5% respectively.
The weakening of the Rand against Sterling had a positive impact on capital ratios in 2006.
Note
| (a) | Regulatory capital, risk weighted assets and resultant capital ratios for 2004 are based on UK GAAP and have not been restated as these remain as reported to the FSA. As at 1st January 2005, for Barclays PLC Group and Barclays Bank PLC Group the tier 1 ratio was 7.1% and the risk asset ratio was 11.8% reflecting the impact of IFRS including the adoption of IAS 32, IAS 39 and IFRS 4. |
| | |
Barclays PLC Annual Report 2006 | | 55 |
| |
Financial review
Capital resources
Total net capital resources
| | | | | | | | | | | | | | | | | | | | |
| | | IFRS | | | | | UK GAAP | |
| | | 2006 | | | 2005 | | | | | 2004(a) | |
| Capital resources (as defined for regulatory purposes) | | Barclays
PLC
Group
£m |
| | Barclays
Bank PLC
Group
£m |
| | Barclays
PLC
Group
£m |
| | Barclays
Bank PLC
Group
£m |
| | | | Barclays
PLC
Group
£m |
| | Barclays
Bank PLC
Group
£m |
|
Tier 1 | | | | | | | | | | | | | | | | | | | | |
Called up share capital | | 1,634 | | | 2,363 | | | 1,623 | | | 2,348 | | | | | 1,614 | | | 2,316 | |
Eligible reserves | | 19,608 | | | 21,700 | | | 16,837 | | | 18,646 | | | | | 15,670 | | | 15,656 | |
Minority interests | | 7,899 | | | 4,528 | | | 6,634 | | | 3,700 | | | | | 2,890 | | | 2,202 | |
Tier One Notes | | 909 | | | 909 | | | 981 | | | 981 | | | | | 920 | | | 920 | |
Less: Intangible assets | | (7,045 | ) | | (7,045 | ) | | (7,180 | ) | | (7,180 | ) | | | | (4,432 | ) | | (4,432 | ) |
| Total qualifying tier 1 capital | | 23,005 | | | 22,455 | | | 18,895 | | | 18,495 | | | | | 16,662 | | | 16,662 | |
Tier 2 | | | | | | | | | | | | | | | | | | | | |
Revaluation reserves | | 25 | | | 25 | | | 25 | | | 25 | | | | | 25 | | | 25 | |
Available for sale equity | | 221 | | | 221 | | | 223 | | | 223 | | | | | n/a | | | n/a | |
Collectively assessed impairment allowances | | 2,556 | | | 2,556 | | | 2,306 | | | 2,306 | | | | | n/a | | | n/a | |
General provisions | | n/a | | | n/a | | | n/a | | | n/a | | | | | 564 | | | 564 | |
Minority interests | | 451 | | | 451 | | | 515 | | | 515 | | | | | – | | | – | |
Qualifying subordinated liabilities | | | | | | | | | | | | | | | | | | | | |
Undated loan capital | | 3,180 | | | 3,180 | | | 3,212 | | | 3,212 | | | | | 3,573 | | | 3,573 | |
Dated loan capital | | 7,603 | | | 7,603 | | | 7,069 | | | 7,069 | | | | | 5,647 | | | 5,647 | |
Other | | – | | | – | | | – | | | – | | | | | 2 | | | 2 | |
| Total qualifying tier 2 capital | | 14,036 | | | 14,036 | | | 13,350 | | | 13,350 | | | | | 9,811 | | | 9,811 | |
| Tier 3: Short-term subordinated liabilities | | – | | | – | | | – | | | – | | | | | 286 | | | 286 | |
Less: Supervisory deductions | | | | | | | | | | | | | | | | | | | | |
Investments not consolidated for supervisory purposes | | (982 | ) | | (982 | ) | | (782 | ) | | (782 | ) | | | | (1,047 | ) | | (1,047 | ) |
Other deductions | | (1,348 | ) | | (1,348 | ) | | (961 | ) | | (961 | ) | | | | (496 | ) | | (496 | ) |
Total deductions | | (2,330 | ) | | (2,330 | ) | | (1,743 | ) | | (1,743 | ) | | | | (1,543 | ) | | (1,543 | ) |
| Total net capital resources | | 34,711 | | | 34,161 | | | 30,502 | | | 30,102 | | | | | 25,216 | | | 25,216 | |
The differences in the net capital resources of Barclays PLC Group and Barclays Bank PLC Group at 31st December 2006 and 31st December 2005 arise from the retention by Barclays PLC of dividends paid by Barclays Bank PLC.
Note
| (a) | Regulatory capital, risk weighted assets and resultant capital ratios for 2004 are based on UK GAAP and have not been restated as these remain as reported to the FSA. |
| | |
| 56 | | Barclays PLC Annual Report 2006 |
| |
Financial review
Deposits and short-term borrowings
Deposits
Deposits include deposits from banks and customers accounts.
| | | | | | |
| | | Average: year ended 31st December |
| | | 2006
£m | | 2005
£m | | 2004(a)
£m |
Deposits from banks | | | | | | |
| Customers in the United Kingdom | | 12,832 | | 9,703 | | 14,216 |
Customers outside the | | | | | | |
United Kingdom: | | | | | | |
Other European Union | | 30,116 | | 29,092 | | 51,656 |
United States | | 7,352 | | 8,670 | | 27,623 |
Africa | | 4,140 | | 3,236 | | 1,168 |
Rest of the World | | 35,013 | | 39,060 | | 38,969 |
| | | |
| Total deposits from banks | | 89,453 | | 89,761 | | 133,632 |
Customer accounts | | | | | | |
| Customers in the United Kingdom | | 173,767 | | 155,252 | | 140,486 |
Customers outside the | | | | | | |
United Kingdom: | | | | | | |
Other European Union | | 22,448 | | 20,773 | | 22,175 |
United States | | 17,661 | | 15,167 | | 38,818 |
Africa | | 23,560 | | 17,169 | | 5,068 |
Rest of the World | | 19,992 | | 16,911 | | 14,761 |
| | | |
Customer accounts | | 257,428 | | 225,272 | | 221,308 |
A further analysis of deposits from banks and customer accounts at 2006 is given in Note 26 and Note 27 to the accounts.
Note
| (a) | Does not reflect the application of IAS 32, IAS 39 and IFRS 4 which became effective from 1st January 2005. |
Short-term borrowings
Short-term borrowings include deposits by banks as reported in ‘Deposits’, Commercial paper and negotiable certificates of deposit.
Deposits from Banks
Deposits from banks are taken from a wide range of counterparties and generally have maturities of less than one year.
| | | | | | |
| | | 2006
£m | | 2005 £m | | 2004(a) £m |
Year-end balance | | 79,562 | | 75,127 | | 111,024 |
| Average balance | | 89,453 | | 89,761 | | 133,632 |
| Maximum balance | | 97,165 | | 103,397 | | 155,971 |
| Average interest rate during year | | 4.2% | | 2.6% | | 2.4% |
| Year-end interest rate | | 4.3% | | 3.6% | | 2.9% |
Commercial paper
Commercial paper is issued by the Group, mainly in the United States, generally in denominations of not less than US$100,000, with maturities of up to 270 days.
| | | | | | |
| | | 2006
£m | | 2005
£m | | 2004(a) £m |
Year-end balance | | 26,546 | | 28,275 | | 20,948 |
| Average balance | | 29,740 | | 22,309 | | 16,680 |
| Maximum balance | | 31,859 | | 28,598 | | 20,948 |
| Average interest rate during year | | 4.9% | | 3.4% | | 1.8% |
| Year-end interest rate | | 5.0% | | 4.5% | | 2.2% |
Negotiable certificates of deposit
Negotiable certificates of deposits are issued mainly in the UK and US, generally in denominations of not less than US$100,000.
| | | | | | |
| | | 2006
£m | | 2005
£m | | 2004(a) £m |
Year-end balance | | 52,800 | | 43,109 | | 37,213 |
| Average balance | | 49,327 | | 45,533 | | 35,409 |
| Maximum balance | | 60,914 | | 53,456 | | 44,934 |
| Average interest rate during year | | 5.1% | | 3.5% | | 2.2% |
| Year-end interest rate | | 5.1% | | 4.5% | | 2.8% |
| | |
Barclays PLC Annual Report 2006 | | 57 |
| |
Financial review
Securities
Securities
The following table analyses the book value of securities which are carried at fair value under IFRS for 2006 and 2005.
| | | | | | | | | | | | |
| | | IFRS | | UK GAAP |
| | | 2006 | | 2005 | | 2004 |
| | | Book value
£m | | Amortised
cost
£m | | Book value
£m | | Amortised
cost £m | | Book value
£m | | Valuation
£m |
Investment securities – available for sale | | | | | | | | | | | | |
Debt securities: | | | | | | | | | | | | |
United Kingdom government | | 758 | | 761 | | 31 | | 31 | | 18 | | 18 |
Other government | | 12,587 | | 12,735 | | 14,860 | | 14,827 | | 11,858 | | 12,051 |
Other public bodies | | 280 | | 277 | | 216 | | 216 | | 21 | | 21 |
Mortgage and asset backed securities | | 1,706 | | 1,706 | | 3,062 | | 3,062 | | 8,260 | | 8,234 |
Corporate issuers | | 27,089 | | 27,100 | | 25,590 | | 25,597 | | 17,029 | | 17,062 |
Other issuers | | 5,492 | | 5,450 | | 6,265 | | 6,257 | | 5,531 | | 5,549 |
Equity shares | | 1,371 | | 1,047 | | 1,250 | | 1,007 | | 526 | | 746 |
Investment securities – available for sale | | 49,283 | | 49,076 | | 51,274 | | 50,997 | | 43,243 | | 43,681 |
Other securities – held for trading | | | | | | | | | | | | |
Debt securities: | | | | | | | | | | | | |
United Kingdom government | | 4,986 | | n/a | | 4,786 | | n/a | | 2,567 | | 2,567 |
Other government | | 46,845 | | n/a | | 46,426 | | n/a | | 37,438 | | 37,438 |
Other mortgage and asset backed securities | | 17,032 | | n/a | | 10,290 | | n/a | | 8,177 | | 8,177 |
Bank and building society certificates of deposit | | 14,159 | | n/a | | 15,837 | | n/a | | 7,063 | | 7,063 |
Other issuers | | 57,554 | | n/a | | 51,028 | | n/a | | 32,349 | | 32,349 |
Equity shares | | 31,548 | | n/a | | 20,299 | | n/a | | 10,873 | | 10,873 |
Other securities – held for trading | | 172,124 | | n/a | | 148,666 | | n/a | | 98,467 | | 98,467 |
Investment debt securities include government securities held as part of the Group’s treasury management portfolio for asset and liability, liquidity and regulatory purposes and are for use on a continuing basis in the activities of the Group. In addition, the Group holds as investments listed and unlisted corporate securities. In 2004, under UK GAAP, investment securities were valued at cost, adjusted for the amortisation of premiums or discounts to redemption, less any provision for diminution in value.
Bank and building society certificates of deposit are freely negotiable and have original maturities of up to five years, but are typically held for shorter periods.
A further analysis of the book value and valuation of securities is given in Notes 12 and 18 to the accounts.
In addition to UK government securities shown above, at 31st December 2006, 2005 and 2004, the Group held the following government securities which exceeded 10% of shareholders’ equity.
| | | | | | |
| | | 2006 | | 2005 | | 2004 |
| | | Book value(a)
£m | | Book value(a)
£m | | Book value(a)
£m |
United States government securities | | 18,343 | | 16,093 | | 14,334 |
Japanese government securities | | 15,505 | | 14,560 | | 8,494 |
German government securities | | 4,741 | | 6,376 | | 6,215 |
French government securities | | 4,336 | | 4,822 | | 3,035 |
Italian government securities | | 3,419 | | 4,300 | | 6,900 |
Spanish government securities | | 2,859 | | 2,456 | | 2,597 |
Netherlands government securities | | 395 | | 2,791 | | 484 |
Maturities and yield of available for sale debt securities
| | | | | | | | | | | | | | | | | | | | |
| | | Maturing within
one year: | | Maturing after one but
within five years: | | Maturing after five but
within ten years: | | Maturing after
ten years: | | | | Total yield
% |
| | | Amount
£m | | Yield
% | | Amount
£m | | Yield % | | Amount
£m | | Yield % | | Amount
£m | | Yield
% | | Amount
£m | |
Government | | 2,664 | | 5.2 | | 4,792 | | 3.9 | | 4,855 | | 4.7 | | 1,034 | | 1.2 | | 13,345 | | 4.2 |
Other public bodies | | 256 | | 12.0 | | 14 | | 2.9 | | – | | – | | 10 | | 4.6 | | 280 | | 11.2 |
Other issuers | | 15,264 | | 4.9 | | 13,115 | | 4.2 | | 1,889 | | 5.1 | | 4,019 | | 3.7 | | 34,287 | | 4.5 |
Total book value | | 18,184 | | 5.1 | | 17,921 | | 4.1 | | 6,744 | | 4.8 | | 5,063 | | 3.2 | | 47,912 | | 4.5 |
The yield for each range of maturities is calculated by dividing the annualised interest income prevailing at 31st December 2006 by the fair value of securities held at that date.
Note
| (a) | The book value represents the fair value. |
| | |
| 58 | | Barclays PLC Annual Report 2006 |
| |
Financial review
Off-balance sheet arrangements
Off-balance sheet arrangements
In the ordinary course of business and primarily to facilitate client transactions, the Group enters into off-balance sheet arrangements. These arrangements include the provision of guarantees on behalf of the Group’s customers, retained interests in assets which have been transferred to an unconsolidated entity and obligations arising out of variable interests in an unconsolidated entity.
Guarantees
In the normal course of business, the Group issues guarantees on behalf of its customers. In the majority of cases, Barclays will hold collateral against the exposure, have a right of recourse to the customer or both. In addition, Barclays issues guarantees on its own behalf. The main types of guarantees provided are financial guarantees given to banks and financial institutions on behalf of customers to secure loans, overdrafts and other banking facilities, including stock borrowing indemnities and standby letters of credit. Other guarantees provided include performance guarantees, advance payment guarantees, tender guarantees, guarantees to Her Majesty’s Revenue and Customs and retention guarantees. Further details on these guarantees are provided in Note 60 (o) to the accounts.
Derivatives on own shares
During the period Barclays entered into a cash-settled total return swap referencing its own ordinary shares. This instrument provides a hedge against the employers’ national insurance liability arising on employee share schemes, where the eventual liability is determined by reference to the Barclays share price. As at 31st December, the notional of this derivative was 12.4 million shares and the fair value was £9.5m. Under IFRSs, cash flow hedge accounting has been applied when accounting for the gains and losses arising on this derivative.
Special purpose and variable interest entities
The off-balance sheet arrangements entered into by the Group typically involve the use of special purpose entities (SPEs) as defined under SIC 12 and variable interest entities (VIEs) under FIN 46-R. These are entities that are set up for a specific purpose and generally would not enter into an operating activity nor have any employees. The most common form of SPE involves the acquisition of financial assets that are funded by the issuance of securities to external investors, which have cash flows different from those of the underlying instruments. The repayment of these securities is determined by the performance of the assets acquired by the SPE. These entities form an integral part of many financial markets, and are important to the development of the securitisation markets and functioning of the US commercial paper market. The accounting treatment under IFRSs and US GAAP is summarised in Note 60 on page 247, with further information on the US GAAP treatment provided in Note 60 (m) on pages 264 and 265.
Credit structuring business
The Group structures investments with specific risk profiles which are attractive to investors. This business involves the sale by the Group of credit exposures based on an underlying portfolio of assets into SPEs, often using credit derivative contracts. The assets are funded by issuing securities with varying terms. The Group may also provide other financial services, which include the provision of liquidity or contingent liquidity facilities, act as derivatives counterparty as well as the purchasing and warehousing of securities until they are sold to the SPE. The commitments to provide liquidity to these SPEs is a maximum of £6.4bn (2005: £1.1bn).
Asset securitisations
The Group assists companies with the formation of asset securitisations. These entities have minimal equity and rely on funding in the form of notes to purchase the assets for securitisation. The Group provides financing in the form of senior notes and/or junior notes and may also provide derivatives to the SPE.
The Group has also used SPEs to securitise part of its originated and purchased retail and commercial lending portfolios and credit card receivables. Under US GAAP, where the Group has sold the assets to a Qualifying SPE (QSPE), the QSPE is not consolidated by the Group. This resulted in the derecognition of assets of £5,359m as at 31st December 2006 (2005: £6,953m) under US GAAP. Following the sale of these assets to the securitisation vehicles, the Group may retain servicing rights and an interest in the residual income of the SPEs. Under IFRS, the SPEs are consolidated where the Group is exposed to the majority of the risks and rewards of the transaction. Further details are included in Note 60 (n) to the accounts.
Client intermediation
The Group is involved in structuring transactions as a financial intermediary to meet investor and client needs. These transactions involve entities structured by either the Group or the client and they are used to modify cash flows of third-party assets to create investments with specific risk or return profiles or to assist clients in the efficient management of other risks. The Group also invests in lessor entities specifically to acquire assets for leasing. Client intermediation also includes arrangements to fund the purchase or construction of specific assets (most common in the property industry). Certain entities that are consolidated in accordance with IAS 27 and SIC 12 under IFRS are deconsolidated under US GAAP where the Group is not the primary beneficiary. The impact on the Group’s total assets under US GAAP is an increase of £5,920m (2005: reduction of £327m).
Fund management
The Group provides asset management services to a large number of investment entities on an arms-length basis and at market terms and prices. The majority of these entities are investment funds that are owned by a large and diversified number of investors. These funds are not consolidated under either IFRS or US GAAP because the Group does not own either a significant portion of the equity, or the risks and rewards inherent in the assets.
| | |
Barclays PLC Annual Report 2006 | | 59 |
| |
Risk factors
Risk factors
The following discussion sets forth certain risk factors that the Group believes could cause its actual future results to differ materially from expected results. However, other factors could also adversely affect the Group results and so the factors discussed in this report should not be considered to be a complete set of all potential risks and uncertainties.
Business conditions and general economy
The profitability of Barclays businesses could be adversely affected by a worsening of general economic conditions in the United Kingdom, globally or in certain individual markets such as the US or South Africa. Factors such as interest rates, inflation, investor sentiment, the availability and cost of credit, the liquidity of the global financial markets and the level and volatility of equity prices could significantly affect the activity level of customers, for example:
| · | | An economic downturn or significantly higher interest rates could adversely affect the credit quality of Barclays on-balance sheet and off-balance sheet assets by increasing the risk that a greater number of Barclays customers would be unable to meet their obligations. |
| · | | A market downturn or worsening of the economy could cause the Group to incur mark to market losses in its trading portfolios. |
| · | | A market downturn could reduce the fees Barclays earns for managing assets. For example, a higher level of domestic or foreign interest rates or a downturn in trading markets could affect the flows of assets under management; and |
| · | | A market downturn would be likely to lead to a decline in the volume of transactions that Barclays executes for its customers and, therefore, lead to a decline in the income it receives from fees and commissions and interest. |
Credit risk
Credit risk is the risk of suffering financial loss, should any of the Group’s customers, clients or market counterparties fail to fulfil their contractual obligations to the Group. Credit risk may also arise where the downgrading of an entity’s credit rating causes the fair value of the Group’s investment in that entity’s financial instruments to fall. The credit risk that the Group faces arises mainly from commercial and consumer loans and advances, including credit card lending.
Furthermore, credit risk is manifested as country risk where difficulties may arise; in the country in which the exposure is domiciled thus impeding or reducing the value of the asset; or where the counterparty may be the country itself.
Settlement risk is another form of credit risk and is the possibility that the Group may pay a counterparty – for example, a bank in a foreign exchange transaction – but fail to receive the corresponding settlement in return.
Market risk
The most significant market risks the Group faces are interest rate, credit spread, foreign exchange, commodity price and equity price risks. Changes in interest rate levels, yield curves and spreads may affect the interest rate margin realised between lending income and borrowing costs. Changes in currency rates, particularly in the Sterling-US Dollar, Sterling-Euro and Sterling-Rand exchange rates, affect the value of assets and liabilities denominated in foreign currencies and affect earnings reported by the Group’s non-UK subsidiaries and may affect revenues from foreign exchange dealing. The performance of financial markets may cause changes in the value of the Group’s investment and trading portfolios and in the amount of revenues generated from assets under management. The Group has implemented risk management methods to mitigate and control these and other market risks to which it is exposed. However, it is difficult to predict with accuracy changes in economic or market conditions and to anticipate the effects that such changes could have on the Group’s financial performance, business operations and the value of assets held in the Group’s pension and long-term assurance funds.
Capital risk
Capital risk is the risk that the Group has insufficient capital resources to:
| · | | Meet minimum regulatory capital requirements in the UK and in other markets such as the US and South Africa where regulated activities are undertaken. The Group’s authority to operate as a bank is dependent upon the maintenance of adequate capital resources. |
| · | | Support its strong credit rating. In addition to capital resources, the Group’s rating is supported by a diverse portfolio of activities, an increasingly international presence, consistent profit performance, prudent risk management and a focus on value creation. A weaker credit rating would increase the Group’s cost of funds; and |
| · | | Support its growth and strategic options. |
The Group’s capital management activities seek to maximise shareholder value by optimising the level and mix of its capital resources. Capital risk is mitigated by:
| · | | ensuring access to a broad range of investor markets; |
| · | | management of the Group’s demand for capital; and |
| · | | management of the exposure to foreign currency exchange rate movements. |
Liquidity risk
This is the risk that the Group is unable to meet its obligations when they fall due and to replace funds when they are withdrawn, with consequent failure to repay depositors and fulfil commitments to lend.
The risk that it will be unable to do so is inherent in all banking operations and can be impacted by a range of institution specific and market-wide events including, but not limited to, credit events, merger and acquisition activity, systemic shocks and natural disasters.
Operational risks
The Group’s businesses are dependent on the ability to process a large number of transactions efficiently and accurately. Operational risks and losses can result from fraud, employee errors, failure to properly document transactions or to obtain proper internal authorisation, failure to comply with regulatory requirements and conduct of business rules, equipment failures, natural disasters or the failure of external systems (see page 86 for a detailed list). Although the Group has implemented risk controls and loss mitigation actions, and substantial resources are devoted to developing efficient procedures and to staff training, it is only possible to be reasonably, but not absolutely, certain that such procedures will be effective in controlling each of the operational risks faced by the Group.
Insurance risk
Insurance risk is the risk that the Group will have to make higher than anticipated payments to settle claims arising from its long-term and short-term insurance businesses.
Legal risk
The Group is subject to a comprehensive range of legal obligations in all countries in which it operates. As a result, the Group is exposed to many forms of legal risk, which may arise in a number of ways. Primarily:
| · | | the Group’s business may not be conducted in accordance with applicable laws around the world; |
| · | | contractual obligations may either not be enforceable as intended or may be enforced against the Group in an adverse way; |
| · | | the intellectual property of the Group (such as its trade names) may not be adequately protected; and |
| · | | the Group may be liable for damages to third parties harmed by the conduct of its business. |
The Group faces risk where legal proceedings are brought against it. Regardless of whether such claims have merit, the outcome of legal proceedings is inherently uncertain and could result in financial loss.
| | |
| 60 | | Barclays PLC Annual Report 2006 |
| |
Defending legal proceedings can be expensive and time-consuming and there is no guarantee that all costs incurred will be recovered even if the Group is successful. Although the Group has processes and controls to manage legal risks, failure to manage these risks could impact the Group adversely, both financially and by reputation.
Tax risk
The Group is subject to the tax laws in all countries in which it operates. A number of double taxation agreements entered between countries also impact on the taxation of the Group. The Group is also subject to European Community tax law.
Tax risk is the risk associated with changes in tax law or in the interpretation of tax law. It also includes the risk of changes in tax rates and the risk of failure to comply with procedures required by tax authorities. Failure to manage tax risks could lead to an additional tax charge. It could also lead to a financial penalty for failure to comply with required tax procedures or other aspects of tax law. If, as a result of a particular tax risk materialising, the tax costs associated with particular transactions are greater than anticipated, it could affect the profitability of those transactions.
Effect of governmental policy and regulation
The Group’s businesses and earnings can be affected by the fiscal or other policies and other actions of various governmental and regulatory authorities in the UK, the European Union (EU), the US, South Africa and elsewhere.
There is continuing political and regulatory scrutiny of the operation of the retail banking and consumer credit industries in the UK and elsewhere. The nature and impact of future changes in policies and regulatory action are not predictable and beyond the Group’s control but could have an impact on the Group’s businesses and earnings.
In the EU as a whole, these regulatory actions included an inquiry into retail banking in all of the then 25 Member States by the European Commission’s Directorate General for Competition. The inquiry looked at retail banking in Europe generally and the Group has fully co-operated with the inquiry. On 31st January 2007 the European Commission announced that the inquiry had identified barriers to competition in certain areas of retail banking, payment cards and payment systems in the EU. The Commission indicated it will use its powers to address these barriers, and will encourage national competition authorities to enforce European and national competition laws where appropriate. Any action taken by the Commission and national competition authorities could have an impact on the payment cards and payment systems businesses of the Group and on its retail banking activities in the EU countries in which it operates.
In the UK, in September 2005 the Office of Fair Trading (OFT) received a super-complaint from the Citizens Advice Bureau relating to payment protection insurance (PPI). As a result, the OFT commenced a market study on PPI in April 2006. In October 2006, the OFT announced the outcome of the market study and, following a period of consultation, the OFT referred the PPI market to the UK Competition Commission for an in-depth inquiry on 7th February 2007. This inquiry could last for up to two years. Also in October 2006, the Financial Services Authority (FSA) published the outcome of its broad industry thematic review of PPI sales practices in which it concluded that some firms fail to treat customers fairly. The Group has cooperated fully with these investigations and will continue to do so.
In April 2006, the OFT commenced a review of the undertakings given following the conclusion of the Competition Commission Inquiry in 2002 into the supply of banking services to Small and Medium Enterprises (SMEs). The Group is cooperating fully with that review.
The OFT has carried out investigations into Visa and MasterCard credit card interchange rates. The decision by the OFT in the MasterCard interchange case was set aside by the Competition Appeals Tribunal in June 2006. The OFT’s investigation in the Visa interchange case is at an earlier stage and a second MasterCard interchange case is ongoing. The outcome is not known but these investigations may have an impact on the consumer credit industry in general and therefore on the Group’s business in this sector. On 9th February 2007 the OFT announced that it was expanding its investigation into interchange rates to include debit cards.
The OFT announced the findings of its investigation into the level of late and over-limit fees on credit cards on 5th April 2006, requiring a response from credit card companies by 31st May 2006. Barclaycard responded by confirming that it would reduce its late and over-limit fees on credit cards from 1st August 2006.
On 7th September 2006, the OFT announced that it had decided to undertake a fact find on the application of its statement on credit card fees to current account unauthorised overdraft fees. The OFT expects this work to take up to six months, at which stage the OFT will consider whether a further detailed investigation into unauthorised overdraft fees is needed.
On 26th January 2007, the FSA issued a Statement of Good Practice relating to Mortgage Exit Administration Fees. Barclays will charge the fee applicable at the time the customer took out the mortgage, which is one of the options recommended by the FSA.
Other areas where changes could have an impact include:
| · | | the monetary, interest rate and other policies of central banks and regulatory authorities; |
| · | | general changes in government or regulatory policy that may significantly influence investor decisions in particular markets in which the Group operates; |
| · | | general changes in the regulatory requirements, for example, prudential rules relating to the capital adequacy framework (page 55); |
| · | | changes in competition and pricing environments; |
| · | | further developments in the financial reporting environment; |
| · | | expropriation, nationalisation, confiscation of assets and changes in legislation relating to foreign ownership; and |
| · | | other unfavourable political, military or diplomatic developments producing social instability or legal uncertainty which in turn may affect demand for the Group’s products and services. |
Impact of strategic decisions taken by the Group
The Group devotes substantial management and planning resources to the development of strategic plans for organic growth and identification of possible acquisitions, supported by substantial expenditure to generate growth in customer business. If these strategic plans do not deliver as anticipated, the Group’s earnings could grow more slowly or decline.
Competition
The global financial services markets in which the Group operates are highly competitive. Innovative competition for corporate, institutional and retail clients and customers comes both from incumbent players and a steady stream of new market entrants. The landscape is expected to remain highly competitive in all areas, which could adversely affect the Group’s profitability if the Group fails to retain and attract clients and customers.
Impact of external factors on the Group and peer group
The Group’s primary performance goal is to achieve top quartile Total Shareholder Return performance for 2004 to 2007 (inclusive) against a group of peer financial institutions. This goal assumes that external factors will impact all peer group entities similarly. The Group’s ability
| | |
Barclays PLC Annual Report 2006 | | 61 |
| |
Risk factors
to achieve the goal will be significantly impacted if the Group is disproportionately impacted by negative external factors. Even if the Group performs well, if others perform better or the market believes others have performed better, we may not achieve our goal.
Additionally some peers are listed on exchanges other than the London Stock Exchange and so may react to differing external factors. Barclays devotes considerable resources and expertise to managing the risks to which it is exposed. Our risk management is described in the following pages (pages 63 to 103). Please also refer to the cautionary statement concerning forward-looking statements on the inside of the front cover in conjunction with this section.
Regulatory compliance risk
Regulatory compliance risk arises from a failure or inability to comply fully with the laws, regulations or codes applicable specifically to the financial services industry. Non compliance could lead to fines, public reprimands, damage to reputation, enforced suspension of operations or, in extreme cases, withdrawal of authorisations to operate.
Supervision and regulation
The Group’s operations, including its overseas offices, subsidiaries and associates, are subject to rules and regulations, including reserve and reporting requirements and conduct of business requirements, imposed by the relevant central banks and regulatory authorities.
In the UK, the Financial Services Authority (FSA) is the independent body responsible for the regulation of deposit taking, life insurance, home mortgages, general insurance and investment business. The FSA was established by the Government and it exercises statutory powers under the Financial Services and Markets Act 2000.
Barclays Bank PLC is authorised by the FSA to carry on a range of regulated activities within the UK and is subject to consolidated supervision. In its role as supervisor, the FSA seeks to ensure the safety and soundness of financial institutions with the aim of strengthening, but not guaranteeing, the protection of customers. The FSA’s continuing supervision of financial institutions authorised by it is conducted through a variety of regulatory tools, including the collection of information from statistical and prudential returns, reports obtained from skilled persons, visits to firms and regular meetings with management to discuss issues such as performance, risk management and strategy.
The FSA adopts a risk-based approach to supervision. The starting point for supervision of all financial institutions is a systematic analysis of the risk profile for each authorised firm. The FSA has adopted a homogeneous risk, processes and resourcing model in its approach to its supervisory responsibilities (known as the ARROW model) and the results of the risk assessment are used by the FSA to develop a risk mitigation programme for a firm. The FSA also promulgates requirements that banks and other financial institutions are required to meet on matters such as capital adequacy (see capital ratios on page 55), limits on large exposures to individual entities and groups of closely connected entities, and liquidity. Certain of these requirements derive from EU directives as described below.
Banks, insurance companies and other financial institutions in the UK are subject to a single financial services compensation scheme (the Financial Services Compensation Scheme) where an authorised firm is unable or is likely to be unable to meet claims made against it because of its financial circumstances. Different levels of compensation are available to eligible claimants depending upon whether the protected claim is in relation to a deposit, a contract of insurance or protected investment business and certain types of claims are subject to maximum levels of compensation. Most deposits made with branches of Barclays Bank PLC within the European Economic Area (EEA) which are denominated in Sterling or other EEA currencies (including the euro) are covered by the Scheme. Most claims made in respect of designated investment business will also be protected claims if the business was carried on from the UK or from a branch of the bank or investment firm in another EEA member state.
Outside the UK, the Group has operations (and main regulators) located in continental Europe, in particular France, Germany, Spain, Switzerland, Portugal and Italy (local central banks and other regulatory authorities); Asia Pacific (various regulatory authorities including the Hong Kong Monetary Authority, the Financial Services Agency of Japan, the Australian Securities and Investments Commission and the Monetary Authority of Singapore); Africa (various regulatory authorities including the South African Reserve Bank and the Financial Services Board) and the United States of America (the Board of Governors of the Federal Reserve System (FRB), the Office of the Comptroller of the Currency (OCC) and the Securities and Exchange Commission).
In Europe, the UK regulatory agenda is considerably shaped and influenced by the directives emanating from the EU. A number of EU directives are currently being implemented, for example the Capital Requirements Directive, the Third Money Laundering Directive and the Markets in Financial Instruments Directive (‘MiFID’). These form part of the European Single Market programme, an important feature of which is the framework for the regulation of authorised firms. This framework is designed to enable a credit institution or investment firm authorised in one EU member state to conduct banking or investment business through the establishment of branches or by the provision of services on a cross-border basis in other member states without the need for local authorisation. Barclays operations in Europe are authorised and regulated by a combination of both home (the FSA) and host regulators.
Barclays operations in South Africa, including Absa Group Limited, are supervised and regulated by the South African Reserve Bank (SARB) and the Financial Services Board (FSB). SARB oversees the banking industry and follows a risk-based approach to supervision whilst the FSB oversees the non-banking financial services industry and focuses on enhancing consumer protection and regulating market conduct.
In the United States, Barclays PLC, Barclays Bank PLC, and certain US subsidiaries and branches of the Bank are subject to a comprehensive regulatory structure involving numerous statutes, rules and regulations. Barclays branch operations in New York and Florida are licensed by, and subject to regulation and examination by, their respective licensing authorities, the New York State Banking Department and the Florida Office of Financial Regulation. Barclays Global Investors, NA is a federally-chartered trust company subject to regulation and examination by OCC. Barclays Bank Delaware is subject to regulation and examination by the Federal Deposit Insurance Corporation and the Delaware State Banking Commissioner. In addition, the FRB is the primary US federal regulator for the New York and Florida branch operations and also exercises regulatory authority over Barclays other US operations. The regulation of Barclays US branches and subsidiaries imposes restrictions on the activities of those branches and subsidiaries.
In addition to the direct regulation of Barclays US banking offices, Barclays US operations subject Barclays to regulation by the FRB under various laws, including the International Banking Act of 1978 and the Bank Holding Company Act of 1956 (BHC Act). Barclays PLC, Barclays Bank PLC and Barclays Group US Inc. are bank holding companies registered with the FRB as well as financial holding companies under the BHC Act. Financial holding companies may engage in a broader range of financial and related activities than are permitted to banking organizations that do not maintain financial holding company status, including underwriting and dealing in all types of securities. To maintain the financial holding company status of each of Barclays PLC, Barclays Bank PLC and Barclays Group US Inc., Barclays Bank PLC is required to meet or exceed certain capital ratios and to be deemed to be “well managed”. Barclays Bank Delaware must also meet certain capital requirements, be deemed to be “well managed” and must have at least a “satisfactory” rating under the Community Reinvestment Act of 1977.
A major focus of US governmental policy relating to financial institutions in recent years has been combating money laundering and terrorist financing and enforcing compliance with US economic sanctions. Regulations applicable to US operations of Barclays Bank PLC and its subsidiaries impose obligations to maintain appropriate policies, procedures and controls to detect, prevent and report money laundering and terrorist financing and to ensure compliance with US economic sanctions against designated foreign countries, nationals and others. Failure of a financial institution to maintain and implement adequate programmes to combat money laundering and terrorist financing or to ensure economic sanction compliance could have serious legal and reputational consequences for the institution.
Another recent focus of US governmental policy relating to the financial services sector generally has been on disclosure and sales practices relating to the sector’s subprime mortgage and other lending.
Barclays investment banking operations are subject to regulations that cover all aspects of the securities business, including:
| | – | Trade practices among broker-dealers |
| | – | The financing of customers’ purchases |
| | – | Procedures for compliance with US securities law |
Barclays Capital Inc. and the other subsidiaries that conduct these operations are regulated by a number of different government agencies and self-regulatory organizations, including the Securities and Exchange Commission and the NASD. These regulators have available a variety of sanctions, including the authority to conduct administrative proceedings that can result in censure, fines, the issuance of cease-and-desist orders or the suspension or expulsion of the entity or its directors, officers or employees. The SEC staff has informed Barclays that it is considering recommending a civil enforcement action in federal court against Barclays for violations of the US federal securities laws in connection with trading activity between 2002 and 2003 by a proprietary trading desk at Barclays while desk personnel were serving on various bankruptcy committees. Barclays independently addressed the practices, policies and procedures at issue in 2003, prior to the commencement of the SEC investigation, and none of the employees engaged in such trading activity is currently employed by Barclays. Barclays has cooperated with the SEC staff during its investigation and is in ongoing negotiations with the staff to resolve the matter. Barclays does not expect that the amount of any settlement with the SEC would have a significant adverse effect on Barclays financial position or operating results.
Barclays subsidiaries in the US are also subject to regulation by applicable federal and state regulators of their activities in the asset management, investment advisory, mutual fund and mortgage lending businesses.
| | |
| 62 | | Barclays PLC Annual Report 2006 |
| |
| | |
Barclays PLC Annual Report 2006 | | 63 |
| |
Risk management
Introduction
Barclays approach to risk management
Risk management is a fundamental part of Barclays business activity and an essential component of its planning process. This is achieved by keeping risk management at the centre of the executive agenda and by building a culture in which risk management is embedded in the everyday management of the business. Barclays ensures that it has the functional capability to manage the risk in new and existing businesses, and that business plans are consistent with risk appetite.
Risk appetite is the level of risk that Barclays is willing to accept in fulfilling business objectives. To determine this acceptable level of risk, potential earnings volatility against financial objectives are considered first. As part of the planning process, management estimates the potential earnings volatility from different businesses under various scenarios. Barclays estimates the capacity to absorb unexpected losses in terms of the tolerable level of variance from financial targets, by considering the ability to support business growth, desired dividend payout levels and capital ratio targets. If the projections entail too high a level of risk, management will challenge each area to find new ways to rebalance the business mix to incur less risk on a diversified basis. Barclays believes that this enables it to improve risk and return characteristics across the business and help meet growth targets within an overall risk appetite.
Across Barclays, every business manager is accountable for managing risk in his or her business area; they must understand and control the key risks inherent in the business undertaken. Each business area also employs risk specialists to provide an independent control function and to support the development of a strong risk management environment. This functional approach to risk management is built on formal control processes that rely on individual responsibility and independent oversight, as well as challenge through peer reviews. Barclays continues to use and develop advanced analysis, with comprehensive reporting of risk positions against their key risk factors and against risk appetite. To support expanded risk taking, Barclays has continued to strengthen the independent and specialised risk teams in each of its businesses, supported by matching teams at Group level, acting in both a consultancy and oversight capacity. It has made the recruitment, development and retention of risk professionals a priority because it is believed that it is a prerequisite to business growth plans. Barclays also continues to make significant investment in the infrastructure to identify, measure and report risk positions.
Barclays remains committed to the objective of increasing shareholder value by developing and growing business that is consistent with risk appetite, and through building more effective risk management capabilities. Responsibility for risk management resides at all levels within the Group, from the Executive down through the organisation to each business manager and risk specialist. We are seeking an appropriate balance in our business, and continuing to build the risk management capabilities that will help us to deliver our growth plans in a controlled environment.
2006 developments
In broad terms, Risk Appetite increased by about 20% during 2006, in conjunction with increased and more diversified earnings and a continued strong capital base. Barclays will continue to deploy this expanded appetite across many businesses and risk types. During 2006 it expanded the range and level of credit risk it runs across geographies and products, and this will continue as part of its developing business plans. Traded market risk levels grew at a slower level than trading revenues; these and the other risk types are addressed below.
The risk environment in 2006 had very different characteristics across the risk types, with continued benign conditions in wholesale and
corporate credit risk, a continued difficult environment in the UK unsecured retail credit sector, stable operational risk, and periods of moderate volatility in some areas of market risk. The UK unsecured retail credit market experienced a continuation of recent trends, arising from a high level of household debt and continued strain on the discretionary cash flow in some parts of the retail customer population. Higher interest rates, energy costs and some higher taxation have put strain on UK consumer portfolios, which has been exacerbated by increasing levels of personal bankruptcy and Individual Voluntary Arrangements. This deterioration in consumer credit quality, coupled with the changing social attitudes to bankruptcy and debt default in general, contributed to a higher impairment charge in our UK credit card and unsecured loan portfolios.
Notwithstanding the difficult conditions in the UK credit environment, Barclays experience shows that the actions taken in Barclaycard, including revised underwriting rules, tighter limit assignment and line management, and improved collections have had a positive effect. The quality of new accounts, as measured by average credit scores, has consistently improved since 2005, while in our UK cards and unsecured loan portfolios the flows into early stage and later cycle delinquency as well as arrears balances decreased in the second half of 2006.
Barclays has been alert to contagion from the retail sector influencing the Local Business portfolio and although increasing credit delinquency has been anticipated and experienced, management actions have been taken to mitigate the impact. Conditions in this area have been more directly affected by the conditions prevailing in the retail market, especially those sectors closer to the consumer. All of these businesses are dependent on the UK economy and it is expected that the outlook for economic growth in 2007 will be similar to that experienced in 2006.
Some important changes to the retail risk profile in 2006 were volume related. In the UK, the size of the card portfolio reduced as a result of the management actions in Barclaycard outlined above, while international activities in the USA, Europe and South Africa expanded.
Looking outside the UK, Barclaycard US has been growing its card portfolio and Absa also operated in a growing market in South Africa. The business model explicitly includes the benefits of risk diversification of new products with new clients and in new geographies. Risk diversification was therefore a significant factor in the decision to acquire a majority stake in Absa in 2005, which provided strong earnings in 2006 that are less correlated to the core UK business. The same is true for Barclaycard US and the other areas of international growth within existing businesses, such as Barclays Capital and BGI.
The credit environment in the larger corporate and wholesale sector continued to benefit from relatively stable conditions, although there was some evidence of slightly increasing corporate defaults. Overall global credit conditions, based on economic growth, low inflation and rising stock markets, have led to a very competitive market and credit spreads are still at very low levels in most markets. Borrower quality has remained good across the capital market corporate sector. There has been continued market demand for credit assets resulting from strong financial industry liquidity, which has been important in maintaining the strong corporate credit environment.
Investors in the leveraged finance market displayed a continued strong demand for assets in 2006. With so much liquidity in the market, transaction leverage multiples have risen, maturities have lengthened and amounts financed have increased. Barclays remained focused on the structure of such deals and it declines transactions that are beyond its appetite. It runs a distribution-led leveraged finance business in Barclays Capital and has a strong track record of selling down underwriting positions rather than holding larger positions in the credit portfolio, and it is alert to any slowdown in the distribution performance of the syndication markets. In the UK market for smaller transactions, it has also maintained caps on risk positions in this business during 2006.
| | |
| 64 | | Barclays PLC Annual Report 2006 |
| |
Barclays is also focused on the UK commercial property lending market, where property yields in 2006 declined as financing costs have risen. As a result, there has been further constriction of the available cash flow margin to support higher valuations and increased debt levels. Barclays therefore has increased hold levels and while the business has expanded, none of the caps governing exposure in this sector has been increased.
Overall, the contrast in credit conditions in the retail and wholesale markets is reflected in the different trends of principal metrics. While Risk Tendency and Non-Performing Loan balances both rose in the retail sector, they fell or held steady in the wholesale portfolios.
The market risk environment in 2006 offered clients the opportunity to benefit from market movements in a controlled manner through their own risk management activities. Although Barclays Capital ran higher levels of market risk as measured by daily value at risk (DVaR), this was in line with Risk Appetite and the growth in trading revenues more than kept pace with rising DVaR. The two principal areas where the risk profile at Barclays Capital altered were commodities and interest rates. The commodities business saw an increase in client demand for structured products and risk management solutions, which led to a strong trading performance in Barclays Capital and an increase in risk positions arising from client business needs. In contrast, interest rate markets were quieter, leading to a smaller requirement from clients to hold such market risk positions on the books.
Market risks outside Barclays Capital, which mainly include interest rate exposures within the various banking books and some Treasury risks, remained very modest, consistent with the Group’s policy of hedging these positions to a material degree.
Barclays defined benefit pension risks are also closely monitored. The actuarial funding surplus of the UK pension scheme improved on the back of strong asset returns and contributions from Barclays. These factors, together with several market developments that led to adjustments in accounting assumptions, also drove a reduction in the IAS 19 deficit.
The challenges in operational risk management arise from the strong growth in the transaction volumes contained within the business plans and from the increasing internationalisation of operations. However, Barclays has been successful in reducing the level of operational risk through improving key end-to-end processes and increasing their resilience and capacity to sustain the increasing demands of higher business volumes.
Internet banking was an important focus of financial crime risk management in 2006, with increasing numbers of fraud attacks in the first quarter. These occurred through both attempted identity thefts (‘phishing’) and the placing of electronic devices in systems to extract personal data (‘trojans’). Such attempts are becoming more sophisticated in nature but Barclays was able to stem and then reverse the growth in net losses through the aggressive deployment of additional controls, supported by extra resources within fraud operations. The improved capacity for early detection of compromised accounts meant that a recrudescence of fraud attacks later in the year did not lead to any increase in losses.
In 2006 Barclays continued to strengthen its anti-money laundering activities, to enhance the Group’s financial sanctions screening capability and to implement more robust controls. These measures enable it to comply with the ever more complex demands of the international regulatory environment and to resist increasingly sophisticated criminal operations. As such, Barclays believes that it has further improved the management of financial crime risk globally, an integral part of protecting its reputation and brand.
Basel II
The implementation of the new Basel II regulatory requirements is the principal area of regulatory change ahead for the risk management area. The main purpose of this is to promote a more sophisticated capital assessment and risk management framework for the international banking industry.
In October 2006 Barclays formally applied to the FSA to adopt the advanced approaches for both Credit and Operational risk from 1st January 2008, and the FSA is expected to provide its decision by 30th June 2007. A positive consequence of the advanced approaches is closer alignment between internal economic capital and regulatory capital measures and processes, thus helping Barclays to manage its capital ratios more effectively over time.
The successful implementation of the Basel II requirements has required some data, model, and system changes in many of Barclays businesses. The investment it has made in this area is part of the business strategy to ensure that Barclays continues to be at the leading edge of risk management and, as such, it continues to believe that achieving advanced status is appropriate and realistic.
The Group commenced the parallel run process required to adopt Basel II at the end of 2006. During 2007, the results of the parallel run of the Group’s Basel II models will be an important consideration in the management of its capital resources. A further requirement of Basel II is enhanced market disclosure and to support this, Barclays is moving towards an improved reporting capability.
| | |
Barclays PLC Annual Report 2006 | | 65 |
| |
Risk management
Risk management and control – overview
Governance Structure at Group Level

In addition to the Committees shown in the chart, there is a Brand and Reputation Committee reviewing emerging issues with potentially significant reputational impact.
These Committees receive regular and comprehensive reports. The Board Risk Committee receives a quarterly report covering all of our principal risks. The Board Audit Committee receives quarterly reports on control issues of significance and half-yearly impairment allowances and regulatory reports. Both Committees also receive reports dealing in more depth with specific issues relevant at the time. The proceedings of both Committees are reported to the full Board, which also receives a concise quarterly risk report. Internal Audit supports both Committees by
attendance and/or the provision of quarterly reports resulting from its work on governance, risk and control issues of significance. The Board
Audit Committee reviews and approves Internal Audit’s plans and resources, and evaluates the effectiveness of Internal Audit. An assessment by external advisers is also carried out periodically.
Under Basel II, Barclays aims to achieve advanced status under credit and operational risks. Barclays considers that the investment required to attain this status is warranted by the internal risk management improvements that will follow, the reputational benefits and the potential for greater capital efficiency.
| | |
| 66 | | Barclays PLC Annual Report 2006 |
| |
Risk management – overview
Risk responsibilities
The Board approves Risk Appetite and the Board Risk Committee monitors the Group’s risk profile against this appetite.
| · | | Business Heads are responsible for the identification and management of risk in their businesses. |
| · | | The Risk Director, under delegated authority from the Group Chief Executive and Group Finance Director, has responsibility for ensuring effective risk management and control. |
| · | | Each business has an embedded risk management team reporting to a Business Risk Director or Chief Credit Officer who reports to the Risk Director. The risk management teams assist Group Risk in the formulation of Group Risk policy and the implementation of it across the businesses. |
| · | | Risk-Type Heads and their teams are responsible for establishing a risk control framework and risk oversight. |
| · | | Business risk teams, each under the management of a Business Risk Director, are responsible for assisting Business Heads in the identification and management of their business risk profiles and for implementing appropriate controls. |
| · | | Internal Audit is responsible for the independent review of risk management and the control environment. |
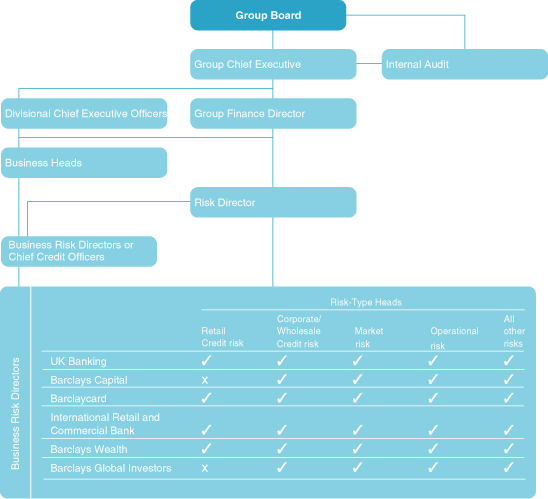
| | |
Barclays PLC Annual Report 2006 | | 67 |
| |
Risk management
Risk management – overview
The internal control framework at Barclays is aligned with the internationally accepted standard Internal Control – Integrated Framework published by the Committee of Sponsoring Organisations of the Treadway Commission (COSO). The Group’s principal risk categories (set out below) are the subject of Board approved risk control requirements.
Credit
Market
Capital
Liquidity
Operational risks and business risks, comprising:
– Financial Reporting, Taxation and Budgeting
– Brand Management
– Change
– Corporate Responsibility
– People
– Regulatory Compliance
– Financial Crime
– Strategic
– Technology
– Legal
– Operations
Detailed discussion of our risk management of credit, market, capital, liquidity, operational and business risks follows, starting with credit risk on page 72. In addition there is also discussion on insurance risk, disclosure about certain trading activities and derivatives.
Risk management
The pages that follow describe how Barclays conducts risk management, including the key risk concepts it uses and how it manages specific types of risk.
To ensure the Group maintains effective governance and control over its risk management processes, Group Risk sets policies and standards for each risk type. Group Risk breaks down the risk management process into five discrete steps: direct, assess, control, report and manage/challenge. It is Group Risk’s responsibility to ensure that each of the five steps is embedded across the Group for each risk type.
| | | | |
| | | Responsibilities |
| Direct | | | | · Understand the principal risks to achieving Group strategy. |
| | | | · Establish Risk Appetite. |
| | | | · Establish and communicate the risk management framework including responsibilities, authorities and key controls. |
| Assess | | | | · Establish the process for identifying and analysing business-level risks. |
| | | | · Agree and implement measurement and reporting standards and methodologies. |
| Control | | | | · Establish key control processes and practices, including limit structures, impairment allowance criteria and reporting requirements. |
| | | | · Monitor the operation of the controls and adherence to risk direction and limits. |
| | | | · Provide early warning of control or appetite breaches. |
| | | | · Ensure that risk management practices and conditions are appropriate for the business environment. |
| Report | | | | · Interpret and report on risk exposures, concentrations and risk-taking outcomes. |
| | | | · Interpret and report on sensitivities and Key Risk Indicators. |
| | | | · Communicate with external parties. |
Manage and Challenge | | | | · Review and challenge all aspects of the Group’s risk profile. |
| | | | · Assess new risk-return opportunities. |
| | | | · Advise on optimising the Group’s risk profile. |
| | | | · Review and challenge risk management practices. |
Risk Appetite
Risk Appetite is the level of risk Barclays chooses to take to reach its strategic objectives, recognising a range of possible outcomes, as business plans are implemented. Barclays framework, approved by the Board Risk Committee, combines a top-down view of its capacity to take risk, with a bottom-up view of the business risk profile requested and recommended by each business area.
The objectives of the Risk Appetite framework are to:
| · | | help protect the Group’s performance; |
| · | | improve management confidence and debate regarding our risk profile; |
| · | | help executive management improve control and co-ordination of |
| · | | risk-taking across businesses; and, |
| · | | enable unused risk capacity to be identified and thus profitable opportunities to be highlighted. |
| | |
| 68 | | Barclays PLC Annual Report 2006 |
| |
The Risk Appetite framework considers credit, market and operational risk and is applied using two perspectives: ‘earnings volatility’ and ‘mandate and scale’.
Earnings Volatility:This is the level of potential deviation from expected financial performance that Barclays is prepared to sustain at relevant points on the risk profile. It is established with reference to the strategic objectives and to the business plans of the Group, including the achievement of annual financial targets, payment of dividends, funding of capital growth and maintenance of acceptable capital ratios. The portfolio is analysed in this way at four representative levels:
| · | | expected performance (including the average credit losses based on measurements over many years); |
| · | | a moderate stress level of loss that is likely to occur only infrequently and is meant to correspond to a macroeconomic cycle; |
| · | | a severe stress which is much less likely; |
| · | | an extreme but highly improbable level of stressed loss which is used to determine the Group’s economic capital. |
These potentially larger but increasingly less likely levels of loss are illustrated in the following chart.
Risk Appetite concepts(diagram not to scale)
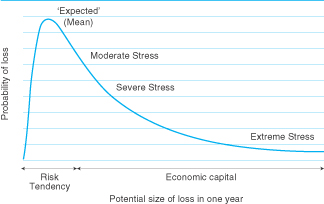
Mandate and scale:This second perspective is a risk management approach that seeks to formally review and control our business activities to ensure that they are within our mandate (i.e. aligned to the expectations of external stakeholders) and are of an appropriate scale (relative to the risk and reward of the underlying activities). This is achieved by using limits and triggers to avoid concentrations and operational risks which could lead to unexpected losses of a scale that would result in a disproportionate fall in Barclays market capitalisation.
Taken as a whole, the Risk Appetite framework provides a basis for the allocation of risk capacity to each business. Since the level of loss at any given probability is dependent on the portfolio of exposures in each business, the statistical measurement for each key risk category gives the Group clearer sight and better control of risk-taking throughout the enterprise. The Risk Appetite framework is designed to be:
| · | | simple and practical to apply by measurement and monitoring of exposures; |
| · | | geared to risk/return where capacity is directly related to opportunity; |
| · | | based on a top-down capacity for earnings volatility; |
| · | | based on bottom-up identification of risk factors in each business; |
| · | | relevant, recognising the impact and likelihood of losses; |
| · | | aggregated across businesses where appropriate. |
Stress testing
The Risk Appetite numbers are validated by estimating the Group sensitivity to macroeconomic events using stress testing and scenario analysis. Changes in certain macroeconomic variables represent environmental stresses which may reveal systemic credit and market risk sensitivities in our retail and wholesale portfolios. The stresses considered include, for example, the following sensitivities:
| · | | Gross Domestic Product weaker; |
| · | | interest rates higher or lower; |
| · | | interest rate curve shifts; |
| · | | property prices weaker; |
| · | | country exposure stressed; |
| · | | industry exposure stressed; |
More complex scenarios, such as recessions, can be represented by combinations of variables. These scenarios allow senior management to gain a better understanding of how portfolios are likely to react to changing economic and geopolitical conditions and how the Group can best react to them. The stress test simulates the balance sheet and profit and loss effects of stresses across the Group, investigating the impact on profits and the ability to maintain appropriate capital ratios. Insights gained are fully integrated into the senior management process and the Risk Appetite framework. This process of analysis and senior management oversight also provides the basis for fulfilling the stress testing requirements of Basel II advanced approach.
Barclays estimates the capital needed to survive an extreme but highly improbable level of stressed loss. The calculation is based on the historical volatility of losses. Capitalisation occurs to a level sufficient to provide a high level of confidence in the Group, consistent with the Group’s AA rating.
The Group macroeconomic stress test is only one of a number of stress test analyses that are performed as part of the wider risk management process. Specific stress test analysis is used across all risk types to gain a better understanding of the risk profile and the potential effects of changes in external factors. These stress tests are performed at a number of different levels, from analysis covering specific stresses on individual sub-portfolios (e.g. high value mortgages in the South East of England), to portfolio level stresses (e.g. the overall commodities portfolio) to Group-wide stresses for particular asset types (e.g. wholesale credit risk stress tests).
Capital management
Barclays considers both regulatory (see page 85) and economic capital (see page 70) as part of its capital management. In respect of economic capital, Group Risk owns the methodology and policy whilst the businesses are responsible for the calculation.
| | |
Barclays PLC Annual Report 2006 | | 69 |
| |
Risk management
Risk management – overview
Economic capital
Barclays assesses capital requirements by measuring the Group risk profile using both internally and externally developed models. The Group assigns economic capital primarily within seven risk categories: Credit Risk, Market Risk, Business Risk, Operational Risk, Insurance Risk, Fixed Assets and Private Equity.
The Group regularly enhances its economic capital methodology and benchmarks outputs to external reference points. The framework has been enhanced to reflect default probabilities during average credit conditions, rather than those prevailing at the balance sheet date, thus seeking to remove cyclicality from the economic capital calculation. The framework also adjusts economic capital to reflect time horizon, correlation of risks and risk concentrations.
Economic capital is allocated on a consistent basis across all of Barclays businesses and risk activities. A single cost of equity is applied to calculate the cost of risk. Economic capital allocations reflect varying levels of risk.
The total average economic capital required by the Group, as determined by risk assessment models and after considering the Group’s estimated portfolio effects, is compared with the supply of economic capital to evaluate economic capital utilisation. Supply of economic capital is calculated as the average available shareholders’ equity after adjustment and including preference shares.
The economic capital methodology will form the basis of the Group’s submission for the Basel II Internal Capital Adequacy Assessment Process.
Economic capital supply
The capital resources to support economic capital comprise adjusted shareholders’ equity including Preference Shares but excluding other minority interests. Preference Shares have been issued to optimise the long-term capital base of the Group.
The capital resources to support economic capital are impacted by a number of factors arising from the application of IFRSs and are modified in calculating available funds for economic capital. This applies specifically to:
| · | | Cash flow hedging reserve – to the extent that the Group undertakes the hedging of future cash flows, shareholders’ equity will include gains and losses which will be offset against the gain or loss on the hedged item when it is recognised in the income statement at the conclusion of the future hedged transaction. Given the future offset of such gains and losses, they are excluded from shareholders’ equity when calculating economic capital. |
| · | | Available for sale reserve – unrealised gains and losses on such securities are included in shareholders’ equity until disposal or impairment. Such gains and losses are excluded from shareholders’ equity for the purposes of calculating economic capital. |
| · | | Retirement benefits liability – the Group has recorded a deficit with a consequent reduction in shareholders’ equity. This represents a non-cash reduction in shareholders’ equity. For the purposes of calculating economic capital, the Group does not deduct the pension deficit from shareholders’ equity. |
| | |
| 70 | | Barclays PLC Annual Report 2006 |
| |
Intentionally Left Blank
| | |
Barclays PLC Annual Report 2006 | | 71 |
| |
Risk management
Credit risk management
Credit risk management
Credit risk
Credit risk is the risk of suffering financial loss, should any of the Group’s customers, clients or market counterparties fail to fulfil their contractual obligations to the Group. Credit risk may also arise where the downgrading of an entity’s credit rating causes the fair value of the Group’s investment in that entity’s financial instruments to fall. The credit risk that the Group faces arises mainly from commercial and consumer loans and advances, including credit card lending.
The granting of credit is one of the Group’s major sources of income and as its most significant risk, the Group dedicates considerable resources to controlling it. The importance of credit risk is illustrated by noting that nearly two-thirds of risk-based economic capital is allocated to credit risk. Credit exposures arise principally in loans and advances.
In managing credit risk, the Group applies the five-step risk management process and internal control framework described previously (page 68). The credit risk management teams in each business are accountable to the Business Risk Directors in those businesses who, in turn, report to the heads of their businesses and also to the Risk Director.
These credit risk management teams assist Group Risk in the formulation of Group Risk policy and the implementation of it across the businesses. Examples include:
| · | | maximum exposure guidelines are in place relating to the exposures to any individual customer or counterparty; |
| · | | country risk policy specifies risk appetite by country and avoids excessive concentration of credit risk in individual countries; |
| · | | policies are in place that limit lending to certain industrial sectors (commercial real estate being one example). |
Within Group Risk, the Credit Risk function, led by the Credit Risk Director, provides Group-wide direction of credit risk-taking. This functional team manages the resolution of all significant credit policy issues and runs the Credit Committee, which approves major credit decisions.
The principal Committees that review credit risk management, formulate overall Group credit policy and resolve all significant credit policy issues are the Group Wholesale Credit Risk Management Committee, the Group Retail Credit Risk Management Committee, the Risk Oversight Committee and the Board Risk Committee (see page 66 for more details of this Committee). The Board Audit Committee also reviews the impairment allowance as part of financial reporting.
Credit risk measurement
Barclays uses statistical modelling techniques throughout its business in its credit rating systems. These systems assist the Bank in frontline credit decisions on new commitments and in managing the portfolio of existing exposures. They enable the application of consistent risk measurement across all credit exposures, retail and wholesale. The key building blocks in the measurement system, which are described below, are theprobability of customer default(expressed through an internal risk rating),exposure in the event of default, andseverity of loss-given-default. Using these, Barclays builds the analysis that leads to its decision support systems in the Risk Appetite context described previously. However, it should be noted that credit risk measurement, particularly Risk Tendency, can be contrasted with impairment allowances required under accounting standards, which are based on losses known to have been incurred at the balance sheet date and not on expected loss.
Probability of customer default – commonly known as Probability of Default (PD): Internal risk ratings
Barclays assesses the credit quality of borrowers and other counterparties and assigns them an internal risk rating. There are two different categories of default rating used. The first reflects the statistical probability of a customer in a rating class defaulting within the next
12-month period, and is referred to as a point in time rating (PIT). The second also reflects the statistical probability of a customer in a rating class defaulting, but the period of assessment is different, in this case the period is defined as 12 months of average credit conditions for the customer type. This type of rating therefore provides a measure of risk that is independent of the current credit conditions for a particular customer type, is much more stable over time than a PIT rating and is referred to as a through the cycle rating (TTC).
Multiple rating methodologies may be used to inform the rating decision on individual large credits, such as internal and external models, rating agency ratings, and for wholesale assets market information such as credit spreads. For smaller credits, a single source may suffice such as the result from a rating model.
In 2005, Barclays improved upon the granularity of its earlier 12-grade internal credit rating scale for wholesale credit. This was achieved by increasing the number of ratings across the same range to 21. The 12-grade rating scale has historically been mapped to long-term agency ratings. The new 21 default grades represent Barclays best estimate of the level of credit risk for each counterparty based on current economic conditions, and as a result a static link to long-term rating agency ratings is no longer used.
Exposure in the event of default – commonly known as Exposure at Default (EAD)
Exposure in the event of default represents the expected level of usage of the credit facility when default occurs. At default the customer may not have drawn the loan fully or may already have repaid some of the principal, so that exposure is typically less than the approved loan limit. When the Group evaluates loans, it takes exposure at default into consideration, using its extensive historical experience. It recognises that customers may make heavier than average usage of their facilities as they approach default.
For derivative instruments, exposure in the event of default is the estimated cost of replacing contracts with a positive value should counterparties fail to perform their obligations.
Severity of loss given default – commonly known as Loss Given Default (LGD)
When a customer defaults, some part of the amount outstanding on its loans is usually recovered. The part that is not recovered, the actual loss, together with the economic costs associated with the recovery process combine to a figure called the LGD. The severity of the LGD is measured as a percentage of the EAD.
Using historical information, the Group can estimate how much is likely to be lost, on average, for various types of loans. To illustrate, LGD is lower for residential mortgages than for unsecured loans because of the property pledged as collateral.
The level of LGD depends on the type of collateral (if any); the seniority or subordination of the exposure; the industry in which the customer operates (if a business); the jurisdiction applicable and work-out expenses. The outcome is also dependent on economic conditions that may determine, for example, the prices that can be realised for assets or whether businesses can readily be refinanced. Individual defaults show a wide range of outcomes, varying from full to nil recovery and all points in between.
Expected Loss: Risk Tendency
The three components described above – the probability of default, exposure at default and loss given default – are building blocks used in a variety of applications that measure credit risk across the entire portfolio. One of these applications is a measurement of expected loss that we use at Barclays, that we call Risk Tendency (RT).
| | |
| 72 | | Barclays PLC Annual Report 2006 |
| |
RT is a statistical estimate of the average loss for the loan portfolio for a 12-month period, taking into account the portfolio’s size and risk characteristics under current credit conditions. It is a PIT measure and therefore requires a point in time PD (PDPIT) as an input. RT provides insight into the credit quality of the portfolio and assists management in tracking risk changes as the Group’s stock of credit exposures evolves in size or risk profile in the course of business.
RT is calculated for both corporate and retail loans as follows:
RT = PDPIT x EAD x LGD.
The RT of each individual loan is aggregated to produce the RT of the various sub-portfolios in the Group and ultimately for the whole Group. At this aggregate level, RT is a statistical estimate of the average loss over a 12-month period that is inherent in the Group’s credit exposures.
Many models are used in the estimation of the components of RT in each of the Group’s businesses. The majority of the models are internally developed using Barclays own historical data and other external information. In some cases we use externally developed models and rating tools. The appropriateness of these external models for use within Barclays is validated as part of the model approval process. It is also a Barclays policy that all existing models are validated annually to ensure their applicability to the current portfolios and credit conditions.
To interpret RT, the following should be considered:
| · | | RT is calculated using probabilities of default that are relevant to the current credit conditions for each customer. These figures are therefore a point-in-time estimate based on current economic and credit conditions. |
| · | | RT is calculated for different purposes and through different methods to impairment allowances, so RT cannot be used as a forecast of the total allowances for impairment. It is rather a statistical estimate that reflects changes in the size and quality of the loan portfolio. RT does not equate to the Group’s budget or internal forecast of impairment allowance in the coming year. |
| · | | The principal reasons for the difference between impairment and RT are: |
| | – | RT is a forecast estimate of the average loss associated with the current performing portfolio over a 12-month period, impairment is the accounting value of incurred loss realised on the whole portfolio. |
| | – | RT covers only the loans at the date of estimation and does not make allowance for subsequent growth or change in the composition of the loan book which can affect impairment. |
| | – | RT is a statistical estimate of losses arising only in the current performing loan portfolio and therefore it is not calculated for non-performing loans in the wholesale portfolio or for retail loans in arrears. |
| | – | Impairment can include significant additional charges, write-backs and recoveries arising during the year from impaired loans. These items can materially affect the impairment allowance charge, but are not included in RT. |
| | – | The actual credit impairment charge arising from new defaults in any one year, from loans that are performing at the start of the year, vary significantly around the RT value. This can be due to changes during the year in the economic environment or in the business conditions in specific sectors or countries and from unpredictable or unexpected external events. This applies especially in wholesale portfolios where the default of a small number of large exposures will significantly increase the period’s impairment allowance but will not have been included in the RT figure. For retail portfolios, consisting of a very large number of small exposures, the variation in the rate of change in new impairment compared to the RT figure is usually much smaller than for wholesale portfolios. |
RT increased £415m to £2,260m (2005: £1,845m).
UK Retail Banking RT increased £45m to £225m (2005: £180m) reflecting a methodology enhancement to better reflect expected loss rates in the Local Business portfolio.
The increase in Barclaycard RT was £310m, the total rising to £1,410m (2005: £1,100m). This reflected the deterioration in credit conditions in the UK credit card and unsecured loan market as well as loan balance growth.
International Retail and Commercial Banking – Absa RT increased £45m, reflecting balance sheet growth, a normalisation of credit conditions in South Africa and by an asset transfer from Absa Capital.
RT in Barclays Capital fell £15m mainly as a result of assets which were transferred to International Retail and Commercial Banking – Absa from Absa Capital.
Risk Tendency by business£m
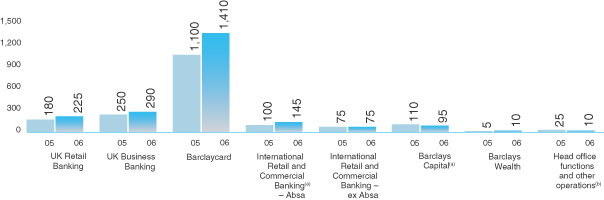
Notes
| (a) | Of the reduction to Barclays Capital RT, £10m is as a consequence of a transfer of certain assets from Absa Capital to International Retail and Commercial Banking in the second half of 2006. The 2006 Risk Tendency in International Retail and Commercial Banking – Absa has increased by an equivalent amount. |
| (b) | Head office functions and other operations comprises discontinued businesses in transition. |
| | |
Barclays PLC Annual Report 2006 | | 73 |
| |
Risk management
Credit risk management
Credit risk mitigation
The Group uses a wide variety of techniques to reduce credit risk on its lending. The most basic of these is performing an assessment of the ability of a borrower to service the proposed level of borrowing without distress. In addition, the Group commonly obtains security for the funds advanced, such as in the case of a retail or commercial mortgage, a reverse repurchase agreement, or a commercial loan with a floating charge over book debts and inventories. The Group also uses various forms of specialised legal agreements to reduce risk, including netting agreements which permit it to offset positive and negative balances with customers in certain circumstances to minimise the exposure at default, financial guarantees, and the use of covenants in commercial lending agreements. Other techniques include the use of credit derivatives and other forms of credit protection.
Barclays manages the diversification of its portfolio to avoid unwanted credit risk concentrations. This takes several dimensions. Maximum exposure guidelines are in place relating to the exposures to any individual counterparty. These permit higher exposures to highly rated borrowers than to lower rated borrowers.
They also distinguish between types of counterparty, for example, between sovereign governments, banks and corporations. Excesses are considered individually at the time of credit sanctioning, are reviewed regularly, and are reported to the Risk Oversight Committee and the Board Risk Committee.
Similarly, country risk policy specifies Risk Appetite by country and avoids excessive concentrations of credits in individual countries.
Finally, there are policies that limit lending to certain industries, for example, commercial real estate.
Barclays actively manages its credit exposures. When weaknesses in exposures are detected – either in individual exposures or in groups of exposures – action is taken to mitigate the risks. These include steps to reduce the amounts outstanding (in discussion with the customers, clients or counterparties if appropriate), the use of credit derivatives and, sometimes, the sale of the loan assets. Credit derivatives are traded for profit and are used for managing credit exposures. Details of these activities may be found in the statistical section (page 97) and Note 52 to the accounts.
Country risk
Country grades
Country risk grades are assigned to all countries where the Group has, or is likely to have, exposure and are reviewed every quarter to ensure they remain appropriate. Country grades, which are derived from long-term sovereign foreign currency ratings, range from 1 (lowest probability of default) to 21 (highest probability of default). A ceiling is applied where a country is graded 12 or worse so that the counterparty cannot be graded better than the country, unless some form of protection is available in the event of a cross-border event, such as a significant portion of a counterparty’s assets or income being held or generated in hard currency.
Country risk appetite
To manage exposure to country risk the Group uses two country limits: the Prudential Guideline and the Country Guideline. The Prudential Guideline is identified through the strict mapping of a country grade to derive a model-driven acceptable level of loss given default. The Country Guideline for all graded countries is set by the Group Credit Committee (GCC) based on the Prudential Guideline and the internal appetite for country risk. The Country Guideline may therefore be above or below the Prudential Guideline.
Measuring country risk
Country risk is managed through the application of Country Loss Given Default (CLGD). All cross-border or domestic foreign currency transactions incur CLGD from the Country Guideline agreed at GCC. The level of CLGD incurred by a counterparty transaction will largely depend on three main factors: the country severity, the product severity and counterparty grade.
CLGD is incurred in the country of direct risk, defined as where the majority of operating assets are held. This may be different to the country of incorporation. However, where transactions are secured with collateral, the country risk can be transferred from the country of the borrower to the country of the collateral provider. This is only permitted where the collateral definitely covers the borrowing and is not expected to decrease over time.
Country executives
Country Managers are in place for all countries where the Group has exposure and they, under the direction of GCC, have responsibility for allocating country risk to individual transactions. The total allocation of country limits is monitored on a daily basis by Group Credit Risk, as headed by the Group Credit Risk Director. Discretions exist to increase the Country Guideline above the level agreed by GCC where the Country Guideline is below the Prudential Guideline. All requests to increase the Country Guideline in line with individual discretions must be submitted to and applied centrally through Group Credit Risk.
Credit concentration
A concentration of credit risk exists when a number of counterparties are engaged in similar activities and have similar economic characteristics that would cause their ability to meet contractual obligations to be similarly affected by changes in economic or other conditions.
The Risk Oversight Committee has delegated responsibility for management of retail exposure, which comprises personal lending (including small businesses), mortgages and credit cards, to the Group Retail Credit Risk Management Committee (RCRMC) and wholesale exposure, which comprises lending to businesses, banks and other financial institutions to the Group Wholesale Credit Risk Management Committee (WCRMC). The RCRMC, considers, among others metrics, the ratio of loan to value for home loans and the exposure by the Barclays Retail Grade (BRG) of the customer, whilst the WCRMC monitors exposure by country and by industry sector and individual large exposures and exposures to sub-investment grade countries.
A further protection against undesirable concentration of risk is the mandate and scale framework described on page 69. Mandate and scale limits, which can also be set at Group level to reflect overall risk appetite, can relate either to the stock of current exposures in the relevant portfolio or to the flow of new exposures into that portfolio. Typical limits include the caps on UK commercial investment property lending, the proportion of lending with maturity in excess of seven years and the proportion of new mortgage business that is buy-to-let.
The concentrations of credit exposure described in the next section (Risk management: loans and advances to customers) and in the statistical sections are not proportionally related to credit loss. Some segments of the Group’s portfolio have and are expected to have proportionally higher credit charges in relation to the exposure than others. Moreover, the volatility of credit loss is different in different parts of the portfolio. Thus comparatively large credit impairment charges could arise in parts of the portfolio not mentioned below.
| | |
| 74 | | Barclays PLC Annual Report 2006 |
| |
Risk management
Loans and advances to customers
Loans and advances to customers
Geographical analysis of loans and advances to customers%

(See also Table 5 on page 92.)
Geographical analysis and country risk
Loans and advances to customers amounted to £286bn (2005: £272bn, 2004: £207bn).
The geographical analysis presented is based on the location of customers. (See also Table 5 on page 92.)
Barclays exposure limits to sub-investment grade countries are shown in the chart below (largest 15 exposure limits).
Credit exposure limits to sub-investment grade countries£m
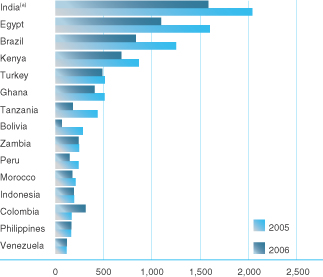
The country exposures shown are the sum of customer limits and unused but available product limits. Both domestic and cross-border exposures are included.
Note
| (a) | From 30th January 2007, India has been regarded as investment grade. |
Risk profile of customer loans and advances
The chart below shows Barclays wholesale loan profile by existing risk grade (see page 72 for a description of the rating system). It is important to note that Barclays prices loans for risk. Thus higher risk loans will usually have higher interest rates or fees or both. A portfolio of higher risk loans may therefore be as profitable as, or more profitable than, a portfolio of lower risk loans.
Loans and advances, balances and limits to wholesale customers by internal risk rating%
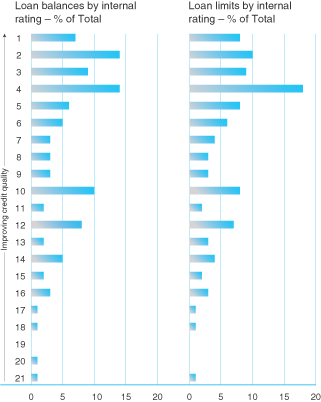
| | |
Barclays PLC Annual Report 2006 | | 75 |
| |
Risk management
Loans and advances to customers
Industry analysis
An industry analysis of customer loans is shown in the chart below. These classifications have been prepared at the level of the borrowing entity. This means that a loan to the subsidiary of a major corporation is classified by the industry in which the subsidiary operates, even though the parent’s predominant business may be in a different industry. (See also Table 6 on page 93.)
Loans and advances to customers by Industry –(% of total)
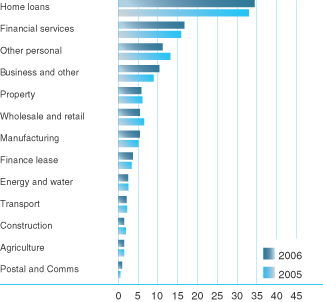
Excluding financial services, the chart shows that Barclays largest sectoral exposures are to home loans, other personal and business and other services. These categories are generally comprised of small loans, have low volatility of credit risk outcomes, and are intrinsically highly diversified.
Just over two-thirds of the Group’s home loans exposure is to customers in the UK. The loan-to-value ratios (LTV) on the Group’s UK home loan portfolio are indicated in the next chart.
Analysis of loan-to-value ratios of mortgages in the UK home loan portfolio
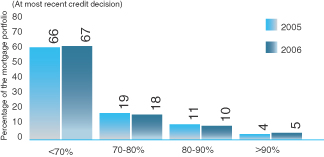
The valuations in the chart are those which applied at the last credit decision on each loan, i.e. when the customer last requested an increase in the limit or, if there has been no increase, at inception of the loan and shows that the business flows (new business versus loans redeemed) has not materially changed the risk profile of the portfolio.
The impact of house price inflation will result in a reduction in LTV ratios within the mortgage book on a current valuation basis. On this basis, LTV on the mortgage book averaged 34% at the end of 2006 (2005: 35%). This ratio is a point in time analysis of the stock with LTV updated to current house prices by reference to an external price index and as a result may be influenced by external market conditions as well as changes in the stock of loans.
Maturity analysis
The analysis by contractual maturity, shown in the chart below, indicates that more than a third of loans to customers have a maturity of more than five years, the majority of which are mortgages.
Maturity analysis of loans and advances to customers%
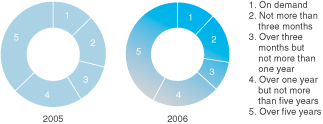
(See also Table 12 on page 96.)
| | |
| 76 | | Barclays PLC Annual Report 2006 |
| |
Risk management
Other credit risks
Other credit risks
In addition to drawn loans and advances, Barclays is exposed to other credit risks. These exposures comprise loan commitments, contingent liabilities, debt securities and other exposures arising in the course of trading activities. The risks are managed in a similar way to those in loans and advances, and are subject to the same or similar approval and governance processes.
The nature of the credit risks among these exposures differ considerably.
| · | | Loan commitments may become funded loans and the risks are thus similar to loans. |
| · | | Contingent liabilities (guarantees, assets pledged as security, acceptances and endorsements) historically experience low loss rates. |
| · | | Losses arising from exposures held for trading (derivatives, debt securities) are accounted for as trading losses, rather than credit charges, even though the fall in value causing the loss may be attributable to credit deterioration. |
Further details of these exposures are shown in the tables below and Note 39 to the accounts. The most notable other credit risks are to guarantees and irrevocable loan commitments, to settlement risk and to debt securities.
Guarantees and irrevocable loan commitments
The Group is exposed to loss through the financial guarantees it issues to clients and commitments to provide loan finance which cannot be withdrawn once entered in to. The credit risks associated with such contracts are managed in a similar way to loans and advances, and form part of the exposure at default measure.
Settlement risk
Barclays is exposed to settlement risk in its dealings with other financial institutions. These risks arise, for example, in foreign exchange transactions when Barclays pays away its side of the transaction to
another bank or other counterparty before receiving payment from the other side. The risk is that the counterparty may not meet its obligation.
While these exposures are of short duration, they can be large. In recent years settlement risk has been reduced by several industry initiatives that have enabled simultaneous and final settlement of transactions to be made (such as payment-versus-payment through Continuous Linked Settlement and delivery-versus-payment).
Barclays has worked with its peers in the development of these arrangements. Increasingly the majority of high value transactions are settled by such mechanisms. Where these mechanisms are not available, the risk is addressed by dealing predominantly with highly rated counterparties, holding collateral and limiting the size of the exposures according to the rating of the counterparty, with smaller exposures to those of higher risk.
Debt securities
Managing the risks associated with debt securities differs in two important respects from the process for loans. Firstly, a market price is generally available for a bond or other debt security, which gives a good indicator of creditworthiness. The financial position of the issuer still needs to be assessed and monitored, just as with the borrower of a loan. Moreover, care needs to be taken when using market price as a proxy for credit risk. To give a simple example, if a bond pays a coupon lower than equivalent market yields, it will tend to trade at below par (say 98 rather than 100) so as to realign the yield to market levels. In this case, the market is not expecting a credit loss of 2% of the face value of the bond.
A second key difference is that many debt securities are rated by independent rating agencies, giving a further indicator of credit quality. However, even with continuous monitoring by the rating agencies, there is often a lag between a credit event and rerating. So, while useful, external ratings can only inform and are not a substitute for the credit assessment undertaken for each exposure by Barclays, using its own grading system (see page 74).
Other commercial commitments
| | | | | | | | | | |
| | | Amount of commitment expiration per period |
| | | Less than
one year
£m | | Between
one to
three years
£m | | Between
three to
five years
£m | | After
five years
£m | | Total
amounts
committed
£m |
| | | | | |
Acceptances and endorsements | | 281 | | 6 | | – | | – | | 287 |
Guarantees and letters of credit pledged as collateral security | | 23,130 | | 1,966 | | 4,048 | | 2,108 | | 31,252 |
Other contingent liabilities | | 5,364 | | 1,016 | | 498 | | 1,002 | | 7,880 |
Documentary credits and other short-term trade related transactions | | 393 | | 21 | | – | | – | | 414 |
Forward asset purchases and forward deposits placed | | 304 | | – | | – | | 56 | | 360 |
Standby facilities, credit lines and other | | 146,996 | | 17,998 | | 27,529 | | 12,207 | | 204,730 |
Contractual obligations
| | | | | | | | | | |
| | | Payments due by period |
| | | Less than
one year
£m | | Between
one to
three years
£m | | Between
three to
five years
£m | | After
five years
£m | | Total
£m |
| | | | | |
Long-term debt | | 84,802 | | 10,644 | | 4,709 | | 19,346 | | 119,501 |
Operating lease obligations | | 344 | | 659 | | 491 | | 2,057 | | 3,551 |
Purchase obligations | | 183 | | 186 | | 313 | | 5 | | 687 |
| | | | | |
Total | | 85,329 | | 11,489 | | 5,513 | | 21,408 | | 123,739 |
The long-term debt does not include undated loan capital of £5,442m.
Further information on the contractual maturity of the Group’s assets and liabilities is given in Note 56.
| | |
Barclays PLC Annual Report 2006 | | 77 |
| |
Risk management
Potential credit risk loans
Potential credit risk loans
Non-performing loans and potential problem loans
Potential Credit Risk Loans (PCRLs) comprise Non-Performing Loans (NPLs) and potential problem loans (PPLs). NPLs are loans where the customers have failed to meet their repayment commitments, either in part or in whole. PPLs are loans where payment of principal and interest is up-to-date and the loans are therefore fully performing, but where serious doubt exists as to the ability of the borrowers to continue to comply with repayment terms in the near future.
The amounts are shown before deduction of the value of security held, impairment allowances (from 2005 onwards) and provisions or interest suspense (2004 and earlier), all of which might reduce the impact of an eventual loss, should it occur.
The US Securities and Exchange Commission (SEC) requires loans to be classified, where applicable, as non-accrual, accruing past due 90 days or more, ‘troubled debt restructurings’ and potential problem loans. Whilst the Group’s risk procedures do not include the classification of loans along these lines, historically balances have been reported based on the SEC categories but with additional categories reported to reflect the particular circumstances pertaining to the UK market. With effect from 1st January 2005, the application of IAS 39 required interest to be recognised on the remaining balance of an impaired financial asset (or a group of financial assets) at the effective interest rate for that asset. As a result, interest is credited to the income statement in relation to impaired loans, therefore these loans technically are not classified as ‘non-accrual’ but are, nonetheless, non-performing. In order to reflect this treatment under IAS 39, in 2005 the Group replaced the ‘non-accrual’ category with one termed ‘Impaired loans’. Impaired loans are non-performing loans where, in general, an impairment allowance has been raised. This category may also include non-performing loans which are fully collateralised or where the indebtedness has already been written down to the expected realisable value.
Since 31st December 2005, NPL balances fell by £122m (2%) to £5,088m. In the retail portfolios, NPLs increased by £179m (5%), primarily in the UK unsecured cards and loans portfolios, while those in the wholesale portfolios (including transition balances) decreased by £301m (18%) reflecting the divergent credit environments.
PPL balances decreased by £168m (18%) during 2006 to £761m. This was primarily as a result of a fall in wholesale portfolios which decreased by £202m to £404m reflecting the favourable credit environment.
As a result, overall PCRL balances fell by £288m (5%) to £5,850m, in line with the 3% fall in impairment stocks (see page 81.).
As a result, NPL and PCRL balances as a percentage of impairment stock (coverage ratios) remained broadly stable (see page 79.).
NPL and PPL balances by location
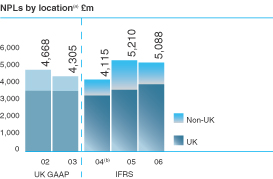
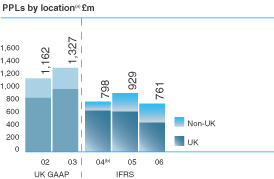
(See also Table 17 on page 98 and Table 18 on page 99.)
NPLs and PPLs as a percentage of Loans and Advances

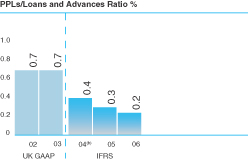
Notes
| (a) | In 2002-2003, non-performing loans and potential problem loans were disclosed, based on the location of the booking office. In 2004-2006 they were disclosed by location of customers. |
| (b) | Does not reflect the application of IAS 32, IAS 39 and IFRS 4 which became effective from 1st January 2005. |
| | |
| 78 | | Barclays PLC Annual Report 2006 |
| |
Risk management
Allowances for impairment
Allowances for impairment
Barclays establishes, through charges against profit, an impairment allowance for the incurred loss inherent in the lending book.
Under IFRSs, impairment allowances are recognised where there is objective evidence of impairment as a result of one or more loss events that have occurred after initial recognition, and where these events have had an impact on the estimated future cash flows of the financial asset or portfolio of financial assets. Impairment of loans and receivables is measured as the difference between the carrying amount and the present value of estimated future cash flows discounted at the financial asset’s original effective interest rate. If the carrying amount is less than the discounted cash flows, then no further allowance is necessary.
Impairment is measured individually for assets that are individually significant, and collectively where a portfolio comprises homogenous assets and where appropriate statistical techniques are available.
In terms of individual assessment, the trigger point for impairment is formal classification of an account as exhibiting serious financial problems and where any further deterioration is likely to lead to failure. Two key inputs to the cash flow calculation are the valuation of all security and collateral and the timing of all asset realisations, after allowing for all attendant costs. This method applies in the corporate portfolios – Business Banking, Barclays Capital and certain areas within International Retail and Commercial Banking and Barclaycard.
For collective assessment, the trigger point for impairment is the missing of a contractual payment. The impairment calculation is based on a roll-rate approach, where the percentage of assets that move from the initial delinquency to default are derived from statistical probabilities based on experience. Recovery amounts and contractual interest rates are calculated using a weighted average for the relevant portfolio. This method applies to parts of Global Retail and Commercial Banking – International, Barclaycard and UK Banking and is consistent with Barclays policy of raising an allowance as soon as impairment is identified.
Unidentified impairment allowances, albeit significantly lower in amount than those reported above, are also raised to cover losses which are judged to be incurred but not yet specifically identified in customer exposures at the balance sheet date, and which, therefore, have not been specifically reported.
The incurred but not yet reported calculation is based on the asset’s probability of moving from the performing portfolio to being specifically identified as impaired within the given emergence period and then on to default within a specified period. This is calculated on the present value of estimated future cash flows discounted at the financial asset’s original effective interest rate.
The emergence periods vary across businesses and are based on actual experience and are reviewed on an annual basis. This methodology ensures that the Group only captures the loss incurred at the balance sheet date.
These impairment allowances are reviewed and adjusted at least quarterly by an appropriate charge or release of the stock of impairment allowances based on statistical analysis and management judgement.
Where appropriate, the accuracy of this analysis is periodically assessed against actual losses.
Impairment allowances/provisions stock coverage of non-performing loans and potential credit risk loans
Impairment/provisions coverage of NPLs%
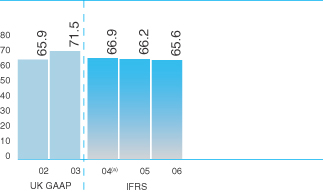
(See also Table 31 on page 103.)
Impairment/provisions coverage of PCRLs%
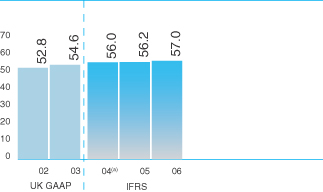
(See also Table 32 on page 103.)
Including Absa, the NPL coverage ratio decreased to 65.6% (2005: 66.2%) whilst the PCRL coverage ratio increased to 57.0% (2005: 56.2%) at the end of 2006.
Note
| (a) | Does not reflect the application of IAS 32, IAS 39 and IFRS 4 which became effective from 1st January 2005. |
| | |
Barclays PLC Annual Report 2006 | | 79 |
| |
Risk management
Allowances for impairment
Writing-off of assets
After an advance has been identified as impaired and is subject to an impairment allowance, the stage may be reached whereby it is concluded that there is no realistic prospect of further recovery. Write-off will occur, when, and to the extent that, the whole or part of a debt is considered irrecoverable.
The timing and extent of write-offs may involve some element of subjective judgement. Nevertheless, a write-off will often be prompted by a specific event, such as the inception of insolvency proceedings or other formal recovery action, which makes it possible to establish that some or the entire advance is beyond realistic prospect of recovery. In any event, the position of impaired loans is reviewed at least quarterly to ensure that irrecoverable advances are being written off in a prompt and orderly manner and in compliance with any local regulations.
Such assets are only written off once all the necessary procedures have been completed and the amount of the loss has been determined.
Subsequent recoveries of amounts previously written off are written back and hence decrease the amount of the reported loan impairment charge in the income statement.
Total write-offs of impaired financial assets increased to £2,174m (2005: £1,587m).
Treatment of interest on impaired loans
IFRSs require that interest on impaired loans be recognised on the net asset value (gross asset value less impairment allowance) at the rate used to discount the expected cash flows (i.e. the original effective interest rate).
Impairment charges for bad and doubtful debts
| | | | | | |
| | | 2006
£m | | 2005
£m | | 2004(a)
£m |
UK Banking | | 461 | | 327 | | 188 |
Barclaycard | | 1,493 | | 1,098 | | 761 |
International Retail and | | | | | | |
Commercial Banking | | 167 | | 32 | | 31 |
Barclays Capital | | 42 | | 111 | | 106 |
Barclays Global Investors | | – | | – | | – |
Barclays Wealth | | 2 | | 2 | | (1) |
Head office and other operations | | (11) | | 1 | | 8 |
Total impairment charges | | 2,154 | | 1,571 | | 1,093 |
Total impairment charges increased 37% (£583m) to £2,154m (2005: £1,571m).
The chart below shows impairment charges over the last five years.
Impairment/provisions charges over five years£m
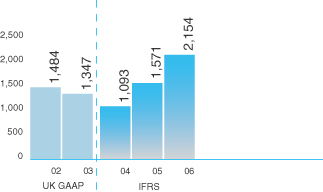
(See also Table 20 on page 99.)
Impairment charges on loans and advances and other credit provisions increased 32% (£501m) to £2,068m (2005: £1,567m). Excluding Absa, the increase was 26% (£395m) and largely reflected the continued challenging credit environment in UK unsecured retail lending through 2006. The wholesale and corporate sectors remained stable with a low level of defaults.
The Group impairment charges on loans and advances and other credit provisions as a percentage of year-end total loans and advances of £316,561m (2005: £303,451m) increased to 0.65% (2005: 0.52%).
Retail impairment charges on loans and advances and other credit provisions increased to £1,809m (2005: £1,254m), including £99m (2005(b): £10m) in respect of Absa. Retail impairment charges on loans and advances amounted to 1.30% (2005(c): 0.93%) as a percentage of year-end total loans and advances of £139,350m (2005(c): £134,420m), including balances in Absa of £20,090m (2005: £20,836m).
In the UK unsecured retail businesses, household discretionary cash flows remained under pressure leading to deterioration in consumer credit quality. High debt levels and changing social attitudes to bankruptcy and debt default contributed to increased impairment charges. In UK cards and unsecured consumer lending, the flows of new delinquencies and the levels of arrears balances declined in the second half of 2006, reflecting more selective customer recruitment limit management and improved collections.
In UK Home Finance, delinquencies were flat and amounts charged-off remained low. The weaker external environment led to increased credit delinquency in Local Business, where there were both higher balances on caution status and higher flows into delinquency, which both stabilised towards the year end.
In the wholesale and corporate businesses, impairment charges on loans and advances and other credit provisions decreased to £259m (2005: £313m), including £27m (2005(b): £10m) in respect of Absa. The fall was due mainly to recoveries in Barclays Capital as a result of the benign wholesale credit environment. This was partially offset by an increase in UK Business Banking, reflecting higher charges in Medium Business and growth in lending balances.
Notes
| (a) | Does not reflect the application of IAS 32, IAS 39 and IFRS 4 which became effective from 1st January 2005. |
| (b) | For 2005, this reflects the period from 27th July until 31st December 2005. |
| (c) | Prior year analysis of loans and advances between retail business and wholesale and corporate business has been reclassified to reflect enhanced methodology implemented in current year. |
| | |
| 80 | | Barclays PLC Annual Report 2006 |
| |
The wholesale and corporate impairment charge was 0.15% (2005: 0.19%) as a percentage of year-end total loans and advances of £177,211m (2005(a): £169,031m), including balances in Absa of £9,299m (2005: £9,731m).
In Absa, impairment charges increased to £126m (2005(b): £20m) reflecting a full year of business and normalisation of credit conditions in South Africa following a period of low interest rates.
The total impairment charges and other credit provisions in Barclays Capital included losses of £83m (2005: £nil) on an ‘available for sale’ portfolio where an intention to sell caused the losses to be viewed as other than temporary in nature.
Movements in allowances for impairment on loans and advances £m
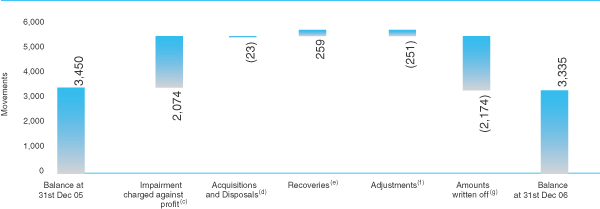
Total impairment allowances at the end of 2006 decreased by 3% (£115m) to £3,335m from the previous year (2005: £3,450m).
An analysis of all movements in the impairment balance is shown in the above chart.
Notes
| (a) | Prior year analysis of loans and advances between retail business and wholesale and corporate business has been reclassified to reflect enhanced methodology implemented in current year. |
| (b) | For 2005, this reflects the period from 27th July until 31st December 2005. |
| (c) | Represents the increase in the allowance for the period following the Group’s assessment of the recoverability of its loans and receivables, in accordance with IAS 39. |
| (d) | Represents net of allowances brought in from new subsidiaries acquired and allowances released following disposal of assets in the year. |
| (e) | Represents recoveries of amounts previously written off. |
| (f) | Includes unwind of discount and other adjustments. |
| (g) | Balances are written off when it is considered that there is no possibility of making further recoveries. |
| | |
Barclays PLC Annual Report 2006 | | 81 |
| |
Risk management
Market risk management
Market risk management
Market risk is the risk that Barclays earnings or capital, or its ability to meet business objectives, will be adversely affected by changes in the level or volatility of market rates or prices such as interest rates, credit spreads, commodity prices, equity prices and foreign exchange rates.
The main market risks arise from trading activities. Barclays is also exposed to non-trading market risks relating to asset and liability management and to the Pension Fund.
Categorisation of market risk
To facilitate the management, control, measurement and reporting of market risk, Barclays has grouped market risk into three broad categories:
These risks arise in trading transactions where Barclays acts as principal with clients or with the market. Barclays policy is that market risks arising from trading activities are concentrated in Barclays Capital.
| · | | Asset and liability risk |
These risks arise from banking activities, including those incurred on non-trading positions such as customer assets and liabilities and capital balances.
Barclays also incurs market risks that are assessed under a slightly different framework. The principal risks of this type are defined benefit pension scheme risk and asset management structural market risk.
Market risk management and control responsibilities
The Board approves the market risk appetite for all types of market risk. The Market Risk Director is responsible for the market risk control framework and, under delegated authority from the Risk Director, sets a limit framework within the context of the approved market risk appetite. A daily market risk report summarises Barclays market risk exposures against agreed limits. This daily report is sent to the Risk Director, the Market Risk Director, the Finance Director and the appropriate Business Risk Directors.
The Head of each business, assisted by the business risk management team, is accountable for identifying, measuring and managing all market risks associated with its activities. Oversight and support is provided by the Market Risk Director, assisted by the central market risk team.
In Barclays Capital, the Head of Market Risk is responsible for implementing the market risk control framework. Day to day responsibility for market risk lies with the senior management of Barclays Capital, supported by the Market Risk Management team that operates independently of the trading areas. Daily market risk reports are produced for the main Barclays Capital business areas covering the six main risk factor categories, namely interest rate, inflation, credit spread, commodity, equity and foreign exchange. A more detailed trading market risk presentation is produced fortnightly and discussed at Barclays Capital’s Traded Products Risk Review meeting. The attendees at this meeting include the senior managers from Barclays Capital and the central market risk team.
Outside Barclays Capital, Treasury manages treasury market risk and structural risk. Retail market risk, a consequence of the UK banking operations, is managed by the Retail Market Risk team. In the non-UK banking operations, market risk is managed mainly by local treasuries. The chart overleaf gives an overview of the business control structure.
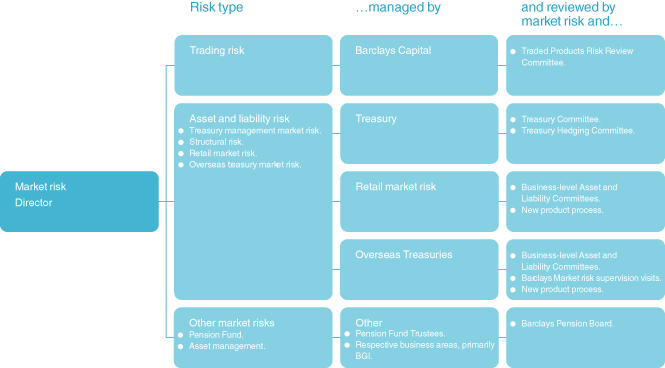
| | |
| 82 | | Barclays PLC Annual Report 2006 |
| |
Market risk measurement
The techniques used to measure and control market risk include:
| · | | Annual Earnings at Risk; |
Daily value at risk (DVaR)
DVaR is an estimate of the potential loss which might arise from unfavourable market movements, if the current positions were to be held unchanged for one business day, measured to a confidence level of 98%. Daily losses exceeding the DVaR figure are likely to occur, on average, twice in every 100 business days.
In Barclays Capital, DVaR is an important market risk measurement tool. DVaR is calculated using the historical simulation method with a historical sample of two years.
The effectiveness of the DVaR model is assessed principally by back-testing which counts the number of days when trading-related losses are bigger than the estimated DVaR figure. Back-testing results are shown on page 84. Outside Barclays Capital, Barclays uses a simplified approach to calculate DVaR.
Stress tests
Stress tests provide an indication of the potential size of losses that could arise in extreme conditions. The stress tests carried out by Barclays Capital include risk factor stress testing where stress movements are applied to each of the six main risk categories, namely interest rate, inflation, credit spread, commodity, equity and foreign exchange rate; emerging market stress testing where emerging market portfolios are subject to stress movements; and ad hoc stress testing, which includes applying stress scenarios to the trading risk book.
If the potential stress loss exceeds the trigger limit, the positions captured by the stress test are reviewed and discussed by Barclays Capital market risk and the respective Barclays Capital Business Head(s). The minutes of the discussion, including the merits of the position and the appropriate course of action, are then sent to the Market Risk Director for review.
Outside Barclays Capital, stress testing is carried out by the business centres and is reviewed by the senior management and business-level asset and liability committees. The stress testing is tailored to the business and is typically scenario analysis and historical stress movements applied to respective portfolios.
Annual earnings at risk (AEaR)
AEaR measures the sensitivity of annual earnings to shocks in market rates at the 99th percentile for change over a one-year period. This shock is consistent with the standardised interest rate shock recommended by the Basel II framework for assessing banking book interest rate risk.
AEaR is used to measure structural interest rate market risk and structural asset management risk (see the Other market risks section (page 84) for more details).
Economic capital
Economic capital methodologies calculate market risk sensitive capital allocations and are used to determine each business’s capital charge.
Trading market risk
Barclays policy is to concentrate trading activities in Barclays Capital. This includes transactions where Barclays Capital acts as principal with clients or with the market. For maximum efficiency, Barclays manages client and market activities together. In Barclays Capital, trading risk occurs in both the trading book and the banking book as defined for regulatory purposes.
In anticipation of future customer demand, Barclays maintains access to market liquidity by quoting bid and offer prices with other market makers and carries an inventory of capital market and treasury instruments, including a broad range of cash, securities and derivatives. Trading positions and any offsetting hedges are established as appropriate to accommodate customer or Barclays requirements. Derivatives entered into for trading purposes include swaps, forward rate agreements, futures, credit derivatives, options and combinations of these instruments. For a description of the nature of derivative instruments, see page 90.
Analysis of trading market risk exposures
The table below shows the DVaR statistics for Barclays Capital’s trading activities (trading book and banking book).
Total DVaR as at 31st December 2006 was £41.9m (31st December 2005: £37.6m(c)). Barclays Capital’s market risk exposure, as measured by average total Daily Value at Risk (DVaR), increased by 16% to £37.1m (2005: £32.0m(a)). Interest rate risk fell while non-interest rate risks were higher, primarily in commodities. The range of total DVaR between high and low was consistent with 2005 and diversification across risk types remained significant, reflecting the broad business mix.
Barclays Capital DVaR: Summary table for 2006 and 2005
| | | | | | | |
| | | 12 months to
31st December 2006 |
| | | Average
£m | | | High(b)
£m | | Low(b)
£m |
Interest rate risk | | 20.1 | | | 28.8 | | 12.3 |
Credit spread risk | | 24.3 | | | 33.1 | | 17.9 |
Commodities risk | | 11.3 | | | 21.6 | | 5.7 |
Equities risk | | 7.8 | | | 11.6 | | 5.8 |
Foreign exchange risk | | 4.0 | | | 7.7 | | 1.8 |
Diversification effect | | (30.4 | ) | | n/a | | n/a |
Total DVaR | | 37.1 | | | 43.2 | | 31.3 |
| | | | | | | |
| | | 12 months to
31st December 2005(a) |
| | | Average
£m | | | High(b)
£m | | Low(b)
£m |
Interest rate risk | | 25.4 | | | 44.8 | | 15.4 |
Credit spread risk | | 23.0 | | | 28.3 | | 19.0 |
Commodities risk | | 6.8 | | | 11.4 | | 4.5 |
Equities risk | | 6.0 | | | 8.3 | | 3.9 |
Foreign exchange risk | | 2.8 | | | 5.4 | | 1.6 |
Diversification effect | | (32.0 | ) | | n/a | | n/a |
Total DVaR | | 32.0 | | | 40.7 | | 25.4 |
Notes
| (a) | 2005 has been restated. The increase reflects the inclusion of Absa Capital. |
| (b) | The high (and low) DVaR figures reported for each category did not necessarily occur on the same day as the high (and low) DVaR reported as a whole. Consequently, a diversification effect number for the high (and low) DVaR figures would not be meaningful and it is therefore omitted from the above table. |
| (c) | This was previously reported as £37.4m. The increase reflects the inclusion of Absa Capital. |
| | |
Barclays PLC Annual Report 2006 | | 83 |
| |
Risk management
Market risk management
The graph below shows the history of total DVaR on a daily basis for 2005 and 2006.
DVaR in 2005 and 2006 (daily values) (£m)

Analysis of trading revenue
The histograms below show the distribution of daily trading revenue for Barclays Capital in 2006 and 2005. It includes dealing profits, net interest income and net fees and commissions relating to primary trading. The average daily revenue in 2006 was £22.0m (2005: £16.3m) and there were 243 positive revenue days out of 252 (2005: 237 positive revenue days out of 252).
Barclays Capital’s trading revenue 2006 £m
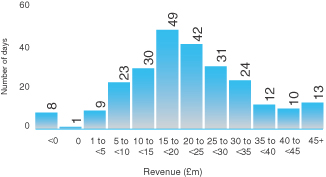
Barclays Capital’s trading revenue 2005 £m
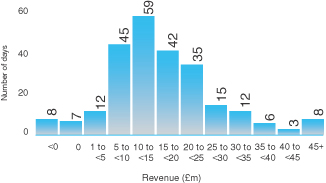
DVaR Back-testing
Barclays recognises the importance of assessing the effectiveness of its DVaR model. The main approach employed is the technique known as back-testing, which counts the number of days when trading losses exceed the estimated DVaR figure. The regulatory standard for back-testing is to measure DVaR assuming a one-day holding period with a 99% level of confidence. For Barclays Capital’s regulatory trading book, there were no instances in 2006 or 2005, of a daily trading revenue loss exceeding the corresponding back-testing DVaR.
Asset and liability market risk
Interest rate exposures arising from mismatches of fixed rate assets and liabilities in UK banking operations are passed to Treasury where these positions are aggregated and the net position passed to the market via Barclays Capital. Due mainly to timing considerations, market risk can arise when some of the net position stays with Treasury. Similarly, market risk can arise due to the impact of interest rates on customer behaviour. The latter risk is managed and measured by the Retail Market Risk Team using behavioural models. The positions are converted into wholesale swap or option exposures, passed to Treasury and managed by the process described above.
Structural interest rate risk arises from the variability of income from non-interest bearing products, managed variable rate products and the Group’s equity. Structural foreign currency risk results from holding non-Sterling investments in subsidiaries, branches, associates or joint ventures. These structural risks are managed by Treasury.
Market risk is also taken in overseas treasuries to support and facilitate customer activity. The risk is comparatively modest. The market risks are managed by local treasury functions and local asset and liability committees. The central market risk team maintains regular contact with the businesses and oversees a comprehensive risk reporting framework.
Other market risks
Defined benefit pension scheme risk
Barclays maintains a number of defined benefit pension schemes for past and current employees. The ability of the Pension Fund to meet the projected pension payments is maintained through investments. Market risk arises because the estimated market value of the pension fund assets might decline or their investment returns might reduce or because the estimated value of the pension liabilities might increase. In these circumstances, Barclays could be required or might choose to make extra contributions to the pension fund. Financial details of the pension fund are in Note 35.
Asset management structural market risk
Asset management structural market risk is the risk that the value of funds managed by Barclays on behalf of clients might reduce leading to a reduction in fee and commission income. It affects Barclays Global Investors, Global Retail and Commercial Banking, Barclays Wealth and Barclays Life. The risk is controlled and managed by the respective businesses and the central market risk team.
| | |
| 84 | | Barclays PLC Annual Report 2006 |
| |
Risk management
Capital and liquidity risk management
Capital and liquidity risk management
The Board Risk Committee has approved minimum control requirements for capital and liquidity risk management.
The Treasurer has established risk control frameworks and a policy and assurance structure to ensure that capital and liquidity risks are managed in accordance with the requirements of the Board. Policies are set by the Treasury Committee which is chaired by the Group Finance Director.
Capital risk management
The Group manages its capital resources to meet regulatory capital requirements. The FSA requires the Group to hold sufficient capital resources to meet minimum regulatory capital requirements. In addition, the Group manages its capital resources to maintain financial holding company status under the rules of the US Federal Reserve Bank and also to ensure Group entities, that are subject to local capital adequacy regulation in individual countries, meet their minimum capital requirements.
Minimum requirements under FSA rules are expressed as the ratio of capital resources to risk weighted assets (Risk Asset Ratio). Risk weighted assets are a function of risk weights applied to the Group’s assets using calculations developed by the Basel Committee for Banking Supervision. In anticipation of the Group’s implementation of the new Basel II standards on 1st January 2008, the Group will also manage its capital resources in accordance with the Basel II advanced approaches during 2007.
In 2006, the Group continued to manage its capital resources, including accessing the capital markets, in order to exceed the minimum capital requirements of its regulators. As at December 2006, the Barclays Group Risk Asset Ratio was 11.7% and the Tier 1 Ratio was 7.7%.
The graph shows the Group’s regulatory capital resources broken down by tier. Further information on the Group’s capital resources is provided in the Financial Review on pages 54 and 56.
Regulatory capital resources by tier £m
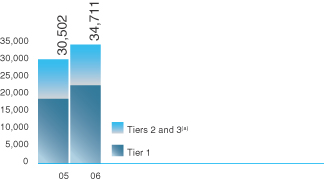
Liquidity risk management
This is the risk that the Group is unable to meet its obligations when they fall due and to replace funds when they are withdrawn, with consequent failure to repay depositors and fulfil commitments to lend. The risk that it will be unable to do so is inherent in all banking operations and can be impacted by a range of institution specific and market-wide events including, but not limited to, credit events, merger and acquisition activity, systemic shocks and natural disasters.
Note
| (a) | Less supervisory deductions. |
Liquidity management within the Group has several strands:
| · | | Day to day funding, managed by monitoring expected cash flows to ensure that requirements can be met. This includes replenishment of funds as they mature or are borrowed by customers. The Group maintains an active presence in global money markets to enable that to happen. |
| · | | Maintain a portfolio of highly marketable assets that can easily be liquidated as protection against any unforeseen interruption to cash flow. |
| · | | Monitor, manage and control intraday liquidity in real time is recognised by the Group as a mission critical process: any failure to meet specific intraday commitments would have significant consequences. |
| · | | Stress testing is undertaken to assess and plan for the impact of various scenarios which may put the Group’s liquidity at risk. |
The ability to raise funds is in part dependent on maintaining the Bank’s credit rating. The funding impact of a credit downgrade is regularly estimated. Whilst the impact of a single downgrade may affect the price at which funding is available, the effect on liquidity is not considered material in Group terms.
Liquidity risk measurement
Monitoring and reporting take the form of cash flow measurement and projections for the next day, week and month as these are key periods for liquidity management. This is based on principles agreed by the FSA.
In addition to cash flow management, Treasury also monitors unmatched medium-term assets and the level and type of undrawn lending commitments, the usage of overdraft facilities and the impact of contingent liabilities such as standby letters of credit and guarantees.
Treasury develops and implements stress tests on the Group’s projected cash flows. The output informs the Group’s contingency funding plan. This is maintained by Treasury and is aligned with the Group and country business resumption plans to encompass decision-making authorities, internal and external communication and, in the event of a systems failure, the restoration of liquidity management and payment systems.
Sources of liquidity are regularly reviewed to maintain a wide diversification by currency, geography, provider, product and term. Whilst the past year saw relatively stable markets, with no significant consequences for the Group’s liquidity, significant market events over recent years including corporate scandals contributed to a short-term flight to quality in financial markets from which Barclays benefited.
An important source of structural liquidity is provided by our core retail deposits in the UK, Europe and Africa, mainly current accounts and savings accounts. Although current accounts are repayable on demand and savings accounts at short notice, the Group’s broad base of customers – numerically and by depositor type – helps to protect against unexpected fluctuations. Such accounts form a stable funding base for the Group’s operations and liquidity needs.
To avoid reliance on a particular group of customers or market sectors, the distribution of sources and the maturity profile of deposits are also carefully managed. Important factors in assuring liquidity are competitive rates and the maintenance of depositors’ confidence. Such confidence is based on a number of factors including the Group’s reputation, the strength of earnings and the Group’s financial position.
For further details see contractual cash obligations and commercial commitments of the Group on page 77.
| | |
Barclays PLC Annual Report 2006 | | 85 |
| |
Risk management
Operational risk and business risk management
Operational risk and business risk management
Operational and business risks are inherent in Barclays operations and are typical of any large enterprise.
Operational riskis the risk of direct or indirect losses resulting from inadequate or failed internal processes or systems, human factors, or from external events. Major sources of operational risk include: operational process reliability, IT security, outsourcing of operations, dependence on key suppliers, implementation of strategic change, integration of acquisitions, fraud, error, customer service quality, regulatory compliance, recruitment, training and retention of staff, and social and environmental impacts.
Business riskis the risk of adverse outcomes resulting from a weak competitive position or from poor choice of strategy, markets, products, activities or structures. Major potential sources of business risk include: revenue volatility due to factors such as macroeconomic conditions; inflexible cost structures; uncompetitive products or pricing; and structural inefficiencies.
Barclays is committed to the advanced management of operational and business risks. In particular, we are implementing improved management and measurement approaches for operational risk to strengthen control, improve customer service and minimise operating losses. In addition, this investment is being made to improve risk sensitivity, to enhance the Operational Risk Capital model and to obtain approval to apply the Advanced Measurement Approach under the Basel II Accord when that option first becomes available in 2008. Barclays works closely with peer banks to benchmark our internal Operational Risk practices and to drive the development of advanced Operational Risk techniques across the industry.
It is not cost effective to attempt to eliminate all operational and business risks and in any event it would not be possible to do so. Events of small significance are expected to occur and are accepted as inevitable; events of material significance are rare and the Group seeks to reduce the risk from these in a framework consistent with its agreed Risk Appetite.
Responsibility for and control of operational risk
Barclays has a Group Operational Risk Framework, which is consistent with and part of the Group Internal Control and Assurance Framework. Minimum control requirements have been established for all key areas of identified risk. The risk categories relevant to operational and business risks are: Financial Crime, Financial Reporting, Taxation, Legal, Operations, People, Regulatory Compliance, Technology, Brand Management, Change, Corporate Responsibility and Strategic.
Responsibility for implementing and overseeing these policies is to be found throughout the organisation as follows:
| · | | The prime responsibility for the management of operational risk and the compliance with control requirements rests with the business and functional units where the risk arises. Frontline risk managers are widely distributed throughout the Group in business units. They service and support these areas assisting line managers in managing these risks. |
| · | | Business Risk Directors in each business are responsible for overseeing the implementation of and compliance with Group policies. |
| · | | Governance and Control Committees in each business monitor control effectiveness. The Group Governance and Control Committee receive reports from the committees in the businesses and considers Group-wide control issues and their risk mitigation. |
| · | | In the corporate centre, the Operational Risk Director oversees the range of operational risks across the Group in accordance with the Group Operational Risk Framework. |
| · | | The Internal Audit function provides assurance for operational risk control across the organisation and reports to the Board and senior management. |
The management and measurement of operational risk
A consistent approach to the identification and assessment of key risks and controls is undertaken across all business units. Self-assessment techniques are used by business management for risk identification and for evaluation of control effectiveness and monitoring capability. Business management determines whether particular risks are effectively managed within business risk appetite and otherwise take remedial action. The risk assessment process is consistent with the principles in the integrated framework published by the Committee of Sponsoring Organisations of the Treadway Commission (COSO).
Risk event data collection and reporting
A standard process is used Group-wide for the recognition, capture, assessment, analysis and reporting of risk events. This process is used to help identify where process and control requirements are needed to reduce the recurrence of risk events. Risk events are loaded onto a central database and reported monthly to the Operational Risk Executive Committee.
Barclays also uses a database of external public risk events and is part of a consortium of international banks that share anonymised loss data information to assist in risk identification and assessment.
Key risk scenarios
Using the above components of the Operational Risk Framework we generate Key Risk Scenarios which identify our most significant operational risks across the Group. It is these that are the main input to our economic capital model.
Reporting
Business units are required to report on both a regular and an event-driven basis. The reports include a profile of the key risks to their business objectives, control issues of Group-level significance, and operational risk events. Specific reports are prepared on a regular basis for the Risk Oversight Committee, the Board Risk Committee and the Board Audit Committee. In particular the Group Operational Risk Profile Report is provided quarterly to the Risk Oversight Committee.
Economic capital
Methodologies are used to model both operational and business risk exposures. These are allocated, on a risk sensitive basis, to business units in the form of economic capital charges, providing an incentive to manage these risks within appetite levels.
| | |
| 86 | | Barclays PLC Annual Report 2006 |
| |
Risk management
Group model policy and taxation risk management
Group model policy
Barclays has a large number of models in place across the Group, covering all risk types, including Credit Risk, Market Risk, Operational Risk, and Finance. To minimise the risk of loss through model failure, a Group Policy for the Control of Model Risk has been developed. The Policy helps reduce the potential for model failure by setting minimum standards around the end-to-end model development and implementation process. The Policy also sets the Group governance processes for all models, which allows model risk to be monitored across the Group, and seeks to identify and escalate any potential problems at an early stage.
The key areas where minimum requirements are defined are:
Model materiality
To help ensure that sufficient management time is spent on the more material models, there is a method of providing each model with a materiality rating. The materiality rating for an individual model depends on the assets for which the model is used and the Expected Loss and Economic Capital associated with the assets. Models of higher materiality are subject to higher levels of independent scrutiny and challenge prior to implementation.
Model documentation
Documentation should be sufficiently detailed to allow an expert to recreate the model from the original data sources. It must include a description of the data used for model development, the methodology used (and the rationale for choosing such a methodology), a description of any assumptions used in the model, and details of where the model works well, and areas that are known as model weaknesses.
Initial model validation
All models are subject to a validation and independent review process before the model can be signed-off for implementation. The model validation exercise must demonstrate that the model is fit for purpose and provides accurate estimates. The independent review process will also ensure that all aspects of the model development process have been performed in a suitable manner.
Model sign-off
The rules for model sign-off are based on model materiality. The sign-off process ensures that the model is technically fit for purpose as well as ensuring that the model satisfies the business requirements and all the relevant regulatory requirements. The most material models used within the Group receive their final sign-off for implementation from Group ExCo, while other models are usually signed-off by their respective business risk committees.
Basel II models
Barclays has spent a considerable amount of time in developing and upgrading a number of credit risk models across the Group moving towards compliance with the Basel II advanced approach. As part of this process all Basel credit risk models are assessed against the Basel II minimum requirements prior to model sign-off to ensure that once signed-off they are fit to be used for regulatory purposes. Basel II models will also be used during the 2007 parallel run process in anticipation of implementation from 1st January 2008 in accordance with Basel requirements.
Ongoing model validation and monitoring
All models within the Group are subject to an annual review, to ensure that the models are working well, and that assumptions used in model development are still appropriate. All credit risk models can also be subject to more frequent monitoring. Model performance monitoring ensures that deficiencies in models are identified early, and remedial action can be taken before the deficiency becomes serious and affects the decision-making process.
Taxation risk
The Group is subject to the tax laws in all countries in which it operates. A number of double taxation agreements entered between countries also impact on the taxation of the Group. The Group is also subject to European Community tax law.
Tax risk is the risk associated with changes in tax law or in the interpretation of tax law. It also includes the risk of changes in tax rates and the risk of failure to comply with procedures required by tax authorities.
Failure to manage tax risks could lead to an additional tax charge. It could also lead to a financial penalty for failure to comply with required tax procedures or other aspects of tax law. If, as a result of a particular tax risk materialising, the tax costs associated with particular transactions are greater than anticipated, it could affect the profitability of those transactions.
The Group takes a responsible and transparent approach to the management and control of its tax affairs and related tax risk.
| · | | tax risks are assessed as part of the Group’s formal governance processes and are reviewed by the Executive Committee, Group Finance Director and the Board Risk Committee; |
| · | | the tax charge is also reviewed by the Board Audit Committee. |
| · | | the tax risks of proposed transactions or new areas of business are fully considered before proceeding; |
| · | | the Group takes appropriate advice from reputable professional firms; |
| · | | the Group employs high-quality tax professionals and provides ongoing technical training; |
| · | | the tax professionals understand and work closely with the different areas of the business; |
| · | | the Group uses effective, well-documented and controlled processes to ensure compliance with tax disclosure and filing obligations. |
| · | | where disputes arise with tax authorities with regard to the interpretation and application of tax law, the Group is committed to addressing the matter promptly and resolving the matter with the tax authority in an open and constructive manner. |
| | |
Barclays PLC Annual Report 2006 | | 87 |
| |
Risk management
Insurance risk management
Insurance risk is the risk that the Group will have to make higher than anticipated payments to settle claims arising from its long-term and short-term insurance businesses.
Long-term insurance business
For long-term insurance contracts where death is the insured risk, the most significant factors that could detrimentally affect the frequency and severity of claims are the incidence of disease, such as AIDS, or general changes in lifestyle, such as in eating, exercise and smoking. Where survival is the insured risk, advances in medical care and social conditions are the key factors that increase longevity. The Group manages its exposure to risk by operating in part as a unit linked business, prudent product design, applying strict underwriting criteria, transferring risk to reinsurers, managing claims and establishing prudent reserves.
Short-term insurance business
For payment protection contracts where inability to make payments under a loan contract is the insured risk, the most significant factors are the health of the policyholder and the possibility of unemployment which depends upon, among other things, long-term and short-term economic factors. The Group manages its exposure to such risks through prudent product design, efficient claims management, prudent reserving methodologies and bases, regular product, economic and market reviews and regular adequacy tests on the size of the reserves.
Absa insures property and motor vehicles, for which the most significant factors that could affect the frequency and severity of claims are climatic change and crime. Absa manages its exposure to risk by diversifying insurance risks accepted and transferring risk to reinsurers. See page 232 for further information.
Reinsurer credit risk
For the long-term business, reinsurance programmes are in place to restrict the amount of cover to any single life. The reinsurance cover is spread across highly rated companies to diversify the risk of reinsurer solvency. Net of insurance reserves include a margin to reflect reinsurer credit risk.
For the short-term business a quota-share programme is in place for selected in-force policies. The structure of the treaty ensures that the underlying assets are bankruptcy remote in the event of credit problems with the reinsurer.
Disclosures about certain trading activities (including non-exchange traded commodity contracts)
The Group delivers a fully integrated service to clients for base metals, precious metals, oil and oil-related products, power, natural gas and other related commodities.
The Group’s commodity business continues to expand, as market conditions allow, through the addition of new products and markets, with the 2006 expansion of business being driven by both organic growth and acquisitions of portfolios.
The Group offers both over the counter (OTC) and exchange traded derivatives in these commodities. The Group’s base metals business also enters into outright metal purchases and sale transactions, while the power and gas business trades both physical forwards and derivative contracts. The Group does not maintain any physical exposures in oil or oil related products. The Group continues to develop and offer a range of commodity-related structured products.
The Group’s principal commodity related derivative contracts are swaps, options, forwards and futures, which are all similar in nature to such non-commodity related contracts. Commodity derivative contracts include commodity specification and delivery location as well as forward date and notional value.
The fair values of commodity physical and derivative positions are determined through a combination of recognised market observable prices, exchange prices, and established inter-commodity relationships. The fair value of OTC commodity derivative contracts is determined primarily by using valuation models which are based on assumptions supported by prices from observable market transactions in the same instrument or are based on available observable market data.
Where a valuation model is used, the fair value is determined based on the expected cash flows under the terms of each specific contract, discounted back to present value. The expected cash flows for each contract are either determined using market parameters such as commodity price curves, commodity volatilities, commodity correlations, interest rate yield curves and foreign exchange rates, or other market prices.
Where possible, fair values generated by models are independently validated with reference to market price quotes or price sharing with other institutions. Where all significant model inputs can be validated to observable market data at the inception of the contract the valuation of the contract is based on the model value output.
However, where no observable market parameter is available then the contract is valued at transaction price at inception. Following initial recognition, the process of calculating fair value from a valuation model may require estimation of certain pricing parameters, assumptions or model characteristics. These estimates are calibrated against industry standards, economic models and observed transaction prices. The valuation model used for a particular instrument, the quality and liquidity of market data used for pricing, other fair value adjustments not specifically captured by the model, market data and any assumptions or estimates are all subject to internal review and approval procedures and consistent application between accounting periods.
The tables on page 89 analyse the overall fair value of the commodity derivative contracts by movement over time and source of fair value. Additionally, the positive fair value of these contracts is analysed by counterparty credit risk rating.
| | |
| 88 | | Barclays PLC Annual Report 2006 |
| |
The following tables analyse the overall fair value of the commodity derivative contracts by movement over time and source of fair value. As at 31st December 2006 this reflects a gross positive fair value of £17,502m (31st December 2005: £21,744m) and a gross negative value of £15,940m (31st December 2005: £21,217m). Realised and unrealised profits relating to physical commodity and commodity derivative activities are included within dealing profits. Physical commodity positions are held at fair value and reported under the Trading Portfolio in Note 12 on page 170.
| | | | | | |
| | | Total
2006
£m | | | Total
2005
£m | |
Fair value of contracts outstanding at the beginning of the period | | 527 | | | 175 | |
Contracts realised or otherwise settled during the period | | 379 | | | (137 | ) |
Fair value of new contracts entered into during the period | | 808 | | | 156 | |
Other changes in fair values | | (152 | ) | | 333 | |
Fair value of contracts outstanding at the end of the period | | 1,562 | | | 527 | |
Movement in fair value of commodity derivative positions
Fair value source and maturity analysis
| | | | | | | | |
| Source of fair value | | Fair value of contracts at 31st December 2006 |
| | Maturity
less than
one year
£m | | Maturity
one to
five years
£m | | Maturity in
excess of
five years
£m | | Total
fair
value
£m |
Valuation models supported by observable market data | | 893 | | 322 | | 315 | | 1,536 |
Valuation models not supported by observable market data | | 9 | | 6 | | 17 | | 26 |
Total | | 902 | | 328 | | 332 | | 1,562 |
The following table analyses the positive fair value arising on commodity derivative contracts. As at 31st December 2006, this reflected a gross positive fair value of £17,501m (31st December 2005: £21,744m).
Analysis of gross positive commodity derivative fair value by counterparty credit risk rating
| | | | |
| S&P equivalent rating(a) | | Total
value
2006
£m | | Total
value
2005
£m |
A- to AAA | | 14,184 | | 12,234 |
BBB- to BBB+ | | 1,826 | | 8,726 |
BB+ and below | | 1,491 | | 784 |
Total | | 17,501 | | 21,744 |
Credit risk exposures are actively managed by the Group. Refer to page 72 for more information on the Group’s approach to credit risk management. At 31st December 2006, 87% of all commodities credit exposure was to counterparties with cross asset class netting agreements which allow exposure on commodities products to be reduced by amounts owed to the same counterparties in other asset classes. 69% of commodities credit exposure to counterparties with BBB+ and below equivalent ratings was to counterparties with cross asset class netting agreements.
Additionally, collateral agreements are held with a majority of these same counterparties that allow collateral to be called against commodity exposures. All non-collateralised exposures are subject to credit limits, and credit or Risk Tendency reserves are created against these exposures if appropriate.
Note
| (a) | Barclays assesses the credit quality and assigns an internal risk rating to all counterparties. Each internal rating corresponds to the statistical probability of a counterparty in that rating class defaulting within the next 12-month period. The counterparty ratings shown in the table above are based on the approximate S&P equivalent of the Barclays internal rating. |
| | |
Barclays PLC Annual Report 2006 | | 89 |
| |
Risk management
Derivatives
Derivatives
The use of derivatives and their sale to customers as risk management products are an integral part of the Group’s trading activities. These instruments are also used to manage the Group’s own exposure to fluctuations in interest, exchange rates and commodity and equity prices as part of its asset and liability management activities.
Barclays Capital manages the trading derivatives book as part of the market risk book. This includes foreign exchange, interest rate, equity, commodity and credit derivatives. The policies regarding market risk management are outlined in the market risk management section on pages 82 to 84.
The policies for derivatives that are used to manage the Group’s own exposure to interest and exchange rate fluctuations are outlined in the asset and liability market risk section on page 84.
Derivative instruments are contracts whose value is derived from one or more underlying financial instruments or indices defined in the contract. They include swaps, forward rate agreements, futures, options and combinations of these instruments and primarily affect the Group’s net interest income, net trading income, net fee and commission income and derivative assets and liabilities. Notional amounts of the contracts are not recorded on the balance sheet.
The Group participates both in exchange traded and over the counter derivatives markets.
Exchange traded derivatives
The Group buys and sells financial instruments that are traded or cleared on an exchange, including interest rate swaps, futures and options on futures. Holders of exchange traded instruments provide margin daily with cash or other security at the exchange, to which the holders look for ultimate settlement.
Over the counter traded derivatives
The Group also buys and sells financial instruments that are traded over the counter, rather than on a recognised exchange.
These instruments range from commoditised transactions in derivative markets, to trades where the specific terms are tailored to the requirements of the Group’s customers. In many cases, industry standard documentation is used, most commonly in the form of a master agreement, with individual transaction confirmations. The existence of a signed master agreement is intended to give the Group protection in situations where a counterparty is in default.
Foreign exchange derivatives
The Group’s principal exchange rate related contracts are forward foreign exchange contracts, currency swaps and currency options. Forward foreign exchange contracts are agreements to buy or sell a specified quantity of foreign currency, usually on a specified future date at an agreed rate. A currency swap generally involves the exchange, or notional exchange, of equivalent amounts of two currencies and a commitment to exchange interest periodically until the principal amounts are re-exchanged on a future date.
Currency options provide the buyer with the right, but not the obligation, either to purchase or sell a fixed amount of a currency at a specified exchange rate on or before a future date. As compensation for assuming the option risk, the option writer generally receives a premium at the start of the option period.
Interest rate derivatives
The Group’s principal interest rate related contracts are interest rate swaps, forward rate agreements, basis swaps, caps, floors and swaptions. Included in this product category are transactions that include combinations of these features.
An interest rate swap is an agreement between two parties to exchange fixed rate and floating rate interest by means of periodic payments based upon a notional principal amount and the interest rates defined in the contract. Certain agreements combine interest rate and foreign currency swap transactions, which may or may not include the exchange of principal amounts. A basis swap is a form of interest rate swap, in which both parties exchange interest payments based on floating rates, where the floating rates are based upon different underlying reference indices. In a forward rate agreement, two parties agree a future settlement of the difference between an agreed rate and a future interest rate, applied to a notional principal amount. The settlement, which generally occurs at the start of the contract period, is the discounted present value of the payment that would otherwise be made at the end of that period.
Credit derivatives
The Group’s principal credit derivative-related contracts include credit default swaps and total return swaps. A credit derivative is an arrangement whereby the credit risk of an asset (the reference asset) is transferred from the buyer to the seller of protection.
A credit default swap is a contract where the protection seller receives premium or interest-related payments in return for contracting to make payments to the protection buyer upon a defined credit event. Credit events normally include bankruptcy, payment default on a reference asset or assets, or downgrades by a rating agency.
A total return swap is an instrument whereby the seller of protection receives the full return of the asset, including both the income and change in the capital value of the asset. The buyer in return receives a predetermined amount.
Equity derivatives
The Group’s principal equity-related contracts are equity and stock index swaps and options (including warrants, which are equity options listed on an exchange). An equity swap is an agreement between two parties to exchange periodic payments, based upon a notional principal amount, with one side paying fixed or floating interest and the other side paying based on the actual return of the stock or stock index. An equity option provides the buyer with the right, but not the obligation, either to purchase or sell a specified stock, basket of stocks or stock index at a specified price or level on or before a specified date.
Commodity derivatives
The Group’s principal commodity-related derivative contracts are swaps, options, forwards and futures. The main commodities transacted are base metals, precious metals, oil and oil-related products, power and natural gas.
| | |
| 90 | | Barclays PLC Annual Report 2006 |
| |
Risk management
Statistical information
Statistical and other risk information
This section of the report contains supplementary information that is more detailed or contains longer histories than the data presented in the discussion. For commentary on this information, please refer to the preceding text (pages 72 to 103).
Barclays applied International Financial Reporting Standards (IFRS) with effect from 1st January 2004, with the exception of IAS 32, IAS 39 and IFRS 4, which were applied from 1st January 2005.
N/a has been included in the tables where, as a result of the application of IAS 32, IAS 39 and IFRS 4 in 2005 and UK GAAP in 2004, the disclosure is not applicable.
Credit risk management
Table 1: Risk Tendency by business
| | | | | | |
| | | 2006
£m | | | | 2005 £m |
UK Banking | | 515 | | | | 430 |
UK Retail Banking | | 225 | | | | 180 |
UK Business Banking | | 290 | | | | 250 |
Barclaycard | | 1,410 | | | | 1,100 |
International Retail and Commercial Banking | | 220 | | | | 175 |
International Retail and Commercial Banking – excluding Absa | | 75 | | | | 75 |
International Retail and Commercial Banking – Absa | | 145 | | | | 100 |
Barclays Capital | | 95 | | | | 110 |
Barclays Wealth | | 10 | | | | 5 |
Head office functions and other operations(a) | | 10 | | | | 25 |
Risk Tendency by business | | 2,260 | | | | 1,845 |
(Also see chart on page 73.) Table 2: Loans and advances | | | | | | |
| | | 2006 £m | | | | 2005 £m |
Retail businesses | | | | | | |
Banks | | – | | | | – |
Customers | | 139,350 | | | | 134,420 |
Total retail businesses(b) | | 139,350 | | | | 134,420 |
Wholesale businesses | | | | | | |
Banks | | 30,930 | | | | 31,109 |
Customers | | 146,281 | | | | 137,922 |
Total wholesale businesses(b) | | 177,211 | | | | 169,031 |
Loans and advances | | 316,561 | | | | 303,451 |
Notes
| (a) | Head office functions and other operations comprises discontinued business in transition. |
| (b) | Prior year analysis of loans and advances between retail business and wholesale and corporate business has been reclassified to reflect enhanced methodology implemented in the current year. |
| | |
Barclays PLC Annual Report 2006 | | 91 |
| |
Risk management
Statistical information
Table 3: Maturity analysis of loans and advances to banks
| | | | | | | | | | | | | | | | | | |
| |
| At 31st December 2006 | | On demand
£m | | Not more
than three
months
£m | | Over three
months
but not
more than
six months
£m | | Over six
months but
not more
than one
year £m | | Over one
year but not
more than
three
years £m | | Over three
years but not
more than
five years
£m | | Over five
years but
not
more than
ten years
£m | | Over
ten years
£m | | Total
£m |
| United Kingdom | | 524 | | 5,211 | | 110 | | 18 | | 43 | | 10 | | – | | 313 | | 6,229 |
| Other European Union | | 619 | | 7,514 | | 90 | | 130 | | 81 | | 78 | | 1 | | – | | 8,513 |
| United States | | 431 | | 2,592 | | 363 | | 2,634 | | 5 | | 809 | | 923 | | 1,299 | | 9,056 |
| Africa | | 701 | | 1,027 | | 83 | | 91 | | 188 | | 85 | | 44 | | – | | 2,219 |
| Rest of the World | | 612 | | 2,465 | | 154 | | 191 | | 1,278 | | 148 | | 44 | | 21 | | 4,913 |
Loans and advances to
banks | | 2,887 | | 18,809 | | 800 | | 3,064 | | 1,595 | | 1,130 | | 1,012 | | 1,633 | | 30,930 |
| | | | | | | | | | | | | | | | | | |
| At 31st December 2005 | | On demand
£m | | Not more
than three
months
£m | | Over three
months
but not
more than
six months
£m | | Over six
months
but not
more than
one year
£m | | Over one
year but not
more than
three years
£m | | Over three
years but not
more than
five years
£m | | Over five
years but
not
more than
ten years
£m | | Over
ten years
£m | | Total
£m |
| United Kingdom | | 369 | | 3,647 | | 31 | | 126 | | 162 | | 19 | | 2 | | 268 | | 4,624 |
| Other European Union | | 585 | | 4,642 | | 122 | | 23 | | 38 | | 12 | | 1 | | – | | 5,423 |
| United States | | 514 | | 3,098 | | 1,736 | | 2,909 | | 1,466 | | 634 | | 1,025 | | 1,885 | | 13,267 |
| Africa | | 722 | | 80 | | 3 | | 3 | | 48 | | 11 | | – | | 13 | | 880 |
| Rest of the World | | 1,739 | | 4,454 | | 114 | | 108 | | 138 | | 103 | | 19 | | 240 | | 6,915 |
Loans and advances to banks | | 3,929 | | 15,921 | | 2,006 | | 3,169 | | 1,852 | | 779 | | 1,047 | | 2,406 | | 31,109 |
Table 4: Interest rate sensitivity of loans and advances to banks(a)
| | | | | | | | | | | | |
| | | 2006 | | 2005 |
At 31st December | | Fixed
rate
£m | | Variable
rate
£m | | Total
£m | | Fixed
rate
£m | | Variable
rate
£m | | Total
£m |
| United Kingdom | | 4,710 | | 1,519 | | 6,229 | | 1,384 | | 3,240 | | 4,624 |
| Other European Union | | 2,907 | | 5,606 | | 8,513 | | 690 | | 4,733 | | 5,423 |
| United States | | 1,780 | | 7,276 | | 9,056 | | 1,683 | | 11,584 | | 13,267 |
| Africa | | 839 | | 1,380 | | 2,219 | | 69 | | 811 | | 880 |
| Rest of the World | | 1,940 | | 2,973 | | 4,913 | | 3,709 | | 3,206 | | 6,915 |
Loans and advances to banks | | 12,176 | | 18,754 | | 30,930 | | 7,535 | | 23,574 | | 31,109 |
Table 5: Interest rate sensitivity of loans and advances to customers(a)
| | | | | | | | | | | | |
| | | 2006 | | 2005 |
At 31st December | | Fixed
rate
£m | | Variable
rate
£m | | Total
£m | | Fixed
rate
£m | | Variable
rate
£m | | Total
£m |
| United Kingdom | | 43,700 | | 126,818 | | 170,518 | | 49,988 | | 113,771 | | 163,759 |
| Other European Union | | 9,258 | | 34,172 | | 43,430 | | 7,317 | | 31,606 | | 38,923 |
United States | | 4,818 | | 20,859 | | 25,677 | | 2,260 | | 20,665 | | 22,925 |
Africa | | 3,952 | | 27,739 | | 31,691 | | 4,314 | | 28,907 | | 33,221 |
Rest of the World | | 4,272 | | 10,043 | | 14,315 | | 5,604 | | 7,910 | | 13,514 |
Loans and advances to customers | | 66,000 | | 219,631 | | 285,631 | | 69,483 | | 202,859 | | 272,342 |
Note
| (a) | Where a loan is earning a fixed rate of interest on the reporting date, it is included as a fixed rate loan, regardless of the term for which the rate is fixed. |
| | |
| 92 | | Barclays PLC Annual Report 2006 |
| |
Table 6: Loans and advances to customers by industry
| | | | | | | | | | |
| | | IFRS | | UK GAAP |
| At 31st December | | 2006
£m | | 2005
£m | | 2004(a)
£m | | 2003
£m | | 2002
£m |
Financial services | | 45,954 | | 43,102 | | 25,132 | | 9,872 | | 7,587 |
Agriculture, forestry and fishing | | 3,997 | | 3,785 | | 2,345 | | 2,115 | | 2,069 |
Manufacturing | | 15,451 | | 13,779 | | 9,044 | | 7,844 | | 9,002 |
Construction | | 4,056 | | 5,020 | | 3,278 | | 2,534 | | 2,229 |
Property | | 16,528 | | 16,325 | | 8,992 | | 6,728 | | 5,863 |
Energy and water | | 6,810 | | 6,891 | | 3,709 | | 3,150 | | 3,988 |
Wholesale and retail, distribution and leisure | | 15,490 | | 17,760 | | 11,099 | | 9,628 | | 8,415 |
Transport | | 5,586 | | 5,960 | | 3,742 | | 3,654 | | 3,900 |
Postal and communication | | 2,180 | | 1,313 | | 834 | | 698 | | 950 |
Business and other services | | 29,425 | | 24,247 | | 23,223 | | 13,913 | | 14,179 |
Home loans(b) | | 98,172 | | 89,529 | | 80,855 | | 72,318 | | 64,738 |
Other personal | | 31,840 | | 35,543 | | 27,602 | | 23,922 | | 22,272 |
Overseas customers(c) | | – | | – | | – | | 8,666 | | 10,635 |
Finance lease receivables | | 10,142 | | 9,088 | | 6,938 | | 5,877 | | 4,389 |
Loans and advances to customers excluding reverse repurchase agreements | | 285,631 | | 272,342 | | 206,793 | | 170,919 | | 160,216 |
Reverse repurchase agreements | | n/a | | n/a | | 58,304 | | n/a | | n/a |
Trading business | | n/a | | n/a | | n/a | | 58,961 | | 45,176 |
Loans and advances to customers | | 285,631 | | 272,342 | | 265,097 | | 229,880 | | 205,392 |
Table 7: Loans and advances to customers in the UK
| | | | | | | | | | |
| | | IFRS | | UK GAAP |
| At 31st December | | 2006
£m | | 2005
£m | | 2004(a)
£m | | 2003
£m | | 2002
£m |
Financial services | | 14,011 | | 11,958 | | 8,774 | | 7,721 | | 6,158 |
Agriculture, forestry and fishing | | 2,307 | | 2,409 | | 1,963 | | 1,766 | | 1,747 |
Manufacturing | | 9,047 | | 8,469 | | 5,684 | | 5,967 | | 6,435 |
Construction | | 2,761 | | 3,090 | | 2,285 | | 1,883 | | 1,825 |
Property | | 10,010 | | 10,547 | | 7,912 | | 6,341 | | 5,695 |
Energy and water | | 2,360 | | 2,701 | | 802 | | 1,286 | | 1,290 |
Wholesale and retail distribution and leisure | | 12,951 | | 12,747 | | 9,356 | | 8,886 | | 7,858 |
Transport | | 2,745 | | 2,797 | | 1,822 | | 2,579 | | 2,366 |
Postal and communication | | 899 | | 455 | | 440 | | 476 | | 694 |
Business and other services | | 19,266 | | 15,403 | | 13,439 | | 12,030 | | 11,693 |
Home loans(b) | | 67,687 | | 61,256 | | 63,039 | | 61,905 | | 58,436 |
Other personal | | 22,551 | | 26,724 | | 25,181 | | 21,905 | | 21,357 |
Overseas customers(c) | | – | | – | | – | | 5,477 | | 6,201 |
Finance lease receivables | | 3,923 | | 5,203 | | 5,551 | | 5,587 | | 4,145 |
Loans and advances to customers in the UK | | 170,518 | | 163,759 | | 146,248 | | 143,809 | | 135,900 |
The category ‘other personal’ includes credit cards, personal loans and personal overdrafts.
The industry classifications in Tables 6-10 have been prepared at the level of the borrowing entity. This means that a loan to the subsidiary of a major corporation is classified by the industry in which the subsidiary operates, even though the parent’s predominant business may be in a different industry.
Notes
| (a) | Does not reflect the application of IAS 32, IAS 39 and IFRS 4 which became effective from 1st January 2005. |
| (b) | Excludes commercial property mortgages. |
| (c) | Overseas customers are now classified as part of other industry segments. |
| | |
Barclays PLC Annual Report 2006 | | 93 |
| |
Risk management
Statistical information
Table 8: Loans and advances to customers in other European Union countries
| | | | | | | | | | |
| | | IFRS | | UK GAAP |
| At 31st December | | 2006
£m | | 2005
£m | | 2004(a)
£m | | 2003
£m | | 2002
£m |
Financial services | | 5,629 | | 3,982 | | 2,419 | | 1,205 | | 371 |
Agriculture, forestry and fishing | | 786 | | 155 | | 280 | | 147 | | 165 |
Manufacturing | | 3,147 | | 2,254 | | 2,021 | | 1,275 | | 1,422 |
Construction | | 639 | | 803 | | 716 | | 609 | | 314 |
Property | | 2,162 | | 3,299 | | 344 | | 346 | | 137 |
Energy and water | | 2,050 | | 1,490 | | 940 | | 409 | | 367 |
Wholesale and retail distribution and leisure | | 776 | | 952 | | 810 | | 426 | | 215 |
Transport | | 1,465 | | 1,695 | | 640 | | 566 | | 252 |
Postal and communication | | 580 | | 432 | | 111 | | 40 | | 173 |
Business and other services | | 2,349 | | 3,594 | | 3,795 | | 1,251 | | 1,648 |
Home loans(b) | | 18,616 | | 16,488 | | 11,828 | | 10,334 | | 6,243 |
Other personal | | 3,672 | | 1,909 | | 1,369 | | 1,769 | | 721 |
Overseas customers(c) | | – | | – | | – | | 438 | | 384 |
Finance lease receivables | | 1,559 | | 1,870 | | 937 | | 212 | | 167 |
Loans and advances to customers in other European Union countries | | 43,430 | | 38,923 | | 26,210 | | 19,027 | | 12,579 |
| | | | | |
| See note under Table 7. | | | | | | | | | | |
Table 9: Loans and advances to customers in the United States | | | | | | | | | | |
| | | IFRS | | UK GAAP |
| At 31st December | | 2006
£m | | 2005
£m | | 2004(a)
£m | | 2003
£m | | 2002
£m |
Financial services | | 17,516 | | 16,229 | | 9,942 | | 919 | | 1,036 |
Agriculture, forestry and fishing | | 2 | | 1 | | – | | 1 | | 3 |
Manufacturing | | 519 | | 937 | | 388 | | 341 | | 842 |
Construction | | 13 | | 32 | | 139 | | 2 | | 31 |
Property | | 1,714 | | 329 | | 394 | | 1 | | 15 |
Energy and water | | 1,078 | | 1,261 | | 891 | | 1,358 | | 2,229 |
Wholesale and retail distribution and leisure | | 403 | | 794 | | 466 | | 77 | | 141 |
Transport | | 128 | | 148 | | 186 | | 468 | | 1,248 |
Postal and communication | | 36 | | 236 | | 63 | | 153 | | 46 |
Business and other services | | 1,585 | | 1,185 | | 1,565 | | 220 | | 441 |
Home loans(b) | | 349 | | 2 | | 5,768 | | – | | – |
Other personal | | 2,022 | | 1,443 | | 845 | | – | | – |
Overseas customers(c) | | – | | – | | – | | – | | 62 |
Finance lease receivables | | 312 | | 328 | | 335 | | 33 | | 44 |
Loans and advances to customers in the United States | | 25,677 | | 22,925 | | 20,982 | | 3,573 | | 6,138 |
See note under Table 7.
Notes
| (a) | Does not reflect the application of IAS 32, IAS 39 and IFRS 4 which became effective from 1st January 2005. The 2004 analysis excludes reverse repurchase agreements. |
| (b) | Excludes commercial property mortgages. |
| (c) | Overseas customers are now classified as part of other industry segments. |
| | |
| 94 | | Barclays PLC Annual Report 2006 |
| |
Table 10: Loans and advances to customers in Africa
| | | | | | | | | | |
| | | IFRS | | UK GAAP |
| At 31st December | | 2006
£m | | 2005
£m | | 2004(a)
£m | | 2003
£m | | 2002
£m |
Financial services | | 2,821 | | 4,350 | | 186 | | 27 | | 22 |
Agriculture, forestry and fishing | | 889 | | 1,193 | | 102 | | 201 | | 154 |
Manufacturing | | 1,747 | | 1,501 | | 313 | | 261 | | 303 |
Construction | | 591 | | 1,068 | | 76 | | 40 | | 59 |
Property | | 1,987 | | 1,673 | | 87 | | 40 | | 16 |
Energy and water | | 156 | | 193 | | 184 | | 97 | | 102 |
Wholesale and retail distribution and leisure | | 1,050 | | 2,774 | | 165 | | 239 | | 201 |
Transport | | 354 | | 394 | | 137 | | 41 | | 34 |
Postal and communication | | 241 | | 27 | | 52 | | 29 | | 37 |
Business and other services | | 3,416 | | 1,883 | | 1,012 | | 412 | | 397 |
Home loans(b) | | 11,223 | | 11,630 | | 214 | | 79 | | 59 |
Other personal | | 2,976 | | 4,955 | | 190 | | 248 | | 194 |
Finance lease receivables | | 4,240 | | 1,580 | | 41 | | 45 | | 33 |
Loans and advances to customers in Africa | | 31,691 | | 33,221 | | 2,759 | | 1,759 | | 1,611 |
| | | | | |
| See note under Table 7. | | | | | | | | | | |
Table 11: Loans and advances to customers in the Rest of the World
| | | | | | | | | | |
| | | IFRS | | UK GAAP |
| At 31st December | | 2006
£m | | 2005
£m | | 2004(a)
£m | | 2003
£m | | 2002
£m |
Loans and advances | | 14,207 | | 13,407 | | 10,520 | | 2,751 | | 3,988 |
Finance lease receivables | | 108 | | 107 | | 74 | | – | | – |
Loans and advances to customers in the Rest of the World | | 14,315 | | 13,514 | | 10,594 | | 2,751 | | 3,988 |
Notes
| (a) | Does not reflect the application of IAS 32, IAS 39 and IFRS 4 which became effective from 1st January 2005. The 2004 analysis excludes reverse repurchase agreements. |
| (b) | Excludes commercial property mortgages. |
| | |
Barclays PLC Annual Report 2006 | | 95 |
| |
Risk management
Statistical information
Table 12: Maturity analysis of loans and advances to customers
| | | | | | | | | | | | | | | | | | |
| At 31st December 2006 | | On demand
£m | | Not more
than three
months
£m | | Over three
months
but not
more than
six months
£m | | Over six
months but
not more than
one year £m | | Over one
year but
not more
than three
years
£m | | Over three
years
but not
more than
five years
£m | | Over five
years
but not
more than
ten years
£m | | Over
ten years
£m | | Total
£m |
United Kingdom | | | | | | | | | | | | | | | | | | |
Corporate lending(a) | | 22,923 | | 13,569 | | 2,262 | | 2,850 | | 7,562 | | 8,499 | | 8,349 | | 10,342 | | 76,356 |
Other lending to customers in
the United Kingdom | | 3,784 | | 4,427 | | 2,110 | | 3,586 | | 11,937 | | 7,459 | | 16,358 | | 44,501 | | 94,162 |
Total United Kingdom | | 26,707 | | 17,996 | | 4,372 | | 6,436 | | 19,499 | | 15,958 | | 24,707 | | 54,843 | | 170,518 |
Other European Union | | 2,137 | | 6,254 | | 1,744 | | 2,869 | | 4,783 | | 4,397 | | 6,565 | | 14,681 | | 43,430 |
United States | | 2,489 | | 11,630 | | 1,689 | | 3,402 | | 1,949 | | 1,871 | | 1,464 | | 1,183 | | 25,677 |
Africa | | 2,575 | | 2,471 | | 1,272 | | 2,177 | | 5,212 | | 4,177 | | 3,555 | | 10,252 | | 31,691 |
Rest of the World | | 86 | | 6,377 | | 1,015 | | 1,020 | | 1,116 | | 1,465 | | 1,800 | | 1,436 | | 14,315 |
Loans and advances
to customers | | 33,994 | | 44,728 | | 10,092 | | 15,904 | | 32,559 | | 27,868 | | 38,091 | | 82,395 | | 285,631 |
| | | | | | | | | | | | | | | | | | | |
| At 31st December 2005 | | On demand
£m | | Not more
than three
months
£m | | Over three
months but
not more
than
six months
£m | | Over six
months but not
more than one
year
£m | | Over one
year but
not more
than three
years
£m | | Over three
years
but not
more than
five years
£m | | Over five
years
but not
more than
ten years
£m | | Over
ten years
£m | | Total
£m |
United Kingdom | | | | | | | | | | | | | | | | | | |
Corporate lending(a) | | 14,305 | | 13,108 | | 1,857 | | 2,894 | | 6,494 | | 8,061 | | 7,207 | | 16,651 | | 70,577 |
Other lending to customers in
the United Kingdom | | 10,251 | | 7,167 | | 5,948 | | 8,564 | | 17,098 | | 7,266 | | 5,224 | | 31,664 | | 93,182 |
Total United Kingdom | | 24,556 | | 20,275 | | 7,805 | | 11,458 | | 23,592 | | 15,327 | | 12,431 | | 48,315 | | 163,759 |
Other European Union | | 1,518 | | 5,596 | | 1,266 | | 2,827 | | 3,902 | | 4,712 | | 5,537 | | 13,565 | | 38,923 |
United States | | 3,534 | | 8,258 | | 1,172 | | 4,831 | | 1,221 | | 1,568 | | 1,196 | | 1,145 | | 22,925 |
Africa | | 5,176 | | 3,240 | | 353 | | 2,539 | | 1,829 | | 5,282 | | 5,743 | | 9,059 | | 33,221 |
Rest of the World | | 161 | | 6,911 | | 736 | | 215 | | 710 | | 1,078 | | 1,933 | | 1,770 | | 13,514 |
Loans and advances
to customers | | 34,945 | | 44,280 | | 11,332 | | 21,870 | | 31,254 | | 27,967 | | 26,840 | | 73,854 | | 272,342 |
(Also see chart on page 76.)
Table 13: Loans and advances to borrowers in currencies other than the local currency of the borrower for countries where this exceeds 1% of total Group assets
| | | | | | | | | | |
| | | As % of
assets | | Total
£m | | Banks
and other
financial
institutions
£m | | Governments
and official
institutions
£m | | Commercial
industrial
and other
private
sectors
£m |
At 31st December 2006 – IFRSUnited States | | 1.7 | | 16,579 | | 7,307 | | 89 | | 9,183 |
At 31st December 2005 – IFRS | | | | | | | | | | |
United States | | 2.6 | | 24,274 | | 15,693 | | – | | 8,581 |
At 31st December 2004 – IFRS(b) | | | | | | | | | | |
United States | | 4.0 | | 21,556 | | 10,102 | | 2 | | 11,452 |
Germany | | 1.3 | | 7,128 | | 6,614 | | – | | 514 |
France | | 1.0 | | 5,562 | | 5,019 | | 27 | | 516 |
At 31st December 2006, 2005 and 2004, on an IFRS basis(b) , there were no countries where Barclays had cross-currency loans to borrowers between 0.75% and 1% of total Group assets.
Notes
| (a) | In the UK, finance lease receivables are included in ‘Other lending’, although some leases are to corporate customers. |
| (b) | 2004 does not reflect the applications of IAS 32, IAS 39 and IFRS 4 which became effective from 1st January 2005. Further explanation is provided on page 144. |
| | |
| 96 | | Barclays PLC Annual Report 2006 |
| |
Table 14: Off-balance sheet and other credit exposures as at 31st December
| | | | | | |
| | | 2006
£m | | 2005
£m | | 2004(a)
£m |
Off-balance sheet exposures | | | | | | |
Contingent liabilities | | 39,419 | | 47,143 | | 38,559 |
Commitments | | 205,504 | | 203,785 | | 134,051 |
On-balance sheet exposures | | | | | | |
Balances arising from off-balance sheet financial instruments (OTC derivatives) | | n/a | | n/a | | 18,174 |
London Metal Exchange warrants and other trading positions | | n/a | | n/a | | 952 |
Debt securities – held for trading | | n/a | | n/a | | 87,594 |
– non-trading | | n/a | | n/a | | 42,717 |
Trading portfolio assets | | 177,867 | | 155,723 | | n/a |
Financial assets designated at fair value held on own account | | 31,799 | | 12,904 | | n/a |
Derivative financial instruments | | 138,353 | | 136,823 | | n/a |
Available for sale financial instruments | | 51,703 | | 53,497 | | n/a |
Table 15: Notional principal amounts of credit derivatives as at 31st December
| | | | | | |
| | | 2006
£m | | 2005
£m | | 2004(a)
£m |
Credit derivatives held or issued for trading purposes(b) | | 1,224,548 | | 609,381 | | 186,275 |
Credit derivatives held for risk management purposes | | – | | – | | 5,133 |
Total | | 1,224,548 | | 609,381 | | 191,408 |
Table 16: Non-performing loans summary
| | | | | | | | | | |
| | | IFRS | | UK GAAP |
| | | 2006
£m | | 2005
£m | | 2004(a)
£m | | 2003
£m | | 2002
£m |
Impaired loans | | 4,444 | | 4,550 | | n/a | | n/a | | n/a |
Non-accruing loans | | n/a | | n/a | | 2,115 | | 2,261 | | 2,542 |
Accruing loans where interest is being suspended with or without provisions | | n/a | | n/a | | 492 | | 629 | | 611 |
Other accruing loans against which provisions have been made | | n/a | | n/a | | 943 | | 821 | | 819 |
Subtotal | | 4,444 | | 4,550 | | 3,550 | | 3,711 | | 3,972 |
Accruing loans which are contractually overdue 90 days or more as to principal or interest | | 598 | | 609 | | 550 | | 590 | | 690 |
Restructured loans | | 46 | | 51 | | 15 | | 4 | | 6 |
Non-performing loans | | 5,088 | | 5,210 | | 4,115 | | 4,305 | | 4,668 |
Notes
| (a) | 2004 does not reflect the application of IAS 32, IAS 39 and IFRS 4 which became effective from 1st January 2005. Further explanation is provided on page 144. |
| (b) | Includes credit derivatives held as economic hedges which are not designated as hedges for accounting purposes. |
| | |
Barclays PLC Annual Report 2006 | | 97 |
| |
Risk management
Statistical information
Table 17: Non-performing loans
| | | | | | | | | | | |
| | | IFRS | | | UK GAAP |
| | | 2006
£m | | 2005
£m | | 2004
£m | (a)
| | 2003
£m | | 2002
£m |
Impaired loans: | | | | | | | | | | | |
United Kingdom | | 3,340 | | 2,965 | | n/a | | | n/a | | n/a |
Other European Union | | 410 | | 345 | | n/a | | | n/a | | n/a |
United States | | 129 | | 230 | | n/a | | | n/a | | n/a |
Africa | | 535 | | 831 | | n/a | | | n/a | | n/a |
Rest of the World | | 30 | | 179 | | n/a | | | n/a | | n/a |
Total | | 4,444 | | 4,550 | | n/a | | | n/a | | n/a |
Non-accrual loans: | | | | | | | | | | | |
United Kingdom | | n/a | | n/a | | 1,509 | | | 1,572 | | 1,557 |
Other European Union | | n/a | | n/a | | 243 | | | 143 | | 108 |
United States | | n/a | | n/a | | 258 | | | 383 | | 744 |
Africa | | n/a | | n/a | | 74 | | | 86 | | 72 |
Rest of the World | | n/a | | n/a | | 31 | | | 77 | | 61 |
Total | | n/a | | n/a | | 2,115 | | | 2,261 | | 2,542 |
Accruing loans where interest is being suspended with or without provisions: | | | | | | | | | | | |
United Kingdom | | n/a | | n/a | | 323 | | | 559 | | 480 |
Other European Union | | n/a | | n/a | | 31 | | | 29 | | 35 |
United States | | n/a | | n/a | | – | | | – | | – |
Africa | | n/a | | n/a | | 21 | | | 37 | | 44 |
Rest of the World | | n/a | | n/a | | 117 | | | 4 | | 52 |
Total | | n/a | | n/a | | 492 | | | 629 | | 611 |
Other accruing loans against which provisions have been made: | | | | | | | | | | | |
United Kingdom | | n/a | | n/a | | 865 | | | 760 | | 751 |
Other European Union | | n/a | | n/a | | 27 | | | 35 | | 27 |
United States | | n/a | | n/a | | 26 | | | – | | – |
Africa | | n/a | | n/a | | 21 | | | 22 | | 8 |
Rest of the World | | n/a | | n/a | | 4 | | | 4 | | 33 |
Total | | n/a | | n/a | | 943 | | | 821 | | 819 |
Accruing loans which are contractually overdue 90 days or more as to principal or interest: | | | | | | | | | | | |
United Kingdom | | 516 | | 539 | | 513 | | | 566 | | 687 |
Other European Union | | 58 | | 53 | | 34 | | | 24 | | 3 |
United States | | 3 | | – | | 1 | | | – | | – |
Africa | | 21 | | 17 | | 1 | | | – | | – |
Rest of the World | | – | | – | | 1 | | | – | | – |
Total | | 598 | | 609 | | 550 | | | 590 | | 690 |
Restructured loans: | | | | | | | | | | | |
United Kingdom | | – | | 5 | | 2 | | | 4 | | 4 |
Other European Union | | 10 | | 7 | | – | | | – | | – |
United States | | 22 | | 16 | | 13 | | | – | | – |
Africa | | 14 | | 23 | | – | | | – | | – |
Rest of the World | | – | | – | | – | | | – | | 2 |
Total | | 46 | | 51 | | 15 | | | 4 | | 6 |
Total non-performing loans: | | | | | | | | | | | |
United Kingdom | | 3,856 | | 3,509 | | 3,212 | | | 3,461 | | 3,479 |
Other European Union | | 478 | | 405 | | 335 | | | 231 | | 173 |
United States | | 154 | | 246 | | 298 | | | 383 | | 744 |
Africa | | 570 | | 871 | | 117 | | | 145 | | 124 |
Rest of the World | | 30 | | 179 | | 153 | | | 85 | | 148 |
Non-performing loans | | 5,088 | | 5,210 | | 4,115 | | | 4,305 | | 4,668 |
(Also see chart on page 78.)
Note
| (a) | Does not reflect the application of IAS 32, IAS 39 and IFRS 4 which became effective from 1st January 2005. |
| | |
| 98 | | Barclays PLC Annual Report 2006 |
| |
Table 18: Potential problem loans
| | | | | | | | | | |
| | | IFRS | | UK GAAP |
| | | 2006
£m | | 2005
£m | | 2004(a)
£m | | 2003
£m | | 2002
£m |
United Kingdom | | 465 | | 640 | | 658 | | 989 | | 852 |
Other European Union | | 32 | | 26 | | 32 | | 23 | | – |
United States | | 21 | | 12 | | 27 | | 259 | | 241 |
Africa | | 240 | | 248 | | 67 | | 53 | | 63 |
Rest of the World | | 3 | | 3 | | 14 | | 3 | | 6 |
Potential problem loans | | 761 | | 929 | | 798 | | 1,327 | | 1,162 |
(Also see chart on page 78.)
Table 19: Interest foregone on non-performing loans
| | | | | | |
| | | 2006
£m | | 2005
£m | | 2004
£m |
Interest income that would have been recognised under the original contractual terms | | | | | | |
United Kingdom | | 357 | | 304 | | 266 |
Rest of the World | | 70 | | 52 | | 52 |
| Total | | 427 | | 356 | | 318 |
Interest income of approximately £72m (2005: £29m, 2004: £59m) from such loans was included in profit, of which £49m (2005: £20m, 2004: £54m) related to domestic lending and the remainder related to foreign lending.
In addition, a further £98m (2005: £76m, 2004: £n/a) was recognised arising from impaired loans. Following impairment, interest income is recognised using the original effective rate of interest which was used to discount the expected future cash flows for the purpose of measuring the impairment loss. £88m (2005: £70m, 2004: £n/a) of this related to domestic impaired loans and the remainder related to foreign impaired loans.
Table 20: Analysis of impairment/provision charges
| | | | | | | | | | | | | |
| | | IFRS | | UK GAAP | |
| | | 2006
£m | | | 2005
£m | | | 2004(a)
£m | | 2003
£m | | 2002
£m | |
Impairment charge/net specific provisions charge | | | | | | | | | | | | | |
United Kingdom | | 1,880 | | | 1,382 | | | 1,021 | | 1,132 | | 1,041 | |
Other European Union | | 92 | | | 75 | | | 102 | | 37 | | 14 | |
United States | | 12 | | | 76 | | | 57 | | 84 | | 385 | |
Africa | | 143 | | | 37 | | | 27 | | 21 | | 24 | |
Rest of the World | | (53 | ) | | 4 | | | 103 | | 46 | | 22 | |
Impairment on loans and advances | | 2,074 | | | 1,574 | | | n/a | | n/a | | n/a | |
Impairment on available for sale assets | | 86 | | | 4 | | | n/a | | n/a | | n/a | |
Impairment charge | | 2,160 | | | 1,578 | | | n/a | | n/a | | n/a | |
Total net specific provisions charge | | n/a | | | n/a | | | 1,310 | | 1,320 | | 1,486 | |
General provisions (release)/charge | | n/a | | | n/a | | | (206) | | 27 | | (2 | ) |
Other credit provisions | | (6 | ) | | (7 | ) | | (11) | | – | | – | |
Impairment/provision charges | | 2,154 | | | 1,571 | | | 1,093 | | 1,347 | | 1,484 | |
(Also see chart on page 80.)
Note
| (a) | Does not reflect the application of IAS 32, IAS 39 and IFRS 4 which became effective from 1st January 2005. |
| | |
Barclays PLC Annual Report 2006 | | 99 |
| |
Risk management
Statistical information
Table 21: Impairment/provisions charges ratios (‘Loan loss ratios’)
| | | | | | | | | | | | | | | |
| | | IFRS | | | UK GAAP | |
| | | 2006
% | | | 2005
% | | | 2004(a) % | | | 2003
% | | | 2002
% | |
Impairment/provisions charges as a percentage of average loans and advances for the year: | | | | | | | | | | | | | | | |
Specific provisions charge | | n/a | | | n/a | | | 0.40 | | | 0.46 | | | 0.58 | |
General provisions charge | | n/a | | | n/a | | | (0.07 | ) | | 0.01 | | | – | |
Impairment charge | | 0.66 | | | 0.58 | | | n/a | | | n/a | | | n/a | |
| Total | | 0.66 | | | 0.58 | | | 0.33 | | | 0.47 | | | 0.58 | |
| Amounts written off (net of recoveries) | | 0.61 | | | 0.50 | | | 0.40 | | | 0.48 | | | 0.43 | |
Table 22: Analysis of allowance for impairment/provision for bad and doubtful debts | | | | | | | | | | | | | | | |
| | | IFRS | | | UK GAAP | |
| | | 2006
£m |
| | 2005
£m |
| | 2004
£m | (a)
| | 2003
£m |
| | 2002
£m |
|
Impairment allowance/Specific provisions | | | | | | | | | | | | | | | |
United Kingdom | | 2,477 | | | 2,266 | | | 1,683 | | | 1,856 | | | 1,790 | |
Other European Union | | 311 | | | 284 | | | 149 | | | 97 | | | 84 | |
United States | | 100 | | | 130 | | | 155 | | | 121 | | | 257 | |
Africa | | 417 | | | 647 | | | 70 | | | 79 | | | 60 | |
Rest of the World | | 30 | | | 123 | | | 90 | | | 80 | | | 70 | |
Specific provision balances | | n/a | | | n/a | | | 2,147 | | | 2,233 | | | 2,261 | |
General provision balances | | n/a | | | n/a | | | 564 | | | 795 | | | 737 | |
Allowance for impairment provision balances | | 3,335 | | | 3,450 | | | 2,711 | | | 3,028 | | | 2,998 | |
Average loans and advances for the year | | 313,614 | | | 271,421 | | | 328,134 | | | 285,963 | | | 256,789 | |
Table 23: Allowance for impairment/provision balance ratios | | | | | | | | | | | | | | | |
| | | IFRS | | | UK GAAP | |
| | | 2006
% |
| | 2005
% |
| | 2004
% | (a)
| | 2003
% |
| | 2002
% |
|
| Allowance for impairment/provision balance at end of year as a percentage of loans and advances at end of year: | | | | | | | | | | | | | | | |
| | | | | |
Specific provision balances | | n/a | | | n/a | | | 0.62 | | | 0.77 | | | 0.86 | |
General provision balances | | n/a | | | n/a | | | 0.16 | | | 0.27 | | | 0.28 | |
Impairment balance | | 1.05 | | | 1.14 | | | n/a | | | n/a | | | n/a | |
| Total | | 1.05 | | | 1.14 | | | 0.78 | | | 1.04 | | | 1.14 | |
Table 24: Movements in allowance for impairment/provisions charge for bad and doubtful debts | | | | | | | | | | | | | | | |
| | | IFRS | | | UK GAAP | |
| | | 2006
£m |
| | 2005
£m |
| | 2004
£m | (a)
| | 2003
£m |
| | 2002
£m |
|
Allowance for impairment/provision balance at beginning of year | | 3,450 | | | 2,637 | | | 2,946 | | | 2,998 | | | 2,716 | |
Acquisitions and disposals | | (23 | ) | | 555 | | | 21 | | | 62 | | | (11 | ) |
Unwind of discount | | (98 | ) | | (76 | ) | | n/a | | | n/a | | | n/a | |
Exchange and other adjustments | | (153 | ) | | 125 | | | (33 | ) | | (18 | ) | | (77 | ) |
Amounts written off | | (2,174 | ) | | (1,587 | ) | | (1,582 | ) | | (1,474 | ) | | (1,220 | ) |
Recoveries | | 259 | | | 222 | | | 255 | | | 113 | | | 106 | |
Impairment/provision charged against profit(b) | | 2,074 | | | 1,574 | | | 1,104 | | | 1,347 | | | 1,484 | |
| Allowance for impairment/provision balance at end of year | | 3,335 | | | 3,450 | | | 2,711 | | | 3,028 | | | 2,998 | |
(Also see chart on page 81.)
Notes
| (a) | Does not reflect the application of IAS 32, IAS 39 and IFRS 4 which became effective from 1st January 2005. |
| (b) | Does not reflect the impairment of available for sale assets or other credit risk provisions in 2005 and 2006. |
| | |
| 100 | | Barclays PLC Annual Report 2006 |
| |
Table 25: Amounts written off
| | | | | | | | | | | | | | | |
| | | IFRS | | | UK GAAP | |
| | | 2006
£m |
| | 2005
£m |
| | 2004
£m | (a)
| | 2003
£m |
| | 2002
£m |
|
United Kingdom | | (1,746 | ) | | (1,302 | ) | | (1,280 | ) | | (1,175 | ) | | (950 | ) |
Other European Union | | (74 | ) | | (56 | ) | | (63 | ) | | (54 | ) | | (31 | ) |
United States | | (46 | ) | | (143 | ) | | (50 | ) | | (215 | ) | | (215 | ) |
Africa | | (264 | ) | | (81 | ) | | (15 | ) | | (13 | ) | | (14 | ) |
Rest of the World | | (44 | ) | | (5 | ) | | (174 | ) | | (17 | ) | | (10 | ) |
Amounts written off | | (2,174 | ) | | (1,587 | ) | | (1,582 | ) | | (1,474 | ) | | (1,220 | ) |
Table 26: Recoveries | |
| | | IFRS | | | UK GAAP | |
| | | 2006
£m |
| | 2005
£m |
| | 2004
£m | (a)
| | 2003
£m |
| | 2002
£m |
|
United Kingdom | | 178 | | | 160 | | | 217 | | | 95 | | | 88 | |
Other European Union | | 18 | | | 13 | | | 9 | | | 7 | | | 7 | |
United States | | 22 | | | 15 | | | 14 | | | 10 | | | 9 | |
Africa | | 33 | | | 16 | | | 4 | | | 1 | | | 1 | |
Rest of the World | | 8 | | | 18 | | | 11 | | | – | | | 1 | |
Recoveries | | 259 | | | 222 | | | 255 | | | 113 | | | 106 | |
Table 27: Impairment allowances/provision charged against profit | |
| | | IFRS | | | UK GAAP | |
| | | 2006
£m |
| | 2005
£m |
| | 2004
£m | (a)
| | 2003
£m |
| | 2002
£m |
|
New and increased impairment allowance/specific provision charge: | | | | | | | | | | | | | | | |
United Kingdom | | 2,253 | | | 1,763 | | | 1,358 | | | 1,373 | | | 1,210 | |
Other European Union | | 182 | | | 113 | | | 131 | | | 57 | | | 33 | |
United States | | 60 | | | 105 | | | 85 | | | 118 | | | 404 | |
Africa | | 209 | | | 109 | | | 47 | | | 33 | | | 36 | |
Rest of the World | | 18 | | | 39 | | | 134 | | | 47 | | | 36 | |
| | 2,722 | | | 2,129 | | | 1,755 | | | 1,628 | | | 1,719 | |
Reversals of impairment allowance/specific provision charge: | | | | | | | | | | | | | | | |
United Kingdom | | (195 | ) | | (221 | ) | | (120 | ) | | (146 | ) | | (81 | ) |
Other European Union | | (72 | ) | | (25 | ) | | (20 | ) | | (13 | ) | | (12 | ) |
United States | | (26 | ) | | (14 | ) | | (14 | ) | | (24 | ) | | (10 | ) |
Africa | | (33 | ) | | (56 | ) | | (16 | ) | | (10 | ) | | (11 | ) |
Rest of the World | | (63 | ) | | (17 | ) | | (20 | ) | | (2 | ) | | (13 | ) |
| | (389 | ) | | (333 | ) | | (190 | ) | | (195 | ) | | (127 | ) |
Recoveries | | (259 | ) | | (222 | ) | | (255 | ) | | (113 | ) | | (106 | ) |
Net impairment allowance/specific provision charge(b) | | 2,074 | | | 1,574 | | | 1,310 | | | 1,320 | | | 1,486 | |
General provision (release)/charge | | n/a | | | n/a | | | (206 | ) | | 27 | | | (2 | ) |
Net charge to profit | | 2,074 | | | 1,574 | | | 1,104 | | | 1,347 | | | 1,484 | |
Notes
| (a) | Does not reflect the application of IAS 32, IAS 39 and IFRS 4 which became effective from 1st January 2005. |
| (b) | Does not reflect the impairment of available for sale assets or other credit risk provisions in 2005 and 2006. |
| | |
Barclays PLC Annual Report 2006 | | 101 |
| |
Risk management
Statistical information
Table 28: Total impairment/specific provision charges for bad and doubtful debts by industry
| | | | | | | | | | | | | | | | | | | | | | | | | | |
| | | IFRS | | | UK GAAP |
| | | 2006 £m | | | | | 2005 £m | | | | | 2004(a) £m | | | | | | 2003 £m | | | | | 2002 £m | | | |
United Kingdom: | | | | | | | | | | | | | | | | | | | | | | | | | | |
Financial services | | 64 | | | | | 22 | | | | | (1 | ) | | | | | 13 | | | | | 1 | | | |
Agriculture, forestry and fishing | | 5 | | | | | 9 | | | | | – | | | | | | (3 | ) | | | | (1 | ) | | |
Manufacturing | | 1 | | | | | 120 | | | | | 28 | | | | | | 79 | | | | | 80 | | | |
Construction | | 17 | | | | | 14 | | | | | 10 | | | | | | (23 | ) | | | | 41 | | | |
Property | | 15 | | | | | 18 | | | | | (42 | ) | | | | | (3 | ) | | | | 8 | | | |
Energy and water | | (7 | ) | | | | 1 | | | | | 3 | | | | | | 13 | | | | | 22 | | | |
Wholesale and retail distribution and leisure | | 88 | | | | | 39 | | | | | 66 | | | | | | 38 | | | | | 37 | | | |
Transport | | 19 | | | | | (27 | ) | | | | (19 | ) | | | | | 100 | | | | | 7 | | | |
Postal and communication | | 15 | | | | | 3 | | | | | (1 | ) | | | | | 1 | | | | | 16 | | | |
Business and other services | | 133 | | | | | 45 | | | | | 64 | | | | | | 76 | | | | | 62 | | | |
Home loans | | 71 | | | | | (1 | ) | | | | 17 | | | | | | 9 | | | | | 4 | | | |
Other personal | | 1,459 | | | | | 1,136 | | | | | 894 | | | | | | 757 | | | | | 748 | | | |
Overseas customers(b) | | – | | | | | – | | | | | – | | | | | | 66 | | | | | 13 | | | |
Finance lease receivables | | – | | | | | 3 | | | | | 2 | | | | | | 9 | | | | | 3 | | | |
| | 1,880 | | | | | 1,382 | | | | | 1,021 | | | | | | 1,132 | | | | | 1,041 | | | |
Overseas | | 194 | | | | | 192 | | | | | 289 | | | | | | 188 | | | | | 445 | | | |
| Impairment/specific provision charges(c) | | 2,074 | | | | | 1,574 | | | | | 1,310 | | | | | | 1,320 | | | | | 1,486 | | | |
The category ‘other personal’ includes credit cards, personal loans and personal overdrafts. The industry classifications in Tables 28, 29 and 30 have been prepared at the level of the borrowing entity. This means that a loan to the subsidiary of a major corporation is classified by the industry in which the subsidiary operates, even though the parent’s predominant business may be in a different industry. Table 29: Allowance for impairment/specific provision for bad and doubtful debts by industry |
| | | IFRS | | | UK GAAP |
| | 2006 | | 2005 | | 2004(a) | | | 2003 | | 2002 |
| | | £m | | | % | | £m | | | % | | £m | | | % | | | £m | | | % | | £m | | | % |
United Kingdom: | | | | | | | | | | | | | | | | | | | | | | | | | | |
Financial services | | 67 | | | 2.0 | | 26 | | | 0.8 | | 7 | | | 0.3 | | | 12 | | | 0.5 | | 1 | | | – |
Agriculture, forestry and fishing | | 17 | | | 0.5 | | 12 | | | 0.3 | | 4 | | | 0.2 | | | 5 | | | 0.2 | | 7 | | | 0.3 |
Manufacturing | | 85 | | | 2.5 | | 181 | | | 5.2 | | 37 | | | 1.7 | | | 58 | | | 2.6 | | 98 | | | 4.3 |
Construction | | 16 | | | 0.5 | | 13 | | | 0.4 | | 6 | | | 0.3 | | | 7 | | | 0.3 | | 35 | | | 1.6 |
Property | | 26 | | | 0.8 | | 24 | | | 0.7 | | 26 | | | 1.2 | | | 3 | | | 0.1 | | 9 | | | 0.4 |
Energy and water | | – | | | – | | 18 | | | 0.5 | | 23 | | | 1.0 | | | 27 | | | 1.2 | | 28 | | | 1.3 |
Wholesale and retail distribution and leisure | | 81 | | | 2.4 | | 99 | | | 2.9 | | 70 | | | 3.3 | | | 52 | | | 2.3 | | 54 | | | 2.4 |
Transport | | 24 | | | 0.7 | | 32 | | | 0.9 | | 55 | | | 2.6 | | | 103 | | | 4.6 | | 7 | | | 0.3 |
Postal and communication | | 12 | | | 0.4 | | 2 | | | 0.1 | | 13 | | | 0.6 | | | 15 | | | 0.7 | | 15 | | | 0.7 |
Business and other services | | 186 | | | 5.6 | | 102 | | | 3.0 | | 105 | | | 4.9 | | | 121 | | | 5.4 | | 92 | | | 4.1 |
Home loans | | 81 | | | 2.4 | | 50 | | | 1.4 | | 58 | | | 2.7 | | | 55 | | | 2.5 | | 53 | | | 2.3 |
Other personal | | 1,882 | | | 56.5 | | 1,696 | | | 49.2 | | 1,265 | | | 58.9 | | | 1,359 | | | 60.9 | | 1,343 | | | 59.4 |
Overseas customers(b) | | – | | | – | | – | | | – | | – | | | – | | | 24 | | | 1.1 | | 39 | | | 1.7 |
Finance lease receivables | | – | | | – | | 11 | | | 0.3 | | 14 | | | 0.7 | | | 15 | | | 0.7 | | 9 | | | 0.4 |
| | 2,477 | | | 74.3 | | 2,266 | | | 65.7 | | 1,683 | | | 78.4 | | | 1,856 | | | 83.1 | | 1,790 | | | 79.2 |
Overseas | | 858 | | | 25.7 | | 1,184 | | | 34.3 | | 464 | | | 21.6 | | | 377 | | | 16.9 | | 471 | | | 20.8 |
Total | | 3,335 | | | 100.0 | | 3,450 | | | 100.0 | | 2,147 | | | 100.0 | | | 2,233 | | | 100.0 | | 2,261 | | | 100.0 |
See note under Table 28.
Notes
| (a) | Does not reflect the application of IAS 32, IAS 39 and IFRS 4 which became effective from 1st January 2005. |
| (b) | Overseas customers are now classified as part of other industry segments. |
| (c) | Does not reflect the impairment of available for sale assets or other credit risk provisions in 2005 and 2006. |
| | |
| 102 | | Barclays PLC Annual Report 2006 |
| |
Table 30: Analysis of amounts written off and recovered by industry
| | | | | | | | | | | | | | | | | | | | | |
| | | Amounts written off for the year | | Recoveries of amounts previously written off |
| | IFRS | | UK GAAP | | IFRS | | | UK GAAP |
| | | 2006
£m | | 2005
£m | | 2004(a) £m | | 2003
£m | | 2002
£m | | 2006
£m | | 2005
£m | | 2004(a) £m | | | 2003
£m | | 2002
£m |
United Kingdom: | | | | | | | | | | | | | | | | | | | | | |
Financial services | | 13 | | 2 | | 7 | | 14 | | 2 | | – | | 1 | | 3 | | | 12 | | – |
Agriculture, forestry and fishing | | 8 | | 3 | | 2 | | – | | 4 | | 1 | | – | | 1 | | | 1 | | 2 |
Manufacturing | | 73 | | 47 | | 79 | | 126 | | 72 | | 21 | | 11 | | 30 | | | 8 | | 22 |
Construction | | 17 | | 15 | | 13 | | 19 | | 15 | | 2 | | 1 | | 2 | | | 14 | | 3 |
Property | | 23 | | 4 | | 2 | | 5 | | 10 | | 6 | | 1 | | 69 | | | 1 | | 2 |
Energy and water | | 1 | | 22 | | 9 | | 15 | | 4 | | 2 | | – | | 2 | | | – | | 1 |
Wholesale and retail distribution and leisure | | 120 | | 85 | | 55 | | 45 | | 53 | | 14 | | 25 | | 7 | | | 5 | | 11 |
Transport | | 11 | | 29 | | 44 | | 5 | | 7 | | 1 | | 10 | | 15 | | | 1 | | 1 |
Postal and communication | | 5 | | 15 | | 2 | | 1 | | 2 | | – | | – | | 1 | | | – | | – |
Business and other services | | 124 | | 83 | | 96 | | 58 | | 65 | | 17 | | 14 | | 16 | | | 11 | | 13 |
Home loans | | 34 | | 2 | | 19 | | 11 | | 11 | | 11 | | 9 | | 5 | | | 3 | | 1 |
Other personal | | 1,317 | | 992 | | 948 | | 790 | | 692 | | 103 | | 87 | | 65 | | | 38 | | 31 |
Overseas customers(b) | | – | | – | | – | | 82 | | 9 | | – | | – | | – | | | – | | – |
Finance lease receivables | | – | | 3 | | 4 | | 4 | | 4 | | – | | 1 | | 1 | | | 1 | | 1 |
| | 1,746 | | 1,302 | | 1,280 | | 1,175 | | 950 | | 178 | | 160 | | 217 | | | 95 | | 88 |
Overseas | | 428 | | 285 | | 302 | | 299 | | 270 | | 81 | | 62 | | 38 | | | 18 | | 18 |
Total | | 2,174 | | 1,587 | | 1,582 | | 1,474 | | 1,220 | | 259 | | 222 | | 255 | | | 113 | | 106 |
See note under Table 28. Table 31: Total impairment allowance/(provision) coverage of non-performing loans |
| | | IFRS | | | UK GAAP |
| | | 2006
% | | 2005
% | | 2004(a)
% |
| | 2003
% | | 2002
% |
United Kingdom | | 64.2 | | 64.6 | | 68.1 | | | 74.2 | | 71.2 |
Other European Union | | 65.1 | | 70.1 | | 60.9 | | | 71.4 | | 61.8 |
United States | | 64.9 | | 52.8 | | 57.0 | | | 39.2 | | 43.7 |
Africa | | 73.2 | | 74.3 | | 68.4 | | | 54.5 | | 48.4 |
Rest of the World | | 100.0 | | 68.7 | | 71.9 | | | 94.1 | | 47.3 |
Total coverage of non-performing loans | | 65.6 | | 66.2 | | 66.9 | | | 71.5 | | 65.9 |
(Also see chart on page 79.) Table 32: Total impairment allowance/(provision) coverage of potential credit risk lending (NPLs and PPLs) |
| | | IFRS | | | UK GAAP |
| | | 2006
% | | 2005
% | | 2004
% | (a)
| | 2003
% | | 2002
% |
United Kingdom | | 57.3 | | 54.6 | | 56.5 | | | 57.7 | | 57.2 |
Other European Union | | 61.0 | | 65.9 | | 55.6 | | | 65.0 | | 61.8 |
United States | | 57.1 | | 50.4 | | 52.3 | | | 23.4 | | 33.0 |
Africa | | 51.5 | | 57.8 | | 43.5 | | | 39.9 | | 32.1 |
Rest of the World | | 91.0 | | 67.6 | | 65.9 | | | 90.9 | | 45.5 |
Total coverage of potential credit risk lending | | 57.0 | | 56.2 | | 56.0 | | | 54.6 | | 52.8 |
(Also see chart on page 79.)
Notes
| (a) | Does not reflect the application of IAS 32, IAS 39 and IFRS 4 which became effective from 1st January 2005. |
| (c) | Does not reflect the impairment of available for sale assets or other credit risk provisions in 2005 and 2006. |
| | |
Barclays PLC Annual Report 2006 | | 103 |
| |
Critical accounting estimates
The Group’s accounting policies are set out on pages 147 to 156. Certain of these policies, as well as estimates made by management, are considered to be important to an understanding of the Group’s financial condition since they require management to make difficult, complex or subjective judgements and estimates, some of which may relate to matters that are inherently uncertain. The following accounting policies include estimates which are particularly sensitive in terms of judgements and the extent to which estimates are used. Other accounting policies involve significant amounts of judgements and estimates, but the total amounts involved are not significant to the financial statements. Management has discussed the accounting policies and critical accounting estimates with the Board Accounts Committee.
Fair value of financial instruments
Some of the Bank’s financial instruments are carried at fair value through profit or loss, including derivatives held for trading or risk management purposes. The fair value of a financial instrument is the amount at which the instrument could be exchanged in a current transaction between willing parties, other than in a forced or liquidation sale. Financial instruments entered into as trading transactions, together with any associated hedging, are measured at fair value and the resultant profits and losses are included in net trading income, along with interest and dividends arising from long and short positions and funding costs relating to trading activities. Assets and liabilities resulting from gains and losses on financial instruments held for trading are reported gross in trading portfolio assets and liabilities or derivative financial instruments, reduced by the effects of netting agreements where there is an intention to settle net with counterparties.
Financial instruments are either priced with reference to a quoted market price for that instrument or by using a valuation model. Where the fair value is calculated using financial markets pricing models, the methodology is to calculate the expected cash flows under the terms of each specific contract and then discount these values back to a present value. These models use as their basis independently sourced market parameters including, for example, interest rate yield curves, equities and commodities prices, option volatilities and currency rates. Most market parameters are either directly observable or are implied from instrument prices. However, profits or losses are recognised upon initial recognition only when such profits can be measured solely by reference to observable current market transactions or valuation techniques based solely on observable market inputs.
The calculation of fair value for any financial instrument may also require adjustment of the quoted price or model value to reflect the cost of credit risk (where not embedded in underlying models or prices used), or to reflect hedging costs not captured in pricing models (to the extent they would be taken into account by a market participant in determining a price). The process of calculating fair value on illiquid instruments or from a valuation model may require estimation of certain pricing parameters, assumptions or model characteristics. These estimates are calibrated against industry standards, economic models and observed transaction prices.
The effect of changing these assumptions for those financial instruments for which the fair values were measured using valuation techniques that are determined in full or in part on assumptions that are not supported by observable market prices to a range of reasonably possible alternative assumptions, would be to provide a range of £123m (2005: £87m) lower to £139m (2005: £121m) higher than the fair values recognised in the financial statements. The fair value of financial instruments is provided in Note 58 to the accounts.
Allowances for loan impairment
Allowances for loan impairment represent management’s estimate of the losses incurred in the loan portfolios as at the balance sheet date. Changes to the allowances for loan impairment and changes to the provisions for undrawn contractually committed facilities and guarantees provided are reported in the consolidated income statement as part of the impairment charge.
Within the retail and small businesses portfolios, which comprise large numbers of small homogeneous assets with similar risk characteristics where credit scoring techniques are generally used, statistical techniques are used to calculate impairment allowances on a portfolio basis, based on historical recovery rates and assumed emergence periods. These statistical analyses use as primary inputs the extent to which accounts in the portfolio are in arrears and historical information on the eventual losses encountered from such delinquent portfolios. There are many such models in use, each tailored to a product, line of business or customer category. The models are updated from time to time. However, experience suggests that the models are reliable and stable, stemming from the very large numbers of accounts from which the model building information is drawn. Judgement and knowledge is needed in selecting the statistical methods to use when the models are developed or revised. The impairment allowance reflected in the financial statements for these portfolios is therefore considered to be reasonable and supportable. The impairment charge reflected in the income statement for these portfolios is £1,809m (2005: £1,254m) and amounts to 87% (2005: 80%) of the total impairment charge in 2006.
For larger accounts, impairment allowances are calculated on an individual basis and all relevant considerations that have a bearing on the expected future cash flows are taken into account, for example, the business prospects for the customer, the realisable value of collateral, the Group’s position relative to other claimants, the reliability of customer information and the likely cost and duration of the work-out process. The level of the impairment allowance is the difference between the value of the discounted expected future cash flows (discounted at the loan’s original effective interest rate), and its carrying amount. Subjective judgements are made in this process. Furthermore, judgements change with time as new information becomes available or as work-out strategies evolve, resulting in frequent revisions to the impairment allowance as individual decisions are taken, case by case. Changes in these estimates would result in a change in the allowances and have a direct impact on the impairment charge. The impairment charge reflected in the financial statements in relation to larger accounts is £265m (2005: £320m) or 13% (2005: 20%) of the total impairment charge in 2006. Further information on impairment allowances is set out on pages 79 to 81.
| | |
| 104 | | Barclays PLC Annual Report 2006 |
| |
Goodwill
Management have to consider at least annually whether the current carrying value of goodwill is impaired. The first step of the impairment review process requires the identification of independent operating units, by dividing the Group business into as many largely independent income streams as is reasonably practicable. The goodwill is then allocated to these independent operating units. The first element of this allocation is based on the areas of the business expected to benefit from the synergies derived from the acquisition. The second element reflects the allocation of the net assets acquired and the difference between the consideration paid for those net assets and their fair value. This allocation is reviewed following business reorganisation. The carrying value of the operating unit, including the allocated goodwill, is compared to its fair value to determine whether any impairment exists. If the fair value of an operating unit is less than its carrying value, goodwill will be impaired. Detailed calculations may need to be carried out taking into consideration changes in the market in which a business operates (e.g. competitive activity, regulatory change). In the absence of readily available market price data this calculation is based upon discounting expected pre-tax cash flows at a risk adjusted interest rate appropriate to the operating unit, the determination of both of which requires the exercise of judgement. The estimation of pre-tax cash flows is sensitive to the periods for which detailed forecasts are available and to assumptions regarding the long-term sustainable cash flows. While forecasts are compared with actual performance and external economic data, expected cash flows naturally reflect management’s view of future performance. The most significant amounts of goodwill relate to the Absa and Woolwich acquisitions. The goodwill impairment testing performed in 2006 indicated that none of the goodwill was impaired.
Intangible assets
Intangible assets that derive their value from contractual customer relationships or that can be separated and sold and have a finite useful life are amortised over their estimated useful life. Determining the estimated useful life of these finite life intangible assets requires an analysis of circumstances, and judgement by the Bank’s management. At each balance sheet date, or more frequently when events or changes in circumstances dictate, intangible assets are assessed for indications of impairment. If indications are present, these assets are subject to an impairment review. The impairment review comprises a comparison of the carrying amount of the asset with its recoverable amount: the higher of the assets’ or the cash-generating unit’s net selling price and its value in use. Net selling price is calculated by reference to the amount at which the asset could be disposed of in a binding sale agreement in an arms-length transaction evidenced by an active market or recent transactions for similar assets. Value in use is calculated by discounting the expected future cash flows obtainable as a result of the asset’s continued use, including those resulting from its ultimate disposal, at a market-based discount rate on a pre-tax basis. The most significant amounts of intangible assets relate to the Absa acquisition.
Retirement benefit obligations
The Group provides pension plans for employees in most parts of the world. Arrangements for staff retirement benefits vary from country to country and are made in accordance with local regulations and customs. For defined contribution schemes, the pension cost recognised in the profit and loss account represents the contributions payable to the scheme. For defined benefit schemes, actuarial valuation of each of the scheme’s obligations using the projected unit credit method and the fair valuation of each of the scheme’s assets are performed annually in accordance with the requirements of IAS 19.
The actuarial valuation is dependent upon a series of assumptions, the key ones being interest rates, mortality, investment returns and expense inflation. Mortality estimates are based on standard industry and national mortality tables, adjusted where appropriate to reflect the Group’s own experience. The returns on fixed interest investments are set to market yields at the valuation date (less an allowance for risk) to ensure consistency with the asset valuation. The returns on UK and overseas equities are set relative to fixed interest returns by considering the long-term expected equity risk premium. The expense inflation assumption reflects long-term expectations of both earnings and retail price inflation.
The difference between the fair value of the plan assets and the present value of the defined benefit obligation at the balance sheet date, adjusted for any historic unrecognised actuarial gains or losses and past service cost, is recognised as a liability in the balance sheet. An asset arising, for example, as a result of past over-funding or the performance of the plan investments, is recognised to the extent that it does not exceed the present value of future contribution holidays or refunds of contributions. To the extent that any unrecognised gains or losses at the start of the measurement year in relation to any individual defined benefit scheme exceed 10% of the greater of the fair value of the scheme assets and the defined benefit obligation for that scheme, a proportion of the excess is recognised in the income statement.
The Group’s IAS 19 pension deficit across all pension and post-retirement schemes as at 31st December 2006 was £817m (2005: £2,879m). This comprises net recognised liabilities of £1,719m (2005: £1,737m) and unrecognised actuarial gains of £902m (2005: losses of £1,142m). The net recognised liabilities comprises retirement benefit liabilities of £1,807m (2005: £1,823m) relating to schemes that are in deficit, and assets of £88m (2005: £86m) relating to schemes that are in surplus. The Group’s IAS 19 pension deficit in respect of the main UK scheme as at 31st December 2006 was £0.5bn (2005: £2.5bn). The estimated actuarial funding position of the main UK pension scheme as at 31st December 2006, estimated from the triennial valuation in 2004, was a surplus of £1.3bn (2005: £0.9bn). Cash contributions to the main UK scheme were £351m (2005: £354m).
Further information on retirement benefit obligations, including assumptions is set out in Note 35 to the accounts.
| | |
Barclays PLC Annual Report 2006 | | 105 |
| |
Intentionally Left Blank
| | |
| 106 | | Barclays PLC Annual Report 2006 |
| |
2 Governance
| | |
Barclays PLC Annual Report 2006 | | 107 |
| |
Board and Executive Committee
Marcus AgiusChairmanAge 60 Marcus joined the Board on 1st September 2006 and succeeded Matthew Barrett as Chairman from 1st January 2007. Marcus is the senior non-executive Director of the BBC and was Chairman of Lazard in London and a Deputy Chairman of Lazard LLC until 31st December 2006. He was formerly Chairman of BAA PLC, a position he held from 2002 until 20th December 2006. Marcus is Trustee to the Board of the Royal Botanic Gardens, Kew and Chairman of The Foundation and Friends of the Royal Botanic Gardens, Kew. From 1st January 2007, Marcus became Chairman of the Board Corporate Governance and Nominations Committee and a member of the Board HR and Remuneration Committee.1
Sir Richard BroadbentSenior Independent DirectorAge 53 Sir Richard joined the Board in September 2003. He was appointed Senior Independent Director on 1st September 2004. Sir Richard is Chairman of Arriva plc and was previously the Executive Chairman of HM Customs and Excise from 2000 to 2003. He was formerly a member of the Group Executive Committee of Schroders plc and a non-executive Director of the Securities Institute. Sir Richard is Chairman of the Board Risk Committee and, from 1st January 2007, Chairman of the Board HR and Remuneration Committee. He is also a member of the Board Corporate Governance and Nominations Committee.2
Leigh CliffordNon-executive DirectorAge 59 Leigh joined the Board on 1st October 2004. Leigh has been a Director of Rio Tinto plc since 1994 and Rio Tinto Limited since 1995 and was appointed Chief Executive of the Rio Tinto Group in 2000. He held various roles at Rio Tinto since joining in 1970, including Managing Director of Rio Tinto Limited and Chief Executive of the Energy Group. He was a member of the Coal Industry Advisory Board of the International Energy Agency for a number of years and its Chairman from 1998 to 2000. He was formerly a Director of Freeport-McMoran Copper & Gold Inc. He is a member of the Board HR and Remuneration Committee.3
Fulvio ContiNon-executive DirectorAge 59 Fulvio joined the Board on 1st April 2006. Fulvio is Chief Executive Officer and General Manager of Enel SpA, the Italian energy group, a position he has held since May 2005. He became Chief Financial Officer of Enel SpA in 1999. Fulvio was formerly Chief Financial Officer and General Manager of Telecom Italia and between 1996 and 1998 was General Manager and Chief Financial Officer of Ferrovie dello Stato, the Italian national railway. From 1991 to 1993 he was head of the accounting, finance, and control department of Montecatini and was subsequently in charge of finance at Montedison-Compart, overseeing the financial restructuring of the group. Fulvio is a member of the Board Audit Committee.4
Dr Danie CronjéNon-executive DirectorAge 60 Danie joined the Board on 1st September 2005 following the acquisition by Barclays of a majority stake in Absa, where he is Chairman. Danie joined Absa in 1987 and was formerly Deputy Chief Executive and Group Chief Executive until 1997. He joined Volkskas in 1975 and held various positions in Volkskas Merchant Bank and Volkskas Group. Danie will retire as Chairman of Absa on 1st July 2007 and will leave the Absa Board on 31st July 2007. He is a member of the Board Risk Committee.5
Professor Dame Sandra DawsonNon-executive DirectorAge 60 Sandra joined the Board in March 2003. She is currently KPMG Professor of Management Studies at the University of Cambridge and has been Master of Sidney Sussex College, Cambridge since 1999. She is also a Trustee of Oxfam and a member of the UK-India Round Table. Until September 2006, Sandra was Director of the Judge Business School at Cambridge, a position she had held since 1995. Sandra has held a range of non-executive posts in organisations including Rand Europe (UK), JP Morgan Fleming Claverhouse Investment Trust, and Riverside Mental Health Trust. She was also a member of the Senior Salaries Review Board. She is a member of the Board Audit Committee.6
Sir Andrew LikiermanNon-executive DirectorAge 63 Sir Andrew joined the Board on 1st September 2004. He was previously Managing Director, Financial Management, Reporting and Audit and Head of the Government Accountancy Service at HM Treasury. He is Professor of Management Practice in Accounting at the London Business School and a non-executive Director of the Bank of England. Sir Andrew was formerly a non-executive Director and Chairman of MORI Group Limited. He is also a non-executive Director and Vice Chairman of the Tavistock and Portman NHS Trust and non-executive Chairman of Applied Intellectual Capital plc. Sir Andrew is a member of the Board Audit and Board Risk Committees.7
Sir Nigel Rudd, DL
Deputy Chairman
Non-executive DirectorAge 60 Sir Nigel joined the Board in February 1996 and was appointed Deputy Chairman on 1st September 2004. He is non-executive Chairman of Pendragon PLC and Alliance Boots PLC and a non-executive Director of BAe Systems PLC and Sappi Limited. He is a member of the Board Corporate Governance and Nominations Committee and, until 31st December 2006, was Chairman of the Board HR and Remuneration Committee. Sir Nigel also chairs the Group’s Brand and Reputation Committee.8
Stephen RussellNon-executive DirectorAge 61 Stephen joined the Board in October 2000 on completion of the acquisition of Woolwich plc. Stephen was Chief Executive of Boots Group PLC from 2000 until 2003, having worked for Boots since 1967. Stephen is a trustee of St. John’s Ambulance and Tommy’s the Baby Charity and is on the Council of Nottingham University. Stephen is Chairman of the Board Audit Committee and is a member of the Board Risk and Board Corporate Governance and Nominations Committees. 9

| | |
| 108 | | Barclays PLC Annual Report 2006 |
| |
Sir John SunderlandNon-executive DirectorAge 61 Sir John joined the Board on 1st June 2005. He has been Chairman of Cadbury Schweppes PLC since May 2003. Sir John joined Cadbury Schweppes in 1968 and was appointed Chief Executive in September 1996. He is Deputy President of the CBI, having retired as President on 31st December 2006, and is a former President of both ISBA (the Incorporated Society of British Advertisers) and the Food and Drink Federation. Sir John is a Director of the Financial Reporting Council, an Adviser to CVC Capital Partners, an Advisory Board Member of Ian Jones & Partners and of Marakon Associates, and an Association Member of BUPA. He is a member of the Board HR and Remuneration and Board Corporate Governance and Nominations Committees.10
John Varley
Group Chief Executive
Executive Director and member of Executive CommitteeAge 50 John was appointed as Group Chief Executive on 1st September 2004, prior to which he had been Group Deputy Chief Executive from 1st January 2004. He held the position of Group Finance Director from 2000 until the end of 2003. John joined the Executive Committee in September 1996 and was appointed to the Board in June 1998. He was Chief Executive of Retail Financial Services from 1998 to 2000 and Chairman of the Asset Management Division from 1995 to 1998. He is Chairman of Business Action on Homelessness, President of the Employers’ Forum on Disability and a member of the International Advisory Panel of the Monetary Authority of Singapore.
John is also a non-executive Director of AstraZeneca PLC and a Director of Ascot Racecourse.11
Robert E Diamond Jr
President, Barclays PLC and CEO, Investment Banking and Investment Management
Executive Director and member of Executive CommitteeAge 55 Bob was appointed President of Barclays PLC and became an executive Director on 1st June 2005. He is responsible for the Investment Banking and Investment Management business for the
Group. He has been a member of the Executive Committee since September 1997. He joined Barclays in July 1996 from CSFB where he was Vice-Chairman and Head of Global Fixed Income and Foreign Exchange.12
Gary Hoffman
Group Vice-Chairman
Executive DirectorAge 46 Gary was appointed as Group Vice-Chairman in July 2006. He was formerly Chairman of UK Banking and of Barclaycard and prior to that was Chief Executive of Barclaycard. He joined the Board on 1st January 2004. As Group Vice-Chairman, Gary is accountable on the Board for a range of responsibilities including Corporate Responsibility, Public Policy, Equality and Diversity, leading the Group’s response to the FSA’s Treating Customers Fairly initiative, chairing the Group’s Governance and Control Committee and franchise health with customers, employees and communities. Gary joined the Group in 1982. Gary is also a non-executive Director of Trinity Mirror PLC.13
Naguib Kheraj
Group Finance Director
Executive Director and member of Executive CommitteeAge 42 Naguib was appointed as Group Finance Director and joined the Board on 1st January 2004. He had previously held the positions of Chief Executive of Barclays Private Clients, Deputy Chairman of Barclays Global Investors, Global Head of Investment Banking and Global Chief Operating Officer at Barclays Capital. He joined the Executive Committee in March 2003. Before joining Barclays, he was a Managing Director and held the post of Chief Financial Officer for Europe at Salomon Brothers. Naguib is also a non-executive Director of Absa Group Limited. Naguib will leave the Board on 31st March 2007 and will be succeeded by Chris Lucas.14
Christopher Lucas
Group Finance Director (from 1st April 2007)
Executive Director and member of Executive Committee from 1st April 2007Age 46 Chris will join the Group and the Board from 1st April 2007 and will succeed Naguib
Kheraj as Group Finance Director. Chris joins Barclays from PricewaterhouseCoopers, where he was UK Head of Financial Services and Global Head of Banking and Capital Markets. He was Global Relationship Partner for Barclays for the 1999-2004 financial years and subsequently held similar roles for other global financial services organisations. Chris has worked across financial services for most of his career, including three years in New York as Head of the US Banking Audit Practice of PricewaterhouseCoopers.15
Frederik (Frits) Seegers
Chief Executive, Global Retail and Commercial Banking
Executive Director and member of Executive CommitteeAge 48 Frits was appointed Chief Executive of Global Retail and Commercial Banking and became an executive Director on 10th July 2006. He is responsible for all Barclays retail and commercial banking operations globally, including UK Banking (Retail and Business), International Retail and Commercial Banking and Barclaycard. He is also a non-executive Director of Absa Group Limited. Frits joined the Board from Citigroup, where he previously held a number of senior positions, most recently CEO Global Consumer Group with a remit covering all retail operations in Europe, Middle East and Africa. He was also a member of the Citigroup Operating Committee and the Citigroup Management Committee.16
Paul Idzik
Chief Operating Officer
Member of Executive CommitteeAge 46 Paul joined the Executive Committee and became Chief Operating Officer in November 2004. He is also Chairman of the Group Operating Committee. Paul was formerly Chief Operating Officer of Barclays Capital. He joined Barclays Capital in August 1999 following a career with Booz Allen & Hamilton, where he was a partner and senior member of the Financial Institutions Practice.17

| | |
Barclays PLC Annual Report 2006 | | 109 |
| |
Directors’ report
Report of the Directors
Profit Attributable
The profit attributable to equity shareholders of Barclays PLC for the year amounted to £4,571m, compared with £3,447m in 2005.
Dividends
The final dividends for the year ended 31st December 2006 of 20.5p per ordinary share of 25p each and 10p per staff share of £1 each have been agreed by the Directors. The final dividends will be paid on 27th April 2007 in respect of the ordinary shares registered at the close of business on 9th March 2007 and in respect of the staff shares so registered on 31st December 2006. With the interim dividends of 10.5p per ordinary share and of 10p per staff share that were paid on 2nd October 2006, the total distribution for 2006 is 31p (2005: 26.6p) per ordinary share and 20p (2005: 20p) per staff share. The dividends for the year absorb a total of £1,973m (2005: £1,687m).
Dividend Reinvestment Plan
Ordinary shareholders may have their dividends reinvested in Barclays PLC ordinary shares by participating in the Dividend Reinvestment Plan. The plan is available to all ordinary shareholders provided that they do not live in, and are not subject to the jurisdiction of, any country where their participation in the plan would require Barclays or The Plan Administrator to take action to comply with local government or regulatory procedures or any similar formalities. Any shareholder wishing to obtain details of the plan and a mandate form should contact The Plan Administrator to Barclays at The Causeway, Worthing, BN99 6DA. Those wishing to participate for the first time in the plan should send their completed mandate form to The Plan Administrator so as to be received by 4th April 2007 for it to be applicable to the payment of the final dividend on 27th April 2007. Existing participants should take no action unless they wish to alter their current mandate instructions, in which case they should contact The Plan Administrator.
Share Capital
The Company did not repurchase any shares during the year. As at 27th February 2007 (the latest practicable date for inclusion in this report), the Company had an unexpired authority to repurchase shares up to a maximum of 968.6 million ordinary shares.
The issued ordinary share capital was increased by 45.1million ordinary shares during the year as a result of the exercise of options under the Sharesave and Executive Share Option Schemes. At 31st December 2006 the issued ordinary share capital totalled 6,534,698,021 shares.
Substantial Shareholdings
Until 19th January 2007, persons with notifiable interests in the Company’s shares were required to notify the Company of such interests under sections 198 to 208 of the Companies Act 1985. As at 19th January 2007, the Company had been notified of the following notifiable interest in its shares:
Legal & General Group plc 3.59%
On 20th January 2007 the Companies Act 1985 provisions in respect of substantial shareholdings were repealed and the Disclosure and Transparency Rules of the FSA came into force.
As at 27th February 2007, the Company had been notified under Rule 5 of the Disclosure and Transparency Rules of the FSA of the following holding of voting rights in its shares(a):
Legal & General Group plc 3.70%.
This substantial shareholder does not have different voting rights from those of our other shareholders.
Board Membership
The membership of the Boards of Directors of Barclays PLC and Barclays Bank PLC is identical and biographical details of the Board members are set out on pages 108 and 109. Frits Seegers was appointed as an executive Director with effect from 10th July 2006. Fulvio Conti and Marcus Agius were appointed as non-executive Directors with effect from 1st April 2006 and 1st September 2006 respectively. Sir David Arculus retired from the Board on 27th April 2006 and Robert Steel retired from the Board on 11th October 2006. Matthew Barrett and David Roberts left the Board on 31st December 2006.
Chris Lucas will join the Board as Group Finance Director on 1st April 2007 and Naguib Kheraj will leave the Board on 31st March 2007.
Retirement and Re-election of Directors
In accordance with its Articles of Association, one-third (rounded down) of the Directors of Barclays PLC are required to retire by rotation at each Annual General Meeting (AGM), together with Directors appointed by the Board since the last AGM. The retiring Directors are eligible to stand for re-election. In addition, under the UK Combined Code on Corporate Governance (the Code), every Director should seek re-election by shareholders at least every three years.
The Directors retiring by rotation at the 2007 AGM and offering themselves for re-election are Stephen Russell, Leigh Clifford, Sir Andrew Likierman and John Varley. Sir Nigel Rudd retires annually in accordance with the Code and is offering himself for re-election. In addition, Frits Seegers and Marcus Agius, who were appointed as Directors since the last AGM, will be offering themselves for re-election at the 2007 AGM. Chris Lucas, who will join the Board on 1st April 2007, will also offer himself for re-election at the 2007 AGM.
Directors’ Interests
Directors’ interests in the shares of the Group on 31st December 2006, according to the register maintained under the Companies Act 1985, are shown on page 136. The register is available for inspection during business hours at the Group’s head office and will be available for inspection at the 2007 AGM.
Note
| (a) | In addition, on 19th March 2007, the Company was notified that Lloyds TSB Group plc held voting rights over 343,955,194 of its shares, amounting to 5.26% of the total voting rights. |
| | |
| 110 | | Barclays PLC Annual Report 2006 |
| |
Directors’ Emoluments
Information on emoluments of Directors of Barclays PLC, in accordance with the Companies Act 1985 and the Listing Rules of the United Kingdom Listing Authority, is given in the Remuneration report on pages 121 to 136 and in Note 46 to the accounts.
Directors’ Indemnities
The Board believes that it is in the best interests of the Group to attract and retain the services of the most able and experienced Directors by offering competitive terms of engagement, including the granting of indemnities on terms consistent with the applicable statutory provisions. Qualifying third-party indemnity provisions (as defined by section 309B of the Companies Act 1985) were accordingly in force during the course of the financial year ended 31st December 2006 for the benefit of the then Directors and, at the date of this report, are in force for the benefit of the Directors in relation to certain losses and liabilities which they may incur (or have incurred) in connection with their duties, powers or office.
Activities
Barclays PLC Group is a major global financial services provider engaged in retail and commercial banking, credit cards, investment banking, wealth management and investment management services. The Group operates through branches, offices and subsidiaries in the UK and overseas.
Community Involvement
The total commitment for 2006 was £46.5m (2005: £39.1m).
The Group committed £39.6m in support of the community in the UK (2005: £35.3m) and £6.9m was committed in international support (2005: £3.8m). The UK commitment includes £35.2m of charitable donations (2005: £16.7m).
Barclays is a member of the Percent Club – a group of companies that have undertaken to ensure that donations to the community over time amount to at least 1% of their UK pre-tax profit.
Barclays has an extensive community programme covering many countries around the world. The Group provides funding and support to over 8,279 charities and voluntary organisations, ranging from small, local charities, like Passage (UK), to international organisations like Unicef. We also have a very successful employee programme which in 2006 saw more than 33,000 employees and pensioners worldwide taking part in Barclays supported volunteering, giving and fundraising activities. Further information on our community involvement is given on pages 139 and 142.
Political Donations
The Group did not give any money for political purposes in the UK nor did it make any donations to EU political organisations or incur any EU political expenditure during the year. Absa Group Limited, in which the Group acquired a majority stake in 2005, made donations totalling £212,729 in 2006 (2005: £224,400) in accordance with its policy of making political donations to the major South African political parties to support the development of democracy in South Africa. The Group made no other political donations in 2006.
At the AGM in 2006, shareholders gave a limited authority for Barclays PLC and Barclays Bank PLC to make political donations and incur political expenditure, within an agreed limit, as a precautionary measure in light of the wide definitions in The Political Parties, Elections and Referendums Act 2000. This was a renewal of an authority given by shareholders in 2002. These authorities, which have not been used, expire on 26th April 2007. The risk of inadvertently breaching The Political Parties, Elections and Referendums Act 2000 remains and the Directors consider it prudent to seek a renewal of the authority given by shareholders for Barclays Bank PLC. A resolution to authorise Barclays Bank PLC to make political donations and incur political expenditure up to a maximum aggregate sum of £125,000 is therefore being proposed at the Barclays PLC 2007 AGM.
Employee Involvement
Barclays is committed to ensuring that employees share in the success of the Group. Staff are encouraged to participate in share option and share purchase schemes and have a substantial sum invested in Barclays shares.
Employees are kept informed of matters of concern to them in a variety of ways, including the corporate news magazines, intranets, briefings and mobile phone SMS messaging. These communications help achieve a common awareness among employees of the financial and economic factors affecting the performance of Barclays.
Barclays is also committed to providing employees with opportunities to share their views and provide feedback on issues that are important to them. An annual (bi-annual in the case of BGI) Employee Opinion Survey is undertaken with results being reported to the Board HR and Remuneration Committee and all employees. Roadshows and employee forums also take place.
In addition, Barclays undertakes regular and formal Group, business unit and project specific consultations with Amicus, our recognised union in the UK.
Equality and Diversity
The diversity agenda at Barclays seeks to include customers, colleagues and suppliers. Our objective is to recruit and retain the best people, regardless of (but not limited to) race, religion, age, gender, sexual orientation or disability. We strive to ensure our workforce reflects the communities in which we operate, and the international nature of the organisation. We recognise that diversity is a key part of responsible business strategy in support of our increasingly global business.
Barclays is committed to providing additional support to employees with disabilities and making it easier for them to inform us of their specific requirements including the introduction of a dedicated intranet site. Through our Reasonable Adjustments Scheme, appropriate assistance can be given, including both physical workplace adjustments, and relevant training and access to trained mentors is also provided for disabled employees. A wide range of recruitment initiatives have been taken to increase the number of people with disabilities working in Barclays.
Health and Safety
Barclays is committed to ensuring the health, safety and welfare of our employees and, so far as is reasonably practicable, to providing and maintaining safe working conditions. Barclays regards legislative compliance as a minimum and where appropriate we seek to implement higher standards. Barclays also recognises its responsibilities towards all persons on Barclays premises, such as contractors, visitors and members of the public, and ensures, so far as is reasonably practicable, that they are not exposed to risks to their health and safety.
In 2006 Barclays reviewed its Statement of Commitment which applies in all business areas in which Barclays has operational control. In this statement, Barclays commits to:
| · | | demonstrate personal leadership that is consistent with this vision; |
| · | | provide the appropriate resources to fulfil this commitment; |
| · | | carry out risk assessments and take appropriate actions to mitigate risk; |
| · | | consult our employees on matters affecting their Health and Safety; |
| · | | ensure that appropriate information, instruction, training and supervision are provided; |
| · | | appoint competent persons to provide specialist advice; and |
| · | | review Barclays Health and Safety Group Process, and the Statement of Commitment, at regular intervals. |
| | |
Barclays PLC Annual Report 2006 | | 111 |
| |
Directors’ report
Barclays monitors its health and safety performance using a variety of measurements on a monthly basis and the Board HR and Remuneration Committee receives annual reports on health and safety performance from the Human Resources Director. As part of its Partnership Agreement with trade union Amicus in the UK, Barclays funds seven full time Health and Safety Representatives.
Creditors’ Payment Policy
Barclays values its suppliers and acknowledges the importance of paying invoices, especially those of small businesses, promptly. Normal policy is to pay all small business purchases within 30 days. It is the Group’s practice to agree terms with suppliers when entering into contracts. We negotiate with suppliers on an individual basis and meet our obligations accordingly. The Group does not follow any specific published code or standard on payment practice.
Paragraph 12(3) of Schedule 7 of the Companies Act 1985 requires disclosure of trade creditor payment days. Disclosure is required by the Company, rather than the Group. The Group’s principal trading subsidiary in the UK is Barclays Bank PLC, the accounts for which are prepared in accordance with International Financial Reporting Standards. The components for the trade creditor calculation are not easily identified. However, by identifying as closely as possible the components that would be required if Schedule 4 of the Companies Act applied, the trade creditor payment days for Barclays Bank PLC for 2006 were 28 days (2005: 35 days). This is an arithmetical calculation and does not necessarily reflect our practice, which is described above, nor the experience of any individual creditor.
Financial Instruments
The Group’s financial risk management objectives and policies, including the policy for hedging each major type of forecasted transaction for which hedge accounting is used, and the exposure to market risk, credit risk and liquidity risk are set out in pages 63 to 90 under the headings, ‘Barclays approach to risk management’, ‘Credit Risk Management’, ‘Market risk management’, ‘Capital and liquidity risk management’ and ‘Derivatives’ and in Note 14 and Notes 52 to 57 to the accounts.
Events after the Balance Sheet Date
On 19th January 2007 Barclays announced that it entered into an agreement to purchase EquiFirst Corporation, the non-prime mortgage origination business of Regions Financial Corporation, for a consideration of approximately US$225m. Completion, which is subject to receipt of the required licences and applicable regulatory approval, as well as a post-closing adjustment based on EquiFirst’s balance sheet at the actual completion date, is expected in the first half of 2007.
On 8th February 2007 Barclays completed the acquisition of Indexchange Investment AG from Bayerische Hypo-und Vereinsbank for a consideration of approximately€240m.
The Auditors
The Board Audit Committee reviews the appointment of the external auditors, as well as their relationship with the Group, including monitoring the Group’s use of the auditors for non-audit services and the balance of audit and non-audit fees paid to the auditors. More details on this can be found on pages 117 and 118 and Note 9 to the accounts. Having reviewed the independence and effectiveness of the external auditors, the Committee has recommended to the Board that the existing auditors, PricewaterhouseCoopers LLP, be reappointed. PricewaterhouseCoopers LLP have signified their willingness to continue in office and ordinary resolutions reappointing them as auditors and authorising the Directors to set their remuneration will be proposed at the 2007 AGM.
So far as each of the Directors are aware, there is no relevant audit information of which the Company’s auditors are unaware. Each of the Directors has taken all the steps that he or she ought to have taken as a Director in order to make himself or herself aware of any relevant audit information and to establish that the Company’s auditors are aware of that information. For these purposes, ‘relevant audit information’ means information needed by the Company’s auditors in connection with preparing their report.
The Annual General Meeting
The Barclays PLC AGM will be held at The Queen Elizabeth II Conference Centre on Thursday 26th April 2007. The Notice of Meeting is included in a separate document sent to shareholders with this report. A summary of the resolutions being proposed at the 2007 AGM is set out below:
Ordinary Resolutions
| · | | To receive the Directors’ and Auditors’ Reports and the Audited Accounts for the year ended 31st December 2006. |
| · | | To approve the Remuneration report for the year ended 31st December 2006. |
| · | | To re-elect the following Directors: |
| · | | To reappoint PricewaterhouseCoopers LLP as auditors of the Company. |
| · | | To authorise the Directors to set the remuneration of the auditors. |
| · | | To authorise Barclays Bank PLC to make political donations. |
| · | | To renew the authority given to the Directors to allot securities. |
Special Resolutions
| · | | To renew the authority given to the Directors to allot securities for cash other than on a pro-rata basis to shareholders and to sell treasury shares. |
| · | | To renew the Company’s authority to purchase its own shares. |
| · | | To adopt new Articles of Association to allow the Company to take advantage of the new provisions of the Companies Act 2006 which enable companies to communicate electronically or via a website with all shareholders. |
This is only a summary of the business to be transacted at the meeting and you should refer to the Notice of Meeting for full details.
By order of the Board

Lawrence Dickinson
Company Secretary
8th March 2007
| | |
| 112 | | Barclays PLC Annual Report 2006 |
| |
Corporate governance
Corporate governance report
Chairman’s Introduction
I am pleased to present my first Corporate Governance report as Chairman of Barclays. We report to you below, as we are required to do, on how we have complied with the UK Combined Code on Corporate Governance in 2006. Good corporate governance is, however, more than a mere statement of compliance. It should aim to set the highest standards which should permeate the entire organisation and everything it does. Barclays has a strong ethos of corporate governance, endorsed and upheld by the Board. I see it as a key part of my role as Chairman to maintain the highest standards of corporate governance and to ensure that we seek compliance with best practice provisions wherever possible. I am indebted to my predecessor as Chairman, Matthew Barrett, for the strong legacy I have inherited. Our corporate governance framework, published in ‘Corporate Governance in Barclays’, is a comprehensive statement of our values and how we put them into practice at Barclays. We review this statement annually to ensure it remains relevant and current and you can find a copy on our website atwww.investorrelations.barclays.com.

|
| Marcus Agius |
| Chairman |
| 8th March 2007 |
Statement from Barclays PLC Board of Directors
For the year ended 31st December 2006, we have complied with the provisions set out in section 1 of the UK Combined Code on Corporate Governance (the Code) and applied the principles of the Code as described below. The Code was revised with effect from 1st November 2006 and the revised Code applies to Barclays with effect from 1st January 2007.
Board Structure and Composition
At the date of this report, the Board is comprised of the Chairman, five executive Directors and nine non-executive Directors. The roles of Chairman and Chief Executive are separate and each has clearly defined responsibilities. The Chairman’s main role is to lead and manage the work of the Board to ensure that it operates effectively, provides appropriate challenge and support for the executive management and fully discharges its legal and regulatory responsibilities. The Group Chief Executive is responsible for the day to day management of the Group, for leading the executive Directors, for recommending strategy to the Board and for making and implementing operational decisions. The Chairman’s role is described fully in our ‘Charter of Expectations’, which sets out the role profile for each of the main positions on the Board, including the Chairman, Deputy Chairman, Senior Independent Director and Committee Chairmen. The Charter of Expectations can be found atwww.investorrelations.barclays.com.
Our aim is to have a Board that has an appropriate balance of skills and experience to support our strategy. In line with the recommendations of the Code, at least half the Board, excluding the Chairman, are independent non-executive Directors. The current balance between executive and non-executive Directors is illustrated in the chart. Further details of the Board’s assessment of the independence of non-executive Directors can be found on page 115.
Balance of non-executive and executive Directors

Sir Richard Broadbent continued as Senior Independent Director during the year. The role of Senior Independent Director is important in providing an additional contact for major shareholders and in monitoring the performance of the Chairman. We have set out what we expect of the role in our Charter of Expectations. During 2006, Sir Richard met with a number of institutional shareholders and shareholder bodies to discuss their views on the Group. He also led the Chairman’s performance evaluation process, consulting with the other non-executive Directors.
We made a number of changes to the Board during the year. Frits Seegers joined the Board in July 2006 to head our Global Retail and Commercial Banking businesses. As part of this realignment of our operations, we announced that David Roberts would leave the Board in late 2006 and that Gary Hoffman had been appointed as Vice-Chairman. One of Gary’s key responsibilities is leading our corporate responsibility agenda. In September 2006, we announced that Matthew Barrett would retire as Chairman at the end of 2006 and that Marcus Agius would succeed him as Chairman. Marcus joined the Board on 1st September 2006 as a non-executive Director. He became Chairman on 1st January 2007 and was independent on appointment.
| | |
Barclays PLC Annual Report 2006 | | 113 |
| |
Corporate governance
Corporate governance report
Fulvio Conti, Chief Executive of Enel SpA, the Italian energy company, joined the Board in April 2006 and brings to the Board both international experience and financial expertise; Fulvio was previously Chief Financial Officer of Enel SpA. Sir David Arculus retired as a non-executive Director in April 2006, having served for nine years, and Robert Steel resigned from the Board in October 2006 in order to take up a senior position in the US Treasury.
We review the balance and composition of our Board and its principal Committees regularly to ensure that we have an appropriate balance and a good mix of skills and experience. We also consider the need to refresh the Board and Committees.
Length of tenure of non-executive Directors
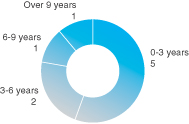
Geographical mix (main experience) of non-executive Directors
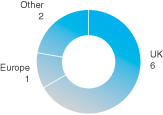
Role of the Board
The Board is responsible to shareholders for creating and sustaining shareholder value through the management of the Group’s businesses. It is also responsible for ensuring that management maintain a system of internal control that provides assurance of effective and efficient operations, internal financial controls and compliance with law and regulation. The Board is the decision-making body for all matters deemed material to the Group in strategic, financial and reputational terms.
The Board has a formal schedule of matters reserved for its decision, including the approval of interim and final financial statements, significant changes in accounting policy and practice, the appointment or removal of Directors or the Company Secretary, changes to the Group’s capital structure and major acquisitions, mergers, disposals and capital expenditure. Further details of the matters reserved to the Board can be found in the document, ‘Corporate Governance in Barclays’.
Specific responsibilities have been delegated to Board Committees, which have access to independent expert advice at the Group’s expense. The terms of reference of our principal Board Committees are available atwww.investorrelations.barclays.com. The principal Board Committees and their activities during 2006 are described on pages 116 to 119.
Responsibility for the day to day management of the Group is delegated to the Group Chief Executive, who is supported by the Group Executive
Committee, which he chairs. The Committee meets weekly to develop strategies and policies for recommendation to the Board and to implement approved strategy.
Attendance at Board and Board Committee meetings
All Directors are expected to attend each Board meeting and each meeting of Board Committees of which they are members, unless there are exceptional circumstances that prevent them from doing so. Meeting dates are generally set well in advance to enable Directors to manage their other commitments. On the few occasions where a Director is unable to attend a particular meeting, he or she will usually discuss the matters to be considered with the Chairman of the meeting to ensure their views are taken into account.
All Directors invested the time required in 2006 to discharge their responsibilities to the Board and, in the case of non-executive Directors, they each met the time commitment expected of them as set out in our Charter of Expectations. All Directors, including the Chairman, must report any material change in their circumstances to the Board for consideration. Executive Directors are permitted to serve on one other listed company board in addition to their duties at Barclays and such appointments must be submitted to the Board for prior approval. The significant other commitments of Directors are reported in their biographies on pages 108 and 109.
Board Meetings
| | | | |
| Director | | Number of
meetings
eligible to
attend in
2006 | | Number of
meetings
attended in
2006 |
Matthew W Barrett | | 8 | | 8 |
Marcus Agius (from 1st September 2006) | | 3 | | 3 |
Sir David Arculus (to 27th April 2006) | | 3 | | 3 |
Sir Richard Broadbent | | 8 | | 8 |
Leigh Clifford | | 8 | | 6 |
Fulvio Conti (from 1st April 2006) | | 6 | | 6 |
Dr Danie Cronjé | | 8 | | 8 |
Professor Dame Sandra Dawson | | 8 | | 8 |
Robert E Diamond Jr | | 8 | | 8 |
Gary Hoffman | | 8 | | 8 |
Naguib Kheraj | | 8 | | 8 |
Sir Andrew Likierman | | 8 | | 8 |
David Roberts | | 8 | | 8 |
Sir Nigel Rudd | | 8 | | 8 |
Stephen Russell | | 8 | | 8 |
Frits Seegers (from 10th July 2006) | | 4 | | 3 |
Robert Steel (to 11th October 2006) | | 6 | | 5 |
Sir John Sunderland | | 8 | | 7 |
John Varley | | 8 | | 8 |
Eight full Board meetings took place in 2006 and the table sets out each Director’s attendance record. The meetings included a full day offsite meeting, devoted to review and approval of Group strategy. The Chairman usually meets privately with all the non-executive Directors prior to each Board meeting to brief them on the business to be considered and to hear any concerns they may have. Eight such meetings took place in 2006. In addition to the eight full meetings held in 2006, two additional Board meetings were held, involving the Chairman, Group Chief Executive and non-executive Directors only, to consider the respective appointments of Frits Seegers and Marcus Agius to the Board. The additional meeting to consider the appointment of Marcus Agius was chaired by Sir Nigel Rudd.
| | |
| 114 | | Barclays PLC Annual Report 2006 |
| |
Regular items for Board meetings include the Finance Director’s Report, the Group Chief Executive’s Report on the key issues affecting the Group and operational performance, strategy updates from the main businesses or functions and reports from each of the principal Board Committees. Strategy execution updates presented in 2006 included UK Retail Banking, International Retail and Commercial Banking, Barclays Capital, Barclaycard, Barclays Global Investors and UK Business Banking. The Board also received strategy updates from the Chief Information Officer and a report on the integration of Absa. Updates are also provided on the Group’s strategy and business in key global regions. The chart sets out how the Board allocated its time at its meetings during 2006.
Board allocation of time
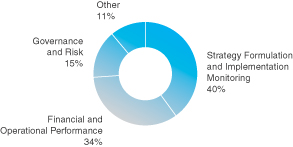
It is part of the Chairman’s role to ensure that Directors receive accurate, timely and clear information about the Group’s performance, to enable the Board to take sound decisions, to monitor effectively and to provide advice to promote the success of the Group. The Chairman works closely with the Company Secretary to ensure that information flows to Directors promptly. Supporting papers for Board and Board Committee meetings are generally distributed at least one week in advance of each meeting. During the year, a Directors’ Intranet was launched, which enables all Directors to access electronic copies of Board papers, reports, minutes and other key documents quickly and securely via a dedicated private network. In addition, all Directors have access to the services of the Company Secretary and his team, who, amongst other things, facilitate information requests and meetings for non-executive Directors with senior management. Independent professional advice is also available, on request, to all Directors at the Company’s expense.
Board Effectiveness
We conduct an annual review of the Board’s performance, which covers the effectiveness of the Board, Board Committees and individual Directors. Following the 2005 Board Effectiveness Review, the Board concluded that it was operating effectively. An action plan was put together to address those areas where the Board felt that some improvements could be made. The actions were primarily focused on ensuring that the Board gained a deeper understanding of the Group’s competitive position and the health of the customer franchise. As a result, improvements were made to the competitor monitoring and customer franchise health reports received by the Board. The Board Corporate Governance and Nominations Committee monitored the progress of the action plan during 2006.
For our 2006 Board Effectiveness Review, we again asked Egon Zehnder International independently to facilitate the evaluation process. This took the form of a detailed questionnaire completed by each Director and supplementary individual interviews, including peer evaluation of fellow Directors. The results of the evaluation were presented to the Board in December 2006 and the Board concluded that it continues to operate effectively. Areas to be covered in the action plan for 2007 include the provision of additional training on risk issues, including risk management and measurement, and continued work on agenda management to ensure there is sufficient time for rigorous debate and exchange of ideas.
Appointment of Directors
The Board Corporate Governance and Nominations Committee is responsible for overseeing the process for appointing new Directors to the Board and it reports on its activities during 2006 on page 120. The process for nominating Directors for appointment is set out in ‘Corporate Governance in Barclays’.
Induction and Training
All new Directors receive a comprehensive induction, tailored to their individual requirements, when they join the Board or a Board Committee. The induction is arranged by the Company Secretary and includes training on Directors’ duties and responsibilities in addition to meetings with the heads of all the major businesses and functions. Training is normally delivered over the initial six-month period following the Director’s appointment. On an ongoing basis, the Company Secretary facilitates additional training and updates for Directors on particular issues, such as Sarbanes-Oxley and Basel II. A two-year programme of business training for non-executive Directors began in 2006, with non-executive Directors attending sessions hosted by International Retail and Commercial Banking and UK Business Banking. Further sessions are planned for 2007.
We also aim to hold some of our Board meetings away from our global headquarters to allow Directors the opportunity to meet our frontline staff and to see our operations at first hand. During 2006, a Board meeting was held at our Barclaycard headquarters in Northampton and further offsite visits will be made in 2007. In addition, non-executive Directors are encouraged to make site visits individually or to liaise with senior management on particular areas of interest.
Re-election of Directors
All Directors are required to seek re-election at least every three years in accordance with the recommendations of the Code. Sir Nigel Rudd, who has served on the Board since 1996, seeks re-election annually as recommended by the Code. Details of Directors proposed for re-election at the 2007 Annual General Meeting (AGM) are given in the Directors’ Report on page 110 and in the Notice of Meeting, which is included separately with the Annual Report.
Independence of non-executive Directors
The Code set outs circumstances which may appear relevant to the Board’s determination of whether a non-executive Director is independent. The Board has also concluded that the following behaviours are essential for the Board to consider a Director to be independent and assesses each non-executive Director against these criteria:
| · | | Provides objective challenge to management. |
| · | | Is prepared to challenge others’ assumptions, beliefs or viewpoints as necessary for the good of the organisation. |
| · | | Questions intelligently, debates constructively, challenges rigorously and decides dispassionately. |
| · | | Is willing to stand up to defend their own beliefs and viewpoints in order to support the ultimate good of the organisation. |
| · | | Has a good understanding of the organisation’s businesses and affairs to enable them to properly evaluate the information and responses provided by management. |
The Board considers the issue of independence on an annual basis. The Board reviewed the independence of non-executive Directors in February 2007 and concluded that each of them continues to demonstrate the behaviours it considers to be essential indicators of independence. In the case of Sir Nigel Rudd, the Board considered the length of his tenure on the Board when assessing his independence. However, the Board concluded that he continued to demonstrate the independent behaviours set out above and that his length of tenure was actually an aid to his independence, given his knowledge and experience of the Group. In the
| | |
Barclays PLC Annual Report 2006 | | 115 |
| |
Corporate governance
Corporate governance report
case of Dr Danie Cronjé, the Board gave particular consideration to his position as Chairman of Absa when assessing his independence, but has determined that, as Dr Cronjé demonstrates the above behaviours, he should be regarded as independent.
Board Committees
The Board has four principal Board Committees, each of which reports on its activities below. Board Committee members are appointed by the Board on the recommendation of the Board Corporate Governance and Nominations Committee, which reviews the composition of each Committee regularly. Committee members are expected to attend each Committee meeting, unless there are exceptional circumstances that prevent them from doing so. The Company Secretary, Lawrence Dickinson, is secretary to the Board Audit Committee, Board Corporate Governance and Nominations Committee and Board Risk Committee and the Deputy Secretary, Patrick Gonsalves, is Secretary to the Board HR and Remuneration Committee.
Board HR and Remuneration Committee
| | | | |
Member | | Number of
meetings
eligible to
attend
in 2006 | | Number of
meetings
attended
in 2006 |
Sir Nigel Rudd (Chairman to 31st December 2006) | | 4 | | 4 |
Sir Richard Broadbent (Chairman from 1st January 2007) | | 4 | | 4 |
Marcus Agius (from 1st January 2007) | | n/a | | n/a |
Sir David Arculus (to 27th April 2006) | | 1 | | 1 |
Leigh Clifford | | 4 | | 3 |
Sir John Sunderland | | 4 | | 4 |
The Committee met four times in 2006 and the table sets out Committee members’ attendance. The Committee was chaired by Sir Nigel Rudd during 2006, who stepped down from the Committee on 31st December 2006. Sir Richard Broadbent became Chairman on 1st January 2007. Marcus Agius joined the Committee on 1st January 2007, following the revisions made to the Code to permit the Chairman of the Board to be a member of the Committee, provided he or she is independent on appointment.
Board HR and Remuneration Committee allocation of time
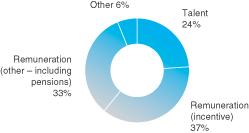
The chart shows how the Committee allocated its time at its meetings in 2006. The Committee’s role and its activities during 2006 are described more fully in the Remuneration report, which can be found on pages 121 to 136.
In late 2006, the Committee carried out a review of its effectiveness as part of the overall Board Effectiveness Review. The review concluded that the Committee is operating effectively.
Board Corporate Governance and Nominations Committee
| | | | |
Member | | Number of
meetings
eligible to
attend
in 2006 | | Number of
meetings
attended
in 2006 |
Matthew W Barrett (Chairman to 31st December 2006) | | 5 | | 5 |
Marcus Agius (member and Chairman from 1st January 2007) | | n/a | | n/a |
Sir David Arculus (to 27th April 2006) | | 1 | | 1 |
Sir Richard Broadbent | | 5 | | 5 |
Sir Nigel Rudd | | 5 | | 5 |
Stephen Russell | | 5 | | 4 |
Sir John Sunderland (from 1st September 2006) | | 1 | | 1 |
The Committee met five times in 2006, including two meetings to deal exclusively with the appointment of the new Chairman. The table sets out Committee members’ attendance at meetings in 2006. The Committee consists of the Chairman, the Deputy Chairman, the Senior Independent Director and the Chairmen of the main Board Committees. Other Directors may be appointed by the Board to the Committee, provided it always has a majority of independent non-executive Directors, and Sir John Sunderland was appointed to the Committee in September. The Chairman of the Board chairs the Committee, except when the Committee is considering the Chairman’s succession, in which case the Deputy Chairman takes the chair. The Group Chief Executive, while not a member of the Committee, attends meetings at the request of the Chairman. Matthew Barrett chaired the Committee during 2006 until his retirement on 31st December 2006. Marcus Agius was appointed to the Committee from 1st January 2007 and as Chairman of the Committee from the same date.
The Committee’s role is set out in its terms of reference, which are available atwww.investorrelations.barclays.com.
Board Corporate Governance and Nominations Committee allocation of time
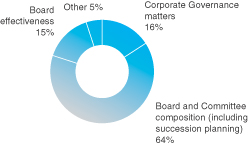
The chart sets out how the Committee allocated its time during 2006.
During 2006, the Committee regularly reviewed Board Committee composition to ensure that the Committees continued to have strong and balanced representation. It recommended the appointment of Fulvio Conti to the Board Audit Committee in order to bring additional financial expertise to that Committee. It also recommended the appointment of Sir Richard Broadbent as Chairman of the Board HR and Remuneration Committee in succession to Sir Nigel Rudd and, following changes to the Code, recommended the appointment of Marcus Agius to that Committee. The Committee received regular reports on the progress of the action plan arising from the 2005 Board Effectiveness Review and monitored the completion of the actions on behalf of the Board. It also received updates on changes in corporate governance best practice and developments in company law, particularly the new statement of Directors’ Duties contained in the Companies Act 2006.
| | |
| 116 | | Barclays PLC Annual Report 2006 |
| |
The main area of focus for the Committee in 2006 was the process of identifying and appointing a successor to Matthew Barrett as Chairman. Sir Nigel Rudd led the Committee during this process and he reports on it separately below. The Committee also received a report from the Group Chief Executive on executive succession planning.
|
Chairman’s Succession During 2006, I was tasked with leading the Committee in the process of selecting and recommending a successor to Matthew Barrett as Chairman. On behalf of the Committee, I engaged a firm of external recruitment consultants to identify potential candidates against the specification for the role set out in the Chairman’s role profile and the criteria we had established. We particularly wanted candidates with a good understanding of the financial services industry and proven ability as Chairman of a large publicly quoted company, whether in the UK or globally. The Committee reviewed a short-list of internal and external candidates. Marcus Agius emerged as the candidate with the experience and capability to succeed Matthew Barrett as Chairman. I facilitated a series of meetings between Marcus, the Group Chief Executive and members of the Committee before the Committee recommended to the Board that we proceed with his appointment. Marcus then met with other Directors and I am delighted that the Board accepted the Committee’s recommendation to appoint him as Chairman. I would like to record my thanks to Matthew Barrett for his assistance in ensuring a smooth transition to the new leadership team. In Marcus Agius I believe we have found a worthy successor as Chairman. He has a proven track record in financial services and as Chairman of a major public company and I look forward to working with him and supporting him in 2007. Sir Nigel Rudd, DL Deputy Chairman 8th March 2007 |
In late 2006, the Committee carried out a review of its effectiveness as part of the overall Board Effectiveness Review. The review concluded that the Committee continues to operate effectively.
Board Audit Committee
| | | | |
| Member | | Number of
meetings
eligible to
attend
in 2006 | | Number of
meetings
attended
in 2006 |
Stephen Russell (Chairman) | | 8 | | 8 |
Fulvio Conti (from 1st September 2006) | | 3 | | 3 |
Professor Dame Sandra Dawson | | 8 | | 7 |
Sir Andrew Likierman | | 8 | | 8 |
Robert Steel (to 11th October 2006) | | 6 | | 5 |
The Committee met eight times in 2006 and the table sets out Committee members’ attendance. Fulvio Conti was appointed to the Committee in September and Robert Steel left the Committee on resigning from the Board in October. Sir Andrew Likierman continued in his role as designated ‘financial expert’ as defined by the US Sarbanes-Oxley Act of 2002, is independent as defined by Rule 10A-3 of the Securities Exchange Act and has ‘recent and relevant financial experience’ as recommended by the Code. The Board’s assessment is based on Sir Andrew’s accounting background and his career with HM Treasury, further details of which can be found in his biography on page 108. Fulvio Conti, who has held a number of Chief financial Officer positions during his career, brings additional, relevant financial experience to the Committee.
Board Audit Committee allocation of time
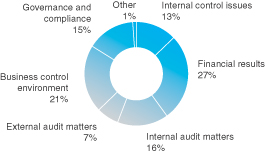
The chart sets out how the Committee allocated its time at its meetings during 2006.
A typical meeting of the Committee includes a report on control issues of Group level significance, along with an in-depth review of the control environment at one of the Group’s major businesses and progress reports on any particular aspects of the Group’s control environment that may have been requested by the Committee. It also includes a report on the non-audit services provided by the auditor, an update on regulatory compliance issues and any whistleblowing incidents and a report from the Barclays Director of Internal Audit, including a private session held without management present.
Stephen Russell, the Chairman of the Committee, reports on the Committee’s activities in more detail below.
|
Board Audit Committee Chairman’s Statement I am pleased to report to you on the Committee’s activities in 2006. We met eight times in 2006. We also met privately with the external and internal auditors after five of our meetings. Our responsibilities as your Board Audit Committee are set out in the Committee’s terms of reference, which are available atwww.investorrelations.barclays.com. I have set out below some of the key activities of the Committee in 2006. External Auditors Our responsibilities include approving and reviewing the appointment and retirement of the external auditors and overseeing their relationship with the Group. In late 2006, we carried out our annual evaluation of the effectiveness of the external auditors, using an evaluation questionnaire, which was completed by senior members of the Finance function. The results of the effectiveness review were considered at our meeting in February 2007. |
| | |
Barclays PLC Annual Report 2006 | | 117 |
| |
Corporate governance
Corporate governance report
|
We also continued to monitor the independence of the external auditors.
We have in place a policy on the provision of non-audit services by the
external auditors and we received regular reports throughout the year on
the nature and amount of the non-audit services provided. Under the
policy, we have agreed which services the external auditors are allowed
to carry out on behalf of the Group and which ones they are prohibited
from doing. Prohibited services include bookkeeping or other services
related to the Group’s accounting records or financial statements,
financial information systems design and implementation, internal audit
outsourcing, management functions or other secondments, human
resource functions, legal and expert services and tax services that involve
advocacy. Any allowable non-audit services require the pre-approval of
the Committee or a member of the Committee before they can be carried
out. For these allowable services, the Committee has pre-approved all
assignments where the expected fee does not exceed £100,000, or
£10,000 in the case of certain taxation services, although such
assignments must be reported to the next meeting of the Committee. Any
assignment where the expected fee is above the relevant threshold
requires specific approval from the Committee. Where any service
requires approval from the Committee, management must give details of
the other potential providers that were considered. A breakdown of the
fees paid to the external auditors during the year is set out on page 167. For the year ended 31st December 2006, we concluded that the external
auditors remain independent and are effective. We have therefore
recommended to the Board that it proposes the reappointment of the
external auditors to shareholders at the 2007 AGM. Relationship with internal audit and monitoring control issues As part of our task of monitoring the effectiveness of the internal audit
function, the Director of Internal Audit, who has a functional reporting line
to the Committee, attended six Committee meetings in 2006. I received a
monthly report from the Director of Internal Audit, which covered key
performance indicators and a trend analysis of internal audit findings. At
four Committee meetings in 2006, we reviewed the progress of the
internal audit plan and in December we held a separate meeting to
consider and agree the internal audit plan for 2007. Throughout the year, we regularly reviewed the level of resources
allocated to the internal audit function to ensure that the internal audit
plan could be delivered as part of our overall monitoring of the
effectiveness of the internal audit function. During the year, we reviewed regular reports on control issues of Group
level significance, including details of any remediation action being
taken. We also received a number of in-depth reports from some of the
Group’s main business areas and functions on their control environment,
with presentations from Absa, UK Retail Banking, Barclaycard, Barclays
Wealth and the Chief Information Office. Our aim is to review in detail the
control environment at each of the Group’s main businesses and
operations over a rolling two-year period. In addition, in 2006 we
undertook a wider overall review of the Group’s Control Environment,
including consideration of key trends over the past three years. Financial Reporting We reviewed the Group’s annual and interim financial statements and
trading updates, including reviewing the effectiveness of the Group’s
disclosure controls and procedures and systems of internal control as
appropriate. We also monitored throughout the year the Group’s preparations for
reporting under s404 of the US Sarbanes-Oxley Act of 2002, under
which the external auditors need to attest to the effectiveness of the
Group’s systems of internal controls over financial reporting. We
received a progress report at each of our meetings on the status of the
Group’s preparations for s404. |
|
For the disclosures made in the 2006 Annual Report, we reviewed the
report of the Disclosure Committee and the Turnbull attestations made
by all Business Heads, and have concluded and reported to the Board
for its approval that the Group has maintained effective disclosure
controls and procedures and that management has continued to operate
an effective system of internal control. Regulatory Compliance and Whistleblowing Procedures We reviewed the arrangements established by management for
compliance with the requirements of the Group’s regulators, receiving a
semi-annual report on compliance issues. In particular this year we have
spent time reviewing the Group’s controls over fraud and financial crime
and are responsible for reviewing the fraud risk control framework
annually. We also reviewed the Group’s sanctions compliance
arrangements during the year. We received regular reports on the effectiveness of the Group’s
whistleblowing arrangements, as well as reports on any specific
instances of whistleblowing. We are responsible for reviewing the
Group’s whistleblowing process annually. Committee Effectiveness In late 2006, we carried out a review of our effectiveness as part of the
overall Board Effectiveness Review. The review concluded that the
Committee continues to operate effectively. Signed on behalf of the Board Audit Committee |
 |
| Stephen Russell |
| Chairman, Board Audit Committee |
| 8th March 2007 |
Board Risk Committee
| | | | |
| Member | | Number of
meetings
eligible to
attend
in 2006 | | Number of
meetings
attended
in 2006 |
Sir Richard Broadbent (Chairman) | | 4 | | 4 |
Dr Danie Cronjé | | 4 | | 4 |
Sir Andrew Likierman | | 4 | | 4 |
Stephen Russell | | 4 | | 4 |
The Committee met four times in 2006 and the table sets out Committee members’ attendance.
The role of the Committee is to review and to recommend to the Board the Group’s overall risk appetite, setting limits for individual types of risk, including credit and market risk. The Committee also considers material changes to risk appetite and monitors the Group’s risk profile, including risk trends and concentrations, loan impairment experience against budget and key performance indicators for risk. The Committee also seeks assurance that the principal risks facing the Group have been properly identified and are being appropriately managed. In order to assess the effectiveness of the Group’s risk control framework, the Committee regularly reviews the Group’s risk measurement systems and receives reports from management confirming that they have reviewed the Group’s risk control standards. The Committee is also responsible for approving certain policy statements required by the FSA. An overview of the Group’s risk management and control framework can be found on pages 64 to 70.
| | |
| 118 | | Barclays PLC Annual Report 2006 |
| |
During 2006, the Committee reviewed the Group’s preparations for Basel II, receiving a report on progress at each meeting. It also reviewed key risk issues, including an in-depth review of the Group’s personal lending impairment experience and received presentations on tax risk and the credit control environment in our UK Business Banking operations. The Committee also reviewed the comparative risk stance taken by the Group in particular risk areas, such as mortgage underwriting, market risk and commercial property lending.
The Committee’s responsibilities are set out in its terms of reference, which are available atwww.investorrelations.barclays.com.
Board Risk Committee allocation of time
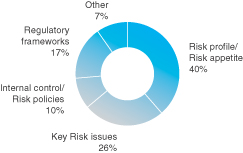
The chart sets out how the Committee allocated its time at its meetings during 2006.
In late 2006, the Committee carried out a review of its effectiveness as part of the overall Board Effectiveness Review. The review concluded that the Committee continues to operate effectively.
Statement on US Corporate Governance standards
As a non-US company listed on the New York Stock Exchange (NYSE), we are exempt from most of the NYSE’s Corporate Governance rules (the NYSE Rules), which domestic US companies must follow. However, we are subject to the NYSE rules requiring us to have a Board Audit Committee that meets the requirements of Rule 10A-3 of the US Securities Exchange Act of 1934 and we must provide an Annual Written Affirmation to the NYSE of our compliance with the applicable NYSE Rules. Furthermore, under NYSE Rule 303.A.11, we are required to disclose any significant ways in which our corporate governance practices differ from those followed by domestic US companies listed on the NYSE.
As our main listing is on the London Stock Exchange, we follow the UK’s Combined Code on Corporate Governance (the Code) adopted by the Financial Reporting Council. Key differences between the NYSE Rules and the Code are set out below:
Director independence
Under the NYSE Rules the majority of the Board should be independent. Under the Code, at least half of the Board (excluding the Chairman) is required to be independent. The NYSE Rules contain detailed tests for determining Director independence, whereas the Code requires the Board to determine whether each Director is independent in character and judgement and sets out criteria that may be relevant to that determination. We follow the Code’s recommendations as well as developing best practices among other UK public companies. Our Board annually reviews the independence of our non-executive Directors, taking into account the guidance in the Code and the criteria we have established for determining independence, which are described on page 115.
Board Committees
We have a Board Corporate Governance and Nominations Committee and a Board HR and Remuneration (rather than Compensation) Committee, both of which are broadly comparable in purpose and constitution to those required by the NYSE Rules and whose terms of reference comply with the Code’s requirements. Beyond the fact that the Board Corporate Governance and Nominations Committee is chaired by the Chairman of the Board and that, from 1st January 2007, the Chairman is a member of the Board HR and Remuneration Committee, both of which are permitted by the revised Code, both Committees are composed solely of non-executive Directors whom the Board has determined to be independent. We follow the Code recommendation that a majority of the Nominations Committee should be independent non-executive Directors, whereas the NYSE Rules state that the Committee must be composed entirely of independent Directors. We comply with the NYSE Rules regarding the obligation to have a Board Audit Committee that meets the requirements of Rule 10A-3 of the US Securities Exchange Act, including the requirements relating to the independence of Committee members. In April 2006, we made an Annual Written Affirmation of our compliance with these requirements to the NYSE. The Code also requires us to have a Board Audit Committee comprised solely of independent non-executive Directors. We follow the Code recommendations, rather than the NYSE Rules, however, regarding the responsibilities of the Board Audit Committee, although both are broadly comparable. We also have a Board Risk Committee, comprised of independent non-executive Directors, which considers and discusses policies with respect to risk assessment and risk management.
Corporate Governance Guidelines
The NYSE Rules require domestic US companies to adopt and disclose corporate governance guidelines. There is no equivalent recommendation in the Code. The Board Corporate Governance and Nominations Committee has, however, developed corporate governance guidelines, entitled ‘Corporate Governance in Barclays’, which have been approved and adopted by the Board.
Code of Ethics
The NYSE Rules require that domestic US companies adopt and disclose a code of business conduct and ethics for Directors, officers and employees. Rather than a single consolidated code as envisaged in the NYSE Rules, we have a number of ‘values based’ business conduct and ethics policies, which apply to all employees. In addition, we have adopted a Code of Ethics for the Group Chief Executive and senior financial officers as required by the US Securities and Exchange Commission.
Shareholder approval of equity-compensation plans
The NYSE listing standards require that shareholders must be given the opportunity to vote on all equity-compensation plans and material revisions to those plans. We comply with UK requirements, which are similar to the NYSE standards. The Board, however, does not explicitly take into consideration the NYSE’s detailed definition of what are considered ‘material revisions’.
Relations with Shareholders
We take a proactive approach to communicating with our 750,000 institutional and private shareholders. Senior executives hold meetings with our key institutional shareholders to discuss strategy, financial performance and investment activities in the UK, throughout Europe and in the US. The Chairman meets regularly with investor bodies and investors to discuss our approach to corporate governance issues. In November 2006, we held a corporate governance event for key institutional investors, the second such event, whose purpose is to update our major shareholders on our corporate governance practices and to discuss any issues that may have arisen.
| | |
Barclays PLC Annual Report 2006 | | 119 |
| |
Corporate governance
Corporate governance report
In addition, investor bodies and major investors are given the opportunity to meet with new non-executive Directors on their appointment. Sir Richard Broadbent, the Senior Independent Director, is available to meet with investors if they are unable to resolve issues through the normal channels of the Chairman, Group Chief Executive and Group Finance Director.
To ensure that all Directors, and in particular, non-executive Directors, have a full understanding of the opinions of our major shareholders, an external consultant conducts an annual audit of investor opinion, the results of which are presented to the Board. Non-executive Directors also receive copies of analysts’ reports on the Group and are invited to attend results presentations to analysts.
We aim to provide a first-class service to private shareholders to help them in the effective and efficient management of their shareholding. The main methods of communicating with private shareholders are the Annual Report, the Annual Review, the dividend mailings and the AGM. We have continued to encourage shareholders to hold their shares in Barclays Sharestore, where their shares are held electronically in a cost effective environment. Our e-view service enables shareholders to receive their documents electronically. It also gives shareholders immediate access to information relating to their personal shareholding and dividend history. Participants can also change their details and dividend mandates online and receive dividend tax vouchers electronically.
Annual General Meeting
All Directors are encouraged to attend the AGM and be available to answer shareholders’ questions. All Directors attended the 2006 AGM. It has been our practice for a number of years that all resolutions are voted on a poll to ensure that the views of all shareholders are reflected proportionately. Each of the resolutions considered at the 2006 AGM was decided on a poll and a copy of the poll results is available atwww.investorrelations.barclays.com. The resolutions to be considered at our 2007 AGM will also be decided on a poll and the results will be made available on our website on 27th April 2007.
Signed on behalf of the Board
Marcus Agius
Chairman
8th March 2007
| | |
| 120 | | Barclays PLC Annual Report 2006 |
| |
Corporate governance
Remuneration report
Statement from the Chairman of the Board HR and Remuneration Committee (the Committee)
The Committee provides governance and strategic oversight of Barclays Human Resource activities with particular emphasis on remuneration and senior management development.
The Committee meets a minimum of four times a year. Sir David Arculus left the Committee during 2006 and Sir Nigel Rudd stepped down as Chairman at the end of 2006 when I was appointed Chairman. Marcus Agius became a member of the Committee from 1st January 2007. All other Committee members are independent non-executive Directors.
In addition to its regular business the Committee also focused on:
| · | | developing a compensation strategy for Global Retail and Commercial Banking in addition to keeping under review the existing compensation strategies for Barclays Capital, BGI and Barclays Wealth; |
| · | | reviewing and developing policies to manage the governance of Barclays pension plans; |
| · | | in-depth monitoring of the development of senior talent in all businesses; and |
| · | | strengthening the linkage of performance and remuneration across the businesses, particularly in respect of annual bonuses. |
As part of its regular business, the Committee considers share-based plans. This includes, since its approval at the 2000 AGM, the Barclays Global Investors Equity Ownership Plan (BGI EOP). The BGI EOP and its operation have been disclosed in our financial statements since that time. This year, we have expanded our reporting further by including an overview of the BGI EOP’s operation.
The Committee takes seriously its commitment to clear and comprehensive disclosure. The majority of this report details the remuneration of the individual Directors who served Barclays in 2006.
Note
| (a) | Economic profit comprises profit after tax and minority interests, less a charge representing the Group’s cost of capital. |
Important context to this report and the disclosures that follow is provided below:
· | | Barclays performed very strongly in 2006 with profit before tax (PBT) up 35% and economic profit (EP)(a)up 54%. This performance has been recognised in the remuneration decisions at all levels coupled with strong performance differentiation. |
| · | | The performance of Barclays Capital, BGI and Barclays Wealth was particularly strong, enabling the double benefit of delivering competitive bonus levels and providing an increased share of profit to shareholders, evidenced by compensation ratios reducing relative to 2005 and in line with the lower end of the market range. |
| · | | In the course of 2006, the Committee approved significant numbers of strategic hires, including at Board level, ensuring their remuneration was in line with the appropriate marketplace. It did this alongside its active oversight of Barclays talent agenda. |
Barclays Remuneration Policy remains unchanged, including the commitment to transparency and to policies and programmes that serve well the interests of shareholders.
The Committee unanimously recommends that you vote to approve the report at the 2007 AGM.
Signed on behalf of the Board

Sir Richard Broadbent
Chairman, Board HR and Remuneration Committee
8th March 2007
| | |
Barclays PLC Annual Report 2006 | | 121 |
| |
Corporate governance
Remuneration report
Board HR and Remuneration Committee Members
The Committee comprised the following independent non-executive Directors during 2006:
|
| Sir Nigel Rudd (Chairman until 31st December 2006) |
Sir Richard Broadbent (Chairman from 1st January 2007) Leigh Clifford Sir John Sunderland Sir David Arculus (resigned 27th April 2006) |
The Committee members were considered by the Board to be independent of management and free from any business or other relationship that could materially affect the exercise of their independent judgement. The constitution and operation of the Committee complies with the Provisions on the Design of Performance Related Remuneration in the Combined Code adopted by the Financial Reporting Council.
Marcus Agius was appointed as a member of the Committee with effect from 1st January 2007.
The Chairman of the Committee presents a report of each meeting to the full Board.
Advisers to the Committee
The Committee has access to independent consultants to ensure that it receives independent advice. Advisers are appointed by the Committee for specific work, as necessary, and are required to disclose to the Committee any potential conflict of interest.
In 2006, Kepler Associates(a)were reappointed by the Committee to provide independent advice to Committee members on remuneration matters. Kepler Associates also supplied supporting valuation data for Barclays share-based payments processes.
The Chairman of the Board (from 1st January 2007 a member of the Committee itself), the Group Chief Executive, the Human Resources Director and, as necessary, members of the Executive Committee, also advise the Committee, supported by their teams. They are not permitted to participate in discussions or decisions relating to their own remuneration. The Human Resources Director is responsible for providing professional support to line management in HR policy and operations and for monitoring compliance with prescribed policy and programmes across Barclays. The Human Resources Director is not a Board Director and is not appointed by the Committee.
Remuneration Policy
Barclays policy is to use reward to drive a high-performance culture. Executive Directors can expect outstanding reward if performance is outstanding and below median reward for below median performance. This philosophy applies to reward policies and practices for all employees in the Group. The Committee considers reward levels across the Group when determining remuneration for executive Directors.
The aims of Barclays remuneration policy are to:
| · | | incentivise excellence in and balance between both short-term (one year) and longer-term (three years plus) performance such that Group financial goals and the goal of achieving top quartile total shareholder return (TSR) are met and sustained; |
| · | | enable the Group to attract and retain people of proven ability, experience and skills in the pools in which we compete for talent; |
· | | encourage behaviour consistent with Barclays Guiding Principles(b)which leads to excellence and the appropriate balance in financial performance, governance, controls, risk management, customer service, people management, brand and reputation management; |
| · | | promote attention to maximising personal contribution, contribution to the business in which the individual works and contribution to the Group overall; and |
| · | | ensure, both internally and externally, that remuneration policies and programmes are transparent, well communicated, easily understood and aligned with the interests of shareholders. |
The graph below shows the value, at 31st December 2006, of £100 invested in Barclays on 31st December 2001 compared with the value of £100 invested in the FTSE 100 Index. The other points plotted are the values at intervening financial year ends. The FTSE 100 Index is the index of the 100 largest UK quoted companies by market capitalisation. It is a widely recognised performance comparison for large UK companies such as Barclays and this is why it has been chosen as a comparator to illustrate Barclays TSR growth. The graph shows that, at the end of 2006, a hypothetical £100 invested in Barclays on 31st December 2001 would have generated a total return of £58, compared with a gain of £41 if invested in the FTSE 100 Index. Barclays, therefore, outperformed the FTSE 100 Index for this period.
Total Shareholder Return
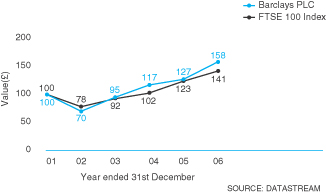
Schedule 7A of the Companies Act 1985 requires that the graph shows TSR for the five years ending with the relevant financial year.
Reward for executive Directors
Reward for the executive Directors and other senior executives comprises:
| · | | annual bonus including mandatory deferral into Barclays shares through the Executive Share Award Scheme (ESAS); |
| · | | long-term incentives through the Performance Share Plan (PSP); and |
| · | | pension and other benefits. |
The Committee reviews the elements of reward relative to the policies above and to the practice of other comparable organisations. Reward is benchmarked against the markets in which we compete for talent. This includes benchmarking against other leading international banks and financial services organisations, and other companies of similar size to Barclays in the FTSE 100 Index.
The component parts for each executive Director are detailed in the tables accompanying this report.
All the executive Directors meet the Committee’s guideline that, as a minimum, they should hold the equivalent of 1x their base salary in Barclays shares, including shares held under award through ESAS.
| (a) | Kepler Associates have given and not withdrawn their written consent to the inclusion of references to their name in the form and context in which it appears. |
| (b) | Barclays Guiding Principles were introduced during 2005 and provide all parts of the Group with a unifying set of values. They are: Winning Together, Best People, Client/Customer Focused, Pioneering and Trusted. |
| | |
| 122 | | Barclays PLC Annual Report 2006 |
| |
Each element of reward is important and has a specific role in achieving the aims of the remuneration policy. The combined potential remuneration from bonus and PSP outweighs the other elements, and is subject to performance conditions, thereby placing the majority of total reward at risk. The relative weighting of each of the key elements of executive Director remuneration (excluding pension and benefits) is shown below.
| | | | | | | | | | |
| | | | |
| | | ‘FIXED’ | | | | ‘AT RISK’ |
| | | | | | Annual
performance bonus
(Maximum) | | PSP
(Maximum) |
| | Base salary | | | | Cash | | Shares | |
| | | | | |
Chief Executive and executive Directors (except Robert E Diamond Jr) | | 20% | | | | 37.5% | | 12.5% | | 30% |
| | | | | |
Robert E Diamond Jr | | 2% | | | | 49% | | 16% | | 33% |
Robert E Diamond Jr’s arrangements reflect general practice in the investment banking and investment management industry.
The purpose of each element of remuneration for executive Directors is summarised in the table below and discussed in greater detail in the sections that follow.
| | | | | | |
| Compensation element | | Purpose | | Delivery | | Programme detail |
| | | |
| Base salary | | To reflect the market value of the individual and their role | | · Cash · Monthly · Pensionable | | · Reviewed annually, with changes typically effective on 1st April |
| | | |
| Annual performance bonus and ESAS | | To incentivise the delivery of annual goals at the Group, business division and individual levels | | · 75% cash(a) · 25% deferred Barclays shares under ESAS · Annual · Non-pensionable | | · Based on annual business unit performance, performance of the Group as a whole and leadership contribution |
| | | |
| PSP(b) | | To reward the creation of above median, sustained growth in shareholder value | | · Free shares subject to a performance condition · Annual awards that vest after three years · Non-pensionable | | · Discretionary awards · Participation reviewed annually · Barclays performance over three years determines the number of performance shares eligible for release to each individual · For awards made in 2006, and awards to be made in 2007, EP threshold, thereafter 50% under a TSR performance condition and 50% under an EP performance condition |
| | | |
| Pension(c) | | To provide market competitive post-retirement benefit | | · Deferred cash · Monthly | | · Non-contributory, defined benefit scheme and/or defined contribution scheme, or cash allowance in lieu of pension contributions |
Notes
| (a) | Eligible executives may request that all or part of the cash bonus to which they would otherwise become entitled, be granted in the form of an additional award under ESAS or as a pension contribution by way of Special Company Contribution (Bonus Sacrifice). |
| (b) | Please refer to Note 51 to the accounts on page 221 for further information on PSP. |
| (c) | Please refer to Note 35 to the accounts on page 199 for further information on the Group’s pension plans. |
| | |
Barclays PLC Annual Report 2006 | | 123 |
| |
Corporate governance
Remuneration report
Changes to Chairman and executive Directors
Matthew Barrett retired as Chairman on 31st December 2006.
Matthew Barrett was succeeded by Marcus Agius, who was appointed as a non-executive Director with effect from 1st September 2006 and Chairman with effect from 1st January 2007.
As a non-executive Director, Marcus Agius received an annual fee of £65,000 (pro rata) with effect from 1st September 2006. From 1st January 2007, on becoming Chairman, Marcus Agius receives a fee of £750,000 (inclusive of director’s fees). He is also eligible for private health insurance. The minimum time commitment is equivalent to 60% of a full time role. Marcus Agius is not eligible to participate in Barclays bonus and share incentive plans, nor will he participate in Barclays pension plans or receive any pension contributions. The service contract provides for a notice period of 12 months from the Group or six months from Marcus Agius.
Frits Seegers was appointed as an executive Director with effect from 10th July 2006. The key terms of the executive Directors’ service contracts are set out on pages 126 and 127.
David Roberts ceased to be an executive Director on 31st December 2006. Payments to David Roberts in respect of the termination of his service contract are shown in note (i) on page 129.
Naguib Kheraj will cease to be an executive Director on 31st March 2007. Naguib Kheraj will be succeeded by Chris Lucas, who has been appointed to the position of Group Finance Director with effect from 1st April 2007.
From 1st April 2007, on becoming an executive Director, Chris Lucas’ base salary will be £600,000 per annum. The Committee will, in line with usual practice, determine the size of any annual performance bonus, dependent on both business and individual performance. For 2007, a guaranteed performance bonus has been agreed, comprising a cash bonus of £450,000 and a recommended ESAS award over shares with a value of £150,000, in total £600,000. This will be recommended in March 2008. The Committee will, in line with usual practice, determine the size of awards of performance shares to be made each year under PSP. The 2007 PSP award will be recommended to be made as soon as practicable after Chris Lucas’ start date for an initial allocation of £600,000. In addition, an ESAS award over shares with a value of £500,000 will be recommended as soon as practicable after Chris Lucas’ start date. This ESAS award would normally vest 50% after one year and the remainder after two years (bonus shares are not applicable to this award). This award is in recognition of forfeited remuneration.
Chris Lucas will be eligible to participate in the following benefits: life cover, use of company car or cash equivalent, medical insurance and the ill-health income plan. In addition, Chris Lucas will receive a cash allowance of 25% of his annual base salary in lieu of pension contributions.
The service contract provides for a notice period of 12 months from the Group or six months from Chris Lucas. On termination, the service contract provides for a pro-rated phased payment of his notice entitlement and Chris Lucas has an explicit duty to mitigate his loss.
Base Salary
The annual base salaries for the current executive Directors are shown in the table below:
| | | | | | |
| | | As at
31st Dec 2006 | | As at
1st April 2007 | | Date of
previous
increase |
John Varley | | £900,000 | | £1,000,000 | | 1st Apr 2006 |
Robert E Diamond Jr | | £250,000 | | £250,000 | | 1st Mar 1999 |
Gary Hoffman | | £625,000 | | £625,000 | | 1st Apr 2006 |
Naguib Kheraj | | £700,000 | | £700,000 | | 1st Apr 2006 |
Frits Seegers | | £700,000 | | £700,000 | | n/a |
In respect of John Varley, having regard to levels of salary and total compensation in comparable organisations, the Committee approved an increase to his base salary effective 1st April 2007.
Annual Bonus and ESAS
75% of the annual bonus is delivered as cash. The remaining 25% is recommended as a provisional allocation of shares under ESAS. The maximum bonus opportunity is tailored to the relevant market; this is typically 250% of base salary.
The annual bonus is based on a qualitative and quantitative assessment of performance (including EP and PBT results) with the quantitative assessment comprising the majority. EP and PBT are considered to be good measures of value creation to shareholders.
ESAS is a deferred share award plan in which awards are initially granted in the form of a provisional allocation that does not give rise to any entitlement to the shares. The value of mandatory bonus deferrals under ESAS is subject to the same Group and individual performance criteria as the annual cash bonus. A mandatory ESAS award comprises shares with a value of 25% of the annual bonus plus an additional element for bonus shares which is approximately equal to 30% of the 25% of the bonus that has been deferred. Normally, the trustees of ESAS will permit the executive to call for the shares from the end of the third year from grant of an award by granting a right to acquire shares (a nil cost option) exercisable for two years. As this nil cost option is part of the structure of an ESAS award and as ESAS is a deferred share award plan, it would not be appropriate to attach a performance condition to the exercise of these options. If the right is not exercised, the trustees of ESAS will normally, at the end of the fifth year, release all of the shares, including bonus shares equal to 30% of the basic award. If the right is exercised, an executive may lose the opportunity of receiving one-third of the bonus shares. If an executive ceases to be employed he may forfeit his award depending on why he leaves. An award under ESAS may be forfeited if the executive resigns and commences employment with a competitor business.
In addition, eligible executives may request that all or part of the cash bonus to which they would otherwise become entitled be granted as an additional award under ESAS called Voluntary ESAS. An award under Voluntary ESAS will be granted as a right to acquire shares which will become fully exercisable after five years. The number of shares under any award will reflect the value of the amount waived together with a number of bonus shares representing 30% of the amount waived.
PSP
PSP was approved by shareholders at the 2005 AGM. PSP replaced the Incentive Share Option Plan (ISOP) in 2005 as the principal long-term incentive plan. Performance shares are an award of ‘free’ Barclays shares in the form of a provisional allocation for which no exercise price is payable and which qualify for dividend shares. Performance share awards are communicated to participants as an initial allocation. This initial allocation is the ‘expected value’ of the award and is up to the higher of 150% of base salary or 75% of base salary and target annual bonus. Barclays performance over a three-year period determines the final number of shares that may be released to participants. After three
| | |
| 124 | | Barclays PLC Annual Report 2006 |
| |
years the trustee considers the release of performance shares based on the outcome of two performance conditions, EP and TSR. Note that:
| · | | Before any shares are released, Barclays cumulative EP over the performance period must normally be greater than the total for the previous three-year period. |
| · | | For PSP awards made in 2005, the award depends on Barclays TSR relative to a peer group of 11 other international banks. |
| · | | For PSP awards made in 2006, 50% of each award depends on Barclays EP and 50% of each award depends on Barclays TSR relative to a peer group of 11 other international banks. |
| · | | For the TSR element of the award, there is no vesting unless Barclays is ranked above median on relative TSR. |
| · | | The performance conditions for PSP awards made in 2006 will be measured over the three-year performance period (2006 to 2008). |
| · | | Relative TSR and EP are both considered to be good measures of value creation to shareholders. |
The peer group for the 2006 award, as for the 2005 award, is:(a)
| | | | |
UK | | Mainland Europe | | US |
HBOS | | ABN Amro | | Citigroup |
HSBC | | BBVA | | JP Morgan Chase |
Lloyds TSB | | BNP Paribas | | |
Royal Bank of Scotland | | Deutsche Bank | | |
| | | UBS | | |
The performance scale for the TSR element of the 2006 award is shown in the chart below:
Total Shareholder Return Performance Scale
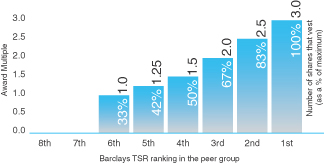
The performance scale for the EP element of the 2006 award is shown in the chart below:
EP Performance Scale
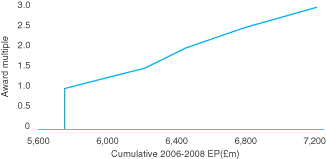
EP comprises profit after tax and minority interests less a capital charge.
Independent confirmation is provided to the Committee as to whether a performance condition has been met.
ISOP
ISOP has not been used for awards to executive Directors since 2004. Details of ISOP can be found on page 135. Awards in 2003 and 2004 under ISOP include financial metrics or thresholds. These were adjusted where necessary to neutralise the effect of the introduction of IFRS.
The main performance condition is TSR relative to a peer group of 11 other major international banks, combined with an EP threshold.
The peer group for the 2003 and 2004 ISOP was: Abbey National, ABN Amro, BBVA, BNP Paribas, Citigroup, Deutsche Bank, HBOS, HSBC, Lloyds TSB, Royal Bank of Scotland and Standard Chartered.
Retained Incentive Opportunity
Robert E Diamond Jr retains an opportunity to be considered for an award in February 2008 up to a maximum value of £14.85m, subject to performance criteria based on the delivery of EP at Barclays Capital over the period 2005 to 2007. EP was chosen as this is an appropriate measure to align the interests of the participant with those of shareholders and is a good measure of value creation for shareholders. Details of the award are provided on page 133.
Sharesave
All eligible employees including executive Directors may participate in Sharesave. Sharesave is an HMRC (Her Majesty’s Revenue and Customs) approved all-employee share option plan. HMRC does not permit performance conditions to be attached to the exercise of Sharesave options. Under Sharesave, participants are granted options over Barclays shares. Each participant may save up to £250 per month to purchase Barclays shares at a discount. For the 2006 grant, the discount was 20% of the market value of a share at the time the option was granted. Sharesave is also offered to employees in Spain and Ireland. Following the 2006 invitation, a total of 41,371 employees in the UK, Spain and Ireland were participants in Sharesave with 79 million shares under option.
Sharepurchase
Sharepurchase was introduced in January 2002. It is an HMRC approved all-employee share plan. Sharepurchase is open to all eligible employees including executive Directors. Under Sharepurchase, participants are able to purchase up to £1,500 worth of Barclays shares each year, which, if kept in trust for five years, can be withdrawn from Sharepurchase tax-free. Any shares in Sharepurchase will earn dividends in the form of additional shares, which must normally be held by the trustee on behalf of the participant for no less than three years.
Note
| (a) | The reserve companies for the 2005 and 2006 awards are Banco Santander, Morgan Stanley, Bank of America and Wachovia. |
| | |
Barclays PLC Annual Report 2006 | | 125 |
| |
Corporate governance
Remuneration report
To encourage employee ownership of Barclays shares, Barclays matches, share for share, up to the first £600 each employee invests in Sharepurchase in each tax year. Matching shares must normally be held by the trustee on behalf of the participant for no less than three years.
At 31st December 2006, 19,619 employees were participants in Sharepurchase, with a total of 9.7 million shares held on their behalf by the Sharepurchase trustee.
Dilution Limits
The outstanding awards under ISOP and Sharesave are intended to be satisfied by the issue of new Barclays shares or through treasury shares within the limits agreed by shareholders when these plans were approved. These limits comply with the Association of British Insurers’ guidelines restricting dilution from employee share plans. The overall limits under the guidelines are that no more than 10% of a company’s issued share capital may be used in any ten-year period. Up to 5% may be used for executive share plans. Shares in Barclays Global Investors UK Holdings Limited issued as a result of option exercises under the BGI EOP also count towards these limits. As at 31st December 2006, Barclays headroom under these limits, i.e. the amount remaining available for issue, was 3.3% and 1.2% respectively.
Employees’ Benefit Trusts (EBTs)
The trustees of the Barclays EBTs grant awards under ESAS and PSP over existing Barclays shares which they have purchased in the market. The trustees of the Barclays EBTs have informed the Bank that their normal policy is to abstain from voting in respect of the Barclays shares held in trust.
Pensions
All Group pension arrangements are managed in accordance with the Global Retirement Fund. Governance Framework to ensure best practice in respect of regulatory compliance, governance, investment and administration. The framework is overseen by the Committee.
Pension benefits for executive Directors are provided through defined benefit plans, defined contribution plans, unfunded unapproved retirement benefit arrangements or a combination of these. The pension benefit applicable will depend on the date an executive Director was appointed and their individual situation. Annual performance related bonuses are not included in pensionable salary.
The Group’s closed UK defined benefit pension arrangement, of which John Varley, Gary Hoffman and David Roberts are members, is a non-contributory scheme. Benefits are provided on leaving service at normal pension age (60) by reference to the executive Director’s length of service, normally by reference to 1/60th of pensionable salary for each year of pensionable service (John Varley’s pension accrual is provided through the scheme in accordance with his service contract as set out in the notes to the pensions table on page 130).
The Group’s closed UK defined benefit pension arrangement also provides that, in the event of death before retirement, a cash lump sum of up to four times salary is paid together with a dependant’s pension of 50% of the pension that would have been payable had the member remained in active service until their normal pension age. For death in retirement, a dependant’s pension is payable of approximately 50% of the member’s pension at the date of death, not taking into account commutation of any cash lump sum at the time of the member’s retirement. If a member is granted a deferred pension that has not yet come into payment, the widow/widower receives a pension of 50% of the deferred pension payable. Where applicable, children’s pensions are payable, usually up to the age of 18. Enhanced benefits may be payable if it is determined that a member is unable to work as a result of serious ill-health.
The Group’s US non-contributory defined benefit arrangement, of which Robert E Diamond Jr is a member, provides a benefit at age 65 of 1/60th of final average pensionable pay plus 0.3% of final average pensionable pay in excess of the US Internal Revenue Service’s covered compensation limit for each year of pensionable service (up to a maximum of 30 years). In line with current market practice, final average pay in the US includes an element of bonus subject to overall plan limits. In the event of a member’s death before retirement, a spouse’s pension of approximately 50% of the member’s pension had the member taken early retirement on the date of death, is payable. On death after retirement, a spouse’s pension of 50% of the pension in payment is payable. In addition, enhanced benefits are payable if the member qualifies for disability benefits.
The US Restoration Plan, of which Robert E Diamond Jr is also a member, is an unfunded unapproved arrangement which restores reductions in the benefits provided through the approved US plan resulting from the application of relevant compensation and benefit limitations under the US Internal Revenue Code. Robert E Diamond Jr participates in this plan on similar terms to other Barclays senior executives participating in US benefit plans.
Robert E Diamond Jr also participates in the Barclays Bank PLC 401K Thrift Savings Plan and Thrift Restoration Plan on similar terms to other Barclays senior executives in the US.
Where appropriate, cash allowances are provided to executive Directors in lieu of being able to join a Group pension arrangement. Both Naguib Kheraj and Frits Seegers receive such cash allowances.
In the event that an executive Director builds up pension benefits close to, or in excess of, the HMRC Lifetime Allowance, the executive Director is eligible to opt for a cash allowance instead of continued pension accrual. The allowance given is no more than the cost of funding the existing pension benefit.
Service Contracts
The Group has service contracts with its Chairman and executive Directors. The effective dates of the contracts for the Chairman and executive Directors who served during 2006 are shown in the table on page 127. The service contracts do not have a fixed term but provide for a notice period from the Group of one year and normally for retirement at age 65, except for David Roberts and Naguib Kheraj who are leaving the Group. The Committee’s policy is that executive Directors’ contracts should allow for termination with contractual notice from the Group, except in circumstances of gross misconduct when notice is not given.
The Committee’s approach when considering payments in the event of termination is to take account of the individual circumstances including the reason for termination, contractual obligations and share and pension plan rules.
Payments in the event of termination are also subject to mitigation if alternative employment is found during any period of pay in lieu of notice.
| | |
| 126 | | Barclays PLC Annual Report 2006 |
| |
| | | | | | | |
| | | | |
Directors(a) | | Effective
date
of contract | | Notice
period | | Potential
compensation
for loss
of office |
|
| | | |
Matthew W Barrett(b)(c) | | 1st Sept 2004 | | 1 year | | 1 year’s
contractual
remuneration |
(d) |
John Varley | | 1st Sept 2004 | | 1 year | | “ | |
Robert E Diamond Jr | | 1st Jun 2005 | | 1 year | | “ | |
Gary Hoffman | | 1st Jan 2004 | | 1 year | | “ | |
Naguib Kheraj | | 1st Jan 2004 | | 1 year | | “ | |
David Roberts(b) | | 1st Jan 2004 | | 1 year | | “ | |
Frits Seegers(b) | | 7th Jun 2006 | | 1 year | | “ | |
Barclays Capital, BGI and Barclays Wealth
The Committee has established frameworks for the governance of remuneration in these businesses. Ranges have been set for key financial and compensation ratios such as operating margin, operating costs to net revenue, compensation to pre-compensation profit before tax and bonus expenditure as a percentage of pre-bonus profits. The Committee approves aggregate bonus and long-term incentive expenditure, and strategic investment for new hires. The Committee also approves individual compensation for the members of the management teams, and any employee with total compensation in excess of £750,000.
The BGI EOP
BGI is Barclays asset management business headquartered in San Francisco. The BGI EOP was approved by shareholders at Barclays 2000 AGM to provide the employee share incentive arrangements required to recruit and retain the quality of senior management and investment talent appropriate for building a global investment management business. The BGI EOP was designed to provide participants with a long-term equity interest in BGI to meet the expectations of, in particular, BGI’s key investment talent in the United States, who could expect to participate in the equity of their employer. Under the terms of the BGI EOP, options are granted at fair value to key BGI employees over shares in Barclays Global Investors UK Holdings Limited (BGI Holdings) within an overall cap of 20% of the issued ordinary share capital of BGI Holdings.
All grants of options are approved by the Committee. The Committee is also advised of option exercises and share sales by employees. Directors of Barclays PLC are not eligible to receive options under the BGI EOP.
In summary the BGI EOP operates as follows:
| · | | Certain key BGI employees are granted options over shares in BGI Holdings. |
| · | | The option exercise price is based on the fair value of a BGI Holdings share at the date of grant determined by an independent appraiser. |
| · | | The options generally vest evenly over a three-year period and can be exercised in two annual exercise windows. |
| · | | Option holders are required to fund the exercise without any financial support from any member of the Barclays Group. |
Once employees become shareholders, they are subject to the Articles of BGI Holdings under which:
| · | | Shareholders are required to hold the shares for a minimum of 355 days. As shareholders, employees derive the full risks and rewards of ownership, including voting rights and entitlement to any ordinary dividends paid by BGI Holdings. |
| · | | On expiry of the minimum holding period, shareholders may, but are not obliged to, offer their shares for sale during two annual sales windows. |
| · | | Barclays Bank PLC, at its discretion, has a right to purchase shares so offered, but is not obliged to do so. |
The table below contains information of the number of shares in BGI Holdings over which options were granted, outstanding and exercised in 2005 and 2006:
| | | | | | | | | |
| | | |
Year | | Number
granted
during year
(000s |
) | | Number
outstanding
at year end
(000s |
) | | Number
exercised
(000s |
) |
2005 | | 2,360 | | | 5,442 | | | 4,368 | |
2006 | | 3,973 | | | 6,929 | | | 2,188 | |
In 2006 BGI employees exercised options over 2.2m (2005: 4.4m) shares for consideration of £44m (2005: £49m); Barclays Bank PLC purchased 4.9m (2005: 3.4m) shares offered for sale by shareholders for consideration of £410m (2005: £160m). As at 31st December 2006, employees own 9.4% of BGI Holdings (2005: 12.1%).
BGI EOP – Accounting and disclosure
The BGI EOP is accounted for as an equity settled share-based payment in accordance with IFRS 2 ‘Share-based Payment’. The fair value of the services received from the employees is measured by reference to the fair value of the share options granted on the date of the grant. The cost of the employee services received in respect of the share options granted is recognised in the income statement over the period that the services are received. The cost for 2006 of £37.4m (2005: £14.9m, 2004: £10.5m) is included in staff costs in Note 8 to the accounts. In accordance with IFRS 2, details of share options granted and exercised, together with weighted average fair values at grant date and weighted average exercise prices are set out in Note 51 to the accounts. In accordance with IAS 33 ‘Earnings per Share’, unexercised options are taken into account in the calculation of diluted earnings per share as set out in Note 11 to the accounts.
For Group reporting, the exercise of options by employees is treated as a deemed disposal of interests in a subsidiary, as its holding in the subsidiary has been reduced for the consideration represented by the exercise price. Any subsequent purchase of shares offered for sale by employees is treated as a purchase of an additional investment in a subsidiary entity. The cash flows relating to these capital transactions are included in the Consolidated cash flow statement and disclosed, along with other disposals and acquisitions, in Notes 43 and 44 to the accounts respectively and related movements in goodwill and minority interests are included in Notes 23 and 38 to the accounts respectively.
Notes
| (a) | Details of executive Directors standing for re-election at the 2007 AGM are set out on page 112. |
| (b) | Matthew W Barrett retired on 31st December 2006, David Roberts ceased to be a Director on 31st December 2006 and Frits Seegers was appointed as an executive Director on 10th July 2006. |
| (c) | There was no formal retirement date under Matthew W Barrett’s contract. However, his pension may not commence later than 20th September 2019 (age 75). |
| (d) | One year’s contractual remuneration is calculated as follows: 12 months’ base salary, bonus, if eligible (being the average of the previous three years’ bonus awards, in some cases (Gary Hoffman, Naguib Kheraj and David Roberts) capped at 100% of base salary), medical benefit (while an employee) and continuation of pension benefits. Payments in the event of termination are subject to mitigation if alternative employment is found during any period of pay in lieu of notice. |
| | |
Barclays PLC Annual Report 2006 | | 127 |
| |
Corporate governance
Remuneration report
Non-executive Directors
The Board determines the fees of non-executive Directors and the fees are reviewed annually. The fee structure as at 31st December 2006 is shown below.
| | | |
Base fee Plus: | | £ | 65,000 |
Chairman of Board Audit Committee | | £ | 50,000 |
Chairman of the Board HR and Remuneration Committee | | £ | 40,000 |
Chairman of Board Risk Committee | | £ | 30,000 |
Members of the Board Audit Committee | | £ | 20,000 |
Members of the following Board Committees: Risk, HR and Remuneration and Corporate Governance and Nominations | | £ | 15,000 |
As Deputy Chairman, Sir Nigel Rudd receives £200,000. He did not receive an additional fee for chairing the Board HR and Remuneration Committee in 2006. Similarly, as Chairman, Matthew Barrett received a salary of £650,000, without any additional fee for chairing the Board Corporate Governance and Nominations Committee. Sir Richard Broadbent receives an additional £30,000 in respect of his role as Senior Independent Director. Until his appointment as Chairman became effective, Marcus Agius received the base fee of £65,000 (pro rata) as a non-executive Director.
The Board’s policy is that fees should reflect individual responsibilities and membership of Board Committees. Barclays encourages its non-executive Directors to build up a holding in Barclays shares. £20,000 of each Director’s base fee of £65,000 is used to buy Barclays shares. These shares, together with reinvested dividends, are retained on behalf of the non-executive Directors until they retire from the Board. They are included in the table of Directors’ interests in Barclays shares on page 136. Non-executive Directors do not receive awards in share plans for employees, nor do they accrue pension benefits from Barclays for their non-executive services.
Non-executive Directors do not have service contracts but each has a letter of appointment. For each non-executive Director who served during 2006, the effective date of their appointment, notice period and the Group’s liability in the event of early termination are shown in the following table.
| | | | | | |
Non-executive Directors(a) | | Effective
date of
letter of
appointment | | Notice
period | | Group
liability in the
event of early
termination |
Sir Richard Broadbent | | 1st Sep 2003 | | 6 months | | 6 months’
fees |
Leigh Clifford | | 1st Oct 2004 | | “ | | “ |
Dr Danie Cronjé | | 1st Sep 2005 | | “ | | “ |
Fulvio Conti | | 1st Apr 2006 | | “ | | “ |
Professor Dame Sandra Dawson | | 1st Mar 2003 | | “ | | “ |
Sir Andrew Likierman | | 1st Sep 2004 | | “ | | “ |
Sir Nigel Rudd | | 1st Feb 1996 | | “ | | “ |
Stephen Russell | | 25th Oct 2000 | | “ | | “ |
Sir John Sunderland | | 1st Jun 2005 | | “ | | “ |
| | | |
Former Directors Sir David Arculus | | 1st Feb 1997 | | – | | – |
Robert Steel | | 1st Jun 2005 | | – | | – |
Each appointment is for an initial six-year term, renewable for a single term of three years thereafter, with the exception of Sir Nigel Rudd, whose appointment as Deputy Chairman is reviewed annually. Details of non-executive Directors standing for re-election at the 2007 AGM are set out on page 112.
Future Policy
The Committee will keep the existing remuneration arrangements, as detailed in this Report, under review during 2007 and ensure that Barclays programmes remain competitive and provide appropriate incentive for performance. As usual, there will be individual reviews of base salary, annual bonus (including ESAS) and awards under the long-term incentive plans.
Audited Information
As required by Part 3 of Schedule 7A of the Companies Act 1985, the Group’s auditors, PricewaterhouseCoopers LLP, have audited the information contained on pages 129 to 135.
Note
| (a) | Marcus Agius was a non-executive Director during 2006 and became Chairman on 1st January 2007. Details of his service contract are set out on page 124. |
| | |
| 128 | | Barclays PLC Annual Report 2006 |
| |
2006 Annual Remuneration(a)
| | | | | | | | | | | | | | |
| | | Salary
and
fees
£000 | | Benefits(b)
£000 | | Annual
cash
bonus
£000 | | 2006
Total
£000 | | 2005(c)
Total
£000 | | Executive Share
Award Scheme
ESAS |
| | | | | | | | 2006
£000(d) | | 2005
£000 |
| | | | | | | |
Chairman | | | | | | | | | | | | | | |
Matthew W Barrett(e) | | 650 | | 50 | | – | | 700 | | 704 | | – | | – |
Executive Directors | | | | | | | | | | | | | | |
John Varley(f) | | 888 | | 15 | | 1,613 | | 2,516 | | 2,249 | | 699 | | 601 |
Robert E Diamond Jr(g) | | 250 | | 17 | | 10,425 | | 10,692 | | 4,528 | | 4,518 | | 1,896 |
Gary Hoffman(f) | | 625 | | 14 | | 469 | | 1,108 | | 1,074 | | 203 | | 244 |
Naguib Kheraj(f)(h) | | 650 | | 165 | | 1,750 | | 2,565 | | 1,451 | | – | | 358 |
David Roberts(f)(i) | | 575 | | 11 | | 1,500 | | 2,086 | | 1,336 | | – | | 358 |
Frits Seegers(f)(j) | | 336 | | 94 | | 1,200 | | 1,630 | | – | | 520 | | – |
Non-executive Directors(k) | | | | | | | | | | | | | | |
Marcus Agius(l) | | 22 | | – | | – | | 22 | | – | | – | | – |
Sir Richard Broadbent | | 147 | | – | | – | | 147 | | 123 | | – | | – |
Leigh Clifford | | 76 | | – | | – | | 76 | | 60 | | – | | – |
Fulvio Conti(m) | | 54 | | – | | – | | 54 | | – | | – | | – |
Dr Danie Cronjé | | 326 | | – | | – | | 326 | | 132 | | – | | – |
Professor Dame Sandra Dawson | | 81 | | – | | – | | 81 | | 71 | | – | | – |
Sir Andrew Likierman | | 96 | | – | | – | | 96 | | 86 | | – | | – |
Sir Nigel Rudd | | 200 | | – | | – | | 200 | | 179 | | – | | – |
Stephen Russell | | 137 | | – | | – | | 137 | | 127 | | – | | – |
Sir John Sunderland | | 81 | | – | | – | | 81 | | 40 | | – | | – |
Former Directors | | | | | | | | | | | | | | |
Sir David Arculus(n) | | 28 | | – | | – | | 28 | | 83 | | – | | – |
Robert Steel(o) | | 62 | | – | | – | | 62 | | 39 | | – | | – |
Notes
| (a) | Emoluments include amounts, if any, payable by subsidiary undertakings. Amounts payable to Dr Danie Cronjé include an amount of ZAR3,114,800 (£249,829) in respect of his Chairmanship of Absa Group Limited (2005: ZAR1,193,275 (£109,734) and ZAR37,913 (£3,486) of benefits). |
| (b) | The Chairman and executive Directors receive benefits in kind, which may include life and disability cover, the use of a Company owned vehicle or cash equivalent, medical insurance and tax advice. Benefits are provided on similar terms to other senior executives. No Director has an expense allowance. |
| (c) | Total remuneration for 2005 includes any amounts waived by way of Special Company Contribution (Bonus Sacrifice). |
| (d) | The amounts shown for ESAS represent the value of shares to be recommended for an award under ESAS in 2007 for each executive Director, including a maximum potential 30% bonus share element. |
| (e) | Matthew W Barrett retired as Chairman on 31st December 2006. No additional payments were due to Matthew W Barrett on his retirement. |
| (f) | John Varley is a Director of Ascot Authority (Holdings) Limited and British Grolux Investments Limited, for which he received fees of £26,000 and £7,500 respectively in 2006 (2005: £24,648 and £6,000 respectively). John Varley is a non-executive Director of AstraZeneca plc for which he received fees of £21,075 in 2006 (2005: £nil). John Varley is also a member of the International Advisory Panel of the Monetary Authority of Singapore for which he received fees of US$10,000 in 2006 (2005: £nil). John Varley is Chairman of Business Action on Homelessness and President of the Employers’ Forum on Disability for which he receives no fees. Gary Hoffman is a Director of Visa (Europe) Limited, for which he receives no fee and Trinity Mirror plc, for which he received fees of £50,000 in 2006 (2005: £39,521). David Roberts was a non-executive Director of BAA PLC during the period March 2006 to June 2006, for which he received fees of £14,333 (2005: £nil). Naguib Kheraj is a member of the Board of Governors of the Institute of Ismaili Studies and Chairman of the National Committee of the Aga Khan Foundation (UK) for which he receives no fees. Naguib Kheraj and (from 23rd October 2006) Frits Seegers are non-executive Directors of Absa Group Limited and Absa Bank Limited. David Roberts was a non-executive Director of Absa Group Limited and Absa Bank Limited until 23rd October 2006. They have each waived their fees, which were paid to Barclays. Their respective fees were ZAR425,100 (£34,096), ZAR75,400 (£6,048) and ZAR381,367 (£30,588) (2005: ZAR161,033 (£14,809) for Naguib Kheraj, ZAR140,366 (£12,908) for David Roberts and £nil for Frits Seegers). |
| (g) | Robert E Diamond Jr joined the Board on 1st June 2005. The amount shown in the “2005 Total” column is for the period from that date to 31st December 2005. The remuneration for 2006 for Robert E Diamond Jr was based on the strong performance of Barclays Capital, Barclays Global Investors and Barclays Wealth, both on an absolute and industry relative basis and given significant upward movement in market reference points. The composition of this package remains consistent with the composition of remuneration shown on page 123. |
| (h) | Naguib Kheraj received an allowance of 23% of base salary (£149,500) in lieu of pension contributions (2005: £115,000). This amount is included in the amount shown in the column for ‘Benefits’. |
| (i) | David Roberts ceased to be a Director on 31st December 2006. His service contract provides for a notice period of 12 months or contractual pay in lieu of notice for 12 months, subject to mitigation if alternative employment is found during the period of pay in lieu of notice. Contractual pay on termination includes base salary (£600,000), £150,000 in respect of pension benefit entitlement and a bonus capped at 100% of base salary (£600,000), totalling up to £1,350,000, payable in 2007, subject to mitigation. The notice period commenced on 1st January 2007. |
| (j) | Frits Seegers was appointed as an executive Director on 10th July 2006. In addition to the amount shown in the column for ‘Salary and Fees’, Frits Seegers received a cash payment of £3,408,000 in July 2006 in recognition of forfeited share awards and benefits from his previous employment. In addition, in August 2006 Frits Seegers received an award under ESAS over 802,208 Barclays shares in recognition of forfeited share awards and benefits. This is shown in the ESAS table on page 132 and is not included in the ESAS column in the table above. Bonus shares are not applicable to this award. Frits Seegers also received an allowance of 25% of base salary (£84,028) in lieu of pension contributions. This amount is included in the amount shown in the column for ‘Benefits’. |
| (k) | Fees to non-executive Directors include an amount of £20,000 per annum which, after tax, is used to buy Barclays shares. Further details are provided on page 136. |
| (l) | Marcus Agius was appointed as non-executive Director on 1st September 2006. |
| (m) | Fulvio Conti was appointed as non-executive Director on 1st April 2006. |
| (n) | Sir David Arculus resigned from the Board on 27th April 2006. |
| (o) | Robert Steel resigned from the Board on 11th October 2006. |
| | |
Barclays PLC Annual Report 2006 | | 129 |
| |
Corporate governance
Remuneration report
Chairman and executive Directors: pension accrued assuming retirement at normal pension age(a)(b)(c)
| | | | | | | | | | | | | | | | | | | | | |
| | | Age at 31st December
2006 | | Completed
years of service | | Accrued
pension at 31st December
2005
£000 | | Pension
accrued
during 2006
(including
increase for
inflation)
£000 | | | Pension
accrued
during
2006
(excluding
inflation)
£000 | | | Accrued
pension
at 31st December
2006 £000 | | Transfer value of
accrued
pension at 31st December
2005
£000 | | Transfer value of
accrued
pension at 31st December
2006 £000 | | Increase in
transfer
value
during the
year £000 | |
Chairman | | | | | | | | | | | | | | | | | | | | | |
Matthew W Barrett(d) | | 62 | | 7 | | – | | – | | | – | | | – | | – | | – | | – | |
Executive Directors | | | | | | | | | | | | | | | | | | | | | |
John Varley(e)(f) | | 50 | | 24 | | 374 | | 44 | | | 30 | | | 418 | | 6,338 | | 7,696 | | 1,358 | |
Robert E Diamond Jr(g)(h) | | 55 | | 10 | | 37 | | (1 | ) | | (1 | ) | | 36 | | 207 | | 195 | | (12 | ) |
Gary Hoffman(f) | | 46 | | 24 | | 198 | | 55 | | | 47 | | | 253 | | 1,723 | | 2,352 | | 629 | |
Naguib Kheraj(i)(j) | | 42 | | 9 | | – | | – | | | – | | | – | | – | | – | | – | |
David Roberts | | 44 | | 23 | | 190 | | 33 | | | 26 | | | 223 | | 1,503 | | 1,893 | | 390 | |
Frits Seegers(i) | | 48 | | – | | – | | – | | | – | | | – | | – | | – | | – | |
Notes
| (a) | Pension accrued during the year represents the change in accrued pension (including inflation at the prescribed rate of 3.6%) which occurred during the entire year. The pensions paid from the final salary section of the applicable pension fund are reviewed annually. Pensions increase by a minimum of the increase in the retail prices index (up to a maximum of 5%), subject to the scheme rules. |
| (b) | The transfer values have been calculated in a manner consistent with the Retirement Benefit Scheme – Transfer Values (GN11) published by the Institute of Actuaries and the Faculty of Actuaries. |
| (c) | With the exception of Matthew W Barrett and the benefits provided through the US Restoration Plan for Robert E Diamond Jr, the pension benefits for all Directors shown above are provided for on a funded basis. |
| (d) | During the year and up until his retirement on 31st December 2006, Matthew W Barrett was not a member of any of the Group’s registered pension arrangements. Instead a notional fund was accrued on his behalf through an Unfunded Unapproved Retirement Benefits Scheme. No contributions were made to this arrangement in 2006 or since becoming Chairman. In addition, had Mr Barrett died during the year, before leaving employment, a capital lump sum of up to 4 times his base salary would have been payable. |
| (e) | John Varley is a member of the Group’s closed UK defined benefit pension arrangement. This non-contributory pension scheme has a normal pension age of 60 and in accordance with his service contract, the scheme provides him with a pension benefit of 66.67% of his Pensionable Salary at normal pension age. Should John Varley retire at age 55, the scheme provides for an unreduced pension of 60% of Pensionable Salary. |
| (f) | In addition to the transfer value of accrued pension at 31st December 2006, John Varley and Gary Hoffman also have defined contribution benefits. John Varley’s benefit is in respect of a transfer from a previous pension arrangement while Gary Hoffman’s benefit is in respect of Special Company Contributions (Bonus Sacrifice). During 2006, Special Company Contributions (Bonus Sacrifice) of £225,000 were paid in respect of Gary Hoffman. The fund value of these arrangements as at 31st December 2006 for John Varley and Gary Hoffman were £662,554 and £623,104 respectively. |
| (g) | The benefits shown above in respect of Robert E Diamond Jr’s participation in the Group’s US non-contributory defined benefit arrangement and the US Restoration Plan have been converted to Pounds Sterling using the 2006 year-end exchange rate of US$1.96 (2005: US$1.72). |
| (h) | Robert E Diamond Jr is also a member of the Barclays Bank PLC 401K Thrift Savings Plan and Thrift Restoration Plan. These are US defined contribution plans. Company contributions into these plans in 2006 amounted to £11,414 (US$21,000). |
| (i) | Naguib Kheraj and Frits Seegers do not participate in any of the Group’s pension arrangements. Instead they receive a cash allowance in lieu of pension contributions of 23% and 25% of their respective base salaries. Naguib Kheraj’s cash allowance in 2006 amounted to £149,500, while Frits Seegers’ cash allowance in 2006 was £84,028. |
| (j) | In addition to the cash allowance in lieu of pension contributions, Naguib Kheraj has defined contribution benefits in respect of a previous period of participation in the Retirement Investment Scheme. The fund value of this deferred benefit as at 31st December 2006 was £108,963. |
| | |
| 130 | | Barclays PLC Annual Report 2006 |
| |
Chairman and executive Directors: illustration of change in value of Barclays PLC shares owned beneficially, or held under option or awarded under employee share plans during the year(a)(h)
| | | | | | | | | | | | | | | | | | | | |
| | | Number at 31st December 2006 | | Notional
value based
on share
price of
£6.11(f )
£000 | | Notional
value based
on share
price of
£7.30(g)
£000 | | Change in
notional
value
£000 |
| | Shares
owned
beneficially(b) | | ESAS(c) | | PSP(d) | | Executive
Share
Option
Scheme
(ESOS)(e) | | ISOP(e) | | Sharesave | | Total | | | |
Chairman | | | | | | | | | | | | | | | | | | | | |
Matthew W Barrett | | 2,000 | | 290,309 | | – | | 766,628 | | 832,000 | | – | | 1,890,937 | | 4,452 | | 6,702 | | 2,250 |
Executive Directors | | | | | | | | | | | | | | | | | | | | |
John Varley | | 375,053 | | 278,211 | | 295,793 | | – | | 920,000 | | 4,096 | | 1,873,153 | | 7,373 | | 9,602 | | 2,229 |
Robert E Diamond Jr | | 2,531,582 | | 5,282,875 | | 820,819 | | 100,000 | | 560,000 | | – | | 9,295,276 | | 53,854 | | 64,915 | | 11,061 |
Gary Hoffman | | 319,186 | | 166,526 | | 171,850 | | – | | 540,000 | | 6,474 | | 1,204,036 | | 4,892 | | 6,325 | | 1,433 |
Naguib Kheraj | | 141,442 | | 790,317 | | 194,745 | | 60,000 | | 520,000 | | 4,007 | | 1,710,511 | | 7,875 | | 9,910 | | 2,035 |
David Roberts | | 225,577 | | 178,140 | | 168,008 | | – | | 260,000 | | 3,974 | | 835,699 | | 3,965 | | 4,960 | | 995 |
Frits Seegers | | 4,319 | | 802,208 | | 157,728 | | – | | – | | – | | 964,255 | | 5,959 | | 7,039 | | 1,080 |
Notes
| (a) | The register of Directors’ interests, which shows full details of Directors’ current share awards and options, is available for public inspection at the Group’s head office in London. |
| (b) | The number shown includes shares held under Sharepurchase. |
| (c) | ESAS includes the maximum potential 30% bonus share element where applicable. |
| (d) | The number of shares shown represents the initial allocation of shares. |
| (e) | The number of shares shown represents the target award shares under option, or the actual number of shares under option if the award had vested as at 31st December 2006. |
| (f) | With the exception of Frits Seegers, the notional value is based on the share price as at 31st December 2005. The notional value for Frits Seegers is based on a share price of £6.18, which was the share price as at 10th July 2006, the date he was appointed executive Director. |
| (g) | The notional value is based on the share price as at 31st December 2006. The highest and lowest market prices per share during the year were 737p and 585p respectively. |
| (h) | Under PSP, ESAS, ISOP, ESOS and Sharesave, nothing was paid by the participants on the grant of options or awards. |
| | |
Barclays PLC Annual Report 2006 | | 131 |
| |
Corporate governance
Remuneration report
Chairman and executive Directors: shares provisionally allocated and shares under option under ESAS(a)(h)(i)(j)
| | | | | | | | | | | | | | | | |
| | | | | During 2006 | | |
| | | Number at
1st January
2006 | | Awarded in
respect of
the results
for 2005(b) | | Released(c) | | Market
price on
Release
date £ | | Exercised(d) | | Market
price on
Exercise
date £ | | Bonus
shares
lapsed | | Number
at 31st
December
2006 |
Chairman | | | | | | | | | | | | | | | | |
Matthew W Barrett | | 350,534 | | – | | – | | – | | 55,592 | | 7.11 | | 4,633 | | 290,309 |
Executive Directors | | | | | | | | | | | | | | | | |
John Varley | | 206,074 | | 92,441 | | 20,304 | | 6.62 | | – | | – | | – | | 278,211 |
Robert E Diamond Jr(e) | | 6,261,163 | | 499,679 | | 1,191,843 | | 6.62 | | – | | – | | – | | 5,282,875 |
| | | | | | 286,124 | | 6.74 | | – | | – | | – | | |
Gary Hoffman | | 345,564 | | 37,477 | | 216,515 | | 6.62 | | – | | – | | – | | 166,526 |
Naguib Kheraj | | 937,361 | | 54,967 | | 202,011 | | 6.62 | | – | | – | | – | | 790,317 |
David Roberts | | 334,844 | | 54,967 | | 211,671 | | 6.62 | | – | | – | | – | | 178,140 |
Frits Seegers | | – | | 802,208 | | – | | – | | – | | – | | – | | 802,208 |
Shares under option under ESAS and voluntary ESAS at 31st December 2006 (with the exception of voluntary ESAS, shares under option are included in aggregate figures above)
| | | | | | | | |
| | | Nil cost
option
granted at 3rd
anniversary(f ) | | Nil cost
option
held under
voluntary
ESAS(g) | | Date from which exercisable | | Latest
expiry
date |
| | | | |
| Chairman | | | | | | | | |
Matthew W Barrett | | – | | – | | – | | – |
| | | | |
| Executive Directors | | | | | | | | |
John Varley | | 48,036 | | – | | 07/03/05 | | 28/02/08 |
Robert E Diamond Jr | | – | | – | | – | | – |
Gary Hoffman | | 33,410 | | 136,584 | | 26/02/99 | | 05/03/14 |
Naguib Kheraj | | 429,536 | | – | | 07/03/05 | | 28/02/08 |
David Roberts | | 31,792 | | – | | 07/03/05 | | 28/02/08 |
Frits Seegers | | – | | – | | – | | – |
Notes
| (a) | The number of shares shown in the table includes the maximum potential 30% bonus share element where applicable. |
| (b) | An award was granted to Frits Seegers in August 2006 following his appointment as an executive Director on 10th July 2006 in recognition of forfeited share awards and benefits from his previous employment. Bonus shares are not applicable to the award. Frits Seegers also received a cash payment in July 2006 in recognition of forfeited share awards and benefits from his previous employment, as referred to in footnote (j) on page 129. |
| (c) | The trustees may release additional shares to participants which represent accumulated dividends (net of withholding) in respect of shares under award. During 2006, the trustees released the following accumulated dividend shares – 4,486 to John Varley, 197,517 to Robert E Diamond Jr, 26,512 to Gary Hoffman, 23,309 to Naguib Kheraj and 25,443 to David Roberts. These are not awarded as part of the original award and consequently are not included in the Released column. |
| (d) | The trustees may release additional shares to participants which represent accumulated dividends (net of withholding) in respect of shares under award. During 2006, the trustees released 8,223 accumulated dividend shares to Matthew W Barrett. These are not awarded as part of the original award and are consequently not included in the Exercised column. |
| (e) | The number shown in the column headed ‘Number at 1st January 2006’ includes shares held by Robert E Diamond Jr which reflect interests built up over the course of successive years’ service with Barclays. The awards were related to Robert E Diamond Jr’s contribution to the performance of Barclays Capital, BGI and the Barclays Group. |
| (f) | The shares under option shown in this column are already included in the numbers shown at 1st January 2006 and relate to provisional allocations made in 2002 and 2003 except that the figures do not include accumulated dividend shares under option as follows: 6,484 shares for John Varley, 4,484 shares for Gary Hoffman, 57,765 shares for Naguib Kheraj and 4,272 shares for David Roberts. Under ESAS, a participant pays £1 to exercise an option, irrespective of the number of shares involved. |
| (g) | The shares under option in this column are not included in the numbers shown at 1st January 2006 or 31st December 2006 in the first table on this page. |
| (h) | Awards in respect of 2006 will be made in March 2007. Including the maximum potential 30% bonus share element, awards will total £698,750 to John Varley, £4,517,500 to Robert E Diamond Jr, £203,125 to Gary Hoffman and £520,000 to Frits Seegers. |
| (i) | Nothing was paid by the participants on the grant of options or awards. |
| (j) | Please refer to page 124 for further details on ESAS and voluntary ESAS. |
| | |
| 132 | | Barclays PLC Annual Report 2006 |
| |
Executive Directors: awards under PSP(a)(e)
| | | | | | | | | | | | | | | | |
| | | Shares
under
initial
allocation
at
1st January
2006 | | Shares
under
initial
allocation
granted
during
2006(b) | | Maximum
number
of shares
granted
during
2006 | | Market
price
on
award
date
£(c) | | Performance
period(d) | | Scheduled
vesting
date | | Shares under
initial
allocation at
31st December
2006 | | Maximum
number of
shares under
award at
31st December
2006 |
Executive Directors | | | | | | | | | | | | | | | | |
John Varley | | | | | | | | | | | | | | | | |
2005 | | 142,045 | | – | | – | | – | | 01/01/05 – 31/12/07 | | 16/06/08 | | 142,045 | | 426,135 |
2006 | | – | | 153,748 | | 461,244 | | 6.75 | | 01/01/06 – 31/12/08 | | 23/03/09 | | 153,748 | | 461,244 |
Total | | | | | | | | | | | | | | 295,793 | | 887,379 |
Robert E Diamond Jr | | | | | | | | | | | | | | | | |
2005 | | 52,083 | | – | | – | | – | | 01/01/05 – 31/12/07 | | 16/06/08 | | 52,083 | | 156,249 |
2006 | | – | | 768,736 | | 2,306,208 | | 6.75 | | 01/01/06 – 31/12/08 | | 23/03/09 | | 768,736 | | 2,306,208 |
Total | | | | | | | | | | | | | | 820,819 | | 2,462,457 |
Gary Hoffman | | | | | | | | | | | | | | | | |
2005 | | 75,758 | | – | | – | | – | | 01/01/05 – 31/12/07 | | 16/06/08 | | 75,758 | | 227,274 |
2006 | | – | | 96,092 | | 288,276 | | 6.75 | | 01/01/06 – 31/12/08 | | 23/03/09 | | 96,092 | | 288,276 |
Total | | | | | | | | | | | | | | 171,850 | | 515,550 |
Naguib Kheraj | | | | | | | | | | | | | | | | |
2005 | | 87,121 | | – | | – | | – | | 01/01/05 – 31/12/07 | | 16/06/08 | | 87,121 | | 261,363 |
2006 | | – | | 107,624 | | 322,872 | | 6.75 | | 01/01/06 – 31/12/08 | | 23/03/09 | | 107,624 | | 322,872 |
Total | | | | | | | | | | | | | | 194,745 | | 584,235 |
David Roberts | | | | | | | | | | | | | | | | |
2005 | | 75,758 | | – | | – | | – | | 01/01/05 – 31/12/07 | | 16/06/08 | | 75,758 | | 227,274 |
2006 | | – | | 92,250 | | 276,750 | | 6.75 | | 01/01/06 – 31/12/08 | | 23/03/09 | | 92,250 | | 276,750 |
Total | | | | | | | | | | | | | | 168,008 | | 504,024 |
Frits Seegers | | | | | | | | | | | | | | | | |
2006 | | – | | 157,728 | | 473,184 | | 6.36 | | 01/01/06 – 31/12/08 | | 04/08/09 | | 157,728 | | 473,184 |
Total | | | | | | | | | | | | | | 157,728 | | 473,184 |
Executive Directors: Retained Incentive Opportunity(f)(g)
| | | | | | | | |
| | | Date of
award | | Maximum
potential
value
£000s | | Performance
period | | Vesting
date |
Robert E Diamond Jr | | 25/05/05 | | 14,850 | | 01/01/05 – 31/12/07 | | No later
than
15/03/08 |
Notes
| (a) | The shares granted during 2005 and 2006 are scheduled for release in June 2008 and March 2009 (August 2009 for Frits Seegers) respectively, to the extent that the applicable performance conditions are achieved. Dividend shares may also be released in respect of the vested shares. |
| (b) | In respect of John Varley, Robert E Diamond Jr, Gary Hoffman, Naguib Kheraj and David Roberts, the price used to convert the present fair value of the award to a number of shares was £6.50. This was an average over the period 21st February 2006 to 10th March 2006. In respect of Frits Seegers, the price used to convert the present fair value of the award to a number of shares was £6.34, which was the price at which shares were purchased in the market to fund the award. |
| (c) | The price shown is the mid-market closing price on the date of the award. |
| (d) | The details of the performance conditions for PSP are included on page 125. |
| (e) | Nothing was paid by the participants on the grant of awards. |
| (f) | This Retained Incentive Opportunity is specific to Robert E Diamond Jr, under which he retains an opportunity broadly equivalent to a prior opportunity to participate in a Barclays Capital long-term incentive arrangement. It is intended to maintain close alignment of reward with Robert E Diamond Jr’s continued contribution to the performance of Barclays Capital. The performance measure is the cumulative EP performance of Barclays Capital during the period 1st January 2005 to 31st December 2007. To achieve the maximum potential value shown above, Barclays Capital would need to generate cumulative EP of £2bn over the performance period. If EP for the performance period is less than £500m, Robert E Diamond Jr will not be eligible for any award. If the minimum performance requirement of £500m EP is met, the potential value of the award would be in a range of £0.65m to £1.08m. The potential value of the Retained Incentive Opportunity between £500m cumulative EP and £2bn cumulative EP is subject to a performance curve graduated to deliver higher proportionate value at higher levels of cumulative EP. Robert E Diamond Jr must normally be in the employment of the Barclays Group on the vesting date, to remain eligible. In determining the potential value of the Retained Incentive Opportunity, the Committee will take into account Robert E Diamond Jr’s individual contribution during the performance period, and the underlying financial health of the Barclays Group. The amount and basis for determining any entitlement under the Retained Incentive Opportunity will not be altered to the advantage of Robert E Diamond Jr without prior approval of shareholders in general meeting. |
| (g) | Under the Retained Incentive Opportunity, 50% of any potential award would be payable in cash on the vesting date. A recommendation would be made to the trustee of ESAS for an award of Barclays shares, in the form of a provisional allocation, in respect of the remaining 50%. Any shares under the ESAS award would be releasable after 12 months from the award date. The Retained Incentive Opportunity is not pensionable. |
| | |
Barclays PLC Annual Report 2006 | | 133 |
| |
Corporate governance
Remuneration report
Chairman and executive Directors: shares under option under Sharesave(a)
| | | | | | | | | | | | | | | | | | |
| | | | | During 2006 | | | | | | Information as at 31st December 2006 |
| | | Number
held at
1st
January
2006 | | Granted | | Exercised | | Exercise
price per
share
£ | | Market
price on
date of
exercise
£ | | Number
of shares
held under
option | | Weighted
average
exercise
price of
outstanding
options £ | | Date from
which
exercisable | | Latest
expiry
date |
| | | | | | | | | |
Chairman | | | | | | | | | | | | | | | | | | |
Matthew W Barrett | | 2,479 | | – | | 2,479 | | 3.73 | | 7.05 | | – | | – | | – | | – |
| | | | | | | | | |
Executive Directors | | | | | | | | | | | | | | | | | | |
John Varley | | 4,096 | | – | | – | | – | | – | | 4,096 | | 4.11 | | 01/11/06 | | 30/04/07 |
Robert E Diamond Jr | | – | | – | | – | | – | | – | | – | | – | | – | | – |
Gary Hoffman | | 6,091 | | 1,743 | | 1,360 | | 3.56 | | 7.05 | | 6,474 | | 4.29 | | 01/11/07 | | 30/04/14 |
Naguib Kheraj | | 4,007 | | – | | – | | – | | – | | 4,007 | | 4.08 | | 01/11/09 | | 30/04/10 |
David Roberts | | 5,227 | | 631 | | 1,068 | | 3.16 | | 6.65 | | 3,974 | | 4.10 | | 01/11/07 | | 30/04/12 |
| | | | | | 816 | | 4.11 | | 7.05 | | | | | | | | |
Frits Seegers(b) | | – | | – | | – | | – | | – | | – | | – | | – | | – |
Notes
| (a) | Nothing was paid by the participants on the grant of options. |
| (b) | Frits Seegers was appointed as an executive Director on 10th July 2006 and was therefore not eligible to participate in the 2006 Sharesave invitation. |
| | |
| 134 | | Barclays PLC Annual Report 2006 |
| |
Chairman and executive Directors: plans used in previous years (ESOS, ISOP and the BGI EOP)
The Chairman and executive Directors continue to have interests in Barclays PLC ordinary shares under ESOS(a)and ISOP(b)and in BGI Holdings under the BGI EOP(c)(as indicated in the table below). No awards were made to Directors under these plans during 2006.
Chairman and executive Directors: awards under plans used in previous years(g)
| | | | | | | | | | | | | | | | | | |
| | | Maximum
number of
shares under
option
at
1st January
2006 | | During 2006 | | Market
price on
exercise
date
£ | | Maximum
number of
shares under
option at
31st
December
2006 | | Weighted
average
exercise
price of
outstanding
options
£ | | Date from
which
exercisable | | Latest
expiry
date | | Target/vested
number
of shares
at 31st
December
2006(d) |
| | | Exercised | | Lapsed | | | | | | |
| | | | | | | | | |
Chairman | | | | | | | | | | | | | | | | | | |
Matthew W Barrett | | | | | | | | | | | | | | | | | | |
ESOS(e) | | 766,628 | | – | | – | | – | | 766,628 | | 4.43 | | 06/09/02 | | 03/10/09 | | 766,628 |
ISOP | | 2,832,000 | | 2,000,000 | | – | | 7.11 | | 832,000 | | 4.45 | | 18/05/03 | | 11/03/11 | | 832,000 |
| | | | | | | | | |
Executive Directors | | | | | | | | | | | | | | | | | | |
| | | | | | | | | |
John Varley | | | | | | | | | | | | | | | | | | |
ISOP | | 2,060,000 | | – | | – | | – | | 2,060,000 | | 4.45 | | 18/05/03 | | 22/03/14 | | 920,000 |
Robert E Diamond Jr | | | | | | | | | | | | | | | | | | |
ESOS | | 100,000 | | – | | – | | – | | 100,000 | | 3.97 | | 14/08/01 | | 13/08/08 | | 100,000 |
ISOP | | 1,340,000 | | – | | – | | – | | 1,340,000 | | 4.42 | | 12/03/04 | | 22/03/14 | | 560,000 |
BGI EOP | | 200,000 | | 100,000 | | – | | 77.60 | | 100,000 | | 20.11 | | 26/03/07 | | 26/03/14 | | 100,000 |
Gary Hoffman | | | | | | | | | | | | | | | | | | |
ISOP | | 1,520,000 | | 200,000 | | – | | 6.93 | | 1,320,000 | | 4.40 | | 12/03/04 | | 22/03/14 | | 540,000 |
Naguib Kheraj | | | | | | | | | | | | | | | | | | |
ESOS | | 60,000 | | – | | – | | – | | 60,000 | | 3.97 | | 14/08/01 | | 13/08/08 | | 60,000 |
ISOP | | 1,360,000 | | – | | – | | – | | 1,360,000 | | 4.40 | | 12/03/04 | | 22/03/14 | | 520,000 |
David Roberts | | | | | | | | | | | | | | | | | | |
ISOP | | 1,300,000 | | 260,000 | | – | | 7.15 | | 1,040,000 | | 4.33 | | 14/03/06 | | 22/03/14 | | 260,000 |
Frits Seegers(f) | | | | | | | | | | | | | | | | | | |
– | | – | | – | | – | | – | | – | | – | | – | | – | | – |
Notes
| (a) | Under ESOS, options granted (at market value) to executives were exercisable only if the growth in Barclays earnings per share over the three-year period was at least equal to the percentage increase in the UK Retail Prices Index plus 6% over the same period. The performance condition for the 1999 ESOS grant was met. |
| (b) | Under ISOP, executives were awarded options (at market value) over Barclays shares which are normally exercisable after three years. The number of shares over which options can be exercised depends upon performance against specific performance conditions. For ISOP awards granted in 2000 to 2003, the first 40,000 target shares under option for each award was subject to an EP performance condition, tested over a period of three years. Any amount above 40,000 target shares was subject to a relative TSR performance condition, to be tested initially over three years. Because the TSR performance condition was not met over three years in relation to the awards in 2003, the TSR condition was tested over a period of four years from the original start date. Awards in 2004 were subject to a relative TSR performance condition. For the 2003 and 2004 grants under ISOP, which become exercisable in 2007, Barclays was ranked sixth in the peer group under the TSR performance condition. This was sufficient for only 25% of the maximum number of shares under the TSR condition to vest. The remaining 75% will lapse. |
| (c) | Robert E Diamond Jr received a grant under the BGI EOP in March 2004. He was not a Director of Barclays PLC at that time. The BGI EOP is an option plan, approved by shareholders in 2000 and offered predominantly to participants in the US. Under the BGI EOP, participants receive an option to purchase shares in Barclays Global Investors UK Holdings Limited. The exercise price is based on the fair value at the time of grant. The option normally vests in three equal tranches on the first, second, and third anniversary of the date of grant. Participants must, in accordance with the Articles of Association of Barclays Global Investors UK Holdings Limited, keep their shares for 355 days after the date of exercise, before they may be offered for sale. In line with market practice, the options were not subject to performance conditions. Robert E Diamond Jr is not eligible to receive further awards under the BGI EOP. The shares shown in respect of the BGI EOP in the above table are shares in Barclays Global Investors UK Holdings Limited. |
| (d) | The number of shares shown for ISOP options represents the target award shares under option, or the actual number of shares under option if the award had vested as at 31st December 2006. The target number of shares takes account of the stretch in the performance condition and the probability of vesting. |
| (e) | The independent trustee of the Barclays Group (PSP) Employees’ Benefit Trust granted Matthew W Barrett a share award in 1999 comprising an option on similar terms to options granted under ESOS. For convenience these are described as granted under ESOS in the above table. |
| (f) | Frits Seegers was appointed as an executive Director on 10th July 2006 and therefore no participation in the above plans has been offered to him. |
| (g) | Nothing was paid by the participants on the grant of options. |
| | |
Barclays PLC Annual Report 2006 | | 135 |
| |
Corporate governance
Remuneration report
Directors: interests in ordinary shares of Barclays PLC(a)
| | | | | | | | |
| | | At 1st January 2006(b) | | At 31st December 2006 |
| | | Beneficial | | Non-
beneficial | | Beneficial | | Non-
beneficial |
Chairman | | | | | | | | |
Matthew W Barrett | | 302,264 | | – | | 2,000 | | – |
Executive Directors | | | | | | | | |
John Varley(c) | | 360,049 | | – | | 375,053 | | – |
Robert E Diamond Jr(e) | | 1,512,575 | | – | | 2,531,582 | | – |
Gary Hoffman(c) | | 172,702 | | – | | 319,186 | | – |
Naguib Kheraj(d) | | 8,550 | | – | | 141,442 | | – |
David Roberts(d) | | 78,191 | | – | | 225,577 | | – |
Frits Seegers(f) | | – | | – | | 4,319 | | – |
Non-executive Directors(c) | | | | | | | | |
Marcus Agius(g) | | – | | – | | 15,000 | | – |
Sir Richard Broadbent | | 6,068 | | – | | 8,092 | | – |
Leigh Clifford | | 3,460 | | – | | 5,219 | | – |
Fulvio Conti(h) | | – | | – | | 2,538 | | – |
Dr Danie Cronjé(d) | | 2,000 | | – | | 3,547 | | – |
Professor Dame Sandra Dawson | | 7,822 | | – | | 9,953 | | – |
Sir Andrew Likierman | | 3,628 | | – | | 5,441 | | – |
Sir Nigel Rudd | | 16,788 | | – | | 51,117 | | – |
Stephen Russell | | 16,221 | | – | | 18,661 | | – |
Sir John Sunderland | | 8,308 | | – | | 10,054 | | – |
Notes
| (a) | Beneficial interests in the table above represent shares held by Directors who were on the Board as at 31st December 2006, either directly or through a nominee, their spouse and children under 18. They include any interests held through Sharepurchase, but do not include any awards under ESAS, ISOP, PSP, ESOS and Sharesave. At 31st December 2006, Matthew W Barrett and the executive Directors, together with other senior executives, were potential beneficiaries in respect of a total of 165,645,889 Barclays PLC ordinary shares (1st January 2006: 147,145,847) held by the trustees of the Barclays EBTs. At 27th February 2007, a total of 181,139,684 shares were held by the trustees. |
| (b) | Or date appointed to the Board if later. |
| (c) | Between 31st December 2006 and 27th February 2007, John Varley and Gary Hoffman each purchased 33 Barclays shares through Sharepurchase. On 21st February 2007, the non-executive Directors acquired ordinary shares pursuant to arrangements under which part of each non-executive Director’s fee is used to buy shares in Barclays. Barclays shares were acquired by each non-executive Director as follows: Marcus Agius – 427; Sir Richard Broadbent – 806; Leigh Clifford – 763; Fulvio Conti – 732; Dr Danie Cronjé – 767; Professor Dame Sandra Dawson – 856; Sir Andrew Likierman – 786; Sir Nigel Rudd – 940; Stephen Russell – 917; Sir John Sunderland –748. Except as described in this note, there were no changes to the beneficial or non-beneficial interests of Directors in the period 31st December 2006 to 27th February 2007. |
| (d) | As at 1st January 2006, Naguib Kheraj, David Roberts and Dr Danie Cronjé held 1,200, 1,200, and 101,577 shares in Absa Group Limited respectively. As at 31st December 2006, Naguib Kheraj, David Roberts, Frits Seegers and Dr Danie Cronjé held 1,200, 1,200, 1,000 and 101,577 shares in Absa Group Limited, respectively. Dr Danie Cronjé also held 7,500 non-cumulative, non-redeemable preference shares in Absa Bank Limited as at 31st December 2006. |
| (e) | As at 1st January 2006 and 31st December 2006, Robert E Diamond Jr also held 100,000 and 200,000 ‘A’ ordinary shares in Barclays Global Investors UK Holdings Limited respectively. |
| (f) | Appointed as an executive Director on 10th July 2006. |
| (g) | Appointed as a non-executive Director on 1st September 2006. |
| (h) | Appointed as a non-executive Director on 1st April 2006. |
| | |
| 136 | | Barclays PLC Annual Report 2006 |
| |
Corporate governance
Accountability and audit
Going concern
The Directors confirm they are satisfied that the Company and the Group have adequate resources to continue in business for the foreseeable future. For this reason, they continue to adopt the ‘going concern’ basis for preparing the accounts.
Internal control
The Directors have responsibility for ensuring that management maintain an effective system of internal control and for reviewing its effectiveness. Such a system is designed to manage rather than eliminate the risk of failure to achieve business objectives, and can only provide reasonable and not absolute assurance against material misstatement or loss. Throughout the year ended 31st December 2006, and to date, the Group has operated a system of internal control which provides reasonable assurance of effective and efficient operations covering all controls, including financial and operational controls and compliance with laws and regulations. Processes are in place for identifying, evaluating and managing the significant risks facing the Group in accordance with the guidance ‘Internal Control: Guidance for Directors on the Combined Code’ published by the Financial Reporting Council. The Board regularly reviews these processes through the Board Committees.
The Directors review the effectiveness of the system of internal control semi-annually. An internal control compliance certification process is conducted throughout the Group in support of this review. The effectiveness of controls is periodically reviewed within the business areas. Regular reports are made to the Board Audit Committee by management, Internal Audit and the compliance and legal functions covering particularly financial controls, compliance and operational controls. The Board Audit Committee monitors resolution of any identified control issues of Group level significance through to a satisfactory conclusion.
The key document for the Group’s internal control processes is the Group Internal Control and Assurance Framework (GICAF) which describes the Group’s approach to internal control and details Group policies and processes. The GICAF is reviewed and approved on behalf of the Group Chief Executive by the Group Governance and Control Committee.
Quarterly risk reports are made to the Board covering risks of Group significance including credit risk, market risk and operational risk, including legal and compliance risk. Reports covering risk measurement standards and risk appetite are made to the Board Risk Committee. Further details of risk management procedures are given in the Risk management section on pages 64 to 103.
Management’s report on internal control over financial reporting
The management of Barclays PLC is responsible for establishing and maintaining adequate internal control over financial reporting. Barclays PLC’s internal control over financial reporting is a process designed under the supervision of Barclays PLC’s principal executive and principal financial officers to provide reasonable assurance regarding the reliability of financial reporting and the preparation of financial statements for external reporting purposes in accordance with International Financial Reporting Standards (IFRSs) as adopted by the European Union and for the purposes of preparation of reconciliations to Generally Accepted Accounting Practices in the United States (US GAAP).
Barclays PLC’s internal control over financial reporting includes policies and procedures that pertain to the maintenance of records that, in reasonable detail, accurately and fairly reflect transactions and dispositions of assets; provide reasonable assurances that transactions are recorded
as necessary to permit preparation of financial statements in accordance with IFRSs and of reconciliations under US GAAP, and that receipts and expenditures are being made only in accordance with authorisations of management and the Directors of Barclays PLC; and provide reasonable assurance regarding prevention or timely detection of unauthorised acquisition, use or disposition of Barclays PLC’s assets that could have a material effect on Barclays PLC’s financial statements.
Internal control systems, no matter how well designed, have inherent limitations and may not prevent or detect misstatements. Also, projections of any evaluation of effectiveness to future periods are subject to the risk that internal controls may become inadequate because of changes in conditions, or that the degree of compliance with the policies or procedures may deteriorate.
Management has assessed the effectiveness of Barclays PLC’s internal control over financial reporting as of 31st December 2006. In making its assessment, management has utilised the criteria set forth by the Committee of Sponsoring Organisations of the Treadway Commission in Internal Control – Integrated Framework. Management concluded that based on its assessment, Barclays PLC’s internal control over financial reporting was effective as of 31st December 2006.
PricewaterhouseCoopers LLP, an independent registered public accounting firm which has audited the consolidated financial statements of the Group for the fiscal year ended 31st December 2006, has also audited management’s assessment of the effectiveness of Barclays PLC’s internal control over financial reporting and the effectiveness of Barclays PLC’s internal controls over financial reporting; their report is included herein on page 146.
The system of internal financial and operational controls is also subject to regulatory oversight in the United Kingdom and overseas. Further information on supervision by the financial services regulators is provided under Supervision and Regulation in the Risk Factors section on page 62.
Statement of Directors’ responsibilities for accounts
The following statement, which should be read in conjunction with the Auditors’ report set out on page 146, is made with a view to distinguishing for shareholders the respective responsibilities of the Directors and of the auditors in relation to the accounts.
The Directors are required by the Companies Act 1985 to prepare accounts for each financial year and, with regards to Group accounts, in accordance with Article 4 of the IAS Regulation. The Directors have prepared individual accounts in accordance with IFRS as adopted by the European Union. The accounts are required by law and IFRS to present fairly the financial position of the Company and the Group and the performance for that period; the Companies Act 1985 provides, in relation to such accounts, that references in the relevant part of the law to accounts giving a true and fair view are references, to their achieving fair presentation.
The Directors consider that, in preparing the accounts on pages 147 to 270, and the additional information contained on pages 271 to 297, the Group has used appropriate accounting policies, supported by reasonable judgements and estimates, and that all accounting standards which they consider to be applicable have been followed.
The Directors have responsibility for ensuring that the Company and the Group keep accounting records which disclose with reasonable accuracy the financial position of the Company and the Group and which enable them to ensure that the accounts comply with the Companies Act 1985.
| | |
Barclays PLC Annual Report 2006 | | 137 |
| |
Corporate governance
Accountability and audit
The Directors have general responsibility for taking such steps as are reasonably open to them to safeguard the assets of the Group and to prevent and detect fraud and other irregularities.
Disclosure controls and procedures
The Group Chief Executive, John Varley, and the Group Finance Director, Naguib Kheraj, conducted with Group Management an evaluation of the effectiveness of the design and operation of the Group’s disclosure controls and procedures as at 31st December 2006, which are defined as those controls and procedures designed to ensure that information required to be disclosed in reports filed or submitted under the US Securities Exchange Act of 1934 is recorded, processed, summarised and reported within the time periods specified in the US Securities and Exchange Commission’s rules and forms. As of the date of the evaluation, the Group Chief Executive and Group Finance Director concluded that the design and operation of these disclosure controls and procedures were effective. The Group Chief Executive and Group Finance Director also concluded that no significant changes were made in our internal controls or in other factors that could significantly affect these controls subsequent to their evaluation.
Signed on behalf of the Board

Marcus Agius
Chairman
8th March 2007
| | |
| 138 | | Barclays PLC Annual Report 2006 |
| |
Corporate responsibility
Responsible banking
The past year has seen another marked increase in the profile of corporate responsibility as a topic of global strategic significance. Two issues have dominated debate – the emergence of climate change and its consequences as the most pressing challenge facing the world and the evolution of thought on social, ethical and environmental issues under the overarching concept of ‘sustainability’.
For Barclays, corporate responsibility is embodied in the concept of ‘responsible banking’ – reflecting its place at the heart of our strategy as an integral part of the way in which we do business. Firmly based on the clear values enshrined in our Guiding Principles, responsible banking means making informed, reasoned and ethical decisions in our business dealings with customers, clients, employees and our other stakeholders. Our Guiding Principles of Winning Together, Customer Focus, The Best People, Pioneering and Trusted describe how we expect our employees to behave with external stakeholders and each other. Responsible banking is the approach by which we aim to progress towards sustainability – recognising that we will succeed in our strategic and financial goals only if we have a strong commitment and focus on achieving sustainable outcomes for all stakeholders.
We make our greatest contribution to society by being good at what we do and by doing so responsibly – by helping our customers meet their financial goals through providing competitive products and services that contribute to economic growth, and in contributing to healthy financial systems around the world.
Our corporate responsibility priorities are informed by regular dialogue with a wide range of organisations and in 2006 we undertook a much broader programme of formal and informal dialogue with investors, non-governmental organisations, customers, our employees and politicians. Our approach is focused on the following areas:
| · | | Environment and climate change |
| · | | Supply chain management |
This is underpinned by a strong governance framework.
Governance
The Group Chief Executive, supported by the Group Executive Committee, has primary responsibility for embedding ‘responsible banking’ throughout Barclays. This includes setting strategy and the identification, review and reporting of all business issues (whether risks or commercial opportunities) which have an important social, environmental or ethical dimension.
The Brand and Reputation Committee, a sub-committee of Group Executive Committee, is chaired by Sir Nigel Rudd, Deputy Chairman and a non-executive Director on the Board. The Committee’s role is to identify and manage issues of reputational significance to the Barclays Group. The Committee met three times during the year.
The Community Partnerships Committee sets the policy and provides governance for our global community investment, and the Environmental Steering Group provides direction and governance to support our environmental and climate change strategies.
Corporate responsibility is firmly established as one of the Board Governance Standards, providing for internal control and governance and establishing ‘responsible banking’ as a key area of profile and measurement within our risk management processes.
Ethical indices
Barclays is a long-standing member of the Dow Jones Sustainability and FTSE4Good ethical indices. Our ranking in the Business in the Community Corporate Responsibility Index rose to 3rd position out of 131 companies. In the Carbon Disclosure Project, we were ranked in the top 50 of the global FT 500 companies.
Our customers
An unswerving focus on our customers lies at the heart of our Guiding Principles. We are committed to providing them with excellent products and services and doing so in accordance with our ten established principles for treating customers fairly, with openness and with transparency. Our aim is to improve the information we give to customers so that they can make better informed decisions in line with their own circumstances and needs.
We have made a large investment in improving our customer service, most notably in our UK Retail Business. We are, therefore, encouraged to see that the progress we reported last year has been maintained in the areas of customer satisfaction and advocacy, as we have implemented steps to improve products and to rectify challenges in key areas such as mortgage processing, where we have made major changes.
Across our other businesses – UK Business Banking, Barclays Capital, Barclays Global Investors, Barclays Wealth and in our African and European retail operations, strong levels of customer satisfaction and advocacy have been sustained.
During the year, we announced our intention to merge our network of Woolwich branches in the UK into Barclays, at the same time investing in our branch network and in the Woolwich as our mortgage brand. This will give Woolwich customers access to all Barclays branches and ATMs and vice versa. The branches we are bringing together are near neighbours – 300 metres or less apart and there will be no change in our community footprint as a result.
Financial inclusion
With 2.7 billion people across the world living on less than US$2 per day and some 2.8 million UK adults without access to a bank account, increasing financial inclusion is both a social imperative and a commercial opportunity. Our focus in this area has been on our businesses in the UK and in Africa and specifically on improving both access to banking and to affordable credit and savings.
In South Africa, Absa’s Customer Education Programme is making banking more accessible to customers at the lower end of the mass market through a range of audio visual channels, whilst in the UK we continued to support agencies such as the Money Advice Trust, Citizens Advice and Business Debtline.
We increased the number of our Cash Card (basic bank) Accounts, designed for low income and vulnerable people in the UK, by 85,000 to 464,000 and held a ‘roundtable’ discussion with three consumer groups – Citizens Advice, the National Consumer Council and SAFE (Services Against Financial Exclusion), an initiative of Toynbee Hall – to inform improvements and increase access to this account. New functions have been added to the account and, based on the feedback, we are giving more profile to the savings needs of these customers. In the UK, our personal current account customers can continue to make cash withdrawals free of charge through the Post Office network.
| | |
Barclays PLC Annual Report 2006 | | 139 |
| |
Corporate responsibility
Absa has been addressing access in South Africa through various means. Portable branches are bringing banking to deprived areas, enabling a full range of transactions to be handled efficiently. 13 were opened in 2006. 1.5 million more South Africans were brought into banking via the Mzansi account, of which Absa continues to be the leading bank provider. The bank has also implemented its AllPay and Sekulula services, enabling 2.3 million social grant beneficiaries to access their payments in four provinces.
We remain the leading private sector supporter of credit unions in the UK, whilst our pilot of microbanking in Ghana through the traditional Susu system proved very successful, reaching over 80,000 disadvantaged market traders and supporting the UN Millennium Development Goals. Work is now under way to develop microfinance programmes for implementation in other African countries.
Responsible lending
The consumer lending market in the UK has continued to be both intensely competitive and challenging. Our commitment is to provide clear and straightforward information to our customers so that they can readily see the terms and conditions and then make an informed personal decision. We have further developed the use of summary information on credit card and personal loan application forms and statements, to help customers understand our terms and pricing and also, for example, the implications of making only the minimum payment on their credit card outstandings.
We are working closely with other banks and finance providers to share information about how people manage their accounts, in the belief that this has a key role to play in helping banks assist their customers through responsible lending practices and customer care. Another development is to encourage responsible borrowing through the introduction of our Flexi-Rate™ card, which offers a lower interest rate to those customers who repay more of their outstanding credit card balance each month.
Environment and climate change
The effects of climate change constitute the most pressing challenge to global sustainability and we continue to reflect this in our policies and actions. As a bank, our impacts are both direct – through our own operations – and indirect – through our lending and other business activities with customers and clients.
One of our key initiatives has been to make our UK operations carbon-neutral. We have achieved this through significant investment in energy efficiency and through the purchase of renewable energy – 50% of our UK operations are now being supplied from renewable sources. Part of our remaining offset of over 200,000 tonnes of CO2 is provided through the purchase of carbon credits in the market, together with a strong contribution from community-based sustainable energy schemes such as solar and wind power in Africa and India.
Barclays CO2 emissions from energy and travel
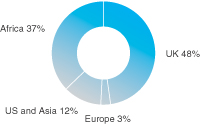
We are also helping to combat climate change through the development of carbon-related products and services, such as our launch of the first carbon-neutral debit card in the UK. Barclays Capital continued to support the vital carbon trading market, where it remains the most active trader. Our Natural Resources Team has provided long-term finance for over 2,600MW of renewable generating capacity, including onshore windfarms, landfill gas extraction plants and bio-diesel conversion plants.
We have committed strongly to the efficient management of our resources, reducing waste and increasing recycling. We extended our ISO14001 certified Environmental Management System, with our operations in France and Absa in South Africa becoming the first major banks in those countries to achieve such accreditation.
As a result of this activity, we improved our score in the Dow Jones Sustainability Index, retaining our 1st position amongst global banks for environmental reporting and joint 1st in environmental performance. In the UK, we achieved 2nd position in the Business in the Environment Index.
As a co-founder of the Equator Principles, which require banks to undertake detailed social and environmental impact assessments when financing projects such as dams and mines, we contributed to the revision and strengthening of the Principles. The threshold amount has been reduced from US$50m to US$10m and criteria tightened, such that they now include more robust procedures for public consultation and a greater focus on social impacts.
Project finance deals – whole Barclays Group
| | | | | | | | |
Category | | A
Higher
Risk | | B
Medium
Risk | | C
Lower
Risk | | Total
2006 |
Number of project finance deals | | 8 | | 10 | | 18 | | 36 |
Deals completed or pending | | 4 | | 9 | | 17 | | 30 |
– of which, number where E/S(a)related changes were made | | 4 | | 9 | | 17 | | 30 |
Deals considered, but not participated in | | 4 | | 1 | | 1 | | 6 |
Projects referred from EU | | 6 | | 4 | | 15 | | 25 |
Projects referred from Africa | | 1 | | 2 | | 2 | | 5 |
Projects referred from Asia Pacific | | 1 | | 2 | | 0 | | 3 |
Projects referred from North America | | 0 | | 2 | | 1 | | 3 |
(a) E/S = Environmental and social issues.
During the year, we updated our internal environmental and social risk guidance, extending it to over 50 different industry sectors. This guidance, which was developed with input from environmental NGOs, now reflects more explicit information on social and other human rights-related impacts. This review also benefited from our work as the only bank participating in the Business Leaders’ Initiative on Human Rights. The guidance has been shared with the United Nations Environment Programme – Finance Initiative and has been made available to their 167 members around the world.
| | |
| 140 | | Barclays PLC Annual Report 2006 |
| |
Supply chain management
Responsible sourcing principles are an important component in our commitment to sustainability whilst, at the same time, enabling us to manage business risk. A key achievement in 2006 was the circulation of our new Corporate Responsibility Questionnaire to our suppliers operating in sectors of higher or medium level environmental or social risk. So far, we have reviewed some 60 suppliers, accounting for approximately £1.5bn of our total annual spend.
The information gathered through our questionnaire is helping to ensure that the social and environmental policies of our suppliers are in line with Barclays own standards. In those cases where suppliers have performed relatively poorly, we intend to work with them to help them improve performance.
In 2006, Absa in South Africa spent over 55% of their annual sourcing total with businesses qualifying under the Black Economic Empowerment guidelines. These support the South African Government’s objective to ensure that its citizens have the opportunity to participate in the economic progress of the country.
In the UK, we worked with our cleaning contractors to secure new terms and conditions for some 2,400 cleaning staff in our 2,000 UK branches. This groundbreaking initiative means that the cleaners will now benefit from improved pay and opportunities for training, as well as access to a pension, sick pay, increased holiday entitlements and annual leave.
Our employees
The commitment, motivation and talent of our employees lies at the heart of our approach to sustainability. During 2006, we continued our pioneering partnership agreement with Amicus, our UK trade union, and signed a joint Equality Charter that commits us to advancing equality for our employees.
Our annual independent Employee Opinion Survey showed further improvements. 87% of our colleagues participated in the survey and 84% expressed pride in working for Barclays, with Employee Engagement standing at 76% (72% in 2005). Employee perceptions of Barclays as a responsible company showed further strong progress.
Employee opinion survey results
(% Positive Scores)
| | | | |
| | | 2006 | | 2005 |
Perceptions of Leadership | | 62 | | 58 |
Employer of Choice | | 70 | | 67 |
Barclays operates with integrity | | 84 | | 80 |
Barclays is an environmentally responsible company | | 77 | | 76 |
Barclays is a socially responsible company | | 83 | | 80 |
I am proud to work for Barclays | | 84 | | 80 |
Diversity amongst our employees is both a long-term commitment and a business imperative. 21% of our senior employees are female and this is a start, but we accept that there is more to do. We boosted our intake of disabled graduates to our summer internship programme with good progress across our businesses and we benefited from a proactive partnership with Spain’s Fundación Once.
6% of our UK senior managers are now from an ethnic minority background whilst, over the past five years, the number of our ethnic minority employees in the UK has risen from 7% to 13%. In South Africa, Absa continued to make strong progress with its commitments under the Financial Sector Charter to increase the number of black managers at all levels and, as a sub-set, black female managers.
UK employment statistics
| | | | | | |
| | | 2006 | | 2005 | | 2004 |
Total employee headcount | | 62,400 | | 59,100 | | 60,000 |
Average length of service (years) | | 9.8 | | 10.2 | | 10.5 |
Percentage working part time | | 21.8% | | 23.7% | | 24.6% |
Sickness absence rate | | 4.0% | | 4.2% | | 4.4% |
Turnover rate | | 19.0% | | 20.0% | | 19.3% |
Resignation rate | | 12.0% | | 11.5% | | 11.8% |
Women in Barclays | | | | | | |
Percentage of all employees | | 61.0% | | 62.2% | | 63.4% |
Percentage of management grades | | 33.0% | | 30.9% | | 30.5% |
Percentage of senior executives | | 12.9% | | 10.9% | | 10.5% |
Ethnic minorities in Barclays | | | | | | |
Percentage of all employees | | 12.7% | | 11.3% | | 10.5% |
Percentage of management grades | | 8.1% | | 7.1% | | 7.0% |
Percentage of senior executives | | 6.1% | | 3.6% | | 3.3% |
Disabled employees in Barclays | | | | | | |
Percentage of all employees | | 5.0% | | 3.4% | | 3.2% |
Notes
All headcount and FTE numbers relate to direct employees therefore excluding agency staff and contractors.
All employee statistics relate to Barclays in the UK excluding Barclays Global Investors (approx 800 UK employees).
All data as at 31st December.
Percentage of disabled employees is derived using responses to the GRCB and Central Support Employee Opinion Survey, 84% of UK employees.
Sickness Absence percentage excludes Barclays Capital population.
UK historical data has been restated to include Barclays Capital and therefore will differ from previously reported figures.
Occupational health is an important concern for us and we maintain a comprehensive HIV/AIDS programme across all our African businesses. This provides counselling, testing and treatment, including free anti-retroviral drugs, for our employees and their dependants. We also have extensive schemes to support business customers and our wider communities and have been active in supporting malaria programmes in various African countries.
Community investment
2006 was an important year for our community investment programme. After extensive research and consultation with stakeholders both inside and outside Barclays, we are now implementing a global programme that unites all our businesses across the world and which complements our business strategy. Our investment is now being directed towards three key themes:
| · | | Banking on brighter futures |
| · | | Looking after local communities |
| | |
Barclays PLC Annual Report 2006 | | 141 |
| |
Corporate responsibility
Banking on brighter futures focuses on the provision of money advice, tackling financial exclusion, helping disadvantaged people into work and supporting their broader education. An example of our initiatives is Barclaycard Horizons – a three-year, £3m community programme with four national partners, which aims to support 50,000 disadvantaged single parents in working their way out of debt and poverty.
Looking after local communities is about investing in the many neighbourhoods around the world where we have a presence. By far our biggest community project in the UK is Barclays Spaces for Sports, now in its third and final year. To date, over 120 community sports facilities have been completed and 3,600 coaching kits provided to local groups, benefiting some 320,000 people in disadvantaged areas.
Charity begins at work is dedicated to, and driven by, our employees. In 2006, 33,000 Barclays employees and pensioners around the world received support for fundraising or volunteering. One focus of our volunteering is Make a Difference Day, now covering 25 countries worldwide. Last year, 11,000 employees contributed their business skills, with international participation up 63% compared to the previous year.
We are a member of the PerCent Club – a group of companies that has undertaken to ensure that investment in the community over time amounts to at least 1% of UK pre-tax profit.
Further information
Our 2006 Corporate Responsibility Report contains more detailed information on our activities and will be available from 26th April 2007 and online atwww.barclays.com/corporate responsibility. We are committed to providing more information on these issues and our report has been produced taking account of the international AA1000 Standard and the 2002 Global Reporting Initiative sustainability reporting guidelines, including the Financial Sector Supplements.
| | |
| 142 | | Barclays PLC Annual Report 2006 |
| |
| | |
Barclays PLC Annual Report 2006 | | 143 |
| |
Presentation of information
Presentation of Information
Barclays PLC is a public limited company registered in England and Wales under company number 48839. The Company, originally named Barclay & Company Limited, was incorporated in England and Wales on 20th July 1896 under the Companies Acts 1862 to 1890 as a company limited by shares. The company name was changed to Barclays Bank Limited on 17th February 1917 and it was reregistered in 1982 as a public limited company under the Companies Acts 1948 to 1980. On 1st January 1985, the company changed its name to Barclays PLC.
Barclays Bank PLC is a public limited company registered in England and Wales under company number 1026167. The Bank was incorporated on 7th August 1925 under the Colonial Bank Act 1925 and on 4th October 1971 was registered as a company limited by shares under the Companies Acts 1948 to 1967. Pursuant to The Barclays Bank Act 1984, on 1st January 1985 the Bank was reregistered as a public limited company and its name was changed from Barclays Bank International Limited to Barclays Bank PLC.
All of the issued ordinary share capital of Barclays Bank PLC is owned by Barclays PLC. The Annual Report for Barclays PLC also contains the consolidated accounts of, and other information relating to, Barclays Bank PLC. The Annual Report includes information required to be included in the Barclays PLC and Barclays Bank PLC Annual Report on Form 20-F for 2006. Form 20-F will contain as exhibits certificates pursuant to Sections 302 and 906 of the Sarbanes-Oxley Act of 2002, signed by the Group Chief Executive and Group Finance Director, with respect to both Barclays PLC and Barclays Bank PLC. Except where otherwise indicated, the information given is identical with respect to both Barclays PLC and Barclays Bank PLC.
The accounts of Barclays Bank PLC included in this document do not comprise statutory accounts within the meaning of Section 240 of the Companies Act 1985. The statutory accounts of Barclays Bank PLC, which contain an unqualified audit report and do not contain any statement under Section 237(2) or (3) of that Act, will be delivered to the Registrar of Companies in accordance with Section 242 of that Act and are published as a separate document.
The term ‘Barclays PLC Group’ means Barclays PLC together with its subsidiary and the term ‘Barclays Bank PLC Group’ means Barclays Bank PLC together with its subsidiaries. ‘Barclays’ and ‘Group’ are terms which are used to refer to either of the preceding groups when the subject matter is identical. The term ‘Company’ or ‘parent Company’ refers to Barclays PLC and the term ‘Bank’ refers to Barclays Bank PLC. The term ‘Absa Group Limited’ is used to refer to Absa Group Limited and its subsidiaries and the term ‘Absa’ is used to refer to the component of the International Retail and Commercial Banking segment represented by this business. In this report, the abbreviations ‘£m’ and ‘��bn’ represent millions and thousands of millions of pounds sterling respectively; the abbreviations ‘US$m’ and ‘US$bn’ represent millions and thousands of millions of US Dollars respectively and ‘€m’ and ‘€bn’ represent millions and thousands of millions of euros respectively.
Statutory Accounts
The consolidated accounts of Barclays PLC and its subsidiary are set out on pages 147 to 270. The consolidated accounts of Barclays Bank PLC and its subsidiaries are set out on pages 274 to 285. The accounting policies on pages 147 to 156 and the Notes commencing on page 164 apply equally to both sets of accounts unless otherwise stated.
Adoption of IFRS and 2004 comparatives
The Group adopted the requirements of International Financial Reporting Standards and International Accounting Standards (collectively IFRSs) as adopted by the European Union in 2005. As permitted by IFRS 1, the accounting standards relating to financial instruments and insurance contracts have not been applied to 2004. Therefore, the 2004 comparatives are significantly different from the numbers reported in 2005 and 2006. N/a has been included in tables where, as a result of the application of IAS 32, IAS 39 and IFRS 4 in 2005 and 2006 and UK GAAP in 2004, the disclosure is not applicable.
| | |
| 144 | | Barclays PLC Annual Report 2006 |
| |
Independent Registered Public Accounting Firm’s report
Report of Independent Registered Public Accounting Firm to the Board of Directors and Shareholders of Barclays PLC
We have completed an integrated audit of Barclays PLC (the ‘Company’) and its subsidiary undertakings 31st December 2006 consolidated financial statements on pages 147 to 270 and of its internal control over financial reporting as of 31st December 2006 and an audit of its 2005 and 2004 consolidated financial statements in accordance with the standards of the Public Company Accounting Oversight Board (United States). Our opinions, based on our audits, are presented below.
Consolidated financial statements
In our opinion, the accompanying Consolidated Income Statements, Consolidated Balance Sheets, Consolidated Cash Flow Statements and the Consolidated Statements of Recognised Income and Expense present fairly, in all material respects, the financial position of Barclays PLC and its subsidiary undertakings at 31st December 2006 and 2005 and the results of their operations and cash flows for each of the three years in the period ended 31st December 2006, in conformity with International Financial Reporting Standards (IFRSs) as adopted by the European Union. These financial statements are the responsibility of the Company’s management. Our responsibility is to express an opinion on these financial statements based on our audits. We conducted our audits of these financial statements in accordance with the standards of the Public Company Accounting Oversight Board (United States). Those standards require that we plan and perform the audit to obtain reasonable assurance about whether the financial statements are free of material misstatement. An audit of financial statements includes examining, on a test basis, evidence supporting the amounts and disclosures in the financial statements, assessing the accounting principles used and significant estimates made by management, and evaluating the overall financial statements presentation. We believe that our audits provide a reasonable basis for our opinion.
IFRSs as adopted by the European Union vary in certain significant respects from accounting principles generally accepted in the United States of America. Information relating to the nature and effect of such differences is presented in Note 60 to the consolidated financial statements.
Internal control over financial reporting
Also, in our opinion, management’s assessment, included in the accompanying ‘Management’s report on internal control over financial reporting’ as set out in the Accountability and audit section on page 137, that the Company maintained effective internal control over financial reporting as of 31st December 2006 based on criteria established in Internal Control – Integrated Framework issued by the Committee of Sponsoring Organisations of the Treadway Commission (COSO), is fairly stated, in all material respects, based on those criteria. Furthermore, in our opinion, the Company maintained, in all material respects, effective internal control over financial reporting as of 31st December 2006, based on criteria established in Internal Control – Integrated Framework issued by the COSO. The Company’s management is responsible for maintaining effective internal control over financial reporting and for its assessment of the effectiveness of internal control over financial reporting. Our responsibility is to express opinions on management’s assessment and on the effectiveness of the Company’s internal control over financial reporting based on our audit.
We conducted our audit of internal control over financial reporting in accordance with the standards of the Public Company Accounting Oversight Board (United States). Those standards require that we plan and perform the audit to obtain reasonable assurance about whether effective internal control over financial reporting was maintained in all material respects. An audit of internal control over financial reporting includes obtaining an understanding of internal control over financial reporting, evaluating management’s assessment, testing and evaluating the design and operating effectiveness of internal control, and performing such other procedures as we consider necessary in the circumstances. We believe that our audit provides a reasonable basis for our opinions.
A company’s internal control over financial reporting is a process designed to provide reasonable assurance regarding the reliability of financial reporting and the preparation of financial statements for external purposes in accordance with generally accepted accounting standards and principles. A company’s internal control over financial reporting includes those policies and procedures that (i) pertain to the maintenance of records that, in reasonable detail, accurately and fairly reflect the transactions and dispositions of the assets of the company; (ii) provide reasonable assurance that transactions are recorded as necessary to permit preparation of financial statements in accordance with generally accepted accounting standards and principles, and that receipts and expenditures of the company are being made only in accordance with authorisations of management and directors of the company; and (iii) provide reasonable assurance regarding prevention or timely detection of unauthorised acquisition, use, or disposition of the company’s assets that could have a material effect on the financial statements.
Because of its inherent limitations, internal control over financial reporting may not prevent or detect misstatements. Also, projections of any evaluation of effectiveness to future periods are subject to the risk that controls may become inadequate because of changes in conditions, or that the degree of compliance with the policies or procedures may deteriorate.

PricewaterhouseCoopers LLP
Chartered Accountants and Registered Auditors
London, United Kingdom 8th March 2007, except for the last two paragraphs in ‘Recent developments’ on page 157, for which the date is 26th March 2007.
| | |
Barclays PLC Annual Report 2006 | | 145 |
| |
Report of Independent Registered Public Accounting Firm to the Board of Directors and Shareholders of Barclays Bank PLC
We have audited the accompanying consolidated financial statements of Barclays Bank PLC and its subsidiary undertakings on pages 274 to 285 which comprise the Consolidated balance sheets as of 31st December 2006 and 31st December 2005, and the related Consolidated income statements, the Consolidated cash flow statements, and the Consolidated statements of recognised income and expense for each of the three years in the period ended 31st December 2006. These financial statements are the responsibility of the Company’s management. Our responsibility is to express an opinion on these financial statements based on our audits.
We conducted our audits in accordance with the standards of the Public Company Accounting Oversight Board (United States). Those standards require that we plan and perform the audit to obtain reasonable assurance about whether the financial statements are free of material misstatement. An audit includes examining, on a test basis, evidence supporting the amounts and disclosures in the financial statements. An audit also includes assessing the accounting principles used and significant estimates made by management, as well as evaluating the overall financial statement presentation. We believe that our audits provide a reasonable basis for our opinion.
In our opinion, the consolidated financial statements referred to above present fairly, in all material respects, the financial position of Barclays Bank PLC and its subsidiary undertakings at 31st December 2006 and 31st December 2005, and the results of their operations and their cash flows for each of the three years in the period ended 31st December 2006 in conformity with International Financial Reporting Standards (IFRSs) as adopted by the European Union.
Accounting principles in conformity with IFRSs as adopted by the European Union vary in certain significant respects from accounting principles generally accepted in the United States of America. Information relating to the nature and effect of such differences is presented in Note 60 and Note (k) to the consolidated financial statements.
PricewaterhouseCoopers LLP
Chartered Accountants and Registered Auditors
London, United Kingdom 8th March 2007, except for the last two paragraphs in ‘Recent developments’ on page 157, for which the date is 26th March 2007.
| | |
| 146 | | Barclays PLC Annual Report 2006 |
| |
Consolidated accounts Barclays PLC
Accounting policies
Significant Accounting Policies
1. Reporting entity
These financial statements are prepared for the Barclays PLC Group (‘Barclays’ or ‘the Group’) under Section 227(2) of the Companies Act 1985. The Group is a major global financial services provider engaged in retail and commercial banking, credit cards, investment banking, wealth management and investment management services. In addition, individual financial statements have been prepared for the holding company, Barclays PLC (‘the Company’), under Section 226(2)(b) of the Companies Act 1985.
Barclays PLC is a public limited company, incorporated in England and Wales and having a registered office in England and Wales.
2. Compliance with International Financial Reporting Standards
The consolidated financial statements of the Barclays PLC Group, and the individual financial statements of Barclays PLC, have been prepared in accordance with International Financial Reporting Standards (IFRSs) and interpretations issued by the International Financial Reporting Interpretations Committee (IFRIC), as adopted by the European Union. They are also in accordance with IFRSs as published by the International Accounting Standards Board (IASB) and interpretations issued by IFRIC.
The principal accounting policies applied in the preparation of the consolidated and individual financial statements are set out below. These policies have been consistently applied.
3. Basis of preparation
The consolidated and individual financial statements have been prepared under the historical cost convention modified to include the fair valuation of certain financial instruments and contracts to buy or sell non-financial items and trading inventories to the extent required or permitted under accounting standards and as set out in the relevant accounting polices. They are stated in millions of pounds Sterling (£m), the currency of the country in which Barclays PLC is incorporated.
Critical accounting estimates
The preparation of financial statements in accordance with IFRS requires the use of certain critical accounting estimates. It also requires management to exercise judgement in the process of applying the accounting policies. The notes to the financial statements set out areas involving a higher degree of judgement or complexity, or areas where assumptions are significant to the consolidated and individual financial statements such as fair value of financial instruments (Note 58), allowance for loan impairment (Note 17), goodwill (Note 23), intangible assets (Note 24), and retirement benefit obligations (Note 35).
4. Consolidation
Subsidiaries
The consolidated financial statements combine the financial statements of Barclays PLC and all its subsidiaries, including certain special purpose entities where appropriate, made up to 31st December. Entities qualify as subsidiaries where the Group has the power to govern the financial and operating policies of the entity so as to obtain benefits from its activities, generally accompanying a shareholding of more than one half of the voting rights. The existence and effect of potential voting rights that are currently exercisable or convertible are considered in assessing whether the Group controls another entity. Details of the principal subsidiaries are given in Note 47.
Subsidiaries are consolidated from the date on which control is transferred to the Group and cease to be consolidated from the date that control ceases.
The acquisition method of accounting is used to account for the purchase of subsidiaries. The cost of an acquisition is measured at the fair value of the assets given, equity instruments issued and liabilities incurred or assumed, plus any costs directly related to the acquisition.
The excess of the cost of an acquisition over the Group’s share of the fair value of the identifiable net assets acquired is recorded as goodwill. See accounting policy 14 for the accounting policy for goodwill. Intra-group transactions and balances are eliminated on consolidation and consistent accounting policies are used throughout the Group for the purposes of the consolidation.
As the consolidated financial statements include partnerships where a Group member is a partner, advantage has been taken of the exemption of Regulation 7 of the Partnerships and Unlimited Companies (Accounts) Regulations 1993 with regard to the preparation and filing of individual partnership financial statements.
Associates and joint ventures
An associate is an entity in which the Group has significant influence, but not control, over the operating and financial management policy decisions. This is generally demonstrated by the Group holding in excess of 20%, but no more than 50%, of the voting rights.
A joint venture exists where the Group has a contractual arrangement with one or more parties to undertake activities typically, though not necessarily, through entities which are subject to joint control.
Unless designated as at fair value through profit and loss as set out in policy 7, the Group’s investments in associates and joint ventures are initially recorded at cost and increased (or decreased) each year by the Group’s share of the post-acquisition net income (or loss), or other movements reflected directly in the equity of the associated or jointly controlled entity. Goodwill arising on the acquisition of an associate or joint venture is included in the carrying amount of the investment (net of any accumulated impairment loss). When the Group’s share of losses in an associate or joint venture equals or exceeds the recorded interest, including any other unsecured receivables, the Group does not recognise further losses, unless it has incurred obligations or made payments on behalf of the entity.
The Group’s share of the results of associates and joint ventures is based on financial statements made up to a date not earlier than three months before the balance sheet date, adjusted to conform with the accounting polices of the Group. Unrealised gains on transactions are eliminated to the extent of the Group’s interest in the investee. Unrealised losses are also eliminated unless the transaction provides evidence of impairment in the asset transferred.
In the individual financial statements, investments in subsidiaries, associates and joint ventures are stated at cost less impairment, if any.
5. Foreign currency translation
The consolidated and individual financial statements are presented in Sterling, which is the functional currency of the parent company.
Items included in the financial statements of each of the Group’s entities are measured using their functional currency, being the currency of the primary economic environment in which the entity operates.
Foreign currency transactions are translated into the appropriate functional currency using the exchange rates prevailing at the dates of the transactions. Monetary items denominated in foreign currencies are retranslated at the rate prevailing at the period end. Foreign exchange gains and losses resulting from the retranslation and settlement of these items are recognised in the income statement except for qualifying cash flow hedges or hedges of net investments. See policy 12 for the policies on hedge accounting.
Non-monetary assets that are measured at fair value are translated using the exchange rate at the date that the fair value was determined. Exchange differences on equities and similar non-monetary items held at fair value through profit or loss, are reported as part of the fair value gain or loss. Translation differences on equities classified as available for sale financial assets and non-monetary items are included directly in equity.
| | |
Barclays PLC Annual Report 2006 | | 147 |
| |
Consolidated accounts Barclays PLC
Accounting policies
For the purposes of translation into the presentational currency, assets, liabilities and equity of foreign operations are translated at the closing rate, and items of income and expense are translated into Sterling at the rates prevailing on the dates of the transactions, or average rates of exchange where these approximate to actual rates.
The exchange differences arising on the translation of a foreign operation are included in cumulative translation reserves within shareholders’ equity and included in the profit or loss on disposal or partial disposal of the operation.
Goodwill and fair value adjustments arising on the acquisition of foreign subsidiaries are maintained in the functional currency of the foreign operation, translated at the closing rate and are included in hedges of net investments where appropriate.
On transition to IFRS, the Group brought forward a nil opening balance on the cumulative foreign currency translation adjustment arising from the retranslation of foreign operations, which is shown as a separate item in shareholders’ equity.
6. Interest, fees and commissions
Interest
Interest is recognised in interest income and interest expense in the income statement for all interest bearing financial instruments classified as held to maturity, available for sale or other loans and receivables using the effective interest method.
The effective interest method is a method of calculating the amortised cost of a financial asset or liability (or group of assets and liabilities) and of allocating the interest income or interest expense over the relevant period. The effective interest rate is the rate that exactly discounts the expected future cash payments or receipts through the expected life of the financial instrument, or when appropriate, a shorter period, to the net carrying amount of the instrument. The application of the method has the effect of recognising income (and expense) receivable (or payable) on the instrument evenly in proportion to the amount outstanding over the period to maturity or repayment.
In calculating effective interest, the Group estimates cash flows (using projections based on its experience of customers’ behaviour) considering all contractual terms of the financial instrument but excluding future credit losses. Fees, including those for early redemption, are included in the calculation to the extent that they can be measured and are considered to be an integral part of the effective interest rate. Cash flows arising from the direct and incremental costs of issuing financial instruments are also taken into account in the calculation. Where it is not possible to otherwise estimate reliably the cash flows or the expected life of a financial instrument, effective interest is calculated by reference to the payments or receipts specified in the contract, and the full contractual term.
Fees and commissions
Unless included in the effective interest calculation, fees and commissions are recognised on an accruals basis as the service is provided. Fees and commissions not integral to effective interest arising from negotiating, or participating in the negotiation of a transaction from a third party, such as the acquisition of loans, shares or other securities or the purchase or sale of businesses, are recognised on completion of the underlying transaction. Portfolio and other management advisory and service fees are recognised based on the applicable service contracts. Asset management fees related to investment funds are recognised over the period the service is provided. The same principle is applied to the recognition of income from wealth management, financial planning and custody services that are continuously provided over an extended period of time.
Commitment fees, together with related direct costs, for loan facilities where draw down is probable are deferred and recognised as an adjustment to the effective interest on the loan once drawn. Commitment
fees in relation to facilities where draw down is not probable are recognised over the term of the commitment.
Insurance premiums
Insurance premiums are recognised in the period earned.
Net trading income
Income arises from the margins which are achieved through market-making and customer business and from changes in market value caused by movements in interest and exchange rates, equity prices and other market variables. Trading positions are held at fair value and the resulting gains and losses are included in the Income statement, together with interest and dividends arising from long and short positions and funding costs relating to trading activities.
Dividends from subsidiaries
In the individual financial statements of Barclays PLC, dividends from subsidiaries are accounted for on the basis of dividends received in the accounting period.
Prior to 1st January 2005
Interest
Interest income is recognised in the income statement as it accrues, with the exception of interest on non-performing loans as set out in accounting policy 8.
Fees and commissions
Fee income relating to loans and advances is recognised in the income statement to match the cost of providing a continuing service, together with a reasonable profit margin. Where a fee is charged in lieu of interest, it is recognised in the income statement as interest receivable on a level yield basis over the life of the advance. Fees and commissions receivable in respect of all other services provided are recognised in the income statement when the related services are performed and when considered recoverable.
Mortgage indemnity premiums
Premiums are deferred and included in accruals and deferred income in the Group balance sheet. Following regular reviews of the amount of income required to cover anticipated losses in respect of this lending, deferred income is released to the income statement on an annual basis.
Insurance premiums
Insurance premiums are recognised in the period earned.
Lending related fees and commissions payable and incentives Fees and commissions payable to introducers in respect of obtaining certain lending business, where this is the primary form of distribution, are charged to the income statement as fees and commissions payable, over the anticipated life of the loans.
The costs of mortgage incentives, which comprise cashbacks and interest discounts, are charged to the income statement as a reduction to interest receivable as incurred.
7. Financial assets and liabilities
Financial assets
The Group classifies its financial assets in the following categories: financial instruments at fair value through profit or loss; loans and receivables; held to maturity investments and available for sale financial assets. Management determines the classification of financial assets and liabilities at initial recognition.
Financial instruments at fair value through profit or loss
Financial instruments are classified in this category if they are held for trading, or if they are designated by management under the fair value option. Instruments are classified as held for trading if they are:
| (i) | acquired principally for the purposes of selling or repurchasing in the near term; |
| | |
| 148 | | Barclays PLC Annual Report 2006 |
| |
| (ii) | part of a portfolio of identified financial instruments that are managed together and for which there is evidence of a recent actual pattern of short-term profit-taking; or |
| (iii) | a derivative, except for a derivative that is a financial guarantee contract or a designated and effective hedging instrument. |
Financial instruments cannot be transferred into or out of this category after inception. Financial instruments included in this category are recognised initially at fair value and transaction costs are taken directly to the Income statement. Gains and losses arising from changes in fair value are included directly in the Income statement. The instruments are derecognised when the rights to receive cash flows have expired or the Group has transferred substantially all the risks and rewards of ownership and the transfer qualifies for derecognition.
Regular way purchases and sales of financial instruments held for trading or designated under the fair value option are recognised on trade date, being the date on which the Group commits to purchase or sell the asset.
The fair value option is used in the following circumstances:
| (i) | financial assets backing insurance contracts and financial assets backing investment contracts are designated at fair value through profit or loss because the related liabilities have cash flows that are contractually based on the performance of the assets or the related liabilities are insurance contracts whose measurement incorporates current information. Fair valuing the assets through profit and loss significantly reduces the recognition inconsistencies that would arise if the financial assets were classified as available for sale; |
| (ii) | financial assets, loans to customers, financial liabilities, financial guarantees and structured notes may be designated at fair value through profit or loss if they contain substantive embedded derivatives; |
| (iii) | financial assets, loans to customers, financial liabilities, financial guarantees and structured notes may be designated at fair value through profit or loss where doing so significantly reduces measurement inconsistencies that would arise if the related derivatives were treated as held for trading and the underlying financial instruments were carried at amortised cost; and |
| (iv) | certain private equity and other investments that are managed, and evaluated on a fair value basis in accordance with a documented risk management or investment strategy and reported to key management personnel on that basis. |
Loans and receivables
Loans and receivables are non-derivative financial assets with fixed or determinable payments that are not quoted in an active market and which are not classified as available for sale. Loans and receivables are initially recognised at fair value including direct and incremental transaction costs. They are subsequently valued at amortised cost, using the effective interest method (see accounting policy 6 on page 148). They are derecognised when the rights to receive cash flows have expired or the Group has transferred substantially all the risks and rewards of ownership.
Regular way purchases and sales of loans and receivables are recognised on contractual settlement.
Held to maturity
Held to maturity investments are non-derivative financial assets with fixed or determinable payments that the Group’s management has the intention and ability to hold to maturity. They are initially recognised at fair value including direct and incremental transaction costs. They are subsequently valued at amortised cost, using the effective interest method (see accounting policy 6). They are derecognised when the rights to receive cash flows have expired.
Purchases of held to maturity financial assets are recognised on trade date, being the date on which the Group commits to purchase the asset.
Available for sale
Available for sale assets are non-derivative financial assets that are designated as available for sale and are not categorised into any of the other categories described above. They are initially recognised at fair value including direct and incremental transaction costs. They are subsequently held at fair value. Gains and losses arising from changes in fair value are included as a separate component of equity until sale when the cumulative gain or loss is transferred to the income statement. Interest determined using the effective interest method (see accounting policy 6), impairment losses and translation differences on monetary items are recognised in the income statement. The assets are derecognised when the rights to receive cash flows have expired or the Group has transferred substantially all the risks and rewards of ownership.
Regular way purchases and sales of available for sale financial instruments are recognised on trade date, being the date on which the Group commits to purchase or sell the asset.
Financial liabilities
Financial liabilities are measured at amortised cost, except for trading liabilities and liabilities designated at fair value, which are held at fair value through profit or loss. Financial liabilities are derecognised when extinguished.
Determining fair value
Where the classification of a financial instrument requires it to be stated at fair value, this is determined by reference to the quoted bid price or asking price (as appropriate) in an active market wherever possible. Where no such active market exists for the particular asset or liability, the Group uses a valuation technique to arrive at the fair value, including the use of prices obtained in recent arms-length transactions, discounted cash flow analysis, option pricing models and other valuation techniques commonly used by market participants.
Profits or losses are only recognised on initial recognition when such profits can be measured solely by reference to observable current market transactions or valuation techniques based solely on observable market inputs.
Prior to 1st January 2005, financial assets were accounted for as follows:
Loans and advances
Loans and advances, other than those held in a dealing portfolio, are recorded in the balance sheet at cost, less interest in suspense debited to the customer’s account, specific and general provisions. Advances held in a dealing portfolio for the purpose of trading on a secondary market are valued at the lower of cost and market value.
Investment securities
Investment securities are debt securities and equity shares intended for use on a continuing basis by the Group and identified as such. Investment securities are stated at cost less any provision for impairment. The cost of dated investment securities is adjusted for the amortisation of premiums or discounts on purchase over the period to redemption. The amortisation of premiums and discounts is included in interest receivable.
Other debt securities and equity shares are stated at market value and profits and losses arising from this revaluation are taken directly to the income statement through dealing profits. Listed securities are valued based on market prices, with long positions at bid and short positions at offer price. Unlisted securities are valued based on the Directors’ estimate, which takes into consideration discounted cash flows, price earnings ratios and other valuation techniques.
| | |
Barclays PLC Annual Report 2006 | | 149 |
| |
Consolidated accounts Barclays PLC
Accounting policies
In the case of private equity investments, listed and unlisted investments are stated at cost less any provision for impairment.
8. Impairment of financial assets
The Group assesses at each balance sheet date whether there is objective evidence that a financial asset or a portfolio of financial assets carried at amortised cost is impaired. A financial asset or portfolio of financial assets is impaired and impairment losses are incurred if, and only if, there is objective evidence of impairment as a result of one or more loss events that occurred after the initial recognition of the asset and prior to the balance sheet date (‘a loss event’) and that loss event or events has had an impact on the estimated future cash flows of the financial asset or the portfolio that can be reliably estimated. Objective evidence that a financial asset or a portfolio is impaired includes observable data that comes to the attention of the Group about the following loss events:
| a) | significant financial difficulty of the issuer or obligor; |
| b) | a breach of contract, such as a default or delinquency in interest or principal payments; |
| c) | the lender, for economic or legal reasons relating to the borrower’s financial difficulty, granting to the borrower a concession that the lender would not otherwise consider; |
| d) | it becomes probable that the borrower will enter bankruptcy or other financial reorganisation; |
| e) | the disappearance of an active market for that financial asset because of financial difficulties; or |
| f) | observable data indicating that there is a measurable decrease in the estimated future cash flows from a portfolio of financial assets since the initial recognition of those assets, although the decrease cannot yet be identified with the individual financial assets in the portfolio, including: |
| | (i) | adverse changes in the payment status of borrowers in the portfolio; |
| | (ii) | national or local economic conditions that correlate with defaults on the assets in the portfolio. |
The Group first assesses whether objective evidence of impairment exists individually for financial assets that are individually significant, and individually or collectively for financial assets that are not individually significant. If the Group determines that no objective evidence of impairment exists for an individually assessed financial asset, whether significant or not, it includes the asset in a group of financial assets with similar credit risk characteristics and collectively assesses them for impairment. Assets that are individually assessed for impairment and for which an impairment loss is or continues to be recognised are not included in a collective assessment of impairment.
For loans and receivables and assets held to maturity, the amount of impairment loss is measured as the difference between the asset’s carrying amount and the present value of estimated future cash flows discounted at the asset’s original effective interest rate. The amount of the loss is recognised using an allowance account and recognised in the income statement.
The calculation of the present value of the estimated future cash flows of a collateralised financial asset reflect the cash flows that may result from foreclosure costs for obtaining and selling the collateral, whether or not foreclosure is probable.
For the purposes of a collective evaluation of impairment, financial assets are grouped on the basis of similar risk characteristics, taking into account asset type, industry, geographical location, collateral type, past-due status and other relevant factors. These characteristics are relevant to the estimation of future cash flows for groups of such assets
by being indicative of the counterparty’s ability to pay all amounts due according to the contractual terms of the assets being evaluated.
Future cash flows in a group of financial assets that are collectively evaluated for impairment are estimated on the basis of the contractual cash flows of the assets in the group and historical loss experience for assets with credit risk characteristics similar to those in the group. Historical loss experience is adjusted based on current observable data to reflect the effects of current conditions that did not affect the period on which the historical loss experience is based and to remove the effects of conditions in the historical period that do not currently exist.
The methodology and assumptions used for estimating future cash flows are reviewed regularly to reduce any differences between loss estimates and actual loss experience.
Following impairment, interest income is recognised using the original effective rate of interest which was used to discount the future cash flows for the purpose of measuring the impairment loss.
When a loan is uncollectable, it is written off against the related provision for loan impairment. Such loans are written off after all the necessary procedures have been completed and the amount of the loss has been determined. Subsequent recoveries of amounts previously written off are credited to the income statement.
If, in a subsequent period, the amount of the impairment loss decreases and the decrease can be related objectively to an event occurring after the impairment was recognised, the previously recognised impairment loss is reversed by adjusting the allowance account. The amount of the reversal is recognised in the income statement.
Equity securities acquired in exchange for loans and advances in order to achieve an orderly realisation are accounted for as a disposal of the loan and an acquisition of equity securities. Where control is obtained over an entity as a result of the transaction, the entity is consolidated. Any further impairment of the assets or business acquired is treated as an impairment of the relevant asset or business and not as an impairment of the original instrument.
In the case of equity instruments classified as available for sale, a significant or prolonged decline in the fair value of the security below its cost is considered in determining whether impairment exists. Where such evidence exists, the cumulative net loss that has been previously recognised directly in equity is removed from equity and recognised in the income statement. In the case of debt instruments classified as available for sale, impairment is assessed based on the same criteria as all other financial assets. Reversals of impairment of debt instruments are recognised in the income statement. Reversals of impairment of equity shares are not recognised in the income statement, increases in the fair value of equity shares after impairment are recognised directly in equity.
Prior to 1st January 2005
Specific provisions are raised when the Group considers that the creditworthiness of a borrower has deteriorated such that the recovery of the whole or part of an outstanding advance is in serious doubt. Typically, this is done on an individual basis, although scope exists within the retail businesses, where the portfolio comprises homogeneous assets and where statistical techniques are appropriate, to raise specific provisions on a portfolio basis.
General provisions are raised to cover losses which are judged to be present in loans and advances at the balance sheet date, but which have not been specifically identified as such. These provisions are adjusted at least half yearly by an appropriate charge or release of general provision based on a statistical analysis. The accuracy of this analysis is periodically assessed against actual losses. Gradings are used to rate the credit quality of borrowers. Each grade corresponds to an Expected Default Frequency and is calculated by using manual or computer driven score-sheets validated by an analysis of the Group’s own
| | |
| 150 | | Barclays PLC Annual Report 2006 |
| |
historical data. This grade can be derived from different sources depending upon the borrower (e.g. internal model, credit rating agency). The general provision also takes into account the economic climate in the market in which the Group operates and the level of security held in relation to each category of counterparty. The general provision includes a specifically identified element to cover country transfer risk calculated on a basis consistent with the overall general provision calculation. General provisions are created with respect to the recoverability of assets arising from off-balance sheet exposures in a manner consistent with the general provisioning methodology.
The aggregate specific and general provisions which are made during the year, less amounts released and recoveries of bad debts previously written off, are charged against operating profit and are deducted from loans and advances. Impaired lendings are written off against the balance sheet asset and provision in part, or in whole, when the extent of the loss incurred has been confirmed.
If the collection of interest is doubtful, it is credited to a suspense account and excluded from interest income in the income statement. Although it continues to be charged to the customers’ accounts, the suspense account in the balance sheet is netted against the relevant loan. If the collection of interest is considered to be remote, interest is no longer applied and suspended interest is written off. Loans on which interest is suspended are not reclassified as accruing interest until interest and principal payments are up to date and future payments are reasonably assured.
Assets acquired in exchange for advances in order to achieve an orderly realisation continue to be reported as advances. The asset acquired is recorded at the carrying value of the original advance updated as at the date of the exchange. Any subsequent impairment is accounted for as a specific provision.
9. Sale and repurchase agreements (including stock borrowing and lending)
Securities may be lent or sold subject to a commitment to repurchase them (a ‘repo’). Such securities are retained on the balance sheet when substantially all the risks and rewards of ownership remain with the Group, and the counterparty liability is included separately on the balance sheet as appropriate.
Similarly, where the Group borrows or purchases securities subject to a commitment to resell them (a ‘reverse repo’) but does not acquire the risks and rewards of ownership, the transactions are treated as collateralised loans, and the securities are not included in the balance sheet.
The difference between sale and repurchase price is accrued over the life of the agreements using the effective interest method. Securities lent to counterparties are also retained in the financial statements. Securities borrowed are not recognised in the financial statements, unless these are sold to third parties, at which point the obligation to repurchase the securities is recorded as a trading liability at fair value and any subsequent gain or loss included in net trading income.
Prior to 1st January 2005
The cash legs of repos and reverse repos are included within loans and advances to banks, loans and advances to customer, deposits by banks and customer accounts. The Group aims to earn net interest income and net trading income from these activities, as well as funding its own holdings of securities. The difference between sale and repurchase and purchase and resale prices for such transactions, including dividends received where appropriate, is charged or credited to the income statement over the life of the relevant transactions.
10. Securitisation transactions
Certain Group undertakings have issued debt securities or have entered into funding arrangements with lenders in order to finance specific loans and advances to customers.
All financial assets continue to be held on the Group balance sheet, and a liability recognised for the proceeds of the funding transaction, unless:
| (i) | substantially all the risks and rewards associated with the financial instruments have been transferred, in which case, the assets are derecognised in full; or |
| (ii) | if a significant portion, but not all, of the risks and rewards have been transferred, the asset is derecognised entirely if the transferee has the ability to sell the financial asset, otherwise the asset continues to be recognised only to the extent of the Group’s continuing involvement. |
Where (i) or (ii) above applies to a fully proportionate share of all or specifically identified cash flows, the relevant accounting treatment is applied to that proportion of the asset.
11. Collateral and netting
The Group enters into master agreements with counterparties whenever possible and, when appropriate, obtains collateral. Master agreements provide that, if an event of default occurs, all outstanding transactions with the counterparty will fall due and all amounts outstanding will be settled on a net basis.
Collateral
The Group obtains collateral in respect of customer liabilities where this is considered appropriate. The collateral normally takes the form of a lien over the customer’s assets and gives the Group a claim on these assets for both existing and future liabilities.
The Group also receives collateral in the form of cash or securities in respect of other credit instruments, such as stock borrowing contracts, and derivative contracts in order to reduce credit risk. Collateral received in the form of securities is not recorded on the balance sheet. Collateral received in the form of cash is recorded on the balance sheet with a corresponding liability. These items are assigned to deposits received from bank or other counterparties. Any interest payable or receivable arising is recorded as interest expense or interest income respectively except for funding costs relating to trading activities which are recorded in net trading income.
Netting
Financial assets and liabilities are offset and the net amount reported in the balance sheet if, and only if, there is a legally enforceable right to set off the recognised amounts and there is an intention to settle on a net basis, or to realise an asset and settle the liability simultaneously. In many cases, even though master netting agreements are in place, the lack of an intention to settle on a net basis results in the related assets and liabilities being presented gross in the balance sheet.
12. Derivatives and hedge accounting
Derivatives are used to hedge interest rate, exchange rate, commodity, and equity exposures and exposures to certain indices such as house price indices and retail price indices related to non-trading positions. In addition, the use of derivatives and their sale to customers as risk management products is an integral part of the Group’s trading activities. Derivatives entered into for hedging purposes and for trading purposes include foreign exchange, interest rate, credit, equity and commodity derivatives mainly in the form of swaps, forwards, options and combinations of these instrument types.
Derivatives
Derivatives are measured initially at fair value and subsequently remeasured to fair value. Fair values are obtained from quoted prices prevailing in active markets, including recent market transactions, and
| | |
Barclays PLC Annual Report 2006 | | 151 |
| |
Consolidated accounts Barclays PLC
Accounting policies
valuation techniques, including discounted cash flow models and option pricing models as appropriate. All derivatives are included in assets when their fair value is positive, and liabilities when their fair value is negative, unless there is the legal ability and intention to settle net (as per accounting policy 11).
Embedded derivatives
Some hybrid contracts contain both a derivative and a non-derivative component. In such cases, the derivative component is termed an embedded derivative. Where the economic characteristics and risks of the embedded derivatives are not closely related to those of the host contract, and the host contract itself is not carried at fair value through profit or loss, the embedded derivative is bifurcated and reported at fair value with gains and losses being recognised in the income statement.
Profits or losses cannot be recognised on the initial recognition of embedded derivatives unless the host contract is also carried at fair value.
Hedge accounting
Where derivatives are held for risk management purposes, and when transactions meet the criteria specified in IAS 39, the Group applies fair value hedge accounting, cash flow hedge accounting, or hedging of a net investment in a foreign operation as appropriate to the risks being hedged.
When a financial instrument is designated as a hedge, the Group formally documents the relationship between the hedging instrument and hedged item as well as its risk management objectives and its strategy for undertaking the various hedging transactions. The Group also documents its assessment, both at hedge inception and on an ongoing basis, of whether the derivatives that are used in hedging transactions are highly effective in offsetting changes in fair values or cash flows of hedged items.
The Group discontinues hedge accounting when:
| (i) | It is determined that a derivative is not, or has ceased to be, highly effective as a hedge; |
| (ii) | the derivative expires, or is sold, terminated, or exercised; |
| (iii) | the hedged item matures or is sold or repaid; or |
| (iv) | a forecast transaction is no longer deemed highly probable. |
In certain circumstances, the Group may decide to cease hedge accounting even though the hedge relationship continues to be highly effective by no longer designating the financial instrument as a hedging instrument. To the extent that the changes in the fair value of the hedging derivative differ from changes in the fair value of the hedged risk in the hedged item; or the cumulative change in the fair value of the hedging derivative differs from the cumulative change in the fair value of expected future cash flows of the hedged item, the hedge is deemed ineffective. The amount of ineffectiveness, provided it is not so great as to disqualify the entire hedge for hedge accounting, is recorded in the income statement.
Fair value hedge accounting
Changes in fair value of derivatives that qualify and are designated as fair value hedges are recorded in the income statement, together with changes in the fair value of the hedged asset or liability that are attributable to the hedged risk.
If the hedge relationship no longer meets the criteria for hedge accounting, it is discontinued. For fair value hedges of interest rate risk, the fair value adjustment to the hedged item is amortised to the income statement over the period to maturity of the previously designated hedge relationship using the effective interest method.
If the hedged item is sold or repaid, the unamortised fair value adjustment is recognised immediately in the income statement.
Cash flow hedges
For qualifying cash flow hedges, the fair value gain or loss associated with the effective portion of the cash flow hedge is recognised initially in shareholders’ equity, and recycled to the income statement in the periods when the hedged item will affect profit or loss. Any ineffective portion of the gain or loss on the hedging instrument is recognised in the income statement immediately.
When a hedging instrument expires or is sold, or when a hedge no longer meets the criteria for hedge accounting, any cumulative gain or loss existing in equity at that time remains in equity and is recognised when the forecast transaction is ultimately recognised in the income statement. When a forecast transaction is no longer expected to occur, the cumulative gain or loss that was recognised in equity is immediately transferred to the income statement.
Hedges of net investments
Hedges of net investments in foreign operations, including monetary items that are accounted for as part of the net investment, are accounted for similarly to cash flow hedges; the effective portion of the gain or loss on the hedging instrument is recognised directly in equity and the ineffective portion is recognised immediately in the income statement. The cumulative gain or loss previously recognised in equity is recognised in the income statement on the disposal or partial disposal of the foreign operation.
Hedges of net investments may include non-derivative liabilities as well as derivative financial instruments although for a non-derivative liability only the foreign exchange risk is designated as a hedge.
Derivatives that do not qualify for hedge accounting
Derivative contracts entered into as economic hedges that do not qualify for hedge accounting are held at fair value through profit or loss.
Prior to 1st January 2005
Derivatives entered into as trading transactions, together with any associated hedging, are measured at fair value and the resultant profits and losses are included in net trading income, along with interest and dividends arising from long and short positions and funding costs relating to trading activities. Assets and liabilities resulting from gains or losses on derivative and foreign exchange contracts are reported gross and reduced by the effects of qualifying netting agreements with counterparties.
The fair value of derivatives is determined by calculating the expected cash flows under the terms of each specific contract, discounted back to a present value. The expected cash flows for each contract are determined either directly by reference to actual cash flows implicit in observable market prices or through modelling cash flows using appropriate financial-markets pricing models.
The effect of discounting expected cash flows back to present value is achieved by constructing discount curves derived from the market price of the most appropriate observable interest rate products such as deposits, interest rate futures and swaps. The calculation of fair value for any financial instrument may also require adjustment of the quoted price or model value to reflect the cost of credit risk (where not embedded in underlying models or prices used), or to reflect hedging costs not captured in pricing models (to the extent they would be taken into account by a market participant in determining a price).
Derivatives used for hedging purposes are measured on an accruals basis consistent with the assets, liabilities, positions or future cash flows being hedged. The gains and losses on these instruments (arising from changes in fair value) are not recognised in the income statement immediately as they arise. Such gains are either not recognised in the balance sheet or are recognised and carried forward. When the hedged transaction occurs, the gain or loss is recognised in the income
| | |
| 152 | | Barclays PLC Annual Report 2006 |
| |
statement at the same time as the hedged item. The criteria required for a derivative instrument to be classified as a designated hedge are that:
| (i) | the transaction must be reasonably expected to match or eliminate a significant proportion of the risk inherent in the assets, liabilities, other positions or cash flows being hedged and which results from potential movements in market rates and credit risk; and |
| (ii) | adequate evidence of the intention to hedge and linkage with the underlying risk inherent in the assets, liabilities, other positions or cash flows being hedged, must be established at the outset of the transaction. |
Designated hedges are reviewed for effectiveness by regular tests to determine that the hedge is closely negatively correlated to the designated hedged position in each and every identified time band in the maturity profile.
Profits and losses on interest rate swaps and options entered into for hedging purposes are measured on an accrual accounting basis, included in the related category of income and expense and reported as part of the yield on the hedged transaction. Amounts paid or received over the life of futures contracts are deferred until the contract is closed; accumulated deferred amounts on futures contracts and settlement amounts paid or received on forward contracts are accounted for as elements of the carrying value of the associated instrument, affecting the resulting yield.
A premium paid or received in respect of a credit derivative hedging an asset or liability is amortised over the life of the protection purchased or sold against either interest payable or interest receivable. Where a credit event occurs which triggers a recovery under the credit derivative, then the recovery will be offset against the profit and loss charge on the underlying asset or liability.
Foreign exchange contracts which qualify as hedges of foreign currency exposures, including positions relating to investments the Group makes outside the UK, are retranslated at the closing rate with any forward premium or discount recognised over the life of the contract in net interest income.
Profits and losses related to qualifying hedges, including foreign exchange contracts, of firm commitments and probable anticipated transactions are deferred and recognised in income or as adjustments to carrying amounts when the hedged transactions occur.
Hedging transactions that are superseded or cease to be effective are measured at fair value. Any profit or loss on these transactions, together with any profit or loss arising on hedging transactions that are terminated prior to the end of the life of the asset, are deferred and amortised into interest income or expense over the remaining life of the item previously being hedged. When the underlying asset, liability position or cash flow is terminated prior to the hedging transaction, or an anticipated transaction is no longer likely to occur, the hedging transaction is measured on the fair value accounting basis, as described in the section on derivatives used for trading purposes below, prior to being transferred to the trading portfolio. The profit or loss arising from the fair value measurement prior to the transfer to the trading portfolio is included in the category of income or expense relating to the previously hedged transaction.
13. Property, plant and equipment
Property and equipment is stated at cost less accumulated depreciation and provisions for impairment, if any. Additions and subsequent expenditures are capitalised only to the extent that they enhance the future economic benefits expected to be derived from the assets.
Depreciation is provided on the depreciable amount of items of property and equipment on a straight-line basis over their estimated useful economic lives. The depreciable amount is the gross carrying amount, less the estimated residual value at the end of its useful economic life.
The Group uses the following annual rates in calculating depreciation:
| | |
| Freehold buildings and long-leasehold property (more than 50 years to run) | | 2-3.3% |
Leasehold property
(less than 50 years to run) | | Over the remaining
life of the lease |
Costs of adaptation of freehold and
leasehold property(a) | | 7-10% |
Equipment installed in freehold and
leasehold property(a) | | 7-10% |
| Computers and similar equipment | | 20-33% |
| Fixtures and fittings and other equipment | | 10-20% |
Note
| (a) | Where leasehold property has a remaining useful life of less than 15 years, costs of adaptation and installed equipment are depreciated over the remaining life of the lease. |
Depreciation rates, methods and the residual values underlying the calculation of depreciation of items of property, plant and equipment are kept under review to take account of any change in circumstances.
When deciding on depreciation rates and methods, the principal factors the Group takes into account are the expected rate of technological developments and expected market requirements for, and the expected pattern of usage of, the assets. When reviewing residual values, the Group estimates the amount that it would currently obtain for the disposal of the asset after deducting the estimated cost of disposal if the asset were already of the age and condition expected at the end of its useful economic life.
No depreciation is provided on freehold land, although, in common with all long-lived assets, it is subject to impairment testing, if deemed appropriate.
Gains and losses on disposals are determined by comparing the proceeds with the carrying amount and are recognised in the income statement.
14. Intangible assets
Goodwill
Goodwill arises on the acquisition of subsidiary and associated entities and joint ventures, and represents the excess of the fair value of the purchase consideration and direct costs of making the acquisition, over the fair value of the Group’s share of the assets acquired, and the liabilities and contingent liabilities assumed on the date of the acquisition.
For the purpose of calculating goodwill, fair values of acquired assets, liabilities and contingent liabilities are determined by reference to market values or by discounting expected future cash flows to present value. This discounting is either performed using market rates or by using risk-free rates and risk-adjusted expected future cash flows. Goodwill is capitalised and reviewed annually for impairment, or more frequently when there are indications that impairment may have occurred. Goodwill is allocated to cash-generating units for the purpose of impairment testing. Goodwill on acquisitions of associates and joint ventures is included in the amount of the investment. Gains and losses on the disposal of an entity include the carrying amount of the goodwill relating to the entity sold.
The carrying amount of goodwill in the UK GAAP balance sheet as at 31st December 2003 has been brought forward without adjustment on transition to IFRSs.
Computer software
Computer software is stated at cost, less amortisation and provisions for impairment, if any.
The identifiable and directly associated external and internal costs of acquiring and developing software are capitalised where the software is
| | |
Barclays PLC Annual Report 2006 | | 153 |
| |
Consolidated accounts Barclays PLC
Accounting policies
controlled by the Group, and where it is probable that future economic benefits that exceed its cost will flow from its use over more than one year. Costs associated with maintaining software are recognised as an expense when incurred.
Capitalised computer software is amortised over three to five years.
Other intangible assets
Other intangible assets consist of brands, customer lists, licences and other contracts, core deposit intangibles, mortgage servicing rights and customer relationships. Other intangible assets are initially recognised when they are separable or arise from contractual or other legal rights, the cost can be measured reliably and, in the case of intangible assets not acquired in a business combination, where it is probable that future economic benefits attributable to the assets will flow from their use. The value of intangible assets which are acquired in a business combination is generally determined using income approach methodologies such as the discounted cash flow method and the relief from royalty method that estimate net cash flows attributable to an asset over its economic life and discount to present value using an appropriate rate of return based on the cost of equity adjusted for risk.
Other intangible assets are stated at cost less amortisation and provisions for impairment, if any, and are amortised over their useful lives in a manner that reflects the pattern to which they contribute to future cash flows, generally over 4-25 years.
15. Impairment of property, plant and equipment and intangible assets
At each balance sheet date, or more frequently where events or changes in circumstances dictate, property, plant and equipment and intangible assets, are assessed for indications of impairment. If indications are present, these assets are subject to an impairment review. Goodwill is subject to an impairment review as at the balance sheet date each year. The impairment review comprises a comparison of the carrying amount of the asset with its recoverable amount: the higher of the asset’s or the cash-generating unit’s net selling price and its value in use. Net selling price is calculated by reference to the amount at which the asset could be disposed of in a binding sale agreement in an arms-length transaction evidenced by an active market or recent transactions for similar assets. Value in use is calculated by discounting the expected future cash flows obtainable as a result of the asset’s continued use, including those resulting from its ultimate disposal, at a market-based discount rate on a pre-tax basis.
The carrying values of fixed assets and goodwill are written down by the amount of any impairment and this loss is recognised in the income statement in the period in which it occurs. A previously recognised impairment loss relating to a fixed asset may be reversed in part or in full when a change in circumstances leads to a change in the estimates used to determine the fixed asset’s recoverable amount. The carrying amount of the fixed asset will only be increased up to the amount that it would have been had the original impairment not been recognised. Impairment losses on goodwill are not reversed. For the purpose of conducting impairment reviews, cash-generating units are the lowest level at which management monitors the return on investment on assets.
16. Financial guarantees
Financial guarantee contracts are contracts that require the issuer to make specified payments to reimburse the holder for a loss it incurs because a specified debtor fails to make payments when due in accordance with the terms of a debt instrument.
Such financial guarantees are given to banks, financial institutions and other bodies on behalf of customers to secure loans, overdrafts and other banking facilities (‘facility guarantees’), and to other parties in connection with the performance of customers under obligations related to contracts, advance payments made by other parties, tenders, retentions and the payment of import duties.
Financial guarantees are initially recognised in the financial statements at fair value on the date that the guarantee was given. Other than where the fair value option is applied, subsequent to initial recognition, the bank’s liabilities under such guarantees are measured at the higher of the initial measurement, less amortisation calculated to recognise in the income statement the fee income earned over the period, and the best estimate of the expenditure required to settle any financial obligation arising as a result of the guarantees at the balance sheet date.
Any increase in the liability relating to guarantees is taken to the income statement in Provisions for undrawn contractually committed facilities and guarantees provided. Any liability remaining is recognised in the income statement when the guarantee is discharged, cancelled or expires.
17. Issued debt and equity securities
Issued financial instruments or their components are classified as liabilities where the contractual arrangement results in the Group having a present obligation to either deliver cash or another financial asset to the holder, to exchange financial instruments on terms that are potentially unfavourable or to satisfy the obligation otherwise than by the exchange of a fixed amount of cash or another financial asset for a fixed number of equity shares. Issued financial instruments, or their components, are classified as equity where they meet the definition of equity and confer on the holder a residual interest in the assets of the Company. The components of issued financial instruments that contain both liability and equity elements are accounted for separately with the equity component being assigned the residual amount after deducting from the instrument as a whole the amount separately determined as the fair value of the liability component.
Financial liabilities, other than trading liabilities and financial liabilities designated at fair value, are carried at amortised cost using the effective interest method as set out in policy 6. Derivatives embedded in financial liabilities that are not designated at fair value are accounted for as set out in policy 12. Equity instruments, including share capital, are initially recognised at net proceeds, after deducting transaction costs and any related income tax. Dividend and other payments to equity holders are deducted from equity, net of any related tax.
Prior to 1st January 2005
Debt securities in issue and similar securities are stated at the net issue proceeds adjusted for amortisation of premiums, discounts and expenses related to their issue where the liability is a fixed amount. Where the liability fluctuates, based on, for example, the performance of an index then the debt security reflects the current value of the liability.
Loan capital in issue is stated at the net issue proceeds adjusted for amortisation of premiums, discounts and expenses related to their issue. Amortisation is calculated in order to achieve a constant yield across the life of the instrument.
18. Share capital
Share issue costs
Incremental costs directly attributable to the issue of new shares or options including those issued on the acquisition of a business are shown in equity as a deduction, net of tax, from the proceeds.
Dividends on ordinary shares
Dividends on ordinary shares are recognised in equity in the period in which they are paid or, if earlier, approved by the Barclays PLC (the Company) shareholders.
Treasury shares
Where the Company or any member of the Group purchases the Company’s share capital, the consideration paid is deducted from shareholders’ equity as treasury shares until they are cancelled. Where such shares are subsequently sold or reissued, any consideration received is included in shareholders’ equity.
| | |
| 154 | | Barclays PLC Annual Report 2006 |
| |
19. Insurance contracts and investment contracts
The Group offers wealth management, term assurance, annuity, property and payment protection insurance products to customers that take the form of long- and short-term insurance contracts.
The Group classifies its wealth management and other products as insurance contracts where these transfer significant insurance risk, generally where the benefits payable on the occurrence of an insured event are at least 5% more than the benefits that would be payable if the insured event does not occur.
Barclays Wealth contracts that do not contain significant insurance risk or discretionary participation features are classified as investment contracts. Financial assets and liabilities relating to investment contracts, and assets backing insurance contracts are classified and measured as appropriate under IAS 39, ‘Financial Instruments: Recognition and Measurement’.
Long-term insurance contracts
These contracts, insure events associated with human life (for example, death or survival) over a long duration. Premiums are recognised as revenue when they become payable by the contract holder. Claims and surrenders are accounted for when notified. Maturities on the policy maturity date and regular withdrawals are accounted for when due.
A liability for contractual benefits that are expected to be incurred in the future is recorded when the premiums are recognised, based on the expected discounted value of the benefit payments and directly related administration costs, less the expected discounted value of the future premiums that would be required to meet the benefits and other expenses. The calculation of the liability contains assumptions regarding mortality, maintenance expenses and investment income.
Liabilities under unit-linked life insurance contracts (such as endowment policies) in addition reflect the value of assets held within unitised investment pools.
Short-term insurance contracts
Under its payment protection insurance products the Group is committed to paying benefits to the policyholder rather than forgiving interest or principal on the occurrence of an insured event, such as unemployment, sickness, or injury. Property insurance contracts mainly compensate the policyholders for damage to their property or for the value of property lost.
Premiums are recognised as revenue proportionally over the period of the coverage. Claims and claims handling costs are charged to income as incurred, based on the estimated liability for compensation owed to policyholders arising from events that have occurred up to the balance sheet date even if they have not yet been reported to the Group, based on assessments of individual cases reported to the Group and statistical analyses for the claims incurred but not reported.
Deferred acquisition costs (DAC)
Commissions and other costs that are related to securing new insurance and investment contracts are capitalised and amortised over the estimated lives of the relevant contracts.
Deferred income liability
Fees that are designed to recover commissions and other costs related to either securing new insurance and investment contracts or renewing existing investment contracts are included as a liability and amortised over the estimated life of the contract.
Value of business acquired
On acquisition of a portfolio of contracts, such as through the acquisition of a subsidiary, the Group recognises an intangible asset representing the value of business acquired (VOBA), representing the future profits embedded in acquired insurance contracts and investment contracts with a discretionary participation feature. The asset is amortised over the remaining terms of the acquired contracts.
Liability adequacy test
Liability adequacy tests are performed at each balance sheet date to ensure the adequacy of contract liabilities net of DAC and VOBA assets. Current best estimates of future contractual cash flows, claims handling and administration costs, and investment returns from the assets backing the liabilities are taken into account in the tests. Where a deficiency is highlighted by the test, DAC and VOBA assets are written off first, and insurance liabilities increased when these are written off in full. Any deficiency is immediately recognised in the income statement.
Reinsurance
Short- and long-term insurance business is ceded to reinsurers under contracts to transfer part or all of one or more of the following risks: mortality, investment and expenses. All such contracts are dealt with as insurance contracts. The benefits to which the Group is entitled under its reinsurance contracts are recognised as reinsurance assets. The Group assesses reinsurance assets at each balance sheet date. If there is objective evidence of impairment, the carrying amount of the reinsurance asset is reduced accordingly resulting in a charge to the income statement.
Prior to 1st January 2005
The Group treated all products taking the legal form of an insurance contract as insurance contracts.
From 1st January 2004 the Group has chosen to change its accounting policy in relation to insurance contracts to use Modified Statutory Solvency Basis rather than an Embedded Value basis to account for insurance policies in the UK. This change resulted in insurance contracts and investment contracts being accounted for on a similar basis and represents the most appropriate accounting policy in the circumstances. This change in policy reduced other operating income by £47m in 2004 and reduced retained earnings by £592m as at 1st January 2004. The impact on earnings per share was immaterial.
20. Leases
Lessor
Assets leased to customers under agreements, which transfer substantially all the risks and rewards of ownership, with or without ultimate legal title, are classified as finance leases. When assets are held subject to a finance lease, the present value of the lease payments, discounted at the rate of interest implicit in the lease, is recognised as a receivable. The difference between the total payments receivable under the lease and the present value of the receivable is recognised as unearned finance income, which is allocated to accounting periods under the pre-tax net investment method to reflect a constant periodic rate of return.
Assets leased to customers under agreements which do not transfer substantially all the risks and rewards of ownership are classified as operating leases. The leased assets are included within property, plant and equipment on the Group’s balance sheet and depreciation is provided on the depreciable amount of these assets on a systematic basis over their estimated useful lives. Lease income is recognised on a straight-line basis over the period of the lease unless another systematic basis is more appropriate.
Lessee
The leases entered into by the Group are primarily operating leases. Operating lease rentals payable are recognised as an expense in the income statement on a straight-line basis over the lease term unless another systematic basis is more appropriate.
21. Employee benefits
The Group provides employees worldwide with post-retirement benefits mainly in the form of pensions. The Group operates a number of pension schemes which may be funded or unfunded and of a defined contribution or defined benefit nature. In addition, the Group contributes, according to local law in the various countries in which it
| | |
Barclays PLC Annual Report 2006 | | 155 |
| |
Consolidated accounts Barclays PLC
Accounting policies
operates, to Governmental and other plans which have the characteristics of defined contribution plans.
For defined benefit schemes, actuarial valuation of each of the scheme’s obligations using the projected unit credit method and the fair valuation of each of the scheme’s assets are performed annually, using the assumptions set out in Note 35. The difference between the fair value of the plan assets and the present value of the defined benefit obligation at the balance sheet date, adjusted for any historic unrecognised actuarial gains or losses and past service cost, is recognised as a liability in the balance sheet. An asset, arising for example, as a result of past over funding or the performance of the plan investments, is recognised to the extent that it does not exceed the present value of future contribution holidays or refunds of contributions.
Cumulative actuarial gains and losses in excess of the greater of 10% of the assets or 10% of the obligations of the plan are recognised in the income statement over the remaining average service lives of the employees of the related plan, on a straight-line basis.
For defined contribution schemes, the Group recognises contributions due in respect of the accounting period in the income statement. Any contributions unpaid at the balance sheet date are included as a liability.
The Group also provides health care to certain retired employees, which are accrued as a liability in the financial statements over the period of employment, using a methodology similar to that for defined benefit pensions plans.
Short-term employee benefits, such as salaries, paid absences, and other benefits, are accounted for on an accruals basis over the period which employees have provided services in the year. Bonuses are recognised to the extent that the Group has a present obligation to its employees that can be measured reliably.
All expenses related to employee benefits are recognised in the income statement in staff costs, which is included within operating expenses.
22. Share-based payments to employees
The Group engages in equity settled share-based payment transactions in respect of services received from certain of its employees. The fair value of the services received is measured by reference to the fair value of the shares or share options granted on the date of the grant. The cost of the employee services received in respect of the shares or share options granted is recognised in the income statement over the period that the services are received, which is the vesting period. The fair value of the options granted is determined using option pricing models, which take into account the exercise price of the option, the current share price, the risk free interest rate, the expected volatility of the share price over the life of the option and other relevant factors. Except for those which include terms related to market conditions, vesting conditions included in the terms of the grant are not taken into account in estimating fair value. Non-market vesting conditions are taken into account by adjusting the number of shares or share options included in the measurement of the cost of employee services so that ultimately, the amount recognised in the income statement reflects the number of vested shares or share options. Where vesting conditions are related to market conditions, the charges for the services received are recognised regardless of whether or not the market related vesting condition is met, provided that the non-market vesting conditions are met.
23. Provisions
Provisions are recognised for present obligations arising as consequences of past events where it is more likely than not that a transfer of economic benefit will be necessary to settle the obligation, and it can be reliably estimated.
When a leasehold property ceases to be used in the business or a demonstrable commitment has been made to cease to use a property where the costs exceed the benefits of the property, provision is made,
where the unavoidable costs of the future obligations relating to the lease are expected to exceed anticipated rental income and other benefits. The net costs are discounted using market rates of interest to reflect the long-term nature of the cash flows.
Provision is made for the anticipated cost of restructuring, including redundancy costs when an obligation exists. An obligation exists when the Group has a detailed formal plan for restructuring a business and has raised valid expectations in those affected by the restructuring by starting to implement the plan or announcing its main features. The provision raised is normally utilised within nine months.
Contingent liabilities are possible obligations whose existence will be confirmed only by uncertain future events or present obligations where the transfer of economic benefit is uncertain or cannot be reliably measured. Contingent liabilities are not recognised but are disclosed unless they are remote.
24. Taxes, including deferred taxes
Income tax payable on taxable profits (‘current tax’), is recognised as an expense in the period in which the profits arise. Income tax recoverable on tax allowable losses is recognised as an asset only to the extent that it is regarded as recoverable by offset against current or future taxable profits.
Deferred income tax is provided in full, using the liability method, on temporary timing differences arising from the differences between the tax bases of assets and liabilities and their carrying amounts in the consolidated financial statements. Deferred income tax is determined using tax rates and legislation enacted or substantially enacted by the balance sheet date and is expected to apply when the deferred tax asset is realised or the deferred tax liability is settled. Deferred and current tax assets and liabilities are only offset when they arise in the same tax reporting group and where there is both the legal right and the intention to settle on a net basis or to realise the asset and settle the liability simultaneously.
25. Segment reporting
Business segments are distinguishable components of the Group that provide products or services that are subject to risks and rewards that are different to those of other business segments. Geographical segments provide products or services within a particular economic environment that is subject to risks and rewards that are different to those of components operating in other economic environments. Business segments are the primary reporting segments. Group costs are allocated to segments on a reasonable and consistent basis. Transactions between segments are generally accounted for in accordance with Group policies as if the segment were a stand-alone business with intra-segment revenue and costs being eliminated in Head office.
The analyses by geographical segment is based on the location of the customer.
26. Cash and cash equivalents
For the purposes of the cash flow statement, cash comprises cash on hand and demand deposits, and cash equivalents comprise highly liquid investments that are convertible into cash with an insignificant risk of changes in value with original maturities of less than three months. Trading balances, repos and reverse repos are not considered to be part of cash equivalents.
27. Trust activities
The Group commonly acts as trustees and in other fiduciary capacities that result in the holding or placing of assets on behalf of individuals, trusts, retirement benefit plans and other institutions. These assets and income arising thereon are excluded from these financial statements, as they are not assets of the Group.
| | |
| 156 | | Barclays PLC Annual Report 2006 |
| |
Consolidated accounts Barclays PLC
Accounting presentation
Changes in Accounting Presentation
In order to provide more relevance to users and to enhance the comparability of its financial statement presentation, the Group has reformatted the income statement, the balance sheet, the statement of cash flows and certain notes to the accounts, including the presentation of discrete notes that contain information regarding securitisations and leasing disclosed elsewhere in the accounts for 2005. Where appropriate, comparative figures have been re-presented to conform with the current year presentation. Previously reported amounts of assets, liabilities, equity, profits and changes in cash and cash equivalents have not been affected by the changes.
Changes in presentation affecting cash flows in 2005 and 2004 have been disclosed in Note 42.
Future Accounting Developments
IFRS 7 (‘Financial Instruments Disclosures’) and an amendment to IAS 1 (‘Presentation of Financial Statements’) on capital disclosures were issued by the IASB in August 2005 for application in accounting periods beginning on or after 1st January 2007 and have been adopted by the European Commission. The new or revised disclosures will be adopted by the Group for reporting in 2007.
The following International Financial Reporting Interpretations Committee (IFRIC) interpretations issued during 2005 and 2006 which first apply to accounting periods beginning on or after 1st January 2007 are not expected to result in any changes to the Group’s accounting policies:
| · | | Interpretation 7 – Applying the Restatement Approach under IAS 29 Financial Reporting in Hyperinflationary Economies |
| · | | Interpretation 8 – Scope of IFRS 2 |
| · | | Interpretation 9 – Reassessment of Embedded Derivatives |
| · | | Interpretation 10 – Interim Financial Reporting and Impairment |
Consideration will be given during 2007 to the implications, if any, of the following IFRIC interpretations issued during 2006 which would first apply to the Group accounting period beginning on 1st January 2008:
| · | | IFRIC 11 IFRS 2 – Group and Treasury Share Transactions |
| · | | IFRIC12 – Service Concession Arrangements |
IFRS 8 Operating Segments was issued in November 2006 and would first be required to be applied to the Group accounting period beginning on 1st January 2009. The standard replaces IAS 14 Segmental Reporting and would align operating segmental reporting with segments reported to senior management as well as requiring amendments and additions to the existing segmental reporting disclosures. The Group is considering the advantages that permitted early adoption in 2007 may make to the transparency of the segmental disclosures.
US GAAP
Significant differences exist between accounting principles generally accepted under IFRS and those generally accepted in the US. The effect of US GAAP on profit attributable to equity holders of the parent and shareholders’ equity excluding minority interest for Barclays PLC Group is set out in Note 60.
Acquisitions
2006:On 1st November 2006, Barclays Bank PLC acquired the US mortgage servicing business of HomEq Servicing Corporation from Wachovia Corporation.
2005:On 1st June 2005, Barclays Asset and Sales Finance (BASF) acquired a 51% share and controlling stake in Fiat’s Iveco Vehicle Finance Business. The transaction will expand BASF’s commercial vehicle expertise.
On 30th June 2005, EnterCard, the joint venture between Barclays Bank PLC and FöreningsSparbanken (also known as Swedbank), which was announced on 4th February 2005, began operations. Barclays Bank PLC has a 50% economic interest in the joint venture. EnterCard provides credit cards in the Nordic market, initially in Sweden and Norway.
On 1st July 2005, Barclays acquired the wealth business of ING Securities Bank (France) consisting of ING Ferri and ING Private Banking.
On 9th May 2005, Barclays announced the terms of a recommended acquisition of a majority stake in Absa Group Limited (‘Absa’). Barclays has consolidated Absa from 27th July 2005.
2004:On 11th March 2004, Barclays purchased the remaining 40% minority share in Barclays Cairo Bank.
On 1st December 2004, Barclays completed the acquisition of Juniper Financial Corporation from Canadian Imperial Bank of Commerce.
Disposals
2006:On 1st January 2006, Barclays completed the sale of the Barclays South African branch business to Absa Group Limited. This consists of the Barclays Capital South African operations and Corporate and Business Banking activities previously carried out by the South African branch of International Retail and Commercial Banking – excluding Absa, together with the associated assets and liabilities.
On 25th July 2006, Barclays Asset & Sales Finance (BASF) disposed of its interest in its motor vehicle contract hire business, Appleyard Finance Holdings Limited.
On 31st August 2006, Barclays disposed of Bankhaus Wolbern which was formerly part of Absa.
On 22nd December 2006 Barclays disposed of its interest in FirstCaribbean International Bank to Canadian Imperial Bank of Commerce.
On 31st December 2006, BA&SF disposed of its European Vendor Finance business, including Barclays Industrie Bank GmbH and Barclays Technology Finance Ltd, to CIT Group.
2004:On 7th April 2004, Barclays completed the disposal of its shareholding in Edotech Limited to Astron, the business process outsourcing group.
Recent developments
On 19th January 2007, Barclays announced that it had entered into an agreement to purchase EquiFirst Corporation, the non-prime mortgage origination business of Regions Financial Corporation. Completion is expected in the first half of 2007, subject to the receipt of the required licences and applicable regulatory approval.
On 8th February 2007, Barclays completed the acquisition of Indexchange Investment AG, Germany’s leading provider of exchange traded funds, from Bayerische Hypo-und Vereinsbank. The transaction was announced in November 2006.
On 28th February 2007, Barclays completed the acquisition of approximately 96% of the share capital of Nile Bank in Uganda. The transaction was announced in December 2006.
As disclosed in Note 40 of the Notes to the Accounts, Barclays has for some time been party to proceedings, including a class action, in the United States against a number of defendants following the collapse of Enron; the class action claim, commonly known as the Newby litigation, is being heard in the United States District Court for the Southern District of Texas Houston Division (the “District Court”). On 19th March 2007, the United States Court of Appeals for the Fifth Circuit issued its decision on an appeal by Barclays and two other financial institutions contesting a ruling by the District Court allowing the Newby litigation to proceed as a class action. The Court of Appeals held that because no proper claim against Barclays and the other financial institutions had been alleged by the plaintiffs, the case could not proceed against them. The plaintiffs have said they will seek review of this decision by the United States Supreme Court. Pending the outcome of further appellate proceedings, the District Court has stayed the Newby litigation.
On March 19th, 2007, Barclays confirmed that it was in exclusive preliminary discussions with ABN AMRO Holding N.V. concerning a potential combination of the two organisations. Barclays also stated that the talks were at an early and exploratory stage and that there could be no certainty that they would lead to a transaction.
| | |
Barclays PLC Annual Report 2006 | | 157 |
| |
Consolidated accounts Barclays PLC
Consolidated income statement
Consolidated income statement
For the year ended 31st December
| | | | | | | | | | | |
| | | Notes | | 2006
£m |
| | 2005
£m |
| | 2004
£m | (a)
|
Continuing operations | | | | | | | | | | | |
Interest income | | 2 | | 21,805 | | | 17,232 | | | 13,880 | |
Interest expense | | 2 | | (12,662 | ) | | (9,157 | ) | | (7,047 | ) |
Net interest income | | | | 9,143 | | | 8,075 | | | 6,833 | |
Fee and commission income | | 3 | | 8,005 | | | 6,430 | | | 5,509 | |
Fee and commission expense | | 3 | | (828 | ) | | (725 | ) | | (662 | ) |
Net fee and commission income | | | | 7,177 | | | 5,705 | | | 4,847 | |
Net trading income | | 4 | | 3,614 | | | 2,321 | | | 1,487 | |
Net investment income | | 4 | | 962 | | | 858 | | | 1,027 | |
Principal transactions | | | | 4,576 | | | 3,179 | | | 2,514 | |
Net premiums from insurance contracts | | 5 | | 1,060 | | | 872 | | | 1,042 | |
Other income | | 6 | | 214 | | | 147 | | | 131 | |
Total income | | | | 22,170 | | | 17,978 | | | 15,367 | |
Net claims and benefits incurred on insurance contracts | | 5 | | (575 | ) | | (645 | ) | | (1,259 | ) |
Total income net of insurance claims | | | | 21,595 | | | 17,333 | | | 14,108 | |
Impairment charges | | 7 | | (2,154 | ) | | (1,571 | ) | | (1,093 | ) |
Net income | | | | 19,441 | | | 15,762 | | | 13,015 | |
Staff costs | | 8 | | (8,169 | ) | | (6,318 | ) | | (5,227 | ) |
Administration and general expenses | | 9 | | (3,914 | ) | | (3,768 | ) | | (2,990 | ) |
Depreciation of property, plant and equipment | | 25 | | (455 | ) | | (362 | ) | | (297 | ) |
Amortisation of intangible assets | | 24 | | (136 | ) | | (79 | ) | | (22 | ) |
Operating expenses | | | | (12,674 | ) | | (10,527 | ) | | (8,536 | ) |
Share of post-tax results of associates and joint ventures | | 22 | | 46 | | | 45 | | | 56 | |
Profit on disposal of subsidiaries, associates and joint ventures | | | | 323 | | | – | | | 45 | |
Profit before tax | | | | 7,136 | | | 5,280 | | | 4,580 | |
Tax | | 10 | | (1,941 | ) | | (1,439 | ) | | (1,279 | ) |
Profit after tax | | | | 5,195 | | | 3,841 | | | 3,301 | |
Profit attributable to minority interests | | 38 | | 624 | | | 394 | | | 47 | |
Profit attributable to equity holders of the parent | | | | 4,571 | | | 3,447 | | | 3,254 | |
| | | | | 5,195 | | | 3,841 | | | 3,301 | |
| | | | | p | | | p | | | p | |
| | | | |
Earnings per share | | | | | | | | | | | |
Basic earnings per share | | 11 | | 71.9 | | | 54.4 | | | 51.0 | |
Diluted earnings per share | | 11 | | 69.8 | | | 52.6 | | | 49.8 | |
| | | | |
Interim dividend per ordinary share | | | | 10.50 | | | 9.20 | | | 8.25 | |
Proposed final dividend per ordinary share | | 1 | | 20.50 | | | 17.40 | | | 15.75 | |
| | | | £m | | | £m | | | £m | |
Interim dividend | | | | 666 | | | 582 | | | 528 | |
Proposed final dividend | | 1 | | 1,307 | | | 1,105 | | | 1,001 | |
The Board of Directors approved the accounts set out on pages 147 to 270 on 8th March 2007.
The accompanying notes form an integral part of the Consolidated accounts.
Note
| (a) | Does not reflect the application of IAS 32, IAS 39 and IFRS 4 which became effective from 1st January 2005. |
| | |
| 158 | | Barclays PLC Annual Report 2006 |
| |
Consolidated accounts Barclays PLC
Consolidated balance sheet
Consolidated balance sheet
As at 31st December
| | | | | | | | |
| | | Notes | | 2006
£m | | | 2005
£m | |
Assets | | | | | | | | |
Cash and balances at central banks | | | | 7,345 | | | 3,906 | |
Items in the course of collection from other banks | | | | 2,408 | | | 1,901 | |
Trading portfolio assets | | 12 | | 177,867 | | | 155,723 | |
Financial assets designated at fair value: | | | | | | | | |
– held on own account | | 13 | | 31,799 | | | 12,904 | |
– held in respect of linked liabilities to customers under investment contracts | | 13 | | 82,798 | | | 83,193 | |
Derivative financial instruments | | 14 | | 138,353 | | | 136,823 | |
Loans and advances to banks | | 15 | | 30,926 | | | 31,105 | |
Loans and advances to customers | | 16 | | 282,300 | | | 268,896 | |
Available for sale financial investments | | 18 | | 51,703 | | | 53,497 | |
Reverse repurchase agreements and cash collateral on securities borrowed | | 19 | | 174,090 | | | 160,398 | |
Other assets | | 20 | | 5,850 | | | 4,734 | |
Current tax assets | | 21 | | 557 | | | – | |
Investments in associates and joint ventures | | 22 | �� | 228 | | | 546 | |
Goodwill | | 23 | | 6,092 | | | 6,022 | |
Intangible assets | | 24 | | 1,215 | | | 1,269 | |
Property, plant and equipment | | 25 | | 2,492 | | | 2,754 | |
Deferred tax assets | | 21 | | 764 | | | 686 | |
Total assets | | | | 996,787 | | | 924,357 | |
Liabilities | | | | | | | | |
Deposits from banks | | 26 | | 79,562 | | | 75,127 | |
Items in the course of collection due to other banks | | | | 2,221 | | | 2,341 | |
Customer accounts | | 27 | | 256,754 | | | 238,684 | |
Trading portfolio liabilities | | 12 | | 71,874 | | | 71,564 | |
Financial liabilities designated at fair value | | 28 | | 53,987 | | | 33,385 | |
Liabilities to customers under investment contracts | | 13 | | 84,637 | | | 85,201 | |
Derivative financial instruments | | 14 | | 140,697 | | | 137,971 | |
Debt securities in issue | | 29 | | 111,137 | | | 103,328 | |
Repurchase agreements and cash collateral on securities lent | | 19 | | 136,956 | | | 121,178 | |
Other liabilities | | 30 | | 10,337 | | | 11,131 | |
Current tax liabilities | | 21 | | 1,020 | | | 747 | |
Insurance contract liabilities, including unit-linked liabilities | | 31 | | 3,878 | | | 3,767 | |
Subordinated liabilities | | 32 | | 13,786 | | | 12,463 | |
Deferred tax liabilities | | 21 | | 282 | | | 700 | |
Provisions | | 33 | | 462 | | | 517 | |
Retirement benefit liabilities | | 35 | | 1,807 | | | 1,823 | |
Total liabilities | | | | 969,397 | | | 899,927 | |
Shareholders’ equity | | | | | | | | |
Called up share capital | | 36 | | 1,634 | | | 1,623 | |
Share premium account | | 36 | | 5,818 | | | 5,650 | |
Other reserves | | 37 | | 390 | | | 1,377 | |
Retained earnings | | 37 | | 12,169 | | | 8,957 | |
Less: treasury shares | | 37 | | (212 | ) | | (181 | ) |
Shareholders’ equity excluding minority interests | | | | 19,799 | | | 17,426 | |
Minority interests | | 38 | | 7,591 | | | 7,004 | |
Total shareholders’ equity | | | | 27,390 | | | 24,430 | |
Total liabilities and shareholders’ equity | | | | 996,787 | | | 924,357 | |
The accompanying notes form an integral part of the Consolidated accounts.
Marcus AgiusChairman
John VarleyGroup Chief Executive
Naguib KherajGroup Finance Director
| | |
Barclays PLC Annual Report 2006 | | 159 |
| |
Consolidated accounts Barclays PLC
Consolidated statement of recognised income and expense
Consolidated statement of recognised income and expense
For the year ended 31st December
| | | | | | | | | |
| | | 2006
£m |
| | 2005
£m |
| | 2004
£m | (a)
|
Available for sale reserve: | | | | | | | | | |
– Net gains/(losses) from changes in fair value | | 87 | | | (249 | ) | | n/a | |
– Losses transferred to net profit due to impairment | | 86 | | | – | | | n/a | |
– Net gains transferred to net profit on disposal | | (327 | ) | | (120 | ) | | n/a | |
– Net losses transferred to net profit due to fair value hedging | | 14 | | | 260 | | | n/a | |
Cash flow hedging reserve: | | | | | | | | | |
– Net losses from changes in fair value | | (437 | ) | | (50 | ) | | n/a | |
– Net gains transferred to net profit | | (50 | ) | | (69 | ) | | n/a | |
Currency translation differences arising | | (781 | ) | | 300 | | | (58 | ) |
Tax | | 253 | | | 50 | | | – | |
Other | | 25 | | | (102 | ) | | – | |
Amounts included directly in equity | | (1,130 | ) | | 20 | | | (58 | ) |
Profit after tax | | 5,195 | | | 3,841 | | | 3,301 | |
Total recognised income and expense for the year | | 4,065 | | | 3,861 | | | 3,243 | |
Attributable to: | | | | | | | | | |
Equity holders of the parent | | 3,682 | | | 3,379 | | | 3,196 | |
Minority interests | | 383 | | | 482 | | | 47 | |
| | | 4, 065 | | | 3,861 | | | 3,243 | |
The accompanying notes form an integral part of the Consolidated accounts.
Note
| (a) | Does not reflect the application of IAS 32, IAS 39 and IFRS 4 which became effective from 1st January 2005. |
| | |
| 160 | | Barclays PLC Annual Report 2006 |
| |
Consolidated accounts Barclays PLC
Consolidated cash flow statement
Consolidated cash flow statement
For the year ended 31st December
| | | | | | | | | | | | | |
| | | 2006 £m | | | | | 2005 £m | | | | | 2004 £m | |
Reconciliation of profit before tax to net cash flows from operating activities: | | | | | | | | | | | | | |
Profit before tax | | 7,136 | | | | | 5,280 | | | | | 4,580 | |
Adjustment for non-cash items: | | | | | | | | | | | | | |
Allowance for impairment | | 2,154 | | | | | 1,571 | | | | | 1,093 | |
Depreciation and amortisation and impairment of intangibles | | 612 | | | | | 450 | | | | | 328 | |
Other provisions, including pensions | | 558 | | | | | 654 | | | | | 703 | |
Net profit from associates and joint ventures | | (46 | ) | | | | (45 | ) | | | | (56 | ) |
Net profit on disposal of investments and property, plant and equipment | | (778 | ) | | | | (530 | ) | | | | (211 | ) |
Net profit from disposal of associates and joint ventures | | (263 | ) | | | | – | | | | | (45 | ) |
Net profit from disposal of subsidiaries | | (60 | ) | | | | – | | | | | – | |
Other non-cash movements | | 1,702 | | | | | 1,475 | | | | | (1,185 | ) |
| | | | | |
Changes in operating assets and liabilities: | | | | | | | | | | | | | |
Net increase in loans and advances to banks and customers | | (27,385 | ) | | | | (63,177 | ) | | | | (42,763 | ) |
Net increase in deposits and debt securities in issue | | 46,944 | | | | | 67,012 | | | | | 71,711 | |
Net decrease in derivative financial instruments | | 1,196 | | | | | 841 | | | | | – | |
Net increase in trading portfolio assets | | (18,323 | ) | | | | (42,589 | ) | | | | (28,686 | ) |
Net increase in trading liabilities | | 310 | | | | | 9,888 | | | | | 6,925 | |
Net decrease in financial investments | | 1,538 | | | | | 27,129 | | | | | – | |
Net increase in other assets | | (1,527 | ) | | | | (410 | ) | | | | (2,246 | ) |
Net decrease in other liabilities | | (1,580 | ) | | | | (2,818 | ) | | | | – | |
| | | | | |
Tax paid | | (2,141 | ) | | | | (1,082 | ) | | | | (690 | ) |
| | | | | |
Net cash from operating activities | | 10,047 | | | | | 3,649 | | | | | 9,458 | |
Purchase of available for sale investments | | (47,086 | ) | | | | (53,483 | ) | | | | (47,520 | ) |
Proceeds from sale or redemption of available for sale investments | | 46,069 | | | | | 51,111 | | | | | 41,163 | |
Purchase of intangible assets | | (212 | ) | | | | (91 | ) | | | | (64 | ) |
Purchase of property, plant and equipment | | (654 | ) | | | | (588 | ) | | | | (532 | ) |
Proceeds from sale of property, plant and equipment | | 786 | | | | | 98 | | | | | 125 | |
Acquisitions, net of cash acquired | | (248 | ) | | | | (2,115 | ) | | | | (211 | ) |
Disposal of subsidiaries, net of cash disposed | | (15 | ) | | | | – | | | | | – | |
Increase in investment in subsidiaries | | (432 | ) | | | | (160 | ) | | | | (58 | ) |
Decrease in investment in subsidiaries | | 44 | | | | | 49 | | | | | 70 | |
Acquisition of associates and joint ventures | | (162 | ) | | | | (176 | ) | | | | (21 | ) |
Disposal of associates and joint ventures | | 739 | | | | | 40 | | | | | 47 | |
Other cash flows associated with investing activities | | 17 | | | | | 23 | | | | | 15 | |
| | | | | |
Net cash used in investing activities | | (1,154 | ) | | | | (5,292 | ) | | | | (6,986 | ) |
Dividends paid | | (2,215 | ) | | | | (1,894 | ) | | | | (1,425 | ) |
Proceeds of borrowings and issuance of debt securities | | 2,493 | | | | | 1,179 | | | | | 666 | |
Repayments of borrowings and redemption of debt securities | | (366 | ) | | | | (464 | ) | | | | (611 | ) |
Issue of shares and other equity instruments | | 179 | | | | | 135 | | | | | 60 | |
Repurchase of shares and other equity instruments | | – | | | | | – | | | | | (699 | ) |
Net purchase of treasury shares | | (31 | ) | | | | (140 | ) | | | | (35 | ) |
Net issue of shares to minority interest | | 632 | | | | | 2,267 | | | | | 705 | |
| | | | | |
Net cash from/(used in) financing activities | | 692 | | | | | 1,083 | | | | | (1,339 | ) |
| | | | | |
Exchange loss/(gain) on foreign currency cash and cash equivalents | | 562 | | | | | (237 | ) | | | | (470 | ) |
| | | | | |
Net increase/(decrease) in cash and cash equivalents | | 10,147 | | | | | (797 | ) | | | | 663 | |
Cash and cash equivalents at beginning of year | | 20,805 | | | | | 21,602 | | | | | 13,854 | |
| | | | | |
Cash and cash equivalents at end of year | | 30,952 | | | | | 20,805 | | | | | 14,517 | |
Cash and cash equivalents comprise: | | | | | | | | | | | | | |
Cash and balances at central banks | | 7,345 | | | | | 3,906 | | | | | 1,753 | |
Loans and advances to banks | | 30,926 | | | | | 31,105 | | | | | 80,632 | |
Less: amounts with original maturity greater than three months | | (15,892 | ) | | | | (17,987 | ) | | | | (71,180 | ) |
| | 15,034 | | | | | 13,118 | | | | | 9,452 | |
Available for sale treasury and other eligible bills | | 51,703 | | | | | 53,497 | | | | | – | |
Less: non-cash and amounts with original maturity greater than three months | | (50,684 | ) | | | | (53,281 | ) | | | | – | |
| | 1,019 | | | | | 216 | | | | | – | |
Trading portfolio assets | | 177,867 | | | | | 155,723 | | | | | – | |
Less: non-cash and amounts with original maturity greater than three months | | (170,329 | ) | | | | (152,183 | ) | | | | – | |
| | 7,538 | | | | | 3,540 | | | | | – | |
Other | | 16 | | | | | 25 | | | | | 3,312 | |
| | | 30,952 | | | | | 20,805 | | | | | 14,517 | |
In 2005 the opening cash and cash equivalents balance has been adjusted to reflect the adoption of IAS 32 and IAS 39.
The accompanying notes form an integral part of the Consolidated accounts.
| | |
Barclays PLC Annual Report 2006 | | 161 |
| |
Accounts of Barclays PLC
Parent company accounts
Income statement
For the year ended 31st December
| | | | | | | | | |
| | | 2006 £m | | | 2005 £m | | | 2004(a) £m | |
Dividends received from subsidiary | | 1,964 | | | 2,012 | | | 2,138 | |
Interest income | | 4 | | | 4 | | | 3 | |
Management charge from subsidiary undertaking | | (4 | ) | | (4 | ) | | (3 | ) |
Profit before tax | | 1,964 | | | 2,012 | | | 2,138 | |
Tax | | – | | | – | | | – | |
Profit after tax | | 1,964 | | | 2,012 | | | 2,138 | |
Balance Sheet
As at 31st December
| | | | | | |
| | | Notes | | 2006 £m | | 2005 £m |
Assets | | | | | | |
Non-current assets | | | | | | |
Investment in Barclays Bank PLC | | 45 | | 8,641 | | 8,462 |
Current assets | | | | | | |
Cash and balances at central banks | | | | 575 | | 438 |
Other current assets | | | | 17 | | 4 |
| | | |
Total assets | | | | 9,233 | | 8,904 |
| | | |
Liabilities | | | | | | |
Current liabilities | | | | | | |
Amounts payable within one year | | | | 4 | | 4 |
| | | |
Shareholders’ equity | | | | | | |
Called up share capital | | 36 | | 1,634 | | 1,623 |
Share premium account | | 36 | | 5,818 | | 5,650 |
Capital redemption reserve | | 37 | | 309 | | 309 |
Retained earnings | | 37 | | 1,468 | | 1,318 |
Total shareholders’ equity | | | | 9,229 | | 8,900 |
Total liabilities and shareholders’ equity | | | | 9,233 | | 8,904 |
The accompanying notes form an integral part of the accounts.
Marcus Agius Chairman
John Varley Group Chief Executive
Naguib Kheraj Group Finance Director
Note
| (a) | Does not reflect the application of IAS 32, IAS 39, and IFRS 4 which became effictive from 1st January 2005. |
| | |
| 162 | | Barclays PLC Annual Report 2006 |
| |
Statement of recognised income and expense
For the year ended 31st December
| | | | | | |
| | | 2006 £m | | 2005 £m | | 2004 £m |
Profit after tax | | 1,964 | | 2,012 | | 2,138 |
Total recognised income and expense for the year | | 1,964 | | 2,012 | | 2,138 |
Attributable to: | | | | | | |
Equity holders of the parent | | 1,964 | | 2,012 | | 2,138 |
Cash flow statement
For the year ended 31st December
| | | | | | | | | |
| | | 2006 £m | | | 2005 £m | | | 2004 £m | |
Reconciliation of profit before tax to net cash flows from operating activities: | | | | | | | | | |
Profit before tax | | 1,964 | | | 2,012 | | | 2,138 | |
Changes in operating assets and liabilities: | | | | | | | | | |
(Increase)/decrease in other assets | | (13 | ) | | (1 | ) | | 1 | |
Increase/(decrease) in other liabilities | | – | | | 1 | | | (1 | ) |
Net cash from operating activities | | 1,951 | | | 2,012 | | | 2,138 | |
Purchase of shares in Barclays Bank PLC | | (179 | ) | | (135 | ) | | (114 | ) |
Net cash used in investing activities | | (179 | ) | | (135 | ) | | (114 | ) |
Proceeds from issue of shares | | 179 | | | 135 | | | 114 | |
Dividends paid | | (1,814 | ) | | (1,612 | ) | | (1,413 | ) |
Repurchase of ordinary shares | | – | | | – | | | (699 | ) |
Net cash used in financing activities | | (1,635 | ) | | (1,477 | ) | | (1,998 | ) |
Net increase in cash and cash equivalents | | 137 | | | 400 | | | 26 | |
Cash and cash equivalents at beginning of year | | 438 | | | 38 | | | 12 | |
Cash and cash equivalents at end of year | | 575 | | | 438 | | | 38 | |
Cash and cash equivalents comprise: | | | | | | | | | |
Cash and balances at central banks | | 575 | | | 438 | | | 38 | |
Net cash from operating activities includes: | | | | | | | | | |
Dividends received | | 1,964 | | | 2,012 | | | 2,138 | |
Interest received | | 4 | | | 4 | | | 3 | |
The parent company’s sole activity is to hold the investment in its wholly-owned subsidiary, Barclays Bank PLC.
Dividends received are treated as operating income.
The accompanying notes form an integral part of the accounts.
| | |
Barclays PLC Annual Report 2006 | | 163 |
| |
Notes to the accounts
For the year ended 31st December 2006
1 Dividends per share
The Directors have recommended the final dividends in respect of 2006 of 20.5p per ordinary share of 25p each and 10p per staff share of £1 each, amounting to a total of £1,307m, which will be paid on 27th April 2007. The financial statements for the year ended 31st December 2006 do not reflect these dividends, which will be accounted for in shareholders’ equity as an appropriation of retained profits in the year ending 31st December 2007. The financial statements to 31st December 2006 include the 2005 final dividend of £1,105m.
2 Net interest income
| | | | | | | | | |
| | | 2006
£m | | | 2005
£m | | | 2004
£m | |
Cash and balances with central banks | | 91 | | | 9 | | | 4 | |
Financial investments | | 2,811 | | | 2,272 | | | n/a | |
Debt securities | | n/a | | | n/a | | | 2,597 | |
Loans and advances to banks | | 903 | | | 690 | | | 957 | |
Loans and advances to customers | | 16,290 | | | 12,944 | | | 10,312 | |
Other | | 1,710 | | | 1,317 | | | 10 | |
Interest income | | 21,805 | | | 17,232 | | | 13,880 | |
| | | | | | | | | | |
Deposits from banks | | (2,819 | ) | | (2,056 | ) | | (1,535 | ) |
Customer accounts | | (3,076 | ) | | (2,715 | ) | | (2,053 | ) |
Debt securities in issue | | (5,282 | ) | | (3,268 | ) | | (1,569 | ) |
Subordinated liabilities | | (777 | ) | | (605 | ) | | (692 | ) |
Other | | (708 | ) | | (513 | ) | | (1,198 | ) |
Interest expense | | (12,662 | ) | | (9,157 | ) | | (7,047 | ) |
Net interest income | | 9,143 | | | 8,075 | | | 6,833 | |
Interest income includes £98m (2005: £76m, 2004: n/a) accrued on impaired loans.
In 2006 and 2005, other interest income principally includes interest income relating to reverse repurchase agreements. In 2004, such income was classified within the loans and advances to banks and the loans and advances to customers categories. Similarly, other interest expense principally includes expenditure relating to repurchase agreements. In 2004, the expenditure was included within deposits from banks and customer accounts.
Included in net interest income is hedge ineffectiveness as detailed in Note 14.
3 Net fee and commission income
| | | | | | | | | |
| | | 2006
£m | | | 2005
£m | | | 2004
£m | |
Fee and commission income | | | | | | | | | |
Brokerage fees | | 70 | | | 64 | | | 27 | |
Investment management fees | | 1,535 | | | 1,250 | | | 821 | |
Securities lending | | 185 | | | 151 | | | 111 | |
Securities transactions and investment activity fees | | 1,790 | | | 1,465 | | | 959 | |
Banking and credit related fees and commissions | | 6,031 | | | 4,805 | | | 4,386 | |
Foreign exchange commission | | 184 | | | 160 | | | 164 | |
Fee and commission income | | 8,005 | | | 6,430 | | | 5,509 | |
Fee and commission expense | | (828 | ) | | (725 | ) | | (662 | ) |
Net fee and commission income | | 7,177 | | | 5,705 | | | 4,847 | |
| | |
| 164 | | Barclays PLC Annual Report 2006 |
| |
4 Principal transactions
| | | | | | |
| | | | |
| | | 2006
£m | | 2005
£m | | 2004
£m |
| | | |
Rates related business | | 2,848 | | 1,732 | | 1,141 |
Credit related business | | 766 | | 589 | | 346 |
| | | |
Net trading income | | 3,614 | | 2,321 | | 1,487 |
Net gain from disposal of available for sale assets/investment securities | | 307 | | 120 | | 45 |
Dividend income on equity investments | | 15 | | 22 | | 17 |
Net gain from financial instruments designated at fair value | | 447 | | 389 | | n/a |
Income from assets backing insurance policies | | n/a | | n/a | | 717 |
Other investment income | | 193 | | 327 | | 248 |
| | | |
Net investment income | | 962 | | 858 | | 1,027 |
| | | |
Principal transactions | | 4,576 | | 3,179 | | 2,514 |
Net trading income includes the profits and losses arising both on the purchase and sale of trading instruments and from the revaluation to market value, together with the interest income earned from these instruments and the related funding cost.
The gain/loss from disposal of available for sale assets was calculated on an instrument by instrument basis.
Of the total net trading income, £947m (2005: £498m, 2004: £556m) was earned on securities and £480m (2005: £340m, 2004: £213m) was earned in foreign exchange dealings.
Rates related business includes fixed income, foreign exchange, commodities, emerging markets, money markets sales, trading and research, prime services and equity products; Credit related business includes primary and secondary activities for loans and bonds for investment grade, high yield and emerging market credits, as well as hybrid capital products, asset-based finance, commercial mortgage backed securities, credit derivatives, structured capital markets and large asset leasing.
The net gain on financial assets designated at fair value included within principal transactions was £489m (2005: £391m, 2004: n/a) of which gains of £42m (2005: £2m gain, 2004: n/a) were included in net trading income and gains of £447m (2005: £389m, 2004: n/a) were included in net investment income.
The net loss on financial liabilities designated at fair value included within principal transactions was £920m (2005: £666m, 2004: n/a) all of which was included within net trading income.
5 Insurance premiums and insurance claims and benefits
| | | | | | | | | |
| | | | |
| | | 2006
£m | | | 2005
£m | | | 2004
£m | |
Gross premiums from insurance contracts | | 1,108 | | | 909 | | | 1,069 | |
Premiums ceded to reinsurers | | (48 | ) | | (37 | ) | | (27 | ) |
| | | |
Net premiums from insurance contracts | | 1,060 | | | 872 | | | 1,042 | |
| | | | | | | | | | |
| | | | |
| | | 2006
£m | | | 2005
£m | | | 2004
£m | |
Gross claims and benefits incurred on insurance contracts | | 588 | | | 694 | | | 1,275 | |
Reinsurers’ share of claims incurred | | (13 | ) | | (49 | ) | | (16 | ) |
| | | |
Net claims and benefits incurred on insurance contracts | | 575 | | | 645 | | | 1,259 | |
| | |
Barclays PLC Annual Report 2006 | | 165 |
| |
Notes to the accounts
For the year ended 31st December 2006
6 Other income
| | | | | | | | |
| | | 2006
£m | | | 2005
£m | | | 2004
£m |
Increase in fair value of assets held in respect of linked liabilities to customers under investment contracts | | 7,417 | | | 9,234 | | | n/a |
Increase in liabilities to customers under investment contracts | | (7,417 | ) | | (9,234 | ) | | n/a |
Property rentals | | 55 | | | 54 | | | 46 |
Other income | | 159 | | | 93 | | | 85 |
Other income | | 214 | | | 147 | | | 131 |
Included in other income are sub-lease payments of £18m (2005: £18m, 2004: £12m).
Included in other income is a gain on reinsurance.
7 Impairment charges
| | | | | | | | | |
| | | 2006
£m | | | 2005
£m | | | 2004
£m | |
Impairment charges on loans and advances | �� | | | | | | | | |
– New and increased impairment allowances | | 2,722 | | | 2,129 | | | 1,755 | |
– Releases | | (389 | ) | | (333 | ) | | (396 | ) |
– Recoveries | | (259 | ) | | (222 | ) | | (255 | ) |
Impairment charges on loans and advances | | 2,074 | | | 1,574 | | | 1,104 | |
Other credit provisions | | | | | | | | | |
Release in respect of provision for undrawn contractually committed facilities and guarantees provided | | (6 | ) | | (7 | ) | | (11 | ) |
Impairment charges on loans and advances and other credit provisions | | 2,068 | | | 1,567 | | | 1,093 | |
Impairment on available for sale assets | | 86 | | | 4 | | | n/a | |
Impairment charges | | 2,154 | | | 1,571 | | | 1,093 | |
8 Staff costs
| | | | | | |
| | | 2006
£m | | 2005
£m | | 2004
£m |
Salaries and accrued incentive payments | | 6,635 | | 5,036 | | 4,098 |
Social security costs | | 502 | | 412 | | 339 |
Pension costs – defined contribution plans | | 128 | | 76 | | 92 |
Pension costs – defined benefit plans (Note 35) | | 282 | | 271 | | 235 |
Other post-retirement benefits (Note 35) | | 30 | | 27 | | 29 |
Other | | 592 | | 496 | | 434 |
Staff costs | | 8,169 | | 6,318 | | 5,227 |
Included in salaries and accrued incentive payments is £640m (2005: £338m, 2004: £204m) arising from equity settled share-based payments, of which £78m (2005: £44m, 2004: £54m) is a charge related to options-based schemes. Also included is £6m (2005: £nil, 2004: £nil) arising from cash settled share-based payments.
The average number of persons employed by the Group worldwide during the year, excluding agency staff, was 118,600 (2005: 92,800, 2004: 77,000).
| | |
| 166 | | Barclays PLC Annual Report 2006 |
| |
9 Administration and general expenses
| | | | | | | |
| | | 2006
£m | | | 2005
£m | | 2004
£m |
Administrative expenses | | 3,980 | | | 3,443 | | 2,766 |
Impairment loss | | | | | | | |
– property and equipment (Note 25) | | 14 | | | – | | – |
– intangible assets (Note 24) | | 7 | | | 9 | | 9 |
Operating lease rentals | | 345 | | | 316 | | 215 |
Gain on property disposals | | (432 | ) | | – | | – |
Administration and general expenses | | 3,914 | | | 3,768 | | 2,990 |
| | | | | | | | | | |
Auditors’ remuneration | | | | | | | | | | |
| | | 2006 |
| | | Audit
£m | | Audit
related
£m | | Taxation
services
£m | | Other
services
£m | | Total
£m |
Audit of the Group’s annual accounts | | 7 | | – | | – | | – | | 7 |
Other services: | | | | | | | | | | |
Fees payable for the audit of the Company’s associates pursuant to legislation | | 11 | | – | | – | | – | | 11 |
Other services supplied pursuant to such legislation | | 10 | | 1 | | – | | – | | 11 |
Other services relating to taxation | | – | | – | | 6 | | – | | 6 |
| Services relating to corporate finance transactions entered into or proposed to be entered into by or on behalf of the Company or any of its associates | | – | | – | | – | | 4 | | 4 |
Other | | – | | 4 | | – | | 1 | | 5 |
Total auditors’ remuneration | | 28 | | 5 | | 6 | | 5 | | 44 |
| | | | | | | | | | |
| | | 2005 |
| | | Audit
£m | | Audit
related
£m | | Taxation
services
£m | | Other
services
£m | | Total
£m |
�� Audit of the Group’s annual accounts | | 6 | | – | | – | | – | | 6 |
Other services: | | | | | | | | | | |
| Fees payable for the audit of the Company’s associates pursuant to legislation | | 8 | | – | | – | | – | | 8 |
| Other services supplied pursuant to such legislation | | 1 | | – | | – | | – | | 1 |
| Other services relating to taxation | | – | | – | | 4 | | – | | 4 |
| Services relating to corporate finance transactions entered into or proposed to be entered into by or on behalf of the Company or any of its associates | | – | | – | | – | | 3 | | 3 |
Other | | – | | 7 | | – | | – | | 7 |
Total auditors’ remuneration | | 15 | | 7 | | 4 | | 3 | | 29 |
The figures shown in the above table relate to fees paid to PricewaterhouseCoopers LLP and its associates. Fees paid to other auditors not associated with PricewaterhouseCoopers LLP in respect of the audit of the Company’s subsidiaries were £2m (2005: £3m, 2004: £nil).
Fees payable for the audit of the Company’s associates pursuant to legislation comprise the fees for the statutory audit of the subsidiaries and associated pension schemes both inside and outside Great Britain and fees for the work performed by the associates of PricewaterhouseCoopers LLP in respect of the consolidated financial statements of the Company. The fees relating to the audit of the associated pension schemes were £0.3m (2005: £0.3m, 2004: £0.3m).
Other services supplied pursuant to such legislation comprise services in relation to statutory and regulatory filings. These includes audit services for the review of the interim financial information under the Listing Rules of the UK listing authority and for the first time in 2006, fees paid for preparation for reporting under Section 404 of the US Sarbanes-Oxley Act (Section 404). In addition, other services include Section 404 advisory, IFRS advisory, securitisations and services relating to the Absa acquisition.
Taxation services include compliance services such as tax return preparation and advisory services such as consultation on tax matters, tax advice relating to transactions and other tax planning and advice.
Services relating to corporate finance transactions comprise due diligence related to transactions and accounting consultations and audits in connection with such transactions.
Auditors’ remuneration for 2004 was as follows: audit fees £12m, audit related fees £3m, taxation services £5m and other services £2m.
| | |
Barclays PLC Annual Report 2006 | | 167 |
| |
Notes to the accounts
For the year ended 31st December 2006
10 Tax
The charge for tax is based upon the standard UK corporation tax rate of 30% (2005: 30%, 2004: 30%) and comprises:
| | | | | | | | | |
| | | 2006
£m | | | 2005
£m | | | 2004
£m | |
| | | |
Current tax charge | | | | | | | | | |
Current year | | 1,929 | | | 1,583 | | | 1,240 | |
Adjustment for prior years | | 8 | | | (59 | ) | | (48 | ) |
Total | | 1,937 | | | 1,524 | | | 1,192 | |
| | | |
Deferred tax charge/(credit) | | | | | | | | | |
Origination and reversal of temporary differences | | (16 | ) | | (7 | ) | | 65 | |
Adjustment for prior years | | 20 | | | (71 | ) | | 22 | |
Change in tax rate | | 4 | | | 3 | | | – | |
Other | | (4 | ) | | (10 | ) | | – | |
| | | |
Total | | 4 | | | (85 | ) | | 87 | |
| | | |
Tax charge | | 1,941 | | | 1,439 | | | 1,279 | |
| | | | | | | | | | |
| | | 2006
£m | | | 2005
£m | | | 2004
£m | |
| | | |
Current tax charge | | | | | | | | | |
United Kingdom | | 1,138 | | | 1,013 | | | 938 | |
Overseas | | 799 | | | 511 | | | 254 | |
| | | |
Total | | 1,937 | | | 1,524 | | | 1,192 | |
Deferred tax charge/(credit) | | | | | | | | | |
United Kingdom | | 96 | | | (52 | ) | | 90 | |
Overseas | | (92 | ) | | (33 | ) | | (3 | ) |
| | | |
Total | | 4 | | | (85 | ) | | 87 | |
| | | |
Tax charge | | 1,941 | | | 1,439 | | | 1,279 | |
Available overseas tax credits of £515m (2005: £270m, 2004: £360m) have been applied to reduce UK tax in accordance with UK legislation.
The effective tax rate for the years 2006, 2005 and 2004 is lower than the standard rate of corporation tax in the UK of 30% (2005: 30%, 2004: 30%).
The differences are set out below:
| | | | | | | | | |
| | | 2006
£m | | | 2005
£m | | | 2004
£m | |
| | | |
Profit before tax | | 7,136 | | | 5,280 | | | 4,580 | |
Tax charge at standard UK corporation tax rate of 30% (2005: 30%, 2004: 30%) | | 2,141 | | | 1,584 | | | 1,374 | |
Adjustment for prior years | | 28 | | | (130 | ) | | (26 | ) |
Differing overseas tax rates | | (17 | ) | | (35 | ) | | (110 | ) |
Non-taxable gains and income (including amounts offset by previously unrecognised tax losses) | | (393 | ) | | (129 | ) | | (51 | ) |
Share-based payments | | 27 | | | (12 | ) | | – | |
Deferred tax assets not recognised | | (4 | ) | | (7 | ) | | 24 | |
Other non-allowable expenses | | 159 | | | 168 | | | 68 | |
Overall tax charge | | 1,941 | | | 1,439 | | | 1,279 | |
Effective tax rate | | 27 | % | | 27% | | | 28% | |
| | |
| 168 | | Barclays PLC Annual Report 2006 |
| |
11 Earnings per share
| | | | | | | | | |
| | | 2006
£m | | | 2005
£m | | | 2004
£m | |
Profit attributable to equity holders of parent | | 4,571 | | | 3,447 | | | 3,254 | |
Dilutive impact of convertible options | | (30 | ) | | (38 | ) | | (16 | ) |
Profit attributable to equity holders of parent including dilutive impact of convertible options | | 4,541 | | | 3,409 | | | 3,238 | |
| | | | | | |
| | | 2006
million | | 2005
million | | 2004
million |
Basic weighted average number of shares in issue | | 6,357 | | 6,337 | | 6,381 |
Number of potential ordinary shares | | 150 | | 149 | | 124 |
Diluted weighted average number of shares | | 6,507 | | 6,486 | | 6,505 |
| | | | | | |
| | | p | | p | | p |
Basic earnings per share | | 71.9 | | 54.4 | | 51.0 |
Diluted earnings per share | | 69.8 | | 52.6 | | 49.8 |
The calculation of basic earnings per share is based on the profit attributable to equity holders of the parent and the number of basic weighted average number of shares excluding own shares held in employee benefits trusts, currently not vested, and shares held for trading.
When calculating the diluted earnings per share, the profit attributable to equity holders of the parent is adjusted for the conversion of outstanding options into shares within Absa Group Limited and Barclays Global Investors UK Holdings Limited. The weighted average number of ordinary shares excluding own shares held in employee benefit trusts, currently not vested, and shares held for trading, is adjusted for the effects of all dilutive potential ordinary shares, totalling 150 million (2005: 149 million, 2004: 124 million).
Of the total number of employee share options and share awards at 31st December 2006, 5 million were anti-dilutive (2005: nil, 2004: 51 million).
Subsequent to the balance sheet date, the Group continued to make on-market purchases of treasury shares under its various employee share schemes. No adjustment has been made to earnings per share in respect of these purchases.
| | |
Barclays PLC Annual Report 2006 | | 169 |
| |
Notes to the accounts
For the year ended 31st December 2006
12 Trading portfolio
| | | | | | |
| | | 2006
£m | | | 2005
£m | |
Trading portfolio assets | | | | | | |
Treasury and other eligible bills | | 2,960 | | | 6,074 | |
Debt securities | | | | | | |
United Kingdom government bonds | | 4,986 | | | 4,786 | |
Other government bonds | | 46,845 | | | 46,426 | |
Other mortgage and asset backed securities | | 17,032 | | | 10,290 | |
Bank and building society certificates of deposit | | 14,159 | | | 15,837 | |
Other issuers | | 57,554 | | | 51,028 | |
Debt securities | | 140,576 | | | 128,367 | |
Equity securities | | 31,548 | | | 20,299 | |
Traded loans | | 1,843 | | | 408 | |
Physical commodity trading positions | | 940 | | | 575 | |
Trading portfolio assets | | 177,867 | | | 155,723 | |
Trading portfolio liabilities | | | | | | |
Treasury and other eligible bills | | (608 | ) | | (1,120 | ) |
Debt securities | | | | | | |
United Kingdom government bonds | | (6,889 | ) | | (7,784 | ) |
Other government bonds | | (44,950 | ) | | (44,601 | ) |
Other mortgage and asset backed securities | | (26 | ) | | (40 | ) |
Bank and building society certificates of deposit | | (113 | ) | | (45 | ) |
Other issuers | | (6,164 | ) | | (9,903 | ) |
Debt securities | | (58,142 | ) | | (62,373 | ) |
Equity securities | | (12,697 | ) | | (8,071 | ) |
Short positions in commodity contracts | | (427 | ) | | – | |
Trading portfolio liabilities | | (71,874 | ) | | (71,564 | ) |
| | |
| 170 | | Barclays PLC Annual Report 2006 |
| |
13 Financial assets designated at fair value
Held on own account
| | | | |
| | | 2006
£m | | 2005
£m |
Loans and advances designated at fair value | | 13,196 | | 8,600 |
Debt securities designated at fair value | | 12,100 | | 171 |
Equity securities designated at fair value | | 3,711 | | 3,915 |
Other financial assets designated at fair value | | 2,792 | | 218 |
| | |
Financial assets designated at fair value – held on own account | | 31,799 | | 12,904 |
Credit risk on loans and advances designated at fair value
The maximum exposure to credit risk on loans and advances designated at fair value at 31st December 2006 was £13,196m (2005: £8,600m). The amount by which related credit derivatives and similar instruments mitigate the exposure to credit risk at 31st December 2006 was £28m (2005: £2,505m).
The net gain attributable to changes in credit risk for loans and advances designated at fair value was £nil in 2006 (2005: £3m). The gains or losses on related credit derivatives was £nil for the year (2005: £nil).
The cumulative net gain attributable to changes in credit risk for loans and advances designated at fair value since initial recognition is £3m at 31st December 2006 (2005: £3m). The cumulative change in fair value of related credit derivatives at 31st December 2006 is £nil (2005: £nil).
Certain loans and advances designated at fair value are subject to securitisation. See Note 34.
Held in respect of linked liabilities to customers under investment contracts/liabilities arising from investment contracts
| | | | | | |
| | | 2006 £m | | | 2005 £m | |
Financial assets designated at fair value held in respect of linked liabilities to customers under investment contracts | | 82,798 | | | 83,193 | |
Cash and bank balances within the portfolio | | 1,839 | | | 2,008 | |
| | |
Assets held in respect of linked liabilities to customers under investment contracts | | 84,637 | | | 85,201 | |
| | |
Liabilities to customers under investment contracts | | (84,637 | ) | | (85,201 | ) |
A portion of the Group’s fund management business takes the legal form of insurance policies, under which legal title to the underlying investment is held by the Group, but the inherent risks and rewards in the investments are borne by the customer. In the normal course of business, the Group’s financial interest in such investments is restricted to fees for investment management services.
Due to the nature of these contracts, the carrying value of the assets is always the same as the value of the liabilities and any change in the value of the assets results in an equal but opposite change in the value of the amounts due to the policyholders.
In the balance sheet, the assets are included as ‘Financial assets designated at fair value – held in respect of linked liabilities to customers under investment contracts’. Cash balances within the portfolio have been included in the Group’s cash balances. The associated obligation to deliver the value of the investments to customers at their fair value on balance sheet date is included as ‘Liabilities to customers under investment contracts’.
The increase/decrease in the value arising from the return on the investments and the corresponding increase/decrease in linked liabilities to customers is included in the Other income note in Note 6.
| | |
Barclays PLC Annual Report 2006 | | 171 |
| |
Notes to the accounts
For the year ended 31st December 2006
14 Derivative financial instruments
Financial instruments
The Group’s objectives and policies on managing the risks that arise in connection with derivatives, including the policies for hedging, are included in Note 52 to Note 56 under the headings, ‘Financial Risk’, ‘Interest Rate Risk’, ‘Credit Risk’, ‘Currency Risk’ and ‘Liquidity Risk’.
The notional amounts of certain types of financial instruments provide a basis for comparison with instruments recognised on the balance sheet but do not necessarily indicate the amounts of future cash flows involved or the current fair value of the instruments and, therefore, do not indicate the Group’s exposure to credit or price risks. The derivative instruments become favourable (assets) or unfavourable (liabilities) as a result of fluctuations in market rates or prices relative to their terms. The aggregate contractual or notional amount of derivative financial instruments on hand, the extent to which instruments are favourable or unfavourable and, thus the aggregate fair values of derivative financial assets and liabilities can fluctuate significantly.
The fair value of a derivative contract represents the amount at which that contract could be exchanged in an arms-length transaction, calculated at market rates current at the balance sheet date.
The fair values and notional amounts of derivative instruments held for trading are set out in the following table:
| | | | | | | | | | | | | | | | |
| | | 2006 | | | | | 2005 | |
Year ended 31st December
Derivatives held for trading | | Notional
contract
amount
£m | | Fair value | | | | | Notional
contract
amount
£m | | Fair value | |
| | |
Assets
£m | |
Liabilities
£m | | | | |
Assets
£m | |
Liabilities
£m | |
Foreign exchange derivatives | | | | | | | | | | | | | | | | |
Forward foreign exchange | | 767,734 | | 8,074 | | (7,808 | ) | | | | 585,635 | | 7,574 | | (6,707 | ) |
Currency swaps | | 411,889 | | 10,029 | | (10,088 | ) | | | | 351,319 | | 8,316 | | (8,045 | ) |
OTC options bought and sold | | 320,184 | | 3,923 | | (3,849 | ) | | | | 244,810 | | 2,595 | | (2,516 | ) |
OTC derivatives | | 1,499,807 | | 22,026 | | (21,745 | ) | | | | 1,181,764 | | 18,485 | | (17,268 | ) |
Exchange traded futures – bought and sold | | 852 | | – | | – | | | | | 2,304 | | – | | – | |
Exchange traded options – bought and sold | | 115 | | – | | – | | | | | 6 | | – | | – | |
Foreign exchange derivatives | | 1,500,774 | | 22,026 | | (21,745 | ) | | | | 1,184,074 | | 18,485 | | (17,268 | ) |
Interest rate derivatives | | | | | | | | | | | | | | | | |
Interest rate swaps | | 8,718,015 | | 61,267 | | (61,510 | ) | | | | 7,311,939 | | 68,341 | | (67,669 | ) |
Forward rate agreements | | 1,335,594 | | 337 | | (374 | ) | | | | 1,345,368 | | 431 | | (434 | ) |
OTC options bought and sold | | 2,301,239 | | 13,977 | | (13,558 | ) | | | | 1,267,683 | | 12,256 | | (11,598 | ) |
OTC derivatives | | 12,354,848 | | 75,581 | | (75,442 | ) | | | | 9,924,990 | | 81,028 | | (79,701 | ) |
Exchange traded futures – bought and sold | | 1,057,767 | | 188 | | (256 | ) | | | | 1,862,606 | | – | | – | |
Exchange traded options – bought and sold | | 848,629 | | 241 | | (156 | ) | | | | 826,351 | | – | | – | |
Exchange traded swaps | | 3,405,109 | | – | | – | | | | | 2,760,110 | | – | | – | |
Interest rate derivatives | | 17,666,353 | | 76,010 | | (75,854 | ) | | | | 15,374,057 | | 81,028 | | (79,701 | ) |
Credit derivatives | | | | | | | | | | | | | | | | |
Swaps | | 1,224,548 | | 9,275 | | (8,894 | ) | | | | 609,381 | | 4,172 | | (4,806 | ) |
Equity and stock index derivatives | | | | | | | | | | | | | | | | |
OTC options bought and sold | | 114,227 | | 11,171 | | (15,613 | ) | | | | 208,068 | | 9,974 | | (13,067 | ) |
Equity swaps and forwards | | 24,580 | | 656 | | (846 | ) | | | | 8,108 | | 328 | | (164 | ) |
OTC derivatives | | 138,807 | | 11,827 | | (16,459 | ) | | | | 216,176 | | 10,302 | | (13,231 | ) |
Exchange traded futures – bought and sold | | 30,159 | | 154 | | (176 | ) | | | | 52,454 | | – | | – | |
Exchange traded options – bought and sold | | 30,473 | | 161 | | (171 | ) | | | | 26,789 | | – | | – | |
Equity and stock index derivatives | | 199,439 | | 12,142 | | (16,806 | ) | | | | 295,419 | | 10,302 | | (13,231 | ) |
Commodity derivatives | | | | | | | | | | | | | | | | |
OTC options bought and sold | | 52,899 | | 2,568 | | (2,443 | ) | | | | 68,377 | | 4,070 | | (3,881 | ) |
Commodity swaps and forwards | | 164,863 | | 14,933 | | (13,497 | ) | | | | 211,541 | | 17,674 | | (17,336 | ) |
OTC derivatives | | 217,762 | | 17,501 | | (15,940 | ) | | | | 279,918 | | 21,744 | | (21,217 | ) |
Exchange traded futures – bought and sold | | 68,710 | | 13 | | (33 | ) | | | | 50,244 | | – | | – | |
Exchange traded options – bought and sold | | 9,169 | | 306 | | (474 | ) | | | | 11,871 | | 435 | | (680 | ) |
Commodity derivatives | | 295,641 | | 17,820 | | (16,447 | ) | | | | 342,033 | | 22,179 | | (21,897 | ) |
Derivative assets/(liabilities) held for trading | | 20,886,755 | | 137,273 | | (139,746 | ) | | | | 17,804,964 | | 136,166 | | (136,903 | ) |
| | |
| 172 | | Barclays PLC Annual Report 2006 |
| |
14 Derivative financial instruments (continued)
The fair values and notional amounts of derivative instruments held for risk management are set out in the following table:
| | | | | | | | | | | | | | |
| | | | | 2006 | | | | | | | 2005 | | | |
| | Notional
contract
amount
£m | | Fair value | | | Notional
Contract
amount
£m | | Fair value | |
Year ended 31st December Derivatives held for risk management | | | Assets
£m | | Liabilities
£m |
| | | Assets
£m | | Liabilities
£m |
|
Derivatives designated as cash flow hedges | | | | | | | | | | | | | | |
Currency swaps | | – | | – | | – | | | 14 | | 1 | | – | |
Interest rate swaps | | 51,614 | | 132 | | (312 | ) | | 27,042 | | 230 | | (290 | ) |
OTC interest rate options bought | | – | | – | | – | | | 782 | | 1 | | – | |
Exchange traded interest rate swaps | | 12,077 | | – | | – | | | 11,899 | | – | | – | |
Commodity swaps and forwards | | 204 | | – | | (89 | ) | | 343 | | – | | (193 | ) |
| | | | | | |
Derivatives designated as cash flow hedges | | 63,895 | | 132 | | (401 | ) | | 40,080 | | 232 | | (483 | ) |
| | | | | | |
Derivatives designated as fair value hedges | | | | | | | | | | | | | | |
Currency swaps | | 1,454 | | – | | (233 | ) | | 1,686 | | – | | (81 | ) |
Interest rate swaps | | 16,940 | | 240 | | (152 | ) | | 29,394 | | 387 | | (190 | ) |
Equity options | | 1,029 | | 58 | | (56 | ) | | 1,084 | | 36 | | (46 | ) |
Forward foreign exchange | | 66 | | – | | – | | | 28 | | – | | (14 | ) |
OTC interest rate options bought | | – | | – | | – | | | 1,287 | | – | | – | |
| | | | | | |
Derivatives designated as fair value hedges | | 19,489 | | 298 | | (441 | ) | | 33,479 | | 423 | | (331 | ) |
| | | | | | |
Derivatives designated as hedges of net investments | | | | | | | | | | | | | | |
Forward foreign exchange | | 2,730 | | – | | (78 | ) | | – | | – | | – | |
Currency swaps | | 9,320 | | 650 | | (31 | ) | | 5,919 | | 2 | | (254 | ) |
| | | | | | |
Derivatives designated as hedges of net investment | | 12,050 | | 650 | | (109 | ) | | 5,919 | | 2 | | (254 | ) |
| | | | | | |
Derivative assets/(liabilities) held for risk management | | 95,434 | | 1,080 | | (951 | ) | | 79,478 | | 657 | | (1,068 | ) |
Interest rate derivatives, designated as cash flow hedges, primarily hedge the exposure to cash flow variability from interest rates of variable rate loans to banks and customers, variable rate debt securities held and highly probable forecast financing transactions and reinvestments.
Interest rate derivatives designated as fair value hedges primarily hedge the interest rate risk of fixed rate borrowings in issue, fixed rate loans to banks and customers and investments in fixed rate debt securities held.
Currency derivatives are primarily designated as hedges of the foreign currency risk of net investments in foreign operations.
The Group’s total derivative asset and liability position as reported on the balance sheet is as follows:
| | | | | | | | | | | | | | |
| | | | | 2006 | | | | | | | 2005 | | | |
| | Notional
contract
amount
£m | | Fair value | | | Notional
Contract
amount
£m | | Fair value | |
Year ended 31st December | | | Assets
£m | | Liabilities
£m |
| | | Assets
£m | | Liabilities
£m |
|
Total derivative assets/(liabilities) held for trading | | 20,886,755 | | 137,273 | | (139,746 | ) | | 17,804,964 | | 136,166 | | (136,903 | ) |
Total derivative assets/(liabilities) held for risk management | | 95,434 | | 1,080 | | (951 | ) | | 79,478 | | 657 | | (1,068 | ) |
| | | | | | |
Recognised derivative assets/(liabilities) | | 20,982,189 | | 138,353 | | (140,697 | ) | | 17,884,442 | | 136,823 | | (137,971 | ) |
The Group has hedged the following forecast cash flows, which primarily vary with interest rates. These cash flows are expected to impact the income statement in the following periods, excluding any hedge adjustments that may be applied:
| | | | | | | | | | | | | | |
| | | 2006 |
| | | Total
£m | | Up to
one year
£m | | Between
one to
two years
£m | | Between
two to
three years
£m | | Between
three to
four years
£m | | Between
four to
five years
£m | | More than
five years
£m |
| | | | | | | |
Forecast receivable cash flows | | 5,111 | | 1,500 | | 1,452 | | 954 | | 689 | | 410 | | 106 |
Forecast payable cash flows | | 1,280 | | 704 | | 349 | | 121 | | 73 | | 30 | | 3 |
| | |
Barclays PLC Annual Report 2006 | | 173 |
| |
Notes to the accounts
For the year ended 31st December 2006
14 Derivative financial instruments (continued)
| | | | | | | | | | | | | | |
| | | 2005 |
| | | Total
£m | | Up to
one year
£m | | Between
one to
two years
£m | | Between
two to
three years
£m | | Between
three to
four years
£m | | Between
four to
five years
£m | | More than
five years
£m |
Forecast receivable cash flows | | 3,230 | | 779 | | 768 | | 704 | | 458 | | 265 | | 256 |
Forecast payable cash flows | | 2,300 | | 358 | | 350 | | 337 | | 287 | | 238 | | 730 |
The maximum length of time over which the Group is hedging its exposure to the variability in future cash flows for forecasted transactions, excluding those forecasted transactions related to the payment of variable interest on existing financial instruments, is eight years (2005: 29 years).
No gain or loss on forecast transactions accorded hedge accounting in 2006 that are no longer expected to occur remains in equity.
Net gains/(losses) arising on fair value hedges in net interest income during the year were:
| | | | | | |
| | | 2006
£m | | | 2005
£m | |
On hedging instruments | | (460 | ) | | 204 | |
On the hedged items attributable to the hedged risk | | 465 | | | (164 | ) |
Ineffectiveness | | 5 | | | 40 | |
Ineffectiveness recognised in relation to cash flow hedges in net interest income was a loss of £23m (2005: loss of £34m). Ineffectiveness recognised in relation to hedge of net investment was a gain of £13m (2005: loss of £5m).
15 Loans and advances to banks
| | | | | | |
| | | 2006
£m | | | 2005
£m | |
Repayable: | | | | | | |
on demand | | 2,887 | | | 3,929 | |
not more than three months | | 18,809 | | | 15,921 | |
over three months but not more than six months | | 800 | | | 2,006 | |
over six months but not more than one year | | 3,064 | | | 3,169 | |
over one year but not more than three years | | 1,595 | | | 1,852 | |
over three years but not more than five years | | 1,130 | | | 779 | |
over five years but not more than ten years | | 1,012 | | | 1,047 | |
over ten years | | 1,633 | | | 2,406 | |
Total | | 30,930 | | | 31,109 | |
Less: Allowance for impairment (Note 17) | | (4 | ) | | (4 | ) |
Loans and advances to banks | | 30,926 | | | 31,105 | |
| | | | | | | |
By geographical area | | | | | | |
United Kingdom | | 6,229 | | | 4,624 | |
Other European Union | | 8,513 | | | 5,423 | |
United States | | 9,056 | | | 13,267 | |
Africa | | 2,219 | | | 880 | |
Rest of the World | | 4,913 | | | 6,915 | |
Total | | 30,930 | | | 31,109 | |
Less: Allowance for impairment (Note 17) | | (4 | ) | | (4 | ) |
Loans and advances to banks | | 30,926 | | | 31,105 | |
The Group is required to maintain balances with central banks and other regulatory authorities and these amounted to £1,262m at 31st December 2006 (2005: £1,218m).
Information relating to effective interest rates can be found in Note 53.
The geographical analysis is based on the location of the customer to which the lendings are made.
| | |
| 174 | | Barclays PLC Annual Report 2006 |
| |
16 Loans and advances to customers
| | | | | | |
| | | 2006
£m | | | 2005
£m | |
Repayable: | | | | | | |
on demand | | 33,994 | | | 34,945 | |
not more than three months | | 44,728 | | | 44,280 | |
over three months but not more than six months | | 10,092 | | | 11,332 | |
over six months but not more than one year | | 15,904 | | | 21,870 | |
over one year but not more than three years | | 32,559 | | | 31,254 | |
over three years but not more than five years | | 27,868 | | | 27,967 | |
over five years but not more than ten years | | 38,091 | | | 26,840 | |
over ten years | | 82,395 | | | 73,854 | |
Total | | 285,631 | | | 272,342 | |
Less: Allowance for impairment (Note 17) | | (3,331 | ) | | (3,446 | ) |
Loans and advances to customers | | 282,300 | | | 268,896 | |
By geographical area | | | | | | |
United Kingdom | | 170,518 | | | 163,759 | |
Other European Union | | 43,430 | | | 38,923 | |
United States | | 25,677 | | | 22,925 | |
Africa | | 31,691 | | | 33,221 | |
Rest of the World | | 14,315 | | | 13,514 | |
Total | | 285,631 | | | 272,342 | |
| | |
Less: Allowance for impairment (Note 17) | | (3,331 | ) | | (3,446 | ) |
Loans and advances to customers | | 282,300 | | | 268,896 | |
| | |
Loans and advances to customers by industry | | | | | | |
| At 31st December | | 2006
£m | | | 2005
£m | |
Financial services | | 45,954 | | | 43,102 | |
Agriculture, forestry and fishing | | 3,997 | | | 3,785 | |
Manufacturing | | 15,451 | | | 13,779 | |
Construction | | 4,056 | | | 5,020 | |
Property | | 16,528 | | | 16,325 | |
Energy and water | | 6,810 | | | 6,891 | |
Wholesale and retail, distribution and leisure | | 15,490 | | | 17,760 | |
Transport | | 5,586 | | | 5,960 | |
Postal and communication | | 2,180 | | | 1,313 | |
Business and other services | | 29,425 | | | 24,247 | |
Home loans | | 98,172 | | | 89,529 | |
Other personal | | 31,840 | | | 35,543 | |
Finance lease receivables (Note 41) | | 10,142 | | | 9,088 | |
| | 285,631 | | | 272,342 | |
Less: Allowance for impairment (Note 17) | | (3,331 | ) | | (3,446 | ) |
Loans and advances to customers | | 282,300 | | | 268,896 | |
| | |
Barclays PLC Annual Report 2006 | | 175 |
| |
Notes to the accounts
For the year ended 31st December 2006
16 Loans and advances to customers (continued)
Loans and advances to customers in the UK
| | | | |
| | | |
| At 31st December | | 2006
£m | | 2005
£m |
Financial services | | 14,011 | | 11,958 |
Agriculture, forestry and fishing | | 2,307 | | 2,409 |
Manufacturing | | 9,047 | | 8,469 |
Construction | | 2,761 | | 3,090 |
Property | | 10,010 | | 10,547 |
Energy and water | | 2,360 | | 2,701 |
Wholesale and retail distribution and leisure | | 12,951 | | 12,747 |
Transport | | 2,745 | | 2,797 |
Postal and communication | | 899 | | 455 |
Business and other services | | 19,266 | | 15,403 |
Home loans | | 67,687 | | 61,256 |
Other personal | | 22,551 | | 26,724 |
Finance lease receivables | | 3,923 | | 5,203 |
Loans and advances to customers in the UK | | 170,518 | | 163,759 |
Loans and advances to customers outside the UK
| | | | |
| | | |
| At 31st December | | 2006
£m | | 2005
£m |
Financial services | | 31,943 | | 31,144 |
Agriculture, forestry and fishing | | 1,690 | | 1,376 |
Manufacturing | | 6,404 | | 5,310 |
Construction | | 1,295 | | 1,930 |
Property | | 6,518 | | 5,778 |
Energy and water | | 4,450 | | 4,190 |
Wholesale and retail distribution and leisure | | 2,539 | | 5,013 |
Transport | | 2,841 | | 3,163 |
Postal and communication | | 1,281 | | 858 |
Business and other services | | 10,159 | | 8,844 |
Home loans | | 30,485 | | 28,273 |
Other personal | | 9,289 | | 8,819 |
Finance lease receivables | | 6,219 | | 3,885 |
Loans and advances to customers outside the UK | | 115,113 | | 108,583 |
The geographical analysis is based on the location of the customer to which the lendings are made.
Effective interest rates are included in Note 53.
Certain of the Group’s loans and advances are subject to securitisations which are described in Note 34.
| | |
| 176 | | Barclays PLC Annual Report 2006 |
| |
17 Allowance for impairment
The movement in the allowance for impairment is as follows:
| | | | | | |
| | | 2006
£m | | | 2005
£m | |
At beginning of year | | 3,450 | | | 2,637 | |
Acquisitions and disposals | | (23 | ) | | 555 | |
Unwind of discount | | (98 | ) | | (76 | ) |
Exchange and other adjustments | | (153 | ) | | 125 | |
Amounts written off | | (2,174 | ) | | (1,587 | ) |
Recoveries | | 259 | | | 222 | |
Amounts charged against profit | | 2,074 | | | 1,574 | |
At end of year | | 3,335 | | | 3,450 | |
Allowances for loan impairment represent management’s estimate of the losses incurred in the loan portfolios at the balance sheet date. For the retail and small business portfolios, which comprise large numbers of small homogeneous assets with similar risk characteristics, statistical techniques are used to calculate impairment allowances on a portfolio basis. These models contain judgemental inputs. The impairment charge in relation to retail and small business portfolios is £1,809m or 87% (2005: £1,254m or 80%) of the total impairment charge in 2006. For larger accounts, impairment allowances are calculated on an individual basis using discounted expected future cash flows. Subjective judgements are made in this process. Changes in these estimates could result in a change in allowances and have a direct impact on the impairment charge. The impairment charge in relation to larger accounts is £265m or 13% (2005: £320m or 20%) of the total impairment charge in 2006. | |
| Allowance for impairment at 31st December | | 2006
£m | | | 2005
£m | |
United Kingdom | | 2,477 | | | 2,266 | |
Other European Union | | 311 | | | 284 | |
United States | | 100 | | | 130 | |
Africa | | 417 | | | 647 | |
Rest of the World | | 30 | | | 123 | |
Allowance for impairment at 31st December | | 3,335 | | | 3,450 | |
| | |
| Non-performing loans | | 2006
£m | | | 2005
£m | |
Impaired loans | | 4,444 | | | 4,550 | |
Accruing loans which are contractually overdue 90 days or more as to principal or interest | | 598 | | | 609 | |
Restructured loans | | 46 | | | 51 | |
Non-performing loans | | 5,088 | | | 5,210 | |
| | |
Barclays PLC Annual Report 2006 | | 177 |
| |
Notes to the accounts
For the year ended 31st December 2006
18 Available for sale financial investments
| | | | | | |
| | | 2006
£m | | | 2005
£m | |
Debt securities | | 47,912 | | | 50,024 | |
Equity securities | | 1,371 | | | 1,250 | |
Treasury bills and other eligible bills | | 2,420 | | | 2,223 | |
| Available for sale financial investments | | 51,703 | | | 53,497 | |
| | | | | | |
| Movement in available for sale financial investments | | 2006
£m | | | 2005
£m | |
At beginning of year | | 53,497 | | | 48,097 | |
Exchange and other adjustments | | (3,999 | ) | | 1,791 | |
Acquisitions and transfers | | 47,086 | | | 54,556 | |
Disposals (sale and redemption) | | (44,959 | ) | | (50,609 | ) |
Gains/(losses) from changes in fair value recognised in equity | | 162 | | | (248 | ) |
Impairment | | (86 | ) | | (4 | ) |
Amortisation of discounts/premium | | 2 | | | (86 | ) |
| At end of year | | 51,703 | | | 53,497 | |
The following table analyses the book value of securities under IFRS, which are carried at fair value.
| | | | | | | | | | | | | | | | | | | | |
| | | 2006
Available for sale securities | | | | 2005
Available for sale securities |
| | Amortised
cost
£m | | Gross
unrealised
gains
£m | | Gross
unrealised
losses
£m | | | Book
value
£m | | | | Amortised
cost
£m | | Gross
unrealised
gains
£m | | Gross
unrealised
losses
£m | | | Book
value
£m |
Debt securities | | | | | | | | | | | | | | | | | | | | |
–United Kingdom government | | 761 | | – | | (3 | ) | | 758 | | | | 31 | | – | | – | | | 31 |
–Other government | | 12,735 | | 27 | | (175 | ) | | 12,587 | | | | 14,827 | | 83 | | (50 | ) | | 14,860 |
–Other public bodies | | 277 | | 4 | | (1 | ) | | 280 | | | | 216 | | 2 | | (2 | ) | | 216 |
–Mortgage and asset backed securities | | 1,706 | | – | | – | | | 1,706 | | | | 3,062 | | – | | – | | | 3,062 |
–Corporate issuers | | 27,100 | | 22 | | (33 | ) | | 27,089 | | | | 25,597 | | 101 | | (108 | ) | | 25,590 |
–Other issuers | | 5,450 | | 58 | | (16 | ) | | 5,492 | | | | 6,257 | | 17 | | (9 | ) | | 6,265 |
Total debt securities | | 48,029 | | 111 | | (228 | ) | | 47,912 | | | | 49,990 | | 203 | | (169 | ) | | 50,024 |
Equity securities | | 1,047 | | 353 | | (29 | ) | | 1,371 | | | | 1,007 | | 247 | | (4 | ) | | 1,250 |
Treasury bills and other eligible bills | | 2,420 | | – | | – | | | 2,420 | | | | 2,223 | | – | | – | | | 2,223 |
Available for sale financial investments | | 51,496 | | 464 | | (257 | ) | | 51,703 | | | | 53,220 | | 450 | | (173 | ) | | 53,497 |
Gross gains of £354m (2005: £318m) and gross losses of £47m (2005: £198m) have been realised on the sale of available for sale financial investments.
A maturity analysis of available for sale financial investments is included in Note 56.
The basis of determining cost during the calculation of gains and losses on available for sale investments is on an instrument by instrument basis.
| | |
| 178 | | Barclays PLC Annual Report 2006 |
| |
19 Securities borrowing, securities lending, repurchase and reverse repurchase agreements
The following amounts were included in the balance sheet and are reported on a net basis where the Group has the intention and the ability to settle net or realise simultaneously.
| | | | |
| | | 2006
£m | | 2005
£m |
Reverse repurchase agreements and cash collateral on securities borrowed | | | | |
Banks | | 85,336 | | 83,610 |
Customers | | 88,754 | | 76,788 |
Reverse repurchase agreements and cash collateral on securities borrowed | | 174,090 | | 160,398 |
| | | | | |
Repurchase agreements and cash collateral on securities lent | | | | |
Banks | | 79,833 | | 66,939 |
Customers | | 57,123 | | 54,239 |
Repurchase agreements and cash collateral on securities lent | | 136,956 | | 121,178 |
Reverse repurchase agreements and cash collateral on securities borrowed are accounted for as collateralised loans. It is the Group’s policy to seek collateral at the outset equal to 100% to 105% of the loan amount. The level of collateral held is monitored daily and further collateral calls made to bring the level of cash held and the market value of collateral in line with the loan balance.
Under certain transactions, including reverse repurchase agreements and stock borrowing transactions, the Group is allowed to sell or repledge the collateral held. The fair value at the balance sheet date of collateral accepted and repledged to others was as follows:
| | | | |
| | | 2006
£m | | 2005
£m |
| Fair value of securities accepted as collateral under reverse repurchase agreements and stock borrowing transactions which can be repledged or resold | | 279,591 | | 248,010 |
Of which, fair value of securities repledged/transferred to others | | 210,182 | | 203,777 |
20 Other assets
| | | | |
| | | 2006
£m | | 2005
£m |
| Sundry debtors | | 4,298 | | 3,569 |
| Prepayments | | 658 | | 722 |
| Accrued income | | 722 | | 329 |
Reinsurance assets | | 172 | | 114 |
Other assets | | 5,850 | | 4,734 |
Included in the above are balances are £5,065m (2005: £3,848m) expected to be recovered within no more than 12 months after the balance sheet date; and balances of £785m (2005: £886m) expected to be recovered more than 12 months after the balance sheet date.
| | |
Barclays PLC Annual Report 2006 | | 179 |
| |
Notes to the accounts
For the year ended 31st December 2006
21 Current and deferred tax
The components of taxes are as follows:
| | | | | | | | | | |
| | | 2006 | | 2005 | |
| | | Assets
£m | | Liabilities
£m | | Assets
£m | | | Liabilities
£m | |
Current tax | | | | | | | | | | |
United Kingdom | | 420 | | 481 | | – | | | 484 | |
Overseas | | 137 | | 539 | | – | | | 263 | |
Current tax | | 557 | | 1,020 | | – | | | 747 | |
Deferred tax | | | | | | | | | | |
United Kingdom | | 1,613 | | 1,111 | | 1,425 | | | 1,517 | |
Overseas | | 392 | | 412 | | 284 | | | 206 | |
Deferred tax | | 2,005 | | 1,523 | | 1,709 | | | 1,723 | |
|
Deferred taxes are calculated on all temporary differences under the liability method. The movement on the deferred tax account is as follows: | |
| | | | | | | 2006
£m | | | 2005 £m | |
At beginning of year | | | | | | (14 | ) | | 244 | |
| Income statement (charge)/credit | | | | | | (4 | ) | | 85 | |
| Equity | | | | | | | | | | |
Available for sale investments | | | | | | 4 | | | 10 | |
Cash flow hedges | | | | | | 128 | | | (112 | ) |
Share-based payments | | | | | | 24 | | | 101 | |
Other equity movements | | | | | | 48 | | | (24 | ) |
| Acquisitions and disposals | | | | | | 264 | | | (199 | ) |
Exchange and other adjustments | | | | | | 32 | | | (119 | ) |
At end of year | | | | | | 482 | | | (14 | ) |
|
Deferred tax assets and liabilities are attributable to the following items: | |
| | | | | | | 2006
£m | | | 2005 £m | |
Deferred tax liabilities | | | | | | | | | | |
| Accelerated tax depreciation | | | | | | 705 | | | 883 | |
| Available for sale investments | | | | | | 116 | | | 119 | |
| Cash flow hedges | | | | | | – | | | 138 | |
Other | | | | | | 702 | | | 583 | |
Deferred tax liabilities | | | | | | 1,523 | | | 1,723 | |
Deferred tax assets | | | | | | | | | | |
| Pensions and other retirement benefits | | | | | | 622 | | | 609 | |
| Allowance for impairment on loans | | | | | | 69 | | | 41 | |
| Other provisions | | | | | | 436 | | | 342 | |
| Cash flow hedges | | | | | | 91 | | | 44 | |
| Tax losses carried forward | | | | | | 1 | | | 26 | |
| Share-based payments | | | | | | 380 | | | 232 | |
Other | | | | | | 406 | | | 415 | |
Deferred tax assets | | | | | | 2,005 | | | 1,709 | |
Net deferred tax asset/(liability) | | | | | | 482 | | | (14 | ) |
| | | | | | | | | | | |
Disclosed as deferred tax liabilities | | | | | | 282 | | | 700 | |
Disclosed as deferred tax assets | | | | | | 764 | | | 686 | |
Net deferred tax asset/(liability) | | | | | | 482 | | | (14 | ) |
| | |
| 180 | | Barclays PLC Annual Report 2006 |
| |
21 Current and deferred tax (continued)
Deferred tax assets and liabilities are offset if, and only if, there is a legally enforceable right to set off and the balances relate to income tax levied by the same taxation authority on either the same taxable entity or different taxable entities within the same tax group where there is the intention and ability to settle on a net basis or realise the assets and liabilities simultaneously.
The amount of deferred tax liability expected to be settled after more than 12 months is £1,046m (2005: £982m).
The amount of deferred tax asset expected to be recovered after more than 12 months is £1,582m (2005: £1,686m).
The deferred tax assets balance includes £106m (2005: £27m) which is the excess deferred tax assets over deferred tax liabilities in entities which have suffered a loss in either the current or prior year. This is based on management assessment that it is probable that the relevant entities will have taxable profits against which the temporary differences can be utilised.
The deferred tax charge/(credit) in the income statement comprises the following temporary differences:
| | | | | | |
| | | 2006
£m | | | 2005
£m | |
Accelerated tax depreciation | | 120 | | | 130 | |
Pensions and other retirement benefits | | (24 | ) | | 39 | |
Allowance for impairment on loans | | (30 | ) | | (1 | ) |
Other provisions | | (105 | ) | | (133 | ) |
Tax losses carry forward | | 25 | | | (20 | ) |
Available for sale investments | | 8 | | | (52 | ) |
Cash flow hedges | | (14 | ) | | 1 | |
Share-based payments | | (77 | ) | | (115 | ) |
Other | | 101 | | | 66 | |
| | |
Total | | 4 | | | (85 | ) |
Deferred tax assets have not been recognised in respect of the following items: | | | | | | |
| | | 2006
£m |
| | 2005
£m |
|
Deductible temporary differences (gross) | | 395 | | | 340 | |
Unused tax losses (gross) | | 190 | | | 363 | |
Unused tax credits | | 98 | | | 24 | |
The following tax losses expire: £3m in 2007 and £4m in 2009. The other tax losses, tax credits and temporary differences do not expire under current tax legislation. Deferred tax assets have not been recognised in respect of these items because it is not probable that future taxable profit will be available against which the Group can utilise the benefits.
The amount of temporary differences associated with investments in subsidiaries, branches, associates and joint ventures for which deferred tax liabilities have not been recognised is £3,387m (2005: £2,126m).
| | |
Barclays PLC Annual Report 2006 | | 181 |
| |
Notes to the accounts
For the year ended 31st December 2006
22 Investment in associates and joint ventures
| | | | | | | | | | | | | | | | | | |
| Share of net assets | | | | | | | | | | | | | | | | | | |
| | | Associates | | | Joint ventures | | | Total | |
| | | 2006
£m | | | 2005
£m | | | 2006
£m | | | 2005
£m | | | 2006
£m | | | 2005
£m | |
At beginning of year | | 427 | | | 399 | | | 119 | | | 30 | | | 546 | | | 429 | |
Share of results before tax | | 63 | | | 63 | | | (6 | ) | | (12 | ) | | 57 | | | 51 | |
Share of tax | | (10 | ) | | (10 | ) | | (1 | ) | | 4 | | | (11 | ) | | (6 | ) |
Share of post-tax results | | 53 | | | 53 | | | (7 | ) | | (8 | ) | | 46 | | | 45 | |
Dividends paid | | (17 | ) | | (23 | ) | | – | | | – | | | (17 | ) | | (23 | ) |
New investments | | 2 | | | – | | | 7 | | | 81 | | | 9 | | | 81 | |
Acquisitions | | 51 | | | 72 | | | 102 | | | 23 | | | 153 | | | 95 | |
Disposals | | (404 | ) | | (39 | ) | | (72 | ) | | (1 | ) | | (476 | ) | | (40 | ) |
Exchange and other adjustments | | (38 | ) | | (35 | ) | | 5 | | | (6 | ) | | (33 | ) | | (41 | ) |
At end of year | | 74 | | | 427 | | | 154 | | | 119 | | | 228 | | | 546 | |
| | | | | | |
Goodwill included above: | | | | | | | | | | | | | | | | | | |
| | | Associates | | | Joint ventures | | | Total | |
| | | 2006
£m | | | 2005
£m | | | 2006
£m | | | 2005
£m | | | 2006
£m | | | 2005
£m | |
Cost | | | | | | | | | | | | | | | | | | |
At beginning of year | | 122 | | | 122 | | | 83 | | | – | | | 205 | | | 122 | |
Acquisitions | | – | | | – | | | – | | | 83 | | | – | | | 83 | |
Disposals | | (121 | ) | | – | | | – | | | – | | | (121 | ) | | – | |
Transfer | | – | | | – | | | (43 | ) | | – | | | (43 | ) | | – | |
At end of year | | 1 | | | 122 | | | 40 | | | 83 | | | 41 | | | 205 | |
The fair value of the investment in Gabetti Holding SpA, which is listed on the Milan stock exchange, is £16m (2005: £15m).
Disposal of FirstCaribbean International Bank
On 22nd December 2006 the Group disposed of its investment in FirstCaribbean International Bank, its former principal associate, for cash consideration, net of transaction costs of £583m, which, after deducting the Group’s share of its net assets on the date of disposal, resulted in a profit of £247m.
Following this transaction, there were no individually significant associates or joint ventures.
Of the £46m share of post-tax results of associates and joint ventures, FirstCaribbean International Bank contributed £41m (2005: £37m).
| | |
| 182 | | Barclays PLC Annual Report 2006 |
| |
22 Investment in associates and joint ventures (continued)
The table below provides summarised financial information of the Group’s associates and joint ventures (the entities’ entire financial position and results of operations are presented, not the Group’s share).
| | | | | | | | | | | | | | | | | | |
| | | 2006 | | | 2005 | |
| | | FirstCaribbean
International
Bank
£m |
| | Other
associates
£m |
| | Joint
ventures
£m |
| | FirstCaribbean
International
Bank
£m |
| | Other
associates
£m |
| | Joint
ventures
£m |
|
Property, plant and equipment | | – | | | 599 | | | 142 | | | 86 | | | 454 | | | 119 | |
Financial investments | | – | | | 4 | | | 2 | | | 376 | | | 66 | | | 24 | |
Trading portfolio assets | | – | | | 1 | | | – | | | 389 | | | – | | | – | |
Loans to banks and customers | | – | | | 1,378 | | | 797 | | | 4,379 | | | 1,575 | | | 393 | |
Other assets | | – | | | 541 | | | 199 | | | 267 | | | 226 | | | 16 | |
Total assets | | – | | | 2,523 | | | 1,140 | | | 5,497 | | | 2,321 | | | 552 | |
Deposits from banks and customers | | – | | | 1,421 | | | 769 | | | 4,519 | | | 1,527 | | | 369 | |
Trading portfolio liabilities | | – | | | 1 | | | – | | | 115 | | | – | | | – | |
Other liabilities | | – | | | 887 | | | 187 | | | 270 | | | 572 | | | 188 | |
Shareholders’ equity | | – | | | 214 | | | 184 | | | 593 | | | 222 | | | (5 | ) |
Total liabilities | | – | | | 2,523 | | | 1,140 | | | 5,497 | | | 2,321 | | | 552 | |
Net income | | 274 | | | 264 | | | 178 | | | 234 | | | 213 | | | 176 | |
Operating expenses | | (167 | ) | | (167 | ) | | (178 | ) | | (148 | ) | | (161 | ) | | (213 | ) |
Profit/(loss) before tax | | 107 | | | 97 | | | – | | | 86 | | | 52 | | | (37 | ) |
Profit/(loss) after tax | | 96 | | | 90 | | | (2 | ) | | 76 | | | 37 | | | (26 | ) |
The amounts included above are based on accounts made up to 31st December 2006 with the exception of FirstCaribbean International Bank and certain undertakings included within the Other associates category for which the amounts are based on accounts made up to dates not earlier than three months before the balance sheet date.
Other associates in 2006 includes £1,525m (2005: £1,885m) of assets, £1,380m (2005: £1,741m) of liabilities and £25m (2005: £20m) of profit after tax in associates within the Absa Group.
The Group’s share of commitments and contingencies incurred in relation to its joint ventures is £nil (2005: £1m) and its share of contingent liabilities of an associate or joint venture for which it is contingently liable is £nil (2005: £252m).
| | |
Barclays PLC Annual Report 2006 | | 183 |
| |
Notes to the accounts
For the year ended 31st December 2006
23 Goodwill
| | | | | |
| | | 2006
£m | | | 2005
£m |
Net book value | | | | | |
At beginning of year | | 6,022 | | | 4,518 |
Acquisitions | | 390 | | | 1,417 |
Disposals | | (14 | ) | | – |
Exchange and other adjustments | | (306 | ) | | 87 |
At end of year | | 6,092 | | | 6,022 |
Goodwill is reviewed annually for impairment, or more frequently when there are indications that impairment may have occurred. There was no impairment identified in 2006 (2005: £nil). | | | | | |
| | | 2006
£m | | | 2005
£m |
UK Banking | | 2,820 | | | 2,824 |
Barclaycard | | 403 | | | 418 |
International Retail and Commercial Banking | | 1,481 | | | 1,725 |
Barclays Capital | | 72 | | | 89 |
Barclays Global Investors | | 673 | | | 322 |
Barclays Wealth | | 629 | | | 629 |
Head office functions and other operations | | 14 | | | 15 |
Goodwill | | 6,092 | | | 6,022 |
Goodwill is allocated to business operations. The recoverable amount of each operation’s goodwill is based on value-in-use calculations using an appropriate pre-tax cost of equity for the market and associated risk. The principal goodwill relating to UK Banking and International Retail and Commercial Banking are Woolwich and Absa respectively.
Woolwich and Absa future cash flows are based on approved budgets and plans. Woolwich has applied a growth factor of 3% (proxy for inflation) to cash flows for the period 2010 to 2020. Absa has applied a growth rate of 8% to cash flows for the four years from 2010 to 2013 and a rate of 4% for the years from 2014 to 2020.
Both businesses justify the use of longer cash flow projections due to the long-term nature of these businesses within the Barclays Group.
| | |
| 184 | | Barclays PLC Annual Report 2006 |
| |
24 Intangible assets
| | | | | | | | | | | | | | | | | | | | | | | | |
| | | 2006 | |
| | | Internally
generated
software
£m |
| | Other
software
£m |
| | Core
deposit
intangibles
£m |
| | Brands
£m |
| | Customer
lists
£m |
| | Mortgage
servicing
rights
£m |
| | Licences
and other
£m |
| | Total
£m |
|
Cost or valuation | | | | | | | | | | | | | | | | | | | | | | | | |
At 1st January 2006 | | 188 | | | 43 | | | 306 | | | 183 | | | 582 | | | – | | | 139 | | | 1,441 | |
Acquisitions | | – | | | – | | | – | | | – | | | – | | | 114 | | | 2 | | | 116 | |
Additions | | 95 | | | 86 | | | – | | | – | | | – | | | 16 | | | 13 | | | 210 | |
Exchange and other adjustments | | (16 | ) | | (6 | ) | | (64 | ) | | (38 | ) | | (115 | ) | | (8 | ) | | (14 | ) | | (261 | ) |
At 31st December 2006 | | 267 | | | 123 | | | 242 | | | 145 | | | 467 | | | 122 | | | 140 | | | 1,506 | |
Accumulated amortisation and impairment | | | | | | | | | | | | | | | | | | | | | | | | |
At 1st January 2006 | | (90 | ) | | (18 | ) | | (7 | ) | | (9 | ) | | (29 | ) | | – | | | (19 | ) | | (172 | ) |
Amortisation charge | | (29 | ) | | (7 | ) | | (20 | ) | | (16 | ) | | (44 | ) | | (11 | ) | | (9 | ) | | (136 | ) |
Impairment charge | | (2 | ) | | (5 | ) | | – | | | – | | | – | | | – | | | – | | | (7 | ) |
Exchange and other adjustments | | 5 | | | 1 | | | 3 | | | 3 | | | 9 | | | 1 | | | 2 | | | 24 | |
At 31st December 2006 | | (116 | ) | | (29 | ) | | (24 | ) | | (22 | ) | | (64 | ) | | (10 | ) | | (26 | ) | | (291 | ) |
Net book value | | 151 | | | 94 | | | 218 | | | 123 | | | 403 | | | 112 | | | 114 | | | 1,215 | |
| | | | | | | | | | | | | | | | | | | | | | | | |
| | | | | | 2005 | |
| | | | | | Internally
generated
software
£m |
| | Other
software
£m |
| | Core
deposit
intangibles
£m |
| | Brands
£m |
| | Customer
lists
£m |
| | Licences
and other
£m |
| | Total
£m |
|
Cost or valuation | | | | | | | | | | | | | | | | | | | | | | | | |
At 1st January 2005 | | | | | 138 | | | 5 | | | – | | | – | | | 36 | | | 53 | | | 232 | |
Acquisitions/disposals | | | | | – | | | 9 | | | 288 | | | 172 | | | 524 | | | 10 | | | 1,003 | |
Additions | | | | | 68 | | | 23 | | | – | | | – | | | – | | | 82 | | | 173 | |
Exchange and other adjustments | | | | | (18 | ) | | 6 | | | 18 | | | 11 | | | 22 | | | (6 | ) | | 33 | |
At 31st December 2005 | | | | | 188 | | | 43 | | | 306 | | | 183 | | | 582 | | | 139 | | | 1,441 | |
Accumulated amortisation and impairment | | | | | | | | | | | | | | | | | | | | | | | | |
At 1st January 2005 | | | | | (84 | ) | | (3 | ) | | – | | | – | | | (2 | ) | | (4 | ) | | (93 | ) |
Amortisation charge | | | | | (20 | ) | | (3 | ) | | (7 | ) | | (9 | ) | | (27 | ) | | (13 | ) | | (79 | ) |
Impairment charge | | | | | (5 | ) | | (3 | ) | | – | | | – | | | – | | | (1 | ) | | (9 | ) |
Exchange and other adjustments | | | | | 19 | | | (9 | ) | | – | | | – | | | – | | | (1 | ) | | 9 | |
At 31st December 2005 | | | �� | | (90 | ) | | (18 | ) | | (7 | ) | | (9 | ) | | (29 | ) | | (19 | ) | | (172 | ) |
Net book value | | | | | 98 | | | 25 | | | 299 | | | 174 | | | 553 | | | 120 | | | 1,269 | |
Impairment charges on internally generated and other software reflect impairment of certain capitalised IT assets following a review of the future economic benefits likely to be generated by them.
Impairment charges detailed above have been included within other operating expenses.
| | |
Barclays PLC Annual Report 2006 | | 185 |
| |
Notes to the accounts
For the year ended 31st December 2006
25 Property, plant and equipment
| | | | | | | | | | | | | | | | | | | | | | | | |
| | | 2006 | | | 2005 | |
| | | Property
£m |
| | Equipment
£m |
| | Operating
leased
assets
£m |
| | Total
£m |
| | Property
£m |
| | Equipment
£m |
| | Operating
leased
assets
£m |
| | Total
£m |
|
| | | | | | | | |
Cost | | | | | | | | | | | | | | | | | | | | | | | | |
At 1st January | | 2,450 | | | 2,541 | | | 365 | | | 5,356 | | | 2,303 | | | 2,026 | | | 361 | | | 4,690 | |
Acquisitions and disposals | | – | | | – | | | – | | | – | | | 126 | | | 159 | | | – | | | 285 | |
Additions | | 180 | | | 475 | | | – | | | 655 | | | 125 | | | 463 | | | – | | | 588 | |
Disposals | | (422 | ) | | (382 | ) | | – | | | (804 | ) | | (80 | ) | | (130 | ) | | – | | | (210 | ) |
Fully depreciated assets written off | | (1 | ) | | (89 | ) | | – | | | (90 | ) | | (1 | ) | | (1 | ) | | – | | | (2 | ) |
Exchange and other adjustments | | (53 | ) | | (116 | ) | | – | | | (169 | ) | | (23 | ) | | 24 | | | 4 | | | 5 | |
| | | | | | | | |
At 31st December | | 2,154 | | | 2,429 | | | 365 | | | 4,948 | | | 2,450 | | | 2,541 | | | 365 | | | 5,356 | |
| | | | | | | | |
Accumulated depreciation and impairment | | | | | | | | | | | | | | | | | | | | | | | | |
At 1st January | | (1,022 | ) | | (1,575 | ) | | (5 | ) | | (2,602 | ) | | (978 | ) | | (1,429 | ) | | (1 | ) | | (2,408 | ) |
Acquisitions and disposals | | – | | | – | | | – | | | – | | | (1 | ) | | (1 | ) | | – | | | (2 | ) |
Depreciation charge | | (118 | ) | | (335 | ) | | (2 | ) | | (455 | ) | | (92 | ) | | (268 | ) | | (2 | ) | | (362 | ) |
Impairment | | (14 | ) | | – | | | – | | | (14 | ) | | – | | | – | | | – | | | – | |
Disposals | | 148 | | | 341 | | | – | | | 489 | | | 20 | | | 113 | | | – | | | 133 | |
Fully depreciated assets written off | | 1 | | | 89 | | | – | | | 90 | | | 1 | | | 1 | | | – | | | 2 | |
Exchange and other adjustments | | 12 | | | 26 | | | (2 | ) | | 36 | | | 28 | | | 9 | | | (2 | ) | | 35 | |
| | | | | | | | |
At 31st December | | (993 | ) | | (1,454 | ) | | (9 | ) | | 2,456 | | | (1,022 | ) | | (1,575 | ) | | (5 | ) | | (2,602 | ) |
| | | | | | | | |
Net book value | | 1,161 | | | 975 | | | 356 | | | 2,492 | | | 1,428 | | | 966 | | | 360 | | | 2,754 | |
Operating leased assets represent assets such as plant and equipment leased to customers under operating leases.
Certain of the Group’s equipment is held on finance leases. See Note 41.
Impairment of £14m follows a review of the future use of an existing office building in our UK property portfolio. In 2007 the freehold of the building will be disposed of by either a short- or long-term leaseback, depending on the conclusions of the review. Consequently the value has been written down to fair value, less cost of sale.
The carrying value of property on transition to IFRS was the deemed cost. The following table shows the historical cost of property:
| | | | | | |
| | | 2006
£m | | | 2005
£m | |
| | |
Historical cost of property | | | | | | |
At cost | | 1,982 | | | 2,257 | |
Accumulated depreciation and impairment | | (958 | ) | | (1,050 | ) |
| | |
Net book value | | 1,024 | | | 1,207 | |
| | |
| 186 | | Barclays PLC Annual Report 2006 |
| |
26 Deposits from banks
| | | | |
| | | 2006
£m | | 2005
£m |
| | |
Repayable | | | | |
on demand | | 19,163 | | 13,924 |
no more than three months | | 55,534 | | 54,620 |
over three months but not more than six months | | 1,418 | | 2,488 |
over six months but not more than one year | | 891 | | 1,168 |
over one year but not more than three years | | 593 | | 442 |
over three years but not more than five years | | 1,406 | | 725 |
over five years but not more than ten years | | 367 | | 1,288 |
over ten years | | 190 | | 472 |
Deposits from banks | | 79,562 | | 75,127 |
| | |
By geographical area | | | | |
United Kingdom | | 14,292 | | 7,307 |
Other European Union | | 27,521 | | 23,496 |
United States | | 5,140 | | 7,418 |
Africa | | 4,508 | | 4,192 |
Rest of the World | | 28,101 | | 32,714 |
Deposits from banks | | 79,562 | | 75,127 |
Other time deposits in the United Kingdom and United States are mostly over £50,000.
Deposits in offices in the United Kingdom from non-residents amounted to £41,762m (2005: £49,286m).
For details on the effective rate of interest please refer to Note 53.
| | |
Barclays PLC Annual Report 2006 | | 187 |
| |
Notes to the accounts
For the year ended 31st December 2006
27 Customer accounts
| | | | |
| | | 2006 £m | | 2005 £m |
Repayable | | | | |
on demand | | 153,642 | | 144,015 |
no more than three months | | 89,079 | | 72,590 |
over three months but not more than six months | | 5,594 | | 9,282 |
over six months but not more than one year | | 3,604 | | 2,606 |
over one year but not more than three years | | 1,655 | | 3,072 |
over three years but not more than five years | | 1,436 | | 1,503 |
over five years but not more than ten years | | 807 | | 2,223 |
over ten years | | 937 | | 3,393 |
Customer accounts | | 256,754 | | 238,684 |
By geographical area | | | | |
United Kingdom | | 170,120 | | 153,686 |
Other European Union | | 21,260 | | 19,038 |
United States | | 17,903 | | 16,690 |
Africa | | 27,205 | | 29,866 |
Rest of the World | | 20,266 | | 19,404 |
Customer accounts | | 256,754 | | 238,684 |
In offices in the United Kingdom: | | | | |
Current and Demand accounts – interest free | | 25,650 | | 22,980 |
Current and Demand accounts – interest bearing | | 31,769 | | 28,416 |
Savings accounts | | 62,745 | | 57,715 |
Other time deposits – retail | | 36,110 | | 35,142 |
Other time deposits – wholesale | | 53,733 | | 42,967 |
Total repayable in offices in the United Kingdom | | 210,007 | | 187,220 |
In offices outside the United Kingdom: | | | | |
Current and Demand accounts – interest free | | 2,169 | | 2,300 |
Current and Demand accounts – interest bearing | | 17,626 | | 20,494 |
Savings accounts | | 3,041 | | 3,230 |
Other time deposits | | 23,911 | | 25,440 |
Total repayable in offices outside the United Kingdom | | 46,747 | | 51,464 |
Deposits in offices in the United Kingdom received from non-residents amounted to £40,291m (2005: £33,309m).
Other time deposits in the United Kingdom and the United States are mostly over £50,000.
For details on the effective rate of interest please refer to Note 53.
28 Financial liabilities designated at fair value
| | | | | | | | |
| | | 2006 | | 2005 |
| | | Fair value
£m | | Contractual
amount due
on maturity
£m | | Fair value
£m | | Contractual
amount due
on maturity
£m |
Financial liabilities designated at fair value | | | | | | | | |
Debt securities | | 32,261 | | 37,393 | | 25,951 | | 26,260 |
Deposits | | 19,990 | | 20,465 | | 7,434 | | 7,437 |
Other | | 1,736 | | 2,913 | | – | | – |
Total financial liabilities designated at fair value | | 53,987 | | 60,771 | | 33,385 | | 33,697 |
Financial liabilities designated at fair value include certain financial instruments that pay out the higher of a guaranteed amount or a notional plus a performance related amount.
There were no significant gains or losses attributable to changes in own credit risk for financial liabilities designated at fair value in 2006 (2005: £nil).
| | |
| 188 | | Barclays PLC Annual Report 2006 |
| |
29 Debt securities in issue
| | | | |
| | | 2006
£m | | 2005
£m |
Bonds and medium-term notes repayable: | | | | |
on demand | | – | | 14 |
not more than three months | | 578 | | 42 |
over three months but not more than six months | | 311 | | 3,571 |
over six months but not more than one year | | 991 | | 2,628 |
over one year but not more than three years | | 5,243 | | 5,626 |
over three years but not more than five years | | 2,187 | | 1,725 |
over five years but not more than ten years | | 1,394 | | 299 |
over ten years | | 4,848 | | 7,256 |
| | | 15,552 | | 21,161 |
Other debt securities in issue repayable: | | | | |
on demand | | 17 | | 880 |
not more than three months | | 70,227 | | 54,070 |
over three months but not more than six months | | 8,358 | | 10,414 |
over six months but not more than one year | | 4,320 | | 6,149 |
over one year but not more than three years | | 5,165 | | 3,169 |
over three years but not more than five years | | 1,611 | | 1,151 |
over five years but not more than ten years | | 2,623 | | 7 |
over ten years | | 3,264 | | 6,327 |
| | | 95,585 | | 82,167 |
Debt securities in issue | | 111,137 | | 103,328 |
Debt securities in issue at 31st December 2006 included certificates of deposit of £52,800m (2005: £43,109m) and commercial paper of £26,546m (2005: £28,275m).
Debt securities in issue included amounts raised from the securitisations, which are described in Note 34.
The average interest rate during 2006 for commercial paper was 4.9% (2005: 3.4%) and for negotiable certificates of deposits was 5.1% (2005: 3.5%).
30 Other liabilities
| | | | |
| | | 2006
£m | | 2005
£m |
Obligations under finance leases (Note 41) | | 92 | | 289 |
Sundry creditors | | 4,118 | | 6,131 |
Accruals and deferred income | | 6,127 | | 4,711 |
Other liabilities | | 10,337 | | 11,131 |
Included in the above are balances of £9,265 (2005: £8,998m) expected to be settled within no more than 12 months after the balance sheet date; and balances of £1,072m (2005: £2,133m) expected to be settled more than 12 months after the balance sheet date.
Accruals and deferred income included £107m (2005: £113m) in relation to deferred income from investment contracts and £822m (2005: £819m) in relation to deferred income from insurance contracts.
| | |
Barclays PLC Annual Report 2006 | | 189 |
| |
Notes to the accounts
For the year ended 31st December 2006
31 Insurance assets and liabilities
Insurance assets
Reinsurance assets are £172m (2005: £114m) and relate principally to the Group’s long-term business. Reinsurers’ share of provisions relating to the Group’s short-term business are £82m (2005: £15m). The reinsurance assets expected to be recovered after more than one year are £92m (2005: £99m).
Insurance contract liabilities including unit-linked liabilities
Insurance liabilities comprise the following:
| | | | |
| | | 2006
£m | | 2005
£m |
| | |
Insurance contract liabilities: | | | | |
– linked liabilities | | 1,591 | | 1,532 |
– non-linked liabilities | | 2,121 | | 2,187 |
Provision for claims | | 166 | | 48 |
Insurance contract liabilities including unit-linked liabilities | | 3,878 | | 3,767 |
Insurance contract liabilities relate principally to the Group’s long-term business. Insurance contract liabilities associated with the Group’s short-term non-life business are £198m (2005: £133m).
Claims development
The amount and timing of claims payments is normally within one year.
Movements in insurance liabilities and reinsurance assets
Movements in insurance assets and insurance contract liabilities were as follows:
| | | | | | | | | | | | | | | | |
| | | 2006 | | 2005 | |
| | | Gross
£m | | Reinsurance
£m | | | Net
£m | | Gross
£m | | | Reinsurance
£m | | | Net
£m | |
At beginning of year | | 3,767 | | (114 | ) | | 3,653 | | 3,596 | | | (109 | ) | | 3,487 | |
Acquisitions | | – | | – | | | – | | 252 | | | (29 | ) | | 223 | |
Change in year | | 111 | | (58 | ) | | 53 | | (81 | ) | | 24 | | | (57 | ) |
At end of year | | 3,878 | | (172 | ) | | 3,706 | | 3,767 | | | (114 | ) | | 3,653 | |
Assumptions used to measure insurance liabilities
The assumptions that have the greatest effect on the measurement of the amounts recognised above, and the processes used to determine them were as follows:
Long-term business – linked and non-linked
Mortality – mortality estimates are based on standard industry and national mortality tables, adjusted where appropriate to reflect the Group’s own experience. A margin is added to ensure prudence – for example, future mortality improvements for annuity business.
Renewal expenses level and inflation – expense reserves are a small part of overall insurance liabilities, however, increases in expenses caused by unanticipated inflation or other unforeseen factors could lead to expense reserve increases. Expenses are therefore set using prudent assumptions. Initial renewal expense levels are set by considering expense forecasts for the business and, where appropriate, building in a margin to allow for the increasing burden of fixed costs on the UK closed life book of business. The inflation assumption is set by adding a margin to the market rate of inflation implied by index-linked gilt yields.
Short-term business
Short-term business – for single premium policies the proportion of unearned premiums is calculated based on estimates of the frequency and severity of incidents.
Changes in assumptions
Sensitivity analysis regarding changes in these assumptions are described under the heading ‘Sensitivity Analysis’ on page 202. There have been no changes in assumptions in 2006 that have had a material effect on the financial statements.
| | |
| 190 | | Barclays PLC Annual Report 2006 |
| |
31 Insurance assets and liabilities (continued)
Uncertainties associated with cash flows related to insurance contracts and risk management activities
Long-term insurance contracts (linked and non-linked)
For long-term insurance contracts where death is the insured risk, the most significant factors that could detrimentally affect the frequency and severity of claims are the incidence of disease, such as AIDS, or general changes in lifestyle, such as in eating, exercise and smoking. Where survival is the insured risk, advances in medical care and social conditions are the key factors that increase longevity.
The Group manages its exposure to risk by operating in part as a unit-linked business, prudent product design, applying strict underwriting criteria, transferring risk to reinsurers, managing claims and establishing prudent reserves.
Short-term insurance contracts
For payment protection contracts where inability to make payments under a loan contract is the insured risk, the most significant factors are the health of the policyholder and the possibility of unemployment which depends upon, among other things, long-term and short-term economic factors. The Group manages its exposure to such risks through prudent product design, efficient claims management, prudent reserving methodologies and bases, regular product, economic and market reviews and regular adequacy tests on the size of the reserves.
Absa insures property and motor vehicles, for which the most significant factors that could effect the frequency and severity of claims are climatic change and crime. Absa manages its exposure to risk by diversifying insurance risks accepted and transferring risk to reinsurers.
Sensitivity analysis
The following table presents the sensitivity of the level of insurance contract liabilities disclosed in this note to movements in the actuarial assumptions used to calculate them. The percentage change in variable is applied to a range of existing actuarial modelling assumptions to derive the possible impact on net profit after tax. The disclosure is not intended to explain the impact of a percentage change in the insurance assets and liabilities disclosed above.
| | | | | | | | |
| | | 2006 | | 2005 |
| | | Change in
variable
% | | Net profit
after tax
impact
£m | | Change in
variable
% | | Net profit
after tax
impact
£m |
Long-term insurance contracts: | | | | | | | | |
Improving mortality (annuitants only) | | 10 | | 23 | | 10 | | 19 |
Worsening of mortality (assured lives only) | | 10 | | 25 | | 10 | | 28 |
Worsening of base renewal expense level | | 20 | | 23 | | 20 | | 20 |
Worsening of expense inflation rate | | 10 | | 9 | | 10 | | 5 |
Short-term insurance contracts: | | | | | | | | |
Worsening of claim expense assumptions | | 10 | | 9 | | 10 | | 13 |
Any change in net profit after tax would result in a corresponding increase or decrease in shareholders’ equity.
The above analyses are based on a change in a single assumption while holding all other assumptions constant. In practice this is unlikely to occur.
Options and guarantees
The Group’s contracts do not contain options or guarantees that could confer material risk.
| | |
Barclays PLC Annual Report 2006 | | 191 |
| |
Notes to the accounts
For the year ended 31st December 2006
32 Subordinated liabilities
Subordinated liabilities comprise dated and undated loan capital as follows:
| | | | | | | |
| | | Notes | | | 2006
£m | | 2005
£m |
Undated loan capital | | (a | ) | | 5,422 | | 4,397 |
Dated loan capital | | (b | ) | | 8,364 | | 8,066 |
(a) Undated loan capital | | | | | 13,786 | | 12,463 |
| | | |
| | | Notes | | | 2006
£m | | 2005
£m |
Non-convertible | | | | | | | |
The Bank | | | | | | | |
6% Callable Perpetual Core tier One Notes | | (a,n | ) | | 404 | | 432 |
6.86% Callable Perpetual Core tier One Notes (US$1,000m) | | (a,n | ) | | 571 | | 623 |
5.3304% Step-up Callable Perpetual Reserve Capital Instruments | | (b,o | ) | | 501 | | – |
5.926% Step-up Callable Perpetual Reserve Capital Instruments (US$1,350m) | | (c,p | ) | | 690 | | – |
Junior Undated Floating Rate Notes (US$121m) | | (d,q | ) | | 62 | | 71 |
Undated Floating Rate Primary Capital Notes Series 3 | | (d,r | ) | | 146 | | 147 |
9.875% Undated Subordinated Notes | | (e,s | ) | | 319 | | 319 |
9.25% Perpetual Subordinated Bonds (ex-Woolwich plc) | | (f,t | ) | | 178 | | 186 |
9% Permanent Interest Bearing Capital Bonds | | (g,u | ) | | 102 | | 102 |
7.125% Undated Subordinated Notes | | (h,v | ) | | 550 | | 573 |
6.875% Undated Subordinated Notes | | (i,w | ) | | 656 | | 670 |
6.375% Undated Subordinated Notes | | (j,x | ) | | 481 | | 498 |
6.125% Undated Subordinated Notes | | (k,y | ) | | 571 | | 611 |
6.5% Undated Subordinated Notes (FFr 1,000m) | | (l,z | ) | | 105 | | 107 |
5.03% Reverse Dual Currency Undated Subordinated Loan (Yen 8,000m) | | (m,aa | ) | | 34 | | 23 |
5% Reverse Dual Currency Undated Subordinated Loan (Yen 12,000m) | | (m,aa | ) | | 52 | | 35 |
Undated loan capital – non-convertible | | | | | 5,422 | | 4,397 |
Security and subordination
None of the undated loan capital of the Bank is secured.
The Junior Undated Floating Rate Notes (the ‘Junior Notes’) rank behind the claims against the Bank of depositors and other unsecured unsubordinated creditors and holders of dated loan capital.
All other issues of the Bank’s undated loan capital rank pari passu with each other and behind the claims of the holders of the Junior Notes, except for the 6% and 6.86% Callable Perpetual Core tier One Notes (the ‘TONs’) and the 5.3304% and 5.926% Step-up Callable Perpetual Reserve Capital Instruments (the ‘RCIs’) (such issues, excluding the TONs and the RCIs, being the ‘Undated Notes and Loans’).
The TONs and the RCIs rank pari passu with each other and behind the claims of the holders of the Undated Notes and Loans.
| | |
| 192 | | Barclays PLC Annual Report 2006 |
| |
32 Subordinated liabilities (continued)
Interest
Notes
| (a) | These TONs bear a fixed rate of interest until 2032. After that date, in the event that the TONs are not redeemed, the TONs will bear interest at rates fixed periodically in advance, based on London interbank rates. |
| (b) | These RCIs bear a fixed rate of interest until 2036. After that date, in the event that the RCIs are not redeemed, the RCIs will bear interest at rates fixed periodically in advance, based on London interbank rates. |
| (c) | These RCIs bear a fixed rate of interest until 2016. After that date, in the event that the RCIs are not redeemed, the RCIs will bear interest at rates fixed periodically in advance, based on London interbank rates. |
| (d) | These Notes bear interest at rates fixed periodically in advance, based on London interbank rates. |
| (e) | These Notes bear a fixed rate of interest until 2008. After that date, in the event that the Notes are not redeemed, the coupon will be reset to a fixed margin over a reference gilt rate for a further period of five years. |
| (f) | These Notes bear a fixed rate of interest until 2021. After that date, in the event that the Notes are not redeemed, the Notes will be reset to a fixed margin over a reference gilt rate for a further period of five years. |
| (g) | The interest rate on these Notes is fixed for the life of this issue. |
| (h) | These Notes bear a fixed rate of interest until 2020. After that date, in the event that the Notes are not redeemed, the coupon will be reset to a fixed margin over a reference gilt rate for a further period of five years. |
| (i) | These Notes bear a fixed rate of interest until 2015. After that date, in the event that the Notes are not redeemed, the coupon will be reset to a fixed margin over a reference gilt rate for a further period of five years. |
| (j) | These Notes bear a fixed rate of interest until 2017. After that date, in the event that the Notes are not redeemed, the coupon will be reset to a fixed margin over a reference gilt rate for a further period of five years. |
| (k) | These Notes bear a fixed rate of interest until 2027. After that date, in the event that the Notes are not redeemed, the coupon will be reset to a fixed margin over a reference gilt rate for a further period of five years. |
| (l) | These Notes bear a fixed rate of interest until 2009. After that date, in the event that the Notes are not redeemed, the Notes will bear interest at rates fixed periodically in advance based on European interbank rates. |
| (m) | These Loans bear a fixed rate of interest until 2028 based on a US Dollar principal amount, but the interest payments have been swapped, resulting in a Yen interest rate payable, which is fixed periodically in advance based on London interbank rates. After that date, in the event that the Loans are not redeemed, the Loans will bear Yen interest rates fixed periodically in advance, based on London interbank rates. |
The Bank is not obliged to make a payment of interest on its Undated Notes and Loans excluding the 9.25% Perpetual Subordinated Bonds if, in the preceding six months, a dividend has not been declared or paid on any class of shares of Barclays PLC or, in certain cases, any class of preference shares of the Bank. The Bank is not obliged to make a payment of interest on its 9.25% Perpetual Subordinated Bonds if, in the immediately preceding 12 months interest period, a dividend has not been paid on any class of its share capital. Interest not so paid becomes payable in each case if such a dividend is subsequently paid or in certain other circumstances. During the year, the Bank declared and paid dividends on its ordinary shares and on all classes of preference shares.
No payment of principal or any interest may be made unless the Bank satisfies a specified solvency test.
The Bank may elect to defer any payment of interest on the RCIs ((b) and (c) above). Any such deferred payment of interest must be paid on the earlier of (i) the date of redemption of the RCIs, and (ii) the coupon payment date falling on or nearest to the tenth anniversary of the date of deferral of such payment. Whilst such deferral is continuing, neither the Bank nor Barclays PLC may declare or pay a dividend, subject to certain exceptions, on any of its ordinary shares or Preference Shares.
The Bank may elect to defer any payment of interest on the TONs if it determines that it is, or such payment would result in it being, in non-compliance with capital adequacy requirements and policies of the FSA. Any such deferred payment of interest will only be payable on a redemption of the TONs. Until such time as the Bank next makes a payment of interest on the TONs, neither the Bank nor Barclays PLC may (a) declare or pay a dividend, subject to certain exceptions, on any of their respective ordinary shares or Preference Shares, or make payments of interest in respect of the Bank’s Reserve Capital Instruments and (b) certain restrictions on the redemption, purchase or reduction of their respective share capital and certain other securities also apply.
| | |
Barclays PLC Annual Report 2006 | | 193 |
| |
Notes to the accounts
For the year ended 31st December 2006
32 Subordinated liabilities (continued)
Repayment
Notes
| (n) | These TONs are repayable, at the option of the Bank, in whole on any coupon payment date falling in or after June 2032. |
| (o) | These RCIs are repayable, at the option of the Bank, in whole on any coupon payment date falling in or after December 2036. |
| (p) | These RCIs are repayable, at the option of the Bank, in whole on any coupon payment date falling in or after December 2016. |
| (q) | These Notes are repayable, at the option of the Bank, in whole or in part on any interest payment date. |
| (r) | These Notes are repayable, at the option of the Bank, in whole on any interest payment date. |
| (s) | These Notes are repayable, at the option of the Bank, in whole in 2008, or on any fifth anniversary thereafter. |
| (t) | These Bonds are repayable, at the option of the Bank, in whole in 2021, or on any fifth anniversary thereafter. |
| (u) | These Bonds are repayable, at the option of the Bank, in whole at any time. |
| (v) | These Notes are repayable, at the option of the Bank, in whole in 2020, or on any fifth anniversary thereafter. |
| (w) | These Notes are repayable, at the option of the Bank, in whole in 2015, or on any fifth anniversary thereafter. |
| (x) | These Notes are repayable, at the option of the Bank, in whole in 2017, or on any fifth anniversary thereafter. |
| (y) | These Notes are repayable at the option of the Bank, in whole in 2027, or on any fifth anniversary thereafter. |
| (z) | These Notes are repayable, at the option of the Bank, in whole in 2009, or on any fifth anniversary thereafter. |
| (aa) | These Loans are repayable, at the option of the Bank, in whole in 2028, or on any fifth anniversary thereafter. |
In addition, each issue of undated loan capital is repayable, at the option of the Bank, in whole for certain tax reasons, either at any time, or on an interest payment date. There are no events of default except non-payment of principal or mandatory interest.
Any repayments require the prior approval of the FSA.
All issues of undated loan capital have been made in the eurocurrency market and/or under Rule 144A, and no issues have been registered under the US Securities Act of 1933.
| | |
| 194 | | Barclays PLC Annual Report 2006 |
| |
32 Subordinated liabilities (continued)
(b) Dated loan capital
Dated loan capital, issued by the Bank for the development and expansion of the Group’s business and to strengthen its capital base, by Barclays Bank Spain SA (Barclays Spain), Barclays Bank of Botswana Ltd (BBB) and Barclays Bank Zambia PLC (Barclays Zambia) to enhance their respective capital bases and by Absa and Barclays Bank of Ghana Ltd (BBG) for general corporate purposes, comprise:
| | | | | | |
| | | Notes | | 2006
£m | | 2005
£m |
Non-convertible | | | | | | |
| The Bank | | | | | | |
Floating Rate Unsecured Capital Loan Stock 2006 | | | | – | | 2 |
7.4% Subordinated Notes 2009 (US$400m) | | (a) | | 204 | | 233 |
Subordinated Fixed to CMS-Linked Notes 2009 (€31m) | | (b) | | 21 | | 21 |
12% Unsecured Capital Loan Stock 2010 | | (a) | | 27 | | 26 |
Floating Rate Subordinated Step-up Callable Notes 2011 (US$100m) | | | | – | | 58 |
Floating Rate Subordinated Step-up Callable Notes 2011 (US$125m) | | | | – | | 73 |
Floating Rate Subordinated Notes 2011 (US$400m) | | | | – | | 235 |
5.75% Subordinated Notes 2011 (€1,000m) | | (a) | | 676 | | 783 |
5.25% Subordinated Notes 2011 (€250m) (ex-Woolwich plc) | | (a) | | 186 | | 200 |
Fixed/Floating Rate Subordinated Notes 2011 (Yen 5,000m) | | | | – | | 25 |
Floating Rate Subordinated Notes 2012 | | (b,n) | | 301 | | 298 |
Callable Subordinated Floating Rate Notes 2012 | | (b,n) | | 44 | | 44 |
Step-up Callable Floating Rate Subordinated Bonds 2012 (ex-Woolwich plc) | | (b,n) | | 151 | | 150 |
Callable Subordinated Floating Rate Notes 2012 (US$150m) | | (b,n) | | 77 | | 88 |
Floating Rate Subordinated Notes 2012 (US$100m) | | (b,n) | | 51 | | 58 |
Capped Floating Rate Subordinated Notes 2012 (US$100m) | | (b,n) | | 51 | | 58 |
Floating Rate Subordinated Notes 2013 (US$1,000m) | | (b,n) | | 513 | | 585 |
5.015% Subordinated Notes 2013 (US $150m) | | (a) | | 77 | | 88 |
4.875% Subordinated Notes 2013 (€750m) | | (a) | | 540 | | 565 |
5.5% Subordinated Notes 2013 (DM 500m) | | (d,n) | | 179 | | 183 |
Floating Rate Subordinated Step-up Callable Notes 2013 (Yen 5,500m) | | (b,n) | | 24 | | 27 |
Floating Rate Subordinated Notes 2013 (AU$150m) | | (c,n) | | 61 | | 65 |
5.93% Subordinated Notes 2013 (AU $100m) | | (e,n) | | 41 | | 43 |
Callable Floating Rate Subordinated Notes 2015 (US$1,500m) | | (b,n) | | 767 | | 877 |
4.38% Fixed Rate Subordinated Notes 2015 (US$75m) | | (a) | | 37 | | 42 |
4.75% Fixed Rate Subordinated Notes 2015 (US$150m) | | (a) | | 76 | | 86 |
Floating Rate Subordinated Step-up Callable Notes 2016 (US$750m) | | (b,n) | | 382 | | – |
Callable Floating Rate Subordinated Notes 2016 (€1,250m) | | (b,n) | | 844 | | – |
Callable Floating Rate Subordinated Notes 2017 (US$500m) | | (b,n) | | 255 | | 292 |
10.125% Subordinated Notes 2017 (ex-Woolwich plc) | | (k,n) | | 113 | | 115 |
Floating Rate Subordinated Notes 2018 (€40m) | | (b) | | 27 | | 27 |
Floating Rate Subordinated Notes 2019 (€50m) | | (b) | | 32 | | 33 |
Callable Fixed/Floating Rate Subordinated Notes 2019 (€1,000m) | | (l) | | 696 | | 742 |
9.5% Subordinated Bonds 2021 (ex-Woolwich plc) | | (a) | | 290 | | 297 |
Subordinated Floating Rate Notes 2021 (€100m) | | (b) | | 66 | | 67 |
Subordinated Floating Rate Notes 2022 (€50m) | | (b) | | 34 | | 34 |
Subordinated Floating Rate Notes 2023 (€50m) | | (b) | | 34 | | 34 |
5.75% Fixed Rate Subordinated Notes 2026 | | (a) | | 608 | | 631 |
5.4% Reverse Dual Currency Subordinated Loan 2027 (Yen 15,000m) | | (m) | | 66 | | 46 |
6.33% Subordinated Notes 2032 | | (a) | | 50 | | 55 |
Subordinated Floating Rate Notes 2040 (€100m) | | (b) | | 67 | | 69 |
| Barclays Bank SA, Spain (Barclays Spain) | | | | | | |
Subordinated Floating Rate Capital Notes 2011 (€50m) | | (b) | | 22 | | 27 |
| Absa | | | | | | |
14.25% Subordinated Callable Notes 2014 (ZAR 3,100m) | | (f,n) | | 269 | | 318 |
10.75% Subordinated Callable Notes 2015 (ZAR 1,100m) | | (g,n) | | 89 | | 113 |
Subordinated Callable Notes 2015 (ZAR 400m) | | (h,n) | | 29 | | 41 |
8.75% Subordinated Callable Notes 2017 (ZAR 1,500m) | | (i,n) | | 113 | | 174 |
8.1% Subordinated Callable Notes 2020 (ZAR 2,000m) | | (j,n) | | 143 | | – |
| Barclays Bank of Ghana Ltd (BBG) | | | | | | |
14% Fixed Rate BBG Subordinated Callable Notes 2016 (GHC 100,000m) | | (a,n) | | 6 | | – |
Dated loan capital – non-convertible | | | | 8,339 | | 8,028 |
| | |
Barclays PLC Annual Report 2006 | | 195 |
| |
Notes to the accounts
For the year ended 31st December 2006
32 Subordinated liabilities (continued)
| | | | | | |
| | | Notes | | 2006
£m | | 2005
£m |
Convertible | | | | | | |
| Barclays Bank of Botswana (BBB) | | | | | | |
Subordinated Unsecured Floating Rate Capital Notes 2014 (BWP 100m) | | (n,o) | | 9 | | 11 |
| Barclays Bank Zambia PLC (Barclays Zambia) | | | | | | |
Subordinated Unsecured Floating Rate Capital Notes 2015 (ZMK 30,000m) | | (n,p) | | 5 | | 5 |
| Absa | | | | | | |
Redeemable cumulative option-holding preference shares (ZAR 147m) | | (q) | | 11 | | 22 |
| | | |
| Total convertible | | | | 25 | | 38 |
Repayable | | | | | | |
not more than one year | | | | – | | 2 |
over one year but not more than five years | | | | 1,147 | | 302 |
over five years | | | | 7,217 | | 7,762 |
| | | |
| Total repayable | | | | 8,364 | | 8,066 |
None of the Group’s dated loan capital is secured. The debt obligations of the Bank, Barclays Spain, BBG, BBB, Barclays Zambia and Absa rank ahead of the interests of holders of their equity. Dated loan capital of the Bank, Barclays Spain, BBG, BBB, Barclays Zambia and Absa has been issued on the basis that the claims there under are subordinated to the respective claims of their depositors and other unsecured unsubordinated creditors.
Interest
Notes
| (a) | The interest rates on these Notes are fixed for the life of those issues. |
| (b) | These Notes bear interest at rates fixed periodically in advance based on London or European interbank rates. |
| (c) | These Notes bear interest at rates fixed periodically in advance based on Sydney Bill of exchange rates. |
| (d) | These Notes bear a fixed rate of interest until 2008. After that date, in the event that the Notes are not redeemed, the Notes will bear interest at rates fixed periodically in advance based on London interbank rates. |
| (e) | These Notes bear a fixed rate of interest until 2008. After that date, in the event that the Notes are not redeemed, the Notes will bear interest at rates fixed periodically in advance based on Sydney Bill of exchange rates. |
| (f) | These Notes bear a fixed rate of interest until 2009. After that date, in the event that the Notes are not redeemed, the coupon will be reset to a fixed margin over a reference rate for a further period of five years. |
| (g) | These Notes bear a fixed rate of interest until 2010. After that date, in the event that the Notes are not redeemed, the Notes will bear interest at rates fixed periodically in advance based on Johannesburg interbank acceptance rates. |
| (h) | These Notes bear interest at rates fixed periodically in advance based on Johannesburg interbank acceptance rates. |
| (i) | These Notes bear a fixed rate of interest until 2012. After that date, in the event that the Notes are not redeemed, the Notes will bear interest at rates fixed periodically in advance based on Johannesburg interbank acceptance rates. |
| (j) | These Notes bear a fixed rate of interest until 2015. After that date, in the event that the Notes are not redeemed, the Notes will bear interest at rates fixed periodically in advance based on Johannesburg interbank acceptance rates. |
| (k) | These Notes bear a fixed rate of interest until 2012. After that date, in the event that the Notes are not redeemed, the coupon will be reset to a fixed margin over a reference gilt rate for a further period of five years. |
| (l) | These Notes bear a fixed rate of interest until 2014. After that date, in the event that the Notes are not redeemed, the Notes will bear interest at rates fixed periodically in advance based on European interbank rates. |
| (m) | This Loan bears a fixed rate of interest based on a US Dollar principal amount, but the interest payments have been swapped, resulting in a Yen interest rate payable which is fixed periodically in advance based on London interbank rates. |
| (n) | Repayable at the option of the issuer, prior to maturity, on conditions governing the respective debt obligations, some in whole or in part, and some only in whole. |
| (o) | These Notes bear interest at rates fixed periodically in advance based on the Bank of Botswana Certificate Rate. All of these Notes will be compulsorily converted to Preference Shares of BBB, having a total par value equal in sum to the principal amount of Notes outstanding at the time of conversion, should BBB experience pre-tax losses in excess of its retained earnings and other capital surplus accounts. |
| (p) | These Notes bear interest at rates fixed periodically in advance based on the Bank of Zambia Treasury Bill rate. All of these Notes will be compulsorily converted to Preference Shares of Barclays Zambia, having a total par value equal in sum to the principal amount of Notes outstanding at the time of conversion, should Barclays Zambia experience pre-tax losses in excess of its retained earnings and other capital surplus accounts. |
| (q) | The dividends are compounded and payable semi-annually in arrears on 30th September and 31st March of each year. The shares were issued by Absa Group Limited on 1st July 2004 and the redemption dates commence on the first business day after the third anniversary of the date of issue of the redeemable preference shares and ending on the fifth anniversary of the date of issue. Such exercise and notice will be deemed to be effective only on the option exercise dates, being 1st March, 1st June, 1st September or 1st December of each year. The shares are convertible into ordinary shares at the option of the preference shareholders on the redemption dates in lots of 100. |
| | |
| 196 | | Barclays PLC Annual Report 2006 |
| |
32 Subordinated liabilities (continued)
The 7.4% Subordinated Notes 2009 (the ‘7.4% Notes’) issued by the Bank have been registered under the US Securities Act of 1933. All other issues of dated loan capital by the Bank, Barclays Spain, BBG, BBB, Barclays Zambia and Absa, which were made in non-US markets, have not been so registered. With respect to the 7.4% Notes, the Bank is not obliged to make (i) a payment of interest on any interest payment date unless a dividend is paid on any class of share capital and (ii) a payment of principal until six months after the respective maturity date with respect to such Notes.
Repayment terms
Unless otherwise indicated, the Group’s dated loan capital outstanding at 31st December 2006 is redeemable only on maturity, subject in particular cases, to provisions allowing an early redemption in the event of certain changes in tax law or, in the case of BBB and Barclays Zambia to certain changes in legislation or regulations.
Any repayments prior to maturity require in the case of the Bank, the prior approval of the FSA, in the case of BBB, the prior approval of the Bank of Botswana, in the case of Barclays Zambia, the prior approval of the Bank of Zambia, and in the case of Absa, the prior approval of the South African Registrar of Banks.
There are no committed facilities in existence at the balance sheet date which permit the refinancing of debt beyond the date of maturity.
33 Provisions
| | | | | | | | | | | | | | | |
| | | Onerous
contracts
£m |
| | Redundancy
and
restructuring
£m |
| | Undrawn
contractually
committed
facilities and
guarantees
provided
£m |
| | Sundry
provisions
£m |
| | Total
£m |
|
| | | | | |
| At 1st January 2006 | | 79 | | | 74 | | | 55 | | | 309 | | | 517 | |
Exchange | | (2 | ) | | 2 | | | – | | | (16 | ) | | (16 | ) |
Additions | | 45 | | | 180 | | | 35 | | | 159 | | | 419 | |
Amounts used | | (53 | ) | | (133 | ) | | (9 | ) | | (94 | ) | | (289 | ) |
Unused amounts reversed | | (2 | ) | | (21 | ) | | (35 | ) | | (115 | ) | | (173 | ) |
Amortisation of discount | | 4 | | | – | | | – | | | – | | | 4 | |
| | | | | |
| At 31st December 2006 | | 71 | | | 102 | | | 46 | | | 243 | | | 462 | |
| | | | | |
| At 1st January 2005 | | 39 | | | 97 | | | 55 | | | 212 | | | 403 | |
Acquisitions and disposals of subsidiaries | | – | | | – | | | – | | | 51 | | | 51 | |
Exchange | | – | | | – | | | – | | | 7 | | | 7 | |
Additions | | 63 | | | 196 | | | 20 | | | 170 | | | 449 | |
Amounts used | | (27 | ) | | (178 | ) | | – | | | (104 | ) | | (309 | ) |
Unused amounts reversed | | – | | | (41 | ) | | (20 | ) | | (27 | ) | | (88 | ) |
Amortisation of discount | | 4 | | | – | | | – | | | – | | | 4 | |
| | | | | |
| At 31st December 2005 | | 79 | | | 74 | | | 55 | | | 309 | | | 517 | |
Provisions expected to be recovered or settled within no more than 12 months after 31st December 2006 were £388m (2005: £360m).
Sundry provisions are made with respect to commission clawbacks, warranties and litigation claims.
The Group has a restructuring programme, largely focused on activities within the UK, which involves the reshaping of the Group’s operations through the centralisation of core processes, application of new technologies, and reduction of workforce. It is anticipated that the majority of the remaining provision related to this programme will be utilised in 2007.
Redundancy and restructuring provisions are reported within operating expenses in the income statements.
| | |
Barclays PLC Annual Report 2006 | | 197 |
| |
Notes to the accounts
For the year ended 31st December 2006
34 Securitisations
During the year, the Group has engaged in securitisation transactions involving Barclays residential mortgage loans, business loans and credit card balances. In addition, the Group acts as a conduit for commercial paper, whereby it acquires static pools of residential mortgage loans from other lending institutions for securitisation transactions.
In these transactions, the assets, or interests in the assets, or beneficial interests in the cash flows arising from the assets, are transferred to a special purpose entity, or to a trust which then transfers its beneficial interests to a special purpose entity, which then issues floating rate debt securities to third-party investors.
Securitisations may, depending on the individual arrangement: result in continued recognition of the securitised assets and the recognition of the debt securities issued in the transaction; partial continued recognition of the assets to the extent of the Group’s continuing involvement in those assets; or derecognition of the assets and the separate recognition, as assets or liabilities, of any rights and obligations created or retained in the transfer. Full derecognition only occurs when the Group transfers both its contractual right to receive cash flows from the financial assets and substantially all the risks and rewards of ownership, including credit risk, prepayment risk and interest rate risk.
The following table shows the carrying amount of securitised assets, stated at the amount of the Group’s continuing involvement where appropriate, together with the associated liabilities, for each category of asset in the balance sheet:
| | | | | | | | |
| | | |
| | | 2006 | | 2005 |
| | | Carrying
amount of
assets
£m | | Associated
liabilities
£m | | Carrying
amount
of assets
£m | | Associated
liabilities
£m |
Loans and advances to customers (Note 16) | | | | | | | | |
Residential mortgage loans | | 12,577 | | 13,271 | | 6,779 | | 6,861 |
Commercial loans | | 6,081 | | 5,558 | | 5,000 | | 4,760 |
Credit card receivables | | 5,700 | | 5,195 | | 6,815 | | 6,799 |
| | | | |
| Total | | 24,358 | | 24,024 | | 18,594 | | 18,420 |
| | | | |
| Assets designated at fair value through profit or loss (Note 13) | | | | | | | | |
| Retained interest in residential mortgage loans | | 628 | | – | | 175 | | – |
Retained interests in residential mortgage loans include interest only strips which represent a continuing exposure to the prepayment and credit risk in the underlying securitised assets, the total amount of which was £15,063m (2005: £6,291m). These are initially recorded as an allocation of the original carrying amount based on the relative fair values of the portion derecognised and the portion retained.
| | |
| 198 | | Barclays PLC Annual Report 2006 |
| |
35 Retirement benefit obligations
Pension schemes
The UK Retirement Fund (UKRF), which is the main scheme of the Group, amounting to 91% of all the Group’s schemes in terms of benefit obligations, comprises five sections.
The 1964 Pension Scheme
Most employees recruited before July 1997 are members of this non-contributory defined benefit scheme. Pensions are calculated by reference to service and pensionable salary and are normally subject to a deduction from State pension age.
The Retirement Investment Scheme (RIS)
A defined contribution plan for most joiners between July 1997 and 1st October 2003. This was closed to new entrants on 1st October 2003 and the large majority of existing members of the RIS transferred toafterwork in respect of future benefit accrual with effect from 1st January 2004. There are now no longer any active members of the RIS.
The Pension Investment Plan (PIP)
A defined contribution plan created from 1st July 2001 to provide benefits for certain employees of Barclays Capital.
afterwork
Combines a contributory cash balance element with a voluntary defined contribution element. New employees since 1st October 2003 are eligible to joinafterwork. In addition, the large majority of active members of the RIS (now closed) were transferred toafterwork in respect of future benefit accrual after 1st January 2004.
Career Average Section
The Career Average Section was established in the UKRF with effect from 1st May 2004 following the transfer of members from the Woolwich Pension Fund. The Career Average Section is a non-contributory career average scheme and was closed to new entrants on 1st December 2006.
In addition, the costs of ill-health retirements and death in service benefits are generally borne by the UKRF for each of the five sections.
Governance
The assets of the UKRF are held separately from the assets of the Group and are administered by trustees.
Barclays Pension Fund Trustees Ltd (BPFTL) acts as corporate trustee for the UKRF. BPFTL is a private limited company, incorporated on 20th December 1990, and is a subsidiary of Barclays Bank PLC.
As the corporate trustee for the UKRF, BPFTL is the legal owner of the assets of the UKRF and BPFTL holds these assets in trust for the beneficiaries of the scheme.
BPFTL comprises nine Directors, of which six are Employer Directors selected by the Bank and three are Employee Directors nominated by the Pension Fund Advisory Committee (PFAC). Employee Directors are selected from those eligible active employees and pensioner members who apply to be considered for the role.
Employee Director vacancies are advertised to all eligible active and pensioner members. This enables any eligible member with an interest in becoming an Employee Director to express that interest and be considered for the role. The PFAC provides the mechanism through which Employee Directors are selected. The PFAC will accept nominations from eligible members and select from amongst all properly nominated candidates.
There are also three Alternate Employer Directors and three Alternate Employee Directors. The selection process for these appointments are as detailed above. The role of alternate directors is to provide cover for individual directors, should they not be available for meetings.
Currently, the Bank decides the funding rate after consulting with the trustees. Under the Pensions Act 2004, which has practical impact for the UKRF from its next triennial valuation due in September 2007, the Bank and the trustee must agree the funding rate (including a recovery plan to fund any deficit against the scheme specific statutory funding objective).
In addition to the UKRF, there are other defined benefit and defined contribution schemes in the UK and overseas. The same approach to pensions governance applies to the other schemes in the UK but different legislation covers schemes outside of the UK where in most cases the Bank has the power to determine the funding rate.
| | |
Barclays PLC Annual Report 2006 | | 199 |
| |
Notes to the accounts
For the year ended 31st December 2006
35 Retirement benefit obligations (continued)
The following tables present an analysis of defined benefit obligation and fair value of plan assets for all the Group’s pension schemes and post-retirement benefits (the latter are unfunded) and present the amounts recognised in the income statement including those related to post-retirement health care.
Income statement charge
| | | | | | | | | | | | | | | | | | | | | | | | |
| | | 2006 | | | 2005 | | | 2004 | |
| | | Pensions
£m |
| | Other post-
retirement
benefits
£m | | Total
£m |
| | Pensions
£m |
| | Other post-
retirement
benefits
£m | | Total
£m |
| | Pensions
£m |
| | Other post-
retirement
benefits
£m | | Total
£m | ��
|
| | | | | | | | | |
| Staff cost charge | | | | | | | | | | | | | | | | | | | | | | | | |
Current service cost | | 378 | | | 21 | | 399 | | | 348 | | | 22 | | 370 | | | 330 | | | 20 | | 350 | |
Interest cost | | 900 | | | 8 | | 908 | | | 853 | | | 4 | | 857 | | | 772 | | | 6 | | 778 | |
Expected return on scheme assets | | (999 | ) | | – | | (999 | ) | | (898 | ) | | – | | (898 | ) | | (834 | ) | | – | | (834 | ) |
Recognised actuarial loss | | 3 | | | 1 | | 4 | | | 4 | | | – | | 4 | | | – | | | 3 | | 3 | |
Past service cost | | 29 | | | – | | 29 | | | 13 | | | 1 | | 14 | | | 1 | | | – | | 1 | |
Curtailment or settlements | | (29 | ) | | – | | (29 | ) | | (49 | ) | | – | | (49 | ) | | (34 | ) | | – | | (34 | ) |
| | | | | | | | | |
| Total included in staff costs | | 282 | | | 30 | | 312 | | | 271 | | | 27 | | 298 | | | 235 | | | 29 | | 264 | |
Staff costs are included in other operating expenses.
Change in benefit obligation
| | | | | | | | | | | | | | | | | | | | | | | | | | | | | | |
| | | 2006 | | | 2005 | |
| | | Pensions | | | Post-retirement
benefits | | | Total | | | Pensions | | | Post-retirement
benefits | | | Total | |
| | | UK
£m |
| | Overseas
£m |
| | UK
£m |
| | Overseas
£m |
| | £m | | | UK
£m |
| | Overseas
£m |
| | UK
£m |
| | Overseas
£m |
| | £m | |
| | | | | | | | | | |
| Benefit obligation at beginning of the year | | (18,149 | ) | | (938 | ) | | (103 | ) | | (79 | ) | | (19,269 | ) | | (15,494 | ) | | (522 | ) | | (80 | ) | | (65 | ) | | (16,161 | ) |
Current service cost | | (358 | ) | | (20 | ) | | (20 | ) | | (1 | ) | | (399 | ) | | (332 | ) | | (16 | ) | | (18 | ) | | (4 | ) | | (370 | ) |
Interest cost | | (863 | ) | | (37 | ) | | (4 | ) | | (4 | ) | | (908 | ) | | (822 | ) | | (31 | ) | | (3 | ) | | (1 | ) | | (857 | ) |
Past service cost | | (4 | ) | | (25 | ) | | – | | | – | | | (29 | ) | | (12 | ) | | (1 | ) | | – | | | (1 | ) | | (14 | ) |
Curtailments or settlements | | 43 | | | 2 | | | – | | | – | | | 45 | | | 58 | | | 3 | | | – | | | – | | | 61 | |
Actuarial gain/(loss) | | 1,566 | | | 15 | | | 11 | | | (3 | ) | | 1,589 | | | (2,024 | ) | | (28 | ) | | (18 | ) | | (4 | ) | | (2,074 | ) |
Contributions by plan participants | | (15 | ) | | (2 | ) | | – | | | – | | | (17 | ) | | (13 | ) | | (2 | ) | | – | | | – | | | (15 | ) |
Benefits paid | | 536 | | | 40 | | | 19 | | | 4 | | | 599 | | | 490 | | | 24 | | | 16 | | | 5 | | | 535 | |
Business combinations | | – | | | 11 | | | – | | | – | | | 11 | | | – | | | (335 | ) | | – | | | – | | | (335 | ) |
Exchange and other adjustments | | (12 | ) | | 60 | | | – | | | 7 | | | 55 | | | – | | | (30 | ) | | – | | | (9 | ) | | (39 | ) |
| | | | | | | | | | |
Benefit obligation at end of the year | | (17,256 | ) | | (894 | ) | | (97 | ) | | (76 | ) | | (18,323 | ) | | (18,149 | ) | | (938 | ) | | (103 | ) | | (79 | ) | | (19,269 | ) |
The benefit obligation arises from plans that are wholly unfunded and wholly or partly funded as follows:
| | | | | | |
| | | 2006
£m |
| | 2005
£m |
|
Unfunded obligations | | (237 | ) | | (224 | ) |
Wholly or partly funded obligations | | (18,086 | ) | | (19,045 | ) |
| | |
| Total | | (18,323 | ) | | (19,269 | ) |
| | |
| 200 | | Barclays PLC Annual Report 2006 |
| |
35 Retirement benefit obligations (continued)
Change in plan assets
| | | | | | | | | | | | | | | | | | | | | | | | | | | | | | |
| | | |
| | | 2006 | | | 2005 | |
| | | | | | |
| | | Pensions | | | Post-retirement
benefits | | | Total | | | Pensions | | | Post-retirement
benefits | | | Total | |
| | | UK
£m |
| | Overseas
£m |
| | UK
£m |
| | Overseas
£m |
| | £m | | | UK
£m |
| | Overseas
£m |
| | UK
£m |
| | Overseas
£m |
| | £m | |
| | | | | | | | | | |
| Fair value of plan assets at beginning of the year | | 15,571 | | | 819 | | | – | | | – | | | 16,390 | | | 13,261 | | | 436 | | | – | | | – | | | 13,697 | |
Expected return on plan assets | | 965 | | | 34 | | | – | | | – | | | 999 | | | 867 | | | 31 | | | – | | | – | | | 898 | |
Employer contribution | | 357 | | | 26 | | | 2 | | | 4 | | | 389 | | | 358 | | | 11 | | | 1 | | | 3 | | | 373 | |
Settlements | | (11 | ) | | (2 | ) | | – | | | – | | | (13 | ) | | (7 | ) | | – | | | – | | | – | | | (7 | ) |
Contributions by plan participants | | 15 | | | 2 | | | – | | | – | | | 17 | | | 13 | | | 2 | | | – | | | – | | | 15 | |
Actuarial gain | | 423 | | | 25 | | | – | | | – | | | 448 | | | 1,599 | | | 2 | | | – | | | – | | | 1,601 | |
Benefits paid | | (536 | ) | | (30 | ) | | (2 | ) | | (4 | ) | | (572 | ) | | (490 | ) | | (24 | ) | | (1 | ) | | (3 | ) | | (518 | ) |
Business combinations | | – | | | – | | | – | | | – | | | – | | | – | | | 335 | | | – | | | – | | | 335 | |
Exchange and other adjustments | | (23 | ) | | (129 | ) | | – | | | – | | | (152 | ) | | (30 | ) | | 26 | | | – | | | – | | | (4 | ) |
| | | | | | | | | | |
Fair value of plan assets at the end of the year | | 16,761 | | | 745 | | | – | | | – | | | 17,506 | | | 15,571 | | | 819 | | | – | | | – | | | 16,390 | |
Amounts recognised on balance sheet
The pension and post-retirement benefit assets and liabilities recognised on the balance sheet are as follows:
| | | | | | | | | | | | | | | | | | | | | | | | | | | | | | |
| | | |
| | | 2006 | | | 2005 | |
| | | | | | |
| | | Pensions | | | Post-
retirement
benefits | | | Total | | | Pensions | | | Post-retirement
benefits | | | Total | |
| | | UK
£m |
| | Overseas
£m |
| | UK
£m |
| | Overseas
£m |
| | £m | | | UK
£m |
| | Overseas
£m |
| | UK
£m |
| | Overseas
£m |
| | £m | |
| | | | | | | | | | |
| Benefit obligation at end of period | | (17,256 | ) | | (894 | ) | | (97 | ) | | (76 | ) | | (18,323 | ) | | (18,149 | ) | | (938 | ) | | (103 | ) | | (79 | ) | | (19,269 | ) |
| Fair value of plan assets at end of period | | 16,761 | | | 745 | | | – | | | – | | | 17,506 | | | 15,571 | | | 819 | | | – | | | – | | | 16,390 | |
Net deficit | | (495 | ) | | (149 | ) | | (97 | ) | | (76 | ) | | (817 | ) | | (2,578 | ) | | (119 | ) | | (103 | ) | | (79 | ) | | (2,879 | ) |
Unrecognised actuarial (gains)/losses | | (953 | ) | | 20 | | | 17 | | | 14 | | | (902 | ) | | 1,039 | | | 63 | | | 29 | | | 11 | | | 1,142 | |
| | | | | | | | | | |
| Net recognised liability | | (1,448 | ) | | (129 | ) | | (80 | ) | | (62 | ) | | (1,719 | ) | | (1,539 | ) | | (56 | ) | | (74 | ) | | (68 | ) | | (1,737 | ) |
Recognised assets | | 53 | | | 35 | | | – | | | – | | | 88 | | | 52 | | | 34 | | | – | | | – | | | 86 | |
Recognised liability | | (1,501 | ) | | (164 | ) | | (80 | ) | | (62 | ) | | (1,807 | ) | | (1,591 | ) | | (90 | ) | | (74 | ) | | (68 | ) | | (1,823 | ) |
| | | | | | | | | | |
| Net recognised liability | | (1,448 | ) | | (129 | ) | | (80 | ) | | (62 | ) | | (1,719 | ) | | (1,539 | ) | | (56 | ) | | (74 | ) | | (68 | ) | | (1,737 | ) |
The UKRF deficit measured using the IAS 19 assumptions has decreased over the year from £2.5bn at 31st December 2005 to £0.5bn at 31st December 2006. Among the reasons for this change were greater than expected returns on assets and an increase in AA long-term corporate bond yields which resulted in a higher discount rate of 5.12% (31st December 2005: 4.83%), partially offset by an increase in the inflation assumption to 3.08% (31st December 2005: 2.75%). A number of additional changes were made to the assumptions used in valuing the liabilities, including a decrease in the assumed rate of real salary increases to 1% (31st December 2005: 1.55%), a change in the assumption regarding pension increases to recognise the caps and floors which apply to guaranteed pension increases, and the introduction of an explicit allowance for early retirement and commutation. Mortality assumptions remain unchanged from those in force at 31st December 2005.
The Group operates a number of schemes that are insured with third-party insurers. Reimbursement rights of £60m in relation to these schemes have been included within Other assets. The present value of the benefits payable under these schemes is £60m and has been included within the net pension liability recognised on the balance sheet.
The IAS 19 pension surplus of the Absa Group Pension Fund as at 31st December 2006 was £60m (2005: £90m). A net IAS 19 liability of £nil (2005: £nil) has been recognised on the balance sheet (consisting of £286m defined benefit obligation (2005: £335m) and £286m fair value of plan assets (2005: £335m)). These balances are not recognised in the financial statements of the Absa Group Limited in accordance with South African legislative requirements.
| | |
Barclays PLC Annual Report 2006 | | 201 |
| |
Notes to the accounts
For the year ended 31st December 2006
35 Retirement benefit obligations (continued)
Assumptions
Obligations arising under defined benefit schemes are actuarially valued using the projected unit credit method. Under this method, where a defined benefit scheme is closed to new members, such as in the case of the 1964 Pension Scheme, the current service cost expressed as a percentage of salary is expected to increase in the future, although this higher rate will be applied to a decreasing payroll. The latest actuarial IAS valuations were carried out as at 31st December using the following assumptions:
| | | | | | | | |
| | | |
| | | UK schemes | | Overseas schemes |
| | | 2006
% p.a. | | 2005
% p.a. | | 2006
% p.a. | | 2005
% p.a. |
| | | | |
Discount rate | | 5.12 | | 4.83 | | 6.94 | | 7.42 |
Rate of increase in salaries | | 4.08 | | 4.30 | | 5.66 | | 5.93 |
Inflation rate | | 3.08 | | 2.75 | | 3.94 | | 4.11 |
Rate of increase for pensions in payment | | 2.88 | | 2.75 | | 3.58 | | 3.66 |
Rate of increase for pensions in deferment | | 3.08 | | 2.75 | | 2.24 | | 2.97 |
Initial health care inflation | | 8.93 | | 10.00 | | 9.93 | | 10.87 |
Long-term health care inflation | | 5.00 | | 5.00 | | 5.00 | | 5.03 |
Expected return on plan assets | | 6.32 | | 6.30 | | 7.89 | | 8.58 |
The expected return on plan assets assumption is weighted on the basis of the fair value of these assets. Health care inflation assumptions are weighted on the basis of the health care cost for the period. All other assumptions are weighted on the basis of the defined benefit obligation at the end of the period.
The UK Schemes discount rate assumption is based on the yield on the iBoxx (over 15 year) AA corporate bond index.
The overseas health care inflation assumptions relate to the US and Mauritius.
Mortality assumptions
The post-retirement mortality assumptions used in valuing the liabilities of the UKRF were based on the standard tables PA92 as published by the Institute and Faculty of Actuaries. These tables are considered to be most relevant to the population of the UKRF based on their mortality history. These were then adjusted in line with both current industry experience and the actual experience of the UKRF’s own pensioners relative to the standard table. An allowance has been made for future mortality improvements based on the medium cohort projections published by the CMIB. On this basis the post-retirement mortality assumptions for the UKRF are as follows:
| | | | | | | | |
| | | 2006 | | 2005 | | 2004 | | 2003 |
| | | | |
| Longevity at 60 for current pensioners (years) | | | | | | | | |
– Males | | 25.8 | | 25.8 | | 25.7 | | 23.3 |
– Females | | 29.5 | | 29.5 | | 29.4 | | 26.4 |
| | | | |
| Longevity at 60 for future pensioners currently aged 40 (years) | | | | | | | | |
– Males | | 27.1 | | 27.1 | | 27.0 | | 24.9 |
– Females | | 30.7 | | 30.6 | | 30.6 | | 27.9 |
Sensitivity analysis
Sensitivity analysis for each of the principal assumptions used to measure the benefit obligation of the UKRF are as follows:
| | | | | | |
| Impact on UKRF benefit obligation | |
| | | (Decrease)
/Increase
% |
| | (Decrease)/
Increase
£bn |
|
0.5% increase to: | | | | | | |
– Discount rate | | (10.5 | ) | | (1.8 | ) |
– Rate of inflation | | 10.0 | | | 1.7 | |
– Rate of salary growth | | 2.3 | | | 0.4 | |
1 year increase to longevity at 60 | | 2.4 | | | 0.4 | |
Post-retirement health care
A one percentage point change in assumed health care trend rates, assuming all other assumptions remain constant would have the following effects for 2006:
| | | | | |
| | | 1% increase
£m | | 1% decrease
£m |
|
Effect on total of service and interest cost components | | 1.7 | | (1.4 | ) |
Effect on post-retirement benefit obligation | | 22.1 | | (18.7 | ) |
| | |
| 202 | | Barclays PLC Annual Report 2006 |
| |
35 Retirement benefit obligations (continued)
Assets
A long-term strategy has been set for the asset allocation of the UKRF which comprises a mixture of equities, bonds, property and other appropriate assets. This recognises that different asset classes are likely to produce different long-term returns and some asset classes may be more volatile than others.
The long-term strategy ensures that investments are adequately diversified. Asset managers are permitted some flexibility to vary the asset allocation from the long-term strategy within control ranges agreed with the trustee from time to time.
The UKRF also employs derivative instruments, where appropriate, to achieve a desired exposure or return, or to match assets more closely to liabilities.
The value of the assets of the schemes, their percentage in relation to total scheme assets, and their expected rate of return at 31st December 2006 and 31st December 2005 were as follows:
| | | | | | | | | | | | | | | | | | |
| | | 2006 |
| | UK schemes | | Overseas schemes | | Total |
| | | Value
£m | | % of
total fair
value of
scheme
assets | | Expected
rate
of
return
% | | Value
£m | | % of
total fair
value of
scheme
assets | | Expected
rate
of
return
% | | Value
£m | | % of
total fair
value of
scheme
assets | | Expected
rate
of
return
% |
| | | | | | | | | |
UK equities | | 2,099 | | 12.5 | | 7.9 | | 13 | | 1.7 | | 7.4 | | 2,112 | | 12.0 | | 7.9 |
US equities | | 1,815 | | 10.8 | | 7.9 | | 86 | | 11.5 | | 7.4 | | 1,901 | | 10.9 | | 7.9 |
Other equities | | 3,371 | | 20.1 | | 7.9 | | 238 | | 32.0 | | 10.0 | | 3,609 | | 20.6 | | 8.0 |
UK government bonds | | 3,309 | | 19.8 | | 4.4 | | – | | – | | – | | 3,309 | | 18.9 | | 4.4 |
UK corporate bonds | | 2,134 | | 12.7 | | 4.9 | | – | | – | | – | | 2,134 | | 12.2 | | 4.9 |
Other bonds | | 1,487 | | 8.9 | | 4.9 | | 300 | | 40.3 | | 6.2 | | 1,787 | | 10.3 | | 5.1 |
Property | | 1,995 | | 11.9 | | 6.4 | | 15 | | 2.0 | | 13.4 | | 2,010 | | 11.5 | | 6.5 |
Derivatives(a) | | 21 | | 0.1 | | n/a | | – | | – | | – | | 21 | | 0.1 | | n/a |
Cash | | 293 | | 1.8 | | 4.6 | | 37 | | 5.0 | | 5.9 | | 330 | | 1.9 | | 4.8 |
Other | | 237 | | 1.4 | | 5.9 | | 56 | | 7.5 | | 9.4 | | 293 | | 1.6 | | 6.6 |
Fair value of plan assets(b) | | 16,761 | | 100 | | 6.3 | | 745 | | 100 | | 7.9 | | 17,506 | | 100 | | 6.4 |
| | | | | | | | | |
| | | | | | | | | | | | | | | | | | |
| | | 2005 |
| | UK schemes | | Overseas schemes | | Total |
| | | Value
£m | | % of
total fair
value of
scheme
assets | | Expected
rate
of
return
% | | Value
£m | | % of
total fair
value of
scheme
assets | | Expected
rate
of
return
% | | Value
£m | | % of
total fair
value of
scheme
assets | | Expected
rate
of
return
% |
| | | | | | | | | |
UK equities | | 2,782 | | 17.9 | | 7.9 | | 13 | | 1.6 | | 7.8 | | 2,795 | | 17.1 | | 7.9 |
US equities | | 1,734 | | 11.1 | | 7.9 | | 90 | | 11.0 | | 7.8 | | 1,824 | | 11.1 | | 7.9 |
Other equities | | 3,007 | | 19.3 | | 7.9 | | 228 | | 27.8 | | 11.6 | | 3,235 | | 19.7 | | 8.2 |
UK government bonds | | 2,729 | | 17.6 | | 4.0 | | – | | – | | – | | 2,729 | | 16.7 | | 4.0 |
UK corporate bonds | | 1,827 | | 11.7 | | 4.6 | | – | | – | | – | | 1,827 | | 11.1 | | 4.6 |
Other bonds | | 899 | | 9.7 | | 4.6 | | 343 | | 41.9 | | 7.0 | | 1,242 | | 7.6 | | 5.3 |
Property | | 1,678 | | 10.8 | | 6.2 | | 16 | | 2.0 | | 15.3 | | 1,694 | | 10.3 | | 6.3 |
Derivatives(a) | | 1 | | – | | n/a | | 10 | | 1.2 | | n/a | | 11 | | 0.1 | | n/a |
Cash | | 755 | | 4.8 | | 4.0 | | 33 | | 4.0 | | 4.4 | | 788 | | 4.8 | | 4.0 |
Other | | 159 | | 1.1 | | 5.5 | | 86 | | 10.5 | | 7.7 | | 245 | | 1.5 | | 6.3 |
Fair value of plan assets(b) | | 15,571 | | 100 | | 6.3 | | 819 | | 100 | | 8.6 | | 16,390 | | 100 | | 6.4 |
Notes
| (a) | The expected return by asset class is based on the portfolio of assets, after considering the net impact of derivatives with a notional of £1,565m (2005: £281m). |
| (b) | Excludes £613m (2005: £512m) representing the money purchase assets of the UKRF. |
| | |
Barclays PLC Annual Report 2006 | | 203 |
| |
Notes to the accounts
For the year ended 31st December 2006
35 Retirement benefit obligations (continued)
The UKRF plan assets include £27m relating to UK private equity investments (2005: £53m) and £447m relating to overseas private equity investments (2005: £280m). These are disclosed within UK equities and Other equities respectively.
Amounts included in the fair value of plan assets include £7m (2005: £4m) relating to shares in Barclays Group, £10m (2005: £1m) relating to bonds issued by the Barclays Group, £1m (2005: £nil) relating to other investments in the Barclays Group, and £8m (2005: £5m) relating to property occupied by Group companies.
The expected return on assets is determined by calculating a total return estimate based on weighted average estimated returns for each asset class. Asset class returns are estimated using current and projected economic and market factors such as inflation, credit spreads and equity risk premiums.
The actual return on plan assets was £1,447m (2005: £2,499m).
Actuarial gains and losses
The actuarial gains and losses arising on plan liabilities and plan assets are as follows:
| | | | | | | | | | | | | | | | | | | | | | | | | | | |
| | | UK schemes | | | Overseas schemes | | | Total | |
| | | 2006
£m |
| | 2005
£m |
| | 2004
£m |
| | 2006
£m |
| | 2005
£m |
| | 2004
£m |
| | 2006
£m |
| | 2005
£m |
| | 2004
£m |
|
Present value of obligations | | (17,353 | ) | | (18,252 | ) | | (15,574 | ) | | (970 | ) | | (1,017 | ) | | (587 | ) | | (18,323 | ) | | (19,269 | ) | | (16,161 | ) |
Fair value of plan assets | | 16,761 | | | 15,571 | | | 13,261 | | | 745 | | | 819 | | | 436 | | | 17,506 | | | 16,390 | | | 13,697 | |
Net deficit in the plans | | (592 | ) | | (2,681 | ) | | (2,313 | ) | | (225 | ) | | (198 | ) | | (151 | ) | | (817 | ) | | (2,879 | ) | | (2,464 | ) |
Actuarial (losses)/gains | | | | | | | | | | | | | | | | | | | | | | | | | | | |
– arising on benefit obligation | | 1,577 | | | (2,042 | ) | | (1,204 | ) | | 12 | | | (32 | ) | | (62 | ) | | 1,589 | | | (2,074 | ) | | (1,266 | ) |
– arising on benefit obligation | | | | | | | | | | | | | | | | | | | | | | | | | | | |
(% of plan liabilities) | | 9% | | | 11% | | | 8% | | | 1% | | | 3% | | | 11% | | | 9% | | | 11% | | | 8% | |
Actuarial gains | | | | | | | | | | | | | | | | | | | | | | | | | | | |
– arising on plan assets | | 423 | | | 1,599 | | | 570 | | | 25 | | | 2 | | | 9 | | | 448 | | | 1,601 | | | 579 | |
– arising on plan assets | | | | | | | | | | | | | | | | | | | | | | | | | | | |
(% of plan assets) | | 3% | | | 10% | | | 4% | | | 3% | | | – | | | 2% | | | 3% | | | 10% | | | 4% | |
Funding
The most recent triennial funding valuation of the UK Retirement Fund was performed in September 2004 and forms the basis of the Group’s commitment that the fund has sufficient assets to make payments to members in respect of their accrued benefits as and when they fall due. This funding valuation uses a discount rate that reflects the assumed future return from the actual asset allocation at that date, and takes into account projected future salary increases when assessing liabilities arising from accrued service. The funding valuation is updated annually on the basis of interim assumptions. The UK Retirement Fund recorded a funding surplus of £1.3bn as at 31st December 2006 (2005: £0.9bn).
The Group has agreed funding contributions which, in aggregate, are no less than those which are sufficient to meet the Group’s share of the cost of benefits accruing over each year. The Group has, in the recent past, chosen to make funding contributions in excess of this, more consistent with the IAS service cost.
Defined benefit contributions paid with respect to the UKRF were as follows:
| | |
| | | £m |
Contributions paid | | |
2004 | | 255 |
2005 | | 354 |
2006 | | 351 |
In 2007 the Group will follow the same funding approach, and expects to make a contribution to the UKRF of no less than £263m as per the schedule of contributions agreed with the Trustee. The next triennial valuation will be performed in September 2007. To comply with the requirements of the Pensions Act 2004, the Group and trustees plan to agree a scheme-specific funding target, statement of funding principles, and a schedule of contributions which in 2008 will supersede those in place under the current actuarial funding valuation.
Excluding the UKRF, the Group is expected to pay contributions of approximately £7m to UK schemes and £44m to overseas schemes in 2007.
The Pensions Protection Fund (PPF) solvency ratio(a)for the main UK scheme as at 31st December 2006 was estimated to be 121% (31st December 2005: 110%).
Note
| (a) | The PPF solvency ratio represents the funds as a percentage of pension liabilities calculated using a section 179 valuation model. |
| | |
| 204 | | Barclays PLC Annual Report 2006 |
| |
36 Ordinary shares and share premium
| | | | | | | | |
| | | Number of
shares
m | | Ordinary
shares
£m | | Share
premium
£m | | Total
£m |
At 1st January 2006 | | 6,490 | | 1,623 | | 5,650 | | 7,273 |
Issued to staff under the Sharesave Share Option Scheme | | 18 | | 5 | | 67 | | 72 |
Issued under the Incentive Share Option Plan | | 25 | | 6 | | 96 | | 102 |
Issued under the Executive Share Option Scheme(a) | | 1 | | – | | 3 | | 3 |
Issued under the Woolwich Executive Share Option Plan(a) | | 1 | | – | | 2 | | 2 |
At 31st December 2006 | | 6,535 | | 1,634 | | 5,818 | | 7,452 |
At 1st January 2005 | | 6,454 | | 1,614 | | 5,524 | | 7,138 |
Issued to staff under the Sharesave Share Option Scheme | | 26 | | 6 | | 79 | | 85 |
Issued under the Incentive Share Option Plan | | 8 | | 2 | | 39 | | 41 |
Issued under the Executive Share Option Scheme | | 2 | | 1 | | 8 | | 9 |
At 31st December 2005 | | 6,490 | | 1,623 | | 5,650 | | 7,273 |
The authorised share capital of Barclays PLC is £2,500m (2005: £2,500m), comprising 9,996 million (2005: 9,996 million) ordinary shares of 25p each and 1 million (2005: 1 million) staff shares of £1 each. All issued shares are fully paid.
| | | | |
Called up share capital, allotted and fully paid | | 2006
£m | | 2005
£m |
Ordinary shares: | | | | |
At beginning of year | | 1,622 | | 1,613 |
Issued to staff under the Sharesave Share Option Scheme | | 5 | | 6 |
Issued under Incentive Share Option Plan | | 6 | | 2 |
Issued under Woolwich Executive Share Option Plan | | – | | 1 |
At end of year | | 1,633 | | 1,622 |
Staff shares | | 1 | | 1 |
Total | | 1,634 | | 1,623 |
Share repurchase
No share repurchases were made during the year (2005: £nil).
At the 2006 AGM on 27th April, Barclays PLC was authorised to repurchase 968,600,000 of its ordinary shares of 25p. The authorisation is effective until the AGM in 2007.
Shares under option
The Group has four schemes that give employees rights to subscribe for shares in Barclays PLC. A summary of the key terms of each scheme are included in Note 51.
At 31st December 2006, 78.9 million (2005: 85.7 million) options were outstanding under the terms of the Sharesave Share Option Scheme (Sharesave), 1.7 million (2005: 2.6 million) options were outstanding under the terms of the Executive Share Option Scheme (ESOS), 0.7 million (2005: 1.3 million) options were outstanding under the terms of the Woolwich Executive Share Option Plan (Woolwich ESOP) and 77.5 million (2005: 105.1 million) options were outstanding under the terms of the Incentive Share Option Plan (ISOP), enabling certain Directors and members of staff to subscribe for ordinary shares between 2006 and 2015 at prices ranging from 176p to 562p.
In addition to the above, the independent trustee of the Barclays Group (ESAS) Employees’ Benefit Trust (ESAS Trust), established by Barclays Bank PLC in 1996, operates the Executive Share Award Scheme (ESAS). ESAS is a deferred share bonus plan for employees of the Group. The key terms of the ESAS are described in Note 51. The independent trustees of the ESAS Trust make awards of Barclays shares and grant options over Barclays shares to beneficiaries of the ESAS Trust. Beneficiaries of the ESAS Trust include employees and former employees of the Barclays Group.
The independent trustee of the Barclays Group (PSP and ESOS) Employees’ Benefit Trust (PSP Trust), established by Barclays Bank PLC in 1996, operates the Performance Share Plan (PSP) and may satisfy awards under the ESOS. No awards have been made under this trust since 1999. All awards are in the form of options over Barclays shares.
The Sharepurchase scheme which was established in 2002 is open to all eligible UK employees, including executive Directors. The key terms of the Sharepurchase scheme are described in Note 51.
The total number of Barclays shares held in Group employee benefit trusts at 31st December 2006 was 168 million (2005: 148 million). Dividend rights have been waived on nil (2005: nil) of these shares. The total market value of the shares held in trust based on the year-end share price of £7.30 (2005: £6.11) was £1,227m (2005: £904m). As at 31st December 2006, options over 9.6 million (2005: 9.5 million) of the total shares held in the trusts were exercisable.
Note
| (a) | The nominal value for share options issued during 2006 for the Executive Share Option Scheme and Woolwich ESOP was less than £500,000 in each case. |
| | |
Barclays PLC Annual Report 2006 | | 205 |
| |
Notes to the accounts
For the year ended 31st December 2006
37 Reserves
Other reserves – Barclays PLC Group
| | | | | | | | | | | | | | | | |
| | | Capital
redemption
reserve
£m | | Other
capital
reserve
£m | | Available
for sale
reserve
£m |
| | Cash flow
hedging
reserve
£m |
| | Currency
translation
reserve
£m |
| | Total
£m |
|
At 1st January 2006 | | 309 | | 617 | | 225 | | | 70 | | | 156 | | | 1,377 | |
Net gains/(losses) from changes in fair value | | – | | – | | 71 | | | (421 | ) | | – | | | (350 | ) |
Net gains transferred to net profit | | – | | – | | (308 | ) | | (51 | ) | | – | | | (359 | ) |
Currency translation differences | | – | | – | | – | | | – | | | (464 | ) | | (464 | ) |
Losses transferred to net profit due to impairment | | – | | – | | 86 | | | – | | | – | | | 86 | |
Changes in insurance liabilities | | – | | – | | 23 | | | – | | | – | | | 23 | |
Net losses transferred to net profit due to fair value hedging | | – | | – | | 13 | | | – | | | – | | | 13 | |
Tax | | – | | – | | 22 | | | 172 | | | (130 | ) | | 64 | |
At 31st December 2006 | | 309 | | 617 | | 132 | | | (230 | ) | | (438 | ) | | 390 | |
| | | | | | |
| | | | | | | | | | | | | | | | |
| | | Capital
redemption
reserve
£m | | Other
capital
reserve
£m | | Available
for sale
reserve
£m |
| | Cash flow
hedging
reserve
£m |
| | Currency
translation
reserve |
£m | | Total
£m |
|
At 1st January 2005 | | 309 | | 617 | | 314 | | | 302 | | | (58 | ) | | 1,484 | |
Net losses from changes in fair value | | – | | – | | (250 | ) | | (51 | ) | | – | | | (301 | ) |
Net gains transferred to net profit | | – | | – | | (120 | ) | | (69 | ) | | – | | | (189 | ) |
Currency translation differences | | – | | – | | – | | | – | | | 214 | | | 214 | |
Changes in insurance liabilities | | – | | – | | (64 | ) | | – | | | – | | | (64 | ) |
Net losses transferred to net profit due to fair value hedging | | – | | – | | 260 | | | – | | | – | | | 260 | |
Tax | | – | | – | | 85 | | | (112 | ) | | – | | | (27 | ) |
At 31st December 2005 | | 309 | | 617 | | 225 | | | 70 | | | 156 | | | 1,377 | |
The capital redemption reserve and other capital reserve represent transfers from retained earnings in accordance with relevant legislation. These reserves are not distributable.
The available for sale reserve represents the unrealised change in the fair value of available for sale investments.
The cash flow hedging reserve represents the net gains on effective cash flow hedging instruments that will be recycled to the income statement when the hedged transaction affects profit or loss.
The currency translation reserve represents the cumulative gains and losses on the retranslation of the Group’s net investment in foreign operations, net of the effects of instruments that have qualified as hedges.
| | |
| 206 | | Barclays PLC Annual Report 2006 |
| |
37 Reserves (continued)
Retained earnings and treasury shares – Barclays PLC Group
| | | | | | | | | |
| | | Retained
earnings
£m |
| | Treasury
shares
£m |
| | Total
£m |
|
At 1st January 2006 | | 8,957 | | | (181 | ) | | 8,776 | |
Profit attributable to equity holders of the parent | | 4,571 | | | – | | | 4,571 | |
Equity-settled share schemes | | 663 | | | – | | | 663 | |
Tax on equity-settled share schemes | | 96 | | | – | | | 96 | |
Amortisation on treasury shares/ESOP | | (394 | ) | | 394 | | | – | |
Dividends paid | | (1,771 | ) | | – | | | (1,771 | ) |
Net purchases of treasury shares | | – | | | (425 | ) | | (425 | ) |
Other | | 47 | | | – | | | 47 | |
At 31st December 2006 | | 12,169 | | | (212 | ) | | 11,957 | |
At 1st January 2005 | | 6,784 | | | (119 | ) | | 6,665 | |
Profit attributable to equity holders of the parent | | 3,447 | | | – | | | 3,447 | |
Equity-settled share schemes | | 346 | | | – | | | 346 | |
Tax on equity-settled share schemes | | 101 | | | – | | | 101 | |
Amortisation on treasury shares/ESOP | | (78 | ) | | 78 | | | – | |
Dividends paid | | (1,581 | ) | | – | | | (1,581 | ) |
Net purchases of treasury shares | | – | | | (140 | ) | | (140 | ) |
Other | | (62 | ) | | – | | | (62 | ) |
At 31st December 2005 | | 8,957 | | | (181 | ) | | 8,776 | |
The Treasury shares primarily relate to shares held by employee benefit trusts, to the extent that they have not yet been expensed.
The Group operates in a number of countries subject to regulations under which a local subsidiary has to maintain a minimum level of capital. The current policy of the Group is that local capital requirements are met, as far as possible, by the retention of profit. Certain countries operate exchange control regulations which limit the amount of dividends that can be remitted to non-resident shareholders. It is not possible to determine the amount of profit retained and other reserves that are restricted by these regulations, but the net profit retained of overseas subsidiaries, associates and joint ventures at 31st December 2006 totalled £5,667m (2005: £3,980m). If such overseas reserves were to be remitted, other tax liabilities, which have not been provided for in the accounts, might arise.
Retained earnings – Barclays PLC (Parent company)
| | | | | | | | |
| | | Retained
earnings
£m |
| | Capital
redemption
reserve
£m | | Total
£m |
|
At 1st January 2006 | | 1,318 | | | 309 | | 1,627 | |
Profit after tax | | 1,964 | | | – | | 1,964 | |
Dividends paid | | (1,814 | ) | | – | | (1,814 | ) |
At 31st December 2006 | | 1,468 | | | 309 | | 1,777 | |
At 1st January 2005 | | 918 | | | 309 | | 1,227 | |
Profit after tax | | 2,012 | | | – | | 2,012 | |
Dividends paid | | (1,612 | ) | | – | | (1,612 | ) |
At 31st December 2005 | | 1,318 | | | 309 | | 1,627 | |
Details of principal subsidiaries held through Barclays Bank PLC are shown in Note 47.
| | |
Barclays PLC Annual Report 2006 | | 207 |
| |
Notes to the accounts
For the year ended 31st December 2006
38 Minority interests
| | | | | | |
| | | 2006
£m |
| | 2005
£m |
|
At beginning of year | | 7,004 | | | 3,330 | |
Share of profit after tax | | 624 | | | 394 | |
Dividend and other payments | | (452 | ) | | (318 | ) |
Equity issued by subsidiaries | | 639 | | | 2,273 | |
Available for sale reserve: net (loss)/gain from changes in fair value | | (2 | ) | | 1 | |
Cash flow hedges: net (loss)/gain from changes in fair value | | (9 | ) | | 1 | |
Currency translation differences | | (317 | ) | | 86 | |
Additions | | 51 | | | 1,281 | |
Disposals | | (34 | ) | | 4 | |
Other | | 87 | | | (48 | ) |
At end of year | | 7,591 | | | 7,004 | |
During the year, subsidiaries issued the following Preference Shares:
| · | | 3 million Preference Shares of nominal ZAR0.01 each (Principal amount: ZAR3,000m; £219m) with a variable dividend issued on 25th April 2006. |
| · | | 27 million Preference Shares of nominal US$0.25 each (Principal amount: US$675m; £378m) with a 6.625% dividend issued on 25th April 2006. |
| · | | 3 million Preference Shares of nominal US $0.25 each (Principal amount: US$75m; £41m) with a 6.625% dividend issued on 28th April 2006. |
39 Contingent liabilities and commitments
Contingent liabilities and commitments
In common with other banks, the Group conducts business involving acceptances, performance bonds and indemnities. The majority of these facilities are offset by corresponding obligations of third parties.
Nature of instruments
An acceptance is an undertaking by a bank to pay a bill of exchange drawn on a customer. The Group expects most acceptances to be presented, but reimbursement by the customer is normally immediate. Endorsements are residual liabilities of the Group in respect of bills of exchange, which have been paid and subsequently rediscounted.
Guarantees and letters of credit are given as security to support the performance of a customer to third parties. As the Group will only be required to meet these obligations in the event of the customer’s default, the cash requirements of these instruments are expected to be considerably below their nominal amounts.
Other contingent liabilities include transaction related customs and performance bonds and are, generally, short-term commitments to third parties which are not directly dependent on the customer’s creditworthiness.
Commitments to lend are agreements to lend to a customer in the future, subject to certain conditions. Such commitments are either made for a fixed period, or have no specific maturity but are cancellable by the lender subject to notice requirements.
Documentary credits commit the Group to make payments to third parties, on production of documents, which are usually reimbursed immediately by customers.
| | |
| 208 | | Barclays PLC Annual Report 2006 |
| |
39 Contingent liabilities and commitments (continued)
The following tables summarise the nominal principal amount of contingent liabilities and commitments with off-balance sheet risk:
| | | | |
| | | 2006
£m | | 2005
£m |
Acceptances and endorsements | | 287 | | 283 |
Guarantees and letters of credit pledged as collateral security | | 31,252 | | 38,035 |
Other contingent liabilities | | 7,880 | | 8,825 |
Contingent liabilities | | 39,419 | | 47,143 |
Documentary credits and other short-term trade related transactions | | 414 | | 380 |
Undrawn note issuance and revolving underwriting facilities: | | | | |
Forward asset purchases and forward deposits placed | | 360 | | 43 |
Standby facilities, credit lines and other | | 204,730 | | 203,362 |
Commitments | | 205,504 | | 203,785 |
Capital commitments
At 31st December 2006 the commitments for capital expenditure under contract amounted to £9m (2005: £1m).
Assets pledged
Assets are pledged as collateral to secure liabilities under repurchase agreements, securitisations and stock lending agreements or as security deposits relating to futures and options. The aggregate amount of secured liabilities is £108,928m (2005: £105,679m).
The following table summarises the nature and carrying amount of the assets pledged as security against these liabilities:
| | | | |
| | | 2006
£m | | 2005
£m |
Trading portfolio assets | | 77,255 | | 79,648 |
Loans and advances to banks | | 5,952 | | 4,480 |
Loans and advances to customers | | 17,763 | | 14,094 |
Available for sale investments | | 20,495 | | 26,818 |
Other | | 4 | | 55 |
Assets pledged | | 121,469 | | 125,095 |
40 Legal proceedings
Barclays has for some time been party to proceedings, including a class action, in the United States against a number of defendants following the collapse of Enron; the class action claim is commonly known as the Newby litigation. On 20th July 2006 Barclays received an Order from the United States District Court for the Southern District of Texas Houston Division (the ‘Court’) which dismissed the claims against Barclays PLC, Barclays Bank PLC and Barclays Capital Inc. in the Newby litigation. On 4th December 2006, in response to the plaintiffs’ procedural objections, the Court stayed Barclays dismissal from the proceedings and allowed the plaintiffs to file a supplemental complaint. The Court will consider the plaintiffs’ supplemental complaint in connection with consideration of a summary judgment motion filed by Barclays.
Barclays considers that the Enron related claims against it are without merit and is defending them vigorously. It is not possible to estimate Barclays possible loss in relation to these matters, nor the effect that they might have upon operating results in any particular financial period.
Barclays has been in negotiations with the staff of the US Securities and Exchange Commission with respect to a settlement of the Commission’s investigations of transactions between Barclays and Enron. Barclays does not expect that the amount of any settlement with the Commission would have a significant adverse effect on its financial position or operating results.
On 3rd November 2006 Barclays announced that it had reached a settlement in principle with Enron in the Enron bankruptcy proceedings.
A settlement agreement was signed on 30th November 2006 and became effective on 3rd January 2007. The settlement has had no negative impact on Barclays earnings as an adequate provision had already been made for the likely cost in prior periods. In reaching the settlement Barclays has denied any wrongdoing or liability.
Barclays is engaged in various other litigation proceedings both in the United Kingdom and a number of overseas jurisdictions, including the United States, involving claims by and against it which arise in the ordinary course of business. Barclays does not expect the ultimate resolution of any of the proceedings to which Barclays is party to have a significant adverse effect on the financial position of the Group and Barclays has not disclosed the contingent liabilities associated with these claims either because they cannot reasonably be estimated or because such disclosure could be prejudicial to the conduct of the claims.
| | |
Barclays PLC Annual Report 2006 | | 209 |
| |
Notes to the accounts
For the year ended 31st December 2006
41 Leasing
The Group is both lessor and lessee under finance and operating leases, providing asset financing for its customers and leasing assets for its own use. In addition, assets leased by the Group may be sublet to other parties. An analysis of the impact of these transactions on the Group balance sheet and income statement is as follows
(a) As Lessor
Finance lease receivables
The Group specialises in asset-based lending and works with a broad range of international technology, industrial equipment and commercial companies and provides customised finance programmes to assist manufacturers, dealers and distributors of assets.
Finance lease receivables are included within loans and advances to customers (see Note 16).
The Group’s net investment in finance lease receivables was as follows:
| | | | | | | | | | | | | | | | | | |
| | | 2006 | | 2005 |
| | | Gross
investment in
finance lease
receivables
£m | | Future
finance
income
£m | | | Present value of
minimum lease
payments
receivable
£m | | Unguaranteed
residual
values
£m | | Gross
investment in
finance lease
receivables
£m | | Future
finance
income
£m | | | Present value of
minimum lease
payments
receivable
£m | | Unguaranteed
residual
values
£m |
Not more than one year | | 3,650 | | (734 | ) | | 2,916 | | 166 | | 2,038 | | (514 | ) | | 1,524 | | 61 |
Over one year but not more than five years | | 5,824 | | (1,490 | ) | | 4,334 | | 334 | | 5,345 | | (1,222 | ) | | 4,123 | | 113 |
More than five years | | 3,790 | | (898 | ) | | 2,892 | | 15 | | 5,252 | | (1,811 | ) | | 3,441 | | 31 |
Total | | 13,264 | | (3,122 | ) | | 10,142 | | 515 | | 12,635 | | (3,547 | ) | | 9,088 | | 205 |
The allowance for uncollectable finance lease receivables included in the allowance for impairment amounted to £22m at 31st December 2006 (2005: £11m).
Operating lease receivables
The Group acts as lessor, whereby items of plant and equipment are purchased and then leased to third parties under arrangements qualifying as operating leases. The items purchased to satisfy these leases are treated as plant and equipment in the Group’s financial statements and are generally disposed of at the end of the lease term (see Note 25).
The future minimum lease payments expected to be received under non-cancellable operating leases at 31st December 2006 were as follows:
| | | | |
| | | 2006
Plant and
equipment
£m | | 2005
Plant and
equipment
£m |
Not more than one year | | 18 | | 22 |
More than one year but not more than two years | | 5 | | 17 |
More than two years but not more than five years | | 9 | | 14 |
More than five years | | 7 | | 10 |
Total | | 39 | | 63 |
(b) As Lessee
Finance lease commitments
The Group leases items of property, plant and equipment on terms that meet the definition of finance leases. Finance lease commitments are included within other liabilities (see Note 30).
Obligations under finance leases were as follows:
| | | | | | |
| | | 2006
Total future
minimum
payments
£m | | | 2005
Total future
minimum
payments
£m | |
Not more than one year | | 11 | | | 99 | |
Over one year but not more than two years | | 25 | | | 71 | |
Over two years but not more than five years | | 55 | | | 109 | |
More than five years | | 55 | | | 97 | |
Less: future finance charges | | (54 | ) | | (87 | ) |
Net obligations under finance leases | | 92 | | | 289 | |
| | |
| 210 | | Barclays PLC Annual Report 2006 |
| |
41 Leasing (continued)
(b) As Lessee (continued)
The carrying amount of assets held under finance leases at the balance sheet date was:
| | | | | | |
| | | 2006
£m | | | 2005
£m | |
Cost | | 44 | | | 77 | |
Accumulated depreciation | | (25 | ) | | (18 | ) |
Net book value | | 19 | | | 59 | |
Operating lease commitments
The Group leases various offices, branches and other premises under non-cancellable operating lease arrangements. The leases have various terms, escalation and renewal rights. There are no contingent rents payable. The Group also leases equipment under non-cancellable lease arrangements.
Where the Group is the lessee the future minimum lease payment under non-cancellable operating leases are as follows:
| | | | | | | | |
| | | 2006 | | 2005 |
| | | Property
£m | | Equipment
£m | | Property
£m | | Equipment
£m |
Less than one year | | 335 | | 9 | | 297 | | 8 |
Between one to two years | | 337 | | 9 | | 271 | | 7 |
Between two to three years | | 311 | | 2 | | 261 | | 7 |
Between three to four years | | 268 | | – | | 242 | | 2 |
Between four to five years | | 223 | | – | | 204 | | – |
Over five years | | 2,057 | | – | | 1,672 | | – |
Total | | 3,531 | | 20 | | 2,947 | | 24 |
The total of future minimum sublease payments to be received under non-cancellable subleases at the balance sheet date is £251m (2005: £246m).
42 Consolidated cash flow statement
In order to provide more relevance to users and to enhance the comparability of its financial statement presentation, the Group has changed certain classifications within the cash flow statement in 2006.
These changes have increased net cash from operating activities by £14,147m in 2005 (2004: £4,287m) with a corresponding decrease in net cash used in investing activities of £111m (2004: £12m increase) and decrease in net cash from financing activities of £14,036m (2004: £4,299m). The amounts of cash and cash equivalents in 2005 and 2004 have not been affected by the changes.
Interest received in 2006 was £38,544m (2005: £32,124m, 2004: £20,301m) and interest paid in 2006 was £29,372m (2005: £23,319m, 2004: £13,875m).
| | |
Barclays PLC Annual Report 2006 | | 211 |
| |
Notes to the accounts
For the year ended 31st December 2006
43 Disposals
The Group was involved in the following disposals:
| | | | | |
| | | % Disposal | | Date | |
Bankhaus Wolbern | | 100% | | 31/08/06 | |
European Vendor Finance Business | | 100% | | 31/12/06 | |
| | | | | |
| | | | | 2006
£m |
|
Total disposal consideration | | | | 140 | |
Net assets disposed | | | | (80 | ) |
Profit on disposal of subsidiaries | | | | 60 | |
Total disposal consideration | | | | 140 | |
Deferred consideration | | | | (116 | ) |
Cash and cash equivalents disposed of | | | | (39 | ) |
Disposal of subsidiaries, net of cash disposed | | | | (15 | ) |
Cash received in respect of disposal of ownership in Barclays Global Investors UK Holdings Limited
through the exercise of options under the BGI EOP scheme | | | | 44 | |
Decrease in investment in subsidiaries | | | | 44 | |
| | |
| 212 | | Barclays PLC Annual Report 2006 |
| |
44 Acquisitions
The Group was involved in the following acquisitions in 2006:
| | |
| | | Date |
HomEq Servicing Corporation mortgage servicing business | | 01/11/06 |
Details of the net assets acquired and the consideration paid are set out below.
| | | | | | | |
| | | Carrying value
pre-acquisition
£m | | Fair value
adjustments
£m | | | 2006
£m |
Assets | | | | | | | |
Cash and balances at central banks | | 10 | | – | | | 10 |
Loans and advances to customers | | 153 | | – | | | 153 |
Intangible assets | | 123 | | (9 | ) | | 114 |
Other assets | | – | | 1 | | | 1 |
Total assets | | 286 | | (8 | ) | | 278 |
Liabilities | | | | | | | |
Deposits by customers | | 2 | | – | | | 2 |
Other liabilities | | 18 | | – | | | 18 |
Total liabilities | | 20 | | – | | | 20 |
Net assets acquired | | | | | | | 258 |
Goodwill | | | | | | | – |
Total | | | | | | | 258 |
Acquisition cost | | | | | | | |
Cash paid | | | | | | | 258 |
Total consideration | | | | | | | 258 |
The acquired business contributed £5m to consolidated profit before tax for the period from acquisition date to 31st December 2006.
If the acquisition had occurred on 1st January 2006 (for 2005 on 1st January 2005), total Group income would have been £22,258m (2005: £18,065m), profit before tax would have been £7,167m (2005: £5,295m), and basic earnings per share would have been 72.2p (2005: 54.5p).
The initial accounting for the business combination that took effect during the year has been determined only provisionally as a result of the proximity of the acquisition to the year end.
| | | |
Cash outflows in respect of acquisitions | | | |
| | | 2006
£m |
|
Cash consideration in respect of acquisition | | 258 | |
Cash and cash equivalents acquired | | (10 | ) |
Net cash outflow on acquisition | | 248 | |
Cash paid in respect of acquisition of shares in Barclays Global Investors UK Holdings Limited | | 410 | |
Cash paid in respect of acquisition of shares in Absa Bank Limited | | 22 | |
Increase in investment in subsidiaries | | 432 | |
45 Investment in Barclays Bank PLC
The investment in Barclays Bank PLC is stated in the balance sheet of Barclays PLC at a cost of £8,641m (2005: £8,462m). The increase of £179m (2005: £135m) during the year represents the cost of additional shares.
| | |
Barclays PLC Annual Report 2006 | | 213 |
| |
Notes to the accounts
For the year ended 31st December 2006
46 Related party transactions and Directors’ remuneration
(a) Related party transactions
Parties are considered to be related if one party has the ability to control the other party or exercise significant influence over the other party in making financial or operation decisions, or one other party controls both. The definition includes subsidiaries, associates, joint ventures and the Group’s pension schemes, as well as other persons.
Subsidiaries
Transactions between Barclays PLC and subsidiaries also meet the definition of related party transactions. Where these are eliminated on consolidation, they are not disclosed in the Group financial statements. Transactions between Barclays PLC and its subsidiary, Barclays Bank PLC are fully disclosed directly in its balance sheet and income statement. A list of the Group’s principal subsidiaries is shown in Note 47.
Associates, joint ventures and other entities
The Group provides banking services to its associates, joint ventures and the Group pension funds (principally the UK Retirement Fund), providing loans, overdrafts, interest and non-interest bearing deposits and current accounts to these entities as well as other services. Group companies, principally within Barclays Global Investors, also provide investment management and custodian services to the Group pension schemes. The Group also provides banking services for unit trusts and investment funds managed by Group companies and are not individually material.
All of these transactions are conducted on the same terms to third-party transactions and are not individually material.
Amounts included in the accounts, in aggregate, by category of related party entity are as follows:
| | | | | | | | | | | | | | | |
| | | For the year ended and as at 31st December 2006 | |
Loans | | Associates
£m |
| | Joint
ventures
£m |
| | Entities
under
common
directorships
£m |
| | Pension
funds unit
trusts and
investment
funds
£m |
| | Total
£m |
|
| | | | | |
Income statement: | | | | | | | | | | | | | | | |
Interest received | | 45 | | | 38 | | | – | | | 2 | | | 85 | |
Interest paid | | (31 | ) | | (57 | ) | | – | | | – | | | (88 | ) |
| Fees received for services rendered (including investment management and custody and commissions) | | 14 | | | 7 | | | – | | | 28 | | | 49 | |
Fees paid for services provided | | (115 | ) | | (51 | ) | | – | | | (1 | ) | | (167 | ) |
Principal transactions | | 3 | | | – | | | (2 | ) | | – | | | 1 | |
| | | | | |
Assets: | | | | | | | | | | | | | | | |
Loans and advances to banks and customers | | 784 | | | 146 | | | 65 | | | – | | | 995 | |
Derivative transactions | | – | | | – | | | – | | | – | | | – | |
Other assets | | 19 | | | 3 | | | – | | | 17 | | | 39 | |
| | | | | |
Liabilities: | | | | | | | | | | | | | | | |
Deposits from banks | | 9 | | | – | | | – | | | 3 | | | 12 | |
Customer accounts | | 19 | | | 18 | | | 5 | | | 34 | | | 76 | |
Derivative transactions | | – | | | – | | | 2 | | | – | | | 2 | |
Other liabilities | | 13 | | | 8 | | | – | | | – | | | 21 | |
| | |
| 214 | | Barclays PLC Annual Report 2006 |
| |
46 Related party transactions and Directors’ remuneration (continued)
| | | | | | | | | | | | | |
| | | For the year ended and as at 31st December 2005 | |
| | | Associates
£m |
| | Joint
ventures
£m |
| | Entities
under
common
directorships
£m | | Pension
funds unit
trusts and
investment
funds
£m | | Total
£m |
|
Income statement: | | | | | | | | | | | | | |
Interest received | | 23 | | | 14 | | | – | | – | | 37 | |
Interest paid | | (37 | ) | | (45 | ) | | – | | – | | (82 | ) |
Fees received for services rendered (including investment management and custody and commissions) | | 5 | | | 7 | | | – | | 17 | | 29 | |
Fees paid for services provided | | (120 | ) | | (34 | ) | | – | | – | | (154 | ) |
Principal transactions | | 33 | | | – | | | – | | 1 | | 34 | |
| | | | | |
Assets: | | | | | | | | | | | | | |
Loans and advances to banks and customers | | 632 | | | 19 | | | – | | – | | 651 | |
Derivative transactions | | 36 | | | – | | | – | | – | | 36 | |
Other assets | | 26 | | | 1 | | | – | | 19 | | 46 | |
| | | | | |
Liabilities: | | | | | | | | | | | | | |
Deposits from banks | | 827 | | | – | | | – | | – | | 827 | |
Customer accounts | | 13 | | | 22 | | | – | | 501 | | 536 | |
Derivative transactions | | 1 | | | – | | | – | | – | | 1 | |
Other liabilities | | 22 | | | 6 | | | – | | – | | 28 | |
| | | | | | | | | | | | | |
| | | For the year ended and as at 31st December 2004 | |
| | | Associates
£m |
| | Joint
ventures
£m |
| | Entities
under
common
directorships
£m | | Pension
funds unit
trusts and
investment
funds
£m | | Total
£m |
|
Income statement: | | | | | | | | | | | | | |
Interest received | | 13 | | | 9 | | | – | | 1 | | 23 | |
Interest paid | | (17 | ) | | (31 | ) | | – | | – | | (48 | ) |
Fees received for services rendered (including investment management and custody and commissions) | | – | | | 8 | | | – | | 19 | | 27 | |
Fees paid for services provided | | (286 | ) | | (19 | ) | | – | | – | | (305 | ) |
Principal transactions | | – | | | – | | | – | | – | | – | |
| | | | | |
Assets: | | | | | | | | | | | | | |
Loans and advances to banks and customers | | 202 | | | 88 | | | – | | 30 | | 320 | |
Derivative transactions | | 21 | | | 4 | | | – | | – | | 25 | |
Other assets | | – | | | – | | | – | | – | | – | |
| | | | | |
Liabilities: | | | | | | | | | | | | | |
Deposits from banks | | 1,634 | | | – | | | – | | – | | 1,634 | |
Customer accounts | | 26 | | | 28 | | | – | | 30 | | 84 | |
Derivative transactions | | – | | | – | | | – | | – | | – | |
Other liabilities | | 174 | | | 3 | | | – | | – | | 177 | |
No guarantees, pledges or commitments have been given or received in respect of these transactions in 2006, 2005 or 2004.
There are no leasing transactions between related parties for 2006, 2005 or 2004.
Derivatives transacted on behalf of the Pensions Funds Unit Trusts and Investment Funds amounted to £1,209m (2005: £280m, 2004: £161m).
In 2006 Barclays channelled £19m (2005: £nil) of its charitable donations through the Charities Aid Foundation, a registered charitable organisation, in which a Director of the Company is a Trustee.
| | |
Barclays PLC Annual Report 2006 | | 215 |
| |
Notes to the accounts
For the year ended 31st December 2006
46 Related party transactions and Directors’ remuneration (continued)
Key Management Personnel
The Group’s Key Management Personnel, and persons connected with them, are also considered to be related parties for disclosure purposes. Key Management Personnel are defined as those persons having authority and responsibility for planning, directing and controlling the activities of Barclays PLC (directly or indirectly) and comprise the Directors of Barclays PLC and the Officers of the Group, certain direct reports of the Group Chief Executive and the heads of major business units.
In the ordinary course of business, the Bank makes loans to companies where a Director or other member of Key Management Personnel (or any connected person) is also a Director or other member of Key Management Personnel (or any connected person) of Barclays. These loans are made on substantially the same criteria and terms, including interest rates and collateral, as those prevailing at the time for comparable transactions with other persons and did not involve more than the normal risk of collectability or present other unfavourable features.
There were no material related party transactions with companies where a Director or other member of Key Management Personnel (or any connected person) is also a Director or other member of Key Management Personnel (or any connected person) of Barclays.
The Group provides banking services to Directors and other Key Management Personnel and persons connected to them. Transactions during the year and the balances outstanding at 31st December 2006 were as follows:
| | | | | | | | | |
| | | Directors, other Key
Management Personnel
and connected persons |
|
| | | 2006
£m |
| | 2005
£m |
| | 2004
£m |
|
| | | |
Loans outstanding at 1st January | | 7.4 | | | 7.8 | | | 6.7 | |
Loans issued during the year | | 2.7 | | | 3.4 | | | 2.7 | |
Loan repayments during the year | | (2.3 | ) | | (3.2 | ) | | (1.5 | ) |
Loans outstanding at 31st December | | 7.8 | | | 8.0 | | | 7.9 | |
Interest income earned | | 0.3 | | | 0.4 | | | 0.3 | |
No allowances for impairment were recognised in respect of loans to Directors or other members of Key Management Personnel (or any connected person) in 2006 or 2005.
| | | | | | | | | |
| | | 2006
£m |
| | 2005
£m |
| | 2004
£m |
|
| | | |
Deposits outstanding at 1st January | | 4.7 | | | 2.5 | | | 5.9 | |
Deposits received during the year | | 105.2 | | | 20.4 | | | 18.2 | |
Deposits repaid during the year | | (94.8 | ) | | (18.2 | ) | | (21.1 | ) |
Deposits outstanding at 31st December | | 15.1 | | | 4.7 | | | 3.0 | |
Interest expense on deposits | | 0.2 | | | 0.1 | | | 0.1 | |
Fees payable and other expenses | | – | | | – | | | – | |
Fees receivable and other income | | – | | | – | | | – | |
Guarantees issued by the Group | | – | | | – | | | – | |
Of the loans outstanding above, £nil (2005: £0.7m, 2004: £0.1m) relates to Directors and other Key Management Personnel (and persons connected to them) that left the Group during the year. Of the deposits outstanding above, £0.1m (2005: £nil, 2004: £nil) relates to Directors and other Key Management Personnel (and persons connected to them) that left the Group during the year.
All loans are provided on normal commercial terms to Directors and other Key Management Personnel (and persons connected to them), with the exception of £3,645 of loans which are provided to non-Director members of Key Management Personnel on staff preferential interest rates (5%) and £4,278 of loans which are provided on an interest free basis.
| | |
| 216 | | Barclays PLC Annual Report 2006 |
| |
46 Related party transactions and Directors’ remuneration (continued)
Remuneration of Directors and other Key Management Personnel
| | | | | | |
| | | Directors, other Key Management
Personnel and connected persons |
| | | 2006
£m | | 2005
£m | | 2004
£m |
Salaries and other short-term benefits | | 34.2 | | 32.9 | | 31.7 |
Pension costs | | 0.8 | | 1.1 | | 2.1 |
Other long-term benefits | | 9.3 | | 21.5 | | 11.4 |
Termination benefits | | 1.4 | | 1.5 | | 0.4 |
Share-based payments | | 27.2 | | 25.3 | | 14.3 |
Employer social security charges on emoluments | | 10.0 | | 10.4 | | 7.3 |
| | | |
| | | 82.9 | | 92.7 | | 67.2 |
| | | |
| (b) Disclosures required by the Companies Act 1985 | | | | | | |
| | | |
| The following information is presented in accordance with the Companies Act 1985: | | | | | | |
| | | |
Directors’ remuneration | | | | | | |
| | | | | 2006
£m | | 2005
£m |
Aggregate emoluments | | | | 32.0 | | 17.3 |
Gains made on the exercise of share options | | | | 5.5 | | 0.3 |
Amounts paid under long-term incentive schemes | | | | – | | – |
Actual pension contributions to money purchase scheme (2006: one Director, £11,414 and 2005: two Directors, £114,856) | | | | – | | 0.1 |
Notional pension contributions to money purchase scheme (2006: no Directors and 2005: no Directors) | | | | – | | – |
| | | |
| | | | | 37.5 | | 17.7 |
As at 31st December 2006, four Directors were accruing retirement benefits under a defined benefit scheme (2005: four Directors).
Three Directors (Naguib Kheraj, David Roberts and Frits Seegers) have agreed to waive their fees as non-executive Directors of Absa Group Limited and Absa Bank Limited. The respective fees for 2006 were ZAR0.4m (£0.03m), ZAR0.4m (£0.03m) and ZAR0.1m (£0.01m). The fees for 2005 were ZAR0.2m (£0.02m) for Naguib Kheraj and ZAR0.1m (£0.01m) for David Roberts (Frits Seegers was not a non-executive Director of Absa Group Limited or Absa Bank Limited in 2005). In both 2005 and 2006 the fees were paid to Barclays.
Directors’ and Officers’ shareholdings and options
The beneficial ownership of the ordinary share capital of Barclays PLC by all Directors and Officers of Barclays PLC (involving 22 persons) and Barclays Bank PLC (involving 23 persons) at 31st December 2006 amounted to 3,999,415 ordinary shares of 25p each (0.06% of the ordinary share capital outstanding) and 4,001,170 ordinary shares of 25p each (0.06% of the ordinary share capital outstanding), respectively.
Executive Directors and Officers of Barclays PLC as a group (involving 11 persons) held, at 31st December 2006, options to purchase 9,735,764 Barclays PLC ordinary shares of 25p each at prices ranging from 316p to 510p under Sharesave and at 397p under the Executive Share Option Scheme and ranging from 326p to 534p under the Incentive Share Option Plan, respectively.
| | |
Barclays PLC Annual Report 2006 | | 217 |
| |
Notes to the accounts
For the year ended 31st December 2006
46 Related party transactions and Directors’ remuneration (continued)
Contracts with Directors (and their connected persons) and Managers
The aggregate amounts outstanding at 31st December 2006 under transactions, arrangements and agreements made by banking companies within the Group for persons who are, or were during the year, Directors of Barclays PLC and persons connected with them and for Managers, within the meaning of the Financial Services and Markets Act 2000, of Barclays Bank PLC were:
| | | | | | |
| | | Number of
Directors or
Managers | | Number of
connected
persons | | Amount
£m |
| | | |
Directors | | | | | | |
Loans | | 4 | | – | | – |
Quasi-loans and credit card accounts | | 17 | | 6 | | 0.1 |
Managers | | | | | | |
Loans | | 4 | | – | | 0.4 |
Quasi-loans and credit card accounts | | 3 | | – | | – |
(c) US disclosures
For US disclosure purposes, the aggregate emoluments of all Directors and Officers of Barclays PLC who held office during the year (2006: 24 persons, 2005: 25 persons, 2004: 30 persons) for the year ended 31st December 2006 amounted to £72.1m (2005: £75.2m, 2004: £48.1m). In addition, the aggregate amount set aside for the year ended 31st December 2006, to provide pension benefits for the Directors and Officers amounted to £0.8m (2005: £0.2m, 2004: £1.9m). The aggregate emoluments of all Directors and Officers of Barclays Bank PLC who held office during the year (2006: 25 persons, 2005: 26 persons, 2004: 31 persons) for the year ended 31st December 2006 amounted to £72.2m (2005: £75.4m, 2004: £48.3m). In addition, the aggregate amount set aside by the Bank and its subsidiaries for the year ended 31st December 2006, to provide pension benefits for the Directors and Officers amounted to £0.8m (2005: £0.2m, 2004: £1.9m).
| | |
| 218 | | Barclays PLC Annual Report 2006 |
| |
47 Principal subsidiaries
| | | | | | | |
Country of registration or incorporation | | Company name | | Nature of business | | Percentage
of equity
capital held
% | |
| | | |
Botswana | | Barclays Bank of Botswana Limited | | Banking | | 74.9 | |
Egypt | | Barclays Bank Egypt SAE | | Banking | | 100 | |
England | | Barclays Bank PLC | | Banking, holding company | | 100 | * |
England | | Barclays Mercantile Business Finance Limited | | Loans and advances including leases to customers | | 100 | * |
England | | Barclays Global Investors UK Holdings Limited | | Holding company | | 90.6 | |
England | | Barclays Global Investors Limited | | Investment management | | 90.6 | * |
England | | Barclays Life Assurance Company Limited | | Life and pension business | | 100 | |
England | | Barclays Bank Trust Company Limited | | Banking, securities industries and trust services | | 100 | |
England | | Barclays Stockbrokers Limited | | Stockbroking | | 100 | |
England | | Barclays Capital Securities Limited | | Securities dealing | | 100 | |
England | | Barclays Global Investors Pensions Management Limited | | Investment management | | 90.6 | * |
England | | FIRSTPLUS Financial Group PLC | | Secured loans | | 100 | * |
England | | Gerrard Investment Management Limited | | Investment management | | 100 | * |
Ghana | | Barclays Bank of Ghana Limited | | Banking | | 100 | |
Ireland | | Barclays Insurance (Dublin) Limited | | Payment protection insurance | | 100 | * |
Ireland | | Barclays Assurance (Dublin) Limited | | Payment protection assurance | | 100 | * |
Isle of Man | | Barclays Private Clients International Limited(a) | | Banking | | 100 | * |
Japan | | Barclays Capital Japan Limited(b) | | Securities dealing | | 100 | * |
Jersey | | Barclays Private Bank & Trust Limited | | Banking, holding company | | 100 | * |
Kenya | | Barclays Bank of Kenya Limited | | Banking, financial and related services | | 68.5 | |
South Africa | | Absa Group Limited | | Banking | | 56.5 | |
Spain | | Barclays Bank SA | | Banking | | 99.7 | |
Switzerland | | Barclays Bank (Suisse) S.A. | | Banking and trust services | | 100 | * |
USA | | Barclays Capital Inc. | | Securities dealing | | 100 | * |
USA | | Barclays Financial Corporation | | Credit card issuer | | 100 | |
USA | | Barclays Global Investors, National Association | | Investment management and securities industry | | 90.6 | * |
Zimbabwe | | Barclays Bank of Zimbabwe Limited | | Banking | | 67.8 | * |
In accordance with Section 231(5) of the Companies Act 1985, the above information is provided solely in relation to principal subsidiaries.
The country of registration or incorporation is also the principal area of operation of each of the above subsidiaries. Investments in these subsidiaries are held directly by Barclays Bank PLC except where marked *.
Full information of all subsidiaries will be included in the Annual Return to be filed at Companies House.
Notes
| (a) | BBPLC is the beneficial owner of 38.1% of shares and Barclays Holdings (Isle of Man) Limited is the beneficial owner of 61.9% of shares. |
| (b) | Barclays Capital Japan Limited, Tokyo Branch was licensed to operate in Japan as a branch of a foreign principal subsidiary incorporated in the Cayman Islands until 30th April 2006. Pursuant to changes in the Japanese law, a Japanese domestic company was incorporated on 8th November 2005 into which the entire business was transferred in from the branch as at 30th April 2006. This domestic company was renamed Barclays Capital Japan Limited. |
| | |
Barclays PLC Annual Report 2006 | | 219 |
| |
Notes to the accounts
For the year ended 31st December 2006
48 Other entities
There are a number of entities that do not qualify as subsidiaries under UK Law but which are consolidated under IAS 27 (SIC-12) when the substance of the relationship between the Group and the entity (usually a Special Purpose Entity (SPE)) indicates that the entity is controlled by the Group. Such entities are deemed to be controlled by the Group when relationships with such entities gives rise to benefits that are in substance no different from those that would arise were the entity a subsidiary.
The consolidation of such entities may be appropriate in a number of situations, but primarily when:
| · | | the operating and financial polices of the entity are closely defined from the outset (i.e. it operates on an ‘autopilot’ basis) with such policies being largely determined by the Group; |
| · | | the Group has rights to obtain the majority of the benefits of the entity and/or retains the majority of the residual or ownership risks related to the entity; or |
| · | | the activities of the entity are being conducted largely on behalf of the Group according to its specific business objectives. |
Such entities are created for a variety of purposes including securitisation, structuring, asset realisation, intermediation and management.
Entities may have a different reporting date from that of the parent of 31st December. Dates may differ for a variety of reasons including local reporting regulations or tax laws. In accordance with our accounting policies, for the purpose of inclusion in the consolidated financial statements of Barclays PLC, entities with different reporting dates are made up until 31st December.
Entities may have restrictions placed on their ability to transfer funds, including payment of dividends and repayment of loans, to their parent entity. Reasons for the restrictions include:
| · | | Central bank restrictions relating to local exchange control laws. |
| · | | Central bank capital adequacy requirements. |
| · | | Company law restrictions relating to treatment of the entities as going concerns. |
Although the Group’s interest in the equity voting rights in certain entities exceeds 50%, these entities are excluded from consolidation because the Group either does not direct the financial and operating policies of these entities, or on the ground that another group has a superior economic interest in such entities. Consequently, these entities are not deemed to be controlled by Barclays under IAS 27 (SIC-12).
The table below includes information in relation to such entities as required by the Companies Act 1985, Section 231(5).
Subsidiaries excluded from consolidation
| | | | | | | | | | |
Country of registration
or incorporation | | Name | | Percentage of
ordinary share
capital held
% | | Equity
share-
holders’
funds
£m |
| | Retained
profit/
(loss) for
the year
£m |
|
UK | | Oak Dedicated Limited | | 100 | | (7 | ) | | (2 | ) |
UK | | Oak Dedicated Two Limited | | 100 | | (5 | ) | | (1 | ) |
UK | | Oak Dedicated Three Limited | | 100 | | – | | | – | |
USA | | Ivanhoe Funding LLC(a) | | 75 | | 6 | | | – | |
UK | | Fitzroy Finance | | 100 | | – | | | – | |
UK | | St James Fleet Investments Two Limited | | 100 | | 2 | | | – | |
Cayman Islands | | 29 Park Investment No1 Limited(b) | | – | | – | | | – | |
Cayman Islands | | 29 Park Investment No2 Limited(b) | | – | | – | | | – | |
Notes
| (a) | Barclays has 51% of voting rights in the entity. |
| (b) | Barclays appoint the majority of Directors of these entities. |
| | |
| 220 | | Barclays PLC Annual Report 2006 |
| |
49 Events after the balance sheet date
On 19th January 2007 Barclays announced that it entered into an agreement to purchase EquiFirst Corporation, the non-prime mortgage origination business of Regions Financial Corporation, for a consideration of approximately US$225m. Completion, which is subject to receipt of the required licences and applicable regulatory approval, as well as a post-closing adjustment based on EquiFirst’s balance sheet at the actual completion date, is expected in the first half of 2007.
On 8th February 2007 Barclays completed the acquisition of Indexchange Investment AG from Bayerische Hypo-und Vereinsbank for a consideration of approximately€240m.
50 Trust activities
The Group provides custody, trustee, corporate administration, investment management and advisory services to third parties which involve the Group making allocation, purchase and sale decisions in relation to a wide range of financial instruments. Those assets that are held in a fiduciary capacity are not included in these financial statements. At the balance sheet date the Group had the following assets under administration:
| | | | |
| | | 2006
£bn | | 2005
£bn |
| | |
Indexed assets | | 612 | | 609 |
Active assets | | 235 | | 198 |
Managed cash and other assets | | 170 | | 153 |
| Total | | 1,017 | | 960 |
51 Share-based payments
The Group operates share schemes for employees throughout the world. The main current schemes are:
Sharesave
Eligible employees in the UK, Spain and Ireland may participate in the Barclays Sharesave scheme. Under this scheme, employees may enter into contracts to save up to £250 per month and, at the expiry of a fixed term of three, five or seven years, have the option to use these savings to acquire shares in the Company at a discount, calculated in accordance with the rules of the scheme. The discount is currently 20% of the market price at the date the options are granted. Participants in the scheme have six months from the date of vest in which the option can be exercised.
Sharepurchase
Sharepurchase was introduced in January 2002. It is an HM Revenue & Customs approved all-employee share plan. The plan is open to all eligible UK employees, including executive Directors. Under the plan, participants are able to purchase up to £1,500 worth of Barclays PLC ordinary shares per tax year, which, if kept in trust for five years, can be withdrawn from the plan tax-free. Matching shares were introduced to the scheme during 2005 where the purchase of Barclays shares by the participant are matched equally by the Company up to a value of £600 per tax year. Any shares in the plan will earn dividends in the form of additional shares, which must normally be held by the trustee for three years before being eligible for release.
Executive Share Award Scheme (ESAS)
For certain employees of the Group an element of their annual bonus is in the form of a deferred award of a provisional allocation of Barclays PLC shares under ESAS. The total value of the bonus made to the employee of which ESAS is an element is dependent upon the business unit, Group and individual employee performance. The ESAS element of the annual bonus must normally be held for at least three years. Additional bonus shares are subsequently awarded to recipients of the provisional allocation and vest upon achieving continued service for three and five years from the date of award. ESAS awards are also made to eligible employees for recruitment purposes. All awards are subject to potential forfeit if the individual resigns and commences work with a competitor business.
Performance Share Plan (PSP)
The Performance Share Plan (PSP) was approved by shareholders at the 2005 AGM to replace the ISOP scheme. Performance shares are ‘free’ Barclays shares for which no exercise price is payable and which qualify for dividends. Performance share awards are communicated to participants as an initial allocation. Barclays performance over a three-year period determines the final number of shares that may be released to participants.
Options granted under the following schemes are over subsidiaries of Barclays PLC:
Barclays Global Investors Equity Ownership Plan (BGI EOP)
The Equity Ownership Plan extends to key employees of BGI. The exercise price of the options is determined by the Remuneration Committee of Barclays PLC based on the fair value of BGI as determined by an independent appraiser. The options are granted over shares in Barclays Global Investors UK Holdings Limited, a subsidiary of Barclays Bank PLC. Options are normally not exercisable until vesting, with a third of the options held generally becoming exercisable at each anniversary of grant. The shareholder has the right to offer to sell the shares to Barclays Bank PLC 355 days following the exercise of the option. Barclays Bank PLC may accept the offer and purchase the shares at the most recent agreed valuation but is under no obligation to do so. Options lapse ten years after grant. The most recently agreed valuation at 30th June 2006 was £91.43.
| | |
Barclays PLC Annual Report 2006 | | 221 |
| |
Notes to the accounts
For the year ended 31st December 2006
51 Share-based payments (continued)
Absa Group Limited Black Economic Empowerment (BEE) Transaction
On 25th June 2004, Absa shareholders approved the allocation of 73,152,300, redeemable cumulative option-holding Absa preference shares to Batho Bonke Capital Limited. Each redeemable preference share carries the option to acquire one Absa ordinary share. The shares carry the same rights as ordinary shares including voting rights, and receive dividends which are payable semi-annually. Options vest after three years and lapse after five years from the date of issue. Exercise may occur in lots of 100 only and within a price range varying from ZAR48 to ZAR69 (£3.50-£5.03) dependent on the 30-day volume weighted trading price on the JSE Limited. Options are redeemed by Absa on the final exercise date.
Absa Group Limited Share Incentive Trust (AGLSIT)
In terms of the rules of Absa Group Limited Share Incentive Trust the maximum number of shares which may be issued or transferred and/or in respect of which options may be granted to the participants shall be limited to shares representing 10% of the total number of issued shares. Options are allocated to Absa employees according to the normal Human Resources talent management process. The options issued up to August 2005 had no performance criteria linked to them and vested in equal tranches after three, four and five years respectively. No dividends accrue to the option holder over the period. The options expire after a period of ten years from the issuing date. Options issued since August 2005 have vesting performance criteria associated with them, which require headline earnings per share to exceed an agreed benchmark over a three-year period from July 2005 for the options to vest.
Absa Group Limited Share Ownership Trust (AGLSOT)
The Absa Group Limited Share Ownership Trust (AGLSOT) enabled all Absa employees to participate in a one-off offer to purchase 200 redeemable cumulative option-holding preference shares. Each redeemable preference share carries the option to acquire one Absa ordinary share. Options vest after three years and lapse after five years from the date of issue. Exercise may occur in lots of 100 only and within a price range varying from ZAR48 to ZAR69 (£3.50-£5.03) dependent on the 30-day volume weighted trading price on the JSE Limited. Options are redeemed by Absa on the final exercise date.
Absa Group Limited Executive Share Award Scheme (AGLESAS)
For certain employees of Absa an element of their annual bonus is in the form of a deferred award of a provisional allocation of Absa Group Limited shares under Absa ESAS. The total value of the bonus made to the employee of which ESAS is an element is dependent upon the business unit and individual employee performance. The ESAS element of the annual bonus must be held for at least three years. Additional bonus shares are subsequently awarded to recipients of the provisional allocation and vest upon achieving continued service for three and five years from the date of award. All awards are subject to potential forfeit if the individual resigns.
In addition, options remain outstanding under the following closed schemes:
Incentive Share Option Plan (ISOP)
The ISOP was open by invitation to the employees and Directors of Barclays PLC. Options were granted at the market price at the date of grant calculated in accordance with the rules of the plan, and are normally exercisable between three and ten years from that date. The final number of shares over which the option may be exercised is determined by reference to set performance criteria. The number of shares under option represents the maximum possible number that may be exercised. No awards were made under ISOP during 2006.
Executive Share Option Scheme (ESOS)
The ESOS is a long-term incentive scheme and was available by invitation to certain senior executives of the Group with grants usually made annually. Options were issued with an exercise price equivalent to the market price at the date of the grant without any discount, calculated in accordance with the rules of the scheme, and are normally exercisable between three and ten years from that date. No further awards are made under ESOS.
Woolwich Executive Share Option Plan (Woolwich ESOP)
Options originally granted over Woolwich PLC shares at market value were exercised in 2001 or exchanged, in accordance with the proposals made under the offer to acquire the Woolwich, for options over Barclays PLC shares. Under the rules of ESOP, the performance conditions attached to the exercise of options were disapplied on acquisition of Woolwich PLC by Barclays. Options lapse ten years after grant.
At the balance sheet date, nil options remained outstanding or exercisable in respect of the following closed scheme:
Woolwich Save as You Earn (Woolwich SAYE)
Under this scheme, employees entered into contracts to save up to £250 per month and, at the expiry of a fixed term of three, five, or seven years, have the option to use these savings to acquire the shares in the Company at a discount calculated in accordance with the rules of the scheme. The discount was 20% of the market price at the date the options were granted.
Several cash-settled schemes also operate within the Group.
Barclays Africa Share Plan
The Barclays Africa Share Plan grants a number of notional shares and settles in a cash award linked to the Barclays PLC share price. The exercise price of options is equal to the increment of the market price of Barclays shares over the original price on the date of grant. The final number of notional shares over which the option may by exercised is determined by reference to set performance criteria. Awards will vest three years from grant and expire four years from that date.
| | |
| 222 | | Barclays PLC Annual Report 2006 |
| |
51 Share-based payments (continued)
Absa Group Phantom Performance Share Plan (Absa Phantom PSP)
The Absa Phantom PSP was implemented during the year to replace the Absa Group Limited Share Incentive Trust (AGLSIT) scheme. Shares are awarded at no cost to participants and the cash paid is equal to the market value of ordinary shares of Absa Group Limited. The performance of Absa over a three-year period determines the final number of notional shares that any cash payment would be based on. Awards vest after three years to the extent that the performance conditions are satisfied.
The weighted average fair value per option granted during the year is as follows:
| | | | | | | | | | | | | | | |
| | | | | | | | | | | | 2006 £ | | | 2005 £ | |
| | | | | |
Sharesave | | | | | | | | | | | 1.88 | | | 1.29 | |
Sharepurchase | | | | | | | | | | | 6.55 | | | 5.57 | |
ESAS | | | | | | | | | | | 6.73 | | | 5.03 | |
PSP | | | | | | | | | | | 7.53 | | | 3.99 | |
BGI EOP | | | | | | | | | | | 21.18 | | | 10.41 | |
AGLSIT | | | | | | | | | | | 2.70 | | | 2.42 | |
AGLESAS | | | | | | | | | | | 8.42 | | | – | |
ISOP | | | | | | | | | | | – | | | 2.78 | |
Fair values for Sharesave, PSP, BGI EOP, AGLSIT and ISOP are calculated at the date of grant using either a Black-Scholes model or Monte Carlo simulation. Sharepurchase, ESAS and AGLESAS are nil cost awards on which the performance conditions are substantially completed at the date of grant. Consequently the fair value of these awards is based on the market value at that date. As described above, the terms of the ESAS scheme require shares to be held for a set number of years from the date of vest. The calculation of the vest date fair value of such awards includes a reduction for this post-vesting restriction. This discount is determined by calculating how much a willing market participant would rationally pay to remove the restriction using a Black-Scholes option pricing model. The total discount required in 2006 is £62m (2005: £36m, 2004: £25m). The significant weighted average assumptions used to estimate the fair value of the options granted in 2006 are as follows: | |
| | | | | | 2006 | |
| | | | | |
| | | | | | Sharesave | | | PSP | | | BGI EOP | | | AGLSIT | |
| | | | | |
Weighted average share price | | | | | 6.20 | | | 6.74 | | | 81.12 | | | 8.92 | |
Weighted average exercise price | | | | | 5.11 | | | – | | | 81.12 | | | 6.57 | |
Expected volatility | | | | | 25 | % | | 25 | % | | 24 | % | | 29 | % |
Expected option life | | | | | 4 years | | | 3 years | | | 4 years | | | 5 years | |
The significant weighted average assumptions used to estimate the fair value of the options granted in 2005 are as follows: | |
| | | Sharesave | | | PSP | | | BGI EOP | | | AGLSIT | | | ISOP | |
| | | | | |
Weighted average share price | | 5.71 | | | 5.33 | | | 39.09 | | | 8.25 | | | 5.73 | |
Weighted average exercise price | | 4.44 | | | n/a | | | 39.09 | | | 8.41 | | | 5.66 | |
Expected volatility | | 24 | % | | 20 | % | | 25 | % | | n/a | | | 34 | % |
Option life | | 4 years | | | 3 years | | | 4 years | | | 5-8 years | | | 5 years | |
The significant weighted average assumptions used to estimate the fair value of the options granted in 2004 are as follows:
| | | | | | |
| | | Sharesave | | BGI EOP | | ISOP |
| | | |
Weighted average share price | | 5.28 | | 20.11 | | 4.77 |
Weighted average exercise price | | 3.59 | | 20.11 | | 4.18 |
Expected volatility | | 25% | | 25% | | 34% |
Option life | | 5 years | | 5 years | | 5 years |
Expected volatility and dividend yield on the date of grant have been used as inputs into the respective valuation models for Sharesave and PSP. Expected volatility has been determined using historical volatility of its peers over the expected life of the options for BGI EOP and AGLSIT applies a five-year rolling period.
The yield on UK government bonds with a commensurate life has been used to determine the risk-free discount rate of 5% for all schemes other than AGLSIT. Option life is estimated based upon historical data for the holding period of options between grant and exercise dates. The risk-free rate on the AGLSIT scheme represents the yield, recorded on date of option grant, on South African government zero coupon bond of a term commensurate to the expected life of the option.
| | |
Barclays PLC Annual Report 2006 | | 223 |
| |
Notes to the accounts
For the year ended 31st December 2006
51 Share-based payments (continued)
For the purposes of determining the expected life and number of options to vest, historical exercise patterns have been used, together with an assumption that a certain percentage of options will lapse due to leavers.
The assumed dividend yield for Barclays PLC is the average annual dividend yield on the date of grant of 4%. The expected dividends for BGI UK Holdings Limited are assumed to grow in line with the expected increases in share prices for the industry sector until exercise giving a yield of 2%. Dividend yield for AGLSIT of 3.5% was based on the average 12-month trailing yield over the year to grant date.
Analysis of the movement in the number and weighted average exercise price of options is set out below:
| | | | | | | | | | | | | | | | | | | | |
| | | Sharesave(a) | | Sharepurchase(a)(d) |
| | | | |
| | Number
(000s) |
| | Weighted average
ex. price (£) | | Number
(000s) |
| | Weighted average
ex. price (£) |
| | | | | | | | |
| | | 2006 | | | 2005 | | | 2006 | | 2005 | | 2006 | | | 2005 | | | 2006 | | 2005 |
Outstanding at beginning of year | | 85,686 | | | 97,266 | | | 3.95 | | 3.69 | | 1,126 | | | – | | | – | | – |
Granted in the year | | 17,449 | | | 19,492 | | | 5.11 | | 4.44 | | 1,561 | | | 1,190 | | | – | | – |
Exercised/released in the year | | (18,727 | ) | | (24,365 | ) | | 3.84 | | 3.34 | | (113 | ) | | (41 | ) | | – | | – |
Less: forfeited in the year | | (5,479 | ) | | (6,670 | ) | | 4.11 | | 3.82 | | (102 | ) | | (23 | ) | | – | | – |
Less: expired in the year | | – | | | (37 | ) | | – | | 3.46 | | – | | | – | | | – | | – |
Outstanding at end of year | | 78,929 | | | 85,686 | | | 4.22 | | 3.95 | | 2,472 | | | 1,126 | | | – | | – |
Of which exercisable: | | 915 | | | 1,189 | | | 3.87 | | 3.28 | | – | | | – | | | – | | – |
| | | | | | | | |
| | | | | | | | | | | | | | | | | | | | |
| | | ESAS(a)(d) | | PSP(a)(d) |
| | | | |
| | Number
(000s) |
| | Weighted average
ex. price (£) | | Number
(000s) |
| | Weighted average
ex. price (£) |
| | | | | | | | |
| | | 2006 | | | 2005 | | | 2006 | | 2005 | | 2006 | | | 2005 | | | 2006 | | 2005 |
Outstanding at beginning of year | | 121,515 | | | 100,284 | | | – | | – | | 20,269 | | | – | | | – | | – |
Granted in the year | | 59,758 | | | 46,374 | | | – | | – | | 22,563 | | | 20,269 | | | – | | – |
Exercised/released in the year | | (33,663 | ) | | (22,237 | ) | | – | | – | | – | | | – | | | – | | – |
Less: forfeited in the year | | (5,251 | ) | | (2,906 | ) | | – | | – | | – | | | – | | | – | | – |
Less: expired in the year | | – | | | – | | | – | | – | | – | | | – | | | – | | – |
Outstanding at end of year | | 142,359 | | | 121,515 | | | – | | – | | 42,832 | | | 20,269 | | | – | | – |
Of which exercisable: | | 9,607 | | | 9,548 | | | – | | – | | – | | | – | | | – | | – |
| | | | | | | | |
| | | | | | | | | | | | | | | | | | | | |
| | | BGI EOP(b) | | Absa BEE(c) |
| | | | |
| | Number
(000s) |
| | Weighted average
ex. price (£) | | Number
(000s) |
| | Weighted average
ex. price (£) |
| | | | | | | | |
| | | 2006 | | | 2005 | | | 2006 | | 2005 | | 2006 | | | 2005 | | | 2006 | | 2005 |
Outstanding at beginning of year/acquisition date | | 5,442 | | | 7,575 | | | 25.26 | | 12.74 | | 73,152 | | | 73,152 | | | 4.41-6.35 | | 4.41-6.35 |
Granted in the year | | 3,973 | | | 2,360 | | | 81.12 | | 39.09 | | – | | | – | | | – | | – |
Exercised/released in the year | | (2,188 | ) | | (4,368 | ) | | 19.92 | | 11.21 | | – | | | – | | | – | | – |
Less: forfeited in the year | | (298 | ) | | (125 | ) | | 52.66 | | 18.52 | | – | | | – | | | – | | – |
Less: expired in the year | | – | | | – | | | – | | – | | – | | | – | | | – | | – |
Outstanding at end of year | | 6,929 | | | 5,442 | | | 57.79 | | 25.26 | | 73,152 | | | 73,152 | | | 3.50-5.03 | | 4.41-6.35 |
Of which exercisable: | | 1,050 | | | 1,751 | | | 18.99 | | 11.18 | | – | | | – | | | – | | – |
Notes
| (a) | Options/award granted over Barclays PLC shares. |
| (b) | Options/award granted over Barclays Global Investors UK Holdings Limited shares. |
| (c) | Options/award granted over Absa Group Limited shares. |
| | |
| 224 | | Barclays PLC Annual Report 2006 |
| |
51 Share-based payments (continued)
| | | | | | | | | | | | | | | | | | | | |
| | | AGLSIT(a) | | AGLSOT(a) |
| | Number
(000s) |
| | Weighted average
ex. price (£) | | Number
(000s) |
| | Weighted average
ex. price (£) |
| | | 2006 | | | 2005 | | | 2006 | | 2005 | | 2006 | | | 2005 | | | 2006 | | 2005 |
| | | | | | | | |
Outstanding at beginning of year/acquisition date | | 25,126 | | | 31,138 | | | 4.38 | | 3.33 | | 5,359 | | | 5,509 | | | 4.41-6.35 | | 4.41-6.35 |
Granted in the year | | 586 | | | 4,347 | | | 6.57 | | 8.41 | | – | | | – | | | – | | – |
Exercised/released in the year | | (6,137 | ) | | (9,606 | ) | | 2.86 | | 2.80 | | – | | | – | | | – | | – |
Less: forfeited in the year | | (797 | ) | | (753 | ) | | 4.12 | | 3.83 | | (512 | ) | | (150 | ) | | 3.85-5.53 | | 4.41-6.35 |
Less: expired in the year | | – | | | – | | | – | | – | �� | – | | | – | | | – | | – |
Outstanding at end of year | | 18,778 | | | 25,126 | | | 3.87 | | 4.38 | | 4,847 | | | 5,359 | | | 3.50-5.03 | | 4.41-6.35 |
Of which exercisable: | | 5,305 | | | 3,390 | | | 2.43 | | 2.82 | | – | | | – | | | – | | – |
| | | | | | | | | | | | | | | | | | | | |
| | | | | AGLESAS(a)(c) |
| | | | | | | Number
(000s) |
| | Weighted average
ex. price (£) |
| | | | | | | | | | | | | 2006 | | | 2005 | | | 2006 | | 2005 |
| | | | | | | | |
Outstanding at beginning of year/acquisition date | | | | | | | | | | | | – | | | – | | | – | | – |
Granted in the year | | | | | | | | | | | | 37 | | | – | | | – | | – |
Exercised/released in the year | | | | | | | | | | | | – | | | – | | | – | | – |
Less: forfeited in the year | | | | | | | | | | | | – | | | – | | | – | | – |
Less: expired in the year | | | | | | | | | | | | – | | | – | | | – | | – |
Outstanding at end of year | | | | | | | | | | | | 37 | | | – | | | – | | – |
Of which exercisable: | | | | | | | | | | | | – | | | – | | | – | | – |
| | | | | | | | | | | | | | | | | | | | |
| | | ISOP(b) | | ESOS(b) |
| | Number
(000s) |
| | Weighted average
ex. price (£) | | Number
(000s) |
| | Weighted average
ex. price (£) |
| | | 2006 | | | 2005 | | | 2006 | | 2005 | | 2006 | | | 2005 | | | 2006 | | 2005 |
| | | | | | | | |
Outstanding at beginning of year | | 105,081 | | | 137,870 | | | 4.46 | | 4.59 | | 2,552 | | | 4,546 | | | 4.16 | | 4.13 |
Granted in the year | | – | | | 220 | | | – | | 5.66 | | – | | | – | | | – | | – |
Exercised/released in the year | | (25,122 | ) | | (8,489 | ) | | 4.04 | | 4.90 | | (768 | ) | | (1,924 | ) | | 4.20 | | 4.09 |
Less: forfeited in the year | | (2,452 | ) | | (24,520 | ) | | 4.75 | | 5.06 | | (36 | ) | | (70 | ) | | 4.71 | | 4.10 |
Less: expired in the year | | – | | | – | | | – | | – | | – | | | – | | | – | | – |
Outstanding at end of year | | 77,507 | | | 105,081 | | | 4.59 | | 4.46 | | 1,748 | | | 2,552 | | | 4.14 | | 4.16 |
Of which exercisable: | | 14,544 | | | 19,970 | | | 4.29 | | 4.95 | | 1,748 | | | 2,552 | | | 4.14 | | 4.16 |
| | | | | | | | | | | | | | | | | | | | |
| | | Woolwich ESOP(b) | | Woolwich SAYE(b) |
| | Number
(000s) |
| | Weighted average
ex. price (£) | | Number
(000s) |
| | Weighted average
ex. price (£) |
| | | 2006 | | | 2005 | | | 2006 | | 2005 | | 2006 | | | 2005 | | | 2006 | | 2005 |
| | | | | | | | |
Outstanding at beginning of year | | 1,260 | | | 2,301 | | | 3.80 | | 3.80 | | 3 | | | 164 | | | 3.32 | | 3.32 |
Granted in the year | | – | | | – | | | – | | – | | – | | | – | | | – | | – |
Exercised/released in the year | | (560 | ) | | (1,030 | ) | | 3.79 | | 3.81 | | (1 | ) | | (148 | ) | | 3.32 | | 3.32 |
Less: forfeited in the year | | – | | | (11 | ) | | – | | 3.78 | | (2 | ) | | (13 | ) | | 3.32 | | 3.34 |
Less: expired in the year | | – | | | – | | | – | | – | | – | | | – | | | – | | – |
Outstanding at end of year | | 700 | | | 1,260 | | | 3.81 | | 3.80 | | – | | | 3 | | | – | | 3.32 |
Of which exercisable: | | 700 | | | 1,260 | | | 3.81 | | 3.80 | | – | | | 3 | | | – | | 3.32 |
Notes
| (a) | Options/award granted over Absa Group Limited shares. |
| (b) | Options/award granted over Barclays PLC shares. |
| | |
Barclays PLC Annual Report 2006 | | 225 |
| |
Notes to the accounts
For the year ended 31st December 2006
51 Share-based payments (continued)
The table below shows the weighted average share price at the date of exercise/release of shares:
| | | | |
| | | 2006
£ | | 2005
£ |
| | |
Sharesave(a) | | 6.95 | | 5.63 |
Sharepurchase(a)(d) | | 6.59 | | 5.67 |
ESAS(a)(d) | | 6.78 | | 5.69 |
BGI EOP(b) | | 81.08 | | 42.98 |
AGLSIT(c) | | 8.81 | | 7.59 |
ISOP(a) | | 6.75 | | 5.86 |
ESOS(a) | | 6.64 | | 5.89 |
Woolwich ESOP(a) | | 6.65 | | 5.78 |
Woolwich SAYE(a) | | 6.09 | | 5.61 |
The exercise price range, the weighted average contractual remaining life, weighted average fair values at the date of grant, and number of options outstanding (including those exercisable) at the balance sheet date are as follows:
| | | | | | | | | | | | | | | | |
| | | 2006 | | 2005 |
Exercise Price Range | | Weighted
average
exercise
price
£ | | Weighted
average
remaining
contractual
life in years | | Weighted
average
fair value
per option
£ | | Number of
options
outstanding | | Weighted
average
exercise
price
£ | | Weighted
average
remaining
contractual
life in years | | Weighted
average
fair value
per option
£ | | Number of
options
outstanding |
| | | | | | | | |
Sharesave(a) | | | | | | | | | | | | | | | | |
£2.50-£3.49 | | 3.16 | | 1 | | 1.89 | | 2,177,121 | | 3.15 | | 1 | | 1.83 | | 3,081,016 |
£3.50-£4.49 | | 4.00 | | 2 | | 1.62 | | 59,531,668 | | 3.98 | | 3 | | 1.72 | | 82,605,783 |
£4.50-£5.49 | | 5.11 | | 4 | | 1.88 | | 17,220,043 | | – | | – | | – | | – |
Sharepurchase(a)(d) | | – | | 3 | | 6.18 | | 2,472,304 | | – | | 3 | | 5.57 | | 1,125,779 |
ESAS(a)(d) | | – | | 3 | | 5.80 | | 142,359,494 | | – | | 3 | | 4.98 | | 121,515,063 |
PSP(a)(d) | | – | | 2 | | 5.80 | | 42,832,026 | | – | | 2 | | 3.99 | | 20,268,666 |
BGI EOP(b) | | | | | | | | | | | | | | | | |
£6.11-£13.99 | | 10.21 | | 5 | | 3.50 | | 602,914 | | 10.28 | | 7 | | 3.56 | | 1,659,353 |
£14.00-£20.11 | | 20.11 | | 7 | | 5.59 | | 771,553 | | 20.11 | | 8 | | 5.59 | | 1,447,696 |
£20.12-£56.94 | | 39.02 | | 8 | | 10.39 | | 1,716,714 | | 39.10 | | 9 | | 10.41 | | 2,335,000 |
£56.95-£91.43 | | 81.24 | | 9 | | 21.18 | | 3,838,000 | | – | | – | | – | | – |
Absa BEE(c) | | | | | | | | | | | | | | | | |
£3.50-£6.35 | | 3.50-5.03 | | 3 | | 1.08 | | 73,152,300 | | 4.41-6.35 | | 4 | | 1.36 | | 73,152,300 |
AGLSIT(c) | | | | | | | | | | | | | | | | |
£1.92-£8.19 | | 3.87 | | 7 | | 1.32 | | 18,778,473 | | 4.38 | | 8 | | 1.42 | | 25,125,744 |
AGLSOT(c) | | | | | | | | | | | | | | | | |
£3.50-£6.35 | | 3.50-5.03 | | 3 | | 1.08 | | 4,847,400 | | 4.41-6.35 | | 4 | | 1.36 | | 5,359,400 |
AGLESAS(c)(d) | | – | | 3 | | 7.66 | | 37,059 | | – | | – | | – | | – |
ISOP(a) | | | | | | | | | | | | | | | | |
£2.50-£3.49 | | 3.26 | | 6 | | 0.75 | | 11,055,352 | | 3.26 | | 7 | | 0.75 | | 24,896,000 |
£3.50-£4.49 | | 3.90 | | 4 | | 1.70 | | 2,411,828 | | 3.90 | | 5 | | 1.70 | | 4,665,028 |
£4.50-£5.49 | | 4.85 | | 7 | | 2.44 | | 63,746,456 | | 4.89 | | 8 | | 2.40 | | 75,158,832 |
£5.50-£6.49 | | 5.65 | | 8 | | 2.61 | | 293,096 | | 5.64 | | 8 | | 2.51 | | 361,096 |
ESOS(a) | | | | | | | | | | | | | | | | |
£1.50-£2.49 | | – | | – | | – | | – | | 2.22 | | 1 | | 0.59 | | 22,024 |
£2.50-£3.49 | | 3.47 | | 1 | | 1.49 | | 45,288 | | 3.47 | | 2 | | 1.49 | | 70,576 |
£3.50-£4.49 | | 4.16 | | 2 | | 1.19 | | 1,702,612 | | 4.20 | | 3 | | 1.14 | | 2,459,094 |
Woolwich ESOP(a) | | | | | | | | | | | | | | | | |
£2.50-£3.49 | | 3.29 | | 3 | | 2.94 | | 128,624 | | 3.29 | | 4 | | 2.94 | | 240,826 |
£3.50-£4.49 | | 3.93 | | 3 | | 2.63 | | 571,836 | | 3.92 | | 4 | | 2.63 | | 1,019,612 |
Woolwich SAYE(a) | | | | | | | | | | | | | | | | |
£2.50-£3.49 | | – | | – | | – | | – | | 3.32 | | – | | 2.76 | | 2,632 |
Notes
| (a) | Options/award granted over Barclays PLC shares. |
| (b) | Options/award granted over Barclays Global Investors UK Holdings Limited shares. |
| (c) | Options/award granted over Absa Group Limited shares. |
| | |
| 226 | | Barclays PLC Annual Report 2006 |
| |
51 Share-based payments (continued)
The exercise price range, the weighted average contractual remaining life, weighted average fair values at the date of grant and number of options excercisable at the balance sheet date are as follows:
| | | | | | | | | | | | | | | | |
| | | 2006 | | 2005 |
Exercise Price Range | | Weighted
average
exercise
price
£ | | Weighted
average
remaining
contractual
life in years | | Weighted
average
fair value
per option
£ | | Number
of options
exercisable | | Weighted
average
exercise
price
£ | | Weighted
average
remaining
contractual
life in years | | Weighted
average
fair value
per option
£ | | Number of
options
exercisable |
| | | | | | | | |
Sharesave(a) | | | | | | | | | | | | | | | | |
£2.50-£3.49 | | – | | – | | – | | – | | 3.13 | | – | | 1.44 | | 705,372 |
£3.50-£4.49 | | 3.87 | | – | | 2.00 | | 914,953 | | 3.50 | | – | | 2.10 | | 483,296 |
ESAS(a)(d) | | – | | 2 | | 4.40 | | 9,606,775 | | – | | 2 | | 5.35 | | 9,547,928 |
BGI EOP(b) | | | | | | | | | | | | | | | | |
£6.11-£13.99 | | 10.21 | | 5 | | 3.50 | | 602,914 | | 10.25 | | 7 | | 3.55 | | 1,586,017 |
£14.00-£20.11 | | 20.11 | | 7 | | 5.59 | | 183,471 | | 20.11 | | 8 | | 5.59 | | 164,980 |
£20.12-£56.94 | | 38.30 | | 8 | | 10.19 | | 263,298 | | – | | – | | – | | – |
AGLSIT(c) | | | | | | | | | | | | | | | | |
£1.92-£8.19 | | 2.43 | | 5 | | 0.79 | | 5,304,576 | | 2.82 | | 6 | | 0.92 | | 3,390,000 |
ISOP(a) | | | | | | | | | | | | | | | | |
£2.50-£3.49 | | 3.26 | | 6 | | 0.75 | | 5,287,352 | | – | | – | | – | | – |
£3.50-£4.49 | | 3.90 | | 4 | | 1.70 | | 2,411,828 | | 3.89 | | 5 | | 2.94 | | 4,340,220 |
£4.50-£5.49 | | 5.23 | | 5 | | 2.07 | | 6,771,920 | | 5.24 | | 6 | | 2.15 | | 15,488,464 |
£5.50-£6.49 | | 5.62 | | 5 | | 2.10 | | 73,096 | | 5.62 | | 6 | | 2.10 | | 141,096 |
ESOS(a) | | | | | | | | | | | | | | | | |
£1.50-£2.49 | | – | | – | | – | | – | | 2.22 | | 1 | | 0.59 | | 22,024 |
£2.50-£3.49 | | 3.47 | | 1 | | 1.49 | | 45,288 | | 3.47 | | 2 | | 1.49 | | 70,576 |
£3.50-£4.49 | | 4.16 | | 2 | | 1.19 | | 1,702,612 | | 4.20 | | 3 | | 1.14 | | 2,459,094 |
Woolwich ESOP(a) | | | | | | | | | | | | | | | | |
£2.50-£3.49 | | 3.29 | | 3 | | 2.94 | | 128,624 | | 3.29 | | 4 | | 2.94 | | 240,826 |
£3.50-£4.49 | | 3.93 | | 3 | | 2.63 | | 571,836 | | 3.92 | | 4 | | 2.63 | | 1,019,612 |
Woolwich SAYE(a) | | | | | | | | | | | | | | | | |
£2.50-£3.49 | | – | | – | | – | | – | | 3.32 | | – | | 2.76 | | 2,632 |
The total intrinsic value of options exercised and the total cash received for those options exercised during the period is:
| | | | | | | | | | |
| | | Total intrinsic value
of options exercised | | Total cash received
for options exercised |
| | | 2006
£m | | 2005
£m | | 2004
£m | | 2006
£m | | 2005
£m |
| | | | | |
Sharesave(a) | | 58 | | 57 | | 39 | | 72 | | 81 |
BGI EOP(b) | | 134 | | 139 | | 119 | | 44 | | 49 |
AGLSIT(c) | | 36 | | 11 | | – | | 18 | | 5 |
ISOP(a) | | 68 | | 9 | | 5 | | 101 | | 42 |
ESOS(a) | | 2 | | 4 | | 2 | | 3 | | 8 |
Woolwich ESOP(a) | | 2 | | 2 | | 3 | | 2 | | 4 |
Woolwich SAYE(a) | | – | | – | | 1 | | – | | – |
Total | | 300 | | 222 | | 169 | | 240 | | 189 |
Notes
| (a) | Option/award granted over Barclays PLC shares. |
| (b) | Option/award granted over Barclays Global Investors UK Holdings Limited shares. |
| (c) | Option/award granted over Absa Group Limited shares. |
| | |
Barclays PLC Annual Report 2006 | | 227 |
| |
Notes to the accounts
For the year ended 31st December 2006
51 Share-based payments (continued)
The aggregate intrinsic value of options either fully vested or expected to vest at the balance sheet date and the total intrinsic value of options exercisable at the balance sheet date is:
| | | | | | | | |
| | | Aggregate intrinsic
value of options fully
vested or expected to vest | | Total intrinsic value of options exercisable |
| | 2006
£m | | 2005
£m | | 2006
£m | | 2005
£m |
| | | | |
Sharesave(a) | | 243 | | 188 | | 3 | | 3 |
BGI EOP(b) | | 233 | | 172 | | 76 | | 80 |
Absa BEE(c) | | 299 | | 215 | | – | | – |
AGLSIT(c) | | 89 | | 123 | | 35 | | 35 |
AGLSOT(c) | | 16 | | 16 | | – | | – |
ISOP(a) | | 210 | | 176 | | 44 | | 24 |
ESOS(a) | | 6 | | 5 | | 6 | | 5 |
Woolwich ESOP(a) | | 2 | | 3 | | 2 | | 3 |
Total | | 1,098 | | 898 | | 166 | | 150 |
The total fair value of shares vested during the year was: | | | | | | | | |
| | | | | 2006 £m | | 2005 £m | | 2004 £m |
ESAS(a)(d) | | | | 227 | | 125 | | 80 |
The total unrecognised share-based payment cost and weighted average vesting period related to awards that have not yet vested is:
| | | | | | | | |
| | | Total unrecognised
share-based payment cost | | Weighted average remaining
vesting period |
| | | 2006
£m | | 2005
£m | | 2006
Years | | 2005
Years |
| | | | |
Sharesave(a) | | 60 | | 67 | | 3 | | 3 |
Sharepurchase(a)(d) | | 11 | | 5 | | 2 | | 3 |
ESAS(a)(d) | | 121 | | 122 | | 2 | | 2 |
PSP(a)(d) | | 64 | | 18 | | 2 | | 2 |
BGI EOP(b) | | 55 | | 15 | | 2 | | 2 |
AGLSIT(c) | | 11 | | 19 | | 2 | | 3 |
AGLSOT(c) | | 2 | | 4 | | 1 | | 1 |
Absa PSP(c)(d) | | 28 | | – | | 2 | | – |
ISOP(a) | | 3 | | 23 | | – | | 1 |
Total | | 355 | | 273 | | n/a | | n/a |
There were no modifications to the share-based payment arrangements in the years 2006, 2005 and 2004. As at 31st December 2006, the total liability arising from cash-settled share-based payment transactions was £7m (2005: £nil).
At 31st December 2006, 6.9 million (2005: 5.4 million) options were outstanding under the terms of the BGI EOP (which would represent a 7.3% interest if exercised). Employees in BGI own 9.4% of the shares in Barclays Global Investors UK Holdings Limited (2005: 12.1%). If all the current options were exercised, £400.5m (2005: £137.5m) would be subscribed. Since the scheme was introduced, options over 19.3 million (2005: 17.1 million) shares have been exercised, of which 8.3 million are still held by employees and represent a minority interest in the Group.
At 31st December 2006, there were 73.2 million, 18.8 million and 4.8 million options granted over Absa Group Limited shares under the Absa Group Limited Black Economic Empowerment Transaction, Absa Group Limited Share Incentive Trust and Absa Group Limited Share Ownership Trust respectively. In aggregate, these options would represent a 14.4% interest in Absa Group Limited if exercised.
Notes
| (a) | Options/award granted over Barclays PLC shares. |
| (b) | Options/award granted over Barclays Global Investors UK Holdings Limited shares. |
| (c) | Options/award granted over Absa Group Limited shares. |
| | |
| 228 | | Barclays PLC Annual Report 2006 |
| |
52 Financial risks
The main sources of financial risk that the Group faces are those arising from financial instruments – credit risk, market risk, liquidity risk and insurance risk. The Group devotes considerable resources to maintaining effective controls to manage, measure and mitigate each of these risks and regularly reviews its risk management procedures and systems to ensure that these are the best available.
Financial instruments are fundamental to the Group’s business and constitute the core element of its operations. The risks associated with financial instruments are a significant component of the risks faced by the Group. Financial instruments create, modify or reduce the liquidity, credit and market risks of the Group’s balance sheet. These risks and the Group’s policies and objectives for managing such risks are outlined below.
Credit Risk Management
Credit risk is the risk of suffering financial loss from any of the Group’s customers, clients or market counterparties failing to fulfil their contractual obligations to the Group. Credit risk mainly arises from loans and advances, but may also arise where the downgrading of an entity’s credit rating causes the fair value of the Group’s investment in that entity’s financial instruments to fall.
Credit risk is the Group’s most significant risk and it deploys considerable resources to controlling it. Nearly two-thirds of risk-based economic capital is allocated to businesses for credit risks.
Each business has an embedded risk management team reporting to a Business Risk Director who reports to the Group Risk Director, who leads the Group Risk function, including credit, which is charged with devising and implementing Group risk policy, such as ensuring:
| · | | maximum exposure guidelines are in place relating to the exposures to any individual customer or counterparty; |
| · | | country risk policy specifies risk appetite by country and avoids excessive concentrations of credit in individual countries; and |
| · | | policies are in place that limit lending to certain industries, for example, commercial real estate. |
A Credit Committee of Directors and experienced senior managers formulates overall Group credit policy and resolves all significant credit policy issues.
Credit Risk Measurement
The Group’s credit rating systems use statistical modelling techniques throughout its business which assist the Group in front line credit decisions, such as managing its existing portfolios and making new commitments.
The Group assesses the credit quality and assigns an internal risk rating to all borrowers and other counterparties, including retail customers. Each internal rating corresponds to the statistical probability of a customer in that rating class defaulting within the next 12-month period. The probability of default, the exposure at default and the loss given default are calculated for all loan portfolios. This allows the Group to monitor its exposures, enabling it to derive measures such as Risk Tendency. Risk Tendency is a statistical estimate of the average loss for each loan portfolio for a 12-month period, taking into account the size of the portfolio and its risk characteristics under current economic conditions, and is used to track the change in risk as the portfolio of loans changes over time.
The Group monitors its financial exposure to individual counterparties, to industries and countries to ensure that no undue concentrations of credit arise.
Credit Risk Mitigation
The Group uses a wide variety of techniques to reduce credit risk on its lending. The most basic of these is performing an assessment of the ability of a borrower to service the proposed level of borrowing without distress. In addition, the Group commonly obtains security for the funds advanced, such as in the case of a retail or commercial mortgage, a reverse repurchase agreement, or a commercial loan with a floating charge over book debts and inventories. The Group also uses various forms of specialised legal agreements to reduce risk, including netting agreements which permit it to offset positive and negative balances with customers in certain circumstances to minimise the exposure at default, financial guarantees, and the use of covenants in commercial lending agreements. Other techniques include the use of credit derivatives and other forms of credit collateral.
In addition, the Group actively manages its exposures to clients, countries and industries through diversification, minimising individual concentrations.
| | |
Barclays PLC Annual Report 2006 | | 229 |
| |
Notes to the accounts
For the year ended 31st December 2006
52 Financial risks (continued)
Market Risk Management
Market risk is the risk that Barclays earnings or capital, or its ability to meet business objectives, will be adversely affected by changes in the level or volatility of market rates or prices such as interest rates, credit spreads, commodity prices, equity prices and foreign exchange rates.
The main market risks arise from trading activities. Barclays is also exposed to non-trading market risks to asset and liability management and to the Pension Fund.
To facilitate the management, control, measurement and reporting of market risk, Barclays has grouped market risk into three broad categories:
| · | | Trading market risk. These risks arise in trading transactions where Barclays acts as principal with clients or with the market. Barclays policy is that market risks arising from trading activities are concentrated in Barclays Capital. |
| · | | Asset and liability risk. These risks arise from banking activities, including those incurred on non-trading positions such as customer assets and liabilities and capital balances. |
| · | | Other market risks. Barclays also incurs market risks that are assessed under a slightly different framework. The principal risks of this type are defined benefit pension scheme risk and asset management structural market risk. |
The Board approves the market risk appetite for all types of market risk. The Market Risk Director is responsible for the market risk control framework and, under delegated authority from the Risk Director, sets a limit framework within the context of the approved market risk appetite. A daily market risk report summarises Barclays market risk exposures against agreed limits. This daily report is sent to the Risk Director, the Market Risk Director, the Finance Director and the appropriate Business Risk Directors.
In Barclays Capital, the Head of Market Risk is responsible for implementing the market risk control framework. Day to day responsibility for market risk lies with the senior management of Barclays Capital, supported by the Market Risk Management team that operates independently of the trading areas. Daily market risk reports are produced for the main Barclays Capital business areas covering the six main types of trading market risk: interest rate, inflation, credit spread, commodity, equity and foreign exchange. A more detailed trading market risk presentation is produced fortnightly and discussed at Barclays Capital’s Traded Products Risk Review meeting. The attendees at this meeting include the senior managers from Barclays Capital and the central market risk team.
Market risk measurement
The measurement techniques used to measure and control market risk include:
| · | | Annual Earnings at Risk; |
Daily Value at Risk (DVaR)
DVaR is an estimate of the potential loss which might arise from unfavourable market movements, if the current positions were to be held unchanged for one business day, measured to a confidence level of 98%. Daily losses exceeding the DVaR figure are likely to occur, on average, twice in every 100 business days.
Stress Tests
Stress tests provide an indication of the potential size of losses that could arise in extreme conditions. The stress tests carried out by Barclays Capital include risk factor stress testing, where stress movements are applied to each of the six risk categories namely interest rate, inflation, credit spread, commodity, equity and foreign exchange rate; emerging market stress testing where emerging market portfolios are subject to stress movements; and ad hoc stress testing, which includes applying stress scenarios to the trading risk book.
If potential stressed losses exceed the trigger limit, the positions captured by the stress test are reviewed and discussed by Barclays Capital Market Risk and the respective senior management.
Outside Barclays Capital, stress testing is carried out by the business centres and is reviewed by the senior management and business-level asset and liability committees. The stress testing is tailored to the business and is typically scenario analysis and historical stress movements applied to respective portfolios.
Annual Earnings at Risk (AEaR)
AEaR measures the sensitivity of annual earnings to shocks in market rates at the 99th percentile for change over a one-year period. This shock is consistent with the standardised interest rate shock recommended by the Basel II framework for assessing banking book interest rate risk.
AEaR is used to measure structural interest rate market risk and structural asset management risk.
Economic capital
The total average economic capital required by the Group is determined by risk assessment models and after considering the Group’s estimated portfolio effects. Methodologies are used for both operational and business risks to calculate risk sensitive capital allocations. The Group regularly enhances its economic capital methodologies and benchmarks outputs to external reference points. Economic capital is allocated on a consistent basis across all of the Group’s businesses and risk activities, and these allocations reflect varying levels of risk.
Trading Market Risk
Group policy is to concentrate trading activities in Barclays Capital. This includes transactions where Barclays Capital acts as principal with clients or with the market. For maximum efficiency, client and market activities are managed together.
| | |
| 230 | | Barclays PLC Annual Report 2006 |
| |
52 Financial risks (continued)
In anticipation of future customer demand, Barclays maintains access to market liquidity by quoting bid and offer prices with other market makers and carries an inventory of capital market and treasury instruments, including a broad range of cash, securities and derivatives. Trading positions and any offsetting hedges are established as appropriate to accommodate customer or Barclays requirements.
Analysis of trading market risk exposures
The table below shows the DVaR statistics for Barclays Capital’s trading activities:
Barclays Capital DVaR: Summary table for 2006 and 2005
| | | | | | | | | | | | | | |
| | | 12 months to
31st December 2006 | | 12 months to
31st December 2005(b) |
| | | Average
£m |
| | High(a)
£m | | Low(a)
£m | | Average
£m |
| | High(a)
£m | | Low(a)
£m |
Interest rate risk | | 20.1 | | | 28.8 | | 12.3 | | 25.4 | | | 44.8 | | 15.4 |
Credit spread risk | | 24.3 | | | 33.1 | | 17.9 | | 23.0 | | | 28.3 | | 19.0 |
Commodities risk | | 11.3 | | | 21.6 | | 5.7 | | 6.8 | | | 11.4 | | 4.5 |
Equities risk | | 7.8 | | | 11.6 | | 5.8 | | 6.0 | | | 8.3 | | 3.9 |
Foreign exchange risk | | 4.0 | | | 7.7 | | 1.8 | | 2.8 | | | 5.4 | | 1.6 |
Diversification effect | | (30.4 | ) | | n/a | | n/a | | (32.0 | ) | | n/a | | n/a |
Total DVaR | | 37.1 | | | 43.2 | | 31.3 | | 32.0 | | | 40.7 | | 25.4 |
The graph below shows the history of total DVaR on a daily basis for 2005 and 2006.
DVaR in 2005 and 2006 (daily values)(£m)
DVaR Back-testing
Barclays recognises the importance of assessing the effectiveness of its DVaR model. The main approach employed is the technique known as back-testing, which counts the number of days when trading losses are bigger than the estimated DVaR figure. The regulatory standard for backtesting is to measure DVaR assuming a one-day holding period with a 99% level of confidence. For Barclays Capital’s regulatory trading book, there were no instances in 2006 or 2005, of a daily trading revenue loss exceeding the corresponding back-testing DVaR.
Asset and Liability Market Risk
Interest rate exposures arise from mismatches of fixed rate assets and liabilities in UK banking operations and are passed to Treasury where these positions are aggregated and the net position passed to the market via Barclays Capital. Due mainly to timing considerations, market risk can arise when some of the net position stays with Treasury. Similarly, market risk can arise due to the impact of interest rates on customer behaviour. The latter risk is managed and measured by the Retail Market Risk team using behavioural models. The positions are converted into wholesale swap or option exposures, passed to Treasury and managed by the process outlined above.
Structural interest rate risk arises from the variability of income from non-interest bearing products, managed variable rate products and the Group’s equity. Structural foreign currency risk results from holding non-Sterling investments in subsidiaries, branches, associates or joint ventures. These structural risks are managed by Treasury.
Interest rate exposures, structural interest rate risk and other market risks may be managed through the use of derivatives. Where this is the case, hedge accounting is obtained where possible so that the benefits of Risk management are reflected in the financial statements.
Liquidity Risk Management
Liquidity risk is the risk that the Group is unable to meet its payment obligations when they fall due or to replace funds when they are withdrawn.
The Group has several core liquidity management strategies. The first is to project future cash flows and make plans to address normal operating requirements, as well as variable scenarios and contingencies. The second is to manage day to day funding, by controlling intraday liquidity in real
Notes
| (a) | The high (and low) DVaR figures reported for each category did not necessarily occur on the same day as the high (and low) DVaR reported as a whole. Consequently a diversification effect number for the high (and low) DVaR figures would not be meaningful and it is therefore omitted from the above table. |
| (b) | 2005 has been restated. The increase reflects the inclusion of Absa Capital. |
| | |
Barclays PLC Annual Report 2006 | | 231 |
| |
Notes to the accounts
For the year ended 31st December 2006
52 Financial risks (continued)
time and by forecasting future cash flows to ensure that requirements can be met. The third is maintaining a diverse and stable funding base. Finally, the Group maintains a portfolio of highly marketable assets that can easily be liquidated as protection against any unforeseen interruption to cash flows.
The Group’s funding base comprises a mixture of different funding sources, including retail and corporate customer deposits, and short- and long-term debt issuances. Although current accounts are repayable on demand and savings accounts at short notice, the Group’s broad base of customers – numerically and by depositor type – helps to protect against unexpected fluctuations. Such accounts form a stable funding base for the Group’s operations and liquidity needs. Important factors in assuring liquidity are competitive rates and the maintenance of depositors’ confidence. Such confidence is based on a number of factors including the Group’s reputation, the strength of earnings and the Group’s financial position.
The ability to raise funds is in part dependent on maintaining the Bank’s credit rating. The funding impact of a credit downgrade is regularly estimated. Whilst the impact of a single downgrade may affect the price at which funding is available, the effect on liquidity is not considered material in Group terms.
Liquidity Risk Measurement
Based on principles agreed by the FSA, monitoring and reporting of liquidity risk involves the measurement of cash flows and projections for the next day, week and month.
In addition to cash flow management, Treasury also monitors unmatched medium-term assets and the level and type of undrawn lending commitments, the usage of overdraft facilities and the impact of contingent liabilities such as standby letters of credit and guarantees.
Treasury develops and implements the process for submitting the Group’s projected cash flows to stress scenarios. The output of stress testing informs the Group’s contingency funding plan. This is maintained by Treasury and is aligned with the Group and country business resumption plans to encompass decision-making authorities, internal and external communication and, in the event of a systems failure, the restoration of liquidity management and payment systems.
Sources of liquidity are regularly reviewed to maintain a wide diversification by currency, geography, provider, product and term. An important source of structural liquidity is provided by our core retail deposits in the UK, Europe and Africa, comprising mainly current accounts and savings accounts. To avoid reliance on a particular group of customers or market sectors, the distribution of sources and the maturity profile of deposits are also carefully managed.
An analysis of the Group’s liquidity position is presented at Note 56.
Insurance Risk Management
Insurance risk is the risk that the Group will have to make higher than anticipated payments to settle claims arising from its long-term and short-term insurance businesses.
Long-term insurance business
For long-term insurance contracts where death is the insured risk, the most significant factors that could detrimentally affect the frequency and severity of claims are the incidence of disease, such as AIDS, or general changes in lifestyle, such as in eating, exercise and smoking. Where survival is the insured risk, advances in medical care and social conditions are the key factors that increase longevity.
The Group manages its exposure to risk by operating in part as a unit-linked business, prudent product design, applying strict underwriting criteria, transferring risk to reinsurers, managing claims and establishing prudent reserves.
Short-term insurance business
For payment protection contracts where inability to make payments under a loan contract is the insured risk, the most significant factors are the health of the policyholder and the possibility of unemployment which depends upon, among other things, long-term and short-term economic factors. The Group manages its exposure to such risks through prudent product design, efficient claims management, prudent reserving methodologies and bases, regular product, economic and market reviews and regular adequacy tests on the size of the reserves.
Absa insures property and motor vehicles, for which the most significant factors that could affect the frequency and severity of claims are climatic change and crime. Absa manages its exposure to risk by diversifying insurance risks accepted and transferring risk to reinsurers.
Derivatives held for risk management
The Group uses both cash flow hedging and fair value hedging techniques to achieve hedge accounting for interest rate portions. For example, cash flow hedge relationships have been established between interest rate swaps receive fixed with pay variable legs and cash flows generated by customer assets on which we receive a variable interest rate (including forecast customer assets which are expected to be originated in the future). The cash flows on the variable leg of the swap and the interest flows on the assets are both based on the same benchmark rate (e.g. LIBOR or EURIBOR). Fair value hedge relationships are also established between interest rate swaps with receive fixed/pay variable legs and fixed rate liabilities (e.g. issued loan stock).
Various techniques are used to ensure that the hedge relationship results in an effective reduction in the risks intended to be hedged. For cash flow hedging a hypothetical interest rate swap is created which would completely offset the risks which are being hedged. The ratio of movements (due to changes in the risk being hedged) in the fair value of this instrument (or the hedged item for fair value hedges) and the movement in the fair value of the actual interest rate swaps used as hedges is calculated to determine how close the actual interest rate swap is to a perfect hedging instrument. In some circumstances these ratios are calculated for various scenarios and regression analysis is used to assess the level of effectiveness.
| | |
| 232 | | Barclays PLC Annual Report 2006 |
| |
53 Interest rate risk
The Group’s objectives and policies in managing the interest rate risks that arise in connection with the use of financial instruments are set out in Note 52 under the headings ‘Market risk Management’ and ‘Asset and Liability Market Risk’. The table below summarises the repricing profiles of the Group’s financial instruments and other assets and liabilities as at 31st December 2006. Items are allocated to time periods by reference to the earlier of the next contractual interest rate repricing date and the maturity date.
As at 31st December 2006
| | | | | | | | | | | | | | | | | | | | |
| | | Not
more
than
three
months
£m | | Over three
months
but not
more
than six
months
£m | | Over six
months
but not
more
than one
year
£m | | Over one
year
but not
more
than three
years
£m | | Over three
years
but not
more
than five
years
£m | | Over five
years
but not
more
than ten
years
£m | | Over
ten
years
£m | | Trading
portfolio
and
derivatives
£m | | Non-
interest
bearing
£m | | Total
£m |
Assets | | | | | | | | | | | | | | | | | | | | |
| Cash and balances at central banks | | 7,012 | | – | | – | | – | | – | | – | | – | | – | | 333 | | 7,345 |
| Items in course of collection from other banks | | 654 | | – | | – | | – | | – | | – | | – | | – | | 1,754 | | 2,408 |
Trading portfolio assets | | – | | – | | – | | – | | – | | – | | – | | 177,867 | | – | | 177,867 |
| Financial assets designated at fair value: | | | | | | | | | | | | | | | | | | | | |
– held on own account | | 17,831 | | 834 | | 387 | | 1,121 | | 2,544 | | 1,131 | | 6,231 | | – | | 1,720 | | 31,799 |
– held in respect of linked liabilities to customers
under investment contracts | | 5,351 | | 369 | | 740 | | 860 | | 1,196 | | 2,912 | | 12,946 | | – | | 58,424 | | 82,798 |
| Derivative financial instruments | | – | | – | | – | | – | | – | | – | | – | | 138,353 | | – | | 138,353 |
| Loans and advances to banks | | 25,012 | | 483 | | 233 | | 211 | | 69 | | 36 | | 1 | | – | | 4,881 | | 30,926 |
| Loans and advances to customers | | 195,500 | | 15,048 | | 14,225 | | 24,850 | | 9,485 | | 6,399 | | 7,699 | | – | | 9,094 | | 282,300 |
| Available for sale financial instruments | | 25,899 | | 2,427 | | 7,780 | | 3,737 | | 3,234 | | 6,701 | | 1,091 | | – | | 834 | | 51,703 |
| Reverse repurchase agreements and cash collateral on securities borrowed | | 157,592 | | 4,721 | | 8,338 | | – | | 3,431 | | – | | – | | – | | 8 | | 174,090 |
Total financial assets | | 434,851 | | 23,882 | | 31,703 | | 30,779 | | 19,959 | | 17,179 | | 27,968 | | 316,220 | | 77,048 | | 979,589 |
Non-financial assets | | – | | – | | – | | – | | – | | – | | – | | – | | 17,198 | | 17,198 |
Total assets | | 434,851 | | 23,882 | | 31,703 | | 30,779 | | 19,959 | | 17,179 | | 27,968 | | 316,220 | | 94,246 | | 996,787 |
Not more than three months includes instruments at floating interest rates.
| | |
Barclays PLC Annual Report 2006 | | 233 |
| |
Notes to the accounts
For the year ended 31st December 2006
53 Interest rate risk (continued)
As at 31st December 2006 (continued)
| | | | | | | | | | | | | | | | | | | | | | | | | | | |
| | | Not
more
than
three
months
£m |
| | Over three
months
but not
more
than six
months
£m |
| | Over six
months
but not
more
than one
year
£m |
| | Over one
year
but not
more
than three
years
£m |
| | Over three
years
but not
more
than five
years
£m |
| | Over five
years
but not
more
than ten
years
£m |
| | Over
ten
years
£m |
| | Trading
portfolio
and
derivatives
£m | | Non-
interest
bearing
£m | | Total
£m |
Liabilities | | | | | | | | | | | | | | | | | | | | | | | | | | | |
Deposits from other banks | | 72,353 | | | 1,377 | | | 763 | | | 351 | | | – | | | 7 | | | 199 | | | – | | 4,512 | | 79,562 |
| Items in course of transmission due to other banks | | 20 | | | – | | | – | | | – | | | – | | | – | | | – | | | – | | 2,201 | | 2,221 |
Customer accounts | | 207,023 | | | 3,965 | | | 3,963 | | | 2,371 | | | 506 | | | 43 | | | 216 | | | – | | 38,667 | | 256,754 |
Trading portfolio liabilities | | – | | | – | | | – | | | – | | | – | | | – | | | – | | | 71,874 | | – | | 71,874 |
| Financial liabilities designated at fair value: | | | | | | | | | | | | | | | | | | | | | | | | | | | |
– held on own account | | 20,186 | | | 5,635 | | | 3,800 | | | 1,538 | | | 1,607 | | | 1,843 | | | 774 | | | – | | 18,604 | | 53,987 |
– liabilities to customers under investment contracts | | 6,931 | | | 372 | | | 730 | | | 806 | | | 1,164 | | | 2,875 | | | 12,794 | | | – | | 58,965 | | 84,637 |
| Derivative financial instruments | | – | | | – | | | – | | | – | | | – | | | – | | | – | | | 140,697 | | – | | 140,697 |
Debt securities in issue | | 92,649 | | | 5,624 | | | 2,430 | | | 4,020 | | | 1,630 | | | 3,249 | | | 1,535 | | | – | | – | | 111,137 |
| Repurchase agreements and cash collateral on securities lent | | 122,612 | | | 6,132 | | | 2,348 | | | 1,662 | | | – | | | – | | | 2,818 | | | – | | 1,384 | | 136,956 |
| Subordinated liabilities | | 3,192 | | | 377 | | | 21 | | | 1,074 | | | 783 | | | 3,475 | | | 4,842 | | | – | | 22 | | 13,786 |
Total financial liabilities | | 524,966 | | | 23,482 | | | 14,055 | | | 11,822 | | | 5,690 | | | 11,492 | | | 23,178 | | | 212,571 | | 124,355 | | 951,611 |
Non-financial liabilities | | – | | | – | | | – | | | – | | | – | | | – | | | – | | | – | | 17,786 | | 17,786 |
Total liabilities | | 524,966 | | | 23,482 | | | 14,055 | | | 11,822 | | | 5,690 | | | 11,492 | | | 23, 178 | | | 212,571 | | 142,141 | | 969,397 |
Interest rate repricing gap | | (90,115 | ) | | 400 | | | 17,648 | | | 18,957 | | | 14,269 | | | 5,687 | | | 4,790 | | | | | | | |
Cumulative gap | | (90,115 | ) | | (89,715 | ) | | (72,067 | ) | | (53,110 | ) | | (38,841 | ) | | (33,154 | ) | | (28,364 | ) | | | | | | |
Not more than three months includes instruments at floating interest rates.
Expected repricing and maturity dates do not differ significantly from the contract dates, except for:
| · | | Trading Portfolio Assets and Liabilities, which may not be held to maturity as part of the Group’s trading strategies. For these instruments, which are mostly held by Barclays Capital, liquidity and repricing risk is managed through the Daily Value at Risk (DVaR) methodology, see Note 52 for more information. |
| · | | Retail deposits, which are repayable on demand or at short notice. These instruments form a stable base for the Group’s operations and liquidity needs because of the broad base of customers – numerically and by depositor type. |
| | |
| 234 | | Barclays PLC Annual Report 2006 |
| |
53 Interest rate risk (continued)
As at 31st December 2005
| | | | | | | | | | | | | | | | | | | | |
| | | Not
more
than
three
months
£m | | Over three
months
but not
more
than six
months
£m | | Over six
months
but not
more
than one
year
£m | | Over one
year
but not
more
than three
years
£m | | Over three
years
but not
more
than five
years
£m | | Over five
years
but not
more
than ten
years
£m | | Over
ten
years
£m | | Trading
portfolio
and
derivatives
£m | | Non-
interest
bearing
£m | | Total
£m |
Assets | | | | | | | | | | | | | | | | | | | | |
| Cash and balances at central banks | | 3,695 | | – | | – | | – | | – | | – | | – | | – | | 211 | | 3,906 |
| Items in course of collection from other banks | | 397 | | – | | – | | – | | – | | – | | – | | – | | 1,504 | | 1,901 |
Trading portfolio assets | | – | | – | | – | | – | | – | | – | | – | | 155,723 | | – | | 155,723 |
| Financial assets designated at fair value: | | | | | | | | | | | | | | | | | | | | |
– held on own account | | 2,750 | | 1,968 | | 336 | | 612 | | 590 | | 806 | | 4,611 | | – | | 1,231 | | 12,904 |
– held in respect of linked liabilities to customers under investment contracts | | 1,936 | | 76 | | 458 | | 1,834 | | 930 | | 3,252 | | 12,852 | | – | | 61,855 | | 83,193 |
| Derivative financial instruments | | – | | – | | – | | – | | – | | – | | – | | 136,823 | | – | | 136,823 |
| Loans and advances to banks | | 27,454 | | 589 | | 11 | | 18 | | 6 | | 14 | | 1,206 | | – | | 1,807 | | 31,105 |
| Loans and advances to customers | | 175,632 | | 26,086 | | 12,255 | | 22,248 | | 10,874 | | 5,574 | | 6,657 | | – | | 9,570 | | 268,896 |
| Available for sale financial instruments | | 17,458 | | 7,275 | | 5,561 | | 11,756 | | 2,188 | | 4,164 | | 3,621 | | – | | 1,474 | | 53,497 |
| Reverse repurchase agreements and cash collateral on securities borrowed | | 152,509 | | 3,656 | | 3,863 | | 99 | | 215 | | 26 | | 30 | | – | | – | | 160,398 |
Total financial assets | | 381,831 | | 39,650 | | 22,484 | | 36,567 | | 14,803 | | 13,836 | | 28,977 | | 292,546 | | 77,652 | | 908,346 |
Non-financial assets | | – | | – | | – | | – | | – | | – | | – | | – | | 16,011 | | 16,011 |
Total assets | | 381,831 | | 39,650 | | 22,484 | | 36,567 | | 14,803 | | 13,836 | | 28,977 | | 292,546 | | 93,663 | | 924,357 |
Not more than three months includes instruments at floating interest rates.
| | |
Barclays PLC Annual Report 2006 | | 235 |
| |
Notes to the accounts
For the year ended 31st December 2006
53 Interest rate risk (continued)
As at 31st December 2005 (continued)
| | | | | | | | | | | | | | | | | | | | | | | | | | | |
| | | Not
more
than
three
months
£m |
| | Over three
months
but not
more
than six
months
£m |
| | Over six
months
but not
more
than one
year
£m |
| | Over one
year
but not
more
than three
years
£m |
| | Over three
years
but not
more
than five
years
£m |
| | Over five
years
but not
more
than ten
years
£m |
| | Over
ten
years
£m |
| | Trading
portfolio
and
derivatives
£m | | Non-
interest
bearing
£m | | Total
£m |
Liabilities | | | | | | | | | | | | | | | | | | | | | | | | | | | |
Deposits from other banks | | 69,837 | | | 2,418 | | | 1,000 | | | 243 | | | 264 | | | 9 | | | 165 | | | – | | 1,191 | | 75,127 |
| Items in course of transmission due to other banks | | 117 | | | 16 | | | – | | | – | | | – | | | – | | | – | | | – | | 2,208 | | 2,341 |
Customer accounts | | 191,633 | | | 6,948 | | | 4,038 | | | 2,917 | | | 1,119 | | | 845 | | | 581 | | | – | | 30,603 | | 238,684 |
Trading portfolio liabilities | | – | | | – | | | – | | | – | | | – | | | – | | | – | | | 71,564 | | – | | 71,564 |
| Financial liabilities designated at fair value: | | | | | | | | | | | | | | | | | | | | | | | | | | | |
– held on own account | | 8,127 | | | 3,497 | | | 7,243 | | | 3,016 | | | 3,308 | | | 5,629 | | | 2,557 | | | – | | 8 | | 33,385 |
– liabilities to customers under investment contracts | | – | | | – | | | – | | | – | | | – | | | – | | | – | | | – | | 85,201 | | 85,201 |
| Derivative financial instruments | | – | | | – | | | – | | | – | | | – | | | – | | | – | | | 137,971 | | – | | 137,971 |
Debt securities in issue | | 82,044 | | | 5,187 | | | 1,981 | | | 4,890 | | | 2,463 | | | 206 | | | 6,557 | | | – | | – | | 103,328 |
| Repurchase agreements and cash collateral on securities lent | | 106,389 | | | 7,186 | | | 2,994 | | | 431 | | | – | | | – | | | 4,170 | | | – | | 8 | | 121,178 |
| Subordinated liabilities | | 3,909 | | | 459 | | | 97 | | | 955 | | | 500 | | | 2,688 | | | 3,738 | | | – | | 117 | | 12,463 |
Total financial liabilities | | 462,056 | | | 25,711 | | | 17,353 | | | 12,452 | | | 7,654 | | | 9,377 | | | 17,768 | | | 209,535 | | 119,336 | | 881,242 |
Non-financial liabilities | | – | | | – | | | – | | | – | | | – | | | – | | | – | | | – | | 18,685 | | 18,685 |
Total liabilities | | 462,056 | | | 25,711 | | | 17,353 | | | 12,452 | | | 7,654 | | | 9,377 | | | 17,768 | | | 209,535 | | 138,021 | | 899,927 |
Interest rate repricing gap | | (80,225 | ) | | 13,939 | | | 5,131 | | | 24,115 | | | 7,149 | | | 4,459 | | | 11,209 | | | | | | | |
Cumulative gap | | (80,225 | ) | | (66,286 | ) | | (61,155 | ) | | (37,040 | ) | | (29,891 | ) | | (25,432 | ) | | (14,223 | ) | | | | | | |
Not more than three months includes instruments at floating interest rates.
Expected repricing and maturity dates do not differ significantly from the contract dates, except for:
| · | | Trading Portfolio Assets and Liabilities, which may not be held to maturity as part of the Group’s trading strategies. For these instruments, which are mostly held by Barclays Capital, liquidity and repricing risk is managed through the Daily Value at Risk (DVaR) methodology, see Note 52 for more information. |
| · | | Retail deposits which are repayable on demand or at short notice form a stable base for the Group’s operations and liquidity needs because of the broad base of customers – numerically and by depositor type. |
Effective interest rates
Weighted average effective interest rates were as follows:
| | | | |
As at 31st December | | 2006
% | | 2005
% |
Assets | | | | |
Cash and balances at central banks | | 4.1 | | 3.1 |
Loans and advances to banks | | 4.1 | | 3.5 |
Loans and advances to customers | | 6.5 | | 4.5 |
Available for sale financial instruments | | 4.6 | | 4.2 |
Reverse repurchase agreements and cash collateral on securities borrowed | | 4.2 | | 3.4 |
Liabilities | | | | |
Deposits from other banks | | 4.3 | | 3.6 |
Customer accounts | | 3.4 | | 2.5 |
Debt securities in issue | | 5.0 | | 4.5 |
Repurchase agreements and cash collateral on securities lent | | 4.2 | | 3.1 |
Subordinated liabilities | | 5.9 | | 5.6 |
| | |
| 236 | | Barclays PLC Annual Report 2006 |
| |
54 Credit risk
The Group’s objectives and policies in managing the credit risks that arise in connection with the use of financial instruments and other credit exposures are set out in Note 52 under the heading ‘Credit Risk Management’.
Concentrations of credit risk
A concentration of credit risk exists when a number of counterparties are engaged in similar activities and have similar economic characteristics that would cause their ability to meet contractual obligations to be similarly affected by changes in economic or other conditions. The concentrations of credit exposure described below are not proportionally related to credit loss. Some segments of the Group’s portfolio have and are expected to have proportionally higher credit charges in relation to the exposure than others. Moreover, the volatility of credit loss is different in different parts of the portfolio. Thus comparatively large credit charges could arise in parts of the portfolio not mentioned below.
The single biggest geographical concentration of credit risk is in the UK. Gross credit exposure to borrowers in the UK (based on the location of the customer) was £170.5bn at 31st December 2006 (2005: £163.8bn). In the UK, the Group’s collateral policy differs by line of business and product but is broadly consistent with UK market practice. Netting agreements are made with wholesale counterparties whenever practical and to the extent that such agreements are legally enforceable. Outside the UK, the Group’s geographical spread ensures a wide variety of counterparties in the main areas of operation in Europe, the United States and other areas of the world.
Barclays also has significant concentrations of exposures to home loans and banks. All these concentrations may spread across one or more of the line items described below.
Maximum exposure to credit risk
The Group’s maximum exposure to credit risk is the carrying amount of assets held on the balance sheet. The actual exposure to credit risk is less than this in most cases.
Cash and demand balances at central banks– By their nature, the Group expects that these balances will have close to nil credit risk attached to them.
Items in the course of collection from other banks/loans and advances to banks –The Group maintains relationships with a wide range of banking counterparties. While banking counterparties are generally of high quality, the Group also monitors its exposure to individual banks to ensure that the credit risk is diversified. The Group is also exposed to credit risk with banks on other financial assets including derivatives and also on letters of credit and guarantees. The Group may require collateral before entering into a credit commitment with another bank, depending on the type of the financial product and the counterparty involved. Netting agreements are secured whenever possible and to the extent that such agreements are legally enforceable.
Trading portfolio assets/financial assets designated at fair value/available for sale financial investments– The Group’s practice is to take into account credit risk when valuing these assets. The Group therefore expects little additional credit risk on these instruments, other than the credit risk component of trading market risk on these instruments. The trading market risk is monitored through the Daily Value at Risk (DVaR) methodology. In addition, many of the trading portfolio and available for sale assets held are of very high quality, including treasury bills and government bonds. An analysis of trading portfolio assets by instrument type is included in Note 12 and a similar analysis for available for sale assets is included in Note 18.
Derivative financial instruments– In addition to including the credit risk on these instruments in the DVaR methodology, the Group also uses a number of other techniques to reduce its exposure to credit risk on these instruments. These techniques include master netting agreements, which do not qualify for offset under IAS 32 but which give a legally enforceable right to net receivables and payables with the same counterparty, and the obtaining of cash collateral from counterparties who have a net exposure to the Group through Collateral Service Agreements.
Loans and advances to customers– A significant portion of the Group’s loans and advances to customers comprises lending in respect of home loans. Home loan lending totalled £98.2bn at 31st December 2006 (2005: £89.5bn), which represents 34% (2005: 33%) of loans to customers. As collateral, Barclays requires a first mortgage over the residential property for the acquisition of which the loan is made. For other lending to customers, the Group may require various forms of credit protection, including the use of netting agreements and covenants and the obtaining of security such as mortgages or charges. Finally, the Group actively seeks to manage credit risk by ensuring diversification of its lending across clients, regions and industries. An analysis of loans to customers according to geographic region and industry sector is set out in Note 16.
Reverse repurchase agreements and cash collateral on securities borrowed– By their nature these balances have a low credit risk, as they are largely secured by obtaining collateral from counterparties. The Group’s policy is to seek collateral at the outset equal to 100% to 105% of the loan amount, with further collateral calls made as required.
Barclays manages its credit exposure by counterparty exposure which may be spread across one or more of the line items described above.
| | |
Barclays PLC Annual Report 2006 | | 237 |
| |
Notes to the accounts
For the year ended 31st December 2006
55 Currency risk
Foreign currency exposures comprise structural foreign currency exposures, which arise from investments in the Group’s overseas operations and other investments; and those originating in trading activities.
The Group holds foreign currency net investments and is exposed to fluctuations in the Group’s share of their net assets measured in their functional currencies caused by movements in exchange rates between these currencies and Sterling, the Group’s reporting currency.
The carrying value of the Group’s foreign currency net investments and the foreign currency borrowings and derivatives used to hedge them were as follows:
| | | | | | | | | | | | | | | | |
| | | 2006 | | 2005 |
Functional currency of the operation involved | | Foreign
currency
net
investments
£m | | Borrowings
which hedge
the net
investments
£m | | Derivatives
which hedge
the net
investments
£m | | Remaining
structural
currency
exposures
£m | | Foreign
currency
net
investments
£m | | Borrowings
which hedge
the net
investments
£m | | Derivatives
which hedge
the net
investments
£m | | Remaining
structural
currency
exposures
£m |
United States Dollar | | 4,462 | | 2,141 | | – | | 2,321 | | 2,254 | | 428 | | – | | 1,826 |
Euro | | 3,409 | | 1,185 | | – | | 2,224 | | 3,326 | | 1,017 | | – | | 2,309 |
Rand | | 2,849 | | – | | 2,665 | | 184 | | 3,143 | | – | | 3,056 | | 87 |
Japanese Yen | | 2,754 | | 202 | | 2,527 | | 25 | | 3,118 | | 195 | | 2,914 | | 9 |
Swiss Franc | | 2,071 | | 158 | | 1,900 | | 13 | | 138 | | 129 | | – | | 9 |
Other | | 2,069 | | 205 | | 410 | | 1,454 | | 1,736 | | 222 | | 228 | | 1,286 |
| | | | | | | | | |
Total | | 17,614 | | 3,891 | | 7,502 | | 6,221 | | 13,715 | | 1,991 | | 6,198 | | 5,526 |
In addition to the above, the Group has US Dollar and Euro Preference Shares and reserve capital instruments in issue that are treated as equity under IFRS.
In accordance with Group policy, as at 31st December 2006 and 31st December 2005, there were no material net currency exposures in the non-trading book relating to transactional (or non-structural) positions that would give rise to net currency gains and losses recognised in the profit and loss account.
The Daily Value at Risk (DVaR) methodology is used by the Group to estimate potential losses arising from exposure to market risk, including currency risk, on trading positions. The tables shown on page 231 show an analysis of DVaR for the market risk exposures in Barclays Capital.
| | |
| 238 | | Barclays PLC Annual Report 2006 |
| |
56 Liquidity risk
The Group’s objectives and policies in managing the liquidity risks that arise in connection with the use of financial instruments are set out in Note 52 under the heading ‘Liquidity Risk Management’.
The following table provides detail on the contractual maturity of all financial instruments and other assets and liabilities:
| | | | | | | | | | | | | | | | | | | | | | | | | |
At 31st December 2006 | | On
demand
£m |
| | Not more
than three
months
£m |
| | Over three
months
but not
more
than six
months
£m |
| | Over six
months
but not
more
than one
year
£m |
| | Over one
year
but not
more
than three
years
£m |
| | Over three
years
but not
more
than five
years
£m |
| | Over five
years
but not
more
than ten
years
£m |
| | Over
ten
years
£m | | Total
£m |
Assets | | | | | | | | | | | | | | | | | | | | | | | | | |
Cash and balances with central banks | | 7,050 | | | 295 | | | – | | | – | | | – | | | – | | | – | | | – | | 7,345 |
| Items in course of collection from other banks | | 1,782 | | | 626 | | | – | | | – | | | – | | | – | | | – | | | – | | 2,408 |
Trading portfolio assets | | 1,528 | | | 28,433 | | | 7,034 | | | 10,540 | | | 27,738 | | | 21,606 | | | 28,809 | | | 52,179 | | 177,867 |
| Financial assets designated at fair value: | | | | | | | | | | | | | | | | | | | | | | | | | |
– held on own account | | 1,899 | | | 1,975 | | | 295 | | | 942 | | | 5,692 | | | 5,239 | | | 4,018 | | | 11,739 | | 31,799 |
– held in respect of linked liabilities to customers under investment contracts | | 59,462 | | | 1,026 | | | 366 | | | 999 | | | 2,856 | | | 1,266 | | | 2,994 | | | 13,829 | | 82,798 |
Derivative financial instruments | | – | | | 11,991 | | | 7,803 | | | 12,570 | | | 24,072 | | | 28,249 | | | 30,949 | | | 22,719 | | 138,353 |
Loans and advances to banks | | 2,887 | | | 18,806 | | | 800 | | | 3,063 | | | 1,595 | | | 1,130 | | | 1,012 | | | 1,633 | | 30,926 |
Loans and advances to customers | | 32,492 | | | 44,424 | | | 9,901 | | | 15,508 | | | 31,986 | | | 27,668 | | | 38,036 | | | 82,285 | | 282,300 |
| Available for sale financial investments | | 564 | | | 9,084 | | | 2,516 | | | 8,733 | | | 13,854 | | | 4,621 | | | 6,999 | | | 5,332 | | 51,703 |
| Reverse repurchase agreements and cash collateral on securities borrowed | | 32,795 | | | 117,077 | | | 4,670 | | | 11,025 | | | 1,375 | | | 6,939 | | | 168 | | | 41 | | 174,090 |
Total financial assets | | 140,459 | | | 233,737 | | | 33, 385 | | | 63,380 | | | 109,168 | | | 96,718 | | | 112,985 | | | 189,757 | | 979,589 |
Non-financial assets | | – | | | – | | | – | | | – | | | – | | | – | | | – | | | 17,198 | | 17,198 |
Total assets | | 140,459 | | | 233,737 | | | 33,385 | | | 63,380 | | | 109,168 | | | 96,718 | | | 112,985 | | | 206,955 | | 996,787 |
Liabilities | | | | | | | | | | | | | | | | | | | | | | | | | |
Deposits from banks | | 19,163 | | | 55,534 | | | 1,418 | | | 891 | | | 593 | | | 1,406 | | | 367 | | | 190 | | 79,562 |
| Items in course of collection to other banks | | 2,154 | | | 67 | | | – | | | – | | | – | | | – | | | – | | | – | | 2,221 |
Customer accounts | | 153,642 | | | 89,079 | | | 5,594 | | | 3,604 | | | 1,655 | | | 1,436 | | | 807 | | | 937 | | 256,754 |
Trading portfolio liabilities | | 114 | | | 11,578 | | | 2,885 | | | 1,709 | | | 12,242 | | | 7,495 | | | 17,740 | | | 18,111 | | 71,874 |
| Financial liabilities designated at fair value: | | | | | | | | | | | | | | | | | | | | | | | | | |
– held on own account | | 6 | | | 13,958 | | | 6,297 | | | 5,143 | | | 7,090 | | | 8,447 | | | 10,978 | | | 2,068 | | 53,987 |
– liabilities to customers under investment contracts | | 56, 612 | | | 1,481 | | | 367 | | | 912 | | | 2,976 | | | 1,446 | | | 3,737 | | | 17,106 | | 84,637 |
Derivative financial instruments | | 59 | | | 12,040 | | | 7,589 | | | 13,143 | | | 25,510 | | | 30,499 | | | 32,010 | | | 19,847 | | 140,697 |
Debt securities in issue | | 17 | | | 70,805 | | | 8,669 | | | 5,311 | | | 10,408 | | | 3,798 | | | 4,017 | | | 8,112 | | 111,137 |
| Repurchase agreements and cash collateral on securities lent | | 2,230 | | | 119,048 | | | 6,362 | | | 2,659 | | | 2,305 | | | – | | | – | | | 4,352 | | 136,956 |
| Subordinated liabilities | | – | | | – | | | – | | | – | | | 236 | | | 911 | | | 4,623 | | | 8,016 | | 13,786 |
Total financial liabilities | | 233,997 | | | 373,590 | | | 39,181 | | | 33,372 | | | 63,015 | | | 55,438 | | | 74,279 | | | 78,739 | | 951,611 |
Non-financial liabilities | | – | | | – | | | – | | | – | | | – | | | – | | | – | | | 17,786 | | 17,786 |
Total liabilities | | 233,997 | | | 373,590 | | | 39,181 | | | 33,372 | | | 63,015 | | | 55,438 | | | 74,279 | | | 96,525 | | 969,397 |
Cumulative liquidity gap | | (93,538 | ) | | (233,391 | ) | | (239,187 | ) | | (209,179 | ) | | (163,026 | ) | | (121,746 | ) | | (83,040 | ) | | 27,390 | | 27,390 |
| | |
Barclays PLC Annual Report 2006 | | 239 |
| |
Notes to the accounts
For the year ended 31st December 2006
56 Liquidity risk (continued)
The following table provides detail on the contractual maturity of all financial instruments and other assets and liabilities:
| | | | | | | | | | | | | | | | | | | | | | | | | |
At 31st December 2005 | | On
demand
£m |
| | Not more
than three
months
£m |
| | Over three
months
but not
more
than six
months
£m |
| | Over six
months
but not
more
than one
year
£m |
| | Over one
year
but not
more
than three
years
£m |
| | Over three
years
but not
more
than five
years
£m |
| | Over five
years
but not
more
than ten
years
£m |
| | Over
ten
years
£m | | Total
£m |
Assets | | | | | | | | | | | | | | | | | | | | | | | | | |
Cash and balances with central banks | | 3,793 | | | 113 | | | – | | | – | | | – | | | – | | | – | | | – | | 3,906 |
| Items in course of collection from other banks | | 1,526 | | | 375 | | | – | | | – | | | – | | | – | | | – | | | – | | 1,901 |
Trading portfolio assets | | 610 | | | 21,430 | | | 9,401 | | | 14,328 | | | 27,077 | | | 17,775 | | | 22,906 | | | 42,196 | | 155,723 |
Financial assets designated at fair value: | | | | | | | | | | | | | | | | | | | | | | | | | |
– held on own account | | 1,436 | | | 484 | | | 103 | | | 555 | | | 2,157 | | | 822 | | | 836 | | | 6,511 | | 12,904 |
– held in respect of linked liabilities to customers under investment contracts | | 62,636 | | | 1,039 | | | 75 | | | 546 | | | 1,841 | | | 939 | | | 3,261 | | | 12,856 | | 83,193 |
Derivative financial instruments | | 1,839 | | | 16,254 | | | 6,924 | | | 8,479 | | | 29,086 | | | 20,246 | | | 29,618 | | | 24,377 | | 136,823 |
Loans and advances to banks | | 3,929 | | | 15,917 | | | 2,000 | | | 3,175 | | | 1,844 | | | 787 | | | 1,048 | | | 2,405 | | 31,105 |
Loans and advances to customers | | 33,999 | | | 43,884 | | | 11,407 | | | 21,340 | | | 32,713 | | | 25,476 | | | 30,030 | | | 70,047 | | 268,896 |
Available for sale financial investments | | 476 | | | 3,775 | | | 2,765 | | | 7,744 | | | 19,449 | | | 9,488 | | | 4,798 | | | 5,002 | | 53,497 |
| Reverse repurchase agreements and cash collateral on securities borrowed | | 690 | | | 149,276 | | | 3,923 | | | 4,028 | | | 1,537 | | | 888 | | | 26 | | | 30 | | 160,398 |
Total financial assets | | 110,934 | | | 252,547 | | | 36,598 | | | 60,195 | | | 115,704 | | | 76,421 | | | 92,523 | | | 163,424 | | 908,346 |
Non-financial assets | | – | | | – | | | – | | | – | | | – | | | – | | | – | | | 16,011 | | 16,011 |
Total assets | | 110,934 | | | 252,547 | | | 36,598 | | | 60,195 | | | 115,704 | | | 76,421 | | | 92,523 | | | 179,435 | | 924,357 |
Liabilities | | | | | | | | | | | | | | | | | | | | | | | | | |
Deposits from banks | | 13,924 | | | 54,620 | | | 2,488 | | | 1,168 | | | 442 | | | 725 | | | 1,288 | | | 472 | | 75,127 |
| Items in the course of collection due to other banks | | 2,238 | | | 103 | | | – | | | – | | | – | | | – | | | – | | | – | | 2,341 |
Customer accounts | | 144,015 | | | 72,590 | | | 9,282 | | | 2,606 | | | 2,981 | | | 1,594 | | | 2,223 | | | 3,393 | | 238,684 |
Trading portfolio liabilities | | 6 | | | 1,580 | | | 1,448 | | | 4,047 | | | 18,424 | | | 10,172 | | | 17,293 | | | 18,594 | | 71,564 |
| Financial liabilities designated at fair value: | | | | | | | | | | | | | | | | | | | | | | | | | |
– held on own account | | 6 | | | 6,692 | | | 3,186 | | | 7,293 | | | 3,582 | | | 3,718 | | | 5,882 | | | 3,026 | | 33,385 |
| Liabilities to customers under investment contracts | | 79,985 | | | – | | | – | | | 83 | | | 191 | | | 213 | | | 1,518 | | | 3,211 | | 85,201 |
Derivative financial instruments | | 1,512 | | | 17,238 | | | 6,594 | | | 8,436 | | | 29,740 | | | 21,359 | | | 29,360 | | | 23,732 | | 137,971 |
Debt securities in issue | | 894 | | | 54,112 | | | 13,985 | | | 8,777 | | | 8,795 | | | 2,876 | | | 307 | | | 13,582 | | 103,328 |
| Repurchase agreements and cash collateral on securities lent | | 275 | | | 104,063 | | | 7,217 | | | 3,208 | | | 431 | | | – | | | – | | | 5,984 | | 121,178 |
| Subordinated liabilities | | 2 | | | 185 | | | 2 | | | 74 | | | 28 | | | 721 | | | 4,672 | | | 6,779 | | 12,463 |
Total financial liabilities | | 242,857 | | | 311,183 | | | 44,202 | | | 35,692 | | | 64,614 | | | 41,378 | | | 62,543 | | | 78,773 | | 881,242 |
Non-financial liabilities | | – | | | – | | | – | | | – | | | – | | | – | | | – | | | 18,685 | | 18,685 |
Total liabilities | | 242,857 | | | 311,183 | | | 44,202 | | | 35,692 | | | 64,614 | | | 41,378 | | | 62,543 | | | 97,458 | | 899,927 |
Cumulative liquidity gap | | (131,923 | ) | | (190,559 | ) | | (198,163 | ) | | (173,660 | ) | | (122,570 | ) | | (87,527 | ) | | (57,547 | ) | | 27,104 | | 24,430 |
Expected maturity dates do not differ significantly from the contract dates, except for:
| · | | Trading Portfolio Assets and Liabilities and derivative financial instruments, which may not be held to maturity as part of the Group’s trading strategies. For these instruments, which are mostly held by Barclays Capital, liquidity and repricing risk is managed through the Daily Value at Risk (DVaR) methodology. |
| · | | Retail deposits which are repayable on demand or at short notice. These instruments form a stable base for the Group’s operations and liquidity needs because of the broad base of customers – both numerically and by depositor type. |
| · | | Financial assets designated at fair value held in respect of linked liabilities, which are managed with the associated liabilities. |
| | |
| 240 | | Barclays PLC Annual Report 2006 |
| |
57 Insurance risk
The Group’s objectives and policies in managing the insurance risks that arise in connection with the use of financial instruments are set out in Note 52 under the heading ‘Insurance Risk Management’.
Concentration of insurance risk
The Group considers that the concentration of insurance risk that is most relevant to the Group financial statements is according to the type of cover offered and the location of insured risk. The following table shows the maximum amounts payable under all of the Group’s insurance products. It ignores the probability of insured events occurring and the contribution from investments backing the insurance policies. The table shows the broad product types and the location of the insured risk, before and after the impact of reinsurance that represents the risk that is passed to other insurers.
| | | | | | | | | | | | | | |
| | | 2006 | | 2005 |
| | | Before
Reinsurance
£m | | Reinsurance
£m |
| | After
Reinsurance
£m | | Before
Reinsurance
£m | | Reinsurance
£m |
| | After
Reinsurance
£m |
Total benefits insured by product type | | | | | | | | | | | | | | |
Long-term insurance contracts | | 24,934 | | (9,445 | ) | | 15,489 | | 28,877 | | (12,128 | ) | | 16,749 |
Short-term insurance contracts | | 39,870 | | (901 | ) | | 38,969 | | 57,049 | | (753 | ) | | 56,296 |
Total benefits insured | | 64,804 | | (10,346 | ) | | 54,458 | | 85,926 | | (12,881 | ) | | 73,045 |
| | | | | | | | | | | | | | |
| | | 2006 | | 2005 |
| | | Before
Reinsurance
£m | | Reinsurance
£m |
| | After
Reinsurance
£m | | Before
Reinsurance
£m | | Reinsurance
£m |
| | After
Reinsurance
£m |
Total benefits insured by geographic location | | | | | | | | | | | | | | |
United Kingdom | | 25,403 | | (8,010 | ) | | 17,393 | | 28,687 | | (8,697 | ) | | 19,990 |
Other European Union | | 3,317 | | (1,802 | ) | | 1,515 | | 5,418 | | (2,981 | ) | | 2,437 |
Africa | | 36,084 | | (534 | ) | | 35,550 | | 51,821 | | (1,203 | ) | | 50,618 |
Total benefits insured | | 64,804 | | (10,346 | ) | | 54,458 | | 85,926 | | (12,881 | ) | | 73,045 |
Reinsurer credit risk
For the long-term business, reinsurance programmes are in place to restrict the amount of cover to any single life. The reinsurance cover is spread across highly rated companies to diversify the risk of reinsurer solvency. Net insurance reserves include a margin to reflect reinsurer credit risk.
| | |
Barclays PLC Annual Report 2006 | | 241 |
| |
Notes to the accounts
For the year ended 31st December 2006
58 Fair value of financial instruments
The fair value of a financial instrument is the amount for which an asset could be exchanged, or a liability settled, in an arms-length transaction between knowledgeable willing parties.
The following table summarises the carrying amounts of financial assets and financial liabilities presented on the Group’s balance sheet, and their fair values:
| | | | | | | | | | | |
| | | | | | 2006 | | 2005 |
| | | Notes | | | Carrying
amount
£m | | Fair
value
£m | | Carrying
amount
£m | | Fair
value
£m |
Financial assets: | | | | | | | | | | | |
Cash and balances at central banks | | (a | ) | | 7,345 | | 7,345 | | 3,906 | | 3,906 |
Items in the course of collection from other banks | | (a | ) | | 2,408 | | 2,408 | | 1,901 | | 1,901 |
Trading portfolio assets | | (b | ) | | 177,867 | | 177,867 | | 155,723 | | 155,723 |
Financial assets designated at fair value: | | | | | | | | | | | |
– held on own account | | (b | ) | | 31,799 | | 31,799 | | 12,904 | | 12,904 |
– held in respect of linked liabilities to customers under investment contracts | | (b | ) | | 82,798 | | 82,798 | | 83,193 | | 83,193 |
Derivative financial instruments | | (b | ) | | 138,353 | | 138,353 | | 136,823 | | 136,823 |
Loans and advances to banks | | (c | ) | | 30,926 | | 30,895 | | 31,105 | | 31,094 |
Loans and advances to customers | | (c | ) | | 282,300 | | 282,061 | | 268,896 | | 268,786 |
Available for sale financial investments | | (b | ) | | 51,703 | | 51,703 | | 53,497 | | 53,497 |
Reverse repurchase agreements and cash collateral on securities borrowed | | (c | ) | | 174,090 | | 174,090 | | 160,398 | | 160,398 |
Financial liabilities: | | | | | | | | | | | |
Deposits from banks | | (d | ) | | 79,562 | | 79,436 | | 75,127 | | 75,145 |
Items in the course of collection due to other banks | | (a | ) | | 2,221 | | 2,221 | | 2,341 | | 2,341 |
Customer accounts | | (d | ) | | 256,754 | | 256,661 | | 238,684 | | 238,608 |
Trading portfolio liabilities | | (b | ) | | 71,874 | | 71,874 | | 71,564 | | 71,564 |
Financial liabilities designated at fair value: held on own account | | (b | ) | | 53,987 | | 53,987 | | 33,385 | | 33,385 |
Liabilities to customers under investment contracts | | (g | ) | | 84,637 | | 84,637 | | 85,201 | | 85,201 |
Derivative financial instruments | | (b | ) | | 140,697 | | 140,697 | | 137,971 | | 137,971 |
Debt securities in issue | | (e | ) | | 111,137 | | 111,131 | | 103,328 | | 103,294 |
Repurchase agreements and cash collateral on securities lent | | (d | ) | | 136,956 | | 136,956 | | 121,178 | | 121,178 |
Subordinated liabilities | | (f | ) | | 13,786 | | 13,976 | | 12,463 | | 13,610 |
Notes
| (a) | Fair value approximates carrying value due to the minimal credit losses and short-term nature of the financial assets and liabilities. |
| (b) | Financial instruments at fair value (including those held for trading, designated at fair value, derivatives and available for sale) are either priced with reference to a quoted market price for that instrument or by using a valuation model. Where the fair value is calculated using a valuation model, the methodology is to calculate the expected cash flows under the terms of each specific contract and then discount these values back to a present value. The expected cash flows for each contract are determined either directly by reference to actual cash flows implicit in observable market prices or through modelling cash flows using appropriate financial markets pricing models. Wherever possible these models use as their basis observable market prices and rates including, for example, interest rate yield curves, equities and commodities prices, option volatilities and currency rates. |
The process of calculating fair value on illiquid instruments or from a valuation model may require estimation of certain pricing parameters, assumptions or model characteristics. These estimates are calibrated against industry standards, economic models and observed transaction prices. Changes to assumptions or estimated levels can potentially impact the fair value of an instrument as reported. The effect of changing these assumptions, for those financial instruments for which the fair values were measured using valuation techniques that are determined in full or in part on assumptions that are not supported by observable market prices, to a range of reasonably possible alternative assumptions, would be to increase the fair value by up to £139m (2005: £121m) or to decrease the fair value by up to £123m (2005: £87m). The decrease in fair value was arrived at by imposing more conservative assumptions in the estimation of valuation model inputs. The increase in fair value was arrived at by taking less conservative assumptions in the estimation of valuation model inputs and less conservative assumptions over the uncertainty of valuation models. These variations in the assumptions have been estimated on a product by product basis and form part of the Bank’s internal control processes over the determination of fair value.
The valuation model used for a particular instrument, the quality and liquidity of market data used for pricing, other fair value adjustments not specifically captured by the model, market data and assumptions or estimates in these are all subject to internal review and approval procedures and consistent application between accounting periods.
The net asset fair value position of those financial instruments where the fair values were estimated using valuation techniques which are based in full or in part on assumptions that are not supported by observable market prices decreased to £2,814m for the year ended 31st December 2006 (31st December 2005: £2,877m). In many cases these changes in fair values were offset by changes in fair values of other financial instruments, which were priced in active markets or valued by using a valuation technique which is supported by observable market prices or rates, or by transactions which have been realised.
| | |
| 242 | | Barclays PLC Annual Report 2006 |
| |
58 Fair value of financial instruments (continued)
| (c) | The fair value for loans and advances, and other lending (including reverse repurchase agreements and cash collateral on securities borrowed) is estimated using discounted cash flows, applying either market rates where practicable or, where the counterparty is a bank, rates currently offered by other financial institutions for placings with similar characteristics. In many cases the fair value approximates carrying value because the instruments are short term in nature or have interest rates that reprice frequently. |
| (d) | Fair values of deposit liabilities payable on demand (interest free, interest bearing and savings deposits) approximate to their carrying value. The fair value of all other deposits and other borrowings (including repurchase agreements and cash collateral on securities lent) is estimated using discounted cash flows, applying either market rates, where practicable, or rates currently offered by the Group for deposits of similar remaining maturities. |
| (e) | Fair values of short-term debt securities in issue are approximately equal to their carrying amount. Fair values of other debt securities in issue are based on quoted prices where available, or where these are unavailable, are estimated using other valuation techniques. |
| (f) | The estimated fair values for dated and undated convertible and non-convertible loan capital were based upon quoted market rates for the issue concerned or equivalent issues with similar terms and conditions. |
| (g) | The fair value of liabilities to customers under investment contracts approximates carrying value. |
The Group considers that, given the lack of an established market, the diversity of fee structures and the difficulty of separating the value of the instruments from the value of the overall transaction, it is not meaningful to provide an estimate of the fair value of financial commitments and contingent liabilities.
| | |
Barclays PLC Annual Report 2006 | | 243 |
| |
Notes to the accounts
For the year ended 31st December 2006
59 Segmental reporting
Business segments
The Group reports the results of its operations through eight business segments: UK Banking, Barclaycard, International Retail and Commercial Banking, Barclays Capital, Barclays Global Investors, Barclays Wealth, Barclays Wealth – Closed Life Assurance Business and Head Office and other operations.
UK Banking provides banking solutions to Barclays UK retail and business banking customers. Barclaycard provides credit card services across Europe and the United States. International Retail and Commercial Banking provides banking services to personal and corporate customers in Europe, Africa and the Middle East. Barclays Capital conducts the Group’s investment banking business providing corporate, institutional and government clients with financing and risk management products. Barclays Global Investors provides investment management products and services to international institutional clients. Barclays Wealth provides banking and asset management services to affluent and high net worth clients. Head Office functions and other operations comprise all the Group’s central function costs and other central items including businesses in transition.
During 2006 Barclays realigned a number of reportable business segments to better reflect the type of client served, the nature of the products offered and the associated risks and rewards. The changes have no impact on the Group Income Statement or Balance Sheet, and are summarised as follows:
The majority of Absa Corporate and Merchant Banking, previously reported in International Retail and Commercial Banking, has been relaunched as Absa Capital and is being managed and reported in Barclays Capital. A number of financial institution, large corporate and property clients previously reported within UK Banking are now managed by and reported in Barclays Capital. Certain portfolios previously reported in UK Banking have been reclassified as businesses in transition and are now centrally managed and reported in Head Office functions and other operations.
The structure remains unchanged for Barclays Global Investors, Barclays Wealth, Barclays Wealth – closed life assurance activities and Barclaycard.
All transactions between business segments are conducted on an arms length basis. Internal charges and transfer pricing adjustments are reflected in the performance of each business. Head office functions and other operations contains a centralised treasury function, which deals with the Group’s funding requirements. The funding requirements of each business segment reflects funding at market rates and not internally generated transfer prices and is therefore not separately disclosed within inter-segment net income.
| | | | | | | | | | | | | | | | | | | | | | | | | | | |
| As at 31st December 2006 | | UK
Banking
£m | | | Barclaycard
£m | | | International
Retail and
Commercial
Banking
£m | | | Barclays
Capital
£m | | | Barclays
Global
Investors
£m | | | Barclays
Wealth
£m | | | Barclays
Wealth –
closed life
assurance
activities
£m | | | Head office
functions
and other
operations
£m | | | Total £m | |
| | | | | | | | | |
| Income from external customers, net of insurance claims | | 6,253 | | | 2,816 | | | 3,308 | | | 6,206 | | | 1,670 | | | 1,073 | | | 127 | | | 142 | | | 21,595 | |
Inter-segment income | | (30 | ) | | 121 | | | 29 | | | 61 | | | (5 | ) | | (37 | ) | | 4 | | | (143 | ) | | – | |
| | | | | | | | | |
Total income net of insurance claims | | 6,223 | | | 2,937 | | | 3,337 | | | 6,267 | | | 1,665 | | | 1,036 | | | 131 | | | (1 | ) | | 21,595 | |
| | | | | | | | | |
| Impairment charge and other credit provisions | | (461 | ) | | (1,493 | ) | | (167 | ) | | (42 | ) | | – | | | (2 | ) | | – | | | 11 | | | (2,154 | ) |
| | | | | | | | | |
Segment expenses – external | | (2,439 | ) | | (805 | ) | | (2,170 | ) | | (3,988 | ) | | (940 | ) | | (759 | ) | | (87 | ) | | (1,486 | ) | | (12,674 | ) |
Inter-segment expenses | | (826 | ) | | (249 | ) | | (26 | ) | | (21 | ) | | (11 | ) | | (62 | ) | | (22 | ) | | 1,217 | | | – | |
Total expenses | | (3,265 | ) | | (1,054 | ) | | (2,196 | ) | | (4,009 | ) | | (951 | ) | | (821 | ) | | (109 | ) | | (269 | ) | | (12,674 | ) |
| | | | | | | | | |
| Share of post-tax results of associates and joint ventures | | 5 | | | (8 | ) | | 49 | | | – | | | – | | | – | | | – | | | – | | | 46 | |
| | | | | | | | | |
| Profit on disposal of subsidiaries, associates and joint ventures | | 76 | | | – | | | 247 | | | – | | | – | | | – | | | – | | | – | | | 323 | |
| | | | | | | | | |
Business segment performance before tax | | 2,578 | | | 382 | | | 1,270 | | | 2,216 | | | 714 | | | 213 | | | 22 | | | (259 | ) | | 7,136 | |
| | | | | | | | | |
Additional information | | | | | | | | | | | | | | | | | | | | | | | | | | | |
Depreciation and amortisation | | 95 | | | 45 | | | 180 | | | 132 | | | 13 | | | 12 | | | – | | | 114 | | | 591 | |
Impairment loss – intangible assets | | – | | | – | | | 5 | | | – | | | – | | | – | | | – | | | 2 | | | 7 | |
Capital expenditure(a) | | 217 | | | 99 | | | 193 | | | 246 | | | 406 | | | 44 | | | – | | | 166 | | | 1,371 | |
Investments in associates and joint ventures | | 12 | | | 89 | | | 56 | | | 71 | | | – | | | – | | | – | | | – | | | 228 | |
Total assets | | 139,902 | | | 27,628 | | | 68,848 | | | 657,922 | | | 80,515 | | | 7,285 | | | 7,605 | | | 7,082 | | | 996,787 | |
Total liabilities | | 159,503 | | | 1,909 | | | 37,567 | | | 632,208 | | | 79,366 | | | 26,817 | | | 7,499 | | | 24,528 | | | 969,397 | |
Note
| (a) | Capital expenditure comprises purchased goodwill, intangible assets and property, plant and equipment acquired during the year. |
| | |
| 244 | | Barclays PLC Annual Report 2006 |
| |
59 Segmental reporting (continued)
| | | | | | | | | | | | | | | | | | | | | | | | | | | |
| As at 31st December 2005 | | UK
Banking
£m |
| | Barclaycard
£m |
| | International
Retail and
Commercial
Banking
£m |
| | Barclays
Capital
£m |
| | Barclays
Global
Investors
£m |
| | Barclays
Wealth
£m |
| | Barclays
Wealth –
closed life
assurance
activities
£m |
| | Head office
functions
and other
operations
£m |
| | Total
£m |
|
Income from external customers, net of insurance claims | | 5,712 | | | 2,635 | | | 1,983 | | | 4,388 | | | 1,318 | | | 922 | | | 120 | | | 255 | | | 17,333 | |
Inter-segment income | | 33 | | | 80 | | | – | | | 117 | | | – | | | – | | | – | | | (230 | ) | | – | |
| | | | | | | | | |
| Total income net of insurance claims | | 5,745 | | | 2,715 | | | 1,983 | | | 4,505 | | | 1,318 | | | 922 | | | 120 | | | 25 | | | 17,333 | |
| | | | | | | | | |
| Impairment charge and other credit provisions | | (327 | ) | | (1,098 | ) | | (32 | ) | | (111 | ) | | – | | | (2 | ) | | – | | | (1 | ) | | (1,571 | ) |
| | | | | | | | | |
Segment expenses – external | | (2,545 | ) | | (816 | ) | | (1,343 | ) | | (2,952 | ) | | (769 | ) | | (676 | ) | | (105 | ) | | (1,321 | ) | | (10,527 | ) |
Inter-segment expenses | | (670 | ) | | (162 | ) | | (21 | ) | | (11 | ) | | (10 | ) | | (78 | ) | | (22 | ) | | 974 | | | – | |
Total expenses | | (3,215 | ) | | (978 | ) | | (1,364 | ) | | (2,963 | ) | | (779 | ) | | (754 | ) | | (127 | ) | | (347 | ) | | (10,527 | ) |
| | | | | | | | | |
| Share of post-tax results of associates and joint ventures | | (3 | ) | | 1 | | | 46 | | | – | | | 1 | | | – | | | – | | | – | | | 45 | |
| | | | | | | | | |
| Business segment performance before tax | | 2,200 | | | 640 | | | 633 | | | 1,431 | | | 540 | | | 166 | | | (7 | ) | | (323 | ) | | 5,280 | |
| | | | | | | | | |
| Additional information | | | | | | | | | | | | | | | | | | | | | | | | | | | |
Depreciation and amortisation | | 53 | | | 41 | | | 111 | | | 99 | | | 10 | | | 10 | | | – | | | 117 | | | 441 | |
Impairment loss – intangible assets | | – | | | 6 | | | 3 | | | – | | | – | | | – | | | – | | | – | | | 9 | |
Capital expenditure(a) | | 67 | | | 165 | | | 2,577 | | | 294 | | | 155 | | | 14 | | | – | | | 194 | | | 3,466 | |
Investments in associates and joint ventures | | 31 | | | 80 | | | 415 | | | 20 | | | – | | | – | | | – | | | – | | | 546 | |
| | | | | | | | | |
Total assets | | 130,304 | | | 25,771 | | | 63,556 | | | 601,193 | | | 80,900 | | | 6,094 | | | 7,276 | | | 9,263 | | | 924,357 | |
Total liabilities | | 143,100 | | | 1,559 | | | 34,787 | | | 576,350 | | | 80,115 | | | 24,775 | | | 7,181 | | | 32,060 | | | 899,927 | |
Note
| (a) | Capital expenditure comprises purchased goodwill, intangible assets and property, plant and equipment acquired during the year. |
| | |
Barclays PLC Annual Report 2006 | | 245 |
| |
Notes to the accounts
For the year ended 31st December 2006
59 Segmental reporting (continued)
| | | | | | | | | | | | | | | | | | | | | | | | | | | |
| As at 31st December 2004 | | UK
Banking
£m |
| | Barclaycard
£m |
| | International
Retail and
Commercial
Banking
£m |
| | Barclays
Capital
£m |
| | Barclays
Global
Investors
£m |
| | Barclays
Wealth
£m |
| | Barclays
Wealth –
closed life
assurance
activities
£m |
| | Head
office
functions
and other
operations
£m |
| | Total
£m |
|
Income from external customers, net of insurance claims | | 5,257 | | | 2,586 | | | 887 | | | 3,455 | | | 893 | | | 837 | | | 90 | | | 103 | | | 14,108 | |
Inter-segment income | | 192 | | | (192 | ) | | – | | | 63 | | | – | | | – | | | – | | | (63 | ) | | – | |
| Total income net of insurance claims | | 5,449 | | | 2,394 | | | 887 | | | 3,518 | | | 893 | | | 837 | | | 90 | | | 40 | | | 14,108 | |
| | | | | | | | | |
| Impairment charge and other credit provisions | | (188 | ) | | (761 | ) | | (31 | ) | | (106 | ) | | – | | | 1 | | | – | | | (8 | ) | | (1,093 | ) |
| | | | | | | | | |
Segment expenses – external | | (2,483 | ) | | (668 | ) | | (585 | ) | | (2,267 | ) | | (556 | ) | | (619 | ) | | (143 | ) | | (1,215 | ) | | (8,536 | ) |
Inter-segment expenses | | (739 | ) | | (139 | ) | | (32 | ) | | (3 | ) | | – | | | (111 | ) | | – | | | 1,024 | | | – | |
| Total expenses | | (3,222 | ) | | (807 | ) | | (617 | ) | | (2,270 | ) | | (556 | ) | | (730 | ) | | (143 | ) | | (191 | ) | | (8,536 | ) |
| | | | | | | | | |
| Share of post-tax results of associates and joint ventures | | 5 | | | 4 | | | 49 | | | – | | | (2 | ) | | – | | | – | | | – | | | 56 | |
| | | | | | | | | |
| Profit on disposal of subsidiaries, associates and joint ventures | | 42 | | | – | | | – | | | – | | | 1 | | | – | | | – | | | 2 | | | 45 | |
| Business segment performance before tax | | 2,086 | | | 830 | | | 288 | | | 1,142 | | | 336 | | | 108 | | | (53 | ) | | (157 | ) | | 4,580 | |
| Additional information | | | | | | | | | | | | | | | | | | | | | | | | | | | |
Depreciation and amortisation | | 62 | | | 25 | | | 26 | | | 73 | | | 7 | | | 9 | | | – | | | 117 | | | 319 | |
Impairment loss – intangible assets | | – | | | 4 | | | 2 | | | – | | | – | | | 3 | | | – | | | – | | | 9 | |
Capital expenditure(a) | | 137 | | | 207 | | | 33 | | | 146 | | | 51 | | | 24 | | | – | | | 230 | | | 828 | |
| Investments in associates and joint ventures | | 63 | | | – | | | 366 | | | – | | | – | | | – | | | – | | | – | | | 429 | |
| | | | | | | | | |
Total assets | | 114,934 | | | 23,367 | | | 28,505 | | | 353,246 | | | 968 | | | 5,616 | | | 6,425 | | | 5,120 | | | 538,181 | |
Total liabilities | | 117,688 | | | 1,257 | | | 17,754 | | | 329,128 | | | 486 | | | 22,881 | | | 6,869 | | | 25,354 | | | 521,417 | |
| | | | | | |
| Geographic segments | | | | | | | | | | | | | | | | | | | |
| Year ended 31st December 2006 | | | | | | | | | | | United
Kingdom
£m |
| | Other
European
Union
£m |
| | United
States
£m |
| | Africa
£m |
| | Rest of
the
World
£m |
| | Total
£m |
|
Total income net of insurance claims | | | | | | | | | | | 12,154 | | | 2,882 | | | 2,840 | | | 2,791 | | | 928 | | | 21,595 | |
Total assets (by location of asset) | | | | | | | | | | | 406,328 | | | 203,929 | | | 229,779 | | | 44,696 | | | 112,055 | | | 996,787 | |
Capital expenditure (by location of asset)(a) | | | | | | | | | | | 569 | | | 62 | | | 565 | | | 136 | | | 39 | | | 1,371 | |
| Year ended 31st December 2005 | | | | | | | | | | | United
Kingdom
£m |
| | Other
European
Union
£m |
| | United
States
£m |
| | Africa
£m |
| | Rest of the
World
£m |
| | Total
£m |
|
Total income net of insurance claims | | | | | | | | | | | 10,697 | | | 1,995 | | | 2,421 | | | 1,445 | | | 775 | | | 17,333 | |
Total assets (by location of asset) | | | | | | | | | | | 348,703 | | | 196,965 | | | 230,200 | | | 48,803 | | | 99,686 | | | 924,357 | |
Capital expenditure (by location of asset)(a) | | | | | | | | | | | 449 | | | 119 | | | 276 | | | 2,586 | | | 36 | | | 3,466 | |
| Year ended 31st December 2004 | | | | | | | | | | | United
Kingdom
£m |
| | Other
European
Union
£m |
| | United
States
£m |
| | Africa
£m |
| | Rest of the
World
£m |
| | Total
£m |
|
Total income net of insurance claims | | | | | | | | | | | 9,830 | | | 1,793 | | | 1,551 | | | 348 | | | 586 | | | 14,108 | |
Total assets (by location of asset) | | | | | | | | | | | 215,451 | | | 115,258 | | | 142,655 | | | 4,690 | | | 60,127 | | | 538,181 | |
Capital expenditure (by location of asset)(a) | | | | | | | | | | | 505 | | | 6 | | | 259 | | | 32 | | | 26 | | | 828 | |
Note
| (a) | Capital expenditure comprises purchased goodwill, intangible assets and property, plant and equipment acquired during the year. |
| | |
| 246 | | Barclays PLC Annual Report 2006 |
| |
60 Differences between IFRS and US GAAP accounting principles
The Group has applied IFRS from 1st January 2004, with the exception of the standards relating to financial instruments and insurance contracts which are applied only from 1st January 2005. Therefore the impacts of adopting IAS 32, IAS 39 and IFRS 4 are not included in the IFRS 2004 comparatives and financial instruments and insurance contracts are accounted for under UK GAAP.
Significant differences between IFRS and US GAAP that are applicable to Barclays are summarised below.
| | |
| IFRS | | US GAAP |
Goodwill | | |
From 1st January 2004, goodwill recognised in the IFRS balance sheet is not amortised but tested annually for impairment. Goodwill previously written off to reserves in accordance with UK GAAP has not been reinstated on the balance sheet. | | From 1st January 2002, US GAAP required goodwill not to be amortised but tested annually for impairment. Goodwill previously written off to reserves in accordance with UK GAAP is recorded on the balance sheet. |
Intangible assets other than goodwill | | |
For acquisitions arising after 1st January 2004, intangible assets are recognised as an asset apart from goodwill in accordance with IFRS 3. | | From 1st January 2002, intangible assets are recognised as an asset apart from goodwill in accordance with SFAS 141. As the amortisation of intangible assets is a deductible expense for income tax purposes, US GAAP requires the recognition of a tax amortisation benefit. The tax amortisation benefit is taken to income over an appropriate life. |
Pensions | | |
For defined benefit schemes, an actuarial measurement of the scheme obligation and the fair value of the plan assets is made at the end of each year and the difference between the fair value of the plan assets and the present value of the defined benefit obligation at the balance sheet date, together with adjustments for any unrecognised actuarial gains and losses and past service cost, is recognised as a liability in the balance sheet. Pension assets and liabilities existing at 1st January 2004 were recognised in full. | | For defined benefit schemes, the same actuarial approach used under IFRS is used under SFAS 87. Differences arise in certain assumptions and in the measurement and adoption dates used for calculation purposes. Under SFAS 158 any unrecognised actuarial losses and past service costs are recognised on the balance sheet through an adjustment to other comprehensive income. |
Post-retirement benefits | | |
Post-retirement benefits are assessed actuarially on a similar basis to pension liabilities under IAS 19. From 1st January 2004 these benefits are accrued as a liability in the financial statements over the period of employment. | | Under SFAS 106, there are certain differences in the assumptions, measurement and the adoption dates used for calculation purposes. Under SFAS 158 any unrecognised actuarial losses and past service costs are recognised on the balance sheet through an adjustment to other comprehensive income. |
Leasing | | |
The Group has entered into leasing contracts whereby the unavoidable costs in meeting the obligations under the lease exceed the economic benefits expected to be received. Under IFRS a provision for the costs is recognised when the leasehold property ceases to be used in the business or a commitment is made to vacate the property. For a sale and operating leaseback transaction established at fair value, profit or loss is recognised immediately. | | Under US GAAP a provision is only recognised at the time the leasehold property is actually vacated. Regardless of whether a finance or operating leaseback has occurred, if the seller retains more than minor but less than substantially all of the use of the asset, profit in excess of the present value of minimum lease payments is recognised immediately. The remainder is deferred and amortised in proportion to the related gross rentals over the lease term. |
Other compensation arrangements | | |
Non-share-based compensation arrangements awarded to employees where no performance criteria, other than continued service, are required to be met are accrued fully on the date of the grant. Employer payroll taxes on employee stock-based compensation are recognised over the vesting period. | | Non-share-based compensation arrangements awarded to employees where no performance criteria, other than continued service, are required to be met are accrued evenly over the period of the grant to date of payout. Employer payroll taxes on employee stock-based compensation are recognised on exercise date. |
| | |
Barclays PLC Annual Report 2006 | | 247 |
| |
Notes to the accounts
For the year ended 31st December 2006
60 Differences between IFRS and US GAAP accounting principles (continued)
| | | | |
| IFRS | | | | US GAAP |
| | |
Insurance | | | | |
Life assurance products that are not classified as insurance contracts are accounted for under IAS 39. Products with sufficient insurance risk to be classified as insurance contracts are accounted for under the Modified Statutory Solvency Basis or similar bases. Reinsurance contracts that transfer sufficient insurance risk are accounted for as insurance contracts, otherwise they are accounted for under IAS 39. Gains and losses recognised on entering reinsurance contracts are recognised in income. | | Under US GAAP, life assurance products are accounted for under SFAS 60, SFAS 97 and SOP 03-01, depending on the nature of the underlying product and the level of insurance risk. This gives rise to measurement and classification differences. Similar to IFRS, reinsurance contracts that transfer sufficient insurance risk are classified as insurance contracts. Where reinsurance contacts are further classified as Prospective Reinsurance, any gains and losses recognised from the transaction are deferred and amortised over the remaining contact period in proportion to the amount of insurance protection provided. |
| | |
Revaluation of property | | | | |
The carrying amount of property, plant and equipment included in the UK GAAP balance at 31st December 2003 has been carried forward into the IFRS balance sheet at 1st January 2004 without adjustment as deemed cost. This results in property being carried either at original cost or at a subsequent valuation less related depreciation, calculated on the revalued amount where applicable. | | Revaluations of property are not permitted under US GAAP. |
| | |
Hedging | | | | |
| As at 1st January 2005, all derivatives were recognised at fair value and adjustments were made to hedged items where appropriate to comply with the IFRS First-time adoption rules for hedge accounting. Where hedges have been designated and documented in compliance with IFRS, hedge accounting has been subsequently applied from that date. | | IFRS first-time adoption hedging derivatives adjustments made on the transition to IFRS have been reversed. |
| | In certain instances, positions which achieve hedge accounting under IFRS do not meet hedge accounting conditions under US GAAP, and vice versa. In particular, qualifying IFRS hedge accounting relationships that do not meet the criteria under US GAAP include: |
| | |
| | • | | IFRS hedge accounting relationships that are a fair value hedge of the interest rate risk exposure of a portfolio of loans for which the hedged item is designated in terms of an amount of currency rather than as individual loans. US GAAP does not permit this hedge accounting methodology. |
| | |
| | | • | | IFRS hedge accounting relationships for which no equivalent US GAAP hedge has been designated or that were designated at a later date for US GAAP purposes. |
| | |
Financial instruments | | | | |
| Financial assets and financial liabilities may be designated at fair value through profit or loss (the ‘fair value option’) where they contain substantive embedded derivatives, where doing so significantly reduces measurement inconsistencies, or where they are managed and evaluated on a fair value basis with a documented risk management or investment strategy and reported to Key Management Personnel on that basis. | | US GAAP only permits the ‘fair value option’ for financial assets and liabilities that contain embedded derivatives that otherwise are required to be separated from their host contract. Financial instruments that qualify for the ‘fair value option’ under IFRS but which are not measured at fair value through profit or loss under US GAAP are as follows: |
| | • | | In accordance with SOP 01-6, originated loans are reported at outstanding principal adjusted for any charge-offs, the allowance for loans losses and any deferred origination fees or costs. |
| | |
| | • | | Debt, including deposits, is recorded at face value less any discount or plus any premium. |
| | |
| | • | | Structured financial liabilities that are not required to be separated into a host contract and a derivative are measured on an amortised cost basis. |
| | |
| | • | | In accordance with SFAS 115, available for sale debt securities are measured at fair value with changes in fair value recognised in equity. |
| | |
| | • | | Mortgage loans held-for-sale are accounted for at the lower of cost or market value in accordance with SFAS 65. |
| | |
| | • | | Contracts that meet the definition of a financial guarantee in accordance with SFAS 133.10(d) are initially measured at fair value and subsequently amortised over the life of the guarantee in accordance with the provisions of FIN 45. |
| |
| | Certain entities have been deemed to be investment companies or broker/dealers in accordance with the specific industry guidance applicable to those entities under US GAAP. The specific industry guidance requires certain financial instruments held within these entities to be measured at fair value through profit or loss. |
| | |
| 248 | | Barclays PLC Annual Report 2006 |
| |
60 Differences between IFRS and US GAAP accounting principles (continued)
| | |
| IFRS | | US GAAP |
Foreign exchange on available for sale securities | | |
Changes in the fair value of available for sale debt securities resulting from movements in foreign currency exchange rates are reflected in the income statement as exchange differences. | | Under EITF 96-15, as amended by SFAS 133, changes in the value of available for sale debt instruments due to changes in foreign currency exchange rate are carried in shareholders’ equity and transferred to income on sale of the instrument. |
Fee and cost recognition | | |
IAS 39 does not consider certain internal costs to be incremental costs directly attributable to the origination of financial instruments and are excluded from effective interest calculations and are taken as an expense to income. Redemption fees are deferred and amortised on the balance sheet using the effective yield method. Specific accounting guidance for leveraged leases does not exist under IFRS. Income is recognised on an effective yield basis. | | SFAS 91 requires loan origination fees and direct costs (including certain internal costs) to be deferred and amortised over the life of the loan as an adjustment of yield. Redemption fees are recorded in income as received. Leveraged leases require income to be recognised only during the period that the net investment in the lease is positive. |
Consolidation | | |
Under SIC-12 an SPE is consolidated by the entity that is deemed to control it. Indicators of control include the SPE conducting activities on behalf of the entity or the entity holding the majority of the risks and rewards of the SPE. The disposal of shares from the Group to a minority shareholder is recorded in the income statement. | | In accordance with FIN 46-R Variable Interest Entities (VIEs) are consolidated by the interest holder that remains exposed to the majority of the entity’s expected losses or residual returns, that is, the primary beneficiary. Where an SPE is deemed a ‘Qualifying Special Purpose Entity’ (QSPE), it is not consolidated. The disposal of shares from the Group to a minority shareholder is recorded directly in equity. |
Securitisations | | |
Group undertakings have issued debt securities or have entered into funding arrangements with lenders in order to finance specific loans and advances to customers. All such loans and advances continue to be held on the Group balance sheet, and a liability recognised for the proceeds of the funding transaction, unless certain conditions are met. IFRS allows for the partial derecognition of transferred financial assets where the Group has a continuing involvement in them. | | Transfers of financial assets through securitisation are derecognised if the securitisation entity’s activities comply with certain rigorous accounting requirements to be considered a QSPE. If the securitisation entity’s activities are sufficiently restricted to be considered a QSPE, the entity is not consolidated by the seller of the transferred assets. Where appropriate, upon derecognition a servicing asset/liability and retained interest in the transferred assets is recognised. Any recognised servicing asset/liability is amortised over the period in which the benefits are expected to be received. US GAAP does not permit the application of ‘continuing involvement’ principles to achieve partial derecognition of transferred financial assets. |
Guarantees | | |
All financial guarantees (other than credit derivatives) are initially recognised in the financial statements at fair value on the date that the guarantee was given. | | Under FIN 45, only guarantees issued or modified from 1st January 2003 are recognised at inception at fair value as a liability on the balance sheet. |
Classification of debt and equity | | |
From 1st January 2005, certain subordinated instruments issued by the Group are treated as equity under IFRS where they contain no present obligation to deliver cash or another financial asset to a holder. If these are held in foreign currency, the instrument is translated into the reporting currency at the exchange rate ruling on the date of issuance. | | These instruments are treated as debt instruments under US GAAP and are translated at the rate ruling at the balance sheet date. |
| | |
Barclays PLC Annual Report 2006 | | 249 |
| |
Notes to the accounts
For the year ended 31st December 2006
60 Differences between IFRS and US GAAP accounting principles (continued)
| | |
| IFRS | | US GAAP |
| |
| Loans held for sale | | |
Financial instruments are measured as required by IAS 39 and are outside the scope of the measurement provisions of IFRS 5. | | Under SOP 06-1 once a decision has been made to sell loans not previously classified as held for sale, such loans are transferred into the held-for-sale classification and carried at the lower of cost or fair value. At the time of the transfer into the held-for-sale classification, any amount by which cost exceeds fair value is accounted for as a valuation allowance. |
Non-financial instruments | | |
�� Purchased financial guarantees may be carried at fair value with changes in fair value recognised in the income statement. | | All purchased financial guarantees not meeting the definition of a derivative are measured on an accrual basis. |
| |
Disposal of foreign subsidiaries, associates and joint ventures | | |
Under IAS 21 the exchange differences arising on the translation of a foreign operation are included in cumulative translation reserves within shareholders’ equity and recycled to the income statement on disposal or partial disposal of the operation. Under the transition rules contained within IFRS 1 the requirement applies to translation currency gains and losses arising after 1st January 2004. | | The requirements outlined in SFAS 52 in relation to translation gains and losses of a foreign operation are the same as IAS 21. However, the requirements apply to all gains and losses arising from acquisition of the foreign operation. |
Taxation | | |
Profit before tax and the tax charge includes tax at the effective tax rate on certain transactions. Under IFRS the deferred tax asset on share-based compensation schemes is calculated using the intrinsic value of outstanding share awards at the balance sheet date. The associated income tax credit is capped by the fair value of the award multiplied by the statutory tax rate, any excess is recorded in reserves. | | Income before tax and the tax charge do not include such tax adjustments. The deferred tax asset on share compensation schemes is calculated on the fair value of share awards on the date of issue, with adjustments made for the number of options expected to exercise. Deferred tax excesses or shortfalls are only taken to reserves upon exercise of an award. |
Earnings per share | | |
Basic earnings per share (EPS) is net income divided by the weighted average shares in issue during the period. Diluted EPS reflects the effect that potential ordinary shares in the form of existing options would have on the basic EPS if they were to be exercised, by increasing the number of ordinary shares and adjusting income where appropriate. | | The basic and diluted US GAAP EPS differs from IFRS EPS to the extent that net income under US GAAP differs and the windfall tax benefit/deficiency to be recognised in additional paid in capital is included in the assumed proceeds used to determine the number of potential ordinary shares. |
Acceptances | | |
Acceptances are bills of exchange that the drawee has agreed responsibility for payment. They are not recognised on the balance sheet. | | Acceptances and the related customer liabilities are recognised on the balance sheet. |
Non-cash collateral | | |
Where a transferee sells collateral pledged to it, IFRS requires recognition of the proceeds from the sale and a liability measured at fair value for its obligation to return the collateral. | | Where a transferee receives collateral that it has a right to on sell or on pledge, a liability is recognised when the collateral is received. |
Netting | | |
Financial assets and liabilities are offset and reported net in the balance sheet if, and only if, there is currently a legally enforceable right to set off the recognised amounts, and there is an intention to settle on a net basis, or to realise an asset and settle the liability simultaneously. | | US GAAP permits netting in relation to long and short positions in securities and derivative assets and liabilities subject to a master netting agreement between two counterparties. |
| | |
| 250 | | Barclays PLC Annual Report 2006 |
| |
60 Differences between IFRS and US GAAP accounting principles (continued)
For those standards that were not adopted until 1st January 2005, UK GAAP continued to be applied throughout 2004 in accordance with IFRS transition rules. Therefore, for 31st December 2004, the differences relating to Derivatives, Fair value of securities, Loan origination and Extinguishment of liabilities are the same as those previously reported and have been provided on page 254.
| | |
| IFRS (2004 only) | | US GAAP (2004 only) |
Derivatives | | |
Derivatives used for hedging purposes are measured on an accruals basis consistent with the assets, liabilities, positions or future cash flows being hedged. The gains and losses on these instruments (arising from changes in fair value) are not recognised in the profit and loss account immediately as they arise. Such gains are either not recognised in the balance sheet or are recognised and carried forward. When the hedged transaction occurs, the gain or loss is recognised in the profit and loss account at the same time as the hedged item. Derivatives entered into as trading transactions, together with any associated hedging, are measured at fair value, and the resultant profits and losses are included in dealing profits. Products which contain embedded derivatives are valued with reference to the total product inclusive of the derivative element. | | SFAS 133 requires all derivatives to be recorded at fair value as adjusted by the requirements of EITF 02-03. If certain conditions are met then the derivative may be designated as a fair value hedge, cash flow hedge or hedge of the foreign currency exposure of a net investment in a foreign subsidiary. The change in value of the fair value hedge is recorded in income along with the change in fair value of the hedged asset or liability. The change in value of a cash flow hedge is recorded in other comprehensive income and reclassified to income as the hedged cash flows affect earnings. The change in the value of a net investment hedge is recorded in the currency translation reserve and only released to income when the underlying investment is sold. With a limited number of exceptions, Barclays has chosen not to update the documentation of derivative hedges to comply fully with the requirements of SFAS 133. Certain terms and conditions of hybrid contracts which themselves would be standalone derivatives are bifurcated from the underlying hybrid contract and fair valued if they are not clearly and closely related to the contract in which they are contained. These are referred to as embedded derivatives. |
Fair value of securities | | |
Positions in investment debt securities and investment equity shares are stated at cost less any provision for impairment. The cost of dated investment securities is adjusted for the amortisation of premiums or discount on purchase over the period to redemption. Investment securities are those intended for use on a continuing basis by the Group. | | Under SFAS 115, debt and marketable equity securities are classified as one of three types. Trading securities are carried at fair value with changes in fair value taken through profit and loss; held to maturity debt securities are carried at amortised cost where there is the ability and intent to hold to maturity; available for sale securities that are held for continuing use in the business are carried at fair value with movements in fair value recorded in shareholders’ equity. Declines in fair value below cost that are deemed other-than-temporary impairment are recognised on the held to maturity and available for sale categories and are reflected in the profit and loss account. Non-marketable securities held by investment companies are carried at fair value with movements in fair value recorded in net income. |
Loan origination | | |
Fee income relating to the origination of loans is recognised in the profit and loss account to match the cost over the period in which the service is provided, together with a reasonable profit margin. The cost of mortgage incentives, which comprise cashbacks and interest discounts, are charged to the profit and loss account as a reduction to interest receivable as incurred. | | SFAS 91 requires loan origination fees and incremental direct costs of loan origination to be deferred and amortised over the life of the loan as an adjustment to interest income. |
Extinguishment of liabilities | | |
| Under FRS 5, a liability is extinguished if an entity’s obligation to transfer economic benefits is satisfied, removed or is no longer likely to occur. Satisfaction would encompass an ‘in-substance’ defeasance transaction where liabilities are satisfied from the cash flows arising from essentially risk free assets transferred by the debtor to an irrevocable defeasance trust. | | Under SFAS 140, a debtor may derecognise a liability if and only if either (a) the debtor pays the creditor and is relieved of its obligation for the liability, or (b) the debtor is legally released from being the primary obligor under the liability either financially or by the creditor. SFAS 140 does not allow for the derecognition of a liability by means of an ‘in-substance’ defeasance transaction or if it is no longer believed likely that the liability will be settled. |
Any adjustments included in the reconciliations of IFRS to US GAAP provided on pages 254 to 270 and pages 284 and 285 that are not described above have arisen from refinements of methodology arising from the Group’s conversion to IFRS.
| | |
Barclays PLC Annual Report 2006 | | 251 |
| |
Notes to the accounts
For the year ended 31st December 2006
60 Differences between IFRS and US GAAP accounting principles (continued)
Applicable developments in US GAAP
SFAS 155: Accounting for Certain Hybrid Financial Instruments
In February 2006, the FASB issued Statement of Financial Accounting Standards No. 155 (SFAS 155), an amendment to SFAS 140 and SFAS 133. SFAS 155 permits entities to elect to measure at fair value through earnings any hybrid financial instrument that contains an embedded derivative that would otherwise require bifurcation. This fair value election is made on an instrument-by-instrument basis and is irreversible. It is available for all hybrid instruments that exist as of the date of adoption of the standard as well as new instruments issued or acquired after the date of adoption.
SFAS 155 eliminates a prior restriction on certain passive types of derivatives that a qualifying special purpose entity is expected to hold.
As permitted by SFAS 155, the Group has adopted the fair value election from 1st January 2006. The impact of the adoption of SFAS 155 is a credit to retained earnings of £251m (£176m net of tax) comprising gross losses of £267m and gross gains of £518m, determined on an instrument by instrument basis.
For additional information on SFAS 155, see Note (k) on page 264.
SFAS 123-R: Accounting for Stock-Based Compensation
Statement of Financial Accounting Standards No. 123 (R) (SFAS 123-R) was issued on 16th December 2004. SFAS 123-R requires that entities recognise an expense for employee stock options and other forms of stock-based compensation based on the fair value of the options.
The statement applies as of the beginning of the interim or annual reporting period starting after 15th June 2005. Barclays has adopted SFAS 123-R using Modified Prospective Application where SFAS 123-R applies to new awards and to awards modified, repurchased, or cancelled after 1st January 2006. Adoption did not have a material impact on the Group’s results of operations or financial condition as determined under US GAAP for the year ended 31st December 2006.
SFAS 154: Accounting Changes and Error Corrections
Statement of Financial Accounting Standards No. 154 (SFAS 154) issued in May 2005 replaces APB 20 and SFAS 3 and changes the requirements for the accounting and reporting of a change in accounting principle. This statement applies to all voluntary changes in accounting principle, and requires the retrospective application to prior periods’ financial statements of such changes.
SFAS 154 also requires that a change in depreciation, amortisation or depletion method for long-lived non-financial assets be accounted for as a change in accounting estimate affected by a change in accounting principle. SFAS 154 carries forward without change the guidance in Opinion 20 for reporting the correction of an error in previously issued financial statements.
The statement is effective for accounting changes and correction of errors made in fiscal years beginning after 15th December 2005, although it has not been applicable to Barclays.
SFAS 158: Employers’ Accounting for Defined Benefit Pension and Other Post-retirement Plans
The standard requires the recognition in the statement of financial performance of the overfunded or underfunded status of a defined benefit post-retirement plan measured as the difference between the fair value of plan assets and the benefit obligation.
Actuarial gains and losses and prior period service costs and credits are recognised as a component of other comprehensive income and taken to income under the recognition and amortisation provisions of SFAS 87 and SFAS 106. Defined benefit plan assets and defined benefit plan obligations are required to be measured at the date of the statement of financial position. Additional information is required to be disclosed on certain effects on net periodic benefit cost that arise from delayed recognition of the actuarial gains and losses and the prior service costs and credits.
The requirement to recognise the funded status of a defined benefit post-retirement plan and the related disclosure requirements is effective for fiscal years ending after 15th December 2006. Retrospective application is not required.
The Group has adopted the recognition provisions of SFAS 158 as at 31st December 2006. The impact of adoption for the Group’s defined benefit pension schemes is an increase in other liabilities of £860m, a decrease in other assets of £25m and a decrease in other comprehensive income of £885m. Associated deferred tax assets have increased by £258m and deferred tax liabilities have decreased by £8m.
The adoption of the recognition provisions for the Groups post-retirement benefit schemes has resulted in an increase in other liabilities of £66m and a decrease in other comprehensive income of £66m. Associated deferred tax assets have increased by £20m.
For a public entity that measures plan assets and benefit obligations as of a date other than the date of its statement of position, the requirement to change that date to year-end reporting date is applied for fiscal years ending after 15th December 2008 and shall not be applied retrospectively. Earlier application is encouraged. Barclays is considering applying the change in measurement date from 30th September to 31st December for the UKRF and certain post-retirement benefit schemes in 2007.
The expected impact of adoption of the measurement provisions of SFAS 158 for the Group’s pension schemes as at 1st January 2007 is a decrease in retained earnings of approximately £35m, a decrease in other liabilities of approximately £350m and an increase in other comprehensive income of approximately £390m as at 1st January 2007.
The impact of adoption of the measurement provisions of SFAS 158 on the Group’s post retirement benefit schemes is not expected to be significant as at 1st January 2007.
For additional information on SFAS 158 see Note (c) on page 257.
| | |
| 252 | | Barclays PLC Annual Report 2006 |
| |
60 Differences between IFRS and US GAAP accounting principles (continued)
SFAS 156: Accounting for Servicing of Financial Assets
Statement of Financial Accounting Standards No. 156 (SFAS 156) was issued in March 2006. SFAS 156 amends SFAS 140 to require that all separately recognised servicing assets and servicing liabilities be initially measured at fair value, if practicable. SFAS 156 permits an entity to choose the subsequent measurement of separately recognised servicing assets and servicing liabilities either using amortisation method or fair value method.
SFAS 156 also permits, at its initial adoption, a one-time reclassification of available for sale securities to trading securities by entities with recognised servicing rights, without impacting the treatment of other available for sale securities under SFAS 115, provided that the available for sale securities are identified in some manner as offsetting the entity’s exposure to changes in fair value of servicing assets or servicing liabilities that a servicer elects to subsequently measure at fair value.
The statement is effective as of the beginning of its first fiscal year beginning after 15th September 2006. The impact of SFAS 156 on the Group’s US GAAP position is expected to be immaterial.
FIN 48: Accounting for Uncertainty in Income Taxes
FASB Interpretation No. 48 (FIN 48) was issued in June 2006. This Interpretation prescribes a recognition threshold and measurement attribute for the financial statement recognition and measurement of a tax position taken or expected to be taken in a tax return. In recognising a tax position, the enterprise determines whether it is more likely than not that a tax position will be sustained upon examination. A tax position that is recognised is then measured at the largest amount of benefit that is greater than 50 percent likely of being realised upon ultimate settlement.
This Interpretation is effective for fiscal years beginning after 15th December 2006. The impact of the interpretation on the Group’s US GAAP position is expected to be immaterial.
SFAS 157: Fair Value Measurements
Statement of Financial Accounting Standards No. 157 (SFAS 157) defines fair value, establishes a framework for measuring fair value in generally accepted accounting principles (US GAAP) and expands disclosures about fair value measurements. While this SFAS 157 does not require any new fair value measurements, it is possible that the application of SFAS 157 will change current practice and introduce new differences between IFRS and US GAAP. SFAS 157 is effective for financial statements issued for fiscal years beginning after 15th November 2007. Barclays is assessing the impact of the standard on the Group’s US GAAP position.
SFAS 159: The Fair Value Option for Financial Assets and Liabilities
Statement of Financial Accounting Standards No. 159 (SFAS 159) was issued on 15th February 2006 and provides companies with an option to report selected financial assets and liabilities at fair value.
SFAS 159 establishes presentation and disclosure requirements designed to facilitate comparisons between companies that choose different measurement attributes for similar types of assets and liabilities. The standard also requires entities to display the fair value of those assets and liabilities for which the company has chosen to use fair value on the face of the balance sheet. The new statement does not eliminate disclosure requirements included in other accounting standards, including requirements for disclosures about fair value measurements included in SFAS 157 and SFAS 107.
The statement is effective as of the beginning of an entity’s first fiscal year beginning after 15th November 2007. Barclays is assessing the impact of the standard on the Group’s US GAAP position.
| | |
Barclays PLC Annual Report 2006 | | 253 |
| |
Notes to the accounts
For the year ended 31st December 2006
60 Differences between IFRS and US GAAP accounting principles (continued)
| | | | | | | | | | | | |
| | | Notes | | | 2006
£m | | | 2005
£m | | | 2004
£m | |
Profit attributable to equity holders of the parent (IFRS) | | | | | 4,571 | | | 3,447 | | | 3,254 | |
Goodwill | | (a | ) | | (8 | ) | | – | | | (2 | ) |
Intangible assets | | (b | ) | | (127 | ) | | (121 | ) | | (137 | ) |
Pensions | | (c | ) | | (106 | ) | | (202 | ) | | (14 | ) |
Post-retirement benefits | | (c | ) | | (17 | ) | | (1 | ) | | 20 | |
Leasing | | | | | (342 | ) | | (136 | ) | | n/a | |
Other compensation arrangements | | | | | 66 | | | 44 | | | 54 | |
Insurance | | | | | (96 | ) | | (35 | ) | | (95 | ) |
Revaluation of property | | | | | 85 | | | 9 | | | 11 | |
Hedging | | (l | ) | | (76 | ) | | (208 | ) | | n/a | |
Derivatives | | | | | n/a | | | n/a | | | (364 | ) |
Financial instruments | | | | | 52 | | | (417 | ) | | n/a | |
Fair value of securities | | | | | n/a | | | n/a | | | 80 | |
Foreign exchange on available for sale securities | | (j | ) | | 349 | | | 185 | | | 428 | |
Fee and cost recognition | | | | | 31 | | | 58 | | | (180 | ) |
Loan origination | | | | | n/a | | | n/a | | | (66 | ) |
Consolidation | | (m | ) | | (33 | ) | | (22 | ) | | 68 | |
Securitisations | | (n | ) | | (48 | ) | | 204 | | | 21 | |
Guarantees | | | | | (9 | ) | | (25 | ) | | (10 | ) |
Business combinations | | (i | ) | | – | | | – | | | 13 | |
Software capitalisation | | | | | – | | | – | | | (15 | ) |
Extinguishment of liabilities | | | | | n/a | | | n/a | | | (32 | ) |
Classification of debt and equity | | | | | 58 | | | (57 | ) | | – | |
Impairment | | | | | – | | | (24 | ) | | – | |
Loans held for sale | | | | | (11 | ) | | – | | | – | |
Non-financial instruments | | | | | 1 | | | 18 | | | – | |
Disposal of foreign subsidiaries | | | | | (34 | ) | | – | | | – | |
Tax effect on IFRS/US GAAP reconciling items | | | | | 12 | | | 215 | | | (2 | ) |
Net income (US GAAP) | | | | | 4,318 | | | 2,932 | | | 3,032 | |
| | | | | | | | | | | | | |
Barclays PLC Group | | | | | p | | | p | | | p | |
| | | | |
Basic earnings per 25p ordinary share | | (f | ) | | 67.9 | | | 46.3 | | | 47.5 | |
Diluted earnings per 25p ordinary share | | (f | ) | | 66.5 | | | 44.7 | | | 46.8 | |
| | | | | | | | | | | | | |
| | | | | | 2006
£m | | | 2005
£m | | | | |
Shareholders’ equity excluding minority interests (IFRS) | | | | | 19,799 | | | 17,426 | | | | |
Goodwill | | (a | ) | | 533 | | | 563 | | | | |
Intangible assets | | (b | ) | | (694 | ) | | (573 | ) | | | |
Pensions | | (c | ) | | 324 | | | 1,224 | | | | |
Post-retirement benefits | | (c | ) | | (32 | ) | | 51 | | | | |
Leasing | | | | | (342 | ) | | – | | | | |
Other compensation arrangements | | | | | 176 | | | 104 | | | | |
Insurance | | | | | (33 | ) | | 62 | | | | |
Revaluation of property | | | | | (136 | ) | | (221 | ) | | | |
Hedging | | (l | ) | | 295 | | | 254 | | | | |
Financial instruments | | | | | (91 | ) | | (424 | ) | | | |
Fee and cost recognition | | | | | 62 | | | 30 | | | | |
Consolidation | | (m | ) | | 9 | | | 51 | | | | |
Securitisations | | (n | ) | | 307 | | | 355 | | | | |
Guarantees | | | | | (3 | ) | | 6 | | | | |
Classification of debt and equity | | | | | 179 | | | 116 | | | | |
Loans held for sale | | | | | (11 | ) | | – | | | | |
Non-financial instruments | | | | | (3 | ) | | (4 | ) | | | |
Tax effect on IFRS/US GAAP reconciling items | | | | | (307 | ) | | (559 | ) | | | |
Shareholders’ equity (US GAAP) | | | | | 20,032 | | | 18,461 | | | | |
For those standards that were not adopted until 1st January 2005, UK GAAP continued to be applied throughout 2004 in accordance with IFRS transition rules. Therefore, for 31st December 2004, the differences relating to Derivatives, Fair value of securities, Loan origination and Extinguishment of liabilities are the same as those previously reported.
| | |
| 254 | | Barclays PLC Annual Report 2006 |
| |
60 Differences between IFRS and US GAAP accounting principles (continued)
The following table provides the Group’s balance sheet on an IFRS presentation for 2006 and 2005, incorporating those adjustments required under US GAAP that are discussed on pages 247 to 251.
| | | | |
| | | 2006 £m | | 2005 £m |
Assets | | | | |
Cash and balances at central banks | | 7,345 | | 3,908 |
Items in the course of collection from other banks | | 2,408 | | 2,017 |
Trading portfolio assets | | 278,941 | | 243,000 |
Financial assets designated at fair value | | 10,935 | | – |
Derivative financial instruments | | 41,506 | | 40,306 |
Loans and advances to banks | | 30,927 | | 31,105 |
Loans and advances to customers | | 301,453 | | 288,963 |
Financial investments | | 63,189 | | 55,403 |
Reverse repurchase agreements and cash collateral on securities borrowed | | 174,090 | | 160,398 |
Other assets | | 17,263 | | 15,557 |
Total assets | | 928,057 | | 840,657 |
Deposits from banks | | 75,455 | | 69,389 |
Items in the course of collection due to other banks | | 2,221 | | 2,341 |
Customer accounts | | 270,313 | | 253,252 |
Trading portfolio liabilities | | 143,084 | | 150,263 |
Financial liabilities designated at fair value | | 28,452 | | – |
Derivative financial instruments | | 43,890 | | 42,607 |
Debt securities in issue | | 136,548 | | 125,600 |
Repurchase agreements and cash collateral on securities lent | | 168,582 | | 141,760 |
Other liabilities | | 18,677 | | 18,099 |
Subordinated liabilities | | 13,957 | | 12,753 |
Total liabilities | | 901,179 | | 816,064 |
Shareholders’ equity excluding minority interest | | 20,032 | | 18,461 |
Minority interests | | 6,846 | | 6,132 |
Total shareholders’ equity | | 26,878 | | 24,593 |
Total liabilities and shareholders’ equity | | 928,057 | | 840,657 |
Segmental analysis of the Group is provided in Note 59, Segmental analysis. The significant differences for each segment under US GAAP are in respect of netting adjustments as disclosed in Note 60 (p), consolidation adjustments as disclosed in Note 60 (m) and the securitisation adjustment as disclosed in Note 60 (n). The impact of these adjustments is to decrease the total assets of Barclays Capital by £86,558m (2005: decrease by £89,042m), increase the total assets of Barclays Global Investors by £13,448m (2005: increase by £9,669m), decrease the total assets of Barclaycard by £5,455m (2005: decrease by £6,390m).
| | |
Barclays PLC Annual Report 2006 | | 255 |
| |
Notes to the accounts
For the year ended 31st December 2006
60 Differences between IFRS and US GAAP accounting principles (continued)
(a) Goodwill
The Group annually reviews the carrying value of its goodwill for impairment based on expected future earnings. In 2006 and 2005, there was no impairment to goodwill under US GAAP.
In 2004, goodwill recorded by the Group under US GAAP included amounts related to interests acquired following the restructuring of businesses to which the Group had previously advanced funds. The Group identified an excess in the carrying value of the reporting units over their implied fair value and recorded an impairment charge of £56m. The impairment was based on revised cash flow projections which were lower than forecasted due to going concern issues within these businesses. Further, a partial write-down of £12m was recorded in 2004 in relation to a Group entity acquired prior to 1st January 1998 in respect of which the goodwill had been previously written off to reserves under UK GAAP. The impairment was due to achieved cash flows being lower than those required to support the carrying value of goodwill.
The current carrying value of goodwill for US GAAP purposes has been allocated to the reportable business clusters of the Group:
| | | | | | | | | | | | | | | | | | | | | |
| 2006 | | | | | At beginning
of year
£m | | | Reallocation
between
clusters
£m | | | Additions £m | | | Disposals
£m | | | Exchange
and other
£m | | | 2006
£m | |
UK Banking | | | | | 2,775 | | | – | | | – | | | (4 | ) | | (2 | ) | | 2,769 | |
Barclays Wealth | | | | | 548 | | | – | | | – | | | – | | | – | | | 548 | |
International Retail and Commercial Banking | | | | | 1,764 | | | (89 | ) | | 14 | | | – | | | (267 | ) | | 1,422 | |
Barclaycard | | | | | 372 | | | – | | | – | | | – | | | (15 | ) | | 357 | |
Barclays Capital | | | | | 26 | | | 89 | | | 55 | | | – | | | (17 | ) | | 153 | |
Barclays Global Investors | | | | | 258 | | | – | | | 376 | | | (10 | ) | | (10 | ) | | 614 | |
Head office functions and other operations | | | | | 18 | | | – | | | – | | | – | | | (6 | ) | | 12 | |
Goodwill | | | | | 5,761 | | | – | | | 445 | | | (14 | ) | | (317 | ) | | 5,875 | |
| | | | | | | | | | | | | | | | | | | | | |
| 2005 | | | | | | | | At beginning
of year £m | | | Reallocation
between
clusters
£m | | | Additions
£m | | | Exchange
and other
£m | | | 2005
£m | |
UK Banking | | | | | | | | 2,760 | | | 14 | | | 1 | | | – | | | 2,775 | |
Wealth Management | | | | | | | | 548 | | | – | | | – | | | – | | | 548 | |
International Retail and Commercial Banking | | | | | | | | 448 | | | – | | | 1,253 | | | 63 | | | 1,764 | |
Barclaycard | | | | | | | | 336 | | | – | | | 24 | | | 12 | | | 372 | |
Barclays Capital | | | | | | | | 42 | | | (16 | ) | | – | | | – | | | 26 | |
Barclays Global Investors | | | | | | | | 116 | | | (6 | ) | | 139 | | | 9 | | | 258 | |
Head office functions and other operations | | | | | | | | 10 | | | 8 | | | – | | | – | | | 18 | |
Goodwill | | | | | | | | 4,260 | | | – | | | 1,417 | | | 84 | | | 5,761 | |
| | | | | | | | | | | | | | | | | | | | | |
| (b) Intangible assets | | | | | | | | | | | | | | | | | | | | | |
| 2006 | | Core
deposit
intangible
£m | | | Brand
£m | | | Customer
lists £m | | | Mortgage
servicing
rights £m | | | Licences
and other
contracts
£m | | | Other
software
£m | | | 2006
£m | |
Cost or valuation | | | | | | | | | | | | | | | | | | | | | |
At beginning of year | | 706 | | | 121 | | | 692 | | | – | | | 137 | | | 32 | | | 1,688 | |
Acquisitions/disposals as a result of business combinations | | – | | | – | | | – | | | 114 | | | 2 | | | – | | | 116 | |
Additions | | – | | | – | | | – | | | 16 | | | 10 | | | – | | | 26 | |
Fully amortised assets written off | | – | | | – | | | (52 | ) | | – | | | – | | | – | | | (52 | ) |
Exchange/other | | (38 | ) | | (19 | ) | | (27 | ) | | (8 | ) | | (6 | ) | | (1 | ) | | (99 | ) |
Cost carried forward | | 668 | | | 102 | | | 613 | | | 122 | | | 143 | | | 31 | | | 1,679 | |
Accumulated amortisation and impairment | | | | | | | | | | | | | | | | | | | | | |
At beginning of year | | (359 | ) | | (9 | ) | | (192 | ) | | – | | | (17 | ) | | (10 | ) | | (587 | ) |
Amortisation charge for year | | (95 | ) | | (13 | ) | | (90 | ) | | (11 | ) | | (2 | ) | | (6 | ) | | (217 | ) |
Impairment charge | | – | | | – | | | – | | | – | | | – | | | – | | | – | |
Fully amortised assets written off | | – | | | – | | | 52 | | | – | | | – | | | – | | | 52 | |
Exchange/other | | (2 | ) | | 2 | | | (37 | ) | | 1 | | | 3 | | | – | | | (33 | ) |
Amortisation carried forward | | (456 | ) | | (20 | ) | | (267 | ) | | (10 | ) | | (16 | ) | | (16 | ) | | (785 | ) |
Net book value 2006 | | 212 | | | 82 | | | 346 | | | 112 | | | 127 | | | 15 | | | 894 | |
Weighted average amortisation period for additions (months) | | – | | | – | | | – | | | 48 | | | 20 | | | – | | | | |
| | |
| 256 | | Barclays PLC Annual Report 2006 |
| |
60 Differences between IFRS and US GAAP accounting principles (continued)
| | | | | | | | | | | | | | | | | | |
| 2005 | | Core
deposit
intangible
£m | | | Brand
£m | | | Customer
lists £m | | | Licences
and other
contracts
£m | | | Other
software
£m | | | 2005
£m | |
| | | | | | |
Cost or valuation | | | | | | | | | | | | | | | | | | |
At beginning of year | | 513 | | | 33 | | | 313 | | | 57 | | | 12 | | | 928 | |
Acquisitions/disposals as a result of business combinations | | 186 | | | 110 | | | 338 | | | 2 | | | 17 | | | 653 | |
Additions | | – | | | – | | | 8 | | | 76 | | | 3 | | | 87 | |
Fully amortised assets written off | | – | | | (25 | ) | | – | | | – | | | – | | | (25 | ) |
Exchange/other | | 7 | | | 3 | | | 33 | | | 2 | | | – | | | 45 | |
| | | | | | |
Cost carried forward | | 706 | | | 121 | | | 692 | | | 137 | | | 32 | | | 1,688 | |
| | | | | | |
Accumulated amortisation and impairment | | | | | | | | | | | | | | | | | | |
At beginning of year | | (284 | ) | | (29 | ) | | (129 | ) | | (6 | ) | | (4 | ) | | (452 | ) |
Amortisation charge for year | | (80 | ) | | (7 | ) | | (58 | ) | | (9 | ) | | (6 | ) | | (160 | ) |
Impairment charge | | – | | | – | | | – | | | (1 | ) | | – | | | (1 | ) |
Fully amortised assets written off | | – | | | 25 | | | – | | | – | | | – | | | 25 | |
Exchange/other | | 5 | | | 2 | | | (5 | ) | | (1 | ) | | – | | | 1 | |
| | | | | | |
Amortisation carried forward | | (359 | ) | | (9 | ) | | (192 | ) | | (17 | ) | | (10 | ) | | (587 | ) |
| | | | | | |
Net book value 2005 | | 347 | | | 112 | | | 500 | | | 120 | | | 22 | | | 1,101 | |
| | | | | | |
Weighted average amortisation period for additions (months) | | 334 | | | 127 | | | 332 | | | 78 | | | 36 | | | – | |
The amortisation expense for the net carrying amount of intangible assets is estimated to be £214m in 2007, £98m in 2008, £74m in 2009, £63m in 2010 and £49m in 2011.
(c) Pensions and post-retirement benefits
The US GAAP pension disclosures below reflect the following Group pension schemes; the UK Retirement Fund (UKRF), Barclays Capital Staff Pension Plan and Barclays Capital Pension Restoration Plan (Barclays Capital schemes). Together these schemes make up approximately 93% of all the Group’s schemes in terms of assets and actuarial liabilities. The UKRF is composed of the 1964 Pension Scheme, Retirement Investment Scheme, Pension Investment Plan, after work and the Career Average Section.
The provisions of US GAAP have been applied to the UKRF and certain post-retirement benefit schemes based on a measurement date of 30th September, and to the remaining schemes based on a measurement date of 31st December. The impact of the £350m contribution made to the UKRF in the fourth quarter of 2006 (£350m in the fourth quarter 2005) on the funded status of the Group’s pension schemes is shown below.
The components of the pension and post-retirements expense (where an actuarial basis is appropriate) which arise under US GAAP are as follows:
| | | | | | | | | | | | | | | |
| | | 2006 | | 2005 | | 2004 |
| | | Pensions
£m | | | Post-
retirement
benefits
£m | | Pensions
£m | | | Post-
retirement
benefits
£m | | Pensions
£m | | | Post-
retirement
benefits
£m |
Components of net periodic benefit cost (defined benefit schemes) | | | | | | | | | | | | | | | |
Service cost | | 403 | | | 1 | | 361 | | | 2 | | 319 | | | 1 |
Interest cost | | 851 | | | 7 | | 808 | | | 6 | | 692 | | | 5 |
Expected return on plan assets | | (926 | ) | | – | | (818 | ) | | – | | (738 | ) | | – |
Amortisation of transition adjustment | | – | | | 1 | | – | | | 1 | | – | | | – |
Termination benefits(a) | | 21 | | | – | | 51 | | | – | | – | | | – |
Recognised net actuarial loss | | 24 | | | 4 | | 40 | | | 2 | | 27 | | | 2 |
Prior service cost | | 1 | | | – | | – | | | – | | – | | | – |
Net periodic benefit cost | | 374 | | | 13 | | 442 | | | 11 | | 300 | | | 8 |
Note
| (a) | Termination benefits relate to costs incurred to the UKRF when members are made redundant and are permitted to take enhanced benefits in exchange for a reduced redundancy lump sum. |
| | |
Barclays PLC Annual Report 2006 | | 257 |
| |
Notes to the accounts
For the year ended 31st December 2006
60 Differences between IFRS and US GAAP accounting principles (continued)
(c) Pensions and post-retirement benefits (continued)
The following table presents the estimated funded status of the pension schemes and post-retirement benefits (the latter are unfunded) under US GAAP:
| | | | | | | | | | | | |
| | | 2006 | | | 2005 | |
| | | Pensions £m | | | Post- retirement benefits £m | | | Pensions £m | | | Post- retirement benefit £m | |
Change in benefit obligation | | | | | | | | | | | | |
Benefit obligation at beginning of year | | 17,483 | | | 131 | | | 14,992 | | | 100 | |
Service cost | | 403 | | | 1 | | | 361 | | | 2 | |
Interest cost | | 851 | | | 7 | | | 808 | | | 6 | |
Plan participants’ contributions | | 32 | | | – | | | 26 | | | – | |
Termination benefits | | 21 | | | – | | | 51 | | | – | |
Prior period service cost | | 4 | | | – | | | 4 | | | – | |
Actuarial (gain)/loss | | (336 | ) | | – | | | 1,748 | | | 23 | |
Benefits paid | | (520 | ) | | (5 | ) | | (470 | ) | | (4 | ) |
Curtailments | | (53 | ) | | – | | | (57 | ) | | – | |
Settlements | | (12 | ) | | – | | | (7 | ) | | – | |
Exchange and other | | (33 | ) | | (6 | ) | | 27 | | | 4 | |
Benefit obligation at end of year | | 17,840 | | | 128 | | | 17,483 | | | 131 | |
Change in plan assets | | | | | | | | | | | | |
Fair value of plan assets at beginning of year | | 14,802 | | | – | | | 12,540 | | | – | |
Actual return on plan assets | | 1,676 | | | – | | | 2,426 | | | – | |
Employer contribution | | 370 | | | 5 | | | 266 | | | 4 | |
Plan participants’ contributions | | 32 | | | – | | | 26 | | | – | |
Benefits paid | | (520 | ) | | (5 | ) | | (470 | ) | | (4 | ) |
Settlements | | (11 | ) | | – | | | (7 | ) | | – | |
Exchange and other | | (27 | ) | | – | | | 21 | | | – | |
Fair value of plan assets at end of year | | 16,322 | | | – | | | 14,802 | | | – | |
Funded status – deficit | | (1,518 | ) | | (128 | ) | | (2,681 | ) | | (131 | ) |
Fourth quarter contribution to UKRF | | 350 | | | – | | | 350 | | | – | |
Total deficit | | (1,168 | ) | | (128 | ) | | (2,331 | ) | | (131 | ) |
Unrecognised transition amount(a) | | n/a | | | n/a | | | – | | | 5 | |
Unrecognised net actuarial loss(a) | | n/a | | | n/a | | | 2,047 | | | 68 | |
Unrecognised prior service cost(a) | | n/a | | | n/a | | | 7 | | | – | |
Accrued benefit cost | | n/a | | | n/a | | | (277 | ) | | (58 | ) |
The minimum liability, intangible asset and other comprehensive income as at the measurement date for the Group’s pension schemes is shown in the table below:
| | | | | | | | | | | | | | | | | | |
| | | | | | 2006 | | | | | | | | | 2005 | | | | |
| | | Barclays
Capital
Staff
Retirement
Plan
£m | | | Barclays
Capital
Pension
Restoration
Plan
£m | | | UKRF
£m | | | Barclays
Capital
Staff
Retirement
Plan
£m | | | Barclays
Capital
Pension
Restoration
Plan
£m | | | UKRF
£m | |
Accumulated Benefit Obligation (ABO) | | 216 | | | 11 | | | 15,037 | | | 249 | | | 12 | | | 15,149 | |
Scheme assets at market value | | (203 | ) | | – | | | (16,119 | ) | | (213 | ) | | – | | | (14,589 | ) |
Minimum liablity (excess of ABO over market value of assets) | | 13 | | | 11 | | | – | | | 36 | | | 12 | | | 560 | |
Net amount recognised | | 12 | | | (11 | ) | | (282 | ) | | 18 | | | (13 | ) | | (282 | ) |
Minimum additional liability | | 25 | | | – | | | – | | | 54 | | | – | | | 278 | |
Intangible asset | | – | | | – | | | – | | | – | | | – | | | – | |
Accumulated other comprehensive income before SFAS 158 | | 25 | | | – | | | – | | | 54 | | | – | | | 278 | |
Note
| (a) | The adoption of SFAS 158 as at 31st December 2006 results in the funded status of the Group’s pension and post-retirement benefit schemes being recognised on the balance sheet. |
| | |
| 258 | | Barclays PLC Annual Report 2006 |
| |
60 Differences between IFRS and US GAAP accounting principles (continued)
(c) Pensions and post-retirement benefits (continued)
| | | | | | |
| | | 2006 | |
| | | Pensions £m | | | Post- retirement benefits £m | |
The funded status consists of: | | | | | | |
Current liabilities | | (1 | ) | | (5 | ) |
Non-current liabilities | | (1,167 | ) | | (123 | ) |
| | |
| | | (1,168 | ) | | (128 | ) |
Amounts recognised in accumulated other comprehensive income consist of: | | | | | | |
Net loss | | 876 | | | 62 | |
Prior service cost | | 10 | | | – | |
Net transition obligation | | – | | | 4 | |
Accumulated other comprehensive income before deferred tax | | 886 | | | 66 | |
Deferred tax | | (266 | ) | | (20 | ) |
Accumulated other comprehensive income after deferred tax | | 620 | | | 46 | |
The estimated Pension net gains and losses, prior service costs, and transition assets that are expected to be amortised from accumulated other comprehensive income into net periodic benefit cost for 2007 are: | |
| | | 2006 | |
| | | Pensions
£m | | | Post- retirement benefits £m | |
Net loss | | – | | | 3 | |
Prior service cost | | 1 | | | – | |
Net transition amount | | – | | | – | |
Total estimated amortisation for 2007 from accumulated other comprehensive income | | 1 | | | 3 | |
A one percentage point change in assumed health care trend rates would have the following effects for 2006: | |
| | | 2006 | |
| | | 1% increase
£m | | | 1% decrease
£m | |
Effect on service and interest cost component | | 2 | | | (1 | ) |
Effect on post-retirement benefit obligation | | 22 | | | (19 | ) |
| | |
Barclays PLC Annual Report 2006 | | 259 |
| |
Notes to the accounts
For the year ended 31st December 2006
60 Differences between IFRS and US GAAP accounting principles (continued)
(c) Pensions and post-retirement benefits (continued)
For those pension schemes with an accumulated benefit obligation in excess of plan assets:
| | | | |
| | | 2006 |
| | | Pensions
£m | | Post-
retirement
benefits
£m |
Projected benefit obligation | | 237 | | 128 |
Accumulated benefit obligation | | 227 | | 128 |
Fair value of plan assets | | 203 | | – |
For those pension schemes with a projected benefit obligation in excess of plan assets: | | | | |
| | | 2006 |
| | | Pensions
£m | | Post-
retirement
benefits
£m |
Projected benefit obligation | | 17,603 | | – |
Accumulated benefit obligation | | 15,037 | | – |
Fair value of plan assets | | 16,119 | | – |
A long-term strategy has been set for the pension plan asset allocation which comprises a mixture of equities, bonds, property and other appropriate assets. This recognises that different asset classes are likely to produce different long-term returns, and some asset classes will be more volatile than others. One of the factors in the choice of a long-term strategy is to ensure that the investments are adequately diversified. The managers are permitted some flexibility to vary the asset allocation from the long-term strategy within control ranges agreed with the Trustee from time to time.
The table below shows the percentage of the fair value of each major category as at the measurement date.
| | | | | | | | | | | | |
| | | Barclays Capital Retirement Plan | | UKRF (defined benefits only) |
| | | Target
2006 % | | 31/12/06 % | | 31/12/05 % | | Target
2006
% | | 30/09/06 % | | 30/09/05 % |
| | | | | | |
Equity securities | | 50-70 | | 60 | | 61 | | 45.75 | | 44 | | 50 |
Debt securities | | 30-50 | | 38 | | 39 | | 42.25 | | 39 | | 35 |
Property | | 0-10 | | – | | – | | 10.00 | | 13 | | 11 |
All other assets | | 0-10 | | 2 | | – | | 2.00 | | 4 | | 4 |
| | | | | | |
Total | | 100 | | 100 | | 100 | | 100 | | 100 | | 100 |
The expected return on assets is determined by calculating a total return estimate based on a weighted average of estimated returns for each asset class. Asset class returns are estimated using current and projected economic and market factors such as inflation, credit spreads and equity risk premiums.
The Group is expected to make contributions of £351m to the UKRF scheme in 2007 and £20m to the Barclays Capital schemes in 2007.
Estimated future benefit payments
The following benefit payments, which reflect future service, as appropriate, are expected to be paid:
| | | | |
| | | Pensions
£m | | Post- retirement benefits
£m |
| | |
2007 | | 474 | | 5 |
2008 | | 491 | | 5 |
2009 | | 511 | | 5 |
2010 | | 531 | | 6 |
2011 | | 549 | | 6 |
Years 2012 – 2016 | | 3,168 | | 31 |
| | |
| 260 | | Barclays PLC Annual Report 2006 |
| |
60 Differences between IFRS and US GAAP accounting principles (continued)
(c) Pensions and post-retirement benefits (continued)
The weighted-average assumptions used to determine net periodic benefit cost for pensions are as follows:
| | | | | | | | | | | | |
| | | 2006 | | | | 2005 | | |
| | | Barclays Capital
Retirement Plan
% | | Barclays Capital
Restoration Plan
% | | UKRF
% | | Barclays Capital
Retirement Plan
% | | Barclays Capital
Restoration Plan
% | | UKRF
% |
Discount rate | | 5.50 | | 5.50 | | 5.08 | | 5.75 | | 5.75 | | 5.60 |
Rate of compensation increase | | 4.50 | | 4.50 | | 4.30 | | 4.50 | | 4.50 | | 4.30 |
Expected long-term return on plan assets | | 8.00 | | n/a | | 6.45 | | 8.50 | | n/a | | 6.70 |
The weighted-average assumptions used to determine benefit obligations for pensions are as follows:
| | | | | | | | | | | | |
| | | 2006 | | | | 2005 |
| | | Barclays Capital
Retirement Plan
% | | Barclays Capital
Restoration Plan
% | | UKRF
% | | Barclays Capital
Retirement Plan
% | | Barclays Capital
Restoration Plan
% | | UKRF
% |
Discount rate | | 6.00 | | 6.00 | | 5.01 | | 5.50 | | 5.50 | | 5.08 |
Rate of compensation increase | | 4.50 | | 4.50 | | 4.00 | | 4.50 | | 4.50 | | 4.30 |
Inflation | | 2.80 | | 2.80 | | 3.00 | | 2.70 | | 2.70 | | 2.75 |
A number of additional changes have been made to the assumptions used in valuing the liabilities of the UKRF, including a decrease in the assumed rate of real salary increases to 1% (30th September 2005: 1.55%), a change in the assumption regarding pension increases to recognise the caps and floors which apply to guaranteed pension increases, and the introduction of an explicit allowance for early retirement and commutation. Mortality assumptions remain unchanged from those in force at 30th September 2005.
For measurement purposes, the calculations assume a 10% and 5% annual rate of increase in the per capita cost of covered medical benefits and dental benefits respectively for pensioners in the US at the end of the 2006 year (11% and 5% at the end of 2005). The rate for 2007 is assumed to be 10% and to decrease to 5% over five years to 2012 and remain at that level thereafter. For pensioners in the UK the calculation assumes a 9% increase in the per capita cost of covered medical benefits is adopted for the 2006 year end (10% annual rate as at the end of 2005). The rate for 2007 is assumed to be 8% and to decrease to 5% by 2010 and remain at that level thereafter.
Details of the post-retirement health care expense under IFRS are given in Note 35 to the accounts.
The accounting for the post-retirement benefits charge assumed a discount rate of 5.5% (2005: 5.75%) for US benefits and 5.1% (2005: 5.6%) for UK benefits on a weighted average basis.
(d) Share-based payments
The total equity settled share-based payment cost recognised for US GAAP for 2006 is £640m (2005: £338m, 2004: £204m).
The related tax benefit was £193m (2005: £80m, 2004: £nil).
The tax benefit from share options exercised during the year was £161m (2005: £56m).
(e) Deferred tax
In accordance with SFAS No. 109 ‘Accounting for Income Taxes’, the components of US GAAP deferred tax assets and liabilities are as follows:
| | | | | | |
| | | 2006
£m | | | 2005
£m | |
Deferred tax liabilities: | | | | | | |
Deferred tax liabilities under IFRS (see Note 21) | | 282 | | | 700 | |
In respect of IFRS/US GAAP reconciling items | | 175 | | | 116 | |
Total deferred tax liabilities | | 457 | | | 816 | |
Deferred tax assets: | | | | | | |
Deferred tax assets under IFRS (see Note 21) | | 764 | | | 686 | |
Add: valuation allowance | | 294 | | | 252 | |
In respect of IFRS/US GAAP reconciling items | | (137 | ) | | (441 | ) |
Total deferred tax assets before valuation allowance | | 921 | | | 497 | |
Less: valuation allowance | | (294 | ) | | (252 | ) |
Deferred tax assets less valuation allowance | | 627 | | | 245 | |
| | |
Barclays PLC Annual Report 2006 | | 261 |
| |
Notes to the accounts
For the year ended 31st December 2006
60 Differences between IFRS and US GAAP accounting principles (continued)
(e) Deferred tax (continued)
The main components of the tax charge attributable to continuing operations are shown in Note 21 to the accounts on pages 180 and 181. Included in the tax effect on net income of IFRS/US GAAP reconciling items for 2006 is a credit amount of £12m relating to deferred tax (2005: credit of £215m).
The valuation allowance relates to the Group’s capital losses and unrelieved overseas tax losses. These assets will be recognised in the future when it becomes more likely than not that they will be utilised.
(f) Earnings per share
| | | | | | | | | | | | | | | | | | | | |
| | | 2006 | | 2005 | | 2004 |
| | | Income
£m | | | Weighted
average
share no.
(in millions) | | Per-share
amount
pence | | Income
£m | | | Weighted
average
share no.
(in millions) | | Per-share
amount
pence | | Income
£m | | Weighted
average
share no.
(in millions) | | Per-share
amount
pence |
Basic earnings per share | | | | | | | | | | | | | | | | | | | | |
| US GAAP net income attributable to equity holders of the parent | | 4,318 | | | 6,357 | | 67.9 | | 2,932 | | | 6,337 | | 46.3 | | 3,032 | | 6,381 | | 47.5 |
Dilutive impact of convertible options | | (21 | ) | | | | | | (32 | ) | | | | | | – | | | | |
Potential shares | | | | | 106 | | | | | | | 149 | | | | | | 99 | | |
| | | | | | | | | |
Diluted earnings per share | | 4,297 | | | 6,463 | | 66.5 | | 2,900 | | | 6,486 | | 44.7 | | 3,032 | | 6,480 | | 46.8 |
Upon adoption of IFRS, the Group amended the methodology for the calculation of potential shares and the dilutive impact of convertible options. Had this change been reflected in the US GAAP diluted earnings per share for 2004, the impact would have been a 0.4p decrease.
(g) Securities
Unlisted investment equity securities are outside the scope of SFAS 115 ‘Accounting for Certain Investments in Debt and Equity Securities’. Where the securities are held by an investment company within the Group, the securities are carried at fair value.
All investment securities are classified as being ‘available for sale’ unless the Group has a clear intention and ability to hold them to maturity. Other securities are classified as trading securities.
The following table shows the gross unrealised losses and fair value for available for sale and held-to-maturity securities, aggregated by investment category and length of time that individual securities have been in a continuous unrealised loss position at 31st December 2006.
| | | | | | | | | | | | | | | |
| | | Less than 12 months | | | 12 months or more | | | Total | |
| Description of securities | | Fair value
£m | | Unrealised
losses
£m | | | Fair value
£m | | Unrealised
losses
£m | | | Fair value
£m | | Unrealised
losses
£m | |
United Kingdom government | | 714 | | (3 | ) | | – | | – | | | 714 | | (3 | ) |
Other government | | 5,156 | | (54 | ) | | 4,632 | | (127 | ) | | 9,788 | | (181 | ) |
Other public bodies | | 8 | | – | | | 10 | | (1 | ) | | 18 | | (1 | ) |
Mortgage-backed securities | | 138 | | – | | | 37 | | (3 | ) | | 175 | | (3 | ) |
Corporate issuers | | 3,728 | | (10 | ) | | 604 | | (1 | ) | | 4,332 | | (11 | ) |
Bank and building society certificates of deposits | | 6,824 | | (26 | ) | | – | | – | | | 6,824 | | (26 | ) |
Other issuers | | 28 | | – | | | 26 | | (1 | ) | | 54 | | (1 | ) |
| | | | | | |
Total | | 16,596 | | (93 | ) | | 5,309 | | (133 | ) | | 21,095 | | (226 | ) |
The Group performs a review of each individual available for sale and held-to-maturity security on a regular basis to determine whether any evidence of other-than-temporary impairment exists. This review considers factors such as the duration and amount at which fair value is below cost, the credit standing and prospects of the issuer, and the intent and ability of the Group to hold the security for such sufficient time to allow for any anticipated recovery in fair value.
Under US GAAP, 540 (2005: 177) available for sale and held-to-maturity debt securities had unrealised losses as at 31st December 2006. Based on a review performed at 31st December 2006, management believes that the unrealised losses are temporary in nature. The unrealised losses are due to market movements in interest rates. The credit quality of the bond issuers remains strong with 100% rated as investment grade or higher and the Group has the ability and intent to hold these positions until recovery.
| | |
| 262 | | Barclays PLC Annual Report 2006 |
| |
60 Differences between IFRS and US GAAP accounting principles (continued)
(g) Securities (continued)
Held-to-maturity securities
| | | | | | | | | | | | | |
| | | 2006 | | 2005 |
| Description of securities | | Book value
£m | | Unrealised
gain/(loss)
£m | | | Fair
value
£m | | Book
value
£m | | Unrealised
gain/(loss)
£m | | Fair
value
£m |
Mortgage-backed securities | | 1,082 | | 1 | | | 1,083 | | 2,099 | | 2 | | 2,101 |
Other issuers | | 1,867 | | (3 | ) | | 1,864 | | 3,488 | | 1 | | 3,489 |
Total | | 2,949 | | (2 | ) | | 2,947 | | 5,587 | | 3 | | 5,590 |
The gross unrealised losses on the held to maturity securities amounted to £5m at 31st December 2006 (2005: £4m).
| | | | | | | | | | | | | | | | |
| | | 2006
Book value | | 2006
Fair value |
| Description of securities | | Maturing
within one year £m | | Maturing
after one
but within
five years
£m | | Maturing
after five
but within
ten years
£m | | Maturing
after ten
years £m | | Maturing
within one
year £m | | Maturing
after one
but within
five years
£m | | Maturing
after five
but within
ten years
£m | | Maturing
after ten
years £m |
Mortgage-backed securities | | 324 | | 585 | | 14 | | 159 | | 324 | | 586 | | 14 | | 159 |
Other issuers | | 925 | | 747 | | 99 | | 96 | | 922 | | 746 | | 100 | | 97 |
Total | | 1,249 | | 1,332 | | 113 | | 255 | | 1,246 | | 1,332 | | 114 | | 256 |
(h) Loan loss impairment
SFAS 114 applies only to impaired loans, the measurement of which is based upon the present value of expected future cash flows discounted at the loan’s effective interest rate, the loan’s observable market value, or the fair value of the collateral if the loan is collateral dependent. Smaller balance homogeneous consumer loans that are collectively evaluated for impairment are outside the scope of SFAS 114, as are debt securities and leases. At 31st December 2006, the element of impaired loans outside the scope of SFAS 114 amounted to £3,583m (2005: £3,336m).
In accordance with SFAS 114, the Group’s total impaired loans being non-performing, less impaired loans outside the scope of SFAS 114, amount to £1,459m at 31st December 2006 (2005: £1,874m). Credit risk provisions of £674m, estimated in accordance with SFAS 114, were held against these loans (2005: £935m). The average level of such impaired lendings in 2006 was £1,706m (2005: £1,661m).
Where cash received represents the realisation of security, or there is doubt regarding the recovery of a loan, such receipts are treated as repayments of the loan principal. Otherwise, cash received in respect of impaired loans is recognised as interest income. Estimated interest income which was recognised in 2006 on impaired loans within the scope of SFAS 114 was £52m (2005: £13m, 2004: £24m).
SFAS 114 modifies the accounting for in-substance foreclosure, in that collateralised debts where the Group takes physical possession of the collateral, regardless of formal insolvency procedures, would be reclassified as if the collateral had been acquired for cash. At 31st December 2006, under US GAAP, the amount of collateral recorded at the lower of the book value of the debt or the fair value of the collateral that would be reclassified as ‘property, plant and equipment’ was £12m (2005: £nil) and as debt and equity instruments was £nil (2005: £57m).
Mortgage loans of £10,856m (2005: £nil) are included within loans and advances to customers which are held with the intention of resale. During the year £9,483m (2005: £nil) of loans were sold generating a net profit of £74m (2005: £nil, 2004: £31m).
(i) Business combination
In 2002, Barclays and Canadian Imperial Bank of Commerce completed the combination of their retail, corporate and offshore banking operations and created FirstCaribbean International Bank. Until disposal on 22nd December 2006, under both IFRS and US GAAP, Barclays accounted for the resulting interest as an associate. At the time of the combination, a gain of £206m was generated under both UK and US GAAP, the gain being recorded in equity for UK GAAP but in the income statement under US GAAP (APB 29 and EITF 01-02). The net assets of the business transferred by Barclays to the new entity were not materially different under US GAAP.
In 2004, an adjustment of £13m was made to the gain of £206m, which was also recorded in the income statement under US GAAP.
| | |
Barclays PLC Annual Report 2006 | | 263 |
| |
Notes to the accounts
For the year ended 31st December 2006
60 Differences between IFRS and US GAAP accounting principles (continued)
(j) Foreign exchange differences on available for sale (AFS) debt securities
Under IFRS the translation of foreign currency denominated AFS debt securities into the functional currency of the legal entity in which they are held is recognised directly in the income statement. For US GAAP these movements are reported in shareholders’ equity.
The pre-tax credit of £349m (2005: £185m, 2004: £428m) represents the reclassification of this amount from the income statement into shareholders’ equity for US GAAP.
(k) Hybrid Financial Instruments
In 2006 a fair value loss of £953m is recorded in the income statement in regards to using the option in SFAS 155 to record hybrid financial instruments at fair value under US GAAP.
(l) Hedging
The US GAAP hedging adjustment results in a decrease in income of £76m (2005: £208m, 2004: n/a). Of this, £85m (2005: £69m, 2004: n/a) relates to the reversal of IFRS transition adjustments and the inclusion of SFAS 133 transition adjustments and £(9)m (2005: £139m, 2004: n/a) relates to ongoing hedging differences.
(m) Consolidation
Differences in the consolidation criteria betwen US GAAP and IFRS result in an increase in total assets of £12,217m (2005: increase of £4,268m).
Under US GAAP, the Group consolidates entities in which it has a controlling financial interest. This is determined by initially evaluating whether the entity is a voting interest entity, a VIE, or a QSPE.
Certain mortgage loan securitisation entities are consolidated under IFRS and US GAAP. The financial assets of these entities are fully recognised under US GAAP whereas under IFRS they are only recognised to the extent of the Group’s continuing involvement. This derecognition difference results in greater total assets under US GAAP.
Entities that qualify as qualifying special purpose entities (QSPEs) under SFAS 140 and therefore are outside the scope of FIN 46(R) are not consolidated. This exemption from consolidation is not permitted under IFRS and as a consequence the entities are consolidated under IAS 27 and SIC-12.
Barclays consolidates certain investment entities under IFRS that are not consolidated under US GAAP. Consolidation is appropriate under IFRS due to Barclays’ control over the operating and financial policies of the entity. These entities are variable interest entities (VIEs) under FIN 46(R) and are not consolidated as Barclays is not exposed to the majority of the entities’ expected losses and residual returns.
Voting interest entities
Voting interest entities are entities in which the total equity investment at risk is sufficient to enable each entity to finance itself independently and provides the equity holders with the obligation to absorb losses, the rights to receive residual returns and the right to make decisions about the entity’s activities. Voting interest entities are consolidated in accordance with ARB 51 which states that the usual condition for a controlling financial interest in an entity is ownership of a majority voting interest.
Variable interest entities
As defined in FIN 46-R, an entity is considered a VIE subject to consolidation if the equity investment at risk is not sufficient to permit the entity to finance its activities without additional subordinated financial support or if the equity investors lack one of three characteristics of a controlling financial interest described above. First, the equity investors lack the ability to make decisions about the entity’s activities through voting rights or similar rights. Second, they do not bear the obligation to absorb the expected losses of the entity if they occur. Lastly, they do not claim the right to receive expected returns of the entity if they occur, which are the compensation for the risk of absorbing the expected losses.
VIEs are consolidated by the interest holder that remains exposed to the majority of the entity’s expected losses or residual returns, that is, the primary beneficiary.
The business activities within the Barclays Group where VIEs are used include multi-seller conduit programmes, asset securitisations, client intermediation, credit structuring, asset realisations and fund management.
Multi-seller conduit programmes
Barclays creates, administers and provides liquidity and credit enhancements to several commercial paper conduit programmes, primarily in the United States. These conduits provide clients access to liquidity in the commercial paper markets by allowing them to sell consumer or trade receivables to the conduit, which then issues commercial paper to investors to fund the purchase. The conduits have sufficient collateral, credit enhancements and liquidity support to maintain an investment grade rating for the commercial paper.
Asset securitisations
The Group assists companies with the formation of asset securitisations. These entities have minimal equity and rely upon funding in the form of notes to purchase the assets for securitisation. The Group provides both senior and/or junior lending and derivative contracts to the entities, where junior notes are provided and in certain circumstances where derivative contracts are provided, the Group may be the primary beneficiary of the entity.
| | |
| 264 | | Barclays PLC Annual Report 2006 |
| |
60 Differences between IFRS and US GAAP accounting principles (continued)
(m) Consolidation (continued)
Client intermediation
As a financial intermediary, the Group is involved in structuring transactions to meet investor and client needs. These transactions may involve entities that fall within the scope of FIN 46-R structured by either Barclays or the client and that are used to modify cash flows of third-party assets to create investments with specific risk or return profiles, or to assist clients in the efficient management of other risks. These transactions may include derivative instruments, and often contain contractual clauses to enable Barclays to terminate the transaction under certain circumstances, for example, if the legal or accounting basis on which the transaction was completed changes. In addition, Barclays invests as a limited partner in lessor partnerships and as a parent in wholly owned subsidiaries specifically to acquire assets for leasing. In a portion of these leasing transactions, there may be risk mitigants in place which result in a third-party consolidating the entities as the primary beneficiary.
Credit structuring
The Group structures investments to provide specific risk profiles to investors. This may involve the sale of credit exposures, often by way of credit derivatives, to an entity which subsequently funds the credit exposures by issuing securities. These securities may initially be held by Barclays prior to sale outside of the Group.
Asset realisations
The Group establishes SPEs to facilitate the recovery of loans in circumstances where the borrower has suffered financial loss.
Fund management
The Group provides asset management services to a large number of investment entities on an arms-length basis and at market terms and prices. The majority of these entities are investment funds that are owned by a large and diversified number of investors. In addition, there are various partnerships, funds and open-ended investment companies that are used by a limited number of independent third parties to facilitate their tailored private debt, debt securities or hedge fund investment strategies.
The Group is the primary beneficiary in the following VIEs, classified by type of activity:
| | | | |
| | | 2006 | | 2005 |
| Activity | | Total assets
£m | | Total assets
£m |
Asset securitisations | | 15,614 | | 13,750 |
Multi-seller conduit programmes | | 15,389 | | 17,260 |
Client intermediation | | 8,655 | | 4,451 |
Credit structuring | | 678 | | 641 |
Asset realisations | | 51 | | 49 |
The creditors of these entities do not have recourse to the general credit of the Group in respect of the variable interest entities consolidated by the Group.
The Group also has significant variable interests in the following VIEs, classified by type of activity, where the Group is not the primary beneficiary.
| | | | | | | | |
| | | 2006 | | 2005 |
| | | Total assets
£m | | Maximum
loss(a)
£m | | Total
assets
£m | | Maximum
loss(a)
£m |
Asset securitisations | | 3,244 | | 62 | | 5,746 | | 221 |
Client intermediation | | 12,622 | | 1,999 | | 11,298 | | 3,284 |
Credit structuring | | 778 | | 577 | | 313 | | 8 |
Fund management | | – | | – | | 6,158 | | 3,222 |
Qualifying Special Purpose Entities (QSPEs)
In accordance with SFAS 140 and FIN 46-R, the Group does not consolidate QSPEs. QSPEs are passive entities used by the Group to hold financial assets transferred to them by the Group and are commonly used in mortgage and other securitisation transactions as described in Note 60 (n) below.
Note
| (a) | The maximum exposure to loss represents a ‘worst case’ scenario in the event that all such entities simultaneously fail. It does not provide an indication of ongoing exposure which is managed within the Group’s risk management framework. Where a maximum exposure to loss is quoted, this represents the Group’s total exposure and includes both drawn and undrawn lending facilities. The Group’s exposure is determined by changes in the value of the variable interests it holds within these entities, which primarily comprise liquidity, credit enhancements, derivative transactions and financing arrangements. |
| | |
Barclays PLC Annual Report 2006 | | 265 |
| |
Notes to the accounts
For the year ended 31st December 2006
60 Differences between IFRS and US GAAP accounting principles (continued)
(n) Securitisations
Credit card securitisations
The Group transfers beneficial interests in portfolios of Barclaycard branded credit card receivable assets to Gracechurch Receivables Trustee Limited, which in turn issues investor certificates to Barclaycard Funding PLC, a subsidiary of Barclays Bank PLC. By purchasing the investor certificates, Barclaycard Funding PLC obtains an equitable beneficial interest in the cash flows arising from the securitised assets and then issues Medium Term Loan Notes to the Gracechurch Card Funding vehicles which are Qualifying Special Purpose Entities (‘QSPEs’).
QSPEs sell Loan Notes to investors, who are then entitled to receive specified cash flows during the life of the security. The QSPEs use the proceeds from the sale of the investor Loan Notes to purchase the Medium Term Loan Notes from Barclaycard Funding PLC. The proceeds of the issuance of the investor certificates by Gracechurch Receivables Trustee Limited are then distributed to the Group as consideration for the beneficial interests in the credit card receivables transferred.
Following a securitisation, the Group receives fees for servicing the receivables and providing cash management services and payment of deferred consideration for the sale of the beneficial interest in the excess income over and above the interest paid and payable to the noteholder and other expenses. The Group maintains an interest in the pool of receivables that are available for securitisation, referred to as the seller’s interest.
Investors have no recourse against the Group if cash flows generated from the securitised assets are not sufficient to service the obligations of the QSPEs.
The Group has no right or obligation to repurchase the benefit of any securitised balance, except if certain representations and warranties given by the Group at the time of transfer are breached.
The Group has entered into interest rate currency swaps with the QSPEs. These swaps convert a proportion of the Sterling variable interest flows arising from the Loan Note Certificates to US Dollar variable and fixed rate interest flows to match the interest payable on the Medium Term Notes issued.
The transfer of receivables is accounted for as a sale under US GAAP where control of the receivables has been relinquished. A gain or loss is recognised on securitisation of the receivables which is calculated based on the previous carrying amount of the loans involved in the transfer (allocated between the receivables sold and the seller’s interest based on their relative fair values at the date of sale).
The Group estimates the fair value of the retained interests by determining the present value of future expected cash flows using valuation models that incorporate management’s best estimates of key assumptions, which include:
(a) the expected prepayment rate of the receivables each year;
(b) the anticipated credit losses from the receivables; and
(c) a discount rate to calculate future income flows.
The retained interests that are subject to prepayment risk such that the Group may not recover substantially all of its investment are recorded at fair value with subsequent adjustments reflected in net income.
The servicing liability represents the shortfall of future servicing income from the Group’s obligation to service the transferred assets compared to the adequate compensation of servicing those assets. The servicing liability is amortised over the expected life of the receivables.
Credit card securitisation activity during the year
During 2006, the Group securitised credit card receivables with a book value of £112m (2005: £3,497m) recognising a resultant pre-tax gain on sale under US GAAP of £7m (2005: £174m, 2004: £38m). The Group has recognised an interest only strip asset and a servicing liability in connection with the transfer.
The derecognition of the securitised assets results in a reduction in net loans and advances to customers of £5,511m (2005: £6,648m).
Mortgage loans securitisation
In 2004, Barclays acquired and then securitised 10 static pools of residential mortgage loans which were originated by unaffiliated mortgage companies. Certain of these securitisations were affected through the sale of mortgage loans to QSPEs. During 2005, Barclays acquired and then securitised an additional 10 pools of residential mortgage loans; however, these securitisations did not qualify for sale accounting and are treated as financing transactions.
To fund the acquisition of these mortgage loans, the trust issued Floating Rate Notes (FRNs). The FRNs were underwritten by Barclays and sold to third-party investors. The offering circulars for the issues of FRNs stated that they are the obligations of the respective trust only and are not guaranteed by, or the responsibility of, any other party. A call right is held by the originator with the right to liquidate the trust if the principal balance of the mortgage shares has fallen below 10% of their initial amount, provided all obligations under the bonds can be satisfied in full.
Mortgage loan securitisation activity during the year
During 2006, 17 whole loans and 4 commercial mortgage loan pools were acquired and securitised. Of these, 9 whole loans and 4 commercial mortgage loan transactions qualified for sale accounting, and therefore non-returnable proceeds of these securitisations totalled £7,887m (2005: £nil). There was a gain of £41m (2005: £nil, 2004: £25m) arising from the sale of 4 commercial mortgage loan pools.
The retained interests that are subject to prepayment risk such that the Group may not recover substantially all of its investment are recorded at fair value with subsequent adjustments reflected in net income. The remaining eight securitisations did not qualify for sale accounting and are treated as financing transactions.
| | |
| 266 | | Barclays PLC Annual Report 2006 |
| |
60 Differences between IFRS and US GAAP accounting principles (continued)
(n) Securitisations (continued)
Interest only strip
The movement in fair value of retained interests during the year is as follows:
| | | | | | | | | | | | |
| | | 2006 | | | 2005 | | | 2006 | | | 2005 | |
| | | Mortgage
loans £m | | | Mortgage
loans £m | | | Credit card
receivables
£m | | | Credit card
receivables
£m | |
| | | | |
Value at 1st January | | 18 | | | 171 | | | 191 | | | 117 | |
Value at inception of new securitisations | | 55 | | | – | | | 4 | | | 98 | |
Transfer to net income | | – | | | – | | | (84 | ) | | (24 | ) |
Cash flow from interests retained/sold | | (17 | ) | | (173 | ) | | – | | | – | |
Foreign exchange differences | | (3 | ) | | 20 | | | – | | | – | |
| | | | |
Value at 31st December | | 53 | | | 18 | | | 111 | | | 191 | |
Key economic assumptions used in measuring the interest only strip at the time of the securitisation were as follows:
| | | | | | | | | | | |
| | | 2006 | | | 2005 | | 2006 | | | 2005 | |
| | | Mortgage
loans | | | Mortgage
loans | | Credit card
receivables | | | Credit card
receivables | |
| | | | |
Fair value of interest only strip at inception of new securitisations | | £55 | m | | – | | £4 | m | | £98 | m |
Constant prepayment rate per annum | | 30 | % | | – | | 100 | % | | 100 | % |
Credit losses per annum(a) | | 3 | % | | – | | 8.5 | % | | 6.5 | % |
Discount rate | | 18 | % | | – | | 5.5 | % | | 5.0 | % |
Servicing liabilities
The following table shows the servicing liabilities recognised and amortised during the year:
| | | | | | |
| | | 2006 | | | 2005 | |
| | | Credit card
receivables
£m | | | Credit card
receivables
£m | |
| | |
Balance at 1st January | | 70 | | | 45 | |
Additions | | 1 | | | 37 | |
Amortisation for the year | | (41 | ) | | (12 | ) |
| | |
Balance at 31st December | | 30 | | | 70 | |
The fair value of the servicing liability for credit card receivables is £30m (2005: £70m).
Servicing assets
The following table shows the servicing assets recognised during the year:
| | | | |
| | | 2006 | | 2005 |
| | | Mortgage
loans £m | | Mortgage
loans £m |
| | |
Balance at 1st January | | – | | – |
Additions | | 33 | | – |
Amortisation for the year | | – | | – |
| | |
Balance at 31st December | | 33 | | – |
The fair value of the servicing asset for mortgage loans is £33m (2005: £nil).
The cash flows between the Group and the securitisation vehicles were as follows:
| | | | | | | | | |
| | | 2006 | | 2005 | | 2006 | | | 2005 |
| | | Mortgage
loans £m | | Mortgage
loans £m | | Credit card
receivables
£m | | | Credit card
receivables
£m |
| | | | |
Proceeds from new securitisations | | – | | – | | 112 | | | 3,497 |
Proceeds from collection reinvested in receivables | | – | | – | | 15,709 | | | 11,151 |
Cash inflow from servicing fees | | – | | – | | 47 | | | 32 |
Cash inflow on interests retained/sold | | 17 | | 173 | | 387 | | | 291 |
Cash outflow from redemptions | | – | | – | | (1,228 | ) | | – |
Cash inflow from loan repayments | | – | | – | | 5 | | | – |
Note
| (a) | Annual percentage credit loss is based only on positions in which expected credit loss is a key assumption in the determination of fair values. |
| | |
Barclays PLC Annual Report 2006 | | 267 |
| |
Notes to the accounts
For the year ended 31st December 2006
60 Differences between IFRS and US GAAP accounting principles (continued)
(n) Securitisations (continued)
Interest only strip at year end
At 31st December 2006, key economic assumptions and a sensitivity analysis showing the hypothetical effect on the fair value of those interests of two unfavourable variations from the expected levels for each key assumption are as follows:
| | | | | | |
| | | 2006
Mortgage
loans
£m | | | 2006
Credit
card
receivables
£m | |
Fair value of interest only strip | | 53 | | | 111 | |
Constant prepayment rate per annum | | 30% | | | 100% | |
Impact of 33% adverse change | | (9 | ) | | (15 | ) |
Impact of 50% adverse change | | (12 | ) | | (43 | ) |
Credit losses per annum(a) | | 3% | | | 9% | |
Impact of 10% adverse change | | (7 | ) | | (33 | ) |
Impact of 20% adverse change | | (10 | ) | | (67 | ) |
Discount rate | | 18% | | | 6% | |
Impact of 10% adverse change | | (6 | ) | | – | |
Impact of 20% adverse change | | (11 | ) | | (1 | ) |
The sensitivity analysis illustrates the potential magnitude of significant adverse changes in key assumptions used in valuing the interest only strip. However, changes in fair value based on a variation in assumptions generally cannot be extrapolated because the relationship of the change in assumption to the change in fair value may not be linear. Furthermore, the sensitivities for each key variable are calculated independently of changes in the other key variables.
The following tables present information about principal balances of managed and securitised receivables:
| | | | | | | | | | | | | | | | | | |
| | | 2006 Credit card receivables | | | 2005 Credit card receivables | |
| | | Total
loans
£m | | | Delinquent
loans(b) £m | | | Net
write-offs(c) £m | | | Total
loans
£m | | | Delinquent
loans(b) £m | | | Net
write-offs(c) £m | |
Total receivables managed | | 13,313 | | | 396 | | | 1,003 | | | 12,924 | | | 349 | | | 726 | |
Less: receivables securitised(c) | | (5,700 | ) | | (131 | ) | | (239 | ) | | (6,815 | ) | | (149 | ) | | (184 | ) |
Assets on US GAAP balance sheet | | 7,613 | | | 265 | | | 764 | | | 6,109 | | | 200 | | | 542 | |
| | |
| | | 2006 Mortgages | | | 2005 Mortgages | |
| | | Total
loans
£m | | | Delinquent
loans
£m | | | Net
write-offs
£m | | | Total
loans
£m | | | Delinquent
loans
£m | | | Net
write-offs
£m | |
Total receivables managed | | 9,441 | | | – | | | – | | | 6,270 | | | – | | | – | |
Less: receivables securitised(d) | | (2,101 | ) | | – | | | – | | | (563) | | | – | | | – | |
Assets on US GAAP balance sheet | | 7,340 | | | – | | | – | | | 5,707 | | | – | | | – | |
Notes
(a) Annual percentage credit loss is based only on positions in which expected credit loss is a key determination of fair values.
(b) Delinquent loans are loans 90 days or more past due.
(c) Net of recoveries during the year.
(d) Securitised and derecognised from the balance sheet under US GAAP.
| | |
| 268 | | Barclays PLC Annual Report 2006 |
| |
60 Differences between IFRS and US GAAP accounting principles (continued)
(o) Guarantees
An element of Barclays normal banking business is to issue guarantees on behalf of its customers. In almost all cases, Barclays will hold collateral against the exposure, have a right of recourse to the customer or both. In addition, Barclays issues guarantees on its own behalf. The major categories of these guarantees are:
Financial guarantees
These are given to banks and financial institutions on behalf of customers to secure loans, overdrafts and other banking facilities. These are commonly called facility guarantees.
Included within this category are stock borrowing indemnities. These relate to funds managed by Barclays on behalf of clients, which participate in stock lending programmes. Barclays indemnifies the clients against any losses incurred by the clients resulting from borrower default. Collateral, principally cash, is maintained against all stock borrowing transactions ranging from 102% to 105% of the securities loaned with adjustments to collateral made daily. It is possible that the exposure could exceed the collateral provided should the value of the security rise concurrently with the default of the borrowers.
Standby letters of credit
These are irrevocable commitments to pay a third party, on behalf of our customers, the value of which on demand is subject to certain criteria being complied with. Any amounts paid are debited to the customers’ accounts. These contracts are used when required in substitution of guarantees due to a greater acceptability in the beneficiary country.
Other guarantees
This category includes the following types of contracts:
Performance guarantees– a guarantee given by the Bank on behalf of a customer, undertaking to pay a certain sum if our customer has failed to carry out the terms or certain terms of the contract.
Advance payment guarantees– enables the beneficiary to demand repayment of an advance in funds in certain circumstances.
Tender guarantees– provided during a tender process to lend support to a customer’s commitment to a tender process.
Customs and Excise– guarantees provided to HM Revenue and Customs to cover a customer’s liability, most commonly for import duties.
Retention guarantees– similar to advance payments but are used to secure early release of retained contract payments.
The following table provides the maturity analysis of guarantees issued by the Group. The amounts disclosed represent the maximum potential amount of future payments (undiscounted) the Group could be required to make under the guarantee, before any recovery through recourse or collaterisation provisions.
| | | | | | | | | | | | |
| | | 2006 | | 2005 |
| | | Less than
one year
£m | | Over
one year
but not
more than
three years
£m | | Over
three years
but not
more than
five years
£m | | Over
five years
£m | | Total
£m | | Total
£m |
| | | | | | |
Financial guarantees | | 19,241 | | 900 | | 332 | | 806 | | 21,279 | | 27,049 |
Standby letters of credit | | 3,889 | | 1,066 | | 3,716 | | 1,302 | | 9,973 | | 10,986 |
Other guarantees | | 5,364 | | 1,016 | | 498 | | 1,002 | | 7,880 | | 8,825 |
Credit card guarantees
Under the Consumer Credit Act of 1974, Barclays may be liable to customers to refund payments made for unsatisfactory goods or services or unfulfilled contracts where payment was made using a credit card. The maximum liability that Barclays could have is the total credit limits marked to customers of £58,695m (2005: £54,479m).
Warranties and indemnities given as part of acquisition and disposal activity
Warranties and indemnities are routinely provided to counterparties as part of the terms and conditions required in a business acquisition, disposal or investing in joint ventures. Most commonly, these relate to indemnification against tax liabilities arising from pre-transaction activities. Usually the total aggregate liability, in respect of warranties and indemnities for a transaction is capped and the maximum exposure under these is £1,368m (2005: £2,139m). No collateral or recourse to third parties is generally available.
Certain derivative contracts
In addition to the contracts described above, there are certain derivative contracts to which the Group is a counterparty that meet the characteristics of a guarantee under FIN 45. These derivatives are recorded in the Group’s balance sheet at fair value under US GAAP.
| | |
Barclays PLC Annual Report 2006 | | 269 |
| |
Notes to the accounts
For the year ended 31st December 2006
60 Differences between IFRS and US GAAP accounting principles (continued)
(p) Total assets
Netting
Differences between the netting requirements of IFRS and US GAAP (FIN 39) result in a net reduction in total assets reported for US purposes of £70,755m (2005: £77,598m).
| | | | | |
| | | 2006
£m | | | 2005
£m |
| | |
Derivatives | | (96,858 | ) | | (96,963) |
Securities | | (5,858 | ) | | (2,491) |
Receivables and payables in respect of unsettled trades | | (8,224 | ) | | (8,292) |
Loans and deposits | | 8,559 | | | 9,567 |
Non-cash collateral on stock lending | | 31,626 | | | 20,581 |
Total | | (70,755 | ) | | (77,598) |
The inclusion of acceptances resulted in an increase in total assets under US GAAP of £256m (2005: £253m).
The 2005 comparative amounts for derivatives reflect changes to the netting process made in 2006.
(q) Segmental reporting
Barclaycard management include the results of Absa Card within internally reported segment information. On this basis, Absa Card would be reported within Barclaycard under SFAS 131. Barclaycard’s profit before tax would increase by £68m (2005: £26m, 2004: £nil) on an IFRS basis with IRCB – Absa profit before tax decreasing by the same amount.
(r) Income statement
There are include differences in the presentation of the income statement between IFRS and US GAAP. Under US GAAP, net interest expense (2006: £605m, 2005: £126m, 2004: £219m) relating to trading activities would be shown within net interest income, rather than included in net trading income.
61 Regulatory capital requirements
Capital adequacy and the use of regulatory capital are monitored by the Group, employing techniques based on the guidelines developed by the Basel Committee on Banking Supervision (the Basel Committee) and European Community directives, as implemented by the FSA for supervisory purposes. The FSA regards the risk asset ratio calculation, originally developed by the Basel Committee, as a key supervisory tool and sets individual minimum ratio requirements for banks in the UK at or above the minimum of 8%. The concept of risk weighting and the basis for calculating eligible capital resources are described under capital ratios on page 55.
The following tables summarises capital resources and capital ratios, as defined for supervisory purposes:
| | | | |
| Barclays PLC Group | | | | |
| | | Amount
£m | | Ratio
% |
| | |
As at 31st December 2006 | | | | |
Total net capital resources | | 34,711 | | 11.7 |
Tier 1 capital resources | | 23,005 | | 7.7 |
| | |
As at 31st December 2005 | | | | |
Total net capital resources | | 30,502 | | 11.3 |
Tier 1 capital resources | | 18,895 | | 7.0 |
In addition to the regulatory capital requirements arising from the Group’s banking businesses, the Group has a capital resource requirement of £225m (2005: £189m) arising from its life assurance businesses. The equity of the life businesses on the same date was £726m (2005: £417m) and the capital resources available to the Group as a whole amounted to £41,176m (2005: £36,893m).
| | |
| 270 | | Barclays PLC Annual Report 2006 |
| |
SEC Form 20-F cross reference and other information
SEC Form 20-F Cross Reference and Other Information
| | | | |
Form 20-F item number | | | | Page reference in this document |
| 1 | | Identity of Directors, Senior Management and Advisers | | |
| | | Not applicable | | |
| 2 | | Offer Statistics and Expected Timetable | | |
| | | Not applicable | | |
| 3 | | Key Information | | |
| | Risk factors | | 60 |
| | Currency of presentation | | 272 |
| | Financial data | | 4 |
| | | Dividends | | 292 |
| 4 | | Information on the Company | | |
| | Presentation of information | | 144 |
| | Glossary | | 273 |
| | Business description | | 10 |
| | Acquisitions | | 157 |
| | Financial review | | 9 |
| | Recent developments | | 157 |
| | Supervision and regulation | | 62 |
| | Note 25 Property, plant and equipment | | 186 |
| | Note 39 Contingent liabilities and commitments | | 208 |
| | Note 47 Principal subsidiaries | | 219 |
| | | Note 59 Segmental reporting | | 244 |
| 4A | | Unresolved staff comments | | |
| | | Not applicable | | |
| 5 | | Operating and Financial Review and Prospects | | |
| | Financial review | | 9 |
| | | Capital and liquidity risk management | | 85 |
| 6 | | Directors, Senior Management and Employees | | |
| | Directors and Officers | | 108 |
| | Directors’ report | | 110 |
| | Corporate governance report | | 113 |
| | Remuneration report | | 121 |
| | Accountability and Audit | | 137 |
| | Note 8 Staff costs | | 166 |
| | Note 35 Retirement benefit obligations | | 199 |
| | | Note 46 Related party transactions and Directors’ remuneration | | 214 |
| 7 | | Major Shareholders and Related Party Transactions | | |
| | Presentation of information | | 144 |
| | Directors’ report | | 110 |
| | Note 46 Related party transactions and Director’s remuneration | | 214 |
| | | Trading market for ordinary shares of Barclays PLC | | 292 |
| 8 | | Financial Information | | |
| | Note 1 Dividends per share –Barclays PLC | | 164 |
| | Note 40 Legal proceedings | | 209 |
| | Note 49 Events after the balance sheet date | | 221 |
| | | Dividends – Barclays PLC | | 292 |
| 9 | | The Offer and Listing | | |
| | Trading market for ordinary shares of Barclays PLC | | 292 |
| | | | |
Form 20-F item number | | | | Page reference in this document |
| 10 | | Additional Information | | |
| | Memorandum and Articles of Association | | 294 |
| | Taxation | | 295 |
| | Exchange controls and other | | |
| | limitations affecting security holders | | 296 |
| | | Documents on display | | 296 |
| 11 | | Quantitative and qualitative disclosure about market risk | | |
| | Risk management and control – overview | | 66 |
| | Credit risk management | | 72 |
| | Loans and advances to customers | | 75 |
| | Allowances for impairment | | 79 |
| | Potential credit risk loans | | 78 |
| | Loans and advances in non-local currencies | | 96 |
| | Market risk management | | 82 |
| | Derivatives | | 90 |
| | Capital and liquidity risk management | | 85 |
| | | Note 14 Derivative financial instruments | | 172 |
| 12 | | Description of Securities Other than Equity Securities | | |
| | | Not applicable | | |
| 13 | | Defaults, Dividends Arrearages and Delinquencies | | |
| | | Not applicable | | |
| 14 | | Material Modifications to the Rights of Security Holders and Use of Proceeds | | |
| | | Not applicable | | |
| 15 | | Controls and Procedures | | |
| | Disclosure controls and procedures | | 138 |
| | Management’s report on internal controls | | 137 |
| | Attestation of registered public accounting firm | | 145 |
| | | Changes in internal control | | 138 |
| 16A | | Audit Committee Financial Expert | | 117 |
| 16B | | Code of Ethics | | Exhibit 11.1 |
| 16C | | Principal Accountant Fees and Services | | 167 |
| 16D | | Exemptions from the Listing Standards for Audit Committees | | |
| | | Not applicable | | |
| 16E | | Share Repurchases | | 205 |
| 17 | | Financial Statements | | |
| | | Not applicable | | |
| 18 | | Financial Statements | | |
| | US audit report for Barclays PLC | | 145 |
| | US audit report for Barclays Bank PLC | | 146 |
| | Accounting policies | | 147 |
| | Consolidated accounts Barclays PLC | | 147 |
| | Notes to accounts of Barclays PLC | | 164 |
| | Consolidated accounts Barclays Bank PLC | | 274 |
| | | Notes to consolidated accounts of Barclays Bank PLC | | 278 |
| 19 | | Exhibits | | |
| | Included in documents as filed with the SEC | | |
| | |
Barclays PLC Annual Report 2006 | | 271 |
| |
SEC Form 20-F cross reference and other information
Currency of presentation
In this report, unless otherwise specified, all amounts are expressed in Pounds Sterling. For the months indicated, the high and low noon buying rates in New York City for cable transfers in Pounds Sterling, as certified for customs purposes by the Federal Reserve Bank of New York (the noon buying rate), were:
| | | | | | | | | | | | |
| | | | | (US Dollars per Pound Sterling) |
| | 2007 | | 2006 |
| | | February | | January | | December | | November | | October | | September |
High | | 1.97 | | 1.98 | | 1.98 | | 1.97 | | 1.91 | | 1.91 |
Low | | 1.94 | | 1.93 | | 1.95 | | 1.88 | | 1.85 | | 1.86 |
For the years indicated, the average of the noon buying rates on the last day of each month were:
| | | | | | | | | | |
| | |
| | | (US Dollars per Pound Sterling) |
| | | | | |
| | | 2006 | | 2005 | | 2004 | | 2003 | | 2002 |
Average | | 1.86 | | 1.78 | | 1.84 | | 1.64 | | 1.61 |
On March 22, 2007, the noon buying rate in New York City for cable transfers in Pound Sterling was $1.9672.
No representation is made that Pounds Sterling amounts have been, or could have been, or could be, converted into US Dollars at any of the above rates. For the purpose of presenting financial information in this report, exchange rates other than those shown above may have been used.
| | |
| 272 | | Barclays PLC Annual Report 2006 |
| |
Glossary
| | |
| Term used in Annual Report | | US equivalent or brief description |
| |
| Accounts | | Financial statements |
| |
| Allotted | | Issued |
| |
| Attributable profit | | Net income |
| |
| Called up share capital | | Ordinary shares, issued and fully paid |
| |
| Capital allowances | | Tax term equivalent to US tax depreciation allowances |
| |
| Cash at bank and in hand | | Cash |
| |
| Class of business | | Industry segment |
| |
| Finance lease | | Capital lease |
| |
| Freehold | | Ownership with absolute rights in perpetuity |
| |
| Loans and advances | | Lendings |
| |
| Loan capital | | Long-term debt |
| |
| Net asset value | | Book value |
| |
| Profit | | Income |
| |
| Share capital | | Ordinary shares, capital stock or common stock issued and fully paid |
| |
| Share premium account | | Additional paid-up capital or paid-in surplus (not distributable) |
| |
| Shares in issue | | Shares outstanding |
| |
| Write-offs | | Charge-offs |
| | |
Barclays PLC Annual Report 2006 | | 273 |
| |
Barclays Bank PLC data
Consolidated income statement
Consolidated income statement
For the year ended 31st December
| | | | | | | | | | | | |
| | | Notes | | | 2006
£m | | | 2005
£m | | | 2004(a) £m | |
| | | | |
Continuing operations | | | | | | | | | | | | |
Interest income | | 2 | | | 21,805 | | | 17,232 | | | 13,880 | |
Interest expense | | 2 | | | (12,662 | ) | | (9,157 | ) | | (7,047 | ) |
| | | | |
Net interest income | | | | | 9,143 | | | 8,075 | | | 6,833 | |
| | | | |
Fee and commission income | | 3 | | | 8,005 | | | 6,430 | | | 5,509 | |
Fee and commission expense | | 3 | | | (828 | ) | | (725 | ) | | (662 | ) |
| | | | |
Net fee and commission income | | | | | 7,177 | | | 5,705 | | | 4,847 | |
| | | | |
Net trading income | | (a | ) | | 3,632 | | | 2,321 | | | 1,487 | |
Net investment income | | (a | ) | | 962 | | | 858 | | | 1,027 | |
| | | | |
Principal transactions | | | | | 4,594 | | | 3,179 | | | 2,514 | |
| | | | |
Net premiums from insurance contracts | | 5 | | | 1,060 | | | 872 | | | 1,042 | |
Other income | | (b | ) | | 257 | | | 178 | | | 140 | |
| | | | |
Total income | | | | | 22,231 | | | 18,009 | | | 15,376 | |
Net claims and benefits incurred on insurance contracts | | 5 | | | (575 | ) | | (645 | ) | | (1,259 | ) |
| | | | |
Total income net of insurance claims | | | | | 21,656 | | | 17,364 | | | 14,117 | |
Impairment charges | | 7 | | | (2,154 | ) | | (1,571 | ) | | (1,093 | ) |
| | | | |
Net income | | | | | 19,502 | | | 15,793 | | | 13,024 | |
| | | | |
Staff costs | | 8 | | | (8,169 | ) | | (6,318 | ) | | (5,227 | ) |
Administration and general expenses | | 9 | | | (3,914 | ) | | (3,768 | ) | | (2,990 | ) |
Depreciation of property, plant and equipment | | 25 | | | (455 | ) | | (362 | ) | | (297 | ) |
Amortisation of intangible assets | | 24 | | | (136 | ) | | (79 | ) | | (22 | ) |
| | | | |
Operating expenses | | | | | (12,674 | ) | | (10,527 | ) | | (8,536 | ) |
| | | | |
Share of post-tax results of associates and joint ventures | | 22 | | | 46 | | | 45 | | | 56 | |
Profit on disposal of subsidiaries, associates and joint ventures | | | | | 323 | | | – | | | 45 | |
| | | | |
Profit before tax | | | | | 7,197 | | | 5,311 | | | 4,589 | |
Tax | | 10 | | | (1,941 | ) | | (1,439 | ) | | (1,279 | ) |
| | | | |
Profit after tax | | | | | 5,256 | | | 3,872 | | | 3,310 | |
| | | | |
Profit attributable to minority interests | | | | | 342 | | | 177 | | | 47 | |
Profit attributable to equity holders | | | | | 4,914 | | | 3,695 | | | 3,263 | |
| | | | | | 5,256 | | | 3,872 | | | 3,310 | |
The note numbers refer to the notes on pages 164 to 270, whereas the note letters refer to those on pages 278 to 285.
Note
(a) Does not reflect the application of IAS 32, IAS 39 and IFRS 4 which became effective from 1st January 2005.
| | |
| 274 | | Barclays PLC Annual Report 2006 |
| |
Barclays Bank PLC data
Consolidated balance sheet
Consolidated balance sheet
As at 31st December
| | | | | | | | |
| | | Notes | | | 2006
£m |
| | 2005
£m |
| | | |
Assets | | | | | | | | |
Cash and balances at central banks | | | | | 6,795 | | | 3,506 |
Items in the course of collection from other banks | | | | | 2,408 | | | 1,901 |
Trading portfolio assets | | (c | ) | | 177,884 | | | 155,730 |
Financial assets designated at fair value: | | | | | | | | |
– held on own account | | 13 | | | 31,799 | | | 12,904 |
– held in respect of linked liabilities to customers under investment contracts | | 13 | | | 82,798 | | | 83,193 |
Derivative financial instruments | | 14 | | | 138,353 | | | 136,823 |
Loans and advances to banks | | 15 | | | 30,926 | | | 31,105 |
Loans and advances to customers | | 16 | | | 282,300 | | | 268,896 |
Available for sale financial investments | | (d | ) | | 51,952 | | | 53,703 |
Reverse repurchase agreements and cash collateral on securities borrowed | | 19 | | | 174,090 | | | 160,398 |
Other assets | | 20 | | | 5,850 | | | 4,734 |
Current tax assets | | 21 | | | 557 | | | – |
Investments in associates and joint ventures | | 22 | | | 228 | | | 546 |
Goodwill | | 23 | | | 6,092 | | | 6,022 |
Intangible assets | | 24 | | | 1,215 | | | 1,269 |
Property, plant and equipment | | 25 | | | 2,492 | | | 2,754 |
Deferred tax assets | | 21 | | | 764 | | | 686 |
| | | |
Total assets | | | | | 996,503 | | | 924,170 |
| | | |
Liabilities | | | | | | | | |
Deposits from banks | | 26 | | | 79,562 | | | 75,127 |
Items in the course of collection due to other banks | | | | | 2,221 | | | 2,341 |
Customer accounts | | 27 | | | 256,754 | | | 238,684 |
Trading portfolio liabilities | | 12 | | | 71,874 | | | 71,564 |
Financial liabilities designated at fair value | | 28 | | | 53,987 | | | 33,385 |
Liabilities to customers under investment contracts | | 13 | | | 84,637 | | | 85,201 |
Derivative financial instruments | | 14 | | | 140,697 | | | 137,971 |
Debt securities in issue | | 29 | | | 111,137 | | | 103,328 |
Repurchase agreements and cash collateral on securities lent | | 19 | | | 136,956 | | | 121,178 |
Other liabilities | | 30 | | | 10,337 | | | 11,131 |
Current tax liabilities | | 21 | | | 1,020 | | | 747 |
Insurance contract liabilities, including unit-linked liabilities | | 31 | | | 3,878 | | | 3,767 |
Subordinated liabilities | | 32 | | | 13,786 | | | 12,463 |
Deferred tax liabilities | | 21 | | | 282 | | | 700 |
Provisions | | 33 | | | 462 | | | 517 |
Retirement benefit liabilities | | 35 | | | 1,807 | | | 1,823 |
| | | |
Total liabilities | | | | | 969,397 | | | 899,927 |
| | | |
Shareholders’ equity | | | | | | | | |
Called up share capital | | (e | ) | | 2,363 | | | 2,348 |
Share premium account | | (e | ) | | 9,452 | | | 8,882 |
Other reserves | | (f | ) | | (484 | ) | | 483 |
Other shareholders’ equity | | (g | ) | | 2,534 | | | 2,490 |
Retained earnings | | (f | ) | | 11,556 | | | 8,462 |
| | | |
Shareholders’ equity excluding minority interests | | | | | 25,421 | | | 22,665 |
Minority interests | | (h | ) | | 1,685 | | | 1,578 |
| | | |
Total shareholders’ equity | | | | | 27,106 | | | 24,243 |
| | | |
Total liabilities and shareholders’ equity | | | | | 996,503 | | | 924,170 |
The note numbers refer to the notes on pages 164 to 270, whereas the note letters refer to those on pages 278 to 285.
These financial statements have been approved for issue by the Board of Directors on 8th March 2007.
| | |
Barclays PLC Annual Report 2006 | | 275 |
| |
Barclays Bank PLC data
Consolidated statement of recognised income and expense
Consolidated statement of recognised income and expense
| | | | | | | | | |
For the year ended 31st December | | | | | | | | | |
| | | 2006
£m |
| | 2005
£m |
| | 2004(a)
£m |
|
| | | |
Available for sale reserve: | | | | | | | | | |
– Net gains/(losses) from changes in fair value | | 107 | | | (217 | ) | | n/a | |
– Losses transferred to net profit due to impairment | | 86 | | | – | | | n/a | |
– Net gains transferred to net profit on disposal | | (327 | ) | | (120 | ) | | n/a | |
– Net losses transferred to net profit due to fair value hedging | | 14 | | | 260 | | | n/a | |
Cash flow hedges: | | | | | | | | | |
– Net losses from changes in fair value | | (437 | ) | | (50 | ) | | n/a | |
– Net gains transferred to net profit | | (50 | ) | | (69 | ) | | n/a | |
Currency translation differences arising during the year | | (781 | ) | | 300 | | | (58 | ) |
Tax | | 253 | | | 50 | | | – | |
Other | | 25 | | | (102 | ) | | – | |
| | | |
Amounts included directly in equity | | (1,110 | ) | | 52 | | | (58 | ) |
Profit after tax | | 5,256 | | | 3,872 | | | 3,310 | |
| | | |
Total recognised income and expense for the year | | 4,146 | | | 3,924 | | | 3,252 | |
| | | |
Attributable to: | | | | | | | | | |
Equity holders | | 4,132 | | | 3,659 | | | 3,205 | |
Minority interests | | 14 | | | 265 | | | 47 | |
| | | 4,146 | | | 3,924 | | | 3,252 | |
Note
(a) Does not reflect the application of IAS 32, IAS 39 and IFRS 4 which became effective from 1st January 2005.
| | |
| 276 | | Barclays PLC Annual Report 2006 |
| |
Barclays Bank PLC data
Consolidated cash flow statement
Consolidated cash flow statement
For the year ended 31st December
| | | | | | | | | | | | | | | | | |
| | | | | 2006
£m | | | | | 2005
£m | | | | | 2004
£m | | | |
| | | | | | | |
Reconciliation of profit before tax to net cash flows from operating activities: | | | | | | | | | | | | | | | | | |
Profit before tax | | | | 7,197 | | | | | 5,311 | | | | | 4,589 | | | |
Adjustment for non-cash items: | | | | | | | | | | | | | | | | | |
Allowance for impairment | | | | 2,154 | | | | | 1,571 | | | | | 1,093 | | | |
Depreciation and amortisation and impairment of intangibles | | | | 612 | | | | | 450 | | | | | 328 | | | |
Other provisions, including pensions | | | | 558 | | | | | 654 | | | | | 703 | | | |
Net profit from associates and joint ventures | | | | (46 | ) | | | | (45 | ) | | | | (56 | ) | | |
Net profit on disposal of investments and property, plant and equipment | | | | (778 | ) | | | | (530 | ) | | | | (211 | ) | | |
Net profit from disposal of associates and joint ventures | | | | (263 | ) | | | | – | | | | | (45 | ) | | |
Net profit from disposal of subsidiaries | | | | (60 | ) | | | | – | | | | | – | | | |
Other non-cash movements | | | | 1,661 | | | | | 1,505 | | | | | (1,194 | ) | | |
| | | | | | | |
Changes in operating assets and liabilities: | | | | | | | | | | | | | | | | | |
Net increase in loans and advances to banks and customers | | | | (27,385 | ) | | | | (63,177 | ) | | | | (42,763 | ) | | |
Net increase in deposits and debt securities in issue | | | | 46,944 | | | | | 67,012 | | | | | 71,711 | | | |
Net decrease in derivative financial instruments | | | | 1,196 | | | | | 841 | | | | | – | | | |
Net increase in trading portfolio assets | | | | (18,333 | ) | | | | (42,585 | ) | | | | (28,686 | ) | | |
Net increase in trading liabilities | | | | 310 | | | | | 9,888 | | | | | 6,925 | | | |
Net decrease in financial investments | | | | 1,538 | | | | | 27,129 | | | | | – | | | |
Net increase in other assets | | | | (1,527 | ) | | | | (411 | ) | | | | (1,471 | ) | | |
Net decrease in other liabilities | | | | (1,580 | ) | | | | (2,852 | ) | | | | (742 | ) | | |
Tax paid | | | | (2,141 | ) | | | | (1,082 | ) | | | | (690 | ) | | |
| | | | | | | |
Net cash from operating activities | | | | 10,057 | | | | | 3,679 | | | | | 9,491 | | | |
| | | | | | | |
Purchase of available for sale investments | | | | (47,109 | ) | | | | (53,626 | ) | | | | (47,555 | ) | | |
Proceeds from sale or redemption of available for sale investments | | | | 46,069 | | | | | 51,114 | | | | | 41,163 | | | |
Purchase of intangible assets | | | | (212 | ) | | | | (91 | ) | | | | (64 | ) | | |
Purchase of property, plant and equipment | | | | (654 | ) | | | | (588 | ) | | | | (532 | ) | | |
Proceeds from sale of property, plant and equipment | | | | 786 | | | | | 98 | | | | | 125 | | | |
Acquisition of subsidiaries, net of cash acquired | | | | (248 | ) | | | | (2,115 | ) | | | | (211 | ) | | |
Disposal of subsidiaries, net of cash disposed | | | | (15 | ) | | | | – | | | | | – | | | |
Increase in investment in subsidiaries | | | | (432 | ) | | | | (160 | ) | | | | (58 | ) | | |
Decrease in investment in subsidiaries | | | | 44 | | | | | 49 | | | | | 70 | | | |
Acquisition of associates and joint ventures | | | | (162 | ) | | | | (176 | ) | | | | (21 | ) | | |
Disposal of associates and joint ventures | | | | 739 | | | | | 40 | | | | | 47 | | | |
Other cash flows associated with investing activities | | | | 17 | | | | | 23 | | | | | 15 | | | |
| | | | | | | |
Net cash used in investing activities | | | | (1,177 | ) | | | | (5,432 | ) | | | | (7,021 | ) | | |
| | | | | | | |
Dividends paid | | | | (2,373 | ) | | | | (2,325 | ) | | | | (2,158 | ) | | |
Proceeds from borrowings and issuance of debt securities | | | | 2,493 | | | | | 1,179 | | | | | 666 | | | |
Repayments of borrowings and redemption of debt securities | | | | (366 | ) | | | | (464 | ) | | | | (611 | ) | | |
Issue of shares and other equity instruments | | | | 585 | | | | | 2,383 | | | | | 749 | | | |
| | | | | | | |
Net issues of shares to minority interests | | | | 226 | | | | | 20 | | | | | 17 | | | |
| | | | | | | |
Net cash from financing activities | | | | 565 | | | | | 793 | | | | | (1,337 | ) | | |
| | | | | | | |
Exchange loss/(gain) on foreign currency cash and cash equivalents | | | | 552 | | | | | (237 | ) | | | | (470 | ) | | |
| | | | | | | |
Net increase/(decrease) in cash and cash equivalents | | | | 9,997 | | | | | (1,197 | ) | | | | 663 | | | |
| | | | | | | |
Cash and cash equivalents at beginning of year | | | | 20,405 | | | | | 21,602 | | | | | 13,854 | | | |
| | | | | | | |
Cash and cash equivalents at end of year | | | | 30,402 | | | | | 20,405 | | | | | 14,517 | | | |
| | | | | | | |
Cash and cash equivalents comprise: | | | | | | | | | | | | | | | | | |
Cash in hand | | | | 6,795 | | | | | 3,506 | | | | | 1,753 | | | |
Loans and advances to banks | | | | 30,926 | | | | | 31,105 | | | | | 80,632 | | | |
Less: amounts with original maturity greater than three months | | | | (15,892 | ) | | | | (17,987 | ) | | | | (71,180 | ) | | |
| | | | | 15,034 | | | | | 13,118 | | | | | 9,452 | | | |
Available for sale financial investments | | | | 51,952 | | | | | 53,703 | | | | | – | | | |
Less: non-cash and amounts with original maturity greater than three months | | | | (50,933 | ) | | | | (53,487 | ) | | | | – | | | |
| | | | | 1,019 | | | | | 216 | | | | | – | | | |
Trading portfolio assets | | | | 177,884 | | | | | 155,730 | | | | | – | | | |
Less: non-cash and amounts with maturity greater than three months | | | | (170,346 | ) | | | | (152,190 | ) | | | | – | | | |
| | | | | 7,538 | | | | | 3,540 | | | | | – | | | |
Other | | | | 16 | | | | | 25 | | | | | 3,312 | | | |
| | | | | | | |
| | | | | 30,402 | | | | | 20,405 | | | | | 14,517 | | | |
In 2005, the opening cash and cash equivalents balance has been adjusted to reflect the adoption of IAS 32 and IAS 39.
| | |
Barclays PLC Annual Report 2006 | | 277 |
| |
Barclays Bank PLC data
Notes to the accounts
(a) Principal transactions
| | | | | | | | |
| | | 2006
£m | | | 2005
£m | | | 2004
£m |
| | | |
Rates related business | | 2,866 | | | 1,732 | | | 1,141 |
Credit related business | | 766 | | | 589 | | | 346 |
| | | |
Net trading income | | 3,632 | | | 2,321 | | | 1,487 |
| | | |
Gain from disposal of available for sale assets/investment securities | | 307 | | | 120 | | | 45 |
Dividend income on equity investments | | 15 | | | 22 | | | 17 |
Net gain from financial instruments designated at fair value | | 447 | | | 389 | | | n/a |
Income from assets backing insurance policies | | n/a | | | n/a | | | 717 |
Other investment income | | 193 | | | 327 | | | 248 |
| | | |
Net investment income | | 962 | | | 858 | | | 1,027 |
| | | |
Principal transactions | | 4,594 | | | 3,179 | | | 2,154 |
Net trading income includes the profits and losses arising both on the purchase and sale of trading instruments and from the revaluation to market value, together with the interest income earned from these instruments and the related funding cost. The gain/loss from disposal of available for sale assets was calculated on an instrument by instrument basis. Of the total net trading income, £947m (2005: £498m, 2004: £556m) was earned on securities and £480m (2005: £340m, 2004: £213m) was earned in foreign exchange dealings. Rates related business includes fixed income, foreign exchange, commodities, emerging markets, money markets sales, trading and research, prime services and equity products; Credit related business includes primary and secondary activities for loans and bonds for investment grade, high yield and emerging market credits, as well as hybrid capital products, asset based finance, commercial mortgage backed securities, credit derivatives, structured capital markets and large asset leasing. The net gain on financial assets designated as at fair value and included within principal transactions was £489m (2005: £391m, 2004: n/a) of which gains of £42m (2005: £2m gain, 2004: n/a) were included in net trading income and gains of £447m (2005: £389m, 2004: n/a) were included in net investment income. The net loss on financial liabilities designated at fair value and included within principal transactions was £920m (2005: £666m, 2004: n/a) all of which was included within net trading income. (b) Other income |
| | | 2006
£m |
| | 2005
£m |
| | 2004
£m |
| | | |
Increase in fair value of assets held in respect of linked liabilities to customers under investment contracts | | 7,417 | | | 9,234 | | | n/a |
Increase in liabilities to customers under investment contracts | | (7,417 | ) | | (9,234 | ) | | n/a |
Property rentals | | 55 | | | 54 | | | 46 |
Other income | | 202 | | | 124 | | | 94 |
| | | |
Other income | | 257 | | | 178 | | | 140 |
(c) Trading portfolio assets |
| | | | | | 2006
£m |
| | 2005
£m |
| | | |
Trading portfolio assets | | | | | | | | |
Treasury and other eligible bills | | | | | 2,960 | | | 6,081 |
| | | |
Debt securities | | | | | | | | |
United Kingdom government bonds | | | | | 4,986 | | | 4,786 |
Other government bonds | | | | | 46,845 | | | 46,426 |
Other mortgage-backed securities | | | | | 17,032 | | | 10,290 |
Bank and building society certificates of deposit | | | | | 14,159 | | | 15,837 |
Other issuers | | | | | 57,554 | | | 51,028 |
| | | |
Debt securities | | | | | 140,576 | | | 128,367 |
| | | |
Equity securities | | | | | 31,565 | | | 20,299 |
| | | |
Traded loans | | | | | 1,843 | | | 408 |
| | | |
London Metal Exchange warrants and other metals trading positions | | | | | 940 | | | 575 |
Trading portfolio assets | | | | | 177,884 | | | 155,730 |
| | |
| 278 | | Barclays PLC Annual Report 2006 |
| |
(d) Available for sale financial investments
| | | | | | |
| | | 20 06
£m | | | 2005
£m | |
| | |
Debt securities | | 47,912 | | | 50,024 | |
Equity securities | | 1,620 | | | 1,456 | |
Treasury bills and other eligible bills | | 2,420 | | | 2,223 | |
| | |
Available for sale financial investments | | 51,952 | | | 53,703 | |
| | | | | | |
| Movement in available for sale financial investments | | 2006
£m | | | 2005 £m | |
| | |
At beginning of year | | 53,703 | | | 48,293 | |
Exchange and other adjustments | | (3,999 | ) | | 1,791 | |
Acquisitions and transfers | | 47,109 | | | 54,556 | |
Disposals (sale and redemption) | | (44,959 | ) | | (50,609 | ) |
Gains/(losses) from changes in fair value recognised in equity | | 182 | | | (238 | ) |
Impairment | | (86 | ) | | (4 | ) |
Amortisation of discounts/premium | | 2 | | | (86 | ) |
| | |
At end of year | | 51,952 | | | 53,703 | |
| | | | | | |
| Available for sale securities | | 2006
Book value
£m | | | 2005 Book value
£m | |
| | |
Debt securities | | | | | | |
– United Kingdom government | | 758 | | | 31 | |
– Other government | | 12,587 | | | 14,860 | |
– Other public bodies | | 280 | | | 216 | |
– Mortgage backed securities | | 1,706 | | | 3,062 | |
– Corporate issuers | | 27,089 | | | 25,590 | |
– Other issuers | | 5,492 | | | 6,265 | |
Equity securities | | 1,620 | | | 1,456 | |
Treasury bills and other eligible bills | | 2,420 | | | 2,223 | |
| | |
Available for sale financial investments | | 51,952 | | | 53,703 | |
| | |
Barclays PLC Annual Report 2006 | | 279 |
| |
Barclays Bank PLC data
Notes to the accounts
(e) Called up share capital
Ordinary Shares
The authorised ordinary share capital of the Bank, as at 31st December 2006, was 3,000 million (2005: 3,000 million) ordinary shares of £1 each.
During the year, the Bank issued 11 million ordinary shares with an aggregate nominal value of £11m, for cash consideration of £179m.
Preference Shares
The authorised preference share capital of Barclays Bank PLC, as at 31st December 2006, was 1,000 Preference Shares (2005: 1,000) of £1; 400,000 Preference Shares of€100 each (2005: 400,000); 400,000 Preference Shares of £100 each (2005: 400,000); 400,000 Preference Shares of US$100 each (2005: 400,000); 80 million Preference Shares of US$0.25 each (2005: 80 million).
The issued preference share capital of Barclays Bank PLC, as at 31st December 2006, comprised 1,000 (2005: 1,000) Sterling £1 Preference Shares of £1 each; 240,000 (2005: 240,000) Euro Preference Shares of€100 each; 75,000 (2005: 75,000) Sterling Preference Shares of £100 each; 100,000 (2005: 100,000) US Dollar Preference Shares of US$100 each; 30 million (2005: nil) US Dollar Preference Shares of US$0.25 each.
| | | | |
| | | 2006
£m | | 2005
£m |
| | |
Called up share capital, allotted and fully paid | | | | |
At beginning of year | | 2,318 | | 2,309 |
Issued for cash | | 11 | | 9 |
| | |
At end of year | | 2,329 | | 2,318 |
Called up preference share capital, allotted and fully paid | | | | |
At beginning of year | | 30 | | 7 |
Issued for cash | | 4 | | 23 |
| | |
At end of year | | 34 | | 30 |
| | |
Called up share capital | | 2,363 | | 2,348 |
Share premium
| | | | |
| | | 2006
£m | | 2005
£m |
At beginning of year | | 8,882 | | 6,531 |
Ordinary shares issued for cash | | 168 | | 126 |
Preference shares issued for cash | | 402 | | 2,225 |
| | |
At end of year | | 9,452 | | 8,882 |
Sterling £1 Preference Shares
1,000 Sterling cumulative callable preference shares of £1 each (the ‘£1 Preference Shares’) were issued on 31st December 2004 at nil premium.
The £1 Preference Shares entitle the holders thereof to receive sterling cumulative cash dividends out of distributable profits of Barclays Bank PLC, semi-annually at a rate reset semi-annually equal to the sterling interbank offered rate for six-month sterling deposits.
Barclays Bank PLC shall be obliged to pay such dividends if (1) it has profits available for the purpose of distribution under the Companies Act 1985 as at each dividend payment date and (2) it is solvent on the relevant dividend payment date, provided that a capital regulations condition is satisfied on such dividend payment date. The dividends shall not be due and payable on the relevant dividend payment date except to the extent that Barclays Bank PLC could make such payment and still be solvent immediately thereafter. Barclays Bank PLC shall be considered solvent on any date if (1) it is able to pay its debts to senior creditors as they fall due and (2) its auditors have reported within the previous six months that its assets exceed its liabilities.
If Barclays Bank PLC shall not pay, or shall pay only in part, a dividend for a period of seven days or more after the due date for payment, the holders of the £1 Preference Shares may institute proceedings for the winding-up of Barclays Bank PLC. No remedy against Barclays Bank PLC shall be available to the holder of any £1 Preference Shares for the recovery of amounts owing in respect of £1 Preference Shares other than the institution of proceedings for the winding-up of Barclays Bank PLC and/or proving in such winding-up.
On a winding-up or other return of capital (other than a redemption or purchase by Barclays Bank PLC of any of its issued shares, or a reduction of share capital, permitted by the Articles of Barclays Bank PLC and under applicable law), the assets of Barclays Bank PLC available to shareholders shall be applied in priority to any payment to the holders of ordinary shares and any other class of shares in the capital of Barclays Bank PLC then in issue ranking junior to the £1 Preference Shares on such a return of capital and pari passu on such a return of capital with the holders of any other class of shares in the capital of Barclays Bank PLC then in issue (other than any class of shares in the capital of Barclays Bank PLC then in issue ranking in priority to the £1 Preference Shares on a winding-up or other such return of capital), in payment to the holders of the £1 Preference Shares of a sum equal to the aggregate of: (1) an amount equal to the dividends accrued thereon for the then current dividend period (and any accumulated arrears thereof) to the date of the commencement of the winding-up or other such return of capital; and (2) an amount equal to £1 per £1 Preference Share.
After payment of the full amount of the liquidating distributions to which they are entitled, the holders of the £1 Preference Shares will have no right or claim to any of the remaining assets of Barclays Bank PLC and will not be entitled to any further participation in such return of capital. The £1 Preference Shares are redeemable at the option of Barclays Bank PLC, in whole but not in part only, subject to the Companies Act and its Articles. Holders of the £1 Preference Shares are not entitled to receive notice of, or to attend, or vote at, any general meeting of Barclays Bank PLC.
| | |
| 280 | | Barclays PLC Annual Report 2006 |
| |
(e) Called up share capital (continued)
Euro Preference Shares
100,000 Euro 4.875% non-cumulative callable preference shares of€100 each (the ‘4.875% Preference Shares’) were issued on 8th December 2004 for a consideration of€993.6m (£688.4m), of which the nominal value was€10m and the balance was share premium. The 4.875% Preference Shares entitle the holders thereof to receive Euro non-cumulative cash dividends out of distributable profits of Barclays Bank PLC, annually at a fixed rate of 4.875% per annum on the amount of€10,000 per preference share until 15th December 2014, and thereafter quarterly at a rate reset quarterly equal to 1.05% per annum above the Euro interbank offered rate for three-month Euro deposits.
The 4.875% Preference Shares are redeemable at the option of Barclays Bank PLC, in whole but not in part only, on 15th December 2014, and on each dividend payment date thereafter at€10,000 per share plus any dividends accrued for the then current dividend period to the date fixed for redemption.
140,000 Euro 4.75% non-cumulative callable preference shares of€100 each (the ‘4.75% Preference Shares’) were issued on 15th March 2005 for a consideration of€1,383.3m (£966.7m), of which the nominal value was€14m and the balance was share premium. The 4.75% Preference Shares entitle the holders thereof to receive Euro non-cumulative cash dividends out of distributable profits of Barclays Bank PLC, annually at a fixed rate of 4.75% per annum on the amount of€10,000 per preference share until 15th March 2020, and thereafter quarterly at a rate reset quarterly equal to 0.71% per annum above the Euro interbank offered rate for three-month Euro deposits.
The 4.75% Preference Shares are redeemable at the option of Barclays Bank PLC, in whole but not in part only, on 15th March 2020, and on each dividend payment date thereafter at€10,000 per share plus any dividends accrued for the then current dividend period to the date fixed for redemption.
Sterling Preference Shares
75,000 Sterling 6.0% non-cumulative callable preference shares of £100 each (the ‘6.0% Preference Shares’) were issued on 22nd June 2005 for a consideration of £732.6m, of which the nominal value was £7.5m and the balance was share premium. The 6.0% Preference Shares entitle the holders thereof to receive Sterling non-cumulative cash dividends out of distributable profits of Barclays Bank PLC, annually at a fixed rate of 6.0% per annum on the amount of £10,000 per preference share until 15th December 2017, and thereafter quarterly at a rate reset quarterly equal to 1.42% per annum above the London interbank offered rate for three-month Sterling deposits.
The 6.0% Preference Shares are redeemable at the option of Barclays Bank PLC, in whole but not in part only, on 15th December 2017, and on each dividend payment date thereafter at £10,000 per share plus any dividends accrued for the then current dividend period to the date fixed for redemption.
US Dollar Preference Shares
100,000 US Dollar 6.278% non-cumulative callable preference shares of US $100 each (the ‘6.278% Preference Shares’), represented by 100,000 American Depositary Shares, Series 1, were issued on 8th June 2005 for a consideration of US $995.4m (£548.1m), of which the nominal value was US $10m and the balance was share premium. The 6.278% Preference Shares entitle the holders thereof to receive US Dollar non-cumulative cash dividends out of distributable profits of Barclays Bank PLC, semi-annually at a fixed rate of 6.278% per annum on the amount of US $10,000 per preference share until 15th December 2034, and thereafter quarterly at a rate reset quarterly equal to 1.55% per annum above the London interbank offered rate for three-month US Dollar deposits.
The 6.278% Preference Shares are redeemable at the option of Barclays Bank PLC, in whole but not in part only, on 15th December 2034, and on each dividend payment date thereafter at US $10,000 per share plus any dividends accrued for the then current dividend period to the date fixed for redemption.
30 million US Dollar 6.625% non-cumulative callable preference shares of US $0.25 each (the ‘6.625% Preference Shares’), represented by 30 million American Depositary Shares, Series 2, were issued on 25th and 28th April 2006 for a consideration of US $727m (£406m), of which the nominal value was US $7.5m and the balance was share premium. The 6.625% Preference Shares entitle the holders thereof to receive US Dollar non-cumulative cash dividends out of distributable profits of Barclays Bank PLC, quarterly at a fixed rate of 6.625% per annum on the amount of US $25 per preference share.
The 6.625% Preference Shares are redeemable at the option of Barclays Bank PLC, in whole but not in part only, on 15th September 2011, and on each dividend payment date thereafter at US $25 per share plus any dividends accrued for the then current dividend period to the date fixed for redemption.
No redemption or purchase of any 4.875% Preference Shares, the 4.75% Preference Shares, the 6.0% Preference Shares, the 6.278% Preference Shares and the 6.625% Preference Shares (together the ‘Preference Shares’) may be made by Barclays Bank PLC without the prior consent of the UK FSA and any such redemption will be subject to the Companies Act and the Articles of Barclays Bank PLC.
On a winding-up of Barclays Bank PLC or other return of capital (other than a redemption or purchase of shares of Barclays Bank PLC, or a reduction of share capital), a holder of preference shares will rank in the application of assets of Barclays Bank PLC available to shareholders (1) junior to the holder of any shares of Barclays Bank PLC in issue ranking in priority to the preference shares, (2) equally in all respects with holders of other preference shares and any other shares of Barclays Bank PLC in issue ranking pari passu with the preference shares and (3) in priority to the holders of ordinary shares and any other shares of Barclays Bank PLC in issue ranking junior to the preference shares.
The holders of the £400m 6% Callable Perpetual Core Tier One Notes and the US $1,000m 6.86% Callable Perpetual Core Tier One Notes of Barclays Bank PLC (together, the ‘TONs’) and the holders of the US $1,250m 8.55% Step-up Callable Perpetual Reserve Capital Instruments, the US $750m 7.375% Step-up Callable Perpetual Reserve Capital Instruments, the€850m 7.50% Step-up Callable Perpetual Reserve Capital Instruments, the £500m 5.3304% Step-up Callable Perpetual Reserve Capital Instruments and the US $1,350m 5.926% Step-up Callable Perpetual Reserve Capital Instruments of Barclays Bank PLC (together, the ‘RCIs’) would, for the purposes only of calculating the amounts payable in respect of such securities on a winding-up of Barclays Bank PLC, subject to limited exceptions and to the extent that the TONs and the RCIs are then in issue, rank pari passu with the holders of the most senior class or classes of preference shares then in issue in the capital of Barclays Bank PLC. Accordingly, the holders of
| | |
Barclays PLC Annual Report 2006 | | 281 |
| |
Barclays Bank PLC data
Notes to the accounts
(e) Called up share capital (continued)
the preference shares would rank equally with the holders of such TONs and RCIs on such a winding-up of Barclays Bank PLC (unless one or more classes of shares of Barclays Bank PLC ranking in priority to the preference shares are in issue at the time of such winding-up, in which event the holders of such TONs and RCIs would rank equally with the holders of such shares and in priority to the holders of the preference shares).
Subject to such ranking, in such event, holders of the preference shares will be entitled to receive out of assets of Barclays Bank PLC available for distributions to shareholders, liquidating distributions in the amount of€10,000 per 4.875% Preference Share,€10,000 per 4.75% Preference Share, £10,000 per 6.0% Preference Share, US $10,000 per 6.278% Preference Share and US $25 per 6.625% Preference Share plus, in each case, an amount equal to the accrued dividend for the then current dividend period to the date of the commencement of the winding-up or other such return of capital. If a dividend is not paid in full on any preference shares on any dividend payment date, then a dividend restriction shall apply.
This dividend restriction will mean that neither Barclays Bank PLC nor Barclays PLC may (a) declare or pay a dividend (other than payment by Barclays PLC of a final dividend declared by its shareholders prior to the relevant dividend payment date, or a dividend paid by Barclays Bank PLC to Barclays PLC or to a wholly owned subsidiary) on any of their respective ordinary shares, other preference shares or other share capital or (b) redeem, purchase, reduce or otherwise acquire any of their respective share capital, other than shares of Barclays Bank PLC held by Barclays PLC or a wholly owned subsidiary, until the earlier of (1) the date on which Barclays Bank PLC next declares and pays in full a preference dividend and (2) the date on or by which all the preference shares are redeemed in full or purchased by Barclays Bank PLC.
Holders of the preference shares are not entitled to receive notice of, or to attend, or vote at, any general meeting of Barclays Bank PLC. Barclays Bank PLC is not permitted to create a class of shares ranking as regards participation in the profits or assets of Barclays Bank PLC in priority to the preference shares, save with the sanction of a special resolution of a separate general meeting of the holders of the preference shares (requiring a majority of not less than three-fourths of the holders of the preference shares voting at the separate general meeting), or with the consent in writing of the holders of three-fourths of the preference shares.
Except as described above, the holders of the preference shares have no right to participate in the surplus assets of Barclays Bank PLC.
(f) Revaluation reserves, retained earnings and other reserves
Revaluation reserves
| | | | | | | | | | | | |
| | | Available
for sale
reserve
£m | | | Cash flow
hedging
reserve
£m | | | Translation
reserve £m | | | Total £m | |
At 1st January 2006 | | 257 | | | 70 | | | 156 | | | 483 | |
Net gains/(losses) from changes in fair value | | 91 | | | (421 | ) | | – | | | (330 | ) |
Net gains transferred to net profit | | (308 | ) | | (51 | ) | | – | | | (359 | ) |
Currency translation differences arising during the year | | – | | | – | | | (464 | ) | | (464 | ) |
Changes in insurance liabilities | | 23 | | | – | | | – | | | 23 | |
Net losses transferred to net profit due to fair value hedging | | 13 | | | – | | | – | | | 13 | |
Tax | | 22 | | | 172 | | | (130 | ) | | 64 | |
Losses transferred to net profit due to impairment | | 86 | | | – | | | – | | | 86 | |
| | | | |
At 31st December 2006 | | 184 | | | (230 | ) | | (438 | ) | | (484 | ) |
| | | |
| |
| Retained earnings | | | |
| | | Retained
earnings
£m | |
| |
At 1st January 2006 | | 8,462 | |
Profit attributable to equity holders | | 4,914 | |
Equity-settled share schemes | | 663 | |
Tax on equity-settled shares schemes | | 96 | |
Vesting of Barclays PLC shares under share-based payment schemes | | (394 | ) |
Dividends paid | | (1,964 | ) |
Dividends on preference shares and other shareholders’ equity | | (329 | ) |
Other movements | | 108 | |
| |
At 31st December 2006 | | 11,556 | |
| |
At 1st January 2005 | | 6,657 | |
Profit attributable to equity holders | | 3,695 | |
Equity-settled share schemes | | 346 | |
Tax on equity-settled share schemes | | 101 | |
Vesting of Barclays PLC shares under share-based payment schemes | | (78 | ) |
Dividends paid | | (2,012 | ) |
Dividends on preference shares and other shareholders’ equity | | (217 | ) |
Other | | (30 | ) |
| |
At 31st December 2005 | | 8,462 | |
| | |
| 282 | | Barclays PLC Annual Report 2006 |
| |
(g) Other shareholders’ equity
| | | | |
| | | 2006
£m | | 2005
£m |
At 1st January | | 2,490 | | 2,494 |
Appropriations | | 44 | | (4) |
At 31st December | | 2,534 | | 2,490 |
Included in other shareholders’ equity are:
Issuances of reserve capital instruments which bear a fixed rate of interest ranging between 7.375%-8.55% until 2010 or 2011. After these dates, in the event that the reserve capital instruments are not redeemed, they will bear interest at rates fixed periodically in advance, based on London or European interbank rates. These instruments are repayable, at the option of the Bank, in whole on any coupon payment date falling in or after June or December 2010 or 2011. The Bank may elect to defer any payment of interest on the reserve capital instruments for any period of time. Whilst such deferral is continuing, neither the Bank nor Barclays PLC may declare or pay a dividend, subject to certain exceptions, on any of its ordinary shares or preference shares.
Issuance of capital notes which bear interest at rates fixed periodically in advance, based on London interbank rates. These notes are repayable in each case, at the option of the Bank, in whole on any interest payment date. The Bank is not obliged to make a payment of interest on its capital notes if, in the preceding six months, a dividend has not been declared or paid on any class of shares of Barclays PLC.
(h) Minority interests
| | | | |
| | | 2006
£m | | 2005
£m |
At beginning of year | | 1,578 | | 147 |
Share of profit after tax | | 342 | | 177 |
Dividend and other payments | | (127) | | (96) |
Equity issued by subsidiaries | | 233 | | 26 |
Available for sale reserve: net (loss)/gain from changes in fair value | | (2) | | 1 |
Cash flow hedges: net (loss)/gain from changes in fair value | | (9) | | 1 |
Currency translation differences | | (316) | | 85 |
Additions | | 20 | | 1,281 |
Disposals | | (34) | | 4 |
Other | | – | | (48) |
At end of year | | 1,685 | | 1,578 |
(i) Dividends
| | | | |
| | | 2006
£m | | 2005
£m |
On ordinary shares | | | | |
Final dividend | | 730 | | 1,017 |
Interim dividend | | 1,234 | | 995 |
Dividends | | 1,964 | | 2,012 |
The 2006 dividend disclosure of £730m relates to the cash payment of the 2005 final dividend made in April 2006. The 2005 final dividend disclosure of £1,017m relates to the cash payment of the 2004 final dividend made in April 2005.
These dividends are paid to enable Barclays PLC to fund its dividends to its shareholders.
Dividends paid on preference shares amounted to £174m (2005: £74m). Dividends paid on other equity instruments as detailed in Note (g) amounted to £151m (2005: £143m).
| | |
Barclays PLC Annual Report 2006 | | 283 |
| |
Barclays Bank PLC data
Notes to the accounts
(j) Segmental analysis
| | | | | | | | | | | | |
Year ended 31st December 2006 | | United
Kingdom
£m | | Other
European
Union
£m | | United
States
£m | | Africa
£m | | Rest of
the World
£m | | Total
£m |
Total income | | 12,503 | | 3,063 | | 2,840 | | 2,897 | | 928 | | 22,231 |
Insurance claims and benefits | | (288) | | (181) | | – | | (106) | | – | | (575) |
Total income net of insurance claims | | 12,215 | | 2,882 | | 2,840 | | 2,791 | | 928 | | 21,656 |
Percentage of total income net of insurance claims (%) | | 57% | | 13% | | 13% | | 13% | | 4% | | 100% |
Total assets (by location of asset) | | 406,044 | | 203,929 | | 229,779 | | 44,696 | | 112,055 | | 996,503 |
Percentage of total assets (%) | | 41% | | 20% | | 23% | | 5% | | 11% | | 100% |
Capital expenditure (by location of asset)(a) | | 569 | | 62 | | 565 | | 136 | | 39 | | 1,371 |
| | | | | | | | | | | | | |
Year ended 31st December 2005 | | United
Kingdom
£m | | Other
European
Union
£m | | United
States
£m | | Africa
£m | | Rest of
the World
£m | | Total
£m |
Total income | | 11,103 | | 2,221 | | 2,421 | | 1,489 | | 775 | | 18,009 |
Insurance claims and benefits | | (375) | | (226) | | – | | (44) | | – | | (645) |
Total income net of insurance claims | | 10,728 | | 1,995 | | 2,421 | | 1,445 | | 775 | | 17,364 |
Percentage of total income net of insurance claims (%) | | 63% | | 11% | | 14% | | 8% | | 4% | | 100% |
Total assets (by location of asset) | | 348,516 | | 196,965 | | 230,200 | | 48,803 | | 99,686 | | 924,170 |
Percentage of total assets (%) | | 38% | | 21% | | 25% | | 5% | | 11% | | 100% |
Capital expenditure (by location of asset)(a) | | 449 | | 119 | | 276 | | 2,586 | | 36 | | 3,466 |
(k) Differences between IFRS and US accounting principles – Barclays Bank PLC
| | | | | | | | |
| | | | | 2006
£m | | 2005
£m | | 2004
£m |
| Profit attributable to equity holders of the parent (IFRS) | | Note | | 4,914 | | 3,695 | | 3,263 |
Goodwill | | (a) | | (8) | | – | | (2) |
Intangible assets | | (b) | | (127) | | (121) | | (137) |
Pensions | | (c) | | (106) | | (202) | | (14) |
Post-retirement benefits | | (c) | | (17) | | (1) | | 20 |
Leasing | | | | (342) | | (136) | | – |
Other compensation arrangements | | | | 66 | | 44 | | 54 |
Insurance | | | | (96) | | (35) | | (95) |
Revaluation of property | | | | 85 | | 9 | | 11 |
Hedging | | (l) | | (76) | | (208) | | n/a |
Derivatives | | | | n/a | | n/a | | (364) |
Financial instruments | | | | 52 | | (417) | | n/a |
Fair value of securities | | | | n/a | | n/a | | 80 |
Foreign exchange on available for sale securities | | (j) | | 349 | | 185 | | 428 |
Fee and cost recognition | | | | 31 | | 58 | | (180) |
Loan origination | | | | n/a | | n/a | | (66) |
Consolidation | | (m) | | (33) | | (22) | | 68 |
Securitisations | | (n) | | (48) | | 204 | | 21 |
Guarantees | | | | (9) | | (25) | | (10) |
Business combinations | | (i) | | – | | – | | 13 |
Software capitalisation | | | | – | | – | | (15) |
Extinguishment of liabilities | | | | n/a | | n/a | | (32) |
Classification of debt and equity | | | | 35 | | (73) | | 96 |
Impairment | | | | – | | (24) | | – |
Loans held for sale | | | | (11) | | – | | – |
Non-financial instruments | | | | 1 | | 18 | | – |
Disposal of investment in foreign subsidiaries | | | | (34) | | n/a | | n/a |
Tax effect on IFRS/US GAAP reconciling items | | | | 24 | | 215 | | (2) |
| Net income (US GAAP) | | | | 4,650 | | 3,164 | | 3,137 |
The note letters refer to Note 60.
Note
(a) Capital expenditure comprises purchased goodwill, intangible assets and property, plant and equipment acquired during the year.
| | |
| 284 | | Barclays PLC Annual Report 2006 |
| |
(k) Differences between IFRS and US accounting principles – Barclays Bank PLC (continued)
| | | | | | |
| | | Note | | 2006
£m | | 2005
£m |
Shareholders’ equity excluding minority interests (IFRS) | | | | 25,421 | | 22,665 |
| | | |
Goodwill | | (a) | | 533 | | 563 |
Intangible assets | | (b) | | (694) | | (573) |
Pensions | | (c) | | 324 | | 1,224 |
Post-retirement benefits | | (c) | | (32) | | 51 |
Leasing | | | | (342) | | – |
Other compensation arrangements | | | | 176 | | 104 |
Insurance | | | | (33) | | 62 |
Revaluation of property | | | | (136) | | (221) |
Hedging | | (l) | | 295 | | 254 |
Financial instruments | | | | (91) | | (424) |
Fee and cost recognition | | | | 62 | | 30 |
Consolidation | | (m) | | 9 | | 51 |
Securitisations | | (n) | | 307 | | 355 |
Guarantees | | | | (3) | | 6 |
Classification of debt and equity | | | | (407) | | (470) |
Loans held for sale | | | | (11) | | – |
Non-financial instruments | | | | (3) | | (4) |
Tax effect on IFRS/US GAAP reconciling items | | | | (307) | | (559) |
Shareholders’ equity (US GAAP) | | | | 25,068 | | 23,114 |
For those standards that were not adopted until 1st January 2005, UK GAAP continued to be applied throughout 2004 in accordance with IFRS transition rules. Therefore, for 31st December 2004, the differences relating to Derivatives, Fair value of securities, Loan origination and Extinguishment of liabilities are the same as those previously reported.
| | | | |
| | | 2006
£m | | 2005
£m |
| | |
Total assets (US GAAP) of Barclays PLC Group (Note 60) | | 928,057 | | 840,657 |
Shares in Barclays PLC – held within Barclays Bank PLC Group | | 266 | | 213 |
Cash and balances at central banks – held by Barclays PLC | | (550) | | (400) |
Total assets (US GAAP) of Barclays Bank PLC Group | | 927,773 | | 840,470 |
The note letters refer to Note 60.
| | |
Barclays PLC Annual Report 2006 | | 285 |
| |
Barclays Bank PLC
Financial Data
| | | | | | | | | | | | | | | |
| | | IFRS | | | UK GAAP | |
Selected financial statistics | | 2006
% |
| | 2005
% |
| | 2004(a)
% |
| | 2003
% |
| | 2002
% |
|
Attributable profit as a percentage of: | | | | | | | | | | | | | | | |
– average total assets | | 0.4 | | | 0.4 | | | 0.5 | | | 0.6 | | | 0.5 | |
– average shareholders’ equity | | 20.2 | | | 17.4 | | | 21.3 | | | 17.0 | | | 14.7 | |
Average shareholders’ equity as a percentage of average total assets | | 2.2 | | | 2.2 | | | 2.4 | | | 3.3 | | | 3.5 | |
Selected income statement data | | £m | | | £m | | | £m | | | £m | | | £m | |
Interest income | | 21,805 | | | 17,232 | | | 13,880 | | | 12,427 | | | 12,044 | |
Interest expense | | (12,662 | ) | | (9,157 | ) | | (7,047 | ) | | (5,823 | ) | | (5,839 | ) |
Non-interest income | | 13,088 | | | 9,934 | | | 8,543 | | | 5,807 | | | 5,122 | |
Operating expenses | | (12,674 | ) | | (10,527 | ) | | (8,536 | ) | | (7,253 | ) | | (6,626 | ) |
Provisions – bad and doubtful debts | | n/a | | | n/a | | | n/a | | | (1,347 | ) | | (1,484 | ) |
– contingent liabilities and commitments | | n/a | | | n/a | | | n/a | | | 1 | | | (1 | ) |
Impairment charges | | (2,154 | ) | | (1,571 | ) | | (1,093 | ) | | n/a | | | n/a | |
Share of post-tax results of associates and joint ventures | | 46 | | | 45 | | | 56 | | | 29 | | | (10 | ) |
Profit on disposal of subsidiaries, associates and joint ventures | | 323 | | | – | | | 45 | | | n/a | | | n/a | |
Exceptional items | | n/a | | | n/a | | | n/a | | | 4 | | | (3 | ) |
Profit before tax | | 7,197 | | | 5,311 | | | 4,589 | | | 3,845 | | | 3,203 | |
Attributable profit | | 4,914 | | | 3,695 | | | 3,263 | | | 2,744 | | | 2,228 | |
| | | | | |
Selected balance sheet data | | £m | | | £m | | | £m | | | £m | | | £m | |
Total shareholders’ equity | | 27,106 | | | 24,243 | | | 16,849 | | | 16,485 | | | 15,205 | |
Subordinated liabilities | | 13,786 | | | 12,463 | | | 12,277 | | | 12,339 | | | 11,537 | |
Deposits from banks, customer accounts and debt securities in issue | | 447,453 | | | 417,139 | | | 412,358 | | | 329,815 | | | 304,817 | |
Loans and advances to banks and customers | | 313,226 | | | 300,001 | | | 343,041 | | | 288,743 | | | 260,572 | |
Total assets | | 996,503 | | | 924,170 | | | 538,300 | | | 443,373 | | | 403,066 | |
Note
| (a) | Does not reflect the application of IAS 32, IAS 39 and IFRS 4 which became effective from 1st January 2005. |
| | |
| 286 | | Barclays PLC Annual Report 2006 |
| |
US GAAP financial data
US GAAP financial data
The following information has been adjusted from data prepared under IFRS for 2005 and 2004, and UK GAAP for 2003 and 2002 to reflect significant differences from accounting principles generally accepted in the United States (US GAAP). See Note 60 for an explanation of these differences.
Selected financial data
| | | | | | | | | | | | |
| | | 2006(a)
¢ | | 2006
p | | 2005
p | | 2004
p | | 2003
p | | 2002
p |
Barclays PLC Group | | | | | | | | | | | | |
Earnings per 25p ordinary share (basic) | | 132.4 | | 67.9 | | 46.3 | | 47.5 | | 26.8 | | 37.4 |
Dividends per 25p ordinary share | | 54.2 | | 27.8 | | 25.0 | | 21.7 | | 19.1 | | 17.2 |
Book value per 25p ordinary share | | 599 | | 307 | | 291 | | 266 | | 260 | | 242 |
| | | | % | | % | | % | | % | | % |
Net income as a percentage of: | | | | | | | | | | | | |
– average total assets | | | | 0.5 | | 0.4 | | 0.5 | | 0.3 | | 0.5 |
– average shareholders’ equity | | | | 23.4 | | 16.8 | | 18.0 | | 10.6 | | 16.6 |
Dividends as a percentage of net income | | | | 42.0 | | 54.0 | | 46.5 | | 71.5 | | 44.7 |
Average shareholders’ equity as a percentage of average total assets | | | | 2.3 | | 2.6 | | 2.5 | | 3.2 | | 3.1 |
Barclays Bank PLC Group | | | | | | | | | | | | |
Net income as a percentage of: | | | | | | | | | | | | |
– average total assets | | | | 0.6 | | 0.5 | | 0.5 | | 0.4 | | 0.5 |
– average shareholders’ equity | | | | 20.6 | | 13.8 | | 17.2 | | 10.1 | | 15.6 |
Average shareholders’ equity as a percentage of average total assets | | | | 2.8 | | 3.0 | | 2.7 | | 3.5 | | 3.4 |
| | | | | | |
Selected financial statement data | | | | | | | | | | | | |
| | | 2006(a)
US$m | | 2006
£m | | 2005
£m | | 2004
£m | | 2003
£m | | 2002
£m |
Net income: | | | | | | | | | | | | |
Barclays PLC Group | | 8,420 | | 4,318 | | 2,932 | | 3,032 | | 1,740 | | 2,476 |
Barclays Bank PLC Group | | 9,068 | | 4,650 | | 3,164 | | 3,137 | | 1,842 | | 2,578 |
Shareholders’ equity: | | | | | | | | | | | | |
Barclays PLC Group | | 39,062 | | 20,032 | | 18,461 | | 16,953 | | 16,830 | | 16,015 |
Barclays Bank PLC Group | | 48,883 | | 25,068 | | 23,114 | | 19,594 | | 18,646 | | 17,846 |
Total assets: | | | | | | | | | | | | |
Barclays PLC Group | | 1,809,711 | | 928,057 | | 840,657 | | 654,580 | | 541,969 | | 491,466 |
Barclays Bank PLC Group | | 1,809,157 | | 927,773 | | 840,470 | | 654,699 | | 542,080 | | 491,586 |
Note
| (a) | The Dollar financial information has been translated for convenience at the rate of US$1.95 to £1, the Noon Buying Rate for cable transfers in New York City, payable in Pounds Sterling, at 31st December 2006. |
| | |
Barclays PLC Annual Report 2006 | | 287 |
| |
US GAAP financial data
Ratio of earnings to fixed charges – Barclays Bank PLC
| | | | | | | | | | | | | | | |
| | | 2006 | | | 2005 | | | 2004 | (a) | | 2003 | (b) | | 2002 | (b) |
| | | (in £m except for ratios) | |
Ratio of earnings to fixed charges | | | | | | | | | | | | | | | |
UK GAAP/IFRS: Fixed charges | | | | | | | | | | | | | | | |
Interest expense | | 30,385 | | | 20,965 | | | 14,464 | | | 10,754 | | | 10,153 | |
Rental expense | | 137 | | | 126 | | | 93 | | | 85 | | | 87 | |
Total fixed charges | | 30,522 | | | 21,091 | | | 14,557 | | | 10,839 | | | 10,240 | |
Earnings | | | | | | | | | | | | | | | |
Income before taxes and minority interests | | 7,197 | | | 5,311 | | | 4,589 | | | 3,845 | | | 3,203 | |
Less: Unremitted pre-tax (income)/loss of associated companies and joint ventures | | (41 | ) | | (28 | ) | | (51 | ) | | (21 | ) | | 11 | |
| | 7,156 | | | 5,283 | | | 4,538 | | | 3,824 | | | 3,214 | |
Fixed charges | | 30,522 | | | 21,091 | | | 14,557 | | | 10,839 | | | 10,240 | |
Total earnings including fixed charges | | 37,678 | | | 26,374 | | | 19,095 | | | 14,663 | | | 13,454 | |
Ratio of earnings to fixed charges | | 1.23 | | | 1.25 | | | 1.31 | | | 1.35 | | | 1.31 | |
US GAAP: Fixed charges | | | | | | | | | | | | | | | |
Interest expense(d) | | 30,117 | | | 20,953 | | | 14,330 | | | 10,609 | | | 10,004 | |
Rental expense(d) | | 137 | | | 126 | | | 93 | | | 85 | | | 87 | |
Total fixed charges | | 30,254 | | | 21,079 | | | 14,423 | | | 10,694 | | | 10,091 | |
Earnings | | | | | | | | | | | | | | | |
US GAAP Income before taxes and minority interests(c) | | 6,909 | | | 4,565 | | | 4,465 | | | 2,588 | | | 3,609 | |
Less: Unremitted pre-tax (income)/loss of associated companies and joint ventures(d) | | (41 | ) | | (28 | ) | | (51 | ) | | (21 | ) | | 11 | |
| | 6,868 | | | 4,537 | | | 4,414 | | | 2,567 | | | 3,620 | |
Fixed charges | | 30,254 | | | 21,079 | | | 14,423 | | | 10,694 | | | 10,091 | |
Total earnings including fixed charges | | 37,122 | | | 25,616 | | | 18,837 | | | 13,261 | | | 13,711 | |
Ratio of earnings to fixed charges | | 1.23 | | | 1.22 | | | 1.31 | | | 1.24 | | | 1.36 | |
Notes
| (a) | Does not reflect the application of IAS 32, IAS 39 and IFRS 4 which became effective from 1st January 2005. |
| (c) | For a discussion of significant differences between IFRS and US GAAP and a reconciliation of net income between amounts calculated under IFRS and those calculated under US GAAP, see Note 60 of the accounts included herein. |
| (d) | Interest expense, rental expense and unremitted pre-tax income of associated companies and joint venture under US GAAP for 2004 have been revised to take account of line item reclassifications arising from the Group’s conversion to IFRS. |
| | |
| 288 | | Barclays PLC Annual Report 2006 |
| |
Ratio of earnings to fixed charges and preference shares – Barclays Bank PLC (continued)
| | | | | | | | | | | | | | | |
| | | 2006 | | | 2005 | | | 2004 | (a) | | 2003 | (b) | | 2002 | (b) |
| | (in £m except for ratios) | |
Combined fixed charges, preference share dividends and similar appropriations | | | | | | | | | | | | | | | |
UK GAAP/ IFRS: | | | | | | | | | | | | | | | |
Interest expense | | 30,385 | | | 20,965 | | | 14,464 | | | 10,754 | | | 10,153 | |
Rental expense | | 137 | | | 126 | | | 93 | | | 85 | | | 87 | |
Fixed charges | | 30,522 | | | 21,091 | | | 14,557 | | | 10,839 | | | 10,240 | |
Preference share dividends and similar appropriations | | 395 | | | 304 | | | 3 | | | – | | | – | |
Total fixed charges | | 30,917 | | | 21,395 | | | 14,560 | | | 10,839 | | | 10,240 | |
Earnings Income before taxes and minority interests | | 7,197 | | | 5,311 | | | 4,589 | | | 3,845 | | | 3,203 | |
Less: Unremitted pre-tax (income)/loss of associated companies and joint ventures | | (41 | ) | | (28 | ) | | (51 | ) | | (21 | ) | | 11 | |
| | 7,156 | | | 5,283 | | | 4,538 | | | 3,824 | | | 3,214 | |
Fixed charges | | 30,917 | | | 21,091 | | | 14,557 | | | 10,839 | | | 10,240 | |
Total earnings including fixed charges | | 38,073 | | | 26,374 | | | 19,095 | | | 14,663 | | | 13,454 | |
| Ratio of earnings to combined fixed charges,preference share dividends and similar appropriations | | 1.23 | | | 1.23 | | | 1.31 | | | 1.35 | | | 1.31 | |
US GAAP: Interest expense(d) | | 30,117 | | | 20,953 | | | 14,330 | | | 10,609 | | | 10,004 | |
Rental expense(d) | | 137 | | | 126 | | | 93 | | | 85 | | | 87 | |
Fixed charges | | 30,254 | | | 21,079 | | | 14,423 | | | 10,694 | | | 10,091 | |
Preference share dividends and similar appropriations(e) | | 372 | | | 288 | | | 137 | | | 145 | | | 149 | |
Total fixed charges | | 30,626 | | | 21,367 | | | 14,560 | | | 10,839 | | | 10,240 | |
Earnings US GAAP income before taxes and minority interests(c) | | 6,909 | | | 4,565 | | | 4,465 | | | 2,588 | | | 3,609 | |
Less: Unremitted pre-tax (income)/loss of associated companies and joint ventures(d) | | (41 | ) | | (28 | ) | | (51 | ) | | (21 | ) | | 11 | |
| | 6,868 | | | 4,537 | | | 4,414 | | | 2,567 | | | 3,620 | |
Fixed charges | | 30,626 | | | 21,079 | | | 14,423 | | | 10,694 | | | 10,091 | |
Total earnings including fixed charges | | 37,494 | | | 25,616 | | | 18,837 | | | 13,261 | | | 13,711 | |
| Ratio of earnings to combined fixed charges, preference share dividends and similar appropriations | | 1.22 | | | 1.20 | | | 1.29 | | | 1.22 | | | 1.34 | |
Notes
| (a) | Does not reflect the application of IAS 32, IAS 39 and IFRS 4 which became effective from 1st January 2005. |
| (c) | For a discussion of significant differences between IFRS and US GAAP and a reconciliation of net income between amounts calculated under IFRS and those calculated under US GAAP, see Note 60 of the accounts included herein. |
| (d) | Interest expense, rental expense and unremitted pre-tax income of associated companies and joint venture under US GAAP for 2004 have been revised to take account of line item reclassifications arising from the Group’s conversion to IFRS. |
| (e) | Dividends payable on preference shares and similar appropriations are computed as the amount divided by 1 minus the effective or actual tax rate as appropriate. In reporting in previous years, the dividends payable on preference shares and similar appropriations were not grossed up to reflect the effective or actual tax rate. Prior year ratios have been revised accordingly. |
| | |
Barclays PLC Annual Report 2006 | | 289 |
| |
Intentionally Left Blank
| | |
| 290 | | Barclays PLC Annual Report 2006 |
| |
| | | | | | | | |
| | 4 Shareholder information |
| | |
Barclays PLC Annual Report 2006 | | 291 |
| |
Shareholder information
Dividends on the ordinary shares of Barclays PLC
Barclays PLC has paid dividends on its ordinary shares every year without interruption since its incorporation in 1896.
The dividends declared for each of the last five years were:
Pence per 25p ordinary share
| | | | | | | | | | |
| | | 2006 | | 2005 | | 2004 | | 2003 | | 2002 |
Interim | | 10.50 | | 9.20 | | 8.25 | | 7.05 | | 6.35 |
Final | | 20.50 | | 17.40 | | 15.75 | | 13.45 | | 12.00 |
Total | | 31.00 | | 26.60 | | 24.00 | | 20.50 | | 18.35 |
| | | | | |
US Dollars per 25p ordinary share | | | | | | | | | | |
| | | 2006 | | 2005 | | 2004 | | 2003 | | 2002 |
Interim | | 0.20 | | 0.16 | | 0.15 | | 0.12 | | 0.10 |
Final | | 0.40 | | 0.31 | | 0.30 | | 0.24 | | 0.19 |
Total | | 0.60 | | 0.47 | | 0.45 | | 0.36 | | 0.29 |
The gross dividends applicable to an American Depositary Share (ADS) representing four ordinary shares, before deduction of withholding tax, are as follows:
| | | | | | | | | | |
US Dollars per American Depositary Share | | | | | | | | | | |
| | | 2006 | | 2005 | | 2004 | | 2003 | | 2002 |
Interim | | 0.80 | | 0.65 | | 0.60 | | 0.48 | | 0.40 |
Final | | 1.61 | | 1.24 | | 1.20 | | 0.95 | | 0.76 |
Total | | 2.41 | | 1.89 | | 1.80 | | 1.43 | | 1.16 |
Dividends expressed in Dollars are translated at the Noon Buying Rates in New York City for cable transfers in Pounds Sterling as certified for customs purposes by the Federal Reserve Bank of New York (the ‘Noon Buying Rate’) for the days on which dividends are paid, except for the 2006 final dividend, payable in the UK on 27th April 2007, which is translated at Noon Buying Rate applicable on 27th February 2007. No representation is made that Pounds Sterling amounts have been, or could have been, or could be, converted into Dollars at these rates.
Trading market for ordinary shares of Barclays PLC
The nominal capital of Barclays PLC is divided into 9,996,000,000 ordinary shares of 25p each (ordinary shares) and 1,000,000 staff shares of £1 each (staff shares). At the close of business on 31st December 2006, 6,534,698,021 25p ordinary shares and 875,000 staff shares were outstanding.
The principal trading market for Barclays PLC ordinary shares is the London Stock Exchange. Ordinary share listings were also obtained on the Tokyo Stock Exchange with effect from 1st August 1986 and the New York Stock Exchange (NYSE) with effect from 9th September 1986.
Trading on the NYSE is in the form of ADSs under the symbol ‘BCS’. Each ADS represents four 25p ordinary shares and is evidenced by an American Depositary Receipt (ADR). The ADR depositary is The Bank of New York. Details of trading activity are published in the stock tables of leading daily newspapers in the US.
There were 146 ADR holders and 1,371 recorded holders of ordinary shares with US addresses at 31st December 2006, whose shareholdings represented approximately 3.51% of total outstanding ordinary shares on that date. Since certain of the ordinary shares and ADRs were held by brokers or other nominees, the number of recorded holders in the US may not be representative of the number of beneficial holders or of their country of residence.
| | |
| 292 | | Barclays PLC Annual Report 2006 |
| |
The following table shows the high and low sales price for the ordinary shares of 25p during the periods indicated, based on mid-market prices at close of business on the London Stock Exchange and the high and low sale price for ADSs as reported on the NYSE composite tape.
| | | | | | | | |
| | | 25p ordinary shares | | American
Depositary Shares |
| | | High
p | | Low
p | | High
US$ | | Low
US$ |
| | | | |
2007 | | | | | | | | |
By month: | | | | | | | | |
January | | 768 | | 740 | | 60.56 | | 58.00 |
February | | 790 | | 740 | | 62.68 | | 58.22 |
2006 | | | | | | | | |
By month: | | | | | | | | |
July | | 634 | | 586 | | 47.80 | | 42.90 |
August | | 661.5 | | 619 | | 51.01 | | 46.26 |
September | | 680 | | 656.5 | | 51.75 | | 49.36 |
October | | 723.5 | | 677 | | 54.54 | | 51.02 |
November | | 716.5 | | 676.5 | | 55.21 | | 52.81 |
December | | 737 | | 676 | | 61.52 | | 53.27 |
By quarter: | | | | | | | | |
First quarter | | 684 | | 587.5 | | 48.00 | | 41.80 |
Second quarter | | 701 | | 588 | | 51.03 | | 43.20 |
Third quarter | | 680 | | 586 | | 51.75 | | 42.90 |
Fourth quarter | | 737 | | 676 | | 61.52 | | 51.02 |
2005 | | | | | | | | |
Fourth quarter | | 615 | | 529 | | 42.85 | | 40.50 |
Third quarter | | 590 | | 549 | | 42.80 | | 37.80 |
Second quarter | | 570 | | 520 | | 43.41 | | 38.27 |
First quarter | | 614 | | 541 | | 47.00 | | 37.16 |
2006 | | 737 | | 586 | | 61.52 | | 41.80 |
2005 | | 615 | | 520 | | 47.00 | | 37.16 |
2004 | | 586 | �� | 443 | | 45.99 | | 32.78 |
2003 | | 527 | | 311 | | 36.57 | | 20.30 |
2002 | | 624 | | 355 | | 38.00 | | 21.37 |
This section incorporates information on the prices at which securities of Barclays PLC have traded. It is emphasised that past performance cannot be relied upon as a guide to future performance.
| | | | | | | | | |
| Shareholdings at 31st December 2006(a) | | | | | | | | | |
| | Shareholders | | | Shares
held as a
percentage
of issued
ordinary
shares |
| | | Number | | Percentage
of total
holders | | Number of
shares held
(millions |
) | |
Classification of shareholders | | | | | | | | | |
Personal holders | | 733,705 | | 97.60 | | 697.0 | | | 10.67 |
Banks and nominees | | 16,195 | | 2.15 | | 5,679.7 | | | 86.92 |
Other companies | | 1,769 | | 0.24 | | 145.0 | | | 2.22 |
Insurance companies | | 14 | | 0.01 | | 0.3 | | | 0.00 |
Pensions funds | | 31 | | 0.00 | | 12.7 | | | 0.19 |
Totals | | 751,714 | | 100 | | 6,534.7 | | | 100 |
Shareholding range | | | | | | | | | |
1-100 | | 27,246 | | 3.62 | | 1.2 | | | 0.02 |
101-250 | | 283,138 | | 37.67 | | 60.2 | | | 0.92 |
251-500 | | 214,706 | | 28.56 | | 75.2 | | | 1.15 |
501-1,000 | | 107,159 | | 14.26 | | 75.0 | | | 1.15 |
1,001-5,000 | | 89,997 | | 11.97 | | 182.0 | | | 2.79 |
5,001-10,000 | | 15,452 | | 2.06 | | 109.0 | | | 1.67 |
10,001-25,000 | | 9,443 | | 1.26 | | 142.0 | | | 2.17 |
25,001-50,000 | | 2,328 | | 0.31 | | 80.0 | | | 1.23 |
50,001 and over | | 2,245 | | 0.30 | | 5,810.1 | | | 88.9 |
Totals | | 751,714 | | 100 | | 6,534.7 | | | 100 |
United States holdings | | 1,371 | | 0.18 | | 2.66 | | | 0.04 |
Note
| (a) | These figures include Barclays Sharestore members. |
| | |
Barclays PLC Annual Report 2006 | | 293 |
| |
Shareholder information
Memorandum and Articles of Association
The Company was incorporated in England and Wales on 20th July 1896 under the Companies Acts 1862 to 1890 as a company limited by shares and was reregistered in 1982 as a public limited company under the Companies Acts 1948 to 1980. The Company is registered under company number 48839. The Company was reregistered as Barclays PLC on 1st January 1985.
The objects of the Company are set out in full in clause 4 of its Memorandum of Association which provides, among other things, that the Company’s objects are to carry on business as an investment and holding company in all its aspects.
Directors
A Director may not vote or count towards the quorum on any resolution concerning any proposal in which he (or any person connected with him) has a material interest (other than by virtue of his interest in securities of the Company) or if he has a duty which conflicts or may conflict with the interests of the Company, unless the resolution relates to any proposal:
(i) to indemnify a Director in respect of any obligation incurred for the benefit of the Company (or any other member of the Group);
(ii) to indemnify a third party in respect of any obligation for which the Director has personally assumed responsibility;
(iii) to indemnify a Director for any liability which he may incur in the performance of his duties or to obtain insurance against such a liability;
(iv) involving the acquisition by a Director of any securities of the Company pursuant to an offer to existing holders of securities or to the public;
(v) that the Director underwrite any issue of securities of the Company (or any of its subsidiaries);
(vi) concerning any other company in which the Director is interested as an officer or creditor or shareholder, but only if he owns less than 1% of either the issued equity share capital or of the voting rights of that company;
(vii) concerning any superannuation fund or retirement, death or disability benefits scheme or employees’ share scheme, so long as any such fund or scheme does not give additional advantages to the Directors which are not granted to the employees who are in the fund or scheme; and
(viii) concerning any other arrangement for the benefit of employees of the Company or any other member of the Group under which the Director benefits in a similar manner to the employees concerned and which does not give the Director any advantage which the employees to whom the arrangement relates would not receive.
A Director may not vote or be counted in the quorum on any resolution which concerns his own employment with the Company or any other company in which the Company is interested.
The Directors may exercise all the powers of the Company to borrow money.
A Director must retire from office at the conclusion of the first Annual General Meeting (AGM) after he reaches the age of 70 although he is eligible to stand for re-election at that meeting. The new Articles of Association proposed to be adopted at the 2007 AGM will remove this restriction.
A Director is required to hold an interest in ordinary shares having a nominal value of at least £500. A Director may act before acquiring those shares but must acquire the qualification shares within two months from his or her appointment.
At each AGM one-third of the Directors for the time being (rounded down if necessary) are required to retire from office.
Classes of share
The Company has two classes of shares, ordinary shares and staff shares, to which the provisions set out below apply.
(a) Dividends
Under English law, dividends are payable on the Company’s ordinary shares only out of profits available for distribution, as determined in accordance with accounting principles generally accepted in the UK and by the Companies Act 1985. The Company in general meeting may declare dividends by ordinary resolution, but such dividend may not exceed the amount recommended by the Directors. The Directors may pay interim or final dividends if it appears they are justified by the Company’s financial position.
The profits which are resolved to be distributed in respect of any financial period are applied first in payment of a fixed dividend of 20% per annum on the staff shares and then in payment of dividends on the ordinary shares.
If a dividend is not claimed after 12 years of it becoming payable, it is forfeited and reverts to the Company.
The Directors may, with the approval of an ordinary resolution of the Company, offer shareholders the right to choose to receive an allotment of new ordinary shares credited as fully paid instead of cash in respect of all or part of any dividend.
(b) Voting
Every member who is present in person or represented at any general meeting of the Company and who is entitled to vote has one vote on a show of hands. On a poll, every member who is present or represented has one vote for every share held.
If any sum remains unpaid in relation to a member’s shareholding, that member is not entitled to vote that share unless the Board otherwise determines.
If any member, or any other person appearing to be interested in any shares in the Company, is served with a notice under Section 212 of the Companies Act 1985 and does not supply the Company with the information required in the notice, then the Board, in its absolute discretion, may direct that that member shall not be entitled to attend or vote at any meeting of the Company.
(c) Liquidation
In the event of any return of capital on liquidation the ordinary shares and the staff shares rank equally in proportion to the amounts paid up or credited as paid up on the shares of each class, except that in the event of a winding up of the Company the holders of the staff shares are only entitled to participate in the surplus assets available for distribution up to the amount paid up on the staff shares plus 10%.
(d) Redemption provisions
Subject to the Companies Act 1985, any share may be issued on terms that it is, at the option of the Company or the holder of such share, redeemable. The Company has no redeemable shares in issue.
(e) Calls on capital
The Directors may make calls upon the members in respect of any monies unpaid on their shares. A person upon whom a call is made remains liable even if the shares in respect of which the call is made have been transferred.
(f) Variation of rights
The rights attached to any class of shares may be varied with the sanction of an extraordinary resolution passed at a separate meeting of the holders of the shares of that class.
| | |
| 294 | | Barclays PLC Annual Report 2006 |
| |
Annual and extraordinary general meetings
The Company is required to hold a general meeting each year as its AGM in addition to other meetings (called extraordinary general meetings) as the Directors think fit. The type of the meeting will be specified in the notice calling it. Not more than 15 months may elapse between the date of one AGM and the next.
In the case of an AGM or a meeting for the passing of a special resolution (requiring the consent of a 75% majority) 21 clear days’ notice is required. In other cases 14 clear days’ notice is required. The notice must specify the place, the day and the hour of the meeting, and the general nature of the business to be transacted.
Subject as noted in (b) above, all shareholders are entitled to attend and vote at general meetings. The Articles of Association do, however, provide that arrangements may be made for simultaneous attendance at a general meeting at a place other than that specified in the notice of meeting, in which case some shareholders may be excluded from the specified place.
Limitations on foreign shareholders
There are no limitations imposed by English law or the Company’s Memorandum or Articles of Association on the right of non-residents or foreign persons to hold or vote the Company’s ordinary shares other than the limitations that would generally apply to all of the Company’s shareholders.
Taxation
The following is a summary of the principal tax consequences for holders of ordinary shares of Barclays PLC, preference shares of the Bank, or ADSs representing such ordinary shares or preference shares, and who are citizens or residents of the UK or US, or otherwise who are subject to UK tax or US federal income tax on a net income basis in respect of such securities, that own the shares or ADSs as capital assets for tax purposes. It is not, however, a comprehensive analysis of all the potential tax consequences for such holders, and it does not discuss the tax consequences of members of special classes of holders subject to special rules or holders that, directly or indirectly, hold 10% or more of Barclays voting stock. Investors are advised to consult their tax advisers regarding the tax implications of their particular holdings, including the consequences under applicable state and local law, and in particular whether they are eligible for the benefits of the Treaty, as defined below.
A US holder is a beneficial owner of shares or ADSs that is for US federal income tax purposes (i) a citizen or resident of the US, (ii) a US domestic corporation, (iii) an estate whose income is subject to US federal income tax regardless of its source, or (iv) a trust if a US court can exercise primary supervision over the trust’s administration and one or more US persons are authorised to control all substantial decisions of the trust.
Unless otherwise noted, the statements of tax laws set out below are based on the tax laws of the UK in force as at 28th February 2006 and are subject to any subsequent changes in UK law, in particular any announcements made in the Chancellor’s UK Budget in March 2006. This section is also based on the Internal Revenue Code of 1986, as amended, its legislative history, existing and proposed regulations, published rulings and court decisions (the Code), and on the Double Taxation Convention between the UK and the US as entered into force in March 2003 (the Treaty), all of which are subject to change, possibly on a retroactive basis.
This section is based in part upon the representations of the ADR Depositary and the assumption that each obligation of the Deposit Agreement and any related agreement will be performed in accordance with its terms.
For purposes of the Treaty, the Estate and Gift Tax Convention and for the purposes of the Code, the holders of ADRs evidencing ADSs will be treated as owners of the underlying ordinary shares or preference shares, as the case may be. Generally, exchanges of shares for ADRs, and ADRs for shares, will not be subject to US federal income tax or to UK tax, other than stamp duty or stamp duty reserve tax, as described below.
Taxation of UK holders
Taxation of dividends
In accordance with UK law, Barclays PLC and the Bank pay dividends on ordinary shares and preference shares without any deduction or withholding tax in respect of any taxes imposed by the UK government or any UK taxing authority.
If the shareholder is a UK resident individual liable to income tax only at the basic rate or the lower rate, then there will be no further tax liability in respect of the dividend received. If, however, the individual shareholder is subject to income tax at the higher rate (currently 40%), there will be a further liability to tax. Higher rate taxpayers are taxable on dividend income at a special rate of (currently 32.5%) against which can be offset a tax credit of one-ninth of the dividend paid. Tax credits are no longer repayable to shareholders with no tax liability.
Taxation of shares under the Dividend Reinvestment Plan
Where a shareholder elects to purchase shares using their cash dividend, the individual will be liable for income tax on dividends reinvested in the Plan on the same basis as if they had received the cash and arranged the investment themselves. They should accordingly include the dividend received in their annual tax return in the normal way. The tax consequences for a UK individual are the same as described in ‘Taxation of dividends’ above.
Taxation of capital gains
Where shares are disposed of by open market sale, a capital gain may result if the disposal proceeds exceed the sum of the base cost of the shares sold and any other allowable deductions such as share dealing costs, indexation relief (up to 5th April 1998) and taper relief (generally on shares held at 16th March 1998 and subsequent acquisitions). To arrive at the total base cost of any Barclays PLC shares held, the amount subscribed for rights taken up in 1985 and 1988 must be added to the cost of all other shares held. For this purpose, current legislation permits the market valuation at 31st March 1982 to be substituted for the original cost of shares purchased before that date.
The calculations required to compute chargeable capital gains, particularly taper and indexation reliefs, may be complex. Capital gains may also arise from the gifting of shares to connected parties such as relatives (although not spouses) and family trusts. Shareholders are advised to consult their personal financial adviser if further information regarding a possible tax liability in respect of their holdings of Barclays PLC shares is required.
Stamp duty
On the purchase of shares, stamp duty or stamp duty reserve tax at the rate of 0.5% is normally payable on the purchase price of the shares.
Inheritance tax
An individual may be liable to inheritance tax on the transfer of ordinary shares or preference shares. Where an individual is liable, inheritance tax may be charged on the amount by which the value of his or her estate is reduced as a result of any transfer by way of gift or other gratuitous transaction made by them or treated as made by them.
| | |
Barclays PLC Annual Report 2006 | | 295 |
| |
Shareholder information
Taxation of US holders
Taxation of dividends
A US holder is subject to US federal income taxation on the gross amount of any dividend paid by Barclays PLC or the Bank, as applicable, out of its current or accumulated earnings and profits (as determined for US federal income tax purposes). Dividends paid to a non-corporate US holder in taxable years beginning before 1st January 2011 that constitute qualified dividend income will be taxable to the holder at a maximum tax rate of 15%, provided that the holder has a holding period of the shares or ADSs of more than 60 days during the 121-day period beginning 60 days before the ex-dividend date (or, in the case of preference shares or ADSs relating thereto, if the dividend is attributable to a period or periods aggregating over 366 days, provided that the holder holds the shares or ADSs for more than 90 days during the 181-day period beginning 90 days before the ex-dividend date) and meets certain other holding period requirements. Dividends paid by Barclays or the Bank, as applicable, with respect to the ordinary or preference shares or ADSs will generally be qualified dividend income. A US holder will not be subject to UK withholding tax. The US holder will include in gross income for US federal income tax purposes the amount of the dividend actually received from Barclays or the Bank.
Dividends must be included in income when the US holder, in the case of shares, or the Depositary, in the case of ADSs, actually or constructively receives the dividend, and will not be eligible for the dividends-received deduction generally allowed to US corporations in respect of dividends received from other US corporations. Dividends will be income from sources outside the US, but dividends paid in taxable years beginning before 1st January 2007 will generally be ‘passive income’ or ‘financial services income,’ and dividends paid in taxable years beginning after 31st December 2006 will, depending on the holder’s circumstances, be ‘passive’ or ‘general’ income which, in either case, is treated separately from other types of income for the purposes of computing any allowable foreign tax credit.
The amount of the dividend distribution includable in income will be the US Dollar value of the pound Sterling payments made, determined at the spot Pound Sterling/US Dollar rate on the date the dividend distribution is includable in income, regardless of whether the payment is in fact converted into US Dollars. Generally, any gain or loss resulting from currency exchange fluctuations during the period from the date the dividend payment is includable in income to the date the payment is converted into US Dollars will be treated as ordinary income or loss and, for foreign tax credit limitation purposes, from sources within the US and will not be eligible for the special tax rate applicable to qualified dividend income.
Distributions in excess of current or accumulated earnings and profits, as determined for US federal income tax purposes, will be treated as a return of capital to the extent of the US holder’s basis in the shares or ADSs and thereafter as capital gain.
Taxation of capital gains
Generally, US holders will not be subject to UK tax, but will be subject to US tax on capital gains realised on the sale or other disposition of ordinary shares, preference shares or ADSs. Capital gain of a non-corporate US holder that is recognised before 1st January 2011 is generally taxed at a maximum rate of 15% where the holder has a holding period of greater than one year. The gain or loss will generally be income or loss from sources within the United States for foreign tax credit limitation purposes.
��
Taxation of premium on redemption or purchase of shares
No refund of tax will be available under the Treaty in respect of any premium paid on a redemption of preference shares by the Bank or on a purchase by Barclays PLC of its own shares. For US tax purposes, redemption premium generally will be treated as an additional amount realised in the calculation of gain or loss.
Stamp duty
No UK stamp duty is payable on the transfer of an ADS, provided that the separate instrument of transfer is not executed in, and remains at all times outside, the UK.
Estate and gift tax
Under the Estate and Gift Tax Convention between the United Kingdom and the United States, a US holder generally is not subject to UK inheritance tax.
Exchange controls and other limitations affecting security holders
Other than certain economic sanctions which may be in force from time to time, there are currently no UK laws, decrees or regulations which would affect the transfer of capital or remittance of dividends, interest and other payments to holders of Barclays securities who are not residents of the UK. There are also no restrictions under the Articles of Association of either Barclays PLC or the Bank, or (subject to the effect of any such economic sanctions) under current UK laws, which relate only to non-residents of the UK, and which limit the right of such non-residents to hold Barclays securities or, when entitled to vote, to do so.
Documents on display
It is possible to read and copy documents that have been filed by Barclays PLC and Barclays Bank PLC with the US Securities and Exchange Commission at the US Securities and Exchange Commission’s office of Investor Education and Assistance located at 100 F Street, NE, Washington DC 20549-0213. Please call the US Securities and Exchange Commission at 1-800-SEC-0330 for further information on the public reference rooms and their copy charges. Filings with the US Securities and Exchange Commission are also available to the public from commercial document retrieval services, and from the website maintained by the US Securities and Exchange Commission at www.sec.gov.
| | |
| 296 | | Barclays PLC Annual Report 2006 |
| |
Shareholder enquiries
Investors who have any questions about their investment in Barclays,
or about Barclays in general, may write to the Director, Investor
Relations at our head office as follows:
Director, Investor Relations
Barclays PLC
London
E14 5HP
or, in the United States of America,
The Corporate Communications Department
Barclays Bank PLC
200 Park Avenue
New York, NY 10166, USA
Registered and Head office:
London
E14 5HP
Tel: +44 (0) 20 7116 1000
Registrar:
The Registrar to Barclays PLC
The Causeway
Worthing
BN99 6DA
Tel: 0870 609 4535
Email: questions@share-registers.co.uk
ADR Depositary:
The Bank of New York
PO Box 11258
Church Street Station
New York
NY 10286-1258
Tel: 1-888-BNY-ADRS (toll-free for US domestic callers)
or +1 212 815 3700
Email: shareowner-svcs@bankofny.com
| | |
Barclays PLC Annual Report 2006 | | 297 |
| |
Index
| | | | | | |
| Accountability and Audit | | 137 | | Debt securities in issue | | 189 |
| Accounting | | | | Deposits | | |
| developments | | 157 | | average balances | | 57 |
| policies | | 147 | | from banks | | 187 |
| presentation | | 157 | | Derivatives and other financial instruments | | |
| Acquisitions | | 157 | | definitions | | 90 |
| notes to the accounts | | 213 | | notes to the accounts | | 172 |
| Allowance for impairment | | | | Directors’ and officers’ | | |
| notes to the accounts | | 177 | | biographies | | 108 |
| risk management | | 79 | | emoluments | | 111 |
| Annual General Meeting | | 112 | | interests | | 110 |
| Annual Report and Accounts (approval) | | 158 | | notes to the accounts | | 214 |
| Assets | | | | Directors’ report | | 110 |
| by class of business | | 244 | | Disposal of subsidiaries | | 212 |
| by geographical region | | 246 | | Dividends | | 164 |
| other | | 179 | | Earnings per share | | 169 |
| Auditors | | | | Economic capital | | 70 |
| reports | | 146 | | Employees | | |
| Available for sale investments | | 178 | | equality and diversity | | 111 |
| Balance sheet | | | | involvement | | 111 |
| average | | 48 | | Events after the balance sheet date | | 221 |
| consolidated | | 159 | | Fair value of financial instruments | | 242 |
| consolidated (Barclays Bank) | | 275 | | Financial assets designated at fair value | | 171 |
| Barclaycard | | 22 | | Financial data | | |
| business analysis | | | | Barclays Bank PLC | | 286 |
| business description | | 10 | | Barclays PLC | | 4 |
| Barclays Bank PLC | | | | US GAAP | | 287 |
| consolidated accounts | | 274 | | Financial liabilities designated at fair value | | 188 |
| financial data | | 286 | | Financial review | | 9 |
| notes to the accounts | | 278 | | Financial risks | | 229 |
| Barclays Capital | | | | Glossary (UK/US) | | 273 |
| business analysis | | 30 | | Goodwill | | 184 |
| business description | | 11 | | Head office functions and other operations | | |
| Barclays Global Investors | | | | business analysis | | 38 |
| business analysis | | 32 | | Impairment charges | | |
| business description | | 11 | | notes to the accounts | | 166 |
| BGI Equity Ownership Plan (EOP) | | 221 | | risk management | | 80 |
| Barclays Group description | | 10 | | summary | | 43 |
| Barclays Wealth | | | | Income statement | | |
| business analysis | | 34 | | consolidated | | 158 |
| business description | | 11 | �� | consolidated (Barclays Bank) | | 274 |
| Barclays Wealth – closed life assurance activities | | | | Insurance assets and liabilities | | 190 |
| business analysis | | 36 | | Insurance premiums and insurance claims and benefits | | 165 |
| business description | | 11 | | Intangible assets | | 185 |
| Capital adequacy data | | | | Interest rate risk | | 233 |
| total assets and risk weighted assets | | 52 | | Internal control | | 137 |
| capital management | | 54 | | International Retail and Commercial Banking | | |
| capital ratios | | 55 | | business analysis | | 24 |
| capital resources | | 56 | | business description | | 10 |
| Cash flow statement | | | | International Retail and Commercial Banking | | |
| consolidated | | 161 | | – excluding Absa | | |
| consolidated (Barclays Bank) | | 277 | | business analysis | | 26 |
| notes to the accounts | | 211 | | business description | | 10 |
| Cautionary forward looking statement | | IFC | | International Retail and Commercial Banking | | |
| Competition | | 61 | | – Absa | | |
| Concentrations of credit risk | | 237 | | business analysis | | 28 |
| Contingent liabilities and commitments | | 208 | | business description | | 10 |
| Contractual obligations | | 77 | | Investment in associates and joint ventures | | 182 |
| Corporate governance report | | 113 | | | | |
| attendance at board meetings | | 114 | | | | |
| Corporate responsibility | | 139 | | | | |
| Critical accounting estimates | | 104 | | | | |
| Currency of presentation | | 272 | | | | |
| Currency risk | | 238 | | | | |
| Customer accounts | | 188 | | | | |
| | |
| 298 | | Barclays PLC Annual Report 2006 |
| |
| | | | | | |
| Leasing | | 210 | | Risk management | | |
| Legal proceedings | | 209 | | allowances for impairment | | 79 |
| Liabilities | | | | capital and liquidity risk management | | 85 |
| other | | 189 | | credit risk management | | 72 |
| Liquidity risk | | 239 | | disclosures about certain trading activitiesincluding
non-exchange contracts | | 88 |
| Loans and advances to banks | | | | governance structure | | 66 |
| interest rate sensitivity | | 92 | | insurance risk | | 88 |
| maturity analysis | | 92 | | loans and advances to customers | | 75 |
| notes to the accounts | | 164 | | management of operational risk and business risk | | 86 |
| Loans and advances to customers | | | | market risk management | | 82 |
| interest rate sensitivity | | 92 | | potential credit risk loans | | 78 |
| maturity analysis | | 96 | | risk responsibilities | | 67 |
| notes to the accounts | | 175 | | statistical information | | 91 |
| Memorandum and Articles of Association | | 294 | | taxation risk | | 87 |
| Minority interests | | 208 | | Risk Tendency | | 72 |
| Net fee and commission income | | | | Risk weighted assets | | 52 |
| notes to the accounts | | 164 | | SEC Form 20-F | | 271 |
| summary | | 42 | | Securities borrowing, securities lending, repurchase and reverse repurchase agreements | | 179 |
| Net interest income | | | | Securitisation | | 198 |
| notes to the accounts | | 164 | | Segmental reporting | | |
| summary | | 40 | | by class of business | | 244 |
| Off-balance sheet arrangements | | 59 | | by geographical segments | | 246 |
| Operating expenses | | | | Share-based payments | | 221 |
| administration and general expenses | | 167 | | Shareholder information | | 291 |
| staff costs | | 166 | | Short-term borrowings | | 57 |
| summary | | 45 | | Statement of recognised income and expense | | |
| Ordinary shares and share premium | | | | consolidated | | 160 |
| called up | | 205 | | consolidated (Barclays Bank) | | 276 |
| Other entities | | 220 | | Subordinated liabilities | | 192 |
| Other income | | | | Supervision and regulation | | 62 |
| notes to the accounts | | 166 | | Taxation | | |
| summary | | 43 | | notes to the accounts | | 180 |
| Pensions | | | | shareholder information | | 295 |
| directors | | 126 | | summary | | 47 |
| notes to the accounts | | 199 | | Total assets | | 52 |
| Principal subsidiaries | | 219 | | Trading portfolio | | 170 |
| Principal transactions | | | | Trust activities | | 221 |
| notes to the accounts | | 165 | | UK Banking | | |
| summary | | 42 | | business analysis | | 16 |
| Potential credit risk loans | | 78 | | business description | | 10 |
| Presentation of information | | 144 | | UK Business Banking | | |
| Property, plant and equipment | | 186 | | business analysis | | 20 |
| Provisions | | 197 | | business description | | 10 |
| Recent developments | | 157 | | UK Retail Banking | | |
| Related party transactions | | 214 | | business analysis | | 18 |
| Remuneration report | | | | business description | | 10 |
| 2006 annual remuneration | | 121 | | US GAAP | | |
| chairman and executive directors: beneficial shareholdings | | 136 | | differences from IFRS accounting principles | | 247 |
| Reserves | | 206 | | differences from IFRS accounting principles (Barclays Bank) | | 284 |
| Results by business | | 15 | | | | |
| Results by nature of income and expense | | 40 | | | | |
| Risk factors | | 60 | | | | |
| | |
Barclays PLC Annual Report 2006 | | 299 |
| |
| | |
| 300 | | Barclays PLC Annual Report 2006 |
| |
Signatures
The registrant hereby certifies that it meets all of the requirements for filing on Form 20-F and that it has duly caused and authorised the undersigned to sign this annual report on its behalf.
| | | | |
| Date March 26, 2007 | | Barclays PLC (Registrant) |
| | |
| | By | | /s/ Naguib Kheraj |
| | | | Naguib Kheraj, Group Finance Director |
The registrant hereby certifies that it meets all of the requirements for filing on Form 20-F and that it has duly caused and authorised the undersigned to sign this annual report on its behalf.
| | | | |
| Date March 26, 2007 | | Barclays Bank PLC (Registrant) |
| | |
| | By | | /s/ Naguib Kheraj |
| | | | Naguib Kheraj, Group Finance Director |
EXHIBIT INDEX
| | |
EXHIBIT
NUMBER | | DESCRIPTION |
| 1.1 | | Memorandum and Articles of Association of Barclays PLC (incorporated by reference to the 2005 Form 20-F filed on March 29th, 2006) |
| |
| 1.2 | | Memorandum and Articles of Association of Barclays Bank PLC (incorporated by reference to the 2005 Form 20-F filed on March 29th, 2006) |
| |
| 2.1 | | Long term debt instruments |
| |
| 4.1 | | Rules of the Barclays Group Performance Share Plan (2005) |
| |
| 4.2 | | Rules of the Barclays PLC Renewed 1986 Executive Share Option Scheme (incorporated by reference to the 2000 Form 20-F filed on April 16th, 2001) |
| |
| 4.5 | | Rules of the Barclays PLC Approved Incentive Share Option Plans and Appendix relating to eligible employees resident in France (incorporated by reference to the 2004 Form 20-F filed on March 24th, 2005) |
| |
| 4.8 | | Service Contract – Matthew Barrett (incorporated by reference to the 2004 Form 20-F filed on March 24th, 2005) |
| |
| 4.9 | | Service Contract – John Varley (incorporated by reference to the 2003 Form 20-F filed on March 26th, 2004) |
| |
| 4.11 | | Service Contract – Naguib Kheraj (incorporated by reference to the 2003 Form 20-F filed on March 26th, 2004) |
| |
| 4.12 | | Service Contract and Subsequent Side Letter to Service Contract – Gary Hoffman (incorporated by reference to the 2005 Form 20-F filed on March 29th, 2006) |
| |
| 4.13 | | Service Contract – David Roberts (incorporated by reference to the 2003 Form 20-F filed on March 26th, 2004) |
| |
| 4.14 | | Service Contract – Robert E. Diamond Jr (incorporated by reference to the 2005 Form 20-F filed on March 29th, 2006) |
| |
| 4.15 | | Appointment Letter and Subsequent Amendment to appoint as Senior Independent Director – Sir Richard Broadbent (incorporated by reference to the 2004 Form 20-F filed on March 24th, 2005) |
| |
| 4.16 | | Appointment Letter – Professor Dame Sandra Dawson (incorporated by reference to the 2004 Form 20-F filed on March 24th, 2005) |
| |
| 4.17 | | Appointment Letter and Subsequent Amendment to appoint as Deputy Chairman – Sir Nigel Rudd (incorporated by reference to the 2004 Form 20-F filed on March 24th, 2005) |
| |
| 4.18 | | Appointment Letter – Stephen Russell (incorporated by reference to the 2004 Form 20-F filed on March 24th, 2005) |
| |
| 4.20 | | Appointment Letter – Leigh Clifford (incorporated by reference to the 2004 Form 20-F filed on March 24th, 2005) |
| | |
| | | |
| 4.21 | | Appointment Letter – Sir Andrew Likierman (incorporated by reference to the 2004 Form 20-F filed on March 24th, 2005) |
| |
| 4.22 | | Appointment Letter – Dr Danie Cronjé (incorporated by reference to the 2005 Form 20-F filed on March 29th, 2006) |
| |
| 4.23 | | Appointment Letter – Robert Steel (incorporated by reference to the 2005 Form 20-F filed on March 29th, 2006) |
| |
| 4.24 | | Appointment Letter – John Sunderland (incorporated by reference to the 2005 Form 20-F filed on March 29th, 2006) |
| |
| 4.25 | | Indemnity Letter – Matthew Barrett (incorporated by reference to the 2005 Form 20-F filed on March 29th, 2006) |
| |
| 4.26 | | Indemnity Letter – John Varley (incorporated by reference to the 2005 Form 20-F filed on March 29th, 2006) |
| |
| 4.28 | | Indemnity Letter – Naguib Kheraj (incorporated by reference to the 2005 Form 20-F filed on March 29th, 2006) |
| |
| 4.29 | | Indemnity Letter – Gary Hoffman (incorporated by reference to the 2005 Form 20-F filed on March 29th, 2006) |
| |
| 4.30 | | Indemnity Letter – David Roberts (incorporated by reference to the 2005 Form 20-F filed on March 29th, 2006) |
| |
| 4.31 | | Indemnity Letter – Robert E. Diamond Jr (incorporated by reference to the 2005 Form 20-F filed on March 29th, 2006) |
| |
| 4.32 | | Indemnity Letter – Sir Richard Broadbent (incorporated by reference to the 2005 Form 20-F filed on March 29th, 2006) |
| |
| 4.33 | | Indemnity Letter – Professor Dame Sandra Dawson (incorporated by reference to the 2005 Form 20-F filed on March 29th, 2006) |
| |
| 4.34 | | Indemnity Letter – Sir Nigel Rudd (incorporated by reference to the 2005 Form 20-F filed on March 29th, 2006) |
| |
| 4.35 | | Indemnity Letter – Stephen Russell (incorporated by reference to the 2005 Form 20-F filed on March 29th, 2006) |
| |
| 4.36 | | Indemnity Letter – Leigh Clifford (incorporated by reference to the 2005 Form 20-F filed on March 29th, 2006) |
| |
| 4.37 | | Indemnity Letter – Sir Andrew Likierman (incorporated by reference to the 2005 Form 20-F filed on March 29th, 2006) |
| |
| 4.38 | | Indemnity Letter – Dr. Danie Cronjé (incorporated by reference to the 2005 Form 20-F filed on March 29th, 2006) |
| |
| 4.39 | | Indemnity Letter – Robert Steel (incorporated by reference to the 2005 Form 20-F filed on March 29th, 2006) |
| |
| 4.40 | | Indemnity Letter – John Sunderland (incorporated by reference to the 2005 Form 20-F filed on March 29th, 2006) |
| | |
| | | |
| 4.41 | | Indemnity Letter – Sir David Arculus (incorporated by reference to the 2005 Form 20-F filed on March 29th, 2006) |
| |
| 4.42 | | Employment Contract and Assignment Agreement – Frederik Seegers |
| |
| 4.43 | | Appointment Letter – Marcus Agius |
| |
| 4.44 | | Contract of Employment – Christopher Lucas |
| |
| 4.45 | | Appointment Letter – Fulvio Conti |
| |
| 4.46 | | Addendum to contract of employment between Barclays Bank plc and Gary Hoffman |
| |
| 4.47 | | Addendum to contract of employment between Barclays Bank plc and John Varley |
| |
| 7.1 | | Ratios of earnings under IFRS to fixed charges |
| |
| 7.2 | | Ratios of earnings under UK GAAP to fixed charges |
| |
| 7.3 | | Ratios of earning under US GAAP to fixed charges |
| |
| 7.4 | | Ratios of earnings under IFRS to combined fixed charges, preference share dividends and similar appropriations |
| |
| 7.5 | | Ratios of earnings under UK GAAP to combined fixed charges, preference share dividends and similar appropriations |
| |
| 7.6 | | Ratios of earnings under US GAAP to combined fixed charges, preference share dividends and similar appropriations |
| |
| 8.1 | | List of subsidiaries |
| |
| 11.1 | | Code of Ethics (incorporated by reference to the 2003 Form 20-F filed on March 26th, 2004) |
| |
| 12.1 | | Certifications filed pursuant to 17 CFR 240. 13(a)-14(a) |
| |
| 13.1 | | Certifications filed pursuant to 17 CFR 240. 13(a)-14b and 18 U.S.C 1350(a) and 1350(b) |
| |
| 15.1 | | Consent of PricewaterhouseCoopers LLP for incorporation by reference of reports in certain securities registration statements of Barclays Bank PLC |