UNITED STATES
SECURITIES AND EXCHANGE COMMISSION
Washington, D.C. 20549
FormN-CSR
CERTIFIED SHAREHOLDER REPORT OF REGISTERED
MANAGEMENT INVESTMENT COMPANIES
Investment Company Act File Number:811-01545
Eaton Vance Special Investment Trust
(Exact Name of Registrant as Specified in Charter)
Two International Place, Boston, Massachusetts 02110
(Address of Principal Executive Offices)
Maureen A. Gemma
Two International Place, Boston, Massachusetts 02110
(Name and Address of Agent for Services)
(617)482-8260
(Registrant’s Telephone Number)
December 31
Date of Fiscal Year End
December 31, 2018
Date of Reporting Period
Item 1. Reports to Stockholders

Eaton Vance
Balanced Fund
Annual Report
December 31, 2018
Important Note. Beginning on January 1, 2021, as permitted by regulations adopted by the Securities and Exchange Commission, paper copies of the Fund’s annual and semi-annual shareholder reports will no longer be sent by mail unless you specifically request paper copies of the reports. Instead, the reports will be made available on the Fund’s website (eatonvance.com/funddocuments), and you will be notified by mail each time a report is posted and provided with a website address to access the report.
If you already elected to receive shareholder reports electronically, you will not be affected by this change and you need not take any action. If you are a direct investor, you may elect to receive shareholder reports and other communications from the Fund electronically by signing up for e-Delivery at eatonvance.com/edelivery. If you own your shares through a financial intermediary (such as a broker-dealer or bank), you must contact your financial intermediary to sign up.
You may elect to receive all future Fund shareholder reports in paper free of charge. If you are a direct investor, you can inform the Fund that you wish to continue receiving paper copies of your shareholder reports by calling 1-800-262-1122. If you own these shares through a financial intermediary, you must contact your financial intermediary or follow instructions included with this disclosure, if applicable, to elect to continue to receive paper copies of your shareholder reports. Your election to receive reports in paper will apply to all Eaton Vance funds held directly or to all funds held through your financial intermediary, as applicable.

Commodity Futures Trading Commission Registration. Effective December 31, 2012, the Commodity Futures Trading Commission (“CFTC”) adopted certain regulatory changes that subject registered investment companies and advisers to regulation by the CFTC if a fund invests more than a prescribed level of its assets in certain CFTC-regulated instruments (including futures, certain options and swap agreements) or markets itself as providing investment exposure to such instruments. The Fund has claimed an exclusion from the definition of the term “commodity pool operator” under the Commodity Exchange Act. Accordingly, neither the Fund nor the adviser with respect to the operation of the Fund is subject to CFTC regulation. Because of its management of other strategies, the Fund’s adviser is registered with the CFTC as a commodity pool operator and a commodity trading advisor.
Fund shares are not insured by the FDIC and are not deposits or other obligations of, or guaranteed by, any depository institution. Shares are subject to investment risks, including possible loss of principal invested.
This report must be preceded or accompanied by a current summary prospectus or prospectus. Before investing, investors should consider carefully the investment objective, risks, and charges and expenses of a mutual fund. This and other important information is contained in the summary prospectus and prospectus, which can be obtained from a financial advisor. Prospective investors should read the prospectus carefully before investing. For further information, please call1-800-262-1122.
Annual Report December 31, 2018
Eaton Vance
Balanced Fund
Table of Contents
Management’s Discussion of Fund Performance | 2 | |||
Performance | 3 | |||
Fund Profile | 4 | |||
Endnotes and Additional Disclosures | 5 | |||
Fund Expenses | 6 | |||
Financial Statements | 7 | |||
Report of Independent Registered Public Accounting Firm | 22 and 34 | |||
Federal Tax Information | 23 | |||
Special Meeting of Shareholders | 35 | |||
Board of Trustees’ Contract Approval | 36 | |||
Management and Organization | 38 | |||
Important Notices | 41 | |||
Eaton Vance
Balanced Fund
December 31, 2018
Management’s Discussion of Fund Performance1
Economic and Market Conditions
U.S. stock indexes declined during the12-month period ended December 31, 2018, as a sharp downturn in the final quarter of the year erased earlier gains.
U.S. stocks opened the period on an upswing, as investors reacted favorably to the passage of the Republican tax reform package in December 2017. Sharp cuts in corporate taxes, a key element of the bill, raised corporate-profit expectations. U.S. stocks also got a boost from positive U.S. economic data, including the unemployment rate, which fell to a17-year low.
In February 2018, however, U.S. stocks pulled back amid fears of rising interest rates. After a brief rebound, equity markets again weakened in the spring of 2018, as investors confronted the prospect of a global trade war due to President Trump’sthen-new tariffs. Despite a brief rally in technology stocks during the summer months, markets plunged in the final three months of the period amid global trade war fears and sagging economies in China and Europe. Despite a partial rebound in the final days of the period, the U.S. stock market’s December 2018 plunge was the worst monthly loss since the 2008 financial crisis.
For the12-month period ended December 31, 2018, the blue-chip Dow Jones Industrial Average®2 declined 3.48%, while the broader U.S. equity market represented by the S&P 500® Index fell 4.38%. The technology-laden NASDAQ Composite Index fell 2.84 % during the period.Large-cap U.S. stocks as measured by the S&P 500® Index generally outperformed theirsmall-cap counterparts as measured by the Russell 2000® Index during the period. Growth stocks as a group outpaced value stocks in both the large- andsmall-cap categories, as measured by the Russell Growth and Value Indexes.
As the economy showed signs of strength for most of the year, the U.S. Federal Reserve raised interest rates four times during the period with the federal funds rate ending the year at 2.5%, the highest level since January 2008.
U.S. fixed-income markets, depending on the segment of the market, eked out meager positive or negative returns during the period. U.S. investment-grade fixed-income securities marginally advanced during the period, with the Bloomberg Barclays U.S. Aggregate Bond Index returning 0.01%. Hurt by growing volatility late in the period, higher-risk assets retreated, with the ICE BofAML U.S. High Yield Index returning –2.26%. The10-year U.S. Treasury bond yield closed at 2.69%, up from 2.40% at the outset of the period.
Fund Performance
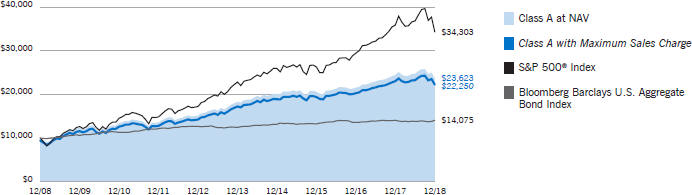
For the12-month period ended December 31, 2018, Eaton Vance Balanced Fund (the Fund) returned –3.43% for Class A shares at net asset value (NAV), outperforming its primary benchmark, the S&P 500® Index (the Index), which returned –4.38%.
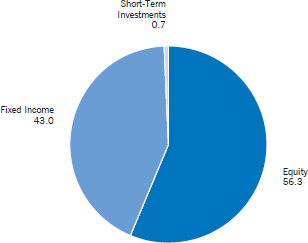
At period end, 56% of the Fund was invested in equities through Stock Portfolio, while 43% was invested in fixed-income securities through Core Bond Portfolio. In the Fund’s equity allocation, stock selections in the materials and communication services sectors were leading contributors to outperformance during the period.
In the industrials sector, the Stock Portfolio’s lack of exposure to General Electric Co. (GE) significantly enhanced performance. Although GE hired a new CEO who promised to bring change, the company suffered fromsub-par stock performance in 2018 due to pension liabilities and legal issues, among other matters.
In information technology, the Stock Portfolio’s holding of Adobe, Inc. (Adobe) was an important contributor as the company continued to benefit from the long-term, secular trend toward digital formats in advertising. Strong demand for Adobe’s core products — Photoshop and Omniture — and new products like Stock, a database of stock images, drove revenue above market expectations during the period. In addition, the company raised prices for its products and met little resistance from customers.
Despite the positive impact of not holding GE in its portfolio, overall stock selections in industrials detracted from Fund performance relative to the Index. Stock selections in consumer staples also weighed down on relative performance during the period.
In industrials, FedEx Corp. was a significant detractor. The company lowered its projections for earnings after the U.S. threatened to impose tariffs on Chinese imports, raising concerns about decelerating global trade. The stock was further weighed down by the company’s difficulties in integrating a relatively new acquisition, TNT Express, which was still recovering from a 2017 cyber attack.
In consumer staples, Conagra Brands, Inc., which manufactures and sells packaged foods, also detracted from relative performance during the period. Its shares fell on concerns over lower-than-expected revenues and that the company might be too highly leveraged following its acquisition of Pinnacle Foods, Inc. The security was sold during the period.
Among the Core Bond Portfolio’s fixed-income holdings, security selections and ashort-duration6 position contributed to Fund returns relative to the Fund’s secondary benchmark, the Bloomberg Barclays U.S. Aggregate Bond Index (the Bloomberg Barclays Agg). In particular, security selections in investment-grade corporate bonds and commercialmortgage-backed securities were beneficial. Core Bond Portfolio’s shorter-than-Bloomberg Barclays Agg duration enhanced performance as interest rates rose across the curve during the period.
Conversely, an overweight allocation to investment-grade corporate bonds detracted as the sector posted negative returns during the period. An underweight allocation to U.S. Treasurys and mortgage- backed securities further dampened relative returns as these sectors advanced during the period.
See Endnotes and Additional Disclosures in this report.
Past performance is no guarantee of future results. Returns are historical and are calculated by determining the percentage change in net asset value (NAV) or offering price (as applicable) with all distributions reinvested. Investment return and principal value will fluctuate so that shares, when redeemed, may be worth more or less than their original cost. Performance less than or equal to one year is cumulative. Performance is for the stated time period only; due to market volatility, the Fund’s current performance may be lower or higher than quoted. Returns are before taxes unless otherwise noted. For performance as of the most recentmonth-end, please refer to eatonvance.com.
| 2 |
Eaton Vance
Balanced Fund
December 31, 2018
Performance2,3
Portfolio Managers Charles B. Gaffney, Vishal Khanduja, CFA and Brian S. Ellis, CFA
| % Average Annual Total Returns | Class Inception Date | Performance Inception Date | One Year | Five Years | Ten Years | |||||||||||||||||||
Class A at NAV | 04/01/1932 | 04/01/1932 | –3.43 | % | 5.23 | % | 8.97 | % | ||||||||||||||||
Class A with 5.75% Maximum Sales Charge | — | — | –9.02 | 3.98 | 8.32 | |||||||||||||||||||
Class B at NAV | 11/02/1993 | 04/01/1932 | –4.15 | 4.43 | 8.14 | |||||||||||||||||||
Class B with 5% Maximum Sales Charge | — | — | –8.70 | 4.10 | 8.14 | |||||||||||||||||||
Class C at NAV | 11/02/1993 | 04/01/1932 | –4.03 | 4.46 | 8.17 | |||||||||||||||||||
Class C with 1% Maximum Sales Charge | — | — | -4.94 | 4.46 | 8.17 | |||||||||||||||||||
Class I at NAV | 09/28/2012 | 04/01/1932 | –3.19 | 5.48 | 9.14 | |||||||||||||||||||
Class R at NAV | 05/02/2016 | 04/01/1932 | –3.61 | 5.10 | 8.90 | |||||||||||||||||||
Class R6 at NAV | 05/02/2016 | 04/01/1932 | –3.13 | 5.52 | 9.16 | |||||||||||||||||||
S&P 500® Index | — | — | –4.38 | % | 8.49 | % | 13.11 | % | ||||||||||||||||
Bloomberg Barclays U.S. Aggregate Bond Index | — | — | 0.01 | 2.52 | 3.48 | |||||||||||||||||||
Blended Index | — | — | –2.35 | 6.24 | 9.42 | |||||||||||||||||||
| % Total Annual Operating Expense Ratios4 | Class A | Class B | Class C | Class I | Class R | Class R6 | ||||||||||||||||||
Gross | 0.99 | % | 1.74 | % | 1.74 | % | 0.74 | % | 1.24 | % | 0.70 | % | ||||||||||||
Net | 0.98 | 1.73 | 1.73 | 0.73 | 1.23 | 0.69 | ||||||||||||||||||
Growth of $10,000
This graph shows the change in value of a hypothetical investment of $10,000 in Class A of the Fund for the period indicated. For comparison, the same investment is shown in the indicated index.
| Growth of Investment3 | Amount Invested | Period Beginning | At NAV | With Maximum Sales Charge | ||||||||||||
Class B | $ | 10,000 | 12/31/2008 | $ | 21,871 | N.A. | ||||||||||
Class C | $ | 10,000 | 12/31/2008 | $ | 21,940 | N.A. | ||||||||||
Class I | $ | 250,000 | 12/31/2008 | $ | 599,631 | N.A. | ||||||||||
Class R | $ | 10,000 | 12/31/2008 | $ | 23,479 | N.A. | ||||||||||
Class R6 | $ | 1,000,000 | 12/31/2008 | $ | 2,402,566 | N.A. | ||||||||||
See Endnotes and Additional Disclosures in this report.
Past performance is no guarantee of future results. Returns are historical and are calculated by determining the percentage change in net asset value (NAV) or offering price (as applicable) with all distributions reinvested. Investment return and principal value will fluctuate so that shares, when redeemed, may be worth more or less than their original cost. Performance less than or equal to one year is cumulative. Performance is for the stated time period only; due to market volatility, the Fund’s current performance may be lower or higher than quoted. Returns are before taxes unless otherwise noted. For performance as of the most recent month-end, please refer to eatonvance.com.
| 3 |
Eaton Vance
Balanced Fund
December 31, 2018
Fund Profile5
Asset Allocation (% of total investments)
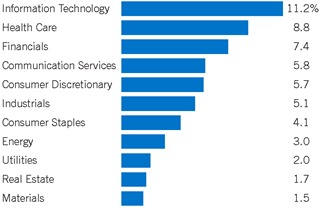
Equity Investments Sector Allocation (% of total investments)
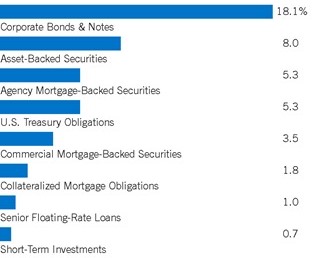
Fixed Income Allocation (% of total investments)
See Endnotes and Additional Disclosures in this report.
| 4 |
Eaton Vance
Balanced Fund
December 31, 2018
Endnotes and Additional Disclosures
| 1 | The views expressed in this report are those of the portfolio manager(s) and are current only through the date stated at the top of this page. These views are subject to change at any time based upon market or other conditions, and Eaton Vance and the Fund(s) disclaim any responsibility to update such views. These views may not be relied upon as investment advice and, because investment decisions are based on many factors, may not be relied upon as an indication of trading intent on behalf of any Eaton Vance fund. This commentary may contain statements that are not historical facts, referred to as “forward looking statements.” The Fund’s actual future results may differ significantly from those stated in any forward looking statement, depending on factors such as changes in securities or financial markets or general economic conditions, the volume of sales and purchases of Fund shares, the continuation of investment advisory, administrative and service contracts, and other risks discussed from time to time in the Fund’s filings with the Securities and Exchange Commission. |
| 2 | Dow Jones Industrial Average® is a price-weighted average of 30 blue-chip stocks that are generally the leaders in their industry. S&P 500® Index is an unmanaged index oflarge-cap stocks commonly used as a measure of U.S. stock market performance. NASDAQ Composite Index is a market capitalization- weighted index of all domestic and international securities listed on NASDAQ. Source: Nasdaq, Inc. The information is provided by Nasdaq (with its affiliates, are referred to as the “Corporations”) and Nasdaq’s third party licensors on an “as is” basis and the Corporations make no guarantees and bear no liability of any kind with respect to the information or the Fund. Russell 2000® Index is an unmanaged index of 2,000 U.S.small-cap stocks. Bloomberg Barclays U.S. Aggregate Bond Index is an unmanaged index of domestic investment-grade bonds, including corporate, government andmortgage-backed securities. ICE BofAML U.S. High Yield Index is an unmanaged index of below-investment grade U.S. corporate bonds. ICE® BofAML® indices are not for redistribution or other uses; provided “as is”, without warranties, and with no liability. Eaton Vance has prepared this report and ICE Data Indices, LLC does not endorse it, or guarantee, review, or endorse Eaton Vance’s products. BofAML® is a licensed registered trademark of Bank of America Corporation in the United States and other countries. The Blended Index consists of 60% S&P 500® Index and 40% Bloomberg Barclays U.S. Aggregate Bond Index, rebalanced monthly. Unless otherwise stated, index returns do not reflect the effect of any applicable sales charges, commissions, expenses, taxes or leverage, as applicable. It is not possible to invest directly in an index. |
| 3 | Total Returns at NAV do not include applicable sales charges. If sales charges were deducted, the returns would be lower. Total Returns shown with maximum sales charge reflect the stated maximum sales charge. Unless otherwise stated, performance does not reflect the deduction of taxes on Fund distributions or redemptions of Fund shares. |
Performance prior to the inception date of a class may be linked to the performance of an older class of the Fund. This linked performance is adjusted for any applicable sales charge, but is not adjusted for class expense differences. If adjusted for such differences, the performance would be different. The performance of Class I and Class R is linked to Class A and the performance of Class R6 is linked to Class I. Performance since inception for an index, if presented, is the performance since the Fund’s or oldest share class’ inception, as applicable. Performance presented in the Financial Highlights included in the financial statements is not linked. |
| 4 | Source: Fund prospectus. Net expense ratios reflect a contractual expense reimbursement that continues through 4/30/19. Without the reimbursement, performance would have been lower. The expense ratios for the current reporting period can be found in the Financial Highlights section of this report. |
| 5 | Fund invests in one or more affiliated investment companies (Portfolios). References to investments are to the aggregate holdings of the Fund, including its pro rata share of each Portfolio in which it invests. |
| 6 | Duration is a measure of the expected change in price of a bond — in percentage terms — given a one percent change in interest rates, all else being constant. Securities with lower durations tend to be less sensitive to interest rate changes. |
Fund profile subject to change due to active management. |
| 5 |
Eaton Vance
Balanced Fund
December 31, 2018
Fund Expenses
Example: As a Fund shareholder, you incur two types of costs: (1) transaction costs, including sales charges (loads) on purchases and redemption fees (if applicable); and (2) ongoing costs, including management fees; distribution and/or service fees; and other Fund expenses. This Example is intended to help you understand your ongoing costs (in dollars) of Fund investing and to compare these costs with the ongoing costs of investing in other mutual funds. The Example is based on an investment of $1,000 invested at the beginning of the period and held for the entire period (July 1, 2018 – December 31, 2018).
Actual Expenses: The first section of the table below provides information about actual account values and actual expenses. You may use the information in this section, together with the amount you invested, to estimate the expenses that you paid over the period. Simply divide your account value by $1,000 (for example, an $8,600 account value divided by $1,000 = 8.6), then multiply the result by the number in the first section under the heading entitled “Expenses Paid During Period” to estimate the expenses you paid on your account during this period.
Hypothetical Example for Comparison Purposes: The second section of the table below provides information about hypothetical account values and hypothetical expenses based on the actual Fund expense ratio and an assumed rate of return of 5% per year (before expenses), which is not the actual Fund return. The hypothetical account values and expenses may not be used to estimate the actual ending account balance or expenses you paid for the period. You may use this information to compare the ongoing costs of investing in your Fund and other funds. To do so, compare this 5% hypothetical example with the 5% hypothetical examples that appear in the shareholder reports of the other funds.
Please note that the expenses shown in the table are meant to highlight your ongoing costs only and do not reflect any transactional costs, such as sales charges (loads) or redemption fees (if applicable). Therefore, the second section of the table is useful in comparing ongoing costs only, and will not help you determine the relative total costs of owning different funds. In addition, if these transactional costs were included, your costs would be higher.
| Beginning Account Value (7/1/18) | Ending Account Value (12/31/18) | Expenses Paid During Period* (7/1/18 – 12/31/18) | Annualized Expense Ratio | |||||||||||||
Actual |
| |||||||||||||||
Class A | $ | 1,000.00 | $ | 956.70 | $ | 4.83 | ** | 0.98 | % | |||||||
Class B | $ | 1,000.00 | $ | 952.60 | $ | 8.51 | ** | 1.73 | % | |||||||
Class C | $ | 1,000.00 | $ | 953.30 | $ | 8.52 | ** | 1.73 | % | |||||||
Class I | $ | 1,000.00 | $ | 956.90 | $ | 3.60 | ** | 0.73 | % | |||||||
Class R | $ | 1,000.00 | $ | 955.80 | $ | 6.06 | ** | 1.23 | % | |||||||
Class R6 | $ | 1,000.00 | $ | 957.20 | $ | 3.40 | ** | 0.69 | % | |||||||
Hypothetical |
| |||||||||||||||
(5% return per year before expenses) |
| |||||||||||||||
Class A | $ | 1,000.00 | $ | 1,020.30 | $ | 4.99 | ** | 0.98 | % | |||||||
Class B | $ | 1,000.00 | $ | 1,016.50 | $ | 8.79 | ** | 1.73 | % | |||||||
Class C | $ | 1,000.00 | $ | 1,016.50 | $ | 8.79 | ** | 1.73 | % | |||||||
Class I | $ | 1,000.00 | $ | 1,021.50 | $ | 3.72 | ** | 0.73 | % | |||||||
Class R | $ | 1,000.00 | $ | 1,019.00 | $ | 6.26 | ** | 1.23 | % | |||||||
Class R6 | $ | 1,000.00 | $ | 1,021.70 | $ | 3.52 | ** | 0.69 | % | |||||||
| * | Expenses are equal to the Fund’s annualized expense ratio for the indicated Class, multiplied by the average account value over the period, multiplied by 184/365 (to reflect theone-half year period). The Example assumes that the $1,000 was invested at the net asset value per share determined at the close of business on June 30, 2018. The Example reflects the expenses of both the Fund and the Portfolios. |
| ** | Absent an allocation of certain expenses to an affiliate, expenses would be higher. |
| 6 |
Eaton Vance
Balanced Fund
December 31, 2018
Statement of Assets and Liabilities
| Assets | December 31, 2018 | |||
Investment in Core Bond Portfolio, at value (identified cost, $339,780,068) | $ | 332,160,336 | ||
Investment in Stock Portfolio, at value (identified cost, $404,530,523) | 426,808,305 | |||
Receivable for Fund shares sold | 1,823,741 | |||
Receivable from affiliate | 123,780 | |||
Total assets | $ | 760,916,162 | ||
| Liabilities |
| |||
Payable for Fund shares redeemed | $ | 3,123,231 | ||
Payable to affiliates: |
| |||
Administration fee | 26,514 | |||
Distribution and service fees | 260,463 | |||
Trustees’ fees | 125 | |||
Accrued expenses | 216,583 | |||
Total liabilities | $ | 3,626,916 | ||
Net Assets | $ | 757,289,246 | ||
| Sources of Net Assets |
| |||
Paid-in capital | $ | 733,605,733 | ||
Distributable earnings | 23,683,513 | |||
Net Assets | $ | 757,289,246 | ||
| 7 | See Notes to Financial Statements. |
Eaton Vance
Balanced Fund
December 31, 2018
Statement of Assets and Liabilities — continued
| Class A Shares | December 31, 2018 | |||
Net Assets | $ | 294,742,487 | ||
Shares Outstanding | 35,602,254 | |||
Net Asset Value and Redemption Price Per Share |
| |||
(net assets ÷ shares of beneficial interest outstanding) | $ | 8.28 | ||
Maximum Offering Price Per Share |
| |||
(100 ÷ 94.25 of net asset value per share) | $ | 8.79 | ||
| Class B Shares |
| |||
Net Assets | $ | 1,408,477 | ||
Shares Outstanding | 169,512 | |||
Net Asset Value and Offering Price Per Share* |
| |||
(net assets ÷ shares of beneficial interest outstanding) | $ | 8.31 | ||
| Class C Shares |
| |||
Net Assets | $ | 221,669,423 | ||
Shares Outstanding | 26,659,307 | |||
Net Asset Value and Offering Price Per Share* |
| |||
(net assets ÷ shares of beneficial interest outstanding) | $ | 8.31 | ||
| Class I Shares |
| |||
Net Assets | $ | 208,740,252 | ||
Shares Outstanding | 25,204,458 | |||
Net Asset Value, Offering Price and Redemption Price Per Share |
| |||
(net assets ÷ shares of beneficial interest outstanding) | $ | 8.28 | ||
| Class R Shares |
| |||
Net Assets | $ | 2,513,695 | ||
Shares Outstanding | 304,472 | |||
Net Asset Value, Offering Price and Redemption Price Per Share |
| |||
(net assets ÷ shares of beneficial interest outstanding) | $ | 8.26 | ||
| Class R6 Shares |
| |||
Net Assets | $ | 28,214,912 | ||
Shares Outstanding | 3,406,740 | |||
Net Asset Value, Offering Price and Redemption Price Per Share |
| |||
(net assets ÷ shares of beneficial interest outstanding) | $ | 8.28 | ||
On sales of $50,000 or more, the offering price of Class A shares is reduced.
| * | Redemption price per share is equal to the net asset value less any applicable contingent deferred sales charge. |
| 8 | See Notes to Financial Statements. |
Eaton Vance
Balanced Fund
December 31, 2018
Statement of Operations
| Investment Income | Year Ended December 31, 2018 | |||
Dividends allocated from Portfolios (net of foreign taxes, $51,808) | $ | 9,258,200 | ||
Interest allocated from Portfolios (net of foreign taxes, $4,885) | 10,840,442 | |||
Expenses allocated from Portfolios | (4,826,131 | ) | ||
Total investment income from Portfolios | $ | 15,272,511 | ||
| Expenses |
| |||
Administration fee | $ | 331,416 | ||
Distribution and service fees |
| |||
Class A | 815,601 | |||
Class B | 26,136 | |||
Class C | 2,475,318 | |||
Class R | 7,500 | |||
Trustees’ fees and expenses | 500 | |||
Custodian fee | 62,592 | |||
Transfer and dividend disbursing agent fees | 595,220 | |||
Legal and accounting services | 61,129 | |||
Printing and postage | 263,155 | |||
Registration fees | 83,881 | |||
Miscellaneous | 22,547 | |||
Total expenses | $ | 4,744,995 | ||
Deduct — |
| |||
Allocation of expenses to affiliate | $ | 226,067 | ||
Total expense reductions | $ | 226,067 | ||
Net expenses | $ | 4,518,928 | ||
Net investment income | $ | 10,753,583 | ||
| Realized and Unrealized Gain (Loss) from Portfolios |
| |||
Net realized gain (loss) — |
| |||
Investment transactions | $ | 38,152,305 | (1) | |
Financial futures contracts | (1,263,599 | ) | ||
Foreign currency transactions | 433 | |||
Net realized gain | $ | 36,889,139 | ||
Change in unrealized appreciation (depreciation) — |
| |||
Investments | $ | (77,262,117 | ) | |
Financial futures contracts | 1,343,447 | |||
Foreign currency | (1,120 | ) | ||
Net change in unrealized appreciation (depreciation) | $ | (75,919,790 | ) | |
Net realized and unrealized loss | $ | (39,030,651 | ) | |
Net decrease in net assets from operations | $ | (28,277,068 | ) | |
| (1) | Includes $1,736,702 of net realized gains from redemptionsin-kind. |
| 9 | See Notes to Financial Statements. |
Eaton Vance
Balanced Fund
December 31, 2018
Statements of Changes in Net Assets
| Year Ended December 31, | ||||||||
| Increase (Decrease) in Net Assets | 2018 | 2017 | ||||||
From operations — | ||||||||
Net investment income | $ | 10,753,583 | $ | 10,497,056 | ||||
Net realized gain | 36,889,139 | (1) | 38,866,291 | (2) | ||||
Net change in unrealized appreciation (depreciation) | (75,919,790 | ) | 56,128,936 | |||||
Net increase (decrease) in net assets from operations | $ | (28,277,068 | ) | $ | 105,492,283 | |||
Distributions to shareholders(3) | ||||||||
Class A | $ | (18,739,469 | ) | $ | (15,777,475 | ) | ||
Class B | (91,266 | ) | (152,811 | ) | ||||
Class C | (12,205,962 | ) | (10,079,965 | ) | ||||
Class I | (13,826,475 | ) | (10,699,599 | ) | ||||
Class R | (135,021 | ) | (19,273 | ) | ||||
Class R6 | (1,789,678 | ) | (1,199,580 | ) | ||||
Total distributions to shareholders | $ | (46,787,871 | ) | $ | (37,928,703 | ) | ||
Transactions in shares of beneficial interest — | ||||||||
Proceeds from sale of shares | ||||||||
Class A | $ | 36,195,194 | $ | 53,200,585 | ||||
Class B | 102,651 | 383,520 | ||||||
Class C | 32,946,973 | 46,001,367 | ||||||
Class I | 84,683,057 | 125,211,421 | ||||||
Class R | 2,505,931 | 345,985 | ||||||
Class R6 | 8,927,546 | 29,845,058 | ||||||
Net asset value of shares issued to shareholders in payment of distributions declared | ||||||||
Class A | 17,050,458 | 14,377,214 | ||||||
Class B | 75,196 | 131,920 | ||||||
Class C | 11,694,047 | 9,594,045 | ||||||
Class I | 12,115,212 | 9,476,794 | ||||||
Class R | 135,021 | 19,272 | ||||||
Class R6 | 1,789,678 | 1,199,579 | ||||||
Cost of shares redeemed | ||||||||
Class A | (65,301,961 | ) | (137,560,952 | ) | ||||
Class��B | (382,402 | ) | (1,053,892 | ) | ||||
Class C | (60,203,295 | ) | (72,158,153 | ) | ||||
Class I | (87,201,665 | ) | (143,521,607 | ) | ||||
Class R | (419,113 | ) | (1,100 | ) | ||||
Class R6 | (7,265,449 | ) | (4,088,771 | ) | ||||
Net asset value of shares exchanged | ||||||||
Class A | 1,881,655 | 1,518,158 | ||||||
Class B | (1,881,655 | ) | (1,518,158 | ) | ||||
Net decrease in net assets from Fund share transactions | $ | (12,552,921 | ) | $ | (68,597,715 | ) | ||
Other capital — | ||||||||
Portfolio transaction fee contributed to Stock Portfolio | $ | (210,067 | ) | $ | (165,472 | ) | ||
Portfolio transaction fee allocated from Stock Portfolio | 199,641 | 171,802 | ||||||
Net increase (decrease) in net assets from other capital | $ | (10,426 | ) | $ | 6,330 | |||
Net decrease in net assets | $ | (87,628,286 | ) | $ | (1,027,805 | ) | ||
| Net Assets | ||||||||
At beginning of year | $ | 844,917,532 | $ | 845,945,337 | ||||
At end of year | $ | 757,289,246 | $ | 844,917,532 | ||||
| (1) | Includes $1,736,702 of net realized gains from redemptionsin-kind. |
| (2) | Includes $5,153,441 of net realized gains from redemptionsin-kind. |
| (3) | For the year ended December 31, 2017, the source of distributions was as follows: |
Net investment income - Class A $(5,388,871), Class B $(33,748), Class C $(2,075,186), Class I $(3,884,926), Class R $(4,260) and Class R6 $(354,961) |
Net realized gain - Class A $(10,388,604), Class B $(119,063), Class C $(8,004,779), Class I $(6,814,673), Class R $(15,013) and Class R6 $(844,619) |
The current year presentation of distributions conforms with the Disclosure Update and Simplification Rule issued by the Securities and Exchange Commission, effective November 5, 2018. |
| 10 | See Notes to Financial Statements. |
Eaton Vance
Balanced Fund
December 31, 2018
Financial Highlights
| Class A | ||||||||||||||||||||
| Year Ended December 31, | ||||||||||||||||||||
| 2018 | 2017 | 2016 | 2015 | 2014 | ||||||||||||||||
Net asset value — Beginning of year | $ | 9.110 | $ | 8.410 | $ | 8.190 | $ | 8.460 | $ | 8.460 | ||||||||||
| Income (Loss) From Operations | ||||||||||||||||||||
Net investment income(1) | $ | 0.132 | $ | 0.124 | $ | 0.114 | $ | 0.088 | $ | 0.090 | ||||||||||
Net realized and unrealized gain (loss) | (0.424 | ) | 1.003 | 0.261 | 0.139 | 0.703 | ||||||||||||||
Total income (loss) from operations | $ | (0.292 | ) | $ | 1.127 | $ | 0.375 | $ | 0.227 | $ | 0.793 | |||||||||
| Less Distributions | ||||||||||||||||||||
From net investment income | $ | (0.146 | ) | $ | (0.139 | ) | $ | (0.123 | ) | $ | (0.116 | ) | $ | (0.110 | ) | |||||
From net realized gain | (0.392 | ) | (0.288 | ) | (0.032 | ) | (0.381 | ) | (0.683 | ) | ||||||||||
Total distributions | $ | (0.538 | ) | $ | (0.427 | ) | $ | (0.155 | ) | $ | (0.497 | ) | $ | (0.793 | ) | |||||
Portfolio transaction fee, net(1) | $ | (0.000 | )(2) | $ | 0.000 | (2) | $ | (0.000 | )(2) | $ | — | $ | — | |||||||
Net asset value — End of year | $ | 8.280 | $ | 9.110 | $ | 8.410 | $ | 8.190 | $ | 8.460 | ||||||||||
Total Return(3) | (3.43 | )%(4) | 13.53 | %(4) | 4.60 | %(4) | 2.65 | %(4) | 9.62 | % | ||||||||||
| Ratios/Supplemental Data |
| |||||||||||||||||||
Net assets, end of year (000’s omitted) | $ | 294,742 | $ | 333,860 | $ | 374,579 | $ | 293,994 | $ | 197,190 | ||||||||||
Ratios (as a percentage of average daily net assets):(5) | ||||||||||||||||||||
Expenses(6) | 0.98 | %(4) | 0.98 | %(4) | 0.98 | %(4) | 1.05 | %(4) | 1.14 | % | ||||||||||
Net investment income | 1.45 | % | 1.41 | % | 1.38 | % | 1.05 | % | 1.02 | % | ||||||||||
Portfolio Turnover of the Fund(7) | 7 | % | 4 | % | 11 | % | 2 | % | 17 | % | ||||||||||
| (1) | Computed using average shares outstanding. |
| (2) | Amount is less than $0.0005 or $(0.0005), as applicable. |
| (3) | Returns are historical and are calculated by determining the percentage change in net asset value with all distributions reinvested and do not reflect the effect of sales charges. |
| (4) | The administrator of the Fund reimbursed certain operating expenses (equal to 0.03%, 0.01%, 0.03% and less than 0.005% of average daily net assets for the years ended December 31, 2018, 2017, 2016 and 2015, respectively). Absent this reimbursement, total return would be lower. |
| (5) | Includes the Fund’s share of the Portfolios’ allocated expenses. |
| (6) | Excludes the effect of custody fee credits, if any, of less than 0.005%. Effective September 1, 2015, custody fee credits, which were earned on cash deposit balances, were discontinued by the custodian. |
| (7) | Percentage is based on the Fund’s contributions to and withdrawals from the Portfolios and excludes the investment activity of the Portfolios. |
| 11 | See Notes to Financial Statements. |
Eaton Vance
Balanced Fund
December 31, 2018
Financial Highlights — continued
| Class B | ||||||||||||||||||||
| Year Ended December 31, | ||||||||||||||||||||
| 2018 | 2017 | 2016 | 2015 | 2014 | ||||||||||||||||
Net asset value — Beginning of year | $ | 9.130 | $ | 8.430 | $ | 8.200 | $ | 8.470 | $ | 8.470 | ||||||||||
| Income (Loss) From Operations | ||||||||||||||||||||
Net investment income(1) | $ | 0.060 | $ | 0.058 | $ | 0.051 | $ | 0.025 | $ | 0.024 | ||||||||||
Net realized and unrealized gain (loss) | (0.422 | ) | 0.997 | 0.266 | 0.139 | 0.702 | ||||||||||||||
Total income (loss) from operations | $ | (0.362 | ) | $ | 1.055 | $ | 0.317 | $ | 0.164 | $ | 0.726 | |||||||||
| Less Distributions | ||||||||||||||||||||
From net investment income | $ | (0.066 | ) | $ | (0.067 | ) | $ | (0.055 | ) | $ | (0.053 | ) | $ | (0.043 | ) | |||||
From net realized gain | (0.392 | ) | (0.288 | ) | (0.032 | ) | (0.381 | ) | (0.683 | ) | ||||||||||
Total distributions | $ | (0.458 | ) | $ | (0.355 | ) | $ | (0.087 | ) | $ | (0.434 | ) | $ | (0.726 | ) | |||||
Portfolio transaction fee, net(1) | $ | (0.000 | )(2) | $ | 0.000 | (2) | $ | (0.000 | )(2) | $ | — | $ | — | |||||||
Net asset value — End of year | $ | 8.310 | $ | 9.130 | $ | 8.430 | $ | 8.200 | $ | 8.470 | ||||||||||
Total Return(3) | (4.15 | )%(4) | 12.60 | %(4) | 3.87 | %(4) | 1.88 | %(4) | 8.78 | % | ||||||||||
| Ratios/Supplemental Data |
| |||||||||||||||||||
Net assets, end of year (000’s omitted) | $ | 1,408 | $ | 3,638 | $ | 5,313 | $ | 7,992 | $ | 10,022 | ||||||||||
Ratios (as a percentage of average daily net assets):(5) | ||||||||||||||||||||
Expenses(6) | 1.73 | %(4) | 1.73 | %(4) | 1.73 | %(4) | 1.80 | %(4) | 1.89 | % | ||||||||||
Net investment income | 0.66 | % | 0.66 | % | 0.62 | % | 0.29 | % | 0.27 | % | ||||||||||
Portfolio Turnover of the Fund(7) | 7 | % | 4 | % | 11 | % | 2 | % | 17 | % | ||||||||||
| (1) | Computed using average shares outstanding. |
| (2) | Amount is less than $0.0005 or $(0.0005), as applicable. |
| (3) | Returns are historical and are calculated by determining the percentage change in net asset value with all distributions reinvested and do not reflect the effect of sales charges. |
| (4) | The administrator of the Fund reimbursed certain operating expenses (equal to 0.03%, 0.01%, 0.03% and less than 0.005% of average daily net assets for the years ended December 31, 2018, 2017, 2016 and 2015, respectively). Absent this reimbursement, total return would be lower. |
| (5) | Includes the Fund’s share of the Portfolios’ allocated expenses. |
| (6) | Excludes the effect of custody fee credits, if any, of less than 0.005%. Effective September 1, 2015, custody fee credits, which were earned on cash deposit balances, were discontinued by the custodian. |
| (7) | Percentage is based on the Fund’s contributions to and withdrawals from the Portfolios and excludes the investment activity of the Portfolios. |
| 12 | See Notes to Financial Statements. |
Eaton Vance
Balanced Fund
December 31, 2018
Financial Highlights — continued
| Class C | ||||||||||||||||||||
| Year Ended December 31, | ||||||||||||||||||||
| 2018 | 2017 | 2016 | 2015 | 2014 | ||||||||||||||||
Net asset value — Beginning of year | $ | 9.140 | $ | 8.440 | $ | 8.220 | $ | 8.500 | $ | 8.500 | ||||||||||
| Income (Loss) From Operations | ||||||||||||||||||||
Net investment income(1) | $ | 0.064 | $ | 0.058 | $ | 0.052 | $ | 0.026 | $ | 0.024 | ||||||||||
Net realized and unrealized gain (loss) | (0.426 | ) | 1.001 | 0.266 | 0.138 | 0.705 | ||||||||||||||
Total income (loss) from operations | $ | (0.362 | ) | $ | 1.059 | $ | 0.318 | $ | 0.164 | $ | 0.729 | |||||||||
| Less Distributions | ||||||||||||||||||||
From net investment income | $ | (0.076 | ) | $ | (0.071 | ) | $ | (0.066 | ) | $ | (0.063 | ) | $ | (0.046 | ) | |||||
From net realized gain | (0.392 | ) | (0.288 | ) | (0.032 | ) | (0.381 | ) | (0.683 | ) | ||||||||||
Total distributions | $ | (0.468 | ) | $ | (0.359 | ) | $ | (0.098 | ) | $ | (0.444 | ) | $ | (0.729 | ) | |||||
Portfolio transaction fee, net(1) | $ | (0.000 | )(2) | $ | 0.000 | (2) | $ | (0.000 | )(2) | $ | — | $ | — | |||||||
Net asset value — End of year | $ | 8.310 | $ | 9.140 | $ | 8.440 | $ | 8.220 | $ | 8.500 | ||||||||||
Total Return(3) | (4.03 | )%(4) | 12.63 | %(4) | 3.88 | %(4) | 1.86 | %(4) | 8.78 | % | ||||||||||
| Ratios/Supplemental Data |
| |||||||||||||||||||
Net assets, end of year (000’s omitted) | $ | 221,669 | $ | 258,844 | $ | 254,656 | $ | 137,051 | $ | 60,351 | ||||||||||
Ratios (as a percentage of average daily net assets):(5) | ||||||||||||||||||||
Expenses(6) | 1.73 | %(4) | 1.73 | %(4) | 1.73 | %(4) | 1.80 | %(4) | 1.88 | % | ||||||||||
Net investment income | 0.70 | % | 0.65 | % | 0.63 | % | 0.30 | % | 0.28 | % | ||||||||||
Portfolio Turnover of the Fund(7) | 7 | % | 4 | % | 11 | % | 2 | % | 17 | % | ||||||||||
| (1) | Computed using average shares outstanding. |
| (2) | Amount is less than $0.0005 or $(0.0005), as applicable. |
| (3) | Returns are historical and are calculated by determining the percentage change in net asset value with all distributions reinvested and do not reflect the effect of sales charges. |
| (4) | The administrator of the Fund reimbursed certain operating expenses (equal to 0.03%, 0.01%, 0.03% and less than 0.005% of average daily net assets for the years ended December 31, 2018, 2017, 2016 and 2015, respectively). Absent this reimbursement, total return would be lower. |
| (5) | Includes the Fund’s share of the Portfolios’ allocated expenses. |
| (6) | Excludes the effect of custody fee credits, if any, of less than 0.005%. Effective September 1, 2015, custody fee credits, which were earned on cash deposit balances, were discontinued by the custodian. |
| (7) | Percentage is based on the Fund’s contributions to and withdrawals from the Portfolios and excludes the investment activity of the Portfolios. |
| 13 | See Notes to Financial Statements. |
Eaton Vance
Balanced Fund
December 31, 2018
Financial Highlights — continued
| Class I | ||||||||||||||||||||
| Year Ended December 31, | ||||||||||||||||||||
| 2018 | 2017 | 2016 | 2015 | 2014 | ||||||||||||||||
Net asset value — Beginning of year | $ | 9.110 | $ | 8.410 | $ | 8.190 | $ | 8.460 | $ | 8.460 | ||||||||||
| Income (Loss) From Operations | ||||||||||||||||||||
Net investment income(1) | $ | 0.156 | $ | 0.147 | $ | 0.137 | $ | 0.109 | $ | 0.115 | ||||||||||
Net realized and unrealized gain (loss) | (0.425 | ) | 1.002 | 0.258 | 0.138 | 0.700 | ||||||||||||||
Total income (loss) from operations | $ | (0.269 | ) | $ | 1.149 | $ | 0.395 | $ | 0.247 | $ | 0.815 | |||||||||
| Less Distributions | ||||||||||||||||||||
From net investment income | $ | (0.169 | ) | $ | (0.161 | ) | $ | (0.143 | ) | $ | (0.136 | ) | $ | (0.132 | ) | |||||
From net realized gain | (0.392 | ) | (0.288 | ) | (0.032 | ) | (0.381 | ) | (0.683 | ) | ||||||||||
Total distributions | $ | (0.561 | ) | $ | (0.449 | ) | $ | (0.175 | ) | $ | (0.517 | ) | $ | (0.815 | ) | |||||
Portfolio transaction fee, net(1) | $ | (0.000 | )(2) | $ | 0.000 | (2) | $ | (0.000 | )(2) | $ | — | $ | — | |||||||
Net asset value — End of year | $ | 8.280 | $ | 9.110 | $ | 8.410 | $ | 8.190 | $ | 8.460 | ||||||||||
Total Return(3) | (3.19 | )%(4) | 13.81 | %(4) | 4.86 | %(4) | 2.88 | %(4) | 9.89 | % | ||||||||||
| Ratios/Supplemental Data |
| |||||||||||||||||||
Net assets, end of year (000’s omitted) | $ | 208,740 | $ | 220,522 | $ | 211,211 | $ | 78,055 | $ | 24,397 | ||||||||||
Ratios (as a percentage of average daily net assets):(5) | ||||||||||||||||||||
Expenses(6) | 0.73 | %(4) | 0.73 | %(4) | 0.73 | %(4) | 0.80 | %(4) | 0.89 | % | ||||||||||
Net investment income | 1.70 | % | 1.66 | % | 1.63 | % | 1.29 | % | 1.31 | % | ||||||||||
Portfolio Turnover of the Fund(7) | 7 | % | 4 | % | 11 | % | 2 | % | 17 | % | ||||||||||
| (1) | Computed using average shares outstanding. |
| (2) | Amount is less than $0.0005 or $(0.0005), as applicable. |
| (3) | Returns are historical and are calculated by determining the percentage change in net asset value with all distributions reinvested. |
| (4) | The administrator of the Fund reimbursed certain operating expenses (equal to 0.03%, 0.01%, 0.03% and less than 0.005% of average daily net assets for the years ended December 31, 2018, 2017, 2016 and 2015, respectively). Absent this reimbursement, total return would be lower. |
| (5) | Includes the Fund’s share of the Portfolios’ allocated expenses. |
| (6) | Excludes the effect of custody fee credits, if any, of less than 0.005%. Effective September 1, 2015, custody fee credits, which were earned on cash deposit balances, were discontinued by the custodian. |
| (7) | Percentage is based on the Fund’s contributions to and withdrawals from the Portfolios and excludes the investment activity of the Portfolios. |
| 14 | See Notes to Financial Statements. |
Eaton Vance
Balanced Fund
December 31, 2018
Financial Highlights — continued
| Class R | ||||||||||||
| Year Ended December 31, | Period Ended December 31, 2016(1) | |||||||||||
| 2018 | 2017 | |||||||||||
Net asset value — Beginning of period | $ | 9.090 | $ | 8.400 | $ | 8.290 | ||||||
| Income (Loss) From Operations | ||||||||||||
Net investment income(2) | $ | 0.115 | $ | 0.104 | $ | 0.075 | ||||||
Net realized and unrealized gain (loss) | (0.423 | ) | 0.996 | 0.152 | ||||||||
Total income (loss) from operations | $ | (0.308 | ) | $ | 1.100 | $ | 0.227 | |||||
| Less Distributions | ||||||||||||
From net investment income | $ | (0.130 | ) | $ | (0.122 | ) | $ | (0.085 | ) | |||
From net realized gain | (0.392 | ) | (0.288 | ) | (0.032 | ) | ||||||
Total distributions | $ | (0.522 | ) | $ | (0.410 | ) | $ | (0.117 | ) | |||
Portfolio transaction fee, net(2) | $ | (0.000 | )(3) | $ | 0.000 | (3) | $ | (0.000 | )(3) | |||
Net asset value — End of period | $ | 8.260 | $ | 9.090 | $ | 8.400 | ||||||
Total Return(4)(5) | (3.61 | )% | 13.22 | % | 2.73 | %(6) | ||||||
| Ratios/Supplemental Data |
| |||||||||||
Net assets, end of period (000’s omitted) | $ | 2,514 | $ | 561 | $ | 178 | ||||||
Ratios (as a percentage of average daily net assets):(7) | ||||||||||||
Expenses(5)(8) | 1.23 | % | 1.23 | % | 1.23 | %(9) | ||||||
Net investment income | 1.27 | % | 1.17 | % | 1.33 | %(9) | ||||||
Portfolio Turnover of the Fund(10) | 7 | % | 4 | % | 11 | %(11) | ||||||
| (1) | For the period from commencement of operations on May 2, 2016 to December 31, 2016. |
| (2) | Computed using average shares outstanding. |
| (3) | Amount is less than $0.0005 or $(0.0005), as applicable. |
| (4) | Returns are historical and are calculated by determining the percentage change in net asset value with all distributions reinvested. |
| (5) | The administrator of the Fund reimbursed certain operating expenses (equal to 0.03%, 0.01% and 0.03% of average daily net assets for the years ended December 31, 2018 and 2017 and the period ended December 31, 2016, respectively). Absent this reimbursement, total return would be lower. |
| (6) | Not annualized. |
| (7) | Includes the Fund’s share of the Portfolios’ allocated expenses. |
| (8) | Excludes the effect of custody fee credits, if any, of less than 0.005%. Effective September 1, 2015, custody fee credits, which were earned on cash deposit balances, were discontinued by the custodian. |
| (9) | Annualized. |
| (10) | Percentage is based on the Fund’s contributions to and withdrawals from the Portfolios and excludes the investment activity of the Portfolios. |
| (11) | For the Fund’s year ended December 31, 2016. |
| 15 | See Notes to Financial Statements. |
Eaton Vance
Balanced Fund
December 31, 2018
Financial Highlights — continued
| Class R6 | ||||||||||||
| Year Ended December 31, | Period Ended December 31, 2016(1) | |||||||||||
| 2018 | 2017 | |||||||||||
Net asset value — Beginning of period | $ | 9.110 | $ | 8.420 | $ | 8.300 | ||||||
| Income (Loss) From Operations | ||||||||||||
Net investment income(2) | $ | 0.160 | $ | 0.146 | $ | 0.088 | ||||||
Net realized and unrealized gain (loss) | (0.423 | ) | 0.999 | 0.170 | ||||||||
Total income (loss) from operations | $ | (0.263 | ) | $ | 1.145 | $ | 0.258 | |||||
| Less Distributions | ||||||||||||
From net investment income | $ | (0.175 | ) | $ | (0.167 | ) | $ | (0.106 | ) | |||
From net realized gain | (0.392 | ) | (0.288 | ) | (0.032 | ) | ||||||
Total distributions | $ | (0.567 | ) | $ | (0.455 | ) | $ | (0.138 | ) | |||
Portfolio transaction fee, net(2) | $ | (0.000 | )(3) | $ | 0.000 | (3) | $ | (0.000 | )(3) | |||
Net asset value — End of period | $ | 8.280 | $ | 9.110 | $ | 8.420 | ||||||
Total Return(4)(5) | (3.13 | )% | 13.75 | % | 3.11 | %(6) | ||||||
| Ratios/Supplemental Data |
| |||||||||||
Net assets, end of period (000’s omitted) | $ | 28,215 | $ | 27,492 | $ | 7 | ||||||
Ratios (as a percentage of average daily net assets):(7) | �� | |||||||||||
Expenses(5)(8) | 0.69 | % | 0.69 | % | 0.69 | %(9) | ||||||
Net investment income | 1.74 | % | 1.62 | % | 1.58 | %(9) | ||||||
Portfolio Turnover of the Fund(10) | 7 | % | 4 | % | 11 | %(11) | ||||||
| (1) | For the period from commencement of operations on May 2, 2016 to December 31, 2016. |
| (2) | Computed using average shares outstanding. |
| (3) | Amount is less than $0.0005 or $(0.0005), as applicable. |
| (4) | Returns are historical and are calculated by determining the percentage change in net asset value with all distributions reinvested. |
| (5) | The administrator of the Fund reimbursed certain operating expenses (equal to 0.03%, 0.01% and 0.03% of average daily net assets for the years ended December 31, 2018 and 2017 and the period ended December 31, 2016, respectively). Absent this reimbursement, total return would be lower. |
| (6) | Not annualized. |
| (7) | Includes the Fund’s share of the Portfolios’ allocated expenses. |
| (8) | Excludes the effect of custody fee credits, if any, of less than 0.005%. Effective September 1, 2015, custody fee credits, which were earned on cash deposit balances, were discontinued by the custodian. |
| (9) | Annualized. |
| (10) | Percentage is based on the Fund’s contributions to and withdrawals from the Portfolios and excludes the investment activity of the Portfolios. |
| (11) | For the Fund’s year ended December 31, 2016. |
| 16 | See Notes to Financial Statements. |
Eaton Vance
Balanced Fund
December 31, 2018
Notes to Financial Statements
1 Significant Accounting Policies
Eaton Vance Balanced Fund (the Fund) is a diversified series of Eaton Vance Special Investment Trust (the Trust). The Trust is a Massachusetts business trust registered under the Investment Company Act of 1940, as amended (the 1940 Act), as anopen-end management investment company. The Fund offers six classes of shares. Class A shares are generally sold subject to a sales charge imposed at time of purchase. Class B and Class C shares are sold at net asset value and are generally subject to a contingent deferred sales charge (see Note 5). Class I, Class R and Class R6 shares are sold at net asset value and are not subject to a sales charge. Class B shares automatically convert to Class A shares eight years after their purchase as described in the Fund’s prospectus. Beginning January 1, 2012, Class B shares are only available for purchase upon exchange from another Eaton Vance fund or through reinvestment of distributions. Effective January 25, 2019, Class C shares generally will automatically convert to Class A shares ten years after their purchase as described in the Fund’s prospectus. Each class represents apro-rata interest in the Fund, but votes separately on class-specific matters and (as noted below) is subject to different expenses. Realized and unrealized gains and losses and net investment income and losses, other than class-specific expenses, are allocated daily to each class of shares based on the relative net assets of each class to the total net assets of the Fund.Sub-accounting, recordkeeping and similar administrative fees payable to financial intermediaries, which are a component of transfer and dividend disbursing agent fees on the Statement of Operations, are not allocated to Class R6 shares. Each class of shares differs in its distribution plan and certain other class-specific expenses. The Fund’s investment objective is to provide current income and long-term growth of capital. The Fund currently pursues its objective by investing all of its investable assets in interests in two portfolios managed by Eaton Vance Management (EVM) or its affiliates (the Portfolios), which are Massachusetts business trusts. The value of the Fund’s investments in the Portfolios reflects the Fund’s proportionate interest in their net assets. The Fund’s proportionate interest in each of the Portfolio’s net assets at December 31, 2018 were as follows: Core Bond Portfolio (65.6%) and Stock Portfolio (82.6%). The performance of the Fund is directly affected by the performance of the Portfolios. The financial statements of Stock Portfolio, including the portfolio of investments, are included elsewhere in this report and should be read in conjunction with the Fund’s financial statements. A copy of Core Bond Portfolio’s financial statements is available on the EDGAR database on the Securities and Exchange Commission’s website (www.sec.gov), at the Commission’s public reference room in Washington, DC or upon request from the Fund’s principal underwriter, Eaton Vance Distributors, Inc. (EVD), by calling1-800-262-1122.
The following is a summary of significant accounting policies of the Fund. The policies are in conformity with accounting principles generally accepted in the United States of America (U.S. GAAP). The Fund is an investment company and follows accounting and reporting guidance in the Financial Accounting Standards Board (FASB) Accounting Standards Codification Topic 946.
A Investment Valuation— Valuation of securities by Stock Portfolio is discussed in Note 1A of the Portfolio’s Notes to Financial Statements, which are included elsewhere in this report. Such policies are consistent with those of Core Bond Portfolio.
Additional valuation policies for Core Bond Portfolio (the Portfolio) are as follows:
Debt Obligations.Debt obligations are generally valued on the basis of valuations provided by third party pricing services, as derived from such services’ pricing models. Inputs to the models may include, but are not limited to, reported trades, executable bid and ask prices, broker/dealer quotations, prices or yields of securities with similar characteristics, interest rates, anticipated prepayments, benchmark curves or information pertaining to the issuer, as well as industry and economic events. The pricing services may use a matrix approach, which considers information regarding securities with similar characteristics to determine the valuation for a security. Short-term debt obligations purchased with a remaining maturity of sixty days or less for which a valuation from a third party pricing service is not readily available may be valued at amortized cost, which approximates fair value.
Senior Floating-Rate Loans. Interests in senior floating-rate loans (Senior Loans) for which reliable market quotations are readily available are valued generally at the average mean of bid and ask quotations obtained from a third party pricing service.
Derivatives. Financial futures contracts are valued at the closing settlement price established by the board of trade or exchange on which they are traded.
B Income — The Fund’s net investment income or loss consists of the Fund’spro-rata share of the net investment income or loss of the Portfolios, less all actual and accrued expenses of the Fund.
C Federal Taxes — The Fund’s policy is to comply with the provisions of the Internal Revenue Code applicable to regulated investment companies and to distribute to shareholders each year substantially all of its net investment income, and all or substantially all of its net realized capital gains. Accordingly, no provision for federal income or excise tax is necessary.
As of December 31, 2018, the Fund had no uncertain tax positions that would require financial statement recognition,de-recognition, or disclosure. The Fund files a U.S. federal income tax return annually after its fiscalyear-end, which is subject to examination by the Internal Revenue Service for a period of three years from the date of filing.
D Expenses — The majority of expenses of the Trust are directly identifiable to an individual fund. Expenses which are not readily identifiable to a specific fund are allocated taking into consideration, among other things, the nature and type of expense and the relative size of the funds.
E Use of Estimates — The preparation of the financial statements in conformity with U.S. GAAP requires management to make estimates and assumptions that affect the reported amounts of assets and liabilities at the date of the financial statements and the reported amounts of income and expense during the reporting period. Actual results could differ from those estimates.
| 17 |
Eaton Vance
Balanced Fund
December 31, 2018
Notes to Financial Statements — continued
F Indemnifications — Under the Trust’s organizational documents, its officers and Trustees may be indemnified against certain liabilities and expenses arising out of the performance of their duties to the Fund. Under Massachusetts law, if certain conditions prevail, shareholders of a Massachusetts business trust (such as the Trust) could be deemed to have personal liability for the obligations of the Trust. However, the Trust’s Declaration of Trust contains an express disclaimer of liability on the part of Fund shareholders and theBy-laws provide that the Trust shall assume the defense on behalf of any Fund shareholders. Moreover, theBy-laws also provide for indemnification out of Fund property of any shareholder held personally liable solely by reason of being or having been a shareholder for all loss or expense arising from such liability. Additionally, in the normal course of business, the Fund enters into agreements with service providers that may contain indemnification clauses. The Fund’s maximum exposure under these arrangements is unknown as this would involve future claims that may be made against the Fund that have not yet occurred.
G Other — Investment transactions are accounted for on a trade date basis.
2 Distributions to Shareholders and Income Tax Information
It is the present policy of the Fund to make quarterly distributions of all or substantially all of its net investment income and to distribute annually all or substantially all of its net realized capital gains. Distributions to shareholders are recorded on theex-dividend date. Distributions are declared separately for each class of shares. Shareholders may reinvest income and capital gain distributions in additional shares of the same class of the Fund at the net asset value as of theex-dividend date or, at the election of the shareholder, receive distributions in cash. Distributions to shareholders are determined in accordance with income tax regulations, which may differ from U.S. GAAP. As required by U.S. GAAP, only distributions in excess of tax basis earnings and profits are reported in the financial statements as a return of capital. Permanent differences between book and tax accounting relating to distributions are reclassified topaid-in capital. For tax purposes, distributions from short-term capital gains and current year earnings and profits attributable to realized gains are considered to be from ordinary income. Distributions in any year may include a substantial return of capital component.
The tax character of distributions declared for the years ended December 31, 2018 and December 31, 2017 was as follows:
| Year Ended December 31, | ||||||||
| 2018 | 2017 | |||||||
Ordinary income | $ | 21,180,027 | $ | 18,924,139 | ||||
Long-term capital gains | $ | 25,607,844 | $ | 19,004,564 | ||||
During the year ended December 31, 2018, distributable earnings was decreased by $3,131,915 andpaid-in capital was increased by $3,131,915 due to the Fund’s use of equalization accounting and differences between book and tax accounting for the Fund’s investment in the Portfolios. Tax equalization accounting allows the Fund to treat as a distribution that portion of redemption proceeds representing a redeeming shareholder’s portion of undistributed taxable income and net capital gains. These reclassifications had no effect on the net assets or net asset value per share of the Fund.
As of December 31, 2018, the components of distributable earnings (accumulated loss) on a tax basis were as follows:
Undistributed ordinary income | $ | 41,630 | ||
Undistributed long-term capital gains | $ | 4,132,544 | ||
Post October capital losses | $ | (5,072,967 | ) | |
Net unrealized appreciation | $ | 24,582,306 | ||
At December 31, 2018, the Fund had a net capital loss of $5,072,967 attributable to security transactions incurred after October 31, 2018 that it has elected to defer. This net capital loss is treated as arising on the first day of the Fund’s taxable year ending December 31, 2019.
3 Investment Adviser Fee and Other Transactions with Affiliates
The investment adviser fee is earned by EVM as compensation for investment advisory services rendered to the Fund. Pursuant to an investment advisory agreement effective October 18, 2018, between the Fund and EVM, the investment adviser fee is computed on investable Fund assets that are not invested in other investment companies for which EVM or its affiliates serve as investment adviser (“Investable Assets”) at the following annual rates: for equity securities — 0.600% up to $500 million and 0.575% from $500 million up to $1 billion of the Fund’s average daily net Investable Assets and at reduced rates when average daily net Investable Assets are $1 billion or more; and for income securities and cash — 0.450% up to $1 billion of the Fund’s average daily net Investable Assets, and at reduced rates when average daily net Investable Assets are $1 billion or more. For the year ended December 31, 2018, the Fund incurred no investment adviser fee on Investable Assets. To the extent the Fund’s assets are invested in the Portfolios, the Fund is allocated its share of the Portfolios’ investment adviser fees. The Portfolios have engaged Boston Management and Research (BMR), a subsidiary of EVM, to render investment advisory services. See Note 2 of the Portfolios’ Notes to Financial Statements. For the year ended December 31, 2018, the
| 18 |
Eaton Vance
Balanced Fund
December 31, 2018
Notes to Financial Statements — continued
Fund’s allocated portion of investment adviser fees paid by the Portfolios amounted to $4,477,165 or 0.54% of the Fund’s average daily net assets. The administration fee is earned by EVM as compensation for administrative services rendered to the Fund. The fee is computed at an annual rate of 0.04% of the Fund’s average daily net assets. For the year ended December 31, 2018, the administration fee amounted to $331,416. EVM has agreed to reimburse the Fund’s expenses to the extent that total annual operating expenses (relating to ordinary operating expenses only) exceed 0.98%, 1.73%, 1.73%, 0.73%, 1.23% and 0.69% of the Fund’s average daily net assets for Class A, Class B, Class C, Class I, Class R and Class R6, respectively. This agreement may be changed or terminated after April 30, 2019. Pursuant to this agreement, EVM was allocated $226,067 of the Fund’s operating expenses for the year ended December 31, 2018.
EVM providessub-transfer agency and related services to the Fund pursuant to aSub-Transfer Agency Support Services Agreement. For the year ended December 31, 2018, EVM earned $85,039 from the Fund pursuant to such agreement, which is included in transfer and dividend disbursing agent fees on the Statement of Operations. The Fund was informed that Eaton Vance Distributors, Inc. (EVD), an affiliate of EVM, received $63,932 as its portion of the sales charge on sales of Class A shares for the year ended December 31, 2018. EVD also received distribution and service fees from Class A, Class B, Class C and Class R shares (see Note 4) and contingent deferred sales charges (see Note 5).
Trustees and officers of the Fund and the Portfolios who are members of EVM’s or BMR’s organizations receive remuneration for their services to the Fund out of the investment adviser fee. Certain officers and Trustees of the Fund and the Portfolios are officers of the above organizations.
4 Distribution Plans
The Fund has in effect a distribution plan for Class A shares (Class A Plan) pursuant to Rule12b-1 under the 1940 Act. Pursuant to the Class A Plan, the Fund pays EVD a distribution and service fee of 0.25% per annum of its average daily net assets attributable to Class A shares for distribution services and facilities provided to the Fund by EVD, as well as for personal services and/or the maintenance of shareholder accounts. Distribution and service fees paid or accrued to EVD for the year ended December 31, 2018 amounted to $815,601 for Class A shares.
The Fund also has in effect distribution plans for Class B shares (Class B Plan), Class C shares (Class C Plan) and Class R shares (Class R Plan) pursuant to Rule12b-1 under the 1940 Act. Pursuant to the Class B and Class C Plans, the Fund pays EVD amounts equal to 0.75% per annum of its average daily net assets attributable to Class B and Class C shares for providing ongoing distribution services and facilities to the Fund. For the year ended December 31, 2018, the Fund paid or accrued to EVD $19,602 and $1,856,488 for Class B and Class C shares, respectively.
The Class R Plan requires the Fund to pay EVD an amount up to 0.50% per annum of its average daily net assets attributable to Class R shares for providing ongoing distribution services and facilities to the Fund. The Trustees of the Trust have currently limited Class R distribution payments to 0.25% per annum of the average daily net assets attributable to Class R shares. For the year ended December 31, 2018, the Fund paid or accrued to EVD $3,750 for Class R shares.
Pursuant to the Class B, Class C and Class R Plans, the Fund also makes payments of service fees to EVD, financial intermediaries and other persons in amounts equal to 0.25% per annum of its average daily net assets attributable to that class. Service fees paid or accrued are for personal services and/or the maintenance of shareholder accounts. They are separate and distinct from the sales commissions and distribution fees payable to EVD. Service fees paid or accrued for the year ended December 31, 2018 amounted to $6,534, $618,830 and $3,750 for Class B, Class C and Class R shares, respectively.
Distribution and service fees are subject to the limitations contained in the Financial Industry Regulatory Authority Rule 2341(d) and for Class B, are further limited to a 5% maximum sales charge as determined in accordance with such rule.
5 Contingent Deferred Sales Charges
A contingent deferred sales charge (CDSC) generally is imposed on redemptions of Class B shares made within six years of purchase and on redemptions of Class C shares made within one year of purchase. Class A shares may be subject to a 1% CDSC if redeemed within 18 months of purchase (depending on the circumstances of purchase). Generally, the CDSC is based upon the lower of the net asset value at date of redemption or date of purchase. No charge is levied on shares acquired by reinvestment of dividends or capital gain distributions. The CDSC for Class B shares is imposed at declining rates that begin at 5% in the case of redemptions in the first and second year after purchase, declining one percentage point each subsequent year. Class C shares are subject to a 1% CDSC if redeemed within one year of purchase. For the year ended December 31, 2018, the Fund was informed that EVD received approximately $3,000 and $17,000 paid by Class A and Class C shareholders, respectively, and no CDSCs paid by Class B shareholders.
| 19 |
Eaton Vance
Balanced Fund
December 31, 2018
Notes to Financial Statements — continued
6 Investment Transactions
For the year ended December 31, 2018, increases and decreases in the Fund’s investments in the Portfolios were as follows:
| Portfolio | Contributions | Withdrawals | ||||||
Core Bond Portfolio | $ | 45,193,360 | $ | 26,781,088 | ||||
Stock Portfolio | 16,683,713 | 98,311,548 | ||||||
In addition, a Portfolio transaction fee is imposed by Stock Portfolio on the combined daily inflows or outflows of the Fund and Stock Portfolio’s other investors as more fully described at Note 1H of Stock Portfolio’s financial statements included herein. Such fee is allocated to the Fund based on itspro-rata interest in Stock Portfolio. The amount of the Portfolio transaction fee imposed on the Fund, if any, and the allocation of such fee are presented as Other capital on the Statements of Changes in Net Assets.
7 Shares of Beneficial Interest
The Fund’s Declaration of Trust permits the Trustees to issue an unlimited number of full and fractional shares of beneficial interest (without par value). Such shares may be issued in a number of different series (such as the Fund) and classes. Transactions in Fund shares were as follows:
| Year Ended December 31, | ||||||||
| Class A | 2018 | 2017 | ||||||
Sales | 3,974,276 | 6,046,264 | ||||||
Issued to shareholders electing to receive payments of distributions in Fund shares | 1,955,621 | 1,601,057 | ||||||
Redemptions | (7,190,686 | ) | (15,698,095 | ) | ||||
Exchange from Class B shares | 206,017 | 171,228 | ||||||
Net decrease | (1,054,772 | ) | (7,879,546 | ) | ||||
| Year Ended December 31, | ||||||||
| Class B | 2018 | 2017 | ||||||
Sales | 11,130 | 43,589 | ||||||
Issued to shareholders electing to receive payments of distributions in Fund shares | 8,605 | 14,629 | ||||||
Redemptions | (43,085 | ) | (119,317 | ) | ||||
Exchange to Class A shares | (205,611 | ) | (170,938 | ) | ||||
Net decrease | (228,961 | ) | (232,037 | ) | ||||
| Year Ended December 31, | ||||||||
| Class C | 2018 | 2017 | ||||||
Sales | 3,593,719 | 5,210,829 | ||||||
Issued to shareholders electing to receive payments of distributions in Fund shares | 1,343,199 | 1,060,832 | ||||||
Redemptions | (6,583,869 | ) | (8,125,257 | ) | ||||
Net decrease | (1,646,951 | ) | (1,853,596 | ) | ||||
| 20 |
Eaton Vance
Balanced Fund
December 31, 2018
Notes to Financial Statements — continued
| Year Ended December 31, | ||||||||
| Class I | 2018 | 2017 | ||||||
Sales | 9,218,867 | 14,281,311 | ||||||
Issued to shareholders electing to receive payments of distributions in Fund shares | 1,387,914 | 1,055,190 | ||||||
Redemptions | (9,606,842 | ) | (16,235,147 | ) | ||||
Net increase (decrease) | 999,939 | (898,646 | ) | |||||
| Year Ended December 31, | ||||||||
| Class R | 2018 | 2017 | ||||||
Sales | 273,640 | 38,453 | ||||||
Issued to shareholders electing to receive payments of distributions in Fund shares | 15,680 | 2,141 | ||||||
Redemptions | (46,563 | ) | (119 | ) | ||||
Net increase | 242,757 | 40,475 | ||||||
| Year Ended December 31, | ||||||||
| Class R6 | 2018 | 2017 | ||||||
Sales | 978,178 | 3,334,907 | ||||||
Issued to shareholders electing to receive payments of distributions in Fund shares | 205,202 | 132,953 | ||||||
Redemptions | (793,374 | ) | (451,958 | ) | ||||
Net increase | 390,006 | 3,015,902 | ||||||
8 Fair Value Measurements
Under generally accepted accounting principles for fair value measurements, a three-tier hierarchy to prioritize the assumptions, referred to as inputs, is used in valuation techniques to measure fair value. The three-tier hierarchy of inputs is summarized in the three broad levels listed below.
| • | Level 1 – quoted prices in active markets for identical investments |
| • | Level 2 – other significant observable inputs (including quoted prices for similar investments, interest rates, prepayment speeds, credit risk, etc.) |
| • | Level 3 – significant unobservable inputs (including a fund’s own assumptions in determining the fair value of investments) |
In cases where the inputs used to measure fair value fall in different levels of the fair value hierarchy, the level disclosed is determined based on the lowest level input that is significant to the fair value measurement in its entirety. The inputs or methodology used for valuing securities are not necessarily an indication of the risk associated with investing in those securities. At December 31, 2018 and December 31, 2017, the Fund’s investment in Core Bond Portfolio, whose financial statements are not included but are available elsewhere as discussed in Note 1, was valued based on Level 1 inputs.
| 21 |
Eaton Vance
Balanced Fund
December 31, 2018
Report of Independent Registered Public Accounting Firm
To the Trustees of Eaton Vance Special Investment Trust and Shareholders of Eaton Vance Balanced Fund:
Opinion on the Financial Statements and Financial Highlights
We have audited the accompanying statement of assets and liabilities of Eaton Vance Balanced Fund (the “Fund”) (one of the funds constituting Eaton Vance Special Investment Trust), as of December 31, 2018, the related statement of operations for the year then ended, the statements of changes in net assets for each of the two years in the period then ended, the financial highlights for each of the five years in the period then ended, and the related notes. In our opinion, the financial statements and financial highlights present fairly, in all material respects, the financial position of the Fund as of December 31, 2018, and the results of its operations for the year then ended, the changes in its net assets for each of the two years in the period then ended, and the financial highlights for each of the five years in the period then ended, in conformity with accounting principles generally accepted in the United States of America.
Basis for Opinion
These financial statements and financial highlights are the responsibility of the Fund’s management. Our responsibility is to express an opinion on the Fund’s financial statements and financial highlights based on our audits. We are a public accounting firm registered with the Public Company Accounting Oversight Board (United States) (PCAOB) and are required to be independent with respect to the Fund in accordance with the U.S. federal securities laws and the applicable rules and regulations of the Securities and Exchange Commission and the PCAOB.
We conducted our audits in accordance with the standards of the PCAOB. Those standards require that we plan and perform the audit to obtain reasonable assurance about whether the financial statements and financial highlights are free of material misstatement, whether due to error or fraud. The Fund is not required to have, nor were we engaged to perform, an audit of its internal control over financial reporting. As part of our audits we are required to obtain an understanding of internal control over financial reporting but not for the purpose of expressing an opinion on the effectiveness of the Fund’s internal control over financial reporting. Accordingly, we express no such opinion.
Our audits included performing procedures to assess the risks of material misstatement of the financial statements and financial highlights, whether due to error or fraud, and performing procedures that respond to those risks. Such procedures included examining, on a test basis, evidence regarding the amounts and disclosures in the financial statements and financial highlights. Our audits also included evaluating the accounting principles used and significant estimates made by management, as well as evaluating the overall presentation of the financial statements and financial highlights. We believe that our audits provide a reasonable basis for our opinion.
/s/ Deloitte & Touche LLP
Boston, Massachusetts
February 22, 2019
We have served as the auditor of one or more Eaton Vance investment companies since 1959.
| 22 |
Eaton Vance
Balanced Fund
December 31, 2018
Federal Tax Information (Unaudited)
The Form1099-DIV you received in February 2019 showed the tax status of all distributions paid to your account in calendar year 2018. Shareholders are advised to consult their own tax adviser with respect to the tax consequences of their investment in the Fund. As required by the Internal Revenue Code and/or regulations, shareholders must be notified regarding the status of qualified dividend income for individuals, the dividends received deduction for corporations and capital gains dividends.
Qualified Dividend Income. For the fiscal year ended December 31, 2018, the Fund designates approximately $8,320,942, or up to the maximum amount of such dividends allowable pursuant to the Internal Revenue Code, as qualified dividend income eligible for the reduced tax rate of 15%.
Dividends Received Deduction. Corporate shareholders are generally entitled to take the dividends received deduction on the portion of the Fund’s dividend distribution that qualifies under tax law. For the Fund’s fiscal 2018 ordinary income dividends, 41.21% qualifies for the corporate dividends received deduction.
Capital Gains Dividends. The Fund hereby designates as a capital gain dividend with respect to the taxable year ended December 31, 2018, $32,610,446 or, if subsequently determined to be different, the net capital gain of such year.
| 23 |
Stock Portfolio
December 31, 2018
Portfolio of Investments
| Common Stocks— 99.6% | ||||||||
| Security | Shares | Value | ||||||
| Aerospace & Defense — 3.1% | ||||||||
CAE, Inc. | 285,500 | $ | 5,246,993 | |||||
Hexcel Corp. | 82,800 | 4,747,752 | ||||||
Raytheon Co. | 39,517 | 6,059,932 | ||||||
| $ | 16,054,677 | |||||||
| Air Freight & Logistics — 1.2% | ||||||||
FedEx Corp. | 38,121 | $ | 6,150,061 | |||||
| $ | 6,150,061 | |||||||
| Banks — 5.9% | ||||||||
Bank of America Corp. | 556,940 | $ | 13,723,002 | |||||
JPMorgan Chase & Co. | 109,220 | 10,662,056 | ||||||
PNC Financial Services Group, Inc. (The) | 52,940 | 6,189,215 | ||||||
| $ | 30,574,273 | |||||||
| Beverages — 2.0% | ||||||||
PepsiCo, Inc. | 93,300 | $ | 10,307,784 | |||||
| $ | 10,307,784 | |||||||
| Biotechnology— 2.2% | ||||||||
Celgene Corp.(1) | 49,355 | $ | 3,163,162 | |||||
Gilead Sciences, Inc. | 72,933 | 4,561,959 | ||||||
Vertex Pharmaceuticals, Inc.(1) | 23,052 | 3,819,947 | ||||||
| $ | 11,545,068 | |||||||
| Chemicals — 1.0% | ||||||||
DowDuPont, Inc. | 96,420 | $ | 5,156,542 | |||||
| $ | 5,156,542 | |||||||
| Commercial Services & Supplies — 2.0% | ||||||||
Waste Management, Inc. | 116,082 | $ | 10,330,137 | |||||
| $ | 10,330,137 | |||||||
| Consumer Finance — 2.9% | ||||||||
Ally Financial, Inc. | 215,907 | $ | 4,892,453 | |||||
American Express Co. | 105,860 | 10,090,575 | ||||||
| $ | 14,983,028 | |||||||
| Containers & Packaging — 1.7% | ||||||||
Ball Corp. | 120,718 | $ | 5,550,614 | |||||
Packaging Corp. of America | 38,697 | 3,229,651 | ||||||
| $ | 8,780,265 | |||||||
| Security | Shares | Value | ||||||
| Diversified Consumer Services— 0.9% | ||||||||
Grand Canyon Education, Inc.(1) | 48,340 | $ | 4,647,408 | |||||
| $ | 4,647,408 | |||||||
| Diversified Telecommunication Services — 2.9% | ||||||||
Verizon Communications, Inc. | 267,863 | $ | 15,059,258 | |||||
| $ | 15,059,258 | |||||||
| Electric Utilities — 1.5% | ||||||||
NextEra Energy, Inc. | 44,696 | $ | 7,769,059 | |||||
| $ | 7,769,059 | |||||||
| Electrical Equipment — 1.1% | ||||||||
AMETEK, Inc. | 81,900 | $ | 5,544,630 | |||||
| $ | 5,544,630 | |||||||
| Energy Equipment & Services — 0.7% | ||||||||
Halliburton Co. | 126,852 | $ | 3,371,726 | |||||
| $ | 3,371,726 | |||||||
| Entertainment — 2.4% | ||||||||
Walt Disney Co. (The) | 113,429 | $ | 12,437,490 | |||||
| $ | 12,437,490 | |||||||
| Equity Real Estate Investment Trusts (REITs) — 3.0% | ||||||||
AvalonBay Communities, Inc. | 35,080 | $ | 6,105,674 | |||||
Simon Property Group, Inc. | 54,900 | 9,222,651 | ||||||
| $ | 15,328,325 | |||||||
| Food & Staples Retailing — 1.5% | ||||||||
Performance Food Group Co.(1) | 239,598 | $ | 7,731,827 | |||||
| $ | 7,731,827 | |||||||
| Food Products — 1.6% | ||||||||
Mondelez International, Inc., Class A | 209,420 | $ | 8,383,083 | |||||
| $ | 8,383,083 | |||||||
| Health Care Equipment & Supplies — 3.5% | ||||||||
Boston Scientific Corp.(1) | 187,520 | $ | 6,626,957 | |||||
Danaher Corp. | 112,466 | 11,597,494 | ||||||
| $ | 18,224,451 | |||||||
| 24 | See Notes to Financial Statements. |
Stock Portfolio
December 31, 2018
Portfolio of Investments — continued
| Security | Shares | Value | ||||||
| Health Care Providers & Services — 3.4% | ||||||||
Anthem, Inc. | 46,060 | $ | 12,096,738 | |||||
WellCare Health Plans, Inc.(1) | 22,600 | 5,335,634 | ||||||
| $ | 17,432,372 | |||||||
| Household Products — 2.1% | ||||||||
Procter & Gamble Co. (The) | 117,100 | $ | 10,763,832 | |||||
| $ | 10,763,832 | |||||||
| Insurance — 3.3% | ||||||||
American Financial Group, Inc. | 75,828 | $ | 6,864,709 | |||||
American International Group, Inc. | 149,440 | 5,889,430 | ||||||
First American Financial Corp. | 100,872 | 4,502,926 | ||||||
| $ | 17,257,065 | |||||||
| Interactive Media & Services — 4.9% | ||||||||
Alphabet, Inc., Class C(1) | 16,729 | $ | 17,324,720 | |||||
Facebook, Inc., Class A(1) | 59,952 | 7,859,107 | ||||||
| $ | 25,183,827 | |||||||
| Internet & Direct Marketing Retail — 3.4% | ||||||||
Amazon.com, Inc.(1) | 8,622 | $ | 12,949,985 | |||||
Booking Holdings, Inc.(1) | 2,700 | 4,650,534 | ||||||
| $ | 17,600,519 | |||||||
| IT Services — 5.5% | ||||||||
Amdocs, Ltd. | 98,942 | $ | 5,796,023 | |||||
Fiserv, Inc.(1) | 119,200 | 8,760,008 | ||||||
GoDaddy, Inc., Class A(1) | 43,339 | 2,843,905 | ||||||
Visa, Inc., Class A | 84,600 | 11,162,124 | ||||||
| $ | 28,562,060 | |||||||
| Life Sciences Tools & Services — 1.6% | ||||||||
Thermo Fisher Scientific, Inc. | 36,900 | $ | 8,257,851 | |||||
| $ | 8,257,851 | |||||||
| Machinery — 1.8% | ||||||||
Gardner Denver Holdings, Inc.(1) | 258,220 | $ | 5,280,599 | |||||
Parker-Hannifin Corp. | 25,520 | 3,806,053 | ||||||
| $ | 9,086,652 | |||||||
| Security | Shares | Value | ||||||
| Multi-Utilities — 2.0% | ||||||||
CMS Energy Corp. | 110,400 | $ | 5,481,360 | |||||
Sempra Energy | 43,742 | 4,732,447 | ||||||
| $ | 10,213,807 | |||||||
| Oil, Gas & Consumable Fuels — 4.6% | ||||||||
ConocoPhillips | 99,886 | $ | 6,227,892 | |||||
Diamondback Energy, Inc. | 25,820 | 2,393,514 | ||||||
Exxon Mobil Corp. | 144,944 | 9,883,731 | ||||||
Phillips 66 | 62,025 | 5,343,454 | ||||||
| $ | 23,848,591 | |||||||
| Pharmaceuticals — 4.8% | ||||||||
Jazz Pharmaceuticals PLC(1) | 35,373 | $ | 4,384,837 | |||||
Johnson & Johnson | 78,304 | 10,105,131 | ||||||
Merck & Co., Inc. | 135,800 | 10,376,478 | ||||||
| $ | 24,866,446 | |||||||
| Semiconductors & Semiconductor Equipment — 3.9% | ||||||||
QUALCOMM, Inc. | 122,622 | $ | 6,978,418 | |||||
Taiwan Semiconductor Manufacturing Co., Ltd. ADR | 133,723 | 4,935,716 | ||||||
Texas Instruments, Inc. | 85,079 | 8,039,965 | ||||||
| $ | 19,954,099 | |||||||
| Software— 6.2% | ||||||||
Adobe, Inc.(1) | 22,878 | $ | 5,175,919 | |||||
Intuit, Inc. | 18,836 | 3,707,867 | ||||||
Microsoft Corp. | 229,820 | 23,342,817 | ||||||
| $ | 32,226,603 | |||||||
| Specialty Retail — 4.0% | ||||||||
Home Depot, Inc. (The) | 63,088 | $ | 10,839,780 | |||||
TJX Cos., Inc. (The) | 153,040 | 6,847,010 | ||||||
Ulta Beauty, Inc.(1) | 12,200 | 2,987,048 | ||||||
| $ | 20,673,838 | |||||||
| Technology Hardware, Storage & Peripherals — 4.3% | ||||||||
Apple, Inc. | 104,297 | $ | 16,451,809 | |||||
HP, Inc. | 276,051 | 5,648,003 | ||||||
| $ | 22,099,812 | |||||||
| 25 | See Notes to Financial Statements. |
Stock Portfolio
December 31, 2018
Portfolio of Investments — continued
| Security | Shares | Value | ||||||
| Textiles, Apparel & Luxury Goods — 1.7% | ||||||||
Gildan Activewear, Inc. | 296,360 | $ | 8,997,490 | |||||
| $ | 8,997,490 | |||||||
| Thrifts & Mortgage Finance — 1.0% | ||||||||
MGIC Investment Corp.(1) | 478,640 | $ | 5,006,574 | |||||
| $ | 5,006,574 | |||||||
Total Common Stocks |
| $ | 514,410,530 | |||||
| Short-Term Investments— 0.0%(2) | ||||||||
| Description | Units | Value | ||||||
Eaton Vance Cash Reserves Fund, LLC, 2.46%(3) | 46,123 | $ | 46,118 | |||||
Total Short-Term Investments |
| $ | 46,118 | |||||
Total Investments — 99.6% |
| $ | 514,456,648 | |||||
Other Assets, Less Liabilities — 0.4% |
| $ | 2,158,575 | |||||
Net Assets — 100.0% |
| $ | 516,615,223 | |||||
The percentage shown for each investment category in the Portfolio of Investments is based on net assets.
| (1) | Non-income producing security. |
| (2) | Amount is less than 0.05%. |
| (3) | Affiliated investment company, available to Eaton Vance portfolios and funds, which invests in high quality, U.S. dollar denominated money market instruments. The rate shown is the annualizedseven-day yield as of December 31, 2018. |
Abbreviations:
| ADR | – | American Depositary Receipt | ||
| 26 | See Notes to Financial Statements. |
Stock Portfolio
December 31, 2018
Statement of Assets and Liabilities
| Assets | December 31, 2018 | |||
Unaffiliated investments, at value (identified cost, $477,913,990) | $ | 514,410,530 | ||
Affiliated investment, at value (identified cost, $46,116) | 46,118 | |||
Foreign currency, at value (identified cost, $16,025) | 15,943 | |||
Dividends receivable | 708,584 | |||
Dividends receivable from affiliated investment | 465 | |||
Receivable for investments sold | 3,323,293 | |||
Tax reclaims receivable | 185,243 | |||
Total assets | $ | 518,690,176 | ||
| Liabilities | ||||
Demand note payable | $ | 1,700,000 | ||
Payable to affiliates: | ||||
Investment adviser fee | 276,173 | |||
Trustees’ fees | 6,813 | |||
Accrued expenses | 91,967 | |||
Total liabilities | $ | 2,074,953 | ||
Net Assets applicable to investors’ interest in Portfolio | $ | 516,615,223 | ||
| 27 | See Notes to Financial Statements. |
Stock Portfolio
December 31, 2018
Statement of Operations
| Investment Income | Year Ended December 31, 2018 | |||
Dividends (net of foreign taxes, $62,566) | $ | 11,066,786 | ||
Dividends from affiliated investment | 44,254 | |||
Total investment income | $ | 11,111,040 | ||
| Expenses | ||||
Investment adviser fee | $ | 3,712,063 | ||
Trustees’ fees and expenses | 25,620 | |||
Custodian fee | 165,493 | |||
Legal and accounting services | 49,618 | |||
Miscellaneous | 29,444 | |||
Total expenses | $ | 3,982,238 | ||
Net investment income | $ | 7,128,802 | ||
| Realized and Unrealized Gain (Loss) | ||||
Net realized gain (loss) — | ||||
Investment transactions | $ | 50,383,798 | (1) | |
Investment transactions — affiliated investment | (304 | ) | ||
Foreign currency transactions | 524 | |||
Net realized gain | $ | 50,384,018 | ||
Change in unrealized appreciation (depreciation) — | ||||
Investments | $ | (84,772,150 | ) | |
Investments — affiliated investment | 407 | |||
Foreign currency | (1,353 | ) | ||
Net change in unrealized appreciation (depreciation) | $ | (84,773,096 | ) | |
Net realized and unrealized loss | $ | (34,389,078 | ) | |
Net decrease in net assets from operations | $ | (27,260,276 | ) | |
| (1) | Includes $2,091,763 of net realized gains from redemptionsin-kind. |
| 28 | See Notes to Financial Statements. |
Stock Portfolio
December 31, 2018
Statements of Changes in Net Assets
| Year Ended December 31, | ||||||||
| Increase (Decrease) in Net Assets | 2018 | 2017 | ||||||
From operations — | ||||||||
Net investment income | $ | 7,128,802 | $ | 8,760,643 | ||||
Net realized gain | 50,384,018 | (1) | 44,411,069 | (2) | ||||
Net change in unrealized appreciation (depreciation) | (84,773,096 | ) | 63,700,885 | |||||
Net increase (decrease) in net assets from operations | $ | (27,260,276 | ) | $ | 116,872,597 | |||
Capital transactions — | ||||||||
Contributions | $ | 19,957,986 | $ | 30,972,679 | ||||
Withdrawals | (123,729,807 | ) | (141,623,853 | ) | ||||
Portfolio transaction fee | 242,333 | 210,734 | ||||||
Net decrease in net assets from capital transactions | $ | (103,529,488 | ) | $ | (110,440,440 | ) | ||
Net increase (decrease) in net assets | $ | (130,789,764 | ) | $ | 6,432,157 | |||
| Net Assets | ||||||||
At beginning of year | $ | 647,404,987 | $ | 640,972,830 | ||||
At end of year | $ | 516,615,223 | $ | 647,404,987 | ||||
| (1) | Includes $2,091,763 of net realized gains from redemptionsin-kind. |
| (2) | Includes $6,288,884 of net realized gains from redemptionsin-kind. |
| 29 | See Notes to Financial Statements. |
Stock Portfolio
December 31, 2018
Financial Highlights
| Year Ended December 31, | ||||||||||||||||||||
| Ratios/Supplemental Data | 2018 | 2017 | 2016 | 2015 | 2014 | |||||||||||||||
Ratios (as a percentage of average daily net assets): | ||||||||||||||||||||
Expenses(1) | 0.64 | % | 0.64 | % | 0.65 | % | 0.70 | % | 0.71 | % | ||||||||||
Net investment income | 1.14 | % | 1.38 | % | 1.60 | % | 1.16 | % | 1.07 | % | ||||||||||
Portfolio Turnover | 90 | % | 101 | % | 118 | % | 96 | % | 109 | % | ||||||||||
Total Return | (5.57 | )% | 20.31 | % | 7.14 | % | 4.88 | % | 12.56 | % | ||||||||||
Net assets, end of year (000’s omitted) | $ | 516,615 | $ | 647,405 | $ | 640,973 | $ | 395,492 | $ | 252,929 | ||||||||||
| (1) | Excludes the effect of custody fee credits, if any, of less than 0.005%. Effective September 1, 2015, custody fee credits, which were earned on cash deposit balances, were discontinued by the custodian. |
| 30 | See Notes to Financial Statements. |
Stock Portfolio
December 31, 2018
Notes to Financial Statements
1 Significant Accounting Policies
Stock Portfolio (the Portfolio) is a Massachusetts business trust registered under the Investment Company Act of 1940, as amended (the 1940 Act), as a diversified,open-end management investment company. The Portfolio’s investment objective is to achieve long-term capital appreciation by investing in a diversified portfolio of equity securities. The Declaration of Trust permits the Trustees to issue interests in the Portfolio. At December 31, 2018, Eaton Vance Stock Fund, Eaton Vance Stock NextShares and Eaton Vance Balanced Fund held an interest of 16.3%, 1.0% and 82.6%, respectively, in the Portfolio.
The following is a summary of significant accounting policies of the Portfolio. The policies are in conformity with accounting principles generally accepted in the United States of America (U.S. GAAP). The Portfolio is an investment company and follows accounting and reporting guidance in the Financial Accounting Standards Board (FASB) Accounting Standards Codification Topic 946.
A Investment Valuation— The following methodologies are used to determine the market value or fair value of investments.
Equity Securities. Equity securities listed on a U.S. securities exchange generally are valued at the last sale or closing price on the day of valuation or, if no sales took place on such date, at the mean between the closing bid and ask prices on the exchange where such securities are principally traded. Equity securities listed on the NASDAQ Global or Global Select Market generally are valued at the NASDAQ official closing price. Unlisted or listed securities for which closing sales prices or closing quotations are not available are valued at the mean between the latest available bid and ask prices.
Foreign Securities and Currencies. Foreign securities and currencies are valued in U.S. dollars, based on foreign currency exchange rate quotations supplied by a third party pricing service. The pricing service uses a proprietary model to determine the exchange rate. Inputs to the model include reported trades and implied bid/ask spreads. The daily valuation of exchange-traded foreign securities generally is determined as of the close of trading on the principal exchange on which such securities trade. Events occurring after the close of trading on foreign exchanges may result in adjustments to the valuation of foreign securities to more accurately reflect their fair value as of the close of regular trading on the New York Stock Exchange. When valuing foreign equity securities that meet certain criteria, the Portfolio’s Trustees have approved the use of a fair value service that values such securities to reflect market trading that occurs after the close of the applicable foreign markets of comparable securities or other instruments that have a strong correlation to the fair-valued securities.
Affiliated Fund. The Portfolio may invest in Eaton Vance Cash Reserves Fund, LLC (Cash Reserves Fund), an affiliated investment company managed by Eaton Vance Management (EVM). While Cash Reserves Fund is not a registered money market mutual fund, it conducts all of its investment activities in accordance with the requirements of Rule2a-7 under the 1940 Act. Investments in Cash Reserves Fund are valued at the closing net asset value per unit on the valuation day. Cash Reserves Fund generally values its investment securities based on available market quotations provided by a third party pricing service.
Fair Valuation. Investments for which valuations or market quotations are not readily available or are deemed unreliable are valued at fair value using methods determined in good faith by or at the direction of the Trustees of the Portfolio in a manner that fairly reflects the security’s value, or the amount that the Portfolio might reasonably expect to receive for the security upon its current sale in the ordinary course. Each such determination is based on a consideration of relevant factors, which are likely to vary from one pricing context to another. These factors may include, but are not limited to, the type of security, the existence of any contractual restrictions on the security’s disposition, the price and extent of public trading in similar securities of the issuer or of comparable companies or entities, quotations or relevant information obtained from broker/dealers or other market participants, information obtained from the issuer, analysts, and/or the appropriate stock exchange (for exchange-traded securities), an analysis of the company’s or entity’s financial condition, and an evaluation of the forces that influence the issuer and the market(s) in which the security is purchased and sold.
B Investment Transactions — Investment transactions for financial statement purposes are accounted for on a trade date basis. Realized gains and losses on investments sold are determined on the basis of identified cost.
C Income — Dividend income is recorded on theex-dividend date for dividends received in cash and/or securities. However, if theex-dividend date has passed, certain dividends from foreign securities are recorded as the Portfolio is informed of theex-dividend date. Withholding taxes on foreign dividends and capital gains have been provided for in accordance with the Portfolio’s understanding of the applicable countries’ tax rules and rates.
D Federal Taxes — The Portfolio has elected to be treated as a partnership for federal tax purposes. No provision is made by the Portfolio for federal or state taxes on any taxable income of the Portfolio because each investor in the Portfolio is ultimately responsible for the payment of any taxes on its share of taxable income. Since at least one of the Portfolio’s investors is a regulated investment company that invests all or substantially all of its assets in the Portfolio, the Portfolio normally must satisfy the applicable source of income and diversification requirements (under the Internal Revenue Code) in order for its investors to satisfy them. The Portfolio will allocate, at least annually among its investors, each investor’s distributive share of the Portfolio’s net investment income, net realized capital gains and losses and any other items of income, gain, loss, deduction or credit.
As of December 31, 2018, the Portfolio had no uncertain tax positions that would require financial statement recognition,de-recognition, or disclosure. The Portfolio files a U.S. federal income tax return annually after its fiscalyear-end, which is subject to examination by the Internal Revenue Service for a period of three years from the date of filing.
E Foreign Currency Translation — Investment valuations, other assets, and liabilities initially expressed in foreign currencies are translated each business day into U.S. dollars based upon current exchange rates. Purchases and sales of foreign investment securities and income and expenses denominated in
| 31 |
Stock Portfolio
December 31, 2018
Notes to Financial Statements — continued
foreign currencies are translated into U.S. dollars based upon currency exchange rates in effect on the respective dates of such transactions. Recognized gains or losses on investment transactions attributable to changes in foreign currency exchange rates are recorded for financial statement purposes as net realized gains and losses on investments. That portion of unrealized gains and losses on investments that results from fluctuations in foreign currency exchange rates is not separately disclosed.
F Use of Estimates — The preparation of the financial statements in conformity with U.S. GAAP requires management to make estimates and assumptions that affect the reported amounts of assets and liabilities at the date of the financial statements and the reported amounts of income and expense during the reporting period. Actual results could differ from those estimates.
G Indemnifications — Under the Portfolio’s organizational documents, its officers and Trustees may be indemnified against certain liabilities and expenses arising out of the performance of their duties to the Portfolio. Under Massachusetts law, if certain conditions prevail, interestholders in the Portfolio could be deemed to have personal liability for the obligations of the Portfolio. However, the Portfolio’s Declaration of Trust contains an express disclaimer of liability on the part of Portfolio interestholders and theBy-laws provide that the Portfolio shall assume the defense on behalf of any Portfolio interestholder. Moreover, theBy-laws also provide for indemnification out of Portfolio property of any interestholder held personally liable solely by reason of being or having been an interestholder for all loss or expense arising from such liability. Additionally, in the normal course of business, the Portfolio enters into agreements with service providers that may contain indemnification clauses. The Portfolio’s maximum exposure under these arrangements is unknown as this would involve future claims that may be made against the Portfolio that have not yet occurred.
H Capital Transactions — To seek to protect the Portfolio (and, indirectly, other investors in the Portfolio) against the costs of accommodating investor inflows and outflows, the Portfolio imposes a fee (“Portfolio transaction fee”) on inflows and outflows by Portfolio investors. The Portfolio transaction fee is sized to cover the estimated cost to the Portfolio of, in connection with issuing interests, converting the cash and/or other instruments it receives to the desired composition and, in connection with redeeming its interests, converting Portfolio holdings to cash and/or other instruments to be distributed. Such fee, which may vary over time, is limited to amounts that have been authorized by the Board of Trustees and determined by EVM to be appropriate. The maximum Portfolio transaction fee is 2% of the amount of net contributions or withdrawals. The Portfolio transaction fee is recorded as a component of capital transactions on the Statements of Changes in Net Assets.
2 Investment Adviser Fee and Other Transactions with Affiliates
The investment adviser fee is earned by Boston Management and Research (BMR), a subsidiary of EVM, as compensation for investment advisory services rendered to the Portfolio. Pursuant to the investment advisory agreement and subsequent fee reduction agreement between the Portfolio and BMR, the fee is computed at an annual rate of 0.60% of the Portfolio’s average daily net assets up to $500 million and 0.575% from $500 million but less than $1 billion, and is payable monthly. On net assets of $1 billion or over, the annual fee is reduced. The fee reduction cannot be terminated or reduced without the approval of a majority vote of the Trustees of the Portfolio who are not interested persons of BMR or the Portfolio and by the vote of a majority of the holders of interest in the Portfolio. For the year ended December 31, 2018, the Portfolio’s investment adviser fee amounted to $3,712,063 or 0.60% of the Portfolio’s average daily net assets. The Portfolio invests its cash in Cash Reserves Fund. EVM does not currently receive a fee for advisory services provided to Cash Reserves Fund.
Trustees and officers of the Portfolio who are members of EVM’s or BMR’s organizations receive remuneration for their services to the Portfolio out of the investment adviser fee. Trustees of the Portfolio who are not affiliated with the investment adviser may elect to defer receipt of all or a percentage of their annual fees in accordance with the terms of the Trustees Deferred Compensation Plan. For the year ended December 31, 2018, no significant amounts have been deferred. Certain officers and Trustees of the Portfolio are officers of the above organizations.
3 Purchases and Sales of Investments
Purchases and sales of investments, other than short-term obligations andin-kind transactions, aggregated $556,647,128 and $643,518,151, respectively, for the year ended December 31, 2018.In-kind contributions and withdrawals for the year ended December 31, 2018 aggregated none and $7,040,735, respectively.
4 Federal Income Tax Basis of Investments
The cost and unrealized appreciation (depreciation) of investments of the Portfolio at December 31, 2018, as determined on a federal income tax basis, were as follows:
Aggregate cost | $ | 478,722,514 | ||
Gross unrealized appreciation | $ | 62,480,555 | ||
Gross unrealized depreciation | (26,746,421 | ) | ||
Net unrealized appreciation | $ | 35,734,134 | ||
| 32 |
Stock Portfolio
December 31, 2018
Notes to Financial Statements — continued
5 Line of Credit
The Portfolio participates with other portfolios and funds managed by EVM and its affiliates in a $625 million unsecured line of credit agreement with a group of banks, which is in effect through October 29, 2019. Borrowings are made by the Portfolio solely to facilitate the handling of unusual and/or unanticipated short-term cash requirements. Interest is charged to the Portfolio based on its borrowings at an amount above either the Eurodollar rate or Federal Funds rate. In addition, a fee computed at an annual rate of 0.15% on the daily unused portion of the line of credit is allocated among the participating portfolios and funds at the end of each quarter. Because the line of credit is not available exclusively to the Portfolio, it may be unable to borrow some or all of its requested amounts at any particular time. At December 31, 2018, the Portfolio had a balance outstanding pursuant to this line of credit of $1,700,000 at an interest rate of 3.40%. Based on the short-term nature of the borrowings under the line of credit and variable interest rate, the carrying value of the borrowings approximated its fair value at December 31, 2018. If measured at fair value, borrowings under the line of credit would have been considered as Level 2 in the fair value hierarchy (see Note 6) at December 31, 2018. The Portfolio’s average borrowings or allocated fees during the year ended December 31, 2018 were not significant.
6 Fair Value Measurements
Under generally accepted accounting principles for fair value measurements, a three-tier hierarchy to prioritize the assumptions, referred to as inputs, is used in valuation techniques to measure fair value. The three-tier hierarchy of inputs is summarized in the three broad levels listed below.
| • | Level 1 – quoted prices in active markets for identical investments |
| • | Level 2 – other significant observable inputs (including quoted prices for similar investments, interest rates, prepayment speeds, credit risk, etc.) |
| • | Level 3 – significant unobservable inputs (including a fund’s own assumptions in determining the fair value of investments) |
In cases where the inputs used to measure fair value fall in different levels of the fair value hierarchy, the level disclosed is determined based on the lowest level input that is significant to the fair value measurement in its entirety. The inputs or methodology used for valuing securities are not necessarily an indication of the risk associated with investing in those securities.
At December 31, 2018, the hierarchy of inputs used in valuing the Portfolio’s investments, which are carried at value, were as follows:
| Asset Description | Level 1 | Level 2 | Level 3 | Total | ||||||||||||
Common Stocks | $ | 514,410,530 | * | $ | — | $ | — | $ | 514,410,530 | |||||||
Short-Term Investments | — | 46,118 | — | 46,118 | ||||||||||||
Total Investments | $ | 514,410,530 | $ | 46,118 | $ | — | $ | 514,456,648 | ||||||||
| * | The level classification by major category of investments is the same as the category presentation in the Portfolio of Investments. |
| 33 |
Stock Portfolio
December 31, 2018
Report of Independent Registered Public Accounting Firm
To the Trustees and Investors of Stock Portfolio:
Opinion on the Financial Statements and Financial Highlights
We have audited the accompanying statement of assets and liabilities of Stock Portfolio (the “Portfolio”), including the portfolio of investments, as of December 31, 2018, the related statement of operations for the year then ended, the statements of changes in net assets for each of the two years in the period then ended, the financial highlights for each of the five years in the period then ended, and the related notes. In our opinion, the financial statements and financial highlights present fairly, in all material respects, the financial position of the Portfolio as of December 31, 2018, and the results of its operations for the year then ended, the changes in its net assets for each of the two years in the period then ended, and the financial highlights for each of the five years in the period then ended, in conformity with accounting principles generally accepted in the United States of America.
Basis for Opinion
These financial statements and financial highlights are the responsibility of the Portfolio’s management. Our responsibility is to express an opinion on the Portfolio’s financial statements and financial highlights based on our audits. We are a public accounting firm registered with the Public Company Accounting Oversight Board (United States) (PCAOB) and are required to be independent with respect to the Portfolio in accordance with the U.S. federal securities laws and the applicable rules and regulations of the Securities and Exchange Commission and the PCAOB.
We conducted our audits in accordance with the standards of the PCAOB. Those standards require that we plan and perform the audit to obtain reasonable assurance about whether the financial statements and financial highlights are free of material misstatement, whether due to error or fraud. The Portfolio is not required to have, nor were we engaged to perform, an audit of its internal control over financial reporting. As part of our audits we are required to obtain an understanding of internal control over financial reporting but not for the purpose of expressing an opinion on the effectiveness of the Portfolio’s internal control over financial reporting. Accordingly, we express no such opinion.
Our audits included performing procedures to assess the risks of material misstatement of the financial statements and financial highlights, whether due to error or fraud, and performing procedures that respond to those risks. Such procedures included examining, on a test basis, evidence regarding the amounts and disclosures in the financial statements and financial highlights. Our audits also included evaluating the accounting principles used and significant estimates made by management, as well as evaluating the overall presentation of the financial statements and financial highlights. Our procedures included confirmation of securities owned as of December 31, 2018, by correspondence with the custodian and brokers; when replies were not received from brokers, we performed other auditing procedures. We believe that our audits provide a reasonable basis for our opinion.
/s/ Deloitte & Touche LLP
Boston, Massachusetts
February 19, 2019
We have served as the auditor of one or more Eaton Vance investment companies since 1959.
| 34 |
Eaton Vance
Balanced Fund
December 31, 2018
Special Meeting of Shareholders (Unaudited)
Eaton Vance Balanced Fund
The Fund held a Special Meeting of Shareholders on September 20, 2018 to elect the five Trustees listed below. The other Trustees named herein continue to serve as Trustees. The results of the vote with respect to the Fund were as follows:
| Number of Shares | ||||||||
| Nominee for Trustee | For | Withheld | ||||||
Mark R. Fetting | 75,494,510 | 582,057 | ||||||
Keith Quinton | 75,506,802 | 569,764 | ||||||
Marcus L. Smith | 75,456,269 | 620,298 | ||||||
Susan J. Sutherland | 75,539,958 | 536,609 | ||||||
Scott E. Wennerholm | 75,510,974 | 565,593 | ||||||
| Results | are rounded to the nearest whole number. |
Each nominee was also elected a Trustee of Stock Portfolio.
Stock Portfolio
The Portfolio held a Special Meeting of Interestholders on September 20, 2018 to elect the five Trustees listed below. The other Trustees named herein continue to serve as Trustees. The results of the vote with respect to the Fund’s interest in the Portfolio were as follows:
| Interest in the Portfolio | ||||||||
| Nominee for Trustee | For | Withheld | ||||||
Mark R. Fetting | 99 | % | 1 | % | ||||
Keith Quinton | 99 | % | 1 | % | ||||
Marcus L. Smith | 99 | % | 1 | % | ||||
Susan J. Sutherland | 99 | % | 1 | % | ||||
Scott E. Wennerholm | 99 | % | 1 | % | ||||
| Results | are rounded to the nearest whole number. |
Eaton Vance Balanced Fund
The Fund held a Special Meeting of Shareholders on September 20, 2018, and adjourned until October 18, 2018, to approve a new investment advisory agreement between Eaton Vance Special Investment Trust, on behalf of Eaton Vance Balanced Fund and Eaton Vance Management. The shareholder meeting results are as follows:
| Number of Shares | ||||||
| For | Against | Abstain(1) | Uninstructed(1) | |||
31,746,107 | 776,836 | 2,196,092 | 12,241,730 | |||
| (1) | Uninstructed shares (i.e., proxies from brokers or nominees indicating that such persons have not received instructions from the beneficial owner or other person entitled to vote shares on a particular matter with respect to which the brokers or nominees do not have discretionary power) were treated as shares that were present at the meeting for purposes of establishing a quorum, but had the effect of a vote against the Proposal. Uninstructed shares are sometimes referred to as broker non-votes. Abstentions were also treated in this manner. |
| Results | are rounded to the nearest whole number. |
| 35 |
Eaton Vance
Balanced Fund
December 31, 2018
Board of Trustees’ Contract Approval
Overview of the Contract Review Process
The Investment Company Act of 1940, as amended (the “1940 Act”), provides, in substance, that for a fund to enter into an investment advisory agreement with an investment adviser, the fund’s board of trustees, including a majority of the trustees who are not “interested persons” of the fund (“Independent Trustees”), must approve the agreement and its terms at anin-person meeting called for the purpose of considering such approval.
At a meeting of the Boards of Trustees (each, a “Board”) of the registered investment companies (the “Eaton Vance Funds”) advised by either Eaton Vance Management (“EVM”) or its affiliate, Boston Management and Research (“BMR” and, together with EVM, “Eaton Vance”), held on June 12 and 13, 2018 (the “Meeting”), the Board, including a majority of the Independent Trustees, voted to approve an investment advisory agreement for Eaton Vance Balanced Fund (the “Fund”), with EVM, including its fee structure (the “New Agreement”). The Board noted that the Fund is currently a feeder fund in afund-of-funds structure that invests in two or more portfolios (each, a “Portfolio”) of the Eaton Vance Funds. The Board further noted that the Fund currently does not have an investment advisory agreement at the Fund level. Rather, the Fund has carried out its investment program by investing all of its assets in two or more Portfolios. The Board noted that, although the Fund currently intends to continue to operate in afund-of-funds structure, the New Agreement will afford EVM with the flexibility to manage all or a portion of the assets of the Fund directly upon shareholder approval of the New Agreement.
Prior to voting its approval of the New Agreement, the Board received information from Eaton Vance that the Board considered reasonably necessary to evaluate the terms of the New Agreement. The Board considered information furnished by Eaton Vance for the Meeting relating specifically to the Fund, as well as information furnished for prior meetings of the Board and its committees, including information provided in connection with the annual contract review process for the Eaton Vance Funds, which culminated at the Board’s April 24 and 25, 2018 meeting (the “2018 Approval Process”). As part of this review, the Board considered information provided by Eaton Vance and its affiliates during the 2018 Approval Process relating to the Board’s approval of each Portfolio’s investment advisory agreement (the “Portfolio Agreements”), including with respect to the services offered and the fee rates charged by Eaton Vance or its affiliates to other types of clients with investment objectives and strategies that are substantially similar to and/or managed in a similar investment style as each Portfolio. In voting to approve the New Agreement, the Board noted that Eaton Vance had indicated that it was not aware of any material changes to the information provided to the Board during the 2018 Approval Process in connection with the approval of the Portfolio Agreements.
With respect to the approval of the New Agreement, the Board specifically noted that the terms of the New Agreement are substantially similar to the terms of the standard forms used by EVM for other Eaton Vance Funds in the Eaton Vance complex. The Board further noted that for the Fund, which currently invests in Core Bond Portfolio and Stock Portfolio, the New Agreement would provide that the fee rates payable thereunder will correspond to the fee rates currently payable to BMR by each respective Portfolio with respect to the type(s) of investments in which that Portfolio primarily invests.
The Board also voted to recommend that shareholders of the Fund approve the New Agreement and authorized the officers of the Fund to call a meeting of shareholders of the Fund to consider and vote on the New Agreement.
Information considered by the Board relating to the New Agreement included, among other things, the following (certain of this information was specifically evaluated by the Board in connection with its review of the Portfolio Agreements):
Information about Fees, Performance and Expenses
| • | A report from an independent data provider comparing the advisory and related fees payable by each Portfolio and the Fund with the fees payable by comparable funds identified by the data provider (“comparable funds”); |
| • | A report from an independent data provider comparing the total expense ratio and its components of each Portfolio with those of comparable funds; |
| • | A report from an independent data provider comparing the investment performance of each Portfolio to the investment performance of comparable funds over various time periods; |
| • | Data comparing the investment performance of each Portfolio and the Fund with the performance of benchmark indices over various time periods; |
| • | Comparative information concerning the fees charged and the services provided by Eaton Vance in managing other accounts (including mutual funds, other collective investment funds and institutional accounts) using investment strategies and techniques similar to those used in managing a Portfolio; |
| • | Profitability analyses for Eaton Vance; |
Information about Portfolio Management and Trading
| • | Descriptions of the investment management services to be provided to the Fund, including the Fund’s investment strategies and policies; |
| • | The procedures and processes used to determine the fair value of fund assets and actions taken to monitor and test the effectiveness of such procedures and processes; |
| • | Information about policies and practices with respect to trading, including processes for monitoring best execution of portfolio transactions; |
| • | Information about the allocation of brokerage transactions and the benefits received by Eaton Vance as a result of brokerage allocation, including information concerning the acquisition of research through client commission arrangements and policies with respect to “soft dollars”; |
| 36 |
Eaton Vance
Balanced Fund
December 31, 2018
Board of Trustees’ Contract Approval — continued
Information about Eaton Vance
| • | Reports detailing the financial results and condition of Eaton Vance; |
| • | Descriptions of the qualifications, education and experience of the individual investment professionals whose responsibilities include portfolio management and investment research for the Fund, and information relating to their responsibilities with respect to managing other mutual funds and, if applicable, investment accounts; |
| • | The Code of Ethics of Eaton Vance, together with information relating to compliance with and the administration; |
| • | Policies and procedures relating to proxy voting and the handling of corporate actions and class actions; |
| • | Information concerning the resources devoted to compliance by Eaton Vance (including descriptions of various compliance programs); |
| • | Descriptions of the business continuity and disaster recovery plans of Eaton Vance and its affiliates; |
Other Relevant Information
| • | Information concerning the nature, cost and character of the administrative and othernon-investment advisory services provided by Eaton Vance and its affiliates; |
| • | Information concerning management of the relationship with the custodian, subcustodians and fund accountants by Eaton Vance and its affiliates; and |
| • | The terms of the New Agreement. |
Results of the Process
Based on its consideration of the foregoing, and such other information as it deemed relevant, including the factors and conclusions described below, the Board concluded that the terms of the New Agreement are in the interests of shareholders of the Fund and, therefore, the Board, including a majority of the Independent Trustees, voted to approve the New Agreement for the Fund.
Nature, Extent and Quality of Services
In considering whether to approve the New Agreement, the Board evaluated the nature, extent and quality of services to be provided to the Fund by EVM.
The Board considered Eaton Vance’s management capabilities and investment process with respect to the types of investments held by the Portfolios, including the education, experience and number of its investment professionals and other personnel who provide portfolio management, investment research, and similar services. In particular, the Board noted that Eaton Vance has devoted extensive resources toin-house equity research and also draws upon independent research available from third-party sources. The Board also noted the abilities and experience of Eaton Vance’s investment professionals in analyzing factors relevant to investing in investment grade fixed income securities. The Board also took into account the resources dedicated to portfolio management and other services, as well as the compensation methods of EVM and other factors, such as the reputation and resources of EVM to recruit and retain highly qualified research, advisory and supervisory investment professionals. In addition, the Board considered the time and attention devoted to the Eaton Vance Funds by senior management, as well as the infrastructure, operational capabilities and support staff in place to assist in the portfolio management and operations of the Fund, including the provision of administrative services. The Board also considered the business-related and other risks to which EVM or its affiliates may be subject in managing the Fund.
The Board considered the compliance programs of EVM and relevant affiliates thereof. Among other matters, the Board considered compliance and reporting matters relating to personal trading by investment professionals, selective disclosure of portfolio holdings, late trading, frequent trading, portfolio valuation, business continuity and the allocation of investment opportunities.
After consideration of the foregoing factors, among others, the Board concluded that the nature, extent and quality of services to be provided by EVM, taken as a whole, will be appropriate and consistent with the terms of the New Agreement.
Performance, Management Fees, Profitability and Economies of Scale
The Board considered the fact that, as part of the 2018 Approval Process, the Board had concluded that (i) the performance of the Fund and each Portfolio was satisfactory, (ii) the management fees were reasonable, (iii) the profits being realized by Eaton Vance and its affiliates were reasonable and (iv) the Fund and each Portfolio shared in any benefits from economies of scale and the structure of the advisory fee of each Portfolio, which includes breakpoints at several asset levels, will allow the Fund and each Portfolio to continue to benefit from any economies of scale. The Board concluded that the appointment of EVM as the investment adviser of the Fund is not expected to adversely affect the performance of the Fund, the reasonableness of the management fees payable to EVM by the Fund, the profits to be realized by EVM and its affiliates in managing the Fund or the extent to which the Fund can be expected to benefit from economies of scale in the future.
| 37 |
Eaton Vance
Balanced Fund
December 31, 2018
Management and Organization
Fund Management. The Trustees of Eaton Vance Special Investment Trust (the Trust), Core Bond Portfolio (CBP) and Stock Portfolio (SP) (the Portfolios) are responsible for the overall management and supervision of the Trust’s and Portfolios’ affairs. The Trustees and officers of the Trust and the Portfolios are listed below. Except as indicated, each individual has held the office shown or other offices in the same company for the last five years. Trustees and officers of the Trust and the Portfolios hold indefinite terms of office. The “noninterested Trustees” consist of those Trustees who are not “interested persons” of the Trust and the Portfolios, as that term is defined under the 1940 Act. The business address of each Trustee and officer is Two International Place, Boston, Massachusetts 02110. As used below, “EVC” refers to Eaton Vance Corp., “EV” refers to Eaton Vance, Inc., “EVM” refers to Eaton Vance Management, “BMR” refers to Boston Management and Research and “EVD” refers to Eaton Vance Distributors, Inc. EVC and EV are the corporate parent and trustee, respectively, of EVM and BMR. EVD is the Fund’s principal underwriter, the Portfolios’ placement agent and a wholly-owned subsidiary of EVC. Each officer affiliated with Eaton Vance may hold a position with other Eaton Vance affiliates that is comparable to his or her position with EVM listed below. Each Trustee oversees 175 portfolios in the Eaton Vance Complex (including all master and feeder funds in a master feeder structure). Each officer serves as an officer of certain other Eaton Vance funds. Each Trustee and officer serves until his or her successor is elected.
| Name and Year of Birth | Position(s) with the Portfolios | Trustee Since(1) | Principal Occupation(s) and Directorships During Past Five Years and Other Relevant Experience | |||
| Interested Trustee | ||||||
Thomas E. Faust Jr. 1958 | Trustee | 2007 | Chairman, Chief Executive Officer and President of EVC, Director and President of EV, Chief Executive Officer and President of EVM and BMR, and Director of EVD. Trustee and/or officer of 175 registered investment companies. Mr. Faust is an interested person because of his positions with EVM, BMR, EVD, EVC and EV, which are affiliates of the Trust and the Portfolios. Directorships in the Last Five Years.(2) Director of EVC and Hexavest Inc. (investment management firm). | |||
| Noninterested Trustees | ||||||
Mark R. Fetting 1954 | Trustee | 2016 | Private investor. Formerly held various positions at Legg Mason, Inc. (investment management firm) (2000-2012), including President, Chief Executive Officer, Director and Chairman (2008-2012), Senior Executive Vice President (2004-2008) and Executive Vice President (2001-2004). Formerly, President of Legg Mason family of funds (2001-2008). Formerly, Division President and Senior Officer of Prudential Financial Group, Inc. and related companies (investment management firm)(1991-2000). Directorships in the Last Five Years. None. | |||
Cynthia E. Frost 1961 | Trustee | 2014 | Private investor. Formerly, Chief Investment Officer of Brown University (university endowment) (2000-2012). Formerly, Portfolio Strategist for Duke Management Company (university endowment manager) (1995-2000). Formerly, Managing Director, Cambridge Associates (investment consulting company) (1989-1995). Formerly, Consultant, Bain and Company (management consulting firm) (1987-1989). Formerly, Senior Equity Analyst, BA Investment Management Company (1983-1985). Directorships in the Last Five Years.None. | |||
George J. Gorman 1952 | Trustee | 2014 | Principal at George J. Gorman LLC (consulting firm). Formerly, Senior Partner at Ernst & Young LLP (a registered public accounting firm) (1974-2009). Directorships in the Last Five Years.Formerly, Trustee of the BofA Funds Series Trust (11 funds) (2011-2014) and of the Ashmore Funds (9 funds) (2010-2014). | |||
Valerie A. Mosley 1960 | Trustee | 2014 | Chairwoman and Chief Executive Officer of Valmo Ventures (a consulting and investment firm). Former Partner and Senior Vice President, Portfolio Manager and Investment Strategist at Wellington Management Company, LLP (investment management firm) (1992-2012). Former Chief Investment Officer, PG Corbin Asset Management (1990-1992). Formerly worked in institutional corporate bond sales at Kidder Peabody (1986-1990). Directorships in the Last Five Years.(2) Director of Envestnet, Inc. (provider of intelligent systems for wealth management and financial wellness) (since 2018). | |||
| 38 |
Eaton Vance
Balanced Fund
December 31, 2018
Management and Organization — continued
| Name and Year of Birth | Position(s) with the Portfolios | Trustee Since(1) | Principal Occupation(s) and Directorships During Past Five Years and Other Relevant Experience | |||
| Noninterested Trustees (continued) | ||||||
William H. Park 1947 | Chairperson of the Board and Trustee | 2016 (Chairperson) 2003 (Trustee) | Private investor. Formerly, Consultant (management and transactional) (2012-2014). Formerly, Chief Financial Officer, Aveon Group L.P. (investment management firm) (2010-2011). Formerly, Vice Chairman, Commercial Industrial Finance Corp. (specialty finance company) (2006-2010). Formerly, President and Chief Executive Officer, Prizm Capital Management, LLC (investment management firm) (2002-2005). Formerly, Executive Vice President and Chief Financial Officer, United Asset Management Corporation (investment management firm) (1982-2001). Formerly, Senior Manager, Price Waterhouse (now PricewaterhouseCoopers) (a registered public accounting firm) (1972-1981). Directorships in the Last Five Years.(2)None. | |||
Helen Frame Peters 1948 | Trustee | 2008 | Professor of Finance, Carroll School of Management, Boston College. Formerly, Dean, Carroll School of Management, Boston College (2000-2002). Formerly, Chief Investment Officer, Fixed Income, Scudder Kemper Investments (investment management firm) (1998-1999). Formerly, Chief Investment Officer, Equity and Fixed Income, Colonial Management Associates (investment management firm) (1991-1998). Directorships in the Last Five Years.(2) None. | |||
Keith Quinton(3) 1958 | Trustee | 2018 | Independent Investment Committee Member at New Hampshire Retirement System (since 2017). Advisory Committee member at Northfield Information Services, Inc. (risk management analytics provider) (since 2016). Formerly, Portfolio Manager and Senior Quantitative Analyst at Fidelity Investments (investment management firm)(2001-2014). Directorships in the Last Five Years. Director of New Hampshire Municipal Bond Bank (since 2016). | |||
Marcus L. Smith(3) 1966 | Trustee | 2018 | Member of Posse Boston Advisory Board (foundation) (since 2015); Trustee at University of Mount Union (since 2008). Formerly, Portfolio Manager at MFS Investment Management (investment management firm) (1994-2017). Directorships in the Last Five Years. Director of MSCI Inc. (global provider of investment decision support tools) (since 2017). Director of DCT Industrial Trust Inc. (logistics real estate company) (since 2017). | |||
Susan J. Sutherland 1957 | Trustee | 2015 | Private investor. Formerly, Associate, Counsel and Partner at Skadden, Arps, Slate, Meagher & Flom LLP (law firm) (1982-2013). Directorships in the Last Five Years.Formerly, Director of Montpelier Re Holdings Ltd. (global provider of customized insurance and reinsurance products) (2013-2015). | |||
Scott E. Wennerholm 1959 | Trustee | 2016 | Formerly, Trustee at Wheelock College (postsecondary institution) (2012-2018). Formerly, Consultant at GF Parish Group (executive recruiting firm) (2016-2017). Formerly, Chief Operating Officer and Executive Vice President at BNY Mellon Asset Management (investment management firm) (2005-2011). Formerly, Chief Operating Officer and Chief Financial Officer at Natixis Global Asset Management (investment management firm) (1997-2004). Formerly, Vice President at Fidelity Investments Institutional Services (investment management firm) (1994-1997). Directorships in the Last Five Years.None. | |||
| Name and Year of Birth | Position(s) and the Portfolios | Officer Since(4) | Principal Occupation(s) During Past Five Years | |||
| Principal Officers who are not Trustees | ||||||
Payson F. Swaffield 1956 | President of the Trust and of CBP | 2003 | Vice President and Chief Income Investment Officer of EVM and BMR. Also Vice President of Calvert Research and Management (“CRM”). | |||
Edward J. Perkin 1972 | President of SP | 2014 | Chief Equity Investment Officer and Vice President of EVM and BMR since 2014. Formerly, Chief Investment Officer, International and Emerging Markets Equity, and Managing Director, Portfolio Manager, Europe, EAFE and Global at Goldman Sachs Asset Management (2002-2014). Also Vice President of CRM. | |||
| 39 |
Eaton Vance
Balanced Fund
December 31, 2018
Management and Organization — continued
| Name and Year of Birth | Position(s) and the Portfolios | Officer Since(4) | Principal Occupation(s) During Past Five Years | |||
| Principal Officers who are not Trustees (continued) | ||||||
Maureen A. Gemma 1960 | Vice President, Secretary and Chief Legal Officer | 2005 | Vice President of EVM and BMR. Also Vice President of CRM. | |||
James F. Kirchner 1967 | Treasurer | 2007 | Vice President of EVM and BMR. Also Vice President of CRM. | |||
Richard F. Froio 1968 | Chief Compliance Officer | 2017 | �� | Vice President of EVM and BMR since 2017. Formerly, Deputy Chief Compliance Officer (Adviser/Funds) and Chief Compliance Officer (Distribution) at PIMCO(2012-2017) and Managing Director at BlackRock/Barclays Global Investors(2009-2012). | ||
| (1) | Year first appointed to serve as Trustee for a fund in the Eaton Vance family of funds. Each Trustee has served continuously since appointment unless indicated otherwise. |
| (2) | During their respective tenures, the Trustees (except for Mmes. Frost and Sutherland and Messrs. Fetting, Gorman, Quinton, Smith and Wennerholm) also served as Board members of one or more of the following funds (which operated in the years noted): eUnitsTM 2 Year U.S. Market Participation Trust: Upside to Cap / Buffered Downside (launched in 2012 and terminated in 2014); and eUnitsTM 2 Year U.S. Market Participation Trust II: Upside to Cap / Buffered Downside (launched in 2012 and terminated in 2014). However, Ms. Mosley did not serve as a Board member of eUnitsTM 2 Year U.S. Market Participation Trust: Upside to Cap / Buffered Downside (launched in 2012 and terminated in 2014). |
| (3) | Messrs. Quinton and Smith began serving as Trustees effective October 1, 2018. |
| (4) | Year first elected to serve as officer of a fund in the Eaton Vance family of funds when the officer has served continuously. Otherwise, year of most recent election as an officer of a fund in the Eaton Vance family of funds. Titles may have changed since initial election. |
The SAI for the Fund includes additional information about the Trustees and officers of the Fund and the Portfolios and can be obtained without charge on Eaton Vance’s website at www.eatonvance.com or by calling1-800-262-1122.
| 40 |
Eaton Vance Funds
IMPORTANT NOTICES
Privacy. The Eaton Vance organization is committed to ensuring your financial privacy. Each of the financial institutions identified below has in effect the following policy (“Privacy Policy”) with respect to nonpublic personal information about its customers:
| • | Only such information received from you, through application forms or otherwise, and information about your Eaton Vance fund transactions will be collected. This may include information such as name, address, social security number, tax status, account balances and transactions. |
| • | None of such information about you (or former customers) will be disclosed to anyone, except as permitted by law (which includes disclosure to employees necessary to service your account). In the normal course of servicing a customer’s account, Eaton Vance may share information with unaffiliated third parties that perform various required services such as transfer agents, custodians and broker-dealers. |
| • | Policies and procedures (including physical, electronic and procedural safeguards) are in place that are designed to protect the confidentiality of such information. |
| • | We reserve the right to change our Privacy Policy at any time upon proper notification to you. Customers may want to review our Privacy Policy periodically for changes by accessing the link on our homepage: www.eatonvance.com. |
Our pledge of privacy applies to the following entities within the Eaton Vance organization: the Eaton Vance Family of Funds, Eaton Vance Management, Eaton Vance Investment Counsel, Eaton Vance Distributors, Inc., Eaton Vance Trust Company, Eaton Vance Management (International) Limited, Eaton Vance Advisers International Ltd., Eaton Vance Management’s Real Estate Investment Group and Boston Management and Research. In addition, our Privacy Policy applies only to those Eaton Vance customers who are individuals and who have a direct relationship with us. If a customer’s account (i.e., fund shares) is held in the name of a third-party financial advisor/broker-dealer, it is likely that only such advisor’s privacy policies apply to the customer. This notice supersedes all previously issued privacy disclosures. For more information about Eaton Vance’s Privacy Policy, please call1-800-262-1122.
Delivery of Shareholder Documents. The Securities and Exchange Commission (SEC) permits funds to deliver only one copy of shareholder documents, including prospectuses, proxy statements and shareholder reports, to fund investors with multiple accounts at the same residential or post office box address. This practice is often called “householding” and it helps eliminate duplicate mailings to shareholders.Eaton Vance, or your financial advisor, may household the mailing of your documents indefinitely unless you instruct Eaton Vance, or your financial advisor, otherwise.If you would prefer that your Eaton Vance documents not be householded, please contact Eaton Vance at1-800-262-1122, or contact your financial advisor. Your instructions that householding not apply to delivery of your Eaton Vance documents will typically be effective within 30 days of receipt by Eaton Vance or your financial advisor.
Portfolio Holdings. Each Eaton Vance Fund and its underlying Portfolio(s) (if applicable) will file a schedule of portfolio holdings on FormN-Q with the SEC for the first and third quarters of each fiscal year. The FormN-Q will be available on the Eaton Vance website at www.eatonvance.com, by calling Eaton Vance at1-800-262-1122 or in the EDGAR database on the SEC’s website at www.sec.gov. FormN-Q may also be reviewed and copied at the SEC’s public reference room in Washington, D.C. (call1-800-732-0330 for information on the operation of the public reference room).
Proxy Voting. From time to time, funds are required to vote proxies related to the securities held by the funds. The Eaton Vance Funds or their underlying Portfolios (if applicable) vote proxies according to a set of policies and procedures approved by the Funds’ and Portfolios’ Boards. You may obtain a description of these policies and procedures and information on how the Funds or Portfolios voted proxies relating to portfolio securities during the most recent12-month period ended June 30, without charge, upon request, by calling1-800-262-1122 and by accessing the SEC’s website at www.sec.gov.
| 41 |
This Page Intentionally Left Blank
This Page Intentionally Left Blank
This Page Intentionally Left Blank
Investment Adviser of Core Bond Portfolio and Stock Portfolio
Boston Management and Research
Two International Place
Boston, MA 02110
Investment Adviser and Administrator of Eaton Vance Balanced Fund
Eaton Vance Management
Two International Place
Boston, MA 02110
Principal Underwriter*
Eaton Vance Distributors, Inc.
Two International Place
Boston, MA 02110
(617)482-8260
Custodian
State Street Bank and Trust Company
State Street Financial Center, One Lincoln Street
Boston, MA 02111
Transfer Agent
BNY Mellon Investment Servicing (US) Inc.
Attn: Eaton Vance Funds
P.O. Box 9653
Providence, RI 02940-9653
(800)262-1122
Independent Registered Public Accounting Firm
Deloitte & Touche LLP
200 Berkeley Street
Boston, MA 02116-5022
Fund Offices
Two International Place
Boston, MA 02110
| * | FINRA BrokerCheck. Investors may check the background of their Investment Professional by contacting the Financial Industry Regulatory Authority (FINRA). FINRA BrokerCheck is a free tool to help investors check the professional background of current and former FINRA-registered securities firms and brokers. FINRA BrokerCheck is available by calling1-800-289-9999 and at www.FINRA.org. The FINRA BrokerCheck brochure describing this program is available to investors at www.FINRA.org. |

162 12.31.18

Eaton Vance
Core Bond Fund
Annual Report
December 31, 2018
Important Note. Beginning on January 1, 2021, as permitted by regulations adopted by the Securities and Exchange Commission, paper copies of the Fund’s annual and semi-annual shareholder reports will no longer be sent by mail unless you specifically request paper copies of the reports. Instead, the reports will be made available on the Fund’s website (eatonvance.com/funddocuments), and you will be notified by mail each time a report is posted and provided with a website address to access the report.
If you already elected to receive shareholder reports electronically, you will not be affected by this change and you need not take any action. If you are a direct investor, you may elect to receive shareholder reports and other communications from the Fund electronically by signing up for e-Delivery at eatonvance.com/edelivery. If you own your shares through a financial intermediary (such as a broker-dealer or bank), you must contact your financial intermediary to sign up.
You may elect to receive all future Fund shareholder reports in paper free of charge. If you are a direct investor, you can inform the Fund that you wish to continue receiving paper copies of your shareholder reports by calling 1-800-262-1122. If you own these shares through a financial intermediary, you must contact your financial intermediary or follow instructions included with this disclosure, if applicable, to elect to continue to receive paper copies of your shareholder reports. Your election to receive reports in paper will apply to all Eaton Vance funds held directly or to all funds held through your financial intermediary, as applicable.

Commodity Futures Trading Commission Registration. Effective December 31, 2012, the Commodity Futures Trading Commission (“CFTC”) adopted certain regulatory changes that subject registered investment companies and advisers to regulation by the CFTC if a fund invests more than a prescribed level of its assets in certain CFTC-regulated instruments (including futures, certain options and swap agreements) or markets itself as providing investment exposure to such instruments. The Fund has claimed an exclusion from the definition of the term “commodity pool operator” under the Commodity Exchange Act. Accordingly, neither the Fund nor the adviser with respect to the operation of the Fund is subject to CFTC regulation. Because of its management of other strategies, the Fund’s adviser is registered with the CFTC as a commodity pool operator and a commodity trading advisor.
Fund shares are not insured by the FDIC and are not deposits or other obligations of, or guaranteed by, any depository institution. Shares are subject to investment risks, including possible loss of principal invested.
This report must be preceded or accompanied by a current summary prospectus or prospectus. Before investing, investors should consider carefully the investment objective, risks, and charges and expenses of a mutual fund. This and other important information is contained in the summary prospectus and prospectus, which can be obtained from a financial advisor. Prospective investors should read the prospectus carefully before investing. For further information, please call 1-800-262-1122.
Annual Report December 31, 2018
Eaton Vance
Core Bond Fund
Table of Contents
Management’s Discussion of Fund Performance | 2 | |||
Performance | 3 | |||
Fund Profile | 4 | |||
Endnotes and Additional Disclosures | 5 | |||
Fund Expenses | 6 | |||
Financial Statements | 7 | |||
Report of Independent Registered Public Accounting Firm | 15 and 34 | |||
Federal Tax Information | 16 | |||
Special Meeting of Shareholders | 35 | |||
Management and Organization | 36 | |||
Important Notices | 39 | |||
Eaton Vance
Core Bond Fund
December 31, 2018
Management’s Discussion of Fund Performance1
Economic and Market Conditions
A strong U.S. economy and rising interest rates throughout much of the year gave way to mounting political tensions in the fourth quarter, triggering uncertainties over the sustainability of the domestic expansion. For the12-month period ended December 31, 2018, U.S. fixed-income markets, depending on the segment of the market, eked out meager positive or negative returns.
U.S. investment-grade, fixed-income securities marginally advanced during the period, with the Bloomberg Barclays U.S. Aggregate Bond Index2 returning 0.01%. Hurt by growing volatility late in the period, higher-risk assets retreated, with the ICE BofAML U.S. High Yield Index returning –2.26%. The10-year U.S. Treasury bond yield closed at 2.69%, up from 2.40% at the outset of the period.
Boosted by U.S. tax reform, corporate earnings accelerated alongside the overall U.S. economy during the first three quarters of the year. Growth in the nation’s gross domestic product reached an annualized rate of 4.2% before falling back to 3.5% later in the period. The U.S. unemployment rate reached a17-year low, while inflation remained near the U.S. Federal Reserve (the Fed) target rate of 2%. To counter this strength and the prospect of future inflation, the Fed raised interest rates four times during the period.
In the fourth quarter, slowing U.S. and global economic growth, central bank tightening, and falling oil prices drove down the appeal of higher-risk investment markets. As liquidity tightened, investors became more sensitive to geopolitical issues — mainly the U.S.-China trade conflict — which motivated some to sell riskier assets.
In December 2018, the Fed raised the federal funds rate to 2.5%, the highest level since January 2008. However, signs that U.S. growth may be slowing led to significant repricing of the market in anticipation of fewer future rate hikes. Late in the period, the Fed trimmed its 2019 projections from three to two potential rate hikes.
Toward the end of the period, U.S. Treasury yields moved lower and the yield curve6 continued to flatten, feeding fears of a future recession. Investor worries regarding highly leveraged corporations with proportionately large debt on their balance sheets — making them potentially vulnerable
to a possible market downturn — created additional headwinds for the investment-grade credit market. The spreads of investment-grade and high-yield securities — the differences between the yields of these securities and those of U.S. Treasurys with comparable maturities — widened significantly, while there were large retail outflows from the floating-rate loan market during the period.
Fund Performance
For the12-month period ended December 31, 2018, Eaton Vance Core Bond Fund (the Fund) returned –0.64% for Class A shares at net asset value (NAV), underperforming its benchmark, the Bloomberg Barclays U.S. Aggregate Bond Index (the Index), which returned 0.01%.
The Fund’s sector positioning was the largest detractor from performance relative to the Index during the period. Overweight allocations to investment-grade corporate bonds andout-of-Index allocations to bank loans and collateralized loan obligations also detracted. However, overweight allocations to high-yield corporate bonds andasset-backed securities contributed to performance relative to the Index during the period.
The Fund’s yield curve positioning also weighed on returns relative to the Index. The Fund’s slightly shorter-than-Index duration contributed to returns relative to the Index as interest rates rose during the period, with selective exposures to investment-grade corporate bonds and securitized assets. Duration is a measure of the expected change in the price of a bond — in percentage terms — given aone-percent change in interest rates, all else being constant. Securities with lower durations tend to be less sensitive to interest rate changes.
Overall, security selections were beneficial for the Fund’s performance relative to the Index. Selections were particularly strong among investment-grade corporate bonds, commercialmortgage-backed securities,asset-backed securities, andmortgage-backed securities. Selections among high-yield corporate bonds detracted.
See Endnotes and Additional Disclosures in this report.
Past performance is no guarantee of future results. Returns are historical and are calculated by determining the percentage change in net asset value (NAV) or offering price (as applicable) with all distributions reinvested. Investment return and principal value will fluctuate so that shares, when redeemed, may be worth more or less than their original cost. Performance less than or equal to one year is cumulative. Performance is for the stated time period only; due to market volatility, the Fund’s current performance may be lower or higher than quoted. Returns are before taxes unless otherwise noted. For performance as of the most recent month-end, please refer to eatonvance.com.
| 2 |
Eaton Vance
Core Bond Fund
December 31, 2018
Performance2,3
Portfolio ManagersVishal Khanduja, CFA and Brian S. Ellis, CFA
% Average Annual Total Returns | Class Inception Date | Performance Inception Date | One Year | Five Years | Ten Years | |||||||||||||||
Class A at NAV | 01/05/2009 | 03/07/2000 | –0.64 | % | 2.12 | % | 3.37 | % | ||||||||||||
Class A with 4.75% Maximum Sales Charge | — | — | –5.35 | 1.13 | 2.87 | |||||||||||||||
Class I at NAV | 03/21/2007 | 03/07/2000 | –0.50 | 2.37 | 3.61 | |||||||||||||||
Bloomberg Barclays U.S. Aggregate Bond Index | — | — | 0.01 | % | 2.52 | % | 3.48 | % | ||||||||||||
| % Total Annual Operating Expense Ratios4 | Class A | Class I | ||||||||||||||||||
Gross | 0.86 | % | 0.61 | % | ||||||||||||||||
Net | 0.74 | 0.49 | ||||||||||||||||||
Growth of $10,000
This graph shows the change in value of a hypothetical investment of $10,000 in Class A of the Fund for the period indicated. For comparison, the same investment is shown in the indicated index.
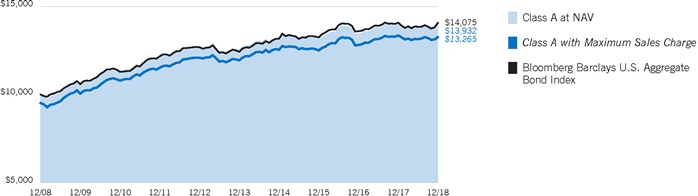
| Growth of Investment | Amount Invested | Period Beginning | At NAV | With Maximum Sales Charge | ||||||||||||
Class I | $ | 250,000 | 12/31/2008 | $ | 356,484 | N.A. | ||||||||||
See Endnotes and Additional Disclosures in this report.
Past performance is no guarantee of future results. Returns are historical and are calculated by determining the percentage change in net asset value (NAV) or offering price (as applicable) with all distributions reinvested. Investment return and principal value will fluctuate so that shares, when redeemed, may be worth more or less than their original cost. Performance less than or equal to one year is cumulative. Performance is for the stated time period only; due to market volatility, the Fund’s current performance may be lower or higher than quoted. Returns are before taxes unless otherwise noted. For performance as of the most recentmonth-end, please refer to eatonvance.com.
| 3 |
Eaton Vance
Core Bond Fund
December 31, 2018
Fund Profile5
Asset Allocation (% of total investments)
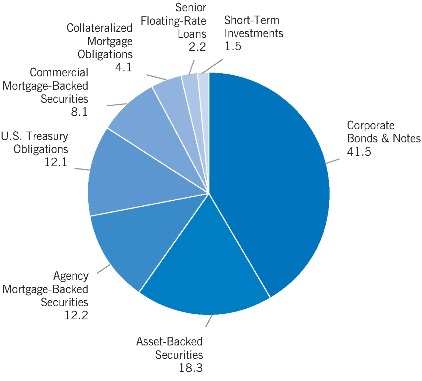
See Endnotes and Additional Disclosures in this report.
| 4 |
Eaton Vance
Core Bond Fund
December 31, 2018
Endnotes and Additional Disclosures
| 1 | The views expressed in this report are those of the portfolio manager(s) and are current only through the date stated at the top of this page. These views are subject to change at any time based upon market or other conditions, and Eaton Vance and the Fund(s) disclaim any responsibility to update such views. These views may not be relied upon as investment advice and, because investment decisions are based on many factors, may not be relied upon as an indication of trading intent on behalf of any Eaton Vance fund. This commentary may contain statements that are not historical facts, referred to as “forward looking statements.” The Fund’s actual future results may differ significantly from those stated in any forward looking statement, depending on factors such as changes in securities or financial markets or general economic conditions, the volume of sales and purchases of Fund shares, the continuation of investment advisory, administrative and service contracts, and other risks discussed from time to time in the Fund’s filings with the Securities and Exchange Commission. |
| 2 | Bloomberg Barclays U.S. Aggregate Bond Index is an unmanaged index of domestic investment-grade bonds, including corporate, government andmortgage-backed securities. ICE BofAML U.S. High Yield Index is an unmanaged index of below-investment grade U.S. corporate bonds. ICE® BofAML® indices are not for redistribution or other uses; provided “as is”, without warranties, and with no liability. Eaton Vance has prepared this report and ICE Data Indices, LLC does not endorse it, or guarantee, review, or endorse Eaton Vance’s products. BofAML® is a licensed registered trademark of Bank of America Corporation in the United States and other countries. Unless otherwise stated, index returns do not reflect the effect of any applicable sales charges, commissions, expenses, taxes or leverage, as applicable. It is not possible to invest directly in an index. |
| 3 | Total Returns at NAV do not include applicable sales charges. If sales charges were deducted, the returns would be lower. Total Returns shown with maximum sales charge reflect the stated maximum sales charge. Unless otherwise stated, performance does not reflect the deduction of taxes on Fund distributions or redemptions of Fund shares. |
Performance prior to the inception date of a class may be linked to the performance of an older class of the Fund. This linked performance is adjusted for any applicable sales charge, but is not adjusted for class expense differences. If adjusted for such differences, the performance would be different. The performance of Class A is linked to Class I. Performance since inception for an index, if presented, is the performance since the Fund’s or oldest share class’ inception, as applicable. Performance presented in the Financial Highlights included in the financial statements is not linked. |
| 4 | Source: Fund prospectus. Net expense ratios reflect a contractual expense reimbursement that continues through 4/30/19. Without the reimbursement, performance would have been lower. The expense ratios for the current reporting period can be found in the Financial Highlights section of this report. |
| 5 | Fund invests in an affiliated investment company (Portfolio) with the same objective(s) and policies as the Fund. References to investments are to the Portfolio’s holdings. |
| 6 | Yield curve is a graphical representation of the yields offered by bonds of various maturities. The yield curve flattens when long-term rates fall and/orshort-term rates increase, and the yield curve steepens when long-term rates increase and/orshort-term rates fall. |
Fund profile subject to change due to active management. |
| 5 |
Eaton Vance
Core Bond Fund
December 31, 2018
Fund Expenses
Example: As a Fund shareholder, you incur two types of costs: (1) transaction costs, including sales charges (loads) on purchases and redemption fees (if applicable); and (2) ongoing costs, including management fees; distribution and/or service fees; and other Fund expenses. This Example is intended to help you understand your ongoing costs (in dollars) of Fund investing and to compare these costs with the ongoing costs of investing in other mutual funds. The Example is based on an investment of $1,000 invested at the beginning of the period and held for the entire period (July 1, 2018 – December 31, 2018).
Actual Expenses: The first section of the table below provides information about actual account values and actual expenses. You may use the information in this section, together with the amount you invested, to estimate the expenses that you paid over the period. Simply divide your account value by $1,000 (for example, an $8,600 account value divided by $1,000 = 8.6), then multiply the result by the number in the first section under the heading entitled “Expenses Paid During Period” to estimate the expenses you paid on your account during this period.
Hypothetical Example for Comparison Purposes: The second section of the table below provides information about hypothetical account values and hypothetical expenses based on the actual Fund expense ratio and an assumed rate of return of 5% per year (before expenses), which is not the actual Fund return. The hypothetical account values and expenses may not be used to estimate the actual ending account balance or expenses you paid for the period. You may use this information to compare the ongoing costs of investing in your Fund and other funds. To do so, compare this 5% hypothetical example with the 5% hypothetical examples that appear in the shareholder reports of the other funds.
Please note that the expenses shown in the table are meant to highlight your ongoing costs only and do not reflect any transactional costs, such as sales charges (loads) or redemption fees (if applicable). Therefore, the second section of the table is useful in comparing ongoing costs only, and will not help you determine the relative total costs of owning different funds. In addition, if these transactional costs were included, your costs would be higher.
Beginning Account Value | Ending Account Value (12/31/18) | Expenses Paid During Period* (7/1/18 – 12/31/18) | Annualized Expense | |||||||||||||
Actual | ||||||||||||||||
Class A | $ | 1,000.00 | $ | 1,009.10 | $ | 3.75 | ** | 0.74 | % | |||||||
Class I | $ | 1,000.00 | $ | 1,009.40 | $ | 2.48 | ** | 0.49 | % | |||||||
Hypothetical | ||||||||||||||||
(5% return per year before expenses) | ||||||||||||||||
Class A | $ | 1,000.00 | $ | 1,021.50 | $ | 3.77 | ** | 0.74 | % | |||||||
Class I | $ | 1,000.00 | $ | 1,022.70 | $ | 2.50 | ** | 0.49 | % | |||||||
| * | Expenses are equal to the Fund’s annualized expense ratio for the indicated Class, multiplied by the average account value over the period, multiplied by 184/365 (to reflect the one-half year period). The Example assumes that the $1,000 was invested at the net asset value per share determined at the close of business on June 30, 2018. The Example reflects the expenses of both the Fund and the Portfolio. |
| ** | Absent an allocation of certain expenses to an affiliate, expenses would be higher. |
| 6 |
Eaton Vance
Core Bond Fund
December 31, 2018
Statement of Assets and Liabilities
| Assets | December 31, 2018 | |||
Investment in Core Bond Portfolio, at value (identified cost, $175,517,617) | $ | 173,855,308 | ||
Receivable for Fund shares sold | 929,548 | |||
Receivable from affiliate | 24,748 | |||
Total assets | $ | 174,809,604 | ||
| Liabilities |
| |||
Payable for Fund shares redeemed | $ | 367,605 | ||
Distributions payable | 3,889 | |||
Payable to affiliates: |
| |||
Distribution and service fees | 5,384 | |||
Trustees’ fees | 125 | |||
Accrued expenses | 55,426 | |||
Total liabilities | $ | 432,429 | ||
Net Assets | $ | 174,377,175 | ||
| Sources of Net Assets |
| |||
Paid-in capital | $ | 180,774,518 | ||
Accumulated loss | (6,397,343 | ) | ||
Total | $ | 174,377,175 | ||
| Class A Shares |
| |||
Net Assets | $ | 25,157,604 | ||
Shares Outstanding | 2,651,754 | |||
Net Asset Value and Redemption Price Per Share |
| |||
(net assets ÷ shares of beneficial interest outstanding) | $ | 9.49 | ||
Maximum Offering Price Per Share |
| |||
(100 ÷ 95.25 of net asset value per share) | $ | 9.96 | ||
| Class I Shares |
| |||
Net Assets | $ | 149,219,571 | ||
Shares Outstanding | 15,750,568 | |||
Net Asset Value, Offering Price and Redemption Price Per Share |
| |||
(net assets ÷ shares of beneficial interest outstanding) | $ | 9.47 | ||
On sales of $50,000 or more, the offering price of Class A shares is reduced.
| 7 | See Notes to Financial Statements. |
Eaton Vance
Core Bond Fund
December 31, 2018
Statement of Operations
| Investment Income | Year Ended December 31, 2018 | |||
Interest allocated from Portfolio (net of foreign taxes, $2,720) | $ | 5,904,547 | ||
Dividends allocated from Portfolio | 59,105 | |||
Expenses allocated from Portfolio | (842,918 | ) | ||
Total investment income from Portfolio | $ | 5,120,734 | ||
| Expenses | ||||
Distribution and service fees | ||||
Class A | $ | 80,363 | ||
Trustees’ fees and expenses | 500 | |||
Custodian fee | 24,124 | |||
Transfer and dividend disbursing agent fees | 57,624 | |||
Legal and accounting services | 30,341 | |||
Printing and postage | 24,470 | |||
Registration fees | 36,197 | |||
Miscellaneous | 9,541 | |||
Total expenses | $ | 263,160 | ||
Deduct — | ||||
Allocation of expenses to affiliate | $ | 182,438 | ||
Total expense reductions | $ | 182,438 | ||
Net expenses | $ | 80,722 | ||
Net investment income | $ | 5,040,012 | ||
| Realized and Unrealized Gain (Loss) from Portfolio | ||||
Net realized gain (loss) — | ||||
Investment transactions | $ | (1,839,522 | ) | |
Financial futures contracts | (640,439 | ) | ||
Net realized loss | $ | (2,479,961 | ) | |
Change in unrealized appreciation (depreciation) — | ||||
Investments | $ | (3,872,350 | ) | |
Financial futures contracts | 662,909 | |||
Net change in unrealized appreciation (depreciation) | $ | (3,209,441 | ) | |
Net realized and unrealized loss | $ | (5,689,402 | ) | |
Net decrease in net assets from operations | $ | (649,390 | ) | |
| 8 | See Notes to Financial Statements. |
Eaton Vance
Core Bond Fund
December 31, 2018
Statements of Changes in Net Assets
| Year Ended December 31, | ||||||||
| Increase (Decrease) in Net Assets | 2018 | 2017 | ||||||
From operations — | ||||||||
Net investment income | $ | 5,040,012 | $ | 3,543,205 | ||||
Net realized gain (loss) | (2,479,961 | ) | 1,125,154 | |||||
Net change in unrealized appreciation (depreciation) | (3,209,441 | ) | 1,644,766 | |||||
Net increase (decrease) in net assets from operations | $ | (649,390 | ) | $ | 6,313,125 | |||
Distributions to shareholders(1)— | ||||||||
Class A | $ | (955,400 | ) | $ | (883,483 | ) | ||
Class I | (4,523,043 | ) | (3,208,600 | ) | ||||
Total distributions to shareholders | $ | (5,478,443 | ) | $ | (4,092,083 | ) | ||
Transactions in shares of beneficial interest — |
| |||||||
Proceeds from sale of shares |
| |||||||
Class A | $ | 17,879,570 | $ | 8,477,454 | ||||
Class I | 59,409,118 | 49,997,896 | ||||||
Net asset value of shares issued to shareholders in payment of distributions declared |
| |||||||
Class A | 919,296 | 850,896 | ||||||
Class I | 4,324,343 | 1,279,199 | ||||||
Cost of shares redeemed |
| |||||||
Class A | (26,440,216 | ) | (13,068,932 | ) | ||||
Class I | (40,364,801 | ) | (37,564,549 | ) | ||||
Net increase in net assets from Fund share transactions | $ | 15,727,310 | $ | 9,971,964 | ||||
Net increase in net assets | $ | 9,599,477 | $ | 12,193,006 | ||||
| Net Assets | ||||||||
At beginning of year | $ | 164,777,698 | $ | 152,584,692 | ||||
At end of year | $ | 174,377,175 | $ | 164,777,698 | (2) | |||
| (1) | For the year ended December 31, 2017, the source of distributions was from net investment income. The current year presentation of distributions conforms with the Disclosure Update and Simplification Rule issued by the Securities and Exchange Commission, effective November 5, 2018. |
| (2) | Includes accumulated distributions in excess of net investment income of $(6,368) at December 31, 2017. The requirement to disclose the corresponding amount as of December 31, 2018 was eliminated. |
| 9 | See Notes to Financial Statements. |
Eaton Vance
Core Bond Fund
December 31, 2018
Financial Highlights
| Class A | ||||||||||||||||||||
| Year Ended December 31, | ||||||||||||||||||||
| 2018 | 2017 | 2016 | 2015 | 2014 | ||||||||||||||||
Net asset value — Beginning of year | $ | 9.840 | $ | 9.690 | $ | 9.690 | $ | 9.980 | $ | 9.800 | ||||||||||
| Income (Loss) From Operations | ||||||||||||||||||||
Net investment income(1) | $ | 0.273 | $ | 0.217 | $ | 0.168 | $ | 0.173 | $ | 0.226 | ||||||||||
Net realized and unrealized gain (loss) | (0.338 | ) | 0.187 | 0.075 | (0.201 | ) | 0.260 | |||||||||||||
Total income (loss) from operations | $ | (0.065 | ) | $ | 0.404 | $ | 0.243 | $ | (0.028 | ) | $ | 0.486 | ||||||||
| Less Distributions | ||||||||||||||||||||
From net investment income | $ | (0.285 | ) | $ | (0.254 | ) | $ | (0.243 | ) | $ | (0.258 | ) | $ | (0.306 | ) | |||||
From net realized gain | — | — | — | (0.004 | ) | — | ||||||||||||||
Total distributions | $ | (0.285 | ) | $ | (0.254 | ) | $ | (0.243 | ) | $ | (0.262 | ) | $ | (0.306 | ) | |||||
Net asset value — End of year | $ | 9.490 | $ | 9.840 | $ | 9.690 | $ | 9.690 | $ | 9.980 | ||||||||||
Total Return(2)(3) | (0.64 | )% | 4.20 | % | 2.48 | % | (0.31 | )% | 5.00 | % | ||||||||||
| Ratios/Supplemental Data | ||||||||||||||||||||
Net assets, end of year (000’s omitted) | $ | 25,158 | $ | 34,064 | $ | 37,290 | $ | 34,501 | $ | 25,821 | ||||||||||
Ratios (as a percentage of average daily net assets):(4) | ||||||||||||||||||||
Expenses(3)(5) | 0.74 | % | 0.75 | % | 0.75 | % | 0.75 | % | 0.75 | % | ||||||||||
Net investment income | 2.85 | % | 2.21 | % | 1.69 | % | 1.75 | % | 2.27 | % | ||||||||||
Portfolio Turnover of the Portfolio | 65 | % | 123 | % | 132 | % | 159 | % | 134 | % | ||||||||||
| (1) | Computed using average shares outstanding. |
| (2) | Returns are historical and are calculated by determining the percentage change in net asset value with all distributions reinvested and do not reflect the effect of sales charges. |
| (3) | The investment adviser of the Portfolio and/or the administrator reimbursed certain operating expenses (equal to 0.11%, 0.11%, 0.11%, 0.21% and 0.24% of average daily net assets for the years ended December 31, 2018, 2017, 2016, 2015 and 2014, respectively). Absent this reimbursement, total return would be lower. |
| (4) | Includes the Fund’s share of the Portfolio’s allocated expenses. |
| (5) | Excludes the effect of custody fee credits, if any, of less than 0.005%. Effective September 1, 2015, custody fee credits, which were earned on cash deposit balances, were discontinued by the custodian. |
| 10 | See Notes to Financial Statements. |
Eaton Vance
Core Bond Fund
December 31, 2018
Financial Highlights — continued
| Class I | ||||||||||||||||||||
| Year Ended December 31, | ||||||||||||||||||||
| 2018 | 2017 | 2016 | 2015 | 2014 | ||||||||||||||||
Net asset value — Beginning of year | $ | 9.830 | $ | 9.680 | $ | 9.680 | $ | 9.960 | $ | 9.780 | ||||||||||
| Income (Loss) From Operations | ||||||||||||||||||||
Net investment income(1) | $ | 0.282 | $ | 0.241 | $ | 0.193 | $ | 0.199 | $ | 0.249 | ||||||||||
Net realized and unrealized gain (loss) | (0.333 | ) | 0.187 | 0.074 | (0.193 | ) | 0.261 | |||||||||||||
Total income (loss) from operations | $ | (0.051 | ) | $ | 0.428 | $ | 0.267 | $ | 0.006 | $ | 0.510 | |||||||||
| Less Distributions | ||||||||||||||||||||
From net investment income | $ | (0.309 | ) | $ | (0.278 | ) | $ | (0.267 | ) | $ | (0.282 | ) | $ | (0.330 | ) | |||||
From net realized gain | — | — | — | (0.004 | ) | — | ||||||||||||||
Total distributions | $ | (0.309 | ) | $ | (0.278 | ) | $ | (0.267 | ) | $ | (0.286 | ) | $ | (0.330 | ) | |||||
Net asset value — End of year | $ | 9.470 | $ | 9.830 | $ | 9.680 | $ | 9.680 | $ | 9.960 | ||||||||||
Total Return(2)(3) | (0.50 | )% | 4.47 | % | 2.73 | % | 0.04 | % | 5.27 | % | ||||||||||
| Ratios/Supplemental Data | ||||||||||||||||||||
Net assets, end of year (000’s omitted) | $ | 149,220 | $ | 130,714 | $ | 115,294 | $ | 55,607 | $ | 40,753 | ||||||||||
Ratios (as a percentage of average daily net assets):(4) | ||||||||||||||||||||
Expenses(3)(5) | 0.49 | % | 0.50 | % | 0.50 | % | 0.50 | % | 0.50 | % | ||||||||||
Net investment income | 2.95 | % | 2.46 | % | 1.95 | % | 2.01 | % | 2.50 | % | ||||||||||
Portfolio Turnover of the Portfolio | 65 | % | 123 | % | 132 | % | 159 | % | 134 | % | ||||||||||
| (1) | Computed using average shares outstanding. |
| (2) | Returns are historical and are calculated by determining the percentage change in net asset value with all distributions reinvested. |
| (3) | The investment adviser of the Portfolio and/or the administrator reimbursed certain operating expenses (equal to 0.11%, 0.11%, 0.11%, 0.21% and 0.24% of average daily net assets for the years ended December 31, 2018, 2017, 2016, 2015 and 2014, respectively). Absent this reimbursement, total return would be lower. |
| (4) | Includes the Fund’s share of the Portfolio’s allocated expenses. |
| (5) | Excludes the effect of custody fee credits, if any, of less than 0.005%. Effective September 1, 2015, custody fee credits, which were earned on cash deposit balances, were discontinued by the custodian. |
| 11 | See Notes to Financial Statements. |
Eaton Vance
Core Bond Fund
December 31, 2018
Notes to Financial Statements
1 Significant Accounting Policies
Eaton Vance Core Bond Fund (the Fund) is a diversified series of Eaton Vance Special Investment Trust (the Trust). The Trust is a Massachusetts business trust registered under the Investment Company Act of 1940, as amended (the 1940 Act), as an open-end management investment company. The Fund offers two classes of shares. Class A shares are generally sold subject to a sales charge imposed at time of purchase. Class I shares are sold at net asset value and are not subject to a sales charge. Each class represents a pro-rata interest in the Fund, but votes separately on class-specific matters and (as noted below) is subject to different expenses. Realized and unrealized gains and losses are allocated daily to each class of shares based on the relative net assets of each class to the total net assets of the Fund. Net investment income, other than class-specific expenses, is allocated daily to each class of shares based upon the ratio of the value of each class’s paid shares to the total value of all paid shares. Each class of shares differs in its distribution plan and certain other class-specific expenses. The Fund invests all of its investable assets in interests in Core Bond Portfolio (the Portfolio), a Massachusetts business trust, having the same investment objective and policies as the Fund. The value of the Fund’s investment in the Portfolio reflects the Fund’s proportionate interest in the net assets of the Portfolio (34.4% at December 31, 2018). The performance of the Fund is directly affected by the performance of the Portfolio. The financial statements of the Portfolio, including the portfolio of investments, are included elsewhere in this report and should be read in conjunction with the Fund’s financial statements.
The following is a summary of significant accounting policies of the Fund. The policies are in conformity with accounting principles generally accepted in the United States of America (U.S. GAAP). The Fund is an investment company and follows accounting and reporting guidance in the Financial Accounting Standards Board (FASB) Accounting Standards Codification Topic 946.
A Investment Valuation — Valuation of securities by the Portfolio is discussed in Note 1A of the Portfolio’s Notes to Financial Statements, which are included elsewhere in this report.
B Income — The Fund’s net investment income or loss consists of the Fund’s pro-rata share of the net investment income or loss of the Portfolio, less all actual and accrued expenses of the Fund.
C Federal Taxes — The Fund’s policy is to comply with the provisions of the Internal Revenue Code applicable to regulated investment companies and to distribute to shareholders each year substantially all of its net investment income, and all or substantially all of its net realized capital gains. Accordingly, no provision for federal income or excise tax is necessary.
As of December 31, 2018, the Fund had no uncertain tax positions that would require financial statement recognition, de-recognition, or disclosure. The Fund files a U.S. federal income tax return annually after its fiscal year-end, which is subject to examination by the Internal Revenue Service for a period of three years from the date of filing.
D Expenses — The majority of expenses of the Trust are directly identifiable to an individual fund. Expenses which are not readily identifiable to a specific fund are allocated taking into consideration, among other things, the nature and type of expense and the relative size of the funds.
E Use of Estimates — The preparation of the financial statements in conformity with U.S. GAAP requires management to make estimates and assumptions that affect the reported amounts of assets and liabilities at the date of the financial statements and the reported amounts of income and expense during the reporting period. Actual results could differ from those estimates.
F Indemnifications — Under the Trust’s organizational documents, its officers and Trustees may be indemnified against certain liabilities and expenses arising out of the performance of their duties to the Fund. Under Massachusetts law, if certain conditions prevail, shareholders of a Massachusetts business trust (such as the Trust) could be deemed to have personal liability for the obligations of the Trust. However, the Trust’s Declaration of Trust contains an express disclaimer of liability on the part of Fund shareholders and the By-laws provide that the Trust shall assume the defense on behalf of any Fund shareholders. Moreover, the By-laws also provide for indemnification out of Fund property of any shareholder held personally liable solely by reason of being or having been a shareholder for all loss or expense arising from such liability. Additionally, in the normal course of business, the Fund enters into agreements with service providers that may contain indemnification clauses. The Fund’s maximum exposure under these arrangements is unknown as this would involve future claims that may be made against the Fund that have not yet occurred.
G Other — Investment transactions are accounted for on a trade date basis.
2 Distributions to Shareholders and Income Tax Information
The Fund declares dividends daily to shareholders of record at the time of declaration. Distributions are generally paid monthly. Distributions of realized capital gains are made at least annually. Distributions are declared separately for each class of shares. Shareholders may reinvest income and capital gain distributions in additional shares of the same class of the Fund at the net asset value as of the reinvestment date or, at the election of the shareholder, receive distributions in cash. Distributions to shareholders are determined in accordance with income tax regulations, which may differ from U.S. GAAP. As required by U.S. GAAP, only distributions in excess of tax basis earnings and profits are reported in the financial statements as a return of capital. Permanent differences between book and tax accounting relating to distributions are reclassified to paid-in capital. For tax purposes, distributions from short-term capital gains are considered to be from ordinary income.
| 12 |
Eaton Vance
Core Bond Fund
December 31, 2018
Notes to Financial Statements — continued
The tax character of distributions declared for the years ended December 31, 2018 and December 31, 2017 was as follows:
| Year Ended December 31, | ||||||||
| 2018 | 2017 | |||||||
Ordinary income | $ | 5,478,443 | $ | 4,092,083 | ||||
As of December 31, 2018, the components of distributable earnings (accumulated loss) on a tax basis were as follows:
Undistributed ordinary income | $ | 828 | ||
Deferred capital losses | $ | (2,212,112 | ) | |
Net unrealized depreciation | $ | (4,182,170 | ) | |
Distributions payable | $ | (3,889 | ) | |
At December 31, 2018, the Fund, for federal income tax purposes, had deferred capital losses of $2,212,112 which would reduce its taxable income arising from future net realized gains on investment transactions, if any, to the extent permitted by the Internal Revenue Code, and thus would reduce the amount of distributions to shareholders, which would otherwise be necessary to relieve the Fund of any liability for federal income or excise tax. The deferred capital losses are treated as arising on the first day of the Fund’s next taxable year and retain the same short-term or long-term character as when originally deferred. Of the deferred capital losses at December 31, 2018, $1,193,622 are short-term and $1,018,490 are long-term.
3 Transactions with Affiliates
Eaton Vance Management (EVM) serves as the administrator of the Fund, but receives no compensation. The Portfolio has engaged Boston Management and Research (BMR), a subsidiary of EVM, to render investment advisory services. See Note 2 of the Portfolio’s Notes to Financial Statements which are included elsewhere in this report. EVM has agreed to reimburse the Fund’s expenses to the extent that total annual operating expenses (relating to ordinary operating expenses only) exceed 0.74% and 0.49% of the Fund’s average daily net assets for Class A and Class I, respectively. This agreement may be changed or terminated after April 30, 2019. Pursuant to this agreement, EVM was allocated $182,438 of the Fund’s operating expenses for the year ended December 31, 2018.
EVM provides sub-transfer agency and related services to the Fund pursuant to a Sub-Transfer Agency Support Services Agreement. For the year ended December 31, 2018, EVM earned $4,410 from the Fund pursuant to such agreement, which is included in transfer and dividend disbursing agent fees on the Statement of Operations. The Fund was informed that Eaton Vance Distributors, Inc. (EVD), an affiliate of EVM and the Fund’s principal underwriter, received $4,232 as its portion of the sales charge on sales of Class A shares for the year ended December 31, 2018. EVD also received distribution and service fees from Class A shares (see Note 4).
Trustees and officers of the Fund who are members of EVM’s or BMR’s organizations receive remuneration for their services to the Fund out of the investment adviser fee. Certain officers and Trustees of the Fund and the Portfolio are officers of the above organizations.
4 Distribution Plan
The Fund has in effect a distribution plan for Class A shares (Class A Plan) pursuant to Rule 12b-1 under the 1940 Act. Pursuant to the Class A Plan, the Fund pays EVD a distribution and service fee of 0.25% per annum of its average daily net assets attributable to Class A shares for distribution services and facilities provided to the Fund by EVD, as well as for personal services and/or the maintenance of shareholder accounts. Distribution and service fees paid or accrued to EVD for the year ended December 31, 2018 amounted to $80,363 for Class A shares.
Distribution and service fees are subject to the limitations contained in the Financial Industry Regulatory Authority Rule 2341(d).
5 Contingent Deferred Sales Charges
Class A shares may be subject to a 1% contingent deferred sales charge (CDSC) if redeemed within 18 months of purchase (depending on the circumstances of purchase). Generally, the CDSC is based upon the lower of the net asset value at date of redemption or date of purchase. No charge is levied on shares acquired by reinvestment of dividends or capital gain distributions. For the year ended December 31, 2018, the Fund was informed that EVD received no CDSCs paid by Class A shareholders.
| 13 |
Eaton Vance
Core Bond Fund
December 31, 2018
Notes to Financial Statements — continued
6 Investment Transactions
For the year ended December 31, 2018, increases and decreases in the Fund’s investment in the Portfolio aggregated $41,104,806 and $31,270,076, respectively.
7 Shares of Beneficial Interest
The Fund’s Declaration of Trust permits the Trustees to issue an unlimited number of full and fractional shares of beneficial interest (without par value). Such shares may be issued in a number of different series (such as the Fund) and classes. Transactions in Fund shares were as follows:
| Year Ended December 31, | ||||||||
| Class A | 2018 | 2017 | ||||||
Sales | 1,867,429 | 865,250 | ||||||
Issued to shareholders electing to receive payments of distributions in Fund shares | 96,166 | 86,763 | ||||||
Redemptions | (2,774,477 | ) | (1,339,027 | ) | ||||
Net decrease | (810,882 | ) | (387,014 | ) | ||||
| Year Ended December 31, | ||||||||
| Class I | 2018 | 2017 | ||||||
Sales | 6,221,419 | 5,107,950 | ||||||
Issued to shareholders electing to receive payments of distributions in Fund shares | 453,570 | 130,382 | ||||||
Redemptions | (4,226,204 | ) | (3,852,006 | ) | ||||
Net increase | 2,448,785 | 1,386,326 | ||||||
At December 31, 2018, donor advised and pooled income funds (established and maintained by a public charity) managed by EVM and an Eaton Vance collective investment trust owned in the aggregate 56.9% of the value of the outstanding shares of the Fund.
| 14 |
Eaton Vance
Core Bond Fund
December 31, 2018
Report of Independent Registered Public Accounting Firm
To the Trustees of Eaton Vance Special Investment Trust and Shareholders of Eaton Vance Core Bond Fund:
Opinion on the Financial Statements and Financial Highlights
We have audited the accompanying statement of assets and liabilities of Eaton Vance Core Bond Fund (the “Fund”) (one of the funds constituting Eaton Vance Special Investment Trust), as of December 31, 2018, the related statement of operations for the year then ended, the statements of changes in net assets for each of the two years in the period then ended, the financial highlights for each of the five years in the period then ended, and the related notes. In our opinion, the financial statements and financial highlights present fairly, in all material respects, the financial position of the Fund as of December 31, 2018, and the results of its operations for the year then ended, the changes in its net assets for each of the two years in the period then ended, and the financial highlights for each of the five years in the period then ended, in conformity with accounting principles generally accepted in the United States of America.
Basis for Opinion
These financial statements and financial highlights are the responsibility of the Fund’s management. Our responsibility is to express an opinion on the Fund’s financial statements and financial highlights based on our audits. We are a public accounting firm registered with the Public Company Accounting Oversight Board (United States) (PCAOB) and are required to be independent with respect to the Fund in accordance with the U.S. federal securities laws and the applicable rules and regulations of the Securities and Exchange Commission and the PCAOB.
We conducted our audits in accordance with the standards of the PCAOB. Those standards require that we plan and perform the audit to obtain reasonable assurance about whether the financial statements and financial highlights are free of material misstatement, whether due to error or fraud. The Fund is not required to have, nor were we engaged to perform, an audit of its internal control over financial reporting. As part of our audits we are required to obtain an understanding of internal control over financial reporting but not for the purpose of expressing an opinion on the effectiveness of the Fund’s internal control over financial reporting. Accordingly, we express no such opinion.
Our audits included performing procedures to assess the risks of material misstatement of the financial statements and financial highlights, whether due to error or fraud, and performing procedures that respond to those risks. Such procedures included examining, on a test basis, evidence regarding the amounts and disclosures in the financial statements and financial highlights. Our audits also included evaluating the accounting principles used and significant estimates made by management, as well as evaluating the overall presentation of the financial statements and financial highlights. We believe that our audits provide a reasonable basis for our opinion.
/s/ Deloitte & Touche LLP
Boston, Massachusetts
February 22, 2019
We have served as the auditor of one or more Eaton Vance investment companies since 1959.
| 15 |
Eaton Vance
Core Bond Fund
December 31, 2018
Federal Tax Information (Unaudited)
The Form 1099-DIV you received in February 2019 showed the tax status of all distributions paid to your account in calendar year 2018. Shareholders are advised to consult their own tax adviser with respect to the tax consequences of their investment in the Fund.
| 16 |
Core Bond Portfolio
December 31, 2018
Portfolio of Investments
| Corporate Bonds & Notes — 41.2% |
| |||||||
| Security | Principal Amount (000’s omitted) | Value | ||||||
| Aerospace & Defense — 0.3% | ||||||||
Azul Investments LLP, 5.875%, 10/26/24(1) | $ | 625 | $ | 585,944 | ||||
WestJet Airlines, Ltd., 3.50%, 6/16/21(1) | 985 | 976,958 | ||||||
| $ | 1,562,902 | |||||||
| Automotive — 1.9% | ||||||||
Ford Motor Credit Co., LLC, 2.979%, 8/3/22 | $ | 2,503 | $ | 2,310,818 | ||||
Ford Motor Credit Co., LLC, 3.218%, (3 mo. USD LIBOR + 0.81%), 4/5/21(2) | 705 | 687,137 | ||||||
Ford Motor Credit Co., LLC, 3.305%, (3 mo. USD LIBOR + 0.88%), 10/12/21(2) | 1,566 | 1,503,420 | ||||||
General Motors Co., 4.20%, 10/1/27 | 2,383 | 2,152,868 | ||||||
General Motors Financial Co., Inc., 3.258%, (3 mo. USD LIBOR + 0.85%), 4/9/21(2) | 805 | 786,933 | ||||||
General Motors Financial Co., Inc., 3.398%, (3 mo. USD LIBOR + 0.99%), 1/5/23(2) | 1,110 | 1,053,583 | ||||||
General Motors Financial Co., Inc., 3.50%, 11/7/24 | 1,149 | 1,046,930 | ||||||
| $ | 9,541,689 | |||||||
| Banks — 16.1% | ||||||||
American Express Co., 3.625%, 12/5/24 | $ | 1,162 | $ | 1,137,350 | ||||
ANZ New Zealand International, Ltd., 2.20%, 7/17/20(1) | 1,084 | 1,065,844 | ||||||
Banco Safra SA/Cayman Islands, 4.125%, 2/8/23(1) | 2,425 | 2,349,219 | ||||||
Banco Santander SA, 3.125%, 2/23/23 | 1,645 | 1,556,655 | ||||||
Bank of America Corp., 2.857%, (3 mo. USD LIBOR + 0.38%), 1/23/22(2) | 2,707 | 2,654,068 | ||||||
Bank of America Corp., 2.881% to 4/24/22, 4/24/23(3) | 1,425 | 1,386,529 | ||||||
Bank of America Corp., 3.124% to 1/20/22, 1/20/23(3) | 2,420 | 2,380,196 | ||||||
Bank of America Corp., 3.30%, 1/11/23 | 1,237 | 1,218,884 | ||||||
Bank of America Corp., 3.499% to 5/17/21, 5/17/22(3) | 1,005 | 1,005,454 | ||||||
Bank of America Corp., 3.541%, (3 mo. USD LIBOR + 0.79%), 3/5/24(2) | 2,400 | 2,333,488 | ||||||
Bank of America Corp., 3.593% to 7/21/27, 7/21/28(3) | 4,880 | 4,635,457 | ||||||
Bank of Montreal, 3.803% to 12/15/27, | 721 | 668,547 | ||||||
Barclays PLC, 4.836%, 5/9/28 | 1,480 | 1,358,728 | ||||||
Capital One Bank (USA), N.A., 3.375%, 2/15/23 | 892 | 862,055 | ||||||
Capital One Financial Corp., 2.50%, 5/12/20 | 485 | 478,813 | ||||||
Capital One Financial Corp., 3.24%, (3 mo. USD LIBOR + 0.72%), 1/30/23(2) | 2,300 | 2,238,655 | ||||||
Capital One Financial Corp., 3.30%, 10/30/24 | 3,227 | 3,055,669 | ||||||
Capital One Financial Corp., 3.75%, 4/24/24 | 700 | 683,479 | ||||||
Capital One, N.A., 2.65%, 8/8/22 | 1,780 | 1,710,703 | ||||||
Citigroup, Inc., 3.142% to 1/24/22, 1/24/23(3) | 1,552 | 1,525,487 | ||||||
Citigroup, Inc., 3.646%, (3 mo. USD LIBOR + 1.25%), 7/1/26(2) | 1,700 | 1,661,715 | ||||||
Citigroup, Inc., 3.668% to 7/24/27, 7/24/28(3) | 3,400 | 3,217,202 | ||||||
| Security | Principal Amount (000’s omitted) | Value | ||||||
| Banks (continued) | ||||||||
Citigroup, Inc., 3.70%, 1/12/26 | $ | 1,000 | $ | 963,391 | ||||
Citigroup, Inc., 3.887% to 1/10/27, 1/10/28(3) | 909 | 875,268 | ||||||
Citigroup, Inc., 4.075% to 4/23/28, 4/23/29(3) | 3,709 | 3,623,909 | ||||||
Citigroup, Inc., 4.50%, 1/14/22 | 725 | 741,248 | ||||||
Citizens Financial Group, Inc., 4.30%, 12/3/25 | 1,399 | 1,382,736 | ||||||
Commonwealth Bank of Australia, 2.50%, 9/18/22(1) | 1,050 | 1,014,640 | ||||||
Deutsche Bank AG, 3.766%, (3 mo. USD LIBOR + 1.29%), 2/4/21(2) | 2,450 | 2,383,459 | ||||||
Discover Bank, 3.20%, 8/9/21 | 950 | 940,673 | ||||||
Discover Bank, 4.682% to 8/9/23, 8/9/28(3) | 1,200 | 1,175,820 | ||||||
Discover Financial Services, 3.95%, 11/6/24 | 490 | 484,068 | ||||||
Fifth Third Bancorp, 4.30%, 1/16/24 | 1,131 | 1,145,056 | ||||||
Goldman Sachs Group, Inc. (The), 2.905% to 7/24/22, 7/24/23(3) | 1,909 | 1,819,627 | ||||||
Goldman Sachs Group, Inc. (The), 3.691% to 6/5/27, 6/5/28(3) | 916 | 852,684 | ||||||
Goldman Sachs Group, Inc. (The), 3.75%, 2/25/26 | 970 | 919,135 | ||||||
Goldman Sachs Group, Inc. (The), 3.786%, (3 mo. USD LIBOR + 1.17%), 5/15/26(2) | 1,226 | 1,177,800 | ||||||
Goldman Sachs Group, Inc. (The), 3.85%, 1/26/27 | 1,510 | 1,422,587 | ||||||
Goldman Sachs Group, Inc. (The), 5.75%, 1/24/22 | 1,151 | 1,205,592 | ||||||
JPMorgan Chase & Co., 2.70%, 5/18/23 | 1,988 | 1,910,585 | ||||||
JPMorgan Chase & Co., 3.782% to 2/1/27, 2/1/28(3) | 1,000 | 972,244 | ||||||
JPMorgan Chase & Co., 3.797% to 7/23/23, 7/23/24(3) | 1,500 | 1,503,550 | ||||||
JPMorgan Chase & Co., 5.00% to 7/1/19(3)(4) | 1,700 | 1,642,625 | ||||||
JPMorgan Chase & Co., 5.625%, 8/16/43 | 628 | 693,590 | ||||||
Lazard Group, LLC, 4.50%, 9/19/28 | 1,467 | 1,471,038 | ||||||
Morgan Stanley, 3.591% to 7/22/27, 7/22/28(3) | 4,750 | 4,494,306 | ||||||
Morgan Stanley, 3.772% to 1/24/28, 1/24/29(3) | 2,042 | 1,957,108 | ||||||
Morgan Stanley, 4.00%, 7/23/25 | 2,220 | 2,192,995 | ||||||
Morgan Stanley, 4.875%, 11/1/22 | 1,132 | 1,167,470 | ||||||
PPTT, 2006-A GS, Class A, 5.865%(1)(4)(5) | 259 | 194,239 | ||||||
Regions Financial Corp., 2.75%, 8/14/22 | 640 | 617,952 | ||||||
Santander Holdings USA, Inc., 4.50%, 7/17/25 | 712 | 706,253 | ||||||
Synovus Financial Corp., 3.125%, 11/1/22 | 622 | 587,784 | ||||||
| $ | 81,423,629 | |||||||
| Beverages — 0.1% | ||||||||
Anheuser-Busch InBev Finance, Inc., 4.90%, 2/1/46(1) | $ | 730 | $ | 679,326 | ||||
| $ | 679,326 | |||||||
| Building Materials — 0.3% | ||||||||
Owens Corning, 3.40%, 8/15/26 | $ | 1,300 | $ | 1,189,713 | ||||
Vulcan Materials Co., 4.50%, 6/15/47 | 479 | 408,384 | ||||||
| $ | 1,598,097 | |||||||
| 17 | See Notes to Financial Statements. |
Core Bond Portfolio
December 31, 2018
Portfolio of Investments — continued
| Security | Principal Amount (000’s omitted) | Value | ||||||
| Chemicals — 1.3% | ||||||||
Cydsa SAB de CV, 6.25%, 10/4/27(1) | $ | 1,490 | $ | 1,346,588 | ||||
DowDuPont, Inc., 3.766%, 11/15/20 | 1,500 | 1,514,755 | ||||||
DowDuPont, Inc., 4.725%, 11/15/28 | 2,500 | 2,597,801 | ||||||
Mosaic Co. (The), 3.25%, 11/15/22 | 1,311 | 1,281,238 | ||||||
| $ | 6,740,382 | |||||||
| Commercial Services — 0.3% | ||||||||
Block Financial, LLC, 5.25%, 10/1/25 | $ | 870 | $ | 882,649 | ||||
Ecolab, Inc., 3.95%, 12/1/47 | 883 | 832,076 | ||||||
| $ | 1,714,725 | |||||||
| Computers — 1.5% | ||||||||
Dell International, LLC/EMC Corp., 4.42%, 6/15/21(1) | $ | 2,350 | $ | 2,348,933 | ||||
DXC Technology Co., 2.875%, 3/27/20 | 800 | 793,221 | ||||||
DXC Technology Co., 3.688%, (3 mo. USD LIBOR + 0.95%), 3/1/21(2) | 1,923 | 1,921,457 | ||||||
Hewlett Packard Enterprise Co., 3.059%, (3 mo. USD LIBOR + 0.72%), 10/5/21(2) | 1,079 | 1,070,030 | ||||||
Microchip Technology, Inc., 4.333%, 6/1/23(1) | 1,664 | 1,624,601 | ||||||
| $ | 7,758,242 | |||||||
| Diversified Financial Services — 3.1% | ||||||||
Air Lease Corp., 3.375%, 6/1/21 | $ | 1,200 | $ | 1,189,187 | ||||
Ally Financial, Inc., 3.50%, 1/27/19 | 1,180 | 1,179,853 | ||||||
Ally Financial, Inc., 4.125%, 3/30/20 | 1,160 | 1,150,674 | ||||||
Banco BTG Pactual SA/Cayman Islands, 5.50%, 1/31/23(1) | 540 | 525,687 | ||||||
Brookfield Finance, Inc., 3.90%, 1/25/28 | 1,943 | 1,838,737 | ||||||
Jefferies Group, LLC/Jefferies Group Capital Finance, Inc., 4.15%, 1/23/30 | 2,336 | 2,008,761 | ||||||
Neuberger Berman Group, LLC/Neuberger Berman Finance Corp., 4.50%, 3/15/27(1) | 432 | 432,580 | ||||||
Neuberger Berman Group, LLC/Neuberger Berman Finance Corp., 4.875%, 4/15/45(1) | 510 | 456,797 | ||||||
Synchrony Financial, 3.812%, (3 mo. USD LIBOR + 1.23%), 2/3/20(2) | 3,465 | 3,462,931 | ||||||
Synchrony Financial, 3.95%, 12/1/27 | 2,635 | 2,224,676 | ||||||
UBS Group Funding Switzerland AG, 3.491%, 5/23/23(1) | 1,450 | 1,414,853 | ||||||
| $ | 15,884,736 | |||||||
| Electric Utilities — 0.3% | ||||||||
Entergy Corp., 4.00%, 7/15/22 | $ | 1,046 | $ | 1,055,960 | ||||
ITC Holdings Corp., 4.05%, 7/1/23 | 680 | 691,721 | ||||||
| $ | 1,747,681 | |||||||
| Security | Principal Amount (000’s omitted) | Value | ||||||
| Electrical and Electronic Equipment — 1.1% | ||||||||
Jabil, Inc., 3.95%, 1/12/28 | $ | 1,108 | $ | 989,710 | ||||
Jabil, Inc., 4.70%, 9/15/22 | 920 | 913,100 | ||||||
NXP B.V./NXP Funding, LLC, 4.625%, 6/1/23(1) | 2,165 | 2,127,112 | ||||||
NXP B.V./NXP Funding, LLC, 4.875%, 3/1/24(1) | 1,153 | 1,159,503 | ||||||
NXP B.V./NXP Funding, LLC, 5.35%, 3/1/26(1) | 591 | 601,786 | ||||||
| $ | 5,791,211 | |||||||
| Foods — 0.7% | ||||||||
ESAL GmbH, 6.25%, 2/5/23(1) | $ | 400 | $ | 398,000 | ||||
Kraft Heinz Foods Co., 3.375%, 6/15/21 | 297 | 296,446 | ||||||
Smithfield Foods, Inc., 2.65%, 10/3/21(1) | 1,304 | 1,246,672 | ||||||
Smithfield Foods, Inc., 3.35%, 2/1/22(1) | 1,482 | 1,418,230 | ||||||
| $ | 3,359,348 | |||||||
| Health Services — 0.3% | ||||||||
MEDNAX, Inc., 5.25%, 12/1/23(1) | $ | 1,420 | $ | 1,395,150 | ||||
| $ | 1,395,150 | |||||||
| Healthcare Products — 0.3% | ||||||||
Becton Dickinson and Co., 3.678%, (3 mo. USD LIBOR + 0.88%), 12/29/20(2) | $ | 1,754 | $ | 1,736,867 | ||||
| $ | 1,736,867 | |||||||
| Home Construction — 0.5% | ||||||||
Lennar Corp., 4.125%, 1/15/22 | $ | 313 | $ | 301,654 | ||||
Lennar Corp., 4.50%, 11/15/19 | 1,150 | 1,144,250 | ||||||
Toll Brothers Finance Corp., 4.875%, 3/15/27 | 940 | 855,400 | ||||||
| $ | 2,301,304 | |||||||
| Home Furnishings — 0.2% | ||||||||
Whirlpool Corp., 4.50%, 6/1/46 | $ | 914 | $ | 768,798 | ||||
| $ | 768,798 | |||||||
| Insurance — 0.1% | ||||||||
Principal Financial Group, Inc., 4.30%, 11/15/46 | $ | 534 | $ | 493,929 | ||||
| $ | 493,929 | |||||||
| Internet Software & Services — 0.2% | ||||||||
Symantec Corp., 5.00%, 4/15/25(1) | $ | 916 | $ | 856,975 | ||||
| $ | 856,975 | |||||||
| 18 | See Notes to Financial Statements. |
Core Bond Portfolio
December 31, 2018
Portfolio of Investments — continued
| Security | Principal Amount (000’s omitted) | Value | ||||||
| Lodging and Gaming — 0.2% | ||||||||
MGM Resorts International, 4.625%, 9/1/26 | $ | 900 | $ | 812,250 | ||||
| $ | 812,250 | |||||||
| Machinery — 0.1% | ||||||||
Wabtec Corp., 3.838%, (3 mo. USD LIBOR + 1.05%), 9/15/21(2) | $ | 431 | $ | 429,578 | ||||
| $ | 429,578 | |||||||
| Media — 0.8% | ||||||||
Comcast Corp., 2.848%, (3 mo. USD LIBOR + 0.44%), 10/1/21(2) | $ | 1,960 | $ | 1,942,165 | ||||
Comcast Corp., 3.70%, 4/15/24 | 1,257 | 1,265,476 | ||||||
Comcast Corp., 4.70%, 10/15/48 | 613 | 625,211 | ||||||
| $ | 3,832,852 | |||||||
| Mining — 0.4% | ||||||||
Freeport-McMoRan, Inc., 5.40%, 11/14/34 | $ | 900 | $ | 713,250 | ||||
Yamana Gold, Inc., 4.625%, 12/15/27 | 1,285 | 1,191,776 | ||||||
| $ | 1,905,026 | |||||||
| Oil and Gas — 1.7% | ||||||||
AmeriGas Partners, L.P./AmeriGas Finance Corp., 5.75%, 5/20/27 | $ | 1,465 | $ | 1,303,850 | ||||
Ecopetrol SA, 5.875%, 9/18/23 | 1,400 | 1,463,000 | ||||||
Nabors Industries, Inc., 4.625%, 9/15/21 | 983 | 886,324 | ||||||
Noble Energy, Inc., 3.90%, 11/15/24 | 937 | 908,756 | ||||||
Oceaneering International, Inc., 4.65%, 11/15/24 | 1,035 | 820,423 | ||||||
Patterson-UTI Energy, Inc., 3.95%, 2/1/28 | 1,830 | 1,682,212 | ||||||
Pioneer Natural Resources Co., 4.45%, 1/15/26 | 1,400 | 1,418,266 | ||||||
| $ | 8,482,831 | |||||||
| Packaging & Containers — 0.2% | ||||||||
Owens-Brockway Glass Container, Inc., 5.875%, 8/15/23(1) | $ | 835 | $ | 840,219 | ||||
| $ | 840,219 | |||||||
| Pharmaceuticals — 1.8% | ||||||||
Celgene Corp., 3.55%, 8/15/22 | $ | 1,041 | $ | 1,030,379 | ||||
CVS Health Corp., 3.70%, 3/9/23 | 2,769 | 2,741,830 | ||||||
CVS Health Corp., 4.10%, 3/25/25 | 998 | 990,588 | ||||||
CVS Health Corp., 4.30%, 3/25/28 | 2,393 | 2,347,608 | ||||||
Teva Pharmaceutical Finance Netherlands III BV, 1.70%, 7/19/19 | 1,757 | 1,734,140 | ||||||
| $ | 8,844,545 | |||||||
| Security | Principal Amount (000’s omitted) | Value | ||||||
| Pipelines — 0.5% | ||||||||
Gulfstream Natural Gas, 4.60%, 9/15/25(1) | $ | 431 | $ | 445,338 | ||||
Sabine Pass Liquefaction, LLC, 5.00%, 3/15/27 | 750 | 753,355 | ||||||
Sabine Pass Liquefaction, LLC, 5.625%, 3/1/25 | 880 | 915,348 | ||||||
Sunoco Logistics Partners Operations, L.P., 4.40%, 4/1/21 | 582 | 588,743 | ||||||
| $ | 2,702,784 | |||||||
| Real Estate Investment Trusts (REITs) — 1.5% | ||||||||
CBL & Associates, L.P., 5.25%, 12/1/23 | $ | 1,000 | $ | 795,000 | ||||
DDR Corp., 3.625%, 2/1/25 | 874 | 836,012 | ||||||
Digital Realty Trust, L.P., 3.70%, 8/15/27 | 1,272 | 1,203,399 | ||||||
EPR Properties, 4.50%, 6/1/27 | 1,350 | 1,304,114 | ||||||
EPR Properties, 4.95%, 4/15/28 | 725 | 719,128 | ||||||
Newmark Group, Inc., 6.125%, 11/15/23(1) | 2,890 | 2,848,503 | ||||||
| $ | 7,706,156 | |||||||
| Retail-Specialty and Apparel — 1.3% | ||||||||
Best Buy Co., Inc., 4.45%, 10/1/28 | $ | 1,577 | $ | 1,508,017 | ||||
Dollar Tree, Inc., 3.70%, 5/15/23 | 1,476 | 1,444,791 | ||||||
Macy’s Retail Holdings, Inc., 4.375%, 9/1/23 | 965 | 953,142 | ||||||
Nordstrom, Inc., 5.00%, 1/15/44 | 88 | 76,196 | ||||||
Reliance Intermediate Holdings, L.P., 6.50%, 4/1/23(1) | 295 | 301,638 | ||||||
Tapestry, Inc., 4.125%, 7/15/27 | 2,491 | 2,336,207 | ||||||
| $ | 6,619,991 | |||||||
| Software — 0.3% | ||||||||
CA, Inc., 4.70%, 3/15/27 | $ | 909 | $ | 863,858 | ||||
IQVIA, Inc., 5.00%, 10/15/26(1) | 930 | 891,637 | ||||||
| $ | 1,755,495 | |||||||
| Technology — 0.4% | ||||||||
Western Digital Corp., 4.75%, 2/15/26 | $ | 2,412 | $ | 2,101,455 | ||||
| $ | 2,101,455 | |||||||
| Telecommunications — 2.2% | ||||||||
AT&T, Inc., 3.00%, 6/30/22 | $ | 1,043 | $ | 1,017,970 | ||||
AT&T, Inc., 3.60%, 2/17/23 | 1,834 | 1,826,296 | ||||||
Nokia Oyj, 4.375%, 6/12/27 | 1,500 | 1,398,750 | ||||||
Verizon Communications, Inc., 3.716%, (3 mo. USD LIBOR + 1.10%), 5/15/25(2) | 1,848 | 1,793,378 | ||||||
Verizon Communications, Inc., 4.329%, 9/21/28 | 2,407 | 2,423,150 | ||||||
Verizon Communications, Inc., 4.862%, 8/21/46 | 1,400 | 1,382,891 | ||||||
Verizon Communications, Inc., 5.50%, 3/16/47 | 1,421 | 1,518,646 | ||||||
| $ | 11,361,081 | |||||||
| 19 | See Notes to Financial Statements. |
Core Bond Portfolio
December 31, 2018
Portfolio of Investments — continued
| Security | Principal Amount (000’s omitted) | Value | ||||||
| Transportation — 0.2% | ||||||||
SMBC Aviation Capital Finance DAC, 3.00%, 7/15/22(1) | $ | 914 | $ | 887,072 | ||||
| $ | 887,072 | |||||||
| Utilities — 1.0% | ||||||||
American Water Capital Corp., 2.95%, 9/1/27 | $ | 1,426 | $ | 1,349,676 | ||||
Baltimore Gas & Electric Co., 3.50%, 8/15/46 | 1,580 | 1,398,898 | ||||||
Southern Co. Gas Capital Corp., 2.45%, 10/1/23 | 1,060 | 1,011,424 | ||||||
Southern Co. Gas Capital Corp., 3.95%, 10/1/46 | 1,270 | 1,117,740 | ||||||
| $ | 4,877,738 | |||||||
Total Corporate Bonds & Notes |
| $ | 208,514,064 | |||||
| Agency Mortgage-Backed Securities — 12.1% |
| |||||||
| Security | Principal Amount (000’s omitted) | Value | ||||||
| Federal Home Loan Mortgage Corp.: | ||||||||
Pool #A93547, 4.50%, 8/1/40 | $ | 764 | $ | 798,983 | ||||
Pool #C03490, 4.50%, 8/1/40 | 617 | 646,132 | ||||||
Pool #C09031, 2.50%, 2/1/43 | 1,738 | 1,653,768 | ||||||
Pool #G07589, 5.50%, 6/1/41 | 2,686 | 2,886,757 | ||||||
Pool #G08596, 4.50%, 7/1/44 | 829 | 863,024 | ||||||
Pool #G08670, 3.00%, 10/1/45 | 1,410 | 1,379,312 | ||||||
Pool #G08701, 3.00%, 4/1/46 | 2,163 | 2,114,807 | ||||||
Pool #G08717, 4.00%, 8/1/46 | 1,931 | 1,973,371 | ||||||
Pool #G08738, 3.50%, 12/1/46 | 1,868 | 1,870,578 | ||||||
Pool #G08758, 4.00%, 4/1/47 | 1,787 | 1,824,897 | ||||||
Pool #G60608, 4.00%, 5/1/46 | 2,986 | 3,053,469 | ||||||
Pool #G60761, 3.00%, 10/1/43 | 2,149 | 2,111,294 | ||||||
Pool #Q10378, 3.00%, 8/1/42 | 1,069 | 1,049,966 | ||||||
Pool #Q17453, 3.50%, 4/1/43 | 1,652 | 1,663,517 | ||||||
Pool #Q34310, 3.50%, 6/1/45 | 1,898 | 1,904,018 | ||||||
Pool #Q40264, 3.50%, 5/1/46 | 1,588 | 1,592,140 | ||||||
Pool #Q45051, 3.00%, 12/1/46 | 3,271 | 3,196,542 | ||||||
Pool #Q46889, 3.50%, 3/1/47 | 2,627 | 2,641,004 | ||||||
Pool #Q47999, 4.00%, 5/1/47 | 3,619 | 3,708,321 | ||||||
| $ | 36,931,900 | |||||||
| Federal National Mortgage Association: | ||||||||
Pool #AB3678, 3.50%, 10/1/41 | $ | 3,482 | $ | 3,512,153 | ||||
Pool #AL7524, 5.00%, 7/1/41 | 931 | 987,962 | ||||||
Pool #AS3892, 4.00%, 11/1/44 | 1,075 | 1,101,015 | ||||||
Pool #AS5332, 4.00%, 7/1/45 | 1,223 | 1,254,196 | ||||||
Pool #AS6014, 4.00%, 10/1/45 | 822 | 842,699 | ||||||
| Security | Principal Amount (000’s omitted) | Value | ||||||
| Federal National Mortgage Association: (continued) | ||||||||
Pool #AS9721, 4.00%, 6/1/47 | $ | 2,708 | $ | 2,765,840 | ||||
Pool #BA0891, 3.50%, 1/1/46 | 2,354 | 2,360,263 | ||||||
Pool #BA3938, 3.50%, 1/1/46 | 1,905 | 1,910,945 | ||||||
Pool #BD1183, 3.50%, 12/1/46 | 1,271 | 1,272,582 | ||||||
Pool #BE2316, 3.50%, 1/1/47 | 2,969 | 2,972,908 | ||||||
Pool #MA0634, 4.50%, 1/1/31 | 622 | 646,708 | ||||||
Pool #MA1789, 4.50%, 2/1/44 | 798 | 831,434 | ||||||
Pool #MA2653, 4.00%, 6/1/46 | 1,986 | 2,030,673 | ||||||
| $ | 22,489,378 | |||||||
| Government National Mortgage Association: | ||||||||
Pool #AQ1784, 3.50%, 12/20/45 | $ | 1,677 | $ | 1,690,044 | ||||
| $ | 1,690,044 | |||||||
Total Agency Mortgage-Backed Securities |
| $ | 61,111,322 | |||||
| Collateralized Mortgage Obligations — 4.0% |
| |||||||
| Security | Principal Amount (000’s omitted) | Value | ||||||
| Federal Home Loan Mortgage Corp.: | ||||||||
Series 3820, Class DJ, 3.00%, 11/15/35 | $ | 754 | $ | 753,751 | ||||
Series 4030, Class PA, 3.50%, 6/15/40 | 1,354 | 1,368,927 | ||||||
Series 4423, Class A, 3.50%, 10/15/39 | 1,304 | 1,311,624 | ||||||
| $ | 3,434,302 | |||||||
| Federal Home Loan Mortgage Corp. Structured Agency Credit Risk Debt Notes: | ||||||||
Series 2017-DNA3, Class M2, 5.006%, (1 mo. USD LIBOR + 2.50%), 3/25/30(2) | $ | 715 | $ | 716,785 | ||||
Series 2018-DNA1, Class M1, 2.956%, (1 mo. USD LIBOR + 0.45%), 7/25/30(2) | 1,180 | 1,176,857 | ||||||
| $ | 1,893,642 | |||||||
| Federal National Mortgage Association: | ||||||||
Series 2005-58, Class MA, 5.50%, 7/25/35 | $ | 261 | $ | 277,614 | ||||
Series 2011-135, Class PK, 4.50%, 5/25/40 | 943 | 977,085 | ||||||
Series 2013-6, Class HD, 1.50%, 12/25/42 | 263 | 241,011 | ||||||
Series 2013-130, Class EA, 3.00%, 6/25/38 | 1,168 | 1,163,632 | ||||||
Series 2014-70, Class KP, 3.50%, 3/25/44 | 1,241 | 1,259,580 | ||||||
| $ | 3,918,922 | |||||||
| Federal National Mortgage Association Connecticut Avenue Securities: | ||||||||
Series 2013-C01, Class M2, 7.756%, (1 mo. USD LIBOR + 5.25%), 10/25/23(2) | $ | 2,276 | $ | 2,557,607 | ||||
Series 2014-C02, Class 1M2, 5.106%, (1 mo. USD LIBOR + 2.60%), 5/25/24(2) | 2,050 | 2,154,871 | ||||||
| 20 | See Notes to Financial Statements. |
Core Bond Portfolio
December 31, 2018
Portfolio of Investments — continued
| Security | Principal Amount (000’s omitted) | Value | ||||||
| Federal National Mortgage Association Connecticut Avenue Securities: (continued) | ||||||||
Series 2014-C02, Class 2M2, 5.106%, (1 mo. USD LIBOR + 2.60%), 5/25/24(2) | $ | 965 | $ | 1,002,330 | ||||
Series 2014-C03, Class 1M2, 5.506%, (1 mo. USD LIBOR + 3.00%), 7/25/24(2) | 1,169 | 1,231,953 | ||||||
Series 2014-C03, Class 2M2, 5.406%, (1 mo. USD LIBOR + 2.90%), 7/25/24(2) | 1,961 | 2,053,723 | ||||||
Series 2017-C05, Class 1M2, 4.706%, (1 mo. USD LIBOR + 2.20%), 1/25/30(2) | 400 | 400,222 | ||||||
Series 2017-C06, Class 1M2, 5.156%, (1 mo. USD LIBOR + 2.65%), 2/25/30(2) | 1,275 | 1,304,218 | ||||||
Series 2018-C03, Class 1M1, 3.186%, (1 mo. USD LIBOR + 0.68%), 10/25/30(2) | 497 | 497,065 | ||||||
| $ | 11,201,989 | |||||||
Total Collateralized Mortgage Obligations |
| $ | 20,448,855 | |||||
| Commercial Mortgage-Backed Securities — 8.0% |
| |||||||
| Security | Principal Amount (000’s omitted) | Value | ||||||
| CFCRE Commercial Mortgage Trust | ||||||||
Series 2016-C7, Class C, 4.435%, 12/10/54(6) | $ | 1,050 | $ | 1,037,135 | ||||
Series 2016-C7, Class D, 4.435%, 12/10/54(1)(6) | 2,000 | 1,757,711 | ||||||
| Citigroup Commercial Mortgage Trust | ||||||||
Series 2017-MDRB, Class C, 4.955%, (1 mo. USD LIBOR + 2.50%), 7/15/30(1)(2) | 3,000 | 2,998,687 | ||||||
| COMM Mortgage Trust | ||||||||
Series 2014-CR21, Class C, 4.418%, 12/10/47(6) | 500 | 502,335 | ||||||
| Credit Suisse Mortgage Trust | ||||||||
Series 2016-NXSR, Class C, 4.362%, 12/15/49(6) | 1,500 | 1,469,820 | ||||||
| GS Mortgage Securities Trust | ||||||||
Series 2018-FBLU, Class A, 3.405%, (1 mo. USD LIBOR + 0.95%), 11/15/35(1)(2) | 5,000 | 4,985,000 | ||||||
| JPMBB Commercial Mortgage Securities Trust | ||||||||
Series 2014-C22, Class C, 4.558%, 9/15/47(6) | 2,530 | 2,472,065 | ||||||
Series 2014-C22, Class D, 4.558%, 9/15/47(1)(6) | 500 | 426,226 | ||||||
Series 2014-C23, Class D, 3.978%, 9/15/47(1)(6) | 250 | 223,691 | ||||||
Series 2014-C25, Class D, 3.945%, 11/15/47(1)(6) | 1,960 | 1,652,019 | ||||||
| JPMorgan Chase Commercial Mortgage Securities Trust | ||||||||
Series 2011-C5, Class D, 5.406%, 8/15/46(1)(6) | 2,000 | 1,992,887 | ||||||
Series 2012-CBX, Class AS, 4.271%, 6/15/45 | 3,325 | 3,394,480 | ||||||
Series 2013-C13, Class D, 3.991%, 1/15/46(1)(6) | 2,000 | 1,913,059 | ||||||
| Morgan Stanley Capital I Trust | ||||||||
Series 2016-UB12, Class D, 3.312%, 12/15/49(1) | 1,000 | 785,139 | ||||||
| Security | Principal Amount (000’s omitted) | Value | ||||||
| Motel 6 Trust | ||||||||
Series 2017-MTL6, Class C, 3.855%, (1 mo. USD LIBOR + 1.40%), 8/15/34(1)(2) | $ | 1,454 | $ | 1,427,394 | ||||
Series 2017-MTL6, Class D, 4.605%, (1 mo. USD LIBOR + 2.15%), 8/15/34(1)(2) | 588 | 581,117 | ||||||
| Natixis Commercial Mortgage Securities Trust | ||||||||
Series 2018-FL1, Class C, 4.507%, (1 mo. USD LIBOR + 2.20%), 6/15/35(1)(2) | 5,000 | 4,910,709 | ||||||
| RETL Trust | ||||||||
Series 2018-RVP, Class A, 3.555%, (1 mo. USD LIBOR + 1.10%), 3/15/33(1)(2) | 2,388 | 2,385,547 | ||||||
| Toorak Mortgage Corp., Ltd. | ||||||||
Series 2018-1, Class A1, 4.336% to 4/25/21, 8/25/21(1)(7) | 1,330 | 1,333,237 | ||||||
| VMC Finance, LLC | ||||||||
Series 2018-FL2, Class A, 3.38%, (1 mo. USD LIBOR + 0.92%), 10/15/35(1)(2) | 3,000 | 3,008,781 | ||||||
| Wells Fargo Commercial Mortgage Trust | ||||||||
Series 2015-LC22, Class C, 4.543%, | 900 | 897,966 | ||||||
Series 2015-SG1, Class C, 4.468%, | 354 | 345,150 | ||||||
Total Commercial Mortgage-Backed Securities |
| $ | 40,500,155 | |||||
| Asset-Backed Securities — 18.1% |
| |||||||
| Security | Principal Amount (000’s omitted) | Value | ||||||
| AASET U.S., Ltd. | ||||||||
Series 2018-1A, Class A, 3.844%, 1/16/38(1) | $ | 514 | $ | 516,533 | ||||
Series 2018-1A, Class B, 5.437%, 1/16/38(1) | 610 | 623,655 | ||||||
| Adams Outdoor Advertising L.P. | ||||||||
Series 2018-1, Class A, 4.81%, 11/15/48(1) | 749 | 771,669 | ||||||
| American Credit Acceptance Receivables Trust | ||||||||
Series 2017-4, Class A, 2.00%, 7/10/20(1) | 102 | 101,614 | ||||||
| AmeriCredit Automobile Receivables Trust | ||||||||
Series 2016-2, Class B, 2.21%, 5/10/21 | 610 | 608,210 | ||||||
Series 2016-4, Class A3, 1.53%, 7/8/21 | 533 | 530,518 | ||||||
| Ascentium Equipment Receivable Trust | ||||||||
Series 2016-1A, Class A3, 1.92%, | 121 | 121,082 | ||||||
| Avis Budget Rental Car Funding, LLC | ||||||||
Series 2013-2A, Class A, 2.97%, 2/20/20(1) | 667 | 666,397 | ||||||
Series 2013-2A, Class B, 3.66%, 2/20/20(1) | 300 | 299,990 | ||||||
Series 2014-1A, Class A, 2.46%, 7/20/20(1) | 3,885 | 3,873,946 | ||||||
| Canadian Pacer Auto Receivables Trust | ||||||||
Series 2017-1A, Class A2A, 1.772%, 12/19/19(1) | 71 | 71,384 | ||||||
| Canyon Capital CLO, Ltd. | ||||||||
Series 2016-1A, Class BR, 4.136%, (3 mo. USD LIBOR + 1.70%), 7/15/31(1)(2) | 1,000 | 955,896 | ||||||
| 21 | See Notes to Financial Statements. |
Core Bond Portfolio
December 31, 2018
Portfolio of Investments — continued
| Security | Principal Amount (000’s omitted) | Value | ||||||
| Canyon Capital CLO, Ltd. (continued) | ||||||||
Series 2016-1A, Class DR, 5.236%, (3 mo. USD LIBOR + 2.80%), 7/15/31(1)(2) | $ | 1,000 | $ | 925,884 | ||||
| Carlyle Global Market Strategies CLO, Ltd. | ||||||||
Series 2014-3RA, Class A2, 4.059%, (3 mo. USD LIBOR + 1.55%), 7/27/31(1)(2) | 1,000 | 976,312 | ||||||
Series 2014-3RA, Class C, 5.459%, (3 mo. USD LIBOR + 2.95%), 7/27/31(1)(2) | 1,000 | 932,572 | ||||||
| CarMax Auto Owner Trust | ||||||||
Series 2017-2, Class A3, 1.93%, 3/15/22 | 1,355 | 1,341,464 | ||||||
| CNH Equipment Trust | ||||||||
Series 2017-A, Class A3, 2.07%, 5/16/22 | 1,200 | 1,188,479 | ||||||
| Coinstar Funding, LLC | ||||||||
Series 2017-1A, Class A2, 5.216%, | 1,084 | 1,096,335 | ||||||
| Conn Funding II L.P. | ||||||||
Series 2018-A, Class A, 3.25%, 1/15/23(1) | 258 | 257,895 | ||||||
| Consumer Loan Underlying Bond Credit Trust | ||||||||
Series 2017-NP1, Class C, 5.13%, 4/17/23(1) | 1,496 | 1,504,780 | ||||||
| Credit Acceptance Auto Loan Trust | ||||||||
Series 2017-2A, Class A, 2.55%, 2/17/26(1) | 2,500 | 2,478,829 | ||||||
| DB Master Finance, LLC | ||||||||
Series 2015-1A, Class A2II, 3.98%, | 2,270 | 2,303,814 | ||||||
Series 2017-1A, Class A2II, 4.03%, | 337 | 325,536 | ||||||
| Driven Brands Funding, LLC | ||||||||
Series 2018-1A, Class A2, 4.739%, | 771 | 786,452 | ||||||
| Dryden Senior Loan Fund | ||||||||
Series 2018-55A, Class D, 5.286%, (3 mo. USD LIBOR + 2.85%), 4/15/31(1)(2) | 1,000 | 934,590 | ||||||
| Enterprise Fleet Financing, LLC | ||||||||
Series 2017-1, Class A2, 2.13%, 7/20/22(1) | 850 | 844,646 | ||||||
| First Investors Auto Owner Trust | ||||||||
Series 2017-1A, Class A1, 1.69%, 4/15/21(1) | 74 | 73,691 | ||||||
| FOCUS Brands Funding, LLC | ||||||||
Series 2017-1A, Class A2II, 5.093%, | 985 | 999,582 | ||||||
| Ford Credit Auto Owner Trust | ||||||||
Series 2014-1, Class B, 2.41%, 11/15/25(1) | 475 | 473,804 | ||||||
| Foundation Finance Trust | ||||||||
Series 2017-1A, Class A, 3.30%, 7/15/33(1) | 2,030 | 2,016,297 | ||||||
| Hardee’s Funding, LLC | ||||||||
Series 2018-1A, Class A2I, 4.25%, 6/20/48(1) | 978 | 989,701 | ||||||
| Hertz Fleet Lease Funding, L.P. | ||||||||
Series 2017-1, Class A2, 2.13%, 4/10/31(1) | 838 | 832,060 | ||||||
| Horizon Aircraft Finance I, Ltd. | ||||||||
Series 2018-1, Class A, 4.458%, 12/15/38(1) | 3,570 | 3,642,774 | ||||||
| Invitation Homes Trust | ||||||||
Series 2017-SFR2, Class B, 3.605%, (1 mo. USD LIBOR + 1.15%), 12/17/36(1)(2) | 363 | 361,631 | ||||||
| Security | Principal Amount (000’s omitted) | Value | ||||||
| Invitation Homes Trust (continued) | ||||||||
Series 2017-SFR2, Class C, 3.905%, (1 mo. USD LIBOR + 1.45%), 12/17/36(1)(2) | $ | 461 | $ | 459,791 | ||||
Series 2018-SFR1, Class B, 3.405%, (1 mo. USD LIBOR + 0.95%), 3/17/37(1)(2) | 380 | 375,755 | ||||||
Series 2018-SFR1, Class C, 3.705%, (1 mo. USD LIBOR + 1.25%), 3/17/37(1)(2) | 445 | 440,828 | ||||||
Series 2018-SFR2, Class A, 3.355%, (1 mo. USD LIBOR + 0.90%), 6/17/37(1)(2) | 5,352 | 5,299,568 | ||||||
| MarketPlace Loan Trust | ||||||||
Series 2015-CB1, Class A, 4.00%, 7/15/21(1) | 459 | 458,901 | ||||||
| Mercedes-Benz Auto Receivables Trust | ||||||||
Series 2016-1, Class A3, 1.26%, 2/16/21 | 771 | 764,710 | ||||||
| OneMain Financial Issuance Trust | ||||||||
Series 2015-1A, Class A, 3.19%, 3/18/26(1) | 558 | 558,131 | ||||||
Series 2015-1A, Class B, 3.85%, 3/18/26(1) | 1,200 | 1,204,759 | ||||||
Series 2016-2A, Class A, 4.10%, 3/20/28(1) | 1,322 | 1,326,556 | ||||||
Series 2017-1A, Class A1, 2.37%, 9/14/32(1) | 1,925 | 1,895,910 | ||||||
| Planet Fitness Master Issuer, LLC | ||||||||
Series 2018-1A, Class A2I, 4.262%, 9/5/48(1) | 2,075 | 2,088,406 | ||||||
| Prosper Marketplace Issuance Trust | ||||||||
Series 2017-1A, Class B, 3.65%, 6/15/23(1) | 532 | 531,444 | ||||||
Series 2017-2A, Class A, 2.41%, 9/15/23(1) | 655 | 654,889 | ||||||
Series 2017-2A, Class B, 3.48%, 9/15/23(1) | 605 | 604,776 | ||||||
Series 2017-3A, Class A, 2.36%, 11/15/23(1) | 1,236 | 1,232,676 | ||||||
Series 2017-3A, Class B, 3.36%, 11/15/23(1) | 3,015 | 2,999,260 | ||||||
Series 2018-1A, Class A, 3.11%, 6/17/24(1) | 1,019 | 1,017,082 | ||||||
Series 2018-1A, Class B, 3.90%, 6/17/24(1) | 600 | 600,208 | ||||||
Series 2018-2A, Class A, 3.35%, 10/15/24(1) | 3,166 | 3,160,205 | ||||||
| Purchasing Power Funding, LLC | ||||||||
Series 2018-A, Class A, 3.34%, 8/15/22(1) | 5,000 | 4,986,198 | ||||||
| Santander Drive Auto Receivables Trust | ||||||||
Series 2017-3, Class A3, 1.87%, 6/15/21 | 1,059 | 1,056,564 | ||||||
| Securitized Term Auto Receivables Trust | ||||||||
Series 2016-1A, Class A3, 1.524%, 3/25/20(1) | 147 | 146,899 | ||||||
| Sierra Receivables Funding Co., LLC | ||||||||
Series 2014-2A, Class B, 2.40%, 6/20/31(1) | 338 | 337,917 | ||||||
Series 2015-1A, Class B, 3.05%, 3/22/32(1) | 121 | 120,389 | ||||||
| Skopos Auto Receivables Trust | ||||||||
Series 2018-1A, Class A, 3.19%, 9/15/21(1) | 1,298 | 1,296,582 | ||||||
| Social Professional Loan Program, LLC | ||||||||
Series 2014-B, Class A2, 2.55%, 8/27/29(1) | 364 | 361,938 | ||||||
| SpringCastle America Funding LLC | ||||||||
Series 2016-AA, Class A, 3.05%, 4/25/29(1) | 711 | 705,311 | ||||||
| Springleaf Funding Trust | ||||||||
Series 2016-AA, Class A, 2.90%, 11/15/29(1) | 2,149 | 2,136,670 | ||||||
| 22 | See Notes to Financial Statements. |
Core Bond Portfolio
December 31, 2018
Portfolio of Investments — continued
| Security | Principal Amount (000’s omitted) | Value | ||||||
| TCF Auto Receivables Owner Trust | ||||||||
Series 2016-PT1A, Class A, 1.93%, 6/15/22(1) | $ | 650 | $ | 644,113 | ||||
| Tesla Auto Lease Trust | ||||||||
Series 2018-A, Class A, 2.32%, 12/20/19(1) | 647 | 645,569 | ||||||
Series 2018-B, Class A, 3.71%, 8/20/21(1) | 1,352 | 1,355,751 | ||||||
| Thunderbolt Aircraft Lease, Ltd. | ||||||||
Series 2017-A, Class B, 5.75% to 4/15/24, 5/17/32(1)(7) | 1,672 | 1,719,451 | ||||||
| Towd Point Asset Trust | ||||||||
Series 2018-SL1, Class A, 3.106%, (1 mo. USD LIBOR + 0.60%), 1/25/46(1)(2) | 4,289 | 4,276,531 | ||||||
| Upland CLO, Ltd. | ||||||||
Series 2016-1A, Class CR, 5.369%, (3 mo. USD LIBOR + 2.90%), 4/20/31(1)(2) | 1,000 | 918,607 | ||||||
| Vantage Data Centers Issuer, LLC | ||||||||
Series 2018-1A, Class A2, 4.072%, 2/16/43(1) | 1,371 | 1,374,995 | ||||||
| Verizon Owner Trust | ||||||||
Series 2016-1A, Class A, 1.42%, 1/20/21(1) | 542 | 540,199 | ||||||
| Veros Automobile Receivables Trust | ||||||||
Series 2018-1, Class A, 3.63%, 5/15/23(1) | 3,372 | 3,372,884 | ||||||
| Voya CLO, Ltd. | ||||||||
Series 2018-2A, Class B1, 3.924%, (3 mo. USD LIBOR + 1.55%), 7/15/31(1)(2) | 1,000 | 970,869 | ||||||
| Wendys Funding, LLC | ||||||||
Series 2015-1A, Class A2II, 4.08%, | 2,917 | 2,922,087 | ||||||
| Wheels SPV, LLC | ||||||||
Series 2017-1A, Class A2, 1.88%, | 660 | 656,128 | ||||||
| World Omni Automobile Lease Securitization Trust | ||||||||
Series 2017-A, Class A3, 2.13%, 4/15/20 | 1,000 | 994,444 | ||||||
Total Asset-Backed Securities | $ | 91,641,973 | ||||||
| U.S. Treasury Obligations — 12.1% |
| |||||||
| Security | Principal Amount (000’s omitted) | Value | ||||||
U.S. Treasury Bond, 3.00%, 2/15/48 | $ | 2,425 | $ | 2,417,047 | ||||
U.S. Treasury Bond, 3.125%, 5/15/48 | 5,880 | 6,003,685 | ||||||
U.S. Treasury Inflation-Protected Note, 0.125%, 4/15/22(8) | 26,072 | 25,231,240 | ||||||
U.S. Treasury Note, 2.625%, 6/30/23 | 1,322 | 1,329,170 | ||||||
U.S. Treasury Note, 2.75%, 9/15/21 | 645 | 649,517 | ||||||
U.S. Treasury Note, 2.875%, 9/30/23 | 10,263 | 10,430,985 | ||||||
U.S. Treasury Note, 2.875%, 10/31/23 | 958 | 974,025 | ||||||
U.S. Treasury Note, 2.875%, 5/15/28 | 7,796 | 7,923,052 | ||||||
U.S. Treasury Note, 2.875%, 8/15/28 | 5,954 | 6,051,472 | ||||||
Total U.S. Treasury Obligations |
| $ | 61,010,193 | |||||
| Senior Floating-Rate Loans — 2.2%(9) |
| |||||||
| Borrower/Tranche Description | Principal Amount (000’s omitted) | Value | ||||||
| Building and Development — 0.2% | ||||||||
DTZ U.S. Borrower, LLC, Term Loan, 5.772%, (1 mo. USD LIBOR + 3.25%), 8/21/25 | $ | 1,247 | $ | 1,192,324 | ||||
| $ | 1,192,324 | |||||||
| Business Equipment and Services — 0.2% | ||||||||
Change Healthcare Holdings, LLC, Term Loan, 5.272%, (1 mo. USD LIBOR + 2.75%), 3/1/24 | $ | 1,069 | $ | 1,018,868 | ||||
| $ | 1,018,868 | |||||||
| Cable and Satellite Television — 0.3% | ||||||||
UPC Financing Partnership, Term Loan, 4.955%, (1 mo. USD LIBOR + 2.50%), 1/15/26 | $ | 833 | $ | 794,910 | ||||
Ziggo Secured Finance Partnership, Term Loan, 4.955%, (1 mo. USD LIBOR + 2.50%), 4/15/25 | 1,000 | 945,625 | ||||||
| $ | 1,740,535 | |||||||
| Drugs — 0.4% | ||||||||
Jaguar Holding Company II, Term Loan, 5.022%, (1 mo. USD LIBOR + 2.50%), 8/18/22 | $ | 1,866 | $ | 1,776,631 | ||||
| $ | 1,776,631 | |||||||
| Electronics / Electrical — 0.5% | ||||||||
Infor (US), Inc., Term Loan, 5.272%, (1 mo. USD LIBOR + 2.75%), 2/1/22 | $ | 1,866 | $ | 1,792,054 | ||||
MA FinanceCo., LLC, Term Loan, 5.022%, (1 mo. USD LIBOR + 2.50%), 6/21/24 | 81 | 75,594 | ||||||
Seattle Spinco, Inc., Term Loan, 5.022%, (1 mo. USD LIBOR + 2.50%), 6/21/24 | 546 | 510,503 | ||||||
| $ | 2,378,151 | |||||||
| Equipment Leasing — 0.3% | ||||||||
Avolon TLB Borrower 1 (US), LLC, Term Loan, 4.47%, (1 mo. USD LIBOR + 2.00%), 1/15/25 | $ | 1,657 | $ | 1,599,521 | ||||
| $ | 1,599,521 | |||||||
| Food / Drug Retailers — 0.1% | ||||||||
Albertsons, LLC, Term Loan, 5.522%, (1 mo. USD LIBOR + 3.00%), 11/17/25 | $ | 669 | $ | 632,728 | ||||
| $ | 632,728 | |||||||
| 23 | See Notes to Financial Statements. |
Core Bond Portfolio
December 31, 2018
Portfolio of Investments — continued
| Borrower/Tranche Description | Principal Amount (000’s omitted) | Value | ||||||
| Telecommunications — 0.2% | ||||||||
Sprint Communications, Inc., Term Loan, 5.063%, (1 mo. USD LIBOR + 2.50%), 2/2/24 | $ | 846 | $ | 809,754 | ||||
| $ | 809,754 | |||||||
Total Senior Floating-Rate Loans |
| $ | 11,148,512 | |||||
| Short-Term Investments — 1.5% |
| |||||||
| Commercial Paper — 0.3% | ||||||||
| Security | Principal Amount (000’s omitted) | Value | ||||||
AT&T, Inc., 3.14%, 5/28/19(1) | $ | 1,450 | $ | 1,431,205 | ||||
Total Commercial Paper |
| $ | 1,431,205 | |||||
| Other — 1.2% |
| |||||||
| Description | Units | Value | ||||||
Eaton Vance Cash Reserves Fund, LLC, 2.46%(10) | 6,204,593 | $ | 6,203,972 | |||||
Total Other |
| $ | 6,203,972 | |||||
Total Short-Term Investments |
| $ | 7,635,177 | |||||
Total Investments — 99.2% |
| $ | 502,010,251 | |||||
Other Assets, Less Liabilities — 0.8% |
| $ | 4,005,573 | |||||
Net Assets — 100.0% |
| $ | 506,015,824 | |||||
The percentage shown for each investment category in the Portfolio of Investments is based on net assets.
| (1) | Security exempt from registration pursuant to Rule 144A under the Securities Act of 1933, as amended. These securities may be sold in certain transactions in reliance on an exemption from registration (normally to qualified institutional buyers). At December 31, 2018, the aggregate value of these securities is $147,404,037 or 29.1% of the Portfolio’s net assets. |
| (2) | Variable rate security. The stated interest rate represents the rate in effect at December 31, 2018. |
| (3) | Security converts to floating rate after the indicated fixed-rate coupon period. |
| (4) | Perpetual security with no stated maturity date but may be subject to calls by the issuer. |
| (5) | Variable rate security. The stated interest rate, which resets quarterly, is determined at auction and represents the rate in effect at December 31, 2018. |
| (6) | Weighted average fixed-rate coupon that changes/updates monthly. Rate shown is the rate at December 31, 2018. |
| (7) | Step coupon security. Interest rate represents the rate in effect at December 31, 2018. |
| (8) | Inflation-linked security whose principal is adjusted for inflation based on changes in the U.S. Consumer Price Index. Interest is calculated based on the inflation-adjusted principal. |
| (9) | Senior floating-rate loans (Senior Loans) often require prepayments from excess cash flows or permit the borrowers to repay at their election. The degree to which borrowers repay, whether as a contractual requirement or at their election, cannot be predicted with accuracy. As a result, the actual remaining maturity may be substantially less than the stated maturities shown. However, Senior Loans will typically have an expected average life of approximately two to four years. Senior Loans typically have rates of interest which are redetermined periodically by reference to a base lending rate, plus a spread. These base lending rates are primarily the London Interbank Offered Rate (“LIBOR”) and secondarily, the prime rate offered by one or more major United States banks (the “Prime Rate”). Base lending rates may be subject to a floor, or minimum rate. |
| (10) | Affiliated investment company, available to Eaton Vance portfolios and funds, which invests in high quality, U.S. dollar denominated money market instruments. The rate shown is the annualized seven-day yield as of December 31, 2018. |
| 24 | See Notes to Financial Statements. |
Core Bond Portfolio
December 31, 2018
Portfolio of Investments — continued
| Futures Contracts | ||||||||||||||||||||
| Description | Number of Contracts | Position | Expiration Date | Notional Amount | Value/Unrealized Appreciation (Depreciation) | |||||||||||||||
Interest Rate Futures | ||||||||||||||||||||
| U.S. 2-Year Treasury Note | 139 | Long | 3/29/19 | $ | 29,511,438 | $ | 201,772 | |||||||||||||
| U.S. 5-Year Treasury Note | 60 | Short | 3/29/19 | (6,881,250 | ) | (116,342 | ) | |||||||||||||
| U.S. 10-Year Treasury Note | 50 | Long | 3/20/19 | 6,100,781 | 151,095 | |||||||||||||||
| U.S. Ultra 10-Year Treasury Note | 125 | Short | 3/20/19 | (16,259,766 | ) | (523,629 | ) | |||||||||||||
| U.S. Ultra-Long Treasury Bond | 275 | Long | 3/20/19 | 44,180,469 | 2,315,595 | |||||||||||||||
| $ | 2,028,491 | |||||||||||||||||||
Abbreviations:
| LIBOR | – | London Interbank Offered Rate | ||
| PPTT | – | Preferred Pass-Through Trust | ||
Currency Abbreviations:
| USD | – | United States Dollar | ||
| 25 | See Notes to Financial Statements. |
Core Bond Portfolio
December 31, 2018
Statement of Assets and Liabilities
| Assets | December 31, 2018 | |||
Unaffiliated investments, at value (identified cost, $506,032,084) | $ | 495,806,279 | ||
Affiliated investment, at value (identified cost, $6,203,887) | 6,203,972 | |||
Cash | 75,500 | |||
Deposits for derivatives collateral — financial futures contracts | 964,866 | |||
Interest receivable | 3,114,764 | |||
Dividends receivable from affiliated investment | 8,995 | |||
Receivable for variation margin on open financial futures contracts | 128,765 | |||
Receivable from affiliate | 34,664 | |||
Total assets | $ | 506,337,805 | ||
| Liabilities |
| |||
Payable to affiliates: | ||||
Investment adviser fee | $ | 193,061 | ||
Trustees’ fees | 5,380 | |||
Accrued expenses | 123,540 | |||
Total liabilities | $ | 321,981 | ||
Net Assets applicable to investors’ interest in Portfolio | $ | 506,015,824 | ||
| 26 | See Notes to Financial Statements. |
Core Bond Portfolio
December 31, 2018
Statement of Operations
| Investment Income | Year Ended December 31, 2018 | |||
Interest (net of foreign taxes, $7,606) | $ | 16,744,995 | ||
Dividends from affiliated investment | 168,088 | |||
Total investment income | $ | 16,913,083 | ||
| Expenses |
| |||
Investment adviser fee | $ | 2,194,180 | ||
Trustees’ fees and expenses | 19,868 | |||
Custodian fee | 141,585 | |||
Legal and accounting services | 112,913 | |||
Miscellaneous | 14,519 | |||
Total expenses | $ | 2,483,065 | ||
Deduct — |
| |||
Allocation of expenses to affiliate | $ | 93,487 | ||
Total expense reductions | $ | 93,487 | ||
Net expenses | $ | 2,389,578 | ||
Net investment income | $ | 14,523,505 | ||
| Realized and Unrealized Gain (Loss) |
| |||
Net realized gain (loss) — |
| |||
Investment transactions | $ | (5,231,692 | ) | |
Investment transactions — affiliated investment | (1,600 | ) | ||
Financial futures contracts | (1,904,227 | ) | ||
Net realized loss | $ | (7,137,519 | ) | |
Change in unrealized appreciation (depreciation) — |
| |||
Investments | $ | (10,988,185 | ) | |
Investments — affiliated investment | 571 | |||
Financial futures contracts | 2,006,356 | |||
Net change in unrealized appreciation (depreciation) | $ | (8,981,258 | ) | |
Net realized and unrealized loss | $ | (16,118,777 | ) | |
Net decrease in net assets from operations | $ | (1,595,272 | ) | |
| 27 | See Notes to Financial Statements. |
Core Bond Portfolio
December 31, 2018
Statements of Changes in Net Assets
| Year Ended December 31, | ||||||||
| Increase (Decrease) in Net Assets | 2018 | 2017 | ||||||
From operations — |
| |||||||
Net investment income | $ | 14,523,505 | $ | 11,721,140 | ||||
Net realized gain (loss) | (7,137,519 | ) | 3,676,612 | |||||
Net change in unrealized appreciation (depreciation) | (8,981,258 | ) | 5,607,998 | |||||
Net increase (decrease) in net assets from operations | $ | (1,595,272 | ) | $ | 21,005,750 | |||
Capital transactions — |
| |||||||
Contributions | $ | 86,298,166 | $ | 55,689,460 | ||||
Withdrawals | (58,051,164 | ) | (81,587,010 | ) | ||||
Net increase (decrease) in net assets from capital transactions | $ | 28,247,002 | $ | (25,897,550 | ) | |||
Net increase (decrease) in net assets | $ | 26,651,730 | $ | (4,891,800 | ) | |||
| Net Assets | ||||||||
At beginning of year | $ | 479,364,094 | $ | 484,255,894 | ||||
At end of year | $ | 506,015,824 | $ | 479,364,094 | ||||
| 28 | See Notes to Financial Statements. |
Core Bond Portfolio
December 31, 2018
Financial Highlights
| Year Ended December 31, | ||||||||||||||||||||
| Ratios/Supplemental Data | 2018 | 2017 | 2016 | 2015 | 2014 | |||||||||||||||
Ratios (as a percentage of average daily net assets): | ||||||||||||||||||||
Expenses(1)(2) | 0.49 | % | 0.49 | % | 0.50 | % | 0.50 | % | 0.50 | % | ||||||||||
Net investment income | 2.98 | % | 2.46 | % | 2.01 | % | 2.00 | % | 2.47 | % | ||||||||||
Portfolio Turnover | 65 | % | 123 | % | 132 | %(3) | 159 | %(3) | 134 | %(3) | ||||||||||
Total Return(2) | (0.50 | )% | 4.48 | % | 2.73 | % | 0.04 | % | 5.27 | % | ||||||||||
Net assets, end of year (000’s omitted) | $ | 506,016 | $ | 479,364 | $ | 484,256 | $ | 342,684 | $ | 214,538 | ||||||||||
| (1) | Excludes the effect of custody fee credits, if any, of less than 0.005%. Effective September 1, 2015, custody fee credits, which were earned on cash deposit balances, were discontinued by the custodian. |
| (2) | The investment adviser reimbursed certain operating expenses (equal to 0.02%, 0.01%, 0.01%, 0.02% and 0.03% of average daily net assets for the years ended December 31, 2018, 2017, 2016, 2015 and 2014, respectively). Absent this reimbursement, total return would be lower. |
| (3) | Includes the effect of To Be Announced (TBA) transactions. |
| 29 | See Notes to Financial Statements. |
Core Bond Portfolio
December 31, 2018
Notes to Financial Statements
1 Significant Accounting Policies
Core Bond Portfolio (the Portfolio) is a Massachusetts business trust registered under the Investment Company Act of 1940, as amended (the 1940 Act), as a diversified, open-end management investment company. The Portfolio’s investment objectives are to seek current income and total return. The Declaration of Trust permits the Trustees to issue interests in the Portfolio. At December 31, 2018, Eaton Vance Balanced Fund and Eaton Vance Core Bond Fund held an interest of 65.6% and 34.4%, respectively, in the Portfolio.
The following is a summary of significant accounting policies of the Portfolio. The policies are in conformity with accounting principles generally accepted in the United States of America (U.S. GAAP). The Portfolio is an investment company and follows accounting and reporting guidance in the Financial Accounting Standards Board (FASB) Accounting Standards Codification Topic 946.
A Investment Valuation — The following methodologies are used to determine the market value or fair value of investments.
Debt Obligations. Debt obligations are generally valued on the basis of valuations provided by third party pricing services, as derived from such services’ pricing models. Inputs to the models may include, but are not limited to, reported trades, executable bid and ask prices, broker/dealer quotations, prices or yields of securities with similar characteristics, interest rates, anticipated prepayments, benchmark curves or information pertaining to the issuer, as well as industry and economic events. The pricing services may use a matrix approach, which considers information regarding securities with similar characteristics to determine the valuation for a security. Short-term debt obligations purchased with a remaining maturity of sixty days or less for which a valuation from a third party pricing service is not readily available may be valued at amortized cost, which approximates fair value.
Senior Floating-Rate Loans. Interests in senior floating-rate loans (Senior Loans) for which reliable market quotations are readily available are valued generally at the average mean of bid and ask quotations obtained from a third party pricing service.
Derivatives. Financial futures contracts are valued at the closing settlement price established by the board of trade or exchange on which they are traded.
Affiliated Fund.The Portfolio may invest in Eaton Vance Cash Reserves Fund, LLC (Cash Reserves Fund), an affiliated investment company managed by Eaton Vance Management (EVM). While Cash Reserves Fund is not a registered money market mutual fund, it conducts all of its investment activities in accordance with the requirements of Rule 2a-7 under the 1940 Act. Investments in Cash Reserves Fund are valued at the closing net asset value per unit on the valuation day. Cash Reserves Fund generally values its investment securities based on available market quotations provided by a third party pricing service.
Fair Valuation.Investments for which valuations or market quotations are not readily available or are deemed unreliable are valued at fair value using methods determined in good faith by or at the direction of the Trustees of the Portfolio in a manner that fairly reflects the security’s value, or the amount that the Portfolio might reasonably expect to receive for the security upon its current sale in the ordinary course. Each such determination is based on a consideration of relevant factors, which are likely to vary from one pricing context to another. These factors may include, but are not limited to, the type of security, the existence of any contractual restrictions on the security’s disposition, the price and extent of public trading in similar securities of the issuer or of comparable companies or entities, quotations or relevant information obtained from broker/dealers or other market participants, information obtained from the issuer, analysts, and/or the appropriate stock exchange (for exchange-traded securities), an analysis of the company’s or entity’s financial condition, and an evaluation of the forces that influence the issuer and the market(s) in which the security is purchased and sold.
B Investment Transactions — Investment transactions for financial statement purposes are accounted for on a trade date basis. Realized gains and losses on investments sold are determined on the basis of identified cost.
C Income — Interest income is recorded on the basis of interest accrued, adjusted for amortization of premium or accretion of discount. Inflation adjustments to the principal amount of inflation-adjusted bonds and notes are reflected as interest income. Deflation adjustments to the principal amount of an inflation-adjusted bond or note are reflected as reductions to interest income to the extent of interest income previously recorded on such bond or note. Dividend income is recorded on the ex-dividend date for dividends received in cash and/or securities. Withholding taxes on foreign interest have been provided for in accordance with the Portfolio’s understanding of the applicable countries’ tax rules and rates.
D Federal Taxes — The Portfolio has elected to be treated as a partnership for federal tax purposes. No provision is made by the Portfolio for federal or state taxes on any taxable income of the Portfolio because each investor in the Portfolio is ultimately responsible for the payment of any taxes on its share of taxable income. Since at least one of the Portfolio’s investors is a regulated investment company that invests all or substantially all of its assets in the Portfolio, the Portfolio normally must satisfy the applicable source of income and diversification requirements (under the Internal Revenue Code) in order for its investors to satisfy them. The Portfolio will allocate, at least annually among its investors, each investor’s distributive share of the Portfolio’s net investment income, net realized capital gains and losses and any other items of income, gain, loss, deduction or credit.
As of December 31, 2018, the Portfolio had no uncertain tax positions that would require financial statement recognition, de-recognition, or disclosure. The Portfolio files a U.S. federal income tax return annually after its fiscal year-end, which is subject to examination by the Internal Revenue Service for a period of three years from the date of filing.
E Unfunded Loan Commitments — The Portfolio may enter into certain loan agreements all or a portion of which may be unfunded. The Portfolio is obligated to fund these commitments at the borrower’s discretion. These commitments, if any, are disclosed in the accompanying Portfolio of Investments.
F Use of Estimates — The preparation of the financial statements in conformity with U.S. GAAP requires management to make estimates and assumptions that affect the reported amounts of assets and liabilities at the date of the financial statements and the reported amounts of income and expense during the reporting period. Actual results could differ from those estimates.
| 30 |
Core Bond Portfolio
December 31, 2018
Notes to Financial Statements — continued
G Indemnifications — Under the Portfolio’s organizational documents, its officers and Trustees may be indemnified against certain liabilities and expenses arising out of the performance of their duties to the Portfolio. Under Massachusetts law, if certain conditions prevail, interestholders in the Portfolio could be deemed to have personal liability for the obligations of the Portfolio. However, the Portfolio’s Declaration of Trust contains an express disclaimer of liability on the part of Portfolio interestholders and the By-laws provide that the Portfolio shall assume the defense on behalf of any Portfolio interestholder. Moreover, the By-laws also provide for indemnification out of Portfolio property of any interestholder held personally liable solely by reason of being or having been an interestholder for all loss or expense arising from such liability. Additionally, in the normal course of business, the Portfolio enters into agreements with service providers that may contain indemnification clauses. The Portfolio’s maximum exposure under these arrangements is unknown as this would involve future claims that may be made against the Portfolio that have not yet occurred.
H Financial Futures Contracts — Upon entering into a financial futures contract, the Portfolio is required to deposit with the broker, either in cash or securities, an amount equal to a certain percentage of the contract amount (initial margin). Subsequent payments, known as variation margin, are made or received by the Portfolio each business day, depending on the daily fluctuations in the value of the underlying security, and are recorded as unrealized gains or losses by the Portfolio. Gains (losses) are realized upon the expiration or closing of the financial futures contracts. Should market conditions change unexpectedly, the Portfolio may not achieve the anticipated benefits of the financial futures contracts and may realize a loss. Futures contracts have minimal counterparty risk as they are exchange traded and the clearinghouse for the exchange is substituted as the counterparty, guaranteeing counterparty performance.
I Purchased Options — Upon the purchase of a call or put option, the premium paid by the Portfolio is included in the Statement of Assets and Liabilities as an investment. The amount of the investment is subsequently marked-to-market to reflect the current market value of the option purchased, in accordance with the Portfolio’s policies on investment valuations discussed above. As the purchaser of an index option, the Portfolio has the right to receive a cash payment equal to any depreciation in the value of the index below the exercise price of the option (in the case of a put) or equal to any appreciation in the value of the index over the exercise price of the option (in the case of a call) as of the valuation date of the option. If an option which the Portfolio had purchased expires on the stipulated expiration date, the Portfolio will realize a loss in the amount of the cost of the option. If the Portfolio enters into a closing sale transaction, the Portfolio will realize a gain or loss, depending on whether the sales proceeds from the closing sale transaction are greater or less than the cost of the option. If the Portfolio exercises a put option on a security, it will realize a gain or loss from the sale of the underlying security, and the proceeds from such sale will be decreased by the premium originally paid. If the Portfolio exercises a call option on a security, the cost of the security which the Portfolio purchases upon exercise will be increased by the premium originally paid. The risk associated with purchasing options is limited to the premium originally paid. Purchased options traded over-the-counter involve risk that the issuer or counterparty will fail to perform its contractual obligations.
2 Investment Adviser Fee and Other Transactions with Affiliates
The investment adviser fee is earned by Boston Management and Research (BMR), a subsidiary of EVM, as compensation for investment advisory services rendered to the Portfolio. Pursuant to the investment advisory agreement and subsequent fee reduction agreement between the Portfolio and BMR, the fee is computed at an annual rate of 0.45% of the Portfolio’s average daily net assets up to $1 billion and at reduced rates on average daily net assets of $1 billion or more, and is payable monthly. The fee reduction cannot be terminated or reduced without the approval of a majority vote of the Trustees of the Portfolio who are not interested persons of BMR or the Portfolio and by the vote of a majority of the holders of interest in the Portfolio. For the year ended December 31, 2018, the Portfolio’s investment adviser fee amounted to $2,194,180 or 0.45% of the Portfolio’s average daily net assets. Pursuant to a voluntary expense reimbursement, BMR was allocated $93,487 of the Portfolio’s operating expenses for the year ended December 31, 2018. The Portfolio invests its cash in Cash Reserves Fund. EVM does not currently receive a fee for advisory services provided to Cash Reserves Fund.
Trustees and officers of the Portfolio who are members of EVM’s or BMR’s organizations receive remuneration for their services to the Portfolio out of the investment adviser fee. Trustees of the Portfolio who are not affiliated with the investment adviser may elect to defer receipt of all or a percentage of their annual fees in accordance with the terms of the Trustees Deferred Compensation Plan. For the year ended December 31, 2018, no significant amounts have been deferred. Certain officers and Trustees of the Portfolio are officers of the above organizations.
3 Purchases and Sales of Investments
Purchases and sales of investments, other than short-term obligations and including maturities and paydowns, for the year ended December 31, 2018 were as follows:
| Purchases | Sales | |||||||
Investments (non-U.S. Government) | $ | 253,970,038 | $ | 185,584,853 | ||||
U.S. Government and Agency Securities | 102,894,262 | 125,237,736 | ||||||
| $ | 356,864,300 | $ | 310,822,589 | |||||
| 31 |
Core Bond Portfolio
December 31, 2018
Notes to Financial Statements — continued
4 Federal Income Tax Basis of Investments
The cost and unrealized appreciation (depreciation) of investments, including open derivative contracts, of the Portfolio at December 31, 2018, as determined on a federal income tax basis, were as follows:
Aggregate cost | $ | 512,843,516 | ||
Gross unrealized appreciation | $ | 1,885,380 | ||
Gross unrealized depreciation | (12,718,645 | ) | ||
Net unrealized depreciation | $ | (10,833,265 | ) | |
5 Financial Instruments
The Portfolio may trade in financial instruments with off-balance sheet risk in the normal course of its investing activities. These financial instruments may include financial futures contracts and may involve, to a varying degree, elements of risk in excess of the amounts recognized for financial statement purposes. The notional or contractual amounts of these instruments represent the investment the Portfolio has in particular classes of financial instruments and do not necessarily represent the amounts potentially subject to risk. The measurement of the risks associated with these instruments is meaningful only when all related and offsetting transactions are considered. A summary of obligations under these financial instruments at December 31, 2018 is included in the Portfolio of Investments. At December 31, 2018, the Portfolio had sufficient cash and/or securities to cover commitments under these contracts.
The Portfolio is subject to interest rate risk in the normal course of pursuing its investment objectives. Because the Portfolio holds fixed-rate bonds, the value of these bonds may decrease if interest rates rise. The Portfolio enters into U.S. Treasury futures contracts and options thereon to hedge against fluctuations in interest rates.
The fair value of open derivative instruments (not considered to be hedging instruments for accounting disclosure purposes) and whose primary underlying risk exposure is interest rate risk at December 31, 2018 was as follows:
| Fair Value | ||||||||
| Derivative | Asset Derivative(1) | Liability Derivative(1) | ||||||
Financial futures contracts | $ | 2,668,462 | $ | (639,971 | ) | |||
| (1) | Amount represents cumulative unrealized appreciation or (depreciation) on futures contracts. Only the current day’s variation margin on open futures contracts is reported within the Statement of Assets and Liabilities as Receivable or Payable for variation margin on open financial futures contracts, as applicable. |
The effect of derivative instruments (not considered to be hedging instruments for accounting disclosure purposes) on the Statement of Operations and whose primary underlying risk exposure is interest rate risk for the year ended December 31, 2018 was as follows:
| Derivative | Realized Gain (Loss) on Derivatives Recognized in Income(1) | Change in Unrealized Appreciation (Depreciation) on Derivatives Recognized in Income(2) | ||||||
Purchased options | $ | 364,352 | $ | 28,780 | ||||
Financial futures contracts | (1,904,227 | ) | 2,006,356 | |||||
| (1) | Statement of Operations location: Net realized gain (loss) – Investment transactions and Financial futures contracts, respectively. |
| (2) | Statement of Operations location: Change in unrealized appreciation (depreciation) – Investments and Financial futures contracts, respectively. |
The average notional cost of futures contracts outstanding during the year ended December 31, 2018, which is indicative of the volume of this derivative type, was approximately as follows:
Futures Contracts — Long | Futures Contracts — Short | |||||
| $55,581,000 | $ | 27,044,000 | ||||
| 32 |
Core Bond Portfolio
December 31, 2018
Notes to Financial Statements — continued
The average number of purchased options contracts outstanding during the year ended December 31, 2018, which is indicative of the volume of this derivative type, was 118 contracts.
6 Line of Credit
The Portfolio participates with other portfolios and funds managed by EVM and its affiliates in a $625 million unsecured line of credit agreement with a group of banks, which is in effect through October 29, 2019. Borrowings are made by the Portfolio solely to facilitate the handling of unusual and/or unanticipated short-term cash requirements. Interest is charged to the Portfolio based on its borrowings at an amount above either the Eurodollar rate or Federal Funds rate. In addition, a fee computed at an annual rate of 0.15% on the daily unused portion of the line of credit is allocated among the participating portfolios and funds at the end of each quarter. Because the line of credit is not available exclusively to the Portfolio, it may be unable to borrow some or all of its requested amounts at any particular time. The Portfolio did not have any significant borrowings or allocated fees during the year ended December 31, 2018.
7 Fair Value Measurements
Under generally accepted accounting principles for fair value measurements, a three-tier hierarchy to prioritize the assumptions, referred to as inputs, is used in valuation techniques to measure fair value. The three-tier hierarchy of inputs is summarized in the three broad levels listed below.
| • | Level 1 – quoted prices in active markets for identical investments |
| • | Level 2 – other significant observable inputs (including quoted prices for similar investments, interest rates, prepayment speeds, credit risk, etc.) |
| • | Level 3 – significant unobservable inputs (including a fund’s own assumptions in determining the fair value of investments) |
In cases where the inputs used to measure fair value fall in different levels of the fair value hierarchy, the level disclosed is determined based on the lowest level input that is significant to the fair value measurement in its entirety. The inputs or methodology used for valuing securities are not necessarily an indication of the risk associated with investing in those securities.
At December 31, 2018, the hierarchy of inputs used in valuing the Portfolio’s investments and open derivative instruments, which are carried at value, were as follows:
| Asset Description | Level 1 | Level 2 | Level 3 | Total | ||||||||||||
Corporate Bonds & Notes | $ | — | $ | 208,514,064 | $ | — | $ | 208,514,064 | ||||||||
Agency Mortgage-Backed Securities | — | 61,111,322 | — | 61,111,322 | ||||||||||||
Collateralized Mortgage Obligations | — | 20,448,855 | — | 20,448,855 | ||||||||||||
Commercial Mortgage-Backed Securities | — | 40,500,155 | — | 40,500,155 | ||||||||||||
Asset-Backed Securities | — | 91,641,973 | — | 91,641,973 | ||||||||||||
U.S. Treasury Obligations | — | 61,010,193 | — | 61,010,193 | ||||||||||||
Senior Floating-Rate Loans | — | 11,148,512 | — | 11,148,512 | ||||||||||||
Short-Term Investments — | ||||||||||||||||
Commercial Paper | — | 1,431,205 | — | 1,431,205 | ||||||||||||
Other | — | 6,203,972 | — | 6,203,972 | ||||||||||||
Total Investments | $ | — | $ | 502,010,251 | $ | — | $ | 502,010,251 | ||||||||
Futures Contracts | $ | 2,668,462 | $ | — | $ | — | $ | 2,668,462 | ||||||||
Total | $ | 2,668,462 | $ | 502,010,251 | $ | — | $ | 504,678,713 | ||||||||
Liability Description | ||||||||||||||||
Futures Contracts | $ | (639,971 | ) | $ | — | $ | — | $ | (639,971 | ) | ||||||
Total | $ | (639,971 | ) | $ | — | $ | — | $ | (639,971 | ) | ||||||
Level 3 investments at the beginning and/or end of the period in relation to net assets were not significant and accordingly, a reconciliation of Level 3 assets for the year ended December 31, 2018 is not presented.
| 33 |
Core Bond Portfolio
December 31, 2018
Report of Independent Registered Public Accounting Firm
To the Trustees and Investors of Core Bond Portfolio:
Opinion on the Financial Statements and Financial Highlights
We have audited the accompanying statement of assets and liabilities of Core Bond Portfolio (the “Portfolio”), including the portfolio of investments, as of December 31, 2018, the related statement of operations for the year then ended, the statements of changes in net assets for each of the two years in the period then ended, the financial highlights for each of the five years in the period then ended, and the related notes. In our opinion, the financial statements and financial highlights present fairly, in all material respects, the financial position of the Portfolio as of December 31, 2018, and the results of its operations for the year then ended, the changes in its net assets for each of the two years in the period then ended, and the financial highlights for each of the five years in the period then ended, in conformity with accounting principles generally accepted in the United States of America.
Basis for Opinion
These financial statements and financial highlights are the responsibility of the Portfolio’s management. Our responsibility is to express an opinion on the Portfolio’s financial statements and financial highlights based on our audits. We are a public accounting firm registered with the Public Company Accounting Oversight Board (United States) (PCAOB) and are required to be independent with respect to the Portfolio in accordance with the U.S. federal securities laws and the applicable rules and regulations of the Securities and Exchange Commission and the PCAOB.
We conducted our audits in accordance with the standards of the PCAOB. Those standards require that we plan and perform the audit to obtain reasonable assurance about whether the financial statements and financial highlights are free of material misstatement, whether due to error or fraud. The Portfolio is not required to have, nor were we engaged to perform, an audit of its internal control over financial reporting. As part of our audits we are required to obtain an understanding of internal control over financial reporting but not for the purpose of expressing an opinion on the effectiveness of the Portfolio’s internal control over financial reporting. Accordingly, we express no such opinion.
Our audits included performing procedures to assess the risks of material misstatement of the financial statements and financial highlights, whether due to error or fraud, and performing procedures that respond to those risks. Such procedures included examining, on a test basis, evidence regarding the amounts and disclosures in the financial statements and financial highlights. Our audits also included evaluating the accounting principles used and significant estimates made by management, as well as evaluating the overall presentation of the financial statements and financial highlights. Our procedures included confirmation of securities and senior loans owned as of December 31, 2018, by correspondence with the custodian, brokers and selling or agent banks; when replies were not received from brokers and selling or agent banks, we performed other auditing procedures. We believe that our audits provide a reasonable basis for our opinion.
/s/ Deloitte & Touche LLP
Boston, Massachusetts
February 22, 2019
We have served as the auditor of one or more Eaton Vance investment companies since 1959.
| 34 |
Eaton Vance Core Bond Fund
Core Bond Portfolio
December 31, 2018
Special Meeting of Shareholders (Unaudited)
Eaton Vance Core Bond Fund
The Fund held a Special Meeting of Shareholders on September 20, 2018 to elect the five Trustees listed below. The other Trustees named herein continue to serve as Trustees. The results of the vote with respect to the Fund were as follows:
| Number of Shares | ||||||||
| Nominee for Trustee | For | Withheld | ||||||
Mark R. Fetting | 7,293,932 | 29,499 | ||||||
Keith Quinton | 7,299,922 | 23,509 | ||||||
Marcus L. Smith | 7,293,932 | 29,499 | ||||||
Susan J. Sutherland | 7,299,922 | 23,509 | ||||||
Scott E. Wennerholm | 7,293,932 | 29,499 | ||||||
Results are rounded to the nearest whole number.
Core Bond Portfolio
The Portfolio held a Special Meeting of Interestholders on September 20, 2018 to elect the five Trustees listed below. The other Trustees named herein continue to serve as Trustees. The results of the vote with respect to the Fund’s interest in the Portfolio were as follows:
| Interest in the Portfolio | ||||||||
| Nominee for Trustee | For | Withheld | ||||||
Mark R. Fetting | 99% | 1% | ||||||
Keith Quinton | 99% | 1% | ||||||
Marcus L. Smith | 99% | 1% | ||||||
Susan J. Sutherland | 99% | 1% | ||||||
Scott E. Wennerholm | 99% | 1% | ||||||
Results are rounded to the nearest whole number.
| 35 |
Eaton Vance
Core Bond Fund
December 31, 2018
Management and Organization
Fund Management. The Trustees of Eaton Vance Special Investment Trust (the Trust) and Core Bond Portfolio (the Portfolio) are responsible for the overall management and supervision of the Trust’s and Portfolio’s affairs. The Trustees and officers of the Trust and the Portfolio are listed below. Except as indicated, each individual has held the office shown or other offices in the same company for the last five years. Trustees and officers of the Trust and the Portfolio hold indefinite terms of office. The “noninterested Trustees” consist of those Trustees who are not “interested persons” of the Trust and the Portfolio, as that term is defined under the 1940 Act. The business address of each Trustee and officer is Two International Place, Boston, Massachusetts 02110. As used below, “EVC” refers to Eaton Vance Corp., “EV” refers to Eaton Vance, Inc., “EVM” refers to Eaton Vance Management, “BMR” refers to Boston Management and Research and “EVD” refers to Eaton Vance Distributors, Inc. EVC and EV are the corporate parent and trustee, respectively, of EVM and BMR. EVD is the Fund’s principal underwriter, the Portfolio’s placement agent and a wholly-owned subsidiary of EVC. Each officer affiliated with Eaton Vance may hold a position with other Eaton Vance affiliates that is comparable to his or her position with EVM listed below. Each Trustee oversees 175 portfolios in the Eaton Vance Complex (including all master and feeder funds in a master feeder structure). Each officer serves as an officer of certain other Eaton Vance funds. Each Trustee and officer serves until his or her successor is elected.
| Name and Year of Birth | Position(s) with the and the Portfolio | Trustee Since(1) | Principal Occupation(s) and Directorships During Past Five Years and Other Relevant Experience | |||
| Interested Trustee | ||||||
Thomas E. Faust Jr. 1958 | Trustee | 2007 | Chairman, Chief Executive Officer and President of EVC, Director and President of EV, Chief Executive Officer and President of EVM and BMR, and Director of EVD. Trustee and/or officer of 175 registered investment companies. Mr. Faust is an interested person because of his positions with EVM, BMR, EVD, EVC and EV, which are affiliates of the Trust and the Portfolio. Directorships in the Last Five Years.(2) Director of EVC and Hexavest Inc. (investment management firm). | |||
| Noninterested Trustees | ||||||
Mark R. Fetting 1954 | Trustee | 2016 | Private investor. Formerly held various positions at Legg Mason, Inc. (investment management firm) (2000-2012), including President, Chief Executive Officer, Director and Chairman (2008-2012), Senior Executive Vice President (2004-2008) and Executive Vice President (2001-2004). Formerly, President of Legg Mason family of funds (2001-2008). Formerly, Division President and Senior Officer of Prudential Financial Group, Inc. and related companies (investment management firm)(1991-2000). Directorships in the Last Five Years. None. | |||
Cynthia E. Frost 1961 | Trustee | 2014 | Private investor. Formerly, Chief Investment Officer of Brown University (university endowment) (2000-2012). Formerly, Portfolio Strategist for Duke Management Company (university endowment manager) (1995-2000). Formerly, Managing Director, Cambridge Associates (investment consulting company) (1989-1995). Formerly, Consultant, Bain and Company (management consulting firm) (1987-1989). Formerly, Senior Equity Analyst, BA Investment Management Company (1983-1985). Directorships in the Last Five Years. None. | |||
George J. Gorman 1952 | Trustee | 2014 | Principal at George J. Gorman LLC (consulting firm). Formerly, Senior Partner at Ernst & Young LLP (a registered public accounting firm) (1974-2009). Directorships in the Last Five Years.Formerly, Trustee of the BofA Funds Series Trust (11 funds) (2011-2014) and of the Ashmore Funds (9 funds) (2010-2014). | |||
Valerie A. Mosley 1960 | Trustee | 2014 | Chairwoman and Chief Executive Officer of Valmo Ventures (a consulting and investment firm). Former Partner and Senior Vice President, Portfolio Manager and Investment Strategist at Wellington Management Company, LLP (investment management firm) (1992-2012). Former Chief Investment Officer, PG Corbin Asset Management (1990-1992). Formerly worked in institutional corporate bond sales at Kidder Peabody (1986-1990). Directorships in the Last Five Years.(2) Director of Envestnet, Inc. (provider of intelligent systems for wealth management and financial wellness) (since 2018). | |||
| 36 |
Eaton Vance
Core Bond Fund
December 31, 2018
Management and Organization — continued
| Name and Year of Birth | Position(s) with the and the Portfolio | Trustee Since(1) | Principal Occupation(s) and Directorships During Past Five Years and Other Relevant Experience | |||
| Noninterested Trustees (continued) | ||||||
William H. Park 1947 | Chairperson of the Board and Trustee | 2016 (Chairperson) 2003 (Trustee) | Private investor. Formerly, Consultant (management and transactional) (2012-2014). Formerly, Chief Financial Officer, Aveon Group L.P. (investment management firm) (2010-2011). Formerly, Vice Chairman, Commercial Industrial Finance Corp. (specialty finance company) (2006-2010). Formerly, President and Chief Executive Officer, Prizm Capital Management, LLC (investment management firm) (2002-2005). Formerly, Executive Vice President and Chief Financial Officer, United Asset Management Corporation (investment management firm) (1982-2001). Formerly, Senior Manager, Price Waterhouse (now PricewaterhouseCoopers) (a registered public accounting firm) (1972-1981). Directorships in the Last Five Years.(2) None. | |||
Helen Frame Peters 1948 | Trustee | 2008 | Professor of Finance, Carroll School of Management, Boston College. Formerly, Dean, Carroll School of Management, Boston College (2000-2002). Formerly, Chief Investment Officer, Fixed Income, Scudder Kemper Investments (investment management firm) (1998-1999). Formerly, Chief Investment Officer, Equity and Fixed Income, Colonial Management Associates (investment management firm) (1991-1998). Directorships in the Last Five Years.(2) None. | |||
Keith Quinton(3) 1958 | Trustee | 2018 | Independent Investment Committee Member at New Hampshire Retirement System (since 2017). Advisory Committee member at Northfield Information Services, Inc. (risk management analytics provider) (since 2016). Formerly, Portfolio Manager and Senior Quantitative Analyst at Fidelity Investments (investment management firm)(2001-2014). Directorships in the Last Five Years. Director of New Hampshire Municipal Bond Bank (since 2016). | |||
Marcus L. Smith(3) 1966 | Trustee | 2018 | Member of Posse Boston Advisory Board (foundation) (since 2015); Trustee at University of Mount Union (since 2008). Formerly, Portfolio Manager at MFS Investment Management (investment management firm) (1994-2017). Directorships in the Last Five Years. Director of MSCI Inc. (global provider of investment decision support tools) (since 2017). Director of DCT Industrial Trust Inc. (logistics real estate company) (since 2017). | |||
Susan J. Sutherland 1957 | Trustee | 2015 | Private investor. Formerly, Associate, Counsel and Partner at Skadden, Arps, Slate, Meagher & Flom LLP (law firm) (1982-2013). Directorships in the Last Five Years. Formerly, Director of Montpelier Re Holdings Ltd. (global provider of customized insurance and reinsurance products) (2013-2015). | |||
Scott E. Wennerholm 1959 | Trustee | 2016 | Formerly, Trustee at Wheelock College (postsecondary institution) (2012-2018). Formerly, Consultant at GF Parish Group (executive recruiting firm) (2016-2017). Formerly, Chief Operating Officer and Executive Vice President at BNY Mellon Asset Management (investment management firm) (2005-2011). Formerly, Chief Operating Officer and Chief Financial Officer at Natixis Global Asset Management (investment management firm) (1997-2004). Formerly, Vice President at Fidelity Investments Institutional Services (investment management firm) (1994-1997). Directorships in the Last Five Years. None. | |||
| Name and Year of Birth | Position(s) with the and the Portfolio | Officer Since(4) | Principal Occupation(s) During Past Five Years | |||
| Principal Officers who are not Trustees | ||||||
Payson F. Swaffield 1956 | President | 2003 | Vice President and Chief Income Investment Officer of EVM and BMR. Also Vice President of Calvert Research and Management (“CRM”). | |||
Maureen A. Gemma 1960 | Vice President, Secretary and Chief Legal Officer | 2005 | Vice President of EVM and BMR. Also Vice President of CRM. | |||
| 37 |
Eaton Vance
Core Bond Fund
December 31, 2018
Management and Organization — continued
| Name and Year of Birth | Position(s) with the and the Portfolio | Officer Since(4) | Principal Occupation(s) During Past Five Years | |||
| Principal Officers who are not Trustees (continued) | ||||||
James F. Kirchner 1967 | Treasurer | 2007 | Vice President of EVM and BMR. Also Vice President of CRM. | |||
Richard F. Froio 1968 | Chief Compliance Officer | 2017 | Vice President of EVM and BMR since 2017. Formerly, Deputy Chief Compliance Officer (Adviser/Funds) and Chief Compliance Officer (Distribution) at PIMCO(2012-2017) and Managing Director at BlackRock/Barclays Global Investors(2009-2012). | |||
| (1) | Year first appointed to serve as Trustee for a fund in the Eaton Vance family of funds. Each Trustee has served continuously since appointment unless indicated otherwise. |
| (2) | During their respective tenures, the Trustees (except for Mmes. Frost and Sutherland and Messrs. Fetting, Gorman, Quinton, Smith and Wennerholm) also served as Board members of one or more of the following funds (which operated in the years noted): eUnitsTM 2 Year U.S. Market Participation Trust: Upside to Cap / Buffered Downside (launched in 2012 and terminated in 2014); and eUnitsTM 2 Year U.S. Market Participation Trust II: Upside to Cap / Buffered Downside (launched in 2012 and terminated in 2014). However, Ms. Mosley did not serve as a Board member of eUnitsTM 2 Year U.S. Market Participation Trust: Upside to Cap / Buffered Downside (launched in 2012 and terminated in 2014). |
| (3) | Messrs. Quinton and Smith began serving as Trustees effective October 1, 2018. |
| (4) | Year first elected to serve as officer of a fund in the Eaton Vance family of funds when the officer has served continuously. Otherwise, year of most recent election as an officer of a fund in the Eaton Vance family of funds. Titles may have changed since initial election. |
The SAI for the Fund includes additional information about the Trustees and officers of the Fund and the Portfolio and can be obtained without charge on Eaton Vance’s website at www.eatonvance.com or by calling 1-800-262-1122.
| 38 |
Eaton Vance Funds
IMPORTANT NOTICES
Privacy. The Eaton Vance organization is committed to ensuring your financial privacy. Each of the financial institutions identified below has in effect the following policy (“Privacy Policy”) with respect to nonpublic personal information about its customers:
| • | Only such information received from you, through application forms or otherwise, and information about your Eaton Vance fund transactions will be collected. This may include information such as name, address, social security number, tax status, account balances and transactions. |
| • | None of such information about you (or former customers) will be disclosed to anyone, except as permitted by law (which includes disclosure to employees necessary to service your account). In the normal course of servicing a customer’s account, Eaton Vance may share information with unaffiliated third parties that perform various required services such as transfer agents, custodians and broker-dealers. |
| • | Policies and procedures (including physical, electronic and procedural safeguards) are in place that are designed to protect the confidentiality of such information. |
| • | We reserve the right to change our Privacy Policy at any time upon proper notification to you. Customers may want to review our Privacy Policy periodically for changes by accessing the link on our homepage: www.eatonvance.com. |
Our pledge of privacy applies to the following entities within the Eaton Vance organization: the Eaton Vance Family of Funds, Eaton Vance Management, Eaton Vance Investment Counsel, Eaton Vance Distributors, Inc., Eaton Vance Trust Company, Eaton Vance Management (International) Limited, Eaton Vance Advisers International Ltd., Eaton Vance Management’s Real Estate Investment Group and Boston Management and Research. In addition, our Privacy Policy applies only to those Eaton Vance customers who are individuals and who have a direct relationship with us. If a customer’s account (i.e., fund shares) is held in the name of a third-party financial advisor/broker-dealer, it is likely that only such advisor’s privacy policies apply to the customer. This notice supersedes all previously issued privacy disclosures. For more information about Eaton Vance’s Privacy Policy, please call 1-800-262-1122.
Delivery of Shareholder Documents. The Securities and Exchange Commission (SEC) permits funds to deliver only one copy of shareholder documents, including prospectuses, proxy statements and shareholder reports, to fund investors with multiple accounts at the same residential or post office box address. This practice is often called “householding” and it helps eliminate duplicate mailings to shareholders.Eaton Vance, or your financial advisor, may household the mailing of your documents indefinitely unless you instruct Eaton Vance, or your financial advisor, otherwise.If you would prefer that your Eaton Vance documents not be householded, please contact Eaton Vance at 1-800-262-1122, or contact your financial advisor. Your instructions that householding not apply to delivery of your Eaton Vance documents will typically be effective within 30 days of receipt by Eaton Vance or your financial advisor.
Portfolio Holdings. Each Eaton Vance Fund and its underlying Portfolio(s) (if applicable) will file a schedule of portfolio holdings on Form N-Q with the SEC for the first and third quarters of each fiscal year. The Form N-Q will be available on the Eaton Vance website at www.eatonvance.com, by calling Eaton Vance at 1-800-262-1122 or in the EDGAR database on the SEC’s website at www.sec.gov. Form N-Q may also be reviewed and copied at the SEC’s public reference room in Washington, D.C. (call 1-800-732-0330 for information on the operation of the public reference room).
Proxy Voting. From time to time, funds are required to vote proxies related to the securities held by the funds. The Eaton Vance Funds or their underlying Portfolios (if applicable) vote proxies according to a set of policies and procedures approved by the Funds’ and Portfolios’ Boards. You may obtain a description of these policies and procedures and information on how the Funds or Portfolios voted proxies relating to portfolio securities during the most recent 12-month period ended June 30, without charge, upon request, by calling 1-800-262-1122 and by accessing the SEC’s website at www.sec.gov.
| 39 |
This Page Intentionally Left Blank
Investment Adviser of Core Bond Portfolio
Boston Management and Research
Two International Place
Boston, MA 02110
Administrator of Eaton Vance Core Bond Fund
Eaton Vance Management
Two International Place
Boston, MA 02110
Principal Underwriter*
Eaton Vance Distributors, Inc.
Two International Place
Boston, MA 02110
(617) 482-8260
Custodian
State Street Bank and Trust Company
State Street Financial Center, One Lincoln Street
Boston, MA 02111
Transfer Agent
BNY Mellon Investment Servicing (US) Inc.
Attn: Eaton Vance Funds
P.O. Box 9653
Providence, RI 02940-9653
(800) 262-1122
Independent Registered Public Accounting Firm
Deloitte & Touche LLP
200 Berkeley Street
Boston, MA 02116-5022
Fund Offices
Two International Place
Boston, MA 02110
| * | FINRA BrokerCheck. Investors may check the background of their Investment Professional by contacting the Financial Industry Regulatory Authority (FINRA). FINRA BrokerCheck is a free tool to help investors check the professional background of current and former FINRA-registered securities firms and brokers. FINRA BrokerCheck is available by calling 1-800-289-9999 and at www.FINRA.org. The FINRA BrokerCheck brochure describing this program is available to investors at www.FINRA.org. |

2978 12.31.18

Eaton Vance
Dividend Builder Fund
Annual Report
December 31, 2018
Important Note. Beginning on January 1, 2021, as permitted by regulations adopted by the Securities and Exchange Commission, paper copies of the Fund’s annual and semi-annual shareholder reports will no longer be sent by mail unless you specifically request paper copies of the reports. Instead, the reports will be made available on the Fund’s website (eatonvance.com/funddocuments), and you will be notified by mail each time a report is posted and provided with a website address to access the report.
If you already elected to receive shareholder reports electronically, you will not be affected by this change and you need not take any action. If you are a direct investor, you may elect to receive shareholder reports and other communications from the Fund electronically by signing up fore-Delivery at eatonvance.com/edelivery. If you own your shares through a financial intermediary (such as a broker-dealer or bank), you must contact your financial intermediary to sign up.
You may elect to receive all future Fund shareholder reports in paper free of charge. If you are a direct investor, you can inform the Fund that you wish to continue receiving paper copies of your shareholder reports by calling1-800-262-1122. If you own these shares through a financial intermediary, you must contact your financial intermediary or follow instructions included with this disclosure, if applicable, to elect to continue to receive paper copies of your shareholder reports. Your election to receive reports in paper will apply to all Eaton Vance funds held directly or to all funds held through your financial intermediary, as applicable.

Commodity Futures Trading Commission Registration. Effective December 31, 2012, the Commodity Futures Trading Commission (“CFTC”) adopted certain regulatory changes that subject registered investment companies and advisers to regulation by the CFTC if a fund invests more than a prescribed level of its assets in certain CFTC-regulated instruments (including futures, certain options and swap agreements) or markets itself as providing investment exposure to such instruments. The Fund has claimed an exclusion from the definition of the term “commodity pool operator” under the Commodity Exchange Act. Accordingly, neither the Fund nor the adviser with respect to the operation of the Fund is subject to CFTC regulation. Because of its management of other strategies, the Fund’s adviser is registered with the CFTC as a commodity pool operator and a commodity trading advisor.
Fund shares are not insured by the FDIC and are not deposits or other obligations of, or guaranteed by, any depository institution. Shares are subject to investment risks, including possible loss of principal invested.
This report must be preceded or accompanied by a current summary prospectus or prospectus. Before investing, investors should consider carefully the investment objective, risks, and charges and expenses of a mutual fund. This and other important information is contained in the summary prospectus and prospectus, which can be obtained from a financial advisor. Prospective investors should read the prospectus carefully before investing. For further information, please call1-800-262-1122.
Annual ReportDecember 31, 2018
Eaton Vance
Dividend Builder Fund
Table of Contents
Management’s Discussion of Fund Performance | 2 | |||
Performance | 3 | |||
Fund Profile | 4 | |||
Endnotes and Additional Disclosures | 5 | |||
Fund Expenses | 6 | |||
Financial Statements | 7 | |||
Report of Independent Registered Public Accounting Firm | 22 | |||
Federal Tax Information | 23 | |||
Special Meeting of Shareholders | 24 | |||
Management and Organization | 25 | |||
Important Notices | 28 | |||
Eaton Vance
Dividend Builder Fund
December 31, 2018
Management’s Discussion of Fund Performance1
Economic and Market Conditions
U.S. stock indexes declined during the12-month period ended December 31, 2018, as a sharp downturn in the final quarter of the year erased earlier gains.
U.S. stocks opened the period on an upswing, as investors reacted favorably to the passage of the Republican tax reform package in December 2017. Sharp cuts in corporate taxes, a key element of the bill, raised corporate-profit expectations. U.S. stocks also got a boost from positive U.S. economic data, including the unemployment rate, which fell to a17-year low.
In February 2018, however, U.S. stocks pulled back amid fears that rising interest rates might boost the appeal of fixed-income investments. After a brief rebound, equity markets again weakened in the spring of 2018, as investors confronted the prospect of a global trade war due to President Trump’sthen-new tariffs. The broad tariffs drew retaliatory actions from impacted countries including China, Canada, and certain countries in the European Union.
U.S. stocks bounced back during the summer months led by technology stocks, which rebounded following an earlier setback from a wave of data-privacy scandals. Markets plunged in the final three months of the period amid global trade war fears and sagging economies in China and Europe. Despite a partial rebound in the final days of the period, the U.S. stock market’s December 2018 plunge was the worst monthly loss since the 2008 financial crisis.
Amid investor worries, however, U.S. economic data remained largely positive during the period, prompting the U.S. Federal Reserve (the Fed) to raise the federal funds rate in December 2018 for the fourth time during the period. Since then, the Fed has indicated that it may reconsider its planned 2019 rate hikes.
For the12-month period ended December 31, 2018, the blue-chip Dow Jones Industrial Average®2 declined 3.48%, while the broader U.S. equity market represented by the S&P 500® Index fell 4.38%. The technology-laden NASDAQ Composite Index fell 2.84% during the period.Large-cap U.S. stocks as measured by the S&P 500® Index generally outperformed theirsmall-cap counterparts as measured by the Russell 2000® Index during the period. Growth stocks as a group outpaced value stocks in both the large- andsmall-cap categories, as measured by the Russell Growth and Value Indexes.
Fund Performance
For the12-month period ended December 31, 2018, Eaton Vance Dividend Builder Fund (the Fund) returned –5.40% for Class A shares at net asset value (NAV), underperforming its benchmark, the S&P 500® Index (the Index), which returned –4.38%.
The Fund’s underperformance relative to the Index resulted from unfavorable stock selections, while sector and industry allocations had a positive effect on performance. The Fund recorded positive returns in five of the 11 market sectors in the Index, while the Index itself had positive returns in four sectors.
Stock selections in the information technology (IT) sector were the largest detractors from relative Fund performance versus the Index during the period. In the outperforming IT services industry, the Fund’s lack of exposure to credit card issuer Mastercard, Inc. and an underweight position in Visa, Inc. constrained relative Fund results, since both companies benefited from a strong global economy during the period.
The materials sector also dragged down Fund performance versus the Index. An overweight position in the underperforming containers & packaging industry, particularly industry giant International Paper Co., detracted from relative Fund results. The company faced mounting price competition due to increased production capacity within the industry.
In the consumer staples sector, an overweight position in the lagging tobacco industry hampered Fund results versus the Index during the period. Tobacco company Philip Morris International, Inc. was the Fund’s poorest-performing stock. Altria Group, Inc. (Altria) was also among the Fund’s weakest stocks. Both companies suffered from declining tobacco sales amid growing competition from alternative smoking products. Altria was sold during the period.
On the positive side, stock selections and an overweight position in the real estate sector contributed to relative Fund performance versus in the Index during the period. In the real estate investment trust industry,out-of-Index holding National Retail Properties, Inc., owner ofgas-convenience store properties, was one of the Fund’s leading stocks after earnings topped expectations.
The communications services sector also outperformed relative to the Index due to stock selections. In the diversified telecommunications industry, the Fund’s underweight position in AT&T, Inc. boosted relative Fund results, as the company lagged amid investor concerns about high debt levels from a major acquisition. Stock selections in the energy sector also boosted relative Fund returns versus the Index during the period, particularly in the oil & gas industry.
In the consumer discretionary sector,e-commerce giant Amazon.com, Inc. was the Fund’s top overall stock during the period. The company benefited from continued acceleration in its key business segments — web services, retail, and advertising.
See Endnotes and Additional Disclosures in this report.
Past performance is no guarantee of future results. Returns are historical and are calculated by determining the percentage change in net asset value (NAV) or offering price (as applicable) with all distributions reinvested. Investment return and principal value will fluctuate so that shares, when redeemed, may be worth more or less than their original cost. Performance less than or equal to one year is cumulative. Performance is for the stated time period only; due to market volatility, the Fund’s current performance may be lower or higher than quoted. Returns are before taxes unless otherwise noted. For performance as of the most recentmonth-end, please refer to eatonvance.com.
| 2 |
Eaton Vance
Dividend Builder Fund
December 31, 2018
Performance2,3
Portfolio ManagerCharles B. Gaffney
| % Average Annual Total Returns | Class Inception Date | Performance Inception Date | One Year | Five Years | Ten Years | |||||||||||||||
Class A at NAV | 12/18/1981 | 12/18/1981 | –5.40 | % | 7.14 | % | 9.60 | % | ||||||||||||
Class A with 5.75% Maximum Sales Charge | — | — | –10.85 | 5.88 | 8.95 | |||||||||||||||
Class C at NAV | 11/01/1993 | 12/18/1981 | –6.09 | 6.33 | 8.78 | |||||||||||||||
Class C with 1% Maximum Sales Charge | — | — | –6.95 | 6.33 | 8.78 | |||||||||||||||
Class I at NAV | 06/20/2005 | 12/18/1981 | –5.10 | 7.40 | 9.87 | |||||||||||||||
S&P 500® Index | — | — | –4.38 | % | 8.49 | % | 13.11 | % | ||||||||||||
| % Total Annual Operating Expense Ratios4 | Class A | Class C | Class I | |||||||||||||||||
| 1.02 | % | 1.77 | % | 0.77 | % | |||||||||||||||
Growth of $10,000
This graph shows the change in value of a hypothetical investment of $10,000 in Class A of the Fund for the period indicated. For comparison, the same investment is shown in the indicated index.
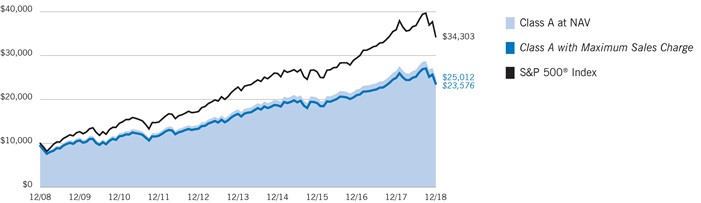
| Growth of Investment | Amount Invested | Period Beginning | At NAV | With Maximum Sales Charge | ||||||||||||
Class C | $ | 10,000 | 12/31/2008 | $ | 23,200 | N.A. | ||||||||||
Class I | $ | 250,000 | 12/31/2008 | $ | 640,909 | N.A. | ||||||||||
See Endnotes and Additional Disclosures in this report.
Past performance is no guarantee of future results. Returns are historical and are calculated by determining the percentage change in net asset value (NAV) or offering price (as applicable) with all distributions reinvested. Investment return and principal value will fluctuate so that shares, when redeemed, may be worth more or less than their original cost. Performance less than or equal to one year is cumulative. Performance is for the stated time period only; due to market volatility, the Fund’s current performance may be lower or higher than quoted. Returns are before taxes unless otherwise noted. For performance as of the most recentmonth-end, please refer to eatonvance.com.
| 3 |
Eaton Vance
Dividend Builder Fund
December 31, 2018
Fund Profile
Sector Allocation (% of net assets)5
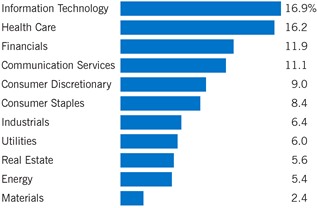
Top 10 Holdings (% of net assets)5
Microsoft Corp. | 4.1 | % | ||
Apple, Inc. | 4.0 | |||
Alphabet, Inc., Class C | 3.0 | |||
Verizon Communications, Inc. | 2.8 | |||
Simon Property Group, Inc. | 2.5 | |||
Amazon.com, Inc. | 2.4 | |||
Johnson & Johnson | 2.3 | |||
Exxon Mobil Corp. | 2.2 | |||
Anthem, Inc. | 2.2 | |||
Pfizer, Inc. | 2.2 | |||
Total | 27.7 | % | ||
See Endnotes and Additional Disclosures in this report.
| 4 |
Eaton Vance
Dividend Builder Fund
December 31, 2018
Endnotes and Additional Disclosures
| 1 | The views expressed in this report are those of the portfolio manager(s) and are current only through the date stated at the top of this page. These views are subject to change at any time based upon market or other conditions, and Eaton Vance and the Fund(s) disclaim any responsibility to update such views. These views may not be relied upon as investment advice and, because investment decisions are based on many factors, may not be relied upon as an indication of trading intent on behalf of any Eaton Vance fund. This commentary may contain statements that are not historical facts, referred to as “forward looking statements.” The Fund’s actual future results may differ significantly from those stated in any forward looking statement, depending on factors such as changes in securities or financial markets or general economic conditions, the volume of sales and purchases of Fund shares, the continuation of investment advisory, administrative and service contracts, and other risks discussed from time to time in the Fund’s filings with the Securities and Exchange Commission. |
| 2 | Dow Jones Industrial Average® is a price-weighted average of 30 blue-chip stocks that are generally the leaders in their industry. S&P 500® Index is an unmanaged index oflarge-cap stocks commonly used as a measure of U.S. stock market performance. NASDAQ Composite Index is a market capitalization-weighted index of all domestic and international securities listed on NASDAQ. Source: Nasdaq, Inc. The information is provided by Nasdaq (with its affiliates, are referred to as the “Corporations”) and Nasdaq’s third party licensors on an “as is” basis and the Corporations make no guarantees and bear no liability of any kind with respect to the information or the Fund. Russell 2000® Index is an unmanaged index of 2,000 U.S.small-cap stocks. Unless otherwise stated, index returns do not reflect the effect of any applicable sales charges, commissions, expenses, taxes or leverage, as applicable. It is not possible to invest directly in an index. |
| 3 | Total Returns at NAV do not include applicable sales charges. If sales charges were deducted, the returns would be lower. Total Returns shown with maximum sales charge reflect the stated maximum sales charge. Unless otherwise stated, performance does not reflect the deduction of taxes on Fund distributions or redemptions of Fund shares. |
| 4 | Source: Fund prospectus. The expense ratios for the current reporting period can be found in the Financial Highlights section of this report. |
| 5 | Excludes cash and cash equivalents. |
Fund profile subject to change due to active management. |
| 5 |
Eaton Vance
Dividend Builder Fund
December 31, 2018
Fund Expenses
Example: As a Fund shareholder, you incur two types of costs: (1) transaction costs, including sales charges (loads) on purchases and redemption fees (if applicable); and (2) ongoing costs, including management fees; distribution and/or service fees; and other Fund expenses. This Example is intended to help you understand your ongoing costs (in dollars) of Fund investing and to compare these costs with the ongoing costs of investing in other mutual funds. The Example is based on an investment of $1,000 invested at the beginning of the period and held for the entire period (July 1, 2018 – December 31, 2018).
Actual Expenses: The first section of the table below provides information about actual account values and actual expenses. You may use the information in this section, together with the amount you invested, to estimate the expenses that you paid over the period. Simply divide your account value by $1,000 (for example, an $8,600 account value divided by $1,000 = 8.6), then multiply the result by the number in the first section under the heading entitled “Expenses Paid During Period” to estimate the expenses you paid on your account during this period.
Hypothetical Example for Comparison Purposes: The second section of the table below provides information about hypothetical account values and hypothetical expenses based on the actual Fund expense ratio and an assumed rate of return of 5% per year (before expenses), which is not the actual Fund return. The hypothetical account values and expenses may not be used to estimate the actual ending account balance or expenses you paid for the period. You may use this information to compare the ongoing costs of investing in your Fund and other funds. To do so, compare this 5% hypothetical example with the 5% hypothetical examples that appear in the shareholder reports of the other funds.
Please note that the expenses shown in the table are meant to highlight your ongoing costs only and do not reflect any transactional costs, such as sales charges (loads) or redemption fees (if applicable). Therefore, the second section of the table is useful in comparing ongoing costs only, and will not help you determine the relative total costs of owning different funds. In addition, if these transactional costs were included, your costs would be higher.
| Beginning Account Value (7/1/18) | Ending Account Value (12/31/18) | Expenses Paid During Period* (7/1/18 – 12/31/18) | Annualized Expense Ratio | |||||||||||||
Actual |
| |||||||||||||||
Class A | $ | 1,000.00 | $ | 936.90 | $ | 4.98 | 1.02 | % | ||||||||
Class C | $ | 1,000.00 | $ | 932.90 | $ | 8.62 | 1.77 | % | ||||||||
Class I | $ | 1,000.00 | $ | 938.00 | $ | 3.76 | 0.77 | % | ||||||||
Hypothetical |
| |||||||||||||||
(5% return per year before expenses) | ||||||||||||||||
Class A | $ | 1,000.00 | $ | 1,020.10 | $ | 5.19 | 1.02 | % | ||||||||
Class C | $ | 1,000.00 | $ | 1,016.30 | $ | 9.00 | 1.77 | % | ||||||||
Class I | $ | 1,000.00 | $ | 1,021.30 | $ | 3.92 | 0.77 | % | ||||||||
| * | Expenses are equal to the Fund’s annualized expense ratio for the indicated Class, multiplied by the average account value over the period, multiplied by 184/365 (to reflect theone-half year period). The Example assumes that the $1,000 was invested at the net asset value per share determined at the close of business on June 30, 2018. |
| 6 |
Eaton Vance
Dividend Builder Fund
December 31, 2018
Portfolio of Investments
| Common Stocks— 99.3% |
| |||||||
| Security | Shares | Value | ||||||
| Aerospace & Defense— 3.1% | ||||||||
Harris Corp. | 75,000 | $ | 10,098,750 | |||||
Lockheed Martin Corp. | 40,300 | 10,552,152 | ||||||
Textron, Inc. | 105,200 | 4,838,148 | ||||||
| $ | 25,489,050 | |||||||
| Banks— 5.8% | ||||||||
Bank of America Corp. | 595,700 | $ | 14,678,048 | |||||
Canadian Imperial Bank of Commerce | 101,772 | 7,579,971 | ||||||
JPMorgan Chase & Co. | 164,600 | 16,068,252 | ||||||
People’s United Financial, Inc. | 594,500 | 8,578,635 | ||||||
| $ | 46,904,906 | |||||||
| Beverages— 4.2% | ||||||||
Coca-Cola Co. (The) | 325,700 | $ | 15,421,895 | |||||
Constellation Brands, Inc., Class A | 27,000 | 4,342,140 | ||||||
PepsiCo, Inc. | 128,200 | 14,163,536 | ||||||
| $ | 33,927,571 | |||||||
| Biotechnology— 2.4% | ||||||||
AbbVie, Inc. | 107,600 | $ | 9,919,644 | |||||
Celgene Corp.(1) | 30,840 | 1,976,536 | ||||||
Gilead Sciences, Inc. | 115,400 | 7,218,270 | ||||||
| $ | 19,114,450 | |||||||
| Capital Markets— 1.6% | ||||||||
CME Group, Inc. | 68,500 | $ | 12,886,220 | |||||
| $ | 12,886,220 | |||||||
| Chemicals— 1.2% | ||||||||
DowDuPont, Inc. | 189,100 | $ | 10,113,068 | |||||
| $ | 10,113,068 | |||||||
| Communications Equipment— 1.0% | ||||||||
Cisco Systems, Inc. | 181,200 | $ | 7,851,396 | |||||
| $ | 7,851,396 | |||||||
| Consumer Finance— 0.5% | ||||||||
Navient Corp. | 498,700 | $ | 4,393,547 | |||||
| $ | 4,393,547 | |||||||
| Security | Shares | Value | ||||||
| Containers & Packaging— 1.2% | ||||||||
International Paper Co. | 236,353 | $ | 9,539,207 | |||||
| $ | 9,539,207 | |||||||
| Diversified Telecommunication Services— 3.8% | ||||||||
AT&T, Inc. | 279,400 | $ | 7,974,076 | |||||
Verizon Communications, Inc. | 409,680 | 23,032,210 | ||||||
| $ | 31,006,286 | |||||||
| Electric Utilities— 4.9% | ||||||||
Duke Energy Corp. | 160,200 | $ | 13,825,260 | |||||
Edison International | 171,400 | 9,730,378 | ||||||
Evergy, Inc. | 113,497 | 6,443,225 | ||||||
PPL Corp. | 345,600 | 9,790,848 | ||||||
| $ | 39,789,711 | |||||||
| Electronic Equipment, Instruments & Components— 0.8% | ||||||||
FLIR Systems, Inc. | 151,800 | $ | 6,609,372 | |||||
| $ | 6,609,372 | |||||||
| Energy Equipment & Services— 0.5% | ||||||||
Schlumberger, Ltd. | 106,600 | $ | 3,846,128 | |||||
| $ | 3,846,128 | |||||||
| Entertainment— 2.5% | ||||||||
Activision Blizzard, Inc. | 99,400 | $ | 4,629,058 | |||||
Walt Disney Co. (The) | 142,800 | 15,658,020 | ||||||
| $ | 20,287,078 | |||||||
| Equity Real Estate Investment Trusts (REITs)— 5.6% | ||||||||
AvalonBay Communities, Inc. | 58,300 | $ | 10,147,115 | |||||
National Retail Properties, Inc. | 314,500 | 15,256,395 | ||||||
Simon Property Group, Inc. | 119,800 | 20,125,202 | ||||||
| $ | 45,528,712 | |||||||
| Food & Staples Retailing— 0.6% | ||||||||
Walmart, Inc. | 55,400 | $ | 5,160,510 | |||||
| $ | 5,160,510 | |||||||
| Food Products— 1.1% | ||||||||
Campbell Soup Co.(2) | 172,200 | $ | 5,680,878 | |||||
Conagra Brands, Inc. | 147,740 | 3,155,726 | ||||||
| $ | 8,836,604 | |||||||
| 7 | See Notes to Financial Statements. |
Eaton Vance
Dividend Builder Fund
December 31, 2018
Portfolio of Investments — continued
| Security | Shares | Value | ||||||
| Health Care Equipment & Supplies— 2.6% | ||||||||
Danaher Corp. | 105,500 | $ | 10,879,160 | |||||
Medtronic PLC | 114,900 | 10,451,304 | ||||||
| $ | 21,330,464 | |||||||
| Health Care Providers & Services— 3.6% | ||||||||
Anthem, Inc. | 68,300 | $ | 17,937,629 | |||||
UnitedHealth Group, Inc. | 46,700 | 11,633,904 | ||||||
| $ | 29,571,533 | |||||||
| Hotels, Restaurants & Leisure— 2.0% | ||||||||
Extended Stay America, Inc. | 276,000 | $ | 4,278,000 | |||||
Starbucks Corp. | 183,000 | 11,785,200 | ||||||
| $ | 16,063,200 | |||||||
| Household Products— 1.6% | ||||||||
Procter & Gamble Co. (The) | 140,100 | $ | 12,877,992 | |||||
| $ | 12,877,992 | |||||||
| Independent Power and Renewable Electricity Producers— 1.1% | ||||||||
NextEra Energy Partners, L.P. | 201,800 | $ | 8,687,490 | |||||
| $ | 8,687,490 | |||||||
| Industrial Conglomerates— 1.6% | ||||||||
3M Co. | 69,600 | $ | 13,261,584 | |||||
| $ | 13,261,584 | |||||||
| Insurance— 4.0% | ||||||||
American Financial Group, Inc. | 138,600 | $ | 12,547,458 | |||||
Chubb, Ltd. | 94,400 | 12,194,592 | ||||||
First American Financial Corp. | 166,000 | 7,410,240 | ||||||
| $ | 32,152,290 | |||||||
| Interactive Media & Services— 4.8% | ||||||||
Alphabet, Inc., Class C(1) | 23,614 | $ | 24,454,895 | |||||
Facebook, Inc., Class A(1) | 110,700 | 14,511,663 | ||||||
| $ | 38,966,558 | |||||||
| Internet & Direct Marketing Retail— 2.4% | ||||||||
Amazon.com, Inc.(1) | 13,100 | $ | 19,675,807 | |||||
| $ | 19,675,807 | |||||||
| Security | Shares | Value | ||||||
| IT Services— 2.7% | ||||||||
Cognizant Technology Solutions Corp., Class A | 136,000 | $ | 8,633,280 | |||||
Visa, Inc., Class A | 99,900 | 13,180,806 | ||||||
| $ | 21,814,086 | |||||||
| Machinery— 1.1% | ||||||||
Stanley Black & Decker, Inc. | 75,400 | $ | 9,028,396 | |||||
| $ | 9,028,396 | |||||||
| Multiline Retail— 1.0% | ||||||||
Dollar Tree, Inc.(1) | 89,900 | $ | 8,119,768 | |||||
| $ | 8,119,768 | |||||||
| Oil, Gas & Consumable Fuels— 4.9% | ||||||||
BP PLC | 1,237,500 | $ | 7,823,088 | |||||
ConocoPhillips | 108,600 | 6,771,210 | ||||||
Exxon Mobil Corp. | 264,500 | 18,036,255 | ||||||
Phillips 66 | 82,400 | 7,098,760 | ||||||
| $ | 39,729,313 | |||||||
| Pharmaceuticals— 7.6% | ||||||||
Eli Lilly & Co. | 77,400 | $ | 8,956,728 | |||||
GlaxoSmithKline PLC ADR | 172,600 | 6,595,046 | ||||||
Johnson & Johnson | 144,800 | 18,686,440 | ||||||
Merck & Co., Inc. | 127,500 | 9,742,275 | ||||||
Pfizer, Inc. | 410,800 | 17,931,420 | ||||||
| $ | 61,911,909 | |||||||
| Professional Services— 0.5% | ||||||||
IHS Markit, Ltd.(1) | 86,000 | $ | 4,125,420 | |||||
| $ | 4,125,420 | |||||||
| Semiconductors & Semiconductor Equipment— 4.4% | ||||||||
Broadcom, Inc. | 49,700 | $ | 12,637,716 | |||||
QUALCOMM, Inc.(2) | 185,700 | 10,568,187 | ||||||
Texas Instruments, Inc. | 134,700 | 12,729,150 | ||||||
| $ | 35,935,053 | |||||||
| Software— 4.1% | ||||||||
Microsoft Corp. | 324,567 | $ | 32,966,270 | |||||
| $ | 32,966,270 | |||||||
| 8 | See Notes to Financial Statements. |
Eaton Vance
Dividend Builder Fund
December 31, 2018
Portfolio of Investments — continued
| Security | Shares | Value | ||||
| Specialty Retail— 1.9% | ||||||
Home Depot, Inc. (The) | 90,800 | $ | 15,601,256 | |||
| $ | 15,601,256 | |||||
| Technology Hardware, Storage & Peripherals— 4.0% | ||||||
Apple, Inc. | 203,437 | $ | 32,090,152 | |||
| $ | 32,090,152 | |||||
| Textiles, Apparel & Luxury Goods— 1.7% | ||||||
Gildan Activewear, Inc. | 321,700 | $ | 9,766,812 | |||
Tapestry, Inc. | 115,900 | 3,911,625 | ||||
| $ | 13,678,437 | |||||
| Tobacco— 0.9% | ||||||
Philip Morris International, Inc. | 111,435 | $ | 7,439,401 | |||
| $ | 7,439,401 | |||||
Total Common Stocks | $ | 806,310,195 | ||||
| Short-Term Investments— 0.2% |
| |||||
| Description | Units | Value | ||||
Eaton Vance Cash Reserves Fund, LLC, 2.46%(3) | 1,475,462 | $ | 1,475,314 | |||
Total Short-Term Investments | $ | 1,475,314 | ||||
Total Investments — 99.5% | $ | 807,785,509 | ||||
Other Assets, Less Liabilities — 0.5% | $ | 4,267,163 | ||||
Net Assets — 100.0% | $ | 812,052,672 | ||||
The percentage shown for each investment category in the Portfolio of Investments is based on net assets.
| (1) | Non-income producing security. |
| (2) | All or a portion of this security was on loan at December 31, 2018. The aggregate market value of securities on loan at December 31, 2018 was $16,086,574. |
| (3) | Affiliated investment company, available to Eaton Vance portfolios and funds, which invests in high quality, U.S. dollar denominated money market instruments. The rate shown is the annualizedseven-day yield as of December 31, 2018. |
Abbreviations:
| ADR | – | American Depositary Receipt | ||
| 9 | See Notes to Financial Statements. |
Eaton Vance
Dividend Builder Fund
December 31, 2018
Statement of Assets and Liabilities
| Assets | December 31, 2018 | |||
Unaffiliated investments, at value including $16,086,574 of securities on loan (identified cost, $776,748,921) | $ | 806,310,195 | ||
Affiliated investment, at value (identified cost, $1,475,192) | 1,475,314 | |||
Dividends receivable | 1,372,317 | |||
Dividends receivable from affiliated investment | 2,945 | |||
Receivable for investments sold | 3,869,921 | |||
Receivable for Fund shares sold | 672,643 | |||
Securities lending income receivable | 5,361 | |||
Tax reclaims receivable | 865,920 | |||
Total assets | $ | 814,574,616 | ||
| Liabilities |
| |||
Payable for Fund shares redeemed | $ | 1,531,994 | ||
Payable to affiliates: | ||||
Investment adviser fee | 459,147 | |||
Distribution and service fees | 219,976 | |||
Trustees’ fees | 10,258 | |||
Accrued expenses | 300,569 | |||
Total liabilities | $ | 2,521,944 | ||
Net Assets | $ | 812,052,672 | ||
| Sources of Net Assets |
| |||
Paid-in capital | $ | 779,735,868 | ||
Distributable earnings | 32,316,804 | |||
Total | $ | 812,052,672 | ||
| Class A Shares |
| |||
Net Assets | $ | 558,487,308 | ||
Shares Outstanding | 44,642,953 | |||
Net Asset Value and Redemption Price Per Share | ||||
(net assets ÷ shares of beneficial interest outstanding) | $ | 12.51 | ||
Maximum Offering Price Per Share | ||||
(100 ÷ 94.25 of net asset value per share) | $ | 13.27 | ||
| Class C Shares |
| |||
Net Assets | $ | 107,494,882 | ||
Shares Outstanding | 8,543,378 | |||
Net Asset Value and Offering Price Per Share* | ||||
(net assets ÷ shares of beneficial interest outstanding) | $ | 12.58 | ||
| Class I Shares |
| |||
Net Assets | $ | 146,070,482 | ||
Shares Outstanding | 11,686,621 | |||
Net Asset Value, Offering Price and Redemption Price Per Share | ||||
(net assets ÷ shares of beneficial interest outstanding) | $ | 12.50 | ||
On sales of $50,000 or more, the offering price of Class A shares is reduced.
| * | Redemption price per share is equal to the net asset value less any applicable contingent deferred sales charge. |
| 10 | See Notes to Financial Statements. |
Eaton Vance
Dividend Builder Fund
December 31, 2018
Statement of Operations
| Investment Income | Year Ended December 31, 2018 | |||
Dividends (net of foreign taxes, $147,847) | $ | 13,724,598 | ||
Dividends allocated from Portfolio (net of foreign taxes, $47,686) | 11,650,689 | |||
Dividends from affiliated investment | 30,650 | |||
Securities lending income, net | 27,452 | |||
Securities lending income allocated from Portfolio, net | 15,626 | |||
Expenses allocated from Portfolio | (2,882,726 | ) | ||
Total investment income | $ | 22,566,289 | ||
| Expenses | ||||
Investment adviser fee | $ | 3,327,538 | ||
Distribution and service fees | ||||
Class A | 1,623,847 | |||
Class C | 1,367,665 | |||
Trustees’ fees and expenses | 30,899 | |||
Custodian fee | 177,372 | |||
Transfer and dividend disbursing agent fees | 655,888 | |||
Legal and accounting services | 82,651 | |||
Printing and postage | 82,263 | |||
Registration fees | 44,374 | |||
Miscellaneous | 44,658 | |||
Total expenses | $ | 7,437,155 | ||
Net investment income | $ | 15,129,134 | ||
| Realized and Unrealized Gain (Loss) | ||||
Net realized gain (loss) — | ||||
Investment transactions | $ | 33,962,112 | ||
Investment transactions allocated from Portfolio | 27,883,868 | |||
Investment transactions — affiliated investment | 524 | |||
Foreign currency transactions | (4,792 | ) | ||
Foreign currency transactions allocated from Portfolio | (3,560 | ) | ||
Net realized gain | $ | 61,838,152 | ||
Change in unrealized appreciation (depreciation) — | ||||
Investments | $ | (113,795,158 | ) | |
Investments allocated from Portfolio | (7,398,254 | ) | ||
Investments — affiliated investment | 122 | |||
Foreign currency | 40,164 | |||
Foreign currency allocated from Portfolio | (56,395 | ) | ||
Net change in unrealized appreciation (depreciation) | $ | (121,209,521 | ) | |
Net realized and unrealized loss | $ | (59,371,369 | ) | |
Net decrease in net assets from operations | $ | (44,242,235 | ) | |
| 11 | See Notes to Financial Statements. |
Eaton Vance
Dividend Builder Fund
December 31, 2018
Statements of Changes in Net Assets
| Year Ended December 31, | ||||||||
| Increase (Decrease) in Net Assets | 2018 | 2017 | ||||||
From operations — | ||||||||
Net investment income | $ | 15,129,134 | $ | 18,304,783 | ||||
Net realized gain | 61,838,152 | 80,093,848 | ||||||
Net change in unrealized appreciation (depreciation) | (121,209,521 | ) | 67,675,672 | |||||
Net increase (decrease) in net assets from operations | $ | (44,242,235 | ) | $ | 166,074,303 | |||
Distributions to shareholders(1) | ||||||||
Class A | $ | (57,837,835 | ) | $ | (65,097,594 | ) | ||
Class C | (10,520,298 | ) | (13,384,963 | ) | ||||
Class I | (15,180,599 | ) | (15,722,240 | ) | ||||
Total distributions to shareholders | $ | (83,538,732 | ) | $ | (94,204,797 | ) | ||
Transactions in shares of beneficial interest — | ||||||||
Proceeds from sale of shares | ||||||||
Class A | $ | 33,642,047 | $ | 32,845,467 | ||||
Class C | 7,151,055 | 8,547,081 | ||||||
Class I | 39,331,886 | 68,649,361 | ||||||
Net asset value of shares issued to shareholders in payment of distributions declared | ||||||||
Class A | 49,523,310 | 55,910,323 | ||||||
Class C | 9,745,958 | 12,314,314 | ||||||
Class I | 13,846,361 | 13,790,271 | ||||||
Cost of shares redeemed | ||||||||
Class A | (110,827,967 | ) | (149,700,017 | ) | ||||
Class C | (41,604,558 | ) | (46,479,020 | ) | ||||
Class I | (49,296,866 | ) | (41,660,421 | ) | ||||
Net decrease in net assets from Fund share transactions | $ | (48,488,774 | ) | $ | (45,782,641 | ) | ||
Net increase (decrease) in net assets | $ | (176,269,741 | ) | $ | 26,086,865 | |||
| Net Assets |
| |||||||
At beginning of year | $ | 988,322,413 | $ | 962,235,548 | ||||
At end of year | $ | 812,052,672 | $ | 988,322,413 | (2) | |||
| (1) | For the year ended December 31, 2017, the source of distributions was as follows: |
Net investment income — Class A $(12,311,304), Class C $(1,676,912) and Class I $(3,038,650) |
Net realized gain — Class A $(52,786,290), Class C $(11,708,051) and Class I $(12,683,590) |
The current year presentation of distributions conforms with the Disclosure Update and Simplification Rule issued by the Securities and Exchange Commission, effective November 5, 2018. |
| (2) | Includes accumulated undistributed net investment income of $2,218,498 at December 31, 2017. The requirement to disclose the corresponding amount as of December 31, 2018 was eliminated. |
| 12 | See Notes to Financial Statements. |
Eaton Vance
Dividend Builder Fund
December 31, 2018
Financial Highlights
| Class A | ||||||||||||||||||||
| Year Ended December 31, | ||||||||||||||||||||
| 2018 | 2017 | 2016 | 2015 | 2014 | ||||||||||||||||
Net asset value — Beginning of year | $ | 14.550 | $ | 13.510 | $ | 13.110 | $ | 14.190 | $ | 13.430 | ||||||||||
| Income (Loss) From Operations | ||||||||||||||||||||
Net investment income(1) | $ | 0.242 | $ | 0.282 | $ | 0.278 | $ | 0.238 | $ | 0.269 | ||||||||||
Net realized and unrealized gain (loss) | (0.942 | ) | 2.212 | 0.907 | 0.178 | 1.269 | ||||||||||||||
Total income (loss) from operations | $ | (0.700 | ) | $ | 2.494 | $ | 1.185 | $ | 0.416 | $ | 1.538 | |||||||||
| Less Distributions | ||||||||||||||||||||
From net investment income | $ | (0.264 | ) | $ | (0.264 | ) | $ | (0.264 | ) | $ | (0.236 | ) | $ | (0.195 | ) | |||||
From net realized gain | (1.076 | ) | (1.190 | ) | (0.521 | ) | (1.260 | ) | (0.583 | ) | ||||||||||
Total distributions | $ | (1.340 | ) | $ | (1.454 | ) | $ | (0.785 | ) | $ | (1.496 | ) | $ | (0.778 | ) | |||||
Net asset value — End of year | $ | 12.510 | $ | 14.550 | $ | 13.510 | $ | 13.110 | $ | 14.190 | ||||||||||
Total Return(2) | (5.40 | )% | 18.89 | % | 9.21 | % | 2.91 | % | 11.73 | % | ||||||||||
| Ratios/Supplemental Data | ||||||||||||||||||||
Net assets, end of year (000’s omitted) | $ | 558,487 | $ | 674,421 | $ | 685,372 | $ | 711,199 | $ | 758,216 | ||||||||||
Ratios (as a percentage of average daily net assets):(3) | ||||||||||||||||||||
Expenses(4) | 1.02 | % | 1.03 | % | 1.04 | % | 1.04 | % | 1.05 | % | ||||||||||
Net investment income | 1.66 | % | 1.98 | % | 2.09 | % | 1.67 | % | 1.92 | % | ||||||||||
Portfolio Turnover of the Portfolio(5) | 37 | %(6) | 86 | % | 97 | % | 99 | % | 93 | % | ||||||||||
Portfolio Turnover of the Fund | 41 | %(6)(7) | — | — | — | — | ||||||||||||||
| (1) | Computed using average shares outstanding. |
| (2) | Returns are historical and are calculated by determining the percentage change in net asset value with all distributions reinvested and do not reflect the effect of sales charges. |
| (3) | Includes the Fund’s share of the Portfolio’s allocated expenses for the period while the Fund was investing in the Portfolio. |
| (4) | Excludes the effect of custody fee credits, if any, of less than 0.005%. Effective September 1, 2015, custody fee credits, which were earned on cash deposit balances, were discontinued by the custodian. |
| (5) | Portfolio turnover represents the rate of portfolio activity for the period while the Fund was investing in the Portfolio. |
| (6) | Not annualized. |
| (7) | For the period from June 11, 2018 through December 31, 2018 when the Fund was making investments directly in securities. |
| 13 | See Notes to Financial Statements. |
Eaton Vance
Dividend Builder Fund
December 31, 2018
Financial Highlights — continued
| Class C | ||||||||||||||||||||
| Year Ended December 31, | ||||||||||||||||||||
| 2018 | 2017 | 2016 | 2015 | 2014 | ||||||||||||||||
Net asset value — Beginning of year | $ | 14.620 | $ | 13.580 | $ | 13.160 | $ | 14.250 | $ | 13.480 | ||||||||||
| Income (Loss) From Operations | ||||||||||||||||||||
Net investment income(1) | $ | 0.133 | $ | 0.177 | $ | 0.179 | $ | 0.132 | $ | 0.163 | ||||||||||
Net realized and unrealized gain (loss) | (0.945 | ) | 2.209 | 0.926 | 0.167 | 1.278 | ||||||||||||||
Total income (loss) from operations | $ | (0.812 | ) | $ | 2.386 | $ | 1.105 | $ | 0.299 | $ | 1.441 | |||||||||
| Less Distributions | ||||||||||||||||||||
From net investment income | $ | (0.152 | ) | $ | (0.156 | ) | $ | (0.164 | ) | $ | (0.129 | ) | $ | (0.088 | ) | |||||
From net realized gain | (1.076 | ) | (1.190 | ) | (0.521 | ) | (1.260 | ) | (0.583 | ) | ||||||||||
Total distributions | $ | (1.228 | ) | $ | (1.346 | ) | $ | (0.685 | ) | $ | (1.389 | ) | $ | (0.671 | ) | |||||
Net asset value — End of year | $ | 12.580 | $ | 14.620 | $ | 13.580 | $ | 13.160 | $ | 14.250 | ||||||||||
Total Return(2) | (6.09 | )% | 17.89 | % | 8.51 | % | 2.05 | % | 10.90 | % | ||||||||||
| Ratios/Supplemental Data | ||||||||||||||||||||
Net assets, end of year (000’s omitted) | $ | 107,495 | $ | 149,298 | $ | 163,138 | $ | 165,915 | $ | 175,086 | ||||||||||
Ratios (as a percentage of average daily net assets):(3) | ||||||||||||||||||||
Expenses(4) | 1.77 | % | 1.78 | % | 1.79 | % | 1.79 | % | 1.80 | % | ||||||||||
Net investment income | 0.91 | % | 1.24 | % | 1.34 | % | 0.92 | % | 1.16 | % | ||||||||||
Portfolio Turnover of the Portfolio(5) | 37 | %(6) | 86 | % | 97 | % | 99 | % | 93 | % | ||||||||||
Portfolio Turnover of the Fund | 41 | %(6)(7) | — | — | — | — | ||||||||||||||
| (1) | Computed using average shares outstanding. |
| (2) | Returns are historical and are calculated by determining the percentage change in net asset value with all distributions reinvested and do not reflect the effect of sales charges. |
| (3) | Includes the Fund’s share of the Portfolio’s allocated expenses for the period while the Fund was investing in the Portfolio. |
| (4) | Excludes the effect of custody fee credits, if any, of less than 0.005%. Effective September 1, 2015, custody fee credits, which were earned on cash deposit balances, were discontinued by the custodian. |
| (5) | Portfolio turnover represents the rate of portfolio activity for the period while the Fund was investing in the Portfolio. |
| (6) | Not annualized. |
| (7) | For the period from June 11, 2018 through December 31, 2018 when the Fund was making investments directly in securities. |
| 14 | See Notes to Financial Statements. |
Eaton Vance
Dividend Builder Fund
December 31, 2018
Financial Highlights — continued
| Class I | ||||||||||||||||||||
| Year Ended December 31, | ||||||||||||||||||||
| 2018 | 2017 | 2016 | 2015 | 2014 | ||||||||||||||||
Net asset value — Beginning of year | $ | 14.530 | $ | 13.500 | $ | 13.100 | $ | 14.180 | $ | 13.430 | ||||||||||
| Income (Loss) From Operations | ||||||||||||||||||||
Net investment income(1) | $ | 0.279 | $ | 0.316 | $ | 0.312 | $ | 0.274 | $ | 0.296 | ||||||||||
Net realized and unrealized gain (loss) | (0.932 | ) | 2.204 | 0.906 | 0.178 | 1.268 | ||||||||||||||
Total income (loss) from operations | $ | (0.653 | ) | $ | 2.520 | $ | 1.218 | $ | 0.452 | $ | 1.564 | |||||||||
| Less Distributions | ||||||||||||||||||||
From net investment income | $ | (0.301 | ) | $ | (0.300 | ) | $ | (0.297 | ) | $ | (0.272 | ) | $ | (0.231 | ) | |||||
From net realized gain | (1.076 | ) | (1.190 | ) | (0.521 | ) | (1.260 | ) | (0.583 | ) | ||||||||||
Total distributions | $ | (1.377 | ) | $ | (1.490 | ) | $ | (0.818 | ) | $ | (1.532 | ) | $ | (0.814 | ) | |||||
Net asset value — End of year | $ | 12.500 | $ | 14.530 | $ | 13.500 | $ | 13.100 | $ | 14.180 | ||||||||||
Total Return(2) | (5.10 | )% | 19.12 | % | 9.49 | % | 3.10 | % | 12.01 | % | ||||||||||
| Ratios/Supplemental Data | ||||||||||||||||||||
Net assets, end of year (000’s omitted) | $ | 146,070 | $ | 164,604 | $ | 113,726 | $ | 107,963 | $ | 103,942 | ||||||||||
Ratios (as a percentage of average daily net assets):(3) | ||||||||||||||||||||
Expenses(4) | 0.77 | % | 0.78 | % | 0.79 | % | 0.79 | % | 0.80 | % | ||||||||||
Net investment income | 1.92 | % | 2.22 | % | 2.35 | % | 1.92 | % | 2.10 | % | ||||||||||
Portfolio Turnover of the Portfolio(5) | 37 | %(6) | 86 | % | 97 | % | 99 | % | 93 | % | ||||||||||
Portfolio Turnover of the Fund | 41 | %(6)(7) | — | — | — | — | ||||||||||||||
| (1) | Computed using average shares outstanding. |
| (2) | Returns are historical and are calculated by determining the percentage change in net asset value with all distributions reinvested. |
| (3) | Includes the Fund’s share of the Portfolio’s allocated expenses for the period while the Fund was investing in the Portfolio. |
| (4) | Excludes the effect of custody fee credits, if any, of less than 0.005%. Effective September 1, 2015, custody fee credits, which were earned on cash deposit balances, were discontinued by the custodian. |
| (5) | Portfolio turnover represents the rate of portfolio activity for the period while the Fund was investing in the Portfolio. |
| (6) | Not annualized. |
| (7) | For the period from June 11, 2018 through December 31, 2018 when the Fund was making investments directly in securities. |
| 15 | See Notes to Financial Statements. |
Eaton Vance
Dividend Builder Fund
December 31, 2018
Notes to Financial Statements
1 Significant Accounting Policies
Eaton Vance Dividend Builder Fund (the Fund) is a diversified series of Eaton Vance Special Investment Trust (the Trust). The Trust is a Massachusetts business trust registered under the Investment Company Act of 1940, as amended (the 1940 Act), as anopen-end management investment company. The Fund’s investment objective is to seek total return. Prior to the close of business on June 8, 2018, the Fund invested all of its investable assets in interests in Dividend Builder Portfolio (the Portfolio), a Massachusetts business trust, having the same investment objective and policies as the Fund. As of the close of business on June 8, 2018, the Fund received itspro-rata share of net assets from the Portfolio as part of the termination of the Portfolio. As of June 11, 2018, the next business day, the Fund invests its assets directly. The Fund offers three classes of shares. Class A shares are generally sold subject to a sales charge imposed at time of purchase. Class C shares are sold at net asset value and are generally subject to a contingent deferred sales charge (see Note 5). Class I shares are sold at net asset value and are not subject to a sales charge. Effective January 25, 2019, Class C shares generally will automatically convert to Class A shares ten years after their purchase as described in the Fund’s prospectus. Each class represents apro-rata interest in the Fund, but votes separately on class-specific matters and (as noted below) is subject to different expenses. Realized and unrealized gains and losses and net investment income and losses, other than class-specific expenses, are allocated daily to each class of shares based on the relative net assets of each class to the total net assets of the Fund. Each class of shares differs in its distribution plan and certain other class-specific expenses.
The following is a summary of significant accounting policies of the Fund. The policies are in conformity with accounting principles generally accepted in the United States of America (U.S. GAAP). The Fund is an investment company and follows accounting and reporting guidance in the Financial Accounting Standards Board (FASB) Accounting Standards Codification Topic 946.
A Investment Valuation — The following methodologies are used to determine the market value or fair value of investments.
Equity Securities. Equity securities listed on a U.S. securities exchange generally are valued at the last sale or closing price on the day of valuation or, if no sales took place on such date, at the mean between the closing bid and asked prices on the exchange where such securities are principally traded. Equity securities listed on the NASDAQ Global or Global Select Market generally are valued at the NASDAQ official closing price. Unlisted or listed securities for which closing sales prices or closing quotations are not available are valued at the mean between the latest available bid and asked prices.
Foreign Securities and Currencies. Foreign securities and currencies are valued in U.S. dollars, based on foreign currency exchange rate quotations supplied by a third party pricing service. The pricing service uses a proprietary model to determine the exchange rate. Inputs to the model include reported trades and implied bid/ask spreads. The daily valuation of exchange-traded foreign securities generally is determined as of the close of trading on the principal exchange on which such securities trade. Events occurring after the close of trading on foreign exchanges may result in adjustments to the valuation of foreign securities to more accurately reflect their fair value as of the close of regular trading on the New York Stock Exchange. When valuing foreign equity securities that meet certain criteria, the Fund’s Trustees have approved the use of a fair value service that values such securities to reflect market trading that occurs after the close of the applicable foreign markets of comparable securities or other instruments that have a strong correlation to the fair-valued securities.
Affiliated Fund. The Fund may invest in Eaton Vance Cash Reserves Fund, LLC (Cash Reserves Fund), an affiliated investment company managed by Eaton Vance Management (EVM). While Cash Reserves Fund is not a registered money market mutual fund, it conducts all of its investment activities in accordance with the requirements of Rule2a-7 under the 1940 Act. Investments in Cash Reserves Fund are valued at the closing net asset value per unit on the valuation day. Cash Reserves Fund generally values its investment securities based on available market quotations provided by a third party pricing service.
Fair Valuation. Investments for which valuations or market quotations are not readily available or are deemed unreliable are valued at fair value using methods determined in good faith by or at the direction of the Trustees of the Fund in a manner that fairly reflects the security’s value, or the amount that the Fund might reasonably expect to receive for the security upon its current sale in the ordinary course. Each such determination is based on a consideration of relevant factors, which are likely to vary from one pricing context to another. These factors may include, but are not limited to, the type of security, the existence of any contractual restrictions on the security’s disposition, the price and extent of public trading in similar securities of the issuer or of comparable companies or entities, quotations or relevant information obtained from broker/dealers or other market participants, information obtained from the issuer, analysts, and/or the appropriate stock exchange (for exchange-traded securities), an analysis of the company’s or entity’s financial condition, and an evaluation of the forces that influence the issuer and the market(s) in which the security is purchased and sold.
B Investment Transactions — Investment transactions for financial statement purposes are accounted for on a trade date basis. Realized gains and losses on investments sold are determined on the basis of identified cost.
C Income — Dividend income is recorded on theex-dividend date for dividends received in cash and/or securities. However, if theex-dividend date has passed, certain dividends from foreign securities are recorded as the Fund is informed of theex-dividend date. Withholding taxes on foreign dividends and capital gains have been provided for in accordance with the Fund’s understanding of the applicable countries’ tax rules and rates. In consideration of recent decisions rendered by European courts, prior to its termination as of the close of business on June 8, 2018, the Portfolio filed additional tax reclaims for previously withheld taxes on dividends earned in certain European Union countries. These filings are subject to various administrative and judicial proceedings within these countries. Due to the uncertainty as to the ultimate resolution of these proceedings, the likelihood of receipt of these reclaims, and the potential timing of payment, no amounts are reflected in the Fund’s financial statements for such outstanding reclaims. Prior to the close of business on June 8, 2018, the net investment income or loss consisted of the Fund’spro-rata share of the net investment income or loss of the Portfolio, less all actual and accrued expenses of the Fund.
| 16 |
Eaton Vance
Dividend Builder Fund
December 31, 2018
Notes to Financial Statements — continued
D Federal Taxes — The Fund’s policy is to comply with the provisions of the Internal Revenue Code applicable to regulated investment companies and to distribute to shareholders each year substantially all of its net investment income, and all or substantially all of its net realized capital gains. Accordingly, no provision for federal income or excise tax is necessary.
As of December 31, 2018, the Fund had no uncertain tax positions that would require financial statement recognition,de-recognition, or disclosure. The Fund files a U.S. federal income tax return annually after its fiscalyear-end, which is subject to examination by the Internal Revenue Service for a period of three years from the date of filing.
E Expenses — The majority of expenses of the Trust are directly identifiable to an individual fund. Expenses which are not readily identifiable to a specific fund are allocated taking into consideration, among other things, the nature and type of expense and the relative size of the funds.
F Foreign Currency Translation — Investment valuations, other assets, and liabilities initially expressed in foreign currencies are translated each business day into U.S. dollars based upon current exchange rates. Purchases and sales of foreign investment securities and income and expenses denominated in foreign currencies are translated into U.S. dollars based upon currency exchange rates in effect on the respective dates of such transactions. Recognized gains or losses on investment transactions attributable to changes in foreign currency exchange rates are recorded for financial statement purposes as net realized gains and losses on investments. That portion of unrealized gains and losses on investments that results from fluctuations in foreign currency exchange rates is not separately disclosed.
G Use of Estimates — The preparation of the financial statements in conformity with U.S. GAAP requires management to make estimates and assumptions that affect the reported amounts of assets and liabilities at the date of the financial statements and the reported amounts of income and expense during the reporting period. Actual results could differ from those estimates.
H Indemnifications — Under the Trust’s organizational documents, its officers and Trustees may be indemnified against certain liabilities and expenses arising out of the performance of their duties to the Fund. Under Massachusetts law, if certain conditions prevail, shareholders of a Massachusetts business trust (such as the Trust) could be deemed to have personal liability for the obligations of the Trust. However, the Trust’s Declaration of Trust contains an express disclaimer of liability on the part of Fund shareholders and theBy-laws provide that the Trust shall assume the defense on behalf of any Fund shareholders. Moreover, theBy-laws also provide for indemnification out of Fund property of any shareholder held personally liable solely by reason of being or having been a shareholder for all loss or expense arising from such liability. Additionally, in the normal course of business, the Fund enters into agreements with service providers that may contain indemnification clauses. The Fund’s maximum exposure under these arrangements is unknown as this would involve future claims that may be made against the Fund that have not yet occurred.
2 Distributions to Shareholders and Income Tax Information
It is the present policy of the Fund to make monthly distributions of all or substantially all of its net investment income and to distribute annually all or substantially all of its net realized capital gains. Distributions to shareholders are recorded on theex-dividend date. Distributions are declared separately for each class of shares. Shareholders may reinvest income and capital gain distributions in additional shares of the same class of the Fund at the net asset value as of theex-dividend date or, at the election of the shareholder, receive distributions in cash. Distributions to shareholders are determined in accordance with income tax regulations, which may differ from U.S. GAAP. As required by U.S. GAAP, only distributions in excess of tax basis earnings and profits are reported in the financial statements as a return of capital. Permanent differences between book and tax accounting relating to distributions are reclassified topaid-in capital. For tax purposes, distributions from short-term capital gains are considered to be from ordinary income.
The tax character of distributions declared for the years ended December 31, 2018 and December 31, 2017 was as follows:
| Year Ended December 31, | ||||||||
| 2018 | 2017 | |||||||
Ordinary income | $ | 33,393,057 | $ | 33,448,384 | ||||
Long-term capital gains | $ | 50,145,675 | $ | 60,756,413 | ||||
During the year ended December 31, 2018, distributable earnings was decreased by $4,256,210 andpaid-in capital was increased by $4,256,210 due to the Fund’s use of equalization accounting and differences between book and tax accounting for the Fund’s investment in the Portfolio. Tax equalization accounting allows the Fund to treat as a distribution that portion of redemption proceeds representing a redeeming shareholder’s portion of undistributed taxable income and net capital gains. These reclassifications had no effect on the net assets or net asset value per share of the Fund.
| 17 |
Eaton Vance
Dividend Builder Fund
December 31, 2018
Notes to Financial Statements — continued
As of December 31, 2018, the components of distributable earnings (accumulated loss) on a tax basis were as follows:
Undistributed ordinary income | $ | 330,062 | ||
Undistributed long-term capital gains | $ | 6,006,126 | ||
Post October capital losses | $ | (2,313,876 | ) | |
Net unrealized appreciation | $ | 28,294,492 | ||
At December 31, 2018, the Fund had a net capital loss of $2,313,876 attributable to security transactions incurred after October 31, 2018 that it has elected to defer. This net capital loss is treated as arising on the first day of the Fund’s taxable year ending December 31, 2019.
The cost and unrealized appreciation (depreciation) of investments of the Fund at December 31, 2018, as determined on a federal income tax basis, were as follows:
Aggregate cost | $ | 779,492,787 | ||
Gross unrealized appreciation | $ | 80,738,030 | ||
Gross unrealized depreciation | (52,445,308 | ) | ||
Net unrealized appreciation | $ | 28,292,722 | ||
3 Investment Adviser Fee and Other Transactions with Affiliates
The investment adviser fee is earned by Boston Management and Research (BMR), a subsidiary of EVM, as compensation for investment advisory services rendered to the Fund. Pursuant to the investment advisory agreement dated June 8, 2018 between the Fund and BMR, the fee is computed at an annual rate of 0.65% of the Fund’s average daily net assets up to $500 million, 0.625% from $500 million up to $1 billion, 0.600% from $1 billion up to $1.5 billion, 0.550% from $1.5 billion up to $2 billion, 0.500% from $2 billion up to $3 billion and at reduced rates on daily net assets of $3 billion or more, and is payable monthly. Prior to the close of business on June 8, 2018, when the Fund’s assets were invested in the Portfolio, the Fund was allocated its share of the Portfolio’s investment adviser fee. The Portfolio paid advisory fees to BMR on the same fee schedule as that of the Fund as described above. For the year ended December 31, 2018, the Fund’s allocated portion of the investment adviser fee paid by the Portfolio amounted to $2,725,054 and the investment adviser fee paid by the Fund amounted to $3,327,538. For the year ended December 31, 2018, the Fund’s investment adviser fee, including the investment adviser fee allocated from the Portfolio, was 0.64% of the Fund’s average daily net assets. The Fund invests its cash in Cash Reserves Fund. EVM does not currently receive a fee for advisory services provided to Cash Reserves Fund.
EVM serves as the administrator of the Fund, but receives no compensation. EVM providessub-transfer agency and related services to the Fund pursuant to aSub-Transfer Agency Support Services Agreement. For the year ended December 31, 2018, EVM earned $111,909 from the Fund pursuant to such agreement, which is included in transfer and dividend disbursing agent fees on the Statement of Operations. The Fund was informed that Eaton Vance Distributors, Inc. (EVD), an affiliate of EVM and the Fund’s principal underwriter, received $26,629 as its portion of the sales charge on sales of Class A shares for the year ended December 31, 2018. EVD also received distribution and service fees from Class A and Class C shares (see Note 4) and contingent deferred sales charges (see Note 5).
Trustees and officers of the Fund who are members of EVM’s or BMR’s organizations receive remuneration for their services to the Fund out of the investment adviser fee. Trustees of the Fund who are not affiliated with the investment adviser may elect to defer receipt of all or a percentage of their annual fees in accordance with the terms of the Trustees Deferred Compensation Plan. For the year ended December 31, 2018, no significant amounts have been deferred. Certain officers and Trustees of the Fund are officers of the above organizations.
4 Distribution Plans
The Fund has in effect a distribution plan for Class A shares (Class A Plan) pursuant to Rule12b-1 under the 1940 Act. Pursuant to the Class A Plan, the Fund pays EVD a distribution and service fee of 0.25% per annum of its average daily net assets attributable to Class A shares for distribution services and facilities provided to the Fund by EVD, as well as for personal services and/or the maintenance of shareholder accounts. Distribution and service fees paid or accrued to EVD for the year ended December 31, 2018 amounted to $1,623,847 for Class A shares.
The Fund also has in effect a distribution plan for Class C shares (Class C Plan) pursuant to Rule12b-1 under the 1940 Act. Pursuant to the Class C Plan, the Fund pays EVD amounts equal to 0.75% per annum of its average daily net assets attributable to Class C shares for providing ongoing distribution services and facilities to the Fund. For the year ended December 31, 2018, the Fund paid or accrued to EVD $1,025,749 for Class C shares.
| 18 |
Eaton Vance
Dividend Builder Fund
December 31, 2018
Notes to Financial Statements — continued
Pursuant to the Class C Plan, the Fund also makes payments of service fees to EVD, financial intermediaries and other persons in amounts equal to 0.25% per annum of its average daily net assets attributable to that class. Service fees paid or accrued are for personal services and/or the maintenance of shareholder accounts. They are separate and distinct from the sales commissions and distribution fees payable to EVD. Service fees paid or accrued for the year ended December 31, 2018 amounted to $341,916 for Class C shares.
Distribution and service fees are subject to the limitations contained in the Financial Industry Regulatory Authority Rule 2341(d).
5 Contingent Deferred Sales Charges
A contingent deferred sales charge (CDSC) of 1% generally is imposed on redemptions of Class C shares made within one year of purchase. Class A shares may be subject to a 1% CDSC if redeemed within 18 months of purchase (depending on the circumstances of purchase). Generally, the CDSC is based upon the lower of the net asset value at date of redemption or date of purchase. No charge is levied on shares acquired by reinvestment of dividends or capital gain distributions. For the year ended December 31, 2018, the Fund was informed that EVD received approximately $2,000 of CDSCs paid by Class C shareholders and no CDSCs paid by Class A shareholders.
6 Purchases and Sales of Investments
Purchases and sales of investments by the Portfolio, other than short-term obligations and investments transferred to the Fund, for the period from January 1, 2018 through June 8, 2018 aggregated $352,684,895 and $398,845,581, respectively. Purchases and sales of investments by the Fund, other than short-term obligations and investments transferred from the Portfolio, for the period from June 11, 2018 through December 31, 2018 aggregated $373,524,226 and $443,306,103, respectively. Increases and decreases in the Fund’s investment in the Portfolio for the period from January 1, 2018 through June 8, 2018 were $245,479 and $1,018,982,880, respectively. Included in decreases is $962,305,499, representing the Fund’s interest in the Portfolio as of the close of business on June 8, 2018, which was exchanged for the Fund’spro-rata share of net assets of the Portfolio on that date having the same fair value. The Fund’s cost of its investment in the Portfolio on such date of $818,987,459 was carried forward to the net assets acquired from the Portfolio and no gain or loss was recognized on the exchange.
7 Shares of Beneficial Interest
The Fund’s Declaration of Trust permits the Trustees to issue an unlimited number of full and fractional shares of beneficial interest (without par value). Such shares may be issued in a number of different series (such as the Fund) and classes. Transactions in Fund shares were as follows:
| Year Ended December 31, | ||||||||
| Class A | 2018 | 2017 | ||||||
Sales | 2,359,977 | 2,305,590 | ||||||
Issued to shareholders electing to receive payments of distributions in Fund shares | 3,615,097 | 3,895,803 | ||||||
Redemptions | (7,693,976 | ) | (10,551,829 | ) | ||||
Net decrease | (1,718,902 | ) | (4,350,436 | ) | ||||
| Year Ended December 31, | ||||||||
| Class C | 2018 | 2017 | ||||||
Sales | 497,780 | 594,697 | ||||||
Issued to shareholders electing to receive payments of distributions in Fund shares | 710,355 | 852,568 | ||||||
Redemptions | (2,875,129 | ) | (3,252,696 | ) | ||||
Net decrease | (1,666,994 | ) | (1,805,431 | ) | ||||
| 19 |
Eaton Vance
Dividend Builder Fund
December 31, 2018
Notes to Financial Statements — continued
| Year Ended December 31, | ||||||||
| Class I | 2018 | 2017 | ||||||
Sales | 2,739,086 | 4,866,028 | ||||||
Issued to shareholders electing to receive payments of distributions in Fund shares | 1,010,772 | 960,791 | ||||||
Redemptions | (3,388,128 | ) | (2,923,307 | ) | ||||
Net increase | 361,730 | 2,903,512 | ||||||
8 Line of Credit
The Fund participates with other portfolios and funds managed by EVM and its affiliates in a $625 million unsecured line of credit agreement with a group of banks, which is in effect through October 29, 2019. Borrowings are made by the Fund solely to facilitate the handling of unusual and/or unanticipated short-term cash requirements. Interest is charged to the Fund based on its borrowings at an amount above either the Eurodollar rate or Federal Funds rate. In addition, a fee computed at an annual rate of 0.15% on the daily unused portion of the line of credit is allocated among the participating portfolios and funds at the end of each quarter. Because the line of credit is not available exclusively to the Fund, it may be unable to borrow some or all of its requested amounts at any particular time. The Fund did not have any significant borrowings or allocated fees during the year ended December 31, 2018.
9 Risks Associated with Foreign Investments
Investing in securities issued by companies whose principal business activities are outside the United States may involve significant risks not present in domestic investments. For example, there is generally less publicly available information about foreign companies, particularly those not subject to the disclosure and reporting requirements of the U.S. securities laws. Certain foreign issuers are generally not bound by uniform accounting, auditing, and financial reporting requirements and standards of practice comparable to those applicable to domestic issuers. Investments in foreign securities also involve the risk of possible adverse changes in investment or exchange control regulations, expropriation or confiscatory taxation, limitation on the removal of funds or other assets of the Fund, political or financial instability or diplomatic and other developments which could affect such investments. Foreign securities markets, while growing in volume and sophistication, are generally not as developed as those in the United States, and securities of some foreign issuers (particularly those located in developing countries) may be less liquid and more volatile than securities of comparable U.S. companies. In general, there is less overall governmental supervision and regulation of foreign securities markets, broker/dealers and issuers than in the United States.
10 Securities Lending Agreement
The Fund has established a securities lending agreement with State Street Bank and Trust Company (SSBT) as securities lending agent in which the Fund lends portfolio securities to qualified borrowers in exchange for collateral consisting of either cash or securities issued or guaranteed by the U.S. Government or its agencies or instrumentalities in an amount at least equal to the market value of the securities on loan. The market value of securities loaned is determined daily and any additional required collateral is delivered to the Fund on the next business day. Cash collateral is invested in the State Street Navigator Securities Lending Government Money Market Portfolio, a money market fund registered under the 1940 Act. The Fund earns interest on the amount invested but it must pay (and at times receive from) the broker a loan rebate fee computed as a varying percentage of the collateral received. For security loans secured bynon-cash collateral, the Fund earns a negotiated lending fee from the borrower. A portion of the income earned by the Fund from its investment of cash collateral, net of rebate fees, and lending fees received is allocated to SSBT for its services as lending agent and the portion allocated to the Fund is presented as securities lending income, net on the Statement of Operations.Non-cash collateral is held by the lending agent on behalf of the Fund and cannot be sold orre-pledged by the Fund; accordingly, such collateral is not reflected in the Statement of Assets and Liabilities.
The Fund is subject to possible delay in the recovery of loaned securities. Pursuant to the securities lending agreement, SSBT has provided indemnification to the Fund in the event of default by a borrower with respect to a loan. The Fund bears the risk of loss with respect to the investment of cash collateral.
At December 31, 2018, the value of the securities loaned (all common stocks) and the value of the collateral received, which exceeded the value of the securities loaned, amounted to $16,086,574 and $16,501,766, respectively. Collateral received was comprised of U.S. Government and/or agencies securities. The securities lending transactions have no contractual maturity date and each of the Fund and borrower has the option to terminate a loan at any time.
11 Fair Value Measurements
Under generally accepted accounting principles for fair value measurements, a three-tier hierarchy to prioritize the assumptions, referred to as inputs, is used in valuation techniques to measure fair value. The three-tier hierarchy of inputs is summarized in the three broad levels listed below.
| • | Level 1 – quoted prices in active markets for identical investments |
| 20 |
Eaton Vance
Dividend Builder Fund
December 31, 2018
Notes to Financial Statements — continued
| • | Level 2 – other significant observable inputs (including quoted prices for similar investments, interest rates, prepayment speeds, credit risk, etc.) |
| • | Level 3 – significant unobservable inputs (including a fund’s own assumptions in determining the fair value of investments) |
In cases where the inputs used to measure fair value fall in different levels of the fair value hierarchy, the level disclosed is determined based on the lowest level input that is significant to the fair value measurement in its entirety. The inputs or methodology used for valuing securities are not necessarily an indication of the risk associated with investing in those securities.
At December 31, 2018, the hierarchy of inputs used in valuing the Fund’s investments, which are carried at value, were as follows:
| Asset Description | Level 1 | Level 2 | Level 3 | Total | ||||||||||||
Common Stocks | ||||||||||||||||
Communication Services | $ | 90,259,922 | $ | — | $ | — | $ | 90,259,922 | ||||||||
Consumer Discretionary | 73,138,468 | — | — | 73,138,468 | ||||||||||||
Consumer Staples | 68,242,078 | — | — | 68,242,078 | ||||||||||||
Energy | 35,752,353 | 7,823,088 | — | 43,575,441 | ||||||||||||
Financials | 96,336,963 | — | — | 96,336,963 | ||||||||||||
Health Care | 131,928,356 | — | — | 131,928,356 | ||||||||||||
Industrials | 51,904,450 | — | — | 51,904,450 | ||||||||||||
Information Technology | 137,266,329 | — | — | 137,266,329 | ||||||||||||
Materials | 19,652,275 | — | — | 19,652,275 | ||||||||||||
Real Estate | 45,528,712 | — | — | 45,528,712 | ||||||||||||
Utilities | 48,477,201 | — | �� | — | 48,477,201 | |||||||||||
Total Common Stocks | $ | 798,487,107 | $ | 7,823,088 | * | $ | — | $ | 806,310,195 | |||||||
Short-Term Investments | $ | — | $ | 1,475,314 | $ | — | $ | 1,475,314 | ||||||||
Total Investments | $ | 798,487,107 | $ | 9,298,402 | $ | — | $ | 807,785,509 | ||||||||
| * | Includes foreign equity securities whose values were adjusted to reflect market trading of comparable securities or other correlated instruments that occurred after the close of trading in their applicable foreign markets. |
| 21 |
Eaton Vance
Dividend Builder Fund
December 31, 2018
Report of Independent Registered Public Accounting Firm
To the Trustees of Eaton Vance Special Investment Trust and Shareholders of Eaton Vance Dividend Builder Fund:
Opinion on the Financial Statements and Financial Highlights
We have audited the accompanying statement of assets and liabilities of Eaton Vance Dividend Builder Fund (the “Fund”) (one of the funds constituting Eaton Vance Special Investment Trust), including the portfolio of investments, as of December 31, 2018, the related statement of operations for the year then ended, the statements of changes in net assets for each of the two years in the period then ended, the financial highlights for each of the five years in the period then ended, and the related notes. In our opinion, the financial statements and financial highlights present fairly, in all material respects, the financial position of the Fund as of December 31, 2018, and the results of its operations for the year then ended, the changes in its net assets for each of the two years in the period then ended, and the financial highlights for each of the five years in the period then ended, in conformity with accounting principles generally accepted in the United States of America.
Basis for Opinion
These financial statements and financial highlights are the responsibility of the Fund’s management. Our responsibility is to express an opinion on the Fund’s financial statements and financial highlights based on our audits. We are a public accounting firm registered with the Public Company Accounting Oversight Board (United States) (PCAOB) and are required to be independent with respect to the Fund in accordance with the U.S. federal securities laws and the applicable rules and regulations of the Securities and Exchange Commission and the PCAOB.
We conducted our audits in accordance with the standards of the PCAOB. Those standards require that we plan and perform the audit to obtain reasonable assurance about whether the financial statements and financial highlights are free of material misstatement, whether due to error or fraud. The Fund is not required to have, nor were we engaged to perform, an audit of its internal control over financial reporting. As part of our audits we are required to obtain an understanding of internal control over financial reporting but not for the purpose of expressing an opinion on the effectiveness of the Fund’s internal control over financial reporting. Accordingly, we express no such opinion.
Our audits included performing procedures to assess the risks of material misstatement of the financial statements and financial highlights, whether due to error or fraud, and performing procedures that respond to those risks. Such procedures included examining, on a test basis, evidence regarding the amounts and disclosures in the financial statements and financial highlights. Our audits also included evaluating the accounting principles used and significant estimates made by management, as well as evaluating the overall presentation of the financial statements and financial highlights. Our procedures included confirmation of securities owned as of December 31, 2018, by correspondence with the custodian and brokers; when replies were not received from brokers, we performed other auditing procedures. We believe that our audits provide a reasonable basis for our opinion.
/s/ Deloitte & Touche LLP
Boston, Massachusetts
February 20, 2019
We have served as the auditor of one or more Eaton Vance investment companies since 1959.
| 22 |
Eaton Vance
Dividend Builder Fund
December 31, 2018
Federal Tax Information (Unaudited)
The Form1099-DIV you received in February 2019 showed the tax status of all distributions paid to your account in calendar year 2018. Shareholders are advised to consult their own tax adviser with respect to the tax consequences of their investment in the Fund. As required by the Internal Revenue Code and/or regulations, shareholders must be notified regarding the status of qualified dividend income for individuals, the dividends received deduction for corporations and capital gains dividends.
Qualified Dividend Income. For the fiscal year ended December 31, 2018, the Fund designates approximately $19,212,217, or up to the maximum amount of such dividends allowable pursuant to the Internal Revenue Code, as qualified dividend income eligible for the reduced tax rate of 15%.
Dividends Received Deduction. Corporate shareholders are generally entitled to take the dividends received deduction on the portion of the Fund’s dividend distribution that qualifies under tax law. For the Fund’s fiscal 2018 ordinary income dividends, 57.08% qualifies for the corporate dividends received deduction.
Capital Gains Dividends. The Fund hereby designates as a capital gain dividend with respect to the taxable year ended December 31, 2018, $51,572,800 or, if subsequently determined to be different, the net capital gain of such year.
| 23 |
Eaton Vance
Dividend Builder Fund
December 31, 2018
Special Meeting of Shareholders (Unaudited)
Eaton Vance Dividend Builder Fund
The Fund held a Special Meeting of Shareholders on September 20, 2018 to elect the five Trustees listed below. The other Trustees named herein continue to serve as Trustees. The results of the vote with respect to the Fund were as follows:
| Nominee for Trustee | Number of Shares | |||||||
| For | Withheld | |||||||
Mark R. Fetting | 48,712,443 | 531,698 | ||||||
Keith Quinton | 48,733,818 | 510,323 | ||||||
Marcus L. Smith | 48,697,446 | 546,695 | ||||||
Susan J. Sutherland | 48,729,588 | 514,553 | ||||||
Scott E. Wennerholm | 48,808,223 | 435,918 | ||||||
Results are rounded to the nearest whole number.
| 24 |
Eaton Vance
Dividend Builder Fund
December 31, 2018
Management and Organization
Fund Management. The Trustees of Eaton Vance Special Investment Trust (the Trust) are responsible for the overall management and supervision of the Trust’s affairs. The Trustees and officers of the Trust are listed below. Except as indicated, each individual has held the office shown or other offices in the same company for the last five years. Trustees and officers of the Trust hold indefinite terms of office. The “noninterested Trustees” consist of those Trustees who are not “interested persons” of the Trust, as that term is defined under the 1940 Act. The business address of each Trustee and officer is Two International Place, Boston, Massachusetts 02110. As used below, “EVC” refers to Eaton Vance Corp., “EV” refers to Eaton Vance, Inc., “EVM” refers to Eaton Vance Management, “BMR” refers to Boston Management and Research and “EVD” refers to Eaton Vance Distributors, Inc. EVC and EV are the corporate parent and trustee, respectively, of EVM and BMR. EVD is the Fund’s principal underwriter and a wholly-owned subsidiary of EVC. Each officer affiliated with Eaton Vance may hold a position with other Eaton Vance affiliates that is comparable to his or her position with EVM listed below. Each Trustee oversees 175 portfolios in the Eaton Vance Complex (including all master and feeder funds in a master feeder structure). Each officer serves as an officer of certain other Eaton Vance funds. Each Trustee and officer serves until his or her successor is elected.
| Name and Year of Birth | Position(s) with the Trust | Trustee Since(1) | Principal Occupation(s) and Directorships During Past Five Years and Other Relevant Experience | |||
| Interested Trustee | ||||||
Thomas E. Faust Jr. 1958 | Trustee | 2007 | Chairman, Chief Executive Officer and President of EVC, Director and President of EV, Chief Executive Officer and President of EVM and BMR, and Director of EVD. Trustee and/or officer of 175 registered investment companies. Mr. Faust is an interested person because of his positions with EVM, BMR, EVD, EVC and EV, which are affiliates of the Trust. Directorships in the Last Five Years.(2) Director of EVC and Hexavest Inc. (investment management firm). | |||
| Noninterested Trustees | ||||||
Mark R. Fetting 1954 | Trustee | 2016 | Private investor. Formerly held various positions at Legg Mason, Inc. (investment management firm) (2000-2012), including President, Chief Executive Officer, Director and Chairman (2008-2012), Senior Executive Vice President (2004-2008) and Executive Vice President (2001-2004). Formerly, President of Legg Mason family of funds (2001-2008). Formerly, Division President and Senior Officer of Prudential Financial Group, Inc. and related companies (investment management firm) (1991-2000). Directorships in the Last Five Years. None. | |||
Cynthia E. Frost 1961 | Trustee | 2014 | Private investor. Formerly, Chief Investment Officer of Brown University (university endowment) (2000-2012). Formerly, Portfolio Strategist for Duke Management Company (university endowment manager) (1995-2000). Formerly, Managing Director, Cambridge Associates (investment consulting company) (1989-1995). Formerly, Consultant, Bain and Company (management consulting firm) (1987-1989). Formerly, Senior Equity Analyst, BA Investment Management Company (1983-1985). Directorships in the Last Five Years.None. | |||
George J. Gorman 1952 | Trustee | 2014 | Principal at George J. Gorman LLC (consulting firm). Formerly, Senior Partner at Ernst & Young LLP (a registered public accounting firm) (1974-2009). Directorships in the Last Five Years.Formerly, Trustee of the BofA Funds Series Trust (11 funds) (2011-2014) and of the Ashmore Funds (9 funds) (2010-2014). | |||
Valerie A. Mosley 1960 | Trustee | 2014 | Chairwoman and Chief Executive Officer of Valmo Ventures (a consulting and investment firm). Former Partner and Senior Vice President, Portfolio Manager and Investment Strategist at Wellington Management Company, LLP (investment management firm) (1992-2012). Former Chief Investment Officer, PG Corbin Asset Management (1990-1992). Formerly worked in institutional corporate bond sales at Kidder Peabody (1986-1990). Directorships in the Last Five Years.(2) Director of Envestnet, Inc. (provider of intelligent systems for wealth management and financial wellness) (since 2018). | |||
William H. Park 1947 | Chairperson of the Board and Trustee | 2016 (Chairperson) 2003 (Trustee) | Private investor. Formerly, Consultant (management and transactional) (2012-2014). Formerly, Chief Financial Officer, Aveon Group L.P. (investment management firm) (2010-2011). Formerly, Vice Chairman, Commercial Industrial Finance Corp. (specialty finance company) (2006-2010). Formerly, President and Chief Executive Officer, Prizm Capital Management, LLC (investment management firm) (2002-2005). Formerly, Executive Vice President and Chief Financial Officer, United Asset Management Corporation (investment management firm) (1982-2001). Formerly, Senior Manager, Price Waterhouse (now PricewaterhouseCoopers) (a registered public accounting firm) (1972-1981). Directorships in the Last Five Years.(2) None. | |||
| 25 |
Eaton Vance
Dividend Builder Fund
December 31, 2018
Management and Organization — continued
| Name and Year of Birth | Position(s) with the Trust | Trustee Since(1) | Principal Occupation(s) and Directorships During Past Five Years and Other Relevant Experience | |||
| Noninterested Trustees (continued) | ||||||
Helen Frame Peters 1948 | Trustee | 2008 | Professor of Finance, Carroll School of Management, Boston College. Formerly, Dean, Carroll School of Management, Boston College (2000-2002). Formerly, Chief Investment Officer, Fixed Income, Scudder Kemper Investments (investment management firm) (1998-1999). Formerly, Chief Investment Officer, Equity and Fixed Income, Colonial Management Associates (investment management firm) (1991-1998). Directorships in the Last Five Years.(2) None. | |||
Keith Quinton(3) 1958 | Trustee | 2018 | Independent Investment Committee Member at New Hampshire Retirement System (since 2017). Advisory Committee member at Northfield Information Services, Inc. (risk management analytics provider) (since 2016). Formerly, Portfolio Manager and Senior Quantitative Analyst at Fidelity Investments (investment management firm) (2001-2014). Directorships in the Last Five Years. Director of New Hampshire Municipal Bond Bank (since 2016). | |||
Marcus L. Smith(3) 1966 | Trustee | 2018 | Member of Posse Boston Advisory Board (foundation) (since 2015); Trustee at University of Mount Union (since 2008). Formerly, Portfolio Manager at MFS Investment Management (investment management firm) (1994-2017). Directorships in the Last Five Years. Director of MSCI Inc. (global provider of investment decision support tools) (since 2017). Director of DCT Industrial Trust Inc. (logistics real estate company) (since 2017). | |||
Susan J. Sutherland 1957 | Trustee | 2015 | Private investor. Formerly, Associate, Counsel and Partner at Skadden, Arps, Slate, Meagher & Flom LLP (law firm) (1982-2013). Directorships in the Last Five Years. Formerly, Director of Montpelier Re Holdings Ltd. (global provider of customized insurance and reinsurance products) (2013-2015). | |||
Scott E. Wennerholm 1959 | Trustee | 2016 | Formerly, Trustee at Wheelock College (postsecondary institution) (2012-2018). Formerly, Consultant at GF Parish Group (executive recruiting firm) (2016-2017). Formerly, Chief Operating Officer and Executive Vice President at BNY Mellon Asset Management (investment management firm) (2005-2011). Formerly, Chief Operating Officer and Chief Financial Officer at Natixis Global Asset Management (investment management firm) (1997-2004). Formerly, Vice President at Fidelity Investments Institutional Services (investment management firm) (1994-1997). Directorships in the Last Five Years. None. | |||
| Name and Year of Birth | Position(s) Trust | Officer Since(4) | Principal Occupation(s) During Past Five Years | |||
| Principal Officers who are not Trustees | ||||||
Payson F. Swaffield 1956 | President of the Trust | 2003 | Vice President and Chief Income Investment Officer of EVM and BMR. Also Vice President of Calvert Research and Management (“CRM”). | |||
Maureen A. Gemma 1960 | Vice President, Secretary and Chief Legal Officer | 2005 | Vice President of EVM and BMR. Also Vice President of CRM. | |||
James F. Kirchner 1967 | Treasurer | 2007 | Vice President of EVM and BMR. Also Vice President of CRM. | |||
Richard F. Froio 1968 | Chief Compliance Officer | 2017 | Vice President of EVM and BMR since 2017. Formerly, Deputy Chief Compliance Officer (Adviser/Funds) and Chief Compliance Officer (Distribution) at PIMCO (2012-2017) and Managing Director at BlackRock/Barclays Global Investors (2009-2012). | |||
| (1) | Year first appointed to serve as Trustee for a fund in the Eaton Vance family of funds. Each Trustee has served continuously since appointment unless indicated otherwise. |
| (2) | During their respective tenures, the Trustees (except for Mmes. Frost and Sutherland and Messrs. Fetting, Gorman, Quinton, Smith and Wennerholm) also served as Board members of one or more of the following funds (which operated in the years noted): eUnitsTM 2 Year U.S. Market Participation Trust: Upside to Cap / Buffered Downside (launched in 2012 and terminated in 2014); and eUnitsTM 2 Year U.S. Market Participation Trust II: Upside to Cap / Buffered Downside |
| 26 |
Eaton Vance
Dividend Builder Fund
December 31, 2018
Management and Organization — continued
| (launched in 2012 and terminated in 2014). However, Ms. Mosley did not serve as a Board member of eUnitsTM 2 Year U.S. Market Participation Trust: Upside to Cap / Buffered Downside (launched in 2012 and terminated in 2014). |
| (3) | Messrs. Quinton and Smith began serving as Trustees effective October 1, 2018. |
| (4) | Year first elected to serve as officer of a fund in the Eaton Vance family of funds when the officer has served continuously. Otherwise, year of most recent election as an officer of a fund in the Eaton Vance family of funds. Titles may have changed since initial election. |
The SAI for the Fund includes additional information about the Trustees and officers of the Fund can be obtained without charge on Eaton Vance’s website at www.eatonvance.com or by calling1-800-262-1122.
| 27 |
Eaton Vance Funds
IMPORTANT NOTICES
Privacy. The Eaton Vance organization is committed to ensuring your financial privacy. Each of the financial institutions identified below has in effect the following policy (“Privacy Policy”) with respect to nonpublic personal information about its customers:
| • | Only such information received from you, through application forms or otherwise, and information about your Eaton Vance fund transactions will be collected. This may include information such as name, address, social security number, tax status, account balances and transactions. |
| • | None of such information about you (or former customers) will be disclosed to anyone, except as permitted by law (which includes disclosure to employees necessary to service your account). In the normal course of servicing a customer’s account, Eaton Vance may share information with unaffiliated third parties that perform various required services such as transfer agents, custodians and broker-dealers. |
| • | Policies and procedures (including physical, electronic and procedural safeguards) are in place that are designed to protect the confidentiality of such information. |
| • | We reserve the right to change our Privacy Policy at any time upon proper notification to you. Customers may want to review our Privacy Policy periodically for changes by accessing the link on our homepage: www.eatonvance.com. |
Our pledge of privacy applies to the following entities within the Eaton Vance organization: the Eaton Vance Family of Funds, Eaton Vance Management, Eaton Vance Investment Counsel, Eaton Vance Distributors, Inc., Eaton Vance Trust Company, Eaton Vance Management (International) Limited, Eaton Vance Advisers International Ltd., Eaton Vance Management’s Real Estate Investment Group and Boston Management and Research. In addition, our Privacy Policy applies only to those Eaton Vance customers who are individuals and who have a direct relationship with us. If a customer’s account (i.e., fund shares) is held in the name of a third-party financial advisor/broker-dealer, it is likely that only such advisor’s privacy policies apply to the customer. This notice supersedes all previously issued privacy disclosures. For more information about Eaton Vance’s Privacy Policy, please call1-800-262-1122.
Delivery of Shareholder Documents. The Securities and Exchange Commission (SEC) permits funds to deliver only one copy of shareholder documents, including prospectuses, proxy statements and shareholder reports, to fund investors with multiple accounts at the same residential or post office box address. This practice is often called “householding” and it helps eliminate duplicate mailings to shareholders.Eaton Vance, or your financial advisor, may household the mailing of your documents indefinitely unless you instruct Eaton Vance, or your financial advisor, otherwise.If you would prefer that your Eaton Vance documents not be householded, please contact Eaton Vance at1-800-262-1122, or contact your financial advisor. Your instructions that householding not apply to delivery of your Eaton Vance documents will typically be effective within 30 days of receipt by Eaton Vance or your financial advisor.
Portfolio Holdings. Each Eaton Vance Fund and its underlying Portfolio(s) (if applicable) will file a schedule of portfolio holdings on FormN-Q with the SEC for the first and third quarters of each fiscal year. The FormN-Q will be available on the Eaton Vance website at www.eatonvance.com, by calling Eaton Vance at1-800-262-1122 or in the EDGAR database on the SEC’s website at www.sec.gov. FormN-Q may also be reviewed and copied at the SEC’s public reference room in Washington, D.C. (call1-800-732-0330 for information on the operation of the public reference room).
Proxy Voting. From time to time, funds are required to vote proxies related to the securities held by the funds. The Eaton Vance Funds or their underlying Portfolios (if applicable) vote proxies according to a set of policies and procedures approved by the Funds’ and Portfolios’ Boards. You may obtain a description of these policies and procedures and information on how the Funds or Portfolios voted proxies relating to portfolio securities during the most recent12-month period ended June 30, without charge, upon request, by calling1-800-262-1122 and by accessing the SEC’s website at www.sec.gov.
| 28 |
Investment Adviser
Boston Management and Research
Two International Place
Boston, MA 02110
Administrator
Eaton Vance Management
Two International Place
Boston, MA 02110
Principal Underwriter*
Eaton Vance Distributors, Inc.
Two International Place
Boston, MA 02110
(617)482-8260
Custodian
State Street Bank and Trust Company
State Street Financial Center, One Lincoln Street
Boston, MA 02111
Transfer Agent
BNY Mellon Investment Servicing (US) Inc.
Attn: Eaton Vance Funds
P.O. Box 9653
Providence, RI 02940-9653
(800)262-1122
Independent Registered Public Accounting Firm
Deloitte & Touche LLP
200 Berkeley Street
Boston, MA 02116-5022
Fund Offices
Two International Place
Boston, MA 02110
| * | FINRA BrokerCheck. Investors may check the background of their Investment Professional by contacting the Financial Industry Regulatory Authority (FINRA). FINRA BrokerCheck is a free tool to help investors check the professional background of current and former FINRA-registered securities firms and brokers. FINRA BrokerCheck is available by calling1-800-289-9999 and at www.FINRA.org. The FINRA BrokerCheck brochure describing this program is available to investors at www.FINRA.org. |

159 12.31.18

Eaton Vance
Greater India Fund
Annual Report
December 31, 2018
Important Note. Beginning on January 1, 2021, as permitted by regulations adopted by the Securities and Exchange Commission, paper copies of the Fund’s annual and semi-annual shareholder reports will no longer be sent by mail unless you specifically request paper copies of the reports. Instead, the reports will be made available on the Fund’s website (eatonvance.com/funddocuments), and you will be notified by mail each time a report is posted and provided with a website address to access the report.
If you already elected to receive shareholder reports electronically, you will not be affected by this change and you need not take any action. If you are a direct investor, you may elect to receive shareholder reports and other communications from the Fund electronically by signing up for e-Delivery at eatonvance.com/edelivery. If you own your shares through a financial intermediary (such as a broker-dealer or bank), you must contact your financial intermediary to sign up.
You may elect to receive all future Fund shareholder reports in paper free of charge. If you are a direct investor, you can inform the Fund that you wish to continue receiving paper copies of your shareholder reports by calling 1-800-262-1122. If you own these shares through a financial intermediary, you must contact your financial intermediary or follow instructions included with this disclosure, if applicable, to elect to continue to receive paper copies of your shareholder reports. Your election to receive reports in paper will apply to all Eaton Vance funds held directly or to all funds held through your financial intermediary, as applicable.

Commodity Futures Trading Commission Registration. Effective December 31, 2012, the Commodity Futures Trading Commission (“CFTC”) adopted certain regulatory changes that subject registered investment companies and advisers to regulation by the CFTC if a fund invests more than a prescribed level of its assets in certain CFTC-regulated instruments (including futures, certain options and swap agreements) or markets itself as providing investment exposure to such instruments. The Fund has claimed an exclusion from the definition of the term “commodity pool operator” under the Commodity Exchange Act. Accordingly, neither the Fund nor the adviser with respect to the operation of the Fund is subject to CFTC regulation. Because of its management of other strategies, the Fund’s adviser is registered with the CFTC as a commodity pool operator and a commodity trading advisor.
Fund shares are not insured by the FDIC and are not deposits or other obligations of, or guaranteed by, any depository institution. Shares are subject to investment risks, including possible loss of principal invested.
This report must be preceded or accompanied by a current summary prospectus or prospectus. Before investing, investors should consider carefully the investment objective, risks, and charges and expenses of a mutual fund. This and other important information is contained in the summary prospectus and prospectus, which can be obtained from a financial advisor. Prospective investors should read the prospectus carefully before investing. For further information, please call 1-800-262-1122.
Annual Report December 31, 2018
Eaton Vance
Greater India Fund
Table of Contents
Management’s Discussion of Fund Performance | 2 | |||
Performance | 3 | |||
Fund Profile | 4 | |||
Endnotes and Additional Disclosures | 5 | |||
Fund Expenses | 6 | |||
Financial Statements | 7 | |||
Report of Independent Registered Public Accounting Firm | 18 and 32 | |||
Federal Tax Information | 19 | |||
Special Meeting of Shareholders | 33 | |||
Management and Organization | 34 | |||
Important Notices | 37 | |||
Eaton Vance
Greater India Fund
December 31, 2018
Management’s Discussion of Fund Performance1
Economic and Market Conditions
Escalating trade tensions between the U.S. and China, fears of a global economic slowdown, domestic credit concerns, and political uncertainties contributed to volatility for Indian equities for the12-month period ended December 31, 2018. The MSCI India Index (the Index)2 returned –7.30% during the period.
Indian equities saw significant outperformance against broader emerging-market equities in July 2018, buoyed by a Goods and Services Tax cut on key products, expectations of a healthy quarterly earnings season, as well as a normal monsoon season. However, September 2018 marked the worst monthly performance for Indian equities since August 2013, as default by a particularnon-bank finance company weighed down on investor sentiment. Credit concerns persisted in October 2018, extending the selloff amid global volatility driven by growth and trade unease.
A sharp rebound in November 2018 was the result of strong Indian rupee appreciation, lower crude oil prices, and improving global investor sentiment. Indian equities were resilient despite rising domestic and global political uncertainties in December 2018, following the resignation of the governor of the Reserve Bank of India and the ruling political party’s defeat in three state elections, compounded by a partial U.S. federal government shutdown.
Fund Performance
For the12-month period ended December 31, 2018, Eaton Vance Greater India Fund (the Fund) underperformed its benchmark, the Index, returning –12.13% for Class A shares at net asset value (NAV), versus the Index’s –7.30% return.
Positions in industrials and materials sectors detracted from relative returns. In addition, an overweight position in Vodafone Idea, Ltd. (Vodafone Idea), formerly Idea Cellular, Ltd., a communication services provider, was a significant detractor from relative performance.
The stock price declined as the Indian telecom industry faced intensifying competition. The Fund sold its position in Vodafone Idea during the period. Within the energy sector, the Fund’s underweight position in Reliance Industries, Ltd., a refiner and manufacturer of petro-chemicals, also detracted from relative returns. The company performed well during the period following strong business results driven by higher
petro-chemical volumes and margins. Stock selections within the consumer discretionary and health care sectors contributed to relative performance. In the financials sector, the Fund’s overweight position in Bajaj Finance, Ltd. — a nonbanking financial company that focuses on consumers, small- andmedium-size enterprises, and commercial lending — was the largest contributor to relative performance. The stock outperformed the Index as the company reported strong business results along with stable asset quality and healthy traction in loan growth. Similarly, the Fund’s overweight position in HDFC Bank, Ltd., a private bank in India, also contributed to relative performance. The stock outperformed the Index as the company reported healthy loan growth and a stable net interest margin — a measure of the difference between the interest income generated by banks and the amount of interest paid out to lenders.
See Endnotes and Additional Disclosures in this report.
Past performance is no guarantee of future results. Returns are historical and are calculated by determining the percentage change in net asset value (NAV) or offering price (as applicable) with all distributions reinvested. Investment return and principal value will fluctuate so that shares, when redeemed, may be worth more or less than their original cost. Performance less than or equal to one year is cumulative. Performance is for the stated time period only; due to market volatility, the Fund’s current performance may be lower or higher than quoted. Returns are before taxes unless otherwise noted. For performance as of the most recentmonth-end, please refer to eatonvance.com.
| 2 |
Eaton Vance
Greater India Fund
December 31, 2018
Performance2,3
Portfolio ManagerHiren Dasani, CFA, of Goldman Sachs Asset Management, L.P. (GSAM)
| % Average Annual Total Returns | Class Inception Date | Performance Inception Date | One Year | Five Years | Ten Years | |||||||||||||||
Class A at NAV | 05/02/1994 | 05/02/1994 | –12.13 | % | 11.56 | % | 11.11 | % | ||||||||||||
Class A with 5.75% Maximum Sales Charge | — | — | –17.19 | 10.25 | 10.45 | |||||||||||||||
Class B at NAV | 05/02/1994 | 05/02/1994 | –12.76 | 10.78 | 10.37 | |||||||||||||||
Class B with 5% Maximum Sales Charge | — | — | –17.07 | 10.51 | 10.37 | |||||||||||||||
Class C at NAV | 07/07/2006 | 05/02/1994 | –12.76 | 10.78 | 10.38 | |||||||||||||||
Class C with 1% Maximum Sales Charge | — | — | –13.62 | 10.78 | 10.38 | |||||||||||||||
Class I at NAV | 10/01/2009 | 05/02/1994 | –11.85 | 11.90 | 11.44 | |||||||||||||||
MSCI India Index | — | — | –7.30 | % | 8.07 | % | 10.65 | % | ||||||||||||
| % Total Annual Operating Expense Ratios4 | Class A | Class B | Class C | Class I | ||||||||||||
| 1.68 | % | 2.38 | % | 2.38 | % | 1.38 | % | |||||||||
Growth of $10,000
This graph shows the change in value of a hypothetical investment of $10,000 in Class A of the Fund for the period indicated. For comparison, the same investment is shown in the indicated index.
![]()
| Growth of Investment3 | Amount Invested | Period Beginning | At NAV | With Maximum Sales Charge | ||||||||||||
Class B | $ | 10,000 | 12/31/2008 | $ | 26,844 | N.A. | ||||||||||
Class C | $ | 10,000 | 12/31/2008 | $ | 26,856 | N.A. | ||||||||||
Class I | $ | 250,000 | 12/31/2008 | $ | 738,945 | N.A. | ||||||||||
See Endnotes and Additional Disclosures in this report.
Past performance is no guarantee of future results. Returns are historical and are calculated by determining the percentage change in net asset value (NAV) or offering price (as applicable) with all distributions reinvested. Investment return and principal value will fluctuate so that shares, when redeemed, may be worth more or less than their original cost. Performance less than or equal to one year is cumulative. Performance is for the stated time period only; due to market volatility, the Fund’s current performance may be lower or higher than quoted. Returns are before taxes unless otherwise noted. For performance as of the most recentmonth-end, please refer to eatonvance.com.
| 3 |
Eaton Vance
Greater India Fund
December 31, 2018
Fund Profile5
Sector Allocation (% of net assets)6
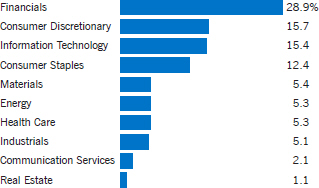
Top 10 Holdings (% of net assets)6
Infosys, Ltd. | 9.0 | % | ||
Maruti Suzuki India, Ltd. | 5.9 | |||
Reliance Industries, Ltd. | 5.3 | |||
Housing Development Finance Corp., Ltd. | 4.5 | |||
Axis Bank, Ltd. | 4.3 | |||
HDFC Bank, Ltd. | 3.5 | |||
ICICI Bank, Ltd. | 3.4 | |||
Bajaj Finance, Ltd. | 3.1 | |||
Hindustan Unilever, Ltd. | 3.0 | |||
Britannia Industries, Ltd. | 2.5 | |||
Total | 44.5 | % | ||
See Endnotes and Additional Disclosures in this report.
| 4 |
Eaton Vance
Greater India Fund
December 31, 2018
Endnotes and Additional Disclosures
| 1 | The views expressed in this report are those of the portfolio manager(s) and are current only through the date stated at the top of this page. These views are subject to change at any time based upon market or other conditions, and Eaton Vance and the Fund(s) disclaim any responsibility to update such views. These views may not be relied upon as investment advice and, because investment decisions are based on many factors, may not be relied upon as an indication of trading intent on behalf of any Eaton Vance fund. This commentary may contain statements that are not historical facts, referred to as “forward looking statements.” The Fund’s actual future results may differ significantly from those stated in any forward looking statement, depending on factors such as changes in securities or financial markets or general economic conditions, the volume of sales and purchases of Fund shares, the continuation of investment advisory, administrative and service contracts, and other risks discussed from time to time in the Fund’s filings with the Securities and Exchange Commission. |
| 2 | MSCI India Index is an unmanaged index of common stocks traded in the India market. MSCI indexes are net of foreign withholding taxes. Source: MSCI. MSCI data may not be reproduced or used for any other purpose. MSCI provides no warranties, has not prepared or approved this report, and has no liability hereunder. Unless otherwise stated, index returns do not reflect the effect of any applicable sales charges, commissions, expenses, taxes or leverage, as applicable. It is not possible to invest directly in an index. |
| 3 | Total Returns at NAV do not include applicable sales charges. If sales charges were deducted, the returns would be lower. Total Returns shown with maximum sales charge reflect the stated maximum sales charge. Unless otherwise stated, performance does not reflect the deduction of taxes on Fund distributions or redemptions of Fund shares. |
Performance prior to the inception date of a class may be linked to the performance of an older class of the Fund. This linked performance is adjusted for any applicable sales charge, but is not adjusted for class expense differences. If adjusted for such differences, the performance would be different. The performance of Class I is linked to Class A. Performance since inception for an index, if presented, is the performance since the Fund’s or oldest share class’ inception, as applicable. Performance presented in the Financial Highlights included in the financial statements is not linked. |
Effective September 15, 2016, Goldman Sachs Asset Management International (GSAM beginning October 19, 2017) begansub- advising the Fund. Performance prior to September 15, 2016, reflects the Fund’s performance under a formersub-adviser. |
| 4 | Source: Fund prospectus. The expense ratios for the current reporting period can be found in the Financial Highlights section of this report. |
| 5 | Fund primarily invests in an affiliated investment company (Portfolio) with the same objective(s) and policies as the Fund and may also invest directly. Unless otherwise noted, references to investments are to the aggregate holdings of the Fund and the Portfolio. |
| 6 | Excludes cash and cash equivalents. |
Fund profile subject to change due to active management. |
| 5 |
Eaton Vance
Greater India Fund
December 31, 2018
Fund Expenses
Example: As a Fund shareholder, you incur two types of costs: (1) transaction costs, including sales charges (loads) on purchases and redemption fees (if applicable); and (2) ongoing costs, including management fees; distribution and/or service fees; and other Fund expenses. This Example is intended to help you understand your ongoing costs (in dollars) of Fund investing and to compare these costs with the ongoing costs of investing in other mutual funds. The Example is based on an investment of $1,000 invested at the beginning of the period and held for the entire period (July 1, 2018 – December 31, 2018).
Actual Expenses: The first section of the table below provides information about actual account values and actual expenses. You may use the information in this section, together with the amount you invested, to estimate the expenses that you paid over the period. Simply divide your account value by $1,000 (for example, an $8,600 account value divided by $1,000 = 8.6), then multiply the result by the number in the first section under the heading entitled “Expenses Paid During Period” to estimate the expenses you paid on your account during this period.
Hypothetical Example for Comparison Purposes: The second section of the table below provides information about hypothetical account values and hypothetical expenses based on the actual Fund expense ratio and an assumed rate of return of 5% per year (before expenses), which is not the actual Fund return. The hypothetical account values and expenses may not be used to estimate the actual ending account balance or expenses you paid for the period. You may use this information to compare the ongoing costs of investing in your Fund and other funds. To do so, compare this 5% hypothetical example with the 5% hypothetical examples that appear in the shareholder reports of the other funds.
Please note that the expenses shown in the table are meant to highlight your ongoing costs only and do not reflect any transactional costs, such as sales charges (loads) or redemption fees (if applicable). Therefore, the second section of the table is useful in comparing ongoing costs only, and will not help you determine the relative total costs of owning different funds. In addition, if these transactional costs were included, your costs would be higher.
| Beginning Account Value (7/1/18) | Ending Account Value (12/31/18) | Expenses Paid During Period* (7/1/18 – 12/31/18) | Annualized Expense Ratio | |||||||||||||
Actual | ||||||||||||||||
Class A | $ | 1,000.00 | $ | 961.10 | $ | 8.01 | 1.62 | % | ||||||||
Class B | $ | 1,000.00 | $ | 957.50 | $ | 11.45 | 2.32 | % | ||||||||
Class C | $ | 1,000.00 | $ | 957.60 | $ | 11.45 | 2.32 | % | ||||||||
Class I | $ | 1,000.00 | $ | 962.80 | $ | 6.53 | 1.32 | % | ||||||||
Hypothetical | ||||||||||||||||
(5% return per year before expenses) | ||||||||||||||||
Class A | $ | 1,000.00 | $ | 1,017.00 | $ | 8.24 | 1.62 | % | ||||||||
Class B | $ | 1,000.00 | $ | 1,013.50 | $ | 11.77 | 2.32 | % | ||||||||
Class C | $ | 1,000.00 | $ | 1,013.50 | $ | 11.77 | 2.32 | % | ||||||||
Class I | $ | 1,000.00 | $ | 1,018.60 | $ | 6.72 | 1.32 | % | ||||||||
| * | Expenses are equal to the Fund’s annualized expense ratio for the indicated Class, multiplied by the average account value over the period, multiplied by 184/365 (to reflect the one-half year period). The Example assumes that the $1,000 was invested at the net asset value per share determined at the close of business on June 30, 2018. The Example reflects the expenses of both the Fund and the Portfolio. |
| 6 |
Eaton Vance
Greater India Fund
December 31, 2018
Statement of Assets and Liabilities
| Assets | December 31, 2018 | |||
Investment in Greater India Portfolio, at value (identified cost, $172,769,721) | $ | 213,184,581 | ||
Receivable for Fund shares sold | 114,094 | |||
Total assets | $ | 213,298,675 | ||
| Liabilities |
| |||
Payable for Fund shares redeemed | $ | 303,278 | ||
Payable to affiliates: | ||||
Administration fee | 26,935 | |||
Distribution and service fees | 57,789 | |||
Trustees’ fees | 125 | |||
Accrued expenses | 107,295 | |||
Total liabilities | $ | 495,422 | ||
Net Assets | $ | 212,803,253 | ||
| Sources of Net Assets |
| |||
Paid-in capital | $ | 172,573,511 | ||
Distributable earnings | 40,229,742 | |||
Total | $ | 212,803,253 | ||
| Class A Shares |
| |||
Net Assets | $ | 152,967,273 | ||
Shares Outstanding | 4,776,701 | |||
Net Asset Value and Redemption Price Per Share | ||||
(net assets ÷ shares of beneficial interest outstanding) | $ | 32.02 | ||
Maximum Offering Price Per Share | ||||
(100 ÷ 94.25 of net asset value per share) | $ | 33.97 | ||
| Class B Shares |
| |||
Net Assets | $ | 615,734 | ||
Shares Outstanding | 22,119 | |||
Net Asset Value and Offering Price Per Share* | ||||
(net assets ÷ shares of beneficial interest outstanding) | $ | 27.84 | ||
| Class C Shares |
| |||
Net Assets | $ | 21,890,595 | ||
Shares Outstanding | 792,481 | |||
Net Asset Value and Offering Price Per Share* | ||||
(net assets ÷ shares of beneficial interest outstanding) | $ | 27.62 | ||
| Class I Shares |
| |||
Net Assets | $ | 37,329,651 | ||
Shares Outstanding | 1,140,628 | |||
Net Asset Value, Offering Price and Redemption Price Per Share | ||||
(net assets ÷ shares of beneficial interest outstanding) | $ | 32.73 | ||
On sales of $50,000 or more, the offering price of Class A shares is reduced.
| * | Redemption price per share is equal to the net asset value less any applicable contingent deferred sales charge. |
| 7 | See Notes to Financial Statements. |
Eaton Vance
Greater India Fund
December 31, 2018
Statement of Operations
| Investment Income | Year Ended December 31, 2018 | |||
Dividends allocated from Portfolio | $ | 2,796,699 | ||
Interest allocated from Portfolio | 17,327 | |||
Expenses allocated from Portfolio | (2,354,847 | ) | ||
Total investment income from Portfolio | $ | 459,179 | ||
| Expenses | ||||
Administration fee | $ | 360,492 | ||
Distribution and service fees | ||||
Class A | 509,887 | |||
Class B | 12,044 | |||
Class C | 256,807 | |||
Trustees’ fees and expenses | 500 | |||
Custodian fee | 27,842 | |||
Transfer and dividend disbursing agent fees | 275,918 | |||
Legal and accounting services | 32,997 | |||
Printing and postage | 51,606 | |||
Registration fees | 38,240 | |||
Miscellaneous | 14,670 | |||
Total expenses | $ | 1,581,003 | ||
Net investment loss | $ | (1,121,824 | ) | |
| Realized and Unrealized Gain (Loss) from Portfolio | ||||
Net realized gain (loss) — | ||||
Investment transactions | $ | 10,913,545 | ||
Financial futures contracts | (382,329 | ) | ||
Foreign currency transactions | (329,961 | ) | ||
Net realized gain | $ | 10,201,255 | ||
Change in unrealized appreciation (depreciation) — | ||||
Investments | $ | (41,881,058 | ) | |
Financial futures contracts | 108,160 | |||
Foreign currency | 1,115 | |||
Net change in unrealized appreciation (depreciation) | $ | (41,771,783 | ) | |
Net realized and unrealized loss | $ | (31,570,528 | ) | |
Net decrease in net assets from operations | $ | (32,692,352 | ) | |
| 8 | See Notes to Financial Statements. |
Eaton Vance
Greater India Fund
December 31, 2018
Statements of Changes in Net Assets
| Year Ended December 31, | ||||||||
| Increase (Decrease) in Net Assets | 2018 | 2017 | ||||||
From operations — | ||||||||
Net investment income (loss) | $ | (1,121,824 | ) | $ | 73,896 | |||
Net realized gain | 10,201,255 | 6,224,328 | ||||||
Net change in unrealized appreciation (depreciation) | (41,771,783 | ) | 82,158,381 | |||||
Net increase (decrease) in net assets from operations | $ | (32,692,352 | ) | $ | 88,456,605 | |||
Distributions to shareholders(1) — | ||||||||
Class A | $ | (1,884,637 | ) | $ | (6,264,273 | ) | ||
Class B | (13,568 | ) | (60,706 | ) | ||||
Class C | (325,992 | ) | (952,147 | ) | ||||
Class I | (459,954 | ) | (1,706,551 | ) | ||||
Total distributions to shareholders | $ | (2,684,151 | ) | $ | (8,983,677 | ) | ||
Transactions in shares of beneficial interest — | ||||||||
Proceeds from sale of shares | ||||||||
Class A | $ | 11,152,692 | $ | 17,106,407 | ||||
Class B | 5,913 | 13,784 | ||||||
Class C | 1,727,576 | 4,814,595 | ||||||
Class I | 13,797,287 | 27,236,258 | ||||||
Net asset value of shares issued to shareholders in payment of distributions declared | ||||||||
Class A | 1,696,856 | 5,659,300 | ||||||
Class B | 12,588 | 55,076 | ||||||
Class C | 299,083 | 853,966 | ||||||
Class I | 368,069 | 1,188,806 | ||||||
Cost of shares redeemed | ||||||||
Class A | (28,089,646 | ) | (39,097,762 | ) | ||||
Class B | (182,325 | ) | (496,150 | ) | ||||
Class C | (6,291,868 | ) | (6,363,095 | ) | ||||
Class I | (19,199,899 | ) | (19,831,021 | ) | ||||
Net asset value of shares exchanged | ||||||||
Class A | 1,085,292 | 1,598,335 | ||||||
Class B | (1,085,292 | ) | (1,598,335 | ) | ||||
Net decrease in net assets from Fund share transactions | $ | (24,703,674 | ) | $ | (8,859,836 | ) | ||
Net increase (decrease) in net assets | $ | (60,080,177 | ) | $ | 70,613,092 | |||
| Net Assets |
| |||||||
At beginning of year | $ | 272,883,430 | $ | 202,270,338 | ||||
At end of year | $ | 212,803,253 | $ | 272,883,430 | (2) | |||
| (1) | For the year ended December 31, 2017, the source of distributions was from net investment income. The current year presentation of distributions conforms with the Disclosure Update and Simplification Rule issued by the Securities and Exchange Commission, effective November 5, 2018. |
| (2) | Includes accumulated undistributed net investment income of $2,683,968 at December 31, 2017. The requirement to disclose the corresponding amount as of December 31, 2018 was eliminated. |
| 9 | See Notes to Financial Statements. |
Eaton Vance
Greater India Fund
December 31, 2018
Financial Highlights
| Class A | ||||||||||||||||||||
| Year Ended December 31, | ||||||||||||||||||||
| 2018 | 2017 | 2016 | 2015 | 2014 | ||||||||||||||||
Net asset value — Beginning of year | $ | 36.830 | $ | 26.300 | $ | 25.770 | $ | 27.310 | $ | 19.980 | ||||||||||
| Income (Loss) From Operations | ||||||||||||||||||||
Net investment income (loss)(1) | $ | (0.150 | ) | $ | 0.016 | $ | (0.200 | ) | $ | (0.245 | ) | $ | (0.116 | ) | ||||||
Net realized and unrealized gain (loss) | (4.284 | ) | 11.737 | 0.878 | (1.090 | ) | 7.956 | |||||||||||||
Total income (loss) from operations | $ | (4.434 | ) | $ | 11.753 | $ | 0.678 | $ | (1.335 | ) | $ | 7.840 | ||||||||
| Less Distributions | ||||||||||||||||||||
From net investment income | $ | (0.376 | ) | $ | (1.223 | ) | $ | (0.148 | ) | $ | (0.205 | ) | $ | (0.510 | ) | |||||
Total distributions | $ | (0.376 | ) | $ | (1.223 | ) | $ | (0.148 | ) | $ | (0.205 | ) | $ | (0.510 | ) | |||||
Net asset value — End of year | $ | 32.020 | $ | 36.830 | $ | 26.300 | $ | 25.770 | $ | 27.310 | ||||||||||
Total Return(2) | (12.13 | )% | 44.80 | % | 2.64 | %(3) | (4.96 | )%(3) | 39.28 | %(3) | ||||||||||
| Ratios/Supplemental Data |
| |||||||||||||||||||
Net assets, end of year (000’s omitted) | $ | 152,967 | $ | 192,016 | $ | 149,950 | $ | 172,386 | $ | 195,146 | ||||||||||
Ratios (as a percentage of average daily net assets):(4) | ||||||||||||||||||||
Expenses(5) | 1.62 | % | 1.68 | % | 1.88 | %(3) | 1.88 | %(3) | 1.88 | %(3) | ||||||||||
Net investment income (loss) | (0.44 | )% | 0.05 | % | (0.75 | )% | (0.88 | )% | (0.48 | )% | ||||||||||
Portfolio Turnover of the Portfolio | 29 | % | 25 | % | 91 | % | 30 | % | 22 | % | ||||||||||
| (1) | Computed using average shares outstanding. |
| (2) | Returns are historical and are calculated by determining the percentage change in net asset value with all distributions reinvested and do not reflect the effect of sales charges. |
| (3) | The investment adviser and sub-adviser of the Portfolio reimbursed certain operating expenses (equal to 0.02%, 0.02% and 0.04% of average daily net assets for the years ended December 31, 2016, 2015 and 2014, respectively). Absent this reimbursement, total return would be lower. |
| (4) | Includes the Fund’s share of the Portfolio’s allocated expenses. |
| (5) | Excludes the effect of custody fee credits, if any, of less than 0.005%. Effective September 1, 2015, custody fee credits, which were earned on cash deposit balances, were discontinued by the custodian. |
| 10 | See Notes to Financial Statements. |
Eaton Vance
Greater India Fund
December 31, 2018
Financial Highlights — continued
| Class B | ||||||||||||||||||||
| Year Ended December 31, | ||||||||||||||||||||
| 2018 | 2017 | 2016 | 2015 | 2014 | ||||||||||||||||
Net asset value — Beginning of year | $ | 32.300 | $ | 23.090 | $ | 22.650 | $ | 24.190 | $ | 17.680 | ||||||||||
| Income (Loss) From Operations | ||||||||||||||||||||
Net investment loss(1) | $ | (0.349 | ) | $ | (0.171 | ) | $ | (0.334 | ) | $ | (0.401 | ) | $ | (0.261 | ) | |||||
Net realized and unrealized gain (loss) | (3.735 | ) | 10.267 | 0.774 | (0.938 | ) | 7.024 | |||||||||||||
Total income (loss) from operations | $ | (4.084 | ) | $ | 10.096 | $ | 0.440 | $ | (1.339 | ) | $ | 6.763 | ||||||||
| Less Distributions | ||||||||||||||||||||
From net investment income | $ | (0.376 | ) | $ | (0.886 | ) | $ | — | $ | (0.201 | ) | $ | (0.253 | ) | ||||||
Total distributions | $ | (0.376 | ) | $ | (0.886 | ) | $ | — | $ | (0.201 | ) | $ | (0.253 | ) | ||||||
Net asset value — End of year | $ | 27.840 | $ | 32.300 | $ | 23.090 | $ | 22.650 | $ | 24.190 | ||||||||||
Total Return(2) | (12.76 | )% | 43.78 | % | 1.94 | %(3) | (5.62 | )%(3) | 38.27 | %(3) | ||||||||||
| Ratios/Supplemental Data |
| |||||||||||||||||||
Net assets, end of year (000’s omitted) | $ | 616 | $ | 2,078 | $ | 3,120 | $ | 6,970 | $ | 16,502 | ||||||||||
Ratios (as a percentage of average daily net assets):(4) | ||||||||||||||||||||
Expenses(5) | 2.32 | % | 2.38 | % | 2.58 | %(3) | 2.58 | %(3) | 2.58 | %(3) | ||||||||||
Net investment loss | (1.17 | )% | (0.60 | )% | (1.45 | )% | (1.62 | )% | (1.27 | )% | ||||||||||
Portfolio Turnover of the Portfolio | 29 | % | 25 | % | 91 | % | 30 | % | 22 | % | ||||||||||
| (1) | Computed using average shares outstanding. |
| (2) | Returns are historical and are calculated by determining the percentage change in net asset value with all distributions reinvested and do not reflect the effect of sales charges. |
| (3) | The investment adviser and sub-adviser of the Portfolio reimbursed certain operating expenses (equal to 0.02%, 0.02% and 0.04% of average daily net assets for the years ended December 31, 2016, 2015 and 2014, respectively). Absent this reimbursement, total return would be lower. |
| (4) | Includes the Fund’s share of the Portfolio’s allocated expenses. |
| (5) | Excludes the effect of custody fee credits, if any, of less than 0.005%. Effective September 1, 2015, custody fee credits, which were earned on cash deposit balances, were discontinued by the custodian. |
| 11 | See Notes to Financial Statements. |
Eaton Vance
Greater India Fund
December 31, 2018
Financial Highlights — continued
| Class C | ||||||||||||||||||||
| Year Ended December 31, | ||||||||||||||||||||
| 2018 | 2017 | 2016 | 2015 | 2014 | ||||||||||||||||
Net asset value — Beginning of year | $ | 32.050 | $ | 23.020 | $ | 22.580 | $ | 24.120 | $ | 17.720 | ||||||||||
| Income (Loss) From Operations | ||||||||||||||||||||
Net investment loss(1) | $ | (0.334 | ) | $ | (0.186 | ) | $ | (0.336 | ) | $ | (0.383 | ) | $ | (0.256 | ) | |||||
Net realized and unrealized gain (loss) | (3.720 | ) | 10.247 | 0.776 | (0.954 | ) | 7.029 | |||||||||||||
Total income (loss) from operations | $ | (4.054 | ) | $ | 10.061 | $ | 0.440 | $ | (1.337 | ) | $ | 6.773 | ||||||||
| Less Distributions | ||||||||||||||||||||
From net investment income | $ | (0.376 | ) | $ | (1.031 | ) | $ | — | $ | (0.203 | ) | $ | (0.373 | ) | ||||||
Total distributions | $ | (0.376 | ) | $ | (1.031 | ) | $ | — | $ | (0.203 | ) | $ | (0.373 | ) | ||||||
Net asset value — End of year | $ | 27.620 | $ | 32.050 | $ | 23.020 | $ | 22.580 | $ | 24.120 | ||||||||||
Total Return(2) | (12.76 | )% | 43.81 | % | 1.95 | %(3) | (5.63 | )%(3) | 38.25 | %(3) | ||||||||||
| Ratios/Supplemental Data |
| |||||||||||||||||||
Net assets, end of year (000’s omitted) | $ | 21,891 | $ | 30,195 | $ | 22,335 | $ | 28,276 | $ | 31,918 | ||||||||||
Ratios (as a percentage of average daily net assets):(4) | ||||||||||||||||||||
Expenses(5) | 2.32 | % | 2.38 | % | 2.58 | %(3) | 2.58 | %(3) | 2.58 | %(3) | ||||||||||
Net investment loss | (1.14 | )% | (0.65 | )% | (1.44 | )% | (1.56 | )% | (1.19 | )% | ||||||||||
Portfolio Turnover of the Portfolio | 29 | % | 25 | % | 91 | % | 30 | % | 22 | % | ||||||||||
| (1) | Computed using average shares outstanding. |
| (2) | Returns are historical and are calculated by determining the percentage change in net asset value with all distributions reinvested and do not reflect the effect of sales charges. |
| (3) | The investment adviser and sub-adviser of the Portfolio reimbursed certain operating expenses (equal to 0.02%, 0.02% and 0.04% of average daily net assets for the years ended December 31, 2016, 2015 and 2014, respectively). Absent this reimbursement, total return would be lower. |
| (4) | Includes the Fund’s share of the Portfolio’s allocated expenses. |
| (5) | Excludes the effect of custody fee credits, if any, of less than 0.005%. Effective September 1, 2015, custody fee credits, which were earned on cash deposit balances, were discontinued by the custodian. |
| 12 | See Notes to Financial Statements. |
Eaton Vance
Greater India Fund
December 31, 2018
Financial Highlights — continued
| Class I | ||||||||||||||||||||
| Year Ended December 31, | ||||||||||||||||||||
| 2018 | 2017 | 2016 | 2015 | 2014 | ||||||||||||||||
Net asset value — Beginning of year | $ | 37.520 | $ | 26.770 | $ | 26.230 | $ | 27.710 | $ | 20.260 | ||||||||||
| Income (Loss) From Operations | ||||||||||||||||||||
Net investment income (loss)(1) | $ | (0.047 | ) | $ | 0.140 | $ | (0.126 | ) | $ | (0.166 | ) | $ | (0.044 | ) | ||||||
Net realized and unrealized gain (loss) | (4.367 | ) | 11.936 | 0.900 | (1.108 | ) | 8.078 | |||||||||||||
Total income (loss) from operations | $ | (4.414 | ) | $ | 12.076 | $ | 0.774 | $ | (1.274 | ) | $ | 8.034 | ||||||||
| Less Distributions | ||||||||||||||||||||
From net investment income | $ | (0.376 | ) | $ | (1.326 | ) | $ | (0.234 | ) | $ | (0.206 | ) | $ | (0.584 | ) | |||||
Total distributions | $ | (0.376 | ) | $ | (1.326 | ) | $ | (0.234 | ) | $ | (0.206 | ) | $ | (0.584 | ) | |||||
Net asset value — End of year | $ | 32.730 | $ | 37.520 | $ | 26.770 | $ | 26.230 | $ | 27.710 | ||||||||||
Total Return(2) | (11.85 | )% | 45.22 | % | 2.97 | %(3) | (4.70 | )%(3) | 39.74 | %(3) | ||||||||||
| Ratios/Supplemental Data |
| |||||||||||||||||||
Net assets, end of year (000’s omitted) | $ | 37,330 | $ | 48,595 | $ | 26,866 | $ | 29,959 | $ | 35,388 | ||||||||||
Ratios (as a percentage of average daily net assets):(4) | ||||||||||||||||||||
Expenses(5) | 1.32 | % | 1.38 | % | 1.58 | %(3) | 1.58 | %(3) | 1.58 | %(3) | ||||||||||
Net investment income (loss) | (0.14 | )% | 0.41 | % | (0.46 | )% | (0.59 | )% | (0.18 | )% | ||||||||||
Portfolio Turnover of the Portfolio | 29 | % | 25 | % | 91 | % | 30 | % | 22 | % | ||||||||||
| (1) | Computed using average shares outstanding. |
| (2) | Returns are historical and are calculated by determining the percentage change in net asset value with all distributions reinvested. |
| (3) | The investment adviser and sub-adviser of the Portfolio reimbursed certain operating expenses (equal to 0.02%, 0.02% and 0.04% of average daily net assets for the years ended December 31, 2016, 2015 and 2014, respectively). Absent this reimbursement, total return would be lower. |
| (4) | Includes the Fund’s share of the Portfolio’s allocated expenses. |
| (5) | Excludes the effect of custody fee credits, if any, of less than 0.005%. Effective September 1, 2015, custody fee credits, which were earned on cash deposit balances, were discontinued by the custodian. |
| 13 | See Notes to Financial Statements. |
Eaton Vance
Greater India Fund
December 31, 2018
Notes to Financial Statements
1 Significant Accounting Policies
Eaton Vance Greater India Fund (the Fund) is a non-diversified series of Eaton Vance Special Investment Trust (the Trust). The Trust is a Massachusetts business trust registered under the Investment Company Act of 1940, as amended (the 1940 Act), as an open-end management investment company. The Fund offers four classes of shares. Class A shares are generally sold subject to a sales charge imposed at time of purchase. Class B and Class C shares are sold at net asset value and are generally subject to a contingent deferred sales charge (see Note 5). Class I shares are sold at net asset value and are not subject to a sales charge. Class B shares automatically convert to Class A shares eight years after their purchase as described in the Fund’s prospectus. Beginning January 1, 2012, Class B shares are only available for purchase upon exchange from another Eaton Vance fund or through reinvestment of distributions. Effective January 25, 2019, Class C shares generally will automatically convert to Class A shares ten years after their purchase as described in the Fund’s prospectus. Each class represents a pro-rata interest in the Fund, but votes separately on class-specific matters and (as noted below) is subject to different expenses. Realized and unrealized gains and losses and net investment income and losses, other than class-specific expenses, are allocated daily to each class of shares based on the relative net assets of each class to the total net assets of the Fund. Each class of shares differs in its distribution plan and certain other class-specific expenses. The Fund invests all of its investable assets in interests in Greater India Portfolio (the Portfolio), a Massachusetts business trust, having the same investment objective and policies as the Fund. The value of the Fund’s investment in the Portfolio reflects the Fund’s proportionate interest in the net assets of the Portfolio (99.9% at December 31, 2018). The performance of the Fund is directly affected by the performance of the Portfolio. The financial statements of the Portfolio, including the portfolio of investments, are included elsewhere in this report and should be read in conjunction with the Fund’s financial statements.
The following is a summary of significant accounting policies of the Fund. The policies are in conformity with accounting principles generally accepted in the United States of America (U.S. GAAP). The Fund is an investment company and follows accounting and reporting guidance in the Financial Accounting Standards Board (FASB) Accounting Standards Codification Topic 946.
A Investment Valuation — Valuation of securities by the Portfolio is discussed in Note 1A of the Portfolio’s Notes to Financial Statements, which are included elsewhere in this report.
B Income — The Fund’s net investment income or loss consists of the Fund’s pro-rata share of the net investment income or loss of the Portfolio, less all actual and accrued expenses of the Fund.
C Federal and Other Taxes — The Fund’s policy is to comply with the provisions of the Internal Revenue Code applicable to regulated investment companies and to distribute to shareholders each year substantially all of its net investment income, and all or substantially all of its net realized capital gains. Accordingly, no provision for federal income or excise tax is necessary.
In addition to the requirements of the Internal Revenue Code, the Fund may also be required to recognize its pro-rata share of the capital gains taxes incurred by the Portfolio. In doing so, the daily net asset value would reflect the Fund’s pro-rata share of the estimated reserve for such taxes incurred by the Portfolio.
As of December 31, 2018, the Fund had no uncertain tax positions that would require financial statement recognition, de-recognition, or disclosure. The Fund files a U.S. federal income tax return annually after its fiscal year-end, which is subject to examination by the Internal Revenue Service for a period of three years from the date of filing.
D Expenses — The majority of expenses of the Trust are directly identifiable to an individual fund. Expenses which are not readily identifiable to a specific fund are allocated taking into consideration, among other things, the nature and type of expense and the relative size of the funds.
E Use of Estimates — The preparation of the financial statements in conformity with U.S. GAAP requires management to make estimates and assumptions that affect the reported amounts of assets and liabilities at the date of the financial statements and the reported amounts of income and expense during the reporting period. Actual results could differ from those estimates.
F Indemnifications — Under the Trust’s organizational documents, its officers and Trustees may be indemnified against certain liabilities and expenses arising out of the performance of their duties to the Fund. Under Massachusetts law, if certain conditions prevail, shareholders of a Massachusetts business trust (such as the Trust) could be deemed to have personal liability for the obligations of the Trust. However, the Trust’s Declaration of Trust contains an express disclaimer of liability on the part of Fund shareholders and the By-laws provide that the Trust shall assume the defense on behalf of any Fund shareholders. Moreover, the By-laws also provide for indemnification out of Fund property of any shareholder held personally liable solely by reason of being or having been a shareholder for all loss or expense arising from such liability. Additionally, in the normal course of business, the Fund enters into agreements with service providers that may contain indemnification clauses. The Fund’s maximum exposure under these arrangements is unknown as this would involve future claims that may be made against the Fund that have not yet occurred.
G Other — Investment transactions are accounted for on a trade date basis.
| 14 |
Eaton Vance
Greater India Fund
December 31, 2018
Notes to Financial Statements — continued
2 Distributions to Shareholders and Income Tax Information
It is the present policy of the Fund to make at least one distribution annually (normally in December) of all or substantially all of its net investment income and to distribute annually all or substantially all of its net realized capital gains. Distributions to shareholders are recorded on the ex-dividend date. Distributions are declared separately for each class of shares. Shareholders may reinvest income and capital gain distributions in additional shares of the same class of the Fund at the net asset value as of the ex-dividend date or, at the election of the shareholder, receive distributions in cash. Distributions to shareholders are determined in accordance with income tax regulations, which may differ from U.S. GAAP. As required by U.S. GAAP, only distributions in excess of tax basis earnings and profits are reported in the financial statements as a return of capital. Permanent differences between book and tax accounting relating to distributions are reclassified to paid-in capital. For tax purposes, distributions from short-term capital gains are considered to be from ordinary income.
The tax character of distributions declared for the years ended December 31, 2018 and December 31, 2017 was as follows:
| Year Ended December 31, | ||||||||
| 2018 | 2017 | |||||||
Ordinary income | $ | 2,684,151 | $ | 8,983,677 | ||||
During the year ended December 31, 2018, distributable earnings was decreased by $632,185 and paid-in capital was increased by $632,185 due to the Fund’s use of equalization accounting and differences between book and tax accounting for net operating losses. Tax equalization accounting allows the Fund to treat as a distribution that portion of redemption proceeds representing a redeeming shareholder’s portion of undistributed taxable income and net capital gains. These reclassifications had no effect on the net assets or net asset value per share of the Fund.
As of December 31, 2018, the components of distributable earnings (accumulated loss) on a tax basis were as follows:
Undistributed long-term capital gains | $ | 6,092,481 | ||
Net unrealized appreciation | $ | 34,137,261 | ||
3 Investment Adviser Fee and Other Transactions with Affiliates
The investment adviser fee is earned by Boston Management and Research (BMR), a subsidiary of Eaton Vance Management (EVM), as compensation for management and investment advisory services rendered to the Fund. The fee is computed at an annual rate of 0.85% of the Fund’s average daily net assets that are not invested in other investment companies for which BMR or its affiliates serve as investment adviser and receive an advisory fee (“Investable Assets”) up to $500 million and is payable monthly. On Investable Assets of $500 million and over, the annual fee is reduced. Pursuant to a sub-advisory agreement, BMR pays Goldman Sachs Asset Management, L.P. a portion of its investment adviser fee for sub-advisory services provided to the Fund. For the year ended December 31, 2018, the Fund incurred no investment adviser fee on Investable Assets. To the extent the Fund’s assets are invested in the Portfolio, the Fund is allocated its share of the Portfolio’s investment adviser fee. The Portfolio has engaged BMR to render investment advisory services. See Note 2 of the Portfolio’s Notes to Financial Statements which are included elsewhere in this report. The administration fee is earned by EVM as compensation for administering the business affairs of the Fund and is computed at an annual rate of 0.15% of the Fund’s average daily net assets. For the year ended December 31, 2018, the administration fee amounted to $360,492.
EVM provides sub-transfer agency and related services to the Fund pursuant to a Sub-Transfer Agency Support Services Agreement. For the year ended December 31, 2018, EVM earned $36,799 from the Fund pursuant to such agreement, which is included in transfer and dividend disbursing agent fees on the Statement of Operations. The Fund was informed that Eaton Vance Distributors, Inc. (EVD), an affiliate of EVM and the Fund’s principal underwriter, received $22,309 as its portion of the sales charge on sales of Class A shares for the year ended December 31, 2018. EVD also received distribution and service fees from Class A, Class B and Class C shares (see Note 4) and contingent deferred sales charges (see Note 5).
Trustees and officers of the Fund who are members of EVM’s or BMR’s organizations receive remuneration for their services to the Fund out of the investment adviser fee and administration fee. Certain officers and Trustees of the Fund and the Portfolio are officers of the above organizations.
4 Distribution Plans
The Fund has in effect a distribution plan for Class A shares (Class A Plan) pursuant to Rule 12b-1 under the 1940 Act. Pursuant to the Class A Plan, the Fund pays EVD a distribution and service fee of 0.30% per annum of its average daily net assets attributable to Class A shares for distribution services and facilities provided to the Fund by EVD, as well as for personal services and/or the maintenance of shareholder accounts. Distribution and service fees paid or accrued to EVD for the year ended December 31, 2018 amounted to $509,887 for Class A shares.
| 15 |
Eaton Vance
Greater India Fund
December 31, 2018
Notes to Financial Statements — continued
The Fund also has in effect distribution plans for Class B shares (Class B Plan) and Class C shares (Class C Plan) pursuant to Rule 12b-1 under the 1940 Act. Pursuant to the Class B and Class C Plans, the Fund pays EVD amounts equal to 0.75% per annum of its average daily net assets attributable to Class B and Class C shares for providing ongoing distribution services and facilities to the Fund. For the year ended December 31, 2018, the Fund paid or accrued to EVD $9,033 and $192,605 for Class B and Class C shares, respectively.
Pursuant to the Class B and Class C Plans, the Fund also makes payments of service fees to EVD, financial intermediaries and other persons in amounts equal to 0.25% per annum of its average daily net assets attributable to that class. Service fees paid or accrued are for personal services and/or the maintenance of shareholder accounts. They are separate and distinct from the sales commissions and distribution fees payable to EVD. Service fees paid or accrued for the year ended December 31, 2018 amounted to $3,011 and $64,202 for Class B and Class C shares, respectively.
Distribution and service fees are subject to the limitations contained in the Financial Industry Regulatory Authority Rule 2341(d) and for Class B, are further limited to a 5% maximum sales charge as determined in accordance with such rule.
5 Contingent Deferred Sales Charges
A contingent deferred sales charge (CDSC) generally is imposed on redemptions of Class B shares made within six years of purchase and on redemptions of Class C shares made within one year of purchase. Class A shares may be subject to a 1% CDSC if redeemed within 18 months of purchase (depending on the circumstances of purchase). Generally, the CDSC is based upon the lower of the net asset value at date of redemption or date of purchase. No charge is levied on shares acquired by reinvestment of dividends or capital gain distributions. The CDSC for Class B shares is imposed at declining rates that begin at 5% in the case of redemptions in the first and second year after purchase, declining one percentage point each subsequent year. Class C shares are subject to a 1% CDSC if redeemed within one year of purchase. For the year ended December 31, 2018, the Fund was informed that EVD received less than $100 and approximately $4,000 of CDSCs paid by Class A and Class C shareholders, respectively, and no CDSCs paid by Class B shareholders.
6 Investment Transactions
For the year ended December 31, 2018, increases and decreases in the Fund’s investment in the Portfolio aggregated $9,325,256 and $38,464,729, respectively.
7 Shares of Beneficial Interest
The Fund’s Declaration of Trust permits the Trustees to issue an unlimited number of full and fractional shares of beneficial interest (without par value). Such shares may be issued in a number of different series (such as the Fund) and classes. Transactions in Fund shares were as follows:
| Year Ended December 31, | ||||||||
| Class A | 2018 | 2017 | ||||||
Sales | 322,437 | 528,248 | ||||||
Issued to shareholders electing to receive payments of distributions in Fund shares | 48,083 | 156,562 | ||||||
Redemptions | (838,993 | ) | (1,220,925 | ) | ||||
Exchange from Class B shares | 32,196 | 48,236 | ||||||
Net decrease | (436,277 | ) | (487,879 | ) | ||||
| Year Ended December 31, | ||||||||
| Class B | 2018 | 2017 | ||||||
Sales | 184 | 542 | ||||||
Issued to shareholders electing to receive payments of distributions in Fund shares | 409 | 1,750 | ||||||
Redemptions | (5,969 | ) | (17,904 | ) | ||||
Exchange to Class A shares | (36,857 | ) | (55,152 | ) | ||||
Net decrease | (42,233 | ) | (70,764 | ) | ||||
| 16 |
Eaton Vance
Greater India Fund
December 31, 2018
Notes to Financial Statements — continued
| Year Ended December 31, | ||||||||
| Class C | 2018 | 2017 | ||||||
Sales | 57,221 | 168,712 | ||||||
Issued to shareholders electing to receive payments of distributions in Fund shares | 9,800 | 27,174 | ||||||
Redemptions | (216,692 | ) | (223,799 | ) | ||||
Net decrease | (149,671 | ) | (27,913 | ) | ||||
| Year Ended December 31, | ||||||||
| Class I | 2018 | 2017 | ||||||
Sales | 394,522 | 843,895 | ||||||
Issued to shareholders electing to receive payments of distributions in Fund shares | 10,218 | 32,284 | ||||||
Redemptions | (559,188 | ) | (584,582 | ) | ||||
Net increase (decrease) | (154,448 | ) | 291,597 | |||||
| 17 |
Eaton Vance
Greater India Fund
December 31, 2018
Report of Independent Registered Public Accounting Firm
To the Trustees of Eaton Vance Special Investment Trust and Shareholders of Eaton Vance Greater India Fund:
Opinion on the Financial Statements and Financial Highlights
We have audited the accompanying statement of assets and liabilities of Eaton Vance Greater India Fund (the “Fund”) (one of the funds constituting Eaton Vance Special Investment Trust), as of December 31, 2018, the related statement of operations for the year then ended, the statements of changes in net assets for each of the two years in the period then ended, the financial highlights for each of the five years in the period then ended, and the related notes. In our opinion, the financial statements and financial highlights present fairly, in all material respects, the financial position of the Fund as of December 31, 2018, and the results of its operations for the year then ended, the changes in its net assets for each of the two years in the period then ended, and the financial highlights for each of the five years in the period then ended, in conformity with accounting principles generally accepted in the United States of America.
Basis for Opinion
These financial statements and financial highlights are the responsibility of the Fund’s management. Our responsibility is to express an opinion on the Fund’s financial statements and financial highlights based on our audits. We are a public accounting firm registered with the Public Company Accounting Oversight Board (United States) (PCAOB) and are required to be independent with respect to the Fund in accordance with the U.S. federal securities laws and the applicable rules and regulations of the Securities and Exchange Commission and the PCAOB.
We conducted our audits in accordance with the standards of the PCAOB. Those standards require that we plan and perform the audit to obtain reasonable assurance about whether the financial statements and financial highlights are free of material misstatement, whether due to error or fraud. The Fund is not required to have, nor were we engaged to perform, an audit of its internal control over financial reporting. As part of our audits we are required to obtain an understanding of internal control over financial reporting but not for the purpose of expressing an opinion on the effectiveness of the Fund’s internal control over financial reporting. Accordingly, we express no such opinion.
Our audits included performing procedures to assess the risks of material misstatement of the financial statements and financial highlights, whether due to error or fraud, and performing procedures that respond to those risks. Such procedures included examining, on a test basis, evidence regarding the amounts and disclosures in the financial statements and financial highlights. Our audits also included evaluating the accounting principles used and significant estimates made by management, as well as evaluating the overall presentation of the financial statements and financial highlights. We believe that our audits provide a reasonable basis for our opinion.
/s/ Deloitte & Touche LLP
Boston, Massachusetts
February 22, 2019
We have served as the auditor of one or more Eaton Vance investment companies since 1959.
| 18 |
Eaton Vance
Greater India Fund
December 31, 2018
Federal Tax Information (Unaudited)
The Form 1099-DIV you received in February 2019 showed the tax status of all distributions paid to your account in calendar year 2018. Shareholders are advised to consult their own tax adviser with respect to the tax consequences of their investment in the Fund. As required by the Internal Revenue Code and/or regulations, shareholders must be notified regarding the status of qualified dividend income for individuals and capital gains dividends.
Qualified Dividend Income. For the fiscal year ended December 31, 2018, the Fund designates approximately $2,796,699, or up to the maximum amount of such dividends allowable pursuant to the Internal Revenue Code, as qualified dividend income eligible for the reduced tax rate of 15%.
Capital Gains Dividends. The Fund hereby designates as a capital gain dividend with respect to the taxable year ended December 31, 2018, $6,819,448 or, if subsequently determined to be different, the net capital gain of such year.
| 19 |
Greater India Portfolio
December 31, 2018
Portfolio of Investments
| Common Stocks — 96.7% |
| |||||||
| Security | Shares | Value | ||||||
| India — 94.9% | ||||||||
| Auto Components — 1.4% | ||||||||
MRF, Ltd. | 3,154 | $ | 3,014,894 | |||||
| $ | 3,014,894 | |||||||
| Automobiles — 10.4% | ||||||||
Eicher Motors, Ltd. | 12,698 | $ | 4,195,575 | |||||
Mahindra & Mahindra, Ltd. | 464,154 | 5,346,915 | ||||||
Maruti Suzuki India, Ltd. | 118,615 | 12,651,417 | ||||||
| $ | 22,193,907 | |||||||
| Banks — 14.2% | ||||||||
Axis Bank, Ltd.(1) | 1,037,912 | $ | 9,203,238 | |||||
Bandhan Bank, Ltd.(2) | 112,536 | 886,548 | ||||||
Federal Bank, Ltd. | 954,107 | 1,270,803 | ||||||
HDFC Bank, Ltd. | 243,980 | 7,422,354 | ||||||
ICICI Bank, Ltd. | 1,406,973 | 7,273,252 | ||||||
IndusInd Bank, Ltd. | 71,957 | 1,648,218 | ||||||
RBL Bank, Ltd.(2) | 315,698 | 2,597,523 | ||||||
| $ | 30,301,936 | |||||||
| Beverages — 1.3% | ||||||||
United Breweries, Ltd. | 139,855 | $ | 2,743,128 | |||||
| $ | 2,743,128 | |||||||
| Capital Markets — 0.0%(3) | ||||||||
HDFC Asset Management Co., Ltd.(1)(2) | 793 | $ | 16,969 | |||||
| $ | 16,969 | |||||||
| Construction & Engineering — 1.3% | ||||||||
Voltas, Ltd. | 360,925 | $ | 2,864,245 | |||||
| $ | 2,864,245 | |||||||
| Construction Materials — 4.1% | ||||||||
Century Textiles & Industries, Ltd. | 181,003 | $ | 2,386,031 | |||||
Odisha Cement, Ltd. | 122,694 | 1,932,894 | ||||||
UltraTech Cement, Ltd. | 78,030 | 4,455,768 | ||||||
| $ | 8,774,693 | |||||||
| Consumer Finance — 6.1% | ||||||||
Bajaj Finance, Ltd. | 174,816 | $ | 6,606,277 | |||||
Bharat Financial Inclusion, Ltd.(1) | 166,217 | 2,410,109 | ||||||
| Security | Shares | Value | ||||||
| Consumer Finance (continued) | ||||||||
Mahindra & Mahindra Financial Services, Ltd. | 400,860 | $ | 2,718,442 | |||||
Muthoot Finance, Ltd. | 174,463 | 1,293,340 | ||||||
| $ | 13,028,168 | |||||||
| Diversified Financial Services — 1.4% | ||||||||
Bajaj Holdings & Investment, Ltd. | 68,909 | $ | 2,911,490 | |||||
| $ | 2,911,490 | |||||||
| Electrical Equipment — 0.4% | ||||||||
Graphite India, Ltd. | 83,106 | $ | 896,963 | |||||
| $ | 896,963 | |||||||
| Food Products — 3.4% | ||||||||
Britannia Industries, Ltd. | 120,034 | $ | 5,359,661 | |||||
GlaxoSmithKline Consumer Healthcare, Ltd. | 18,061 | 1,979,240 | ||||||
| $ | 7,338,901 | |||||||
| Hotels, Restaurants & Leisure — 0.9% | ||||||||
Indian Hotels Co., Ltd. (The) | 923,711 | $ | 1,953,300 | |||||
| $ | 1,953,300 | |||||||
| Household Durables — 2.4% | ||||||||
Crompton Greaves Consumer Electricals, Ltd. | 885,858 | $ | 2,903,425 | |||||
Whirlpool of India, Ltd. | 105,860 | 2,119,630 | ||||||
| $ | 5,023,055 | |||||||
| Household Products — 3.0% | ||||||||
Hindustan Unilever, Ltd. | 242,814 | $ | 6,320,794 | |||||
| $ | 6,320,794 | |||||||
| Insurance — 1.5% | ||||||||
ICICI Lombard General Insurance Co., Ltd.(2) | 108,312 | $ | 1,337,197 | |||||
ICICI Prudential Life Insurance Co., Ltd.(2) | 397,908 | 1,844,560 | ||||||
| $ | 3,181,757 | |||||||
| Interactive Media & Services — 2.1% | ||||||||
Info Edge India, Ltd. | 213,764 | $ | 4,387,533 | |||||
| $ | 4,387,533 | |||||||
| IT Services — 13.6% | ||||||||
HCL Technologies, Ltd. | 328,274 | $ | 4,535,499 | |||||
Infosys, Ltd. | 2,022,853 | 19,131,421 | ||||||
Infosys, Ltd. ADR | 64,160 | 610,803 | ||||||
| 20 | See Notes to Financial Statements. |
Greater India Portfolio
December 31, 2018
Portfolio of Investments — continued
| Security | Shares | Value | ||||||
| IT Services (continued) | ||||||||
Larsen & Toubro Infotech, Ltd.(2) | 61,474 | $ | 1,516,601 | |||||
Tech Mahindra, Ltd. | 304,287 | 3,144,888 | ||||||
| $ | 28,939,212 | |||||||
| Life Sciences Tools & Services — 1.4% | ||||||||
Divi’s Laboratories, Ltd. | 144,024 | $ | 3,052,024 | |||||
| $ | 3,052,024 | |||||||
| Machinery — 2.4% | ||||||||
AIA Engineering, Ltd. | 86,037 | $ | 2,043,883 | |||||
Thermax, Ltd. | 186,957 | 3,029,873 | ||||||
| $ | 5,073,756 | |||||||
| Metals & Mining — 1.3% | ||||||||
Hindustan Zinc, Ltd. | 333,912 | $ | 1,325,910 | |||||
Jindal Steel & Power, Ltd.(1) | 564,567 | 1,330,472 | ||||||
| $ | 2,656,382 | |||||||
| Oil, Gas & Consumable Fuels — 5.3% | ||||||||
Reliance Industries, Ltd. | 706,934 | $ | 11,386,090 | |||||
| $ | 11,386,090 | |||||||
| Personal Products — 2.6% | ||||||||
Marico, Ltd. | 437,357 | $ | 2,345,638 | |||||
Procter & Gamble Hygiene & Health Care, Ltd. | 21,930 | 3,105,664 | ||||||
| $ | 5,451,302 | |||||||
| Pharmaceuticals — 3.8% | ||||||||
Abbott India, Ltd. | 32,581 | $ | 3,526,834 | |||||
Eris Lifesciences, Ltd.(1)(2) | 164,420 | 1,613,106 | ||||||
Lupin, Ltd. | 251,219 | 3,033,692 | ||||||
| $ | 8,173,632 | |||||||
| Real Estate Management & Development — 1.1% | ||||||||
Oberoi Realty, Ltd. | 214,170 | $ | 1,361,093 | |||||
Prestige Estates Projects, Ltd. | 325,464 | 1,026,236 | ||||||
| $ | 2,387,329 | |||||||
| Road & Rail — 1.0% | ||||||||
Container Corp. of India, Ltd. | 219,524 | $ | 2,160,361 | |||||
| $ | 2,160,361 | |||||||
| Security | Shares | Value | ||||||
| Textiles, Apparel & Luxury Goods — 0.6% | ||||||||
Aditya Birla Fashion and Retail, Ltd.(1) | 471,197 | $ | 1,359,452 | |||||
| $ | 1,359,452 | |||||||
| Thrifts & Mortgage Finance — 5.7% | ||||||||
Housing Development Finance Corp., Ltd. | 342,288 | $ | 9,627,308 | |||||
Indiabulls Housing Finance, Ltd. | 205,356 | 2,505,932 | ||||||
| $ | 12,133,240 | |||||||
| Tobacco — 2.2% | ||||||||
ITC, Ltd. | 1,159,472 | $ | 4,674,243 | |||||
| $ | 4,674,243 | |||||||
Total India |
| $ | 202,398,756 | |||||
| United States — 1.8% | ||||||||
| IT Services — 1.8% | ||||||||
Cognizant Technology Solutions Corp., Class A | 59,951 | $ | 3,805,690 | |||||
| $ | 3,805,690 | |||||||
Total United States |
| $ | 3,805,690 | |||||
Total Common Stocks |
| $ | 206,204,446 | |||||
Total Investments — 96.7% |
| $ | 206,204,446 | |||||
Other Assets, Less Liabilities — 3.3% |
| $ | 6,981,894 | |||||
Net Assets — 100.0% |
| $ | 213,186,340 | |||||
The percentage shown for each investment category in the Portfolio of Investments is based on net assets.
| (1) | Non-income producing security. |
| (2) | Security exempt from registration pursuant to Rule 144A under the Securities Act of 1933, as amended. These securities may be sold in certain transactions in reliance on an exemption from registration (normally to qualified institutional buyers). At December 31, 2018, the aggregate value of these securities is $9,812,504 or 4.6% of the Portfolio’s net assets. |
| (3) | Amount is less than 0.05%. |
| 21 | See Notes to Financial Statements. |
Greater India Portfolio
December 31, 2018
Portfolio of Investments — continued
| Futures Contracts | ||||||||||||||||||||
| Description | Number of Contracts | Position | Expiration Date | Notional Amount | Value/ Unrealized | |||||||||||||||
Equity Futures | ||||||||||||||||||||
| SGX CNX Nifty Index | 294 | Long | 1/31/19 | $ | 6,422,430 | $ | 109,517 | |||||||||||||
| $ | 109,517 | |||||||||||||||||||
SGX CNX Nifty Index: Price-weighted average of 50 large and highly liquid companies listed on the National Stock Exchange of India.
Abbreviations:
| ADR | – | American Depositary Receipt | ||
| 22 | See Notes to Financial Statements. |
Greater India Portfolio
December 31, 2018
Statement of Assets and Liabilities
| Assets | December 31, 2018 | |||
Unaffiliated investments, at value (identified cost, $165,968,567) | $ | 206,204,446 | ||
Cash | 4,498,276 | |||
Deposits for derivatives collateral — financial futures contracts | 274,890 | |||
Foreign currency, at value (identified cost, $2,440,358) | 2,445,430 | |||
Receivable for variation margin on open financial futures contracts | 616 | |||
Receivable for foreign taxes | 42,174 | |||
Total assets | $ | 213,465,832 | ||
| Liabilities |
| |||
Payable to affiliates: | ||||
Investment adviser fee | $ | 152,893 | ||
Trustees’ fees | 2,733 | |||
Accrued expenses | 123,866 | |||
Total liabilities | $ | 279,492 | ||
Net Assets applicable to investors’ interest in Portfolio | $ | 213,186,340 | ||
| 23 | See Notes to Financial Statements. |
Greater India Portfolio
December 31, 2018
Statement of Operations
| Investment Income | Year Ended December 31, 2018 | |||
Dividends | $ | 2,796,720 | ||
Interest | 17,328 | |||
Total investment income | $ | 2,814,048 | ||
| Expenses | ||||
Investment adviser fee | $ | 2,045,417 | ||
Trustees’ fees and expenses | 10,647 | |||
Custodian fee | 215,534 | |||
Legal and accounting services | 69,086 | |||
Miscellaneous | 14,178 | |||
Total expenses | $ | 2,354,862 | ||
Net investment income | $ | 459,186 | ||
| Realized and Unrealized Gain (Loss) | ||||
Net realized gain (loss) — | ||||
Investment transactions | $ | 10,913,624 | ||
Financial futures contracts | (382,332 | ) | ||
Foreign currency transactions | (329,964 | ) | ||
Net realized gain | $ | 10,201,328 | ||
Change in unrealized appreciation (depreciation) — | ||||
Investments | $ | (41,881,368 | ) | |
Financial futures contracts | 108,161 | |||
Foreign currency | 1,116 | |||
Net change in unrealized appreciation (depreciation) | $ | (41,772,091 | ) | |
Net realized and unrealized loss | $ | (31,570,763 | ) | |
Net decrease in net assets from operations | $ | (31,111,577 | ) | |
| 24 | See Notes to Financial Statements. |
Greater India Portfolio
December 31, 2018
Statements of Changes in Net Assets
| Year Ended December 31, | ||||||||
| Increase (Decrease) in Net Assets | 2018 | 2017 | ||||||
From operations — | ||||||||
Net investment income | $ | 459,186 | $ | 1,894,484 | ||||
Net realized gain | 10,201,328 | 6,224,372 | ||||||
Net change in unrealized appreciation (depreciation) | (41,772,091 | ) | 82,158,948 | |||||
Net increase (decrease) in net assets from operations | $ | (31,111,577 | ) | $ | 90,277,804 | |||
Capital transactions — | ||||||||
Contributions | $ | 9,325,256 | $ | 10,165,205 | ||||
Withdrawals | (38,464,729 | ) | (30,668,994 | ) | ||||
Net decrease in net assets from capital transactions | $ | (29,139,473 | ) | $ | (20,503,789 | ) | ||
Net increase (decrease) in net assets | $ | (60,251,050 | ) | $ | 69,774,015 | |||
| Net Assets |
| |||||||
At beginning of year | $ | 273,437,390 | $ | 203,663,375 | ||||
At end of year | $ | 213,186,340 | $ | 273,437,390 | ||||
| 25 | See Notes to Financial Statements. |
Greater India Portfolio
December 31, 2018
Financial Highlights
| Year Ended December 31, | ||||||||||||||||||||
| Ratios/Supplemental Data | 2018 | 2017 | 2016 | 2015 | 2014 | |||||||||||||||
Ratios (as a percentage of average daily net assets): | ||||||||||||||||||||
Expenses(1) | 0.98 | % | 0.98 | % | 1.19 | % | 1.23 | % | 1.22 | % | ||||||||||
Net investment income (loss) | 0.19 | % | 0.76 | % | (0.06 | )% | (0.23 | )% | 0.17 | % | ||||||||||
Portfolio Turnover | 29 | % | 25 | % | 91 | % | 30 | % | 22 | % | ||||||||||
Total Return | (11.57 | )% | 45.78 | % | 3.35 | % | (4.33 | )% | 40.17 | % | ||||||||||
Net assets, end of year (000’s omitted) | $ | 213,186 | $ | 273,437 | $ | 203,663 | $ | 238,167 | $ | 280,593 | ||||||||||
| (1) | Excludes the effect of custody fee credits, if any, of less than 0.005%. Effective September 1, 2015, custody fee credits, which were earned on cash deposit balances, were discontinued by the custodian. |
| 26 | See Notes to Financial Statements. |
Greater India Portfolio
December 31, 2018
Notes to Financial Statements
1 Significant Accounting Policies
Greater India Portfolio (the Portfolio) is a Massachusetts business trust registered under the Investment Company Act of 1940, as amended (the 1940 Act), as a non-diversified, open-end management investment company. The Portfolio’s investment objective is to seek long-term capital appreciation. The Declaration of Trust permits the Trustees to issue interests in the Portfolio. At December 31, 2018, Eaton Vance Greater India Fund held a 99.9% interest in the Portfolio.
The following is a summary of significant accounting policies of the Portfolio. The policies are in conformity with accounting principles generally accepted in the United States of America (U.S. GAAP). The Portfolio is an investment company and follows accounting and reporting guidance in the Financial Accounting Standards Board (FASB) Accounting Standards Codification Topic 946.
A Investment Valuation— The following methodologies are used to determine the market value or fair value of investments.
Equity Securities. Equity securities listed on a U.S. securities exchange generally are valued at the last sale or closing price on the day of valuation or, if no sales took place on such date, at the mean between the closing bid and ask prices on the exchange where such securities are principally traded. Equity securities listed on the NASDAQ Global or Global Select Market generally are valued at the NASDAQ official closing price. Unlisted or listed securities for which closing sales prices or closing quotations are not available are valued at the mean between the latest available bid and ask prices.
Short-Term Debt Securities. Short-term debt securities with a remaining maturity at time of purchase of more than sixty days are valued on the basis of valuations provided by a third party pricing service. Short-term debt securities of sufficient credit quality purchased with remaining maturities of sixty days or less are valued at amortized cost, which approximates fair value.
Derivatives. Financial futures contracts are valued at the closing settlement price established by the board of trade or exchange on which they are traded, with adjustments for fair valuation for certain foreign financial futures contracts as described below.
Foreign Securities, Financial Futures Contracts and Currencies.Foreign securities, financial futures contracts and currencies are valued in U.S. dollars, based on foreign currency exchange rate quotations supplied by a third party pricing service. The pricing service uses a proprietary model to determine the exchange rate. Inputs to the model include reported trades and implied bid/ask spreads. The daily valuation of exchange-traded foreign securities and certain exchange-traded foreign financial futures contracts generally is determined as of the close of trading on the principal exchange on which such securities and contracts trade. Foreign ownership of shares of certain Indian companies may be subject to limitations. When foreign ownership of such an Indian company’s shares approaches the limitation, foreign investors may be willing to pay a premium to the local share price to acquire shares from other foreign investors. Such shares are valued at the closing price for foreign investors as provided by the exchange on which they trade. Events occurring after the close of trading on foreign exchanges may result in adjustments to the valuation of foreign securities and certain foreign financial futures contracts to more accurately reflect their fair value as of the close of regular trading on the New York Stock Exchange. When valuing foreign equity securities and foreign financial futures contracts that meet certain criteria, the Portfolio’s Trustees have approved the use of a fair value service that values such securities and foreign financial futures contracts to reflect market trading that occurs after the close of the applicable foreign markets of comparable securities or other instruments that have a strong correlation to the fair-valued securities and foreign financial futures contracts.
Fair Valuation. Investments for which valuations or market quotations are not readily available or are deemed unreliable are valued at fair value using methods determined in good faith by or at the direction of the Trustees of the Portfolio in a manner that fairly reflects the security’s value, or the amount that the Portfolio might reasonably expect to receive for the security upon its current sale in the ordinary course. Each such determination is based on a consideration of relevant factors, which are likely to vary from one pricing context to another. These factors may include, but are not limited to, the type of security, the existence of any contractual restrictions on the security’s disposition, the price and extent of public trading in similar securities of the issuer or of comparable companies or entities, quotations or relevant information obtained from broker/dealers or other market participants, information obtained from the issuer, analysts, and/or the appropriate stock exchange (for exchange-traded securities), an analysis of the company’s or entity’s financial condition, and an evaluation of the forces that influence the issuer and the market(s) in which the security is purchased and sold.
B Investment Transactions — Investment transactions for financial statement purposes are accounted for on a trade date basis. Realized gains and losses on investments sold are determined on the basis of identified cost.
C Income — Dividend income is recorded on the ex-dividend date for dividends received in cash and/or securities. However, if the ex-dividend date has passed, certain dividends from foreign securities are recorded as the Portfolio is informed of the ex-dividend date. Non-cash dividends are recorded at the fair value of the securities received. Withholding taxes on foreign dividends and capital gains have been provided for in accordance with the Portfolio’s understanding of the applicable countries’ tax rules and rates. Interest income is recorded on the basis of interest accrued, adjusted for amortization of premium or accretion of discount.
D Federal and Other Taxes — The Portfolio has elected to be treated as a partnership for federal tax purposes. No provision is made by the Portfolio for federal or state taxes on any taxable income of the Portfolio because each investor in the Portfolio is ultimately responsible for the payment of any taxes on its share of taxable income. Since at least one of the Portfolio’s investors is a regulated investment company that invests all or substantially all of its assets in the Portfolio, the Portfolio normally must satisfy the applicable source of income and diversification requirements (under the Internal Revenue Code) in order for its investors to satisfy them. The Portfolio will allocate, at least annually among its investors, each investor’s distributive share of the Portfolio’s net investment income, net realized capital gains and losses and any other items of income, gain, loss, deduction or credit.
| 27 |
Greater India Portfolio
December 31, 2018
Notes to Financial Statements — continued
In addition to the requirements of the Internal Revenue Code, the Portfolio may also be subject to local taxes on the recognition of capital gains in India. In determining the daily net asset value, the Portfolio estimates the accrual for such taxes, if any, based on the unrealized appreciation on certain portfolio securities, the holding period of such securities, the related tax rates, and the availability of any realized losses in excess of gains that may be carried forward to offset future gains. Taxes attributable to unrealized appreciation are included in the change in unrealized appreciation (depreciation) on investments. Capital gains taxes on certain Indian securities sold at a gain are included in net realized gain (loss) on investments. As of March 31, 2018, the Portfolio, for tax reporting in India, had accumulated losses of INR 699,797,944 (having a value of approximately $10,024,000 at December 31, 2018) that can be carried forward to offset future realized gains from the sale of certain Indian securities that would otherwise be subject to Indian capital gains taxes. These accumulated losses expire on March 31, 2020 (INR 535,151,798), March 31, 2022 (INR 90,144,310) and March 31, 2026 (INR 74,501,836).
As of December 31, 2018, the Portfolio had no uncertain tax positions that would require financial statement recognition, de-recognition, or disclosure. The Portfolio files a U.S. federal income tax return annually after its fiscal year-end, which is subject to examination by the Internal Revenue Service for a period of three years from the date of filing. The Portfolio also files a tax return in India annually as of March 31st. Such tax returns are subject to examination by the Indian tax authorities for open years as determined by the statute of limitations, which is generally a period of up to 7 years after a tax return is filed.
E Foreign Currency Translation — Investment valuations, other assets, and liabilities initially expressed in foreign currencies are translated each business day into U.S. dollars based upon current exchange rates. Purchases and sales of foreign investment securities and income and expenses denominated in foreign currencies are translated into U.S. dollars based upon currency exchange rates in effect on the respective dates of such transactions. Recognized gains or losses on investment transactions attributable to changes in foreign currency exchange rates are recorded for financial statement purposes as net realized gains and losses on investments. That portion of unrealized gains and losses on investments that results from fluctuations in foreign currency exchange rates is not separately disclosed.
F Use of Estimates — The preparation of the financial statements in conformity with U.S. GAAP requires management to make estimates and assumptions that affect the reported amounts of assets and liabilities at the date of the financial statements and the reported amounts of income and expense during the reporting period. Actual results could differ from those estimates.
G Indemnifications — Under the Portfolio’s organizational documents, its officers and Trustees may be indemnified against certain liabilities and expenses arising out of the performance of their duties to the Portfolio. Under Massachusetts law, if certain conditions prevail, interestholders in the Portfolio could be deemed to have personal liability for the obligations of the Portfolio. However, the Portfolio’s Declaration of Trust contains an express disclaimer of liability on the part of Portfolio interestholders and the By-laws provide that the Portfolio shall assume the defense on behalf of any Portfolio interestholder. Moreover, the By-laws also provide for indemnification out of Portfolio property of any interestholder held personally liable solely by reason of being or having been an interestholder for all loss or expense arising from such liability. Additionally, in the normal course of business, the Portfolio enters into agreements with service providers that may contain indemnification clauses. The Portfolio’s maximum exposure under these arrangements is unknown as this would involve future claims that may be made against the Portfolio that have not yet occurred.
H Financial Futures Contracts — Upon entering into a financial futures contract, the Portfolio is required to deposit with the broker, either in cash or securities, an amount equal to a certain percentage of the contract amount (initial margin). Subsequent payments, known as variation margin, are made or received by the Portfolio each business day, depending on the daily fluctuations in the value of the underlying security or index, and are recorded as unrealized gains or losses by the Portfolio. Gains (losses) are realized upon the expiration or closing of the financial futures contracts. Should market conditions change unexpectedly, the Portfolio may not achieve the anticipated benefits of the financial futures contracts and may realize a loss. Futures contracts have minimal counterparty risk as they are exchange traded and the clearinghouse for the exchange is substituted as the counterparty, guaranteeing counterparty performance.
2 Investment Adviser Fee and Other Transactions with Affiliates
The investment adviser fee is earned by Boston Management and Research (BMR), a subsidiary of EVM, as compensation for management and investment advisory services rendered to the Portfolio. Pursuant to the investment advisory agreement and subsequent fee reduction agreement between the Portfolio and BMR, the fee is computed at an annual rate of 0.85% of the Portfolio’s average daily net assets up to $500 million and is payable monthly. On net assets of $500 million and over, the annual fee is reduced. The fee reduction cannot be terminated or reduced without the approval of a majority vote of the Trustees of the Portfolio who are not interested persons of BMR or the Portfolio and by vote of a majority of the holders of interest in the Portfolio. For the year ended December 31, 2018, the investment adviser fee amounted to $2,045,417 or 0.85% of the Portfolio’s average daily net assets. Pursuant to a sub-advisory agreement, BMR pays Goldman Sachs Asset Management, L.P. a portion of its investment adviser fee for sub-advisory services provided to the Portfolio.
Trustees and officers of the Portfolio who are members of EVM’s or BMR’s organizations receive remuneration for their services to the Portfolio out of the investment adviser fee. Trustees of the Portfolio who are not affiliated with the investment adviser may elect to defer receipt of all or a percentage of their annual fees in accordance with the terms of the Trustees Deferred Compensation Plan. For the year ended December 31, 2018, no significant amounts have been deferred. Certain officers and Trustees of the Portfolio are officers of the above organizations.
| 28 |
Greater India Portfolio
December 31, 2018
Notes to Financial Statements — continued
3 Purchases and Sales of Investments
Purchases and sales of investments, other than short-term obligations, aggregated $68,593,438 and $102,327,687, respectively, for the year ended December 31, 2018.
4 Federal Income Tax Basis of Investments
The cost and unrealized appreciation (depreciation) of investments, including open derivative contracts, of the Portfolio at December 31, 2018, as determined on a federal income tax basis, were as follows:
Aggregate cost | $ | 175,051,987 | ||
Gross unrealized appreciation | $ | 34,502,349 | ||
Gross unrealized depreciation | (3,240,373 | ) | ||
Net unrealized appreciation | $ | 31,261,976 | ||
5 Financial Instruments
The Portfolio may trade in financial instruments with off-balance sheet risk in the normal course of its investing activities. These financial instruments may include financial futures contracts and may involve, to a varying degree, elements of risk in excess of the amounts recognized for financial statement purposes. The notional or contractual amounts of these instruments represent the investment the Portfolio has in particular classes of financial instruments and do not necessarily represent the amounts potentially subject to risk. The measurement of the risks associated with these instruments is meaningful only when all related and offsetting transactions are considered. A summary of obligations under these financial instruments at December 31, 2018 is included in the Portfolio of Investments. At December 31, 2018, the Portfolio had sufficient cash and/or securities to cover commitments under these contracts.
The Portfolio is subject to equity price risk in the normal course of pursuing its investment objective. The Portfolio enters into equity index futures contracts to manage cash flows.
The fair value of open derivative instruments (not considered to be hedging instruments for accounting disclosure purposes) and whose primary underlying risk exposure is equity price risk at December 31, 2018 was as follows:
| Fair Value | ||||||||
| Derivative | Asset Derivative(1) | Liability Derivative | ||||||
Futures contracts | $ | 109,517 | $ | — | ||||
| (1) | Amount represents cumulative unrealized appreciation on futures contracts. Only the current day’s variation margin on open futures contracts is reported within the Statement of Assets and Liabilities as Receivable or Payable for variation margin on open financial futures contracts, as applicable. |
The effect of derivative instruments (not considered to be hedging instruments for accounting disclosure purposes) on the Statement of Operations and whose primary underlying risk exposure is equity price risk for the year ended December 31, 2018 was as follows:
| Derivative | Realized Gain (Loss) on Derivatives Recognized in Income(1) | Change in Unrealized Appreciation (Depreciation) on Derivatives Recognized in Income(2) | ||||||
Futures contracts | $ | (382,332 | ) | $ | 108,161 | |||
| (1) | Statement of Operations location: Net realized gain (loss) – Financial futures contracts. |
| (2) | Statement of Operations location: Change in unrealized appreciation (depreciation) – Financial futures contracts. |
The average notional cost of futures contracts (long) outstanding during the year ended December 31, 2018, which is indicative of the volume of this derivative type, was approximately $3,452,000.
| 29 |
Greater India Portfolio
December 31, 2018
Notes to Financial Statements — continued
6 Line of Credit
The Portfolio participates with other portfolios and funds managed by EVM and its affiliates in a $625 million unsecured line of credit agreement with a group of banks, which is in effect through October 29, 2019. Borrowings are made by the Portfolio solely to facilitate the handling of unusual and/or unanticipated short-term cash requirements. Interest is charged to the Portfolio based on its borrowings at an amount above either the Eurodollar rate or Federal Funds rate. In addition, a fee computed at an annual rate of 0.15% on the daily unused portion of the line of credit is allocated among the participating portfolios and funds at the end of each quarter. Because the line of credit is not available exclusively to the Portfolio, it may be unable to borrow some or all of its requested amounts at any particular time. The Portfolio did not have any significant borrowings or allocated fees during the year ended December 31, 2018.
7 Risks Associated with Foreign Investments
Investing in securities issued by companies whose principal business activities are outside the United States may involve significant risks not present in domestic investments. For example, there is generally less publicly available information about foreign companies, particularly those not subject to the disclosure and reporting requirements of the U.S. securities laws. Certain foreign issuers are generally not bound by uniform accounting, auditing, and financial reporting requirements and standards of practice comparable to those applicable to domestic issuers. Investments in foreign securities also involve the risk of possible adverse changes in investment or exchange control regulations, expropriation or confiscatory taxation, limitation on the removal of funds or other assets of the Portfolio, political or financial instability or diplomatic and other developments which could affect such investments. Foreign securities markets, while growing in volume and sophistication, are generally not as developed as those in the United States, and securities of some foreign issuers (particularly those located in developing countries) may be less liquid and more volatile than securities of comparable U.S. companies. In general, there is less overall governmental supervision and regulation of foreign securities markets, broker/dealers and issuers than in the United States.
The securities markets in the India region are substantially smaller, less liquid and more volatile than the major securities markets in the United States, which may result in trading or price volatility and difficulties in the settlement and recording of transactions, and in interpreting and applying relevant laws and regulations. Governmental actions can have a significant effect on the economic conditions in the India region, which could adversely affect the value and liquidity of investments.
8 Fair Value Measurements
Under generally accepted accounting principles for fair value measurements, a three-tier hierarchy to prioritize the assumptions, referred to as inputs, is used in valuation techniques to measure fair value. The three-tier hierarchy of inputs is summarized in the three broad levels listed below.
| • | Level 1 – quoted prices in active markets for identical investments |
| • | Level 2 – other significant observable inputs (including quoted prices for similar investments, interest rates, prepayment speeds, credit risk, etc.) |
| • | Level 3 – significant unobservable inputs (including a fund’s own assumptions in determining the fair value of investments) |
In cases where the inputs used to measure fair value fall in different levels of the fair value hierarchy, the level disclosed is determined based on the lowest level input that is significant to the fair value measurement in its entirety. The inputs or methodology used for valuing securities are not necessarily an indication of the risk associated with investing in those securities.
| 30 |
Greater India Portfolio
December 31, 2018
Notes to Financial Statements — continued
At December 31, 2018, the hierarchy of inputs used in valuing the Portfolio’s investments and open derivative instruments, which are carried at value, were as follows:
| Asset Description | Level 1 | Level 2 | Level 3 | Total | ||||||||||||
Common Stocks | ||||||||||||||||
Communication Services | $ | — | $ | 4,387,533 | $ | — | $ | 4,387,533 | ||||||||
Consumer Discretionary | — | 33,544,608 | — | 33,544,608 | ||||||||||||
Consumer Staples | — | 26,528,368 | — | 26,528,368 | ||||||||||||
Energy | — | 11,386,090 | — | 11,386,090 | ||||||||||||
Financials | — | 61,573,560 | — | 61,573,560 | ||||||||||||
Health Care | — | 11,225,656 | — | 11,225,656 | ||||||||||||
Industrials | — | 10,995,325 | — | 10,995,325 | ||||||||||||
Information Technology | 4,416,493 | 28,328,409 | — | 32,744,902 | ||||||||||||
Materials | 1,932,894 | 9,498,181 | — | 11,431,075 | ||||||||||||
Real Estate | — | 2,387,329 | — | 2,387,329 | ||||||||||||
Total Common Stocks | $ | 6,349,387 | $ | 199,855,059 | * | $ | — | $ | 206,204,446 | |||||||
Total Investments | $ | 6,349,387 | $ | 199,855,059 | $ | — | $ | 206,204,446 | ||||||||
Futures Contracts | $ | — | $ | 109,517 | $ | — | $ | 109,517 | ||||||||
Total | $ | 6,349,387 | $ | 199,964,576 | $ | — | $ | 206,313,963 | ||||||||
| * | Includes foreign equity securities whose values were adjusted to reflect market trading of comparable securities or other correlated instruments that occurred after the close of trading in their applicable foreign markets. |
| 31 |
Greater India Portfolio
December 31, 2018
Report of Independent Registered Public Accounting Firm
To the Trustees and Investors of Greater India Portfolio:
Opinion on the Financial Statements and Financial Highlights
We have audited the accompanying statement of assets and liabilities of Greater India Portfolio (the “Portfolio”), including the portfolio of investments, as of December 31, 2018, the related statement of operations for the year then ended, the statements of changes in net assets for each of the two years in the period then ended, the financial highlights for each of the five years in the period then ended, and the related notes. In our opinion, the financial statements and financial highlights present fairly, in all material respects, the financial position of the Portfolio as of December 31, 2018, and the results of its operations for the year then ended, the changes in its net assets for each of the two years in the period then ended, and the financial highlights for each of the five years in the period then ended, in conformity with accounting principles generally accepted in the United States of America.
Basis for Opinion
These financial statements and financial highlights are the responsibility of the Portfolio’s management. Our responsibility is to express an opinion on the Portfolio’s financial statements and financial highlights based on our audits. We are a public accounting firm registered with the Public Company Accounting Oversight Board (United States) (PCAOB) and are required to be independent with respect to the Portfolio in accordance with the U.S. federal securities laws and the applicable rules and regulations of the Securities and Exchange Commission and the PCAOB.
We conducted our audits in accordance with the standards of the PCAOB. Those standards require that we plan and perform the audit to obtain reasonable assurance about whether the financial statements and financial highlights are free of material misstatement, whether due to error or fraud. The Portfolio is not required to have, nor were we engaged to perform, an audit of its internal control over financial reporting. As part of our audits we are required to obtain an understanding of internal control over financial reporting but not for the purpose of expressing an opinion on the effectiveness of the Portfolio’s internal control over financial reporting. Accordingly, we express no such opinion.
Our audits included performing procedures to assess the risks of material misstatement of the financial statements and financial highlights, whether due to error or fraud, and performing procedures that respond to those risks. Such procedures included examining, on a test basis, evidence regarding the amounts and disclosures in the financial statements and financial highlights. Our audits also included evaluating the accounting principles used and significant estimates made by management, as well as evaluating the overall presentation of the financial statements and financial highlights. Our procedures included confirmation of securities owned as of December 31, 2018, by correspondence with the custodian and brokers; when replies were not received from brokers, we performed other auditing procedures. We believe that our audits provide a reasonable basis for our opinion.
/s/ Deloitte & Touche LLP
Boston, Massachusetts
February 22, 2019
We have served as the auditor of one or more Eaton Vance investment companies since 1959.
| 32 |
Eaton Vance Greater India Fund
Greater India Portfolio
December 31, 2018
Special Meeting of Shareholders (Unaudited)
Eaton Vance Greater India Fund
The Fund held a Special Meeting of Shareholders on September 20, 2018 to elect the five Trustees listed below. The other Trustees named herein continue to serve as Trustees. The results of the vote with respect to the Fund were as follows:
| Number of Shares | ||||||||
| Nominee for Trustee | For | Withheld | ||||||
Mark R. Fetting | 6,051,769 | 145,105 | ||||||
Keith Quinton | 6,054,344 | 142,530 | ||||||
Marcus L. Smith | 6,053,642 | 143,232 | ||||||
Susan J. Sutherland | 6,060,474 | 136,400 | ||||||
Scott E. Wennerholm | 6,051,067 | 145,807 | ||||||
Results are rounded to the nearest whole number.
Each nominee was also elected a Trustee of Greater India Portfolio.
Greater India Portfolio
The Portfolio held a Special Meeting of Interestholders on September 20, 2018 to elect the five Trustees listed below. The other Trustees named herein continue to serve as Trustees. The results of the vote with respect to the Fund’s interest in the Portfolio were as follows:
Nominee for Trustee | Interest in the Portfolio | |||||||
| For | Withheld | |||||||
Mark R. Fetting | 98 | % | 2 | % | ||||
Keith Quinton | 98 | % | 2 | % | ||||
Marcus L. Smith | 98 | % | 2 | % | ||||
Susan J. Sutherland | 98 | % | 2 | % | ||||
Scott E. Wennerholm | 98 | % | 2 | % | ||||
Results are rounded to the nearest whole number.
| 33 |
Eaton Vance
Greater India Fund
December 31, 2018
Management and Organization
Fund Management. The Trustees of Eaton Vance Special Investment Trust (the Trust) and Greater India Portfolio (the Portfolio) are responsible for the overall management and supervision of the Trust’s and Portfolio’s affairs. The Trustees and officers of the Trust and the Portfolio are listed below. Except as indicated, each individual has held the office shown or other offices in the same company for the last five years. Trustees and officers of the Trust and the Portfolio hold indefinite terms of office. The “noninterested Trustees” consist of those Trustees who are not “interested persons” of the Trust and the Portfolio, as that term is defined under the 1940 Act. The business address of each Trustee and officer is Two International Place, Boston, Massachusetts 02110. As used below, “EVC” refers to Eaton Vance Corp., “EV” refers to Eaton Vance, Inc., “EVM” refers to Eaton Vance Management, “BMR” refers to Boston Management and Research and “EVD” refers to Eaton Vance Distributors, Inc. EVC and EV are the corporate parent and trustee, respectively, of EVM and BMR. EVD is the Fund’s principal underwriter, the Portfolio’s placement agent and a wholly-owned subsidiary of EVC. Each officer affiliated with Eaton Vance may hold a position with other Eaton Vance affiliates that is comparable to his or her position with EVM listed below. Each Trustee oversees 175 portfolios in the Eaton Vance Complex (including all master and feeder funds in a master feeder structure). Each officer serves as an officer of certain other Eaton Vance funds. Each Trustee and officer serves until his or her successor is elected.
| Name and Year of Birth | Position(s) with the Trust and the Portfolio | Trustee Since(1) | Principal Occupation(s) and Directorships During Past Five Years and Other Relevant Experience | |||
| Interested Trustee | ||||||
Thomas E. Faust Jr. 1958 | Trustee | 2007 | Chairman, Chief Executive Officer and President of EVC, Director and President of EV, Chief Executive Officer and President of EVM and BMR, and Director of EVD. Trustee and/or officer of 175 registered investment companies. Mr. Faust is an interested person because of his positions with EVM, BMR, EVD, EVC and EV, which are affiliates of the Trust and the Portfolio. Directorships in the Last Five Years.(2)Director of EVC and Hexavest Inc. (investment management firm). | |||
| Noninterested Trustees | ||||||
Mark R. Fetting 1954 | Trustee | 2016 | Private investor. Formerly held various positions at Legg Mason, Inc. (investment management firm) (2000-2012), including President, Chief Executive Officer, Director and Chairman (2008-2012), Senior Executive Vice President (2004-2008) and Executive Vice President (2001-2004). Formerly, President of Legg Mason family of funds (2001-2008). Formerly, Division President and Senior Officer of Prudential Financial Group, Inc. and related companies (investment management firm)(1991-2000). Directorships in the Last Five Years. None. | |||
Cynthia E. Frost 1961 | Trustee | 2014 | Private investor. Formerly, Chief Investment Officer of Brown University (university endowment) (2000-2012). Formerly, Portfolio Strategist for Duke Management Company (university endowment manager) (1995-2000). Formerly, Managing Director, Cambridge Associates (investment consulting company) (1989-1995). Formerly, Consultant, Bain and Company (management consulting firm)(1987-1989). Formerly, Senior Equity Analyst, BA Investment Management Company (1983-1985). Directorships in the Last Five Years. None. | |||
George J. Gorman 1952 | Trustee | 2014 | Principal at George J. Gorman LLC (consulting firm). Formerly, Senior Partner at Ernst & Young LLP (a registered public accounting firm) (1974-2009). Directorships in the Last Five Years. Formerly, Trustee of the BofA Funds Series Trust (11 funds) (2011-2014) and of the Ashmore Funds (9 funds) (2010-2014). | |||
Valerie A. Mosley 1960 | Trustee | 2014 | Chairwoman and Chief Executive Officer of Valmo Ventures (a consulting and investment firm). Former Partner and Senior Vice President, Portfolio Manager and Investment Strategist at Wellington Management Company, LLP (investment management firm) (1992-2012). Former Chief Investment Officer, PG Corbin Asset Management (1990-1992). Formerly worked in institutional corporate bond sales at Kidder Peabody (1986-1990). Directorships in the Last Five Years.(2) Director of Envestnet, Inc. (provider of intelligent systems for wealth management and financial wellness) (since 2018). | |||
| 34 |
Eaton Vance
Greater India Fund
December 31, 2018
Management and Organization — continued
| Name and Year of Birth | Position(s) with the Trust and the Portfolio | Trustee Since(1) | Principal Occupation(s) and Directorships During Past Five Years and Other Relevant Experience | |||
| Noninterested Trustees (continued) | ||||||
William H. Park 1947 | Chairperson of the Board and Trustee | 2016 (Chairperson) 2003 (Trustee) | Private investor. Formerly, Consultant (management and transactional) (2012-2014). Formerly, Chief Financial Officer, Aveon Group L.P. (investment management firm) (2010-2011). Formerly, Vice Chairman, Commercial Industrial Finance Corp. (specialty finance company) (2006-2010). Formerly, President and Chief Executive Officer, Prizm Capital Management, LLC (investment management firm)(2002-2005). Formerly, Executive Vice President and Chief Financial Officer, United Asset Management Corporation (investment management firm) (1982-2001). Formerly, Senior Manager, Price Waterhouse (now PricewaterhouseCoopers) (a registered public accounting firm) (1972-1981). Directorships in the Last Five Years.(2) None. | |||
Helen Frame Peters 1948 | Trustee | 2008 | Professor of Finance, Carroll School of Management, Boston College. Formerly, Dean, Carroll School of Management, Boston College (2000-2002). Formerly, Chief Investment Officer, Fixed Income, Scudder Kemper Investments (investment management firm) (1998-1999). Formerly, Chief Investment Officer, Equity and Fixed Income, Colonial Management Associates (investment management firm)(1991-1998). Directorships in the Last Five Years.(2)None. | |||
Keith Quinton(3) 1958 | Trustee | 2018 | Independent Investment Committee Member at New Hampshire Retirement System (since 2017). Advisory Committee member at Northfield Information Services, Inc. (risk management analytics provider) (since 2016). Formerly, Portfolio Manager and Senior Quantitative Analyst at Fidelity Investments (investment management firm)(2001-2014). Directorships in the Last Five Years. Director of New Hampshire Municipal Bond Bank (since 2016). | |||
Marcus L. Smith(3) 1966 | Trustee | 2018 | Member of Posse Boston Advisory Board (foundation) (since 2015); Trustee at University of Mount Union (since 2008). Formerly, Portfolio Manager at MFS Investment Management (investment management firm) (1994-2017). Directorships in the Last Five Years. Director of MSCI Inc. (global provider of investment decision support tools) (since 2017). Director of DCT Industrial Trust Inc. (logistics real estate company) (since 2017). | |||
Susan J. Sutherland 1957 | Trustee | 2015 | Private investor. Formerly, Associate, Counsel and Partner at Skadden, Arps, Slate, Meagher & Flom LLP (law firm) (1982-2013). Directorships in the Last Five Years. Formerly, Director of Montpelier Re Holdings Ltd. (global provider of customized insurance and reinsurance products)(2013-2015). | |||
Scott E. Wennerholm 1959 | Trustee | 2016 | Formerly, Trustee at Wheelock College (postsecondary institution) (2012-2018). Formerly, Consultant at GF Parish Group (executive recruiting firm) (2016-2017). Formerly, Chief Operating Officer and Executive Vice President at BNY Mellon Asset Management (investment management firm) (2005-2011). Formerly, Chief Operating Officer and Chief Financial Officer at Natixis Global Asset Management (investment management firm) (1997-2004). Formerly, Vice President at Fidelity Investments Institutional Services (investment management firm) (1994-1997). Directorships in the Last Five Years. None. | |||
| Name and Year of Birth | Position(s) and the Portfolio | Officer Since(4) | Principal Occupation(s) During Past Five Years | |||
| Principal Officers who are not Trustees | ||||||
Payson F. Swaffield 1956 | President of the Trust | 2003 | Vice President and Chief Income Investment Officer of EVM and BMR. Also Vice President of Calvert Research and Management (“CRM”). | |||
| 35 |
Eaton Vance
Greater India Fund
December 31, 2018
Management and Organization — continued
| Name and Year of Birth | Position(s) and the Portfolio | Officer Since(4) | Principal Occupation(s) During Past Five Years | |||
| Principal Officers who are not Trustees (continued) | ||||||
Edward J. Perkin 1972 | President of the Portfolio | 2014 | Chief Equity Investment Officer and Vice President of EVM and BMR since 2014. Formerly, Chief Investment Officer, International and Emerging Markets Equity, and Managing Director, Portfolio Manager, Europe, EAFE and Global at Goldman Sachs Asset Management (2002-2014). Also Vice President of CRM. | |||
Maureen A. Gemma 1960 | Vice President, Secretary and Chief Legal Officer | 2005 | Vice President of EVM and BMR. Also Vice President of CRM. | |||
James F. Kirchner 1967 | Treasurer | 2007 | Vice President of EVM and BMR. Also Vice President of CRM. | |||
Richard F. Froio 1968 | Chief Compliance Officer | 2017 | Vice President of EVM and BMR since 2017. Formerly Deputy Chief Compliance Officer (Adviser/Funds) and Chief Compliance Officer (Distribution) at PIMCO (2012-2017) and Managing Director at BlackRock/Barclays Global Investors (2009-2012). | |||
| (1) | Year first appointed to serve as Trustee for a fund in the Eaton Vance family of funds. Each Trustee has served continuously since appointment unless indicated otherwise. |
| (2) | During their respective tenures, the Trustees (except for Mmes. Frost and Sutherland and Messrs. Fetting, Gorman, Quinton, Smith and Wennerholm) also served as Board members of one or more of the following funds (which operated in the years noted): eUnitsTM 2 Year U.S. Market Participation Trust: Upside to Cap / Buffered Downside (launched in 2012 and terminated in 2014); and eUnitsTM 2 Year U.S. Market Participation Trust II: Upside to Cap / Buffered Downside (launched in 2012 and terminated in 2014). However, Ms. Mosley did not serve as a Board member of eUnitsTM 2 Year U.S. Market Participation Trust: Upside to Cap / Buffered Downside (launched in 2012 and terminated in 2014). |
| (3) | Messrs. Quinton and Smith began serving as Trustees effective October 1, 2018. |
| (4) | Year first elected to serve as officer of a fund in the Eaton Vance family of funds when the officer has served continuously. Otherwise, year of most recent election as an officer of a fund in the Eaton Vance family of funds. Titles may have changed since initial election. |
The SAI for the Fund includes additional information about the Trustees and officers of the Fund and the Portfolio and can be obtained without charge on Eaton Vance’s website at www.eatonvance.com or by calling 1-800-262-1122.
| 36 |
Eaton Vance Funds
IMPORTANT NOTICES
Privacy. The Eaton Vance organization is committed to ensuring your financial privacy. Each of the financial institutions identified below has in effect the following policy (“Privacy Policy”) with respect to nonpublic personal information about its customers:
| • | Only such information received from you, through application forms or otherwise, and information about your Eaton Vance fund transactions will be collected. This may include information such as name, address, social security number, tax status, account balances and transactions. |
| • | None of such information about you (or former customers) will be disclosed to anyone, except as permitted by law (which includes disclosure to employees necessary to service your account). In the normal course of servicing a customer’s account, Eaton Vance may share information with unaffiliated third parties that perform various required services such as transfer agents, custodians and broker-dealers. |
| • | Policies and procedures (including physical, electronic and procedural safeguards) are in place that are designed to protect the confidentiality of such information. |
| • | We reserve the right to change our Privacy Policy at any time upon proper notification to you. Customers may want to review our Privacy Policy periodically for changes by accessing the link on our homepage: www.eatonvance.com. |
Our pledge of privacy applies to the following entities within the Eaton Vance organization: the Eaton Vance Family of Funds, Eaton Vance Management, Eaton Vance Investment Counsel, Eaton Vance Distributors, Inc., Eaton Vance Trust Company, Eaton Vance Management (International) Limited, Eaton Vance Advisers International Ltd., Eaton Vance Management’s Real Estate Investment Group and Boston Management and Research. In addition, our Privacy Policy applies only to those Eaton Vance customers who are individuals and who have a direct relationship with us. If a customer’s account (i.e., fund shares) is held in the name of a third-party financial advisor/broker-dealer, it is likely that only such advisor’s privacy policies apply to the customer. This notice supersedes all previously issued privacy disclosures. For more information about Eaton Vance’s Privacy Policy, please call 1-800-262-1122.
Delivery of Shareholder Documents. The Securities and Exchange Commission (SEC) permits funds to deliver only one copy of shareholder documents, including prospectuses, proxy statements and shareholder reports, to fund investors with multiple accounts at the same residential or post office box address. This practice is often called “householding” and it helps eliminate duplicate mailings to shareholders.Eaton Vance, or your financial advisor, may household the mailing of your documents indefinitely unless you instruct Eaton Vance, or your financial advisor, otherwise.If you would prefer that your Eaton Vance documents not be householded, please contact Eaton Vance at 1-800-262-1122, or contact your financial advisor. Your instructions that householding not apply to delivery of your Eaton Vance documents will typically be effective within 30 days of receipt by Eaton Vance or your financial advisor.
Portfolio Holdings. Each Eaton Vance Fund and its underlying Portfolio(s) (if applicable) will file a schedule of portfolio holdings on Form N-Q with the SEC for the first and third quarters of each fiscal year. The Form N-Q will be available on the Eaton Vance website at www.eatonvance.com, by calling Eaton Vance at 1-800-262-1122 or in the EDGAR database on the SEC’s website at www.sec.gov. Form N-Q may also be reviewed and copied at the SEC’s public reference room in Washington, D.C. (call 1-800-732-0330 for information on the operation of the public reference room).
Proxy Voting. From time to time, funds are required to vote proxies related to the securities held by the funds. The Eaton Vance Funds or their underlying Portfolios (if applicable) vote proxies according to a set of policies and procedures approved by the Funds’ and Portfolios’ Boards. You may obtain a description of these policies and procedures and information on how the Funds or Portfolios voted proxies relating to portfolio securities during the most recent 12-month period ended June 30, without charge, upon request, by calling 1-800-262-1122 and by accessing the SEC’s website at www.sec.gov.
| 37 |
This Page Intentionally Left Blank
This Page Intentionally Left Blank
This Page Intentionally Left Blank
Investment Adviser of Eaton Vance Greater India Fund and Greater India Portfolio
Boston Management and Research
Two International Place
Boston, MA 02110
Sub-Adviser of Eaton Vance Greater India Fund and Greater India Portfolio
Goldman Sachs Asset Management, L.P.
200 West Street
New York, NY 10282
Administrator of Eaton Vance Greater India Fund
Eaton Vance Management
Two International Place
Boston, MA 02110
Principal Underwriter*
Eaton Vance Distributors, Inc.
Two International Place
Boston, MA 02110
(617) 482-8260
Custodian
State Street Bank and Trust Company
State Street Financial Center, One Lincoln Street
Boston, MA 02111
Transfer Agent
BNY Mellon Investment Servicing (US) Inc.
Attn: Eaton Vance Funds
P.O. Box 9653
Providence, RI 02940-9653
(800) 262-1122
Independent Registered Public Accounting Firm
Deloitte & Touche LLP
200 Berkeley Street
Boston, MA 02116-5022
Fund Offices
Two International Place
Boston, MA 02110
| * | FINRA BrokerCheck. Investors may check the background of their Investment Professional by contacting the Financial Industry Regulatory Authority (FINRA). FINRA BrokerCheck is a free tool to help investors check the professional background of current and former FINRA-registered securities firms and brokers. FINRA BrokerCheck is available by calling 1-800-289-9999 and at www.FINRA.org. The FINRA BrokerCheck brochure describing this program is available to investors at www.FINRA.org. |

142 12.31.18

Eaton Vance
Growth Fund
Annual Report
December 31, 2018
Important Note. Beginning on January 1, 2021, as permitted by regulations adopted by the Securities and Exchange Commission, paper copies of the Fund’s annual and semi-annual shareholder reports will no longer be sent by mail unless you specifically request paper copies of the reports. Instead, the reports will be made available on the Fund’s website (eatonvance.com/funddocuments), and you will be notified by mail each time a report is posted and provided with a website address to access the report.
If you already elected to receive shareholder reports electronically, you will not be affected by this change and you need not take any action. If you are a direct investor, you may elect to receive shareholder reports and other communications from the Fund electronically by signing up for e-Delivery at eatonvance.com/edelivery. If you own your shares through a financial intermediary (such as a broker-dealer or bank), you must contact your financial intermediary to sign up.
You may elect to receive all future Fund shareholder reports in paper free of charge. If you are a direct investor, you can inform the Fund that you wish to continue receiving paper copies of your shareholder reports by calling 1-800-262-1122. If you own these shares through a financial intermediary, you must contact your financial intermediary or follow instructions included with this disclosure, if applicable, to elect to continue to receive paper copies of your shareholder reports. Your election to receive reports in paper will apply to all Eaton Vance funds held directly or to all funds held through your financial intermediary, as applicable.

Commodity Futures Trading Commission Registration. Effective December 31, 2012, the Commodity Futures Trading Commission (“CFTC”) adopted certain regulatory changes that subject registered investment companies and advisers to regulation by the CFTC if a fund invests more than a prescribed level of its assets in certain CFTC-regulated instruments (including futures, certain options and swap agreements) or markets itself as providing investment exposure to such instruments. The Fund has claimed an exclusion from the definition of the term “commodity pool operator” under the Commodity Exchange Act. Accordingly, neither the Fund nor the adviser with respect to the operation of the Fund is subject to CFTC regulation. Because of its management of other strategies, the Fund’s adviser is registered with the CFTC as a commodity pool operator and a commodity trading advisor.
Fund shares are not insured by the FDIC and are not deposits or other obligations of, or guaranteed by, any depository institution. Shares are subject to investment risks, including possible loss of principal invested.
This report must be preceded or accompanied by a current summary prospectus or prospectus. Before investing, investors should consider carefully the investment objective, risks, and charges and expenses of a mutual fund. This and other important information is contained in the summary prospectus and prospectus, which can be obtained from a financial advisor. Prospective investors should read the prospectus carefully before investing. For further information, please call 1-800-262-1122.
Annual ReportDecember 31, 2018
Eaton Vance
Growth Fund
Table of Contents
Management’s Discussion of Fund Performance | 2 | |||
Performance | 3 | |||
Fund Profile | 4 | |||
Endnotes and Additional Disclosures | 5 | |||
Fund Expenses | 6 | |||
Financial Statements | 7 | |||
Report of Independent Registered Public Accounting Firm | 22 | |||
Federal Tax Information | 23 | |||
Special Meeting of Shareholders | 24 | |||
Management and Organization | 25 | |||
Important Notices | 28 | |||
Eaton Vance
Growth Fund
December 31, 2018
Management’s Discussion of Fund Performance1
Economic and Market Conditions
U.S. stock indexes declined during the12-month period ended December 31, 2018, as a sharp downturn in the final quarter of the year erased earlier gains.
U.S. stocks opened the period on an upswing, as investors reacted favorably to the passage of the Republican tax reform package in December 2017. Sharp cuts in corporate taxes, a key element of the bill, raised corporate-profit expectations. U.S. stocks also got a boost from positive U.S. economic data, including the unemployment rate, which fell to a17-year low.
In February 2018, however, U.S. stocks pulled back amid fears that rising interest rates might boost the appeal of fixed-income investments. After a brief rebound, equity markets again weakened in the spring of 2018, as investors confronted the prospect of a global trade war due to President Trump’sthen-new tariffs. The broad tariffs drew retaliatory actions from impacted countries including China, Canada, and certain countries in the European Union.
U.S. stocks bounced back during the summer months led by technology stocks, which rebounded following an earlier setback from a wave of data-privacy scandals. Markets plunged in the final three months of the period amid global trade war fears and sagging economies in China and Europe. Despite a partial rebound in the final days of the period, the U.S. stock market’s December 2018 plunge was the worst monthly loss since the 2008 financial crisis.
Amid investor worries, however, U.S. economic data remained largely positive during the period, prompting the U.S. Federal Reserve (the Fed) to raise the federal funds rate in December 2018 for the fourth time during the period. Since then, the Fed has indicated that it may reconsider its planned 2019 rate hikes.
For the12-month period ended December 31, 2018, the blue-chip Dow Jones Industrial Average®2 declined 3.48%, while the broader U.S. equity market represented by the S&P 500® Index fell 4.38%. The technology-laden NASDAQ Composite Index fell 2.84% during the period.Large-cap U.S. stocks as measured by the S&P 500® Index generally outperformed theirsmall-cap counterparts as measured by the Russell 2000® Index during the period. Growth stocks as a group outpaced value stocks in both the large- andsmall-cap categories, as measured by the Russell Growth and Value Indexes.
Fund Performance
For the12-month period ended December 31, 2018, Eaton Vance Growth Fund (the Fund) returned 0.27% for Class A shares at net asset value (NAV), outperforming its benchmark, the Russell 1000® Growth Index (the Index), which returned –1.51%.
The Fund outperformed the Index due largely to stock selections, while sector and industry allocations detracted from performance during the period. Of the 11 economic sectors in the Index, the Fund recorded positive returns in four of the nine sectors in which it was invested. The Index had positive returns in four sectors.
Stock selections in the information technology (IT) sector were the largest contributors to relative Fund performance versus the Index. Within the IT sector, the Fund’s overweight position in the outperforming software industry boosted relative results. Four software companies — Microsoft Corp., Adobe, Inc., salesforce. com, Inc., and Palo Alto Networks, Inc. — were among the Fund’s strongest performing stocks during the period.
Stock selections in the communication services sector also contributed to Fund performance relative to the Index during the period. In the interactive media & services industry, social network leader Twitter, Inc. was among the Fund’s leading stocks on better-than-expected results. The Fund’s underweight position in the lagging media industry also boosted relative Fund performance. Stock selections along with an overweight position in the outperforming consumer discretionary sector contributed to relative Fund performance as well. In the direct marketing retail industry,e-commerce giant Amazon.com, Inc. was the Fund’s top stock, benefiting from growth in its key business segments — web services, retail, and advertising. The specialty retail and hotels restaurants & leisure industries also delivered strong performance during the period.
Conversely, financials was the Fund’s weakest sector, largely due to stock selections. Within the sector, the lagging capital markets industry was a drag on Fund results versus the Index. Investment bank Goldman Sachs Group, Inc. was among the Fund’s weakest stocks, pressured by fears of a global economic slowdown as well as operational issues during the period. The stock was sold during the period.
The energy sector detracted from relative Fund performance versus the Index due to stock selections along with an overweight position in the lagging market. Oil and gas producer Devon Energy Corp. was among the Fund’s poorest-performing stocks amid a decline in oil prices during the period.
The industrials sector also detracted from relative Fund results primarily due to stock selections. In particular, an overweight position in the underperforming air freight & logistics industry dragged down Fund performance versus the Index. Package delivery leader FedEx Corp. was one of the weakest performers in the Fund due to disappointing global results and slower-than-expected synergies from a major acquisition.
Overall, social networking giant Facebook, Inc. was the
Fund’s worst-performing stock amid ongoing data security issues.
See Endnotes and Additional Disclosures in this report.
Past performance is no guarantee of future results. Returns are historical and are calculated by determining the percentage change in net asset value (NAV) or offering price (as applicable) with all distributions reinvested. Investment return and principal value will fluctuate so that shares, when redeemed, may be worth more or less than their original cost. Performance less than or equal to one year is cumulative. Performance is for the stated time period only; due to market volatility, the Fund’s current performance may be lower or higher than quoted. Returns are before taxes unless otherwise noted. For performance as of the most recent month-end, please refer to eatonvance.com.
| 2 |
Eaton Vance
Growth Fund
December 31, 2018
Performance2,3
Portfolio ManagersLewis R. Piantedosi and Yana S. Barton, CFA
| % Average Annual Total Returns | Class Inception Date | Performance Inception Date | One Year | Five Years | Ten Years | |||||||||||||||
Class A at NAV | 09/09/2002 | 09/09/2002 | 0.27 | % | 9.48 | % | 13.44 | % | ||||||||||||
Class A with 5.75% Maximum Sales Charge | — | — | –5.50 | 8.19 | 12.77 | |||||||||||||||
Class C at NAV | 09/09/2002 | 09/09/2002 | –0.43 | 8.67 | 12.59 | |||||||||||||||
Class C with 1% Maximum Sales Charge | — | — | –1.29 | 8.67 | 12.59 | |||||||||||||||
Class I at NAV | 05/03/2007 | 09/09/2002 | 0.56 | 9.77 | 13.73 | |||||||||||||||
Class R at NAV | 08/03/2009 | 09/09/2002 | 0.01 | 9.21 | 13.17 | |||||||||||||||
Russell 1000® Growth Index | — | — | –1.51 | % | 10.40 | % | 15.28 | % | ||||||||||||
| % Total Annual Operating Expense Ratios4 | Class A | Class C | Class I | Class R | ||||||||||||||||
Gross | 1.09 | % | 1.84 | % | 0.84 | % | 1.34 | % | ||||||||||||
Net | 1.05 | 1.80 | 0.80 | 1.30 | ||||||||||||||||
Growth of $10,000
This graph shows the change in value of a hypothetical investment of $10,000 in Class A of the Fund for the period indicated. For comparison, the same investment is shown in the indicated index.
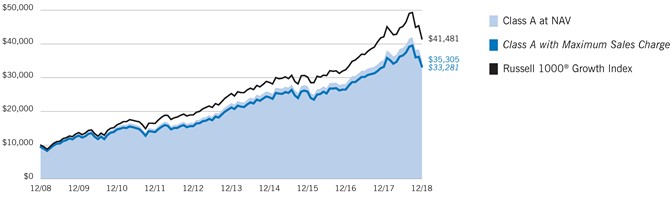
| Growth of Investment3 | Amount Invested | Period Beginning | At NAV | With Maximum Sales Charge | ||||||||||||
Class C | $ | 10,000 | 12/31/2008 | $ | 32,766 | N.A. | ||||||||||
Class I | $ | 250,000 | 12/31/2008 | $ | 905,851 | N.A. | ||||||||||
Class R | $ | 10,000 | 12/31/2008 | $ | 34,486 | N.A. | ||||||||||
See Endnotes and Additional Disclosures in this report.
Past performance is no guarantee of future results. Returns are historical and are calculated by determining the percentage change in net asset value (NAV) or offering price (as applicable) with all distributions reinvested. Investment return and principal value will fluctuate so that shares, when redeemed, may be worth more or less than their original cost. Performance less than or equal to one year is cumulative. Performance is for the stated time period only; due to market volatility, the Fund’s current performance may be lower or higher than quoted. Returns are before taxes unless otherwise noted. For performance as of the most recentmonth-end, please refer to eatonvance.com.
| 3 |
Eaton Vance
Growth Fund
December 31, 2018
Fund Profile
Sector Allocation (% of net assets)5
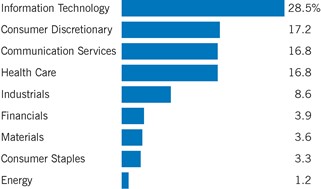
Top 10 Holdings (% of net assets)5
Amazon.com, Inc. | 7.7 | % | ||
Visa, Inc., Class A | 5.2 | |||
Alphabet, Inc., Class C | 4.9 | |||
salesforce.com, Inc. | 3.4 | |||
Alphabet, Inc., Class A | 3.2 | |||
Microsoft Corp. | 3.2 | |||
Adobe, Inc. | 2.7 | |||
Coca-Cola Co. (The) | 2.7 | |||
Ecolab, Inc. | 2.4 | |||
Walt Disney Co. (The) | 2.4 | |||
Total | 37.8 | % | ||
See Endnotes and Additional Disclosures in this report.
| 4 |
Eaton Vance
Growth Fund
December 31, 2018
Endnotes and Additional Disclosures
| 1 | The views expressed in this report are those of the portfolio manager(s) and are current only through the date stated at the top of this page. These views are subject to change at any time based upon market or other conditions, and Eaton Vance and the Fund(s) disclaim any responsibility to update such views. These views may not be relied upon as investment advice and, because investment decisions are based on many factors, may not be relied upon as an indication of trading intent on behalf of any Eaton Vance fund. This commentary may contain statements that are not historical facts, referred to as “forward looking statements.” The Fund’s actual future results may differ significantly from those stated in any forward looking statement, depending on factors such as changes in securities or financial markets or general economic conditions, the volume of sales and purchases of Fund shares, the continuation of investment advisory, administrative and service contracts, and other risks discussed from time to time in the Fund’s filings with the Securities and Exchange Commission. |
| 2 | Dow Jones Industrial Average® is a price-weighted average of 30 blue-chip stocks that are generally the leaders in their industry. S&P 500® Index is an unmanaged index oflarge-cap stocks commonly used as a measure of U.S. stock market performance. NASDAQ Composite Index is a market capitalization-weighted index of all domestic and international securities listed on NASDAQ. Source: Nasdaq, Inc. The information is provided by Nasdaq (with its affiliates, are referred to as the “Corporations”) and Nasdaq’s third party licensors on an “as is” basis and the Corporations make no guarantees and bear no liability of any kind with respect to the information or the Fund. Russell 2000® Index is an unmanaged index of 2,000 U.S.small-cap stocks. Russell 1000® Growth Index is an unmanaged index of U.S.large-cap growth stocks. Unless otherwise stated, index returns do not reflect the effect of any applicable sales charges, commissions, expenses, taxes or leverage, as applicable. It is not possible to invest directly in an index. |
| 3 | Total Returns at NAV do not include applicable sales charges. If sales charges were deducted, the returns would be lower. Total Returns shown with maximum sales charge reflect the stated maximum sales charge. Unless otherwise stated, performance does not reflect the deduction of taxes on Fund distributions or redemptions of Fund shares. |
Performance prior to the inception date of a class may be linked to the performance of an older class of the Fund. This linked performance is adjusted for any applicable sales charge, but is not adjusted for class expense differences. If adjusted for such differences, the performance would be different. The performance of Class R is linked to Class A. Performance since inception for an index, if presented, is the performance since the Fund’s or oldest share class’ inception, as applicable. Performance presented in the Financial Highlights included in the financial statements is not linked. |
| 4 | Source: Fund prospectus. Net expense ratios reflect a contractual expense reimbursement that continues through 4/30/19. Without the reimbursement, performance would have been lower. The expense ratios for the current reporting period can be found in the Financial Highlights section of this report. |
| 5 | Excludes cash and cash equivalents. |
Fund profile subject to change due to active management. |
| 5 |
Eaton Vance
Growth Fund
December 31, 2018
Fund Expenses
Example: As a Fund shareholder, you incur two types of costs: (1) transaction costs, including sales charges (loads) on purchases and redemption fees (if applicable); and (2) ongoing costs, including management fees; distribution and/or service fees; and other Fund expenses. This Example is intended to help you understand your ongoing costs (in dollars) of Fund investing and to compare these costs with the ongoing costs of investing in other mutual funds. The Example is based on an investment of $1,000 invested at the beginning of the period and held for the entire period (July 1, 2018 – December 31, 2018).
Actual Expenses: The first section of the table below provides information about actual account values and actual expenses. You may use the information in this section, together with the amount you invested, to estimate the expenses that you paid over the period. Simply divide your account value by $1,000 (for example, an $8,600 account value divided by $1,000 = 8.6), then multiply the result by the number in the first section under the heading entitled “Expenses Paid During Period” to estimate the expenses you paid on your account during this period.
Hypothetical Example for Comparison Purposes: The second section of the table below provides information about hypothetical account values and hypothetical expenses based on the actual Fund expense ratio and an assumed rate of return of 5% per year (before expenses), which is not the actual Fund return. The hypothetical account values and expenses may not be used to estimate the actual ending account balance or expenses you paid for the period. You may use this information to compare the ongoing costs of investing in your Fund and other funds. To do so, compare this 5% hypothetical example with the 5% hypothetical examples that appear in the shareholder reports of the other funds.
Please note that the expenses shown in the table are meant to highlight your ongoing costs only and do not reflect any transactional costs, such as sales charges (loads) or redemption fees (if applicable). Therefore, the second section of the table is useful in comparing ongoing costs only, and will not help you determine the relative total costs of owning different funds. In addition, if these transactional costs were included, your costs would be higher.
Beginning Account Value (7/1/18) | Ending Account Value (12/31/18) | Expenses Paid During Period* (7/1/18 – 12/31/18) | Annualized Expense | |||||||||||||
Actual | ||||||||||||||||
Class A | $ | 1,000.00 | $ | 910.20 | $ | 5.06 | ** | 1.05 | % | |||||||
Class C | $ | 1,000.00 | $ | 906.90 | $ | 8.65 | ** | 1.80 | % | |||||||
Class I | $ | 1,000.00 | $ | 911.60 | $ | 3.85 | ** | 0.80 | % | |||||||
Class R | $ | 1,000.00 | $ | 908.80 | $ | 6.25 | ** | 1.30 | % | |||||||
Hypothetical | ||||||||||||||||
(5% return per year before expenses) | ||||||||||||||||
Class A | $ | 1,000.00 | $ | 1,019.90 | $ | 5.35 | ** | 1.05 | % | |||||||
Class C | $ | 1,000.00 | $ | 1,016.10 | $ | 9.15 | ** | 1.80 | % | |||||||
Class I | $ | 1,000.00 | $ | 1,021.20 | $ | 4.08 | ** | 0.80 | % | |||||||
Class R | $ | 1,000.00 | $ | 1,018.70 | $ | 6.61 | ** | 1.30 | % | |||||||
| * | Expenses are equal to the Fund’s annualized expense ratio for the indicated Class, multiplied by the average account value over the period, multiplied by 184/365 (to reflect the one-half year period). The Example assumes that the $1,000 was invested at the net asset value per share determined at the close of business on June 30, 2018. |
| ** | Absent an allocation of certain expenses to an affiliate, expenses would be higher. |
| 6 |
Eaton Vance
Growth Fund
December 31, 2018
Portfolio of Investments
| Common Stocks — 99.9% |
| |||||||
| Security | Shares | Value | ||||||
| Aerospace & Defense — 2.6% | ||||||||
Boeing Co. (The) | 7,315 | $ | 2,359,088 | |||||
Raytheon Co. | 35,855 | 5,498,364 | ||||||
| $ | 7,857,452 | |||||||
| Air Freight & Logistics — 1.4% | ||||||||
FedEx Corp. | 25,856 | $ | 4,171,348 | |||||
| $ | 4,171,348 | |||||||
| Auto Components — 2.0% | ||||||||
Aptiv PLC | 102,407 | $ | 6,305,199 | |||||
| $ | 6,305,199 | |||||||
| Banks — 1.8% | ||||||||
JPMorgan Chase & Co. | 56,258 | $ | 5,491,906 | |||||
| $ | 5,491,906 | |||||||
| Beverages — 3.3% | ||||||||
Coca-Cola Co. (The) | 173,542 | $ | 8,217,214 | |||||
PepsiCo, Inc. | 16,728 | 1,848,109 | ||||||
| $ | 10,065,323 | |||||||
| Biotechnology — 4.8% | ||||||||
Celgene Corp.(1) | 37,879 | $ | 2,427,665 | |||||
Exact Sciences Corp.(1)(2) | 47,958 | 3,026,150 | ||||||
Loxo Oncology, Inc.(1) | 15,697 | 2,198,679 | ||||||
Sarepta Therapeutics, Inc.(1)(2) | 14,912 | 1,627,347 | ||||||
Vertex Pharmaceuticals, Inc.(1) | 33,626 | 5,572,164 | ||||||
| $ | 14,852,005 | |||||||
| Building Products — 0.9% | ||||||||
Fortune Brands Home & Security, Inc. | 76,861 | $ | 2,919,949 | |||||
| $ | 2,919,949 | |||||||
| Capital Markets — 2.1% | ||||||||
Charles Schwab Corp. (The) | 153,958 | $ | 6,393,876 | |||||
| $ | 6,393,876 | |||||||
| Chemicals — 3.6% | ||||||||
Ecolab, Inc. | 50,920 | $ | 7,503,062 | |||||
Sherwin-Williams Co. (The) | 8,976 | 3,531,697 | ||||||
| $ | 11,034,759 | |||||||
| Security | Shares | Value | ||||||
| Commercial Services & Supplies — 2.3% | ||||||||
Waste Connections, Inc. | 34,359 | $ | 2,551,156 | |||||
Waste Management, Inc. | 49,422 | 4,398,064 | ||||||
| �� | $ | 6,949,220 | ||||||
| Communications Equipment — 1.0% | ||||||||
Arista Networks, Inc.(1) | 14,230 | $ | 2,998,261 | |||||
| $ | 2,998,261 | |||||||
| Electronic Equipment, Instruments & Components — 1.1% | ||||||||
Littelfuse, Inc. | 18,921 | $ | 3,244,573 | |||||
| $ | 3,244,573 | |||||||
| Entertainment — 5.0% | ||||||||
Activision Blizzard, Inc. | 103,654 | $ | 4,827,167 | |||||
Netflix, Inc.(1) | 12,116 | 3,242,968 | ||||||
Walt Disney Co. (The) | 67,272 | 7,376,375 | ||||||
| $ | 15,446,510 | |||||||
| Health Care Equipment & Supplies — 4.5% | ||||||||
Abbott Laboratories | 96,499 | $ | 6,979,773 | |||||
Danaher Corp. | 34,452 | 3,552,690 | ||||||
Intuitive Surgical, Inc.(1) | 6,685 | 3,201,580 | ||||||
| $ | 13,734,043 | |||||||
| Health Care Providers & Services — 3.4% | ||||||||
Anthem, Inc. | 16,935 | $ | 4,447,639 | |||||
UnitedHealth Group, Inc. | 24,217 | 6,032,939 | ||||||
| $ | 10,480,578 | |||||||
| Hotels, Restaurants & Leisure — 1.2% | ||||||||
Starbucks Corp. | 58,716 | $ | 3,781,310 | |||||
| $ | 3,781,310 | |||||||
| Interactive Media & Services — 11.8% | ||||||||
Alphabet, Inc., Class A(1) | 9,339 | $ | 9,758,881 | |||||
Alphabet, Inc., Class C(1) | 14,429 | 14,942,817 | ||||||
Facebook, Inc., Class A(1) | 28,567 | 3,744,848 | ||||||
IAC/InterActiveCorp.(1) | 30,866 | 5,649,713 | ||||||
Twitter, Inc.(1) | 73,972 | 2,125,955 | ||||||
| $ | 36,222,214 | |||||||
| 7 | See Notes to Financial Statements. |
Eaton Vance
Growth Fund
December 31, 2018
Portfolio of Investments — continued
| Security | Shares | Value | ||||||
| Internet & Direct Marketing Retail — 8.6% | ||||||||
Amazon.com, Inc.(1) | 15,684 | $ | 23,556,898 | |||||
Booking Holdings, Inc.(1) | 1,665 | 2,867,829 | ||||||
| $ | 26,424,727 | |||||||
| IT Services — 7.3% | ||||||||
GoDaddy, Inc., Class A(1) | 98,009 | $ | 6,431,351 | |||||
Visa, Inc., Class A(2) | 120,976 | 15,961,573 | ||||||
| $ | 22,392,924 | |||||||
| Life Sciences Tools & Services — 1.8% | ||||||||
Agilent Technologies, Inc. | 45,706 | $ | 3,083,327 | |||||
Illumina, Inc.(1) | 8,181 | 2,453,727 | ||||||
| $ | 5,537,054 | |||||||
| Multiline Retail — 0.6% | ||||||||
Dollar Tree, Inc.(1) | 20,436 | $ | 1,845,780 | |||||
| $ | 1,845,780 | |||||||
| Oil, Gas & Consumable Fuels — 1.2% | ||||||||
Devon Energy Corp. | 54,467 | $ | 1,227,686 | |||||
HollyFrontier Corp. | 50,157 | 2,564,026 | ||||||
| $ | 3,791,712 | |||||||
| Pharmaceuticals — 2.3% | ||||||||
Merck & Co., Inc. | 62,800 | $ | 4,798,548 | |||||
Novartis AG ADR | 25,909 | 2,223,251 | ||||||
| $ | 7,021,799 | |||||||
| Road & Rail — 1.5% | ||||||||
CSX Corp. | 72,549 | $ | 4,507,469 | |||||
| $ | 4,507,469 | |||||||
| Semiconductors & Semiconductor Equipment — 2.9% | ||||||||
QUALCOMM, Inc. | 70,364 | $ | 4,004,415 | |||||
Texas Instruments, Inc. | 50,614 | 4,783,023 | ||||||
| $ | 8,787,438 | |||||||
| Software — 13.6% | ||||||||
Adobe, Inc.(1) | 37,008 | $ | 8,372,690 | |||||
Intuit, Inc. | 23,984 | 4,721,250 | ||||||
Microsoft Corp. | 95,283 | 9,677,894 | ||||||
Palo Alto Networks, Inc.(1) | 32,747 | 6,167,898 | ||||||
SailPoint Technologies Holding, Inc.(1) | 106,334 | 2,497,786 | ||||||
salesforce.com, Inc.(1) | 76,041 | 10,415,336 | ||||||
| $ | 41,852,854 | |||||||
| Security | Shares | Value | ||||||
| Specialty Retail — 2.6% | ||||||||
Home Depot, Inc. (The) | 8,910 | $ | 1,530,916 | |||||
TJX Cos., Inc. (The) | 65,703 | 2,939,552 | ||||||
Ulta Beauty, Inc.(1) | 14,419 | 3,530,348 | ||||||
| $ | 8,000,816 | |||||||
| Technology Hardware, Storage & Peripherals — 2.6% | ||||||||
Apple, Inc. | 33,018 | $ | 5,208,259 | |||||
HP, Inc. | 143,163 | 2,929,115 | ||||||
| $ | 8,137,374 | |||||||
| Textiles, Apparel & Luxury Goods — 2.1% | ||||||||
NIKE, Inc., Class B | 70,266 | $ | 5,209,521 | |||||
Tapestry, Inc. | 32,975 | 1,112,907 | ||||||
| $ | 6,322,428 | |||||||
Total Common Stocks |
| $ | 306,570,901 | |||||
| Short-Term Investments — 0.2% |
| |||||||
| Description | Units | Value | ||||||
Eaton Vance Cash Reserves Fund, LLC, 2.46%(3) | 709,347 | $ | 709,276 | |||||
Total Short-Term Investments |
| $ | 709,276 | |||||
Total Investments — 100.1% |
| $ | 307,280,177 | |||||
Other Assets, Less Liabilities — (0.1)% |
| $ | (360,301 | ) | ||||
Net Assets — 100.0% |
| $ | 306,919,876 | |||||
The percentage shown for each investment category in the Portfolio of Investments is based on net assets.
| (1) | Non-income producing security. |
| (2) | All or a portion of this security was on loan at December 31, 2018. The aggregate market value of securities on loan at December 31, 2018 was $18,564,415. |
| (3) | Affiliated investment company, available to Eaton Vance portfolios and funds, which invests in high quality, U.S. dollar denominated money market instruments. The rate shown is the annualized seven-day yield as of December 31, 2018. |
Abbreviations:
| ADR | – | American Depositary Receipt | ||
| 8 | See Notes to Financial Statements. |
Eaton Vance
Growth Fund
December 31, 2018
Statement of Assets and Liabilities
| Assets | December 31, 2018 | |||
Unaffiliated investments, at value including $18,564,415 of securities on loan (identified cost, $204,760,892) | $ | 306,570,901 | ||
Affiliated investment, at value (identified cost, $709,269) | 709,276 | |||
Dividends receivable | 250,544 | |||
Dividends receivable from affiliated investment | 2,582 | |||
Receivable for Fund shares sold | 373,107 | |||
Securities lending income receivable | 2,193 | |||
Tax reclaims receivable | 145,537 | |||
Receivable from affiliate | 54,682 | |||
Other assets | 10,742 | |||
Total assets | $ | 308,119,564 | ||
| Liabilities | ||||
Payable for Fund shares redeemed | $ | 784,228 | ||
Payable to affiliates: | ||||
Investment adviser fee | 174,791 | |||
Distribution and service fees | 73,537 | |||
Trustees’ fees | 3,968 | |||
Accrued expenses | 163,164 | |||
Total liabilities | $ | 1,199,688 | ||
Net Assets | $ | 306,919,876 | ||
| Sources of Net Assets | ||||
Paid-in capital | $ | 207,543,053 | ||
Distributable earnings | 99,376,823 | |||
Total | $ | 306,919,876 | ||
| Class A Shares | ||||
Net Assets | $ | 190,017,149 | ||
Shares Outstanding | 8,047,259 | |||
Net Asset Value and Redemption Price Per Share | ||||
(net assets ÷ shares of beneficial interest outstanding) | $ | 23.61 | ||
Maximum Offering Price Per Share | ||||
(100 ÷ 94.25 of net asset value per share) | $ | 25.05 | ||
| Class C Shares | ||||
Net Assets | $ | 35,061,089 | ||
Shares Outstanding | 1,783,305 | |||
Net Asset Value and Offering Price Per Share* | ||||
(net assets ÷ shares of beneficial interest outstanding) | $ | 19.66 | ||
| Class I Shares | ||||
Net Assets | $ | 78,812,030 | ||
Shares Outstanding | 3,232,801 | |||
Net Asset Value, Offering Price and Redemption Price Per Share | ||||
(net assets ÷ shares of beneficial interest outstanding) | $ | 24.38 | ||
| Class R Shares | ||||
Net Assets | $ | 3,029,608 | ||
Shares Outstanding | 131,808 | |||
Net Asset Value, Offering Price and Redemption Price Per Share | ||||
(net assets ÷ shares of beneficial interest outstanding, including fractional shares) | $ | 22.98 | ||
On sales of $50,000 or more, the offering price of Class A shares is reduced.
| * | Redemption price per share is equal to the net asset value less any applicable contingent deferred sales charge. |
| 9 | See Notes to Financial Statements. |
Eaton Vance
Growth Fund
December 31, 2018
Statement of Operations
| Investment Income | Year Ended December 31, 2018 | |||
Dividends (net of foreign taxes, $3,732) | $ | 2,147,634 | ||
Dividends allocated from Portfolio | 1,041,221 | |||
Dividends from affiliated investment | 62,634 | |||
Securities lending income, net | 15,991 | |||
Securities lending income allocated from Portfolio, net | 7,507 | |||
Expenses allocated from Portfolio | (874,548 | ) | ||
Total investment income | $ | 2,400,439 | ||
| Expenses | ||||
Investment adviser fee | $ | 1,466,195 | ||
Distribution and service fees | ||||
Class A | 547,088 | |||
Class C | 421,738 | |||
Class R | 18,050 | |||
Trustees’ fees and expenses | 12,026 | |||
Custodian fee | 69,855 | |||
Transfer and dividend disbursing agent fees | 342,440 | |||
Legal and accounting services | 49,933 | |||
Printing and postage | 41,802 | |||
Registration fees | 57,126 | |||
Miscellaneous | 24,448 | |||
Total expenses | $ | 3,050,701 | ||
Deduct — | ||||
Allocation of expenses to affiliate | $ | 128,396 | ||
Total expense reductions | $ | 128,396 | ||
Net expenses | $ | 2,922,305 | ||
Net investment loss | $ | (521,866 | ) | |
| Realized and Unrealized Gain (Loss) | ||||
Net realized gain (loss) — | ||||
Investment transactions | $ | 13,086,039 | ||
Investment transactions allocated from Portfolio | 21,385,025 | |||
Investment transactions — affiliated investment | (551 | ) | ||
Foreign currency transactions | (19 | ) | ||
Foreign currency transactions allocated from Portfolio | (9,371 | ) | ||
Net realized gain | $ | 34,461,123 | ||
Change in unrealized appreciation (depreciation) — | ||||
Investments | $ | (40,007,882 | ) | |
Investments allocated from Portfolio | 8,803,575 | |||
Investments — affiliated investment | 7 | |||
Foreign currency | (1,697 | ) | ||
Foreign currency allocated from Portfolio | (773 | ) | ||
Net change in unrealized appreciation (depreciation) | $ | (31,206,770 | ) | |
Net realized and unrealized gain | $ | 3,254,353 | ||
Net increase in net assets from operations | $ | 2,732,487 | ||
| 10 | See Notes to Financial Statements. |
Eaton Vance
Growth Fund
December 31, 2018
Statements of Changes in Net Assets
| Year Ended December 31, | ||||||||
| Increase (Decrease) in Net Assets | 2018 | 2017 | ||||||
From operations — | ||||||||
Net investment loss | $ | (521,866 | ) | $ | (418,497 | ) | ||
Net realized gain | 34,461,123 | 20,552,961 | ||||||
Net change in unrealized appreciation (depreciation) | (31,206,770 | ) | 51,170,227 | |||||
Net increase in net assets from operations | $ | 2,732,487 | $ | 71,304,691 | ||||
Distributions to shareholders(1) | ||||||||
Class A | $ | (24,204,622 | ) | $ | (9,956,667 | ) | ||
Class C | (5,206,991 | ) | (2,220,208 | ) | ||||
Class I | (9,715,041 | ) | (3,738,058 | ) | ||||
Class R | (374,416 | ) | (163,345 | ) | ||||
Total distributions to shareholders | $ | (39,501,070 | ) | $ | (16,078,278 | ) | ||
Transactions in shares of beneficial interest — | ||||||||
Proceeds from sale of shares | ||||||||
Class A | $ | 16,474,915 | $ | 16,240,954 | ||||
Class C | 4,753,672 | 4,144,516 | ||||||
Class I | 21,385,481 | 26,639,386 | ||||||
Class R | 742,398 | 728,201 | ||||||
Net asset value of shares issued to shareholders in payment of distributions declared | ||||||||
Class A | 22,215,152 | 9,145,153 | ||||||
Class C | 4,834,021 | 2,019,402 | ||||||
Class I | 9,519,787 | 3,553,117 | ||||||
Class R | 296,311 | 112,580 | ||||||
Cost of shares redeemed | ||||||||
Class A | (36,050,791 | ) | (45,564,024 | ) | ||||
Class C | (11,236,195 | ) | (13,034,293 | ) | ||||
Class I | (21,372,672 | ) | (24,272,291 | ) | ||||
Class R | (1,151,015 | ) | (1,205,617 | ) | ||||
Net increase (decrease) in net assets from Fund share transactions | $ | 10,411,064 | $ | (21,492,916 | ) | |||
Net increase (decrease) in net assets | $ | (26,357,519 | ) | $ | 33,733,497 | |||
| Net Assets | ||||||||
At beginning of year | $ | 333,277,395 | $ | 299,543,898 | ||||
At end of year | $ | 306,919,876 | $ | 333,277,395 | ||||
| (1) | For the year ended December 31, 2017, the source of distributions was as follows: |
Net investment income — Class A $(227,167) and Class I $(249,851) |
Net realized gain — Class A $(9,729,500), Class C $(2,220,208), Class I $(3,488,207) and Class R $(163,345) |
The current year presentation of distributions conforms with the Disclosure Update and Simplification Rule issued by the Securities and Exchange Commission, effective November 5, 2018. |
| 11 | See Notes to Financial Statements. |
Eaton Vance
Growth Fund
December 31, 2018
Financial Highlights
| Class A | ||||||||||||||||||||
| Year Ended December 31, | ||||||||||||||||||||
| 2018 | 2017 | 2016 | 2015 | 2014 | ||||||||||||||||
Net asset value — Beginning of year | $ | 26.650 | $ | 22.300 | $ | 22.230 | $ | 21.670 | $ | 20.920 | ||||||||||
| Income (Loss) From Operations | ||||||||||||||||||||
Net investment income (loss)(1) | $ | (0.034 | ) | $ | (0.021 | ) | $ | 0.047 | $ | 0.140 | $ | (0.000 | )(2) | |||||||
Net realized and unrealized gain | 0.301 | 5.680 | 0.451 | 1.387 | 2.889 | |||||||||||||||
Total income from operations | $ | 0.267 | $ | 5.659 | $ | 0.498 | $ | 1.527 | $ | 2.889 | ||||||||||
| Less Distributions | ||||||||||||||||||||
From net investment income | $ | — | $ | (0.029 | ) | $ | (0.085 | ) | $ | — | $ | — | ||||||||
From net realized gain | (3.307 | ) | (1.280 | ) | (0.343 | ) | (0.967 | ) | (2.139 | ) | ||||||||||
Total distributions | $ | (3.307 | ) | $ | (1.309 | ) | $ | (0.428 | ) | $ | (0.967 | ) | $ | (2.139 | ) | |||||
Net asset value — End of year | $ | 23.610 | $ | 26.650 | $ | 22.300 | $ | 22.230 | $ | 21.670 | ||||||||||
Total Return(3)(4) | 0.27 | % | 25.42 | % | 2.32 | % | 7.04 | % | 14.23 | % | ||||||||||
| Ratios/Supplemental Data | ||||||||||||||||||||
Net assets, end of year (000’s omitted) | $ | 190,017 | $ | 209,606 | $ | 194,018 | $ | 214,135 | $ | 88,448 | ||||||||||
Ratios (as a percentage of average daily net assets):(5) | ||||||||||||||||||||
Expenses(4)(6) | 1.05 | % | 1.05 | % | 1.05 | % | 1.05 | % | 1.15 | % | ||||||||||
Net investment income (loss) | (0.12 | )% | (0.08 | )% | 0.22 | % | 0.62 | % | (0.00 | )%(7) | ||||||||||
Portfolio Turnover of the Portfolio(8) | 20 | %(10) | 50 | % | 60 | % | 55 | % | 38 | % | ||||||||||
Portfolio Turnover of the Fund | 28 | %(9)(10) | — | — | — | — | ||||||||||||||
| (1) | Computed using average shares outstanding. |
| (2) | Amount is less than $(0.0005). |
| (3) | Returns are historical and are calculated by determining the percentage change in net asset value with all distributions reinvested and do not reflect the effect of sales charges. |
| (4) | The administrator reimbursed certain operating expenses (equal to 0.04%, 0.06%, 0.08%, 0.07% and 0.12% of average daily net assets for the years ended December 31, 2018, 2017, 2016, 2015 and 2014, respectively). Absent this reimbursement, total return would be lower. |
| (5) | Includes the Fund’s share of the Portfolio’s allocated expenses for the period while the Fund was investing in the Portfolio. |
| (6) | Excludes the effect of custody fee credits, if any, of less than 0.005%. Effective September 1, 2015, custody fee credits, which were earned on cash deposit balances, were discontinued by the custodian. |
| (7) | Amount is less than (0.005)%. |
| (8) | Portfolio turnover represents the rate of portfolio activity for the period while the Fund was investing in the Portfolio. |
| (9) | For the period from May 14, 2018 through December 31, 2018 when the Fund was making investments directly in securities. |
| (10) | Not annualized. |
| 12 | See Notes to Financial Statements. |
Eaton Vance
Growth Fund
December 31, 2018
Financial Highlights — continued
| Class C | ||||||||||||||||||||
| Year Ended December 31, | ||||||||||||||||||||
| 2018 | 2017 | 2016 | 2015 | 2014 | ||||||||||||||||
Net asset value — Beginning of year | $ | 22.870 | $ | 19.410 | $ | 19.460 | $ | 19.230 | $ | 18.920 | ||||||||||
| Income (Loss) From Operations | ||||||||||||||||||||
Net investment loss(1) | $ | (0.214 | ) | $ | (0.183 | ) | $ | (0.101 | ) | $ | (0.025 | ) | $ | (0.149 | ) | |||||
Net realized and unrealized gain | 0.311 | 4.923 | 0.394 | 1.222 | 2.598 | |||||||||||||||
Total income from operations | $ | 0.097 | $ | 4.740 | $ | 0.293 | $ | 1.197 | $ | 2.449 | ||||||||||
| Less Distributions | ||||||||||||||||||||
From net realized gain | $ | (3.307 | ) | $ | (1.280 | ) | $ | (0.343 | ) | $ | (0.967 | ) | $ | (2.139 | ) | |||||
Total distributions | $ | (3.307 | ) | $ | (1.280 | ) | $ | (0.343 | ) | $ | (0.967 | ) | $ | (2.139 | ) | |||||
Net asset value — End of year | $ | 19.660 | $ | 22.870 | $ | 19.410 | $ | 19.460 | $ | 19.230 | ||||||||||
Total Return(2)(3) | (0.43 | )% | 24.45 | % | 1.57 | % | 6.20 | % | 13.41 | % | ||||||||||
| Ratios/Supplemental Data | ||||||||||||||||||||
Net assets, end of year (000’s omitted) | $ | 35,061 | $ | 41,450 | $ | 41,272 | $ | 48,285 | $ | 30,552 | ||||||||||
Ratios (as a percentage of average daily net assets):(4) | ||||||||||||||||||||
Expenses(3)(5) | 1.80 | % | 1.80 | % | 1.80 | % | 1.80 | % | 1.90 | % | ||||||||||
Net investment loss | (0.87 | )% | (0.83 | )% | (0.53 | )% | (0.13 | )% | (0.75 | )% | ||||||||||
Portfolio Turnover of the Portfolio(6) | 20 | %(8) | 50 | % | 60 | % | 55 | % | 38 | % | ||||||||||
Portfolio Turnover of the Fund | 28 | %(7)(8) | — | — | — | — | ||||||||||||||
| (1) | Computed using average shares outstanding. |
| (2) | Returns are historical and are calculated by determining the percentage change in net asset value with all distributions reinvested and do not reflect the effect of sales charges. |
| (3) | The administrator reimbursed certain operating expenses (equal to 0.04%, 0.06%, 0.08%, 0.07% and 0.12% of average daily net assets for the years ended December 31, 2018, 2017, 2016, 2015 and 2014, respectively). Absent this reimbursement, total return would be lower. |
| (4) | Includes the Fund’s share of the Portfolio’s allocated expenses for the period while the Fund was investing in the Portfolio. |
| (5) | Excludes the effect of custody fee credits, if any, of less than 0.005%. Effective September 1, 2015, custody fee credits, which were earned on cash deposit balances, were discontinued by the custodian. |
| (6) | Portfolio turnover represents the rate of portfolio activity for the period while the Fund was investing in the Portfolio. |
| (7) | For the period from May 14, 2018 through December 31, 2018 when the Fund was making investments directly in securities. |
| (8) | Not annualized. |
| 13 | See Notes to Financial Statements. |
Eaton Vance
Growth Fund
December 31, 2018
Financial Highlights — continued
| Class I | ||||||||||||||||||||
| Year Ended December 31, | ||||||||||||||||||||
| 2018 | 2017 | 2016 | 2015 | 2014 | ||||||||||||||||
Net asset value — Beginning of year | $ | 27.340 | $ | 22.850 | $ | 22.760 | $ | 22.120 | $ | 21.250 | ||||||||||
| Income (Loss) From Operations | ||||||||||||||||||||
Net investment income(1) | $ | 0.040 | $ | 0.043 | $ | 0.108 | $ | 0.192 | $ | 0.056 | ||||||||||
Net realized and unrealized gain | 0.307 | 5.820 | 0.461 | 1.415 | 2.953 | |||||||||||||||
Total income from operations | $ | 0.347 | $ | 5.863 | $ | 0.569 | $ | 1.607 | $ | 3.009 | ||||||||||
| Less Distributions | �� | |||||||||||||||||||
From net investment income | $ | — | $ | (0.093 | ) | $ | (0.136 | ) | $ | — | $ | — | ||||||||
From net realized gain | (3.307 | ) | (1.280 | ) | (0.343 | ) | (0.967 | ) | (2.139 | ) | ||||||||||
Total distributions | $ | (3.307 | ) | $ | (1.373 | ) | $ | (0.479 | ) | $ | (0.967 | ) | $ | (2.139 | ) | |||||
Net asset value — End of year | $ | 24.380 | $ | 27.340 | $ | 22.850 | $ | 22.760 | $ | 22.120 | ||||||||||
Total Return(2)(3) | 0.56 | % | 25.72 | % | 2.59 | % | 7.26 | % | 14.58 | % | ||||||||||
| Ratios/Supplemental Data | ||||||||||||||||||||
Net assets, end of year (000’s omitted) | $ | 78,812 | $ | 78,775 | $ | 61,036 | $ | 58,746 | $ | 32,051 | ||||||||||
Ratios (as a percentage of average daily net assets):(4) | ||||||||||||||||||||
Expenses(3)(5) | 0.80 | % | 0.80 | % | 0.80 | % | 0.80 | % | 0.90 | % | ||||||||||
Net investment income | 0.14 | % | 0.16 | % | 0.48 | % | 0.84 | % | 0.25 | % | ||||||||||
Portfolio Turnover of the Portfolio(6) | 20 | %(8) | 50 | % | 60 | % | 55 | % | 38 | % | ||||||||||
Portfolio Turnover of the Fund | 28 | %(7)(8) | — | — | — | — | ||||||||||||||
| (1) | Computed using average shares outstanding. |
| (2) | Returns are historical and are calculated by determining the percentage change in net asset value with all distributions reinvested. |
| (3) | The administrator reimbursed certain operating expenses (equal to 0.04%, 0.06%, 0.08%, 0.07% and 0.12% of average daily net assets for the years ended December 31, 2018, 2017, 2016, 2015 and 2014, respectively). Absent this reimbursement, total return would be lower. |
| (4) | Includes the Fund’s share of the Portfolio’s allocated expenses for the period while the Fund was investing in the Portfolio. |
| (5) | Excludes the effect of custody fee credits, if any, of less than 0.005%. Effective September 1, 2015, custody fee credits, which were earned on cash deposit balances, were discontinued by the custodian. |
| (6) | Portfolio turnover represents the rate of portfolio activity for the period while the Fund was investing in the Portfolio. |
| (7) | For the period from May 14, 2018 through December 31, 2018 when the Fund was making investments directly in securities. |
| (8) | Not annualized. |
| 14 | See Notes to Financial Statements. |
Eaton Vance
Growth Fund
December 31, 2018
Financial Highlights — continued
| Class R | ||||||||||||||||||||
| Year Ended December 31, | ||||||||||||||||||||
| 2018 | 2017 | 2016 | 2015 | 2014 | ||||||||||||||||
Net asset value — Beginning of year | $ | 26.090 | $ | 21.880 | $ | 21.800 | $ | 21.320 | $ | 20.660 | ||||||||||
| Income (Loss) From Operations | ||||||||||||||||||||
Net investment income (loss)(1) | $ | (0.104 | ) | $ | (0.082 | ) | $ | (0.010 | ) | $ | 0.059 | $ | (0.052 | ) | ||||||
Net realized and unrealized gain | 0.301 | 5.572 | 0.439 | 1.388 | 2.851 | |||||||||||||||
Total income from operations | $ | 0.197 | $ | 5.490 | $ | 0.429 | $ | 1.447 | $ | 2.799 | ||||||||||
| Less Distributions | ||||||||||||||||||||
From net investment income | $ | — | $ | — | $ | (0.006 | ) | $ | — | $ | — | |||||||||
From net realized gain | (3.307 | ) | (1.280 | ) | (0.343 | ) | (0.967 | ) | (2.139 | ) | ||||||||||
Total distributions | $ | (3.307 | ) | $ | (1.280 | ) | $ | (0.349 | ) | $ | (0.967 | ) | $ | (2.139 | ) | |||||
Net asset value — End of year | $ | 22.980 | $ | 26.090 | $ | 21.880 | $ | 21.800 | $ | 21.320 | ||||||||||
Total Return(2)(3) | 0.01 | % | 25.12 | % | 2.03 | % | 6.77 | % | 13.98 | % | ||||||||||
| Ratios/Supplemental Data | ||||||||||||||||||||
Net assets, end of year (000’s omitted) | $ | 3,030 | $ | 3,447 | $ | 3,217 | $ | 4,186 | $ | 2,932 | ||||||||||
Ratios (as a percentage of average daily net assets):(4) | ||||||||||||||||||||
Expenses(3)(5) | 1.30 | % | 1.30 | % | 1.30 | % | 1.30 | % | 1.40 | % | ||||||||||
Net investment income (loss) | (0.37 | )% | (0.33 | )% | (0.05 | )% | 0.27 | % | (0.24 | )% | ||||||||||
Portfolio Turnover of the Portfolio(6) | 20 | %(8) | 50 | % | 60 | % | 55 | % | 38 | % | ||||||||||
Portfolio Turnover of the Fund | �� | 28 | %(7)(8) | — | — | — | — | |||||||||||||
| (1) | Computed using average shares outstanding. |
| (2) | Returns are historical and are calculated by determining the percentage change in net asset value with all distributions reinvested. |
| (3) | The administrator reimbursed certain operating expenses (equal to 0.04%, 0.06%, 0.08%, 0.07% and 0.12% of average daily net assets for the years ended December 31, 2018, 2017, 2016, 2015 and 2014, respectively). Absent this reimbursement, total return would be lower. |
| (4) | Includes the Fund’s share of the Portfolio’s allocated expenses for the period while the Fund was investing in the Portfolio. |
| (5) | Excludes the effect of custody fee credits, if any, of less than 0.005%. Effective September 1, 2015, custody fee credits, which were earned on cash deposit balances, were discontinued by the custodian. |
| (6) | Portfolio turnover represents the rate of portfolio activity for the period while the Fund was investing in the Portfolio. |
| (7) | For the period from May 14, 2018 through December 31, 2018 when the Fund was making investments directly in securities. |
| (8) | Not annualized. |
| 15 | See Notes to Financial Statements. |
Eaton Vance
Growth Fund
December 31, 2018
Notes to Financial Statements
1 Significant Accounting Policies
Eaton Vance Growth Fund (the Fund) is a diversified series of Eaton Vance Special Investment Trust (the Trust). The Trust is a Massachusetts business trust registered under the Investment Company Act of 1940, as amended (the 1940 Act), as an open-end management investment company. The Fund’s investment objective is to seek total return. Prior to the close of business on May 11, 2018, the Fund invested all of its investable assets in interests in Growth Portfolio (the Portfolio), a Massachusetts business trust, having the same investment objective and policies as the Fund. As of the close of business on May 11, 2018, the Fund received its pro-rata share of net assets from the Portfolio as part of the termination of the Portfolio. As of May 14, 2018, the next business day, the Fund invests its assets directly. The Fund offers four classes of shares. Class A shares are generally sold subject to a sales charge imposed at time of purchase. Class C shares are sold at net asset value and are generally subject to a contingent deferred sales charge (see Note 5). Class I and Class R shares are sold at net asset value and are not subject to a sales charge. Effective January 25, 2019, Class C shares generally will automatically convert to Class A shares ten years after their purchase as described in the Fund’s prospectus. Each class represents a pro-rata interest in the Fund, but votes separately on class-specific matters and (as noted below) is subject to different expenses. Realized and unrealized gains and losses and net investment income and losses, other than class-specific expenses, are allocated daily to each class of shares based on the relative net assets of each class to the total net assets of the Fund. Each class of shares differs in its distribution plan and certain other class-specific expenses.
The following is a summary of significant accounting policies of the Fund. The policies are in conformity with accounting principles generally accepted in the United States of America (U.S. GAAP). The Fund is an investment company and follows accounting and reporting guidance in the Financial Accounting Standards Board (FASB) Accounting Standards Codification Topic 946.
A Investment Valuation — The following methodologies are used to determine the market value or fair value of investments.
Equity Securities. Equity securities listed on a U.S. securities exchange generally are valued at the last sale or closing price on the day of valuation or, if no sales took place on such date, at the mean between the closing bid and ask prices on the exchange where such securities are principally traded. Equity securities listed on the NASDAQ Global or Global Select Market generally are valued at the NASDAQ official closing price. Unlisted or listed securities for which closing sales prices or closing quotations are not available are valued at the mean between the latest available bid and ask prices.
Foreign Securities and Currencies. Foreign securities and currencies are valued in U.S. dollars, based on foreign currency exchange rate quotations supplied by a third party pricing service. The pricing service uses a proprietary model to determine the exchange rate. Inputs to the model include reported trades and implied bid/ask spreads. The daily valuation of exchange-traded foreign securities generally is determined as of the close of trading on the principal exchange on which such securities trade. Events occurring after the close of trading on foreign exchanges may result in adjustments to the valuation of foreign securities to more accurately reflect their fair value as of the close of regular trading on the New York Stock Exchange. When valuing foreign equity securities that meet certain criteria, the Fund’s Trustees have approved the use of a fair value service that values such securities to reflect market trading that occurs after the close of the applicable foreign markets of comparable securities or other instruments that have a strong correlation to the fair-valued securities.
Affiliated Fund. The Fund may invest in Eaton Vance Cash Reserves Fund, LLC (Cash Reserves Fund), an affiliated investment company managed by Eaton Vance Management (EVM). While Cash Reserves Fund is not a registered money market mutual fund, it conducts all of its investment activities in accordance with the requirements of Rule 2a-7 under the 1940 Act. Investments in Cash Reserves Fund are valued at the closing net asset value per unit on the valuation day. Cash Reserves Fund generally values its investment securities based on available market quotations provided by a third party pricing service.
Fair Valuation. Investments for which valuations or market quotations are not readily available or are deemed unreliable are valued at fair value using methods determined in good faith by or at the direction of the Trustees of the Fund in a manner that fairly reflects the security’s value, or the amount that the Fund might reasonably expect to receive for the security upon its current sale in the ordinary course. Each such determination is based on a consideration of relevant factors, which are likely to vary from one pricing context to another. These factors may include, but are not limited to, the type of security, the existence of any contractual restrictions on the security’s disposition, the price and extent of public trading in similar securities of the issuer or of comparable companies or entities, quotations or relevant information obtained from broker/dealers or other market participants, information obtained from the issuer, analysts, and/or the appropriate stock exchange (for exchange-traded securities), an analysis of the company’s or entity’s financial condition, and an evaluation of the forces that influence the issuer and the market(s) in which the security is purchased and sold.
B Investment Transactions — Investment transactions for financial statement purposes are accounted for on a trade date basis. Realized gains and losses on investments sold are determined on the basis of identified cost.
C Income — Dividend income is recorded on the ex-dividend date for dividends received in cash and/or securities. Withholding taxes on foreign dividends and capital gains have been provided for in accordance with the Fund’s understanding of the applicable countries’ tax rules and rates. Prior to the close of business on May 11, 2018, the net investment income or loss consisted of the Fund’s pro-rata share of the net investment income or loss of the Portfolio, less all actual and accrued expenses of the Fund.
D Federal Taxes — The Fund’s policy is to comply with the provisions of the Internal Revenue Code applicable to regulated investment companies and to distribute to shareholders each year substantially all of its net investment income, and all or substantially all of its net realized capital gains. Accordingly, no provision for federal income or excise tax is necessary.
| 16 |
Eaton Vance
Growth Fund
December 31, 2018
Notes to Financial Statements — continued
As of December 31, 2018, the Fund had no uncertain tax positions that would require financial statement recognition, de-recognition, or disclosure. The Fund files a U.S. federal income tax return annually after its fiscal year-end, which is subject to examination by the Internal Revenue Service for a period of three years from the date of filing.
E Expenses — The majority of expenses of the Trust are directly identifiable to an individual fund. Expenses which are not readily identifiable to a specific fund are allocated taking into consideration, among other things, the nature and type of expense and the relative size of the funds.
F Foreign Currency Translation — Investment valuations, other assets, and liabilities initially expressed in foreign currencies are translated each business day into U.S. dollars based upon current exchange rates. Purchases and sales of foreign investment securities and income and expenses denominated in foreign currencies are translated into U.S. dollars based upon currency exchange rates in effect on the respective dates of such transactions. Recognized gains or losses on investment transactions attributable to changes in foreign currency exchange rates are recorded for financial statement purposes as net realized gains and losses on investments. That portion of unrealized gains and losses on investments that results from fluctuations in foreign currency exchange rates is not separately disclosed.
G Use of Estimates — The preparation of the financial statements in conformity with U.S. GAAP requires management to make estimates and assumptions that affect the reported amounts of assets and liabilities at the date of the financial statements and the reported amounts of income and expense during the reporting period. Actual results could differ from those estimates.
H Indemnifications — Under the Trust’s organizational documents, its officers and Trustees may be indemnified against certain liabilities and expenses arising out of the performance of their duties to the Fund. Under Massachusetts law, if certain conditions prevail, shareholders of a Massachusetts business trust (such as the Trust) could be deemed to have personal liability for the obligations of the Trust. However, the Trust’s Declaration of Trust contains an express disclaimer of liability on the part of Fund shareholders and the By-laws provide that the Trust shall assume the defense on behalf of any Fund shareholders. Moreover, the By-laws also provide for indemnification out of Fund property of any shareholder held personally liable solely by reason of being or having been a shareholder for all loss or expense arising from such liability. Additionally, in the normal course of business, the Fund enters into agreements with service providers that may contain indemnification clauses. The Fund’s maximum exposure under these arrangements is unknown as this would involve future claims that may be made against the Fund that have not yet occurred.
2 Distributions to Shareholders and Income Tax Information
It is the present policy of the Fund to make at least one distribution annually (normally in December) of all or substantially all of its net investment income and to distribute annually all or substantially all of its net realized capital gains. Distributions to shareholders are recorded on the ex-dividend date. Distributions are declared separately for each class of shares. Shareholders may reinvest income and capital gain distributions in additional shares of the same class of the Fund at the net asset value as of the ex-dividend date or, at the election of the shareholder, receive distributions in cash. Distributions to shareholders are determined in accordance with income tax regulations, which may differ from U.S. GAAP. As required by U.S. GAAP, only distributions in excess of tax basis earnings and profits are reported in the financial statements as a return of capital. Permanent differences between book and tax accounting relating to distributions are reclassified to paid-in capital. For tax purposes, distributions from short-term capital gains are considered to be from ordinary income.
The tax character of distributions declared for the years ended December 31, 2018 and December 31, 2017 was as follows:
| Year Ended December 31, | ||||||||
| 2018 | 2017 | |||||||
Ordinary income | $ | — | $ | 477,018 | ||||
Long-term capital gains | $ | 39,501,070 | $ | 15,601,260 | ||||
During the year ended December 31, 2018, distributable earnings was increased by $4,105,221 and paid-in capital was decreased by $4,105,221 due to distributions in excess for required excise distributions and differences between book and tax accounting, primarily for net operating losses, investments in partnerships and the Fund’s investment in the Portfolio. These reclassifications had no effect on the net assets or net asset value per share of the Fund.
As of December 31, 2018, the components of distributable earnings (accumulated loss) on a tax basis were as follows:
Post October capital losses | $ | (2,390,106 | ) | |
Net unrealized appreciation | $ | 101,766,929 | ||
At December 31, 2018, the Fund had a net capital loss of $2,390,106 attributable to security transactions incurred after October 31, 2018 that it has elected to defer. This net capital loss is treated as arising on the first day of the Fund’s taxable year ending December 31, 2019.
| 17 |
Eaton Vance
Growth Fund
December 31, 2018
Notes to Financial Statements — continued
The cost and unrealized appreciation (depreciation) of investments of the Fund at December 31, 2018, as determined on a federal income tax basis, were as follows:
Aggregate cost | $ | 205,513,366 | ||
Gross unrealized appreciation | $ | 110,329,555 | ||
Gross unrealized depreciation | (8,562,744 | ) | ||
Net unrealized appreciation | $ | 101,766,811 | ||
3 Investment Adviser Fee and Other Transactions with Affiliates
The investment adviser fee is earned by Boston Management and Research (BMR), a subsidiary of EVM, as compensation for investment advisory services rendered to the Fund. Pursuant to the investment advisory agreement dated May 11, 2018 between the Fund and BMR, the fee is computed at an annual rate of 0.65% of the Fund’s average daily net assets up to $500 million and is payable monthly. On net assets of $500 million and over, the annual fee is reduced. Prior to the close of business on May 11, 2018, when the Fund’s assets were invested in the Portfolio, the Fund was allocated its share of the Portfolio’s investment adviser fee. The Portfolio paid advisory fees to BMR on the same fee schedule as that of the Fund as described above. For the year ended December 31, 2018, the Fund’s allocated portion of the investment adviser fee paid by the Portfolio amounted to $815,923 and the investment adviser fee paid by the Fund amounted to $1,466,195. For the year ended December 31, 2018, the Fund’s investment adviser fee, including the investment adviser fee allocated from the Portfolio, was 0.65% of the Fund’s average daily net assets. The Fund invests its cash in Cash Reserves Fund. EVM does not currently receive a fee for advisory services provided to Cash Reserves Fund.
EVM serves as the administrator of the Fund, but currently receives no compensation. EVM has agreed to reimburse the Fund’s expenses to the extent that total annual operating expenses (relating to ordinary operating expenses only) exceed 1.05%, 1.80%, 0.80% and 1.30% of the Fund’s average daily net assets for Class A, Class C, Class I and Class R, respectively. This agreement may be changed or terminated after April 30, 2019. Pursuant to this agreement, EVM was allocated $128,396 of the Fund’s operating expenses for the year ended December 31, 2018.
EVM provides sub-transfer agency and related services to the Fund pursuant to a Sub-Transfer Agency Support Services Agreement. For the year ended December 31, 2018, EVM earned $86,799 from the Fund pursuant to such agreement, which is included in transfer and dividend disbursing agent fees on the Statement of Operations. The Fund was informed that Eaton Vance Distributors, Inc. (EVD), an affiliate of EVM and the Fund’s principal underwriter, received $18,019 as its portion of the sales charge on sales of Class A shares for the year ended December 31, 2018. EVD also received distribution and service fees from Class A, Class C and Class R shares (see Note 4) and contingent deferred sales charges (see Note 5).
Trustees and officers of the Fund who are members of EVM’s or BMR’s organizations receive remuneration for their services to the Fund out of the investment adviser fee. Trustees of the Fund who are not affiliated with the investment adviser may elect to defer receipt of all or a percentage of their annual fees in accordance with the terms of the Trustees Deferred Compensation Plan. For the year ended December 31, 2018, no significant amounts have been deferred. Certain officers and Trustees of the Fund are officers of the above organizations.
4 Distribution Plans
The Fund has in effect a distribution plan for Class A shares (Class A Plan) pursuant to Rule 12b-1 under the 1940 Act. Pursuant to the Class A Plan, the Fund pays EVD a distribution and service fee of 0.25% per annum of its average daily net assets attributable to Class A shares for distribution services and facilities provided to the Fund by EVD, as well as for personal services and/or the maintenance of shareholder accounts. Distribution and service fees paid or accrued to EVD for the year ended December 31, 2018 amounted to $547,088 for Class A shares. The Fund also has in effect distribution plans for Class C shares (Class C Plan) and Class R shares (Class R Plan) pursuant to Rule 12b-1 under the 1940 Act. Pursuant to the Class C Plan, the Fund pays EVD amounts equal to 0.75% per annum of its average daily net assets attributable to Class C shares for providing ongoing distribution services and facilities to the Fund. For the year ended December 31, 2018, the Fund paid or accrued to EVD $316,304 for Class C shares. The Class R Plan requires the Fund to pay EVD an amount up to 0.50% per annum of its average daily net assets attributable to Class R shares for providing ongoing distribution services and facilities to the Fund. The Trustees of the Trust have currently limited Class R distribution payments to 0.25% per annum of the average daily net assets attributable to Class R shares. For the year ended December 31, 2018, the Fund paid or accrued to EVD $9,025 for Class R shares.
Pursuant to the Class C and Class R Plans, the Fund also makes payments of service fees to EVD, financial intermediaries and other persons in amounts equal to 0.25% per annum of its average daily net assets attributable to that class. Service fees paid or accrued are for personal services and/or the maintenance of shareholder accounts. They are separate and distinct from the sales commissions and distribution fees payable to EVD. Service fees paid or accrued for the year ended December 31, 2018 amounted to $105,434 and $9,025 for Class C and Class R shares, respectively.
Distribution and service fees are subject to the limitations contained in the Financial Industry Regulatory Authority Rule 2341(d).
| 18 |
Eaton Vance
Growth Fund
December 31, 2018
Notes to Financial Statements — continued
5 Contingent Deferred Sales Charges
A contingent deferred sales charge (CDSC) of 1% generally is imposed on redemptions of Class C shares made within one year of purchase. Class A shares may be subject to a 1% CDSC if redeemed within 18 months of purchase (depending on the circumstances of purchase). Generally, the CDSC is based upon the lower of the net asset value at date of redemption or date of purchase. No charge is levied on shares acquired by reinvestment of dividends or capital gain distributions. For the year ended December 31, 2018, the Fund was informed that EVD received less than $100 and approximately $1,000 of CDSCs paid by Class A and Class C shareholders, respectively.
6 Purchases and Sales of Investments
Purchases and sales of investments by the Portfolio, other than short-term obligations and investments transferred to the Fund, for the period from January 1, 2018 through May 11, 2018 aggregated $68,217,266 and $79,472,784, respectively. Purchases and sales of investments by the Fund, other than short-term obligations and investments transferred from the Portfolio, for the period from May 14, 2018 through December 31, 2018 aggregated $98,418,864 and $115,640,078, respectively. Increases and decreases in the Fund’s investment in the Portfolio for the period from January 1, 2018 through May 11, 2018 were $2,793,641 and $366,650,976, respectively. Included in decreases is $352,496,467, representing the Fund’s interest in the Portfolio as of the close of business on May 11, 2018, which was exchanged for the Fund’s pro-rata share of net assets of the Portfolio on that date having the same fair value. The Fund’s cost of its investment in the Portfolio on such date of $210,676,761 was carried forward to the net assets acquired from the Portfolio and no gain or loss was recognized on the exchange.
7 Shares of Beneficial Interest
The Fund’s Declaration of Trust permits the Trustees to issue an unlimited number of full and fractional shares of beneficial interest (without par value). Such shares may be issued in a number of different series (such as the Fund) and classes. Transactions in Fund shares were as follows:
| Year Ended December 31, | ||||||||
| Class A | 2018 | 2017 | ||||||
Sales | 576,003 | 638,568 | ||||||
Issued to shareholders electing to receive payments of distributions in Fund shares | 885,772 | 345,274 | ||||||
Redemptions | (1,281,054 | ) | (1,818,551 | ) | ||||
Net increase (decrease) | 180,721 | (834,709 | ) | |||||
| Year Ended December 31, | ||||||||
| Class C | 2018 | 2017 | ||||||
Sales | 200,067 | 190,702 | ||||||
Issued to shareholders electing to receive payments of distributions in Fund shares | 231,293 | 88,765 | ||||||
Redemptions | (460,150 | ) | (593,625 | ) | ||||
Net decrease | (28,790 | ) | (314,158 | ) | ||||
| Year Ended December 31, | ||||||||
| Class I | 2018 | 2017 | ||||||
Sales | 730,159 | 1,031,313 | ||||||
Issued to shareholders electing to receive payments of distributions in Fund shares | 367,701 | 130,793 | ||||||
Redemptions | (746,214 | ) | (952,038 | ) | ||||
Net increase | 351,646 | 210,068 | ||||||
| 19 |
Eaton Vance
Growth Fund
December 31, 2018
Notes to Financial Statements — continued
| Year Ended December 31, | ||||||||
| Class R | 2018 | 2017 | ||||||
Sales | 27,438 | 29,282 | ||||||
Issued to shareholders electing to receive payments of distributions in Fund shares | 12,134 | 4,340 | ||||||
Redemptions | (39,918 | ) | (48,501 | ) | ||||
Net decrease | (346 | ) | (14,879 | ) | ||||
8 Line of Credit
The Fund participates with other portfolios and funds managed by EVM and its affiliates in a $625 million unsecured line of credit agreement with a group of banks, which is in effect through October 29, 2019. Borrowings are made by the Fund solely to facilitate the handling of unusual and/or unanticipated short-term cash requirements. Interest is charged to the Fund based on its borrowings at an amount above either the Eurodollar rate or Federal Funds rate. In addition, a fee computed at an annual rate of 0.15% on the daily unused portion of the line of credit is allocated among the participating portfolios and funds at the end of each quarter. Because the line of credit is not available exclusively to the Fund, it may be unable to borrow some or all of its requested amounts at any particular time. The Fund did not have any significant borrowings or allocated fees during the year ended December 31, 2018.
9 Securities Lending Agreement
The Fund has established a securities lending agreement with State Street Bank and Trust Company (SSBT) as securities lending agent in which the Fund lends portfolio securities to qualified borrowers in exchange for collateral consisting of either cash or securities issued or guaranteed by the U.S. Government or its agencies or instrumentalities in an amount at least equal to the market value of the securities on loan. The market value of securities loaned is determined daily and any additional required collateral is delivered to the Fund on the next business day. Cash collateral is invested in the State Street Navigator Securities Lending Government Money Market Portfolio, a money market fund registered under the 1940 Act. The Fund earns interest on the amount invested but it must pay (and at times receive from) the broker a loan rebate fee computed as a varying percentage of the collateral received. For security loans secured by non-cash collateral, the Fund earns a negotiated lending fee from the borrower. A portion of the income earned by the Fund from its investment of cash collateral, net of rebate fees, and lending fees received is allocated to SSBT for its services as lending agent and the portion allocated to the Fund is presented as securities lending income, net on the Statement of Operations. Non-cash collateral is held by the lending agent on behalf of the Fund and cannot be sold or re-pledged by the Fund; accordingly, such collateral is not reflected in the Statement of Assets and Liabilities.
The Fund is subject to possible delay in the recovery of loaned securities. Pursuant to the securities lending agreement, SSBT has provided indemnification to the Fund in the event of default by a borrower with respect to a loan. The Fund bears the risk of loss with respect to the investment of cash collateral.
At December 31, 2018, the value of the securities loaned (all common stock) and the value of the collateral received, which exceeded the value of the securities loaned, amounted to $18,564,415 and $18,786,776, respectively. Collateral received was comprised of non-cash U.S. Government securities. The securities lending transactions have no contractual maturity date and each of the Fund and borrower has the option to terminate a loan at any time.
10 Fair Value Measurements
Under generally accepted accounting principles for fair value measurements, a three-tier hierarchy to prioritize the assumptions, referred to as inputs, is used in valuation techniques to measure fair value. The three-tier hierarchy of inputs is summarized in the three broad levels listed below.
| • | Level 1 – quoted prices in active markets for identical investments |
| • | Level 2 – other significant observable inputs (including quoted prices for similar investments, interest rates, prepayment speeds, credit risk, etc.) |
| • | Level 3 – significant unobservable inputs (including a fund’s own assumptions in determining the fair value of investments) |
In cases where the inputs used to measure fair value fall in different levels of the fair value hierarchy, the level disclosed is determined based on the lowest level input that is significant to the fair value measurement in its entirety. The inputs or methodology used for valuing securities are not necessarily an indication of the risk associated with investing in those securities.
| 20 |
Eaton Vance
Growth Fund
December 31, 2018
Notes to Financial Statements — continued
At December 31, 2018, the hierarchy of inputs used in valuing the Fund’s investments, which are carried at value, were as follows:
| Asset Description | Level 1 | Level 2 | Level 3 | Total | ||||||||||||
Common Stocks | $ | 306,570,901 | * | $ | — | $ | — | $ | 306,570,901 | |||||||
Short-Term Investments | — | 709,276 | — | 709,276 | ||||||||||||
Total Investments | $ | 306,570,901 | $ | 709,276 | $ | — | $ | 307,280,177 | ||||||||
| * | The level classification by major category of investments is the same as the category presentation in the Portfolio of Investments. |
| 21 |
Eaton Vance
Growth Fund
December 31, 2018
Report of Independent Registered Public Accounting Firm
To the Trustees of Eaton Vance Special Investment Trust and Shareholders of Eaton Vance Growth Fund:
Opinion on the Financial Statements and Financial Highlights
We have audited the accompanying statement of assets and liabilities of Eaton Vance Growth Fund (the “Fund”) (one of the funds constituting Eaton Vance Special Investment Trust), including the portfolio of investments, as of December 31, 2018, the related statement of operations for the year then ended, the statements of changes in net assets for each of the two years in the period then ended, the financial highlights for each of the five years in the period then ended, and the related notes. In our opinion, the financial statements and financial highlights present fairly, in all material respects, the financial position of the Fund as of December 31, 2018, and the results of its operations for the year then ended, the changes in its net assets for each of the two years in the period then ended, and the financial highlights for each of the five years in the period then ended, in conformity with accounting principles generally accepted in the United States of America.
Basis for Opinion
These financial statements and financial highlights are the responsibility of the Fund’s management. Our responsibility is to express an opinion on the Fund’s financial statements and financial highlights based on our audits. We are a public accounting firm registered with the Public Company Accounting Oversight Board (United States) (PCAOB) and are required to be independent with respect to the Fund in accordance with the U.S. federal securities laws and the applicable rules and regulations of the Securities and Exchange Commission and the PCAOB.
We conducted our audits in accordance with the standards of the PCAOB. Those standards require that we plan and perform the audit to obtain reasonable assurance about whether the financial statements and financial highlights are free of material misstatement, whether due to error or fraud. The Fund is not required to have, nor were we engaged to perform, an audit of its internal control over financial reporting. As part of our audits we are required to obtain an understanding of internal control over financial reporting but not for the purpose of expressing an opinion on the effectiveness of the Fund’s internal control over financial reporting. Accordingly, we express no such opinion.
Our audits included performing procedures to assess the risks of material misstatement of the financial statements and financial highlights, whether due to error or fraud, and performing procedures that respond to those risks. Such procedures included examining, on a test basis, evidence regarding the amounts and disclosures in the financial statements and financial highlights. Our audits also included evaluating the accounting principles used and significant estimates made by management, as well as evaluating the overall presentation of the financial statements and financial highlights. Our procedures included confirmation of securities owned as of December 31, 2018, by correspondence with the custodian and brokers; when replies were not received from brokers, we performed other auditing procedures. We believe that our audits provide a reasonable basis for our opinion.
/s/ Deloitte & Touche LLP
Boston, Massachusetts
February 19, 2019
We have served as the auditor of one or more Eaton Vance investment companies since 1959.
| 22 |
Eaton Vance
Growth Fund
December 31, 2018
Federal Tax Information (Unaudited)
The Form 1099-DIV you received in February 2019 showed the tax status of all distributions paid to your account in calendar year 2018. Shareholders are advised to consult their own tax adviser with respect to the tax consequences of their investment in the Fund. As required by the Internal Revenue Code and/or regulations, shareholders must be notified regarding the status of capital gains dividends.
Capital Gains Dividends. The Fund hereby designates as a capital gain dividend with respect to the taxable year ended December 31, 2018, $35,923,404 or, if subsequently determined to be different, the net capital gain of such year.
| 23 |
Eaton Vance
Growth Fund
December 31, 2018
Special Meeting of Shareholders (Unaudited)
The Fund held a Special Meeting of Shareholders on September 20, 2018 to elect the five Trustees listed below. The other Trustees named herein continue to serve as Trustees. The results of the vote with respect to the Fund were as follows:
| Number of Shares | ||||||||
| Nominee for Trustee | For | Withheld | ||||||
Mark R. Fetting | 8,835,842 | 209,807 | ||||||
Keith Quinton | 8,842,898 | 202,751 | ||||||
Marcus L. Smith | 8,842,743 | 202,906 | ||||||
Susan J. Sutherland | 8,886,821 | 158,828 | ||||||
Scott E. Wennerholm | 8,842,810 | 202,839 | ||||||
Results are rounded to the nearest whole number.
| 24 |
Eaton Vance
Growth Fund
December 31, 2018
Management and Organization
Fund Management. The Trustees of Eaton Vance Special Investment Trust (the Trust) are responsible for the overall management and supervision of the Trust’s affairs. The Trustees and officers of the Trust are listed below. Except as indicated, each individual has held the office shown or other offices in the same company for the last five years. Trustees and officers of the Trust hold indefinite terms of office. The “noninterested Trustees” consist of those Trustees who are not “interested persons” of the Trust, as that term is defined under the 1940 Act. The business address of each Trustee and officer is Two International Place, Boston, Massachusetts 02110. As used below, “EVC” refers to Eaton Vance Corp., “EV” refers to Eaton Vance, Inc., “EVM” refers to Eaton Vance Management, “BMR” refers to Boston Management and Research and “EVD” refers to Eaton Vance Distributors, Inc. EVC and EV are the corporate parent and trustee, respectively, of EVM and BMR. EVD is the Fund’s principal underwriter, the Portfolio’s placement agent and a wholly-owned subsidiary of EVC. Each officer affiliated with Eaton Vance may hold a position with other Eaton Vance affiliates that is comparable to his or her position with EVM listed below. Each Trustee oversees 175 portfolios in the Eaton Vance Complex (including all master and feeder funds in a master feeder structure). Each officer serves as an officer of certain other Eaton Vance funds. Each Trustee and officer serves until his or her successor is elected.
| Name and Year of Birth | Position(s) with the Trust | Trustee Since(1) | Principal Occupation(s) and Directorships During Past Five Years and Other Relevant Experience | |||
| Interested Trustee | ||||||
Thomas E. Faust Jr. 1958 | Trustee | 2007 | Chairman, Chief Executive Officer and President of EVC, Director and President of EV, Chief Executive Officer and President of EVM and BMR, and Director of EVD. Trustee and/or officer of 175 registered investment companies. Mr. Faust is an interested person because of his positions with EVM, BMR, EVD, EVC and EV, which are affiliates of the Trust. Directorships in the Last Five Years.(2) Director of EVC and Hexavest Inc. (investment management firm). | |||
| Noninterested Trustees | ||||||
Mark R. Fetting 1954 | Trustee | 2016 | Private investor. Formerly held various positions at Legg Mason, Inc. (investment management firm) (2000-2012), including President, Chief Executive Officer, Director and Chairman (2008-2012), Senior Executive Vice President (2004-2008) and Executive Vice President (2001-2004). Formerly, President of Legg Mason family of funds (2001-2008). Formerly, Division President and Senior Officer of Prudential Financial Group, Inc. and related companies (investment management firm)(1991-2000). Directorships in the Last Five Years. None. | |||
Cynthia E. Frost 1961 | Trustee | 2014 | Private investor. Formerly, Chief Investment Officer of Brown University (university endowment) (2000-2012). Formerly, Portfolio Strategist for Duke Management Company (university endowment manager) (1995-2000). Formerly, Managing Director, Cambridge Associates (investment consulting company) (1989-1995). Formerly, Consultant, Bain and Company (management consulting firm) (1987-1989). Formerly, Senior Equity Analyst, BA Investment Management Company (1983-1985). Directorships in the Last Five Years. None. | |||
George J. Gorman 1952 | Trustee | 2014 | Principal at George J. Gorman LLC (consulting firm). Formerly, Senior Partner at Ernst & Young LLP (a registered public accounting firm) (1974-2009). Directorships in the Last Five Years. Formerly, Trustee of the BofA Funds Series Trust (11 funds) (2011-2014) and of the Ashmore Funds (9 funds) (2010-2014). | |||
Valerie A. Mosley 1960 | Trustee | 2014 | Chairwoman and Chief Executive Officer of Valmo Ventures (a consulting and investment firm). Former Partner and Senior Vice President, Portfolio Manager and Investment Strategist at Wellington Management Company, LLP (investment management firm) (1992-2012). Former Chief Investment Officer, PG Corbin Asset Management (1990-1992). Formerly worked in institutional corporate bond sales at Kidder Peabody (1986-1990). Directorships in the Last Five Years.(2) Director of Envestnet, Inc. (provider of intelligent systems for wealth management and financial wellness) (since 2018). | |||
| 25 |
Eaton Vance
Growth Fund
December 31, 2018
Management and Organization — continued
| Name and Year of Birth | Position(s) with the Trust | Trustee Since(1) | Principal Occupation(s) and Directorships During Past Five Years and Other Relevant Experience | |||
| Noninterested Trustees (continued) | ||||||
William H. Park 1947 | Chairperson of the Board and Trustee | 2016 (Chairperson) 2003 (Trustee) | Private investor. Formerly, Consultant (management and transactional)(2012-2014). Formerly, Chief Financial Officer, Aveon Group L.P. (investment management firm) (2010-2011). Formerly, Vice Chairman, Commercial Industrial Finance Corp. (specialty finance company) (2006-2010). Formerly, President and Chief Executive Officer, Prizm Capital Management, LLC (investment management firm) (2002-2005). Formerly, Executive Vice President and Chief Financial Officer, United Asset Management Corporation (investment management firm) (1982-2001). Formerly, Senior Manager, Price Waterhouse (now PricewaterhouseCoopers) (a registered public accounting firm)(1972-1981). Directorships in the Last Five Years.(2) None. | |||
Helen Frame Peters 1948 | Trustee | 2008 | Professor of Finance, Carroll School of Management, Boston College. Formerly, Dean, Carroll School of Management, Boston College (2000-2002). Formerly, Chief Investment Officer, Fixed Income, Scudder Kemper Investments (investment management firm) (1998-1999). Formerly, Chief Investment Officer, Equity and Fixed Income, Colonial Management Associates (investment management firm) (1991-1998). Directorships in the Last Five Years.(2) None. | |||
Keith Quinton(3) 1958 | Trustee | 2018 | Independent Investment Committee Member at New Hampshire Retirement System (since 2017). Advisory Committee member at Northfield Information Services, Inc. (risk management analytics provider) (since 2016). Formerly, Portfolio Manager and Senior Quantitative Analyst at Fidelity Investments (investment management firm)(2001-2014). Directorships in the Last Five Years. Director of New Hampshire Municipal Bond Bank (since 2016). | |||
Marcus L. Smith(3) 1966 | Trustee | 2018 | Member of Posse Boston Advisory Board (foundation) (since 2015); Trustee at University of Mount Union (since 2008). Formerly, Portfolio Manager at MFS Investment Management (investment management firm) (1994-2017). Directorships in the Last Five Years. Director of MSCI Inc. (global provider of investment decision support tools) (since 2017). Director of DCT Industrial Trust Inc. (logistics real estate company) (since 2017). | |||
Susan J. Sutherland 1957 | Trustee | 2015 | Private investor. Formerly, Associate, Counsel and Partner at Skadden, Arps, Slate, Meagher & Flom LLP (law firm) (1982-2013). Directorships in the Last Five Years. Formerly, Director of Montpelier Re Holdings Ltd. (global provider of customized insurance and reinsurance products) (2013-2015). | |||
Scott E. Wennerholm 1959 | Trustee | 2016 | Formerly, Trustee at Wheelock College (postsecondary institution) (2012-2018). Formerly, Consultant at GF Parish Group (executive recruiting firm) (2016-2017). Formerly, Chief Operating Officer and Executive Vice President at BNY Mellon Asset Management (investment management firm) (2005-2011). Formerly, Chief Operating Officer and Chief Financial Officer at Natixis Global Asset Management (investment management firm) (1997-2004). Formerly, Vice President at Fidelity Investments Institutional Services (investment management firm) (1994-1997). Directorships in the Last Five Years. None. | |||
| Name and Year of Birth | Position(s) with the Trust | Officer Since(4) | Principal Occupation(s) During Past Five Years | |||
| Principal Officers who are not Trustees | ||||||
Payson F. Swaffield 1956 | President of the Trust | 2003 | Vice President and Chief Income Investment Officer of EVM and BMR. Also Vice President of Calvert Research and Management (“CRM”). | |||
Maureen A. Gemma 1960 | Vice President, Secretary and Chief Legal Officer | 2005 | Vice President of EVM and BMR. Also Vice President of CRM. | |||
| 26 |
Eaton Vance
Growth Fund
December 31, 2018
Management and Organization — continued
| Name and Year of Birth | Position(s) with the Trust | Officer Since(4) | Principal Occupation(s) During Past Five Years | |||
| Principal Officers who are not Trustees (continued) | ||||||
James F. Kirchner 1967 | Treasurer | 2007 | Vice President of EVM and BMR. Also Vice President of CRM. | |||
Richard F. Froio 1968 | Chief Compliance Officer | 2017 | Vice President of EVM and BMR since 2017. Formerly Deputy Chief Compliance Officer (Adviser/Funds) and Chief Compliance Officer (Distribution) at PIMCO (2012-2017) and Managing Director at BlackRock/Barclays Global Investors (2009-2012). | |||
| (1) | Year first appointed to serve as Trustee for a fund in the Eaton Vance family of funds. Each Trustee has served continuously since appointment unless indicated otherwise. |
| (2) | During their respective tenures, the Trustees (except for Mmes. Frost and Sutherland and Messrs. Fetting, Gorman, Quinton, Smith and Wennerholm) also served as Board members of one or more of the following funds (which operated in the years noted): eUnitsTM 2 Year U.S. Market Participation Trust: Upside to Cap / Buffered Downside (launched in 2012 and terminated in 2014); and eUnitsTM 2 Year U.S. Market Participation Trust II: Upside to Cap / Buffered Downside (launched in 2012 and terminated in 2014). However, Ms. Mosley did not serve as a Board member of eUnitsTM 2 Year U.S. Market Participation Trust: Upside to Cap / Buffered Downside (launched in 2012 and terminated in 2014). |
| (3) | Messrs. Quinton and Smith began serving as Trustees effective October 1, 2018. |
| (4) | Year first elected to serve as officer of a fund in the Eaton Vance family of funds when the officer has served continuously. Otherwise, year of most recent election as an officer of a fund in the Eaton Vance family of funds. Titles may have changed since initial election. |
The SAI for the Fund includes additional information about the Trustees and officers of the Fund can be obtained without charge on Eaton Vance’s website at www.eatonvance.com or by calling 1-800-262-1122.
| 27 |
Eaton Vance Funds
IMPORTANT NOTICES
Privacy. The Eaton Vance organization is committed to ensuring your financial privacy. Each of the financial institutions identified below has in effect the following policy (“Privacy Policy”) with respect to nonpublic personal information about its customers:
| • | Only such information received from you, through application forms or otherwise, and information about your Eaton Vance fund transactions will be collected. This may include information such as name, address, social security number, tax status, account balances and transactions. |
| • | None of such information about you (or former customers) will be disclosed to anyone, except as permitted by law (which includes disclosure to employees necessary to service your account). In the normal course of servicing a customer’s account, Eaton Vance may share information with unaffiliated third parties that perform various required services such as transfer agents, custodians and broker-dealers. |
| • | Policies and procedures (including physical, electronic and procedural safeguards) are in place that are designed to protect the confidentiality of such information. |
| • | We reserve the right to change our Privacy Policy at any time upon proper notification to you. Customers may want to review our Privacy Policy periodically for changes by accessing the link on our homepage: www.eatonvance.com. |
Our pledge of privacy applies to the following entities within the Eaton Vance organization: the Eaton Vance Family of Funds, Eaton Vance Management, Eaton Vance Investment Counsel, Eaton Vance Distributors, Inc., Eaton Vance Trust Company, Eaton Vance Management (International) Limited, Eaton Vance Advisers International Ltd., Eaton Vance Management’s Real Estate Investment Group and Boston Management and Research. In addition, our Privacy Policy applies only to those Eaton Vance customers who are individuals and who have a direct relationship with us. If a customer’s account (i.e., fund shares) is held in the name of a third-party financial advisor/broker-dealer, it is likely that only such advisor’s privacy policies apply to the customer. This notice supersedes all previously issued privacy disclosures. For more information about Eaton Vance’s Privacy Policy, please call 1-800-262-1122.
Delivery of Shareholder Documents. The Securities and Exchange Commission (SEC) permits funds to deliver only one copy of shareholder documents, including prospectuses, proxy statements and shareholder reports, to fund investors with multiple accounts at the same residential or post office box address. This practice is often called “householding” and it helps eliminate duplicate mailings to shareholders.Eaton Vance, or your financial advisor, may household the mailing of your documents indefinitely unless you instruct Eaton Vance, or your financial advisor, otherwise.If you would prefer that your Eaton Vance documents not be householded, please contact Eaton Vance at 1-800-262-1122, or contact your financial advisor. Your instructions that householding not apply to delivery of your Eaton Vance documents will typically be effective within 30 days of receipt by Eaton Vance or your financial advisor.
Portfolio Holdings. Each Eaton Vance Fund and its underlying Portfolio(s) (if applicable) will file a schedule of portfolio holdings on Form N-Q with the SEC for the first and third quarters of each fiscal year. The Form N-Q will be available on the Eaton Vance website at www.eatonvance.com, by calling Eaton Vance at 1-800-262-1122 or in the EDGAR database on the SEC’s website at www.sec.gov. Form N-Q may also be reviewed and copied at the SEC’s public reference room in Washington, D.C. (call 1-800-732-0330 for information on the operation of the public reference room).
Proxy Voting. From time to time, funds are required to vote proxies related to the securities held by the funds. The Eaton Vance Funds or their underlying Portfolios (if applicable) vote proxies according to a set of policies and procedures approved by the Funds’ and Portfolios’ Boards. You may obtain a description of these policies and procedures and information on how the Funds or Portfolios voted proxies relating to portfolio securities during the most recent 12-month period ended June 30, without charge, upon request, by calling 1-800-262-1122 and by accessing the SEC’s website at www.sec.gov.
| 28 |
Investment Adviser
Boston Management and Research
Two International Place
Boston, MA 02110
Administrator
Eaton Vance Management
Two International Place
Boston, MA 02110
Principal Underwriter*
Eaton Vance Distributors, Inc.
Two International Place
Boston, MA 02110
(617) 482-8260
Custodian
State Street Bank and Trust Company
State Street Financial Center, One Lincoln Street
Boston, MA 02111
Transfer Agent
BNY Mellon Investment Servicing (US) Inc.
Attn: Eaton Vance Funds
P.O. Box 9653
Providence, RI 02940-9653
(800) 262-1122
Independent Registered Public Accounting Firm
Deloitte & Touche LLP
200 Berkeley Street
Boston, MA 02116-5022
Fund Offices
Two International Place
Boston, MA 02110
| * | FINRA BrokerCheck. Investors may check the background of their Investment Professional by contacting the Financial Industry Regulatory Authority (FINRA). FINRA BrokerCheck is a free tool to help investors check the professional background of current and former FINRA-registered securities firms and brokers. FINRA BrokerCheck is available by calling 1-800-289-9999 and at www.FINRA.org. The FINRA BrokerCheck brochure describing this program is available to investors at www.FINRA.org. |

1559 12.31.18

Eaton Vance
Large-Cap Value Fund
Annual Report
December 31, 2018
Important Note. Beginning on January 1, 2021, as permitted by regulations adopted by the Securities and Exchange Commission, paper copies of the Fund’s annual and semi-annual shareholder reports will no longer be sent by mail unless you specifically request paper copies of the reports. Instead, the reports will be made available on the Fund’s website (eatonvance.com/funddocuments), and you will be notified by mail each time a report is posted and provided with a website address to access the report.
If you already elected to receive shareholder reports electronically, you will not be affected by this change and you need not take any action. If you are a direct investor, you may elect to receive shareholder reports and other communications from the Fund electronically by signing up fore-Delivery at eatonvance.com/edelivery. If you own your shares through a financial intermediary (such as a broker-dealer or bank), you must contact your financial intermediary to sign up.
You may elect to receive all future Fund shareholder reports in paper free of charge. If you are a direct investor, you can inform the Fund that you wish to continue receiving paper copies of your shareholder reports by calling1-800-262-1122. If you own these shares through a financial intermediary, you must contact your financial intermediary or follow instructions included with this disclosure, if applicable, to elect to continue to receive paper copies of your shareholder reports. Your election to receive reports in paper will apply to all Eaton Vance funds held directly or to all funds held through your financial intermediary, as applicable.

Commodity Futures Trading Commission Registration. Effective December 31, 2012, the Commodity Futures Trading Commission (“CFTC”) adopted certain regulatory changes that subject registered investment companies and advisers to regulation by the CFTC if a fund invests more than a prescribed level of its assets in certain CFTC-regulated instruments (including futures, certain options and swap agreements) or markets itself as providing investment exposure to such instruments. The Fund has claimed an exclusion from the definition of the term “commodity pool operator” under the Commodity Exchange Act. Accordingly, neither the Fund nor the adviser with respect to the operation of the Fund is subject to CFTC regulation. Because of its management of other strategies, the Fund’s adviser is registered with the CFTC as a commodity pool operator and a commodity trading advisor.
Fund shares are not insured by the FDIC and are not deposits or other obligations of, or guaranteed by, any depository institution. Shares are subject to investment risks, including possible loss of principal invested.
This report must be preceded or accompanied by a current summary prospectus or prospectus. Before investing, investors should consider carefully the investment objective, risks, and charges and expenses of a mutual fund. This and other important information is contained in the summary prospectus and prospectus, which can be obtained from a financial advisor. Prospective investors should read the prospectus carefully before investing. For further information, please call1-800-262-1122.
Annual ReportDecember 31, 2018
Eaton Vance
Large-Cap Value Fund
Table of Contents
Management’s Discussion of Fund Performance | 2 | |||
Performance | 3 | |||
Fund Profile | 4 | |||
Endnotes and Additional Disclosures | 5 | |||
Fund Expenses | 6 | |||
Financial Statements | 7 | |||
Report of Independent Registered Public Accounting Firm | 24 | |||
Federal Tax Information | 25 | |||
Special Meeting of Shareholders | 26 | |||
Management and Organization | 27 | |||
Important Notices | 30 | |||
Eaton Vance
Large-Cap Value Fund
December 31, 2018
Management’s Discussion of Fund Performance1
Economic and Market Conditions
U.S. stock indexes declined during the12-month period ended December 31, 2018, as a sharp downturn in the final quarter of the year erased earlier gains.
U.S. stocks opened the period on an upswing, as investors reacted favorably to the passage of the Republican tax reform package in December 2017. Sharp cuts in corporate taxes, a key element of the bill, raised corporate-profit expectations. U.S. stocks also got a boost from positive U.S. economic data, including the unemployment rate, which fell to a17-year low.
In February 2018, however, U.S. stocks pulled back amid fears that rising interest rates might boost the appeal of fixed-income investments. After a brief rebound, equity markets again weakened in the spring of 2018, as investors confronted the prospect of a global trade war due to President Trump’sthen-new tariffs. The broad tariffs drew retaliatory actions from impacted countries including China, Canada, and certain countries in the European Union.
U.S. stocks bounced back during the summer months led by technology stocks, which rebounded following an earlier setback from a wave of data-privacy scandals. Markets plunged in the final three months of the period amid global trade war fears and sagging economies in China and Europe. Despite a partial rebound in the final days of the period, the U.S. stock market’s December 2018 plunge was the worst monthly loss since the 2008 financial crisis.
Amid investor worries, however, U.S. economic data remained largely positive during the period, prompting the U.S. Federal Reserve (the Fed) to raise the federal funds rate in December 2018 for the fourth time during the period. Since then, the Fed has indicated that it may reconsider its planned 2019 rate hikes.
For the12-month period ended December 31, 2018, the blue-chip Dow Jones Industrial Average®2 declined 3.48%, while the broader U.S. equity market represented by the S&P 500® Index fell 4.38%. The technology-laden NASDAQ Composite Index fell 2.84% during the period.Large-cap U.S. stocks as measured by the S&P 500® Index generally outperformed theirsmall-cap counterparts as measured by the Russell 2000® Index during the period. Growth stocks as a group outpaced value stocks in both the large- andsmall-cap categories, as measured by the Russell Growth and Value Indexes.
Fund Performance
For the12-month period ended December 31, 2018, Eaton VanceLarge-Cap Value Fund (the Fund) returned –6.83% for Class A shares at net asset value (NAV), outperforming its benchmark, the Russell 1000® Value Index (the Index), which returned –8.27%.
Stock selections in the consumer discretionary, communication services and materials sectors contributed to Fund performance versus the Index. In consumer discretionary, the Fund purchased anout-of-Index position in athletic apparel retailer Lululemon Athletica, Inc. in 2017 after its stock declined on operational and management concerns. The stock rose sharply during the period on strong sales, particularly in the women’s workout wear category. By period end, the stock was sold out of the Fund.
Elsewhere in consumer discretionary, the Fund bought anout-of-Index position inoff-price retailer TJX Cos., Inc. (TJX) in early 2018 after the stock declined on fashion-buyer missteps and several quarters of declining same-store sales results due largely to difficult year-over-year comparisons. As those issues started to be resolved, the Fund’s shares of TJX — owner of the T.J. Maxx, HomeGoods, and Marshalls chains — rose in price.
The Fund’s overweight position, relative to the Index, in wireless and cable services provider Verizon Communications, Inc. (Verizon) helped relative results in communication services. Verizon’s stock rose as increasing revenue per user and the company’s early leadership in rolling out new 5G technology drove strong earnings and free cash flow during the period.
In materials, relative performance was aided by the Fund’s overweight position in U.S.-based Ball Corp. (Ball), a leading global manufacturer of metal cans and other packaging. Ball’s stock performed strongly as the firm continued to deliver on the operational synergies management had projected from its 2016 acquisition ofUK-based Rexam, another manufacturer of consumer packaging. An additional positive driver for Ball Corp. shares was increasing recognition by the beverage industry that metal cans are more environmentally friendly than other types of containers.
In contrast, stock selections in the information technology (IT) and financials sectors, along with an overweight position in the energy sector, detracted from performance versus the Index. In IT, not owning technology conglomerate Cisco Systems, Inc., an Index holding that performed well during the period, hurt results versus the Index.
In financials, the Fund’sout-of-index holding in financial services giant Credit Suisse Group AG declined in value as investors appeared to grow impatient with the slow progress of the firm’s multiyear effort to restructure its business. An overweight position in American International Group, Inc., one of the world’s largest insurance and financial services companies, also detracted from results versus the Index. The stock retreated during the period on concerns of potential liabilities from unprofitable policies that the insurer had written in the past.
See Endnotes and Additional Disclosures in this report.
Past performance is no guarantee of future results. Returns are historical and are calculated by determining the percentage change in net asset value (NAV) or offering price (as applicable) with all distributions reinvested. Investment return and principal value will fluctuate so that shares, when redeemed, may be worth more or less than their original cost. Performance less than or equal to one year is cumulative. Performance is for the stated time period only; due to market volatility, the Fund’s current performance may be lower or higher than quoted. Returns are before taxes unless otherwise noted. For performance as of the most recentmonth-end, please refer to eatonvance.com.
| 2 |
Eaton Vance
Large-Cap Value Fund
December 31, 2018
Performance2,3
Portfolio ManagersEdward J. Perkin, CFA and Aaron S. Dunn, CFA
| % Average Annual Total Returns | Class Inception Date | Performance Inception Date | One Year | Five Years | Ten Years | |||||||||||||||
Class A at NAV | 09/23/1931 | 09/23/1931 | –6.83 | % | 5.16 | % | 9.00 | % | ||||||||||||
Class A with 5.75% Maximum Sales Charge | — | — | –12.18 | 3.92 | 8.36 | |||||||||||||||
Class C at NAV | 11/04/1994 | 09/23/1931 | –7.53 | 4.38 | 8.19 | |||||||||||||||
Class C with 1% Maximum Sales Charge | — | — | –8.37 | 4.38 | 8.19 | |||||||||||||||
Class I at NAV | 12/28/2004 | 09/23/1931 | –6.57 | 5.42 | 9.27 | |||||||||||||||
Class R at NAV | 02/18/2004 | 09/23/1931 | –7.04 | 4.90 | 8.72 | |||||||||||||||
Class R6 at NAV | 07/01/2014 | 09/23/1931 | –6.54 | 5.51 | 9.32 | |||||||||||||||
Russell 1000® Value Index | — | — | –8.27 | % | 5.94 | % | 11.17 | % | ||||||||||||
| % Total Annual Operating Expense Ratios4 | Class A | Class C | Class I | Class R | Class R6 | |||||||||||||||
| 1.06 | % | 1.81 | % | 0.81 | % | 1.31 | % | 0.73 | % | |||||||||||
Growth of $10,000
This graph shows the change in value of a hypothetical investment of $10,000 in Class A of the Fund for the period indicated. For comparison, the same investment is shown in the indicated index.
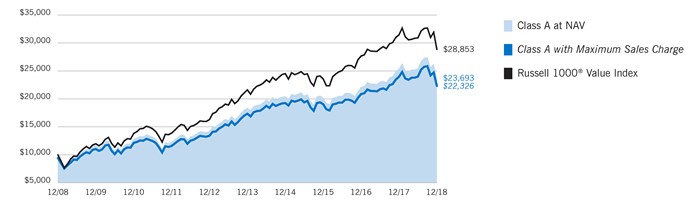
| Growth of Investment3 | Amount Invested | Period Beginning | At NAV | With Maximum Sales Charge | ||||||||||||
Class C | $ | 10,000 | 12/31/2008 | $ | 21,979 | N.A. | ||||||||||
Class I | $ | 250,000 | 12/31/2008 | $ | 607,158 | N.A. | ||||||||||
Class R | $ | 10,000 | 12/31/2008 | $ | 23,089 | N.A. | ||||||||||
Class R6 | $ | 1,000,000 | 12/31/2008 | $ | 2,438,006 | N.A. | ||||||||||
See Endnotes and Additional Disclosures in this report.
Past performance is no guarantee of future results. Returns are historical and are calculated by determining the percentage change in net asset value (NAV) or offering price (as applicable) with all distributions reinvested. Investment return and principal value will fluctuate so that shares, when redeemed, may be worth more or less than their original cost. Performance less than or equal to one year is cumulative. Performance is for the stated time period only; due to market volatility, the Fund’s current performance may be lower or higher than quoted. Returns are before taxes unless otherwise noted. For performance as of the most recentmonth-end, please refer to eatonvance.com.
| 3 |
Eaton Vance
Large-Cap Value Fund
December 31, 2018
Fund Profile
Sector Allocation (% of net assets)5
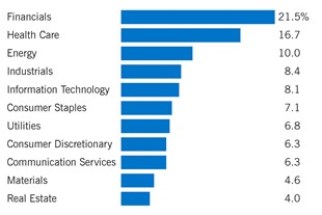
Top 10 Holdings (% of net assets)5
Johnson & Johnson | 4.1 | % | ||
Verizon Communications, Inc. | 3.8 | |||
Merck & Co., Inc. | 3.7 | |||
Bank of America Corp. | 3.4 | |||
Procter & Gamble Co. (The) | 3.0 | |||
Exxon Mobil Corp. | 3.0 | |||
QUALCOMM, Inc. | 2.8 | |||
PNC Financial Services Group, Inc. (The) | 2.8 | |||
DowDuPont, Inc. | 2.3 | |||
NextEra Energy, Inc. | 2.3 | |||
Total | 31.2 | % | ||
See Endnotes and Additional Disclosures in this report.
| 4 |
Eaton Vance
Large-Cap Value Fund
December 31, 2018
Endnotes and Additional Disclosures
| 1 | The views expressed in this report are those of the portfolio manager(s) and are current only through the date stated at the top of this page. These views are subject to change at any time based upon market or other conditions, and Eaton Vance and the Fund(s) disclaim any responsibility to update such views. These views may not be relied upon as investment advice and, because investment decisions are based on many factors, may not be relied upon as an indication of trading intent on behalf of any Eaton Vance fund. This commentary may contain statements that are not historical facts, referred to as “forward looking statements.” The Fund’s actual future results may differ significantly from those stated in any forward looking statement, depending on factors such as changes in securities or financial markets or general economic conditions, the volume of sales and purchases of Fund shares, the continuation of investment advisory, administrative and service contracts, and other risks discussed from time to time in the Fund’s filings with the Securities and Exchange Commission. |
| 2 | Dow Jones Industrial Average® is a price-weighted average of 30 blue-chip stocks that are generally the leaders in their industry. S&P 500® Index is an unmanaged index oflarge-cap stocks commonly used as a measure of U.S. stock market performance. NASDAQ Composite Index is a market capitalization-weighted index of all domestic and international securities listed on NASDAQ. Source: Nasdaq, Inc. The information is provided by Nasdaq (with its affiliates, are referred to as the “Corporations”) and Nasdaq’s third party licensors on an “as is” basis and the Corporations make no guarantees and bear no liability of any kind with respect to the information or the Fund. Russell 2000® Index is an unmanaged index of 2,000 U.S.small-cap stocks. Russell 1000® Value Index is an unmanaged index of U.S.large-cap value stocks. Unless otherwise stated, index returns do not reflect the effect of any applicable sales charges, commissions, expenses, taxes or leverage, as applicable. It is not possible to invest directly in an index. |
| 3 | Total Returns at NAV do not include applicable sales charges. If sales charges were deducted, the returns would be lower. Total Returns shown with maximum sales charge reflect the stated maximum sales charge. Unless otherwise stated, performance does not reflect the deduction of taxes on Fund distributions or redemptions of Fund shares. |
Performance prior to the inception date of a class may be linked to the performance of an older class of the Fund. This linked performance is adjusted for any applicable sales charge, but is not adjusted for class expense differences. If adjusted for such differences, the performance would be different. The performance of Class R6 is linked to Class I. Performance since inception for an index, if presented, is the performance since the Fund’s or oldest share class’ inception, as applicable. Performance presented in the Financial Highlights included in the financial statements is not linked. |
| 4 | Source: Fund prospectus. The expense ratios for the current reporting period can be found in the Financial Highlights section of this report. |
| 5 | Excludes cash and cash equivalents. |
Fund profile subject to change due to active management. |
| 5 |
Eaton Vance
Large-Cap Value Fund
December 31, 2018
Fund Expenses
Example: As a Fund shareholder, you incur two types of costs: (1) transaction costs, including sales charges (loads) on purchases and redemption fees (if applicable); and (2) ongoing costs, including management fees; distribution and/or service fees; and other Fund expenses. This Example is intended to help you understand your ongoing costs (in dollars) of Fund investing and to compare these costs with the ongoing costs of investing in other mutual funds. The Example is based on an investment of $1,000 invested at the beginning of the period and held for the entire period (July 1, 2018 – December 31, 2018).
Actual Expenses: The first section of the table below provides information about actual account values and actual expenses. You may use the information in this section, together with the amount you invested, to estimate the expenses that you paid over the period. Simply divide your account value by $1,000 (for example, an $8,600 account value divided by $1,000 = 8.6), then multiply the result by the number in the first section under the heading entitled “Expenses Paid During Period” to estimate the expenses you paid on your account during this period.
Hypothetical Example for Comparison Purposes: The second section of the table below provides information about hypothetical account values and hypothetical expenses based on the actual Fund expense ratio and an assumed rate of return of 5% per year (before expenses), which is not the actual Fund return. The hypothetical account values and expenses may not be used to estimate the actual ending account balance or expenses you paid for the period. You may use this information to compare the ongoing costs of investing in your Fund and other funds. To do so, compare this 5% hypothetical example with the 5% hypothetical examples that appear in the shareholder reports of the other funds.
Please note that the expenses shown in the table are meant to highlight your ongoing costs only and do not reflect any transactional costs, such as sales charges (loads) or redemption fees (if applicable). Therefore, the second section of the table is useful in comparing ongoing costs only, and will not help you determine the relative total costs of owning different funds. In addition, if these transactional costs were included, your costs would be higher.
| Beginning Account Value (7/1/18) | Ending Account Value (12/31/18) | Expenses Paid During Period* (7/1/18 – 12/31/18) | Annualized Expense Ratio | |||||||||||||
Actual |
| |||||||||||||||
Class A | $ | 1,000.00 | $ | 930.40 | $ | 5.11 | 1.05 | % | ||||||||
Class C | $ | 1,000.00 | $ | 927.30 | $ | 8.74 | 1.80 | % | ||||||||
Class I | $ | 1,000.00 | $ | 931.80 | $ | 3.90 | 0.80 | % | ||||||||
Class R | $ | 1,000.00 | $ | 929.50 | $ | 6.32 | 1.30 | % | ||||||||
Class R6 | $ | 1,000.00 | $ | 932.20 | $ | 3.46 | 0.71 | % | ||||||||
Hypothetical | ||||||||||||||||
(5% return per year before expenses) | ||||||||||||||||
Class A | $ | 1,000.00 | $ | 1,019.90 | $ | 5.35 | 1.05 | % | ||||||||
Class C | $ | 1,000.00 | $ | 1,016.10 | $ | 9.15 | 1.80 | % | ||||||||
Class I | $ | 1,000.00 | $ | 1,021.20 | $ | 4.08 | 0.80 | % | ||||||||
Class R | $ | 1,000.00 | $ | 1,018.70 | $ | 6.61 | 1.30 | % | ||||||||
Class R6 | $ | 1,000.00 | $ | 1,021.60 | $ | 3.62 | 0.71 | % | ||||||||
| * | Expenses are equal to the Fund’s annualized expense ratio for the indicated Class, multiplied by the average account value over the period, multiplied by 184/365 (to reflect theone-half year period). The Example assumes that the $1,000 was invested at the net asset value per share determined at the close of business on June 30, 2018. |
| 6 |
Eaton Vance
Large-Cap Value Fund
December 31, 2018
Portfolio of Investments
| Common Stocks— 99.8% |
| |||||||
| Security | Shares | Value | ||||||
| Aerospace & Defense— 2.7% | ||||||||
Hexcel Corp. | 365,103 | $ | 20,935,006 | |||||
Textron, Inc. | 469,458 | 21,590,373 | ||||||
| $ | 42,525,379 | |||||||
| Banks— 11.2% | ||||||||
Bank of America Corp. | 2,184,077 | $ | 53,815,657 | |||||
JPMorgan Chase & Co. | 269,046 | 26,264,271 | ||||||
KeyCorp | 1,034,989 | 15,297,137 | ||||||
PNC Financial Services Group, Inc. (The) | 375,692 | 43,922,152 | ||||||
Sterling Bancorp | 628,531 | 10,377,047 | ||||||
U.S. Bancorp | 605,896 | 27,689,447 | ||||||
| $ | 177,365,711 | |||||||
| Beverages— 2.1% | ||||||||
Constellation Brands, Inc., Class A | 91,763 | $ | 14,757,326 | |||||
PepsiCo, Inc. | 174,393 | 19,266,938 | ||||||
| $ | 34,024,264 | |||||||
| Biotechnology— 1.3% | ||||||||
Gilead Sciences, Inc. | 321,692 | $ | 20,121,835 | |||||
| $ | 20,121,835 | |||||||
| Capital Markets— 3.6% | ||||||||
Credit Suisse Group AG | 920,448 | $ | 10,062,052 | |||||
Northern Trust Corp. | 259,909 | 21,725,793 | ||||||
Raymond James Financial, Inc. | 242,393 | 18,036,463 | ||||||
S&P Global, Inc. | 47,502 | 8,072,490 | ||||||
| $ | 57,896,798 | |||||||
| Chemicals— 2.3% | ||||||||
DowDuPont, Inc. | 682,938 | $ | 36,523,524 | |||||
| $ | 36,523,524 | |||||||
| Construction & Engineering— 1.5% | ||||||||
Fluor Corp. | 763,790 | $ | 24,594,038 | |||||
| $ | 24,594,038 | |||||||
| Consumer Finance— 3.2% | ||||||||
Ally Financial, Inc. | 429,409 | $ | 9,730,408 | |||||
American Express Co. | 219,177 | 20,891,952 | ||||||
Discover Financial Services | 329,381 | 19,426,891 | ||||||
| $ | 50,049,251 | |||||||
| Security | Shares | Value | ||||||
| Containers & Packaging— 2.3% | ||||||||
Ball Corp.(1) | 468,434 | $ | 21,538,595 | |||||
Packaging Corp. of America | 184,771 | 15,420,988 | ||||||
| $ | 36,959,583 | |||||||
| Diversified Financial Services— 0.8% | ||||||||
Berkshire Hathaway, Inc., Class B(2) | 60,644 | $ | 12,382,292 | |||||
| $ | 12,382,292 | |||||||
| Diversified Telecommunication Services— 3.8% | ||||||||
Verizon Communications, Inc. | 1,078,486 | $ | 60,632,483 | |||||
| $ | 60,632,483 | |||||||
| Electric Utilities— 4.2% | ||||||||
Edison International | 528,568 | $ | 30,006,805 | |||||
NextEra Energy, Inc. | 209,174 | 36,358,625 | ||||||
| $ | 66,365,430 | |||||||
| Electronic Equipment, Instruments & Components— 1.6% | ||||||||
FLIR Systems, Inc. | 573,444 | $ | 24,967,752 | |||||
| $ | 24,967,752 | |||||||
| Energy Equipment & Services— 1.4% | ||||||||
Halliburton Co. | 733,899 | $ | 19,507,035 | |||||
Oceaneering International, Inc.(2) | 249,256 | 3,015,998 | ||||||
| $ | 22,523,033 | |||||||
| Entertainment— 2.5% | ||||||||
Twenty-First Century Fox, Inc., Class A | 355,001 | $ | 17,082,648 | |||||
Walt Disney Co. (The) | 204,524 | 22,426,057 | ||||||
| $ | 39,508,705 | |||||||
| Equity Real Estate Investment Trusts (REITs)— 4.0% | ||||||||
AvalonBay Communities, Inc. | 163,938 | $ | 28,533,409 | |||||
Boston Properties, Inc. | 170,360 | 19,174,018 | ||||||
Invitation Homes, Inc. | 793,125 | 15,925,950 | ||||||
| $ | 63,633,377 | |||||||
| Food Products— 2.0% | ||||||||
Mondelez International, Inc., Class A | 795,748 | $ | 31,853,792 | |||||
| $ | 31,853,792 | |||||||
| 7 | See Notes to Financial Statements. |
Eaton Vance
Large-Cap Value Fund
December 31, 2018
Portfolio of Investments — continued
| Security | Shares | Value | ||||||
| Health Care Equipment & Supplies— 3.5% | ||||||||
Abbott Laboratories | 228,515 | $ | 16,528,490 | |||||
Baxter International, Inc. | 426,038 | 28,041,821 | ||||||
Boston Scientific Corp.(2) | 321,304 | 11,354,884 | ||||||
| $ | 55,925,195 | |||||||
| Health Care Providers & Services— 2.3% | ||||||||
Anthem, Inc. | 108,168 | $ | 28,408,162 | |||||
WellCare Health Plans, Inc.(2) | 35,816 | 8,455,799 | ||||||
| $ | 36,863,961 | |||||||
| Hotels, Restaurants & Leisure— 0.8% | ||||||||
Marriott International, Inc., Class A | 109,686 | $ | 11,907,512 | |||||
| $ | 11,907,512 | |||||||
| Household Durables— 0.8% | ||||||||
D.R. Horton, Inc. | 369,511 | $ | 12,807,251 | |||||
| $ | 12,807,251 | |||||||
| Household Products— 3.0% | ||||||||
Procter & Gamble Co. (The) | 510,099 | $ | 46,888,300 | |||||
| $ | 46,888,300 | |||||||
| Insurance— 2.7% | ||||||||
American Financial Group, Inc. | 64,392 | $ | 5,829,407 | |||||
American International Group, Inc. | 439,546 | 17,322,508 | ||||||
Progressive Corp. (The) | 331,045 | 19,971,945 | ||||||
| $ | 43,123,860 | |||||||
| IT Services— 1.4% | ||||||||
Leidos Holdings, Inc. | 426,022 | $ | 22,459,880 | |||||
| $ | 22,459,880 | |||||||
| Machinery— 4.2% | ||||||||
Gardner Denver Holdings, Inc.(2) | 1,225,047 | $ | 25,052,211 | |||||
Parker-Hannifin Corp. | 168,321 | 25,103,394 | ||||||
Stanley Black & Decker, Inc. | 140,876 | 16,868,492 | ||||||
| $ | 67,024,097 | |||||||
| Multi-Utilities— 2.6% | ||||||||
CMS Energy Corp. | 460,139 | $ | 22,845,901 | |||||
Sempra Energy(1) | 177,634 | 19,218,223 | ||||||
| $ | 42,064,124 | |||||||
| Security | Shares | Value | ||||||
| Oil, Gas & Consumable Fuels— 8.5% | ||||||||
ConocoPhillips | 543,625 | $ | 33,895,019 | |||||
EOG Resources, Inc. | 317,706 | 27,707,140 | ||||||
Exxon Mobil Corp. | 687,524 | 46,882,261 | ||||||
Phillips 66 | 313,471 | 27,005,527 | ||||||
| $ | 135,489,947 | |||||||
| Pharmaceuticals— 9.6% | ||||||||
GlaxoSmithKline PLC ADR | 717,831 | $ | 27,428,323 | |||||
Johnson & Johnson | 503,251 | 64,944,542 | ||||||
Merck & Co., Inc. | 778,184 | 59,461,039 | ||||||
| $ | 151,833,904 | |||||||
| Semiconductors & Semiconductor Equipment— 4.3% | ||||||||
NXP Semiconductors NV | 313,730 | $ | 22,990,135 | |||||
QUALCOMM, Inc.(1) | 789,010 | 44,902,559 | ||||||
| $ | 67,892,694 | |||||||
| Specialty Retail— 3.9% | ||||||||
Home Depot, Inc. (The) | 94,168 | $ | 16,179,946 | |||||
Tiffany & Co. | 192,591 | 15,505,501 | ||||||
TJX Cos., Inc. (The) | 345,516 | 15,458,386 | ||||||
Tractor Supply Co. | 169,454 | 14,139,242 | ||||||
| $ | 61,283,075 | |||||||
| Technology Hardware, Storage & Peripherals— 0.8% | ||||||||
Apple, Inc. | 83,409 | $ | 13,156,936 | |||||
| $ | 13,156,936 | |||||||
| Textiles, Apparel & Luxury Goods— 0.9% | ||||||||
Tapestry, Inc. | 427,225 | $ | 14,418,844 | |||||
| $ | 14,418,844 | |||||||
Total Common Stocks |
| $ | 1,585,066,827 | |||||
| 8 | See Notes to Financial Statements. |
Eaton Vance
Large-Cap Value Fund
December 31, 2018
Portfolio of Investments — continued
| Short-Term Investments— 0.4% |
| |||||||
| Description | Units/Shares | Value | ||||||
Eaton Vance Cash Reserves Fund, LLC, 2.46%(3) | 6,567,623 | $ | 6,566,966 | |||||
Total Short-Term Investments |
| $ | 6,566,966 | |||||
Total Investments — 100.2% |
| $ | 1,591,633,793 | |||||
Other Assets, Less Liabilities — (0.2)% |
| $ | (2,752,011 | ) | ||||
Net Assets — 100.0% |
| $ | 1,588,881,782 | |||||
The percentage shown for each investment category in the Portfolio of Investments is based on net assets.
| (1) | All or a portion of this security was on loan at December 31, 2018. The aggregate market value of securities on loan at December 31, 2018 was $72,009,552. |
| (2) | Non-income producing security. |
| (3) | Affiliated investment company, available to Eaton Vance portfolios and funds, which invests in high quality, U.S. dollar denominated money market instruments. The rate shown is the annualizedseven-day yield as of December 31, 2018. |
Abbreviations:
| ADR | – | American Depositary Receipt | ||
| 9 | See Notes to Financial Statements. |
Eaton Vance
Large-Cap Value Fund
December 31, 2018
Statement of Assets and Liabilities
| Assets | December 31, 2018 | |||
Unaffiliated investments, at value including $72,009,552 of securities on loan (identified cost, $1,592,175,652) | $ | 1,585,066,827 | ||
Affiliated investment, at value (identified cost, $6,566,603) | 6,566,966 | |||
Dividends receivable | 3,133,746 | |||
Dividends receivable from affiliated investment | 7,208 | |||
Receivable for investments sold | 904,040 | |||
Receivable for Fund shares sold | 7,299,152 | |||
Securities lending income receivable | 7,733 | |||
Tax reclaims receivable | 2,916,897 | |||
Other assets | 5,628 | |||
Total assets | $ | 1,605,908,197 | ||
| Liabilities |
| |||
Payable for Fund shares redeemed | $ | 15,134,784 | ||
Due to custodian — foreign currency, at value (identified cost, $2,298) | 2,317 | |||
Payable to affiliates: |
| |||
Investment adviser fee | 866,397 | |||
Distribution and service fees | 302,472 | |||
Trustees’ fees | 21,250 | |||
Accrued expenses | 699,195 | |||
Total liabilities | $ | 17,026,415 | ||
Net Assets | $ | 1,588,881,782 | ||
| Sources of Net Assets |
| |||
Paid-in capital | $ | 1,605,241,757 | ||
Accumulated loss | (16,359,975 | ) | ||
Total | $ | 1,588,881,782 | ||
| Class A Shares |
| |||
Net Assets | $ | 549,515,200 | ||
Shares Outstanding | 33,296,007 | |||
Net Asset Value and Redemption Price Per Share | ||||
(net assets ÷ shares of beneficial interest outstanding) | $ | 16.50 | ||
Maximum Offering Price Per Share | ||||
(100 ÷ 94.25 of net asset value per share) | $ | 17.51 | ||
| Class C Shares |
| |||
Net Assets | $ | 168,782,634 | ||
Shares Outstanding | 10,215,330 | |||
Net Asset Value and Offering Price Per Share* | ||||
(net assets ÷ shares of beneficial interest outstanding) | $ | 16.52 | ||
| Class I Shares |
| |||
Net Assets | $ | 736,581,432 | ||
Shares Outstanding | 44,443,401 | |||
Net Asset Value, Offering Price and Redemption Price Per Share | ||||
(net assets ÷ shares of beneficial interest outstanding) | $ | 16.57 | ||
| Class R Shares |
| |||
Net Assets | $ | 60,983,858 | ||
Shares Outstanding | 3,706,123 | |||
Net Asset Value, Offering Price and Redemption Price Per Share | ||||
(net assets ÷ shares of beneficial interest outstanding) | $ | 16.45 | ||
| Class R6 Shares |
| |||
Net Assets | $ | 73,018,658 | ||
Shares Outstanding | 4,403,403 | |||
Net Asset Value, Offering Price and Redemption Price Per Share | ||||
(net assets ÷ shares of beneficial interest outstanding) | $ | 16.58 | ||
On sales of $50,000 or more, the offering price of Class A shares is reduced.
| * | Redemption price per share is equal to the net asset value less any applicable contingent deferred sales charge. |
| 10 | See Notes to Financial Statements. |
Eaton Vance
Large-Cap Value Fund
December 31, 2018
Statement of Operations
| Investment Income | Year Ended December 31, 2018 | |||
Dividends (net of foreign taxes, $35,542) | $ | 24,051,134 | ||
Dividends allocated from Portfolio (net of foreign taxes, $26,754) | 22,355,324 | |||
Dividends from affiliated investment | 271,495 | |||
Securities lending income, net | 44,596 | |||
Securities lending income allocated from Portfolio, net | 56,439 | |||
Expenses allocated from Portfolio | (6,193,837 | ) | ||
Total investment income | $ | 40,585,151 | ||
| Expenses | ||||
Investment adviser fee | $ | 6,464,554 | ||
Distribution and service fees | ||||
Class A | 1,677,671 | |||
Class C | 2,165,109 | |||
Class R | 374,466 | |||
Trustees’ fees and expenses | 63,878 | |||
Custodian fee | 286,917 | |||
Transfer and dividend disbursing agent fees | 1,631,830 | |||
Legal and accounting services | 95,610 | |||
Printing and postage | 222,409 | |||
Registration fees | 67,220 | |||
ReFlow liquidity program fees | 784,590 | |||
Miscellaneous | 76,165 | |||
Total expenses | $ | 13,910,419 | ||
Net investment income | $ | 26,674,732 | ||
| Realized and Unrealized Gain (Loss) | ||||
Net realized gain (loss) — | ||||
Investment transactions | $ | 128,330,455 | (1) | |
Investment transactions allocated from Portfolio | 91,776,324 | (2) | ||
Investment transactions — affiliated investment | (6,049 | ) | ||
Foreign currency transactions | (14,796 | ) | ||
Foreign currency transactions allocated from Portfolio | (2,853 | ) | ||
Net realized gain | $ | 220,083,081 | ||
Change in unrealized appreciation (depreciation) — | ||||
Investments | $ | (273,517,532 | ) | |
Investments allocated from Portfolio | (82,761,152 | ) | ||
Investments — affiliated investment | 3,322 | |||
Foreign currency | 22,353 | |||
Foreign currency allocated from Portfolio | (45,872 | ) | ||
Net change in unrealized appreciation (depreciation) | $ | (356,298,881 | ) | |
Net realized and unrealized loss | $ | (136,215,800 | ) | |
Net decrease in net assets from operations | $ | (109,541,068 | ) | |
| (1) | Includes $41,052,414 of net realized gains from redemptionsin-kind. |
| (2) | Includes $35,452,860 of net realized gains from redemptionsin-kind. |
| 11 | See Notes to Financial Statements. |
Eaton Vance
Large-Cap Value Fund
December 31, 2018
Statements of Changes in Net Assets
| Year Ended December 31, | ||||||||
| Increase (Decrease) in Net Assets | 2018 | 2017 | ||||||
From operations — | ||||||||
Net investment income | $ | 26,674,732 | $ | 35,759,816 | ||||
Net realized gain | 220,083,081 | (1) | 323,293,196 | (2) | ||||
Net change in unrealized appreciation (depreciation) | (356,298,881 | ) | (29,685,699 | ) | ||||
Net increase (decrease) in net assets from operations | $ | (109,541,068 | ) | $ | 329,367,313 | |||
Distributions to shareholders(3) — | ||||||||
Class A | $ | (57,881,635 | ) | $ | (44,020,613 | ) | ||
Class C | (16,506,261 | ) | (12,123,818 | ) | ||||
Class I | (77,304,463 | ) | (64,972,032 | ) | ||||
Class R | (6,120,235 | ) | (4,840,533 | ) | ||||
Class R6 | (9,922,733 | ) | (5,539,627 | ) | ||||
Total distributions to shareholders | $ | (167,735,327 | ) | $ | (131,496,623 | ) | ||
Transactions in shares of beneficial interest — | ||||||||
Proceeds from sale of shares | ||||||||
Class A | $ | 62,416,237 | $ | 63,821,918 | ||||
Class C | 8,855,103 | 10,371,659 | ||||||
Class I | 530,560,658 | 857,211,602 | ||||||
Class R | 9,564,235 | 11,146,267 | ||||||
Class R6 | 140,837,725 | 59,786,291 | ||||||
Net asset value of shares issued to shareholders in payment of distributions declared | ||||||||
Class A | 51,912,348 | 39,847,811 | ||||||
Class C | 14,842,384 | 10,620,399 | ||||||
Class I | 63,075,579 | 53,885,545 | ||||||
Class R | 5,696,271 | 4,419,613 | ||||||
Class R6 | 9,922,733 | 5,539,255 | ||||||
Cost of shares redeemed | ||||||||
Class A | (209,351,072 | ) | (373,123,326 | ) | ||||
Class C | (66,338,072 | ) | (101,297,200 | ) | ||||
Class I | (762,027,970 | ) | (1,529,195,227 | ) | ||||
Class R | (30,384,832 | ) | (37,258,754 | ) | ||||
Class R6 | (151,555,385 | ) | (22,731,835 | ) | ||||
Net decrease in net assets from Fund share transactions | $ | (321,974,058 | ) | $ | (946,955,982 | ) | ||
Net decrease in net assets | $ | (599,250,453 | ) | $ | (749,085,292 | ) | ||
| Net Assets |
| |||||||
At beginning of year | $ | 2,188,132,235 | $ | 2,937,217,527 | ||||
At end of year | $ | 1,588,881,782 | $ | 2,188,132,235 | (4) | |||
| (1) | Includes $76,505,274 of net realized gains from redemptionsin-kind. |
| (2) | Includes $116,142,543 of net realized gains from redemptionsin-kind. |
| (3) | For the year ended December 31, 2017, the source of distributions was as follows: |
Net investment income — Class A $(10,463,844), Class C $(1,260,961), Class I $(19,104,475), Class R $(928,683) and Class R6 $(1,275,109) |
Net realized gain — Class A $(33,556,769), Class C $(10,862,857), Class I $(45,867,557), Class R $(3,911,850) and Class R6 $(4,264,518) The current year presentation of distributions conforms with the Disclosure Update and Simplification Rule issued by the Securities and Exchange Commission, effective November 5, 2018. |
| (4) | Includes accumulated undistributed net investment income of $575,918 at December 31, 2017. The requirement to disclose the corresponding amount as of December 31, 2018 was eliminated. |
| 12 | See Notes to Financial Statements. |
Eaton Vance
Large-Cap Value Fund
December 31, 2018
Financial Highlights
| Class A | ||||||||||||||||||||
| Year Ended December 31, | ||||||||||||||||||||
| 2018 | 2017 | 2016 | 2015 | 2014 | ||||||||||||||||
Net asset value — Beginning of year | $ | 19.520 | $ | 18.030 | $ | 16.690 | $ | 18.740 | $ | 23.910 | ||||||||||
| Income (Loss) From Operations | ||||||||||||||||||||
Net investment income(1) | $ | 0.254 | $ | 0.246 | $ | 0.279 | $ | 0.246 | $ | 0.317 | ||||||||||
Net realized and unrealized gain (loss) | (1.470 | ) | 2.393 | 1.301 | (0.456 | ) | 2.001 | |||||||||||||
Total income (loss) from operations | $ | (1.216 | ) | $ | 2.639 | $ | 1.580 | $ | (0.210 | ) | $ | 2.318 | ||||||||
| Less Distributions | ||||||||||||||||||||
From net investment income | $ | (0.240 | ) | $ | (0.240 | ) | $ | (0.240 | ) | $ | (0.260 | ) | $ | (0.320 | ) | |||||
From net realized gain | (1.564 | ) | (0.909 | ) | — | (1.580 | ) | (7.168 | ) | |||||||||||
Total distributions | $ | (1.804 | ) | $ | (1.149 | ) | $ | (0.240 | ) | $ | (1.840 | ) | $ | (7.488 | ) | |||||
Net asset value — End of year | $ | 16.500 | $ | 19.520 | $ | 18.030 | $ | 16.690 | $ | 18.740 | ||||||||||
Total Return(2) | (6.83 | )% | 14.80 | % | 9.56 | % | (1.08 | )% | 10.96 | % | ||||||||||
| Ratios/Supplemental Data | ||||||||||||||||||||
Net assets, end of year (000’s omitted) | $ | 549,515 | $ | 741,193 | $ | 942,192 | $ | 1,127,754 | $ | 1,486,142 | ||||||||||
Ratios (as a percentage of average daily net assets):(3) | ||||||||||||||||||||
Expenses(4) | 1.06 | % | 1.06 | % | 1.06 | % | 1.05 | % | 1.01 | % | ||||||||||
Net investment income | 1.30 | % | 1.31 | % | 1.67 | % | 1.33 | % | 1.29 | % | ||||||||||
Portfolio Turnover of the Portfolio(5) | 34 | %(6) | 105 | % | 94 | % | 98 | % | 75 | % | ||||||||||
Portfolio Turnover of the Fund | 48 | %(6)(7) | — | — | — | — | ||||||||||||||
| (1) | Computed using average shares outstanding. |
| (2) | Returns are historical and are calculated by determining the percentage change in net asset value with all distributions reinvested and do not reflect the effect of sales charges. |
| (3) | Includes the Fund’s share of the Portfolio’s allocated expenses for the period while the Fund was investing in the Portfolio. |
| (4) | Excludes the effect of custody fee credits, if any, of less than 0.005%. Effective September 1, 2015, custody fee credits, which were earned on cash deposit balances, were discontinued by the custodian. |
| (5) | Portfolio turnover represents the rate of portfolio activity for the period while the Fund was investing in the Portfolio. |
| (6) | Not annualized. |
| (7) | For the period from June 18, 2018 through December 31, 2018 when the Fund was making investments directly in securities. |
| 13 | See Notes to Financial Statements. |
Eaton Vance
Large-Cap Value Fund
December 31, 2018
Financial Highlights — continued
| Class C | ||||||||||||||||||||
| Year Ended December 31, | ||||||||||||||||||||
| 2018 | 2017 | 2016 | 2015 | 2014 | ||||||||||||||||
Net asset value — Beginning of year | $ | 19.540 | $ | 18.040 | $ | 16.700 | $ | 18.750 | $ | 23.920 | ||||||||||
| Income (Loss) From Operations | ||||||||||||||||||||
Net investment income(1) | $ | 0.107 | $ | 0.107 | $ | 0.154 | $ | 0.107 | $ | 0.132 | ||||||||||
Net realized and unrealized gain (loss) | (1.473 | ) | 2.394 | 1.298 | (0.453 | ) | 1.999 | |||||||||||||
Total income (loss) from operations | $ | (1.366 | ) | $ | 2.501 | $ | 1.452 | $ | (0.346 | ) | $ | 2.131 | ||||||||
| Less Distributions | ||||||||||||||||||||
From net investment income | $ | (0.090 | ) | $ | (0.092 | ) | $ | (0.112 | ) | $ | (0.124 | ) | $ | (0.133 | ) | |||||
From net realized gain | (1.564 | ) | (0.909 | ) | — | (1.580 | ) | (7.168 | ) | |||||||||||
Total distributions | $ | (1.654 | ) | $ | (1.001 | ) | $ | (0.112 | ) | $ | (1.704 | ) | $ | (7.301 | ) | |||||
Net asset value — End of year | $ | 16.520 | $ | 19.540 | $ | 18.040 | $ | 16.700 | $ | 18.750 | ||||||||||
Total Return(2) | (7.53 | )% | 13.96 | % | 8.74 | % | (1.82 | )% | 10.12 | % | ||||||||||
| Ratios/Supplemental Data | ||||||||||||||||||||
Net assets, end of year (000’s omitted) | $ | 168,783 | $ | 241,192 | $ | 300,456 | $ | 345,531 | $ | 419,453 | ||||||||||
Ratios (as a percentage of average daily net assets):(3) | ||||||||||||||||||||
Expenses(4) | 1.81 | % | 1.81 | % | 1.81 | % | 1.80 | % | 1.76 | % | ||||||||||
Net investment income | 0.55 | % | 0.57 | % | 0.92 | % | 0.58 | % | 0.54 | % | ||||||||||
Portfolio Turnover of the Portfolio(5) | 34 | %(6) | 105 | % | 94 | % | 98 | % | 75 | % | ||||||||||
Portfolio Turnover of the Fund | 48 | %(6)(7) | — | — | — | — | ||||||||||||||
| (1) | Computed using average shares outstanding. |
| (2) | Returns are historical and are calculated by determining the percentage change in net asset value with all distributions reinvested and do not reflect the effect of sales charges. |
| (3) | Includes the Fund’s share of the Portfolio’s allocated expenses for the period while the Fund was investing in the Portfolio. |
| (4) | Excludes the effect of custody fee credits, if any, of less than 0.005%. Effective September 1, 2015, custody fee credits, which were earned on cash deposit balances, were discontinued by the custodian. |
| (5) | Portfolio turnover represents the rate of portfolio activity for the period while the Fund was investing in the Portfolio. |
| (6) | Not annualized. |
| (7) | For the period from June 18, 2018 through December 31, 2018 when the Fund was making investments directly in securities. |
| 14 | See Notes to Financial Statements. |
Eaton Vance
Large-Cap Value Fund
December 31, 2018
Financial Highlights — continued
| Class I | ||||||||||||||||||||
| Year Ended December 31, | ||||||||||||||||||||
| 2018 | 2017 | 2016 | 2015 | 2014 | ||||||||||||||||
Net asset value — Beginning of year | $ | 19.590 | $ | 18.090 | $ | 16.750 | $ | 18.800 | $ | 23.970 | ||||||||||
| Income (Loss) From Operations | ||||||||||||||||||||
Net investment income(1) | $ | 0.306 | $ | 0.296 | $ | 0.323 | $ | 0.293 | $ | 0.383 | ||||||||||
Net realized and unrealized gain (loss) | (1.472 | ) | 2.401 | 1.300 | (0.458 | ) | 2.002 | |||||||||||||
Total income (loss) from operations | $ | (1.166 | ) | $ | 2.697 | $ | 1.623 | $ | (0.165 | ) | $ | 2.385 | ||||||||
| Less Distributions | ||||||||||||||||||||
From net investment income | $ | (0.290 | ) | $ | (0.288 | ) | $ | (0.283 | ) | $ | (0.305 | ) | $ | (0.387 | ) | |||||
From net realized gain | (1.564 | ) | (0.909 | ) | — | (1.580 | ) | (7.168 | ) | |||||||||||
Total distributions | $ | (1.854 | ) | $ | (1.197 | ) | $ | (0.283 | ) | $ | (1.885 | ) | $ | (7.555 | ) | |||||
Net asset value — End of year | $ | 16.570 | $ | 19.590 | $ | 18.090 | $ | 16.750 | $ | 18.800 | ||||||||||
Total Return(2) | (6.57 | )% | 15.10 | % | 9.80 | % | (0.83 | )% | 11.22 | % | ||||||||||
| Ratios/Supplemental Data | ||||||||||||||||||||
Net assets, end of year (000’s omitted) | $ | 736,581 | $ | 1,032,300 | $ | 1,555,075 | $ | 1,664,998 | $ | 1,969,601 | ||||||||||
Ratios (as a percentage of average daily net assets):(3) | ||||||||||||||||||||
Expenses(4) | 0.81 | % | 0.81 | % | 0.81 | % | 0.80 | % | 0.76 | % | ||||||||||
Net investment income | 1.56 | % | 1.57 | % | 1.92 | % | 1.58 | % | 1.55 | % | ||||||||||
Portfolio Turnover of the Portfolio(5) | 34 | %(6) | 105 | % | 94 | % | 98 | % | 75 | % | ||||||||||
Portfolio Turnover of the Fund | 48 | %(6)(7) | — | — | — | — | ||||||||||||||
| (1) | Computed using average shares outstanding. |
| (2) | Returns are historical and are calculated by determining the percentage change in net asset value with all distributions reinvested. |
| (3) | Includes the Fund’s share of the Portfolio’s allocated expenses for the period while the Fund was investing in the Portfolio. |
| (4) | Excludes the effect of custody fee credits, if any, of less than 0.005%. Effective September 1, 2015, custody fee credits, which were earned on cash deposit balances, were discontinued by the custodian. |
| (5) | Portfolio turnover represents the rate of portfolio activity for the period while the Fund was investing in the Portfolio. |
| (6) | Not annualized. |
| (7) | For the period from June 18, 2018 through December 31, 2018 when the Fund was making investments directly in securities. |
| 15 | See Notes to Financial Statements. |
Eaton Vance
Large-Cap Value Fund
December 31, 2018
Financial Highlights — continued
| Class R | ||||||||||||||||||||
| Year Ended December 31, | ||||||||||||||||||||
| 2018 | 2017 | 2016 | 2015 | 2014 | ||||||||||||||||
Net asset value — Beginning of year | $ | 19.460 | $ | 17.980 | $ | 16.650 | $ | 18.690 | $ | 23.870 | ||||||||||
| Income (Loss) From Operations | ||||||||||||||||||||
Net investment income(1) | $ | 0.204 | $ | 0.199 | $ | 0.237 | $ | 0.199 | $ | 0.255 | ||||||||||
Net realized and unrealized gain (loss) | (1.460 | ) | 2.382 | 1.292 | (0.445 | ) | 1.993 | |||||||||||||
Total income (loss) from operations | $ | (1.256 | ) | $ | 2.581 | $ | 1.529 | $ | (0.246 | ) | $ | 2.248 | ||||||||
| Less Distributions | ||||||||||||||||||||
From net investment income | $ | (0.190 | ) | $ | (0.192 | ) | $ | (0.199 | ) | $ | (0.214 | ) | $ | (0.260 | ) | |||||
From net realized gain | (1.564 | ) | (0.909 | ) | — | (1.580 | ) | (7.168 | ) | |||||||||||
Total distributions | $ | (1.754 | ) | $ | (1.101 | ) | $ | (0.199 | ) | $ | (1.794 | ) | $ | (7.428 | ) | |||||
Net asset value — End of year | $ | 16.450 | $ | 19.460 | $ | 17.980 | $ | 16.650 | $ | 18.690 | ||||||||||
Total Return(2) | (7.04 | )% | 14.50 | % | 9.26 | % | (1.33 | )% | 10.71 | % | ||||||||||
| Ratios/Supplemental Data | ||||||||||||||||||||
Net assets, end of year (000’s omitted) | $ | 60,984 | $ | 86,706 | $ | 101,010 | $ | 109,468 | $ | 151,329 | ||||||||||
Ratios (as a percentage of average daily net assets):(3) | ||||||||||||||||||||
Expenses(4) | 1.31 | % | 1.31 | % | 1.31 | % | 1.30 | % | 1.26 | % | ||||||||||
Net investment income | 1.05 | % | 1.06 | % | 1.42 | % | 1.08 | % | 1.04 | % | ||||||||||
Portfolio Turnover of the Portfolio(5) | 34 | %(6) | 105 | % | 94 | % | 98 | % | 75 | % | ||||||||||
Portfolio Turnover of the Fund | 48 | %(6)(7) | — | — | — | — | ||||||||||||||
| (1) | Computed using average shares outstanding. |
| (2) | Returns are historical and are calculated by determining the percentage change in net asset value with all distributions reinvested. |
| (3) | Includes the Fund’s share of the Portfolio’s allocated expenses for the period while the Fund was investing in the Portfolio. |
| (4) | Excludes the effect of custody fee credits, if any, of less than 0.005%. Effective September 1, 2015, custody fee credits, which were earned on cash deposit balances, were discontinued by the custodian. |
| (5) | Portfolio turnover represents the rate of portfolio activity for the period while the Fund was investing in the Portfolio. |
| (6) | Not annualized. |
| (7) | For the period from June 18, 2018 through December 31, 2018 when the Fund was making investments directly in securities. |
| 16 | See Notes to Financial Statements. |
Eaton Vance
Large-Cap Value Fund
December 31, 2018
Financial Highlights — continued
| Class R6 | ||||||||||||||||||||
| Year Ended December 31, | Period Ended December 31, 2014(1) | |||||||||||||||||||
| 2018 | 2017 | 2016 | 2015 | |||||||||||||||||
Net asset value — Beginning of period | $ | 19.610 | $ | 18.100 | $ | 16.760 | $ | 18.810 | $ | 25.890 | ||||||||||
| Income (Loss) From Operations | ||||||||||||||||||||
Net investment income(2) | $ | 0.310 | $ | 0.311 | $ | 0.339 | $ | 0.321 | $ | 0.194 | ||||||||||
Net realized and unrealized gain (loss) | (1.470 | ) | 2.413 | 1.301 | (0.469 | ) | 0.089 | |||||||||||||
Total income (loss) from operations | $ | (1.160 | ) | $ | 2.724 | $ | 1.640 | $ | (0.148 | ) | $ | 0.283 | ||||||||
| Less Distributions | ||||||||||||||||||||
From net investment income | $ | (0.306 | ) | $ | (0.305 | ) | $ | (0.300 | ) | $ | (0.322 | ) | $ | (0.195 | ) | |||||
From net realized gain | (1.564 | ) | (0.909 | ) | — | (1.580 | ) | (7.168 | ) | |||||||||||
Total distributions | $ | (1.870 | ) | $ | (1.214 | ) | $ | (0.300 | ) | $ | (1.902 | ) | $ | (7.363 | ) | |||||
Net asset value — End of period | $ | 16.580 | $ | 19.610 | $ | 18.100 | $ | 16.760 | $ | 18.810 | ||||||||||
Total Return(3) | (6.54 | )% | 15.25 | % | 9.90 | % | (0.79 | )% | 2.28 | %(4) | ||||||||||
| Ratios/Supplemental Data | ||||||||||||||||||||
Net assets, end of period (000’s omitted) | $ | 73,019 | $ | 86,742 | $ | 38,485 | $ | 32,525 | $ | 1 | ||||||||||
Ratios (as a percentage of average daily net assets):(5) | ||||||||||||||||||||
Expenses(6) | 0.72 | % | 0.73 | % | 0.71 | % | 0.71 | % | 0.65 | %(7) | ||||||||||
Net investment income | 1.57 | % | 1.64 | % | 2.01 | % | 1.73 | % | 1.54 | %(7) | ||||||||||
Portfolio Turnover of the Portfolio(8) | 34 | %(4) | 105 | % | 94 | % | 98 | % | 75 | %(9) | ||||||||||
Portfolio Turnover of the Fund | 48 | %(4)(10) | — | — | — | — | ||||||||||||||
| (1) | For the period from the commencement of operations, July 1, 2014, to December 31, 2014. |
| (2) | Computed using average shares outstanding. |
| (3) | Returns are historical and are calculated by determining the percentage change in net asset value with all distributions reinvested. |
| (4) | Not annualized. |
| (5) | Includes the Fund’s share of the Portfolio’s allocated expenses for the period while the Fund was investing in the Portfolio. |
| (6) | Excludes the effect of custody fee credits, if any, of less than 0.005%. Effective September 1, 2015, custody fee credits, which were earned on cash deposit balances, were discontinued by the custodian. |
| (7) | Annualized. |
| (8) | Portfolio turnover represents the rate of portfolio activity for the period while the Fund was investing in the Portfolio. |
| (9) | For the Portfolio’s year ended December 31, 2014. |
| (10) | For the period from June 18, 2018 through December 31, 2018 when the Fund was making investments directly in securities. |
| 17 | See Notes to Financial Statements. |
Eaton Vance
Large-Cap Value Fund
December 31, 2018
Notes to Financial Statements
1 Significant Accounting Policies
Eaton VanceLarge-Cap Value Fund (the Fund) is a diversified series of Eaton Vance Special Investment Trust (the Trust). The Trust is a Massachusetts business trust registered under the Investment Company Act of 1940, as amended (the 1940 Act), as anopen-end management investment company. The Fund’s investment objective is to seek total return. Prior to the close of business on June 15, 2018, the Fund invested all of its investable assets in interests inLarge-Cap Value Portfolio (the Portfolio), a Massachusetts business trust, having the same investment objective and policies as the Fund. As of the close of business on June 15, 2018, the Fund received itspro-rata share of net assets from the Portfolio as part of the termination of the Portfolio. As of June 18, 2018, the next business day, the Fund invests its assets directly. The Fund offers five classes of shares. Class A shares are generally sold subject to a sales charge imposed at time of purchase. Class C shares are sold at net asset value and are generally subject to a contingent deferred sales charge (see Note 5). Class I, Class R and Class R6 shares are sold at net asset value and are not subject to a sales charge. Effective January 25, 2019, Class C shares generally will automatically convert to Class A shares ten years after their purchase as described in the Fund’s prospectus.
Each class represents apro-rata interest in the Fund, but votes separately on class-specific matters and (as noted below) is subject to different expenses. Realized and unrealized gains and losses and net investment income and losses, other than class-specific expenses, are allocated daily to each class of shares based on the relative net assets of each class to the total net assets of the Fund.Sub-accounting, recordkeeping and similar administrative fees payable to financial intermediaries, which are a component of transfer and dividend disbursing agent fees on the Statement of Operations, are not allocated to Class R6 shares. Each class of shares differs in its distribution plan and certain other class-specific expenses.
The following is a summary of significant accounting policies of the Fund. The policies are in conformity with accounting principles generally accepted in the United States of America (U.S. GAAP). The Fund is an investment company and follows accounting and reporting guidance in the Financial Accounting Standards Board (FASB) Accounting Standards Codification Topic 946.
A Investment Valuation — The following methodologies are used to determine the market value or fair value of investments.
Equity Securities.Equity securities listed on a U.S. securities exchange generally are valued at the last sale or closing price on the day of valuation or, if no sales took place on such date, at the mean between the closing bid and asked prices on the exchange where such securities are principally traded. Equity securities listed on the NASDAQ Global or Global Select Market generally are valued at the NASDAQ official closing price. Unlisted or listed securities for which closing sales prices or closing quotations are not available are valued at the mean between the latest available bid and ask prices.
Foreign Securities and Currencies.Foreign securities and currencies are valued in U.S. dollars, based on foreign currency exchange rate quotations supplied by a third party pricing service. The pricing service uses a proprietary model to determine the exchange rate. Inputs to the model include reported trades and implied bid/ask spreads. The daily valuation of exchange-traded foreign securities generally is determined as of the close of trading on the principal exchange on which such securities trade. Events occurring after the close of trading on foreign exchanges may result in adjustments to the valuation of foreign securities to more accurately reflect their fair value as of the close of regular trading on the New York Stock Exchange. When valuing foreign equity securities that meet certain criteria, the Fund’s Trustees have approved the use of a fair value service that values such securities to reflect market trading that occurs after the close of the applicable foreign markets of comparable securities or other instruments that have a strong correlation to the fair-valued securities.
Affiliated Fund.The Fund may invest in Eaton Vance Cash Reserves Fund, LLC (Cash Reserves Fund), an affiliated investment company managed by Eaton Vance Management (EVM). While Cash Reserves Fund is not a registered money market mutual fund, it conducts all of its investment activities in accordance with the requirements of Rule2a-7 under the 1940 Act. Investments in Cash Reserves Fund are valued at the closing net asset value per unit on the valuation day. Cash Reserves Fund generally values its investment securities based on available market quotations provided by a third party pricing service.
Other. Investments in registered investment companies (including money market funds) that do not trade on an exchange are valued at the net asset value per share on the valuation day.
Fair Valuation.Investments for which valuations or market quotations are not readily available or are deemed unreliable are valued at fair value using methods determined in good faith by or at the direction of the Trustees of the Fund in a manner that fairly reflects the security’s value, or the amount that the Fund might reasonably expect to receive for the security upon its current sale in the ordinary course. Each such determination is based on a consideration of relevant factors, which are likely to vary from one pricing context to another. These factors may include, but are not limited to, the type of security, the existence of any contractual restrictions on the security’s disposition, the price and extent of public trading in similar securities of the issuer or of comparable companies or entities, quotations or relevant information obtained from broker/dealers or other market participants, information obtained from the issuer, analysts, and/or the appropriate stock exchange (for exchange-traded securities), an analysis of the company’s or entity’s financial condition, and an evaluation of the forces that influence the issuer and the market(s) in which the security is purchased and sold.
B Investment Transactions — Investment transactions for financial statement purposes are accounted for on a trade date basis. Realized gains and losses on investments sold are determined on the basis of identified cost.
C Income — Dividend income is recorded on theex-dividend date for dividends received in cash and/or securities. However, if theex-dividend date has passed, certain dividends from foreign securities are recorded as the Fund is informed of theex-dividend date. Distributions from investment companies are recorded as dividend income, capital gains or return of capital based on the nature of the distribution. Withholding taxes on foreign dividends and capital gains have been provided for in accordance with the Fund’s understanding of the applicable countries’ tax rules and rates. In consideration of recent
| 18 |
Eaton Vance
Large-Cap Value Fund
December 31, 2018
Notes to Financial Statements — continued
decisions rendered by European courts, the Portfolio filed additional tax reclaims for previously withheld taxes on dividends earned in certain European Union countries. These filings are subject to various administrative and judicial proceedings within these countries. Due to the uncertainty as to the ultimate resolution of these proceedings, the likelihood of receipt of these reclaims, and the potential timing of payment, no amounts are reflected in the Fund’s financial statements for such outstanding reclaims. Prior to the close of business on June 15, 2018, the net investment income or loss consisted of the Fund’spro-rata share of the net investment income or loss of the Portfolio, less all actual and accrued expenses of the Fund.
D Federal Taxes — The Fund’s policy is to comply with the provisions of the Internal Revenue Code applicable to regulated investment companies and to distribute to shareholders each year substantially all of its net investment income, and all or substantially all of its net realized capital gains. Accordingly, no provision for federal income or excise tax is necessary.
As of December 31, 2018, the Fund had no uncertain tax positions that would require financial statement recognition,de-recognition, or disclosure. The Fund files a U.S. federal income tax return annually after its fiscalyear-end, which is subject to examination by the Internal Revenue Service for a period of three years from the date of filing.
E Expenses — The majority of expenses of the Trust are directly identifiable to an individual fund. Expenses which are not readily identifiable to a specific fund are allocated taking into consideration, among other things, the nature and type of expense and the relative size of the funds.
F Foreign Currency Translation — Investment valuations, other assets, and liabilities initially expressed in foreign currencies are translated each business day into U.S. dollars based upon current exchange rates. Purchases and sales of foreign investment securities and income and expenses denominated in foreign currencies are translated into U.S. dollars based upon currency exchange rates in effect on the respective dates of such transactions. Recognized gains or losses on investment transactions attributable to changes in foreign currency exchange rates are recorded for financial statement purposes as net realized gains and losses on investments. That portion of unrealized gains and losses on investments that results from fluctuations in foreign currency exchange rates is not separately disclosed.
G Use of Estimates — The preparation of the financial statements in conformity with U.S. GAAP requires management to make estimates and assumptions that affect the reported amounts of assets and liabilities at the date of the financial statements and the reported amounts of income and expense during the reporting period. Actual results could differ from those estimates.
H Indemnifications — Under the Trust’s organizational documents, its officers and Trustees may be indemnified against certain liabilities and expenses arising out of the performance of their duties to the Fund. Under Massachusetts law, if certain conditions prevail, shareholders of a Massachusetts business trust (such as the Trust) could be deemed to have personal liability for the obligations of the Trust. However, the Trust’s Declaration of Trust contains an express disclaimer of liability on the part of Fund shareholders and theBy-laws provide that the Trust shall assume the defense on behalf of any Fund shareholders. Moreover, theBy-laws also provide for indemnification out of Fund property of any shareholder held personally liable solely by reason of being or having been a shareholder for all loss or expense arising from such liability. Additionally, in the normal course of business, the Fund enters into agreements with service providers that may contain indemnification clauses. The Fund’s maximum exposure under these arrangements is unknown as this would involve future claims that may be made against the Fund that have not yet occurred.
2 Distributions to Shareholders and Income Tax Information
It is the present policy of the Fund to make quarterly distributions of all or substantially all of its net investment income and to distribute annually all or substantially all of its net realized capital gains. Distributions to shareholders are recorded on theex-dividend date. Distributions are declared separately for each class of shares. Shareholders may reinvest income and capital gain distributions in additional shares of the same class of the Fund at the net asset value as of theex-dividend date or, at the election of the shareholder, receive distributions in cash. Distributions to shareholders are determined in accordance with income tax regulations, which may differ from U.S. GAAP. As required by U.S. GAAP, only distributions in excess of tax basis earnings and profits are reported in the financial statements as a return of capital. Permanent differences between book and tax accounting relating to distributions are reclassified topaid-in capital. For tax purposes, distributions from short-term capital gains are considered to be from ordinary income.
The tax character of distributions declared for the years ended December 31, 2018 and December 31, 2017 was as follows:
| Year Ended December 31, | ||||||||
| 2018 | 2017 | |||||||
Ordinary income | $ | 24,689,422 | $ | 33,033,072 | ||||
Long-term capital gains | $ | 143,045,905 | $ | 98,463,551 | ||||
During the year ended December 31, 2018, distributable earnings was decreased by $71,215,803 andpaid-in capital was increased by $71,215,803 due to the Fund’s use of equalization accounting and differences between book and tax accounting, primarily for the Fund’s investment in the Portfolio and redemptionsin-kind. Tax equalization accounting allows the Fund to treat as a distribution that portion of redemption proceeds representing a redeeming
| 19 |
Eaton Vance
Large-Cap Value Fund
December 31, 2018
Notes to Financial Statements — continued
shareholder’s portion of undistributed taxable income and net capital gains. These reclassifications had no effect on the net assets or net asset value per share of the Fund.
As of December 31, 2018, the components of distributable earnings (accumulated loss) on a tax basis were as follows:
Net unrealized depreciation | $ | (16,359,975 | ) | |
The cost and unrealized appreciation (depreciation) of investments of the Fund at December 31, 2018, as determined on a federal income tax basis, were as follows:
Aggregate cost | $ | 1,607,808,711 | ||
Gross unrealized appreciation | $ | 125,197,156 | ||
Gross unrealized depreciation | (141,372,074 | ) | ||
Net unrealized depreciation | $ | (16,174,918 | ) | |
3 Investment Adviser Fee and Other Transactions with Affiliates
The investment adviser fee is earned by Boston Management and Research (BMR), a subsidiary of EVM, as compensation for investment advisory services rendered to the Fund. Pursuant to the investment advisory agreement dated June 15, 2018 between the Fund and BMR, the fee is computed at an annual rate of 0.625% of the Fund’s average daily net assets up to $2 billion, 0.60% on net assets of $2 billion but less than $5 billion and at reduced rates on daily net assets of $5 billion and over, and is payable monthly. Prior to the close of business on June 15, 2018, when the Fund’s assets were invested in the Portfolio, the Fund was allocated its share of the Portfolio’s investment adviser fee. The Portfolio paid advisory fees to BMR on the same fee schedule as that of the Fund as described above. For the year ended December 31, 2018, the Fund’s allocated portion of the investment adviser fee paid by the Portfolio amounted to $5,980,401 and the investment adviser fee paid by the Fund amounted to $6,464,554. For the year ended December 31, 2018, the Fund’s investment adviser fee, including the investment adviser fee allocated from the Portfolio, was 0.625% of the Fund’s average daily net assets. The Fund invests its cash in Cash Reserves Fund. EVM does not currently receive a fee for advisory services provided to Cash Reserves Fund.
EVM serves as the administrator of the Fund, but receives no compensation. EVM providessub-transfer agency and related services to the Fund pursuant to aSub-Transfer Agency Support Services Agreement. For the year ended December 31, 2018, EVM earned $117,702 from the Fund pursuant to such agreement, which is included in transfer and dividend disbursing agent fees on the Statement of Operations. The Fund was informed that Eaton Vance Distributors, Inc. (EVD), an affiliate of EVM and the Fund’s principal underwriter, received $20,819 as its portion of the sales charge on sales of Class A shares for the year ended December 31, 2018. EVD also received distribution and service fees from Class A, Class C and Class R shares (see Note 4) and contingent deferred sales charges (see Note 5).
Trustees and officers of the Fund who are members of EVM’s or BMR’s organizations receive remuneration for their services to the Fund out of the investment adviser fee. Trustees of the Fund who are not affiliated with the investment adviser may elect to defer receipt of all or a percentage of their annual fees in accordance with the terms of the Trustees Deferred Compensation Plan. For the year ended December 31, 2018, no significant amounts have been deferred. Certain officers and Trustees of the Fund are officers of the above organizations.
4 Distribution Plans
The Fund has in effect a distribution plan for Class A shares (Class A Plan) pursuant to Rule12b-1 under the 1940 Act. Pursuant to the Class A Plan, the Fund pays EVD a distribution and service fee of 0.25% per annum of its average daily net assets attributable to Class A shares for distribution services and facilities provided to the Fund by EVD, as well as for personal services and/or the maintenance of shareholder accounts. Distribution and service fees paid or accrued to EVD for the year ended December 31, 2018 amounted to $1,677,671 for Class A shares.
The Fund also has in effect distribution plans for Class C shares (Class C Plan) and Class R shares (Class R Plan) pursuant to Rule12b-1 under the 1940 Act. Pursuant to the Class C Plan, the Fund pays EVD amounts equal to 0.75% per annum of its average daily net assets attributable to Class C shares for providing ongoing distribution services and facilities to the Fund. For the year ended December 31, 2018, the Fund paid or accrued to EVD $1,623,832 for Class C shares.
The Class R Plan requires the Fund to pay EVD an amount up to 0.50% per annum of its average daily net assets attributable to Class R shares for providing ongoing distribution services and facilities to the Fund. The Trustees of the Trust have currently limited Class R distribution payments to 0.25% per annum of the average daily net assets attributable to Class R shares. For the year ended December 31, 2018, the Fund paid or accrued to EVD $187,233 for Class R shares.
| 20 |
Eaton Vance
Large-Cap Value Fund
December 31, 2018
Notes to Financial Statements — continued
Pursuant to the Class C and Class R Plans, the Fund also makes payments of service fees to EVD, financial intermediaries and other persons in amounts equal to 0.25% per annum of its average daily net assets attributable to that class. Service fees paid or accrued are for personal services and/or the maintenance of shareholder accounts. They are separate and distinct from the sales commissions and distribution fees payable to EVD. Service fees paid or accrued for the year ended December 31, 2018 amounted to $541,277 and $187,233 for Class C and Class R shares, respectively.
Distribution and service fees are subject to the limitations contained in the Financial Industry Regulatory Authority Rule 2341(d).
5 Contingent Deferred Sales Charges
A contingent deferred sales charge (CDSC) of 1% generally is imposed on redemptions of Class C shares made within one year of purchase. Class A shares may be subject to a 1% CDSC if redeemed within 18 months of purchase (depending on the circumstances of purchase). Generally, the CDSC is based upon the lower of the net asset value at date of redemption or date of purchase. No charge is levied on shares acquired by reinvestment of dividends or capital gain distributions. For the year ended December 31, 2018, the Fund was informed that EVD received less than $100 and approximately $3,000 of CDSCs paid by Class A and Class C shareholders, respectively.
6 Purchases and Sales of Investments
Purchases and sales of investments by the Portfolio, other than short-term obligations,in-kind transactions and investments transferred to the Fund, for the period from January 1, 2018 through June 15, 2018 aggregated $695,714,647 and $752,821,499, respectively.In-kind sales for the period from January 1, 2018 through June 15, 2018 aggregated $179,755,465. Purchases and sales of investments by the Fund, other than short-term obligations,in-kind transactions and investments transferred from the Portfolio, for the period from June 18, 2018 through December 31, 2018 aggregated $899,531,641 and $932,005,372, respectively.In-kind sales for the period from June 18, 2018 through December 31, 2018 aggregated $185,966,716. Increases and decreases in the Fund’s investment in the Portfolio for the period from January 1, 2018 through June 15, 2018 were $1,274,998 and $2,219,167,033, respectively. Included in decreases is $1,996,862,054, representing the Fund’s interest in the Portfolio as of the close of business on June 15, 2018, which was exchanged for the Fund’spro-rata share of net assets of the Portfolio on that date having the same fair value. The Fund’s cost of its investment in the Portfolio on such date of $1,730,663,716 was carried forward to the net assets acquired from the Portfolio and no gain or loss was recognized on the exchange.
7 Shares of Beneficial Interest
The Fund’s Declaration of Trust permits the Trustees to issue an unlimited number of full and fractional shares of beneficial interest (without par value). Such shares may be issued in a number of different series (such as the Fund) and classes. Sales and redemptions of Class I shares include shares purchased and redeemed in connection with the ReFlow liquidity program, a program designed to provide an alternative liquidity source for mutual funds experiencing net redemptions of their shares. Transactions in Fund shares were as follows:
| Year Ended December 31, | ||||||||
| Class A | 2018 | 2017 | ||||||
Sales | 3,229,434 | 3,415,398 | ||||||
Issued to shareholders electing to receive payments of distributions in Fund shares | 2,895,017 | 2,080,537 | ||||||
Redemptions | (10,802,967 | ) | (19,792,778 | ) | ||||
Net decrease | (4,678,516 | ) | (14,296,843 | ) | ||||
| Year Ended December 31, | ||||||||
| Class C | 2018 | 2017 | ||||||
Sales | 467,859 | 553,201 | ||||||
Issued to shareholders electing to receive payments of distributions in Fund shares | 831,675 | 551,526 | ||||||
Redemptions | (3,430,078 | ) | (5,418,102 | ) | ||||
Net decrease | (2,130,544 | ) | (4,313,375 | ) | ||||
| 21 |
Eaton Vance
Large-Cap Value Fund
December 31, 2018
Notes to Financial Statements — continued
| Year Ended December 31, | ||||||||
| Class I | 2018 | 2017 | ||||||
Sales | 27,452,103 | 45,453,216 | ||||||
Issued to shareholders electing to receive payments of distributions in Fund shares | 3,500,040 | 2,809,201 | ||||||
Redemptions | (39,195,998 | ) | (81,538,166 | ) | ||||
Net decrease | (8,243,855 | ) | (33,275,749 | ) | ||||
| Year Ended December 31, | ||||||||
| Class R | 2018 | 2017 | ||||||
Sales | 494,807 | 596,258 | ||||||
Issued to shareholders electing to receive payments of distributions in Fund shares | 319,168 | 231,042 | ||||||
Redemptions | (1,562,335 | ) | (1,991,331 | ) | ||||
Net decrease | (748,360 | ) | (1,164,031 | ) | ||||
| Year Ended December 31, | ||||||||
| Class R6 | 2018 | 2017 | ||||||
Sales | 7,126,880 | 3,193,361 | ||||||
Issued to shareholders electing to receive payments of distributions in Fund shares | 535,679 | 287,615 | ||||||
Redemptions | (7,683,357 | ) | (1,182,622 | ) | ||||
Net increase (decrease) | (20,798 | ) | 2,298,354 | |||||
8 Line of Credit
The Fund participates with other portfolios and funds managed by EVM and its affiliates in a $625 million unsecured line of credit agreement with a group of banks, which is in effect through October 29, 2019. Borrowings are made by the Fund solely to facilitate the handling of unusual and/or unanticipated short-term cash requirements. Interest is charged to the Fund based on its borrowings at an amount above either the Eurodollar rate or Federal Funds rate. In addition, a fee computed at an annual rate of 0.15% on the daily unused portion of the line of credit is allocated among the participating portfolios and funds at the end of each quarter. Because the line of credit is not available exclusively to the Fund, it may be unable to borrow some or all of its requested amounts at any particular time. The Fund did not have any significant borrowings or allocated fees during the year ended December 31, 2018.
9 Securities Lending Agreement
The Fund has established a securities lending agreement with State Street Bank and Trust Company (SSBT) as securities lending agent in which the Fund lends portfolio securities to qualified borrowers in exchange for collateral consisting of either cash or securities issued or guaranteed by the U.S. Government or its agencies or instrumentalities in an amount at least equal to the market value of the securities on loan. The market value of securities loaned is determined daily and any additional required collateral is delivered to the Fund on the next business day. Cash collateral is invested in the State Street Navigator Securities Lending Government Money Market Portfolio, a money market fund registered under the 1940 Act. The Fund earns interest on the amount invested but it must pay (and at times receive from) the broker a loan rebate fee computed as a varying percentage of the collateral received. For security loans secured bynon-cash collateral, the Fund earns a negotiated lending fee from the borrower. A portion of the income earned by the Fund from its investment of cash collateral, net of rebate fees, and lending fees received is allocated to SSBT for its services as lending agent and the portion allocated to the Fund is presented as securities lending income, net on the Statement of Operations.Non-cash collateral is held by the lending agent on behalf of the Fund and cannot be sold orre-pledged by the Fund; accordingly, such collateral is not reflected in the Statement of Assets and Liabilities.
The Fund is subject to possible delay in the recovery of loaned securities. Pursuant to the securities lending agreement, SSBT has provided indemnification to the Fund in the event of default by a borrower with respect to a loan. The Fund bears the risk of loss with respect to the investment of cash collateral.
At December 31, 2018, the value of the securities loaned (all common stocks) and the value of the collateral received, which exceeded the value of the securities loaned, amounted to $72,009,552 and $72,847,885, respectively. Collateral received was comprised of U.S. Government and/or agencies
| 22 |
Eaton Vance
Large-Cap Value Fund
December 31, 2018
Notes to Financial Statements — continued
securities. The securities lending transactions have no contractual maturity date and each of the Fund and borrower has the option to terminate a loan at any time.
10 Fair Value Measurements
Under generally accepted accounting principles for fair value measurements, a three-tier hierarchy to prioritize the assumptions, referred to as inputs, is used in valuation techniques to measure fair value. The three-tier hierarchy of inputs is summarized in the three broad levels listed below.
| • | Level 1 – quoted prices in active markets for identical investments |
| • | Level 2 – other significant observable inputs (including quoted prices for similar investments, interest rates, prepayment speeds, credit risk, etc.) |
| • | Level 3 – significant unobservable inputs (including a fund’s own assumptions in determining the fair value of investments) |
In cases where the inputs used to measure fair value fall in different levels of the fair value hierarchy, the level disclosed is determined based on the lowest level input that is significant to the fair value measurement in its entirety. The inputs or methodology used for valuing securities are not necessarily an indication of the risk associated with investing in those securities.
At December 31, 2018, the hierarchy of inputs used in valuing the Fund’s investments, which are carried at value, were as follows:
| Asset Description | Level 1 | Level 2 | Level 3 | Total | ||||||||||||
Common Stocks | ||||||||||||||||
Communication Services | $ | 100,141,188 | $ | — | $ | — | $ | 100,141,188 | ||||||||
Consumer Discretionary | 100,416,682 | — | — | 100,416,682 | ||||||||||||
Consumer Staples | 112,766,356 | — | — | 112,766,356 | ||||||||||||
Energy | 158,012,980 | — | — | 158,012,980 | ||||||||||||
Financials | 330,755,860 | 10,062,052 | — | 340,817,912 | ||||||||||||
Health Care | 264,744,895 | — | — | 264,744,895 | ||||||||||||
Industrials | 134,143,514 | — | — | 134,143,514 | ||||||||||||
Information Technology | 128,477,262 | — | — | 128,477,262 | ||||||||||||
Materials | 73,483,107 | — | — | 73,483,107 | ||||||||||||
Real Estate | 63,633,377 | — | — | 63,633,377 | ||||||||||||
Utilities | 108,429,554 | — | — | 108,429,554 | ||||||||||||
Total Common Stocks | $ | 1,575,004,775 | $ | 10,062,052 | * | $ | — | $ | 1,585,066,827 | |||||||
Short-Term Investments | $ | — | $ | 6,566,966 | $ | — | $ | 6,566,966 | ||||||||
Total Investments | $ | 1,575,004,775 | $ | 16,629,018 | $ | — | $ | 1,591,633,793 | ||||||||
| * | Includes foreign equity securities whose values were adjusted to reflect market trading of comparable securities or other correlated instruments that occurred after the close of trading in their applicable foreign markets. |
| 23 |
Eaton Vance
Large-Cap Value Fund
December 31, 2018
Report of Independent Registered Public Accounting Firm
To the Trustees of Eaton Vance Special Investment Trust and Shareholders of Eaton VanceLarge-Cap Value Fund:
Opinion on the Financial Statements and Financial Highlights
We have audited the accompanying statement of assets and liabilities of Eaton VanceLarge-Cap Value Fund (the “Fund”) (one of the funds constituting Eaton Vance Special Investment Trust), including the portfolio of investments, as of December 31, 2018, the related statement of operations for the year then ended, the statements of changes in net assets for each of the two years in the period then ended, the financial highlights for each of the five years in the period then ended, and the related notes. In our opinion, the financial statements and financial highlights present fairly, in all material respects, the financial position of the Fund as of December 31, 2018, and the results of its operations for the year then ended, the changes in its net assets for each of the two years in the period then ended, and the financial highlights for each of the five years in the period then ended, in conformity with accounting principles generally accepted in the United States of America.
Basis for Opinion
These financial statements and financial highlights are the responsibility of the Fund’s management. Our responsibility is to express an opinion on the Fund’s financial statements and financial highlights based on our audits. We are a public accounting firm registered with the Public Company Accounting Oversight Board (United States) (PCAOB) and are required to be independent with respect to the Fund in accordance with the U.S. federal securities laws and the applicable rules and regulations of the Securities and Exchange Commission and the PCAOB.
We conducted our audits in accordance with the standards of the PCAOB. Those standards require that we plan and perform the audit to obtain reasonable assurance about whether the financial statements and financial highlights are free of material misstatement, whether due to error or fraud. The Fund is not required to have, nor were we engaged to perform, an audit of its internal control over financial reporting. As part of our audits we are required to obtain an understanding of internal control over financial reporting but not for the purpose of expressing an opinion on the effectiveness of the Fund’s internal control over financial reporting. Accordingly, we express no such opinion.
Our audits included performing procedures to assess the risks of material misstatement of the financial statements and financial highlights, whether due to error or fraud, and performing procedures that respond to those risks. Such procedures included examining, on a test basis, evidence regarding the amounts and disclosures in the financial statements and financial highlights. Our audits also included evaluating the accounting principles used and significant estimates made by management, as well as evaluating the overall presentation of the financial statements and financial highlights. Our procedures included confirmation of securities owned as of December 31, 2018, by correspondence with the custodian and brokers; when replies were not received from brokers, we performed other auditing procedures. We believe that our audits provide a reasonable basis for our opinion.
/s/ Deloitte & Touche LLP
Boston, Massachusetts
February 20, 2019
We have served as the auditor of one or more Eaton Vance investment companies since 1959.
| 24 |
Eaton Vance
Large-Cap Value Fund
December 31, 2018
Federal Tax Information (Unaudited)
The Form1099-DIV you received in February 2019 showed the tax status of all distributions paid to your account in calendar year 2018. Shareholders are advised to consult their own tax adviser with respect to the tax consequences of their investment in the Fund. As required by the Internal Revenue Code and/or regulations, shareholders must be notified regarding the status of qualified dividend income for individuals, the dividends received deduction for corporations and capital gains dividends.
Qualified Dividend Income. For the fiscal year ended December 31, 2018, the Fund designates approximately $38,941,285, or up to the maximum amount of such dividends allowable pursuant to the Internal Revenue Code, as qualified dividend income eligible for the reduced tax rate of 15%.
Dividends Received Deduction. Corporate shareholders are generally entitled to take the dividends received deduction on the portion of the Fund’s dividend distribution that qualifies under tax law. For the Fund’s fiscal 2018 ordinary income dividends, 87.7% qualifies for the corporate dividends received deduction.
Capital Gains Dividends. The Fund hereby designates as a capital gain dividend with respect to the taxable year ended December 31, 2018, $148,156,056 or, if subsequently determined to be different, the net capital gain of such year.
| 25 |
Eaton Vance
Large-Cap Value Fund
December 31, 2018
Special Meeting of Shareholders (Unaudited)
The Fund held a Special Meeting of Shareholders on September 20, 2018 to elect the five Trustees listed below. The other Trustees named herein continue to serve as Trustees. The results of the vote with respect to the Fund were as follows:
Nominee for Trustee | Number of Shares | |||||||
| For | Withheld | |||||||
Mark R. Fetting | 73,117,966 | 914,941 | ||||||
Keith Quinton | 73,103,713 | 929,194 | ||||||
Marcus L. Smith | 73,030,793 | 1,002,114 | ||||||
Susan J. Sutherland | 73,114,547 | 918,360 | ||||||
Scott E. Wennerholm | 73,154,292 | 878,615 | ||||||
Results are rounded to the nearest whole number.
| 26 |
Eaton Vance
Large-Cap Value Fund
December 31, 2018
Management and Organization
Fund Management. The Trustees of Eaton Vance Special Investment Trust (the Trust) are responsible for the overall management and supervision of the Trust’s affairs. The Trustees and officers of the Trust are listed below. Except as indicated, each individual has held the office shown or other offices in the same company for the last five years. Trustees and officers of the Trust hold indefinite terms of office. The “noninterested Trustees” consist of those Trustees who are not “interested persons” of the Trust, as that term is defined under the 1940 Act. The business address of each Trustee and officer is Two International Place, Boston, Massachusetts 02110. As used below, “EVC” refers to Eaton Vance Corp., “EV” refers to Eaton Vance, Inc., “EVM” refers to Eaton Vance Management, “BMR” refers to Boston Management and Research and “EVD” refers to Eaton Vance Distributors, Inc. EVC and EV are the corporate parent and trustee, respectively, of EVM and BMR. EVD is the Fund’s principal underwriter and a wholly-owned subsidiary of EVC. Each officer affiliated with Eaton Vance may hold a position with other Eaton Vance affiliates that is comparable to his or her position with EVM listed below. Each Trustee oversees 175 portfolios in the Eaton Vance Complex (including all master and feeder funds in a master feeder structure). Each officer serves as an officer of certain other Eaton Vance funds. Each Trustee and officer serves until his or her successor is elected.
| Name and Year of Birth | Position(s) with the | Trustee Since(1) | Principal Occupation(s) and Directorships During Past Five Years and Other Relevant Experience | |||
| Interested Trustee | ||||||
Thomas E. Faust Jr. 1958 | Trustee | 2007 | Chairman, Chief Executive Officer and President of EVC, Director and President of EV, Chief Executive Officer and President of EVM and BMR, and Director of EVD. Trustee and/or officer of 175 registered investment companies. Mr. Faust is an interested person because of his positions with EVM, BMR, EVD, EVC and EV, which are affiliates of the Trust. Directorships in the Last Five Years.(2)Director of EVC and Hexavest Inc. (investment management firm). | |||
| Noninterested Trustees | ||||||
Mark R. Fetting 1954 | Trustee | 2016 | Private investor. Formerly held various positions at Legg Mason, Inc. (investment management firm) (2000-2012), including President, Chief Executive Officer, Director and Chairman (2008-2012), Senior Executive Vice President (2004-2008) and Executive Vice President (2001-2004). Formerly, President of Legg Mason family of funds (2001-2008). Formerly, Division President and Senior Officer of Prudential Financial Group, Inc. and related companies (investment management firm)(1991-2000). Directorships in the Last Five Years. None. | |||
Cynthia E. Frost 1961 | Trustee | 2014 | Private investor. Formerly, Chief Investment Officer of Brown University (university endowment) (2000-2012). Formerly, Portfolio Strategist for Duke Management Company (university endowment manager) (1995-2000). Formerly, Managing Director, Cambridge Associates (investment consulting company) (1989-1995). Formerly, Consultant, Bain and Company (management consulting firm) (1987-1989). Formerly, Senior Equity Analyst, BA Investment Management Company (1983-1985). Directorships in the Last Five Years.None. | |||
George J. Gorman 1952 | Trustee | 2014 | Principal at George J. Gorman LLC (consulting firm). Formerly, Senior Partner at Ernst & Young LLP (a registered public accounting firm) (1974-2009). Directorships in the Last Five Years.Formerly, Trustee of the BofA Funds Series Trust (11 funds) (2011-2014) and of the Ashmore Funds (9 funds) (2010-2014). | |||
Valerie A. Mosley 1960 | Trustee | 2014 | Chairwoman and Chief Executive Officer of Valmo Ventures (a consulting and investment firm). Former Partner and Senior Vice President, Portfolio Manager and Investment Strategist at Wellington Management Company, LLP (investment management firm) (1992-2012). Former Chief Investment Officer, PG Corbin Asset Management (1990-1992). Formerly worked in institutional corporate bond sales at Kidder Peabody (1986-1990). Directorships in the Last Five Years.(2)Director of Envestnet, Inc. (provider of intelligent systems for wealth management and financial wellness) (since 2018). | |||
William H. Park 1947 | Chairperson of the Board and Trustee | 2016 (Chairperson) 2003 (Trustee) | Private investor. Formerly, Consultant (management and transactional) (2012-2014). Formerly, Chief Financial Officer, Aveon Group L.P. (investment management firm) (2010-2011). Formerly, Vice Chairman, Commercial Industrial Finance Corp. (specialty finance company) (2006-2010). Formerly, President and Chief Executive Officer, Prizm Capital Management, LLC (investment management firm) (2002-2005). Formerly, Executive Vice President and Chief Financial Officer, United Asset Management Corporation (investment management firm) (1982-2001). Formerly, Senior Manager, Price Waterhouse (now PricewaterhouseCoopers) (a registered public accounting firm) (1972-1981). Directorships in the Last Five Years.(2)None. | |||
| 27 |
Eaton Vance
Large-Cap Value Fund
December 31, 2018
Management and Organization — continued
| Name and Year of Birth | Position(s) with the | Trustee Since(1) | Principal Occupation(s) and Directorships During Past Five Years and Other Relevant Experience | |||
| Noninterested Trustees (continued) | ||||||
Helen Frame Peters 1948 | Trustee | 2008 | Professor of Finance, Carroll School of Management, Boston College. Formerly, Dean, Carroll School of Management, Boston College (2000-2002). Formerly, Chief Investment Officer, Fixed Income, Scudder Kemper Investments (investment management firm) (1998-1999). Formerly, Chief Investment Officer, Equity and Fixed Income, Colonial Management Associates (investment management firm) (1991-1998). Directorships in the Last Five Years.(2) None. | |||
Keith Quinton(3) 1958 | Trustee | 2018 | Independent Investment Committee Member at New Hampshire Retirement System (since 2017). Advisory Committee member at Northfield Information Services, Inc. (risk management analytics provider) (since 2016). Formerly, Portfolio Manager and Senior Quantitative Analyst at Fidelity Investments (investment management firm) (2001-2014). Directorships in the Last Five Years. Director of New Hampshire Municipal Bond Bank (since 2016). | |||
Marcus L. Smith(3) 1966 | Trustee | 2018 | Member of Posse Boston Advisory Board (foundation) (since 2015); Trustee at University of Mount Union (since 2008). Formerly, Portfolio Manager at MFS Investment Management (investment management firm) (1994-2017). Directorships in the Last Five Years. Director of MSCI Inc. (global provider of investment decision support tools) (since 2017). Director of DCT Industrial Trust Inc. (logistics real estate company) (since 2017). | |||
Susan J. Sutherland 1957 | Trustee | 2015 | Private investor. Formerly, Associate, Counsel and Partner at Skadden, Arps, Slate, Meagher & Flom LLP (law firm) (1982-2013). Directorships in the Last Five Years. Formerly, Director of Montpelier Re Holdings Ltd. (global provider of customized insurance and reinsurance products) (2013-2015). | |||
Scott E. Wennerholm 1959 | Trustee | 2016 | Formerly, Trustee at Wheelock College (postsecondary institution) (2012-2018). Formerly, Consultant at GF Parish Group (executive recruiting firm) (2016-2017). Formerly, Chief Operating Officer and Executive Vice President at BNY Mellon Asset Management (investment management firm) (2005-2011). Formerly, Chief Operating Officer and Chief Financial Officer at Natixis Global Asset Management (investment management firm) (1997-2004). Formerly, Vice President at Fidelity Investments Institutional Services (investment management firm) (1994-1997). Directorships in the Last Five Years. None. | |||
| Name and Year of Birth | Position(s) with the Trust | Officer Since(4) | Principal Occupation(s) During Past Five Years | |||
Principal Officers who are not Trustees | ||||||
Payson F. Swaffield 1956 | President of the Trust | 2003 | Vice President and Chief Income Investment Officer of EVM and BMR. Also Vice President of Calvert Research and Management (“CRM”). | |||
Maureen A. Gemma 1960 | Vice President, Secretary and Chief Legal Officer | 2005 | Vice President of EVM and BMR. Also Vice President of CRM. | |||
James F. Kirchner 1967 | Treasurer | 2007 | Vice President of EVM and BMR. Also Vice President of CRM. | |||
Richard F. Froio 1968 | Chief Compliance Officer | 2017 | Vice President of EVM and BMR since 2017. Formerly Deputy Chief Compliance Officer (Adviser/Funds) and Chief Compliance Officer (Distribution) at PIMCO (2012-2017) and Managing Director at BlackRock/Barclays Global Investors (2009-2012). | |||
| (1) | Year first appointed to serve as Trustee for a fund in the Eaton Vance family of funds. Each Trustee has served continuously since appointment unless indicated otherwise. |
| (2) | During their respective tenures, the Trustees (except for Mmes. Frost and Sutherland and Messrs. Fetting, Gorman, Quinton, Smith and Wennerholm) also served as Board members of one or more of the following funds (which operated in the years noted): eUnitsTM 2 Year U.S. Market Participation Trust: Upside to Cap / Buffered Downside (launched in 2012 and terminated in 2014); and eUnitsTM 2 Year U.S. Market Participation Trust II: Upside to Cap / Buffered Downside (launched in 2012 and terminated in 2014). However, Ms. Mosley did not serve as a Board member of eUnitsTM 2 Year U.S. Market Participation Trust: Upside to Cap / Buffered Downside (launched in 2012 and terminated in 2014). |
| 28 |
Eaton Vance
Large-Cap Value Fund
December 31, 2018
Management and Organization — continued
| (3) | Messrs. Quinton and Smith began serving as Trustees effective October 1, 2018. |
| (4) | Year first elected to serve as officer of a fund in the Eaton Vance family of funds when the officer has served continuously. Otherwise, year of most recent election as an officer of a fund in the Eaton Vance family of funds. Titles may have changed since initial election. |
The SAI for the Fund includes additional information about the Trustees and officers of the Fund can be obtained without charge on Eaton Vance’s website at www.eatonvance.com or by calling1-800-262-1122.
| 29 |
Eaton Vance Funds
IMPORTANT NOTICES
Privacy. The Eaton Vance organization is committed to ensuring your financial privacy. Each of the financial institutions identified below has in effect the following policy (“Privacy Policy”) with respect to nonpublic personal information about its customers:
| • | Only such information received from you, through application forms or otherwise, and information about your Eaton Vance fund transactions will be collected. This may include information such as name, address, social security number, tax status, account balances and transactions. |
| • | None of such information about you (or former customers) will be disclosed to anyone, except as permitted by law (which includes disclosure to employees necessary to service your account). In the normal course of servicing a customer’s account, Eaton Vance may share information with unaffiliated third parties that perform various required services such as transfer agents, custodians and broker-dealers. |
| • | Policies and procedures (including physical, electronic and procedural safeguards) are in place that are designed to protect the confidentiality of such information. |
| • | We reserve the right to change our Privacy Policy at any time upon proper notification to you. Customers may want to review our Privacy Policy periodically for changes by accessing the link on our homepage: www.eatonvance.com. |
Our pledge of privacy applies to the following entities within the Eaton Vance organization: the Eaton Vance Family of Funds, Eaton Vance Management, Eaton Vance Investment Counsel, Eaton Vance Distributors, Inc., Eaton Vance Trust Company, Eaton Vance Management (International) Limited, Eaton Vance Advisers International Ltd., Eaton Vance Management’s Real Estate Investment Group and Boston Management and Research. In addition, our Privacy Policy applies only to those Eaton Vance customers who are individuals and who have a direct relationship with us. If a customer’s account (i.e., fund shares) is held in the name of a third-party financial advisor/broker-dealer, it is likely that only such advisor’s privacy policies apply to the customer. This notice supersedes all previously issued privacy disclosures. For more information about Eaton Vance’s Privacy Policy, please call1-800-262-1122.
Delivery of Shareholder Documents. The Securities and Exchange Commission (SEC) permits funds to deliver only one copy of shareholder documents, including prospectuses, proxy statements and shareholder reports, to fund investors with multiple accounts at the same residential or post office box address. This practice is often called “householding” and it helps eliminate duplicate mailings to shareholders.Eaton Vance, or your financial advisor, may household the mailing of your documents indefinitely unless you instruct Eaton Vance, or your financial advisor, otherwise.If you would prefer that your Eaton Vance documents not be householded, please contact Eaton Vance at1-800-262-1122, or contact your financial advisor. Your instructions that householding not apply to delivery of your Eaton Vance documents will typically be effective within 30 days of receipt by Eaton Vance or your financial advisor.
Portfolio Holdings. Each Eaton Vance Fund and its underlying Portfolio(s) (if applicable) will file a schedule of portfolio holdings on FormN-Q with the SEC for the first and third quarters of each fiscal year. The FormN-Q will be available on the Eaton Vance website at www.eatonvance.com, by calling Eaton Vance at1-800-262-1122 or in the EDGAR database on the SEC’s website at www.sec.gov. FormN-Q may also be reviewed and copied at the SEC’s public reference room in Washington, D.C. (call1-800-732-0330 for information on the operation of the public reference room).
Proxy Voting. From time to time, funds are required to vote proxies related to the securities held by the funds. The Eaton Vance Funds or their underlying Portfolios (if applicable) vote proxies according to a set of policies and procedures approved by the Funds’ and Portfolios’ Boards. You may obtain a description of these policies and procedures and information on how the Funds or Portfolios voted proxies relating to portfolio securities during the most recent12-month period ended June 30, without charge, upon request, by calling1-800-262-1122 and by accessing the SEC’s website at www.sec.gov.
| 30 |
This Page Intentionally Left Blank
This Page Intentionally Left Blank
Investment Adviser
Boston Management and Research
Two International Place
Boston, MA 02110
Administrator
Eaton Vance Management
Two International Place
Boston, MA 02110
Principal Underwriter*
Eaton Vance Distributors, Inc.
Two International Place
Boston, MA 02110
(617)482-8260
Custodian
State Street Bank and Trust Company
State Street Financial Center, One Lincoln Street
Boston, MA 02111
Transfer Agent
BNY Mellon Investment Servicing (US) Inc.
Attn: Eaton Vance Funds
P.O. Box 9653
Providence, RI 02940-9653
(800)262-1122
Independent Registered Public Accounting Firm
Deloitte & Touche LLP
200 Berkeley Street
Boston, MA 02116-5022
Fund Offices
Two International Place
Boston, MA 02110
| * | FINRA BrokerCheck. Investors may check the background of their Investment Professional by contacting the Financial Industry Regulatory Authority (FINRA). FINRA BrokerCheck is a free tool to help investors check the professional background of current and former FINRA-registered securities firms and brokers. FINRA BrokerCheck is available by calling1-800-289-9999 and at www.FINRA.org. The FINRA BrokerCheck brochure describing this program is available to investors at www.FINRA.org. |

173 12.31.18

Eaton Vance
Real Estate Fund
Annual Report
December 31, 2018
Important Note. Beginning on January 1, 2021, as permitted by regulations adopted by the Securities and Exchange Commission, paper copies of the Fund’s annual and semi-annual shareholder reports will no longer be sent by mail unless you specifically request paper copies of the reports. Instead, the reports will be made available on the Fund’s website (eatonvance.com/funddocuments), and you will be notified by mail each time a report is posted and provided with a website address to access the report.
If you already elected to receive shareholder reports electronically, you will not be affected by this change and you need not take any action. If you are a direct investor, you may elect to receive shareholder reports and other communications from the Fund electronically by signing up fore-Delivery at eatonvance.com/edelivery. If you own your shares through a financial intermediary (such as a broker-dealer or bank), you must contact your financial intermediary to sign up.
You may elect to receive all future Fund shareholder reports in paper free of charge. If you are a direct investor, you can inform the Fund that you wish to continue receiving paper copies of your shareholder reports by calling1-800-262-1122. If you own these shares through a financial intermediary, you must contact your financial intermediary or follow instructions included with this disclosure, if applicable, to elect to continue to receive paper copies of your shareholder reports. Your election to receive reports in paper will apply to all Eaton Vance funds held directly or to all funds held through your financial intermediary, as applicable.

Commodity Futures Trading Commission Registration. Effective December 31, 2012, the Commodity Futures Trading Commission (“CFTC”) adopted certain regulatory changes that subject registered investment companies and advisers to regulation by the CFTC if a fund invests more than a prescribed level of its assets in certain CFTC-regulated instruments (including futures, certain options and swap agreements) or markets itself as providing investment exposure to such instruments. The Fund has claimed an exclusion from the definition of the term “commodity pool operator” under the Commodity Exchange Act. Accordingly, neither the Fund nor the adviser with respect to the operation of the Fund is subject to CFTC regulation. Because of its management of other strategies, the Fund’s adviser is registered with the CFTC as a commodity pool operator and a commodity trading advisor.
Fund shares are not insured by the FDIC and are not deposits or other obligations of, or guaranteed by, any depository institution. Shares are subject to investment risks, including possible loss of principal invested.
This report must be preceded or accompanied by a current summary prospectus or prospectus. Before investing, investors should consider carefully the investment objective, risks, and charges and expenses of a mutual fund. This and other important information is contained in the summary prospectus and prospectus, which can be obtained from a financial advisor. Prospective investors should read the prospectus carefully before investing. For further information, please call1-800-262-1122.
Annual Report December 31, 2018
Eaton Vance
Real Estate Fund
Table of Contents
Management’s Discussion of Fund Performance | 2 | |||
Performance | 3 | |||
Fund Profile | 4 | |||
Endnotes and Additional Disclosures | 5 | |||
Fund Expenses | 6 | |||
Financial Statements | 7 | |||
Report of Independent Registered Public Accounting Firm | 18 | |||
Federal Tax Information | 19 | |||
Special Meeting of Shareholders | 20 | |||
Management and Organization | 21 | |||
Important Notices | 24 | |||
Eaton Vance
Real Estate Fund
December 31, 2018
Management’s Discussion of Fund Performance1
Economic and Market Conditions
U.S. stock indexes declined during the12-month period ended December 31, 2018, as a sharp downturn in the final quarter of the year erased earlier gains.
U.S. stocks opened the period on an upswing, as investors reacted favorably to the passage of the Republican tax reform package in December 2017. Sharp cuts in corporate taxes, a key element of the bill, raised corporate-profit expectations. U.S. stocks also got a boost from positive U.S. economic data, including the unemployment rate, which fell to a17-year low.
In February 2018, however, U.S. stocks pulled back amid fears that rising interest rates might boost the appeal of fixed-income investments. After a brief rebound, equity markets again weakened in the spring of 2018, as investors confronted the prospect of a global trade war due to President Trump’s then-new tariffs. The broad tariffs drew retaliatory actions from impacted countries including China, Canada, and certain countries in the European Union.
U.S. stocks bounced back during the summer months led by technology stocks, which rebounded following an earlier setback from a wave of data-privacy scandals. Markets plunged in the final three months of the period amid global trade war fears and sagging economies in China and Europe. Despite a partial rebound in the final days of the period, the U.S. stock market’s December 2018 plunge was the worst monthly loss since the 2008 financial crisis.
Amid investor worries, however, U.S. economic data remained largely positive during the period, prompting the U.S. Federal Reserve (the Fed) to raise the federal funds rate in December 2018 for the fourth time during the period. Since then, the Fed has indicated that it may reconsider its planned 2019 rate hikes.
For the12-month period ended December 31, 2018, theblue-chip Dow Jones Industrial Average®2 declined 3.48%, while the broader U.S. equity market represented by the S&P 500® Index fell 4.38%. The technology-laden NASDAQ Composite Index fell 2.84% during the period.Large-cap U.S. stocks as measured by the S&P 500® Index generally outperformed theirsmall-cap counterparts as measured by the Russell 2000® Index during the period. Growth stocks as a group outpaced value stocks in both the large- andsmall-cap categories, as measured by the Russell Growth and Value Indexes.
Fund Performance
For the12-month period ended December 31, 2018, Eaton Vance Real Estate Fund (the Fund) returned –4.61% for Class A shares at net asset value (NAV), underperforming its primary benchmark, the Dow Jones U.S. Select Real Estate Securities Index (the Index), which returned –4.22%.
The Fund underperformed the Index due to sector and industry allocations. Stock selections made a positive contribution to relative Fund performance versus the Index. Three of the 10property-type groups in the Fund had positive absolute returns during the period. The Index had positive returns in three of its eight industry groups.
Real estate investment trusts (REITs), which represented a majority of the Fund’s holdings during the period, delivered negative results, but slightly outperformed the broader stock market. REITs performed poorly early in the period amid concerns about rising long-term interest rates, but recovered later in the year as rates eased.
The residentialproperty-type group was the biggest detractor from relative Fund performance versus the Index due to stock selections during the period. Among the Fund’s weakest stocks was Invitation Homes, Inc., an owner of single-family rental homes, which was hurt by rising operating costs and capital expenses.
The hotels, resorts & cruise lines group, anout-of-Index holding, also constrained relative Fund results. Hotel operator Marriott International, Inc. lagged the Index during the period, as its financial results failed to meet investor expectations.
An underweight position in the health careproperty-type group dragged down Fund performance relative to the Index, as the group outperformed during the period. In particular, the Fund’s limited exposure to medical property REIT Welltower, Inc. hurt relative performance, as the company outperformed the Index.
On the positive side, stock selections in the retailproperty-type group boosted relative Fund results versus the Index during the period. Upscale shopping mall owner Simon Property Group, Inc. contributed positively to performance, exceeding investor expectations. The diversified property group also boosted relative Fund performance due to stock selections. STORE Capital Corp. — owner of fast food outlets, convenience stores, and othernet-leased retail properties — was among the Fund’sbest-performing stocks amid a strong economy. The Fund benefited from an underweight position in the lagging officeproperty-type group, especially a lack of exposure to New York City-based SL Green Realty Corp. Shares in the office-building owner declined amid a softening New York City rental market.
Also among the Fund’s top stocks was warehouse owner DCT Industrial Trust, Inc., which was acquired during the period by Prologis, Inc. in astock-for-stock transaction at a premium to its stock price.
See Endnotes and Additional Disclosures in this report.
Past performance is no guarantee of future results. Returns are historical and are calculated by determining the percentage change in net asset value (NAV) or offering price (as applicable) with all distributions reinvested. Investment return and principal value will fluctuate so that shares, when redeemed, may be worth more or less than their original cost. Performance less than or equal to one year is cumulative. Performance is for the stated time period only; due to market volatility, the Fund’s current performance may be lower or higher than quoted. Returns are before taxes unless otherwise noted. For performance as of the most recent month-end, please refer to eatonvance.com.
| 2 |
Eaton Vance
Real Estate Fund
December 31, 2018
Performance2,3
Portfolio Manager J. Scott Craig
| % Average Annual Total Returns | Class Inception Date | Performance Inception Date | One Year | Five Years | Ten Years | |||||||||||||||
Class A at NAV | 06/09/2010 | 04/28/2006 | –4.61 | % | 7.74 | % | 11.68 | % | ||||||||||||
Class A with 5.75% Maximum Sales Charge | — | — | –10.10 | 6.47 | 11.02 | |||||||||||||||
Class I at NAV | 04/28/2006 | 04/28/2006 | –4.43 | 7.98 | 11.90 | |||||||||||||||
Dow Jones U.S. Select Real Estate Securities Index | — | — | –4.22 | % | 7.86 | % | 12.06 | % | ||||||||||||
S&P 500® Index | — | — | –4.38 | 8.49 | 13.11 | |||||||||||||||
| % Total Annual Operating Expense Ratios4 | Class A | Class I | ||||||||||||||||||
Gross | 1.42 | % | 1.17 | % | ||||||||||||||||
Net | 1.25 | 1.00 | ||||||||||||||||||
Growth of $10,0003
This graph shows the change in value of a hypothetical investment of $10,000 in Class A of the Fund for the period indicated. For comparison, the same investment is shown in the indicated index.
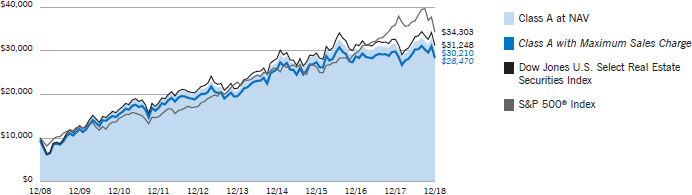
| Growth of Investment | Amount Invested | Period Beginning | At NAV | With Maximum Sales Charge | ||||||||||||
Class I | $ | 250,000 | 12/31/2008 | $ | 770,261 | N.A. | ||||||||||
See Endnotes and Additional Disclosures in this report.
Past performance is no guarantee of future results. Returns are historical and are calculated by determining the percentage change in net asset value (NAV) or offering price (as applicable) with all distributions reinvested. Investment return and principal value will fluctuate so that shares, when redeemed, may be worth more or less than their original cost. Performance less than or equal to one year is cumulative. Performance is for the stated time period only; due to market volatility, the Fund’s current performance may be lower or higher than quoted. Returns are before taxes unless otherwise noted. For performance as of the most recent month-end, please refer to eatonvance.com.
| 3 |
Eaton Vance
Real Estate Fund
December 31, 2018
Fund Profile
Sector Allocation (% of net assets)5
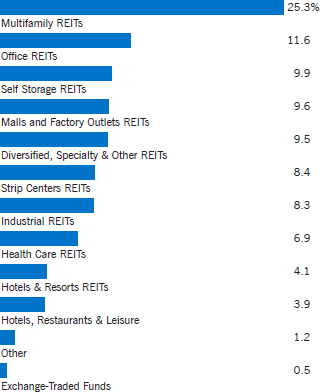
Top 10 Holdings (% of net assets)5
Simon Property Group, Inc. | 9.0 | % | ||
AvalonBay Communities, Inc. | 6.3 | |||
Public Storage | 5.8 | |||
Equity Residential | 5.5 | |||
Mid-America Apartment Communities, Inc. | 5.0 | |||
Boston Properties, Inc. | 4.8 | |||
ProLogis, Inc. | 3.9 | |||
Invitation Homes, Inc. | 3.4 | |||
Regency Centers Corp. | 2.8 | |||
Welltower, Inc. | 2.5 | |||
Total | 49.0 | % | ||
See Endnotes and Additional Disclosures in this report.
| 4 |
Eaton Vance
Real Estate Fund
December 31, 2018
Endnotes and Additional Disclosures
| 1 | The views expressed in this report are those of the portfolio manager(s) and are current only through the date stated at the top of this page. These views are subject to change at any time based upon market or other conditions, and Eaton Vance and the Fund(s) disclaim any responsibility to update such views. These views may not be relied upon as investment advice and, because investment decisions are based on many factors, may not be relied upon as an indication of trading intent on behalf of any Eaton Vance fund. This commentary may contain statements that are not historical facts, referred to as “forward looking statements.” The Fund’s actual future results may differ significantly from those stated in any forward looking statement, depending on factors such as changes in securities or financial markets or general economic conditions, the volume of sales and purchases of Fund shares, the continuation of investment advisory, administrative and service contracts, and other risks discussed from time to time in the Fund’s filings with the Securities and Exchange Commission. |
| 2 | Dow Jones Industrial Average® is a price-weighted average of 30 blue-chip stocks that are generally the leaders in their industry. S&P 500® Index is an unmanaged index of large-cap stocks commonly used as a measure of U.S. stock market performance. NASDAQ Composite Index is a market capitalization-weighted index of all domestic and international securities listed on NASDAQ. Source: Nasdaq, Inc. The information is provided by Nasdaq (with its affiliates, are referred to as the “Corporations”) and Nasdaq’s third party licensors on an “as is” basis and the Corporations make no guarantees and bear no liability of any kind with respect to the information or the Fund. Russell 2000® Index is an unmanaged index of 2,000 U.S.small-cap stocks. Dow Jones U.S. Select Real Estate Securities Index is an unmanaged index of publicly traded real estate securities. Unless otherwise stated, index returns do not reflect the effect of any applicable sales charges, commissions, expenses, taxes or leverage, as applicable. It is not possible to invest directly in an index. |
| 3 | Total Returns at NAV do not include applicable sales charges. If sales charges were deducted, the returns would be lower. Total Returns shown with maximum sales charge reflect the stated maximum sales charge. Unless otherwise stated, performance does not reflect the deduction of taxes on Fund distributions or redemptions of Fund shares. |
Performance prior to the inception date of a class may be linked to the performance of an older class of the Fund. This linked performance is adjusted for any applicable sales charge, but is not adjusted for class expense differences. If adjusted for such differences, the performance would be different. The performance of Class A is linked to Class I. Performance since inception for an index, if presented, is the performance since the Fund’s or oldest share class’ inception, as applicable. Performance presented in the Financial Highlights included in the financial statements is not linked. |
| 4 | Source: Fund prospectus. Net expense ratios reflect a contractual expense reimbursement that continues through 4/30/19. Without the reimbursement, performance would have been lower. The expense ratios for the current reporting period can be found in the Financial Highlights section of this report. |
| 5 | Excludes cash and cash equivalents. |
Fund profile subject to change due to active management. |
| 5 |
Eaton Vance
Real Estate Fund
December 31, 2018
Fund Expenses
Example: As a Fund shareholder, you incur two types of costs: (1) transaction costs, including sales charges (loads) on purchases and redemption fees (if applicable); and (2) ongoing costs, including management fees; distribution and/or service fees; and other Fund expenses. This Example is intended to help you understand your ongoing costs (in dollars) of Fund investing and to compare these costs with the ongoing costs of investing in other mutual funds. The Example is based on an investment of $1,000 invested at the beginning of the period and held for the entire period (July 1, 2018 – December 31, 2018).
Actual Expenses: The first section of the table below provides information about actual account values and actual expenses. You may use the information in this section, together with the amount you invested, to estimate the expenses that you paid over the period. Simply divide your account value by $1,000 (for example, an $8,600 account value divided by $1,000 = 8.6), then multiply the result by the number in the first section under the heading entitled “Expenses Paid During Period” to estimate the expenses you paid on your account during this period.
Hypothetical Example for Comparison Purposes: The second section of the table below provides information about hypothetical account values and hypothetical expenses based on the actual Fund expense ratio and an assumed rate of return of 5% per year (before expenses), which is not the actual Fund return. The hypothetical account values and expenses may not be used to estimate the actual ending account balance or expenses you paid for the period. You may use this information to compare the ongoing costs of investing in your Fund and other funds. To do so, compare this 5% hypothetical example with the 5% hypothetical examples that appear in the shareholder reports of the other funds.
Please note that the expenses shown in the table are meant to highlight your ongoing costs only and do not reflect any transactional costs, such as sales charges (loads) or redemption fees (if applicable). Therefore, the second section of the table is useful in comparing ongoing costs only, and will not help you determine the relative total costs of owning different funds. In addition, if these transactional costs were included, your costs would be higher.
| Beginning Account Value (7/1/18) | Ending Account Value (12/31/18) | Expenses Paid During Period* (7/1/18 – 12/31/18) | Annualized Expense Ratio | |||||||||||||
Actual | ||||||||||||||||
Class A | $ | 1,000.00 | $ | 939.10 | $ | 6.11 | ** | 1.25 | % | |||||||
Class I | $ | 1,000.00 | $ | 939.50 | $ | 4.89 | ** | 1.00 | % | |||||||
Hypothetical | ||||||||||||||||
(5% return per year before expenses) | ||||||||||||||||
Class A | $ | 1,000.00 | $ | 1,018.90 | $ | 6.36 | ** | 1.25 | % | |||||||
Class I | $ | 1,000.00 | $ | 1,020.20 | $ | 5.09 | ** | 1.00 | % | |||||||
| * | Expenses are equal to the Fund’s annualized expense ratio for the indicated Class, multiplied by the average account value over the period, multiplied by 184/365 (to reflect theone-half year period). The Example assumes that the $1,000 was invested at the net asset value per share determined at the close of business on June 30, 2018. |
| ** | Absent an allocation of certain expenses to an affiliate, expenses would be higher. |
| 6 |
Eaton Vance
Real Estate Fund
December 31, 2018
Portfolio of Investments
| Common Stocks — 98.7% |
| |||||||
| Security | Shares | Value | ||||||
| Hotels, Restaurants & Leisure — 3.9% | ||||||||
Hilton Worldwide Holdings, Inc. | 14,546 | $ | 1,044,403 | |||||
Marriott International, Inc., Class A | 9,726 | 1,055,854 | ||||||
| $ | 2,100,257 | |||||||
| Other — 1.2% | ||||||||
CBRE Group, Inc., Class A(1) | 9,384 | $ | 375,736 | |||||
Jones Lang LaSalle, Inc. | 2,422 | 306,625 | ||||||
| $ | 682,361 | |||||||
| Real Estate Investment Trusts — 93.6% |
| |||||||
| Security | Shares | Value | ||||||
| Diversified, Specialty & Other — 9.5% | ||||||||
CoreSite Realty Corp. | 10,905 | $ | 951,243 | |||||
Digital Realty Trust, Inc. | 9,371 | 998,480 | ||||||
National Retail Properties, Inc. | 21,256 | 1,031,129 | ||||||
PS Business Parks, Inc. | 3,705 | 485,355 | ||||||
STORE Capital Corp. | 26,634 | 754,008 | ||||||
Vornado Realty Trust | 14,785 | 917,114 | ||||||
| $ | 5,137,329 | |||||||
| Health Care — 6.9% | ||||||||
HCP, Inc. | 27,045 | $ | 755,367 | |||||
Healthcare Realty Trust, Inc. | 14,342 | 407,886 | ||||||
Ventas, Inc. | 20,656 | 1,210,235 | ||||||
Welltower, Inc. | 19,814 | 1,375,290 | ||||||
| $ | 3,748,778 | |||||||
| Hotels & Resorts — 4.1% | ||||||||
Apple Hospitality REIT, Inc. | 38,386 | $ | 547,384 | |||||
DiamondRock Hospitality Co. | 34,885 | 316,756 | ||||||
Summit Hotel Properties, Inc. | 50,747 | 493,768 | ||||||
Sunstone Hotel Investors, Inc. | 66,406 | 863,942 | ||||||
| $ | 2,221,850 | |||||||
| Industrial — 8.3% | ||||||||
Duke Realty Corp. | 28,560 | $ | 739,704 | |||||
EastGroup Properties, Inc. | 6,330 | 580,651 | ||||||
First Industrial Realty Trust, Inc. | 18,126 | 523,116 | ||||||
ProLogis, Inc. | 35,990 | 2,113,333 | ||||||
Rexford Industrial Realty, Inc. | 17,872 | 526,688 | ||||||
| $ | 4,483,492 | |||||||
| Security | Shares | Value | ||||||
| Malls and Factory Outlets — 9.6% | ||||||||
Pennsylvania Real Estate Investment Trust | 50,898 | $ | 302,334 | |||||
Simon Property Group, Inc. | 29,019 | 4,874,902 | ||||||
| $ | 5,177,236 | |||||||
| Multifamily — 25.3% | ||||||||
American Campus Communities, Inc. | 11,433 | $ | 473,212 | |||||
American Homes 4 Rent, Class A | 34,665 | 688,100 | ||||||
AvalonBay Communities, Inc. | 19,616 | 3,414,165 | ||||||
Camden Property Trust | 11,320 | 996,726 | ||||||
Equity Residential | 44,944 | 2,966,753 | ||||||
Essex Property Trust, Inc. | 2,395 | 587,278 | ||||||
Invitation Homes, Inc. | 91,398 | 1,835,272 | ||||||
Mid-America Apartment Communities, Inc. | 28,013 | 2,680,844 | ||||||
| $ | 13,642,350 | |||||||
| Office — 11.6% | ||||||||
Boston Properties, Inc. | 23,093 | $ | 2,599,117 | |||||
Corporate Office Properties Trust | 13,543 | 284,809 | ||||||
Cousins Properties, Inc. | 87,386 | 690,349 | ||||||
Douglas Emmett, Inc. | 14,957 | 510,483 | ||||||
Highwoods Properties, Inc. | 21,080 | 815,585 | ||||||
Hudson Pacific Properties, Inc. | 20,899 | 607,325 | ||||||
JBG Smith Properties | 8,585 | 298,844 | ||||||
Tier REIT, Inc. | 21,395 | 441,379 | ||||||
| $ | 6,247,891 | |||||||
| Self Storage — 9.9% | ||||||||
CubeSmart | 43,651 | $ | 1,252,347 | |||||
Extra Space Storage, Inc. | 10,840 | 980,803 | ||||||
Public Storage | 15,392 | 3,115,495 | ||||||
| $ | 5,348,645 | |||||||
| Strip Centers — 8.4% | ||||||||
Acadia Realty Trust | 27,386 | $ | 650,691 | |||||
Brixmor Property Group, Inc. | 22,231 | 326,574 | ||||||
Federal Realty Investment Trust | 10,678 | 1,260,431 | ||||||
Kimco Realty Corp. | 27,949 | 409,453 | ||||||
Regency Centers Corp. | 25,984 | 1,524,741 | ||||||
SITE Centers Corp. | 34,586 | 382,867 | ||||||
| $ | 4,554,757 | |||||||
Total Real Estate Investment Trusts |
| $ | 50,562,328 | |||||
Total Common Stocks |
| $ | 53,344,946 | |||||
| 7 | See Notes to Financial Statements. |
Eaton Vance
Real Estate Fund
December 31, 2018
Portfolio of Investments — continued
| Exchange-Traded Funds — 0.5% |
| |||||||
| Security | Shares | Value | ||||||
iShares U.S. Real Estate ETF | 3,390 | $ | 254,047 | |||||
Total Exchange-Traded Funds |
| $ | 254,047 | |||||
| Short-Term Investments — 0.2% |
| |||||||
| Description | Units | Value | ||||||
Eaton Vance Cash Reserves Fund, LLC, 2.46%(2) | 130,275 | $ | 130,262 | |||||
Total Short-Term Investments |
| $ | 130,262 | |||||
Total Investments — 99.4% |
| $ | 53,729,255 | |||||
Other Assets, Less Liabilities — 0.6% |
| $ | 318,942 | |||||
Net Assets — 100.0% |
| $ | 54,048,197 | |||||
The percentage shown for each investment category in the Portfolio of Investments is based on net assets.
| (1) | Non-income producing security. |
| (2) | Affiliated investment company, available to Eaton Vance portfolios and funds, which invests in high quality, U.S. dollar denominated money market instruments. The rate shown is the annualizedseven-day yield as of December 31, 2018. |
| 8 | See Notes to Financial Statements. |
Eaton Vance
Real Estate Fund
December 31, 2018
Statement of Assets and Liabilities
| Assets | December 31, 2018 | |||
Unaffiliated investments, at value (identified cost, $48,693,558) | $ | 53,598,993 | ||
Affiliated investment, at value (identified cost, $130,262) | 130,262 | |||
Dividends receivable | 245,299 | |||
Dividends receivable from affiliated investment | 1,187 | |||
Receivable for investments sold | 325,408 | |||
Receivable for Fund shares sold | 114,348 | |||
Receivable from affiliate | 17,449 | |||
Total assets | $ | 54,432,946 | ||
| Liabilities |
| |||
Payable for Fund shares redeemed | $ | 265,893 | ||
Payable to affiliates: |
| |||
Investment adviser fee | 31,332 | |||
Administration fee | 7,230 | |||
Distribution and service fees | 2,039 | |||
Trustees’ fees | 755 | |||
Accrued expenses | 77,500 | |||
Total liabilities | $ | 384,749 | ||
Net Assets | $ | 54,048,197 | ||
| Sources of Net Assets |
| |||
Paid-in capital | $ | 50,067,220 | ||
Distributable earnings | 3,980,977 | |||
Total | $ | 54,048,197 | ||
| Class A Shares |
| |||
Net Assets | $ | 9,169,292 | ||
Shares Outstanding | 709,229 | |||
Net Asset Value and Redemption Price Per Share | ||||
(net assets ÷ shares of beneficial interest outstanding) | $ | 12.93 | ||
Maximum Offering Price Per Share | ||||
(100 ÷ 94.25 of net asset value per share) | $ | 13.72 | ||
| Class I Shares |
| |||
Net Assets | $ | 44,878,905 | ||
Shares Outstanding | 3,472,316 | |||
Net Asset Value, Offering Price and Redemption Price Per Share | ||||
(net assets ÷ shares of beneficial interest outstanding) | $ | 12.92 | ||
On sales of $50,000 or more, the offering price of Class A shares is reduced.
| 9 | See Notes to Financial Statements. |
Eaton Vance
Real Estate Fund
December 31, 2018
Statement of Operations
| Investment Income | Year Ended December 31, 2018 | |||
Dividends | $ | 1,638,731 | ||
Dividends from affiliated investment | 19,220 | |||
Total investment income | $ | 1,657,951 | ||
| Expenses | ||||
Investment adviser fee | $ | 347,560 | ||
Administration fee | 80,206 | |||
Distribution and service fees | ||||
Class A | 24,536 | |||
Trustees’ fees and expenses | 2,653 | |||
Custodian fee | 43,049 | |||
Transfer and dividend disbursing agent fees | 40,707 | |||
Legal and accounting services | 46,047 | |||
Printing and postage | 14,992 | |||
Registration fees | 33,985 | |||
Miscellaneous | 13,121 | |||
Total expenses | $ | 646,856 | ||
Deduct — | ||||
Allocation of expenses to affiliate | $ | 86,699 | ||
Total expense reductions | $ | 86,699 | ||
Net expenses | $ | 560,157 | ||
Net investment income | $ | 1,097,794 | ||
| Realized and Unrealized Gain (Loss) | ||||
Net realized gain (loss) — | ||||
Investment transactions | $ | (257,796 | ) | |
Investment transactions — affiliated investment | (246 | ) | ||
Capital gain distributions received | 343,258 | |||
Net realized gain | $ | 85,216 | ||
Change in unrealized appreciation (depreciation) — | ||||
Investments | $ | (2,929,988 | ) | |
Investments — affiliated investment | 89 | |||
Net change in unrealized appreciation (depreciation) | $ | (2,929,899 | ) | |
Net realized and unrealized loss | $ | (2,844,683 | ) | |
Net decrease in net assets from operations | $ | (1,746,889 | ) | |
| 10 | See Notes to Financial Statements. |
Eaton Vance
Real Estate Fund
December 31, 2018
Statements of Changes in Net Assets
| Year Ended December 31, | ||||||||
| Increase (Decrease) in Net Assets | 2018 | 2017 | ||||||
From operations — | ||||||||
Net investment income | $ | 1,097,794 | $ | 968,524 | ||||
Net realized gain | 85,216 | 493,220 | ||||||
Net change in unrealized appreciation (depreciation) | (2,929,899 | ) | 656,483 | |||||
Net increase (decrease) in net assets from operations | $ | (1,746,889 | ) | $ | 2,118,227 | |||
Distributions to shareholders(1) | ||||||||
Class A | $ | (261,715 | ) | $ | (276,059 | ) | ||
Class I | (1,368,966 | ) | (1,012,563 | ) | ||||
Total distributions to shareholders | $ | (1,630,681 | ) | $ | (1,288,622 | ) | ||
Transactions in shares of beneficial interest — | ||||||||
Proceeds from sale of shares | ||||||||
Class A | $ | 1,877,008 | $ | 3,062,393 | ||||
Class I | 26,287,130 | 27,779,739 | ||||||
Net asset value of shares issued to shareholders in payment of distributions declared | ||||||||
Class A | 261,497 | 269,513 | ||||||
Class I | 1,315,399 | 846,790 | ||||||
Cost of shares redeemed | ||||||||
Class A | (3,919,114 | ) | (12,582,293 | ) | ||||
Class I | (16,502,409 | ) | (19,108,242 | ) | ||||
Net increase in net assets from Fund share transactions | $ | 9,319,511 | $ | 267,900 | ||||
Net increase in net assets | $ | 5,941,941 | $ | 1,097,505 | ||||
| Net Assets | ||||||||
At beginning of year | $ | 48,106,256 | $ | 47,008,751 | ||||
At end of year | $ | 54,048,197 | $ | 48,106,256 | ||||
| (1) | For the year ended December 31, 2017, the source of distributions was as follows: |
Net investment income — Class A $(199,421) and Class I $(771,108) |
Net realized gain — Class A $(76,638) and Class I $(241,455) |
The current year presentation of distributions conforms with the Disclosure Update and Simplification Rule issued by the Securities and Exchange Commission, effective November 5, 2018. |
| 11 | See Notes to Financial Statements. |
Eaton Vance
Real Estate Fund
December 31, 2018
Financial Highlights
| Class A | ||||||||||||||||||||
| Year Ended December 31, | ||||||||||||||||||||
| 2018 | 2017 | 2016 | 2015 | 2014 | ||||||||||||||||
Net asset value — Beginning of year | $ | 13.930 | $ | 13.700 | $ | 13.790 | $ | 14.030 | $ | 11.090 | ||||||||||
| Income (Loss) From Operations | ||||||||||||||||||||
Net investment income(1) | $ | 0.237 | $ | 0.199 | $ | 0.158 | $ | 0.192 | $ | 0.165 | ||||||||||
Net realized and unrealized gain (loss) | (0.870 | ) | 0.333 | 0.518 | 0.660 | 3.253 | ||||||||||||||
Total income (loss) from operations | $ | (0.633 | ) | $ | 0.532 | $ | 0.676 | $ | 0.852 | $ | 3.418 | |||||||||
| Less Distributions | ||||||||||||||||||||
From net investment income | $ | (0.246 | ) | $ | (0.212 | ) | $ | (0.226 | ) | $ | (0.227 | ) | $ | (0.264 | ) | |||||
From net realized gain | (0.121 | ) | (0.090 | ) | (0.540 | ) | (0.865 | ) | (0.214 | ) | ||||||||||
Total distributions | $ | (0.367 | ) | $ | (0.302 | ) | $ | (0.766 | ) | $ | (1.092 | ) | $ | (0.478 | ) | |||||
Net asset value — End of year | $ | 12.930 | $ | 13.930 | $ | 13.700 | $ | 13.790 | $ | 14.030 | ||||||||||
Total Return(2)(3) | (4.61 | )% | 3.93 | % | 4.94 | % | 6.40 | % | 31.19 | % | ||||||||||
| Ratios/Supplemental Data |
| |||||||||||||||||||
Net assets, end of year (000’s omitted) | $ | 9,169 | $ | 11,766 | $ | 21,078 | $ | 21,880 | $ | 11,204 | ||||||||||
Ratios (as a percentage of average daily net assets): | ||||||||||||||||||||
Expenses(3) | 1.25 | % | 1.25 | % | 1.25 | % | 1.25 | % | 1.25 | % | ||||||||||
Net investment income | 1.76 | % | 1.45 | % | 1.13 | % | 1.38 | % | 1.29 | % | ||||||||||
Portfolio Turnover | 35 | % | 36 | % | 52 | % | 72 | % | 31 | % | ||||||||||
| (1) | Computed using average shares outstanding. |
| (2) | Returns are historical and are calculated by determining the percentage change in net asset value with all distributions reinvested and do not reflect the effect of sales charges. |
| (3) | The administrator reimbursed certain operating expenses (equal to 0.16%, 0.17%, 0.23%, 0.30% and 0.30% of average daily net assets for the years ended December 31, 2018, 2017, 2016, 2015 and 2014, respectively). Absent this reimbursement, total return would be lower. |
| 12 | See Notes to Financial Statements. |
Eaton Vance
Real Estate Fund
December 31, 2018
Financial Highlights — continued
| Class I | ||||||||||||||||||||
| Year Ended December 31, | ||||||||||||||||||||
| 2018 | 2017 | 2016 | 2015 | 2014 | ||||||||||||||||
Net asset value — Beginning of year | $ | 13.930 | $ | 13.700 | $ | 13.800 | $ | 14.030 | $ | 11.100 | ||||||||||
| Income (Loss) From Operations | ||||||||||||||||||||
Net investment income(1) | $ | 0.286 | $ | 0.271 | $ | 0.200 | $ | 0.192 | $ | 0.182 | ||||||||||
Net realized and unrealized gain (loss) | (0.894 | ) | 0.301 | 0.501 | 0.703 | 3.258 | ||||||||||||||
Total income (loss) from operations | $ | (0.608 | ) | $ | 0.572 | $ | 0.701 | $ | 0.895 | $ | 3.440 | |||||||||
| Less Distributions | ||||||||||||||||||||
From net investment income | $ | (0.281 | ) | $ | (0.252 | ) | $ | (0.261 | ) | $ | (0.260 | ) | $ | (0.296 | ) | |||||
From net realized gain | (0.121 | ) | (0.090 | ) | (0.540 | ) | (0.865 | ) | (0.214 | ) | ||||||||||
Total distributions | $ | (0.402 | ) | $ | (0.342 | ) | $ | (0.801 | ) | $ | (1.125 | ) | $ | (0.510 | ) | |||||
Net asset value — End of year | $ | 12.920 | $ | 13.930 | $ | 13.700 | $ | 13.800 | $ | 14.030 | ||||||||||
Total Return(2)(3) | (4.43 | )% | 4.23 | % | 5.12 | % | 6.73 | % | 31.40 | % | ||||||||||
| Ratios/Supplemental Data |
| |||||||||||||||||||
Net assets, end of year (000’s omitted) | $ | 44,879 | $ | 36,340 | $ | 25,930 | $ | 17,044 | $ | 22,115 | ||||||||||
Ratios (as a percentage of average daily net assets): | ||||||||||||||||||||
Expenses(3) | 1.00 | % | 1.00 | % | 1.00 | % | 1.00 | % | 1.00 | % | ||||||||||
Net investment income | 2.12 | % | 1.97 | % | 1.43 | % | 1.37 | % | 1.43 | % | ||||||||||
Portfolio Turnover | 35 | % | 36 | % | 52 | % | 72 | % | 31 | % | ||||||||||
| (1) | Computed using average shares outstanding. |
| (2) | Returns are historical and are calculated by determining the percentage change in net asset value with all distributions reinvested. |
| (3) | The administrator reimbursed certain operating expenses (equal to 0.16%, 0.17%, 0.23%, 0.30% and 0.30% of average daily net assets for the years ended December 31, 2018, 2017, 2016, 2015 and 2014, respectively). Absent this reimbursement, total return would be lower. |
| 13 | See Notes to Financial Statements. |
Eaton Vance
Real Estate Fund
December 31, 2018
Notes to Financial Statements
1 Significant Accounting Policies
Eaton Vance Real Estate Fund (the Fund) is anon-diversified series of Eaton Vance Special Investment Trust (the Trust). The Trust is a Massachusetts business trust registered under the Investment Company Act of 1940, as amended (the 1940 Act), as anopen-end management investment company. The Fund’s investment objective is to seek total return. The Fund offers two classes of shares. Class A shares are generally sold subject to a sales charge imposed at time of purchase. Class I shares are sold at net asset value and are not subject to a sales charge. Each class represents apro-rata interest in the Fund, but votes separately on class-specific matters and (as noted below) is subject to different expenses. Realized and unrealized gains and losses and net investment income and losses, other than class-specific expenses, are allocated daily to each class of shares based on the relative net assets of each class to the total net assets of the Fund. Each class of shares differs in its distribution plan and certain other class-specific expenses.
The following is a summary of significant accounting policies of the Fund. The policies are in conformity with accounting principles generally accepted in the United States of America (U.S. GAAP). The Fund is an investment company and follows accounting and reporting guidance in the Financial Accounting Standards Board (FASB) Accounting Standards Codification Topic 946.
A Investment Valuation — The following methodologies are used to determine the market value or fair value of investments.
Equity Securities.Equity securities listed on a U.S. securities exchange generally are valued at the last sale or closing price on the day of valuation or, if no sales took place on such date, at the mean between the closing bid and ask prices on the exchange where such securities are principally traded. Equity securities listed on the NASDAQ Global or Global Select Market generally are valued at the NASDAQ official closing price. Unlisted or listed securities for which closing sales prices or closing quotations are not available are valued at the mean between the latest available bid and ask prices.
Affiliated Fund.The Fund may invest in Eaton Vance Cash Reserves Fund, LLC (Cash Reserves Fund), an affiliated investment company managed by Eaton Vance Management (EVM). While Cash Reserves Fund is not a registered money market mutual fund, it conducts all of its investment activities in accordance with the requirements of Rule2a-7 under the 1940 Act. Investments in Cash Reserves Fund are valued at the closing net asset value per unit on the valuation day. Cash Reserves Fund generally values its investment securities based on available market quotations provided by a third party pricing service.
Fair Valuation.Investments for which valuations or market quotations are not readily available or are deemed unreliable are valued at fair value using methods determined in good faith by or at the direction of the Trustees of the Fund in a manner that fairly reflects the security’s value, or the amount that the Fund might reasonably expect to receive for the security upon its current sale in the ordinary course. Each such determination is based on a consideration of relevant factors, which are likely to vary from one pricing context to another. These factors may include, but are not limited to, the type of security, the existence of any contractual restrictions on the security’s disposition, the price and extent of public trading in similar securities of the issuer or of comparable companies or entities, quotations or relevant information obtained from broker/dealers or other market participants, information obtained from the issuer, analysts, and/or the appropriate stock exchange (for exchange-traded securities), an analysis of the company’s or entity’s financial condition, and an evaluation of the forces that influence the issuer and the market(s) in which the security is purchased and sold.
B Investment Transactions — Investment transactions for financial statement purposes are accounted for on a trade date basis. Realized gains and losses on investments sold are determined on the basis of identified cost.
C Income — Dividend income is recorded on theex-dividend date for dividends received in cash and/or securities. Dividends from real estate investment trusts (REITs) are recorded as income, capital gains or return of capital based on the nature of the distribution. Distributions from investment companies are recorded as dividend income, capital gains or return of capital based on the nature of the distribution.
D Federal Taxes — The Fund’s policy is to comply with the provisions of the Internal Revenue Code applicable to regulated investment companies and to distribute to shareholders each year substantially all of its net investment income, and all or substantially all of its net realized capital gains. Accordingly, no provision for federal income or excise tax is necessary.
As of December 31, 2018, the Fund had no uncertain tax positions that would require financial statement recognition,de-recognition, or disclosure. The Fund files a U.S. federal income tax return annually after its fiscalyear-end, which is subject to examination by the Internal Revenue Service for a period of three years from the date of filing.
E Expenses — The majority of expenses of the Trust are directly identifiable to an individual fund. Expenses which are not readily identifiable to a specific fund are allocated taking into consideration, among other things, the nature and type of expense and the relative size of the funds.
F Use of Estimates — The preparation of the financial statements in conformity with U.S. GAAP requires management to make estimates and assumptions that affect the reported amounts of assets and liabilities at the date of the financial statements and the reported amounts of income and expense during the reporting period. Actual results could differ from those estimates.
G Indemnifications — Under the Trust’s organizational documents, its officers and Trustees may be indemnified against certain liabilities and expenses arising out of the performance of their duties to the Fund. Under Massachusetts law, if certain conditions prevail, shareholders of a Massachusetts business trust (such as the Trust) could be deemed to have personal liability for the obligations of the Trust. However, the Trust’s Declaration of Trust contains an express disclaimer of liability on the part of Fund shareholders and theBy-laws provide that the Trust shall assume the defense on behalf of any Fund shareholders. Moreover, theBy-laws also provide for indemnification out of Fund property of any shareholder held personally liable solely by reason of
| 14 |
Eaton Vance
Real Estate Fund
December 31, 2018
Notes to Financial Statements — continued
being or having been a shareholder for all loss or expense arising from such liability. Additionally, in the normal course of business, the Fund enters into agreements with service providers that may contain indemnification clauses. The Fund’s maximum exposure under these arrangements is unknown as this would involve future claims that may be made against the Fund that have not yet occurred.
2 Distributions to Shareholders and Income Tax Information
It is the present policy of the Fund to make at least quarterly distributions of substantially all of the distributions it receives from its REIT investments, less expenses, as well as income from other investments. Such distributions may be comprised of income, return of capital, and capital gains. The Fund may also realize capital gains on the sale of its REIT shares and other investments. Distributions of these gains, if any, will be made annually. In addition, the Fund may occasionally be required to make supplemental distributions at some other time during the year. Distributions to shareholders are recorded on theex-dividend date. Distributions are declared separately for each class of shares. Shareholders may reinvest income and capital gain distributions in additional shares of the same class of the Fund at the net asset value as of theex-dividend date or, at the election of the shareholder, receive distributions in cash. Distributions to shareholders are determined in accordance with income tax regulations, which may differ from U.S. GAAP. As required by U.S. GAAP, only distributions in excess of tax basis earnings and profits are reported in the financial statements as a return of capital. Permanent differences between book and tax accounting relating to distributions are reclassified topaid-in capital. For tax purposes, distributions from short-term capital gains are considered to be from ordinary income.
The tax character of distributions declared for the years ended December 31, 2018 and December 31, 2017 was as follows:
| Year Ended December 31, | ||||||||
| 2018 | 2017 | |||||||
Ordinary income | $ | 1,322,533 | $ | 970,529 | ||||
Long-term capital gains | $ | 308,148 | $ | 318,093 | ||||
During the year ended December 31, 2018, distributable earnings was decreased by $60,972 andpaid-in capital was increased by $60,972 due to the Fund’s use of equalization accounting and differences between book and tax accounting for distributions from REITs. Tax equalization accounting allows the Fund to treat as a distribution that portion of redemption proceeds representing a redeeming shareholder’s portion of undistributed taxable income and net capital gains. These reclassifications had no effect on the net assets or net asset value per share of the Fund.
As of December 31, 2018, the components of distributable earnings (accumulated loss) on a tax basis were as follows:
Post October capital losses | $ | (89,514 | ) | |
Net unrealized appreciation | $ | 4,070,491 | ||
At December 31, 2018, the Fund had a net capital loss of $89,514, attributable to security transactions incurred after October 31, 2018 that it has elected to defer. This net capital loss is treated as arising on the first day of the Fund’s taxable year ending December 31, 2019.
The cost and unrealized appreciation (depreciation) of investments of the Fund at December 31, 2018, as determined on a federal income tax basis, were as follows:
Aggregate cost | $ | 49,658,764 | ||
Gross unrealized appreciation | $ | 5,200,881 | ||
Gross unrealized depreciation | (1,130,390 | ) | ||
Net unrealized appreciation | $ | 4,070,491 | ||
3 Investment Adviser Fee and Other Transactions with Affiliates
The investment adviser fee is earned by EVM as compensation for management and investment advisory services rendered to the Fund. The fee is computed at an annual rate of 0.65% of the Fund’s average daily net assets and is payable monthly. For the year ended December 31, 2018, the Fund’s investment adviser fee amounted to $347,560. The Fund invests its cash in Cash Reserves Fund. EVM does not currently receive a fee for advisory services provided to Cash Reserves Fund. The administration fee is earned by EVM for administering the business affairs of the Fund and is computed at
| 15 |
Eaton Vance
Real Estate Fund
December 31, 2018
Notes to Financial Statements — continued
an annual rate of 0.15% of the Fund’s average daily net assets. For the year ended December 31, 2018, the administration fee amounted to $80,206. EVM has agreed to reimburse the Fund’s expenses to the extent that total annual operating expenses (relating to ordinary operating expenses only) exceed 1.25% and 1.00% of the Fund’s average daily net assets for Class A and Class I, respectively. This agreement may be changed or terminated after April 30, 2019. Pursuant to this agreement, EVM was allocated $86,699of the Fund’s operating expenses for the year ended December 31, 2018. EVM providessub-transfer agency and related services to the Fund pursuant to aSub-Transfer Agency Support Services Agreement. For the year ended December 31, 2018, EVM earned $4,447 from the Fund pursuant to such agreement, which is included in transfer and dividend disbursing agent fees on the Statement of Operations. The Fund was informed that Eaton Vance Distributors, Inc. (EVD), an affiliate of EVM and the Fund’s principal underwriter, received $2,291 as its portion of the sales charge on sales of Class A shares for the year ended December 31, 2018. EVD also received distribution and service fees from Class A (see Note 4).
Trustees and officers of the Fund who are members of EVM’s organization receive remuneration for their services to the Fund out of the investment adviser fee. Trustees of the Fund who are not affiliated with the investment adviser may elect to defer receipt of all or a percentage of their annual fees in accordance with the terms of the Trustees Deferred Compensation Plan. For the year ended December 31, 2018, no significant amounts have been deferred. Certain officers and Trustees of the Fund are officers of EVM.
4 Distribution Plan
The Fund has in effect a distribution plan for Class A shares (Class A Plan) pursuant to Rule12b-1 under the 1940 Act. Pursuant to the Class A Plan, the Fund pays EVD a distribution and service fee of 0.25% per annum of its average daily net assets attributable to Class A shares for distribution services and facilities provided to the Fund by EVD, as well as for personal services and/or the maintenance of shareholder accounts. Distribution and service fees paid or accrued to EVD for the year ended December 31, 2018 amounted to $24,536 for Class A shares.
Distribution and service fees are subject to the limitations contained in the Financial Industry Regulatory Authority Rule 2341(d).
5 Contingent Deferred Sales Charges
Class A shares may be subject to a 1% contingent deferred sales charge (CDSC) if redeemed within 18 months of purchase (depending on the circumstances of purchase). Generally, the CDSC is based upon the lower of the net asset value at date of redemption or date of purchase. No charge is levied on shares acquired by reinvestment of dividends or capital gain distributions. For the year ended December 31, 2018, the Fund was informed that EVD received no CDSCs paid by Class A shareholders.
6 Purchases and Sales of Investments
Purchases and sales of investments, other than short-term obligations, aggregated $27,660,520 and $18,102,489, respectively, for the year ended December 31, 2018.
7 Shares of Beneficial Interest
The Fund’s Declaration of Trust permits the Trustees to issue an unlimited number of full and fractional shares of beneficial interest (without par value). Such shares may be issued in a number of different series (such as the Fund) and classes. Transactions in Fund shares were as follows:
| Year Ended December 31, | ||||||||
| Class A | 2018 | 2017 | ||||||
Sales | 138,910 | 222,787 | ||||||
Issued to shareholders electing to receive payments of distributions in Fund shares | 19,567 | 19,599 | ||||||
Redemptions | (293,811 | ) | (936,937 | ) | ||||
Net decrease | (135,334 | ) | (694,551 | ) | ||||
| 16 |
Eaton Vance
Real Estate Fund
December 31, 2018
Notes to Financial Statements — continued
| Year Ended December 31, | ||||||||
| Class I | 2018 | 2017 | ||||||
Sales | 1,998,237 | 2,044,691 | ||||||
Issued to shareholders electing to receive payments of distributions in Fund shares | 98,358 | 61,585 | ||||||
Redemptions | (1,233,071 | ) | (1,390,138 | ) | ||||
Net increase | 863,524 | 716,138 | ||||||
At December 31, 2018, donor advised funds (established and maintained by a public charity) managed by EVM and an Eaton Vance collective investment trust owned in the aggregate 36.6% of the value of the outstanding shares of the Fund.
8 Line of Credit
The Fund participates with other portfolios and funds managed by EVM and its affiliates in a $625 million unsecured line of credit agreement with a group of banks, which is in effect through October 29, 2019. Borrowings are made by the Fund solely to facilitate the handling of unusual and/or unanticipated short-term cash requirements. Interest is charged to the Fund based on its borrowings at an amount above either the Eurodollar rate or Federal Funds rate. In addition, a fee computed at an annual rate of 0.15% on the daily unused portion of the line of credit is allocated among the participating portfolios and funds at the end of each quarter. Because the line of credit is not available exclusively to the Fund, it may be unable to borrow some or all of its requested amounts at any particular time. The Fund did not have any significant borrowings or allocated fees during the year ended December 31, 2018.
9 Concentration of Risk
In accordance with the Fund’s strategy, under normal market conditions, the Fund’s investments are concentrated in equity securities of companies primarily engaged in the real estate industry, such as REITs and other real estate related investments. Securities of companies in the real estate industry are subject to special risks including changes in real estate values, property taxes, interest rates, cash flow of underlying real estate assets, occupancy rates, government regulations affecting zoning, land use and rents, and the management skill and creditworthiness of the issuer.
10 Fair Value Measurements
Under generally accepted accounting principles for fair value measurements, a three-tier hierarchy to prioritize the assumptions, referred to as inputs, is used in valuation techniques to measure fair value. The three-tier hierarchy of inputs is summarized in the three broad levels listed below.
| • | Level 1 – quoted prices in active markets for identical investments |
• Level 2 – other significant observable inputs (including quoted prices for similar investments, interest rates, prepayment speeds, credit risk, etc.)
• Level 3 – significant unobservable inputs (including a fund’s own assumptions in determining the fair value of investments)
In cases where the inputs used to measure fair value fall in different levels of the fair value hierarchy, the level disclosed is determined based on the lowest level input that is significant to the fair value measurement in its entirety. The inputs or methodology used for valuing securities are not necessarily an indication of the risk associated with investing in those securities.
At December 31, 2018, the hierarchy of inputs used in valuing the Fund’s investments, which are carried at value, were as follows:
| Asset Description | Level 1 | Level 2 | Level 3 | Total | ||||||||||||
Common Stocks | $ | 53,344,946 | * | $ | — | $ | — | $ | 53,344,946 | |||||||
Exchange-Traded Funds | 254,047 | — | — | 254,047 | ||||||||||||
Short-Term Investments | — | 130,262 | — | 130,262 | ||||||||||||
Total Investments | $ | 53,598,993 | $ | 130,262 | $ | — | $ | 53,729,255 | ||||||||
| * | The level classification by major category of investments is the same as the category presentation in the Portfolio of Investments. |
| 17 |
Eaton Vance
Real Estate Fund
December 31, 2018
Report of Independent Registered Public Accounting Firm
To the Trustees of Eaton Vance Special Investment Trust and Shareholders of Eaton Vance Real Estate Fund:
Opinion on the Financial Statements and Financial Highlights
We have audited the accompanying statement of assets and liabilities of Eaton Vance Real Estate Fund (the “Fund”) (one of the funds constituting Eaton Vance Special Investment Trust), including the portfolio of investments, as of December 31, 2018, the related statement of operations for the year then ended, the statements of changes in net assets for each of the two years in the period then ended, the financial highlights for each of the five years in the period then ended, and the related notes. In our opinion, the financial statements and financial highlights present fairly, in all material respects, the financial position of the Fund as of December 31, 2018, and the results of its operations for the year then ended, the changes in its net assets for each of the two years in the period then ended, and the financial highlights for each of the five years in the period then ended, in conformity with accounting principles generally accepted in the United States of America.
Basis for Opinion
These financial statements and financial highlights are the responsibility of the Fund’s management. Our responsibility is to express an opinion on the Fund’s financial statements and financial highlights based on our audits. We are a public accounting firm registered with the Public Company Accounting Oversight Board (United States) (PCAOB) and are required to be independent with respect to the Fund in accordance with the U.S. federal securities laws and the applicable rules and regulations of the Securities and Exchange Commission and the PCAOB.
We conducted our audits in accordance with the standards of the PCAOB. Those standards require that we plan and perform the audit to obtain reasonable assurance about whether the financial statements and financial highlights are free of material misstatement, whether due to error or fraud. The Fund is not required to have, nor were we engaged to perform, an audit of its internal control over financial reporting. As part of our audits we are required to obtain an understanding of internal control over financial reporting but not for the purpose of expressing an opinion on the effectiveness of the Fund’s internal control over financial reporting. Accordingly, we express no such opinion.
Our audits included performing procedures to assess the risks of material misstatement of the financial statements and financial highlights, whether due to error or fraud, and performing procedures that respond to those risks. Such procedures included examining, on a test basis, evidence regarding the amounts and disclosures in the financial statements and financial highlights. Our audits also included evaluating the accounting principles used and significant estimates made by management, as well as evaluating the overall presentation of the financial statements and financial highlights. Our procedures included confirmation of securities owned as of December 31, 2018, by correspondence with the custodian and brokers; when replies were not received from brokers, we performed other auditing procedures. We believe that our audits provide a reasonable basis for our opinion.
/s/ Deloitte & Touche LLP
Boston, Massachusetts
February 22, 2019
We have served as the auditor of one or more Eaton Vance investment companies since 1959.
| 18 |
Eaton Vance
Real Estate Fund
December 31, 2018
Federal Tax Information (Unaudited)
The Form1099-DIV you received in March 2019 showed the tax status of all distributions paid to your account in calendar year 2018. Shareholders are advised to consult their own tax adviser with respect to the tax consequences of their investment in the Fund. As required by the Internal Revenue Code and/or regulations, shareholders must be notified regarding the status of qualified business income, qualified dividend income for individuals and capital gains dividends.
Qualified Business Income. For the fiscal year ended December 31, 2018, the Fund designates $1,621,043, or up to the maximum amount of such dividends allowable pursuant to the Internal Revenue Code, as qualified business income.
Qualified Dividend Income. For the fiscal year ended December 31, 2018, the Fund designates approximately $39,746, or up to the maximum amount of such dividends allowable pursuant to the Internal Revenue Code, as qualified dividend income eligible for the reduced tax rate of 15%.
Capital Gains Dividends. The Fund hereby designates as a capital gain dividend with respect to the taxable year ended December 31, 2018, $322,167 or, if subsequently determined to be different, the net capital gain of such year.
| 19 |
Eaton Vance
Real Estate Fund
December 31, 2018
Special Meeting of Shareholders (Unaudited)
The Fund held a Special Meeting of Shareholders on September 20, 2018 to elect the five Trustees listed below. The other Trustees named herein continue to serve as Trustees. The results of the vote with respect to the Fund were as follows:
Nominee for Trustee | Number of Shares | |||||||
| For | Withheld | |||||||
Mark R. Fetting | 2,219,559 | 21,822 | ||||||
Keith Quinton | 2,219,559 | 21,822 | ||||||
Marcus L. Smith | 2,225,095 | 16,286 | ||||||
Susan J. Sutherland | 2,225,767 | 15,614 | ||||||
Scott E. Wennerholm | 2,219,559 | 21,822 | ||||||
Results are rounded to the nearest whole number.
| 20 |
Eaton Vance
Real Estate Fund
December 31, 2018
Management and Organization
Fund Management. The Trustees of Eaton Vance Special Investment Trust (the Trust) are responsible for the overall management and supervision of the Trust’s affairs. The Trustees and officers of the Trust are listed below. Except as indicated, each individual has held the office shown or other offices in the same company for the last five years. Trustees and officers of the Trust hold indefinite terms of office. The “noninterested Trustees” consist of those Trustees who are not “interested persons” of the Trust, as that term is defined under the 1940 Act. The business address of each Trustee and officer is Two International Place, Boston, Massachusetts 02110. As used below, “EVC” refers to Eaton Vance Corp., “EV” refers to Eaton Vance, Inc., “EVM” refers to Eaton Vance Management, “BMR” refers to Boston Management and Research and “EVD” refers to Eaton Vance Distributors, Inc. EVC and EV are the corporate parent and trustee, respectively, of EVM and BMR. EVD is the Fund’s principal underwriter and a wholly-owned subsidiary of EVC. Each officer affiliated with Eaton Vance may hold a position with other Eaton Vance affiliates that is comparable to his or her position with EVM listed below. Each Trustee oversees 175 portfolios in the Eaton Vance Complex (including all master and feeder funds in a master feeder structure). Each officer serves as an officer of certain other Eaton Vance funds. Each Trustee and officer serves until his or her successor is elected.
| Name and Year of Birth | Position(s) with the | Trustee Since(1) | Principal Occupation(s) and Directorships During Past Five Years and Other Relevant Experience | |||
| Interested Trustee | ||||||
Thomas E. Faust Jr. 1958 | Trustee | 2007 | Chairman, Chief Executive Officer and President of EVC, Director and President of EV, Chief Executive Officer and President of EVM and BMR, and Director of EVD. Trustee and/or officer of 175 registered investment companies. Mr. Faust is an interested person because of his positions with EVM, BMR, EVD, EVC and EV, which are affiliates of the Trust. Directorships in the Last Five Years.(2)Director of EVC and Hexavest Inc. (investment management firm). | |||
| Noninterested Trustees | ||||||
Mark R. Fetting 1954 | Trustee | 2016 | Private investor. Formerly held various positions at Legg Mason, Inc. (investment management firm) (2000-2012), including President, Chief Executive Officer, Director and Chairman (2008-2012), Senior Executive Vice President (2004-2008) and Executive Vice President (2001-2004). Formerly, President of Legg Mason family of funds (2001-2008). Formerly, Division President and Senior Officer of Prudential Financial Group, Inc. and related companies (investment management firm)(1991-2000). Directorships in the Last Five Years. None. | |||
Cynthia E. Frost 1961 | Trustee | 2014 | Private investor. Formerly, Chief Investment Officer of Brown University (university endowment) (2000-2012). Formerly, Portfolio Strategist for Duke Management Company (university endowment manager) (1995-2000). Formerly, Managing Director, Cambridge Associates (investment consulting company) (1989-1995). Formerly, Consultant, Bain and Company (management consulting firm) (1987-1989). Formerly, Senior Equity Analyst, BA Investment Management Company (1983-1985). Directorships in the Last Five Years.None. | |||
George J. Gorman 1952 | Trustee | 2014 | Principal at George J. Gorman LLC (consulting firm). Formerly, Senior Partner at Ernst & Young LLP (a registered public accounting firm) (1974-2009). Directorships in the Last Five Years.Formerly, Trustee of the BofA Funds Series Trust (11 funds) (2011-2014) and of the Ashmore Funds (9 funds) (2010-2014). | |||
Valerie A. Mosley 1960 | Trustee | 2014 | Chairwoman and Chief Executive Officer of Valmo Ventures (a consulting and investment firm). Former Partner and Senior Vice President, Portfolio Manager and Investment Strategist at Wellington Management Company, LLP (investment management firm) (1992-2012). Former Chief Investment Officer, PG Corbin Asset Management (1990-1992). Formerly worked in institutional corporate bond sales at Kidder Peabody (1986-1990). Directorships in the Last Five Years.(2)Director of Envestnet, Inc. (provider of intelligent systems for wealth management and financial wellness) (since 2018). | |||
| 21 |
Eaton Vance
Real Estate Fund
December 31, 2018
Management and Organization — continued
| Name and Year of Birth | Position(s) with the | Trustee Since(1) | Principal Occupation(s) and Directorships During Past Five Years and Other Relevant Experience | |||
| Noninterested Trustees (continued) | ||||||
William H. Park 1947 | Chairperson of the Board and Trustee | 2016 (Chairperson) 2003 (Trustee) | Private investor. Formerly, Consultant (management and transactional) (2012-2014). Formerly, Chief Financial Officer, Aveon Group L.P. (investment management firm) (2010-2011). Formerly, Vice Chairman, Commercial Industrial Finance Corp. (specialty finance company) (2006-2010). Formerly, President and Chief Executive Officer, Prizm Capital Management, LLC (investment management firm) (2002-2005). Formerly, Executive Vice President and Chief Financial Officer, United Asset Management Corporation (investment management firm) (1982-2001). Formerly, Senior Manager, Price Waterhouse (now PricewaterhouseCoopers) (a registered public accounting firm) (1972-1981). Directorships in the Last Five Years.(2)None. | |||
Helen Frame Peters 1948 | Trustee | 2008 | Professor of Finance, Carroll School of Management, Boston College. Formerly, Dean, Carroll School of Management, Boston College (2000-2002). Formerly, Chief Investment Officer, Fixed Income, Scudder Kemper Investments (investment management firm) (1998-1999). Formerly, Chief Investment Officer, Equity and Fixed Income, Colonial Management Associates (investment management firm)(1991-1998). Directorships in the Last Five Years.(2)None. | |||
Keith Quinton(3) 1958 | Trustee | 2018 | Independent Investment Committee Member at New Hampshire Retirement System (since 2017). Advisory Committee member at Northfield Information Services, Inc. (risk management analytics provider) (since 2016). Formerly, Portfolio Manager and Senior Quantitative Analyst at Fidelity Investments (investment management firm)(2001-2014). Directorships in the Last Five Years. Director of New Hampshire Municipal Bond Bank (since 2016). | |||
Marcus L. Smith(3) 1966 | Trustee | 2018 | Member of Posse Boston Advisory Board (foundation) (since 2015); Trustee at University of Mount Union (since 2008). Formerly, Portfolio Manager at MFS Investment Management (investment management firm)(1994-2017). Directorships in the Last Five Years. Director of MSCI Inc. (global provider of investment decision support tools) (since 2017). Director of DCT Industrial Trust Inc. (logistics real estate company) (since 2017). | |||
Susan J. Sutherland 1957 | Trustee | 2015 | Private investor. Formerly, Associate, Counsel and Partner at Skadden, Arps, Slate, Meagher & Flom LLP (law firm) (1982-2013). Directorships in the Last Five Years. Formerly, Director of Montpelier Re Holdings Ltd. (global provider of customized insurance and reinsurance products) (2013-2015). | |||
Scott E. Wennerholm 1959 | Trustee | 2016 | Formerly, Trustee at Wheelock College (postsecondary institution) (2012-2018). Formerly, Consultant at GF Parish Group (executive recruiting firm) (2016-2017). Formerly, Chief Operating Officer and Executive Vice President at BNY Mellon Asset Management (investment management firm) (2005-2011). Formerly, Chief Operating Officer and Chief Financial Officer at Natixis Global Asset Management (investment management firm) (1997-2004). Formerly, Vice President at Fidelity Investments Institutional Services (investment management firm)(1994-1997). Directorships in the Last Five Years. None. | |||
| Name and Year of Birth | Position(s) with the Trust | Officer Since(4) | Principal Occupation(s) During Past Five Years | |||
| Principal Officers who are not Trustees | ||||||
Payson F. Swaffield 1956 | President | 2003 | Vice President and Chief Income Investment Officer of EVM and BMR. Also Vice President of Calvert Research and Management (“CRM”). | |||
Maureen A. Gemma 1960 | Vice President, Secretary and Chief Legal Officer | 2005 | Vice President of EVM and BMR. Also Vice President of CRM. | |||
| 22 |
Eaton Vance
Real Estate Fund
December 31, 2018
Management and Organization — continued
| Name and Year of Birth | Position(s) with the Trust | Officer Since(4) | Principal Occupation(s) During Past Five Years | |||
| Principal Officers who are not Trustees (continued) | ||||||
James F. Kirchner 1967 | Treasurer | 2007 | Vice President of EVM and BMR. Also Vice President of CRM. | |||
Richard F. Froio 1968 | Chief Compliance Officer | 2017 | Vice President of EVM and BMR since 2017. Formerly Deputy Chief Compliance Officer (Adviser/Funds) and Chief Compliance Officer (Distribution) at PIMCO (2012-2017) and Managing Director at BlackRock/Barclays Global Investors (2009-2012). | |||
| (1) | Year first appointed to serve as Trustee for a fund in the Eaton Vance family of funds. Each Trustee has served continuously since appointment unless indicated otherwise. |
| (2) | During their respective tenures, the Trustees (except for Mmes. Frost and Sutherland and Messrs. Fetting, Gorman, Quinton, Smith and Wennerholm) also served as Board members of one or more of the following funds (which operated in the years noted): eUnitsTM 2 Year U.S. Market Participation Trust: Upside to Cap / Buffered Downside (launched in 2012 and terminated in 2014); and eUnitsTM 2 Year U.S. Market Participation Trust II: Upside to Cap / Buffered Downside (launched in 2012 and terminated in 2014). However, Ms. Mosley did not serve as a Board member of eUnitsTM 2 Year U.S. Market Participation Trust: Upside to Cap / Buffered Downside (launched in 2012 and terminated in 2014). |
| (3) | Messrs. Quinton and Smith began serving as Trustees effective October 1, 2018. |
| (4) | Year first elected to serve as officer of a fund in the Eaton Vance family of funds when the officer has served continuously. Otherwise, year of most recent election as an officer of a fund in the Eaton Vance family of funds. Titles may have changed since initial election. |
The SAI for the Fund includes additional information about the Trustees and officers of the Fund and can be obtained without charge on Eaton Vance’s website at www.eatonvance.com or by calling1-800-262-1122.
| 23 |
Eaton Vance Funds
IMPORTANT NOTICES
Privacy. The Eaton Vance organization is committed to ensuring your financial privacy. Each of the financial institutions identified below has in effect the following policy (“Privacy Policy”) with respect to nonpublic personal information about its customers:
| • | Only such information received from you, through application forms or otherwise, and information about your Eaton Vance fund transactions will be collected. This may include information such as name, address, social security number, tax status, account balances and transactions. |
| • | None of such information about you (or former customers) will be disclosed to anyone, except as permitted by law (which includes disclosure to employees necessary to service your account). In the normal course of servicing a customer’s account, Eaton Vance may share information with unaffiliated third parties that perform various required services such as transfer agents, custodians and broker-dealers. |
| • | Policies and procedures (including physical, electronic and procedural safeguards) are in place that are designed to protect the confidentiality of such information. |
| • | We reserve the right to change our Privacy Policy at any time upon proper notification to you. Customers may want to review our Privacy Policy periodically for changes by accessing the link on our homepage: www.eatonvance.com. |
Our pledge of privacy applies to the following entities within the Eaton Vance organization: the Eaton Vance Family of Funds, Eaton Vance Management, Eaton Vance Investment Counsel, Eaton Vance Distributors, Inc., Eaton Vance Trust Company, Eaton Vance Management (International) Limited, Eaton Vance Advisers International Ltd., Eaton Vance Management’s Real Estate Investment Group and Boston Management and Research. In addition, our Privacy Policy applies only to those Eaton Vance customers who are individuals and who have a direct relationship with us. If a customer’s account (i.e., fund shares) is held in the name of a third-party financial advisor/broker-dealer, it is likely that only such advisor’s privacy policies apply to the customer. This notice supersedes all previously issued privacy disclosures. For more information about Eaton Vance’s Privacy Policy, please call1-800-262-1122.
Delivery of Shareholder Documents. The Securities and Exchange Commission (SEC) permits funds to deliver only one copy of shareholder documents, including prospectuses, proxy statements and shareholder reports, to fund investors with multiple accounts at the same residential or post office box address. This practice is often called “householding” and it helps eliminate duplicate mailings to shareholders.Eaton Vance, or your financial advisor, may household the mailing of your documents indefinitely unless you instruct Eaton Vance, or your financial advisor, otherwise.If you would prefer that your Eaton Vance documents not be householded, please contact Eaton Vance at1-800-262-1122, or contact your financial advisor. Your instructions that householding not apply to delivery of your Eaton Vance documents will typically be effective within 30 days of receipt by Eaton Vance or your financial advisor.
Portfolio Holdings. Each Eaton Vance Fund and its underlying Portfolio(s) (if applicable) will file a schedule of portfolio holdings on FormN-Q with the SEC for the first and third quarters of each fiscal year. The FormN-Q will be available on the Eaton Vance website at www.eatonvance.com, by calling Eaton Vance at1-800-262-1122 or in the EDGAR database on the SEC’s website at www.sec.gov. FormN-Q may also be reviewed and copied at the SEC’s public reference room in Washington, D.C. (call1-800-732-0330 for information on the operation of the public reference room).
Proxy Voting. From time to time, funds are required to vote proxies related to the securities held by the funds. The Eaton Vance Funds or their underlying Portfolios (if applicable) vote proxies according to a set of policies and procedures approved by the Funds’ and Portfolios’ Boards. You may obtain a description of these policies and procedures and information on how the Funds or Portfolios voted proxies relating to portfolio securities during the most recent12-month period ended June 30, without charge, upon request, by calling1-800-262-1122 and by accessing the SEC’s website at www.sec.gov.
| 24 |
Investment Adviser and Administrator
Eaton Vance Management
Two International Place
Boston, MA 02110
Principal Underwriter*
Eaton Vance Distributors, Inc.
Two International Place
Boston, MA 02110
(617)482-8260
Custodian
State Street Bank and Trust Company
State Street Financial Center, One Lincoln Street
Boston, MA 02111
Transfer Agent
BNY Mellon Investment Servicing (US) Inc.
Attn: Eaton Vance Funds
P.O. Box 9653
Providence, RI 02940-9653
(800)262-1122
Independent Registered Public Accounting Firm
Deloitte & Touche LLP
200 Berkeley Street
Boston, MA 02116-5022
Fund Offices
Two International Place
Boston, MA 02110
| * | FINRA BrokerCheck. Investors may check the background of their Investment Professional by contacting the Financial Industry Regulatory Authority (FINRA). FINRA BrokerCheck is a free tool to help investors check the professional background of current and former FINRA-registered securities firms and brokers. FINRA BrokerCheck is available by calling1-800-289-9999 and at www.FINRA.org. The FINRA BrokerCheck brochure describing this program is available to investors at www.FINRA.org. |

2685 12.31.18

Eaton Vance
Small-Cap Fund
Annual Report
December 31, 2018
Important Note. Beginning on January 1, 2021, as permitted by regulations adopted by the Securities and Exchange Commission, paper copies of the Fund’s annual and semi-annual shareholder reports will no longer be sent by mail unless you specifically request paper copies of the reports. Instead, the reports will be made available on the Fund’s website (eatonvance.com/funddocuments), and you will be notified by mail each time a report is posted and provided with a website address to access the report.
If you already elected to receive shareholder reports electronically, you will not be affected by this change and you need not take any action. If you are a direct investor, you may elect to receive shareholder reports and other communications from the Fund electronically by signing up for e-Delivery at eatonvance.com/edelivery. If you own your shares through a financial intermediary (such as a broker-dealer or bank), you must contact your financial intermediary to sign up.
You may elect to receive all future Fund shareholder reports in paper free of charge. If you are a direct investor, you can inform the Fund that you wish to continue receiving paper copies of your shareholder reports by calling 1-800-262-1122. If you own these shares through a financial intermediary, you must contact your financial intermediary or follow instructions included with this disclosure, if applicable, to elect to continue to receive paper copies of your shareholder reports. Your election to receive reports in paper will apply to all Eaton Vance funds held directly or to all funds held through your financial intermediary, as applicable.

Commodity Futures Trading Commission Registration. Effective December 31, 2012, the Commodity Futures Trading Commission (“CFTC”) adopted certain regulatory changes that subject registered investment companies and advisers to regulation by the CFTC if a fund invests more than a prescribed level of its assets in certain CFTC-regulated instruments (including futures, certain options and swap agreements) or markets itself as providing investment exposure to such instruments. The Fund has claimed an exclusion from the definition of the term “commodity pool operator” under the Commodity Exchange Act. Accordingly, neither the Fund nor the adviser with respect to the operation of the Fund is subject to CFTC regulation. Because of its management of other strategies, the Fund’s adviser is registered with the CFTC as a commodity pool operator and a commodity trading advisor.
Fund shares are not insured by the FDIC and are not deposits or other obligations of, or guaranteed by, any depository institution. Shares are subject to investment risks, including possible loss of principal invested.
This report must be preceded or accompanied by a current summary prospectus or prospectus. Before investing, investors should consider carefully the investment objective, risks, and charges and expenses of a mutual fund. This and other important information is contained in the summary prospectus and prospectus, which can be obtained from a financial advisor. Prospective investors should read the prospectus carefully before investing. For further information, please call 1-800-262-1122.
Annual Report December 31, 2018
Eaton Vance
Small-Cap Fund
Table of Contents
Management’s Discussion of Fund Performance | 2 | |||
Performance | 3 | |||
Fund Profile | 4 | |||
Endnotes and Additional Disclosures | 5 | |||
Fund Expenses | 6 | |||
Financial Statements | 7 | |||
Report of Independent Registered Public Accounting Firm | 22 | |||
Federal Tax Information | 23 | |||
Special Meeting of Shareholders | 24 | |||
Management and Organization | 25 | |||
Important Notices | 28 | |||
Eaton Vance
Small-Cap Fund
December 31, 2018
Management’s Discussion of Fund Performance1
Economic and Market Conditions
U.S. stock indexes declined during the12-month period ended December 31, 2018, as a sharp downturn in the final quarter of the year erased earlier gains.
U.S. stocks opened the period on an upswing, as investors reacted favorably to the passage of the Republican tax reform package in December 2017. Sharp cuts in corporate taxes, a key element of the bill, raised corporate-profit expectations. U.S. stocks also got a boost from positive U.S. economic data, including the unemployment rate, which fell to a17-year low.
In February 2018, however, U.S. stocks pulled back amid fears that rising interest rates might boost the appeal of fixed-income investments. After a brief rebound, equity markets again weakened in the spring of 2018, as investors confronted the prospect of a global trade war due to President Trump’sthen-new tariffs. The broad tariffs drew retaliatory actions from impacted countries including China, Canada, and certain countries in the European Union.
U.S. stocks bounced back during the summer months led by technology stocks, which rebounded following an earlier setback from a wave of data-privacy scandals. Markets plunged in the final three months of the period amid global trade war fears and sagging economies in China and Europe. Despite a partial rebound in the final days of the period, the U.S. stock market’s December 2018 plunge was the worst monthly loss since the 2008 financial crisis.
Amid investor worries, however, U.S. economic data remained largely positive during the period, prompting the U.S. Federal Reserve (the Fed) to raise the federal funds rate in December 2018 for the fourth time during the period. Since then, the Fed has indicated that it may reconsider its planned 2019 rate hikes.
For the12-month period ended December 31, 2018, the blue-chip Dow Jones Industrial Average®2 declined 3.48%, while the broader U.S. equity market represented by the S&P 500® Index fell 4.38%. The technology-laden NASDAQ Composite Index fell 2.84% during the period.Large-cap U.S. stocks as measured by the S&P 500® Index generally outperformed theirsmall-cap counterparts as measured by the Russell 2000® Index during the period. Growth stocks as a group outpaced value stocks in both the large- andsmall-cap categories, as measured by the Russell Growth and Value Indexes.
Fund Performance
For the12-month period ended December 31, 2018, Eaton VanceSmall-Cap Fund (the Fund) returned –5.81% for Class A shares at net asset value (NAV), outperforming its benchmark, the Russell 2000® Index (the Index), which returned –11.01%.
The Fund outperformed the Index largely due to favorable stock selections. Sector and industry allocations also made positive contributions to relative Fund performance versus the Index. Of the Index’s 11 market sectors, the Fund recorded positive absolute returns in six sectors. The Index itself had positive returns in three sectors.
The health care sector contributed most to relative Fund performance versus the Index due to stock selections. Within the sector, the health care providers & services industry delivered notable results during the period. The Fund’stop-performing stock, home health services provider Amedisys, Inc., benefited from strong organic growth and a more favorable government regulatory environment. In the health care equipment & supplies industry, ICU Medical, Inc., a medical supplies company, delivered notable returns after it successfully integrated a large acquisition.
In the outperforming consumer discretionary sector, an overweight position in the diversified consumer services industry aided Fund results versus the Index during the period. Grand Canyon Education, Inc., a provider of post-secondary education services, was among the Fund’s stock leaders as it recorded strong earnings growth and unlocked value by converting to a technology services company. In the same industry, ServiceMaster Global Holdings, Inc., a pest control leader, also outperformed after aspin-off of its home warranty business.
In the textile, apparel and leisure industry, shares of Gildan Activewear, Inc., an apparel manufacturer, rose after the company gained a major new customer. The Fund’s lack of exposure to the household durables industry also contributed to relative Fund results. The materials sector contributed to Fund performance relative to the Index due to stock selections and an underweight position — in particular, a lack of exposure to the depressed metals & mining industry.
Conversely, the financials sector was the weakest performer versus the Index during the period. In the lagging banking industry, New York-based Sterling Bancorp and Texas Capital Bancshares, Inc. were among the Fund’s weakest stocks. Both banks suffered from slowing loan growth and tightening net interest margins. The capital markets industry was also a notable laggard during the period.
The industrials sector also dragged down relative Fund returns due to stock selections and an overweight position. In the commercial services & supplies industry, consumer-product label supplier Multi-Color Corp. was the Fund’s weakest stock after poor results and an unfavorable reaction to a major acquisition. In the same industry, shares of check printer Deluxe Corp. declined during the period following the departure of its long-tenured CEO. Deluxe Corp. was sold during the period.
See Endnotes and Additional Disclosures in this report.
Past performance is no guarantee of future results. Returns are historical and are calculated by determining the percentage change in net asset value (NAV) or offering price (as applicable) with all distributions reinvested. Investment return and principal value will fluctuate so that shares, when redeemed, may be worth more or less than their original cost. Performance less than or equal to one year is cumulative. Performance is for the stated time period only; due to market volatility, the Fund’s current performance may be lower or higher than quoted. Returns are before taxes unless otherwise noted. For performance as of the most recentmonth-end, please refer to eatonvance.com.
| 2 |
Eaton Vance
Small-Cap Fund
December 31, 2018
Performance2,3
Portfolio ManagersMichael D. McLean, CFA and J. Griffith Noble, CFA
| % Average Annual Total Returns | Class Inception Date | Performance Inception Date | One Year | Five Years | Ten Years | |||||||||||||||
Class A at NAV | 01/02/1997 | 01/02/1997 | –5.81 | % | 5.43 | % | 12.44 | % | ||||||||||||
Class A with 5.75% Maximum Sales Charge | — | — | –11.21 | 4.19 | 11.78 | |||||||||||||||
Class C at NAV | 05/03/2002 | 01/02/1997 | –6.52 | 4.65 | 11.60 | |||||||||||||||
Class C with 1% Maximum Sales Charge | — | — | –7.34 | 4.65 | 11.60 | |||||||||||||||
Class I at NAV | 09/02/2008 | 01/02/1997 | –5.57 | 5.69 | 12.72 | |||||||||||||||
Class R at NAV | 08/03/2009 | 01/02/1997 | –6.04 | 5.17 | 12.18 | |||||||||||||||
Russell 2000® Index | — | | — | | | –11.01 | % | | 4.41 | % | | 11.97 | % | |||||||
| % Total Annual Operating Expense Ratios4 | Class A | Class C | Class I | Class R | ||||||||||||||||
Gross | 1.52 | % | 2.27 | % | 1.26 | % | 1.76 | % | ||||||||||||
Net | 1.21 | 1.96 | 0.96 | 1.46 | ||||||||||||||||
Growth of $10,000
This graph shows the change in value of a hypothetical investment of $10,000 in Class A of the Fund for the period indicated. For comparison, the same investment is shown in the indicated index.
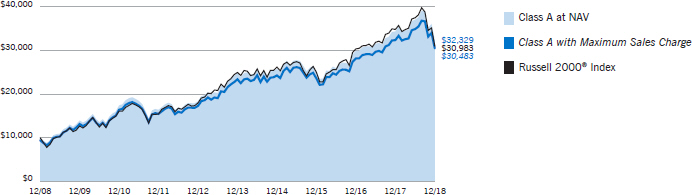
| Growth of Investment3 | Amount Invested | Period Beginning | At NAV | With Maximum Sales Charge | ||||||||||||
Class C | $ | 10,000 | 12/31/2008 | $ | 29,975 | N.A. | ||||||||||
Class I | $ | 250,000 | 12/31/2008 | $ | 828,602 | N.A. | ||||||||||
Class R | $ | 10,000 | 12/31/2008 | $ | 31,576 | N.A. | ||||||||||
See Endnotes and Additional Disclosures in this report.
Past performance is no guarantee of future results. Returns are historical and are calculated by determining the percentage change in net asset value (NAV) or offering price (as applicable) with all distributions reinvested. Investment return and principal value will fluctuate so that shares, when redeemed, may be worth more or less than their original cost. Performance less than or equal to one year is cumulative. Performance is for the stated time period only; due to market volatility, the Fund’s current performance may be lower or higher than quoted. Returns are before taxes unless otherwise noted. For performance as of the most recentmonth-end, please refer to eatonvance.com.
| 3 |
Eaton Vance
Small-Cap Fund
December 31, 2018
Fund Profile
Sector Allocation (% of net assets)5
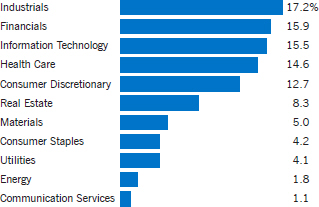
Top 10 Holdings (% of net assets)5
ICU Medical, Inc. | 2.8 | % | ||
ACI Worldwide, Inc. | 2.8 | |||
Euronet Worldwide, Inc. | 2.5 | |||
RealPage, Inc. | 2.3 | |||
Grand Canyon Education, Inc. | 2.3 | |||
Hexcel Corp. | 2.1 | |||
Performance Food Group Co. | 2.1 | |||
Catalent, Inc. | 2.1 | |||
ServiceMaster Global Holdings, Inc. | 2.0 | |||
ONE Gas, Inc. | 2.0 | |||
Total | 23.0 | % | ||
See Endnotes and Additional Disclosures in this report.
| 4 |
Eaton Vance
Small-Cap Fund
December 31, 2018
Endnotes and Additional Disclosures
| 1 | The views expressed in this report are those of the portfolio manager(s) and are current only through the date stated at the top of this page. These views are subject to change at any time based upon market or other conditions, and Eaton Vance and the Fund(s) disclaim any responsibility to update such views. These views may not be relied upon as investment advice and, because investment decisions are based on many factors, may not be relied upon as an indication of trading intent on behalf of any Eaton Vance fund. This commentary may contain statements that are not historical facts, referred to as “forward looking statements.” The Fund’s actual future results may differ significantly from those stated in any forward looking statement, depending on factors such as changes in securities or financial markets or general economic conditions, the volume of sales and purchases of Fund shares, the continuation of investment advisory, administrative and service contracts, and other risks discussed from time to time in the Fund’s filings with the Securities and Exchange Commission. |
| 2 | Dow Jones Industrial Average® is a price-weighted average of 30 blue-chip stocks that are generally the leaders in their industry. S&P 500® Index is an unmanaged index of large- cap stocks commonly used as a measure of U.S. stock market performance. NASDAQ Composite Index is a market capitalization- weighted index of all domestic and international securities listed on NASDAQ. Source: Nasdaq, Inc. The information is provided by Nasdaq (with its affiliates, are referred to as the “Corporations”) and Nasdaq’s third party licensors on an “as is” basis and the Corporations make no guarantees and bear no liability of any kind with respect to the information or the Fund. Russell 2000® Index is an unmanaged index of 2,000 U.S.small-cap stocks. Unless otherwise stated, index returns do not reflect the effect of any applicable sales charges, commissions, expenses, taxes or leverage, as applicable. It is not possible to invest directly in an index. |
| 3 | Total Returns at NAV do not include applicable sales charges. If sales charges were deducted, the returns would be lower. Total Returns shown with maximum sales charge reflect the stated maximum sales charge. Unless otherwise stated, performance does not reflect the deduction of taxes on Fund distributions or redemptions of Fund shares. |
Performance prior to the inception date of a class may be linked to the performance of an older class of the Fund. This linked performance is adjusted for any applicable sales charge, but is not adjusted for class expense differences. If adjusted for such differences, the performance would be different. The performance of Class R is linked to Class A. Performance since inception for an index, if presented, is the performance since the Fund’s or oldest share class’ inception, as applicable. Performance presented in the Financial Highlights included in the financial statements is not linked. |
| 4 | Source: Fund prospectus. Net expense ratios reflect a contractual expense reimbursement that continues through 4/30/20. Without the reimbursement, performance would have been lower. The expense ratios for the current reporting period can be found in the Financial Highlights section of this report. |
| 5 | Excludes cash and cash equivalents. |
Fund profile subject to change due to active management. |
| 5 |
Eaton Vance
Small-Cap Fund
December 31, 2018
Fund Expenses
Example: As a Fund shareholder, you incur two types of costs: (1) transaction costs, including sales charges (loads) on purchases and redemption fees (if applicable); and (2) ongoing costs, including management fees; distribution and/or service fees; and other Fund expenses. This Example is intended to help you understand your ongoing costs (in dollars) of Fund investing and to compare these costs with the ongoing costs of investing in other mutual funds. The Example is based on an investment of $1,000 invested at the beginning of the period and held for the entire period (July 1, 2018 – December 31, 2018).
Actual Expenses: The first section of the table below provides information about actual account values and actual expenses. You may use the information in this section, together with the amount you invested, to estimate the expenses that you paid over the period. Simply divide your account value by $1,000 (for example, an $8,600 account value divided by $1,000 = 8.6), then multiply the result by the number in the first section under the heading entitled “Expenses Paid During Period” to estimate the expenses you paid on your account during this period.
Hypothetical Example for Comparison Purposes: The second section of the table below provides information about hypothetical account values and hypothetical expenses based on the actual Fund expense ratio and an assumed rate of return of 5% per year (before expenses), which is not the actual Fund return. The hypothetical account values and expenses may not be used to estimate the actual ending account balance or expenses you paid for the period. You may use this information to compare the ongoing costs of investing in your Fund and other funds. To do so, compare this 5% hypothetical example with the 5% hypothetical examples that appear in the shareholder reports of the other funds.
Please note that the expenses shown in the table are meant to highlight your ongoing costs only and do not reflect any transactional costs, such as sales charges (loads) or redemption fees (if applicable). Therefore, the second section of the table is useful in comparing ongoing costs only, and will not help you determine the relative total costs of owning different funds. In addition, if these transactional costs were included, your costs would be higher.
| Beginning Account Value (7/1/18) | Ending Account Value (12/31/18) | Expenses Paid During Period* (7/1/18 – 12/31/18) | Annualized Expense Ratio | |||||||||||||
Actual | ||||||||||||||||
Class A | $ | 1,000.00 | $ | 873.50 | $ | 6.38 | ** | 1.35 | % | |||||||
Class C | $ | 1,000.00 | $ | 870.50 | $ | 9.90 | ** | 2.10 | % | |||||||
Class I | $ | 1,000.00 | $ | 874.70 | $ | 5.20 | ** | 1.10 | % | |||||||
Class R | $ | 1,000.00 | $ | 872.80 | $ | 7.55 | ** | 1.60 | % | |||||||
Hypothetical | ||||||||||||||||
(5% return per year before expenses) | ||||||||||||||||
Class A | $ | 1,000.00 | $ | 1,018.40 | $ | 6.87 | ** | 1.35 | % | |||||||
Class C | $ | 1,000.00 | $ | 1,014.60 | $ | 10.66 | ** | 2.10 | % | |||||||
Class I | $ | 1,000.00 | $ | 1,019.70 | $ | 5.60 | ** | 1.10 | % | |||||||
Class R | $ | 1,000.00 | $ | 1,017.10 | $ | 8.13 | ** | 1.60 | % | |||||||
| * | Expenses are equal to the Fund’s annualized expense ratio for the indicated Class, multiplied by the average account value over the period, multiplied by 184/365 (to reflect the one-half year period). The Example assumes that the $1,000 was invested at the net asset value per share determined at the close of business on June 30, 2018. |
| ** | Absent an allocation of certain expenses to an affiliate, expenses would be higher. |
| 6 |
Eaton Vance
Small-Cap Fund
December 31, 2018
Portfolio of Investments
| Common Stocks — 100.4% |
| |||||||
| Security | Shares | Value | ||||||
| Aerospace & Defense — 3.1% | ||||||||
Hexcel Corp. | 23,311 | $ | 1,336,653 | |||||
Mercury Systems, Inc.(1) | 13,369 | 632,220 | ||||||
| $ | 1,968,873 | |||||||
| Auto Components — 0.8% | ||||||||
Visteon Corp.(1) | 8,714 | $ | 525,280 | |||||
| $ | 525,280 | |||||||
| Banks — 7.6% | ||||||||
Columbia Banking System, Inc. | 24,998 | $ | 907,177 | |||||
Sterling Bancorp | 58,893 | 972,323 | ||||||
Stock Yards Bancorp, Inc. | 22,777 | 747,086 | ||||||
Texas Capital Bancshares, Inc.(1) | 12,128 | 619,620 | ||||||
Western Alliance Bancorp(1) | 14,777 | 583,544 | ||||||
Wintrust Financial Corp. | 13,508 | 898,147 | ||||||
| $ | 4,727,897 | |||||||
| Biotechnology — 1.0% | ||||||||
Ligand Pharmaceuticals, Inc.(1) | 4,744 | $ | 643,761 | |||||
| $ | 643,761 | |||||||
| Building Products — 0.7% | ||||||||
Trex Co., Inc.(1) | 6,976 | $ | 414,095 | |||||
| $ | 414,095 | |||||||
| Capital Markets — 2.7% | ||||||||
Cohen & Steers, Inc. | 35,890 | $ | 1,231,745 | |||||
Lazard, Ltd., Class A | 12,614 | 465,583 | ||||||
| $ | 1,697,328 | |||||||
| Chemicals — 5.0% | ||||||||
Balchem Corp. | 11,533 | $ | 903,610 | |||||
NewMarket Corp. | 2,599 | 1,071,022 | ||||||
Valvoline, Inc. | 59,425 | 1,149,874 | ||||||
| $ | 3,124,506 | |||||||
| Commercial Services & Supplies — 3.6% | ||||||||
Brink’s Co. (The) | 14,650 | $ | 947,123 | |||||
Multi-Color Corp. | 20,236 | 710,081 | ||||||
Viad Corp. | 11,827 | 592,414 | ||||||
| $ | 2,249,618 | |||||||
| Security | Shares | Value | ||||||
| Distributors — 0.5% | ||||||||
Pool Corp. | 2,157 | $ | 320,638 | |||||
| $ | 320,638 | |||||||
| Diversified Consumer Services — 4.9% | ||||||||
Bright Horizons Family Solutions, Inc.(1) | 3,494 | $ | 389,406 | |||||
Grand Canyon Education, Inc.(1) | 14,748 | 1,417,873 | ||||||
ServiceMaster Global Holdings, Inc.(1) | 34,883 | 1,281,601 | ||||||
| $ | 3,088,880 | |||||||
| Electric Utilities — 1.8% | ||||||||
ALLETE, Inc. | 14,677 | $ | 1,118,681 | |||||
| $ | 1,118,681 | |||||||
| Electrical Equipment — 1.5% | ||||||||
EnerSys | 12,160 | $ | 943,738 | |||||
| $ | 943,738 | |||||||
| Electronic Equipment, Instruments & Components — 1.6% | ||||||||
Dolby Laboratories, Inc., Class A | 16,417 | $ | 1,015,227 | |||||
| $ | 1,015,227 | |||||||
| Energy Equipment & Services — 0.5% | ||||||||
Oceaneering International, Inc.(1) | 26,310 | $ | 318,351 | |||||
| $ | 318,351 | |||||||
| Equity Real Estate Investment Trusts (REITs) — 8.3% | ||||||||
Acadia Realty Trust | 27,602 | $ | 655,823 | |||||
American Homes 4 Rent, Class A | 27,914 | 554,093 | ||||||
CubeSmart | 31,080 | 891,685 | ||||||
EastGroup Properties, Inc. | 8,918 | 818,048 | ||||||
Healthcare Realty Trust, Inc. | 30,520 | 867,989 | ||||||
Rexford Industrial Realty, Inc. | 26,553 | 782,517 | ||||||
STORE Capital Corp. | 21,119 | 597,879 | ||||||
| $ | 5,168,034 | |||||||
| Food & Staples Retailing — 2.1% | ||||||||
Performance Food Group Co.(1) | 40,220 | $ | 1,297,899 | |||||
| $ | 1,297,899 | |||||||
| Food Products — 0.5% | ||||||||
J&J Snack Foods Corp. | 2,266 | $ | 327,641 | |||||
| $ | 327,641 | |||||||
| 7 | See Notes to Financial Statements. |
Eaton Vance
Small-Cap Fund
December 31, 2018
Portfolio of Investments — continued
| Security | Shares | Value | ||||||
| Gas Utilities — 2.0% | ||||||||
ONE Gas, Inc. | 15,999 | $ | 1,273,520 | |||||
| $ | 1,273,520 | |||||||
| Health Care Equipment & Supplies — 7.5% | ||||||||
ICU Medical, Inc.(1) | 7,589 | $ | 1,742,662 | |||||
Integra LifeSciences Holdings Corp.(1) | 15,788 | 712,039 | ||||||
Masimo Corp.(1) | 6,265 | 672,673 | ||||||
West Pharmaceutical Services, Inc. | 10,900 | 1,068,527 | ||||||
Wright Medical Group NV(1) | 18,534 | 504,495 | ||||||
| $ | 4,700,396 | |||||||
| Health Care Providers & Services — 4.0% | ||||||||
Addus HomeCare Corp.(1) | 9,600 | $ | 651,648 | |||||
Amedisys, Inc.(1) | 7,347 | 860,407 | ||||||
Chemed Corp. | 2,588 | 733,128 | ||||||
R1 RCM, Inc.(1) | 29,766 | 236,640 | ||||||
| $ | 2,481,823 | |||||||
| Household Products — 1.6% | ||||||||
Central Garden & Pet Co., Class A(1) | 32,159 | $ | 1,004,969 | |||||
| $ | 1,004,969 | |||||||
| Insurance — 4.9% | ||||||||
AMERISAFE, Inc. | 9,155 | $ | 518,997 | |||||
First American Financial Corp. | 16,230 | 724,507 | ||||||
Horace Mann Educators Corp. | 24,409 | 914,117 | ||||||
Kinsale Capital Group, Inc. | 4,058 | 225,462 | ||||||
RLI Corp. | 9,939 | 685,692 | ||||||
| $ | 3,068,775 | |||||||
| Interactive Media & Services — 1.1% | ||||||||
Eventbrite, Inc., Class A(1) | 25,158 | $ | 699,644 | |||||
| $ | 699,644 | |||||||
| IT Services — 4.6% | ||||||||
Conduent, Inc.(1) | 41,567 | $ | 441,857 | |||||
CSG Systems International, Inc. | 26,566 | 844,002 | ||||||
Euronet Worldwide, Inc.(1) | 15,394 | 1,576,038 | ||||||
| $ | 2,861,897 | |||||||
| Leisure Products — 0.7% | ||||||||
Brunswick Corp. | 9,526 | $ | 442,483 | |||||
| $ | 442,483 | |||||||
| Security | Shares | Value | ||||||
| Machinery — 3.8% | ||||||||
Milacron Holdings Corp.(1) | 57,463 | $ | 683,235 | |||||
RBC Bearings, Inc.(1) | 5,440 | 713,184 | ||||||
Woodward, Inc. | 13,614 | 1,011,384 | ||||||
| $ | 2,407,803 | |||||||
| Marine — 1.6% | ||||||||
Kirby Corp.(1) | 14,646 | $ | 986,555 | |||||
| $ | 986,555 | |||||||
| Oil, Gas & Consumable Fuels — 1.3% | ||||||||
Gulfport Energy Corp.(1) | 30,278 | $ | 198,321 | |||||
Jagged Peak Energy, Inc.(1) | 20,524 | 187,179 | ||||||
PDC Energy, Inc.(1) | 13,734 | 408,724 | ||||||
| $ | 794,224 | |||||||
| Pharmaceuticals — 2.1% | ||||||||
Catalent, Inc.(1) | 41,241 | $ | 1,285,894 | |||||
| $ | 1,285,894 | |||||||
| Road & Rail — 1.4% | ||||||||
Landstar System, Inc. | 9,011 | $ | 862,082 | |||||
| $ | 862,082 | |||||||
| Software — 9.3% | ||||||||
ACI Worldwide, Inc.(1) | 62,231 | $ | 1,721,932 | |||||
Altair Engineering, Inc., Class A(1) | 35,937 | 991,142 | ||||||
Blackbaud, Inc. | 8,141 | 512,069 | ||||||
CDK Global, Inc. | 11,972 | 573,219 | ||||||
Ceridian HCM Holding, Inc.(1) | 16,785 | 578,915 | ||||||
RealPage, Inc.(1) | 30,420 | 1,465,940 | ||||||
| $ | 5,843,217 | |||||||
| Specialty Retail — 2.3% | ||||||||
Floor & Decor Holdings, Inc., Class A(1) | 10,783 | $ | 279,280 | |||||
Hudson, Ltd., Class A(1) | 14,901 | 255,552 | ||||||
Monro, Inc. | 9,568 | 657,800 | ||||||
National Vision Holdings, Inc.(1) | 8,669 | 244,206 | ||||||
| $ | 1,436,838 | |||||||
| Textiles, Apparel & Luxury Goods — 3.5% | ||||||||
Columbia Sportswear Co. | 11,158 | $ | 938,276 | |||||
Gildan Activewear, Inc. | 40,293 | 1,223,296 | ||||||
| $ | 2,161,572 | |||||||
| 8 | See Notes to Financial Statements. |
Eaton Vance
Small-Cap Fund
December 31, 2018
Portfolio of Investments — continued
| Security | Shares | Value | ||||||
| Thrifts & Mortgage Finance — 0.7% | ||||||||
Essent Group, Ltd.(1) | 13,312 | $ | 455,004 | |||||
| $ | 455,004 | |||||||
| Trading Companies & Distributors — 1.5% | ||||||||
Applied Industrial Technologies, Inc. | 17,908 | $ | 965,958 | |||||
| $ | 965,958 | |||||||
| Water Utilities — 0.3% | ||||||||
Middlesex Water Co. | 3,774 | $ | 201,343 | |||||
| $ | 201,343 | |||||||
Total Common Stocks |
| $ | 62,884,444 | |||||
| Short-Term Investments — 0.1% |
| |||||||
| Description | Units | Value | ||||||
Eaton Vance Cash Reserves Fund, LLC, 2.46%(2) | 40,128 | $ | 40,124 | |||||
Total Short-Term Investments |
| $ | 40,124 | |||||
Total Investments — 100.5% |
| $ | 62,924,568 | |||||
Other Assets, Less Liabilities — (0.5)% |
| $ | (344,002 | ) | ||||
Net Assets — 100.0% |
| $ | 62,580,566 | |||||
The percentage shown for each investment category in the Portfolio of Investments is based on net assets.
| (1) | Non-income producing security. |
| (2) | Affiliated investment company, available to Eaton Vance portfolios and funds, which invests in high quality, U.S. dollar denominated money market instruments. The rate shown is the annualized seven-day yield as of December 31, 2018. |
| 9 | See Notes to Financial Statements. |
Eaton Vance
Small-Cap Fund
December 31, 2018
Statement of Assets and Liabilities
| Assets | December 31, 2018 | |||
Unaffiliated investments, at value (identified cost, $55,558,821) | $ | 62,884,444 | ||
Affiliated investment, at value (identified cost, $40,121) | 40,124 | |||
Dividends receivable | 52,507 | |||
Dividends receivable from affiliated investment | 355 | |||
Receivable for investments sold | 2,733,753 | |||
Receivable for Fund shares sold | 67,109 | |||
Receivable from affiliate | 19,366 | |||
Total assets | $ | 65,797,658 | ||
| Liabilities |
| |||
Demand note payable | $ | 900,000 | ||
Payable for investments purchased | 138,602 | |||
Payable for Fund shares redeemed | 2,025,816 | |||
Payable to affiliates: | ||||
Investment adviser fee | 44,377 | |||
Administration fee | 8,875 | |||
Distribution and service fees | 11,445 | |||
Trustees’ fees | 1,000 | |||
Accrued expenses | 86,977 | |||
Total liabilities | $ | 3,217,092 | ||
Net Assets | $ | 62,580,566 | ||
| Sources of Net Assets |
| |||
Paid-in capital | $ | 53,872,612 | ||
Distributable earnings | 8,707,954 | |||
Net Assets | $ | 62,580,566 | ||
| Class A Shares | ||||
Net Assets | $ | 19,328,648 | ||
Shares Outstanding | 1,741,304 | |||
Net Asset Value and Redemption Price Per Share | ||||
(net assets ÷ shares of beneficial interest outstanding) | $ | 11.10 | ||
Maximum Offering Price Per Share | ||||
(100 ÷ 94.25 of net asset value per share) | $ | 11.78 | ||
| Class C Shares |
| |||
Net Assets | $ | 7,355,961 | ||
Shares Outstanding | 808,387 | |||
Net Asset Value and Offering Price Per Share* | ||||
(net assets ÷ shares of beneficial interest outstanding) | $ | 9.10 | ||
| Class I Shares |
| |||
Net Assets | $ | 35,096,887 | ||
Shares Outstanding | 2,839,854 | |||
Net Asset Value, Offering Price and Redemption Price Per Share | ||||
(net assets ÷ shares of beneficial interest outstanding) | $ | 12.36 | ||
| Class R Shares |
| |||
Net Assets | $ | 799,070 | ||
Shares Outstanding | 75,235 | |||
Net Asset Value, Offering Price and Redemption Price Per Share | ||||
(net assets ÷ shares of beneficial interest outstanding) | $ | 10.62 | ||
On sales of $50,000 or more, the offering price of Class A shares is reduced.
| * | Redemption price per share is equal to the net asset value less any applicable contingent deferred sales charge. |
| 10 | See Notes to Financial Statements. |
Eaton Vance
Small-Cap Fund
December 31, 2018
Statement of Operations
| Investment Income | Year Ended December 31, 2018 | |||
Dividends (net of foreign taxes, $1,231) | $ | 917,604 | ||
Dividends from affiliated investment | 10,836 | |||
Total investment income | $ | 928,440 | ||
| Expenses | ||||
Investment adviser fee | $ | 597,546 | ||
Administration fee | 119,509 | |||
Distribution and service fees | ||||
Class A | 60,285 | |||
Class C | 90,064 | |||
Class R | 4,000 | |||
Trustees’ fees and expenses | 3,734 | |||
Custodian fee | 46,924 | |||
Transfer and dividend disbursing agent fees | 111,902 | |||
Legal and accounting services | 45,624 | |||
Printing and postage | 23,884 | |||
Registration fees | 47,618 | |||
Miscellaneous | 16,300 | |||
Total expenses | $ | 1,167,390 | ||
Deduct — | ||||
Allocation of expenses to affiliate | $ | 135,514 | ||
Total expense reductions | $ | 135,514 | ||
Net expenses | $ | 1,031,876 | ||
Net investment loss | $ | (103,436 | ) | |
| Realized and Unrealized Gain (Loss) | ||||
Net realized gain (loss) — | ||||
Investment transactions | $ | 9,635,830 | ||
Investment transactions — affiliated investment | (27 | ) | ||
Net realized gain | $ | 9,635,803 | ||
Change in unrealized appreciation (depreciation) — | ||||
Investments | $ | (13,461,037 | ) | |
Investments — affiliated investment | 40 | |||
Net change in unrealized appreciation (depreciation) | $ | (13,460,997 | ) | |
Net realized and unrealized loss | $ | (3,825,194 | ) | |
Net decrease in net assets from operations | $ | (3,928,630 | ) | |
| 11 | See Notes to Financial Statements. |
Eaton Vance
Small-Cap Fund
December 31, 2018
Statements of Changes in Net Assets
| Year Ended December 31, | ||||||||
| Increase (Decrease) in Net Assets | 2018 | 2017 | ||||||
From operations — | ||||||||
Net investment loss | $ | (103,436 | ) | $ | (301,249 | ) | ||
Net realized gain | 9,635,803 | 7,351,539 | ||||||
Net change in unrealized appreciation (depreciation) | (13,460,997 | ) | 3,901,554 | |||||
Net increase (decrease) in net assets from operations | $ | (3,928,630 | ) | $ | 10,951,844 | |||
Distributions to shareholders(1) | ||||||||
Class A | $ | (2,254,742 | ) | $ | (2,614,958 | ) | ||
Class C | (1,016,241 | ) | (1,183,862 | ) | ||||
Class I | (3,938,296 | ) | (4,242,331 | ) | ||||
Class R | (91,038 | ) | (73,491 | ) | ||||
Total distributions to shareholders | $ | (7,300,317 | ) | $ | (8,114,642 | ) | ||
Transactions in shares of beneficial interest — | ||||||||
Proceeds from sale of shares | ||||||||
Class A | $ | 3,623,121 | $ | 4,452,831 | ||||
Class B | — | 35,944 | ||||||
Class C | 2,116,310 | 2,917,320 | ||||||
Class I | 6,703,355 | 15,021,565 | ||||||
Class R | 400,213 | 234,533 | ||||||
Net asset value of shares issued to shareholders in payment of distributions declared | ||||||||
Class A | 2,180,383 | 2,455,295 | ||||||
Class C | 974,220 | 1,108,865 | ||||||
Class I | 3,791,027 | 4,063,024 | ||||||
Class R | 91,038 | 73,491 | ||||||
Cost of shares redeemed | ||||||||
Class A | (7,937,543 | ) | (14,244,785 | ) | ||||
Class B | — | (112,082 | ) | |||||
Class C | (3,747,056 | ) | (4,575,223 | ) | ||||
Class I | (14,858,960 | ) | (10,011,521 | ) | ||||
Class R | (265,029 | ) | (171,692 | ) | ||||
Net asset value of shares exchanged | ||||||||
Class A | — | 111,870 | ||||||
Class B | — | (111,870 | ) | |||||
Net asset value of shares merged* | ||||||||
Class A | — | 878,745 | ||||||
Class B | — | (878,745 | ) | |||||
Net increase (decrease) in net assets from Fund share transactions | $ | (6,928,921 | ) | $ | 1,247,565 | |||
Net increase (decrease) in net assets | $ | (18,157,868 | ) | $ | 4,084,767 | |||
| Net Assets |
| |||||||
At beginning of year | $ | 80,738,434 | $ | 76,653,667 | ||||
At end of year | $ | 62,580,566 | $ | 80,738,434 | (2) | |||
| (1) | For the year ended December 31, 2017, the source of distributions was from net realized gain. The current year presentation of distributions conforms with the Disclosure Update and Simplification Rule issued by the Securities and Exchange Commission, effective November 5, 2018. |
| (2) | Includes accumulated undistributed net investment income of $817 at December 31, 2017. The requirement to disclose the corresponding amount as of December 31, 2018 was eliminated. |
| * | At the close of business on April 27, 2017, Class B shares were merged into Class A shares. |
| 12 | See Notes to Financial Statements. |
Eaton Vance
Small-Cap Fund
December 31, 2018
Financial Highlights
| Class A | ||||||||||||||||||||
| Year Ended December 31, | ||||||||||||||||||||
| 2018 | 2017 | 2016 | 2015 | 2014 | ||||||||||||||||
Net asset value — Beginning of year | $ | 13.150 | $ | 12.740 | $ | 12.200 | $ | 15.320 | $ | 18.040 | ||||||||||
| Income (Loss) From Operations | ||||||||||||||||||||
Net investment loss(1) | $ | (0.026 | ) | $ | (0.057 | ) | $ | (0.053 | ) | $ | (0.078 | ) | $ | (0.078 | ) | |||||
Net realized and unrealized gain (loss) | (0.660 | ) | 1.916 | 2.361 | (0.205 | ) | 0.618 | |||||||||||||
Total income (loss) from operations | $ | (0.686 | ) | $ | 1.859 | $ | 2.308 | $ | (0.283 | ) | $ | 0.540 | ||||||||
| Less Distributions | ||||||||||||||||||||
From net realized gain | $ | (1.364 | ) | $ | (1.449 | ) | $ | (1.768 | ) | $ | (2.837 | ) | $ | (3.260 | ) | |||||
Total distributions | $ | (1.364 | ) | $ | (1.449 | ) | $ | (1.768 | ) | $ | (2.837 | ) | $ | (3.260 | ) | |||||
Net asset value — End of year | $ | 11.100 | $ | 13.150 | $ | 12.740 | $ | 12.200 | $ | 15.320 | ||||||||||
Total Return(2) | (5.81 | )%(3) | 14.91 | %(3) | 19.32 | % | (2.78 | )% | 3.77 | %(4) | ||||||||||
| Ratios/Supplemental Data | ||||||||||||||||||||
Net assets, end of year (000’s omitted) | $ | 19,329 | $ | 24,865 | $ | 30,174 | $ | 26,391 | $ | 29,536 | ||||||||||
Ratios (as a percentage of average daily net assets): | ||||||||||||||||||||
Expenses(5) | 1.35 | %(3) | 1.42 | %(3) | 1.52 | % | 1.43 | % | 1.39 | % | ||||||||||
Net investment loss | (0.19 | )% | (0.43 | )% | (0.43 | )% | (0.52 | )% | (0.44 | )% | ||||||||||
Portfolio Turnover | 44 | % | 50 | % | 76 | % | 71 | % | 66 | % | ||||||||||
| (1) | Computed using average shares outstanding. |
| (2) | Returns are historical and are calculated by determining the percentage change in net asset value with all distributions reinvested and do not reflect the effect of sales charges. |
| (3) | The administrator reimbursed certain operating expenses (equal to 0.17% and 0.10% of average daily net assets for the years ended December 31, 2018 and 2017, respectively). Absent this reimbursement, total return would be lower. |
| (4) | During the year ended December 31, 2014, the investment adviser reimbursed the Fund for a net loss realized on the disposal of an investment which did not meet the Fund’s investment guidelines. The reimbursement had no effect on total return for the year ended December 31, 2014. |
| (5) | Excludes the effect of custody fee credits, if any, of less than 0.005%. Effective September 1, 2015, custody fee credits, which were earned on cash deposit balances, were discontinued by the custodian. |
| 13 | See Notes to Financial Statements. |
Eaton Vance
Small-Cap Fund
December 31, 2018
Financial Highlights — continued
| Class C | ||||||||||||||||||||
| Year Ended December 31, | ||||||||||||||||||||
| 2018 | 2017 | 2016 | 2015 | 2014 | ||||||||||||||||
Net asset value — Beginning of year | $ | 11.110 | $ | 11.040 | $ | 10.850 | $ | 14.040 | $ | 16.930 | ||||||||||
| Income (Loss) From Operations | ||||||||||||||||||||
Net investment loss(1) | $ | (0.108 | ) | $ | (0.133 | ) | $ | (0.129 | ) | $ | (0.173 | ) | $ | (0.198 | ) | |||||
Net realized and unrealized gain (loss) | (0.538 | ) | 1.652 | 2.087 | (0.180 | ) | 0.568 | |||||||||||||
Total income (loss) from operations | $ | (0.646 | ) | $ | 1.519 | $ | 1.958 | $ | (0.353 | ) | $ | 0.370 | ||||||||
| Less Distributions | ||||||||||||||||||||
From net realized gain | $ | (1.364 | ) | $ | (1.449 | ) | $ | (1.768 | ) | $ | (2.837 | ) | $ | (3.260 | ) | |||||
Total distributions | $ | (1.364 | ) | $ | (1.449 | ) | $ | (1.768 | ) | $ | (2.837 | ) | $ | (3.260 | ) | |||||
Net asset value — End of year | $ | 9.100 | $ | 11.110 | $ | 11.040 | $ | 10.850 | $ | 14.040 | ||||||||||
Total Return(2) | (6.52 | )%(3) | 14.11 | %(3) | 18.47 | % | (3.59 | )% | 3.02 | %(4) | ||||||||||
| Ratios/Supplemental Data | ||||||||||||||||||||
Net assets, end of year (000’s omitted) | $ | 7,356 | $ | 9,565 | $ | 10,001 | $ | 9,040 | $ | 10,883 | ||||||||||
Ratios (as a percentage of average daily net assets): | ||||||||||||||||||||
Expenses(5) | 2.10 | %(3) | 2.17 | %(3) | 2.27 | % | 2.18 | % | 2.14 | % | ||||||||||
Net investment loss | (0.94 | )% | (1.17 | )% | (1.18 | )% | (1.27 | )% | (1.18 | )% | ||||||||||
Portfolio Turnover | 44 | % | 50 | % | 76 | % | 71 | % | 66 | % | ||||||||||
| (1) | Computed using average shares outstanding. |
| (2) | Returns are historical and are calculated by determining the percentage change in net asset value with all distributions reinvested and do not reflect the effect of sales charges. |
| (3) | The administrator reimbursed certain operating expenses (equal to 0.17% and 0.10% of average daily net assets for the years ended December 31, 2018 and 2017, respectively). Absent this reimbursement, total return would be lower. |
| (4) | During the year ended December 31, 2014, the investment adviser reimbursed the Fund for a net loss realized on the disposal of an investment which did not meet the Fund’s investment guidelines. The reimbursement had no effect on total return for the year ended December 31, 2014. |
| (5) | Excludes the effect of custody fee credits, if any, of less than 0.005%. Effective September 1, 2015, custody fee credits, which were earned on cash deposit balances, were discontinued by the custodian. |
| 14 | See Notes to Financial Statements. |
Eaton Vance
Small-Cap Fund
December 31, 2018
Financial Highlights — continued
| Class I | ||||||||||||||||||||
| Year Ended December 31, | ||||||||||||||||||||
| 2018 | 2017 | 2016 | 2015 | 2014 | ||||||||||||||||
Net asset value — Beginning of year | $ | 14.450 | $ | 13.840 | $ | 13.080 | $ | 16.190 | $ | 18.840 | ||||||||||
| Income (Loss) From Operations | ||||||||||||||||||||
Net investment income (loss)(1) | $ | 0.010 | $ | (0.022 | ) | $ | (0.027 | ) | $ | (0.043 | ) | $ | (0.040 | ) | ||||||
Net realized and unrealized gain (loss) | (0.736 | ) | 2.081 | 2.555 | (0.230 | ) | 0.650 | |||||||||||||
Total income (loss) from operations | $ | (0.726 | ) | $ | 2.059 | $ | 2.528 | $ | (0.273 | ) | $ | 0.610 | ||||||||
| Less Distributions | ||||||||||||||||||||
From net realized gain | $ | (1.364 | ) | $ | (1.449 | ) | $ | (1.768 | ) | $ | (2.837 | ) | $ | (3.260 | ) | |||||
Total distributions | $ | (1.364 | ) | $ | (1.449 | ) | $ | (1.768 | ) | $ | (2.837 | ) | $ | (3.260 | ) | |||||
Net asset value — End of year | $ | 12.360 | $ | 14.450 | $ | 13.840 | $ | 13.080 | $ | 16.190 | ||||||||||
Total Return(2) | (5.57 | )%(3) | 15.17 | %(3) | 19.70 | % | (2.57 | )% | 3.99 | %(4) | ||||||||||
| Ratios/Supplemental Data | ||||||||||||||||||||
Net assets, end of year (000’s omitted) | $ | 35,097 | $ | 45,587 | $ | 34,888 | $ | 52,335 | $ | 74,510 | ||||||||||
Ratios (as a percentage of average daily net assets): | ||||||||||||||||||||
Expenses(5) | 1.10 | %(3) | 1.16 | %(3) | 1.27 | % | 1.18 | % | 1.13 | % | ||||||||||
Net investment income (loss) | 0.07 | % | (0.15 | )% | (0.21 | )% | (0.27 | )% | (0.22 | )% | ||||||||||
Portfolio Turnover | 44 | % | 50 | % | 76 | % | 71 | % | 66 | % | ||||||||||
| (1) | Computed using average shares outstanding. |
| (2) | Returns are historical and are calculated by determining the percentage change in net asset value with all distributions reinvested. |
| (3) | The administrator reimbursed certain operating expenses (equal to 0.17% and 0.10% of average daily net assets for the years ended December 31, 2018 and 2017, respectively). Absent this reimbursement, total return would be lower. |
| (4) | During the year ended December 31, 2014, the investment adviser reimbursed the Fund for a net loss realized on the disposal of an investment which did not meet the Fund’s investment guidelines. The reimbursement had no effect on total return for the year ended December 31, 2014. |
| (5) | Excludes the effect of custody fee credits, if any, of less than 0.005%. Effective September 1, 2015, custody fee credits, which were earned on cash deposit balances, were discontinued by the custodian. |
| 15 | See Notes to Financial Statements. |
Eaton Vance
Small-Cap Fund
December 31, 2018
Financial Highlights — continued
| Class R | ||||||||||||||||||||
| Year Ended December 31, | ||||||||||||||||||||
| 2018 | 2017 | 2016 | 2015 | 2014 | ||||||||||||||||
Net asset value — Beginning of year | $ | 12.670 | $ | 12.350 | $ | 11.900 | $ | 15.050 | $ | 17.820 | ||||||||||
| Income (Loss) From Operations | ||||||||||||||||||||
Net investment loss(1) | $ | (0.053 | ) | $ | (0.084 | ) | $ | (0.078 | ) | $ | (0.113 | ) | $ | (0.111 | ) | |||||
Net realized and unrealized gain (loss) | (0.633 | ) | 1.853 | 2.296 | (0.200 | ) | 0.601 | |||||||||||||
Total income (loss) from operations | $ | (0.686 | ) | $ | 1.769 | $ | 2.218 | $ | (0.313 | ) | $ | 0.490 | ||||||||
| Less Distributions | ||||||||||||||||||||
From net realized gain | $ | (1.364 | ) | $ | (1.449 | ) | $ | (1.768 | ) | $ | (2.837 | ) | $ | (3.260 | ) | |||||
Total distributions | $ | (1.364 | ) | $ | (1.449 | ) | $ | (1.768 | ) | $ | (2.837 | ) | $ | (3.260 | ) | |||||
Net asset value — End of year | $ | 10.620 | $ | 12.670 | $ | 12.350 | $ | 11.900 | $ | 15.050 | ||||||||||
Total Return(2) | (6.04 | )%(3) | 14.64 | %(3) | 19.04 | % | (3.05 | )% | 3.54 | %(4) | ||||||||||
| Ratios/Supplemental Data | ||||||||||||||||||||
Net assets, end of year (000’s omitted) | $ | 799 | $ | 722 | $ | 567 | $ | 289 | $ | 305 | ||||||||||
Ratios (as a percentage of average daily net assets): | ||||||||||||||||||||
Expenses(5) | 1.60 | %(3) | 1.66 | %(3) | 1.77 | % | 1.68 | % | 1.63 | % | ||||||||||
Net investment loss | (0.40 | )% | (0.66 | )% | (0.64 | )% | (0.77 | )% | (0.63 | )% | ||||||||||
Portfolio Turnover | 44 | % | 50 | % | 76 | % | 71 | % | 66 | % | ||||||||||
| (1) | Computed using average shares outstanding. |
| (2) | Returns are historical and are calculated by determining the percentage change in net asset value with all distributions reinvested. |
| (3) | The administrator reimbursed certain operating expenses (equal to 0.17% and 0.10% of average daily net assets for the years ended December 31, 2018 and 2017, respectively). Absent this reimbursement, total return would be lower. |
| (4) | During the year ended December 31, 2014, the investment adviser reimbursed the Fund for a net loss realized on the disposal of an investment which did not meet the Fund’s investment guidelines. The reimbursement had no effect on total return for the year ended December 31, 2014. |
| (5) | Excludes the effect of custody fee credits, if any, of less than 0.005%. Effective September 1, 2015, custody fee credits, which were earned on cash deposit balances, were discontinued by the custodian. |
| 16 | See Notes to Financial Statements. |
Eaton Vance
Small-Cap Fund
December 31, 2018
Notes to Financial Statements
1 Significant Accounting Policies
Eaton Vance Small-Cap Fund (the Fund) is a diversified series of Eaton Vance Special Investment Trust (the Trust). The Trust is a Massachusetts business trust registered under the Investment Company Act of 1940, as amended (the 1940 Act), as an open-end management investment company. The Fund’s investment objective is to seek long-term capital appreciation. The Fund offers four classes of shares. Class A shares are generally sold subject to a sales charge imposed at time of purchase. Class C shares are sold at net asset value and are generally subject to a contingent deferred sales charge (see Note 5). Class I and Class R shares are sold at net asset value and are not subject to a sales charge. The Fund previously offered Class B shares, which beginning January 1, 2012, were only available for purchase upon exchange from another Eaton Vance fund or through reinvestment of distributions. Class B shares automatically converted to Class A shares eight years after their purchase as described in the Fund’s prospectus. At the close of business on April 27, 2017, Class B shares were merged into Class A shares. Effective January 25, 2019, Class C shares generally will automatically convert to Class A shares ten years after their purchase as described in the Fund’s prospectus. Each class represents a pro-rata interest in the Fund, but votes separately onclass-specific matters and (as noted below) is subject to different expenses. Realized and unrealized gains and losses and net investment income and losses, other than class-specific expenses, are allocated daily to each class of shares based on the relative net assets of each class to the total net assets of the Fund. Each class of shares differs in its distribution plan and certain other class-specific expenses.
The following is a summary of significant accounting policies of the Fund. The policies are in conformity with accounting principles generally accepted in the United States of America (U.S. GAAP). The Fund is an investment company and follows accounting and reporting guidance in the Financial Accounting Standards Board (FASB) Accounting Standards Codification Topic 946.
A Investment Valuation — The following methodologies are used to determine the market value or fair value of investments.
Equity Securities. Equity securities listed on a U.S. securities exchange generally are valued at the last sale or closing price on the day of valuation or, if no sales took place on such date, at the mean between the closing bid and ask prices on the exchange where such securities are principally traded. Equity securities listed on the NASDAQ Global or Global Select Market generally are valued at the NASDAQ official closing price. Unlisted or listed securities for which closing sales prices or closing quotations are not available are valued at the mean between the latest available bid and ask prices.
Affiliated Fund. The Fund may invest in Eaton Vance Cash Reserves Fund, LLC (Cash Reserves Fund), an affiliated investment company managed by Eaton Vance Management (EVM). While Cash Reserves Fund is not a registered money market mutual fund, it conducts all of its investment activities in accordance with the requirements of Rule 2a-7 under the 1940 Act. Investments in Cash Reserves Fund are valued at the closing net asset value per unit on the valuation day. Cash Reserves Fund generally values its investment securities based on available market quotations provided by a third party pricing service.
Fair Valuation. Investments for which valuations or market quotations are not readily available or are deemed unreliable are valued at fair value using methods determined in good faith by or at the direction of the Trustees of the Fund in a manner that fairly reflects the security’s value, or the amount that the Fund might reasonably expect to receive for the security upon its current sale in the ordinary course. Each such determination is based on a consideration of relevant factors, which are likely to vary from one pricing context to another. These factors may include, but are not limited to, the type of security, the existence of any contractual restrictions on the security’s disposition, the price and extent of public trading in similar securities of the issuer or of comparable companies or entities, quotations or relevant information obtained from broker/dealers or other market participants, information obtained from the issuer, analysts, and/or the appropriate stock exchange (for exchange-traded securities), an analysis of the company’s or entity’s financial condition, and an evaluation of the forces that influence the issuer and the market(s) in which the security is purchased and sold.
B Investment Transactions — Investment transactions for financial statement purposes are accounted for on a trade date basis. Realized gains and losses on investments sold are determined on the basis of identified cost.
C Income — Dividend income is recorded on the ex-dividend date for dividends received in cash and/or securities. Withholding taxes on foreign dividends and capital gains have been provided for in accordance with the Fund’s understanding of the applicable countries’ tax rules and rates.
D Federal Taxes — The Fund’s policy is to comply with the provisions of the Internal Revenue Code applicable to regulated investment companies and to distribute to shareholders each year substantially all of its net investment income, and all or substantially all of its net realized capital gains. Accordingly, no provision for federal income or excise tax is necessary.
As of December 31, 2018, the Fund had no uncertain tax positions that would require financial statement recognition, de-recognition, or disclosure. The Fund files a U.S. federal income tax return annually after its fiscal year-end, which is subject to examination by the Internal Revenue Service for a period of three years from the date of filing.
E Expenses — The majority of expenses of the Trust are directly identifiable to an individual fund. Expenses which are not readily identifiable to a specific fund are allocated taking into consideration, among other things, the nature and type of expense and the relative size of the funds.
F Use of Estimates — The preparation of the financial statements in conformity with U.S. GAAP requires management to make estimates and assumptions that affect the reported amounts of assets and liabilities at the date of the financial statements and the reported amounts of income and expense during the reporting period. Actual results could differ from those estimates.
| 17 |
Eaton Vance
Small-Cap Fund
December 31, 2018
Notes to Financial Statements — continued
G Indemnifications — Under the Trust’s organizational documents, its officers and Trustees may be indemnified against certain liabilities and expenses arising out of the performance of their duties to the Fund. Under Massachusetts law, if certain conditions prevail, shareholders of a Massachusetts business trust (such as the Trust) could be deemed to have personal liability for the obligations of the Trust. However, the Trust’s Declaration of Trust contains an express disclaimer of liability on the part of Fund shareholders and the By-laws provide that the Trust shall assume the defense on behalf of any Fund shareholders. Moreover, the By-laws also provide for indemnification out of Fund property of any shareholder held personally liable solely by reason of being or having been a shareholder for all loss or expense arising from such liability. Additionally, in the normal course of business, the Fund enters into agreements with service providers that may contain indemnification clauses. The Fund’s maximum exposure under these arrangements is unknown as this would involve future claims that may be made against the Fund that have not yet occurred.
2 Distributions to Shareholders and Income Tax Information
It is the present policy of the Fund to make at least one distribution annually (normally in December) of all or substantially all of its net investment income and to distribute annually all or substantially all of its net realized capital gains. Distributions to shareholders are recorded on the ex-dividend date. Distributions are declared separately for each class of shares. Shareholders may reinvest income and capital gain distributions in additional shares of the same class of the Fund at the net asset value as of the ex-dividend date or, at the election of the shareholder, receive distributions in cash. Distributions to shareholders are determined in accordance with income tax regulations, which may differ from U.S. GAAP. As required by U.S. GAAP, only distributions in excess of tax basis earnings and profits are reported in the financial statements as a return of capital. Permanent differences between book and tax accounting relating to distributions are reclassified to paid-in capital. For tax purposes, distributions from short-term capital gains are considered to be from ordinary income.
The tax character of distributions declared for the years ended December 31, 2018 and December 31, 2017 was as follows:
| Year Ended December 31, | ||||||||
| 2018 | 2017 | |||||||
Ordinary income | $ | 973,145 | $ | 1,523,720 | ||||
Long-term capital gains | $ | 6,327,172 | $ | 6,590,922 | ||||
During the year ended December 31, 2018, distributable earnings was decreased by $800,576 and paid-in capital was increased by $800,576 due to the Fund’s use of equalization accounting. Tax equalization accounting allows the Fund to treat as a distribution that portion of redemption proceeds representing a redeeming shareholder’s portion of undistributed taxable income and net capital gains. These reclassifications had no effect on the net assets or net asset value per share of the Fund.
As of December 31, 2018, the components of distributable earnings (accumulated loss) on a tax basis were as follows:
Undistributed long-term capital gains | $ | 1,660,899 | ||
Post October capital losses | $ | (197,131 | ) | |
Net unrealized appreciation | $ | 7,244,186 | ||
At December 31, 2018, the Fund had a net capital loss of $197,131 attributable to security transactions incurred after October 31, 2018 that it has elected to defer. This net capital loss is treated as arising on the first day of the Fund’s taxable year ending December 31, 2019.
The cost and unrealized appreciation (depreciation) of investments of the Fund at December 31, 2018, as determined on a federal income tax basis, were as follows:
Aggregate cost | $ | 55,680,382 | ||
Gross unrealized appreciation | $ | 11,981,950 | ||
Gross unrealized depreciation | (4,737,764 | ) | ||
Net unrealized appreciation | $ | 7,244,186 | ||
| 18 |
Eaton Vance
Small-Cap Fund
December 31, 2018
Notes to Financial Statements — continued
3 Investment Adviser Fee and Other Transactions with Affiliates
The investment adviser fee is earned by Boston Management and Research (BMR), a subsidiary of EVM, as compensation for investment advisory services rendered to the Fund. The fee is computed at an annual rate of 0.75% of the Fund’s average daily net assets up to $500 million and is payable monthly. On net assets of $500 million and over, the annual fee is reduced. For the year ended December 31, 2018, the Fund’s investment adviser fee amounted to $597,546 or 0.75% of the Fund’s average daily net assets. The Fund invests its cash in Cash Reserves Fund. EVM does not currently receive a fee for advisory services provided to Cash Reserves Fund. The administration fee is earned by EVM for administering the business affairs of the Fund and is computed at an annual rate of 0.15% of the Fund’s average daily net assets. For the year ended December 31, 2018, the administration fee amounted to $119,509.
EVM has agreed to reimburse the Fund’s expenses to the extent that total annual operating expenses (relating to ordinary operating expenses only) exceed 1.35%, 2.10%, 1.10% and 1.60% of the Fund’s average daily net assets for Class A, Class C, Class I and Class R, respectively. Pursuant to this agreement, EVM was allocated $135,514 of the Fund’s operating expenses for the year ended December 31, 2018. Effective January 1, 2019, EVM has agreed to reimburse the Fund’s expenses to the extent that total annual operating expenses (relating to ordinary operating expenses only) exceed 1.21%, 1.96%, 0.96% and 1.46% of the Fund’s average daily net assets for Class A, Class C, Class I and Class R, respectively. This agreement may be changed or terminated after April 30, 2020.
EVM provides sub-transfer agency and related services to the Fund pursuant to a Sub-Transfer Agency Support Services Agreement. For the year ended December 31, 2018, EVM earned $25,305 from the Fund pursuant to such agreement, which is included in transfer and dividend disbursing agent fees on the Statement of Operations. The Fund was informed that Eaton Vance Distributors, Inc. (EVD), an affiliate of EVM and the Fund’s principal underwriter, received $4,903 as its portion of the sales charge on sales of Class A shares for the year ended December 31, 2018. EVD also received distribution and service fees from Class A, Class C and Class R shares (see Note 4) and contingent deferred sales charges (see Note 5).
Trustees and officers of the Fund who are members of EVM’s or BMR’s organizations receive remuneration for their services to the Fund out of the investment adviser fee. Trustees of the Fund who are not affiliated with the investment adviser may elect to defer receipt of all or a percentage of their annual fees in accordance with the terms of the Trustees Deferred Compensation Plan. For the year ended December 31, 2018, no significant amounts have been deferred. Certain officers and Trustees of the Fund are officers of the above organizations.
4 Distribution Plans
The Fund has in effect a distribution plan for Class A shares (Class A Plan) pursuant to Rule 12b-1 under the 1940 Act. Pursuant to the Class A Plan, the Fund pays EVD a distribution and service fee of 0.25% per annum of its average daily net assets attributable to Class A shares for distribution services and facilities provided to the Fund by EVD, as well as for personal services and/or the maintenance of shareholder accounts. Distribution and service fees paid or accrued to EVD for the year ended December 31, 2018 amounted to $60,285 for Class A shares.
The Fund also has in effect distribution plans for Class C shares (Class C Plan) and Class R shares (Class R Plan) pursuant to Rule 12b-1 under the 1940 Act. Pursuant to the Class C Plan, the Fund pays EVD amounts equal to 0.75% per annum of its average daily net assets attributable to Class C shares for providing ongoing distribution services and facilities to the Fund. For the year ended December 31, 2018, the Fund paid or accrued to EVD $67,548 for Class C shares.
The Class R Plan requires the Fund to pay EVD an amount up to 0.50% per annum of its average daily net assets attributable to Class R shares for providing ongoing distribution services and facilities to the Fund. The Trustees of the Trust have currently limited Class R distribution payments to 0.25% per annum of the average daily net assets attributable to Class R shares. For the year ended December 31, 2018, the Fund paid or accrued to EVD $2,000 for Class R shares.
Pursuant to the Class C and Class R Plans, the Fund also makes payments of service fees to EVD, financial intermediaries and other persons in amounts equal to 0.25% per annum of its average daily net assets attributable to that class. Service fees paid or accrued are for personal services and/or the maintenance of shareholder accounts. They are separate and distinct from the sales commissions and distribution fees payable to EVD. Service fees paid or accrued for the year ended December 31, 2018 amounted to $22,516 and $2,000 for Class C and Class R shares, respectively.
Distribution and service fees are subject to the limitations contained in the Financial Industry Regulatory Authority Rule 2341(d).
5 Contingent Deferred Sales Charges
A contingent deferred sales charge (CDSC) generally is imposed on redemptions of Class C shares made within one year of purchase. Class A shares may be subject to a 1% CDSC if redeemed within 18 months of purchase (depending on the circumstances of purchase). Generally, the CDSC is based upon the lower of the net asset value at date of redemption or date of purchase. No charge is levied on shares acquired by reinvestment of dividends or capital gain distributions. Class C shares are subject to a 1% CDSC if redeemed within one year of purchase. For the year ended December 31, 2018, the Fund was informed that EVD received less than $100 and approximately $1,000 of CDSCs paid by Class A and Class C shareholders, respectively.
| 19 |
Eaton Vance
Small-Cap Fund
December 31, 2018
Notes to Financial Statements — continued
6 Purchases and Sales of Investments
Purchases and sales of investments, other than short-term obligations, aggregated $34,214,879 and $47,688,849, respectively, for the year ended December 31, 2018.
7 Shares of Beneficial Interest
The Fund’s Declaration of Trust permits the Trustees to issue an unlimited number of full and fractional shares of beneficial interest (without par value). Such shares may be issued in a number of different series (such as the Fund) and classes. Transactions in Fund shares were as follows:
| Year Ended December 31, | ||||||||
| Class A | 2018 | 2017 | ||||||
Sales | 258,149 | 338,548 | ||||||
Issued to shareholders electing to receive payments of distributions in Fund shares | 185,092 | 187,923 | ||||||
Redemptions | (593,147 | ) | (1,077,773 | ) | ||||
Merger from Class B shares | — | 65,809 | ||||||
Exchange from Class B shares | — | 8,496 | ||||||
Net decrease | (149,906 | ) | (476,997 | ) | ||||
| Year Ended December 31, | ||||||||
| Class B | 2018 | 2017(1) | ||||||
Sales | — | 2,995 | ||||||
Issued to shareholders electing to receive payments of distributions in Fund shares | — | — | ||||||
Redemptions | — | (9,372 | ) | |||||
Merger to Class A shares | — | (71,490 | ) | |||||
Exchange to Class A shares | — | (9,223 | ) | |||||
Net increase (decrease) | — | (87,090 | ) | |||||
| Year Ended December 31, | ||||||||
| Class C | 2018 | 2017 | ||||||
Sales | 186,200 | 256,377 | ||||||
Issued to shareholders electing to receive payments of distributions in Fund shares | 100,851 | 100,048 | ||||||
Redemptions | (339,855 | ) | (400,759 | ) | ||||
Net decrease | (52,804 | ) | (44,334 | ) | ||||
| Year Ended December 31, | ||||||||
| Class I | 2018 | 2017 | ||||||
Sales | 440,035 | 1,049,947 | ||||||
Issued to shareholders electing to receive payments of distributions in Fund shares | 288,950 | 283,726 | ||||||
Redemptions | (1,044,718 | ) | (699,288 | ) | ||||
Net increase (decrease) | (315,733 | ) | 634,385 | |||||
| 20 |
Eaton Vance
Small-Cap Fund
December 31, 2018
Notes to Financial Statements — continued
| Year Ended December 31, | ||||||||
| Class R | 2018 | 2017 | ||||||
Sales | 30,244 | 18,555 | ||||||
Issued to shareholders electing to receive payments of distributions in Fund shares | 8,071 | 5,836 | ||||||
Redemptions | (20,029 | ) | (13,358 | ) | ||||
Net increase | 18,286 | 11,033 | ||||||
| (1) | Offering of Class B shares was discontinued during the year ended December 31, 2017 (see Note 1). |
8 Line of Credit
The Fund participates with other portfolios and funds managed by EVM and its affiliates in a $625 million unsecured line of credit agreement with a group of banks, which is in effect through October 29, 2019. Borrowings are made by the Fund solely to facilitate the handling of unusual and/or unanticipated short-term cash requirements. Interest is charged to the Fund based on its borrowings at an amount above either the Eurodollar rate or Federal Funds rate. In addition, a fee computed at an annual rate of 0.15% on the daily unused portion of the line of credit is allocated among the participating portfolios and funds at the end of each quarter. Because the line of credit is not available exclusively to the Fund, it may be unable to borrow some or all of its requested amounts at any particular time. At December 31, 2018, the Fund had a balance outstanding pursuant to this line of credit of $900,000 at an interest rate of 3.40%. Based on the short-term nature of the borrowings under the line of credit and variable interest rate, the carrying value of the borrowings approximated its fair value at December 31, 2018. If measured at fair value, borrowings under the line of credit would have been considered as Level 2 in the fair value hierarchy (see Note 9) at December 31, 2018. The Fund’s average borrowings or allocated fees during the year ended December 31, 2018 were not significant.
9 Fair Value Measurements
Under generally accepted accounting principles for fair value measurements, a three-tier hierarchy to prioritize the assumptions, referred to as inputs, is used in valuation techniques to measure fair value. The three-tier hierarchy of inputs is summarized in the three broad levels listed below.
| • | Level 1 – quoted prices in active markets for identical investments |
| • | Level 2 – other significant observable inputs (including quoted prices for similar investments, interest rates, prepayment speeds, credit risk, etc.) |
| • | Level 3 – significant unobservable inputs (including a fund’s own assumptions in determining the fair value of investments) |
In cases where the inputs used to measure fair value fall in different levels of the fair value hierarchy, the level disclosed is determined based on the lowest level input that is significant to the fair value measurement in its entirety. The inputs or methodology used for valuing securities are not necessarily an indication of the risk associated with investing in those securities.
At December 31, 2018, the hierarchy of inputs used in valuing the Fund’s investments, which are carried at value, were as follows:
| Asset Description | Level 1 | Level 2 | Level 3 | Total | ||||||||||||
Common Stocks | $ | 62,884,444 | * | $ | — | $ | — | $ | 62,884,444 | |||||||
Short-Term Investments | — | 40,124 | — | 40,124 | ||||||||||||
Total Investments | $ | 62,884,444 | $ | 40,124 | $ | — | $ | 62,924,568 | ||||||||
| * | The level classification by major category of investments is the same as the category presentation in the Portfolio of Investments. |
| 21 |
Eaton Vance
Small-Cap Fund
December 31, 2018
Report of Independent Registered Public Accounting Firm
To the Trustees of Eaton Vance Special Investment Trust and Shareholders of Eaton Vance Small-Cap Fund:
Opinion on the Financial Statements and Financial Highlights
We have audited the accompanying statement of assets and liabilities of Eaton Vance Small-Cap Fund (the “Fund”) (one of the funds constituting Eaton Vance Special Investment Trust), including the portfolio of investments, as of December 31, 2018, the related statement of operations for the year then ended, the statements of changes in net assets for each of the two years in the period then ended, the financial highlights for each of the five years in the period then ended, and the related notes. In our opinion, the financial statements and financial highlights present fairly, in all material respects, the financial position of the Fund as of December 31, 2018, and the results of its operations for the year then ended, the changes in its net assets for each of the two years in the period then ended, and the financial highlights for each of the five years in the period then ended, in conformity with accounting principles generally accepted in the United States of America.
Basis for Opinion
These financial statements and financial highlights are the responsibility of the Fund’s management. Our responsibility is to express an opinion on the Fund’s financial statements and financial highlights based on our audits. We are a public accounting firm registered with the Public Company Accounting Oversight Board (United States) (PCAOB) and are required to be independent with respect to the Fund in accordance with the U.S. federal securities laws and the applicable rules and regulations of the Securities and Exchange Commission and the PCAOB.
We conducted our audits in accordance with the standards of the PCAOB. Those standards require that we plan and perform the audit to obtain reasonable assurance about whether the financial statements and financial highlights are free of material misstatement, whether due to error or fraud. The Fund is not required to have, nor were we engaged to perform, an audit of its internal control over financial reporting. As part of our audits we are required to obtain an understanding of internal control over financial reporting but not for the purpose of expressing an opinion on the effectiveness of the Fund’s internal control over financial reporting. Accordingly, we express no such opinion.
Our audits included performing procedures to assess the risks of material misstatement of the financial statements and financial highlights, whether due to error or fraud, and performing procedures that respond to those risks. Such procedures included examining, on a test basis, evidence regarding the amounts and disclosures in the financial statements and financial highlights. Our audits also included evaluating the accounting principles used and significant estimates made by management, as well as evaluating the overall presentation of the financial statements and financial highlights. Our procedures included confirmation of securities owned as of December 31, 2018, by correspondence with the custodian and brokers; when replies were not received from brokers, we performed other auditing procedures. We believe that our audits provide a reasonable basis for our opinion.
/s/ Deloitte & Touche LLP
Boston, Massachusetts
February 22, 2019
We have served as the auditor of one or more Eaton Vance investment companies since 1959.
| 22 |
Eaton Vance
Small-Cap Fund
December 31, 2018
Federal Tax Information (Unaudited)
The Form 1099-DIV you received in February 2019 showed the tax status of all distributions paid to your account in calendar year 2018. Shareholders are advised to consult their own tax adviser with respect to the tax consequences of their investment in the Fund. As required by the Internal Revenue Code and/or regulations, shareholders must be notified regarding the status of qualified dividend income for individuals, the dividends received deduction for corporations and capital gains dividends.
Qualified Dividend Income. For the fiscal year ended December 31, 2018, the Fund designates approximately $719,558, or up to the maximum amount of such dividends allowable pursuant to the Internal Revenue Code, as qualified dividend income eligible for the reduced tax rate of 15%.
Dividends Received Deduction. Corporate shareholders are generally entitled to take the dividends received deduction on the portion of the Fund’s dividend distribution that qualifies under tax law. For the Fund’s fiscal 2018 ordinary income dividends, 58.69% qualifies for the corporate dividends received deduction.
Capital Gains Dividends. The Fund hereby designates as a capital gain dividend with respect to the taxable year ended December 31, 2018, $8,795,601 or, if subsequently determined to be different, the net capital gain of such year.
| 23 |
Eaton Vance
Small-Cap Fund
December 31, 2018
Special Meeting of Shareholders (Unaudited)
The Fund held a Special Meeting of Shareholders on September 20, 2018 to elect the five Trustees listed below. The other Trustees named herein continue to serve as Trustees. The results of the vote with respect to the Fund were as follows:
| Number of Shares | ||||||||
| Nominee for Trustee | For | Withheld | ||||||
Mark R. Fetting | 4,474,040 | 233,761 | ||||||
Keith Quinton | 4,464,734 | 243,067 | ||||||
Marcus L. Smith | 4,464,734 | 243,067 | ||||||
Susan J. Sutherland | 4,474,040 | 233,761 | ||||||
Scott E. Wennerholm | 4,468,983 | 238,817 | ||||||
Results are rounded to the nearest whole number.
| 24 |
Eaton Vance
Small-Cap Fund
December 31, 2018
Management and Organization
Fund Management. The Trustees of Eaton Vance Special Investment Trust (the Trust) are responsible for the overall management and supervision of the Trust’s affairs. The Trustees and officers of the Trust are listed below. Except as indicated, each individual has held the office shown or other offices in the same company for the last five years. Trustees and officers of the Trust hold indefinite terms of office. The “noninterested Trustees” consist of those Trustees who are not “interested persons” of the Trust, as that term is defined under the 1940 Act. The business address of each Trustee and officer is Two International Place, Boston, Massachusetts 02110. As used below, “EVC” refers to Eaton Vance Corp., “EV” refers to Eaton Vance, Inc., “EVM” refers to Eaton Vance Management, “BMR” refers to Boston Management and Research and “EVD” refers to Eaton Vance Distributors, Inc. EVC and EV are the corporate parent and trustee, respectively, of EVM and BMR. EVD is the Fund’s principal underwriter and a wholly-owned subsidiary of EVC. Each officer affiliated with Eaton Vance may hold a position with other Eaton Vance affiliates that is comparable to his or her position with EVM listed below. Each Trustee oversees 175 portfolios in the Eaton Vance Complex (including all master and feeder funds in a master feeder structure). Each officer serves as an officer of certain other Eaton Vance funds. Each Trustee and officer serves until his or her successor is elected.
| Name and Year of Birth | Position(s) with the Trust | Trustee Since(1) | Principal Occupation(s) and Directorships During Past Five Years and Other Relevant Experience | |||
| Interested Trustee | ||||||
Thomas E. Faust Jr. 1958 | Trustee | 2007 | Chairman, Chief Executive Officer and President of EVC, Director and President of EV, Chief Executive Officer and President of EVM and BMR, and Director of EVD. Trustee and/or officer of 175 registered investment companies. Mr. Faust is an interested person because of his positions with EVM, BMR, EVD, EVC and EV, which are affiliates of the Trust. Directorships in the Last Five Years.(2) Director of EVC and Hexavest Inc. (investment management firm). | |||
| Noninterested Trustees | ||||||
Mark R. Fetting 1954 | Trustee | 2016 | Private investor. Formerly held various positions at Legg Mason, Inc. (investment management firm) (2000-2012), including President, Chief Executive Officer, Director and Chairman (2008-2012), Senior Executive Vice President (2004-2008) and Executive Vice President (2001-2004). Formerly, President of Legg Mason family of funds (2001-2008). Formerly, Division President and Senior Officer of Prudential Financial Group, Inc. and related companies (investment management firm) (1991-2000). Directorships in the Last Five Years. None. | |||
Cynthia E. Frost 1961 | Trustee | 2014 | Private investor. Formerly, Chief Investment Officer of Brown University (university endowment) (2000-2012). Formerly, Portfolio Strategist for Duke Management Company (university endowment manager) (1995-2000). Formerly, Managing Director, Cambridge Associates (investment consulting company) (1989-1995). Formerly, Consultant, Bain and Company (management consulting firm) (1987-1989). Formerly, Senior Equity Analyst, BA Investment Management Company (1983-1985). Directorships in the Last Five Years. None. | |||
George J. Gorman 1952 | Trustee | 2014 | Principal at George J. Gorman LLC (consulting firm). Formerly, Senior Partner at Ernst & Young LLP (a registered public accounting firm) (1974-2009). Directorships in the Last Five Years. Formerly, Trustee of the BofA Funds Series Trust (11 funds) (2011-2014) and of the Ashmore Funds (9 funds) (2010-2014). | |||
Valerie A. Mosley 1960 | Trustee | 2014 | Chairwoman and Chief Executive Officer of Valmo Ventures (a consulting and investment firm). Former Partner and Senior Vice President, Portfolio Manager and Investment Strategist at Wellington Management Company, LLP (investment management firm) (1992-2012). Former Chief Investment Officer, PG Corbin Asset Management(1990-1992). Formerly worked in institutional corporate bond sales at Kidder Peabody(1986-1990). Directorships in the Last Five Years.(2) Director of Envestnet, Inc. (provider of intelligent systems for wealth management and financial wellness) (since 2018). | |||
William H. Park 1947 | Chairperson of the Board and Trustee | 2016 (Chairperson) 2003 (Trustee) | Private investor. Formerly, Consultant (management and transactional) (2012-2014). Formerly, Chief Financial Officer, Aveon Group L.P. (investment management firm)(2010-2011). Formerly, Vice Chairman, Commercial Industrial Finance Corp. (specialty finance company) (2006-2010). Formerly, President and Chief Executive Officer, Prizm Capital Management, LLC (investment management firm) (2002-2005). Formerly, Executive Vice President and Chief Financial Officer, United Asset Management Corporation (investment management firm) (1982-2001). Formerly, Senior Manager, Price Waterhouse (now PricewaterhouseCoopers) (a registered public accounting firm)(1972-1981). Directorships in the Last Five Years.(2) None. | |||
| 25 |
Eaton Vance
Small-Cap Fund
December 31, 2018
Management and Organization — continued
| Name and Year of Birth | Position(s) with the Trust | Trustee Since(1) | Principal Occupation(s) and Directorships During Past Five Years and Other Relevant Experience | |||
| Noninterested Trustees (continued) | ||||||
Helen Frame Peters 1948 | Trustee | 2008 | Professor of Finance, Carroll School of Management, Boston College. Formerly, Dean, Carroll School of Management, Boston College (2000-2002). Formerly, Chief Investment Officer, Fixed Income, Scudder Kemper Investments (investment management firm) (1998-1999). Formerly, Chief Investment Officer, Equity and Fixed Income, Colonial Management Associates (investment management firm) (1991-1998). Directorships in the Last Five Years.(2) None. | |||
Keith Quinton(3) 1958 | Trustee | 2018 | Independent Investment Committee Member at New Hampshire Retirement System (since 2017). Advisory Committee member at Northfield Information Services, Inc. (risk management analytics provider) (since 2016). Formerly, Portfolio Manager and Senior Quantitative Analyst at Fidelity Investments (investment management firm) (2001-2014). Directorships in the Last Five Years. Director of New Hampshire Municipal Bond Bank (since 2016). | |||
Marcus L. Smith(3) 1966 | Trustee | 2018 | Member of Posse Boston Advisory Board (foundation) (since 2015); Trustee at University of Mount Union (since 2008). Formerly, Portfolio Manager at MFS Investment Management (investment management firm) (1994-2017). Directorships in the Last Five Years. Director of MSCI Inc. (global provider of investment decision support tools) (since 2017). Director of DCT Industrial Trust Inc. (logistics real estate company) (since 2017). | |||
Susan J. Sutherland 1957 | Trustee | 2015 | Private investor. Formerly, Associate, Counsel and Partner at Skadden, Arps, Slate, Meagher & Flom LLP (law firm) (1982-2013). Directorships in the Last Five Years. Formerly, Director of Montpelier Re Holdings Ltd. (global provider of customized insurance and reinsurance products) (2013-2015). | |||
Scott E. Wennerholm 1959 | Trustee | 2016 | Formerly, Trustee at Wheelock College (postsecondary institution) (2012-2018). Formerly, Consultant at GF Parish Group (executive recruiting firm) (2016-2017). Formerly, Chief Operating Officer and Executive Vice President at BNY Mellon Asset Management (investment management firm) (2005-2011). Formerly, Chief Operating Officer and Chief Financial Officer at Natixis Global Asset Management (investment management firm) (1997-2004). Formerly, Vice President at Fidelity Investments Institutional Services (investment management firm) (1994-1997). Directorships in the Last Five Years. None. | |||
| Name and Year of Birth | Position(s) with the Trust | Officer Since(4) | Principal Occupation(s) During Past Five Years | |||
| Principal Officers who are not Trustees | ||||||
Payson F. Swaffield 1956 | President | 2003 | Vice President and Chief Income Investment Officer of EVM and BMR. Also Vice President of Calvert Research and Management (“CRM”). | |||
Maureen A. Gemma 1960 | Vice President, Secretary and Chief Legal Officer | 2005 | Vice President of EVM and BMR. Also Vice President of CRM. | |||
James F. Kirchner 1967 | Treasurer | 2007 | Vice President of EVM and BMR. Also Vice President of CRM. | |||
Richard F. Froio 1968 | Chief Compliance Officer | 2017 | Vice President of EVM and BMR since 2017. Formerly Deputy Chief Compliance Officer (Adviser/Funds) and Chief Compliance Officer (Distribution) at PIMCO (2012-2017) and Managing Director at BlackRock/Barclays Global Investors (2009-2012). | |||
| (1) | Year first appointed to serve as Trustee for a fund in the Eaton Vance family of funds. Each Trustee has served continuously since appointment unless indicated otherwise. |
| (2) | During their respective tenures, the Trustees (except for Mmes. Frost and Sutherland and Messrs. Fetting, Gorman, Quinton, Smith and Wennerholm) also served as Board members of one or more of the following funds (which operated in the years noted): eUnitsTM 2 Year U.S. Market Participation Trust: Upside to Cap / Buffered Downside (launched in 2012 and terminated in 2014); and eUnitsTM 2 Year U.S. Market Participation Trust II: Upside to Cap / Buffered Downside (launched in 2012 and terminated in 2014). However, Ms. Mosley did not serve as a Board member of eUnitsTM 2 Year U.S. Market Participation Trust: Upside to Cap / Buffered Downside (launched in 2012 and terminated in 2014). |
| 26 |
Eaton Vance
Small-Cap Fund
December 31, 2018
Management and Organization — continued
| (3) | Messrs. Quinton and Smith began serving as Trustees effective October 1, 2018. |
| (4) | Year first elected to serve as officer of a fund in the Eaton Vance family of funds when the officer has served continuously. Otherwise, year of most recent election as an officer of a fund in the Eaton Vance family of funds. Titles may have changed since initial election. |
The SAI for the Fund includes additional information about the Trustees and officers of the Fund and can be obtained without charge on Eaton Vance’s website at www.eatonvance.com or by calling 1-800-262-1122.
| 27 |
Eaton Vance Funds
IMPORTANT NOTICES
Privacy. The Eaton Vance organization is committed to ensuring your financial privacy. Each of the financial institutions identified below has in effect the following policy (“Privacy Policy”) with respect to nonpublic personal information about its customers:
| • | Only such information received from you, through application forms or otherwise, and information about your Eaton Vance fund transactions will be collected. This may include information such as name, address, social security number, tax status, account balances and transactions. |
| • | None of such information about you (or former customers) will be disclosed to anyone, except as permitted by law (which includes disclosure to employees necessary to service your account). In the normal course of servicing a customer’s account, Eaton Vance may share information with unaffiliated third parties that perform various required services such as transfer agents, custodians and broker-dealers. |
| • | Policies and procedures (including physical, electronic and procedural safeguards) are in place that are designed to protect the confidentiality of such information. |
| • | We reserve the right to change our Privacy Policy at any time upon proper notification to you. Customers may want to review our Privacy Policy periodically for changes by accessing the link on our homepage: www.eatonvance.com. |
Our pledge of privacy applies to the following entities within the Eaton Vance organization: the Eaton Vance Family of Funds, Eaton Vance Management, Eaton Vance Investment Counsel, Eaton Vance Distributors, Inc., Eaton Vance Trust Company, Eaton Vance Management (International) Limited, Eaton Vance Advisers International Ltd., Eaton Vance Management’s Real Estate Investment Group and Boston Management and Research. In addition, our Privacy Policy applies only to those Eaton Vance customers who are individuals and who have a direct relationship with us. If a customer’s account (i.e., fund shares) is held in the name of a third-party financial advisor/broker-dealer, it is likely that only such advisor’s privacy policies apply to the customer. This notice supersedes all previously issued privacy disclosures. For more information about Eaton Vance’s Privacy Policy, please call 1-800-262-1122.
Delivery of Shareholder Documents. The Securities and Exchange Commission (SEC) permits funds to deliver only one copy of shareholder documents, including prospectuses, proxy statements and shareholder reports, to fund investors with multiple accounts at the same residential or post office box address. This practice is often called “householding” and it helps eliminate duplicate mailings to shareholders.Eaton Vance, or your financial advisor, may household the mailing of your documents indefinitely unless you instruct Eaton Vance, or your financial advisor, otherwise.If you would prefer that your Eaton Vance documents not be householded, please contact Eaton Vance at 1-800-262-1122, or contact your financial advisor. Your instructions that householding not apply to delivery of your Eaton Vance documents will typically be effective within 30 days of receipt by Eaton Vance or your financial advisor.
Portfolio Holdings. Each Eaton Vance Fund and its underlying Portfolio(s) (if applicable) will file a schedule of portfolio holdings on Form N-Q with the SEC for the first and third quarters of each fiscal year. The Form N-Q will be available on the Eaton Vance website at www.eatonvance.com, by calling Eaton Vance at 1-800-262-1122 or in the EDGAR database on the SEC’s website at www.sec.gov. Form N-Q may also be reviewed and copied at the SEC’s public reference room in Washington, D.C. (call 1-800-732-0330 for information on the operation of the public reference room).
Proxy Voting. From time to time, funds are required to vote proxies related to the securities held by the funds. The Eaton Vance Funds or their underlying Portfolios (if applicable) vote proxies according to a set of policies and procedures approved by the Funds’ and Portfolios’ Boards. You may obtain a description of these policies and procedures and information on how the Funds or Portfolios voted proxies relating to portfolio securities during the most recent 12-month period ended June 30, without charge, upon request, by calling 1-800-262-1122 and by accessing the SEC’s website at www.sec.gov.
| 28 |
Investment Adviser
Boston Management and Research
Two International Place
Boston, MA 02110
Administrator
Eaton Vance Management
Two International Place
Boston, MA 02110
Principal Underwriter*
Eaton Vance Distributors, Inc.
Two International Place
Boston, MA 02110
(617) 482-8260
Custodian
State Street Bank and Trust Company
State Street Financial Center, One Lincoln Street
Boston, MA 02111
Transfer Agent
BNY Mellon Investment Servicing (US) Inc.
Attn: Eaton Vance Funds
P.O. Box 9653
Providence, RI 02940-9653
(800) 262-1122
Independent Registered Public Accounting Firm
Deloitte & Touche LLP
200 Berkeley Street
Boston, MA 02116-5022
Fund Offices
Two International Place
Boston, MA 02110
| * | FINRA BrokerCheck. Investors may check the background of their Investment Professional by contacting the Financial Industry Regulatory Authority (FINRA). FINRA BrokerCheck is a free tool to help investors check the professional background of current and former FINRA-registered securities firms and brokers. FINRA BrokerCheck is available by calling 1-800-289-9999 and at www.FINRA.org. The FINRA BrokerCheck brochure describing this program is available to investors at www.FINRA.org. |

164 12.31.18

Eaton Vance
Special Equities Fund
Annual Report
December 31, 2018
Important Note. Beginning on January 1, 2021, as permitted by regulations adopted by the Securities and Exchange Commission, paper copies of the Fund’s annual and semi-annual shareholder reports will no longer be sent by mail unless you specifically request paper copies of the reports. Instead, the reports will be made available on the Fund’s website (eatonvance.com/funddocuments), and you will be notified by mail each time a report is posted and provided with a website address to access the report.
If you already elected to receive shareholder reports electronically, you will not be affected by this change and you need not take any action. If you are a direct investor, you may elect to receive shareholder reports and other communications from the Fund electronically by signing up for e-Delivery at eatonvance.com/edelivery. If you own your shares through a financial intermediary (such as a broker-dealer or bank), you must contact your financial intermediary to sign up.
You may elect to receive all future Fund shareholder reports in paper free of charge. If you are a direct investor, you can inform the Fund that you wish to continue receiving paper copies of your shareholder reports by calling 1-800-262-1122. If you own these shares through a financial intermediary, you must contact your financial intermediary or follow instructions included with this disclosure, if applicable, to elect to continue to receive paper copies of your shareholder reports. Your election to receive reports in paper will apply to all Eaton Vance funds held directly or to all funds held through your financial intermediary, as applicable.

Commodity Futures Trading Commission Registration. Effective December 31, 2012, the Commodity Futures Trading Commission (“CFTC”) adopted certain regulatory changes that subject registered investment companies and advisers to regulation by the CFTC if a fund invests more than a prescribed level of its assets in certain CFTC-regulated instruments (including futures, certain options and swap agreements) or markets itself as providing investment exposure to such instruments. The Fund has claimed an exclusion from the definition of the term “commodity pool operator” under the Commodity Exchange Act. Accordingly, neither the Fund nor the adviser with respect to the operation of the Fund is subject to CFTC regulation. Because of its management of other strategies, the Fund’s adviser is registered with the CFTC as a commodity pool operator and a commodity trading advisor.
Fund shares are not insured by the FDIC and are not deposits or other obligations of, or guaranteed by, any depository institution. Shares are subject to investment risks, including possible loss of principal invested.
This report must be preceded or accompanied by a current summary prospectus or prospectus. Before investing, investors should consider carefully the investment objective, risks, and charges and expenses of a mutual fund. This and other important information is contained in the summary prospectus and prospectus, which can be obtained from a financial advisor. Prospective investors should read the prospectus carefully before investing. For further information, please call 1-800-262-1122.
Annual Report December 31, 2018
Eaton Vance
Special Equities Fund
Table of Contents
Management’s Discussion of Fund Performance | 2 | |||
Performance | 3 | |||
Fund Profile | 4 | |||
Endnotes and Additional Disclosures | 5 | |||
Fund Expenses | 6 | |||
Financial Statements | 7 | |||
Report of Independent Registered Public Accounting Firm | 20 | |||
Federal Tax Information | 21 | |||
Special Meeting of Shareholders | 22 | |||
Management and Organization | 23 | |||
Important Notices | 26 | |||
Eaton Vance
Special Equities Fund
December 31, 2018
Management’s Discussion of Fund Performance1
Economic and Market Conditions
U.S. stock indexes declined during the 12-month period ended December 31, 2018, as a sharp downturn in the final quarter of the year erased earlier gains.
U.S. stocks opened the period on an upswing, as investors reacted favorably to the passage of the Republican tax reform package in December 2017. Sharp cuts in corporate taxes, a key element of the bill, raised corporate-profit expectations. U.S. stocks also got a boost from positive U.S. economic data, including the unemployment rate, which fell to a 17-year low.
In February 2018, however, U.S. stocks pulled back amid fears that rising interest rates might boost the appeal of fixed-income investments. After a brief rebound, equity markets again weakened in the spring of 2018, as investors confronted the prospect of a global trade war due to President Trump’s then-new tariffs. The broad tariffs drew retaliatory actions from impacted countries including China, Canada, and certain countries in the European Union.
U.S. stocks bounced back during the summer months led by technology stocks, which rebounded following an earlier setback from a wave of data-privacy scandals. Markets plunged in the final three months of the period amid global trade war fears and sagging economies in China and Europe. Despite a partial rebound in the final days of the period, the U.S. stock market’s December 2018 plunge was the worst monthly loss since the 2008 financial crisis.
Amid investor worries, however, U.S. economic data remained largely positive during the period, prompting the U.S. Federal Reserve (the Fed) to raise the federal funds rate in December 2018 for the fourth time during the period. Since then, the Fed has indicated that it may reconsider its planned 2019 rate hikes.
For the 12-month period ended December 31, 2018, the blue-chip Dow Jones Industrial Average®2 declined 3.48%, while the broader U.S. equity market represented by the S&P 500® Index fell 4.38%. The technology-laden NASDAQ Composite Index fell 2.84% during the period. Large-cap U.S. stocks as measured by the S&P 500® Index generally outperformed their small-cap counterparts as measured by the Russell 2000® Index during the period. Growth stocks as a group outpaced value stocks in both the large- and small-cap categories, as measured by the Russell Growth and Value Indexes.
Fund Performance
For the 12-month period ended December 31, 2018, Eaton Vance Special Equities Fund (the Fund) returned –4.95% for Class A shares at net asset value (NAV), outperforming its benchmark, the Russell 2500™ Index (the Index), which returned –10.00%.
The Fund outperformed the Index largely due to stock selections. Sector and industry allocations also made a positive contribution to Fund performance relative to the Index. Of the 11 market sectors in the Index, the Fund recorded positive returns in seven sectors. The Index had positive returns in two sectors.
The health care sector contributed the most to relative Fund performance versus the Index due to stock selections. Within the sector, the health care providers & services industry delivered notable results during the period. The Fund’s top-performing stock, home health services provider Amedisys, Inc., benefited from strong organic growth and a more favorable government regulatory environment. An underweight position in the biotechnology industry also aided relative Fund performance, as the industry lagged during the period.
In the outperforming consumer discretionary sector, an overweight position in the diversified consumer services industry aided Fund results versus the Index during the period. Grand Canyon Education, Inc., a provider of post-secondary education services, was among the Fund’s stock leaders as it recorded strong earnings growth and unlocked value by converting to a technology services company. In the same industry, ServiceMaster Global Holdings, Inc., a pest control leader, also outperformed the Index after a spin-off of its home warranty business.
In the textile, apparel and leisure industry, shares of Gildan Activewear, Inc., an apparel manufacturer, rose after the company gained a major new customer. The materials sector contributed to Fund performance relative to the Index due to stock selections and an underweight position — in particular, a lack of exposure to the depressed metals & mining industry.
Conversely, financials was the weakest-performing sector versus the Index during the period. In the lagging banking industry, Sterling Bancorp and Texas Capital Bancshares, Inc. were among the Fund’s weakest stocks. Both banks suffered from slowing loan growth and tightening net interest margins. The capital markets industry was also a notable laggard during the period.
The industrials sector also dragged down relative Fund returns due to stock selections and an overweight position. In the commercial services & supplies industry, consumer-product label supplier Multi-Color Corp. was the Fund’s weakest stock after poor results and an unfavorable reaction to a major acquisition. In the same industry, shares of check printer Deluxe Corp. declined following the departure of its long-tenured CEO. Deluxe Corp. was sold during the period.
An underweight position in the communication services sector also detracted from relative Fund performance during the period. In particular, the Fund’s lack of exposure to the outperforming entertainment industry dragged down relative Fund returns.
See Endnotes and Additional Disclosures in this report.
Past performance is no guarantee of future results. Returns are historical and are calculated by determining the percentage change in net asset value (NAV) or offering price (as applicable) with all distributions reinvested. Investment return and principal value will fluctuate so that shares, when redeemed, may be worth more or less than their original cost. Performance less than or equal to one year is cumulative. Performance is for the stated time period only; due to market volatility, the Fund’s current performance may be lower or higher than quoted. Returns are before taxes unless otherwise noted. For performance as of the most recent month-end, please refer to eatonvance.com.
| 2 |
Eaton Vance
Special Equities Fund
December 31, 2018
Performance2,3
Portfolio Managers Michael D. McLean, CFA and J. Griffith Noble, CFA
| % Average Annual Total Returns | Class Inception Date | Performance Inception Date | One Year | Five Years | Ten Years | |||||||||||||||
Class A at NAV | 04/22/1968 | 04/22/1968 | –4.95 | % | 4.56 | % | 11.28 | % | ||||||||||||
Class A with 5.75% Maximum Sales Charge | — | — | –10.40 | 3.32 | 10.63 | |||||||||||||||
Class C at NAV | 11/17/1994 | 04/22/1968 | –5.66 | 3.77 | 10.45 | |||||||||||||||
Class C with 1% Maximum Sales Charge | — | — | –6.52 | 3.77 | 10.45 | |||||||||||||||
Class I at NAV | 07/29/2011 | 04/22/1968 | –4.67 | 4.83 | 11.50 | |||||||||||||||
Russell 2500™ Index | — | — | –10.00 | % | 5.14 | % | 13.14 | % | ||||||||||||
| % Total Annual Operating Expense Ratios4 | Class A | Class C | Class I | |||||||||||||||||
Gross | 1.37 | % | 2.12 | % | 1.12 | % | ||||||||||||||
Net | 1.35 | 2.10 | 1.10 | |||||||||||||||||
Growth of $10,000
This graph shows the change in value of a hypothetical investment of $10,000 in Class A of the Fund for the period indicated. For comparison, the same investment is shown in the indicated index.
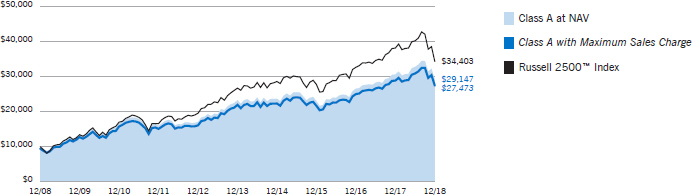
| Growth of Investment3 | Amount Invested | Period Beginning | At NAV | With Maximum Sales Charge | ||||||||||||
Class C | $ | 10,000 | 12/31/2008 | $ | 27,034 | N.A. | ||||||||||
Class I | $ | 250,000 | 12/31/2008 | $ | 742,909 | N.A. | ||||||||||
See Endnotes and Additional Disclosures in this report.
Past performance is no guarantee of future results. Returns are historical and are calculated by determining the percentage change in net asset value (NAV) or offering price (as applicable) with all distributions reinvested. Investment return and principal value will fluctuate so that shares, when redeemed, may be worth more or less than their original cost. Performance less than or equal to one year is cumulative. Performance is for the stated time period only; due to market volatility, the Fund’s current performance may be lower or higher than quoted. Returns are before taxes unless otherwise noted. For performance as of the most recent month-end, please refer to eatonvance.com.
| 3 |
Eaton Vance
Special Equities Fund
December 31, 2018
Fund Profile
Sector Allocation (% of net assets)5
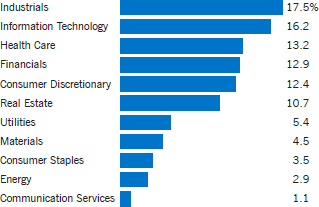
Top 10 Holdings (% of net assets)5
ACI Worldwide, Inc. | 2.7 | % | ||
RealPage, Inc. | 2.4 | |||
Grand Canyon Education, Inc. | 2.0 | |||
Hexcel Corp. | 2.0 | |||
Gildan Activewear, Inc. | 2.0 | |||
Black Knight, Inc. | 1.9 | |||
Performance Food Group Co. | 1.9 | |||
Dolby Laboratories, Inc., Class A | 1.8 | |||
Euronet Worldwide, Inc. | 1.8 | |||
Altair Engineering, Inc., Class A | 1.7 | |||
Total | 20.2 | % | ||
See Endnotes and Additional Disclosures in this report.
| 4 |
Eaton Vance
Special Equities Fund
December 31, 2018
Endnotes and Additional Disclosures
| 1 | The views expressed in this report are those of the portfolio manager(s) and are current only through the date stated at the top of this page. These views are subject to change at any time based upon market or other conditions, and Eaton Vance and the Fund(s) disclaim any responsibility to update such views. These views may not be relied upon as investment advice and, because investment decisions are based on many factors, may not be relied upon as an indication of trading intent on behalf of any Eaton Vance fund. This commentary may contain statements that are not historical facts, referred to as “forward looking statements.” The Fund’s actual future results may differ significantly from those stated in any forward looking statement, depending on factors such as changes in securities or financial markets or general economic conditions, the volume of sales and purchases of Fund shares, the continuation of investment advisory, administrative and service contracts, and other risks discussed from time to time in the Fund’s filings with the Securities and Exchange Commission. |
| 2 | Dow Jones Industrial Average® is a price-weighted average of 30 blue-chip stocks that are generally the leaders in their industry. S&P 500® Index is an unmanaged index of large-cap stocks commonly used as a measure of U.S. stock market performance. NASDAQ Composite Index is a market capitalization-weighted index of all domestic and international securities listed on NASDAQ. Source: Nasdaq, Inc. The information is provided by Nasdaq (with its affiliates, are referred to as the “Corporations”) and Nasdaq’s third party licensors on an “as is” basis and the Corporations make no guarantees and bear no liability of any kind with respect to the information or the Fund. Russell 2000® Index is an unmanaged index of 2,000 U.S. small-cap stocks. Russell 2500™ Index is an unmanaged index of approximately 2,500 small- and midcap U.S. stocks. Unless otherwise stated, index returns do not reflect the effect of any applicable sales charges, commissions, expenses, taxes or leverage, as applicable. It is not possible to invest directly in an index. |
| 3 | Total Returns at NAV do not include applicable sales charges. If sales charges were deducted, the returns would be lower. Total Returns shown with maximum sales charge reflect the stated maximum sales charge. Unless otherwise stated, performance does not reflect the deduction of taxes on Fund distributions or redemptions of Fund shares. |
Performance prior to the inception date of a class may be linked to the performance of an older class of the Fund. This linked performance is adjusted for any applicable sales charge, but is not adjusted for class expense differences. If adjusted for such differences, the performance would be different. The performance of Class I is linked to Class A. Performance since inception for an index, if presented, is the performance since the Fund’s or oldest share class’ inception, as applicable. Performance presented in the Financial Highlights included in the financial statements is not linked. |
| 4 | Source: Fund prospectus. Net expense ratios reflect a contractual expense reimbursement that continues through 4/30/19. Without the reimbursement, performance would have been lower. The expense ratios for the current reporting period can be found in the Financial Highlights section of this report. |
| 5 | Excludes cash and cash equivalents. |
Fund profile subject to change due to active management. |
| 5 |
Eaton Vance
Special Equities Fund
December 31, 2018
Fund Expenses
Example: As a Fund shareholder, you incur two types of costs: (1) transaction costs, including sales charges (loads) on purchases and redemption fees (if applicable); and (2) ongoing costs, including management fees; distribution and/or service fees; and other Fund expenses. This Example is intended to help you understand your ongoing costs (in dollars) of Fund investing and to compare these costs with the ongoing costs of investing in other mutual funds. The Example is based on an investment of $1,000 invested at the beginning of the period and held for the entire period (July 1, 2018 – December 31, 2018).
Actual Expenses: The first section of the table below provides information about actual account values and actual expenses. You may use the information in this section, together with the amount you invested, to estimate the expenses that you paid over the period. Simply divide your account value by $1,000 (for example, an $8,600 account value divided by $1,000 = 8.6), then multiply the result by the number in the first section under the heading entitled “Expenses Paid During Period” to estimate the expenses you paid on your account during this period.
Hypothetical Example for Comparison Purposes: The second section of the table below provides information about hypothetical account values and hypothetical expenses based on the actual Fund expense ratio and an assumed rate of return of 5% per year (before expenses), which is not the actual Fund return. The hypothetical account values and expenses may not be used to estimate the actual ending account balance or expenses you paid for the period. You may use this information to compare the ongoing costs of investing in your Fund and other funds. To do so, compare this 5% hypothetical example with the 5% hypothetical examples that appear in the shareholder reports of the other funds.
Please note that the expenses shown in the table are meant to highlight your ongoing costs only and do not reflect any transactional costs, such as sales charges (loads) or redemption fees (if applicable). Therefore, the second section of the table is useful in comparing ongoing costs only, and will not help you determine the relative total costs of owning different funds. In addition, if these transactional costs were included, your costs would be higher.
| Beginning Account Value (7/1/18) | Ending Account Value (12/31/18) | Expenses Paid During Period* (7/1/18 – 12/31/18) | Annualized Expense Ratio | |||||||||||||
Actual | ||||||||||||||||
Class A | $ | 1,000.00 | $ | 887.50 | $ | 6.42 | ** | 1.35 | % | |||||||
Class C | $ | 1,000.00 | $ | 884.00 | $ | 9.97 | ** | 2.10 | % | |||||||
Class I | $ | 1,000.00 | $ | 888.80 | $ | 5.24 | ** | 1.10 | % | |||||||
Hypothetical | ||||||||||||||||
(5% return per year before expenses) | ||||||||||||||||
Class A | $ | 1,000.00 | $ | 1,018.40 | $ | 6.87 | ** | 1.35 | % | |||||||
Class C | $ | 1,000.00 | $ | 1,014.60 | $ | 10.66 | ** | 2.10 | % | |||||||
Class I | $ | 1,000.00 | $ | 1,019.70 | $ | 5.60 | ** | 1.10 | % | |||||||
| * | Expenses are equal to the Fund’s annualized expense ratio for the indicated Class, multiplied by the average account value over the period, multiplied by 184/365 (to reflect the one-half year period). The Example assumes that the $1,000 was invested at the net asset value per share determined at the close of business on June 30, 2018. |
| ** | Absent an allocation of certain expenses to an affiliate, expenses would be higher. |
| 6 |
Eaton Vance
Special Equities Fund
December 31, 2018
Portfolio of Investments
| Common Stocks — 100.3% |
| |||||||
| Security | Shares | Value | ||||||
| Aerospace & Defense — 3.0% | ||||||||
Hexcel Corp. | 14,351 | $ | 822,886 | |||||
Mercury Systems, Inc.(1) | 8,916 | 421,638 | ||||||
| $ | 1,244,524 | |||||||
| Auto Components — 0.6% | ||||||||
Visteon Corp.(1) | 4,240 | $ | 255,587 | |||||
| $ | 255,587 | |||||||
| Banks — 5.9% | ||||||||
Columbia Banking System, Inc. | 5,480 | $ | 198,869 | |||||
First Republic Bank | 4,913 | 426,940 | ||||||
Sterling Bancorp | 29,013 | 479,005 | ||||||
Stock Yards Bancorp, Inc. | 11,375 | 373,100 | ||||||
Texas Capital Bancshares, Inc.(1) | 7,905 | 403,866 | ||||||
Western Alliance Bancorp(1) | 5,590 | 220,749 | ||||||
Wintrust Financial Corp. | 4,527 | 301,000 | ||||||
| $ | 2,403,529 | |||||||
| Biotechnology — 0.5% | ||||||||
Ligand Pharmaceuticals, Inc.(1) | 1,605 | $ | 217,798 | |||||
| $ | 217,798 | |||||||
| Building Products — 0.4% | ||||||||
Trex Co., Inc.(1) | 2,990 | $ | 177,486 | |||||
| $ | 177,486 | |||||||
| Capital Markets — 2.2% | ||||||||
Cohen & Steers, Inc. | 19,204 | $ | 659,081 | |||||
Lazard, Ltd., Class A | 6,358 | 234,674 | ||||||
| $ | 893,755 | |||||||
| Chemicals — 3.8% | ||||||||
Balchem Corp. | 5,757 | $ | 451,061 | |||||
NewMarket Corp. | 1,260 | 519,233 | ||||||
Valvoline, Inc. | 31,310 | 605,849 | ||||||
| $ | 1,576,143 | |||||||
| Commercial Services & Supplies — 3.6% | ||||||||
Brink’s Co. (The) | 8,291 | $ | 536,013 | |||||
Copart, Inc.(1) | 4,675 | 223,372 | ||||||
Multi-Color Corp. | 12,890 | 452,310 | ||||||
Viad Corp. | 5,520 | 276,497 | ||||||
| $ | 1,488,192 | |||||||
| Security | Shares | Value | ||||||
| Containers & Packaging — 0.7% | ||||||||
Ball Corp. | 5,935 | $ | 272,891 | |||||
| $ | 272,891 | |||||||
| Distributors — 0.4% | ||||||||
Pool Corp. | 1,190 | $ | 176,894 | |||||
| $ | 176,894 | |||||||
| Diversified Consumer Services — 4.3% | ||||||||
Bright Horizons Family Solutions, Inc.(1) | 2,229 | $ | 248,422 | |||||
Grand Canyon Education, Inc.(1) | 8,688 | 835,264 | ||||||
ServiceMaster Global Holdings, Inc.(1) | 18,950 | 696,223 | ||||||
| $ | 1,779,909 | |||||||
| Electric Utilities — 2.6% | ||||||||
ALLETE, Inc. | 3,875 | $ | 295,353 | |||||
Alliant Energy Corp. | 9,839 | 415,698 | ||||||
Pinnacle West Capital Corp. | 4,177 | 355,880 | ||||||
| $ | 1,066,931 | |||||||
| Electrical Equipment — 3.2% | ||||||||
AMETEK, Inc. | 10,335 | $ | 699,680 | |||||
EnerSys | 7,682 | 596,200 | ||||||
| $ | 1,295,880 | |||||||
| Electronic Equipment, Instruments & Components — 1.8% | ||||||||
Dolby Laboratories, Inc., Class A | 12,206 | $ | 754,819 | |||||
| $ | 754,819 | |||||||
| Energy Equipment & Services — 0.4% | ||||||||
Oceaneering International, Inc.(1) | 14,220 | $ | 172,062 | |||||
| $ | 172,062 | |||||||
| Equity Real Estate Investment Trusts (REITs) — 10.7% | ||||||||
Acadia Realty Trust | 13,270 | $ | 315,295 | |||||
American Homes 4 Rent, Class A | 18,105 | 359,384 | ||||||
CubeSmart | 18,562 | 532,544 | ||||||
Douglas Emmett, Inc. | 7,540 | 257,340 | ||||||
EastGroup Properties, Inc. | 5,455 | 500,387 | ||||||
Essex Property Trust, Inc. | 1,771 | 434,267 | ||||||
Federal Realty Investment Trust | 2,144 | 253,078 | ||||||
Healthcare Realty Trust, Inc. | 11,450 | 325,638 | ||||||
National Retail Properties, Inc. | 9,925 | 481,462 | ||||||
Paramount Group, Inc. | 32,609 | 409,569 | ||||||
| 7 | See Notes to Financial Statements. |
Eaton Vance
Special Equities Fund
December 31, 2018
Portfolio of Investments — continued
| Security | Shares | Value | ||||||
| Equity Real Estate Investment Trusts (REITs) (continued) | ||||||||
Rexford Industrial Realty, Inc. | 17,340 | $ | 511,010 | |||||
| $ | 4,379,974 | |||||||
| Food & Staples Retailing — 1.9% | ||||||||
Performance Food Group Co.(1) | 23,683 | $ | 764,250 | |||||
| $ | 764,250 | |||||||
| Food Products — 0.3% | ||||||||
J&J Snack Foods Corp. | 875 | $ | 126,516 | |||||
| $ | 126,516 | |||||||
| Gas Utilities — 1.3% | ||||||||
ONE Gas, Inc. | 6,595 | $ | 524,962 | |||||
| $ | 524,962 | |||||||
| Health Care Equipment & Supplies — 7.4% | ||||||||
Cooper Cos., Inc. (The) | 1,216 | $ | 309,472 | |||||
ICU Medical, Inc.(1) | 2,683 | 616,097 | ||||||
Integra LifeSciences Holdings Corp.(1) | 7,874 | 355,118 | ||||||
Masimo Corp.(1) | 3,330 | 357,542 | ||||||
Teleflex, Inc. | 2,294 | 592,953 | ||||||
West Pharmaceutical Services, Inc. | 5,179 | 507,697 | ||||||
Wright Medical Group NV(1) | 10,155 | 276,419 | ||||||
| $ | 3,015,298 | |||||||
| Health Care Providers & Services — 2.9% | ||||||||
Addus HomeCare Corp.(1) | 4,775 | $ | 324,127 | |||||
Amedisys, Inc.(1) | 4,100 | 480,151 | ||||||
Chemed Corp. | 1,170 | 331,438 | ||||||
R1 RCM, Inc.(1) | 8,160 | 64,872 | ||||||
| $ | 1,200,588 | |||||||
| Household Products — 1.4% | ||||||||
Central Garden & Pet Co., Class A(1) | 17,717 | $ | 553,656 | |||||
| $ | 553,656 | |||||||
| Insurance — 4.2% | ||||||||
AMERISAFE, Inc. | 3,645 | $ | 206,635 | |||||
First American Financial Corp. | 8,101 | 361,629 | ||||||
Horace Mann Educators Corp. | 14,640 | 548,268 | ||||||
Kinsale Capital Group, Inc. | 2,140 | 118,898 | ||||||
RLI Corp. | 7,142 | 492,727 | ||||||
| $ | 1,728,157 | |||||||
| Security | Shares | Value | ||||||
| Interactive Media & Services — 1.1% | ||||||||
Eventbrite, Inc., Class A(1) | 16,176 | $ | 449,855 | |||||
| $ | 449,855 | |||||||
| IT Services — 5.3% | ||||||||
Black Knight, Inc.(1) | 17,087 | $ | 769,940 | |||||
Conduent, Inc.(1) | 21,595 | 229,555 | ||||||
CSG Systems International, Inc. | 13,844 | 439,824 | ||||||
Euronet Worldwide, Inc.(1) | 7,171 | 734,167 | ||||||
| $ | 2,173,486 | |||||||
| Leisure Products — 0.7% | ||||||||
Brunswick Corp. | 6,205 | $ | 288,222 | |||||
| $ | 288,222 | |||||||
| Machinery — 2.6% | ||||||||
Milacron Holdings Corp.(1) | 26,488 | $ | 314,942 | |||||
RBC Bearings, Inc.(1) | 1,951 | 255,776 | ||||||
Woodward, Inc. | 6,415 | 476,571 | ||||||
| $ | 1,047,289 | |||||||
| Marine — 1.2% | ||||||||
Kirby Corp.(1) | 7,088 | $ | 477,448 | |||||
| $ | 477,448 | |||||||
| Multi-Utilities — 1.2% | ||||||||
CMS Energy Corp. | 10,295 | $ | 511,147 | |||||
| $ | 511,147 | |||||||
| Oil, Gas & Consumable Fuels — 2.5% | ||||||||
Diamondback Energy, Inc. | 6,565 | $ | 608,576 | |||||
Gulfport Energy Corp.(1) | 9,745 | 63,830 | ||||||
Jagged Peak Energy, Inc.(1) | 9,794 | 89,321 | ||||||
PDC Energy, Inc.(1) | 8,265 | 245,966 | ||||||
| $ | 1,007,693 | |||||||
| Pharmaceuticals — 2.4% | ||||||||
Catalent, Inc.(1) | 17,475 | $ | 544,871 | |||||
Jazz Pharmaceuticals PLC(1) | 3,670 | 454,933 | ||||||
| $ | 999,804 | |||||||
| Road & Rail — 2.1% | ||||||||
Kansas City Southern | 6,115 | $ | 583,677 | |||||
Landstar System, Inc. | 2,915 | 278,878 | ||||||
| $ | 862,555 | |||||||
| 8 | See Notes to Financial Statements. |
Eaton Vance
Special Equities Fund
December 31, 2018
Portfolio of Investments — continued
| Security | Shares | Value | ||||||
| Software — 9.1% | ||||||||
ACI Worldwide, Inc.(1) | 39,793 | $ | 1,101,072 | |||||
Altair Engineering, Inc., Class A(1) | 25,602 | 706,103 | ||||||
Blackbaud, Inc. | 4,730 | 297,517 | ||||||
CDK Global, Inc. | 8,215 | 393,334 | ||||||
Ceridian HCM Holding, Inc.(1) | 6,736 | 232,325 | ||||||
RealPage, Inc.(1) | 20,748 | 999,846 | ||||||
| $ | 3,730,197 | |||||||
| Specialty Retail — 3.1% | ||||||||
Floor & Decor Holdings, Inc., Class A(1) | 6,240 | $ | 161,616 | |||||
Hudson, Ltd., Class A(1) | 9,700 | 166,355 | ||||||
Monro, Inc. | 4,500 | 309,375 | ||||||
National Vision Holdings, Inc.(1) | 5,645 | 159,019 | ||||||
Tractor Supply Co. | 5,820 | 485,621 | ||||||
| $ | 1,281,986 | |||||||
| Textiles, Apparel & Luxury Goods — 3.2% | ||||||||
Columbia Sportswear Co. | 5,725 | $ | 481,415 | |||||
Gildan Activewear, Inc. | 26,975 | 818,961 | ||||||
| $ | 1,300,376 | |||||||
| Thrifts & Mortgage Finance — 0.6% | ||||||||
Essent Group, Ltd.(1) | 7,169 | $ | 245,036 | |||||
| $ | 245,036 | |||||||
| Trading Companies & Distributors — 1.5% | ||||||||
Applied Industrial Technologies, Inc. | 11,219 | $ | 605,153 | |||||
| $ | 605,153 | |||||||
| Water Utilities — 0.2% | ||||||||
Middlesex Water Co. | 1,805 | $ | 96,297 | |||||
| $ | 96,297 | |||||||
Total Common Stocks |
| $ | 41,146,345 | |||||
| Short-Term Investments — 0.8% |
| |||||||
| Description | Units | Value | ||||||
Eaton Vance Cash Reserves Fund, LLC, 2.46%(2) | 353,753 | $ | 353,718 | |||||
Total Short-Term Investments |
| $ | 353,718 | |||||
Total Investments — 101.1% |
| $ | 41,500,063 | |||||
Other Assets, Less Liabilities — (1.1)% |
| $ | (462,037 | ) | ||||
Net Assets — 100.0% |
| $ | 41,038,026 | |||||
The percentage shown for each investment category in the Portfolio of Investments is based on net assets.
| (1) | Non-income producing security. |
| (2) | Affiliated investment company, available to Eaton Vance portfolios and funds, which invests in high quality, U.S. dollar denominated money market instruments. The rate shown is the annualized seven-day yield as of December 31, 2018. |
| 9 | See Notes to Financial Statements. |
Eaton Vance
Special Equities Fund
December 31, 2018
Statement of Assets and Liabilities
| Assets | December 31, 2018 | |||
Unaffiliated investments, at value (identified cost, $37,377,249) | $ | 41,146,345 | ||
Affiliated investment, at value (identified cost, $353,713) | 353,718 | |||
Dividends receivable | 36,067 | |||
Dividends receivable from affiliated investment | 470 | |||
Receivable for Fund shares sold | 20,958 | |||
Total assets | $ | 41,557,558 | ||
| Liabilities | ||||
Payable for investments purchased | $ | 218,716 | ||
Payable for Fund shares redeemed | 197,531 | |||
Payable to affiliates: | ||||
Investment adviser fee | 22,193 | |||
Distribution and service fees | 7,630 | |||
Trustees’ fees | 645 | |||
Other | 1,536 | |||
Accrued expenses | 71,281 | |||
Total liabilities | $ | 519,532 | ||
Net Assets | $ | 41,038,026 | ||
| Sources of Net Assets | ||||
Paid-in capital | $ | 36,775,789 | ||
Distributable earnings | 4,262,237 | |||
Net Assets | $ | 41,038,026 | ||
| Class A Shares | ||||
Net Assets | $ | 28,418,983 | ||
Shares Outstanding | 1,433,866 | |||
Net Asset Value and Redemption Price Per Share | ||||
(net assets ÷ shares of beneficial interest outstanding) | $ | 19.82 | ||
Maximum Offering Price Per Share | ||||
(100 ÷ 94.25 of net asset value per share) | $ | 21.03 | ||
| Class C Shares | ||||
Net Assets | $ | 1,460,621 | ||
Shares Outstanding | 84,274 | |||
Net Asset Value and Offering Price Per Share* | ||||
(net assets ÷ shares of beneficial interest outstanding) | $ | 17.33 | ||
| Class I Shares | ||||
Net Assets | $ | 11,158,422 | ||
Shares Outstanding | 548,977 | |||
Net Asset Value, Offering Price and Redemption Price Per Share | ||||
(net assets ÷ shares of beneficial interest outstanding) | $ | 20.33 | ||
On sales of $50,000 or more, the offering price of Class A shares is reduced.
| * | Redemption price per share is equal to the net asset value less any applicable contingent deferred sales charge. |
| 10 | See Notes to Financial Statements. |
Eaton Vance
Special Equities Fund
December 31, 2018
Statement of Operations
| Investment Income | Year Ended December 31, 2018 | |||
Dividends (net of foreign taxes, $740) | $ | 550,670 | ||
Dividends from affiliated investment | 12,734 | |||
Total investment income | $ | 563,404 | ||
| Expenses | ||||
Investment adviser fee | $ | 292,862 | ||
Distribution and service fees | ||||
Class A | 82,267 | |||
Class C | 21,399 | |||
Trustees’ fees and expenses | 2,364 | |||
Custodian fee | 39,456 | |||
Transfer and dividend disbursing agent fees | 79,823 | |||
Legal and accounting services | 41,080 | |||
Printing and postage | 18,400 | |||
Registration fees | 34,835 | |||
Miscellaneous | 13,600 | |||
Total expenses | $ | 626,086 | ||
Deduct — | ||||
Allocation of expenses to affiliates | $ | 7,091 | ||
Total expense reductions | $ | 7,091 | ||
Net expenses | $ | 618,995 | ||
Net investment loss | $ | (55,591 | ) | |
| Realized and Unrealized Gain (Loss) | ||||
Net realized gain (loss) — | ||||
Investment transactions | $ | 4,591,787 | ||
Investment transactions — affiliated investment | (47 | ) | ||
Net realized gain | $ | 4,591,740 | ||
Change in unrealized appreciation (depreciation) — | ||||
Investments | $ | (6,520,827 | ) | |
Investments — affiliated investment | 74 | |||
Net change in unrealized appreciation (depreciation) | $ | (6,520,753 | ) | |
Net realized and unrealized loss | $ | (1,929,013 | ) | |
Net decrease in net assets from operations | $ | (1,984,604 | ) | |
| 11 | See Notes to Financial Statements. |
Eaton Vance
Special Equities Fund
December 31, 2018
Statements of Changes in Net Assets
| Year Ended December 31, | ||||||||
| Increase (Decrease) in Net Assets | 2018 | 2017 | ||||||
From operations — | ||||||||
Net investment loss | $ | (55,591 | ) | $ | (133,829 | ) | ||
Net realized gain | 4,591,740 | 2,719,251 | ||||||
Net change in unrealized appreciation (depreciation) | (6,520,753 | ) | 3,736,549 | |||||
Net increase (decrease) in net assets from operations | $ | (1,984,604 | ) | $ | 6,321,971 | |||
Distributions to shareholders(1) | ||||||||
Class A | $ | (2,501,084 | ) | $ | (2,250,679 | ) | ||
Class C | (152,745 | ) | (170,691 | ) | ||||
Class I | (936,941 | ) | (748,940 | ) | ||||
Total distributions to shareholders | $ | (3,590,770 | ) | $ | (3,170,310 | ) | ||
Transactions in shares of beneficial interest — | ||||||||
Proceeds from sale of shares | ||||||||
Class A | $ | 1,157,319 | $ | 3,689,532 | ||||
Class C | 187,769 | 309,569 | ||||||
Class I | 3,283,176 | 7,001,138 | ||||||
Net asset value of shares issued to shareholders in payment of distributions declared | ||||||||
Class A | 2,050,820 | 1,888,108 | ||||||
Class C | 150,290 | 167,311 | ||||||
Class I | 927,608 | 570,718 | ||||||
Cost of shares redeemed | ||||||||
Class A | (3,300,392 | ) | (7,524,476 | ) | ||||
Class C | (902,688 | ) | (685,772 | ) | ||||
Class I | (2,796,758 | ) | (2,986,506 | ) | ||||
Net increase in net assets from Fund share transactions | $ | 757,144 | $ | 2,429,622 | ||||
Net increase (decrease) in net assets | $ | (4,818,230 | ) | $ | 5,581,283 | |||
| Net Assets | ||||||||
At beginning of year | $ | 45,856,256 | $ | 40,274,973 | ||||
At end of year | $ | 41,038,026 | $ | 45,856,256 | (2) | |||
| (1) | For the year ended December 31, 2017, the source of distributions was from net realized gain. The current year presentation of distributions conforms with the Disclosure Update and Simplification Rule issued by the Securities and Exchange Commission, effective November 5, 2018. |
| (2) | Includes accumulated undistributed net investment income of $6,934 at December 31, 2017. The requirement to disclose the corresponding amount as of December 31, 2018 was eliminated. |
| 12 | See Notes to Financial Statements. |
Eaton Vance
Special Equities Fund
December 31, 2018
Financial Highlights
| Class A | ||||||||||||||||||||
| Year Ended December 31, | ||||||||||||||||||||
| 2018 | 2017 | 2016 | 2015 | 2014 | ||||||||||||||||
Net asset value — Beginning of year | $ | 22.700 | $ | 21.100 | $ | 19.550 | $ | 22.460 | $ | 22.070 | ||||||||||
| Income (Loss) From Operations | ||||||||||||||||||||
Net investment loss(1) | $ | (0.036 | ) | $ | (0.070 | ) | $ | (0.058 | ) | $ | (0.111 | ) | $ | (0.113 | ) | |||||
Net realized and unrealized gain (loss) | (0.982 | ) | 3.281 | 3.025 | (0.539 | ) | 0.503 | |||||||||||||
Total income (loss) from operations | $ | (1.018 | ) | $ | 3.211 | $ | 2.967 | $ | (0.650 | ) | $ | 0.390 | ||||||||
| Less Distributions | ||||||||||||||||||||
From net realized gain | $ | (1.862 | ) | $ | (1.611 | ) | $ | (1.417 | ) | $ | (2.260 | ) | $ | — | ||||||
Total distributions | $ | (1.862 | ) | $ | (1.611 | ) | $ | (1.417 | ) | $ | (2.260 | ) | $ | — | ||||||
Net asset value — End of year | $ | 19.820 | $ | 22.700 | $ | 21.100 | $ | 19.550 | $ | 22.460 | ||||||||||
Total Return(2) | (4.95 | )%(3) | 15.38 | %(3) | 15.44 | % | (2.99 | )% | 1.77 | % | ||||||||||
| Ratios/Supplemental Data |
| |||||||||||||||||||
Net assets, end of year (000’s omitted) | $ | 28,419 | $ | 32,397 | $ | 32,005 | $ | 30,930 | $ | 35,786 | ||||||||||
Ratios (as a percentage of average daily net assets): | ||||||||||||||||||||
Expenses(4) | 1.35 | %(3) | 1.36 | %(3) | 1.41 | % | 1.32 | % | 1.31 | % | ||||||||||
Net investment loss | (0.15 | )% | (0.32 | )% | (0.29 | )% | (0.48 | )% | (0.52 | )% | ||||||||||
Portfolio Turnover | 41 | % | 65 | % | 67 | % | 83 | % | 55 | % | ||||||||||
| (1) | Computed using average shares outstanding. |
| (2) | Returns are historical and are calculated by determining the percentage change in net asset value with all distributions reinvested and do not reflect the effect of sales charges. |
| (3) | The administrator reimbursed certain operating expenses (equal to 0.02% and 0.01% of average daily net assets for the years ended December 31, 2018 and 2017, respectively). Absent this reimbursement, total return would be lower. |
| (4) | Excludes the effect of custody fee credits, if any, of less than 0.005%. Effective September 1, 2015, custody fee credits, which were earned on cash deposit balances, were discontinued by the custodian. |
| 13 | See Notes to Financial Statements. |
Eaton Vance
Special Equities Fund
December 31, 2018
Financial Highlights — continued
| Class C | ||||||||||||||||||||
| Year Ended December 31, | ||||||||||||||||||||
| 2018 | 2017 | 2016 | 2015 | 2014 | ||||||||||||||||
Net asset value — Beginning of year | $ | 20.230 | $ | 19.110 | $ | 17.960 | $ | 20.970 | $ | 20.760 | ||||||||||
| Income (Loss) From Operations | ||||||||||||||||||||
Net investment loss(1) | $ | (0.195 | ) | $ | (0.215 | ) | $ | (0.191 | ) | $ | (0.262 | ) | $ | (0.260 | ) | |||||
Net realized and unrealized gain (loss) | (0.843 | ) | 2.946 | 2.758 | (0.488 | ) | 0.470 | |||||||||||||
Total income (loss) from operations | $ | (1.038 | ) | $ | 2.731 | $ | 2.567 | $ | (0.750 | ) | $ | 0.210 | ||||||||
| Less Distributions | ||||||||||||||||||||
From net realized gain | $ | (1.862 | ) | $ | (1.611 | ) | $ | (1.417 | ) | $ | (2.260 | ) | $ | — | ||||||
Total distributions | $ | (1.862 | ) | $ | (1.611 | ) | $ | (1.417 | ) | $ | (2.260 | ) | $ | — | ||||||
Net asset value — End of year | $ | 17.330 | $ | 20.230 | $ | 19.110 | $ | 17.960 | $ | 20.970 | ||||||||||
Total Return(2) | (5.66 | )%(3) | 14.46 | %(3) | 14.57 | % | (3.68 | )% | 1.01 | % | ||||||||||
| Ratios/Supplemental Data |
| |||||||||||||||||||
Net assets, end of year (000’s omitted) | $ | 1,461 | $ | 2,243 | $ | 2,316 | $ | 2,925 | $ | 2,913 | ||||||||||
Ratios (as a percentage of average daily net assets): | ||||||||||||||||||||
Expenses(4) | 2.10 | %(3) | 2.11 | %(3) | 2.16 | % | 2.06 | % | 2.06 | % | ||||||||||
Net investment loss | (0.93 | )% | (1.07 | )% | (1.05 | )% | (1.22 | )% | (1.26 | )% | ||||||||||
Portfolio Turnover | 41 | % | 65 | % | 67 | % | 83 | % | 55 | % | ||||||||||
| (1) | Computed using average shares outstanding. |
| (2) | Returns are historical and are calculated by determining the percentage change in net asset value with all distributions reinvested and do not reflect the effect of sales charges. |
| (3) | The administrator reimbursed certain operating expenses (equal to 0.02% and 0.01% of average daily net assets for the years ended December 31, 2018 and 2017, respectively). Absent this reimbursement, total return would be lower. |
| (4) | Excludes the effect of custody fee credits, if any, of less than 0.005%. Effective September 1, 2015, custody fee credits, which were earned on cash deposit balances, were discontinued by the custodian. |
| 14 | See Notes to Financial Statements. |
Eaton Vance
Special Equities Fund
December 31, 2018
Financial Highlights — continued
| Class I | ||||||||||||||||||||
| Year Ended December 31, | ||||||||||||||||||||
| 2018 | 2017 | �� | 2016 | 2015 | 2014 | |||||||||||||||
Net asset value — Beginning of year | $ | 23.170 | $ | 21.460 | $ | 19.820 | $ | 22.670 | $ | 22.220 | ||||||||||
| Income (Loss) From Operations | ||||||||||||||||||||
Net investment income (loss)(1) | $ | 0.028 | $ | (0.010 | ) | $ | (0.009 | ) | $ | (0.047 | ) | $ | (0.056 | ) | ||||||
Net realized and unrealized gain (loss) | (1.006 | ) | 3.331 | 3.066 | (0.543 | ) | 0.506 | |||||||||||||
Total income (loss) from operations | $ | (0.978 | ) | $ | 3.321 | $ | 3.057 | $ | (0.590 | ) | $ | 0.450 | ||||||||
| Less Distributions | ||||||||||||||||||||
From net realized gain | $ | (1.862 | ) | $ | (1.611 | ) | $ | (1.417 | ) | $ | (2.260 | ) | $ | — | ||||||
Total distributions | $ | (1.862 | ) | $ | (1.611 | ) | $ | (1.417 | ) | $ | (2.260 | ) | $ | — | ||||||
Net asset value — End of year | $ | 20.330 | $ | 23.170 | $ | 21.460 | $ | 19.820 | $ | 22.670 | ||||||||||
Total Return(2) | (4.67 | )%(3) | 15.63 | %(3) | 15.69 | % | (2.70 | )% | 2.03 | % | ||||||||||
| Ratios/Supplemental Data |
| |||||||||||||||||||
Net assets, end of year (000’s omitted) | $ | 11,158 | $ | 11,216 | $ | 5,954 | $ | 9,087 | $ | 19,636 | ||||||||||
Ratios (as a percentage of average daily net assets): | ||||||||||||||||||||
Expenses(4) | 1.10 | %(3) | 1.11 | %(3) | 1.16 | % | 1.07 | % | 1.06 | % | ||||||||||
Net investment income (loss) | 0.12 | % | (0.04 | )% | (0.05 | )% | (0.20 | )% | (0.25 | )% | ||||||||||
Portfolio Turnover | 41 | % | 65 | % | 67 | % | 83 | % | 55 | % | ||||||||||
| (1) | Computed using average shares outstanding. |
| (2) | Returns are historical and are calculated by determining the percentage change in net asset value with all distributions reinvested. |
| (3) | The administrator reimbursed certain operating expenses (equal to 0.02% and 0.01% of average daily net assets for the years ended December 31, 2018 and 2017, respectively). Absent this reimbursement, total return would be lower. |
| (4) | Excludes the effect of custody fee credits, if any, of less than 0.005%. Effective September 1, 2015, custody fee credits, which were earned on cash deposit balances, were discontinued by the custodian. |
| 15 | See Notes to Financial Statements. |
Eaton Vance
Special Equities Fund
December 31, 2018
Notes to Financial Statements
1 Significant Accounting Policies
Eaton Vance Special Equities Fund (the Fund) is a diversified series of Eaton Vance Special Investment Trust (the Trust). The Trust is a Massachusetts business trust registered under the Investment Company Act of 1940, as amended (the 1940 Act), as an open-end management investment company. The Fund’s investment objective is to provide growth of capital. The Fund offers three classes of shares. Class A shares are generally sold subject to a sales charge imposed at time of purchase. Class C shares are sold at net asset value and are generally subject to a contingent deferred sales charge (see Note 5). Class I shares are sold at net asset value and are not subject to a sales charge. Effective January 25, 2019, Class C shares generally will automatically convert to Class A shares ten years after their purchase as described in the Fund’s prospectus. Each class represents a pro-rata interest in the Fund, but votes separately on class-specific matters and (as noted below) is subject to different expenses. Realized and unrealized gains and losses and net investment income and losses, other than class-specific expenses, are allocated daily to each class of shares based on the relative net assets of each class to the total net assets of the Fund. Each class of shares differs in its distribution plan and certain other class-specific expenses.
The following is a summary of significant accounting policies of the Fund. The policies are in conformity with accounting principles generally accepted in the United States of America (U.S. GAAP). The Fund is an investment company and follows accounting and reporting guidance in the Financial Accounting Standards Board (FASB) Accounting Standards Codification Topic 946.
A Investment Valuation — The following methodologies are used to determine the market value or fair value of investments.
Equity Securities.Equity securities listed on a U.S. securities exchange generally are valued at the last sale or closing price on the day of valuation or, if no sales took place on such date, at the mean between the closing bid and ask prices on the exchange where such securities are principally traded. Equity securities listed on the NASDAQ Global or Global Select Market generally are valued at the NASDAQ official closing price. Unlisted or listed securities for which closing sales prices or closing quotations are not available are valued at the mean between the latest available bid and ask prices.
Affiliated Fund.The Fund may invest in Eaton Vance Cash Reserves Fund, LLC (Cash Reserves Fund), an affiliated investment company managed by Eaton Vance Management (EVM). While Cash Reserves Fund is not a registered money market mutual fund, it conducts all of its investment activities in accordance with the requirements of Rule 2a-7 under the 1940 Act. Investments in Cash Reserves Fund are valued at the closing net asset value per unit on the valuation day. Cash Reserves Fund generally values its investment securities based on available market quotations provided by a third party pricing service.
Fair Valuation.Investments for which valuations or market quotations are not readily available or are deemed unreliable are valued at fair value using methods determined in good faith by or at the direction of the Trustees of the Fund in a manner that fairly reflects the security’s value, or the amount that the Fund might reasonably expect to receive for the security upon its current sale in the ordinary course. Each such determination is based on a consideration of relevant factors, which are likely to vary from one pricing context to another. These factors may include, but are not limited to, the type of security, the existence of any contractual restrictions on the security’s disposition, the price and extent of public trading in similar securities of the issuer or of comparable companies or entities, quotations or relevant information obtained from broker/dealers or other market participants, information obtained from the issuer, analysts, and/or the appropriate stock exchange (for exchange-traded securities), an analysis of the company’s or entity’s financial condition, and an evaluation of the forces that influence the issuer and the market(s) in which the security is purchased and sold.
B Investment Transactions — Investment transactions for financial statement purposes are accounted for on a trade date basis. Realized gains and losses on investments sold are determined on the basis of identified cost.
C Income — Dividend income is recorded on the ex-dividend date for dividends received in cash and/or securities. Withholding taxes on foreign dividends and capital gains have been provided for in accordance with the Fund’s understanding of the applicable countries’ tax rules and rates.
D Federal Taxes — The Fund’s policy is to comply with the provisions of the Internal Revenue Code applicable to regulated investment companies and to distribute to shareholders each year substantially all of its net investment income, and all or substantially all of its net realized capital gains. Accordingly, no provision for federal income or excise tax is necessary.
As of December 31, 2018, the Fund had no uncertain tax positions that would require financial statement recognition, de-recognition, or disclosure. The Fund files a U.S. federal income tax return annually after its fiscal year-end, which is subject to examination by the Internal Revenue Service for a period of three years from the date of filing.
E Expenses — The majority of expenses of the Trust are directly identifiable to an individual fund. Expenses which are not readily identifiable to a specific fund are allocated taking into consideration, among other things, the nature and type of expense and the relative size of the funds.
F Use of Estimates — The preparation of the financial statements in conformity with U.S. GAAP requires management to make estimates and assumptions that affect the reported amounts of assets and liabilities at the date of the financial statements and the reported amounts of income and expense during the reporting period. Actual results could differ from those estimates.
G Indemnifications — Under the Trust’s organizational documents, its officers and Trustees may be indemnified against certain liabilities and expenses arising out of the performance of their duties to the Fund. Under Massachusetts law, if certain conditions prevail, shareholders of a Massachusetts business trust (such as the Trust) could be deemed to have personal liability for the obligations of the Trust. However, the Trust’s Declaration of Trust contains an express disclaimer of liability on the part of Fund shareholders and the By-laws provide that the Trust shall assume the defense on behalf of any Fund
| 16 |
Eaton Vance
Special Equities Fund
December 31, 2018
Notes to Financial Statements — continued
shareholders. Moreover, the By-laws also provide for indemnification out of Fund property of any shareholder held personally liable solely by reason of being or having been a shareholder for all loss or expense arising from such liability. Additionally, in the normal course of business, the Fund enters into agreements with service providers that may contain indemnification clauses. The Fund’s maximum exposure under these arrangements is unknown as this would involve future claims that may be made against the Fund that have not yet occurred.
2 Distributions to Shareholders and Income Tax Information
It is the present policy of the Fund to make at least one distribution annually (normally in December) of all or substantially all of its net investment income and to distribute annually all or substantially all of its net realized capital gains. Distributions to shareholders are recorded on the ex-dividend date. Distributions are declared separately for each class of shares. Shareholders may reinvest income and capital gain distributions in additional shares of the same class of the Fund at the net asset value as of the ex-dividend date or, at the election of the shareholder, receive distributions in cash. Distributions to shareholders are determined in accordance with income tax regulations, which may differ from U.S. GAAP. As required by U.S. GAAP, only distributions in excess of tax basis earnings and profits are reported in the financial statements as a return of capital. Permanent differences between book and tax accounting relating to distributions are reclassified to paid-in capital. For tax purposes, distributions from short-term capital gains are considered to be from ordinary income.
The tax character of distributions declared for the years ended December 31, 2018 and December 31, 2017 was as follows:
| Year Ended December 31, | ||||||||
| 2018 | 2017 | |||||||
Ordinary income | $ | 578,280 | $ | 677,123 | ||||
Long-term capital gains | $ | 3,012,490 | $ | 2,493,187 | ||||
During the year ended December 31, 2018, distributable earnings was decreased by $174,651 and paid-in capital was increased by $174,651 due to the Fund’s use of equalization accounting. Tax equalization accounting allows the Fund to treat as a distribution that portion of redemption proceeds representing a redeeming shareholder’s portion of undistributed taxable income and net capital gains. These reclassifications had no effect on the net assets or net asset value per share of the Fund.
As of December 31, 2018, the components of distributable earnings (accumulated loss) on a tax basis were as follows:
Undistributed ordinary income | $ | 94,634 | ||
Undistributed long-term capital gains | $ | 390,273 | ||
Net unrealized appreciation | $ | 3,777,330 | ||
The cost and unrealized appreciation (depreciation) of investments of the Fund at December 31, 2018, as determined on a federal income tax basis, were as follows:
Aggregate cost | $ | 37,722,733 | ||
Gross unrealized appreciation | $ | 6,795,846 | ||
Gross unrealized depreciation | (3,018,516 | ) | ||
Net unrealized appreciation | $ | 3,777,330 | ||
3 Investment Adviser Fee and Other Transactions with Affiliates
The investment adviser fee is earned by Boston Management and Research (BMR), a subsidiary of EVM, as compensation for investment advisory services rendered to the Fund. The fee is computed at an annual rate of 0.625% of the Fund’s average daily net assets and is payable monthly. For the year ended December 31, 2018, the Fund’s investment adviser fee amounted to $292,862. The Fund invests its cash in Cash Reserves Fund. EVM does not currently receive a fee for advisory services provided to Cash Reserves Fund. EVM also serves as administrator of the Fund, but receives no compensation.
EVM has agreed to reimburse the Fund’s expenses to the extent that total annual operating expenses (relating to ordinary operating expenses only) exceed 1.35%, 2.10% and 1.10% of the Fund’s average daily net assets for Class A, Class C and Class I, respectively, through April 30, 2019. Thereafter, the
| 17 |
Eaton Vance
Special Equities Fund
December 31, 2018
Notes to Financial Statements — continued
reimbursement may be changed or terminated at any time. Pursuant to this agreement, EVM was allocated $7,091 of the Fund’s operating expenses for the year ended December 31, 2018.
EVM provides sub-transfer agency and related services to the Fund pursuant to a Sub-Transfer Agency Support Services Agreement. For the year ended December 31, 2018, EVM earned $31,049 from the Fund pursuant to such agreement, which is included in transfer and dividend disbursing agent fees on the Statement of Operations. The Fund was informed that Eaton Vance Distributors, Inc. (EVD), an affiliate of EVM and the Fund’s principal underwriter, received $1,683 as its portion of the sales charge on sales of Class A shares for the year ended December 31, 2018. EVD also received distribution and service fees from Class A and Class C shares (see Note 4).
Trustees and officers of the Fund who are members of EVM’s or BMR’s organizations receive remuneration for their services to the Fund out of the investment adviser fee. Trustees of the Fund who are not affiliated with the investment adviser may elect to defer receipt of all or a percentage of their annual fees in accordance with the terms of the Trustees Deferred Compensation Plan. For the year ended December 31, 2018, no significant amounts have been deferred. Certain officers and Trustees of the Fund are officers of the above organizations.
4 Distribution Plans
The Fund has in effect a distribution plan for Class A shares (Class A Plan) pursuant to Rule 12b-1 under the 1940 Act. Pursuant to the Class A Plan, the Fund pays EVD a distribution and service fee of 0.25% per annum of its average daily net assets attributable to Class A shares for distribution services and facilities provided to the Fund by EVD, as well as for personal services and/or the maintenance of shareholder accounts. Distribution and service fees paid or accrued to EVD for the year ended December 31, 2018 amounted to $82,267 for Class A shares.
The Fund also has in effect a distribution plan for Class C shares (Class C Plan) pursuant to Rule 12b-1 under the 1940 Act. Pursuant to the Class C Plan, the Fund pays EVD amounts equal to 0.75% per annum of its average daily net assets attributable to Class C shares for providing ongoing distribution services and facilities to the Fund. For the year ended December 31, 2018, the Fund paid or accrued to EVD $16,049 for Class C shares.
Pursuant to the Class C Plan, the Fund also makes payments of service fees to EVD, financial intermediaries and other persons in amounts equal to 0.25% per annum of its average daily net assets attributable to that class. Service fees paid or accrued are for personal services and/or the maintenance of shareholder accounts. They are separate and distinct from the sales commissions and distribution fees payable to EVD. Service fees paid or accrued for the year ended December 31, 2018 amounted to $5,350 for Class C shares.
Distribution and service fees are subject to the limitations contained in the Financial Industry Regulatory Authority Rule 2341(d).
5 Contingent Deferred Sales Charges
A contingent deferred sales charge (CDSC) of 1% generally is imposed on redemptions of Class C shares made within one year of purchase. Class A shares may be subject to a 1% CDSC if redeemed within 18 months of purchase (depending on the circumstances of purchase). Generally, the CDSC is based upon the lower of the net asset value at date of redemption or date of purchase. No charge is levied on shares acquired by reinvestment of dividends or capital gain distributions. For the year ended December 31, 2018, the Fund was informed that EVD received no CDSCs paid by Class A and Class C shareholders.
6 Purchases and Sales of Investments
Purchases and sales of investments, other than short-term obligations, aggregated $18,684,422 and $20,967,334, respectively, for the year ended December 31, 2018.
7 Shares of Beneficial Interest
The Fund’s Declaration of Trust permits the Trustees to issue an unlimited number of full and fractional shares of beneficial interest (without par value). Such shares may be issued in a number of different series (such as the Fund) and classes. Transactions in Fund shares were as follows:
| Year Ended December 31, | ||||||||
| Class A | 2018 | 2017 | ||||||
Sales | 51,058 | 167,494 | ||||||
Issued to shareholders electing to receive payments of distributions in Fund shares | 97,565 | 84,043 | ||||||
Redemptions | (142,160 | ) | (340,791 | ) | ||||
Net increase (decrease) | 6,463 | (89,254 | ) | |||||
| 18 |
Eaton Vance
Special Equities Fund
December 31, 2018
Notes to Financial Statements — continued
| Year Ended December 31, | ||||||||
| Class C | 2018 | 2017 | ||||||
Sales | 8,747 | 15,591 | ||||||
Issued to shareholders electing to receive payments of distributions in Fund shares | 8,172 | 8,340 | ||||||
Redemptions | (43,525 | ) | (34,265 | ) | ||||
Net decrease | (26,606 | ) | (10,334 | ) | ||||
| Year Ended December 31, | ||||||||
| Class I | 2018 | 2017 | ||||||
Sales | 138,332 | 313,156 | ||||||
Issued to shareholders electing to receive payments of distributions in Fund shares | 43,044 | 24,916 | ||||||
Redemptions | (116,436 | ) | (131,500 | ) | ||||
Net increase | 64,940 | 206,572 | ||||||
At December 31, 2018, donor advised and pooled income funds (established and maintained by a public charity) managed by EVM owned 16.5% of the outstanding shares of the Fund.
8 Line of Credit
The Fund participates with other portfolios and funds managed by EVM and its affiliates in a $625 million unsecured line of credit agreement with a group of banks, which is in effect through October 29, 2019. Borrowings are made by the Fund solely to facilitate the handling of unusual and/or unanticipated short-term cash requirements. Interest is charged to the Fund based on its borrowings at an amount above either the Eurodollar rate or Federal Funds rate. In addition, a fee computed at an annual rate of 0.15% on the daily unused portion of the line of credit is allocated among the participating portfolios and funds at the end of each quarter. Because the line of credit is not available exclusively to the Fund, it may be unable to borrow some or all of its requested amounts at any particular time. The Fund did not have any significant borrowings or allocated fees during the year ended December 31, 2018.
9 Fair Value Measurements
Under generally accepted accounting principles for fair value measurements, a three-tier hierarchy to prioritize the assumptions, referred to as inputs, is used in valuation techniques to measure fair value. The three-tier hierarchy of inputs is summarized in the three broad levels listed below.
| • | Level 1 – quoted prices in active markets for identical investments |
| • | Level 2 – other significant observable inputs (including quoted prices for similar investments, interest rates, prepayment speeds, credit risk, etc.) |
| • | Level 3 – significant unobservable inputs (including a fund’s own assumptions in determining the fair value of investments) |
In cases where the inputs used to measure fair value fall in different levels of the fair value hierarchy, the level disclosed is determined based on the lowest level input that is significant to the fair value measurement in its entirety. The inputs or methodology used for valuing securities are not necessarily an indication of the risk associated with investing in those securities.
At December 31, 2018, the hierarchy of inputs used in valuing the Fund’s investments, which are carried at value, were as follows:
| Asset Description | Level 1 | Level 2 | Level 3 | Total | ||||||||||||
Common Stocks | $ | 41,146,345 | * | $ | — | $ | — | $ | 41,146,345 | |||||||
Short-Term Investments | — | 353,718 | — | 353,718 | ||||||||||||
Total Investments | $ | 41,146,345 | $ | 353,718 | $ | — | $ | 41,500,063 | ||||||||
| * | The level classification by major category of investments is the same as the category presentation in the Portfolio of Investments. |
| 19 |
Eaton Vance
Special Equities Fund
December 31, 2018
Report of Independent Registered Public Accounting Firm
To the Trustees of Eaton Vance Special Investment Trust and Shareholders of Eaton Vance Special Equities Fund:
Opinion on the Financial Statements and Financial Highlights
We have audited the accompanying statement of assets and liabilities of Eaton Vance Special Equities Fund (the “Fund”) (one of the funds constituting Eaton Vance Special Investment Trust), including the portfolio of investments, as of December 31, 2018, the related statement of operations for the year then ended, the statements of changes in net assets for each of the two years in the period then ended, the financial highlights for each of the five years in the period then ended, and the related notes. In our opinion, the financial statements and financial highlights present fairly, in all material respects, the financial position of the Fund as of December 31, 2018, and the results of its operations for the year then ended, the changes in its net assets for each of the two years in the period then ended, and the financial highlights for each of the five years in the period then ended, in conformity with accounting principles generally accepted in the United States of America.
Basis for Opinion
These financial statements and financial highlights are the responsibility of the Fund’s management. Our responsibility is to express an opinion on the Fund’s financial statements and financial highlights based on our audits. We are a public accounting firm registered with the Public Company Accounting Oversight Board (United States) (PCAOB) and are required to be independent with respect to the Fund in accordance with the U.S. federal securities laws and the applicable rules and regulations of the Securities and Exchange Commission and the PCAOB.
We conducted our audits in accordance with the standards of the PCAOB. Those standards require that we plan and perform the audit to obtain reasonable assurance about whether the financial statements and financial highlights are free of material misstatement, whether due to error or fraud. The Fund is not required to have, nor were we engaged to perform, an audit of its internal control over financial reporting. As part of our audits we are required to obtain an understanding of internal control over financial reporting but not for the purpose of expressing an opinion on the effectiveness of the Fund’s internal control over financial reporting. Accordingly, we express no such opinion.
Our audits included performing procedures to assess the risks of material misstatement of the financial statements and financial highlights, whether due to error or fraud, and performing procedures that respond to those risks. Such procedures included examining, on a test basis, evidence regarding the amounts and disclosures in the financial statements and financial highlights. Our audits also included evaluating the accounting principles used and significant estimates made by management, as well as evaluating the overall presentation of the financial statements and financial highlights. Our procedures included confirmation of securities owned as of December 31, 2018, by correspondence with the custodian and brokers; when replies were not received from brokers, we performed other auditing procedures. We believe that our audits provide a reasonable basis for our opinion.
/s/ Deloitte & Touche LLP
Boston, Massachusetts
February 22, 2019
We have served as the auditor of one or more Eaton Vance investment companies since 1959.
| 20 |
Eaton Vance
Special Equities Fund
December 31, 2018
Federal Tax Information (Unaudited)
The Form 1099-DIV you received in February 2019 showed the tax status of all distributions paid to your account in calendar year 2018. Shareholders are advised to consult their own tax adviser with respect to the tax consequences of their investment in the Fund. As required by the Internal Revenue Code and/or regulations, shareholders must be notified regarding the status of qualified dividend income for individuals, the dividends received deduction for corporations and capital gains dividends.
Qualified Dividend Income. For the fiscal year ended December 31, 2018, the Fund designates approximately $402,776, or up to the maximum amount of such dividends allowable pursuant to the Internal Revenue Code, as qualified dividend income eligible for the reduced tax rate of 15%.
Dividends Received Deduction. Corporate shareholders are generally entitled to take the dividends received deduction on the portion of the Fund’s dividend distribution that qualifies under tax law. For the Fund’s fiscal 2018 ordinary income dividends, 36.19% qualifies for the corporate dividends received deduction.
Capital Gains Dividends. The Fund hereby designates as a capital gain dividend with respect to the taxable year ended December 31, 2018, $3,546,279 or, if subsequently determined to be different, the net capital gain of such year.
| 21 |
Eaton Vance
Special Equities Fund
December 31, 2018
Special Meeting of Shareholders (Unaudited)
The Fund held a Special Meeting of Shareholders on September 20, 2018 to elect the five Trustees listed below. The other Trustees named herein continue to serve as Trustees. The results of the vote with respect to the Fund were as follows:
Nominee for Trustee | Number of Shares | |||||||
| For | Withheld | |||||||
Mark R. Fetting | 838,540 | 6,649 | ||||||
Keith Quinton | 839,674 | 5,514 | ||||||
Marcus L. Smith | 839,674 | 5,514 | ||||||
Susan J. Sutherland | 839,674 | 5,514 | ||||||
Scott E. Wennerholm | 838,226 | 6,962 | ||||||
Results are rounded to the nearest whole number.
| 22 |
Eaton Vance
Special Equities Fund
December 31, 2018
Management and Organization
Fund Management. The Trustees of Eaton Vance Special Investment Trust (the Trust) are responsible for the overall management and supervision of the Trust’s affairs. The Trustees and officers of the Trust are listed below. Except as indicated, each individual has held the office shown or other offices in the same company for the last five years. Trustees and officers of the Trust hold indefinite terms of office. The “noninterested Trustees” consist of those Trustees who are not “interested persons” of the Trust, as that term is defined under the 1940 Act. The business address of each Trustee and officer is Two International Place, Boston, Massachusetts 02110. As used below, “EVC” refers to Eaton Vance Corp., “EV” refers to Eaton Vance, Inc., “EVM” refers to Eaton Vance Management, “BMR” refers to Boston Management and Research and “EVD” refers to Eaton Vance Distributors, Inc. EVC and EV are the corporate parent and trustee, respectively, of EVM and BMR. EVD is the Fund’s principal underwriter and a wholly-owned subsidiary of EVC. Each officer affiliated with Eaton Vance may hold a position with other Eaton Vance affiliates that is comparable to his or her position with EVM listed below. Each Trustee oversees 175 portfolios in the Eaton Vance Complex (including all master and feeder funds in a master feeder structure). Each officer serves as an officer of certain other Eaton Vance funds. Each Trustee and officer serves until his or her successor is elected.
| Name and Year of Birth | Position(s) with the | Trustee Since(1) | Principal Occupation(s) and Directorships During Past Five Years and Other Relevant Experience | |||
| Interested Trustee | ||||||
Thomas E. Faust Jr. 1958 | Trustee | 2007 | Chairman, Chief Executive Officer and President of EVC, Director and President of EV, Chief Executive Officer and President of EVM and BMR, and Director of EVD. Trustee and/or officer of 175 registered investment companies. Mr. Faust is an interested person because of his positions with EVM, BMR, EVD, EVC and EV, which are affiliates of the Trust. Directorships in the Last Five Years.(2) Director of EVC and Hexavest Inc. (investment management firm). | |||
| Noninterested Trustees | ||||||
Mark R. Fetting 1954 | Trustee | 2016 | Private investor. Formerly held various positions at Legg Mason, Inc. (investment management firm) (2000-2012), including President, Chief Executive Officer, Director and Chairman (2008-2012), Senior Executive Vice President(2004-2008) and Executive Vice President (2001-2004). Formerly, President of Legg Mason family of funds (2001-2008). Formerly, Division President and Senior Officer of Prudential Financial Group, Inc. and related companies (investment management firm)(1991-2000). Directorships in the Last Five Years. None. | |||
Cynthia E. Frost 1961 | Trustee | 2014 | Private investor. Formerly, Chief Investment Officer of Brown University (university endowment) (2000-2012). Formerly, Portfolio Strategist for Duke Management Company (university endowment manager) (1995-2000). Formerly, Managing Director, Cambridge Associates (investment consulting company)(1989-1995). Formerly, Consultant, Bain and Company (management consulting firm)(1987-1989). Formerly, Senior Equity Analyst, BA Investment Management Company (1983-1985). Directorships in the Last Five Years. None. | |||
George J. Gorman 1952 | Trustee | 2014 | Principal at George J. Gorman LLC (consulting firm). Formerly, Senior Partner at Ernst & Young LLP (a registered public accounting firm)(1974-2009). Directorships in the Last Five Years. Formerly, Trustee of the BofA Funds Series Trust (11 funds) (2011-2014) and of the Ashmore Funds (9 funds)(2010-2014). | |||
Valerie A. Mosley 1960 | Trustee | 2014 | Chairwoman and Chief Executive Officer of Valmo Ventures (a consulting and investment firm). Former Partner and Senior Vice President, Portfolio Manager and Investment Strategist at Wellington Management Company, LLP (investment management firm) (1992-2012). Former Chief Investment Officer, PG Corbin Asset Management (1990-1992). Formerly worked in institutional corporate bond sales at Kidder Peabody (1986-1990). Directorships in the Last Five Years.(2)Director of Envestnet, Inc. (provider of intelligent systems for wealth management and financial wellness) (since 2018). | |||
William H. Park 1947 | Chairperson of the Board and Trustee | 2016 (Chairperson) 2003 (Trustee) | Private investor. Formerly, Consultant (management and transactional)(2012-2014). Formerly, Chief Financial Officer, Aveon Group L.P. (investment management firm) (2010-2011). Formerly, Vice Chairman, Commercial Industrial Finance Corp. (specialty finance company) (2006-2010). Formerly, President and Chief Executive Officer, Prizm Capital Management, LLC (investment management firm) (2002-2005). Formerly, Executive Vice President and Chief Financial Officer, United Asset Management Corporation (investment management firm) (1982-2001). Formerly, Senior Manager, Price Waterhouse (now PricewaterhouseCoopers) (a registered public accounting firm) (1972-1981). Directorships in the Last Five Years.(2)None. | |||
| 23 |
Eaton Vance
Special Equities Fund
December 31, 2018
Management and Organization — continued
| Name and Year of Birth | Position(s) with the | Trustee Since(1) | Principal Occupation(s) and Directorships During Past Five Years and Other Relevant Experience | |||
| Noninterested Trustees (continued) | ||||||
Helen Frame Peters 1948 | Trustee | 2008 | Professor of Finance, Carroll School of Management, Boston College. Formerly, Dean, Carroll School of Management, Boston College (2000-2002). Formerly, Chief Investment Officer, Fixed Income, Scudder Kemper Investments (investment management firm)(1998-1999). Formerly, Chief Investment Officer, Equity and Fixed Income, Colonial Management Associates (investment management firm) (1991-1998). Directorships in the Last Five Years.(2)None. | |||
Keith Quinton(3) 1958 | Trustee | 2018 | Independent Investment Committee Member at New Hampshire Retirement System (since 2017). Advisory Committee member at Northfield Information Services, Inc. (risk management analytics provider) (since 2016). Formerly, Portfolio Manager and Senior Quantitative Analyst at Fidelity Investments (investment management firm)(2001-2014). Directorships in the Last Five Years. Director of New Hampshire Municipal Bond Bank (since 2016). | |||
Marcus L. Smith(3) 1966 | Trustee | 2018 | Member of Posse Boston Advisory Board (foundation) (since 2015); Trustee at University of Mount Union (since 2008). Formerly, Portfolio Manager at MFS Investment Management (investment management firm) (1994-2017). Directorships in the Last Five Years. Director of MSCI Inc. (global provider of investment decision support tools) (since 2017). Director of DCT Industrial Trust Inc. (logistics real estate company) (since 2017). | |||
Susan J. Sutherland 1957 | Trustee | 2015 | Private investor. Formerly, Associate, Counsel and Partner at Skadden, Arps, Slate, Meagher & Flom LLP (law firm) (1982-2013). Directorships in the Last Five Years. Formerly, Director of Montpelier Re Holdings Ltd. (global provider of customized insurance and reinsurance products)(2013-2015). | |||
Scott E. Wennerholm 1959 | Trustee | 2016 | Formerly, Trustee at Wheelock College (postsecondary institution)(2012-2018). Formerly, Consultant at GF Parish Group (executive recruiting firm)(2016-2017). Formerly, Chief Operating Officer and Executive Vice President at BNY Mellon Asset Management (investment management firm) (2005-2011). Formerly, Chief Operating Officer and Chief Financial Officer at Natixis Global Asset Management (investment management firm)(1997-2004). Formerly, Vice President at Fidelity Investments Institutional Services (investment management firm)(1994-1997). Directorships in the Last Five Years. None. | |||
| Name and Year of Birth | Position(s) with the Trust | Officer Since(4) | Principal Occupation(s) During Past Five Years | |||
| Principal Officers who are not Trustees | ||||||
Payson F. Swaffield 1956 | President | 2003 | Vice President and Chief Income Investment Officer of EVM and BMR. Also Vice President of Calvert Research and Management (“CRM”). | |||
Maureen A. Gemma 1960 | Vice President, Secretary and Chief Legal Officer | 2005 | Vice President of EVM and BMR. Also Vice President of CRM. | |||
James F. Kirchner 1967 | Treasurer | 2007 | Vice President of EVM and BMR. Also Vice President of CRM. | |||
Richard F. Froio 1968 | Chief Compliance Officer | 2017 | Vice President of EVM and BMR since 2017. Formerly Deputy Chief Compliance Officer (Adviser/Funds) and Chief Compliance Officer (Distribution) at PIMCO (2012-2017) and Managing Director at BlackRock/Barclays Global Investors (2009-2012). | |||
| (1) | Year first appointed to serve as Trustee for a fund in the Eaton Vance family of funds. Each Trustee has served continuously since appointment unless indicated otherwise. |
| (2) | During their respective tenures, the Trustees (except for Mmes. Frost and Sutherland and Messrs. Fetting, Gorman, Quinton, Smith and Wennerholm) also served as Board members of one or more of the following funds (which operated in the years noted): eUnitsTM 2 Year U.S. Market Participation Trust: Upside to Cap / Buffered Downside (launched in 2012 and terminated in 2014); and eUnitsTM 2 Year U.S. Market Participation Trust II: Upside to Cap / Buffered Downside (launched in 2012 and terminated in 2014). However, Ms. Mosley did not serve as a Board member of eUnitsTM 2 Year U.S. Market Participation Trust: Upside to Cap / Buffered Downside (launched in 2012 and terminated in 2014). |
| 24 |
Eaton Vance
Special Equities Fund
December 31, 2018
Management and Organization — continued
| (3) | Messrs. Quinton and Smith began serving as Trustees effective October 1, 2018. |
| (4) | Year first elected to serve as officer of a fund in the Eaton Vance family of funds when the officer has served continuously. Otherwise, year of most recent election as an officer of a fund in the Eaton Vance family of funds. Titles may have changed since initial election. |
The SAI for the Fund includes additional information about the Trustees and officers of the Fund and can be obtained without charge on Eaton Vance’s website at www.eatonvance.com or by calling 1-800-262-1122.
| 25 |
Eaton Vance Funds
IMPORTANT NOTICES
Privacy. The Eaton Vance organization is committed to ensuring your financial privacy. Each of the financial institutions identified below has in effect the following policy (“Privacy Policy”) with respect to nonpublic personal information about its customers:
| • | Only such information received from you, through application forms or otherwise, and information about your Eaton Vance fund transactions will be collected. This may include information such as name, address, social security number, tax status, account balances and transactions. |
| • | None of such information about you (or former customers) will be disclosed to anyone, except as permitted by law (which includes disclosure to employees necessary to service your account). In the normal course of servicing a customer’s account, Eaton Vance may share information with unaffiliated third parties that perform various required services such as transfer agents, custodians and broker-dealers. |
| • | Policies and procedures (including physical, electronic and procedural safeguards) are in place that are designed to protect the confidentiality of such information. |
| • | We reserve the right to change our Privacy Policy at any time upon proper notification to you. Customers may want to review our Privacy Policy periodically for changes by accessing the link on our homepage: www.eatonvance.com. |
Our pledge of privacy applies to the following entities within the Eaton Vance organization: the Eaton Vance Family of Funds, Eaton Vance Management, Eaton Vance Investment Counsel, Eaton Vance Distributors, Inc., Eaton Vance Trust Company, Eaton Vance Management (International) Limited, Eaton Vance Advisers International Ltd., Eaton Vance Management’s Real Estate Investment Group and Boston Management and Research. In addition, our Privacy Policy applies only to those Eaton Vance customers who are individuals and who have a direct relationship with us. If a customer’s account (i.e., fund shares) is held in the name of a third-party financial advisor/broker-dealer, it is likely that only such advisor’s privacy policies apply to the customer. This notice supersedes all previously issued privacy disclosures. For more information about Eaton Vance’s Privacy Policy, please call1-800-262-1122.
Delivery of Shareholder Documents. The Securities and Exchange Commission (SEC) permits funds to deliver only one copy of shareholder documents, including prospectuses, proxy statements and shareholder reports, to fund investors with multiple accounts at the same residential or post office box address. This practice is often called “householding” and it helps eliminate duplicate mailings to shareholders.Eaton Vance, or your financial advisor, may household the mailing of your documents indefinitely unless you instruct Eaton Vance, or your financial advisor, otherwise.If you would prefer that your Eaton Vance documents not be householded, please contact Eaton Vance at1-800-262-1122, or contact your financial advisor. Your instructions that householding not apply to delivery of your Eaton Vance documents will typically be effective within 30 days of receipt by Eaton Vance or your financial advisor.
Portfolio Holdings. Each Eaton Vance Fund and its underlying Portfolio(s) (if applicable) will file a schedule of portfolio holdings on FormN-Q with the SEC for the first and third quarters of each fiscal year. The FormN-Q will be available on the Eaton Vance website at www.eatonvance.com, by calling Eaton Vance at1-800-262-1122 or in the EDGAR database on the SEC’s website at www.sec.gov. FormN-Q may also be reviewed and copied at the SEC’s public reference room in Washington, D.C. (call1-800-732-0330 for information on the operation of the public reference room).
Proxy Voting. From time to time, funds are required to vote proxies related to the securities held by the funds. The Eaton Vance Funds or their underlying Portfolios (if applicable) vote proxies according to a set of policies and procedures approved by the Funds’ and Portfolios’ Boards. You may obtain a description of these policies and procedures and information on how the Funds or Portfolios voted proxies relating to portfolio securities during the most recent12-month period ended June 30, without charge, upon request, by calling1-800-262-1122 and by accessing the SEC’s website at www.sec.gov.
| 26 |
This Page Intentionally Left Blank
This Page Intentionally Left Blank
Investment Adviser
Boston Management and Research
Two International Place
Boston, MA 02110
Administrator
Eaton Vance Management
Two International Place
Boston, MA 02110
Principal Underwriter*
Eaton Vance Distributors, Inc.
Two International Place
Boston, MA 02110
(617) 482-8260
Custodian
State Street Bank and Trust Company
State Street Financial Center, One Lincoln Street
Boston, MA 02111
Transfer Agent
BNY Mellon Investment Servicing (US) Inc.
Attn: Eaton Vance Funds
P.O. Box 9653
Providence, RI 02940-9653
(800) 262-1122
Independent Registered Public Accounting Firm
Deloitte & Touche LLP
200 Berkeley Street
Boston, MA 02116-5022
Fund Offices
Two International Place
Boston, MA 02110
| * | FINRA BrokerCheck. Investors may check the background of their Investment Professional by contacting the Financial Industry Regulatory Authority (FINRA). FINRA BrokerCheck is a free tool to help investors check the professional background of current and former FINRA-registered securities firms and brokers. FINRA BrokerCheck is available by calling 1-800-289-9999 and at www.FINRA.org. The FINRA BrokerCheck brochure describing this program is available to investors at www.FINRA.org. |

172 12.31.18
Item 2. Code of Ethics
The registrant has adopted a code of ethics applicable to its Principal Executive Officer, Principal Financial Officer and Principal Accounting Officer. The registrant undertakes to provide a copy of such code of ethics to any person upon request, without charge, by calling1-800-262-1122. The registrant has not amended the code of ethics as described in FormN-CSR during the period covered by this report. The registrant has not granted any waiver, including an implicit waiver, from a provision of the code of ethics as described in FormN-CSR during the period covered by this report.
Item 3. Audit Committee Financial Expert
The registrant’s Board has designated George J. Gorman and William H. Park, each an independent trustee, as audit committee financial experts. Mr. Gorman is a certified public accountant who is the Principal at George J. Gorman LLC (a consulting firm). Previously, Mr. Gorman served in various capacities at Ernst & Young LLP (a registered public accounting firm), including as Senior Partner. Mr. Gorman also has experience serving as an independent trustee and audit committee financial expert of other mutual fund complexes. Mr. Park is a
certified public accountant who is a private investor. Previously, he served as a consultant, as the Chief Financial Officer of Aveon Group, L.P. (an investment management firm), as the Vice Chairman of Commercial Industrial Finance Corp. (specialty finance company), as President and Chief Executive Officer of Prizm Capital Management, LLC (investment management firm), as Executive Vice President and Chief Financial Officer of United Asset Management Corporation (an institutional investment management firm) and as a Senior Manager at Price Waterhouse (now PricewaterhouseCoopers) (a registered public accounting firm).
Item 4. Principal Accountant Fees and Services
Eaton Vance Balanced Fund, Eaton Vance Core Bond Fund, Eaton Vance Dividend Builder Fund, Eaton Vance Greater India Fund, Eaton Vance Growth Fund, Eaton VanceLarge-Cap Value Fund, Eaton Vance Real Estate Fund, Eaton VanceSmall-Cap Fund and Eaton Vance Special Equities Fund (the “Fund(s)”) are series of Eaton Vance Special Investment Trust (the “Trust”), a Massachusetts business trust, which, including the Funds, contains a total of 14 series (the “Series”). The Trust is registered under the Investment Company Act of 1940 as anopen-end management investment company. This FormN-CSR relates to the Funds’ annual reports.
(a)-(d)
The following tables present the aggregate fees billed to each Fund for the Fund’s fiscal years ended December 31, 2017 and December 31, 2018 by the registrant’s principal accountant, Deloitte & Touche LLP (“D&T”), for professional services rendered for the audit of the Fund’s annual financial statements and fees billed for other services rendered by D&T during such periods.
Eaton Vance Balanced Fund
Fiscal Years Ended | 12/31/17 | 12/31/18 | ||||||
Audit Fees | $ | 24,140 | $ | 24,140 | ||||
Audit-Related Fees(1) | $ | 0 | $ | 0 | ||||
Tax Fees(2) | $ | 17,351 | $ | 17,401 | ||||
All Other Fees(3) | $ | 0 | $ | 0 | ||||
|
|
|
| |||||
Total | $ | 41,491 | $ | 41,541 | ||||
|
|
|
| |||||
Eaton Vance Core Bond Fund
Fiscal Years Ended | 12/31/17 | 12/31/18 | ||||||
Audit Fees | $ | 15,050 | $ | 15,050 | ||||
Audit-Related Fees(1) | $ | 0 | $ | 0 | ||||
Tax Fees(2) | $ | 12,101 | $ | 12,101 | ||||
All Other Fees(3) | $ | 0 | $ | 0 | ||||
|
|
|
| |||||
Total | $ | 27,151 | $ | 27,151 | ||||
|
|
|
| |||||
Eaton Vance Dividend Builder Fund
Fiscal Years Ended | 12/31/17 | 12/31/18 | ||||||
Audit Fees | $ | 28,930 | $ | 47,020 | ||||
Audit-Related Fees(1) | $ | 0 | $ | 0 | ||||
Tax Fees(2) | $ | 11,640 | $ | 15,790 | ||||
All Other Fees(3) | $ | 0 | $ | 0 | ||||
|
|
|
| |||||
Total | $ | 40,570 | $ | 62,810 | ||||
|
|
|
|
Eaton Vance Greater India Fund
Fiscal Years Ended | 12/31/17 | 12/31/18 | ||||||
Audit Fees | $ | 16,150 | $ | 16,150 | ||||
Audit-Related Fees(1) | $ | 0 | $ | 0 | ||||
Tax Fees(2) | $ | 9,989 | $ | 9,989 | ||||
All Other Fees(3) | $ | 0 | $ | 0 | ||||
|
|
|
| |||||
Total | $ | 26,139 | $ | 26,139 | ||||
|
|
|
| |||||
Eaton Vance Growth Fund
Fiscal Years Ended | 12/31/17 | 12/31/18 | ||||||
Audit Fees | $ | 17,980 | $ | 34,980 | ||||
Audit-Related Fees(1) | $ | 0 | $ | 0 | ||||
Tax Fees(2) | $ | 8,558 | $ | 13,719 | ||||
All Other Fees(3) | $ | 0 | $ | 0 | ||||
|
|
|
| |||||
Total | $ | 26,538 | $ | 48,699 | ||||
|
|
|
| |||||
Eaton VanceLarge-Cap Value Fund
Fiscal Years Ended | 12/31/17 | 12/31/18 | ||||||
Audit Fees | $ | 25,140 | $ | 48,270 | ||||
Audit-Related Fees(1) | $ | 0 | $ | 0 | ||||
Tax Fees(2) | $ | 10,390 | $ | 16,545 | ||||
All Other Fees(3) | $ | 0 | $ | 0 | ||||
|
|
|
| |||||
Total | $ | 35,530 | $ | 64,815 | ||||
|
|
|
| |||||
Eaton Vance Real Estate Fund
Fiscal Years Ended | 12/31/17 | 12/31/18 | ||||||
Audit Fees | $ | 32,380 | $ | 32,380 | ||||
Audit-Related Fees(1) | $ | 0 | $ | 0 | ||||
Tax Fees(2) | $ | 12,792 | $ | 12,842 | ||||
All Other Fees(3) | $ | 0 | $ | 0 | ||||
|
|
|
| |||||
Total | $ | 45,172 | $ | 45,222 | ||||
|
|
|
| |||||
Eaton VanceSmall-Cap Fund
Fiscal Years Ended | 12/31/17 | 12/31/18 | ||||||
Audit Fees | $ | 32,640 | $ | 32,640 | ||||
Audit-Related Fees(1) | $ | 0 | $ | 0 | ||||
Tax Fees(2) | $ | 11,690 | $ | 11,740 | ||||
All Other Fees(3) | $ | 0 | $ | 0 | ||||
|
|
|
| |||||
Total | $ | 44,330 | $ | 44,380 | ||||
|
|
|
| |||||
Eaton Vance Special Equities Fund
Fiscal Years Ended | 12/31/17 | 12/31/18 | ||||||
Audit Fees | $ | 29,060 | $ | 29,060 | ||||
Audit-Related Fees(1) | $ | 0 | $ | 0 | ||||
Tax Fees(2) | $ | 11,140 | $ | 11,190 | ||||
All Other Fees(3) | $ | 0 | $ | 0 | ||||
|
|
|
| |||||
Total | $ | 40,200 | $ | 40,250 | ||||
|
|
|
| |||||
| (1) | Audit-related fees consist of the aggregate fees billed for assurance and related services that are reasonably related to the performance of the audit of financial statements and are not reported under the category of audit fees. |
| (2) | Tax fees consist of the aggregate fees billed for professional services rendered by the principal accountant relating to tax compliance, tax advice, and tax planning and specifically include fees for tax return preparation and other related tax compliance/planning matters. |
| (3) | All other fees consist of the aggregate fees billed for products and services provided by the principal accountant other than audit, audit-related, and tax services. |
The various Series comprising the Trust have differing fiscal year ends (August 31, October 31, November 30 or December 31). The following table presents the aggregate audit, audit-related, tax, and other fees billed to all of the Series in the Trust by D&T for the last two fiscal years of each Series.
Fiscal Years Ended | 8/31/17* | 10/31/17 | 11/30/17 | 12/31/17 | 8/31/18 | 10/31/18 | 11/30/18 | 12/31/18 | ||||||||||||||||||||||||
Audit Fees | $ | 37,050 | $ | 100,790 | $ | 27,380 | $ | 247,830 | $ | 37,050 | $ | 127,240 | $ | 27,380 | $ | 279,690 | ||||||||||||||||
Audit-Related Fees(1) | $ | 0 | $ | 0 | $ | 0 | $ | 0 | $ | 0 | $ | 0 | $ | 0 | $ | 0 | ||||||||||||||||
Tax Fees(2) | $ | 13,000 | $ | 57,669 | $ | 10,711 | $ | 117,089 | $ | 10,000 | $ | 72,001 | $ | 10,761 | $ | 121,317 | ||||||||||||||||
All Other Fees(3) | $ | 0 | $ | 0 | $ | 0 | $ | 0 | $ | 0 | $ | 0 | $ | 0 | $ | 0 | ||||||||||||||||
|
|
|
|
|
|
|
|
|
|
|
|
|
|
|
| |||||||||||||||||
Total | $ | 50,050 | $ | 158,459 | $ | 38,091 | $ | 364,919 | $ | 47,050 | $ | 199,241 | $ | 38,141 | $ | 401,007 | ||||||||||||||||
|
|
|
|
|
|
|
|
|
|
|
|
|
|
|
| |||||||||||||||||
| * | The table presents the aggregate fees billed to the Fund for the Fund’s fiscal period from September 27, 2016 (commencement of operations) to August 31, 2017. |
| (1) | Audit-related fees consist of the aggregate fees billed for assurance and related services that are reasonably related to the performance of the audit of financial statements and are not reported under the category of audit fees. |
| (2) | Tax fees consist of the aggregate fees billed for professional services rendered by the principal accountant relating to tax compliance, tax advice, and tax planning and specifically include fees for tax return preparation and other related tax compliance/planning matters. |
| (3) | All other fees consist of the aggregate fees billed for products and services provided by the principal accountant other than audit, audit-related, and tax services. |
(e)(1) The registrant’s audit committee has adopted policies and procedures relating to thepre-approval of services provided by the registrant’s principal accountant (the“Pre-Approval Policies”). ThePre-Approval Policies establish a framework intended to assist the audit committee in the proper discharge of itspre-approval responsibilities. As a general matter, thePre-Approval Policies (i) specify certain types of audit, audit-related, tax, and other services determined to bepre-approved by the audit committee; and (ii) delineate specific procedures governing the mechanics of thepre-approval process, including the approval and monitoring of audit andnon-audit service fees. Unless a service is specificallypre-approved under thePre-Approval Policies, it must be separatelypre-approved by the audit committee.
ThePre-Approval Policies and the types of audit andnon-audit servicespre-approved therein must be reviewed and ratified by the registrant’s audit committee at least annually. The registrant’s audit committee maintains full responsibility for the appointment, compensation, and oversight of the work of the registrant’s principal accountant.
(e)(2) No services described in paragraphs (b)-(d) above were approved by the registrant’s audit committee pursuant to the “de minimis exception” set forth in Rule2-01 (c)(7)(i)(C) of RegulationS-X.
(f) Not applicable.
(g)The following table presents (i) the aggregatenon-audit fees (i.e., fees for audit-related, tax, and other services) billed for services rendered to all of the Series in the Trust by D&T for the last two fiscal years of each Series; and (ii) the aggregatenon-audit fees (i.e., fees for audit-related, tax, and other services) billed to the Eaton Vance organization by D&T for the last two fiscal years of each Series.
Fiscal Years Ended | 8/31/17* | 10/31/17 | 11/30/17 | 12/31/17 | 8/31/18 | 10/31/18 | 11/30/18 | 12/31/18 | ||||||||||||||||||||||||
Registrant(1) | $ | 13,000 | $ | 57,669 | $ | 10,711 | $ | 117,089 | $ | 10,000 | $ | 72,001 | $ | 10,761 | $ | 121,317 | ||||||||||||||||
Eaton Vance(2) | $ | 148,018 | $ | 148,018 | $ | 148,018 | $ | 148,018 | $ | 74,355 | $ | 126,485 | $ | 126,485 | $ | 126,485 | ||||||||||||||||
| * | The table presents the aggregate fees billed to the Fund for the Fund’s fiscal period from September 27, 2016 (commencement of operations) to August 31, 2017. |
| (1) | Includes all of the Series of the Trust. During the fiscal years reported above, certain of the Funds were “feeder” funds in a “master-feeder” fund structure or funds of funds. |
| (2) | Various subsidiaries of Eaton Vance Corp. act in either an investment advisory and/or service provider capacity with respect to the Series and/or their respective “master” funds (if applicable). |
(h) The registrant’s audit committee has considered whether the provision by the registrant’s principal accountant ofnon-audit services to the registrant’s investment adviser and any entity controlling, controlled by, or under common control with the adviser that provides ongoing services to the registrant that were notpre-approved pursuant to Rule2-01(c)(7)(ii) of RegulationS-X is compatible with maintaining the principal accountant’s independence.
Item 5. Audit Committee of Listed Registrants
Not applicable.
Item 6. Schedule of Investments
Please see schedule of investments contained in the Report to Stockholders included under Item 1 of this FormN-CSR.
Item 7. Disclosure of Proxy Voting Policies and Procedures forClosed-End Management Investment Companies
Not applicable.
Item 8. Portfolio Managers ofClosed-End Management Investment Companies
Not applicable.
Item 9. Purchases of Equity Securities byClosed-End Management Investment Company and Affiliated Purchasers
Not applicable.
Item 10. Submission of Matters to a Vote of Security Holders
No material changes.
Item 11. Controls and Procedures
(a) It is the conclusion of the registrant’s principal executive officer and principal financial officer that the effectiveness of the registrant’s current disclosure controls and procedures (such disclosure controls and procedures having been evaluated within 90 days of the date of this filing) provide reasonable assurance that the information required to be disclosed by the registrant has been recorded, processed, summarized and reported within the time period specified in the Commission’s rules and forms and that the information required to be disclosed by the registrant has been accumulated and communicated to the registrant’s principal executive officer and principal financial officer in order to allow timely decisions regarding required disclosure.
(b) There have been no changes in the registrant’s internal controls over financial reporting during the second fiscal quarter of the period covered by this report that has materially affected, or is reasonably likely to materially affect, the registrant’s internal control over financial reporting.
Item 12. Disclosure of Securities Lending Activities forClosed-End Management Investment Companies
Not applicable.
Item 13. Exhibits
(a)(1) | Registrant’s Code of Ethics – Not applicable (please see Item 2). | |
(a)(2)(i) | Treasurer’s Section 302 certification. | |
(a)(2)(ii) | President’s Section 302 certification. | |
(b) | Combined Section 906 certification. | |
Signatures
Pursuant to the requirements of the Securities Exchange Act of 1934 and the Investment Company Act of 1940, the registrant has duly caused this report to be signed on its behalf by the undersigned, thereunto duly authorized.
Eaton Vance Special Investment Trust
| By: | /s/ Payson F. Swaffield | |
| Payson F. Swaffield | ||
| President | ||
| Date: | February 25, 2019 | |
Pursuant to the requirements of the Securities Exchange Act of 1934 and the Investment Company Act of 1940, this report has been signed below by the following persons on behalf of the registrant and in the capacities and on the dates indicated.
| By: | /s/ James F. Kirchner | |
| James F. Kirchner | ||
| Treasurer | ||
| Date: | February 25, 2019 | |
| By: | /s/ Payson F. Swaffield | |
| Payson F. Swaffield | ||
| President | ||
| Date: | February 25, 2019 | |